UNITED STATES
SECURITIES AND EXCHANGE COMMISSION
WASHINGTON, D.C. 20549
FORM N-CSR
CERTIFIED SHAREHOLDER REPORT OF REGISTERED MANAGEMENT
INVESTMENT COMPANIES
Investment Company Act file number 811-5225
Oppenheimer Quest for Value Funds
(Exact name of registrant as specified in charter)
6803 South Tucson Way, Centennial, Colorado 80112-3924
(Address of principal executive offices) (Zip code)
Cynthia Lo Bessette
OFI Global Asset Management, Inc.
225 Liberty Street, New York, New York 10281-1008
(Name and address of agent for service)
Registrant’s telephone number, including area code: (303) 768-3200
Date of fiscal year end: October 31
Date of reporting period: 10/31/2016
Item 1. Reports to Stockholders.
Table of Contents
Class A Shares1
AVERAGE ANNUAL TOTAL RETURNS AT 10/31/16
| | | | | | | | | | | | |
| | | 1-Year | | | 5-Year | | | 10-Year | |
| | | |
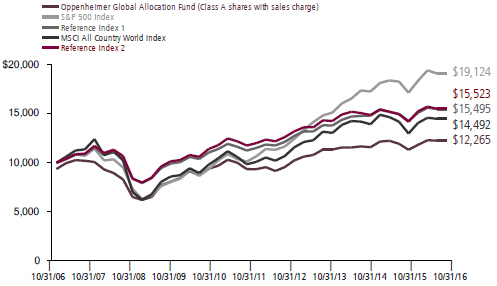
Class A Shares of the Fund without Sales Charge | | | 2.72 | % | | | 5.56 | % | | | 2.67% | |
| | | |
Class A Shares of the Fund with Sales Charge | | | -3.19 | | | | 4.32 | | | | 2.06 | |
| | | |
S&P 500 Index | | | 4.51 | | | | 13.57 | | | | 6.70 | |
| | | |
Reference Index 1 | | | 3.53 | | | | 6.64 | | | | 4.54 | |
| | | |
MSCI All Country World Index | | | 2.05 | | | | 8.03 | | | | 3.78 | |
| | | |
Bloomberg Barclays Global Aggregate Bond Index, Hedged | | | 5.17 | | | | 4.08 | | | | 4.58 | |
| | | |
Reference Index 2 | | | 3.93 | | | | 5.84 | | | | 4.85 | |
| | | |
Russell 1000 Index | | | 4.26 | | | | 13.51 | | | | 6.83 | |
| | | |
MSCI All County World Index (ex-U.S.) | | | 0.22 | | | | 3.64 | | | | 1.61 | |
| | | |
Bloomberg Barclays U.S. Aggregate Bond Index | | | 4.37 | | | | 2.90 | | | | 4.64 | |
| | | |
Bloomberg Barclays Multiverse Index (ex-U.S.) | | | 6.40 | | | | -0.54 | | | | 3.29 | |
Performance data quoted represents past performance, which does not guarantee future results. The investment return and principal value of an investment in the Fund will fluctuate so that an investor’s shares, when redeemed, may be worth more or less than their original cost. Fund returns include changes in share price, reinvested distributions, and a 5.75% maximum applicable sales charge except where “without sales charge” is indicated. Current performance may be lower or higher than the performance quoted. Returns do not consider capital gains or income taxes on an individual’s investment. For performance data current to the most
2 OPPENHEIMER GLOBAL ALLOCATION FUND
recent month-end, visit oppenheimerfunds.com or call 1.800.CALL OPP (225.5677). See Fund prospectuses and summary prospectuses for more information on share classes and sales charges.
1. The Fund has changed its benchmark from Reference Index 2 (30% Russell 1000 Index /30% MSCI All Country World Index (ex-U.S.) / 20% Bloomberg Barclays U.S. Aggregate Bond Index / 20% Bloomberg Barclays Multiverse Index (ex-U.S.) to Reference Index 1 (60% MSCI All Country World Index /40% Bloomberg Barclays Global Aggregate Bond Index, Hedged), which it believes is a more appropriate measure of the Fund’s performance. The Fund will not show performance for the Reference Index 2 (or for the indices comprising the Reference Index 2) in its next annual report.
3 OPPENHEIMER GLOBAL ALLOCATION FUND
Fund Performance Discussion
The Fund’s Class A shares (without sales charge) produced a return of 2.72% during the reporting period. The Fund underperformed its Reference Index (the “Reference Index”), a customized weighted index currently comprised of 60% of the MSCI All Country World Index and 40% of the Bloomberg Barclays Global Aggregate Bond Index, Hedged, which returned 3.53%.
MARKET OVERVIEW
Markets were volatile this reporting period. One of the most significant events during the period was the United Kingdom’s (“UK”) vote to leave the European Union (“EU”). Although the UK still has not initiated the formal process to leave the EU, the vote initially raised the level of uncertainty in global markets. Within days of the result, there were sharp moves across all markets. Perhaps the most significant movers were government bonds, where yields fell sharply,
despite already being well below historical levels.
Markets staged an impressive rebound in July, as investor fears receded, particularly over the immediate implications of June’s Brexit vote. We saw central bank action remain supportive with the Bank of England and the European Central Bank (“ECB”) making forceful statements outlining intentions to backstop market sentiment. Central bank
COMPARISON OF CHANGE IN VALUE OF $10,000 HYPOTHETICAL INVESTMENTS IN:
4 OPPENHEIMER GLOBAL ALLOCATION FUND
activity was not just apparent after the Brexit vote, but played a large role throughout the period.
In June, the ECB started to purchase European corporate bonds, marking another ‘Rubicon crossed’ in the central bank’s unconventional monetary policy moves. The purchasing program started more aggressively than had been expected, buying at the upper end of the 5-10 billion euro per month range.
Two key policy meetings in the third quarter were closely watched, one with the U.S. Federal Reserve (“Fed”) and the other from the Bank of Japan (“BoJ”). The Fed was not expected to hike rates and they met this expectation. However the details were mixed, with 3 dissenters voting in favor of a hike. The overall message was dovish, though a December hike remains a possibility.
The BoJ’s meeting was perhaps even more eagerly anticipated, with a growing view that the unprecedented monetary policy experiment from the last few years has failed to generate the promised inflation. Expectations varied widely, from a further rate cut (to more deeply negative), to expansion of the quantitative easing program, to no change to policy. In the end, the bank opted for what amounted to a fine-tuning of policy: It left its rates unchanged, but announced a new policy of ‘yield curve control’, where it would keep the 10-year Japanese Government Bond yield anchored around 0%, and target a modestly positively sloping yield curve.
FUND REVIEW
During the reporting period, the equity security selection component of the Fund’s investment process was the largest detractor from relative performance, driven mostly by international and domestic strategies. Our global developed equity strategy had underperformance relative to the MSCI All Country World Index during the period driven by poor stock selection within the Financials and Information Technology sectors. Our domestic large-cap growth strategy underperformed the Russell 1000 Growth Index, with poor stock selection within the Information Technology and Health Care sectors.
Our overweight duration posture versus the Reference Index was a big contributor during the period. Last year, we anticipated that U.S. Treasuries would be an attractive hedge against renewed market volatility, given their positive yield (relative to option based hedging strategies, where we would typically pay a premium for protection). Given our general concerns about global growth and a lack of discernible inflation, we believed developed market government bonds, particularly long-dated U.S. Treasuries, offered an attractive hedge in an uncertain environment. This duration hedge worked extremely well as volatility picked up in the first part of 2016 and yields on Treasuries fell substantially. With the significant move in yields, we reduced this exposure but remain neutral duration versus the Reference Index.
5 OPPENHEIMER GLOBAL ALLOCATION FUND
With most developed markets past their cyclical peaks, we have sought to enhance portfolio diversification through investments in income assets. Lower volatility coupled with a dovish Fed make for a favorable environment for income assets. At period end, we maintained broad exposure to income assets with a preference for loans, event-linked bonds, and high yield. During the period, we reduced our high yield exposure in favor of loans because of their attractive valuations, a step-up in credit quality, and less interest rate and sector risk than high yield bonds. Within the U.S., we favor credit over equities given the advanced stage of the business cycle and lower volatility. With sluggish earnings growth, we don’t expect meaningful equity upside. Together, we believe these income generating assets provide attractive sources of return with less severe ups and downs than equities.
Our active currency overlay has been a contributor to relative performance. We have actively managed currency both to hedge downside risk and take advantage of potential opportunities. To take advantage of the upside, we have a bias to higher-yielding emerging currencies versus lower-yielding developed currencies. This positioning added to performance as emerging currencies outperformed developed currencies. We remain modestly underweight the pound versus the Reference Index, as well as the euro, Swiss franc, and Canadian dollar, neutral the U.S. dollar and Japanese yen, and overweight a basket of higher yielding emerging currencies.
The Fund’s return shaping strategies, which are designed to improve the overall risk profile of the Fund, were a neutral contributor to performance during the period. Under normal circumstances, we expect return shaping strategies to cost money, like any insurance premium, and commensurately enhance returns or partially protect principal in environments of extreme market volatility. These strategies are often used as an efficient way to access upside market participation, especially when we are running lower levels of risk. With implied volatility higher than realized volatility across a number of assets (implying a relatively high cost of portfolio protection), we preferred to reduce risk through our asset allocation overlays, and had limited exposure to hedging strategies through options.
STRATEGY & OUTLOOK
Overall, we are underweight equities relative to the Reference Index and prefer to own diversified income sources as an attractive alternative to equities. With most developed equity market valuations relatively full in comparison to history, we have a preference for emerging market equities, where we see cheaper relative valuations, signs of economic recovery across countries, and improving risk sentiment. In terms of the macro environment, we are seeing a relatively weaker economic picture as our macro regime framework continues to indicate that most of the developed economies are past cyclical peaks. Most central banks, excluding the U.S., are trying to counterbalance this by supportive
6 OPPENHEIMER GLOBAL ALLOCATION FUND
monetary policy, but the long-term effects seem to be dissipating. Finally, risks remain somewhat elevated, with the economic drag from Brexit, weakness in European financials, the ongoing structural transition in China, and uncertainty surrounding the direction of Fed policy.
As we look ahead, we expect a continuation in this year’s seesaw behavior, in which global markets alternate between risk-on and risk-off. This muted growth outlook coupled with lack of consistent direction is causing a high degree of financial market uncertainty that may persist for some time. With this type
of backdrop, we believe in being somewhat cautious with our risk posture and focusing on higher risk-adjusted return assets and relative value opportunities across assets and currencies instead of large directional positions. Finally, with a choppy market backdrop, we think a dynamic asset allocation approach is well suited to navigate the short-term market risks. In terms of opportunities, cyclical and policy divergence are leading to some very interesting trends that we expect to exhibit some persistence over time and a flexible mandate is well equipped to capitalize on.
| | | | | | | | | | |

| |  | | 
| |  |
| | Mark Hamilton Portfolio Manager | | | Benjamin Rockmuller, CFA Portfolio Manager |
| | | |

| |  | | 
| |  |
| | Alessio de Longis, CFA Portfolio Manager | | | Dokyoung Lee, CFA Portfolio Manager |
7 OPPENHEIMER GLOBAL ALLOCATION FUND
Top Holdings and Allocations
TOP TEN COMMON STOCK HOLDINGS
| | | | |
Apple, Inc. | | | 1.1% | |
Alphabet, Inc., Cl. C | | | 1.0 | |
SAP SE | | | 0.8 | |
Alphabet, Inc., Cl. A | | | 0.7 | |
Facebook, Inc., Cl. A | | | 0.7 | |
Citigroup, Inc. | | | 0.7 | |
Comcast Corp., Cl. A | | | 0.6 | |
Airbus Group SE | | | 0.6 | |
S&P Global, Inc. | | | 0.5 | |
LVMH Moet Hennessy Louis Vuitton SE | | | 0.5 | |
Portfolio holdings and allocations are subject to change. Percentages are as of October 31, 2016, and are based on net assets. For more current Fund holdings, please visit oppenheimerfunds.com.
TOP TEN COMMON STOCK INDUSTRIES
| | | | |
Internet Software & Services | | | 3.8% | |
Commercial Banks | | | 3.1 | |
Software | | | 2.4 | |
Food Products | | | 2.2 | |
Oil, Gas & Consumable Fuels | | | 2.1 | |
Insurance | | | 2.0 | |
Capital Markets | | | 2.0 | |
Textiles, Apparel & Luxury Goods | | | 1.9 | |
Hotels, Restaurants & Leisure | | | 1.8 | |
Pharmaceuticals | | | 1.8 | |
Portfolio holdings and allocations are subject to change. Percentages are as of October 31, 2016, and are based on net assets.
PORTFOLIO ALLOCATION
| | | | |
| Common Stocks | | | 61.6% | |
| Investment Companies | | | | |
Oppenheimer Institutional Government Money Market Fund | | | 1.6 | |
Oppenheimer Master Event- Linked Bond Fund, LLC | | | 5.3 | |
Oppenheimer Master Loan Fund, LLC | | | 7.6 | |
Oppenheimer Senior Floating Rate Fund | | | 2.7 | |
PowerShares Senior Loan Portfolio Exchange Traded Fund | | | 5.2 | |
| U.S. Government Obligations | | | 11.1 | |
| Foreign Government Obligations | | | 4.5 | |
| Preferred Stocks | | | 0.4 | |
| Rights, Warrants and Certificates | | | —* | |
| Non-Convertible Corporate Bonds and Notes | | | —* | |
| Short-Term Notes | | | —* | |
| * | Represents a value of less than 0.05%. |
Portfolio holdings and allocations are subject to change. Percentages are as of October 31, 2016, and are based on the total market value of investments.
8 OPPENHEIMER GLOBAL ALLOCATION FUND
TOP TEN GEOGRAPHICAL HOLDINGS
| | | | |
United States | | | 60.9% | |
France | | | 4.9 | |
Japan | | | 4.6 | |
United Kingdom | | | 3.5 | |
Germany | | | 3.2 | |
Switzerland | | | 2.4 | |
China | | | 2.3 | |
India | | | 2.0 | |
Canada | | | 1.9 | |
Brazil | | | 1.5 | |
Portfolio holdings and allocation are subject to change. Percentages are as of October 31, 2016, and are based on total market value of investments.
REGIONAL ALLOCATION
| | | | |
U.S./Canada | | | 62.8% | |
Europe | | | 18.5 | |
Asia | | | 12.9 | |
Latin America | | | 3.1 | |
Emerging Europe | | | 1.6 | |
Middle East/Africa | | | 1.1 | |
Portfolio holdings and allocation are subject to change. Percentages are as of October 31, 2016, and are based on total market value of investments.
9 OPPENHEIMER GLOBAL ALLOCATION FUND
Share Class Performance
AVERAGE ANNUAL TOTAL RETURNS WITHOUT SALES CHARGE AS OF 10/31/2016
| | | | | | | | | | |
| | | Inception
Date | | 1-Year | | 5-Year | | 10-Year | | |
Class A (QVGIX) | | 11/1/91 | | 2.72% | | 5.56% | | 2.67% | | |
Class B (QGRBX) | | 9/1/93 | | 1.99 | | 4.73 | | 2.18 | | |
Class C (QGRCX) | | 9/1/93 | | 1.97 | | 4.80 | | 1.93 | | |
Class I (QGRIX) | | 2/28/12 | | 3.18 | | 5.65* | | N/A | | |
Class R (QGRNX) | | 3/1/01 | | 2.51 | | 5.30 | | 2.42 | | |
Class Y (QGRYX) | | 5/1/00 | | 2.97 | | 5.89 | | 3.01 | | |
AVERAGE ANNUAL TOTAL RETURNS WITH SALES CHARGE AS OF 10/31/2016
| | | | | | | | | | |
| | | Inception
Date | | 1-Year | | 5-Year | | 10-Year | | |
Class A (QVGIX) | | 11/1/91 | | -3.19% | | 4.32% | | 2.06% | | |
Class B (QGRBX) | | 9/1/93 | | -3.01 | | 4.39 | | 2.18 | | |
Class C (QGRCX) | | 9/1/93 | | 0.97 | | 4.80 | | 1.93 | | |
Class I (QGRIX) | | 2/28/12 | | 3.18 | | 5.65* | | N/A | | |
Class R (QGRNX) | | 3/1/01 | | 2.51 | | 5.30 | | 2.42 | | |
Class Y (QGRYX) | | 5/1/00 | | 2.97 | | 5.89 | | 3.01 | | |
| |
| *Shows performance since inception. | | |
Performance data quoted represents past performance, which does not guarantee future results. The investment return and principal value of an investment in the Fund will fluctuate so that an investor’s shares, when redeemed, may be worth more or less than their original cost. Current performance may be lower or higher than the performance quoted. For performance data current to the most recent month-end, visit oppenheimerfunds.com or call 1.800. CALL OPP (225.5677). Fund returns include changes in share price, reinvested distributions, and the applicable sales charge: for Class A shares, the current maximum initial sales charge of 5.75%; for Class B shares, the contingent deferred sales charge of 5% (1-year) and 2% (5-year); and for Class C shares, the contingent deferred sales charge (“CDSC”) of 1% for the 1-year period. There is no sales charge for Class I, Class R and Class Y shares. Because Class B shares convert to Class A shares 72 months after purchase, the 10-year return for Class B shares uses Class A performance for the period after conversion. See Fund prospectuses and summary prospectuses for more information on share classes and sales charges.
The Fund’s performance is compared to the performance of the S&P 500 Index, Reference Index 1 (60% MSCI All Country World Index / 40% Bloomberg Barclays Global Aggregate Bond Index, Hedged), the MSCI All Country World Index, the Bloomberg Barclays Global Aggregate Bond Index, Hedged, Reference Index 2 (30% Russell 1000 Index / 30% MSCI All Country World Index (ex-U.S.) / 20% Bloomberg Barclays U.S. Aggregate Bond Index / 20% Bloomberg Barclays Multiverse Index (ex-U.S.) the Russell 1000 Index, the MSCI All Country World Index (ex-U.S.), the Bloomberg Barclays U.S. Aggregate Bond Index, and the Bloomberg Barclays Multiverse Index (ex-U.S.). The Fund has changed its benchmark from Reference Index 2 to Reference Index 1, which it believes is a more appropriate measure of the Fund’s
10 OPPENHEIMER GLOBAL ALLOCATION FUND
performance. The Fund will not show performance for Reference Index 2 (or for the indices that comprise Reference Index 2) in its next annual report.
The S&P 500 Index is a broad-based measure of domestic stock performance. The MSCI All Country World Index is a free float-adjusted market capitalization weighted index that is designed to measure the equity market performance of developed and emerging markets. The Bloomberg Barclays Global Aggregate Bond Index provides a broad-based measure of global investment grade fixed-rate debt markets. The index is comprised of several other Bloomberg Barclays indexes that measure fixed income performance of regions around the world while hedging the currency back to the U.S. dollar. The Russell 1000 Index measures the performance of the large-cap segment of the U.S. equity universe. The MSCI All Country World Index (ex U.S.) is designed to measure global developed and emerging equity market performance excluding the United States. The Bloomberg Barclays U.S. Aggregate Bond Index is an index of U.S dollar-denominated, investment-grade U.S. corporate government and mortgage-backed securities. The Bloomberg Barclays Multiverse Index (ex-U.S.) provides a broad-based measure of the global fixed-income bond market. The indices are unmanaged and cannot be purchased directly by investors. While index comparisons may be useful to provide a benchmark for the Fund’s performance, it must be noted that the Fund’s investments are not limited to the investments comprising the indices. Index performance includes reinvestment of income, but does not reflect transaction costs, fees, expenses or taxes. Index performance is shown for illustrative purposes only as a benchmark for the Fund’s performance, and does not predict or depict performance of the Fund. The Fund’s performance reflects the effects of the Fund’s business and operating expenses.
The Fund’s investment strategy and focus can change over time. The mention of specific fund holdings does not constitute a recommendation by OppenheimerFunds, Inc. or its affiliates.
Before investing in any of the Oppenheimer funds, investors should carefully consider a fund’s investment objectives, risks, charges and expenses. Fund prospectuses and summary prospectuses contain this and other information about the funds, and may be obtained by asking your financial advisor, visiting oppenheimerfunds.com, or calling 1.800.CALL OPP (225.5677). Read prospectuses and summary prospectuses carefully before investing.
Shares of Oppenheimer funds are not deposits or obligations of any bank, are not guaranteed by any bank, are not insured by the FDIC or any other agency, and involve investment risks, including the possible loss of the principal amount invested.
11 OPPENHEIMER GLOBAL ALLOCATION FUND
Fund Expenses
Fund Expenses. As a shareholder of the Fund, you incur two types of costs: (1) transaction costs, which may include sales charges (loads) on purchase payments and/or contingent deferred sales charges on redemptions; and (2) ongoing costs, including management fees; distribution and service fees; and other Fund expenses. These examples are intended to help you understand your ongoing costs (in dollars) of investing in the Fund and to compare these costs with the ongoing costs of investing in other mutual funds.
The examples are based on an investment of $1,000.00 invested at the beginning of the period and held for the entire 6-month period ended October 31, 2016.
Actual Expenses. The first section of the table provides information about actual account values and actual expenses. You may use the information in this section for the class of shares you hold, together with the amount you invested, to estimate the expense that you paid over the period. Simply divide your account value by $1,000.00 (for example, an $8,600.00 account value divided by $1,000.00 = 8.60), then multiply the result by the number in the first section under the heading entitled “Expenses Paid During 6 Months Ended October 31, 2016” to estimate the expenses you paid on your account during this period.
Hypothetical Example for Comparison Purposes. The second section of the table provides information about hypothetical account values and hypothetical expenses based on the Fund’s actual expense ratio for each class of shares, and an assumed rate of return of 5% per year for each class before expenses, which is not the Fund’s actual return. The hypothetical account values and expenses may not be used to estimate the actual ending account balance or expenses you paid for the period. You may use this information to compare the ongoing costs of investing in the Fund and other funds. To do so, compare this 5% hypothetical example for the class of shares you hold with the 5% hypothetical examples that appear in the shareholder reports of the other funds.
Please note that the expenses shown in the table are meant to highlight your ongoing costs only and do not reflect any transactional costs, such as front-end or contingent deferred sales charges (loads). Therefore, the “hypothetical” section of the table is useful in comparing ongoing costs only, and will not help you determine the relative total costs of owning different funds. In addition, if these transactional costs were included, your costs would have been higher.
12 OPPENHEIMER GLOBAL ALLOCATION FUND
| | | | | | | | | | | | | | | | | | | | | | | | |
| Actual | | Beginning Account Value May 1, 2016 | | | | | | Ending Account Value October 31, 2016 | | | Expenses Paid During 6 Months Ended October 31, 2016 | |
Class A | | $ | 1,000.00 | | | | | | | $ | 1,036.80 | | | | | | | $ | 6.57 | | | | | |
Class B | | | 1,000.00 | | | | | | | | 1,032.80 | | | | | | | | 10.63 | | | | | |
Class C | | | 1,000.00 | | | | | | | | 1,033.00 | | | | | | | | 10.43 | | | | | |
Class I | | | 1,000.00 | | | | | | | | 1,038.60 | | | | | | | | 4.06 | | | | | |
Class R | | | 1,000.00 | | | | | | | | 1,035.60 | | | | | | | | 7.86 | | | | | |
Class Y | | | 1,000.00 | | | | | | | | 1,038.00 | | | | | | | | 5.29 | | | | | |
| | | | | | |
| Hypothetical | | | | | | | | | | | | | | | | | | | | | | | | |
(5% return before expenses) | | | | | | | | | | | | | | | | | | | | | | | | |
Class A | | | 1,000.00 | | | | | | | | 1,018.70 | | | | | | | | 6.52 | | | | | |
Class B | | | 1,000.00 | | | | | | | | 1,014.73 | | | | | | | | 10.54 | | | | | |
Class C | | | 1,000.00 | | | | | | | | 1,014.93 | | | | | | | | 10.33 | | | | | |
Class I | | | 1,000.00 | | | | | | | | 1,021.17 | | | | | | | | 4.02 | | | | | |
Class R | | | 1,000.00 | | | | | | | | 1,017.44 | | | | | | | | 7.79 | | | | | |
Class Y | | | 1,000.00 | | | | | | | | 1,019.96 | | | | | | | | 5.24 | | | | | |
Expenses are equal to the Fund’s annualized expense ratio for that class, multiplied by the average account value over the period, multiplied by 184/366 (to reflect the one-half year period). Those annualized expense ratios, excluding indirect expenses from affiliated funds, based on the 6-month period ended October 31, 2016 are as follows:
| | | | | | | | |
| Class | | Expense Ratios | | | | |
Class A | | | 1.28 | % | | | | |
Class B | | | 2.07 | | | | | |
Class C | | | 2.03 | | | | | |
Class I | | | 0.79 | | | | | |
Class R | | | 1.53 | | | | | |
Class Y | | | 1.03 | | | | | |
The expense ratios reflect voluntary and/or contractual waivers and/or reimbursements of expenses by the Fund’s Manager. Some of these undertakings may be modified or terminated at any time, as indicated in the Fund’s prospectus. The “Consolidated Financial Highlights” tables in the Fund’s financial statements, included in this report, also show the gross expense ratios, without such waivers or reimbursements and reduction to custodian expenses, if applicable.
13 OPPENHEIMER GLOBAL ALLOCATION FUND
CONSOLIDATED STATEMENT OF INVESTMENTS October 31, 2016
| | | | | | | | |
| | | Shares | | | Value | |
Common Stocks—60.7% | | | | | | | | |
Consumer Discretionary—10.4% | | | | | | | | |
Auto Components—0.7% | | | | | | | | |
Adient plc1 | | | 9,909 | | | $ | 450,958 | |
Bridgestone Corp. | | | 64,100 | | | | 2,388,751 | |
Continental AG | | | 13,894 | | | | 2,662,804 | |
Delphi Automotive plc | | | 12,930 | | | | 841,355 | |
Koito Manufacturing Co. Ltd. | | | 4,300 | | | | 224,193 | |
Valeo SA | | | 82,667 | | | | 4,762,577 | |
| | | | | | | 11,330,638 | |
| | | | | | | | | |
Automobiles—0.6% | | | | | | | | |
Astra International Tbk PT | | | 1,250,500 | | | | 786,444 | |
Bayerische Motoren Werke AG | | | 13,418 | | | | 1,169,076 | |
Hero MotoCorp Ltd. | | | 48,967 | | | | 2,458,537 | |
Suzuki Motor Corp. | | | 64,100 | | | | 2,275,207 | |
Tata Motors Ltd., Sponsored ADR | | | 60,490 | | | | 2,383,911 | |
| | | | | | | 9,073,175 | |
| | | | | | | | | |
Diversified Consumer Services—0.3% | | | | | | | | |
Dignity plc | | | 38,581 | | | | 1,251,797 | |
Estacio Participacoes SA | | | 132,700 | | | | 769,510 | |
Kroton Educacional SA | | | 137,554 | | | | 685,185 | |
New Oriental Education & Technology Group, Inc., Sponsored ADR1 | | | 23,580 | | | | 1,182,065 | |
| | | | | | | 3,888,557 | |
| | | | | | | | | |
Hotels, Restaurants & Leisure—1.8% | | | | | | | | |
Accor SA | | | 34,740 | | | | 1,320,193 | |
Carnival Corp. | | | 108,870 | | | | 5,345,517 | |
Cedar Fair LP2 | | | 8,683 | | | | 493,628 | |
China Lodging Group Ltd., Sponsored ADR | | | 15,560 | | | | 669,236 | |
Domino’s Pizza Group plc | | | 399,870 | | | | 1,664,239 | |
Galaxy Entertainment Group Ltd. | | | 278,000 | | | | 1,141,416 | |
Genting Bhd | | | 735,800 | | | | 1,374,029 | |
Genting Malaysia Bhd | | | 453,100 | | | | 513,823 | |
International Game Technology plc | | | 58,084 | | | | 1,668,172 | |
Jollibee Foods Corp. | | | 135,080 | | | | 663,912 | |
Las Vegas Sands Corp. | | | 16,590 | | | | 960,229 | |
McDonald’s Corp. | | | 29,530 | | | | 3,324,192 | |
Melco Crown Entertainment Ltd., ADR | | | 68,310 | | | | 1,143,509 | |
Sands China Ltd. | | | 809,600 | | | | 3,513,533 | |
Starbucks Corp. | | | 9,510 | | | | 504,696 | |
Whitbread plc | | | 27,624 | | | | 1,222,072 | |
William Hill plc | | | 398,312 | | | | 1,441,719 | |
| | | | | | | 26,964,115 | |
| | | | | | | | | |
Household Durables—0.7% | | | | | | | | |
Newell Brands, Inc. | | | 13,360 | | | | 641,547 | |
SEB SA | | | 18,830 | | | | 2,772,139 | |
Sony Corp. | | | 149,200 | | | | 4,721,214 | |
Whirlpool Corp. | | | 16,990 | | | | 2,545,442 | |
| | | | | | | 10,680,342 | |
14 OPPENHEIMER GLOBAL ALLOCATION FUND
| | | | | | | | |
| | | Shares | | | Value | |
Internet & Direct Marketing Retail—0.7% | | | | | | | | |
Amazon.com, Inc.1 | | | 5,866 | | | $ | 4,633,084 | |
Ctrip.com International Ltd., ADR1 | | | 40,050 | | | | 1,768,207 | |
JD.com, Inc., ADR1 | | | 89,621 | | | | 2,325,665 | |
Priceline Group, Inc. (The)1 | | | 850 | | | | 1,253,096 | |
Rakuten, Inc. | | | 37,500 | | | | 433,057 | |
| | | | | | | 10,413,109 | |
| | | | | | | | | |
Leisure Products—0.2% | | | | | | | | |
Hasbro, Inc. | | | 3,740 | | | | 311,953 | |
Nintendo Co. Ltd. | | | 13,400 | | | | 3,249,269 | |
| | | | | | | 3,561,222 | |
| | | | | | | | | |
Media—1.8% | | | | | | | | |
Comcast Corp., Cl. A | | | 150,032 | | | | 9,274,978 | |
DISH Network Corp., Cl. A1 | | | 11,440 | | | | 669,926 | |
Grupo Televisa SAB, Sponsored ADR | | | 51,580 | | | | 1,265,257 | |
ProSiebenSat.1 Media SE | | | 39,655 | | | | 1,709,076 | |
SES SA, Cl. A, FDR | | | 68,640 | | | | 1,578,450 | |
SKY Perfect JSAT Holdings, Inc. | | | 225,900 | | | | 1,120,666 | |
Sky plc | | | 176,910 | | | | 1,767,292 | |
Technicolor SA | | | 264,210 | | | | 1,543,914 | |
Walt Disney Co. (The) | | | 46,580 | | | | 4,317,500 | |
Zee Entertainment Enterprises Ltd. | | | 420,852 | | | | 3,270,024 | |
| | | | | | | 26,517,083 | |
| | | | | | | | | |
Multiline Retail—0.3% | | | | | | | | |
Dollarama, Inc. | | | 48,795 | | | | 3,646,256 | |
Hudson’s Bay Co. | | | 120,281 | | | | 1,477,843 | |
| | | | | | | 5,124,099 | |
| | | | | | | | | |
Specialty Retail—1.4% | | | | | | | | |
AutoZone, Inc.1 | | | 2,720 | | | | 2,018,675 | |
CarMax, Inc.1 | | | 16,850 | | | | 841,489 | |
Dufry AG1 | | | 9,790 | | | | 1,190,324 | |
Fast Retailing Co. Ltd. | | | 2,500 | | | | 843,504 | |
Home Depot, Inc. (The) | | | 37,740 | | | | 4,604,657 | |
Industria de Diseno Textil SA | | | 159,585 | | | | 5,577,549 | |
Lowe’s Cos., Inc. | | | 9,470 | | | | 631,175 | |
O’Reilly Automotive, Inc.1 | | | 4,530 | | | | 1,197,913 | |
Tiffany & Co. | | | 38,860 | | | | 2,853,101 | |
TJX Cos., Inc. (The) | | | 12,886 | | | | 950,343 | |
| | | | | | | 20,708,730 | |
| | | | | | | | | |
Textiles, Apparel & Luxury Goods—1.9% | | | | | | | | |
adidas AG | | | 12,334 | | | | 2,022,809 | |
Brunello Cucinelli SpA | | | 34,701 | | | | 687,193 | |
Burberry Group plc | | | 152,027 | | | | 2,744,040 | |
Christian Dior SE | | | 9,380 | | | | 1,810,917 | |
Cie Financiere Richemont SA | | | 24,814 | | | | 1,595,102 | |
Hermes International | | | 4,771 | | | | 1,934,140 | |
Kering | | | 30,938 | | | | 6,868,222 | |
LVMH Moet Hennessy Louis Vuitton SE | | | 42,540 | | | | 7,737,936 | |
15 OPPENHEIMER GLOBAL ALLOCATION FUND
| | |
| CONSOLIDATED STATEMENT OF INVESTMENTS Continued | | |
| | | |
| | | | | | | | |
| | | Shares | | | Value | |
Textiles, Apparel & Luxury Goods (Continued) | | | | | | | | |
Pandora AS | | | 13,714 | | | $ | 1,784,286 | |
Prada SpA | | | 441,500 | | | | 1,548,265 | |
Tod’s SpA | | | 9,126 | | | | 533,713 | |
VF Corp. | | | 2,410 | | | | 130,646 | |
| | | | | | | 29,397,269 | |
| | | | | | | | | |
Consumer Staples—6.3% | | | | | | | | |
Beverages—1.6% | | | | | | | | |
Ambev SA, ADR | | | 129,120 | | | | 761,808 | |
Anadolu Efes Biracilik Ve Malt Sanayii AS | | | 77,625 | | | | 474,446 | |
Anheuser-Busch InBev SA/NV | | | 12,409 | | | | 1,424,178 | |
Coca-Cola Amatil Ltd. | | | 156,917 | | | | 1,138,592 | |
Coca-Cola Co. (The) | | | 20,250 | | | | 858,600 | |
Coca-Cola European Partners plc | | | 51,460 | | | | 1,978,122 | |
Constellation Brands, Inc., Cl. A | | | 7,740 | | | | 1,293,509 | |
Diageo plc | | | 34,783 | | | | 926,053 | |
Dr Pepper Snapple Group, Inc. | | | 8,970 | | | | 787,476 | |
Fomento Economico Mexicano SAB de CV | | | 108,447 | | | | 1,039,831 | |
Fomento Economico Mexicano SAB de CV, Sponsored ADR | | | 3,710 | | | | 354,936 | |
Heineken NV | | | 28,086 | | | | 2,312,150 | |
Molson Coors Brewing Co., Cl. B | | | 9,570 | | | | 993,462 | |
Nigerian Breweries plc | | | 712,630 | | | | 329,905 | |
PepsiCo, Inc. | | | 47,130 | | | | 5,052,336 | |
Pernod Ricard SA | | | 40,040 | | | | 4,759,468 | |
| | | | | | | 24,484,872 | |
| | | | | | | | | |
Food & Staples Retailing—1.0% | | | | | | | | |
Alimentation Couche-Tard, Inc., Cl. B | | | 38,673 | | | | 1,942,732 | |
BIM Birlesik Magazalar AS | | | 32,845 | | | | 533,729 | |
Costco Wholesale Corp. | | | 4,625 | | | | 683,899 | |
CP ALL PCL | | | 1,495,600 | | | | 2,594,588 | |
Magnit PJSC | | | 18,155 | | | | 3,047,169 | |
Spar Group Ltd. (The) | | | 118,131 | | | | 1,673,168 | |
Walgreens Boots Alliance, Inc. | | | 21,350 | | | | 1,766,286 | |
Wal-Mart de Mexico SAB de CV | | | 122,353 | | | | 258,805 | |
Wal-Mart Stores, Inc. | | | 29,140 | | | | 2,040,383 | |
Whole Foods Market, Inc. | | | 22,550 | | | | 637,940 | |
| | | | | | | 15,178,699 | |
| | | | | | | | | |
Food Products—2.2% | | | | | | | | |
Aryzta AG1 | | | 38,157 | | | | 1,674,602 | |
Barry Callebaut AG1 | | | 1,457 | | | | 1,814,376 | |
ConAgra Foods, Inc. | | | 9,790 | | | | 471,682 | |
Danone SA | | | 72,975 | | | | 5,049,412 | |
Kraft Heinz Co. (The) | | | 48,100 | | | | 4,278,495 | |
Mondelez International, Inc., Cl. A | | | 121,910 | | | | 5,478,635 | |
Nestle SA | | | 88,149 | | | | 6,389,142 | |
Saputo, Inc. | | | 70,790 | | | | 2,543,859 | |
Tingyi Cayman Islands Holding Corp. | | | 480,000 | | | | 517,027 | |
Unilever plc | | | 114,940 | | | | 4,806,805 | |
16 OPPENHEIMER GLOBAL ALLOCATION FUND
| | | | | | | | |
| | | Shares | | | Value | |
Food Products (Continued) | | | | | | | | |
Want Want China Holdings Ltd. | | | 1,066,000 | | | $ | 650,063 | |
| | | | | | | 33,674,098 | |
| | | | | | | | | |
Household Products—0.6% | | | | | | | | |
Colgate-Palmolive Co. | | | 65,440 | | | | 4,669,799 | |
Kimberly-Clark de Mexico SAB de CV, Cl. A | | | 17,499 | | | | 37,709 | |
Procter & Gamble Co. (The) | | | 20,500 | | | | 1,779,400 | |
Reckitt Benckiser Group plc | | | 22,463 | | | | 2,008,641 | |
| | | | | | | 8,495,549 | |
| | | | | | | | | |
Personal Products—0.0% | | | | | | | | |
LG Household & Health Care Ltd. | | | 496 | | | | 355,398 | |
| | | | | | | | | |
Tobacco—0.9% | | | | | | | | |
Japan Tobacco, Inc. | | | 85,200 | | | | 3,242,757 | |
KT&G Corp. | | | 28,292 | | | | 2,788,680 | |
Philip Morris International, Inc. | | | 42,350 | | | | 4,084,234 | |
Swedish Match AB | | | 101,860 | | | | 3,541,106 | |
| | | | | | | 13,656,777 | |
| | | | | | | | | |
Energy—2.5% | | | | | | | | |
Energy Equipment & Services—0.4% | | | | | | | | |
Halliburton Co. | | | 5,573 | | | | 256,358 | |
Schlumberger Ltd. | | | 12,117 | | | | 947,913 | |
Technip SA | | | 81,720 | | | | 5,400,056 | |
| | | | | | | 6,604,327 | |
| | | | | | | | | |
Oil, Gas & Consumable Fuels—2.1% | | | | | | | | |
Apache Corp. | | | 18,980 | | | | 1,128,930 | |
Chevron Corp. | | | 65,594 | | | | 6,870,971 | |
CNOOC Ltd. | | | 883,000 | | | | 1,111,734 | |
Concho Resources, Inc.1 | | | 7,855 | | | | 997,114 | |
ConocoPhillips | | | 17,598 | | | | 764,633 | |
Enbridge, Inc. | | | 28,156 | | | | 1,215,495 | |
EOG Resources, Inc. | | | 2,811 | | | | 254,171 | |
Hess Corp. | | | 18,450 | | | | 885,047 | |
HollyFrontier Corp. | | | 36,158 | | | | 902,142 | |
Koninklijke Vopak NV | | | 36,333 | | | | 1,833,401 | |
Magellan Midstream Partners LP2 | | | 36,120 | | | | 2,428,348 | |
Newfield Exploration Co.1 | | | 12,311 | | | | 499,703 | |
Noble Energy, Inc. | | | 45,996 | | | | 1,585,482 | |
Novatek OJSC, Sponsored GDR | | | 22,100 | | | | 2,357,444 | |
Phillips 66 | | | 8,481 | | | | 688,233 | |
Pioneer Natural Resources Co. | | | 1,812 | | | | 324,384 | |
Repsol SA | | | 53,525 | | | | 748,025 | |
Suncor Energy, Inc. | | | 131,940 | | | | 3,960,839 | |
Total SA | | | 59,200 | | | | 2,832,980 | |
| | | | | | | 31,389,076 | |
| | | | | | | | | |
Financials—9.7% | | | | | | | | |
Capital Markets—2.0% | | | | | | | | |
Bank of New York Mellon Corp. (The) | | | 85,500 | | | | 3,699,585 | |
17 OPPENHEIMER GLOBAL ALLOCATION FUND
| | |
| CONSOLIDATED STATEMENT OF INVESTMENTS Continued | | |
| | | |
| | | | | | | | |
| | | Shares | | | Value | |
Capital Markets (Continued) | | | | | | | | |
BlackRock, Inc., Cl. A | | | 1,030 | | | $ | 351,477 | |
Charles Schwab Corp. (The) | | | 22,740 | | | | 720,858 | |
CME Group, Inc., Cl. A | | | 49,130 | | | | 4,917,913 | |
Credit Suisse Group AG1 | | | 49,116 | | | | 684,573 | |
Goldman Sachs Group, Inc. (The) | | | 14,420 | | | | 2,570,221 | |
ICAP plc | | | 313,897 | | | | 1,859,695 | |
Intercontinental Exchange, Inc. | | | 2,930 | | | | 792,243 | |
Nasdaq, Inc. | | | 21,070 | | | | 1,347,848 | |
S&P Global, Inc. | | | 67,370 | | | | 8,209,034 | |
Tullett Prebon plc | | | 98,590 | | | | 427,653 | |
UBS Group AG | | | 318,048 | | | | 4,496,423 | |
| | | | | | | 30,077,523 | |
| | | | | | | | | |
Commercial Banks—3.1% | | | | | | | | |
3SBio, Inc.1,3 | | | 60,000 | | | | 59,952 | |
Australia & New Zealand Banking Group Ltd. | | | 69,200 | | | | 1,462,081 | |
Banco Bilbao Vizcaya Argentaria SA | | | 306,575 | | | | 2,209,496 | |
Bank Mandiri Persero Tbk PT | | | 724,100 | | | | 635,623 | |
Bank of America Corp. | | | 281,410 | | | | 4,643,265 | |
Bank Pekao SA | | | 25,158 | | | | 776,090 | |
BDO Unibank, Inc. | | | 18,900 | | | | 44,030 | |
BOC Hong Kong Holdings Ltd. | | | 565,000 | | | | 2,017,686 | |
Citigroup, Inc. | | | 202,940 | | | | 9,974,501 | |
Commercial International Bank Egypt SAE | | | 123,370 | | | | 712,716 | |
Credicorp Ltd. | | | 660 | | | | 98,129 | |
Grupo Aval Acciones y Valores SA, ADR | | | 109,430 | | | | 896,232 | |
Grupo Financiero Banorte SAB de CV | | | 198,632 | | | | 1,171,762 | |
Grupo Financiero Inbursa SAB de CV | | | 558,626 | | | | 910,305 | |
ICICI Bank Ltd., Sponsored ADR | | | 687,260 | | | | 5,697,385 | |
JPMorgan Chase & Co. | | | 61,510 | | | | 4,260,182 | |
Kotak Mahindra Bank Ltd. | | | 81,370 | | | | 1,001,321 | |
Lloyds Banking Group plc | | | 625,440 | | | | 437,396 | |
Sberbank of Russia PJSC, Sponsored ADR | | | 107,620 | | | | 1,018,909 | |
Societe Generale SA | | | 48,130 | | | | 1,873,312 | |
Sumitomo Mitsui Financial Group, Inc. | | | 39,100 | | | | 1,359,125 | |
Sumitomo Mitsui Trust Holdings, Inc. | | | 43,600 | | | | 1,473,005 | |
SunTrust Banks, Inc. | | | 46,160 | | | | 2,087,817 | |
US Bancorp | | | 48,730 | | | | 2,181,155 | |
Zenith Bank plc | | | 4,422,114 | | | | 206,753 | |
| | | | | | | 47,208,228 | |
| | | | | | | | | |
Consumer Finance—0.6% | | | | | | | | |
Ally Financial, Inc. | | | 167,840 | | | | 3,032,869 | |
American Express Co. | | | 36,210 | | | | 2,405,068 | |
Discover Financial Services | | | 40,890 | | | | 2,303,334 | |
Synchrony Financial | | | 46,880 | | | | 1,340,299 | |
| | | | | | | 9,081,570 | |
| | | | | | | | | |
Diversified Financial Services—0.9% | | | | | | | | |
Berkshire Hathaway, Inc., Cl. B1 | | | 35,210 | | | | 5,080,803 | |
BM&FBovespa SA-Bolsa de Valores Mercadorias e Futuros | | | 246,000 | | | | 1,448,872 | |
18 OPPENHEIMER GLOBAL ALLOCATION FUND
| | | | | | | | |
| | | Shares | | | Value | |
Diversified Financial Services (Continued) | | | | | | | | |
Grupo de Inversiones Suramericana SA | | | 60,454 | | | $ | 779,707 | |
Hong Kong Exchanges & Clearing Ltd. | | | 25,794 | | | | 681,789 | |
ING Groep NV | | | 203,143 | | | | 2,670,720 | |
Kinnevik AB, Cl. B | | | 55,789 | | | | 1,409,399 | |
Moscow Exchange (The) | | | 247,876 | | | | 456,778 | |
ORIX Corp. | | | 46,100 | | | | 733,375 | |
| | | | | | | 13,261,443 | |
| | | | | | | | | |
Insurance—2.0% | | | | | | | | |
AIA Group Ltd. | | | 388,400 | | | | 2,451,076 | |
Allianz SE | | | 20,572 | | | | 3,206,171 | |
American International Group, Inc. | | | 50,390 | | | | 3,109,063 | |
Aon plc | | | 7,800 | | | | 864,474 | |
China Pacific Insurance Group Co. Ltd., Cl. H | | | 252,600 | | | | 913,461 | |
Dai-ichi Life Holdings, Inc. | | | 158,100 | | | | 2,316,589 | |
FNF Group | | | 45,350 | | | | 1,628,519 | |
Marsh & McLennan Cos., Inc. | | | 19,160 | | | | 1,214,552 | |
MetLife, Inc. | | | 73,670 | | | | 3,459,543 | |
Old Mutual plc | | | 397,029 | | | | 973,398 | |
Ping An Insurance Group Co. of China Ltd., Cl. H | | | 266,000 | | | | 1,404,275 | |
Progressive Corp. (The) | | | 67,800 | | | | 2,136,378 | |
Prudential plc | | | 379,421 | | | | 6,186,196 | |
Sul America SA | | | 93,060 | | | | 561,800 | |
| | | | | | | 30,425,495 | |
| | | | | | | | | |
Real Estate Investment Trusts (REITs)—0.3% | | | | | | | | |
Crown Castle International Corp. | | | 11,640 | | | | 1,059,123 | |
Digital Realty Trust, Inc. | | | 4,760 | | | | 444,727 | |
HCP, Inc. | | | 31,420 | | | | 1,076,135 | |
Mid-America Apartment Communities, Inc. | | | 16,650 | | | | 1,544,287 | |
Simon Property Group, Inc. | | | 6,430 | | | | 1,195,723 | |
| | | | | | | 5,319,995 | |
| | | | | | | | | |
Real Estate Management & Development—0.5% | | | | | | | | |
Ayala Land, Inc. | | | 416,000 | | | | 311,440 | |
DLF Ltd. | | | 1,391,232 | | | | 3,132,148 | |
Emaar Properties PJSC | | | 29,198 | | | | 55,325 | |
Global Logistic Properties Ltd. | | | 362,000 | | | | 461,890 | |
Hang Lung Group Ltd. | | | 136,500 | | | | 523,305 | |
SM Prime Holdings, Inc. | | | 1,532,103 | | | | 851,176 | |
SOHO China Ltd. | | | 671,000 | | | | 346,612 | |
Vonovia SE | | | 51,374 | | | | 1,812,044 | |
Wallace Theater Holdings, Inc.1,3 | | | 430 | | | | 4 | |
| | | | | | | 7,493,944 | |
| | | | | | | | | |
Thrifts & Mortgage Finance—0.3% | | | | | | | | |
Housing Development Finance Corp. Ltd. | | | 239,224 | | | | 4,944,828 | |
| | | | | | | | | |
Health Care—6.5% | | | | | | | | |
Biotechnology—1.4% | | | | | | | | |
ACADIA Pharmaceuticals, Inc.1 | | | 47,150 | | | | 1,099,066 | |
Amgen, Inc. | | | 12,040 | | | | 1,699,566 | |
19 OPPENHEIMER GLOBAL ALLOCATION FUND
| | |
| CONSOLIDATED STATEMENT OF INVESTMENTS Continued | | |
| | | |
| | | | | | | | |
| | | Shares | | | Value | |
Biotechnology (Continued) | | | | | | | | |
Biocon Ltd. | | | 3,370 | | | $ | 46,865 | |
Biogen, Inc.1 | | | 11,410 | | | | 3,196,854 | |
BioMarin Pharmaceutical, Inc.1 | | | 16,000 | | | | 1,288,320 | |
Bluebird Bio, Inc.1 | | | 10,150 | | | | 484,663 | |
Celgene Corp.1 | | | 26,666 | | | | 2,724,732 | |
Circassia Pharmaceuticals plc1 | | | 348,434 | | | | 346,332 | |
CSL Ltd. | | | 27,300 | | | | 2,082,560 | |
Gilead Sciences, Inc. | | | 32,130 | | | | 2,365,732 | |
Grifols SA | | | 97,429 | | | | 1,925,380 | |
Ionis Pharmaceuticals, Inc.1 | | | 26,560 | | | | 690,029 | |
MacroGenics, Inc.1 | | | 32,170 | | | | 762,107 | |
Regeneron Pharmaceuticals, Inc.1 | | | 1,050 | | | | 362,271 | |
Sage Therapeutics, Inc.1 | | | 18,580 | | | | 808,973 | |
Vertex Pharmaceuticals, Inc.1 | | | 11,375 | | | | 862,908 | |
| | | | | | | 20,746,358 | |
| | | | | | | | | |
Health Care Equipment & Supplies—1.3% | | | | | | | | |
Baxter International, Inc. | | | 24,820 | | | | 1,181,184 | |
Boston Scientific Corp.1 | | | 96,940 | | | | 2,132,680 | |
Coloplast AS, Cl. B | | | 23,330 | | | | 1,626,181 | |
CR Bard, Inc. | | | 3,400 | | | | 736,712 | |
Danaher Corp. | | | 28,994 | | | | 2,277,479 | |
Essilor International SA | | | 14,274 | | | | 1,601,879 | |
Intuitive Surgical, Inc.1 | | | 510 | | | | 342,761 | |
Medtronic plc | | | 14,830 | | | | 1,216,357 | |
Sonova Holding AG | | | 12,045 | | | | 1,614,677 | |
Stryker Corp. | | | 11,190 | | | | 1,290,766 | |
William Demant Holding AS1 | | | 69,845 | | | | 1,299,205 | |
Zimmer Biomet Holdings, Inc. | | | 37,080 | | | | 3,908,232 | |
| | | | | | | 19,228,113 | |
| | | | | | | | | |
Health Care Providers & Services—1.7% | | | | | | | | |
Aetna, Inc. | | | 46,520 | | | | 4,993,922 | |
Anthem, Inc. | | | 25,050 | | | | 3,052,593 | |
Apollo Hospitals Enterprise Ltd. | | | 38,315 | | | | 766,844 | |
Cardinal Health, Inc. | | | 13,490 | | | | 926,628 | |
Express Scripts Holding Co.1 | | | 53,300 | | | | 3,592,420 | |
Humana, Inc. | | | 13,690 | | | | 2,348,246 | |
Laboratory Corp. of America Holdings1 | | | 7,560 | | | | 947,570 | |
McKesson Corp. | | | 10,470 | | | | 1,331,470 | |
Mediclinic International plc | | | 1,900 | | | | 21,042 | |
Sinopharm Group Co. Ltd., Cl. H | | | 246,600 | | | | 1,198,043 | |
Sonic Healthcare Ltd. | | | 82,422 | | | | 1,281,196 | |
UnitedHealth Group, Inc. | | | 44,320 | | | | 6,263,746 | |
| | | | | | | 26,723,720 | |
| | | | | | | | | |
Health Care Technology—0.1% | | | | | | | | |
Cerner Corp.1 | | | 30,630 | | | | 1,794,305 | |
| | | | | | | | | |
Life Sciences Tools & Services—0.2% | | | | | | | | |
Agilent Technologies, Inc. | | | 19,740 | | | | 860,072 | |
20 OPPENHEIMER GLOBAL ALLOCATION FUND
| | | | | | | | |
| | | Shares | | | Value | |
Life Sciences Tools & Services (Continued) | | | | | | | | |
Charles River Laboratories International, Inc.1 | | | 3,570 | | | $ | 270,892 | |
Lonza Group AG1 | | | 10,861 | | | | 2,047,781 | |
Samsung Biologics Co. Ltd.1 | | | 765 | | | | 90,924 | |
Thermo Fisher Scientific, Inc. | | | 3,940 | | | | 579,298 | |
| | | | | | | 3,848,967 | |
| | | | | | | | | |
Pharmaceuticals—1.8% | | | | | | | | |
Allergan plc1 | | | 7,160 | | | | 1,496,010 | |
Bayer AG | | | 24,014 | | | | 2,380,170 | |
Bristol-Myers Squibb Co. | | | 5,891 | | | | 299,911 | |
Dr. Reddy’s Laboratories Ltd. | | | 22,460 | | | | 1,118,165 | |
Eli Lilly & Co. | | | 15,840 | | | | 1,169,626 | |
Galenica AG | | | 1,314 | | | | 1,315,750 | |
Glenmark Pharmaceuticals Ltd. | | | 28,530 | | | | 399,484 | |
Johnson & Johnson | | | 30,410 | | | | 3,527,256 | |
Merck & Co., Inc. | | | 57,710 | | | | 3,388,731 | |
Mylan NV1 | | | 29,110 | | | | 1,062,515 | |
Novo Nordisk AS, Cl. B | | | 42,297 | | | | 1,508,797 | |
Pfizer, Inc. | | | 58,710 | �� | | | 1,861,694 | |
Roche Holding AG | | | 15,627 | | | | 3,585,953 | |
Shire plc | | | 19,180 | | | | 1,083,088 | |
Sun Pharmaceutical Industries Ltd. | | | 34,712 | | | | 386,998 | |
Teva Pharmaceutical Industries Ltd., Sponsored ADR | | | 40,070 | | | | 1,712,592 | |
Valeant Pharmaceuticals International, Inc.1 | | | 31,930 | | | | 569,631 | |
| | | | | | | 26,866,371 | |
| | | | | | | | | |
Industrials—8.3% | | | | | | | | |
Aerospace & Defense—1.1% | | | | | | | | |
Airbus Group SE | | | 151,060 | | | | 8,969,517 | |
Embraer SA, Sponsored ADR | | | 51,670 | | | | 1,105,221 | |
Lockheed Martin Corp. | | | 12,246 | | | | 3,017,170 | |
Rolls-Royce Holdings plc1 | | | 154,492 | | | | 1,372,639 | |
United Technologies Corp. | | | 16,200 | | | | 1,655,640 | |
| | | | | | | 16,120,187 | |
| | | | | | | | | |
Air Freight & Couriers—0.5% | | | | | | | | |
FedEx Corp. | | | 4,040 | | | | 704,253 | |
Royal Mail plc | | | 457,262 | | | | 2,745,348 | |
United Parcel Service, Inc., Cl. B | | | 27,260 | | | | 2,937,537 | |
XPO Logistics, Inc.1 | | | 39,090 | | | | 1,287,234 | |
| | | | | | | 7,674,372 | |
| | | | | | | | | |
Airlines—0.2% | | | | | | | | |
Delta Air Lines, Inc. | | | 31,760 | | | | 1,326,615 | |
Japan Airlines Co. Ltd. | | | 32,900 | | | | 969,770 | |
Southwest Airlines Co. | | | 3,490 | | | | 139,775 | |
| | | | | | | 2,436,160 | |
| | | | | | | | | |
Building Products—0.2% | | | | | | | | |
A.O. Smith Corp. | | | 5,390 | | | | 243,466 | |
Allegion plc | | | 6,390 | | | | 407,938 | |
21 OPPENHEIMER GLOBAL ALLOCATION FUND
| | |
| CONSOLIDATED STATEMENT OF INVESTMENTS Continued | | |
| | | |
| | | | | | | | |
| | | Shares | | | Value | |
Building Products (Continued) | | | | | | | | |
Assa Abloy AB, Cl. B | | | 140,443 | | | $ | 2,551,668 | |
| | | | | | | 3,203,072 | |
| | | | | | | | | |
Commercial Services & Supplies—0.8% | | | | | | | | |
Aggreko plc | | | 63,566 | | | | 623,055 | |
Edenred | | | 81,484 | | | | 1,889,820 | |
Johnson Controls International plc | | | 99,106 | | | | 3,995,954 | |
KAR Auction Services, Inc. | | | 18,850 | | | | 802,633 | |
Prosegur Cia de Seguridad SA | | | 348,437 | | | | 2,530,459 | |
Republic Services, Inc., Cl. A | | | 15,600 | | | | 821,028 | |
Waste Connections, Inc. | | | 15,092 | | | | 1,135,069 | |
Waste Management, Inc. | | | 8,570 | | | | 562,706 | |
| | | | | | | 12,360,724 | |
| | | | | | | | | |
Construction & Engineering—0.5% | | | | | | | | |
Boskalis Westminster | | | 58,758 | | | | 1,894,111 | |
CIMIC Group Ltd. | | | 51,000 | | | | 1,147,714 | |
FLSmidth & Co. AS | | | 16,382 | | | | 594,904 | |
Vinci SA | | | 47,820 | | | | 3,457,097 | |
| | | | | | | 7,093,826 | |
| | | | | | | | | |
Electrical Equipment—1.4% | | | | | | | | |
ABB Ltd.1 | | | 37,532 | | | | 772,303 | |
Acuity Brands, Inc. | | | 1,680 | | | | 375,598 | |
Eaton Corp. plc | | | 28,560 | | | | 1,821,271 | |
Emerson Electric Co. | | | 24,120 | | | | 1,222,402 | |
Legrand SA | | | 28,830 | | | | 1,627,975 | |
Mitsubishi Electric Corp. | | | 125,000 | | | | 1,691,791 | |
Nidec Corp. | | | 73,100 | | | | 7,086,886 | |
Philips Lighting NV1,3 | | | 67,017 | | | | 1,571,107 | |
Prysmian SpA | | | 39,246 | | | | 978,090 | |
Rockwell Automation, Inc. | | | 1,310 | | | | 156,833 | |
Schneider Electric SE | | | 57,350 | | | | 3,853,061 | |
| | | | | | | 21,157,317 | |
| | | | | | | | | |
Industrial Conglomerates—0.8% | | | | | | | | |
3M Co. | | | 16,420 | | | | 2,714,226 | |
General Electric Co. | | | 212,300 | | | | 6,177,930 | |
Jardine Strategic Holdings Ltd. | | | 42,072 | | | | 1,473,652 | |
Siemens AG | | | 10,359 | | | | 1,176,004 | |
SM Investments Corp. | | | 89,494 | | | | 1,241,941 | |
| | | | | | | 12,783,753 | |
| | | | | | | | | |
Machinery—0.9% | | | | | | | | |
Aalberts Industries NV | | | 71,646 | | | | 2,261,095 | |
Atlas Copco AB, Cl. A | | | 73,622 | | | | 2,156,049 | |
Caterpillar, Inc. | | | 7,990 | | | | 666,846 | |
Deere & Co. | | | 30,510 | | | | 2,694,033 | |
FANUC Corp. | | | 8,100 | | | | 1,517,665 | |
Fortive Corp. | | | 2,440 | | | | 124,562 | |
Ingersoll-Rand plc | | | 3,790 | | | | 255,029 | |
Kubota Corp. | | | 20,300 | | | | 327,224 | |
22 OPPENHEIMER GLOBAL ALLOCATION FUND
| | | | | | | | |
| | | Shares | | | Value | |
Machinery (Continued) | | | | | | | | |
Parker-Hannifin Corp. | | | 9,690 | | | $ | 1,189,448 | |
Pentair plc | | | 15,430 | | | | 850,656 | |
Stanley Black & Decker, Inc. | | | 3,230 | | | | 367,703 | |
Wabtec Corp. | | | 6,440 | | | | 497,876 | |
Weir Group plc (The) | | | 31,967 | | | | 663,570 | |
| | | | | | | 13,571,756 | |
| | | | | | | | | |
Professional Services—0.8% | | | | | | | | |
Experian plc | | | 120,987 | | | | 2,323,222 | |
Intertek Group plc | | | 38,920 | | | | 1,626,493 | |
Nielsen Holdings plc | | | 78,760 | | | | 3,545,775 | |
Recruit Holdings Co. Ltd. | | | 84,800 | | | | 3,411,934 | |
SGS SA | | | 589 | | | | 1,193,493 | |
| | | | | | | 12,100,917 | |
| | | | | | | | | |
Road & Rail—0.3% | | | | | | | | |
Canadian National Railway Co. | | | 30,900 | | | | 1,942,683 | |
Canadian Pacific Railway Ltd. | | | 18,000 | | | | 2,573,280 | |
| | | | | | | 4,515,963 | |
| | | | | | | | | |
Trading Companies & Distributors—0.6% | | | | | | | | |
Brenntag AG | | | 70,873 | | | | 3,791,391 | |
Bunzl plc | | | 84,697 | | | | 2,273,795 | |
Travis Perkins plc | | | 89,976 | | | | 1,465,374 | |
Wolseley plc | | | 33,467 | | | | 1,739,019 | |
| | | | | | | 9,269,579 | |
| | | | | | | | | |
Transportation Infrastructure—0.2% | | | | | | | | |
Airports of Thailand PCL | | | 15,800 | | | | 171,951 | |
Beijing Capital International Airport Co. Ltd., Cl. H | | | 946,000 | | | | 991,633 | |
DP World Ltd. | | | 74,172 | | | | 1,331,131 | |
Grupo Aeroportuario del Sureste SAB de CV, Cl. B | | | 31,792 | | | | 506,122 | |
| | | | | | | 3,000,837 | |
| | | | | | | | | |
Information Technology—12.1% | | | | | | | | |
Communications Equipment—0.2% | | | | | | | | |
Cisco Systems, Inc. | | | 60,030 | | | | 1,841,721 | |
Nokia OYJ | | | 350,224 | | | | 1,563,332 | |
Telefonaktiebolaget LM Ericsson, Cl. B | | | 19,706 | | | | 95,869 | |
| | | | | | | 3,500,922 | |
| | | | | | | | | |
Electronic Equipment, Instruments, & Components—1.4% | | | | | | | | |
Corning, Inc. | | | 33,040 | | | | 750,339 | |
Hoya Corp. | | | 56,800 | | | | 2,371,442 | |
Keyence Corp. | | | 9,550 | | | | 7,010,188 | |
Kyocera Corp. | | | 46,800 | | | | 2,276,601 | |
Murata Manufacturing Co. Ltd. | | | 44,500 | | | | 6,206,293 | |
Spectris plc | | | 36,327 | | | | 910,638 | |
TE Connectivity Ltd. | | | 18,720 | | | | 1,176,926 | |
| | | | | | | 20,702,427 | |
| | | | | | | | | |
Internet Software & Services—3.8% | | | | | | | | |
Alibaba Group Holding Ltd., Sponsored ADR1 | | | 61,293 | | | | 6,232,885 | |
23 OPPENHEIMER GLOBAL ALLOCATION FUND
| | |
| CONSOLIDATED STATEMENT OF INVESTMENTS Continued | | |
| | | |
| | | | | | | | |
| | | Shares | | | Value | |
Internet Software & Services (Continued) | | | | | | | | |
Alphabet, Inc., Cl. A1 | | | 13,689 | | | $ | 11,086,721 | |
Alphabet, Inc., Cl. C1 | | | 18,762 | | | | 14,719,540 | |
Baidu, Inc., Sponsored ADR1 | | | 28,320 | | | | 5,008,675 | |
eBay, Inc.1 | | | 28,700 | | | | 818,237 | |
Facebook, Inc., Cl. A1 | | | 83,620 | | | | 10,953,384 | |
MercadoLibre, Inc. | | | 690 | | | | 115,927 | |
NAVER Corp. | | | 1,501 | | | | 1,124,007 | |
Tencent Holdings Ltd. | | | 180,685 | | | | 4,784,492 | |
Twitter, Inc.1 | | | 75,140 | | | | 1,348,763 | |
United Internet AG | | | 29,641 | | | | 1,217,516 | |
Yahoo Japan Corp. | | | 270,300 | | | | 1,037,765 | |
| | | | | | | 58,447,912 | |
| | | | | | | | | |
IT Services—1.4% | | | | | | | | |
Amadeus IT Group SA, Cl. A | | | 50,844 | | | | 2,398,821 | |
Amdocs Ltd. | | | 52,250 | | | | 3,054,013 | |
Cielo SA | | | 9,900 | | | | 100,489 | |
Cognizant Technology Solutions Corp., Cl. A1 | | | 15,250 | | | | 783,087 | |
Earthport plc1 | | | 867,954 | | | | 183,218 | |
First Data Corp., Cl. A1 | | | 47,820 | | | | 669,002 | |
Infosys Ltd. | | | 146,684 | | | | 2,201,479 | |
Mastercard, Inc., Cl. A | | | 22,670 | | | | 2,426,143 | |
PayPal Holdings, Inc.1 | | | 128,820 | | | | 5,366,641 | |
Tata Consultancy Services Ltd. | | | 28,745 | | | | 1,028,544 | |
Visa, Inc., Cl. A | | | 13,212 | | | | 1,090,122 | |
Xerox Corp. | | | 138,780 | | | | 1,355,881 | |
| | | | | | | 20,657,440 | |
| | | | | | | | | |
Semiconductors & Semiconductor Equipment—1.6% | | | | | | | | |
Applied Materials, Inc. | | | 55,170 | | | | 1,604,343 | |
ASML Holding NV | | | 17,606 | | | | 1,862,753 | |
Broadcom Ltd. | | | 20,677 | | | | 3,520,879 | |
Infineon Technologies AG | | | 302,235 | | | | 5,423,573 | |
Maxim Integrated Products, Inc. | | | 100,320 | | | | 3,975,681 | |
Micron Technology, Inc.1 | | | 16,736 | | | | 287,190 | |
NXP Semiconductors NV1 | | | 8,800 | | | | 880,000 | |
SK Hynix, Inc. | | | 44,299 | | | | 1,578,667 | |
Taiwan Semiconductor Manufacturing Co. Ltd. | | | 673,000 | | | | 4,017,017 | |
Texas Instruments, Inc. | | | 24,480 | | | | 1,734,408 | |
| | | | | | | 24,884,511 | |
| | | | | | | | | |
Software—2.4% | | | | | | | | |
Activision Blizzard, Inc. | | | 34,940 | | | | 1,508,360 | |
Adobe Systems, Inc.1 | | | 29,730 | | | | 3,196,272 | |
AVEVA Group plc | | | 14,840 | | | | 333,845 | |
Dassault Systemes | | | 24,738 | | | | 1,960,366 | |
Electronic Arts, Inc.1 | | | 19,000 | | | | 1,491,880 | |
Gemalto NV | | | 24,726 | | | | 1,339,840 | |
Intuit, Inc. | | | 39,350 | | | | 4,278,919 | |
Microsoft Corp. | | | 84,120 | | | | 5,040,470 | |
Oracle Corp. | | | 39,970 | | | | 1,535,647 | |
24 OPPENHEIMER GLOBAL ALLOCATION FUND
| | | | | | | | |
| | | Shares | | | Value | |
Software (Continued) | | | | | | | | |
SAP SE | | | 131,842 | | | $ | 11,612,844 | |
Synopsys, Inc.1 | | | 21,660 | | | | 1,284,655 | |
Temenos Group AG1 | | | 39,566 | | | | 2,551,666 | |
| | | | | | | 36,134,764 | |
| | | | | | | | | |
Technology Hardware, Storage & Peripherals—1.3% | | | | | | | | |
Apple, Inc. | | | 145,611 | | | | 16,532,673 | |
Western Digital Corp. | | | 42,090 | | | | 2,459,740 | |
| | | | | | | 18,992,413 | |
| | | | | | | | | |
Materials—2.1% | | | | | | | | |
Chemicals—1.2% | | | | | | | | |
Akzo Nobel NV | | | 32,444 | | | | 2,095,070 | |
Albemarle Corp. | | | 3,250 | | | | 271,538 | |
Asian Paints Ltd. | | | 15,950 | | | | 256,974 | |
Eastman Chemical Co. | | | 19,130 | | | | 1,375,638 | |
EI du Pont de Nemours & Co. | | | 17,740 | | | | 1,220,335 | |
Essentra plc | | | 169,466 | | | | 1,057,842 | |
Linde AG | | | 30,412 | | | | 5,017,079 | |
Novozymes AS, Cl. B | | | 43,017 | | | | 1,597,317 | |
PPG Industries, Inc. | | | 15,080 | | | | 1,404,400 | |
Sherwin-Williams Co. (The) | | | 1,320 | | | | 323,215 | |
Sika AG | | | 366 | | | | 1,758,440 | |
Syngenta AG1 | | | 4,211 | | | | 1,676,796 | |
| | | | | | | 18,054,644 | |
| | | | | | | | | |
Construction Materials—0.3% | | | | | | | | |
Indocement Tunggal Prakarsa Tbk PT | | | 371,500 | | | | 467,861 | |
James Hardie Industries plc | | | 142,100 | | | | 2,118,031 | |
Semen Indonesia Persero Tbk PT | | | 221,000 | | | | 166,547 | |
UltraTech Cement Ltd. | | | 13,428 | | | | 799,099 | |
Vulcan Materials Co. | | | 12,510 | | | | 1,416,132 | |
| | | | | | | 4,967,670 | |
| | | | | | | | | |
Containers & Packaging—0.2% | | | | | | | | |
CCL Industries, Inc., Cl. B | | | 10,031 | | | | 1,783,937 | |
WestRock Co. | | | 12,370 | | | | 571,370 | |
| | | | | | | 2,355,307 | |
Metals & Mining—0.4% | | | | | | | | |
Alrosa PJSC | | | 655,951 | | | | 917,784 | |
Glencore plc1 | | | 255,570 | | | | 778,869 | |
Goldcorp, Inc. | | | 137,710 | | | | 2,093,192 | |
Newcrest Mining Ltd. | | | 43,900 | | | | 765,557 | |
Real Gold Mining Ltd.1 | | | 273,000 | | | | 352 | |
Silver Wheaton Corp. | | | 44,620 | | | | 1,075,788 | |
Zijin Mining Group Co. Ltd., Cl. H | | | 1,388,000 | | | | 440,481 | |
| | | | | | | 6,072,023 | |
| | | | | | | | | |
Telecommunication Services—2.2% | | | | | | | | |
Diversified Telecommunication Services—1.2% | | | | | | | | |
BT Group plc | | | 335,198 | | | | 1,540,459 | |
25 OPPENHEIMER GLOBAL ALLOCATION FUND
| | |
| CONSOLIDATED STATEMENT OF INVESTMENTS Continued | | |
| | | |
| | | | | | | | | | | | |
| | | | | | Shares | | | Value | |
Diversified Telecommunication Services (Continued) | | | | | | | | | | | | |
Iliad SA | | | | | | | 7,570 | | | $ | 1,587,244 | |
Inmarsat plc | | | | | | | 91,909 | | | | 787,793 | |
Koninklijke KPN NV | | | | | | | 374,395 | | | | 1,220,201 | |
Nippon Telegraph & Telephone Corp. | | | | | | | 125,900 | | | | 5,599,870 | |
Spark New Zealand Ltd. | | | | | | | 906,667 | | | | 2,373,086 | |
Telstra Corp. Ltd. | | | | | | | 337,394 | | | | 1,276,134 | |
Verizon Communications, Inc. | | | | | | | 73,500 | | | | 3,535,350 | |
| | | | | | | | | | | 17,920,137 | |
| | | | | | | | | | | | | |
Wireless Telecommunication Services—1.0% | | | | | | | | | | | | |
China Mobile Ltd. | | | | | | | 195,500 | | | | 2,239,404 | |
KDDI Corp. | | | | | | | 156,000 | | | | 4,744,138 | |
Rogers Communications, Inc., Cl. B | | | | | | | 61,755 | | | | 2,484,381 | |
SK Telecom Co. Ltd. | | | | | | | 9,355 | | | | 1,832,872 | |
T-Mobile US, Inc.1 | | | | | | | 29,110 | | | | 1,447,640 | |
Vodafone Group plc | | | | | | | 1,166,959 | | | | 3,204,144 | |
| | | | | | | | | | | 15,952,579 | |
| | | | | | | | | | | | | |
Utilities—0.6% | | | | | | | | | | | | |
Electric Utilities—0.5% | | | | | | | | | | | | |
Edison International | | | | | | | 39,060 | | �� | | 2,870,129 | |
PG&E Corp. | | | | | | | 65,470 | | | | 4,066,996 | |
| | | | | | | | | | | 6,937,125 | |
| | | | | | | | | | | | |
Gas Utilities—0.1% | | | | | | | | | | | | |
AmeriGas Partners LP2 | | | | | | | 29,385 | | | | 1,403,134 | |
Total Common Stocks (Cost $867,232,544) | | | | | | | | | | | 920,789,466 | |
| | | | | | | | | | | | |
Preferred Stocks—0.4% | | | | | | | | | | | | |
Bayerische Motoren Werke (BMW) AG, Preference | | | | | | | 45,059 | | | | 3,420,337 | |
Lojas Americanas SA, Preference | | | | | | | 401,014 | | | | 2,600,561 | |
Zee Entertainment Enterprises Ltd., 6% Cum. Non-Cv. | | | | | | | 1,175,581 | | | | 168,980 | |
Total Preferred Stocks (Cost $4,768,880) | | | | | | | | | | | 6,189,878 | |
| | | | | | | | | | | | |
| | | | | | Units | | | | |
Rights, Warrants and Certificates—0.0% | | | | | | | | | | | | |
Genting Bhd Wts., Strike Price 7.96MYR, Exp. 12/18/181 (Cost $77,776) | | | | 123,800 | | | | 37,774 | |
| | | | | | | | | |
| | | | | | Principal Amount | | | | |
U.S. Government Obligations—11.0% | | | | | | | | | | | | |
United States Treasury Bonds, 2.875%, 8/15/454 | | | | | | $ | 61,480,000 | | | | 65,252,843 | |
United States Treasury Nts., 1.625%, 2/15/264,5 | | | | | | | 102,828,000 | | | | 101,199,205 | |
Total U.S. Government Obligations (Cost $163,095,947) | | | | | | | | | | | 166,452,048 | |
| | | | | | | | | | | | |
Foreign Government Obligations—4.4% | | | | | | | | | | | | |
Argentine Republic Sr. Unsec. Nts., 16%, 10/17/23 | | | ARS | | | | 4,825,000 | | | | 320,582 | |
Argentine Republic Unsec. Nts., 2.50%, 7/22/216 | | | ARS | | | | 8,915,000 | | | | 637,773 | |
Federative Republic of Brazil Nota Do Tesouro Nacional Unsec. Nts.: | | | | | | | | | | | | |
9.762%, 1/1/21 | | | BRL | | | | 25,965,000 | | | | 7,812,542 | |
10.00%, 1/1/19 | | | BRL | | | | 12,160,000 | | | | 3,838,190 | |
10.00%, 1/1/23 | | | BRL | | | | 6,580,000 | | | | 1,947,888 | |
12.90%, 8/15/22 | | | BRL | | | | 1,200,000 | | | | 1,121,294 | |
26 OPPENHEIMER GLOBAL ALLOCATION FUND
| | | | | | | | | | |
| | | | | Principal Amount | | | Value | |
Foreign Government Obligations (Continued) | | | | | | | | | | |
Hungary Unsec. Bonds: | | | | | | | | | | |
Series 20/A, 7.50%, 11/12/20 | | HUF | | | 116,700,000 | | | $ | 511,435 | |
Series 25/B, 5.50%, 6/24/25 | | HUF | | | 460,000,000 | | | | 1,964,403 | |
Hungary Unsec. Nts., Series 18/A, 5.50%, 12/20/18 | | HUF | | | 326,800,000 | | | | 1,277,736 | |
Malaysia Sr. Unsec. Nts., Series 0315, 3.659%, 10/15/20 | | MYR | | | 11,670,000 | | | | 2,812,331 | |
Republic of Chile Sr. Unsec. Bonds, 5.50%, 8/5/20 | | CLP | | | 350,500,000 | | | | 571,450 | |
Republic of Colombia Sr. Unsec. Bonds: | | | | | | | | | | |
Series B, 7.00%, 5/4/22 | | COP | | | 2,000,000,000 | | | | 671,512 | |
Series B, 7.50%, 8/26/26 | | COP | | | 2,700,000,000 | | | | 909,452 | |
Series B, 7.75%, 9/18/30 | | COP | | | 950,000,000 | | | | 324,657 | |
Series B, 10.00%, 7/24/24 | | COP | | | 2,400,000,000 | | | | 939,997 | |
Republic of Colombia Sr. Unsec. Nts., Series B, 7%, 9/11/19 | | COP | | | 3,185,000,000 | | | | 1,076,110 | |
Republic of Indonesia Treasury Bonds: | | | | | | | | | | |
Series FR59, 7.00%, 5/15/27 | | IDR | | | 23,300,000,000 | | | | 1,739,939 | |
Series FR61, 7.00%, 5/15/22 | | IDR | | | 44,900,000,000 | | | | 3,435,734 | |
Series FR72, 8.25%, 5/15/36 | | IDR | | | 28,900,000,000 | | | | 2,312,235 | |
Series FR73, 8.75%, 5/15/31 | | IDR | | | 18,650,000,000 | | | | 1,599,072 | |
Republic of Peru Sr. Unsec. Bonds: | | | | | | | | | | |
6.35%, 8/12/283 | | PEN | | | 8,335,000 | | | | 2,555,560 | |
6.95%, 8/12/313 | | PEN | | | 760,000 | | | | 246,171 | |
7.84%, 8/12/203 | | PEN | | | 2,180,000 | | | | 718,625 | |
8.20%, 8/12/263 | | PEN | | | 2,255,000 | | | | 796,591 | |
Republic of Poland Unsec. Bonds, Series 0726, 2.50%, 7/25/26 | | PLN | | | 6,960,000 | | | | 1,687,200 | |
Republic of Poland Unsec. Nts., Series 0721, 1.75%, 7/25/21 | | PLN | | | 9,710,000 | | | | 2,400,757 | |
Republic of South Africa Sr. Unsec. Bonds, Series R208, 6.75%, 3/31/21 | | ZAR | | | 42,700,000 | | | | 3,009,510 | |
Republic of South Africa Unsec. Bonds: | | | | | | | | | | |
Series 2023, 7.75%, 2/28/23 | | ZAR | | | 4,700,000 | | | | 337,796 | |
Series 2030, 8.00%, 1/31/30 | | ZAR | | | 22,280,000 | | | | 1,514,567 | |
Series 2037, 8.50%, 1/31/37 | | ZAR | | | 16,550,000 | | | | 1,134,648 | |
Series R186, 10.50%, 12/21/26 | | ZAR | | | 16,975,000 | | | | 1,403,057 | |
Republic of Turkey Unsec. Nts.: | | | | | | | | | | |
8.50%, 7/10/19 | | TRY | | | 1,165,000 | | | | 371,306 | |
8.80%, 11/14/18 | | TRY | | | 1,100,000 | | | | 354,892 | |
10.60%, 2/11/26 | | TRY | | | 1,400,000 | | | | 475,460 | |
10.70%, 2/17/21 | | TRY | | | 1,470,000 | | | | 494,949 | |
Romania Unsec. Bonds, 5.95%, 6/11/21 | | RON | | | 2,840,000 | | | | 804,633 | |
Romania Unsec. Nts., 5.90%, 7/26/17 | | RON | | | 4,770,000 | | | | 1,210,694 | |
Russian Federation Unsec. Bonds, Series 6212, 7.05%, 1/19/28 | | RUB | | | 18,000,000 | | | | 257,290 | |
Russian Federation Unsec. Nts.: | | | | | | | | | | |
Series 6210, 6.80%, 12/11/19 | | RUB | | | 3,200,000 | | | | 48,107 | |
Series 6216, 6.70%, 5/15/19 | | RUB | | | 338,600,000 | | | | 5,137,967 | |
United Mexican States Sr. Unsec. Bonds: | | | | | | | | | | |
Series M, 5.75%, 3/5/26 | | MXN | | | 50,000,000 | | | | 2,556,140 | |
Series M, 8.00%, 12/7/23 | | MXN | | | 3,800,000 | | | | 223,106 | |
Series M20, 8.50%, 5/31/29 | | MXN | | | 17,020,000 | | | | 1,054,457 | |
Series M20, 10.00%, 12/5/24 | | MXN | | | 19,950,000 | | | | 1,314,550 | |
Series M30, 8.50%, 11/18/38 | | MXN | | | 5,880,000 | | | | 373,214 | |
27 OPPENHEIMER GLOBAL ALLOCATION FUND
| | |
| CONSOLIDATED STATEMENT OF INVESTMENTS Continued | | |
| | | |
| | | | | | | | | | | | |
| | | | | | Principal Amount | | | Value | |
Foreign Government Obligations (Continued) | | | | | | | | | | | | |
United Mexican States Unsec. Bonds, Series M30, 10%, 11/20/36 | | | MXN | | | | 2,750,000 | | | $ | 197,766 | |
Total Foreign Government Obligations (Cost $67,132,789) | | | | | | | | | | | 66,503,345 | |
| | | | | | | | | | | | |
Non-Convertible Corporate Bond and Note—0.0% | | | | | | | | | | | | |
Omnicare, Inc., 4.75% Sr. Unsec. Nts., 12/1/22 (Cost $211,231) | | | | | | | 210,000 | | | | 232,039 | |
| | | | | | | | | | | | |
| | | | | | | | | | | | |
Short-Term Note—0.0% | | | | | | | | | | | | |
Letras del Banco Central de la Republica Argentina, 24.36%, 1/18/177 (Cost $663,696) | | | ARS | | | | 10,610,000 | | | | 664,617 | |
| | | | | | | | | | | | |
| | | | | | | Shares | | | | | |
Investment Companies—22.0% | | | | | | | | | | | | |
Oppenheimer Institutional Government Money Market Fund, Cl. E, 0.28%8,9 | | | | 23,914,591 | | | | 23,914,591 | |
Oppenheimer Master Event-Linked Bond Fund, LLC8 | | | | | | | 4,921,101 | | | | 78,768,555 | |
Oppenheimer Master Loan Fund, LLC8 | | | | | | | 7,213,775 | | | | 114,111,539 | |
Oppenheimer Senior Floating Rate Fund, Cl. I8 | | | | | | | 4,985,986 | | | | 40,087,324 | |
PowerShares Senior Loan Portfolio Exchange Traded Fund | | | | | | | 3,351,165 | | | | 77,680,005 | |
Total Investment Companies (Cost $332,528,206) | | | | | | | | | | | 334,562,014 | |
| | | | | | | | | | | | | |
Total Investments, at Value (Cost $1,435,711,069) | | | | | | | 98.5% | | | | 1,495,431,181 | |
Net Other Assets (Liabilities) | | | | | | | 1.5 | | | | 22,586,602 | |
Net Assets | | | | | | | 100.0% | | | $ | 1,518,017,783 | |
| | | | | | | | |
Footnotes to Consolidated Statement of Investments
1. Non-income producing security.
2. Security is a Master Limited Partnership.
3. Represents securities sold under Rule 144A, which are exempt from registration under the Securities Act of 1933, as amended. These securities have been determined to be liquid under guidelines established by the Board of Trustees. These securities amount to $5,948,010 or 0.39% of the Fund’s net assets at period end.
4. All or a portion of the security position is held in accounts at a futures clearing merchant and pledged to cover margin requirements on open futures contracts and written options on futures, if applicable. The aggregate market value of such securities is $21,530,010. See Note 6 of the accompanying Consolidated Notes.
5. All or a portion of the security position is held in segregated accounts and pledged to cover margin requirements under certain derivative contracts. The aggregate market value of such securities is $1,669,135. See Note 6 of the accompanying Consolidated Notes.
6. Denotes an inflation-indexed security: coupon or principal are indexed to a consumer price index.
7. Zero coupon bond reflects effective yield on the original acquisition date.
8. Is or was an affiliate, as defined in the Investment Company Act of 1940, as amended, at or during the reporting period, by virtue of the Fund owning at least 5% of the voting securities of the issuer or as a result of the Fund and the issuer having the same investment adviser. Transactions during the reporting period in which the issuer was an affiliate are as follows:
| | | | | | | | | | | | | | | | |
| | | Shares | | | | | | | | | Shares | |
| | | October 30, | | | Gross | | | Gross | | | October 31, | |
| | | 2015a | | | Additions | | | Reductions | | | 2016 | |
| Oppenheimer Institutional Government Money Market Fund, Cl. Eb | | | 26,662,924 | | | | 860,641,741 | | | | 863,390,074 | | | | 23,914,591 | |
| Oppenheimer Master Event-Linked Bond Fund, LLC | | | 5,734,430 | | | | — | | | | 813,329 | | | | 4,921,101 | |
| Oppenheimer Master Loan Fund, LLC | | | 5,674,937 | | | | 1,538,838 | | | | — | | | | 7,213,775 | |
28 OPPENHEIMER GLOBAL ALLOCATION FUND
Footnotes to Consolidated Statement of Investments (Continued)
| | | | | | | | | | | | | | | | |
| | | Shares | | | | | | | Shares |
| | | October 30, | | | Gross | | Gross | | October 31, |
| | | 2015a | | | Additions | | Reductions | | 2016 |
Oppenheimer Senior Floating Rate Fund, Cl. I | | | — | | | | 6,984,308 | | | | 1,998,322 | | | | 4,985,986 | |
| | | | |
| | | | | | | | | | Realized Gain |
| | | | | | Value | | Income | | (Loss) |
Oppenheimer Institutional Government Money Market Fund, Cl. Eb | | | | | | $ | 23,914,591 | | | $ | 261,936 | | | $ | — | |
Oppenheimer Master Event-Linked Bond Fund, LLC | | | | 78,768,555 | | | | 5,034,656 | c | | | (1,030,431 | )c |
Oppenheimer Master Loan Fund, LLC | | | | | | | 114,111,539 | | | | 5,441,043 | d | | | (2,690,290 | )d |
Oppenheimer Senior Floating Rate Fund, Cl. I | | | | 40,087,324 | | | | 503,104 | | | | 339,715 | |
| | | | | | | | |
Total | | | | | | $ | 256,882,009 | | | $ | 11,240,739 | | | $ | (3,381,006 | ) |
| | | | | | | | |
a. Represents the last business day of the Fund’s reporting period.
b. Prior to September 28, 2016, this fund was named Oppenheimer Institutional Money Market Fund.
c. Represents the amount allocated to the Fund from Oppenheimer Master Event-linked Bond Fund, LLC.
d. Represents the amount allocated to the Fund from Oppenheimer Master Loan Fund, LLC.
9. Rate shown is the 7-day yield at period end.
Distribution of investments representing geographic holdings, as a percentage of total investments at value, is as follows:
| | | | | | | | | | | | | | | | |
| Geographic Holdings (Unaudited) | | Value | | | | | | Percent | | | | |
United States | | $ | 911,240,226 | | | | | | | | 60.9% | | | | | |
France | | | 75,190,677 | | | | | | | | 4.9 | | | | | |
Japan | | | 68,632,279 | | | | | | | | 4.6 | | | | | |
United Kingdom | | | 55,401,431 | | | | | | | | 3.5 | | | | | |
Germany | | | 46,620,893 | | | | | | | | 3.2 | | | | | |
Switzerland | | | 36,317,196 | | | | | | | | 2.4 | | | | | |
China | | | 31,844,261 | | | | | | | | 2.3 | | | | | |
India | | | 30,061,586 | | | | | | | | 2.0 | | | | | |
Canada | | | 27,875,354 | | | | | | | | 1.9 | | | | | |
Brazil | | | 22,753,359 | | | | | | | | 1.5 | | | | | |
Netherlands | | | 19,940,448 | | | | | | | | 1.3 | | | | | |
Spain | | | 15,389,731 | | | | | | | | 1.0 | | | | | |
Russia | | | 13,241,448 | | | | | | | | 0.9 | | | | | |
Hong Kong | | | 12,945,965 | | | | | | | | 0.9 | | | | | |
Mexico | | | 11,263,960 | | | | | | | | 0.8 | | | | | |
Indonesia | | | 11,143,456 | | | | | | | | 0.7 | | | | | |
Sweden | | | 9,754,091 | | | | | | | | 0.7 | | | | | |
Australia | | | 9,153,835 | | | | | | | | 0.6 | | | | | |
South Africa | | | 9,093,789 | | | | | | | | 0.6 | | | | | |
Denmark | | | 8,410,691 | | | | | | | | 0.6 | | | | | |
South Korea | | | 7,770,548 | | | | | | | | 0.5 | | | | | |
Colombia | | | 5,597,666 | | | | | | | | 0.4 | | | | | |
Poland | | | 4,864,046 | | | | | | | | 0.3 | | | | | |
Malaysia | | | 4,737,957 | | | | | | | | 0.3 | | | | | |
Peru | | | 4,415,076 | | | | | | | | 0.3 | | | | | |
Taiwan | | | 4,017,017 | | | | | | | | 0.3 | | | | | |
29 OPPENHEIMER GLOBAL ALLOCATION FUND
| | |
| CONSOLIDATED STATEMENT OF INVESTMENTS Continued | | |
| | | |
| | | | | | | | | | | | | | | | |
| Geographic Holdings (Unaudited) (Continued) | | Value | | | | | Percent | | | |
| |
Singapore | | $ | 3,982,770 | | | | | | | | 0.3 | % | | | | |
Hungary | | | 3,753,574 | | | | | | | | 0.3 | | | | | |
Italy | | | 3,747,260 | | | | | | | | 0.3 | | | | | |
Ireland | | | 3,652,078 | | | | | | | | 0.2 | | | | | |
Philippines | | | 3,112,498 | | | | | | | | 0.2 | | | | | |
Thailand | | | 2,766,539 | | | | | | | | 0.2 | | | | | |
Turkey | | | 2,704,782 | | | | | | | | 0.2 | | | | | |
New Zealand | | | 2,373,086 | | | | | | | | 0.2 | | | | | |
Romania | | | 2,015,327 | | | | | | | | 0.1 | | | | | |
Argentina | | | 1,738,899 | | | | | | | | 0.1 | | | | | |
Israel | | | 1,712,592 | | | | | | | | 0.1 | | | | | |
Finland | | | 1,563,332 | | | | | | | | 0.1 | | | | | |
Belgium | | | 1,424,178 | | | | | | | | 0.1 | | | | | |
United Arab Emirates | | | 1,386,456 | | | | | | | | 0.1 | | | | | |
Egypt | | | 712,716 | | | | | | | | 0.1 | | | | | |
Chile | | | 571,450 | | | | | | | | 0.0 | | | | | |
Nigeria | | | 536,658 | | | | | | | | 0.0 | | | | | |
| | | | |
Total | | $ | 1,495,431,181 | | | | | | | | 100.0 | % | | | | |
| | | | |
| | | | | | | | | | | | | | | | | | | | | | | | |
| |
Forward Currency Exchange Contracts as of October 31, 2016 | | | | | |
Counter -party | | Settlement Month(s) | | | | | Currency
Purchased
(000’s) | | | | | Currency Sold (000’s) | | | Unrealized
Appreciation | | | Unrealized Depreciation | |
| |
BAC | | | 12/2016 | | | USD | | | 2,867 | | | MYR | | | 12,085 | | | $ | — | | | $ | 7,136 | |
BAC | | | 12/2016 | | | USD | | | 7,599 | | | SEK | | | 66,750 | | | | 190,000 | | | | — | |
BAC | | | 12/2016 | | | USD | | | 6,449 | | | TRY | | | 20,260 | | | | — | | | | 28,489 | |
BOA | | | 01/2017 | | | BRL | | | 34,340 | | | USD | | | 10,180 | | | | 370,687 | | | | — | |
BOA | | | 12/2016 | | | CLP | | | 1,719,200 | | | USD | | | 2,519 | | | | 103,608 | | | | — | |
BOA | | | 11/2016 | | | COP | | | 2,286,000 | | | USD | | | 769 | | | | — | | | | 10,981 | |
BOA | | | 12/2016 | | | INR | | | 230,000 | | | USD | | | 3,431 | | | | 3,073 | | | | — | |
BOA | | | 12/2016 | | | JPY | | | 1,201,000 | | | USD | | | 11,488 | | | | — | | | | 12,064 | |
BOA | | | 11/2016 | | | MXN | | | 13,000 | | | USD | | | 700 | | | | — | | | | 13,652 | |
BOA | | | 12/2016 | | | SGD | | | 5,950 | | | USD | | | 4,366 | | | | — | | | | 87,672 | |
BOA | | | 12/2016 | | | THB | | | 61,000 | | | USD | | | 1,745 | | | | — | | | | 3,981 | |
BOA | | | 12/2016 | | | TWD | | | 261,000 | | | USD | | | 8,272 | | | | 1,333 | | | | — | |
BOA | | | 01/2017 | | | USD | | | 1,206 | | | BRL | | | 3,950 | | | | — | | | | 7,446 | |
BOA | | | 12/2016 | | | USD | | | 11,086 | | | CNH | | | 74,630 | | | | 119,477 | | | | — | |
BOA | | | 12/2016 | | | USD | | | 9,303 | | | HKD | | | 72,120 | | | | 797 | | | | — | |
BOA | | | 12/2016 | | | USD | | | 1,034 | | | HUF | | | 293,000 | | | | — | | | | 8,759 | |
BOA | | | 11/2016 - 12/2016 | | | USD | | | 18,664 | | | INR | | | 1,261,000 | | | | 177 | | | | 129,909 | |
BOA | | | 01/2017 | | | USD | | | 13,332 | | | JPY | | | 1,381,000 | | | | 146,725 | | | | 22,579 | |
BOA | | | 12/2016 | | | USD | | | 3,144 | | | KRW | | | 3,461,000 | | | | 119,523 | | | | — | |
BOA | | | 12/2016 | | | USD | | | 12,503 | | | MYR | | | 51,820 | | | | 179,899 | | | | — | |
BOA | | | 12/2016 | | | USD | | | 2,873 | | | ZAR | | | 40,380 | | | | — | | | | 91,306 | |
CITNA-B | | | 12/2016 | | | EUR | | | 10,475 | | | USD | | | 11,520 | | | | 5,045 | | | | — | |
CITNA-B | | | 12/2016 | | | JPY | | | 1,465,000 | | | USD | | | 14,367 | | | | — | | | | 368,183 | |
CITNA-B | | | 12/2016 - 03/2017 | | | PLN | | | 28,770 | | | USD | | | 7,375 | | | | 27,190 | | | | 79,681 | |
CITNA-B | | | 11/2016 - 12/2016 | | | TRY | | | 14,310 | | | USD | | | 4,649 | | | | — | | | | 47,007 | |
CITNA-B | | | 12/2016 | | | USD | | | 5,070 | | | DKK | | | 34,415 | | | | — | | | | 21,303 | |
CITNA-B | | | 12/2016 | | | USD | | | 108,924 | | | EUR | | | 96,640 | | | | 2,593,487 | | | | — | |
30 OPPENHEIMER GLOBAL ALLOCATION FUND
| | | | | | | | | | | | | | | | | | | | | | | | |
| |
Forward Currency Exchange Contracts (Continued) | | | | | |
Counter -party | | Settlement
Month(s) | | | | | Currency Purchased
(000’s) | | | | | Currency Sold (000’s) | | | Unrealized
Appreciation | | | Unrealized Depreciation | |
| |
CITNA-B | | | 12/2016 | | | USD | | | 25,761 | | | GBP | | | 19,501 | | | $ | 1,863,120 | | | $ | — | |
CITNA-B | | | 11/2016 | | | USD | | | 631 | | | RON | | | 2,600 | | | | — | | | | 2,850 | |
CITNA-B | | | 01/2017 | | | USD | | | 1,011 | | | RUB | | | 64,200 | | | | 20,766 | | | | — | |
CITNA-B | | | 12/2016 | | | ZAR | | | 263,280 | | | USD | | | 18,045 | | | | 1,283,234 | | | | — | |
DEU | | | 12/2016 | | | AUD | | | 18,932 | | | USD | | | 14,114 | | | | 269,545 | | | | — | |
DEU | | | 12/2016 | | | NOK | | | 64,850 | | | USD | | | 7,845 | | | | 4,553 | | | | — | |
DEU | | | 12/2016 | | | USD | | | 41,745 | | | CHF | | | 40,445 | | | | 753,154 | | | | — | |
DEU | | | 12/2016 | | | USD | | | 4,549 | | | THB | | | 160,000 | | | | — | | | | 18,210 | |
DEU | | | 12/2016 | | | USD | | | 10,295 | | | ZAR | | | 149,370 | | | | — | | | | 671,367 | |
DEU | | | 12/2016 | | | ZAR | | | 224,920 | | | USD | | | 15,686 | | | | 826,362 | | | | — | |
GSCO-OT | | | 12/2016 | | | MYR | | | 12,610 | | | USD | | | 3,031 | | | | — | | | | 31,359 | |
GSCO-OT | | | 12/2016 | | | SEK | | | 171,450 | | | USD | | | 20,275 | | | | — | | | | 1,243,985 | |
GSCO-OT | | | 11/2016 | | | USD | | | 3,982 | | | BRL | | | 12,490 | | | | 88,268 | | | | — | |
GSCO-OT | | | 11/2016 | | | USD | | | 2,268 | | | PEN | | | 7,660 | | | | — | | | | 6,322 | |
HSBC | | | 12/2016 | | | MXN | | | 91,500 | | | USD | | | 4,623 | | | | 191,583 | | | | — | |
HSBC | | | 12/2016 | | | PHP | | | 30,000 | | | USD | | | 621 | | | | — | | | | 3,855 | |
HSBC | | | 12/2016 | | | THB | | | 157,000 | | | USD | | | 4,497 | | | | — | | | | 14,521 | |
HSBC | | | 12/2016 | | | USD | | | 12,865 | | | CAD | | | 16,965 | | | | 211,684 | | | | — | |
HSBC | | | 12/2016 | | | USD | | | 4,592 | | | CNH | | | 31,090 | | | | 23,518 | | | | — | |
HSBC | | | 12/2016 | | | USD | | | 15,585 | | | EUR | | | 13,810 | | | | 390,292 | | | | — | |
HSBC | | | 12/2016 | | | USD | | | 5,505 | | | HKD | | | 42,680 | | | | 331 | | | | — | |
HSBC | | | 12/2016 | | | USD | | | 1,680 | | | ILS | | | 6,460 | | | | — | | | | 5,893 | |
HSBC | | | 12/2016 | | | USD | | | 1,991 | | | TWD | | | 63,000 | | | | — | | | | 6,322 | |
JPM | | | 12/2016 | | | CLP | | | 7,169,000 | | | USD | | | 10,849 | | | | 87,101 | | | | — | |
JPM | | | 12/2016 | | | COP | | | 13,542,000 | | | USD | | | 4,573 | | | | — | | | | 104,515 | |
JPM | | | 12/2016 | | | IDR | | | 421,776,000 | | | USD | | | 31,481 | | | | 642,802 | | | | — | |
JPM | | | 11/2016 | | | INR | | | 230,000 | | | USD | | | 3,439 | | | | 4,819 | | | | — | |
JPM | | | 12/2016 | | | KRW | | | 9,519,000 | | | USD | | | 8,452 | | | | — | | | | 134,177 | |
JPM | | | 12/2016 | | | MXN | | | 175,200 | | | USD | | | 9,172 | | | | 46,253 | | | | — | |
JPM | | | 12/2016 | | | PHP | | | 56,000 | | | USD | | | 1,168 | | | | — | | | | 16,082 | |
JPM | | | 12/2016 | | | RUB | | | 881,700 | | | USD | | | 13,629 | | | | 113,509 | | | | 25,061 | |
JPM | | | 12/2016 | | | USD | | | 15,982 | | | CAD | | | 21,195 | | | | 173,945 | | | | — | |
JPM | | | 11/2016 | | | USD | | | 476 | | | CLP | | | 312,000 | | | | — | | | | 735 | |
JPM | | | 12/2016 | | | USD | | | 15,443 | | | GBP | | | 12,445 | | | | 238,142 | | | | 46,680 | |
JPM | | | 11/2016 | | | USD | | | 2,858 | | | IDR | | | 37,311,000 | | | | 561 | | | | — | |
JPM | | | 12/2016 | | | USD | | | 1,365 | | | INR | | | 92,000 | | | | — | | | | 4,904 | |
JPM | | | 12/2016 | | | USD | | | 2,430 | | | KRW | | | 2,736,000 | | | | 38,782 | | | | — | |
JPM | | | 12/2016 | | | USD | | | 12,785 | | | MXN | | | 247,800 | | | | — | | | | 253,300 | |
JPM | | | 12/2016 | | | USD | | | 4,598 | | | NZD | | | 6,300 | | | | 101,506 | | | | — | |
JPM | | | 12/2016 | | | USD | | | 4,091 | | | PHP | | | 199,000 | | | | — | | | | 3,001 | |
JPM | | | 12/2016 | | | USD | | | 9,220 | | | RUB | | | 615,100 | | | | — | | | | 349,891 | |
JPM | | | 12/2016 | | | USD | | | 4,724 | | | SGD | | | 6,590 | | | | — | | | | 14,272 | |
JPM | | | 12/2016 | | | USD | | | 3,123 | | | TWD | | | 97,000 | | | | 48,095 | | | | — | |
JPM | | | 11/2016 | | | USD | | | 2,762 | | | ZAR | | | 38,220 | | | | — | | | | 63,865 | |
MSCO | | | 12/2016 | | | NOK | | | 123,710 | | | USD | | | 15,446 | | | | — | | | | 472,205 | |
TDB | | | 11/2016 | | | MXN | | | 12,700 | | | USD | | | 667 | | | | 3,210 | | | | — | |
31 OPPENHEIMER GLOBAL ALLOCATION FUND
| | |
| CONSOLIDATED STATEMENT OF INVESTMENTS Continued | | |
| | | |
| | | | | | | | | | | | | | | | | | | | | | | | | | |
| |
Forward Currency Exchange Contracts (Continued) | | | | | |
Counter -party | | Settlement
Month(s) | | | | | Currency
Purchased
(000’s) | | | | | | Currency Sold
(000’s) | | | Unrealized Appreciation | | | Unrealized Depreciation | |
| |
TDB | | | 12/2016 | | | USD | | | 15,535 | | | | EUR | | | | 13,825 | | | $ | 324,190 | | | $ | — | |
| | | | | | | | | | | | | | | | | | | | | | |
Total Unrealized Appreciation and Depreciation | | | | | | | | | | | $ | 11,610,346 | | | $ | 4,433,520 | |
| | | | | | | | | | | | | | | | | | | | | | |
| | | | | | | | | | | | | | | | | | | | | | | | |
| |
Futures Contracts as of October 31, 2016 | | | | | |
| Description | | Exchange | | | Buy/Sell | | | Expiration
Date | | | Number of
Contracts | | | Value | | | Unrealized
Appreciation (Depreciation) | |
| |
Mini MSCI Emerging Market Index | | | NYF | | | | Sell | | | | 12/16/16 | | | | 1,432 | | | $ | 64,690,600 | | | $ | (384,071) | |
Nikkei 225 Index | | | TYOE | | | | Buy | | | | 12/8/16 | | | | 24 | | | | 3,991,227 | | | | 131,072 | |
S&P 500 E-Mini Index | | | CME | | | | Buy | | | | 12/16/16 | | | | 233 | | | | 24,699,165 | | | | (371,439) | |
STOXX Europe 600 Index | | | EUX | | | | Sell | | | | 12/16/16 | | | | 8,542 | | | | 158,658,507 | | | | 197,407 | |
United States Treasury Long Bonds | | | CBT | | | | Buy | | | | 12/20/16 | | | | 126 | | | | 20,502,563 | | | | (1,018,059) | |
United States Treasury Nts., 5 yr. | | | CBT | | | | Buy | | | | 12/30/16 | | | | 1,456 | | | | 175,880,250 | | | | (1,025,952) | |
United States Treasury Nts., 10 yr. | | | CBT | | | | Buy | | | | 12/20/16 | | | | 276 | | | | 35,776,500 | | | | (451,114) | |
| | | | | | | | | | | | | | | | | | | | | | | | |
| | | | | | | | | | | | | | | | | | | | | | $ | (2,922,156) | |
| | | | | | | | | | | | | | | | | | | | | | | | |
| | | | | | | | | | | | | | | | | | | | | | | | | | | | |
| |
Over-the-Counter Interest Rate Swaps at October 31, 2016 | | | | | |
Counterparty | | Pay/Receive
Floating
Rate | | | Floating Rate | | | Fixed
Rate | | | Maturity
Date | | | Notional Amount (000’s) | | | Value | |
| |
BOA | | | Pay | | |
| Three-Month MYR
KLIBOR BNM |
| | | 3.290% | | | | 10/27/18 | | | | MYR | | | | 10,430 | | | $ | (2,906) | |
| |
BOA | | | Pay | | |
| Three-Month MYR
KLIBOR BNM |
| | | 3.470 | | | | 10/27/21 | | | | MYR | | | | 17,050 | | | | (11,644) | |
| |
CITNA-B | | | Pay | | | | BZDI | | | | 10.910 | | | | 1/2/23 | | | | BRL | | | | 20,400 | | | | (91,407) | |
| |
CITNA-B | | | Pay | | | | BZDI | | | | 10.950 | | | | 1/4/21 | | | | BRL | | | | 6,165 | | | | (17,336) | |
| |
JPM | | | Pay | | |
| Three-Month
COP IBR OIS
Compound |
| | | 6.520 | | | | 10/27/26 | | | | COP | | | | 3,129,000 | | | | 189 | |
| | | | | | | | | | | | | | | | | | | | | | | | | | | | |
Total of Over-the-Counter Interest Rate Swaps | | | | | | | | | | | | | | | | | | | $ | (123,104) | |
| | | | | | | | | | | | | | | | | | | | | | | | | | | | |
| | | | | | | | | | | | | | | | | | | | | | | | | | | | |
| |
Over-the-Counter Total Return Swaps at October 31, 2016 | | | | | |
| Reference Asset | | Counterparty | | | Pay/Receive Total
Return* | | | Floating Rate | | | Maturity
Date | | | | | | Notional
Amount
(000’s) | | | Value | |
| |
iShares iBoxx $ High Yield | | | | | | | | | | | One-Month USD | | | | | | | | | | | | | | | | | |
Corporate Bond Exchange | | | | | | | | | | | BBA LIBOR minus | | | | | | | | | | | | | | | | | |
Traded Fund | | | GSCOI | | | | Receive | | | | 100 basis points | | | | 11/25/16 | | | | USD | | | | 50,531 | | | $ | (613,486) | |
| |
| | | | | | | | | | | One-Month USD | | | | | | | | | | | | | | | | | |
MSCI Daily TR Net | | | | | | | | | | | BBA LIBOR plus | | | | | | | | | | | | | | | | | |
Emerging | | | GSCOI | | | | Receive | | | | 105 basis points | | | | 11/11/16 | | | | USD | | | | 16,719 | | | | (93,964) | |
| |
| | | | | | | | | | | One-Month USD | | | | | | | | | | | | | | | | | |
MSCI Daily TR Net | | | | | | | | | | | BBA LIBOR plus | | | | | | | | | | | | | | | | | |
Emerging Mexico | | | GSCOI | | | | Receive | | | | 56 basis points | | | | 11/11/16 | | | | USD | | | | 14,925 | | | | 440,739 | |
| |
| | | | | | | | | | | One-Month USD | | | | | | | | | | | | | | | | | |
MSCI Daily TR Net | | | | | | | | | | | BBA LIBOR plus | | | | | | | | | | | | | | | | | |
Malaysia | | | GSCOI | | | | Receive | | | | 33 basis points | | | | 11/11/16 | | | | USD | | | | 15,060 | | | | (176,399) | |
32 OPPENHEIMER GLOBAL ALLOCATION FUND
| | | | | | | | | | | | | | | | | | | | | | | | | | | | |
| |
Over-the-Counter Total Return Swaps (Continued) | | | | | |
Reference Asset | | Counterparty | | | Pay/Receive
Total
Return* | | | Floating Rate | | | Maturity
Date | | | | | | Notional
Amount
(000’s) | | | Value | |
| |
| | | | | | | | | | | One-Month USD | | | | | | | | | | | | | | | | | |
MSCI International Net | | | | | | | | | | | BBA LIBOR plus | | | | | | | | | | | | | | | | | |
Brazil | | | GSCOI | | | | Receive | | | | 21 basis points | | | | 11/11/16 | | | | USD | | | | 19,320 | | | $ | 1,675,745 | |
| | | | | | | | | | | | | | | | | | | | | | | | | | | | |
Total of Over-the-Counter Total Return Swaps | | | | | | | | | | | | | | | | | | | $ | 1,232,635 | |
| | | | | | | | | | | | | | | | | | | | | | | | | | | | |
* Fund will pay or receive the total return of the reference asset depending on whether the return is positive or negative. For contracts where the Fund has elected to receive the total return of the reference asset if positive, it will be responsible for paying the floating rate and the total return of the reference asset if negative. If the Fund has elected to pay the total return of the reference asset if positive, it will receive the floating rate and the total return of the reference asset if negative.
| | |
| Glossary: | | |
| Counterparty Abbreviations |
| BAC | | Barclays Bank plc |
| BOA | | Bank of America NA |
| CITNA-B | | Citibank NA |
| DEU | | Deutsche Bank AG |
| GSCO-OT | | Goldman Sachs Bank USA |
| GSCOI | | Goldman Sachs International |
| HSBC | | HSBC Bank USA NA |
| JPM | | JPMorgan Chase Bank NA |
| MSCO | | Morgan Stanley Capital Services, Inc. |
| TDB | | Toronto Dominion Bank |
|
| Currency abbreviations indicate amounts reporting in currencies |
| ARS | | Argentine Peso |
| AUD | | Australian Dollar |
| BRL | | Brazilian Real |
| CAD | | Canadian Dollar |
| CHF | | Swiss Franc |
| CLP | | Chilean Peso |
| CNH | | Offshore Chinese Renminbi |
| COP | | Colombian Peso |
| DKK | | Danish Krone |
| EUR | | Euro |
| GBP | | British Pound Sterling |
| HKD | | Hong Kong Dollar |
| HUF | | Hungarian Forint |
| IDR | | Indonesian Rupiah |
| ILS | | Israeli Shekel |
| INR | | Indian Rupee |
| JPY | | Japanese Yen |
| KRW | | South Korean Won |
| MXN | | Mexican Nuevo Peso |
| MYR | | Malaysian Ringgit |
| NOK | | Norwegian Krone |
| NZD | | New Zealand Dollar |
| PEN | | Peruvian New Sol |
| PHP | | Philippine Peso |
33 OPPENHEIMER GLOBAL ALLOCATION FUND
| | |
| CONSOLIDATED STATEMENT OF INVESTMENTS Continued | | |
| | | |
| | |
| Currency abbreviations indicate amounts reporting in currencies (Continued) |
| PLN | | Polish Zloty |
| RON | | New Romanian Leu |
| RUB | | Russian Ruble |
| SEK | | Swedish Krona |
| SGD | | Singapore Dollar |
| THB | | Thailand Baht |
| TRY | | New Turkish Lira |
| TWD | | New Taiwan Dollar |
| ZAR | | South African Rand |
| |
| Definitions | | |
| BBA LIBOR | | British Bankers’ Association London - Interbank Offered Rate |
| BNM | | Bank Negara Malaysia |
| BZDI | | Brazil Interbank Deposit Rate |
| IBR | | Indicador Bancario de Referencia |
| KLIBOR | | Kuala Lumpur Interbank Offered Rate |
| MSCI | | Morgan Stanley Capital International |
| OIS | | Overnight Index Swap |
| S&P | | Standard & Poor’s |
| TR | | Total Return |
|
| Exchange Abbreviations |
| CBT | | Chicago Board of Trade |
| CME | | Chicago Mercantile Exchanges |
| EUX | | European Stock Exchange |
| NYF | | New York Futures Exchange |
| TYOE | | Tokyo Stock Exchange |
See accompanying Notes to Consolidated Financial Statements.
34 OPPENHEIMER GLOBAL ALLOCATION FUND
| | |
| CONSOLIDATED STATEMENT OF | | |
| ASSETS AND LIABILITIES October 31, 2016 | | |
| | | | | | | | |
Assets | | | | | | | | |
Investments, at value—see accompanying consolidated statement of investments: | | | | | | | | |
Unaffiliated companies (cost $1,181,329,015) | | $ | 1,238,549,172 | | | | | |
Affiliated companies (cost $254,382,054) | | | 256,882,009 | | | | | |
| | | | |
| | | | 1,495,431,181 | | | | | |
Cash | | | 9,918,802 | | | | | |
Cash—foreign currencies (cost $1,120,156) | | | 1,120,558 | | | | | |
Cash used for collateral on futures | | | 10,059,000 | | | | | |
Unrealized appreciation on forward currency exchange contracts | | | 11,610,346 | | | | | |
Swaps, at value | | | 2,116,673 | | | | | |
Receivables and other assets: | | | | | | | | |
Investments sold | | | 9,545,443 | | | | | |
Interest and dividends | | | 4,158,486 | | | | | |
Variation margin receivable | | | 835,052 | | | | | |
Shares of beneficial interest sold | | | 666,706 | | | | | |
Other | | | 259,556 | | | | | |
| | | | |
Total assets | | | 1,545,721,803 | | | | | |
Liabilities | | | | | | | | |
Unrealized depreciation on forward currency exchange contracts | | | 4,433,520 | | | | | |
Swaps, at value | | | 1,007,142 | | | | | |
Payables and other liabilities: | | | | | | | | |
Investments purchased | | | 17,900,617 | | | | | |
Shares of beneficial interest redeemed | | | 2,513,042 | | | | | |
Trustees’ compensation | | | 606,088 | | | | | |
Variation margin payable | | | 377,033 | | | | | |
Distribution and service plan fees | | | 307,512 | | | | | |
Foreign capital gains tax | | | 255,640 | | | | | |
Shareholder communications | | | 34,419 | | | | | |
Other | | | 269,007 | | | | | |
| | | | |
Total liabilities | | | 27,704,020 | | | | | |
|
| |
Net Assets | | $ | 1,518,017,783 | | | | | |
| | | | |
| | | | | | | | |
Composition of Net Assets | | | | | | | | |
Par value of shares of beneficial interest | | $ | 860,036 | | | | | |
Additional paid-in capital | | | 1,866,739,283 | | | | | |
Accumulated net investment income | | | 22,943,380 | | | | | |
Accumulated net realized loss on investments and foreign currency transactions | | | (437,794,591 | ) | | | | |
| Net unrealized appreciation on investments and translation of assets and liabilities denominated in foreign currencies | | | 65,269,675 | | | | | |
| | | | |
Net Assets | | $ | 1,518,017,783 | | | | | |
| | | | |
35 OPPENHEIMER GLOBAL ALLOCATION FUND
| | |
| CONSOLIDATED STATEMENT OF | | |
| ASSETS AND LIABILITIES Continued | | |
| | | | |
Net Asset Value Per Share | |
Class A Shares: | | | | |
| Net asset value and redemption price per share (based on net assets of $1,139,314,893 and 64,106,952 shares of beneficial interest outstanding) | | $ | 17.77 | |
Maximum offering price per share (net asset value plus sales charge of 5.75% of offering price) | | $ | 18.85 | |
| |
Class B Shares: | | | | |
| |
| Net asset value, redemption price (excludes applicable contingent deferred sales charge) and offering price per share (based on net assets of $18,396,599 and 1,074,654 shares of beneficial interest outstanding) | | $ | 17.12 | |
| |
Class C Shares: | | | | |
| |
| Net asset value, redemption price (excludes applicable contingent deferred sales charge) and offering price per share (based on net assets of $238,770,692 and 13,940,934 shares of beneficial interest outstanding) | | $ | 17.13 | |
| |
Class I Shares: | | | | |
| |
| Net asset value, redemption price and offering price per share (based on net assets of $23,444,043 and 1,320,819 shares of beneficial interest outstanding) | | $ | 17.75 | |
| |
Class R Shares: | | | | |
| |
| Net asset value, redemption price (excludes applicable contingent deferred sales charge) and offering price per share (based on net assets of $37,320,671 and 2,136,595 shares of beneficial interest outstanding) | | $ | 17.47 | |
| |
Class Y Shares: | | | | |
| |
| Net asset value, redemption price and offering price per share (based on net assets of $60,770,885 and 3,423,652 shares of beneficial interest outstanding) | | $ | 17.75 | |
See accompanying Notes to Consolidated Financial Statements.
36 OPPENHEIMER GLOBAL ALLOCATION FUND
| | |
| CONSOLIDATED STATEMENT OF | | |
| OPERATIONS For the Year Ended October 31, 2016 | | |
| | | | | | | | |
Allocation of Income and Expenses from Master Funds1 | | | | | | | | |
Net investment income allocated from Oppenheimer Master Event-Linked Bond Fund, LLC: | | | | | | | | |
Interest | | $ | 5,028,910 | | | | | |
Dividends | | | 5,746 | | | | | |
Net expenses | | | (391,297 | ) | | | | |
| | | | |
Net investment income allocated from Oppenheimer Master Event-Linked Bond Fund, LLC | | | 4,643,359 | | | | | |
Net investment income allocated from Oppenheimer Master Loan Fund, LLC: | | | | | | | | |
Interest | | | 5,424,166 | | | | | |
Dividends | | | 16,877 | | | | | |
Net expenses | | | (321,724 | ) | | | | |
| | | | |
Net investment income allocated from Oppenheimer Master Loan Fund, LLC | | | 5,119,319 | | | | | |
| | | | |
Total allocation of net investment income from master funds | | | 9,762,678 | | | | | |
Investment Income | | | | | | | | |
Dividends: | | | | | | | | |
Unaffiliated companies (net of foreign withholding taxes of $936,858) | | | 21,920,486 | | | | | |
Affiliated companies | | | 765,040 | | | | | |
Interest (net of foreign withholding taxes of $154,284) | | | 6,490,086 | | | | | |
Total investment income | | | 29,175,612 | | | | | |
Expenses | | | | | | | | |
Management fees | | | 12,000,038 | | | | | |
Distribution and service plan fees: | | | | | | | | |
Class A | | | 2,795,395 | | | | | |
Class B | | | 244,627 | | | | | |
Class C | | | 2,401,181 | | | | | |
Class R | | | 180,900 | | | | | |
Transfer and shareholder servicing agent fees: | | | | | | | | |
Class A | | | 2,531,557 | | | | | |
Class B | | | 54,050 | | | | | |
Class C | | | 530,330 | | | | | |
Class I | | | 2,925 | | | | | |
Class R | | | 80,329 | | | | | |
Class Y | | | 114,571 | | | | | |
Shareholder communications: | | | | | | | | |
Class A | | | 64,252 | | | | | |
Class B | | | 5,033 | | | | | |
Class C | | | 10,905 | | | | | |
Class I | | | 144 | | | | | |
Class R | | | 1,104 | | | | | |
Class Y | | | 826 | | | | | |
Custodian fees and expenses | | | 94,514 | | | | | |
Trustees’ compensation | | | 40,410 | | | | | |
Borrowing fees | | | 26,792 | | | | | |
Dividends on short sales | | | 15,856 | | | | | |
Other | | | 298,962 | | | | | |
| | | | |
Total expenses | | | 21,494,701 | | | | | |
37 OPPENHEIMER GLOBAL ALLOCATION FUND
| | |
| CONSOLIDATED STATEMENT OF | | |
| OPERATIONS Continued | | |
| | | | | | | | |
Expenses (Continued) | | | | | | | | |
Less reduction to custodian expenses | | $ | (123 | ) | | | | |
Less waivers and reimbursements of expenses | | | (829,513 | ) | | | | |
| | | | |
Net expenses | | | 20,665,065 | | | | | |
Net Investment Income | | | 18,273,225 | | | | | |
Realized and Unrealized Gain (Loss) | | | | | | | | |
Net realized gain (loss) on: | | | | | | | | |
Investments from: | | | | | | | | |
Unaffiliated companies (includes premiums on options exercised)(net of foreign capital gains tax of $53,769) | | | (22,573,335 | ) | | | | |
Affiliated companies | | | 339,715 | | | | | |
Closing and expiration of futures contracts | | | (12,070,612 | ) | | | | |
Foreign currency transactions | | | 9,304,445 | | | | | |
Short positions | | | (65,356 | ) | | | | |
Swap contracts | | | 12,919,062 | | | | | |
Net realized gain (loss) allocated from: | | | | | | | | |
Oppenheimer Master Event-Linked Bond Fund, LLC | | | (1,030,431 | ) | | | | |
Oppenheimer Master Loan Fund, LLC | | | (2,690,290 | ) | | | | |
| | | | |
Net realized loss | | | (15,866,802 | ) | | | | |
Net change in unrealized appreciation/depreciation on: | | | | | | | | |
Investments (net of foreign capital gains tax of $178,461) | | | 19,759,601 | | | | | |
Translation of assets and liabilities denominated in foreign currencies | | | 3,646,394 | | | | | |
Futures contracts | | | 3,764,451 | | | | | |
Swap contracts | | | 907,226 | | | | | |
Net change in unrealized appreciation/depreciation allocated from: | | | | | | | | |
Oppenheimer Master Event-Linked Bond Fund, LLC | | | 2,501,561 | | | | | |
Oppenheimer Master Loan Fund, LLC | | | 5,119,849 | | | | | |
| | | | |
Net change in unrealized appreciation/depreciation | | | 35,699,082 | | | | | |
Net Increase in Net Assets Resulting from Operations | | $ | 38,105,505 | | | | | |
| | | | |
1. The Fund invests in certain affiliated mutual funds that expect to be treated as partnerships for tax purposes. See Note 4 of the accompanying Consolidated Notes.
See accompanying Notes to Consolidated Financial Statements.
38 OPPENHEIMER GLOBAL ALLOCATION FUND
| | |
| |
| CONSOLIDATED STATEMENTS OF CHANGES IN NET ASSETS | | |
| | | | | | | | | | | | |
| | | Year Ended | | Year Ended | | | |
| | | October 31, 2016 | | October 30, 20151 | | | |
Operations | | | | | | | | | | | | |
Net investment income | | $ | 18,273,225 | | | $ | 20,355,322 | | | | | |
Net realized gain (loss) | | | (15,866,802 | ) | | | 192,105,870 | | | | | |
Net change in unrealized appreciation/depreciation | | | 35,699,082 | | | | (178,509,355 | ) | | | | |
| | | | |
Net increase in net assets resulting from operations | | | 38,105,505 | | | | 33,951,837 | | | | | |
| | | | | | | | | | | | |
Dividends and/or Distributions to Shareholders | | | | | | | | | | | | |
Dividends from net investment income: | | | | | | | | | | | | |
Class A | | | (18,412,487 | ) | | | (17,023,110 | ) | | | | |
Class B | | | (321,701 | ) | | | (341,539 | ) | | | | |
Class C | | | (2,844,253 | ) | | | (1,985,156 | ) | | | | |
Class I | | | (180,458 | ) | | | (13,008 | ) | | | | |
Class R | | | (512,956 | ) | | | (438,972 | ) | | | | |
Class Y | | | (849,669 | ) | | | (679,618 | ) | | | | |
| | | | |
| | | (23,121,524 | ) | | | (20,481,403 | ) | | | | |
| | | | | | | | | | | | | |
Beneficial Interest Transactions | | | | | | | | | | | | |
Net increase (decrease) in net assets resulting from beneficial interest transactions: | | | | | | | | | | | | |
Class A | | | (75,162,877 | ) | | | (86,862,338 | ) | | | | |
Class B | | | (14,955,147 | ) | | | (23,313,213 | ) | | | | |
Class C | | | (10,506,659 | ) | | | (16,762,893 | ) | | | | |
Class I | | | 21,912,567 | | | | (2,296,278 | ) | | | | |
Class R | | | 323,979 | | | | (3,186,570 | ) | | | | |
Class Y | | | 14,335,715 | | | | 4,773,129 | | | | | |
| | | | |
| | | (64,052,422 | ) | | | (127,648,163 | ) | | | | |
| | | | | | | | | | | | | |
Net Assets | | | | | | | | | | | | |
Total decrease | | | (49,068,441 | ) | | | (114,177,729 | ) | | | | |
Beginning of period | | | 1,567,086,224 | | | | 1,681,263,953 | | | | | |
| | | | |
End of period (including accumulated net investment income of $22,943,380 and $7,387,255, respectively) | | $ | 1,518,017,783 | | | $ | 1,567,086,224 | | | | | |
| | | | |
1. Represents the last business day of the Fund’s reporting period.
See accompanying Notes to Consolidated Financial Statements.
39 OPPENHEIMER GLOBAL ALLOCATION FUND
| | |
| |
| CONSOLIDATED FINANCIAL HIGHLIGHTS | | |
| | | | | | | | | | | | | | | | | | | | |
| | | Year Ended | | | Year Ended | | | Year Ended | | | Year Ended | | | Year Ended | |
Class A | | October 31, | | | October 30, | | | October 31, | | | October 31, | | | October 31, | |
| | 2016 | | | 20151 | | | 2014 | | | 2013 | | | 2012 | |
| |
Per Share Operating Data | | | | | | | | | | | | | | | | | | | | |
| Net asset value, beginning of period | | | $17.58 | | | | $17.43 | | | | $17.27 | | | | $14.70 | | | | $14.81 | |
| |
| Income (loss) from investment operations: | | | | | | | | | | | | | | | | | | | | |
| Net investment income2 | | | 0.23 | | | | 0.24 | | | | 0.27 | | | | 0.34 | | | | 0.33 | |
| Net realized and unrealized gain (loss) | | | 0.23 | | | | 0.15 | | | | 0.21 | | | | 2.41 | | | | (0.04) | |
| | | | |
| Total from investment operations | | | 0.46 | | | | 0.39 | | | | 0.48 | | | | 2.75 | | | | 0.29 | |
| |
| Dividends and/or distributions to shareholders: | | | | | | | | | | | | | | | | | | | | |
| Dividends from net investment income | | | (0.27) | | | | (0.24) | | | | (0.32) | | | | (0.18) | | | | (0.40) | |
| |
| Net asset value, end of period | | | $17.77 | | | | $17.58 | | | | $17.43 | | | | $17.27 | | | | $14.70 | |
| | | | |
|
| |
Total Return, at Net Asset Value3 | | | 2.72% | | | | 2.26% | | | | 2.85% | | | | 18.81% | | | | 2.14% | |
|
| |
Ratios/Supplemental Data | | | | | | | | | | | | | | | | | | | | |
Net assets, end of period (in thousands) | | | $1,139,315 | | | | $1,203,181 | | | | $1,279,187 | | | | $1,369,331 | | | | $1,294,433 | |
| |
Average net assets (in thousands) | | | $1,150,095 | | | | $1,247,197 | | | | $1,336,323 | | | | $1,327,442 | | | | $1,358,002 | |
| |
| Ratios to average net assets:4,5 | | | | | | | | | | | | | | | | | | | | |
| Net investment income | | | 1.33% | | | | 1.39% | | | | 1.58% | | | | 2.11% | | | | 2.29% | |
| Expenses excluding specific expenses listed below | | | 1.34% | | | | 1.33% | | | | 1.37% | | | | 1.43% | | | | 1.46% | |
| Interest and fees from borrowings | | | 0.00%6 | | | | 0.00%6 | | | | 0.00% | | | | 0.00% | | | | 0.00% | |
| | | | |
| Total expenses7 | | | 1.34% | | | | 1.33% | | | | 1.37% | | | | 1.43% | | | | 1.46% | |
| Expenses after payments, waivers and/or reimbursements and reduction to custodian expenses | | | 1.28% | | | | 1.28% | | | | 1.30% | | | | 1.35% | | | | 1.38% | |
| |
Portfolio turnover rate | | | 84% | | | | 83% | | | | 43% | | | | 37% | | | | 59% | |
1. Represents the last business day of the Fund’s reporting period.
2. Per share amounts calculated based on the average shares outstanding during the period.
3. Assumes an initial investment on the business day before the first day of the fiscal period, with all dividends and distributions reinvested in additional shares on the reinvestment date, and redemption at the net asset value calculated on the last business day of the fiscal period. Sales charges are not reflected in the total returns. Total returns are not annualized for periods less than one full year. Returns do not reflect the deduction of taxes that a shareholder would pay on fund distributions or the redemption of fund shares.
4. Annualized for periods less than one full year.
5. Includes the Fund’s share of the allocated expenses and/or net investment income from the master funds.
6. Less than 0.005%.
7. Total expenses including indirect expenses from affiliated fund fees and expenses were as follows:
| | | | | | | | |
| | | | | | | | |
| | Year Ended October 31, 2016 | | | 1.35 | % | |
| | Year Ended October 30, 2015 | | | 1.33 | % | |
| | Year Ended October 31, 2014 | | | 1.38 | % | |
| | Year Ended October 31, 2013 | | | 1.44 | % | |
| | Year Ended October 31, 2012 | | | 1.46 | % | |
See accompanying Notes to Consolidated Financial Statements.
40 OPPENHEIMER GLOBAL ALLOCATION FUND
| | | | | | | | | | | | | | | | | | | | |
| | | Year Ended | | | Year Ended | | | Year Ended | | | Year Ended | | | Year Ended | |
Class B | | October 31, | | | October 30, | | | October 31, | | | October 31, | | | October 31, | |
| | 2016 | | | 20151 | | | 2014 | | | 2013 | | | 2012 | |
| |
Per Share Operating Data | | | | | | | | | | | | | | | | | | | | |
| Net asset value, beginning of period | | | $16.99 | | | | $16.86 | | | | $16.76 | | | | $14.30 | | | | $14.43 | |
| |
| Income (loss) from investment operations: | | | | | | | | | | | | | | | | | | | | |
| Net investment income2 | | | 0.09 | | | | 0.11 | | | | 0.13 | | | | 0.19 | | | | 0.20 | |
| Net realized and unrealized gain (loss) | | | 0.23 | | | | 0.14 | | | | 0.21 | | | | 2.34 | | | | (0.02) | |
| | | | |
| Total from investment operations | | | 0.32 | | | | 0.25 | | | | 0.34 | | | | 2.53 | | | | 0.18 | |
| |
| Dividends and/or distributions to shareholders: | | | | | | | | | | | | | | | | | | | | |
| Dividends from net investment income | | | (0.19) | | | | (0.12) | | | | (0.24) | | | | (0.07) | | | | (0.31) | |
| |
| Net asset value, end of period | | | $17.12 | | | | $16.99 | | | | $16.86 | | | | $16.76 | | | | $14.30 | |
| | | | |
|
| |
Total Return, at Net Asset Value3 | | | 1.99% | | | | 1.45% | | | | 2.05% | | | | 17.72% | | | | 1.36% | |
|
| |
Ratios/Supplemental Data | | | | | | | | | | | | | | | | | | | | |
Net assets, end of period (in thousands) | | | $18,396 | | | | $33,478 | | | | $56,317 | | | | $84,161 | | | | $102,131 | |
| |
Average net assets (in thousands) | | | $24,510 | | | | $42,919 | | | | $69,381 | | | | $91,497 | | | | $119,580 | |
| |
| Ratios to average net assets:4,5 | | | | | | | | | | | | | | | | | | | | |
| Net investment income | | | 0.54% | | | | 0.63% | | | | 0.79% | | | | 1.24% | | | | 1.46% | |
| Expenses excluding specific expenses listed below | | | 2.12% | | | | 2.08% | | | | 2.21% | | | | 2.42% | | | | 2.41% | |
| Interest and fees from borrowings | | | 0.00%6 | | | | 0.00%6 | | | | 0.00% | | | | 0.00% | | | | 0.00% | |
| | | | |
| Total expenses7 | | | 2.12% | | | | 2.08% | | | | 2.21% | | | | 2.42% | | | | 2.41% | |
| Expenses after payments, waivers and/or reimbursements and reduction to custodian expenses | | | 2.06% | | | | 2.03% | | | | 2.09% | | | | 2.22% | | | | 2.20% | |
| |
Portfolio turnover rate | | | 84% | | | | 83% | | | | 43% | | | | 37% | | | | 59% | |
1. Represents the last business day of the Fund’s reporting period.
2. Per share amounts calculated based on the average shares outstanding during the period.
3. Assumes an initial investment on the business day before the first day of the fiscal period, with all dividends and distributions reinvested in additional shares on the reinvestment date, and redemption at the net asset value calculated on the last business day of the fiscal period. Sales charges are not reflected in the total returns. Total returns are not annualized for periods less than one full year. Returns do not reflect the deduction of taxes that a shareholder would pay on fund distributions or the redemption of fund shares.
4. Annualized for periods less than one full year.
5. Includes the Fund’s share of the allocated expenses and/or net investment income from the master funds.
6. Less than 0.005%.
7. Total expenses including indirect expenses from affiliated fund fees and expenses were as follows:
| | | | | | | | |
| | | | | | | | |
| | Year Ended October 31, 2016 | | | 2.13 | % | |
| | Year Ended October 30, 2015 | | | 2.08 | % | |
| | Year Ended October 31, 2014 | | | 2.22 | % | |
| | Year Ended October 31, 2013 | | | 2.43 | % | |
| | Year Ended October 31, 2012 | | | 2.41 | % | |
See accompanying Notes to Consolidated Financial Statements.
41 OPPENHEIMER GLOBAL ALLOCATION FUND
| | |
| |
| CONSOLIDATED FINANCIAL HIGHLIGHTS Continued | | |
| | | | | | | | | | | | | | | | | | | | |
| | | Year Ended | | | Year Ended | | | Year Ended | | | Year Ended | | | Year Ended | |
Class C | | October 31, | | | October 30, | | | October 31, | | | October 31, | | | October 31, | |
| | 2016 | | | 20151 | | | 2014 | | | 2013 | | | 2012 | |
| |
Per Share Operating Data | | | | | | | | | | | | | | | | | | | | |
| Net asset value, beginning of period | | | $17.00 | | | | $16.88 | | | | $16.78 | | | | $14.31 | | | | $14.44 | |
| |
| Income (loss) from investment operations: | | | | | | | | | | | | | | | | | | | | |
| Net investment income2 | | | 0.10 | | | | 0.11 | | | | 0.14 | | | | 0.22 | | | | 0.22 | |
| Net realized and unrealized gain (loss) | | | 0.23 | | | | 0.14 | | | | 0.21 | | | | 2.33 | | | | (0.03) | |
| | | | |
| Total from investment operations | | | 0.33 | | | | 0.25 | | | | 0.35 | | | | 2.55 | | | | 0.19 | |
| |
| Dividends and/or distributions to shareholders: | | | | | | | | | | | | | | | | | | | | |
| Dividends from net investment income | | | (0.20) | | | | (0.13) | | | | (0.25) | | | | (0.08) | | | | (0.32) | |
| |
| Net asset value, end of period | | | $17.13 | | | | $17.00 | | | | $16.88 | | | | $16.78 | | | | $14.31 | |
| | | | |
|
| |
Total Return, at Net Asset Value3 | | | 1.97% | | | | 1.50% | | | | 2.10% | | | | 17.90% | | | | 1.45% | |
|
| |
Ratios/Supplemental Data | | | | | | | | | | | | | | | | | | | | |
Net assets, end of period (in thousands) | | | $238,771 | | | | $247,445 | | | | $262,594 | | | | $281,444 | | | | $267,392 | |
| |
Average net assets (in thousands) | | | $240,948 | | | | $256,637 | | | | $275,145 | | | | $273,813 | | | | $284,820 | |
| |
| Ratios to average net assets:4,5 | | | | | | | | | | | | | | | | | | | | |
| Net investment income | | | 0.58% | | | | 0.64% | | | | 0.83% | | | | 1.39% | | | | 1.58% | |
| Expenses excluding specific expenses listed below | | | 2.09% | | | | 2.08% | | | | 2.12% | | | | 2.14% | | | | 2.17% | |
| Interest and fees from borrowings | | | 0.00%6 | | | | 0.00%6 | | | | 0.00% | | | | 0.00% | | | | 0.00% | |
| | | | |
| Total expenses7 | | | 2.09% | | | | 2.08% | | | | 2.12% | | | | 2.14% | | | | 2.17% | |
| Expenses after payments, waivers and/or reimbursements and reduction to custodian expenses | | | 2.03% | | | | 2.03% | | | | 2.05% | | | | 2.06% | | | | 2.09% | |
| |
Portfolio turnover rate | | | 84% | | | | 83% | | | | 43% | | | | 37% | | | | 59% | |
1. Represents the last business day of the Fund’s reporting period.
2. Per share amounts calculated based on the average shares outstanding during the period.
3. Assumes an initial investment on the business day before the first day of the fiscal period, with all dividends and distributions reinvested in additional shares on the reinvestment date, and redemption at the net asset value calculated on the last business day of the fiscal period. Sales charges are not reflected in the total returns. Total returns are not annualized for periods less than one full year. Returns do not reflect the deduction of taxes that a shareholder would pay on fund distributions or the redemption of fund shares.
4. Annualized for periods less than one full year.
5. Includes the Fund’s share of the allocated expenses and/or net investment income from the master funds.
6. Less than 0.005%.
7. Total expenses including indirect expenses from affiliated fund fees and expenses were as follows:
| | | | | | | | |
| | | | | | | | |
| | Year Ended October 31, 2016 | | | 2.10 | % | |
| | Year Ended October 30, 2015 | | | 2.08 | % | |
| | Year Ended October 31, 2014 | | | 2.13 | % | |
| | Year Ended October 31, 2013 | | | 2.15 | % | |
| | Year Ended October 31, 2012 | | | 2.17 | % | |
See accompanying Notes to Consolidated Financial Statements.
42 OPPENHEIMER GLOBAL ALLOCATION FUND
| | | | | | | | | | | | | | | | | | | | |
| | | Year Ended | | | Year Ended | | | Year Ended | | | Year Ended | | | Period
Ended | |
Class I | | October 31, | | | October 30, | | | October 31, | | | October 31, | | | October 31, | |
| | 2016 | | | 20151 | | | 2014 | | | 2013 | | | 20122 | |
| |
Per Share Operating Data | | | | | | | | | | | | | | | | | | | | |
| Net asset value, beginning of period | | | $17.56 | | | | $17.41 | | | | $17.25 | | | | $14.69 | | | | $14.98 | |
| |
| Income (loss) from investment operations: | | | | | | | | | | | | | | | | | | | | |
| Net investment income3 | | | 0.29 | | | | 0.31 | | | | 0.32 | | | | 0.34 | | | | 0.37 | |
| Net realized and unrealized gain (loss) | | | 0.25 | | | | 0.16 | | | | 0.24 | | | | 2.48 | | | | (0.53) | |
| | | | |
| Total from investment operations | | | 0.54 | | | | 0.47 | | | | 0.56 | | | | 2.82 | | | | (0.16) | |
| |
| Dividends and/or distributions to shareholders: | | | | | | | | | | | | | | | | | | | | |
| Dividends from net investment income | | | (0.35) | | | | (0.32) | | | | (0.40) | | | | (0.26) | | | | (0.13) | |
| |
| Net asset value, end of period | | | $17.75 | | | | $17.56 | | | | $17.41 | | | | $17.25 | | | | $14.69 | |
| | | | |
|
| |
Total Return, at Net Asset Value4 | | | 3.18% | | | | 2.71% | | | | 3.32% | | | | 19.35% | | | | (1.04)% | |
|
| |
Ratios/Supplemental Data | | | | | | | | | | | | | | | | | | | | |
Net assets, end of period (in thousands) | | | $23,444 | | | | $747 | | | | $3,031 | | | | $775 | | | | $10 | |
| |
Average net assets (in thousands) | | | $9,808 | | | | $877 | | | | $1,075 | | | | $147 | | | | $10 | |
| |
| Ratios to average net assets:5,6 | | | | | | | | | | | | | | | | | | | | |
| Net investment income | | | 1.66% | | | | 1.74% | | | | 1.90% | | | | 2.01% | | | | 3.78% | |
| Expenses excluding specific expenses listed below | | | 0.85% | | | | 0.88% | | | | 0.94% | | | | 0.92% | | | | 0.94% | |
| Interest and fees from borrowings | | | 0.00%7 | | | | 0.00%7 | | | | 0.00% | | | | 0.00% | | | | 0.00% | |
| | | | |
| Total expenses8 | | | 0.85% | | | | 0.88% | | | | 0.94% | | | | 0.92% | | | | 0.94% | |
| Expenses after payments, waivers and/or reimbursements and reduction to custodian expenses | | | 0.79% | | | | 0.83% | | | | 0.87% | | | | 0.84% | | | | 0.89% | |
| |
Portfolio turnover rate | | | 84% | | | | 83% | | | | 43% | | | | 37% | | | | 59% | |
1. Represents the last business day of the Fund’s reporting period.
2. For the period from February 28, 2012 (inception of offering) to October 31, 2012.
3. Per share amounts calculated based on the average shares outstanding during the period.
4. Assumes an initial investment on the business day before the first day of the fiscal period, with all dividends and distributions reinvested in additional shares on the reinvestment date, and redemption at the net asset value calculated on the last business day of the fiscal period. Sales charges are not reflected in the total returns. Total returns are not annualized for periods less than one full year. Returns do not reflect the deduction of taxes that a shareholder would pay on fund distributions or the redemption of fund shares.
5. Annualized for periods less than one full year.
6. Includes the Fund’s share of the allocated expenses and/or net investment income from the master funds.
7. Less than 0.005%.
8. Total expenses including indirect expenses from affiliated fund fees and expenses were as follows:
| | | | | | | | |
| | | | | | | | |
| | Year Ended October 31, 2016 | | | 0.86 | % | |
| | Year Ended October 30, 2015 | | | 0.88 | % | |
| | Year Ended October 31, 2014 | | | 0.95 | % | |
| | Year Ended October 31, 2013 | | | 0.93 | % | |
| | Period Ended October 31, 2012 | | | 0.94 | % | |
See accompanying Notes to Consolidated Financial Statements.
43 OPPENHEIMER GLOBAL ALLOCATION FUND
| | |
| |
| CONSOLIDATED FINANCIAL HIGHLIGHTS Continued | | |
| | | | | | | | | | | | | | | | | | | | |
| | | Year Ended | | | Year Ended | | | Year Ended | | | Year Ended | | | Year Ended | |
Class R | | October 31, | | | October 30, | | | October 31, | | | October 31, | | | October 31, | |
| | 2016 | | | 20151 | | | 2014 | | | 2013 | | | 2012 | |
| |
Per Share Operating Data | | | | | | | | | | | | | | | | | | | | |
| Net asset value, beginning of period | | | $17.29 | | | | $17.15 | | | | $17.01 | | | | $14.48 | | | | $14.60 | |
| |
| Income (loss) from investment operations: | | | | | | | | | | | | | | | | | | | | |
| Net investment income2 | | | 0.18 | | | | 0.20 | | | | 0.23 | | | | 0.29 | | | | 0.29 | |
| Net realized and unrealized gain (loss) | | | 0.24 | | | | 0.14 | | | | 0.20 | | | | 2.38 | | | | (0.04) | |
| | | | |
| Total from investment operations | | | 0.42 | | | | 0.34 | | | | 0.43 | | | | 2.67 | | | | 0.25 | |
| |
| Dividends and/or distributions to shareholders: | | | | | | | | | | | | | | | | | | | | |
| Dividends from net investment income | | | (0.24) | | | | (0.20) | | | | (0.29) | | | | (0.14) | | | | (0.37) | |
| |
| Net asset value, end of period | | | $17.47 | | | | $17.29 | | | | $17.15 | | | | $17.01 | | | | $14.48 | |
| | | | |
|
| |
Total Return, at Net Asset Value3 | | | 2.51% | | | | 1.98% | | | | 2.56% | | | | 18.52% | | | | 1.86% | |
|
| |
Ratios/Supplemental Data | | | | | | | | | | | | | | | | | | | | |
Net assets, end of period (in thousands) | | | $37,321 | | | | $36,537 | | | | $39,483 | | | | $43,683 | | | | $44,700 | |
| |
Average net assets (in thousands) | | | $36,498 | | | | $38,398 | | | | $42,159 | | | | $44,174 | | | | $50,331 | |
| |
| Ratios to average net assets:4,5 | | | | | | | | | | | | | | | | | | | | |
| Net investment income | | | 1.09% | | | | 1.14% | | | | 1.33% | | | | 1.86% | | | | 2.05% | |
| Expenses excluding specific expenses listed below | | | 1.59% | | | | 1.58% | | | | 1.63% | | | | 1.68% | | | | 1.70% | |
| Interest and fees from borrowings | | | 0.00%6 | | | | 0.00%6 | | | | 0.00% | | | | 0.00% | | | | 0.00% | |
| | | | |
| Total expenses7 | | | 1.59% | | | | 1.58% | | | | 1.63% | | | | 1.68% | | | | 1.70% | |
| Expenses after payments, waivers and/or reimbursements and reduction to custodian expenses | | | 1.53% | | | | 1.53% | | | | 1.56% | | | | 1.60% | | | | 1.62% | |
| |
Portfolio turnover rate | | | 84% | | | | 83% | | | | 43% | | | | 37% | | | | 59% | |
1. Represents the last business day of the Fund’s reporting period.
2. Per share amounts calculated based on the average shares outstanding during the period.
3. Assumes an initial investment on the business day before the first day of the fiscal period, with all dividends and distributions reinvested in additional shares on the reinvestment date, and redemption at the net asset value calculated on the last business day of the fiscal period. Sales charges are not reflected in the total returns. Total returns are not annualized for periods less than one full year. Returns do not reflect the deduction of taxes that a shareholder would pay on fund distributions or the redemption of fund shares.
4. Annualized for periods less than one full year.
5. Includes the Fund’s share of the allocated expenses and/or net investment income from the master funds.
6. Less than 0.005%.
7. Total expenses including indirect expenses from affiliated fund fees and expenses were as follows:
| | | | | | | | |
| | | | | | | | |
| | Year Ended October 31, 2016 | | | 1.60 | % | |
| | Year Ended October 30, 2015 | | | 1.58 | % | |
| | Year Ended October 31, 2014 | | | 1.64 | % | |
| | Year Ended October 31, 2013 | | | 1.69 | % | |
| | Year Ended October 31, 2012 | | | 1.70 | % | |
See accompanying Notes to Consolidated Financial Statements.
44 OPPENHEIMER GLOBAL ALLOCATION FUND
| | | | | | | | | | | | | | | | | | | | |
| | | Year Ended | | | Year Ended | | | Year Ended | | | Year Ended | | | Year Ended | |
Class Y | | October 31, | | | October 30, | | | October 31, | | | October 31, | | | October 31, | |
| | 2016 | | | 20151 | | | 2014 | | | 2013 | | | 2012 | |
| |
Per Share Operating Data | | | | | | | | | | | | | | | | | | | | |
| Net asset value, beginning of period | | | $17.56 | | | | $17.42 | | | | $17.26 | | | | $14.69 | | | | $14.80 | |
| |
| Income (loss) from investment operations: | | | | | | | | | | | | | | | | | | | | |
| Net investment income2 | | | 0.28 | | | | 0.29 | | | | 0.32 | | | | 0.40 | | | | 0.38 | |
| Net realized and unrealized gain (loss) | | | 0.23 | | | | 0.14 | | | | 0.22 | | | | 2.41 | | | | (0.03) | |
| | | | |
| Total from investment operations | | | 0.51 | | | | 0.43 | | | | 0.54 | | | | 2.81 | | | | 0.35 | |
| |
| Dividends and/or distributions to shareholders: | | | | | | | | | | | | | | | | | | | | |
| Dividends from net investment income | | | (0.32) | | | | (0.29) | | | | (0.38) | | | | (0.24) | | | | (0.46) | |
| |
| Net asset value, end of period | | | $17.75 | | | | $17.56 | | | | $17.42 | | | | $17.26 | | | | $14.69 | |
| | | | |
|
| |
Total Return, at Net Asset Value3 | | | 2.97% | | | | 2.47% | | | | 3.17% | | | | 19.26% | | | | 2.53% | |
|
| |
Ratios/Supplemental Data | | | | | | | | | | | | | | | | | | | | |
Net assets, end of period (in thousands) | | | $60,771 | | | | $45,698 | | | | $40,652 | | | | $37,264 | | | | $31,958 | |
| |
Average net assets (in thousands) | | | $52,148 | | | | $42,596 | | | | $39,075 | | | | $33,958 | | | | $33,356 | |
| |
| Ratios to average net assets:4,5 | | | | | | | | | | | | | | | | | | | | |
| Net investment income | | | 1.63% | | | | 1.63% | | | | 1.86% | | | | 2.47% | | | | 2.65% | |
| Expenses excluding specific expenses listed below | | | 1.09% | | | | 1.08% | | | | 1.09% | | | | 1.06% | | | | 1.09% | |
| Interest and fees from borrowings | | | 0.00%6 | | | | 0.00%6 | | | | 0.00% | | | | 0.00% | | | | 0.00% | |
| | | | |
| Total expenses7 | | | 1.09% | | | | 1.08% | | | | 1.09% | | | | 1.06% | | | | 1.09% | |
| Expenses after payments, waivers and/or reimbursements and reduction to custodian expenses | | | 1.03% | | | | 1.03% | | | | 1.02% | | | | 0.98% | | | | 1.01% | |
| |
Portfolio turnover rate | | | 84% | | | | 83% | | | | 43% | | | | 37% | | | | 59% | |
1. Represents the last business day of the Fund’s reporting period.
2. Per share amounts calculated based on the average shares outstanding during the period.
3. Assumes an initial investment on the business day before the first day of the fiscal period, with all dividends and distributions reinvested in additional shares on the reinvestment date, and redemption at the net asset value calculated on the last business day of the fiscal period. Sales charges are not reflected in the total returns. Total returns are not annualized for periods less than one full year. Returns do not reflect the deduction of taxes that a shareholder would pay on fund distributions or the redemption of fund shares.
4. Annualized for periods less than one full year.
5. Includes the Fund’s share of the allocated expenses and/or net investment income from the master funds.
6. Less than 0.005%.
7. Total expenses including indirect expenses from affiliated fund fees and expenses were as follows:
| | | | | | | | |
| | | | | | | | |
| | Year Ended October 31, 2016 | | | 1.10 | % | |
| | Year Ended October 30, 2015 | | | 1.08 | % | |
| | Year Ended October 31, 2014 | | | 1.10 | % | |
| | Year Ended October 31, 2013 | | | 1.07 | % | |
| | Year Ended October 31, 2012 | | | 1.09 | % | |
See accompanying Notes to Consolidated Financial Statements.
45 OPPENHEIMER GLOBAL ALLOCATION FUND
| | |
| NOTES TO CONSOLIDATED FINANCIAL STATEMENTS October 31, 2016 | | |
1. Organization
Oppenheimer Global Allocation Fund (the “Fund”) is a diversified open-end management investment company registered under the Investment Company Act of 1940 (“1940 Act”), as amended. The Fund’s investment objective is to seek total return. The Fund’s investment adviser is OFI Global Asset Management, Inc. (“OFI Global” or the “Manager”), a wholly-owned subsidiary of OppenheimerFunds, Inc. (“OFI” or the “Sub-Adviser”). The Manager has entered into a sub-advisory agreement with OFI.
The Fund offers Class A, Class C, Class I, Class R and Class Y shares, and previously offered Class B shares for new purchase through June 29, 2012. Subsequent to that date, no new purchases of Class B shares are permitted, however reinvestment of dividend and/or capital gain distributions and exchanges of Class B shares into and from other Oppenheimer funds are allowed. As of July 1, 2014, Class N shares were renamed Class R shares. Class N shares subject to a contingent deferred sales charge (“CDSC”) on July 1, 2014, continue to be subject to a CDSC after the shares were renamed. Purchases of Class R shares occurring on or after July 1, 2014, are not subject to a CDSC upon redemption. Class A shares are sold at their offering price, which is normally net asset value plus a front-end sales charge. Class C and Class R shares are sold, and Class B shares were sold, without a front-end sales charge but may be subject to a CDSC. Class R shares are sold only through retirement plans. Retirement plans that offer Class R shares may impose charges on those accounts. Class I and Class Y shares are sold to certain institutional investors or intermediaries without either a front-end sales charge or a CDSC, however, the intermediaries may impose charges on their accountholders who beneficially own Class I and Class Y shares. All classes of shares have identical rights and voting privileges with respect to the Fund in general and exclusive voting rights on matters that affect that class alone. Earnings, net assets and net asset value per share may differ due to each class having its own expenses, such as transfer and shareholder servicing agent fees and shareholder communications, directly attributable to that class. Class A, B, C and R shares have separate distribution and/or service plans under which they pay fees. Class I and Class Y shares do not pay such fees. Class B shares will automatically convert to Class A shares 72 months after the date of purchase.
The following is a summary of significant accounting policies followed in the Fund’s preparation of financial statements in accordance with accounting principles generally accepted in the United States (“U.S. GAAP”).
2. Significant Accounting Policies
Security Valuation. All investments in securities are recorded at their estimated fair value, as described in Note 3.
Basis for Consolidation. The Fund has established a Cayman Islands exempted company, Oppenheimer Global Allocation Fund (Cayman) Ltd., which is wholly-owned and controlled by the Fund (the “Subsidiary”). The Fund and Subsidiary are both managed by the Manager. The Fund may invest up to 25% of its total assets in the Subsidiary. The Subsidiary invests primarily in commodity-linked derivatives (including commodity futures, financial futures,
46 OPPENHEIMER GLOBAL ALLOCATION FUND
2. Significant Accounting Policies (Continued)
options and swap contracts) and certain fixed-income securities and other investments that may serve as margin or collateral for its derivatives positions. The Subsidiary is subject to the same investment restrictions and guidelines, and follows the same compliance policies and procedures, as the Fund.
The financial statements have been consolidated and include accounts of the Fund and the Subsidiary. Accordingly, all inter-company transactions and balances have been eliminated. At period end, the Fund owned 899 shares with net assets of $4,422,390 in the Subsidiary.
Other financial information at period end:
| | | | |
Total market value of investments* | | $ | — | |
Net assets | | $ | 4,422,390 | |
Net income (loss) | | $ | (126,274 | ) |
Net realized gain (loss) | | $ | — | |
Net change in unrealized appreciation/depreciation | | $ | — | |
| * | At period end, the Subsidiary only held cash. |
Foreign Currency Translation. The Fund’s accounting records are maintained in U.S. dollars. The values of securities denominated in foreign currencies and amounts related to the purchase and sale of foreign securities and foreign investment income are translated into U.S. dollars as of the close of the New York Stock Exchange (the “Exchange”), normally 4:00 P.M. Eastern time, on each day the Exchange is open for trading. Foreign exchange rates may be valued primarily using a reliable bank, dealer or service authorized by the Board of Trustees.
Reported net realized gains and losses from foreign currency transactions arise from sales of portfolio securities, sales and maturities of short-term securities, sales of foreign currencies, exchange rate fluctuations between the trade and settlement dates on securities transactions, and the difference between the amounts of dividends, interest, and foreign withholding taxes recorded on the Fund’s books and the U.S. dollar equivalent of the amounts actually received or paid. Net unrealized appreciation and depreciation on the translation of assets and liabilities denominated in foreign currencies arise from changes in the values of assets and liabilities, including investments in securities at fiscal period end, resulting from changes in exchange rates.
The effect of changes in foreign currency exchange rates on investments is separately identified from the fluctuations arising from changes in market values of securities held and reported with all other foreign currency gains and losses in the Fund’s Consolidated Statement of Operations.
Allocation of Income, Expenses, Gains and Losses. Income, expenses (other than those attributable to a specific class), gains and losses are allocated on a daily basis to each class of shares based upon the relative proportion of net assets represented by such class. Operating expenses directly attributable to a specific class are charged against the operations of that class.
47 OPPENHEIMER GLOBAL ALLOCATION FUND
| | |
| NOTES TO CONSOLIDATED FINANCIAL STATEMENTS Continued | | |
2. Significant Accounting Policies (Continued)
Dividends and Distributions to Shareholders. Dividends and distributions to shareholders, which are determined in accordance with income tax regulations and may differ from U.S. GAAP, are recorded on the ex-dividend date. Income distributions, if any, are declared and paid quarterly. Capital gain distributions, if any, are declared and paid annually or at other times as deemed necessary by the Manager.
Investment Income. Dividend income is recorded on the ex-dividend date or upon ex-dividend notification in the case of certain foreign dividends where the ex-dividend date may have passed. Non-cash dividends included in dividend income, if any, are recorded at the fair market value of the securities received. Interest income is recognized on an accrual basis. Discount and premium, which are included in interest income on the Consolidated Statement of Operations, are amortized or accreted daily.
Return of Capital Estimates. Distributions received from the Fund’s investments in Master Limited Partnerships (MLPs) and Real Estate Investments Trusts (REITs), generally are comprised of income and return of capital. The Fund records investment income and return of capital based on estimates. Such estimates are based on historical information available from each MLP, REIT and other industry sources. These estimates may subsequently be revised based on information received from MLPs and REITs after their tax reporting periods are concluded.
Custodian Fees. “Custodian fees and expenses” in the Consolidated Statement of Operations may include interest expense incurred by the Fund on any cash overdrafts of its custodian account during the period. Such cash overdrafts may result from the effects of failed trades in portfolio securities and from cash outflows resulting from unanticipated shareholder redemption activity. The Fund pays interest to its custodian on such cash overdrafts, to the extent they are not offset by positive cash balances maintained by the Fund, based on the negative rolling average balance at an average Federal Funds Rate plus 0.50%. The “Reduction to custodian expenses” line item, if applicable, represents earnings on cash balances maintained by the Fund during the period. Such interest expense and other custodian fees may be paid with these earnings.
Security Transactions. Security transactions are recorded on the trade date. Realized gains and losses on securities sold are determined on the basis of identified cost.
Indemnifications. The Fund’s organizational documents provide current and former Trustees and officers with a limited indemnification against liabilities arising in connection with the performance of their duties to the Fund. In the normal course of business, the Fund may also enter into contracts that provide general indemnifications. The Fund’s maximum exposure under these arrangements is unknown as this would be dependent on future claims that may be made against the Fund. The risk of material loss from such claims is considered remote.
48 OPPENHEIMER GLOBAL ALLOCATION FUND
2. Significant Accounting Policies (Continued)
Federal Taxes. The Fund intends to comply with provisions of the Internal Revenue Code applicable to regulated investment companies and to distribute substantially all of its investment company taxable income, including any net realized gain on investments not offset by capital loss carryforwards, if any, to shareholders. Therefore, no federal income or excise tax provision is required. The Fund files income tax returns in U.S. federal and applicable state jurisdictions. The statute of limitations on the Fund’s tax return filings generally remains open for the three preceding fiscal reporting period ends. The Fund has analyzed its tax positions for the fiscal year ended October 31, 2016, including open tax years, and does not believe there are any uncertain tax positions requiring recognition in the Fund’s financial statements.
Subchapter M requires, among other things, that at least 90% of the Fund’s gross income be derived from securities or derived with respect to its business of investing in securities (typically referred to as “qualifying income”). Income from commodity-linked derivatives may not be treated as “qualifying income” for purposes of the 90% gross income requirement. The Internal Revenue Service (IRS) has previously issued a number of private letter rulings which conclude that income derived from commodity index-linked notes and investments in a wholly-owned subsidiary will be “qualifying income.” As a result, the Fund will gain exposure to commodities through commodity-linked notes and its wholly-owned subsidiary.
The IRS has suspended the granting of private letter rulings pending further review. As a result, there can be no assurance that the IRS will not change its position with respect to commodity-linked notes and wholly-owned subsidiaries. In addition, future legislation and guidance from the Treasury and the IRS may adversely affect the Fund’s ability to gain exposure to commodities through commodity-linked notes and its wholly-owned subsidiary.
The Fund is required to include in income for federal income tax purposes all of the subsidiary’s net income and gains whether or not such income is distributed by the subsidiary. Net income and gains from the subsidiary are generally treated as ordinary income by the Fund, regardless of the character of the subsidiary’s underlying income. Net losses from the subsidiary do not pass through to the Fund for federal income tax purposes.
The tax components of capital shown in the following table represent distribution requirements the Fund must satisfy under the income tax regulations, losses the Fund may be able to offset against income and gains realized in future years and unrealized appreciation or depreciation of securities and other investments for federal income tax purposes.
| | | | | | | | | | | | |
| | | | | | | | | Net Unrealized | |
| | | | | | | | | Appreciation | |
| | | | | | | | | Based on cost of | |
| | | | | | | | | Securities and | |
| Undistributed | | Undistributed | | | Accumulated | | | Other Investments | |
| Net Investment | | Long-Term | | | Loss | | | for Federal Income | |
| Income | | Gain | | | Carryforward1,2,3,4 | | | Tax Purposes | |
| |
$39,951,906 | | | $— | | | | $445,293,331 | | | | $56,360,980 | |
1. At period end, the Fund had $445,293,331 of net capital loss carryforward available to offset future realized capital gains, if any, and thereby reduce future taxable gain distributions. Details of the capital loss carryforwards are included in the table below. Capital loss carryovers with no expiration, if any, must be utilized prior to those with expiration dates.
49 OPPENHEIMER GLOBAL ALLOCATION FUND
| | |
| NOTES TO CONSOLIDATED FINANCIAL STATEMENTS Continued | | |
2. Significant Accounting Policies (Continued)
| | | | |
| Expiring | | | |
| |
2017 | | $ | 410,473,446 | |
No expiration | | | 34,819,885 | |
| | | | |
Total | | $ | 445,293,331 | |
| | | | |
2. During the reporting period, the Fund did not utilize any capital loss carryforward.
3. During the previous reporting period, the Fund utilized $204,310,475 of capital loss carryforward to offset capital gains realized in that fiscal year.
4. During the reporting period, $124,429,461 of unused capital loss carryforward expired.
Net investment income (loss) and net realized gain (loss) may differ for financial statement and tax purposes. The character of dividends and distributions made during the fiscal year from net investment income or net realized gains are determined in accordance with federal income tax requirements, which may differ from the character of net investment income or net realized gains presented in those financial statements in accordance with U.S. GAAP. Also, due to timing of dividends and distributions, the fiscal year in which amounts are distributed may differ from the fiscal year in which the income or net realized gain was recorded by the Fund.
Accordingly, the following amounts have been reclassified for the reporting period. Net assets of the Fund were unaffected by the reclassifications.
| | | | | | | | |
Reduction to Paid-in Capital | | Increase to Accumulated
Net Investment
Income | | | Reduction
to Accumulated Net
Realized Loss
on Investments | |
| |
$124,429,461 | | | $20,404,424 | | | | $104,025,037 | |
The tax character of distributions paid during the reporting periods:
| | | | | | | | |
| | | Year Ended
October 31, 2016 | | | Year Ended
October 31, 2015 | |
| |
Distributions paid from: | | | | | | | | |
Ordinary income | | $ | 23,121,524 | | | $ | 20,481,403 | |
The aggregate cost of securities and other investments and the composition of unrealized appreciation and depreciation of securities and other investments for federal income tax purposes at period end are noted in the following table. The primary difference between book and tax appreciation or depreciation of securities and other investments, if applicable, is attributable to the tax deferral of losses or tax realization of financial statement unrealized gain or loss.
50 OPPENHEIMER GLOBAL ALLOCATION FUND
2. Significant Accounting Policies (Continued)
| | | | | | | | |
Federal tax cost of securities | | $ | 1,436,793,301 | | | | | |
Federal tax cost of other investments | | | 49,369,373 | | | | | |
| | | | |
Total federal tax cost | | $ | 1,486,162,674 | | | | | |
| | | | |
Gross unrealized appreciation | | $ | 139,834,217 | | | | | |
Gross unrealized depreciation | | | (83,473,237 | ) | | | | |
| | | | |
Net unrealized appreciation | | $ | 56,360,980 | | | | | |
| | | | |
Certain foreign countries impose a tax on capital gains which is accrued by the Fund based on unrealized appreciation, if any, on affected securities. The tax is paid when the gain is realized.
Use of Estimates. The preparation of financial statements in conformity with U.S. GAAP requires management to make estimates and assumptions that affect the reported amounts of assets and liabilities and disclosure of contingent assets and liabilities at the date of the financial statements and the reported amounts of increases and decreases in net assets from operations during the reporting period. Actual results could differ from those estimates.
3. Securities Valuation
The Fund calculates the net asset value of its shares as of 4:00 P.M. Eastern time, on each day the New York Stock Exchange (the “Exchange”) is open for trading, except in the case of a scheduled early closing of the Exchange, in which case the Fund will calculate net asset value of the shares as of the scheduled early closing time of the Exchange.
The Fund’s Board has adopted procedures for the valuation of the Fund’s securities and has delegated the day-to-day responsibility for valuation determinations under those procedures to the Manager. The Manager has established a Valuation Committee which is responsible for determining a “fair valuation” for any security for which market quotations are not “readily available.” The Valuation Committee’s fair valuation determinations are subject to review, approval and ratification by the Fund’s Board at its next regularly scheduled meeting covering the calendar quarter in which the fair valuation was determined.
Valuation Methods and Inputs
Securities are valued using unadjusted quoted market prices, when available, as supplied primarily by third party pricing services or dealers.
The following methodologies are used to determine the market value or the fair value of the types of securities described below:
Securities traded on a registered U.S. securities exchange (including exchange-traded derivatives other than futures and futures options) are valued based on the last sale price of the security reported on the principal exchange on which it is traded, prior to the time when the Fund’s assets are valued. In the absence of a sale, the security is valued at the mean between the bid and asked price on the principal exchange or, if not available from the principal exchange, obtained from two dealers. If bid and asked prices are not available from either the exchange or two dealers, the security is valued by using one of the following
51 OPPENHEIMER GLOBAL ALLOCATION FUND
| | |
| NOTES TO CONSOLITDATED FINANCIAL STATEMENTS Continued | | |
3. Securities Valuation (Continued)
methodologies (listed in order of priority): (1) a bid from the principal exchange, (2) the mean between the bid and asked price as provided by a single dealer, or (3) a bid from a single dealer. A security of a foreign issuer traded on a foreign exchange, but not listed on a registered U.S. securities exchange, is valued based on the last sale price on the principal exchange on which the security is traded, as identified by the third party pricing service used by the Manager, prior to the time when the Fund’s assets are valued. If the last sale price is unavailable, the security is valued at the most recent official closing price on the principal exchange on which it is traded. If the last sales price or official closing price for a foreign security is not available, the security is valued at the mean between the bid and asked price per the exchange or, if not available from the exchange, obtained from two dealers. If bid and asked prices are not available from either the exchange or two dealers, the security is valued by using one of the following methodologies (listed in order of priority): (1) a bid from the exchange, (2) the mean between the bid and asked price as provided by a single dealer, or (3) a bid from a single dealer.
Shares of a registered investment company that are not traded on an exchange are valued at that investment company’s net asset value per share.
Corporate and government debt securities (of U.S. or foreign issuers) and municipal debt securities, event-linked bonds, loans, mortgage-backed securities, collateralized mortgage obligations, and asset-backed securities are valued at the mean between the “bid” and “asked” prices utilizing evaluated prices obtained from third party pricing services or broker-dealers who may use matrix pricing methods to determine the evaluated prices.
Short-term money market type debt securities with a remaining maturity of sixty days or less are valued at cost adjusted by the amortization of discount or premium to maturity (amortized cost), which approximates market value. Short-term debt securities with a remaining maturity in excess of sixty days are valued at the mean between the “bid” and “asked” prices utilizing evaluated prices obtained from third party pricing services or broker-dealers.
Structured securities, swaps, swaptions, and other over-the-counter derivatives are valued utilizing evaluated prices obtained from third party pricing services or broker-dealers.
Forward foreign currency exchange contracts are valued utilizing current and forward currency rates obtained from third party pricing services. When the settlement date of a contract is an interim date for which a quotation is not available, interpolated values are derived using the nearest dated forward currency rate.
Futures contracts and futures options traded on a commodities or futures exchange will be valued at the final settlement price or official closing price on the principal exchange as reported by such principal exchange at its trading session ending at, or most recently prior to, the time when the Fund’s assets are valued.
A description of the standard inputs that may generally be considered by the third party pricing vendors in determining their evaluated prices is provided below.
52 OPPENHEIMER GLOBAL ALLOCATION FUND
3. Securities Valuation (Continued)
| | |
Security Type | | Standard inputs generally considered by third-party pricing vendors |
| Corporate debt, government debt, municipal, mortgage- backed and asset-backed securities | | Reported trade data, broker-dealer price quotations, benchmark yields, issuer spreads on comparable securities, the credit quality, yield, maturity, and other appropriate factors. |
Loans | | Information obtained from market participants regarding reported trade data and broker-dealer price quotations. |
Event-linked bonds | | Information obtained from market participants regarding reported trade data and broker-dealer price quotations. |
| Structured securities | | Relevant market information such as the price of underlying financial instruments, stock market indices, foreign currencies, interest rate spreads, commodities, or the occurrence of other specific events. |
Swaps | | Relevant market information, including underlying reference assets such as credit spreads, credit event probabilities, index values, individual security values, forward interest rates, variable interest rates, volatility measures, and forward currency rates. |
If a market value or price cannot be determined for a security using the methodologies described above, or if, in the “good faith” opinion of the Manager, the market value or price obtained does not constitute a “readily available market quotation,” or a significant event has occurred that would materially affect the value of the security, the security is fair valued either (i) by a standardized fair valuation methodology applicable to the security type or the significant event as previously approved by the Valuation Committee and the Fund’s Board or (ii) as determined in good faith by the Manager’s Valuation Committee. The Valuation Committee considers all relevant facts that are reasonably available, through either public information or information available to the Manager, when determining the fair value of a security. Fair value determinations by the Manager are subject to review, approval and ratification by the Fund’s Board at its next regularly scheduled meeting covering the calendar quarter in which the fair valuation was determined. Those fair valuation standardized methodologies include, but are not limited to, valuing securities at the last sale price or initially at cost and subsequently adjusting the value based on: changes in company specific fundamentals, changes in an appropriate securities index, or changes in the value of similar securities which may be further adjusted for any discounts related to security-specific resale restrictions. When possible, such methodologies use observable market inputs such as unadjusted quoted prices of similar securities, observable interest rates, currency rates and yield curves. The methodologies used for valuing securities are not necessarily an indication of the risks associated with investing in those securities nor can it be assured that the Fund can obtain the fair value assigned to a security if it were to sell the security.
To assess the continuing appropriateness of security valuations, the Manager, or its third party service provider who is subject to oversight by the Manager, regularly compares prior day prices, prices on comparable securities, and sale prices to the current day prices and challenges those prices exceeding certain tolerance levels with the third party pricing service or broker source. For those securities valued by fair valuations, whether through a standardized fair valuation methodology or a fair valuation determination, the Valuation Committee reviews and affirms the reasonableness of the valuations based on such methodologies and fair valuation determinations on a regular basis after considering all relevant information that is reasonably available.
53 OPPENHEIMER GLOBAL ALLOCATION FUND
| | |
| NOTES TO CONSOLIDATED FINANCIAL STATEMENTS Continued | | |
3. Securities Valuation (Continued)
Classifications
Each investment asset or liability of the Fund is assigned a level at measurement date based on the significance and source of the inputs to its valuation. Various data inputs are used in determining the value of each of the Fund’s investments as of the reporting period end. These data inputs are categorized in the following hierarchy under applicable financial accounting standards:
1) Level 1-unadjusted quoted prices in active markets for identical assets or liabilities (including securities actively traded on a securities exchange)
2) Level 2-inputs other than unadjusted quoted prices that are observable for the asset or liability (such as unadjusted quoted prices for similar assets and market corroborated inputs such as interest rates, prepayment speeds, credit risks, etc.)
3) Level 3-significant unobservable inputs (including the Manager’s own judgments about assumptions that market participants would use in pricing the asset or liability).
The inputs used for valuing securities are not necessarily an indication of the risks associated with investing in those securities.
The Fund classifies each of its investments in investment companies which are publicly offered as Level 1. Investment companies that are not publicly offered are measured using net asset value as a practical expedient, and are not classified in the fair value hierarchy.
The table below categorizes amounts that are included in the Fund’s Consolidated Statement of Assets and Liabilities at period end based on valuation input level:
| | | | | | | | | | | | | | | | |
| | | Level 1—
Unadjusted
Quoted Prices | | | Level 2— Other Significant
Observable Inputs | | | Level 3—
Significant
Unobservable
Inputs | | | Value | |
Assets Table | | | | | | | | | | | | | | | | |
Investments, at Value: | | | | | | | | | | | | | | | | |
Common Stocks | | | | | | | | | | | | | | | | |
Consumer Discretionary | | $ | 66,326,221 | | | $ | 91,332,118 | | | $ | — | | | $ | 157,658,339 | |
Consumer Staples | | | 43,881,771 | | | | 51,963,622 | | | | — | | | | 95,845,393 | |
Energy | | | 23,709,763 | | | | 14,283,640 | | | | — | | | | 37,993,403 | |
Financials | | | 85,055,458 | | | | 62,757,564 | | | | 4 | | | | 147,813,026 | |
Health Care | | | 71,480,520 | | | | 27,727,314 | | | | — | | | | 99,207,834 | |
Industrials | | | 47,318,390 | | | | 77,970,073 | | | | — | | | | 125,288,463 | |
Information Technology | | | 118,129,124 | | | | 65,191,265 | | | | — | | | | 183,320,389 | |
Materials | | | 11,535,545 | | | | 19,913,747 | | | | 352 | | | | 31,449,644 | |
Telecommunication Services | | | 7,467,371 | | | | 26,405,345 | | | | — | | | | 33,872,716 | |
Utilities | | | 8,340,259 | | | | — | | | | — | | | | 8,340,259 | |
Preferred Stocks | | | 168,980 | | | | 6,020,898 | | | | — | | | | 6,189,878 | |
Rights, Warrants and Certificates | | | 37,774 | | | | — | | | | — | | | | 37,774 | |
U.S. Government Obligations | | | — | | | | 166,452,048 | | | | — | | | | 166,452,048 | |
Foreign Government Obligations | | | — | | | | 66,503,345 | | | | — | | | | 66,503,345 | |
54 OPPENHEIMER GLOBAL ALLOCATION FUND
3. Securities Valuation (Continued)
| | | | | | | | | | | | | | | | |
| | | Level 1—
Unadjusted
Quoted Prices | | | Level 2—
Other Significant
Observable Inputs | | | Level 3—
Significant
Unobservable
Inputs | | | Value | |
| |
| Investments, at Value: (Continued) | | | | | | | | | | | | | | | | |
| Non-Convertible Corporate Bond and Note | | $ | — | | | $ | 232,039 | | | $ | — | | | $ | 232,039 | |
| Short-Term Note | | | — | | | | 664,617 | | | | — | | | | 664,617 | |
| Investment Companies | | | 141,681,920 | | | | — | | | | — | | | | 141,681,920 | |
| | | | |
| Total Investments, at Value | | | 625,133,096 | | | | 677,417,635 | | | | 356 | | | | 1,302,551,087 | |
| Other Financial Instruments: | | | | | | | | | | | | | | | | |
| Swaps, at value | | | — | | | | 2,116,673 | | | | — | | | | 2,116,673 | |
| Futures contracts | | | 328,479 | | | | — | | | | — | | | | 328,479 | |
| Forward currency exchange contracts | | | — | | | | 11,610,346 | | | | — | | | | 11,610,346 | |
| | | | |
| Total Assets excluding investment companies valued using practical expedient | | $ | 625,461,575 | | | $ | 691,144,654 | | | $ | 356 | | | | 1,316,606,585 | |
| | | | |
| Investment companies valued using practical expedient | | | | | | | | | | | | | | | 192,880,094 | |
| | | | | | | | | | | | | | | | |
| Total Assets | | | | | | | | | | | | | | $ | 1,509,486,679 | |
| | | | | | | | | | | | | | | | |
| | | | |
| Liabilities Table | | | | | | | | | | | | | | | | |
| Other Financial Instruments: | | | | | | | | | | | | | | | | |
| Swaps, at value | | $ | — | | | $ | (1,007,142) | | | $ | — | | | $ | (1,007,142) | |
| Futures contracts | | | (3,250,635) | | | | — | | | | — | | | | (3,250,635) | |
| Forward currency exchange contracts | | | — | | | | (4,433,520) | | | | — | | | | (4,433,520) | |
| | | | |
| Total Liabilities | | $ | (3,250,635) | | | $ | (5,440,662) | | | $ | — | | | $ | (8,691,297) | |
| | | | |
Forward currency exchange contracts and futures contracts, if any, are reported at their unrealized appreciation/depreciation at measurement date, which represents the change in the contract’s value from trade date. All additional assets and liabilities included in the above table are reported at their market value at measurement date.
The table below shows the transfers between Level 1 and Level 2. The Fund’s policy is to recognize transfers in and transfers out as of the beginning of the reporting period.
| | | | | | | | | | | | | | | | |
| | | Transfers into Level 1* | | | Transfers out
of Level 1** | | | Transfers into
Level 2** | | | Transfers out of
Level 2* | |
| |
Assets Table | | | | | | | | | | | | | | | | |
Investments, at Value: | | | | | | | | | | | | | | | | |
Common Stocks | | | | | | | | | | | | | | | | |
Consumer | | | | | | | | | | | | | | | | |
Discretionary | | $ | — | | | $ | (956,803 | ) | | $ | 956,803 | | | $ | — | |
Consumer | | | | | | | | | | | | | | | | |
Staples | | | — | | | | (1,099,115 | ) | | | 1,099,115 | | | | — | |
Financials | | | — | | | | (3,018,521 | ) | | | 3,018,521 | | | | — | |
Health Care | | | 374,694 | | | | — | | | | — | | | | (374,694 | ) |
55 OPPENHEIMER GLOBAL ALLOCATION FUND
| | |
| NOTES TO CONSOLIDATED FINANCIAL STATEMENTS Continued | | |
3. Securities Valuation (Continued)
| | | | | | | | | | | | | | | | |
| | | Transfers into | | | Transfers out | | | Transfers into | | | Transfers out of | |
| | | Level 1* | | | of Level 1** | | | Level 2** | | | Level 2* | |
| |
Common Stocks (Continued) | | | | | | | | | | | | | | | | |
Industrials | | $ | — | | | $ | (263,065) | | | $ | 263,065 | | | $ | — | |
Preferred Stocks | | | — | | | | (848,432) | | | | 848,432 | | | | — | |
| | | | |
Total Assets | | $ | 374,694 | | | $ | (6,185,936) | | | $ | 6,185,936 | | | $ | (374,694) | |
| | | | |
*Transfers from Level 2 to Level 1 are a result of the availability of quoted prices from an active market which were not available and have become available.
**Transfers from Level 1 to Level 2 are a result of a change from the use of an exchange traded price to a valuation received from a third-party pricing service or a fair valuation determined based on observable market information other than quoted prices from an active market.
4. Investments and Risks
Risks of Foreign Investing. The Fund may invest in foreign securities which are subject to special risks. Securities traded in foreign markets may be less liquid and more volatile than those traded in U.S. markets. Foreign issuers are usually not subject to the same accounting and disclosure requirements that U.S. companies are subject to, which may make it difficult for the Fund to evaluate a foreign company’s operations or financial condition. A change in the value of a foreign currency against the U.S. dollar will result in a change in the U.S. dollar value of investments denominated in that foreign currency and in the value of any income or distributions the Fund may receive on those investments. The value of foreign investments may be affected by exchange control regulations, foreign taxes, higher transaction and other costs, delays in the settlement of transactions, changes in economic or monetary policy in the United States or abroad, expropriation or nationalization of a company’s assets, or other political and economic factors. In addition, due to the inter-relationship of global economies and financial markets, changes in political and economic factors in one country or region could adversely affect conditions in another country or region. Investments in foreign securities may also expose the Fund to time-zone arbitrage risk. Foreign securities may trade on weekends or other days when the Fund does not price its shares. At times, the Fund may emphasize investments in a particular country or region and may be subject to greater risks from adverse events that occur in that country or region. Foreign securities and foreign currencies held in foreign banks and securities depositories may be subject to limited or no regulatory oversight.
Investments in Affiliated Funds. The Fund is permitted to invest in other mutual funds advised by the Manager (“Affiliated Funds”). Affiliated Funds are open-end management investment companies registered under the 1940 Act, as amended. The Manager is the investment adviser of, and the Sub-Adviser provides investment and related advisory services to, the Affiliated Funds. When applicable, the Fund’s investments in Affiliated Funds are included in the Consolidated Statement of Investments. Shares of Affiliated Funds are valued at their net asset value per share. As a shareholder, the Fund is subject to its proportional share of the Affiliated Funds’ expenses, including their management fee. The Manager will waive fees and/or reimburse Fund expenses in an amount equal to the indirect management
56 OPPENHEIMER GLOBAL ALLOCATION FUND
4. Investments and Risks (Continued)
fees incurred through the Fund’s investment in the Affiliated Funds.
Each of the Affiliated Funds in which the Fund invests has its own investment risks, and those risks can affect the value of the Fund’s investments and therefore the value of the Fund’s shares. To the extent that the Fund invests more of its assets in one Affiliated Fund than in another, the Fund will have greater exposure to the risks of that Affiliated Fund.
Investments in Money Market Instruments. The Fund is permitted to invest its free cash balances in money market instruments to provide liquidity or for defensive purposes. The Fund may invest in money market instruments by investing in Class E shares of Oppenheimer Institutional Government Money Market Fund (“IGMMF”), formerly known as Oppenheimer Institutional Money Market Fund, which is an Affiliated Fund. IGMMF is regulated as a money market fund under the 1940 Act, as amended. The Fund may also invest in money market instruments directly or in other affiliated or unaffiliated money market funds.
Investment in Oppenheimer Master Funds. The Fund is permitted to invest in entities sponsored and/or advised by the Manager or an affiliate. Certain of these entities in which the Fund invests are mutual funds registered under the 1940 Act, as amended, that expect to be treated as partnerships for tax purposes, specifically Oppenheimer Master Loan Fund, LLC (“Master Loan”) and Oppenheimer Master Event-Linked Bond Fund, LLC (“Master Event-Linked Bond”) (the “Master Funds”). Each Master Fund has its own investment risks, and those risks can affect the value of the Fund’s investments and therefore the value of the Fund’s shares. To the extent that the Fund invests more of its assets in one Master Fund than in another, the Fund will have greater exposure to the risks of that Master Fund.
The investment objective of Master Loan is to seek income. The investment objective of Master Event-Linked Bond is to seek total return. The Fund’s investments in the Master Funds are included in the Consolidated Statement of Investments. The Fund recognizes income and gain/(loss) on its investments in each Master Fund according to its allocated pro-rata share, based on its relative proportion of total outstanding Master Fund shares held, of the total net income earned and the net gain/(loss) realized on investments sold by the Master Funds. As a shareholder, the Fund is subject to its proportional share of the Master Funds’ expenses, including their management fee. The Manager will waive fees and/or reimburse Fund expenses in an amount equal to the indirect management fees incurred through the Fund’s investment in the Master Funds. The Fund owns 8.0% of Master Loan and 28.9% of Master Event-Linked Bond at period end.
Master Limited Partnerships (“MLPs”). MLPs issue common units that represent an equity ownership interest in a partnership and provide limited voting rights. MLP common units are registered with the Securities and Exchange Commission (“SEC”), and are freely tradable on securities exchanges such as the NYSE and the NASDAQ Stock Market (“NASDAQ”), or in the over-the-counter (“OTC”) market. An MLP consists of one or more general partners, who conduct the business, and one or more limited partners, who contribute capital. MLP common unit holders have a limited role in the partnership’s operations and
57 OPPENHEIMER GLOBAL ALLOCATION FUND
| | |
| NOTES TO CONSOLIDATED FINANCIAL STATEMENTS Continued | | |
4. Investments and Risks (Continued)
management. The Fund, as a limited partner, normally would not be liable for the debts of the MLP beyond the amounts the Fund has contributed, but would not be shielded to the same extent that a shareholder of a corporation would be. In certain circumstances creditors of an MLP would have the right to seek return of capital distributed to a limited partner. This right of an MLP’s creditors would continue after the Fund sold its investment in the MLP.
Loans. The Fund invests in loans made to U.S. and foreign borrowers that are corporations, partnerships or other business entities. The Fund will do so directly as an original lender or by assignment or indirectly through participation agreements or certain derivative instruments. While many of these loans will be collateralized, the Fund can also invest in uncollateralized loans. Loans are often issued in connection with recapitalizations, acquisitions, leveraged buyouts, and refinancing of borrowers. The loans often pay interest at rates that float above (or are adjusted periodically based on) a benchmark that reflects current interest rates although the Fund can also invest in loans with fixed interest rates.
Equity Security Risk. Stocks and other equity securities fluctuate in price. The value of the Fund’s portfolio may be affected by changes in the equity markets generally. Equity markets may experience significant short-term volatility and may fall sharply at times. Different markets may behave differently from each other and U.S. equity markets may move in the opposite direction from one or more foreign stock markets. Adverse events in any part of the equity or fixed-income markets may have unexpected negative effects on other market segments.
The prices of individual equity securities generally do not all move in the same direction at the same time and a variety of factors can affect the price of a particular company’s securities. These factors may include, but are not limited to, poor earnings reports, a loss of customers, litigation against the company, general unfavorable performance of the company’s sector or industry, or changes in government regulations affecting the company or its industry.
Sovereign Debt Risk. The Fund invests in sovereign debt securities, which are subject to certain special risks. These risks include, but are not limited to, the risk that a governmental entity may delay or refuse, or otherwise be unable, to pay interest or repay the principal on its sovereign debt. There may also be no legal process for collecting sovereign debt that a government does not pay or bankruptcy proceedings through which all or part of such sovereign debt may be collected. In addition, a restructuring or default of sovereign debt may also cause additional impacts to the financial markets, such as downgrades to credit ratings, reduced liquidity and increased volatility, among others.
5. Market Risk Factors
The Fund’s investments in securities and/or financial derivatives may expose the Fund to various market risk factors:
Commodity Risk. Commodity risk relates to the change in value of commodities or commodity indexes as they relate to increases or decreases in the commodities market.
58 OPPENHEIMER GLOBAL ALLOCATION FUND
5. Market Risk Factors (Continued)
Commodities are physical assets that have tangible properties. Examples of these types of assets are crude oil, heating oil, metals, livestock, and agricultural products.
Credit Risk. Credit risk relates to the ability of the issuer of debt to meet interest and principal payments, or both, as they come due. In general, lower-grade, higher-yield debt securities are subject to credit risk to a greater extent than lower-yield, higher-quality securities.
Equity Risk. Equity risk relates to the change in value of equity securities as they relate to increases or decreases in the general market.
Foreign Exchange Rate Risk. Foreign exchange rate risk relates to the change in the U.S. dollar value of a security held that is denominated in a foreign currency. The U.S. dollar value of a foreign currency denominated security will decrease as the dollar appreciates against the currency, while the U.S. dollar value will increase as the dollar depreciates against the currency.
Interest Rate Risk. Interest rate risk refers to the fluctuations in value of fixed-income securities resulting from the inverse relationship between price and yield. For example, an increase in general interest rates will tend to reduce the market value of already issued fixed-income investments, and a decline in general interest rates will tend to increase their value. In addition, debt securities with longer maturities, which tend to have higher yields, are subject to potentially greater fluctuations in value from changes in interest rates than obligations with shorter maturities.
Volatility Risk. Volatility risk refers to the magnitude of the movement, but not the direction of the movement, in a financial instrument’s price over a defined time period. Large increases or decreases in a financial instrument’s price over a relative time period typically indicate greater volatility risk, while small increases or decreases in its price typically indicate lower volatility risk.
6. Use of Derivatives
The Fund’s investment objective not only permits the Fund to purchase investment securities, it also allows the Fund to enter into various types of derivatives contracts, including, but not limited to, futures contracts, forward currency exchange contracts, credit default swaps, interest rate swaps, total return swaps, variance swaps and purchased and written options. In doing so, the Fund will employ strategies in differing combinations to permit it to increase, decrease, or change the level or types of exposure to market risk factors. These instruments may allow the Fund to pursue its objectives more quickly and efficiently than if it were to make direct purchases or sales of securities capable of effecting a similar response to market factors. Such contracts may be entered into through a bilateral over-the-counter (“OTC”) transaction, or through a securities or futures exchange and cleared through a clearinghouse.
Derivatives may have little or no initial cash investment relative to their market value exposure and therefore can produce significant gains or losses in excess of their cost due to unanticipated changes in the market risk factors and the overall market. This use of embedded leverage allows the Fund to increase its market value exposure relative to its net assets and
59 OPPENHEIMER GLOBAL ALLOCATION FUND
| | |
| NOTES TO CONSOLIDATED FINANCIAL STATEMENTS Continued | | |
6. Use of Derivatives (Continued)
can substantially increase the volatility of the Fund’s performance. In instances where the Fund is using derivatives to decrease, or hedge, exposures to market risk factors for securities held by the Fund, there are also risks that those derivatives may not perform as expected resulting in losses for the combined or hedged positions. Some derivatives have the potential for unlimited loss, regardless of the size of the Fund’s initial investment.
Additional associated risks from investing in derivatives also exist and potentially could have significant effects on the valuation of the derivative and the Fund. Typically, the associated risks are not the risks that the Fund is attempting to increase or decrease exposure to, per its investment objectives, but are the additional risks from investing in derivatives. Examples of these associated risks are liquidity risk, which is the risk that the Fund will not be able to sell the derivative in the open market in a timely manner, and counterparty credit risk, which is the risk that the counterparty will not fulfill its obligation to the Fund.
The Fund’s actual exposures to these market risk factors and associated risks during the period are discussed in further detail, by derivative type, below.
Forward Currency Exchange Contracts
The Fund may enter into forward currency exchange contracts (“forward contracts”) for the purchase or sale of a foreign currency at a negotiated rate at a future date. Such contracts are traded in the OTC inter-bank currency dealer market.
Forward contracts are reported on a schedule following the Consolidated Statement of Investments. The unrealized appreciation (depreciation) is reported in the Consolidated Statement of Assets and Liabilities as a receivable (or payable) and in the Consolidated Statement of Operations within the change in unrealized appreciation (depreciation). At contract close, the difference between the original cost of the contract and the value at the close date is recorded as a realized gain (loss) in the Consolidated Statement of Operations.
The Fund has entered into forward contracts with the obligation to purchase specified foreign currencies in the future at a currently negotiated forward rate in order to take a positive investment perspective on the related currency. These forward contracts seek to increase exposure to foreign exchange rate risk.
The Fund has entered into forward contracts with the obligation to purchase specified foreign currencies in the future at a currently negotiated forward rate in order to decrease exposure to foreign exchange rate risk associated with foreign currency denominated securities held by the Fund.
The Fund has entered into forward contracts with the obligation to sell specified foreign currencies in the future at a currently negotiated forward rate in order to take a negative investment perspective on the related currency. These forward contracts seek to increase exposure to foreign exchange rate risk.
The Fund has entered into forward contracts with the obligation to sell specified foreign currencies in the future at a currently negotiated forward rate in order to decrease exposure to foreign exchange rate risk associated with foreign currency denominated securities held by the Fund.
During the reporting period, the Fund had daily average contract amounts on forward
60 OPPENHEIMER GLOBAL ALLOCATION FUND
6. Use of Derivatives (Continued)
contracts to buy and sell of $270,271,798 and $398,067,399, respectively.
Additional associated risk to the Fund includes counterparty credit risk. Counterparty credit risk arises from the possibility that the counterparty to a forward contract will default and fail to perform its obligations to the Fund.
Futures Contracts
A futures contract is a commitment to buy or sell a specific amount of a commodity, financial instrument or currency at a negotiated price on a stipulated future date. The Fund may buy and sell futures contracts and may also buy or write put or call options on these futures contracts. Futures contracts and options thereon are generally entered into on a regulated futures exchange and cleared through a clearinghouse associated with the exchange.
Upon entering into a futures contract, the Fund is required to deposit either cash or securities (initial margin) in an amount equal to a certain percentage of the contract value in an account registered in the futures commission merchant’s name. Subsequent payments (variation margin) are paid to or from the futures commission merchant each day equal to the daily changes in the contract value. Such payments are recorded as unrealized gains and losses. Should the Fund fail to make requested variation margin payments, the futures commission merchant can gain access to the initial margin to satisfy the Fund’s payment obligations.
Futures contracts are reported on a schedule following the Consolidated Statement of Investments. Securities held by a futures commission merchant to cover initial margin requirements on open futures contracts are noted in the Consolidated Statement of Investments. Cash held by a futures commission merchant to cover initial margin requirements on open futures contracts and the receivable and/or payable for the daily mark to market for the variation margin are noted in the Consolidated Statement of Assets and Liabilities. The net change in unrealized appreciation and depreciation is reported in the Consolidated Statement of Operations. Realized gains (losses) are reported in the Consolidated Statement of Operations at the closing or expiration of futures contracts.
The Fund has purchased futures contracts on various bonds and notes to increase exposure to interest rate risk.
The Fund has purchased futures contracts on various equity indexes to increase exposure to equity risk.
The Fund has sold futures contracts on various equity indexes to decrease exposure to equity risk.
During the reporting period, the Fund had an ending monthly average market value of $198,992,141 and $166,405,501 on futures contracts purchased and sold, respectively.
Additional associated risks of entering into futures contracts (and related options) include the possibility that there may be an illiquid market where the Fund is unable to liquidate the contract or enter into an offsetting position and, if used for hedging purposes, the risk that the price of the contract will correlate imperfectly with the prices of the Fund’s securities.
61 OPPENHEIMER GLOBAL ALLOCATION FUND
| | |
| NOTES TO CONSOLIDATED FINANCIAL STATEMENTS Continued | | |
6. Use of Derivatives (Continued)
Option Activity
The Fund may buy and sell put and call options, or write put and call options. When an option is written, the Fund receives a premium and becomes obligated to sell or purchase the underlying security, currency or other underlying financial instrument at a fixed price, upon exercise of the option.
Options can be traded through an exchange or through a privately negotiated arrangement with a dealer in an OTC transaction. Options traded through an exchange are generally cleared through a clearinghouse (such as The Options Clearing Corporation). The difference between the premium received or paid, and market value of the option, is recorded as unrealized appreciation or depreciation. The net change in unrealized appreciation or depreciation is reported in the Consolidated Statement of Operations. When an option is exercised, the cost of the security purchased or the proceeds of the security sale are adjusted by the amount of premium received or paid. Upon the expiration or closing of the option transaction, a gain or loss is reported in the Consolidated Statement of Operations.
The Fund has purchased put options on treasury and/or euro futures to decrease exposure to interest rate risk. A purchased put option becomes more valuable as the price of the underlying financial instrument depreciates relative to the strike price.
The Fund has purchased call options on individual equity securities and/or equity indexes to increase exposure to equity risk. A purchased call option becomes more valuable as the price of the underlying financial instrument appreciates relative to the strike price.
The Fund has purchased put options on individual equity securities and/or equity indexes to decrease exposure to equity risk. A purchased put option becomes more valuable as the price of the underlying financial instrument depreciates relative to the strike price.
During the reporting period, the Fund had an ending monthly average market value of $815,592 and $51,352 on purchased call options and purchased put options, respectively.
Options written, if any, are reported in a schedule following the Consolidated Statement of Investments and as a liability in the Consolidated Statement of Assets and Liabilities. Securities held in collateral accounts to cover potential obligations with respect to outstanding written options are noted in the Consolidated Statement of Investments.
The risk in writing a call option is that the market price of the security increases and if the option is exercised, the Fund must either purchase the security at a higher price for delivery or, if the Fund owns the underlying security, give up the opportunity for profit. The risk in writing a put option is that the Fund may incur a loss if the market price of the security decreases and the option is exercised. The risk in buying an option is that the Fund pays a premium whether or not the option is exercised. The Fund also has the additional risk that there may be an illiquid market where the Fund is unable to close the contract.
The Fund has written call options on treasury and/or euro futures to decrease exposure to interest rate risk. A written call option becomes more valuable as the price of the underlying financial instrument depreciates relative to the strike price.
During the reporting period, the Fund had an ending monthly average market value of $75,827 written call options.
62 OPPENHEIMER GLOBAL ALLOCATION FUND
6. Use of Derivatives (Continued)
At period end, the Fund had no purchased or written options outstanding.
Additional associated risks to the Fund include counterparty credit risk and liquidity risk.
Written option activity for the reporting period was as follows:
| | | | | | | | |
| | | Number of
Contracts | | | Amount of
Premiums | |
| |
| Options outstanding as of October 30, 2015 | | | – | | | $ | – | |
| Options written | | | 2,681 | | | | 888,145 | |
| Options exercised | | | (2,681) | | | | (888,145) | |
| | | | |
| Options outstanding as of October 31, 2016 | | | – | | | $ | – | |
| | | | |
Swap Contracts
The Fund may enter into swap contract agreements with a counterparty to exchange a series of cash flows based on either specified reference rates, the price or volatility of asset or non-asset references, or the occurrence of a credit event, over a specified period. Swaps can be executed in a bi-lateral privately negotiated arrangement with a dealer in an OTC transaction (“OTC swaps”) or executed on a regulated market. Certain swaps, regardless of the venue of their execution, are required to be cleared through a clearinghouse (“centrally cleared swaps”). Swap contracts may include interest rate, equity, debt, index, total return, credit default, currency, and volatility swaps.
Swap contracts are reported on a schedule following the Consolidated Statement of Investments. The values of centrally cleared swap and OTC swap contracts are aggregated by positive and negative values and disclosed separately on the Consolidated Statement of Assets and Liabilities. The unrealized appreciation (depreciation) related to the change in the valuation of the notional amount of the swap is combined with the accrued interest due to (owed by) the Fund, if any, at termination or settlement. The net change in this amount during the period is included on the Consolidated Statement of Operations. The Fund also records any periodic payments received from (paid to) the counterparty, including at termination, under such contracts as realized gain (loss) on the Consolidated Statement of Operations.
Swap contract agreements are exposed to the market risk factor of the specific underlying reference rate or asset. Swap contracts are typically more attractively priced compared to similar investments in related cash securities because they isolate the risk to one market risk factor and eliminate the other market risk factors. Investments in cash securities (for instance bonds) have exposure to multiple risk factors (credit and interest rate risk). Because swaps have embedded leverage, they can expose the Fund to substantial risk in the isolated market risk factor.
Interest Rate Swap Contracts. An interest rate swap is an agreement between counterparties to exchange periodic payments based on interest rates. One cash flow stream will typically be a floating rate payment based upon a specified floating interest rate while the other is typically a fixed interest rate.
The Fund has entered into interest rate swaps in which it pays a floating interest rate
63 OPPENHEIMER GLOBAL ALLOCATION FUND
| | |
| NOTES TO CONSOLIDATED FINANCIAL STATEMENTS Continued | | |
6. Use of Derivatives (Continued)
and receives a fixed interest rate in order to increase exposure to interest rate risk. Typically, if relative interest rates rise, payments made by the Fund under a swap agreement will be greater than the payments received by the Fund.
For the reporting period, the Fund had ending monthly average notional amounts of $5,965,667 interest rate swaps which receive a fixed rate.
Additional associated risks to the Fund include counterparty credit risk and liquidity risk.
Total Return Swap Contracts. A total return swap is an agreement between counterparties to exchange periodic payments based on the value of asset or non-asset references. One cash flow is typically based on a non-asset reference (such as an interest rate) and the other on the total return of a reference asset (such as a security or a basket of securities or securities index). The total return of the reference asset typically includes appreciation or depreciation on the reference asset, plus any interest or dividend payments.
Total return swap contracts are exposed to the market risk factor of the specific underlying financial instrument or index. Total return swaps are less standard in structure than other types of swaps and can isolate and/or include multiple types of market risk factors including equity risk, credit risk, and interest rate risk.
The Fund has entered into total return swaps on various equity securities or indexes to increase exposure to equity risk. These equity risk related total return swaps require the Fund to pay a floating reference interest rate, and an amount equal to the negative price movement of securities or an index (expressed as a percentage) multiplied by the notional amount of the contract. The Fund will receive payments equal to the positive price movement of the same securities or index (expressed as a percentage) multiplied by the notional amount of the contract and, in some cases, dividends paid on the securities.
The Fund has entered into total return swaps to increase exposure to the credit risk of various indexes or basket of securities. These credit risk related total return swaps require the Fund to pay to, or receive payments from, the counterparty based on the movement of credit spreads of the related indexes or securities.
The Fund has entered into total return swaps to decrease exposure to the credit risk of various indexes or basket of securities. These credit risk related total return swaps require the fund to pay to, or receive payments from, the counterparty based on the movement of credit spreads of the related indexes or securities.
For the reporting period, the Fund had ending monthly average notional amounts of $64,107,789 and $11,534,257 on total return swaps which are long the reference asset and total return swaps which are short the reference asset, respectively.
Additional associated risks to the Fund include counterparty credit risk and liquidity risk.
Counterparty Credit Risk. Derivative positions are subject to the risk that the counterparty will not fulfill its obligation to the Fund. The Fund intends to enter into derivative transactions with counterparties that the Manager believes to be creditworthy at the time of the transaction.
The Fund’s risk of loss from counterparty credit risk on OTC derivatives is generally limited to the aggregate unrealized gain netted against any collateral held by the Fund. For OTC options purchased, the Fund bears the risk of loss of the amount of the premiums paid
64 OPPENHEIMER GLOBAL ALLOCATION FUND
6. Use of Derivatives (Continued)
plus the positive change in market values net of any collateral held by the Fund should the counterparty fail to perform under the contracts. Options written by the Fund do not typically give rise to counterparty credit risk, as options written generally obligate the Fund and not the counterparty to perform.
To reduce counterparty risk with respect to OTC transactions, the Fund has entered into master netting arrangements, established within the Fund’s International Swap and Derivatives Association, Inc. (“ISDA”) master agreements, which allow the Fund to make (or to have an entitlement to receive) a single net payment in the event of default (close-out netting) for outstanding payables and receivables with respect to certain OTC positions in swaps, options, swaptions, and forward currency exchange contracts for each individual counterparty. In addition, the Fund may require that certain counterparties post cash and/or securities in collateral accounts to cover their net payment obligations for those derivative contracts subject to ISDA master agreements. If the counterparty fails to perform under these contracts and agreements, the cash and/or securities will be made available to the Fund.
At period end, the Fund has required certain counterparties to post collateral of $11,134,289.
ISDA master agreements include credit related contingent features which allow counterparties to OTC derivatives to terminate derivative contracts prior to maturity in the event that, for example, the Fund’s net assets decline by a stated percentage or the Fund fails to meet the terms of its ISDA master agreements, which would cause the Fund to accelerate payment of any net liability owed to the counterparty.
For financial reporting purposes, the Fund does not offset derivative assets and derivative liabilities that are subject to netting arrangements in the Consolidated Statement of Assets and Liabilities. Bankruptcy or insolvency laws of a particular jurisdiction may impose restrictions on or prohibitions against the right of offset in bankruptcy, insolvency or other events.
The Fund’s risk of loss from counterparty credit risk on exchange-traded derivatives cleared through a clearinghouse and for centrally cleared swaps is generally considered lower than as compared to OTC derivatives. However, counterparty credit risk exists with respect to initial and variation margin deposited/paid by the Fund that is held in futures commission merchant, broker and/or clearinghouse accounts for such exchange-traded derivatives and for centrally cleared swaps.
With respect to centrally cleared swaps, such transactions will be submitted for clearing, and if cleared, will be held in accounts at futures commission merchants or brokers that are members of clearinghouses. While brokers, futures commission merchants and clearinghouses are required to segregate customer margin from their own assets, in the event that a broker, futures commission merchant or clearinghouse becomes insolvent or goes into bankruptcy and at that time there is a shortfall in the aggregate amount of margin held by the broker, futures commission merchant or clearinghouse for all its customers, U.S. bankruptcy laws will typically allocate that shortfall on a pro-rata basis across all the broker’s, futures commission merchant’s or clearinghouse’s customers, potentially resulting in losses to the Fund.
There is the risk that a broker, futures commission merchant or clearinghouse will decline to
65 OPPENHEIMER GLOBAL ALLOCATION FUND
| | |
| NOTES TO CONSOLIDATED FINANCIAL STATEMENTS Continued | | |
6. Use of Derivatives (Continued)
clear a transaction on the Fund’s behalf, and the Fund may be required to pay a termination fee to the executing broker with whom the Fund initially enters into the transaction. Clearinghouses may also be permitted to terminate centrally cleared swaps at any time. The Fund is also subject to the risk that the broker or futures commission merchant will improperly use the Fund’s assets deposited/paid as initial or variation margin to satisfy payment obligations of another customer. In the event of a default by another customer of the broker or futures commission merchant, the Fund might not receive its variation margin payments from the clearinghouse, due to the manner in which variation margin payments are aggregated for all customers of the broker/futures commission merchant.
Collateral and margin requirements differ by type of derivative. Margin requirements are established by the broker, futures commission merchant or clearinghouse for exchange-traded and cleared derivatives, including centrally cleared swaps. Brokers, futures commission merchants and clearinghouses can ask for margin in excess of the regulatory minimum, or increase the margin amount, in certain circumstances.
Collateral terms are contract specific for OTC derivatives. For derivatives traded under an ISDA master agreement, the collateral requirements are typically calculated by netting the mark to market amount for each transaction under such agreement and comparing that amount to the value of any collateral currently pledged by the Fund or the counterparty.
For financial reporting purposes, cash collateral that has been pledged to cover obligations of the Fund, if any, is reported separately on the Consolidated Statement of Assets and Liabilities as cash pledged as collateral. Non-cash collateral pledged by the Fund, if any, is noted in the Consolidated Statement of Investments. Generally, the amount of collateral due from or to a party must exceed a minimum transfer amount threshold (e.g. $250,000) before a transfer has to be made. To the extent amounts due to the Fund from its counterparties are not fully collateralized, contractually or otherwise, the Fund bears the risk of loss from counterparty nonperformance.
The following table presents by counterparty the Fund’s OTC derivative assets net of the related collateral pledged by the Fund at period end.
| | | | | | | | | | | | | | | | | | | | |
| | | | | | Gross Amounts Not Offset in the Consolidated
Statement of Assets & Liabilities | | | | |
| Counterparty | | Gross Amounts
Not Offset in the
Consolidated
Statement
of Assets &
Liabilities* | | | Financial
Instruments
Available for
Offset | | | Financial
Instruments
Collateral
Received** | | | Cash Collateral
Received** | | | Net Amount | |
Bank of America NA | | $ | 1,045,299 | | | $ | (402,899 | ) | | $ | (642,400 | ) | | $ | – | | | $ | – | |
Barclays Bank plc | | | 190,000 | | | | (35,625 | ) | | | – | | | | – | | | | 154,375 | |
Citibank NA | | | 5,792,842 | | | | (627,767 | ) | | | (5,165,075 | ) | | | – | | | | – | |
Deutsche Bank AG | | | 1,853,614 | | | | (689,577 | ) | | | (1,164,037 | ) | | | – | | | | – | |
Goldman Sachs Bank USA | | | 88,268 | | | | (88,268 | ) | | | – | | | | – | | | | – | |
66 OPPENHEIMER GLOBAL ALLOCATION FUND
6. Use of Derivatives (Continued)
| | | | | | | | | | | | | | | | | | | | |
| | | | | | Gross Amounts Not Offset in the Consolidated
Statement of Assets & Liabilities | | | | |
| Counterparty | | Gross Amounts
Not Offset in the
Consolidated
Statement
of Assets &
Liabilities* | | | Financial
Instruments
Available for
Offset | | | Financial
Instruments
Collateral
Received** | | | Cash Collateral
Received** | | | Net Amount | |
Goldman Sachs International | | $ | 2,116,484 | | | $ | (883,849 | ) | | $ | (1,232,635 | ) | | $ | – | | | $ | – | |
HSBC Bank USA NA | | | 817,408 | | | | (30,591 | ) | | | (106,817 | ) | | | (680,000 | ) | | | – | |
JPMorgan Chase Bank NA | | | 1,495,704 | | | | (1,016,483 | ) | | | (479,221 | ) | | | – | | | | – | |
Toronto Dominion Bank | | | 327,400 | | | | – | | | | (275,028 | ) | | | – | | | | 52,372 | |
| | | | |
| | $ | 13,727,019 | | | $ | (3,775,059 | ) | | $ | (9,065,213 | ) | | $ | (680,000 | ) | | $ | 206,747 | |
| | | | |
*OTC derivatives are reported gross on the Consolidated Statement of Assets and Liabilities. Exchange traded options and margin related to centrally cleared swaps and futures, if any, are excluded from these reported amounts.
**Reported collateral posted for the benefit of the Fund within this table is limited to the net outstanding amount due from an individual counterparty. The collateral posted for the benefit of the Fund may exceed these amounts.
The following table presents by counterparty the Fund’s OTC derivative liabilities net of the related collateral pledged by the Fund at period end.
| | | | | | | | | | | | | | | | | | | | |
| | | | | Gross Amounts Not Offset in the Consolidated
Statement of Assets & Liabilities | | |
| Counterparty | | Gross Amounts
Not Offset in the
Consolidated
Statement
of Assets &
Liabilities* | | Financial
Instruments
Available for
Offset | | Financial
Instruments
Collateral
Pledged** | | Cash Collateral
Pledged** | | Net Amount |
Bank of America NA | | $ | (402,899 | ) | | $ | 402,899 | | | $ | – | | | $ | – | | | $ | – | |
Barclays Bank plc | | | (35,625 | ) | | | 35,625 | | | | – | | | | – | | | | – | |
Citibank NA | | | (627,767 | ) | | | 627,767 | | | | – | | | | – | | | | – | |
Deutsche Bank AG | | | (689,577 | ) | | | 689,577 | | | | – | | | | – | | | | – | |
Goldman Sachs Bank USA | | | (1,281,666 | ) | | | 88,268 | | | | 1,193,398 | | | | – | | | | – | |
Goldman Sachs International | | | (883,849 | ) | | | 883,849 | | | | – | | | | – | | | | – | |
HSBC Bank USA NA | | | (30,591 | ) | | | 30,591 | | | | – | | | | – | | | | – | |
JPMorgan Chase Bank NA | | | (1,016,483 | ) | | | 1,016,483 | | | | – | | | | – | | | | – | |
Morgan Stanley Capital Services, Inc. | | | (472,205 | ) | | | – | | | | 327,725 | | | | – | | | | (144,480 | ) |
| | | | |
| | $ | (5,440,662 | ) | | $ | 3,775,059 | | | $ | 1,521,123 | | | $ | – | | | $ | (144,480 | ) |
| | | | |
67 OPPENHEIMER GLOBAL ALLOCATION FUND
| | |
| NOTES TO CONSOLIDATED FINANCIAL STATEMENTS Continued | | |
6. Use of Derivatives (Continued)
*OTC derivatives are reported gross on the Consolidated Statement of Assets and Liabilities. Exchange traded options and margin related to centrally cleared swaps and futures, if any, are excluded from these reported amounts.
**Reported collateral pledged within this table is limited to the net outstanding amount due from the Fund. The securities pledged as collateral by the Fund as reported on the Consolidated Statements of Investments may exceed these amounts.
The following table presents the valuations of derivative instruments by risk exposure as reported within the Consolidated Statement of Assets and Liabilities at period end:
| | | | | | | | | | | | |
| | | Asset Derivatives | | | Liability Derivatives | |
Derivatives
Not Accounted
for as Hedging
Instruments | | Consolidated
Statement of Assets
and Liabilities Location | | Value | | Consolidated
Statement of Assets
and Liabilities Location | | Value |
Credit contracts | | | | | | | | Swaps, at value | | $ | 613,486 | |
Equity contracts | | Swaps, at value | | $ | 2,116,484 | | | Swaps, at value | | | 270,363 | |
Interest rate contracts | | Swaps, at value | | | 189 | | | Swaps, at value | | | 123,293 | |
Equity contracts | | Variation margin receivable | | | 655,552 | * | | Variation margin payable | | | 377,033 | * |
Interest rate contracts | | Variation margin receivable | | | 179,500 | * | | | | | | |
| | Unrealized appreciation | | | | | | Unrealized depreciation on | | | | |
Forward currency | | on forward currency | | | | | | forward currency exchange | | | | |
exchange contracts | | exchange contracts | | | 11,610,346 | | | contracts | | | 4,433,520 | |
| | | | | | | | | | | | |
Total | | | | $ | 14,562,071 | | | | | $ | 5,817,695 | |
| | | | | | | | | | | | |
*Includes only the current day’s variation margin. Prior variation margin movements have been reflected in cash on the Consolidated Statement of Assets and Liabilities upon receipt or payment.
The effect of derivative instruments on the Consolidated Statement of Operations is as follows:
| | | | | | | | | | | | | | | | | | | | |
| Amount of Realized Gain or (Loss) Recognized on Derivatives | |
Derivatives
Not Accounted
for as Hedging
Instruments | | Investment
from
unaffiliated
companies
(including
premiums
on options
exercised)* | | Closing and
expiration
of futures
contracts | | | Forward
currency
exchange
transactions
| | | Swap contracts | | | Total | |
Credit contracts | | $ | — | | | $ | — | | | $ | — | | | $ | 6,131,397 | | | $ | 6,131,397 | |
Equity contracts | | | (2,943,826 | ) | | | (14,781,357 | ) | | | — | | | | 6,504,063 | | | | (11,221,120 | ) |
Forward currency exchange contracts | | | — | | | | — | | | | 3,687,138 | | | | — | | | | 3,687,138 | |
Interest rate contracts | | | 133,044 | | | | 2,710,745 | | | | — | | | | 283,602 | | | | 3,127,391 | |
| | | | |
Total | | $ | (2,810,782 | ) | | $ | (12,070,612 | ) | | $ | 3,687,138 | | | $ | 12,919,062 | | | $ | 1,724,806 | |
| | | | |
*Includes purchased options contracts, purchased swaption contracts, written options contracts exercised and written swaption contracts exercised, if any.
68 OPPENHEIMER GLOBAL ALLOCATION FUND
6. Use of Derivatives (Continued)
| | | | | | | | | | | | | | | | | | | | |
| Amount of Change in Unrealized Gain or (Loss) Recognized on Derivatives | |
Derivatives
Not Accounted
for as Hedging
Instruments | | Investments* | | Futures
contracts | | Translation
of assets and
liabilities
denominated
in foreign
currencies | | Swap contracts | | Total |
Credit contracts | | $ | — | | | $ | — | | | $ | — | | | $ | (613,486 | ) | | $ | (613,486 | ) |
Equity contracts | | | (1,341,640 | ) | | | 6,259,576 | | | | — | | | | 1,846,121 | | | | 6,764,057 | |
Forward currency exchange contracts | | | — | | | | — | | | | 7,360,706 | | | | — | | | | 7,360,706 | |
Interest rate contracts | | | — | | | | (2,495,125 | ) | | | — | | | | (325,409 | ) | | | (2,820,534 | ) |
| | | | |
Total | | $ | (1,341,640 | ) | | $ | 3,764,451 | | | $ | 7,360,706 | | | $ | 907,226 | | | $ | 10,690,743 | |
| | | | |
*Includes purchased option contracts and purchased swaption contracts, if any.
7. Shares of Beneficial Interest
The Fund has authorized an unlimited number of $0.01 par value shares of beneficial interest of each class. Transactions in shares of beneficial interest were as follows:
| | | | | | | | | | | | | | | | |
| | | Year Ended October 31, 2016 | | Year Ended October 30, 20151 |
| | | Shares | | Amount | | Shares | | Amount |
| |
Class A | | | | | | | | | | | | | | | | |
Sold | | | 4,318,037 | | | $
| 74,457,689
|
| | | 4,170,278 | | | $ | 73,756,543 | |
Dividends and/or distributions reinvested | | | 1,005,177 | | | | 17,069,106 | | | | 907,671 | | | | 15,732,481 | |
Redeemed | | | (9,660,559 | ) | | | (166,689,672 | ) | | | (10,011,504 | ) | | | (176,351,362 | ) |
| | | | |
Net decrease | | | (4,337,345 | ) | | $ | (75,162,877 | ) | | | (4,933,555 | ) | | $ | (86,862,338 | ) |
| | | | |
| | | | | | | | | | | | | | | | | |
Class B | | | | | | | | | | | | | | | | |
Sold | | | 24,548 | | | $ | 409,075 | | | | 30,331 | | | $ | 518,762 | |
Dividends and/or distributions reinvested | | | 19,189 | | | | 313,734 | | | | 20,063 | | | | 334,153 | |
Redeemed | | | (940,071 | ) | | | (15,677,956 | ) | | | (1,418,934 | ) | | | (24,166,128 | ) |
| | | | |
Net decrease | | | (896,334 | ) | | $ | (14,955,147 | ) | | | (1,368,540 | ) | | $ | (23,313,213 | ) |
| | | | |
| | | | | | | | | | | | | | | | | |
Class C | | | | | | | | | | | | | | | | |
Sold | | | 1,699,806 | | | $ | 28,178,400 | | | | 1,462,062 | | | $ | 25,116,258 | |
Dividends and/or distributions reinvested | | | 155,174 | | | | 2,541,264 | | | | 106,042 | | | | 1,774,699 | |
Redeemed | | | (2,470,643 | ) | | | (41,226,323 | ) | | | (2,565,044 | ) | | | (43,653,850 | ) |
| | | | |
Net decrease | | | (615,663 | ) | | $ | (10,506,659 | ) | | | (996,940 | ) | | $ | (16,762,893 | ) |
| | | | |
| | | | | | | | | | | | | | | | | |
Class I | | | | | | | | | | | | | | | | |
Sold | | | 1,332,114 | | | $ | 22,846,875 | | | | 11,137 | | | $ | 194,426 | |
Dividends and/or distributions reinvested | | | 10,439 | | | | 180,223 | | | | 741 | | | | 12,797 | |
Redeemed | | | (64,294 | ) | | | (1,114,531 | ) | | | (143,372 | ) | | | (2,503,501 | ) |
| | | | |
Net increase (decrease) | | | 1,278,259 | | | $ | 21,912,567 | | | | (131,494 | ) | | $ | (2,296,278 | ) |
| | | | |
69 OPPENHEIMER GLOBAL ALLOCATION FUND
| | |
| NOTES TO CONSOLIDATED FINANCIAL STATEMENTS Continued | | |
7. Shares of Beneficial Interest (Continued)
| | | | | | | | | | | | | | | | |
| | | Year Ended October 31, 2016 | | Year Ended October 30, 20151 |
| | | Shares | | Amount | | Shares | | Amount |
| |
Class R | | | | | | | | | | | | | | | | |
Sold | | | 455,469 | | | $ | 7,700,149 | | | | 302,088 | | | $ | 5,268,180 | |
Dividends and/or distributions reinvested | | | 29,342 | | | | 489,318 | | | | 24,645 | | | | 420,071 | |
Redeemed | | | (461,073 | ) | | | (7,865,488 | ) | | | (515,784 | ) | | | (8,874,821 | ) |
| | | | |
Net increase (decrease) | | | 23,738 | | | $ | 323,979 | | | | (189,051 | ) | | $ | (3,186,570 | ) |
| | | | |
| | | | | | | | | | | | | | | | | |
Class Y | | | | | | | | | | | | | | | | |
Sold | | | 2,947,398 | | | $ | 51,042,862 | | | | 745,110 | | | $ | 13,146,361 | |
Dividends and/or distributions reinvested | | | 42,758 | | | | 726,535 | | | | 36,217 | | | | 627,593 | |
Redeemed | | | (2,169,062 | ) | | | (37,433,682 | ) | | | (512,820 | ) | | | (9,000,825 | ) |
| | | | |
Net increase | | | 821,094 | | | $ | 14,335,715 | | | | 268,507 | | | $ | 4,773,129 | |
| | | | |
1. Represents the last business day of the Fund’s reporting period
8. Purchases and Sales of Securities
The aggregate cost of purchases and proceeds from sales of securities, other than short-term obligations and investments in IGMMF, for the reporting period were as follows:
| | | | | | | | |
| | | Purchases | | | Sales | |
Investment securities | | $ | 896,355,982 | | | $ | 908,382,750 | |
U.S. government and government agency obligations | | | 301,867,609 | | | | 319,175,797 | |
9. Fees and Other Transactions with Affiliates
Management Fees. Under the investment advisory agreement, the Fund pays the Manager a management fee based on the daily net assets of the Fund at an annual rate as shown in the following table:
| | | | |
| Fee Schedule | | |
Up to $1.0 billion | | | 0.80 | % |
Next $2.0 billion | | | 0.76 | |
Next $1.0 billion | | | 0.71 | |
Next $1.0 billion | | | 0.66 | |
Next $1.0 billion | | | 0.60 | |
Next $1.0 billion | | | 0.55 | |
Next $2.0 billion | | | 0.50 | |
Over $9.0 billion | | | 0.48 | |
The Manager also provides investment management related services to the Subsidiary. The Subsidiary pays the Manager a monthly management fee at an annual rate according to the above schedule. The Subsidiary also pays certain other expenses including custody and directors’ fees.
The Fund’s effective management fee for the reporting period was 0.79% of average annual net assets before any Subsidiary management fees or any applicable waivers.
Sub-Adviser Fees. The Manager has retained the Sub-Adviser to provide the day-to-day
70 OPPENHEIMER GLOBAL ALLOCATION FUND
9. Fees and Other Transactions with Affiliates (Continued)
portfolio management of the Fund and the Subsidiary. Under the Sub-Advisory Agreement, the Manager pays the Sub-Adviser an annual fee in monthly installments, equal to a percentage of the investment management fee collected by the Manager from the Fund and the Subsidiary, which shall be calculated after any investment management fee waivers. The fee paid to the Sub-Adviser is paid by the Manager, not by the Fund.
Transfer Agent Fees. OFI Global (the “Transfer Agent”) serves as the transfer and shareholder servicing agent for the Fund. The Fund pays the Transfer Agent a fee based on annual net assets. Fees incurred and average net assets for each class with respect to these services are detailed in the Consolidated Statement of Operations and Consolidated Financial Highlights, respectively.
Sub-Transfer Agent Fees. The Transfer Agent has retained Shareholder Services, Inc., a wholly-owned subsidiary of OFI (the “Sub-Transfer Agent”), to provide the day-to-day transfer agent and shareholder servicing of the Fund. Under the Sub-Transfer Agency Agreement, the Transfer Agent pays the Sub-Transfer Agent an annual fee in monthly installments, equal to a percentage of the transfer agent fee collected by the Transfer Agent from the Fund, which shall be calculated after any applicable fee waivers. The fee paid to the Sub-Transfer Agent is paid by the Transfer Agent, not by the Fund.
Trustees’ Compensation. The Fund has adopted an unfunded retirement plan (the “Plan”) for the Fund’s Independent Trustees. Benefits are based on years of service and fees paid to each Trustee during their period of service. The Plan was frozen with respect to adding new participants effective December 31, 2006 (the “Freeze Date”) and existing Plan Participants as of the Freeze Date will continue to receive accrued benefits under the Plan. Active Independent Trustees as of the Freeze Date have each elected a distribution method with respect to their benefits under the Plan. During the reporting period, the Fund’s projected benefit obligations, payments to retired Trustees and accumulated liability were as follows:
| | | | |
Projected Benefit Obligations Increased | | $ | 2,555 | |
Payments Made to Retired Trustees | | | 101,588 | |
Accumulated Liability as of October 31, 2016 | | | 395,114 | |
The Fund’s Board of Trustees (“Board”) has adopted a compensation deferral plan for Independent Trustees that enables Trustees to elect to defer receipt of all or a portion of the annual compensation they are entitled to receive from the Fund. For purposes of determining the amount owed to the Trustee under the plan, deferred amounts are treated as though equal dollar amounts had been invested in shares of the Fund or in other Oppenheimer funds selected by the Trustee. The Fund purchases shares of the funds selected for deferral by the Trustee in amounts equal to his or her deemed investment, resulting in a Fund asset equal to the deferred compensation liability. Such assets are included as a component of “Other” within the asset section of the Consolidated Statement of Assets and Liabilities. Deferral of Trustees’ fees under the plan will not affect the net assets of the Fund and will not materially affect the Fund’s assets, liabilities or net investment income per share. Amounts will be
71 OPPENHEIMER GLOBAL ALLOCATION FUND
| | |
| NOTES TO CONSOLIDATED FINANCIAL STATEMENTS Continued | | |
9. Fees and Other Transactions with Affiliates (Continued)
deferred until distributed in accordance with the compensation deferral plan.
Distribution and Service Plan (12b-1) Fees. Under its General Distributor’s Agreement with the Fund, OppenheimerFunds Distributor, Inc. (the “Distributor”) acts as the Fund’s principal underwriter in the continuous public offering of the Fund’s classes of shares.
Distribution and Service Plan for Class A Shares. The Fund has adopted a Distribution and Service Plan (the “Plan”) for Class A shares pursuant to Rule 12b-1 under the 1940 Act. Under the Plan, the Fund pays a service fee to the Distributor at an annual rate of 0.25% of the daily net assets of Class A shares. The Distributor currently uses all of those fees to pay dealers, brokers, banks and other financial institutions periodically for providing personal services and maintenance of accounts of their customers that hold Class A shares. Under the Plan, the Fund may also pay an asset-based sales charge to the Distributor. However, the Fund’s Board has currently set the rate at zero. Fees incurred by the Fund under the Plan are detailed in the Consolidated Statement of Operations.
Distribution and Service Plans for Class B, Class C and Class R Shares. The Fund has adopted Distribution and Service Plans (the “Plans”) for Class B, Class C and Class R shares pursuant to Rule 12b-1 under the 1940 Act to compensate the Distributor for distributing those share classes, maintaining accounts and providing shareholder services. Under the Plans, the Fund pays the Distributor an annual asset-based sales charge of 0.75% on Class B and Class C shares’ daily net assets and 0.25% on Class R shares’ daily net assets. The Fund also pays a service fee under the Plans at an annual rate of 0.25% of daily net assets. The Plans continue in effect from year to year only if the Fund’s Board of Trustees votes annually to approve their continuance at an in person meeting called for that purpose. Fees incurred by the Fund under the Plans are detailed in the Consolidated Statement of Operations.
Sales Charges. Front-end sales charges and CDSC do not represent expenses of the Fund. They are deducted from the proceeds of sales of Fund shares prior to investment or from redemption proceeds prior to remittance, as applicable. The sales charges retained by the Distributor from the sale of shares and the CDSC retained by the Distributor on the redemption of shares is shown in the following table for the period indicated.
| | | | | | | | | | | | | | | | | | | | |
| Year Ended | | Class A
Front-End
Sales Charges
Retained by
Distributor | | | Class A
Contingent
Deferred
Sales Charges
Retained by
Distributor | | | Class B
Contingent
Deferred
Sales Charges
Retained by
Distributor | | | Class C
Contingent
Deferred
Sales Charges
Retained by
Distributor | | | Class R
Contingent
Deferred
Sales Charges
Retained by
Distributor | |
October 31, 2016 | | | $258,943 | | | | $— | | | | $26,988 | | | | $15,959 | | | | $— | |
Waivers and Reimbursements of Expenses. The Manager has contractually agreed to waive the management fee it receives from the Fund in an amount equal to the management fee it receives from the Subsidiary. During the reporting period, the Manager waived $88,622.
72 OPPENHEIMER GLOBAL ALLOCATION FUND
9. Fees and Other Transactions with Affiliates (Continued)
The Manager will waive fees and/or reimburse Fund expenses in an amount equal to the indirect management fees incurred through the Fund’s investments in Affiliated Funds. During the reporting period, the Manager waived fees and/or reimbursed the Fund $740,891 for these management fees.
Waivers and/or reimbursements may be modified or terminated as set forth according to the terms in the prospectus.
10. Borrowings and Other Financing
Securities Sold Short. The Fund sells securities that it does not own, and it will therefore be obligated to purchase such securities at a future date. Upon entering into a short position, the Fund is required to segregate cash or securities at its custodian which are pledged for the benefit of the lending broker and/or to deposit and pledge cash directly at the lending broker, with a value equal to a certain percentage, exceeding 100%, of the value of the securities that it sold short. Cash that has been segregated and pledged for this purpose will be disclosed on the Consolidated Statement of Assets and Liabilities; securities that have been segregated and pledged for this purpose are disclosed as such in the Consolidated Statement of Investments. The value of the open short position is recorded as a liability, and the Fund records an unrealized gain or loss to the extent of the difference between the proceeds received and the change in value of the open short position. The Fund records a realized gain or loss when the short position is closed out. By entering into short sales, the Fund bears the market risk of increases in value of the security sold short in excess of the proceeds received. Until the security is replaced, the Fund is required to pay the lender any dividend or interest earned. Dividend expense on short sales is treated as an expense in the Consolidated Statement of Operations.
At period end, the Fund had no outstanding securities sold short.
Joint Credit Facility. A number of mutual funds managed by the Manager participate in a $1.3 billion revolving credit facility (the “Facility”) intended to provide short-term financing, if necessary, subject to certain restrictions in connection with atypical redemption activity. Expenses and fees related to the Facility are paid by the participating funds and are disclosed separately or as other expenses on the Consolidated Statement of Operations. The Fund did not utilize the Facility during the reporting period.
11. Pending Litigation
In 2009, several putative class action lawsuits were filed and later consolidated before the U.S. District Court for the District of Colorado in connection with the investment performance of Oppenheimer Rochester California Municipal Fund (the “California Fund”), a fund advised by OppenheimerFunds, Inc. (“OFI”) and distributed by OppenheimerFunds Distributor, Inc. (“OFDI”). The plaintiffs asserted claims against OFI, OFDI and certain present and former trustees and officers of the California Fund under the federal securities laws, alleging, among other things, that the disclosure documents of the California Fund contained
73 OPPENHEIMER GLOBAL ALLOCATION FUND
| | |
| NOTES TO CONSOLIDATED FINANCIAL STATEMENTS Continued | | |
11. Pending Litigation (Continued)
misrepresentations and omissions and the investment policies of the California Fund were not followed. An amended complaint and a motion to dismiss were filed, and in 2011, the court issued an order which granted in part and denied in part the defendants’ motion to dismiss. In October 2015, following a successful appeal by defendants and a subsequent hearing, the court granted plaintiffs’ motion for class certification and appointed class representatives and class counsel.
OFI and OFDI believe the suit is without merit; that it is premature to render any opinion as to the likelihood of an outcome unfavorable to them in the suit; and that no estimate can yet be made as to the amount or range of any potential loss. Furthermore, OFI believes that the suit should not impair the ability of OFI or OFDI to perform their respective duties to the Fund and that the outcome of the suit should not have any material effect on the operations of any of the Oppenheimer funds.
74 OPPENHEIMER GLOBAL ALLOCATION FUND
| | |
| REPORT OF INDEPENDENT REGISTERED PUBLIC ACCOUNTING FIRM | | |
The Board of Trustees and Shareholders of Oppenheimer Quest For Value Funds:
We have audited the accompanying consolidated statement of assets and liabilities of Oppenheimer Global Allocation Fund (a series of Oppenheimer Quest For Value Funds) and subsidiary, including the consolidated statement of investments, as of October 31, 2016, and the related consolidated statement of operations for the year then ended, the consolidated statements of changes in net assets for each of the years in the two-year period then ended, and the consolidated financial highlights for each of the years or periods in the five-year period then ended. These consolidated financial statements and consolidated financial highlights are the responsibility of the Fund’s management. Our responsibility is to express an opinion on these consolidated financial statements and consolidated financial highlights based on our audits.
We conducted our audits in accordance with the standards of the Public Company Accounting Oversight Board (United States). Those standards require that we plan and perform the audit to obtain reasonable assurance about whether the financial statements and financial highlights are free of material misstatement. An audit includes examining, on a test basis, evidence supporting the amounts and disclosures in the financial statements. Our procedures included confirmation of securities owned as of October 31, 2016, by correspondence with the custodian, transfer agent and brokers, or by other appropriate auditing procedures where replies from brokers were not received. An audit also includes assessing the accounting principles used and significant estimates made by management, as well as evaluating the overall financial statement presentation. We believe that our audits provide a reasonable basis for our opinion.
In our opinion, the consolidated financial statements and consolidated financial highlights referred to above present fairly, in all material respects, the financial position of Oppenheimer Global Allocation Fund and subsidiary as of October 31, 2016, the results of their operations for the year then ended, the changes in their net assets for each of the years in the two-year period then ended, and the consolidated financial highlights for each of the years or periods in the five-year period then ended, in conformity with U.S. generally accepted accounting principles.
KPMG LLP
Denver, Colorado
December 22, 2016
75 OPPENHEIMER GLOBAL ALLOCATION FUND
| | |
| FEDERAL INCOME TAX INFORMATION Unaudited | | |
| | |
In early 2016, if applicable, shareholders of record received information regarding all dividends and distributions paid to them by the Fund during calendar year 2015.
Dividends, if any, paid by the Fund during the reporting period which are not designated as capital gain distributions should be multiplied by the maximum amount allowable but not less than 13.88% to arrive at the amount eligible for the corporate dividend-received deduction.
A portion, if any, of the dividends paid by the Fund during the reporting period which are not designated as capital gain distributions are eligible for lower individual income tax rates to the extent that the Fund has received qualified dividend income as stipulated by recent tax legislation. The maximum amount allowable but not less than $18,773,423 of the Fund’s fiscal year taxable income may be eligible for the lower individual income tax rates. In early 2016, shareholders of record received information regarding the percentage of distributions that are eligible for lower individual income tax rates.
Recent tax legislation allows a regulated investment company to designate distributions not designated as capital gain distributions, as either interest related dividends or short-term capital gain dividends, both of which are exempt from the U.S. withholding tax applicable to non U.S. taxpayers. For the reporting period, the maximum amount allowable but not less than $9,839,191 of the ordinary distributions to be paid by the Fund qualifies as an interest related dividend.
The foregoing information is presented to assist shareholders in reporting distributions received from the Fund to the Internal Revenue Service. Because of the complexity of the federal regulations which may affect your individual tax return and the many variations in state and local tax regulations, we recommend that you consult your tax advisor for specific guidance.
76 OPPENHEIMER GLOBAL ALLOCATION FUND
| | |
BOARD APPROVAL OF THE FUND’S INVESTMENT ADVISORY AND SUB-ADVISORY AGREEMENTS Unaudited | | |
The Fund has entered into an investment advisory agreement with OFI Global Asset Management, Inc. (“OFI Global” or the “Adviser”), a wholly-owned subsidiary of OppenheimerFunds, Inc. (“OFI” or the “Sub-Adviser”) (“OFI Global” and “OFI” together the “Managers”) and OFI Global has entered into a sub-advisory agreement with OFI whereby OFI provides investment sub-advisory services to the Fund (collectively, the “Agreements”). Each year, the Board of Trustees (the “Board”), including a majority of the independent Trustees, is required to determine whether to approve the terms of the Agreements and the renewal thereof. The Investment Company Act of 1940, as amended, requires that the Board request and evaluate, and that the Managers provide, such information as may be reasonably necessary to evaluate the terms of the Agreements. The Board employs an independent consultant to prepare a report that provides information, including comparative information that the Board requests for that purpose. In addition to in-person meetings focused on this evaluation, the Board receives information throughout the year regarding Fund services, fees, expenses and performance.
The Managers and the independent consultant provided information to the Board on the following factors: (i) the nature, quality and extent of the Managers’ services, (ii) the comparative investment performance of the Fund and the Managers, (iii) the fees and expenses of the Fund, including comparative fee and expense information, (iv) the profitability of the Managers and their affiliates, including an analysis of the cost of providing services, (v) whether economies of scale are realized as the Fund grows and whether fee levels reflect these economies of scale for Fund investors and (vi) other benefits to the Managers from their relationship with the Fund. The Board was aware that there are alternatives to retaining the Managers.
Outlined below is a summary of the principal information considered by the Board as well as the Board’s conclusions.
Nature, Quality and Extent of Services. The Board considered information about the nature, quality and extent of the services provided to the Fund and information regarding the Managers’ key personnel who provide such services. The Managers’ duties include providing the Fund with the services of the portfolio managers and the Sub-Adviser’s investment team, who provide research, analysis and other advisory services in regard to the Fund’s investments; and securities trading services. OFI Global is responsible for oversight of third-party service providers; monitoring compliance with applicable Fund policies and procedures and adherence to the Fund’s investment restrictions; risk management; and oversight of the Sub-Adviser. OFI Global is also responsible for providing certain administrative services to the Fund. Those services include providing and supervising all administrative and clerical personnel who are necessary in order to provide effective corporate administration for the Fund; compiling and maintaining records with respect to the Fund’s operations; preparing and filing reports required by the U.S. Securities and Exchange Commission; preparing periodic reports regarding the operations of the Fund for its shareholders; preparing proxy materials for shareholder meetings; and preparing the registration statements required by federal and state securities laws for the sale of the Fund’s shares. OFI Global also provides the Fund with office space, facilities and equipment.
77 OPPENHEIMER GLOBAL ALLOCATION FUND
| | |
BOARD APPROVAL OF THE FUND’S INVESTMENT ADVISORY AND SUB-ADVISORY AGREEMENTS Unaudited / Continued | | |
The Board also considered the quality of the services provided and the quality of the Managers’ resources that are available to the Fund. The Board took account of the fact that the Sub-Adviser has over fifty years of experience as an investment adviser and that its assets under management rank it among the top mutual fund managers in the United States. The Board evaluated the Managers’ advisory, administrative, accounting, legal, compliance and risk management services, and information the Board has received regarding the experience and professional qualifications of the Managers’ key personnel and the size and functions of its staff. In its evaluation of the quality of the portfolio management services provided, the Board considered the experience of Mark Hamilton, Dokyoung Lee, Alessio de Longis, and Benjamin Rockmuller, the portfolio managers for the Fund, and the Sub-Adviser’s investment team and analysts. The Board members also considered the totality of their experiences with the Managers as directors or trustees of the Fund and other funds advised by the Managers. The Board considered information regarding the quality of services provided by affiliates of the Managers, which the Board members have become knowledgeable about through their experiences with the Managers and in connection with the renewal of the Fund’s service agreements. The Board concluded, in light of the Managers’ experience, reputation, personnel, operations and resources that the Fund benefits from the services provided under the Agreements.
Investment Performance of the Managers and the Fund. Throughout the year, the Managers provided information on the investment performance of the Fund, the Adviser and the Sub-Adviser, including comparative performance information. The Board also reviewed information, prepared by the Managers and by the independent consultant, comparing the Fund’s historical performance to relevant benchmarks or market indices and to the performance of other retail funds in the world allocation category. The Board noted that the Fund’s one-year and three-year performance was better than its category median although its five-year and ten-year performance was below its category median.
Fees and Expenses of the Fund. The Board reviewed the fees paid to the Adviser and the other expenses borne by the Fund. The independent consultant provided comparative data in regard to the fees and expenses of the Fund and other retail front-end load world allocation funds with comparable asset levels and distribution features. The Board noted that the Fund’s contractual management fee and total expenses were higher than its peer group median and category median.
Economies of Scale and Profits Realized by the Managers. The Board considered information regarding the Managers’ costs in serving as the Fund’s investment adviser and sub-adviser, including the costs associated with the personnel and systems necessary to manage the Fund, and information regarding the Managers’ profitability from their relationship with the Fund. The Board also considered that the Managers must be able to pay and retain experienced professional personnel at competitive rates to provide quality services to the Fund. The Board reviewed whether the Managers may realize economies of scale in managing and supporting the Fund. The Board noted that the Fund currently has management fee breakpoints, which are intended to share with Fund shareholders economies of scale that may exist as the Fund’s assets grow.
78 OPPENHEIMER GLOBAL ALLOCATION FUND
Other Benefits to the Managers. In addition to considering the profits realized by the Managers, the Board considered information that was provided regarding the direct and indirect benefits the Managers receive as a result of their relationship with the Fund, including compensation paid to the Managers’ affiliates and research provided to the Adviser in connection with permissible brokerage arrangements (soft dollar arrangements).
Conclusions. These factors were also considered by the independent Trustees meeting separately from the full Board, assisted by experienced counsel to the Fund and to the independent Trustees. Fund counsel and the independent Trustees’ counsel are independent of the Managers within the meaning and intent of the Securities and Exchange Commission Rules.
Based on its review of the information it received and its evaluations described above, the Board, including a majority of the independent Trustees, decided to continue the Agreements through September 30, 2017. In arriving at its decision, the Board did not identify any factor or factors as being more important than others, but considered all of the above information, and considered the terms and conditions of the Agreements, including the management fees, in light of all the surrounding circumstances.
79 OPPENHEIMER GLOBAL ALLOCATION FUND
| | |
PORTFOLIO PROXY VOTING POLICIES AND PROCEDURES; UPDATES TO STATEMENTS OF INVESTMENTS Unaudited | | |
The Fund has adopted Portfolio Proxy Voting Policies and Guidelines under which the Fund votes proxies relating to securities (“portfolio proxies”) held by the Fund. A description of the Fund’s Portfolio Proxy Voting Policies and Guidelines is available (i) without charge, upon request, by calling the Fund toll-free at 1.800.CALL OPP (225.5677), (ii) on the Fund’s website at www.oppenheimerfunds.com, and (iii) on the SEC’s website at www.sec.gov. In addition, the Fund is required to file Form N-PX, with its complete proxy voting record for the 12 months ended June 30th, no later than August 31st of each year. The Fund’s voting record is available (i) without charge, upon request, by calling the Fund toll-free at 1.800.CALL OPP (225.5677), and (ii) in the Form N-PX filing on the SEC’s website at www.sec.gov.
The Fund files its complete schedule of portfolio holdings with the SEC for the first quarter and the third quarter of each fiscal year on Form N-Q. The Fund’s Form N-Q filings are available on the SEC’s website at www.sec.gov. Those forms may be reviewed and copied at the SEC’s Public Reference Room in Washington, D.C. Information on the operation of the Public Reference Room may be obtained by calling 1-800-SEC-0330.
Householding—Delivery of Shareholder Documents
This is to inform you about OppenheimerFunds’ “householding” policy. If more than one member of your household maintains an account in a particular fund, OppenheimerFunds will mail only one copy of the fund’s prospectus (or, if available, the fund’s summary prospectus), annual and semiannual report and privacy policy. The consolidation of these mailings, called householding, benefits your fund through reduced mailing expense, and benefits you by reducing the volume of mail you receive from OppenheimerFunds. Householding does not affect the delivery of your account statements.
Please note that we will continue to household these mailings for as long as you remain an OppenheimerFunds shareholder, unless you request otherwise. If you prefer to receive multiple copies of these materials, please call us at 1.800.CALL-OPP (225-5677). You may also notify us in writing or via email. We will begin sending you individual copies of the prospectus (or, if available, the summary prospectus), reports and privacy policy within 30 days of receiving your request to stop householding.
80 OPPENHEIMER GLOBAL ALLOCATION FUND
| | |
TRUSTEES AND OFFICERS Unaudited | | |
| | |
Name, Position(s) Held with the
Fund, Length of Service, Year of Birth | | Principal Occupation(s) During the Past 5 Years; Other Trusteeships/ Directorships Held; Number of Portfolios in the Fund Complex Currently Overseen |
| |
| INDEPENDENT TRUSTEES | | The address of each Trustee in the chart below is 6803 S. Tucson Way, Centennial, Colorado 80112-3924. Each Trustee serves for an indefinite term, or until his or her resignation, retirement, death or removal. |
| |
Brian F. Wruble,
Chairman of the Board of Trustees (since 2009), Trustee (since 2001) Year of Birth: 1943 | | Governor and Vice Chairman of Community Foundation of the Florida Keys (non- profit) (since July 2012); Director of TCP Capital, Inc. (since November 2015); Chairman Emeritus and Trustee (since August 2011) of The Jackson Laboratory (non-profit); Member of Zurich Insurance Group’s Investment Management Advisory Council (insurance) (since 2004); Treasurer (since 2007) and Trustee of the Institute for Advanced Study (non-profit educational institute) (since May 1992); Director of Special Value Opportunities Fund, LLC (registered investment company) (affiliate of the Sub-Adviser’s parent company) (September 2004- June 2015); General Partner of Odyssey Partners, L.P. (hedge fund) (September 1995-December 2007); Special Limited Partner of Odyssey Investment Partners, LLC (private equity investment) (January 1999-September 2004). Mr. Wruble has served on the Boards of certain Oppenheimer funds since April 2001, during which time he has become familiar with the Fund’s (and other Oppenheimer funds’) financial, accounting, regulatory and investment matters and has contributed to the Boards’ deliberations. Oversees 55 portfolios in the OppenheimerFunds complex. Mr. Wruble has served on the Boards of certain Oppenheimer funds since April 2001, during which time he has become familiar with the Fund’s (and other Oppenheimer funds’) financial, accounting, regulatory and investment matters and has contributed to the Boards’ deliberations. |
| |
Beth Ann Brown,
Trustee (since 2016) Year of Birth: 1968 | | Advisor, Board of Advisors of Caron Engineering Inc. (since December 2014); Independent Consultant (since September 2012); held the following positions at Columbia Management Investment Advisers LLC: Head of Intermediary Distribution (2008-2012), Managing Director, Strategic Relations (2005-2008), Managing Director, Head of National Accounts (2004-2005); Senior Vice President, National Account Manager (2002-2004), Senior Vice President, Key Account Manager (1999-2002) and Vice President, Key Account Manager (1996-1999) of Liberty Funds Distributor, Inc.; President and Director, of Acton Shapleigh Youth Conservation Corps (non-profit) (since 2012); and Vice President and Director of Grahamtastic Connection (non-profit) (since May 2013). Oversees 55 portfolios in the OppenheimerFunds complex. Ms. Brown has served on the Boards of certain Oppenheimer funds since January 2016, during which time she has become familiar with the Fund’s (and other Oppenheimer funds’) financial, accounting, regulatory and investment matters and has contributed to the Boards’ deliberations. |
| |
Matthew P. Fink,
Trustee (since 2009) Year of Birth: 1941 | | Trustee of the Committee for Economic Development (policy research foundation) (2005-2011); Director of ICI Education Foundation (education foundation) (October 1991-August 2006); President of the Investment Company Institute (trade association) (October 1991-June 2004); Director of ICI Mutual Insurance Company (insurance company) (October 1991-June 2004); Author of The Rise of Mutual Funds: An Insider’s View published by Oxford University Press (second edition 2011). Oversees 55 portfolios in the OppenheimerFunds complex. Mr. Fink has served on the Boards of certain Oppenheimer funds since January 2005, during which time he has become familiar with the Fund’s (and other Oppenheimer funds’) financial, accounting, regulatory and investment matters and has contributed to the Boards’ deliberations. |
81 OPPENHEIMER GLOBAL ALLOCATION FUND
| | |
| TRUSTEES AND OFFICERS Unaudited / Continued | | |
| | |
Edmund P. Giambastiani, Jr.,
Trustee (since 2013) Year of Birth: 1948 | | Advisory Board Member of the Maxwell School of Citizenship and Public Affairs of Syracuse University (since April 2012); Director of Mercury Defense Systems Inc. (information technology) (August 2011-February 2013); Trustee of the U.S. Naval Academy Foundation (since November 2010); Advisory Board Member of the Massachusetts Institute of Technology Lincoln Laboratory (federally-funded research development center) (since May 2010); Director of The Boeing Company (aerospace and defense) (since October 2009); Trustee of MITRE Corporation (federally-funded research development center) (since September 2008); Independent Director of QinetiQ Group Plc (defense technology and security) (February 2008-August 2011); Chairman of Monster Worldwide, Inc. (on-line career services) (since March 2015), Lead Director (June 2011-March 2015); Chairman of Alenia North America, Inc. (military and defense products) (January 2008-October 2009); Director of SRA International, Inc. (information technology and services) (January 2008-July 2011); President of Giambastiani Group LLC (national security and energy consulting) (since October 2007); United States Navy, career nuclear submarine officer (June 1970-October 2007), Vice Chairman of the Joint Chiefs of Staff (2005-October 2007), Supreme Allied Commander of NATO Commander Transformation (2003-2005), Commander, U.S. Joint Forces Command (2002-2005). Since his retirement from the U.S. Navy in October 2007, Admiral Giambastiani has also served on numerous U.S. Government advisory boards, investigations and task forces for the Secretaries of Defense, State and Interior and the Central Intelligence Agency. He currently serves as a federal commissioner on the Military Compensation and Retirement Modernization Commission. Oversees 55 portfolios in the OppenheimerFunds complex. Admiral Giambastiani has served on the Boards of certain Oppenheimer funds since February 2013, including as an Advisory Board Member for certain Oppenheimer funds, during which time he has become familiar with the Fund’s (and other Oppenheimer funds’) financial, accounting, regulatory and investment matters and has contributed to the Boards’ deliberations. For purposes of this report, Admiral Giambastiani is identified as a Trustee. |
| |
Elizabeth Krentzman,
Trustee (since 2014) Year of Birth: 1959 | | Advisory Board Member of University of Florida Advisory Board, Washington, DC Alumni Group (since 2015); Advisory Board Member of the Securities and Exchange Commission Historical Society (since 2007); held the following positions at Deloitte & Touche LLP: Principal and Chief Regulatory Advisor for Asset Management Services (2007 - 2014) and U.S. Mutual Fund Leader (2011 - 2014); General Counsel of the Investment Company Institute (trade association) (June 2004 - April 2007); held the following positions at Deloitte & Touche LLP: National Director of the Investment Management Regulatory Consulting Practice (1997 - 2004), Principal (2003 - 2004), Director (1998 - 2003) and Senior Manager (1997 - 1998); Assistant Director of the Division of Investment Management - Office of Disclosure and Investment Adviser Regulation (1996 - 1997) and various positions with the Division of Investment Management – Office of Regulatory Policy (1991 - 1996) of the U.S. Securities and Exchange Commission; Associate at Ropes & Gray (1987 - 1991. Ms. Krentzman has served on the Boards of certain Oppenheimer funds since August 2014, during which time she has become familiar with the Fund’s (and other Oppenheimer funds’) financial, accounting, regulatory and investment matters and has contributed to the Boards’ deliberations. Oversees 55 portfolios in the OppenheimerFunds complex. Ms. Krentzman has served on the Boards of certain Oppenheimer funds since August 2014, during which time she has become familiar with the Fund’s (and other Oppenheimer funds’) financial, accounting, regulatory and investment matters and has contributed to the Boards’ deliberations. |
82 OPPENHEIMER GLOBAL ALLOCATION FUND
| | |
Mary F. Miller,
Trustee (since 2009)
Year of Birth: 1942 | | Trustee of International House (not-for-profit) (since June 2007); Trustee of the American Symphony Orchestra (not-for-profit) (October 1998-November 2011); and Senior Vice President and General Auditor of American Express Company (financial services company) (July 1998-February 2003). Oversees 55 portfolios in the OppenheimerFunds complex. Ms. Miller has served on the Boards of certain Oppenheimer funds since August 2004, during which time she has become familiar with the Fund’s (and other Oppenheimer funds’) financial, accounting, regulatory and investment matters and has contributed to the Boards’ deliberations. |
| |
Joel W. Motley,
Trustee (since 2009) Year of Birth: 1952 | | Director of Greenwall Foundation (since October 2013); Member of Board and Investment Committee of The Greenwall Foundation (since April 2013); Member of the Vestry of Trinity Wall Street (since April 2012); Director of Southern Africa Legal Services Foundation (since March 2012); Board Member of Pulitzer Center for Crisis Reporting (non-profit journalism) (since March 2011); Managing Director of Public Capital Advisors, LLC (privately-held financial advisor) (since January 2006); Managing Director of Carmona Motley, Inc. (privately-held financial advisor) (since January 2002); Director of Columbia Equity Financial Corp. (privately-held financial advisor) (2002-2007); Managing Director of Carmona Motley Hoffman Inc. (privately-held financial advisor) (January 1998-December 2001); Member of the Finance and Budget Committee of the Council on Foreign Relations, Member of the Investment Committee and Board of Human Rights Watch (since July 2000) and Member of the Investment Committee and Board of Historic Hudson Valley (since February 2010). Oversees 55 portfolios in the OppenheimerFunds complex. Mr. Motley has served on the Boards of certain Oppenheimer funds since October 2002, during which time he has become familiar with the Fund’s (and other Oppenheimer funds’) financial, accounting, regulatory and investment matters and has contributed to the Boards’ deliberations. |
| |
Joanne Pace,
Trustee (since 2012) Year of Birth: 1958 | | Advisory Board Director of Massey Quick and Company, LLC (since October 2014); Board Director of Horizon Blue Cross Blue Shield of New Jersey (since November 2012); Advisory Board Director of The Alberleen Group LLC (since March, 2012); Board Member (since January 2015), Advisory Council Member (December 2012-December 2014) of 100 Women in Hedge Funds (non-profit) (since December, 2012); Advisory Council Member of Morgan Stanley Children’s Hospital (non-profit) (since May, 2012); Board Director of The Komera Project (non-profit) (since April, 2012); New York Advisory Board Director of Peace First (non-profit) (2010-2015); Senior Advisor of SECOR Asset Management, LP (2010-2011); Managing Director and Chief Operating Officer of Morgan Stanley Investment Management (2006-2010); Partner and Chief Operating Officer of FrontPoint Partners, LLC (hedge fund) (2005-2006); held the following positions at Credit Suisse: Managing Director (2003-2005); Global Head of Human Resources and member of Executive Board and Operating Committee (2004-2005), Global Head of Operations and Product Control (2003-2004); held the following positions at Morgan Stanley: Managing Director (1997-2003), Controller and Principal Accounting Officer (1999-2003); Chief Financial Officer (temporary assignment) for the Oversight Committee, Long Term Capital Management (1998-1999). Lead Independent Director and Chair of the Audit and Nominating Committee of The Global Chartist Fund, LLC of Oppenheimer Asset Management (2011-2012); Board Director of Managed Funds Association (2008-2010); Board Director of Morgan |
83 OPPENHEIMER GLOBAL ALLOCATION FUND
| | |
| TRUSTEES AND OFFICERS Unaudited / Continued | | |
| | |
Joanne Pace,
Continued | | Stanley Foundation (2007-2010) and Investment Committee Chair (2008-2010). Oversees 55 portfolios in the OppenheimerFunds complex. Ms. Pace has served on the Boards of certain Oppenheimer funds since November 2012, including as an Advisory Board Member for certain Oppenheimer funds, during which time she has become familiar with the Fund’s (and other Oppenheimer funds’) financial, accounting, regulatory and investment matters and has contributed to the Board’s deliberations. For purposes of this report, Ms. Pace is identified as a Trustee. |
| |
Daniel Vandivort,
Trustee (since 2015) Year of Birth: 1954 | | Chairman and Lead Independent Director/Trustee (March 2010-September 2014), Chairman of the Audit Committee (March 2009-September 2014) and Director/ Trustee (December 2008-September 2014) of the Board of Directors/Trustees of Value Line Funds; Trustee, Board of Trustees of Huntington Disease Foundation of America (since January 2015 and June 2007-December 2013): Trustee, Board of Trustees, RIM Retirement Savings Plan (2005-2007); President and Chief Investment Officer, Robeco Investment Management, formerly known as Weiss Peck and Greer (January 2005-June 2007); Member, Management Committee of Robeco Investment Management (2001-2007); Chairman and Trustee of the Board of Trustees of Weiss, Peck and Greer Funds (2004-2005); Managing Director and Head of Fixed Income, Weiss, Peck and Greer (November 1994-January 2005); Managing Director and Head of Fixed Income, CS First Boston Investment Management (January 1992-November 1994); Director, Global Product Development, First Boston Asset Management (November 1989 to January 1992); Vice President, Fixed Income Sales, First Boston Corp. (May 1984-November 1989). Oversees 55 portfolios in the OppenheimerFunds complex. Mr. Vandivort has served on the Boards of certain Oppenheimer funds since 2014, during which time he has become familiar with the Fund’s (and other Oppenheimer funds’) financial, accounting, regulatory and investment matters and has contributed to the Boards’ deliberations. |
|
INTERESTED TRUSTEE AND
OFFICER | | Mr. Steinmetz is an “Interested Trustee” because he is affiliated with the Manager and the Sub-Adviser by virtue of his positions as Chairman of the Sub-Adviser and officer and director of the Manager. Both as a Trustee and as an officer, Mr. Steinmetz serves for an indefinite term, or until his resignation, retirement, death or removal. Mr. Steinmetz’s address is 225 Liberty Street, New York, New York 10281-1008. |
| |
Arthur P. Steinmetz,
Trustee (since 2015), President and Principal Executive Officer (since
2014) Year of Birth: 1958 | | Chairman of the Sub-Adviser (since January 2015); CEO and Chairman of the Manager (since July 2014), President of the Manager (since May 2013), a Director of the Manager (since January 2013), Director of the Sub-Adviser (since July 2014), President, Management Director and CEO of Oppenheimer Acquisition Corp. (the Sub-Adviser’s parent holding company) (since July 2014), and President and Director of OFI SteelPath, Inc. (since January 2013). Chief Investment Officer of the OppenheimerFunds advisory entities from (January 2013-December 2013); Executive Vice President of the Manager (January 2013-May 2013); Chief Investment Officer of the Sub-Adviser (October 2010-December 2012); Chief Investment Officer, Fixed-Income, of the Sub-Adviser (April 2009-October 2010); Executive Vice President of the Sub-Adviser (October 2009-December 2012); Director of Fixed Income of the Sub-Adviser (January 2009-April 2009); and a Senior Vice President of the Sub-Adviser (March 1993-September 2009). An officer of 100 portfolios in the OppenheimerFunds complex. |
|
OTHER OFFICERS OF THE FUND | | The addresses of the Officers in the chart below are as follows: for Messrs. Hamilton, Rockmuller, de Longis, Lee, Mss. Lo Bessette, Foxson and Picciotto, 225 Liberty Street, New York, New York 10281-1008, for Mr. Petersen, 6803 S. Tucson Way, Centennial, Colorado 80112-3924. Each Officer serves for an indefinite term or until his or her resignation, retirement, death or removal. |
84 OPPENHEIMER GLOBAL ALLOCATION FUND
| | |
Mark Hamilton,
Vice President (since 2013)
Year of Birth: 1965 | | Chief Investment Officer, Asset Allocation of the Sub-Adviser (since April 2013) and a Senior Vice President of the Sub-Adviser (since April 2013). Mr. Hamilton served at AllianceBernstein L.P. (from 1994-2013), as an Investment Director of Dynamic Asset Allocation (from 2010-2013), Head of North American Blend Team (from 2009-2010), and Senior Portfolio Manager of Blend Strategies (from 2006-2010). A portfolio manager and an officer of other portfolios in the OppenheimerFunds complex. |
| |
Benjamin H. Rockmuller,
Vice President (since 2011)
Year of Birth: 1979 | | Vice President of the Sub-Adviser (since September 2010); Assistant Vice President of the Sub-Adviser (January 2010-August 2010); Portfolio Manager of the Sub- Adviser (since July 2010); Senior Analyst of the Sub-Adviser for the Global Debt Team (January 2010-July 2010); Intermediate Analyst of the Sub-Adviser for the Global Debt Team (January 2007-January 2010); Junior Analyst of the Sub-Adviser for the Global Debt Team (April 2004-January 2007) and Junior Analyst of the Sub- Adviser for the High Yield Team (June 2003-April 2004). A portfolio manager and an officer in the OppenheimerFunds complex. |
| |
Alessio de Longis,
Vice President (since 2015)
Year of Birth: 1978 | | Vice President of the Sub-Adviser (since June 2010); Assistant Vice President of the Sub-Adviser (May 2009-June 2010); Senior Research Analyst of the Sub-Adviser (January 2008-June 2010); Intermediate Research Analyst of the Sub-Adviser (January 2006-January 2008) Junior Analyst of the Sub-Adviser (February 2004-January 2006). A portfolio manager and an officer in the OppenheimerFunds complex. |
| |
Dokyoung Lee,
Vice President (since 2015)
Year of Birth: 1965 | | Director of Research, Global Multi-Asset Group and a Senior Vice President of the Sub-Adviser (since October 2013). Mr. Lee served at Alliance Bernstein L.P. (1994- 2013): Director of Research for Strategic Asset Allocation (2011-2013), Director of Research for Blend Strategies (2008-2011), Head of Asia Pacific Blend Strategies (2005-2008), Head of Quantitative Research and Senior Portfolio Manager for Japan Value Equities (2001-2005), Portfolio Manager for Emerging Markets Value Equities (1997-2001), and Quantitative Analyst for US Value Equities (1994-1997). A portfolio manager and an officer in the OppenheimerFunds complex. |
| |
Cynthia Lo Bessette,
Secretary and Chief Legal
Officer (since 2016) Year of Birth: 1969 | | Executive Vice President, General Counsel and Secretary of the Manager (since February 2016); Chief Legal Officer of the Sub-Adviser and the Distributor (since February 2016); Vice President, General Counsel and Secretary of Oppenheimer Acquisition Corp. (since February 2016); General Counsel of OFI SteelPath, Inc., VTL Associates, LLC and Index Management Solutions, LLC (since February 2016); Chief Legal Officer of OFI Global Institutional, Inc., HarbourView Asset Management Corporation, OFI Global Trust Company, Oppenheimer Real Asset Management, Inc., OFI Private Investments Inc., Shareholder Services, Inc. and Trinity Investment Management Corporation (since February 2016); Senior Vice President and Deputy General Counsel (March 2015-February 2016); Vice President, Corporate Counsel (February 2012-March 2015) and Deputy Chief Legal Officer (April 2013-March 2015) of Jennison Associates LLC; Assistant General Counsel (April 2008-September 2009) and Deputy General Counsel (October 2009-February 2012) of Lord Abbett & Co. LLC. An officer of 100 portfolios in the OppenheimerFunds complex. |
| |
Jennifer Foxson,
Vice President and Chief
Business Officer (since
2014) Year of Birth: 1969 | | Senior Vice President of OppenheimerFunds Distributor, Inc. (since June 2014); Vice President of OppenheimerFunds Distributor, Inc. (April 2006-June 2014); Vice President of the Sub-Adviser (January 1998-March 2006); Assistant Vice President of the Sub-Adviser (October 1991-December 1998). An officer of 100 portfolios in the OppenheimerFunds complex. |
85 OPPENHEIMER GLOBAL ALLOCATION FUND
| | |
| TRUSTEES AND OFFICERS Unaudited / Continued | | |
| | |
Mary Ann Picciotto,
Chief Compliance Officer and
Chief Anti-Money Laundering
Officer (since 2014) Year of Birth: 1973 | | Senior Vice President and Chief Compliance Officer of the Manager (since March 2014); Chief Compliance Officer of the Sub-Adviser, OFI SteelPath, Inc., OFI Global Trust Company, OFI Global Institutional, Inc., Oppenheimer Real Asset Management, Inc., OFI Private Investments, Inc., Harborview Asset Management Corporation, Trinity Investment Management Corporation, and Shareholder Services, Inc. (since March 2014); Managing Director of Morgan Stanley Investment Management Inc. and certain of its various affiliated entities; Chief Compliance Officer of various Morgan Stanley Funds (May 2010-January 2014); Chief Compliance Officer of Morgan Stanley Investment Management Inc. (April 2007-January 2014). An officer of 100 portfolios in the OppenheimerFunds complex. |
| |
Brian S. Petersen,
Treasurer and Principal Financial &
Accounting Officer (since 2016)
Year of Birth: 1970 | | Vice President of the Manager (since January 2013); Vice President of the Sub-Adviser (February 2007-December 2012); Assistant Vice President of the Sub- Adviser (August 2002-2007). An officer of 100 portfolios in the OppenheimerFunds complex. |
The Fund’s Statement of Additional Information contains additional information about the Fund’s Trustees and Officers and is available without charge upon request by calling 1.800.CALL OPP (225.5677).
86 OPPENHEIMER GLOBAL ALLOCATION FUND
| | |
| OPPENHEIMER GLOBAL ALLOCATION FUND | | |
| | |
| |
| Manager | | OFI Global Asset Management, Inc. |
| |
| Sub-Adviser | | OppenheimerFunds, Inc. |
| |
| Distributor | | OppenheimerFunds Distributor, Inc. |
| |
Transfer and Shareholder
Servicing Agent | | OFI Global Asset Management, Inc. |
| |
| Sub-Transfer Agent | | Shareholder Services, Inc. |
| | DBA OppenheimerFunds Services |
| |
Independent Registered
Public Accounting Firm | | KPMG LLP |
| |
| Legal Counsel | | Kramer Levin Naftalis & Frankel LLP |
© 2016 OppenheimerFunds, Inc. All Rights reserved.
87 OPPENHEIMER GLOBAL ALLOCATION FUND
As an Oppenheimer fund shareholder, you are entitled to know how we protect your personal information and how we limit its disclosure.
Information Sources
We obtain nonpublic personal information about our shareholders from the following sources:
| ● | | Applications or other forms |
| ● | | When you create a user ID and password for online account access |
| ● | | When you enroll in eDocs Direct, our electronic document delivery service |
| ● | | Your transactions with us, our affiliates or others |
| ● | | Technologies on our website, including: “cookies” and web beacons, which are used to collect data on the pages you visit and the features you use. |
If you visit oppenheimerfunds.com and do not log on to the secure account information areas, we do not obtain any personal information about you. When you do log on to a secure area, we do obtain your user ID and password to identify you. We also use this information to provide you with products and services you have requested, to inform you about products and services that you may be interested in and assist you in other ways.
We do not collect personal information through our website unless you willingly provide it to us, either directly by email or in those areas of the website that request information. In order to update your personal information (including your mailing address, email address and phone number) you must first log on and visit your user profile.
If you have set your browser to warn you before accepting cookies, you will receive the warning message with each cookie. You can refuse cookies by turning them off in your browser. However, doing so may limit your access to certain sections of our website.
We use cookies to help us improve and manage our website. For example, cookies help us recognize new versus repeat visitors to the site, track the pages visited, and enable some special features on the website. This data helps us provide a better service for our website visitors.
Protection of Information
We do not disclose any non-public personal information (such as names on a customer list) about current or former customers to anyone, except as permitted by law.
Disclosure of Information
Copies of confirmations, account statements and other documents reporting activity in your fund accounts are made available to your financial advisor (as designated by you). We may also use details about you and your investments to help us, our financial service affiliates, or firms that jointly market their financial products and services with ours, to better serve your investment needs or suggest educational material that may be of interest to you. If this requires us to provide you with an opportunity to “opt in” or “opt out” of such information sharing with a firm not affiliated with us, you will receive notification on how to do so, before any such sharing takes place.
Right of Refusal
We will not disclose your personal information to unaffiliated third parties (except as permitted by law), unless we first offer you a reasonable opportunity to refuse or “opt out” of such disclosure.
88 OPPENHEIMER GLOBAL ALLOCATION FUND
Internet Security and Encryption
In general, the email services provided by our website are encrypted and provide a secure and private means of communication with us. To protect your own privacy, confidential and/or personal information should only be communicated via email when you are advised that you are using a secure website. As a security measure, we do not include personal or account information in non-secure emails, and we advise you not to send such information to us in non-secure emails. Instead, you may take advantage of the secure features of our website to encrypt your email correspondence. To do this, you will need to use a browser that supports Secure Sockets Layer (SSL) protocol.
| ● | | All transactions, including redemptions, exchanges and purchases, are secured by SSL and 256-bit encryption. SSL is used to establish a secure connection between your PC and OppenheimerFunds’ server. It transmits information in an encrypted and scrambled format. |
| ● | | Encryption is achieved through an electronic scrambling technology that uses a “key” to code and then decode the data. Encryption acts like the cable converter box you may have on your television set. It scrambles data with a secret code so that no one can make sense of it while it is being transmitted. When the data reaches its destination, the same software unscrambles the data. |
| ● | | You can exit the secure area by either closing your browser, or for added security, you can use the Log Out button before you close your browser. |
Other Security Measures
We maintain physical, electronic and procedural safeguards to protect your personal account information. Our employees and agents have access to that information only so that they may offer you products or provide services, for example, when responding to your account questions.
How You Can Help
You can also do your part to keep your account information private and to prevent unauthorized transactions. If you obtain a user ID and password for your account, safeguard that information. Also, take special precautions when accessing your account on a computer used by others.
Who We Are
This joint notice describes the privacy policies of the Oppenheimer funds, OppenheimerFunds, Inc., each of its investment adviser subsidiaries, OppenheimerFunds Distributor, Inc. and OFI Global Trust Co. It applies to all Oppenheimer fund accounts you presently have, or may open in the future, using your Social Security number—whether or not you remain a shareholder of our funds. This notice was last updated November 2016. In the event it is updated or changed, we will post an updated notice on our website at oppenheimerfunds.com. If you have any questions about this privacy policy, write to us at P.O. Box 5270, Denver, CO 80217-5270, email us by clicking on the Contact Us section of our website at oppenheimerfunds.com or call us at 1.800.CALL OPP (225.5677).
89 OPPENHEIMER GLOBAL ALLOCATION FUND
THIS PAGE INTENTIONALLY LEFT BLANK.
90 OPPENHEIMER GLOBAL ALLOCATION FUND
THIS PAGE INTENTIONALLY LEFT BLANK.
91 OPPENHEIMER GLOBAL ALLOCATION FUND
THIS PAGE INTENTIONALLY LEFT BLANK.
92 OPPENHEIMER GLOBAL ALLOCATION FUND
THIS PAGE INTENTIONALLY LEFT BLANK.
93 OPPENHEIMER GLOBAL ALLOCATION FUND
THIS PAGE INTENTIONALLY LEFT BLANK.
94 OPPENHEIMER GLOBAL ALLOCATION FUND
THIS PAGE INTENTIONALLY LEFT BLANK.
95 OPPENHEIMER GLOBAL ALLOCATION FUND
| | | | |
| |  | | |
| | OppenheimerFunds® | | |
| | The Right Way | | |
| | to Invest | | |
| | |
| | Visit us at oppenheimerfunds.com for 24-hr access to account information and transactions or call us at 800.CALL OPP (800.225.5677) for 24-hr automated information and automated transactions. Representatives also available Mon–Fri 8am-8pm ET. | | |
| | | | |
| Visit Us | | | | |
| oppenheimerfunds.com | | | | |
| | |
| Call Us | | | | |
| 800 225 5677 | | | | |
| | |
| Follow Us | | | | |
 | | Oppenheimer funds are distributed by OppenheimerFunds Distributor, Inc. | | |
| | 225 Liberty Street, New York, NY 10281-1008 | | |
| | © 2016 OppenheimerFunds Distributor, Inc. All rights reserved. | | |
| | RA0257.001.1016 December 22, 2016 | | |
Table of Contents
Class A Shares
AVERAGE ANNUAL TOTAL RETURNS AT 10/31/16
| | | | | | |
| | | Class A Shares of the Fund | | |
| | | Without Sales Charge | | With Sales Charge | | HFRX Global Hedge Fund Index |
1-Year | | -0.18% | | -5.92% | | -1.30% |
|
5-Year | | 3.29 | | 2.07 | | 1.04 |
|
10-Year | | 2.97 | | 2.36 | | -0.44 |
|
Performance data quoted represents past performance, which does not guarantee future results. The investment return and principal value of an investment in the Fund will fluctuate so that an investor’s shares, when redeemed, may be worth more or less than their original cost. Fund returns include changes in share price, reinvested distributions, and a 5.75% maximum applicable sales charge except where “without sales charge” is indicated. Current performance may be lower or higher than the performance quoted. Returns do not consider capital gains or income taxes on an individual’s investment. For performance data current to the most recent month-end, visit oppenheimerfunds.com or call 1.800.CALL OPP (225.5677). See Fund prospectuses and summary prospectuses for more information on share classes and sales charges.
2 OPPENHEIMER FUNDAMENTAL ALTERNATIVES FUND
Fund Performance Discussion
The Fund’s Class A shares (without sales charge) produced a total return of -0.18% for the 12-month reporting period ending 10/31/16. The Fund outperformed its benchmark, the HFRX Global Hedge Fund Index (“Index”), which returned -1.30% during the same period, by 112 basis points (“bps”). The Fund also outperformed the Morningstar Multialternative Funds category average, which produced a return of -0.39%, by 21 bps. The Fund’s Class A shares (without sales charge) ranked in the 48th percentile (230 out of 474 funds) of its Morningstar peer group for total return during the reporting period and in the 4th percentile (11 out of 260 funds) for the three years ending 10/31/16. For the five-year and ten-year periods ended 10/31/16, the Fund ranked in the 35th percentile (56 out of 161 funds) and 15th (7 out of 43 funds), respectively, although these rankings include time periods before the current portfolio manager began managing the Fund. Our Long/Short Equity strategy (called Equity Hedge in the Fund’s prospectus dated 2/26/16) generated strong positive returns and was the largest contributor to performance during the period. The Long/Short Credit strategy also generated positive returns and contributed to performance. The Long/Short Macro strategy (called Global Macro in the prospectus) generated negative returns and detracted from performance during the period.
COMPARISON OF CHANGE IN VALUE OF $10,000 HYPOTHETICAL INVESTMENTS IN:
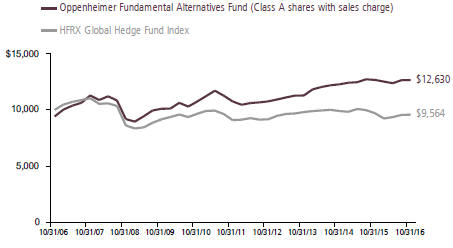
3 OPPENHEIMER FUNDAMENTAL ALTERNATIVES FUND
The Fund offers the flexibility often associated with alternatives while providing the daily liquidity and transparency benefits of a mutual fund. It seeks to provide investors with strong risk-adjusted returns that have low sensitivity to traditional market factors over the long term. The investment team’s process has an underlying value philosophy that combines bottom-up and top-down fundamental analysis for security selection and portfolio construction. The Fund is able to invest both long and short across distinct alternative investment strategies including Long/Short Equity, Long/Short Credit and Long/Short Macro (including currencies, interest rates, sovereign debt and commodities), making the Fund truly flexible. Although many investors focus on the short-term outlook when considering potential investments, the Fund utilizes a longer-term approach. We look at changing dynamics on both a macroeconomic and microeconomic basis over a multi-year time horizon to uncover investment opportunities that emerge from change.
The Fund continues to deliver on its value proposition of effective diversification combined with low volatility (3.10% standard deviation during the reporting period, which was 69% lower than that of the S&P 500), good downside risk mitigation and high risk-adjusted returns. Significantly, the Fund held up well during the most pronounced risk-off episodes of the reporting period. For example, in the first six weeks of 2016 (12/31/15-2/11/16), the S&P 500 Index fell 10.27% while the Fund declined 90% less
or 1.01%, and outperformed that index by 926 basis points. Similarly, in the immediate aftermath of the Brexit vote (6/23/16-6/27/16), the S&P 500 Index declined 5.34% while the Fund declined 99% less or 0.04%, and outperformed that index by 530 basis points.
In addition, the Fund continues to generate extremely high risk-adjusted returns. Two key measures of those returns are the Sharpe ratio (which penalizes both upside and downside volatility) and the Sortino ratio (which penalizes only downside volatility). For the period from April 2012 to October 2016 (the time that Michelle Borré has managed the strategy), the Fund has been ranked in the 2nd percentile of the Morningstar Multialternative peer group for both Sharpe ratio and Sortino ratio, right near the top of the class. Moreover, we believe that upside/downside capture ratios provide a good measure of the Fund’s downside protection. The upside capture ratio is the cumulative performance of the Fund in all up months of positive return divided by the cumulative performance of the index in those months. The downside capture ratio is the cumulative performance of the Fund in all down months of negative return divided by the cumulative performance of the index in those months. For the period from April 2012 to October 2016, the Fund’s upside capture has been 88% of the Index and its downside capture has been just 22%. This level of asymmetry means that the Fund has delivered significantly more upside than downside during that period. In contrast,
4 OPPENHEIMER FUNDAMENTAL ALTERNATIVES FUND
the Morningstar Multialternative peer group average captured 80% of the upside of the Index but also 79% of the downside over the same period. In our view, these risk-adjusted returns and upside/downside capture ratios are a testament to the Fund’s intelligent blending of multiple strategies across multiple asset classes.
MARKET OVERVIEW
The global capital markets began to undergo several meaningful changes during the reporting period. Certain of these changes resulted from the Federal Reserve’s (“Fed”) decision in December 2015 to raise the Fed Funds rate for the first time in nine years. Although the increase was only 25 bps, it was accompanied by Fed guidance that the market could be facing up to four rate hikes in 2016 and an additional four hikes in 2017. The possibility of eight rate hikes over the next 24 months was enough to spark a global selloff, with the S&P 500 falling 10.27% in the first six weeks of 2016. During the same period, the FTSE 100 Index fell 11.11%, the Nikkei 225 Index fell 17.44%, the MSCI Emerging Markets Index fell 10.17% and WTI crude oil collapsed 29.92% to a new cycle low of $26 per barrel. The severity of this selloff surprised the Fed, causing it to walk back market expectations about the steepness of the path to rate normalization. Instead of proceeding with eight rate hikes over 2016-2017, the Fed immediately hit pause and has not raised rates again for the last 10 months. It remains to be seen when the Fed will start hiking again (possibly in December 2016) and
what the path toward rate normalization will look like. However, one thing is certain—when the Fed hikes again it will only be widening a divergence of monetary policy that investors have never faced before. This is especially true since the European Central Bank (“ECB”), the Bank of Japan (“BoJ”), the Bank of England (“BoE”) and the Peoples’ Bank of China, among others, continue to execute quantitative easing (“QE”), negative interest rate policies or other forms of monetary easing. (In fact, central banks in the U.K., Russia, Brazil, India, Australia, New Zealand, Indonesia, Argentina and elsewhere have all cut interest rates since mid-2016.) Each of these central bank programs, like the four rounds of QE that the Fed executed from 2009-2014, are designed to help boost the economy by keeping mortgage rates and other long-term interest rates low, but a primary benefit to investors has turned out to be their contribution to asset price inflation.
Although the Fed stopped purchases under its most recent QE program on Halloween of 2014, the combination of the ECB’s and BoE’s new QE programs, and the BoJ’s acceleration of its existing QE program, have more than made up for the cessation of the Fed’s purchases, further adding to global liquidity in both 2015 and 2016. Significantly, we do not expect this year-on-year acceleration in total global QE to continue indefinitely. Moreover, the results in the Eurozone and Japan have not been particularly impressive so far. Inflation has remained well below target and economic growth has remained anemic in both regions. Real GDP growth in the
5 OPPENHEIMER FUNDAMENTAL ALTERNATIVES FUND
Eurozone was only 1.6% year-on-year in the third quarter of 2016, and it was just 0.9% in Japan for the same period.
As investors have begun to appreciate the broader implications of these changes in both monetary policy and global liquidity, risk asset classes have started to behave differently. For example, during the 25 year period ending 12/31/15, the average annual total return for the S&P 500 was 9.81%. However, four rounds of QE by the Fed during 2009-2014 accelerated economic growth, inflated risk asset prices and pulled forward financial returns. In fact, during that six year period, the average annual total return for the S&P 500 increased to 17.2%. When the last of those QE programs ended on 10/31/14, economic growth slowed and financial returns declined sharply. In this regard, the total return for the S&P 500 in 2015—the first full year after QE3 ended—was just 1.38%. While the total return for the S&P 500 has improved to 5.87% year to date (as of 10/31/16), we believe a critical driver of that improvement has been the fact that the Fed has not raised rates again in the last 10 months. Going forward, we believe that returns for the S&P 500 will be more muted than they have been over the last seven years, with an average annual return in the mid-single digits or less on a longer term basis. In short, we expect structurally lower returns and higher volatility in a post-QE world (at least in the U.S.) where extremely accommodative monetary policies stimulated growth, inflated risk asset prices and pulled forward financial returns. Of course, the surprise election
victory of Donald Trump could act as a catalyst that also pulls forward returns.
More broadly, we believe that in a number of countries there has been a meaningful change in the relationship between elected representatives and voters, or stated differently, between those who make policies and those who actually pay for those policies. This change was typified by Brexit where voters in the U.K. surprised the capital markets by electing to leave the European Union (EU). This outcome caused Prime Minister David Cameron to resign and many economists have opined that Brexit would negatively impact growth and could ultimately send the U.K. into a recession. Yet in the wake of that vote, risk assets around the world sold off sharply for just two days, and then started rising again as the BoE promised additional monetary stimulus to counteract the effects of any slowdown. To be clear, the U.K. has not yet left the EU, and the terms of its withdrawal have not yet been negotiated. This means that the full impact of the Brexit vote, and its true economic cost, are still to be determined.
In other countries, voter dissatisfaction with ruling parties continues to grow. For example, German Chancellor Angela Merkel’s Christian Democratic Union posted disappointing losses in several recent elections, due in part to voter anger over Germany’s acceptance of more than one million refugees from the Middle East and Africa. Italian voters rejected a constitutional referendum in December 2016, causing Prime Minister
6 OPPENHEIMER FUNDAMENTAL ALTERNATIVES FUND
Matteo Renzi to resign. In Turkey, President Recep Erdogan put down an attempted military coup in July and then consolidated power by implementing a broad-based purge of his political enemies. In the Philippines, newly elected right-wing President Rodrigo Duterte is remaking his country through a hyper-aggressive war on corruption as well as a lurch away from the U.S. and toward China. In Brazil, President Dilma Rousseff was impeached for illegally manipulating government accounts. In South Korea, President Park Geun Hye was recently impeached for misconduct while in office. In short, the chasm between politicians who decide social and fiscal policies and the voters who actually pay for those policies is growing. Most recently, voter dissatisfaction was on full display as Donald Trump won the U.S. presidential election, and he will enter office as the ultimate outsider who promised to “drain the swamp” and effect radical change in Washington. Looking ahead, Germany, France and the Netherlands hold national elections in 2017. (French Prime Minister Francois Hollande recently announced that he would not seek a second term.) We believe the results could lead to additional fragmentation in Europe and could create additional volatility in the markets.
Finally, the reporting period was marked by sharp selloffs in risk assets combined with spikes in volatility. For example, the S&P 500 sold off sharply in December 2015 (weak economic data), January/February 2016 (Fed rate hike) and June 2016 (Brexit), while the Chicago Board Options Exchange SPX
Volatility Index (“VIX Index”) spiked in each of those months. During the one year period ended 10/31/16, the yield on the 10-year Treasury note oscillated between a high of 2.37% on 11/9/15 and a low of 1.32% on 7/6/16 before ending the period at 1.83% for a decline of 31 bps. Against this backdrop, the Bloomberg Barclays U.S. Aggregate Bond Index delivered a total return of 4.37% during the period while the Credit Suisse Leveraged Loan Index had a total return of 6.30%. In other words, these bond indices delivered single digit returns with relatively high volatility. In our view, Treasuries could become less helpful to investors during market selloffs in part because they offer paltry yields, making the risk/reward tradeoff unattractive. This is especially true as the Fed moves closer to raising rates again.
In our view, equity markets are exhibiting significantly increased volatility but are no longer rising as consistently as they did in the previous seven years, and traditional fixed income investments are not providing as much ballast to diversified portfolios during a challenging market environment. Under these circumstances, we believe investors could benefit from a broader toolkit than was needed during the risk-on market of 2009-2014 and a different toolkit than has been effective in the past because of the unfavorable risk/reward in conservative fixed income. Part of this broader toolkit could include the ability to take positions with short exposure that can actually profit from market declines. This kind of short exposure is available through the Fund.
7 OPPENHEIMER FUNDAMENTAL ALTERNATIVES FUND
FUND REVIEW
Long/Short Equity Strategy. This strategy generated positive returns and was the strongest contributor to performance during the reporting period. The top contributors in the long equity component of the strategy were UnitedHealth Group and Republic Services. The top contributors in the short equity component of the strategy were Clubcorp Holdings and Ensco. In contrast, the biggest detractor in the long equity component of the strategy was Allergan, while the biggest detractors in the short equity component were Subsea 7 and Caterpillar.
Top Contributors
Our long position in UnitedHealth Group (UNH) contributed to performance during the period. UNH is the largest U.S. health insurer with a diversified business model that serves commercial customers, government programs such as Medicare Advantage and Medicaid, and international customers, among others. Despite facing headwinds over the past two years from implementation of the Affordable Care Act, UNH projected an improving business environment and forecast strong growth in 2016 due to membership gains and disciplined management of medical costs. The company also owns a fast-growing services business, Optimum, which has increasingly become a driver for earnings. UNH significantly bolstered the prescription benefits management (“PBM”) portion of that business in 2015 by acquiring publicly traded Catamaran. The acquisition,
which closed in July and created the third largest PBM company as measured by annual prescriptions, is expected to be meaningfully accretive to earnings in 2016 and beyond.
Our long position in Republic Services (RSG), a U.S.-based solid waste collection and disposal service, contributed to performance as well. The stock benefitted from positive trends in pricing and volume on the back of population growth as well as commercial waste growth. RSG also benefitted from implementing digital and e-commerce capabilities to offer better services to its customers while increasing prices. In addition, the company shifted some of its index-based pricing customers to an alternative (and higher) waste index, which helped RSG offset weakening consumer pricing index trends. Moreover, the company enhanced productivity through automation of its residential collection fleet and improvements in fleet maintenance, thereby expanding margins.
Our short position in Clubcorp Holdings (MYCC), which operates a membership-based leisure business that includes golf clubs and country clubs, also contributed to performance. A combination of factors pressured the company’s stock price, which benefitted our short position. For example, Clubcorp has operations concentrated in states such as Texas where there has been a negative economic impact from the volatility in energy prices. This has caused investors to question the sustainability of
8 OPPENHEIMER FUNDAMENTAL ALTERNATIVES FUND
member retention as well as management’s willingness to reinvest in the business. In addition, there are lingering investor concerns that golf, and country clubs in general, will resonate less with Millennials going forward than they have in the past with older demographic groups. We exited this position during the reporting period.
Similarly, our short position in Ensco (ESV), a U.K.-based offshore driller, was a positive contributor to performance during the period. The stock has been hurt by quarterly operational misses due to declining revenues. ESV was also hurt by announcements of deep-water rig cancellations from Petrobras and Total S.A. The company continues to struggle in an oversupplied offshore rig market. These factors, coupled with revised market expectations that the offshore rig recovery could now be pushed out until 2019, put additional pressure on the stock. ESV’s share price fell 44% year to date through 9/30/16 after falling 47% in 2015. We exited our short position in ESV at the end of the third quarter.
Largest Detractors
In contrast, our long position in Allergan (AGN), formerly known as Actavis, detracted from performance in the period. AGN is a specialty pharmaceuticals company that markets branded drugs for patients suffering from disease principally in the eye care, neuroscience, medical aesthetics/dermatology, women’s health and gastroenterology categories. In July 2015, Allergan announced
the sale of its generics business, which sells approximately 1,000 pharmaceutical products globally, to Teva Pharmaceuticals for $40.5 billion. The transaction closed in mid-2016 and should enable the company to pursue additional opportunities in its branded pharmaceuticals business. In November 2015, the company announced that it was merging with Pfizer and expected the deal to close in the second half of 2016. However, the merger was called off in April after unprecedented actions by the U.S. Treasury department made the economics of the transaction no longer attractive. We continue to like Allergan as a stand-alone company, in part based on its organic and inorganic growth opportunities. We have added to our position following the break-up of the Pfizer acquisition.
Similarly, our short position in Subsea 7 (SUBC NO), a U.K.-based offshore engineering and construction services company, detracted from performance. Our short underperformed as the stock moved higher during the period due to three consecutive quarters of upside surprise in earnings before interest, taxes and depreciation. The financial outperformance resulted from the timing of project completions combined with strong execution. This upside surprise offset investor concerns that the company could face cancellation without recourse of 20% of its vessel contracts by Brazil this year, which could hurt vessel backlog significantly. In addition, investors worried that the book-to-bill ratio was significantly below 1.0x due to weaker
9 OPPENHEIMER FUNDAMENTAL ALTERNATIVES FUND
than expected orders for new projects.
Our short position in Caterpillar (CAT) also detracted from performance. The company is a U.S.-based manufacturer of construction & mining equipment as well as engines. The stock moved higher in the period on the back of investor expectations that the oil & gas and mining markets were bottoming, and therefore, the company’s earnings outlook was also bottoming. CAT also executed well in a challenging environment and was able to expand construction margins despite significant pressure on revenues. This dynamic gave investors greater confidence that 2016 could mark the bottom in the earnings cycle. Nonetheless, fundamentals in the North American construction market continue to deteriorate as manufacturers face increasing price competition, which raises questions about CAT’s ability to deliver higher earnings in 2017.
Long/Short Credit and Long/Short Macro Strategies. The Fund’s Long/Short Credit strategy generated positive returns and contributed to performance during the reporting period while the Long/Short Macro strategy generated negative returns and was a detractor. In terms of individual holdings, the top performers in the period were our long positions in gold, the corporate debt of Lukoil and a trust preferred security issued by Wells Fargo. The top three detractors were our long position in an asset-backed security (“ABS”) backed by airplane engines and our short positions in the Japanese yen and the credit of the Malaysian government.
Top Contributors
Our long position in gold (GLD) contributed to performance as the yellow metal climbed by 11.8% (or $135) to $1,277 per troy ounce during the period. Gold bullion, which began the period at $1,142 per ounce, declined into year end 2015 before rising in 2016 as real interest rates declined and inflation remained well contained. In the face of negative interest rate policies and QE in Europe, Japan and elsewhere around the world, investors bid up the price of gold as a safe haven play, a warrant against monetary policy going off the rails and a potential hedge against competitive currency debasement.
Our long position in the unsecured debt of Lukoil, a Russian integrated oil company, also helped performance. Lukoil’s ability to generate revenue is primarily driven by oil prices while its operating costs are denominated in rubles. In the last year, both oil prices and the ruble have moved in extremely wide ranges, yet both finished the 12-month reporting period essentially flat. During this time, the company maintained stable cash flows due to the tendency of ruble depreciation to offset oil price declines. The durability of this relationship has increased investor confidence in the company’s ability to manage volatility. Simply put, Lukoil has proven to be quite resilient to dramatic oil price fluctuations and geopolitical turmoil because of its modest financial leverage, ruble-denominated cost structure and a Russian tax system that reduces its sensitivity
10 OPPENHEIMER FUNDAMENTAL ALTERNATIVES FUND
to oil price movements.
Our long position in Wachovia Capital Trust III also contributed to performance. This is a trust preferred security of Wells Fargo, which acquired Wachovia Bank in 2008. This security was issued as a fixed-to-floating-rate instrument, but since the security was not called (redeemed) in 2011, it became a floating rate instrument. Because the security’s floor rate of 5.57% exceeds its contractual floating rate of 3-month Libor plus 93 bps, we are receiving the higher floor rate. A rally in longer duration Treasury securities combined with a tightening in corporate credit spreads caused Wachovia Capital Trust III to perform well during the period. In fact, this security outperformed S&P Preferred Stock Index during the year ended 10/31/16.
Largest Detractors
In contrast, our long position in Blade (2006-1AW A1), an ABS backed by a portfolio of aircraft engines, detracted from performance during the period. Some of Blade’s engines are associated with planes that are older and in less demand by aircraft lessors and airlines. The bond has underperformed as some of those engines have sold at prices that were below appraisal values, calling into question the value of the engine portfolio. On the positive side, however, both principal and interest payments on the bond are insured by Assured Guaranty.
Our long U.S. dollar/short Japanese yen position also detracted from performance.
The yen appreciated substantially after the BoJ introduced negative rates in Japan in early 2016. Although the negative rate policy was intended to stimulate the Japanese economy, the stress that negative rates put on Japanese banks has overwhelmed the stimulative impact of those rates. Under current policy, Japanese banks must pay to park reserves at the BoJ. While this increases the incentive for banks to lend, unfortunately loan demand has not been adequate to soak up the excess reserves. Furthermore, it has proven difficult for banks to pass negative rates on to depositors. The strain this policy has put on banks makes any extension of the policy challenging. The problems with negative rates combined with the size of the BoJ’s balance sheet have led some investors to conclude that the BoJ does not have capacity to stimulate the economy further and may need to shift to less accommodative policy. Since monetary stimulus reduces Japanese interest rates and makes the yen less attractive relative to the U.S. dollar, the prospect of this stimulus being removed has caused the yen to appreciate relative to the dollar, which hurt our short yen position. In September, the BoJ moved to a rate-targeting regime whereby it targets a level for 10-year interest rates. This shift away from further negative rates has eased the strain on banks and has resulted in a stabilization of the currency.
Finally, our short position in the credit of the Malaysian government detracted from performance as well. Malaysia is an energy exporter and a large percentage of
11 OPPENHEIMER FUNDAMENTAL ALTERNATIVES FUND
the government’s revenue comes from the energy sector. Stabilization in the oil price has improved Malaysia’s credit profile. In addition, the introduction of a goods and services tax (effectively a VAT) has partially offset the decline in government energy revenues. Furthermore, Malaysia conducts significant trade with China. The recovery in the Chinese economy in second half of 2016 has helped support the Malaysian economy. Lastly, Prime Minister Najib Razak has been the subject of several corruption investigations. In response to these charges, he moved decisively to consolidate power. Although the investigations and voter protests continue, the probability of political turmoil has decreased, which has further supported Malaysia’s credit profile and hurt our short position.
STRATEGY AND OUTLOOK
The macro environment remains complex and we continue to see numerous cross currents. In the wake of Donald Trump’s election victory in the U.S., we expect additional cross currents beginning in 2017. For example, President-elect Trump has discussed providing fiscal stimulus through a combination of tax cuts and infrastructure spending. If these efforts come to fruition, they could help accelerate economic growth, but they would also likely strengthen the U.S. dollar. If the new administration reduces the U.S. corporate tax rate, we believe this could help domestic companies much more than international companies (which presumably already take advantage of lower tax rates in
other jurisdictions). In particular, a reduction in the corporate tax rate to 15% (a level Trump repeatedly discussed on the campaign trail) could boost cash flows and earnings for certain companies in the portfolio by up to 20%. The Fund already had a home bias before the election because the investment team believes that fundamentals are generally better in the U.S. than in other regions. Trump’s victory makes that home bias more acute.
In addition, Trump has spoken about spending up to $1 trillion on infrastructure over a number of years. We believe this kind of investment could be very stimulative for GDP, but we recognize that acceleration in growth would only take place in the early years of the program. After that, the higher level of spending would become part of the base, and growth would taper off. Beyond that, there is currently $19.9 trillion in outstanding U.S. government debt. Depending on how an infrastructure program is funded, that number could grow meaningfully during the next administration.
Furthermore, although Republicans swept the White House, Senate and House of Representatives, legislative action still requires the approval of Congress. Since Republicans hold only a slim majority in the Senate (52 to 48), this may be a more challenging task than many investors expect. As a result, we are closely analyzing areas of public policy where Trump does not need the approval of Congress to effect meaningful change. One of these areas is international trade. Trump
12 OPPENHEIMER FUNDAMENTAL ALTERNATIVES FUND
recently named investor Wilbur Ross as his pick for Secretary of Commerce, and both Trump and Ross in the past have expressed antipathy toward what they consider to be bad trade deals (e.g., NAFTA, Trans-Pacific Partnership, etc.). While no one knows precisely what the new administration’s trade policies will be, we do know that trade barriers tend to make goods and services more expensive. We also know that trade barriers erected in the U.S. won’t necessarily result in the closure of manufacturing capacity in other countries. What this might mean for certain goods (e.g., Chinese steel facing tariffs in the U.S.) is that there could be an undersupply in the U.S., which would be inflationary, while there could be excess supply in foreign markets, which would be deflationary. This mismatch of supply and demand—created by artificial trade barriers and tit-for-tat retaliation—tends to depress global trade and economic growth. It could also be another catalyst that helps push the dollar higher versus certain foreign currencies, which would likely put downward pressure on commodity prices and S&P 500 earnings.
Finally, if Trump (and a newly reconstituted Federal Reserve) were more hawkish than investors currently expect, then the new administration could ultimately shift the tide away from the current “easy money forever” policies of central banks around the world. If so, the surprise would not be that such a shift occurred (most investors knew it had to happen eventually), but rather the catalyst that made it happen (Trump’s election victory). The ECB, BoJ, BoE and other central banks
will ultimately need to taper off negative rates and/or QE just as the Fed did, but the path to rate normalization may not be as smooth. We believe the recent “No” vote on the constitutional referendum in Italy (and Prime Minister Renzi’s subsequent resignation) or the national elections in Germany, France and the Netherlands next year could ultimately end up being catalysts that accelerate this move toward tighter monetary policy globally. We have constructed the portfolio with an eye toward delivering low volatility, effective diversification, strong downside risk mitigation and high risk-adjusted returns in a variety of market conditions.
More broadly, while equities look interesting versus bonds in the mid to longer term, we saw a shorter term disconnect between the strong performance in equities, softness in earnings growth, and negative earnings revisions for the S&P 500 in 2015-2016. Simply put, the U.S. equity market moved meaningfully ahead of earnings growth, and valuations climbed to the point where U.S. equities were no longer inexpensive. We also recognized that late cycle warning signs had started to flash yellow. Default rates on both prime and subprime auto loans, senior bank loans and high yield bonds had started to tick up. Profit margins for the S&P 500 had peaked and were starting to decline. But the outlook changed when Trump won a surprise victory in the presidential election. Although underlying earnings are weak, a reduction in the corporate tax rate could boost those earnings significantly. The timing of any potential tax cut is uncertain, and may
13 OPPENHEIMER FUNDAMENTAL ALTERNATIVES FUND
not occur until 2018 or later. The question for investors is whether earnings growth will meaningfully accelerate as the Trump administration’s policies are formulated and eventually implemented. Today that is an unknown.
As a result, security selection has become even more important. In our view, volatility was likely to increase, which it did with a vengeance in August of 2015 when China devalued the yuan. This heightened volatility continued through late 2015 on the back of weak economic data, into early 2016 as the Fed hiked rates for the first time in nine years, and then into mid-year with the Brexit vote. Extremely accommodative monetary policy around the world has impacted all asset classes, including equities, and has been an important driver of rising asset prices during the last several years. This exceptional accommodation was evident in 2015 with at least 35 central banks cutting rates collectively more than 55 times. It has continued into 2016 with additional rate cuts so far this year by the ECB, BoJ, BoE and central banks in Russia, Brazil, India, Australia, New Zealand, Indonesia, Singapore, Norway, Argentina and elsewhere. Under these circumstances, we believed that any normalization of rates and/or the withdrawal of central bank stimulus could pressure risk asset prices significantly, and that is precisely what happened after the Fed raised rates last December. We continue to believe that there is more risk lurking beneath the surface of the market than many investors recognize, but it has been masked by unusually
accommodative monetary policy, unusually low interest rates, unusually low volatility and adequate market liquidity. In our view, the market is caught between two unattractive outcomes—if growth really resumes, it will lead to sustained tightening. If growth tapers off, the tightening will be avoided but challenging underlying fundamentals will remain.
Trump’s election victory has caused a meaningful change in the fixed income markets. Treasury rates had been range bound for some time, with yields oscillating between 1.25% to 3.0%, although we recognized that a significant negative development in the emerging markets could push rates below the lower end of this range. The market came close to this outcome when 10-year Treasury yields dipped to 1.32% on 7/6/16. In the longer run, however, we did not believe rates this low were sustainable. At the start of October, the 10-year yield began rising from 1.60% to end the month above 1.80% as investors came to realize that the Fed might actually raise rates again in late 2016. Trump’s election victory then sent rates sharply higher as the 10-year yield jumped from 1.83% on November 7 to 2.45% by December 1. The bond market had started to discount some combination of fiscal stimulus, tax cuts, reduced regulation and faster economic growth, all of which implied additional rate hikes by the Fed. Against this backdrop, the dollar climbed sharply, equities and other risk assets rallied sharply, and bonds (especially those with longer duration) came under significant pressure.
14 OPPENHEIMER FUNDAMENTAL ALTERNATIVES FUND
As noted above, the Fed ended its latest QE program in October 2014, which helped to send the dollar higher against many major currencies. Partly as a result of this, combined with slowing economies in China and numerous emerging markets as well as issues specific to the various regions in question, we hold positions that are long the U.S. dollar and short other currencies including the Chinese renminbi, Thai baht, Australian dollar, euro and Japanese yen. In our view, the markets face a new paradigm of slower economic growth in China, and investors need to adjust to it. We also believe this relative divergence in monetary policy could ultimately feed through to interest rates. Currently, the moves that historically could have occurred in the rates markets are being pushed to the currency markets due to the central banks’ aggressive monetary policies holding rates low, although this dynamic may well be starting to change.
Moreover, while some market commentators are calling for further depreciation (or perhaps another devaluation) of the yuan, we believe such a move would negatively impact Asian trading partners and commodity producers. Private credit growth and bank loans in China have continued to grow at a much higher rate than GDP. This level of credit growth is unsustainable, and at some point it will need to slow, which will act as a new drag on GDP in China. In our view, the longer term trend in China is still toward slower growth. The data we analyze indicate that there has been no meaningful shift in that economy, and so far the efforts to stimulate domestic consumption
have not been able to overcome the negative impact of the industrial slowdown.
Although the U.S. economy remains stuck in first gear with average annual real GDP growth of 1.4% over the last seven years, that growth rate has been relatively attractive compared to certain other developed markets. We are mindful that economies around the world likely will not decouple so long as the engines of global growth are slowing. The yield on the 10-year Treasury at 2.45% (as of 12/1/16) is an order of magnitude higher than those in other parts of the developed world, with yields on 10-year German Bunds and 10-year Japanese Government Bonds at 0.37% and 0.03%, respectively, on that date. In addition, the election of Donald Trump could usher in a period of higher sustained economic growth on the back of tax cuts, fiscal stimulus, deficit spending and a meaningful infrastructure program.
Japan is becoming more desperate as consumption falls and evidence mounts that Abenomics is not working as planned. That policy was designed to revive the Japanese economy with “three arrows.” The third arrow in the quiver—meaningful structural reform—is proving to be a significant challenge. The Japanese economy narrowly avoided its sixth recession in nine years during early 2016, and its real GDP growth year-on-year was only 0.9% in the third quarter. In addition, the economy has not bounced back as expected from an increase in the consumption tax, and inflation has remained stubbornly below the BoJ’s target of 2%.
15 OPPENHEIMER FUNDAMENTAL ALTERNATIVES FUND
Moreover, excessive leverage in the banking system is weighing on growth. In our view, early evidence that the market is becoming disillusioned with Abenomics has centered on a weakening yen. The BoJ’s implementation of negative interest rates in the first quarter of 2016 had the opposite effect than what the central bank intended, with the yen strengthening dramatically and the equity market falling. Additional evidence could involve investors’ loss of faith in the supposed omnipotence of the BoJ and the efficacy of its continuing QE and negative interest rate efforts. This is beginning to cause investors to be less responsive to central bank talk and require more actions. Significantly, the Fed has hiked rates less than expected in 2016. As a result, monetary policy in the U.S. has been tightened less than expected, yet it is still meaningfully tighter than policies in either Japan or the Eurozone.
At the same time, growth in parts of Europe is stagnating with numerous countries facing an increasing risk of deflation. Precisely because growth is so slow in the Eurozone, the ECB has now implemented its own form of QE seven years after the U.S. first went down that path. However, the results so far have been underwhelming, which has led the ECB to extend the end date of the program, increase the amount of monthly debt purchases by 33%, expand the scope of the bonds it buys and further lower interest rates. By accelerating QE and expanding its balance sheet aggressively, the ECB seeks to inflate asset prices, just as it did in early 2015. Unfortunately, the
real impediment to Eurozone growth is the lack of meaningful structural reform over the past seven years. Furthermore, the investor playbook of overweighting equities in countries where there is aggressive QE is not working this year, even after the snapback in risk assets over the last several months. The equity markets in Japan and Europe are lagging the U.S. equity market this year, even though the BoJ and ECB are executing QE and have adopted negative interest rates, while the Fed has ended QE and is hiking rates, not implementing negative rates. In short, negative interest rates appear to have backfired as a form of monetary stimulus, with the banks selling off and equities underperforming, and with the yen actually strengthening versus the U.S. dollar (although the euro has weakened marginally). This is not what the ECB or the BoJ predicted or intended. Moreover, these central banks will eventually need to taper their QE programs, just as the Fed did. In fact, the ECB may have taken the first step in that direction in December 2016 when it announced a nine-month extension of the QE program (through December 2017), but at a reduced rate of 60 billion euros in monthly bond purchases, down from the current level of 80 billion euros per month. It remains to be seen whether the ECB and the BoJ can remove such extraordinarily accommodative monetary policies without causing a sharp selloff in risk assets.
We believe geopolitical risk remains elevated as evidenced by Trump’s victory, Brexit and the election results favoring populist/separatist
16 OPPENHEIMER FUNDAMENTAL ALTERNATIVES FUND
parties in the U.K., Greece, Spain, Portugal, Germany and the Philippines. Simply put, political instability in the Eurozone appeared to be contained for much of 2016 but it was by no means resolved. The “No” vote on the constitutional referendum in Italy, and French President Francois Hollande’s recent announcement that he will not seek a second term, put the issue front and center again. We believe continued immigration from the Middle East will only exacerbate tensions. More broadly, while some economic acceleration in visible in China as a result of excessive credit growth, we believe this acceleration may fade in time as that credit growth slows. We do not believe any improvement in China will be enough to offset slowing momentum in the Eurozone, Japan and many of the emerging markets.
In our view, the U.S. economy still has attractive growth potential in certain areas, and we are waiting to see what new pro-growth policies the Trump administration can actually implement. We recognize that there are pockets of innovation in different industries including pharmaceuticals, consumer discretionary and technology. Nonetheless, we are mindful that U.S. equity valuations are pushing up against the edge of bubble territory after several years when S&P 500 Index performance ran well ahead of earnings growth, leading to significant multiple expansion. In fact, the only time in the last four decades when the S&P 500 Index has traded at a higher price-earnings multiple
on next 12 months’ consensus earnings was during the Tech Bubble in 1997-2000.
Furthermore, volatility has been artificially restrained over the last several years by highly accommodative monetary policy, but this started to change in August of 2015 when China devalued the yuan, causing the VIX Index to spike sharply, and that index has spiked almost a dozen times since then, including in the immediate aftermath of the Brexit vote and around the U.S. election. In the past few years, whenever equities sold off, buyers typically stepped in quickly because valuations were still relatively attractive. Since valuations are less attractive today, we could reach a point where it takes longer for buyers to appear after selloffs. Moreover, banking regulations are significantly stricter, the fixed income markets are a lot less liquid, and banks are taking on much less risk. Under these circumstances, we believe that any softness in the markets could lead to more volatility on the fixed income side than we have seen in recent years. That was certainly evident in the fourth quarter of 2015, in early 2016 and in the wake of Trump’s election victory. We expect it to continue.
Accordingly, we continue to pick our spots, selecting securities that we believe offer attractive risk-adjusted returns. We remain focused, as always, on controlling volatility and mitigating downside risk. We expect to be in a muted return world for a while. We believe that the ability to generate attractive
17 OPPENHEIMER FUNDAMENTAL ALTERNATIVES FUND
returns efficiently and without taking on undue risk, controlling volatility and limiting drawdowns will be of greater value to investors in a muted return world, and that is where our investment team’s efforts are focused.
| | |
 | | 
Michelle Borré, CFA Portfolio Manager |
18 OPPENHEIMER FUNDAMENTAL ALTERNATIVES FUND
Portfolio Positioning
LONG/SHORT CREDIT ALLOCATIONS
| | | | | | | | | | | | |
| | | Long | | | Short | | | Net | |
Asset Backed Securities | | | 10.9 | % | | | 0.0 | % | | | 10.9 | % |
Bank Loans | | | 9.6 | | | | 0.0 | | | | 9.6 | |
Corporate Bonds | | | 8.8 | | | | 0.0 | | | | 8.8 | |
Credit Default Swaps | | | 4.1 | | | | -7.1 | | | | -3.0 | |
Duration Hedges (Bond Futures) | | | 0.0 | | | | -1.1 | | | | -1.1 | |
Preferred Securities | | | 0.9 | | | | -3.6 | | | | -2.7 | |
LONG/SHORT EQUITY ALLOCATIONS | | | | | | | | | | | | |
| | | Long | | | Short | | | Net | |
Common Stocks | | | 49.4 | % | | | -25.4 | % | | | 24.0 | % |
Equity Like (Private Securities, Swaps) | | | 1.5 | | | | -5.0 | | | | -3.5 | |
LONG/SHORT MACRO ALLOCATIONS | | | | | | | | | | | | |
| | | Long | | | Short | | | Net | |
Commodities | | | 2.8 | % | | | 0.0 | % | | | 2.8 | % |
Currencies | | | 0.3 | | | | -10.8 | | | | -10.5 | |
Rates | | | 2.0 | | | | -1.2 | | | | 0.8 | |
Sovereign Debt | | | 0.0 | | | | -14.3 | | | | -14.3 | |
FX HEDGES FOR EQUITIES | | | | | | | | | | | | |
| | | Long | | | Short | | | Net | |
Currency Forwards | | | 6.8 | % | | | -6.6 | % | | | 0.2 | % |
CASH | | | | | | | | | | | | |
| | | Long | | | Short | | | Net | |
Collateral Cash | | | 29.6 | % | | | 0.0 | % | | | 29.6 | % |
Cash Net of Collateral Cash | | | 15.8 | | | | 0.0 | | | | 15.8 | |
Portfolio holdings are subject to change, and are dollar weighted based on total net assets. Percentages are as of October 31, 2016. Negative weightings may result from the use of leverage. Leverage involves the use of various financial instruments or borrowed capital in an attempt to increase investment return. Leverage risks include potential for higher volatility, greater decline of the Fund’s net asset value and fluctuations of dividends and distributions paid by the Fund.
19 OPPENHEIMER FUNDAMENTAL ALTERNATIVES FUND
TOTAL PORTFOLIO ALLOCATIONS
| | | | | | | | | | | | |
| | | Long | | | Short | | | Net | |
Long/Short Credit | | | 34.3 | % | | | -11.8 | % | | | 22.5 | % |
Long/Short Equity | | | 50.9 | | | | -30.4 | | | | 20.5 | |
Long/Short Macro | | | 5.1 | | | | -26.3 | | | | -21.2 | |
Portfolio holdings are subject to change, and are dollar weighted based on total net assets. Percentages are as of October 31, 2016. Negative weightings may result from the use of leverage. Leverage involves the use of various financial instruments or borrowed capital in an attempt to increase investment return. Leverage risks include potential for higher volatility, greater decline of the Fund’s net asset value and fluctuations of dividends and distributions paid by the Fund.
20 OPPENHEIMER FUNDAMENTAL ALTERNATIVES FUND
Share Class Performance
AVERAGE ANNUAL TOTAL RETURNS WITHOUT SALES CHARGE AS OF 10/31/16
| | | | | | | | | | | | | | | | |
| | | Inception Date | | | 1-Year | | | 5-Year | | | 10-Year | |
Class A (QVOPX) | | | 1/3/89 | | | | -0.18 | % | | | 3.29 | % | | | 2.97% | |
Class B (QOPBX) | | | 9/1/93 | | | | -0.92 | | | | 2.46 | | | | 2.45 | |
Class C (QOPCX) | | | 9/1/93 | | | | -0.91 | | | | 2.51 | | | | 2.19 | |
Class I (QOPIX) | | | 2/28/13 | | | | 0.29 | | | | 4.40 | * | | | N/A | |
Class R (QOPNX) | | | 3/1/01 | | | | -0.44 | | | | 2.99 | | | | 2.66 | |
Class Y (QOPYX) | | | 12/16/96 | | | | 0.08 | | | | 3.54 | | | | 3.23 | |
AVERAGE ANNUAL TOTAL RETURNS WITH SALES CHARGE AS OF 10/31/16 | | | | | |
| | | Inception Date | | | 1-Year | | | 5-Year | | | 10-Year | |
Class A (QVOPX) | | | 1/3/89 | | | | -5.92 | % | | | 2.07 | % | | | 2.36% | |
Class B (QOPBX) | | | 9/1/93 | | | | -5.85 | | | | 2.09 | | | | 2.45 | |
Class C (QOPCX) | | | 9/1/93 | | | | -1.90 | | | | 2.51 | | | | 2.19 | |
Class I (QOPIX) | | | 2/28/13 | | | | 0.29 | | | | 4.40 | * | | | N/A | |
Class R (QOPNX) | | | 3/1/01 | | | | -0.44 | | | | 2.99 | | | | 2.66 | |
Class Y (QOPYX) | | | 12/16/96 | | | | 0.08 | | | | 3.54 | | | | 3.23 | |
* Shows performance since inception.
Performance data quoted represents past performance, which does not guarantee future results. The investment return and principal value of an investment in the Fund will fluctuate so that an investor’s shares, when redeemed, may be worth more or less than their original cost. Current performance may be lower or higher than the performance quoted. Returns do not consider capital gains or income taxes on an individual’s investment. For performance data current to the most recent month-end, visit oppenheimerfunds.com or call 1.800. CALL OPP (225.5677). Fund returns include changes in share price, reinvested distributions, and the applicable sales charge: for Class A shares, the current maximum initial sales charge of 5.75%; for Class B shares, the contingent deferred sales charge of 5% (1-year) and 2% (5-year); and for Class C shares, the contingent deferred sales charge (“CDSC”) of 1% for the 1-year period. There is no sales charge for Class I, Class R and Class Y shares. Because Class B shares convert to Class A shares 72 months after purchase, the 10-year return for Class B shares uses Class A performance for the period after conversion. See Fund prospectuses and summary prospectuses for more information on share classes and sales charges.
The Fund’s performance is compared to the performance of the HFRX Global Hedge Fund Index. The HFRX Global Hedge Fund Index is designed to be representative of the overall composition of the hedge fund universe. It is comprised of all eligible hedge fund strategies; including but not limited to convertible arbitrage, distressed securities, equity hedge, equity market neutral, event driven, macro, merger arbitrage, and relative value arbitrage. The strategies are asset weighted based on the distribution of assets in the hedge fund industry. The index is unmanaged and cannot be purchased directly by investors. While index comparisons may be useful to provide a benchmark for the Fund’s performance, it must
21 OPPENHEIMER FUNDAMENTAL ALTERNATIVES FUND
be noted that the Fund’s investments are not limited to the investments comprising the indices. Index performance includes reinvestment of income, but does not reflect transaction costs, fees, expenses or taxes. Index performance is shown for illustrative purposes only as a benchmark for the Fund’s performance, and does not predict or depict performance of the Fund. The Fund’s performance reflects the effects of the Fund’s business and operating expenses.
The Morningstar Multialternative Funds Category Average is the average return of the mutual funds within the investment category as defined by Morningstar. Returns include the reinvestment of distributions but do not consider sales charges. The Morningstar Multialternative Category Average performance is shown for illustrative purposes only and does not predict or depict the performance of the Fund.
Morningstar ranking is for Class A shares and ranking may include more than one share class of funds in the category, including other share classes of this Fund. Ranking is based on total return as of 10/31/16, without considering sales charges. Different share classes may have different expenses and performance characteristics. Fund rankings are subject to change monthly. The Fund’s total-return percentile rank is relative to all funds that are in the Multialternative Funds Category. The highest (or most favorable) percentile rank is 1 and the lowest (or least favorable) percentile rank is 100. The top-performing fund in a category will always receive a rank of 1.
The Fund’s investment strategy and focus can change over time. The mention of specific fund holdings does not constitute a recommendation by OppenheimerFunds, Inc. or its affiliates.
Before investing in any of the Oppenheimer funds, investors should carefully consider a fund’s investment objectives, risks, charges and expenses. Fund prospectuses and summary prospectuses contain this and other information about the funds, and may be obtained by asking your financial advisor, visiting oppenheimerfunds.com, or calling 1.800.CALL OPP (225.5677). Read prospectuses and summary prospectuses carefully before investing.
Shares of Oppenheimer funds are not deposits or obligations of any bank, are not guaranteed by any bank, are not insured by the FDIC or any other agency, and involve investment risks, including the possible loss of the principal amount invested.
22 OPPENHEIMER FUNDAMENTAL ALTERNATIVES FUND
Fund Expenses
Fund Expenses. As a shareholder of the Fund, you incur two types of costs: (1) transaction costs, which may include sales charges (loads) on purchase payments and/or contingent deferred sales charges on redemptions; and (2) ongoing costs, including management fees; distribution and service fees; and other Fund expenses. These examples are intended to help you understand your ongoing costs (in dollars) of investing in the Fund and to compare these costs with the ongoing costs of investing in other mutual funds.
The examples are based on an investment of $1,000.00 invested at the beginning of the period and held for the entire 6-month period ended October 31, 2016.
Actual Expenses. The first section of the table provides information about actual account values and actual expenses. You may use the information in this section for the class of shares you hold, together with the amount you invested, to estimate the expense that you paid over the period. Simply divide your account value by $1,000.00 (for example, an $8,600.00 account value divided by $1,000.00 = 8.60), then multiply the result by the number in the first section under the heading entitled “Expenses Paid During 6 Months Ended October 31, 2016” to estimate the expenses you paid on your account during this period.
Hypothetical Example for Comparison Purposes. The second section of the table provides information about hypothetical account values and hypothetical expenses based on the Fund’s actual expense ratio for each class of shares, and an assumed rate of return of 5% per year for each class before expenses, which is not the Fund’s actual return. The hypothetical account values and expenses may not be used to estimate the actual ending account balance or expenses you paid for the period. You may use this information to compare the ongoing costs of investing in the Fund and other funds. To do so, compare this 5% hypothetical example for the class of shares you hold with the 5% hypothetical examples that appear in the shareholder reports of the other funds.
Please note that the expenses shown in the table are meant to highlight your ongoing costs only and do not reflect any transactional costs, such as front-end or contingent deferred sales charges (loads). Therefore, the “hypothetical” section of the table is useful in comparing ongoing costs only, and will not help you determine the relative total costs of owning different funds. In addition, if these transactional costs were included, your costs would have been higher.
23 OPPENHEIMER FUNDAMENTAL ALTERNATIVES FUND
| | | | | | | | | | | | |
| Actual | | Beginning
Account Value
May 1, 2016 | | | Ending Account Value
October 31, 2016 | | | Expenses Paid During 6 Months Ended
October 31, 2016 | |
| |
Class A | | $ | 1,000.00 | | | $ | 1,021.70 | | | $ | 10.47 | |
| |
Class B | | | 1,000.00 | | | | 1,017.90 | | | | 14.20 | |
| |
Class C | | | 1,000.00 | | | | 1,017.90 | | | | 14.35 | |
| |
Class I | | | 1,000.00 | | | | 1,024.10 | | | | 8.48 | |
| |
Class R | | | 1,000.00 | | | | 1,020.30 | | | | 11.85 | |
| |
Class Y | | | 1,000.00 | | | | 1,023.10 | | | | 9.45 | |
| | | |
| Hypothetical | | | | | | | | | |
| (5% return before expenses) | | | | | | | | | |
| |
Class A | | | 1,000.00 | | | | 1,014.83 | | | | 10.44 | |
| |
Class B | | | 1,000.00 | | | | 1,011.16 | | | | 14.15 | |
| |
Class C | | | 1,000.00 | | | | 1,011.01 | | | | 14.30 | |
| |
Class I | | | 1,000.00 | | | | 1,016.79 | | | | 8.45 | |
| |
Class R | | | 1,000.00 | | | | 1,013.47 | | | | 11.81 | |
| |
Class Y | | | 1,000.00 | | | | 1,015.84 | | | | 9.42 | |
Expenses are equal to the Fund’s annualized expense ratio for that class, multiplied by the average account value over the period, multiplied by 184/366 (to reflect the one-half year period). Those annualized expense ratios, excluding indirect expenses from affiliated funds, based on the 6-month period ended October 31, 2016 are as follows:
| | | | |
| Class | | Expense Ratios | |
| |
Class A | | | 2.05% | |
| |
Class B | | | 2.78 | |
| |
Class C | | | 2.81 | |
| |
Class I | | | 1.66 | |
| |
Class R | | | 2.32 | |
| |
Class Y | | | 1.85 | |
The expense ratios reflect voluntary and/or contractual waivers and/or reimbursements of expenses by the Fund’s Manager. Some of these undertakings may be modified or terminated at any time, as indicated in the Fund’s prospectus. The “Consolidated Financial Highlights” tables in the Fund’s financial statements, included in this report, also show the gross expense ratios, without such waivers or reimbursements and reduction to custodian expenses, if applicable.
24 OPPENHEIMER FUNDAMENTAL ALTERNATIVES FUND
CONSOLIDATED STATEMENT OF INVESTMENTS October 31, 2016
| | | | | | |
| | | Shares | | | Value |
|
Common Stocks—51.0% | | | |
|
Consumer Discretionary—1.7% | | | | | | |
|
Auto Components—0.1% | | | | | | |
|
Adient plc1 | | | 20,859 | | | $ 949,293 |
|
|
Hotels, Restaurants & Leisure—0.6% | | | | | | |
|
Brinker International, Inc. | | | 163,816 | | | 8,066,300 |
|
|
Household Durables—0.0% | | | | | | |
|
Everyware Global, Inc.1 | | | 8,735 | | | 76,431 |
|
|
Media—1.0% | | | | | | |
|
DISH Network Corp., Cl. A1,2 | | | 178,065 | | | 10,427,487 |
|
Live Nation Entertainment, Inc.1 | | | 132,430 | | | 3,664,338 |
| | | | | | |
| | | | | | 14,091,825 |
|
|
Consumer Staples—3.2% | | | | | | |
|
Beverages—0.8% | | | | | | |
|
Coca-Cola Co. (The) | | | 249,670 | | | 10,586,008 |
|
|
Tobacco—2.4% | | | | | | |
|
Altria Group, Inc.2 | | | 291,781 | | | 19,292,560 |
|
Philip Morris International, Inc. | | | 147,910 | | | 14,264,440 |
| | | | | | |
| | | | | | 33,557,000 |
|
|
Energy—5.0% | | | | | | |
|
Energy Equipment & Services—0.7% | | | | | | |
|
Halliburton Co. | | | 103,601 | | | 4,765,646 |
|
Schlumberger Ltd. | | | 59,614 | | | 4,663,603 |
|
Vantage Drilling International1 | | | 492 | | | 41,820 |
| | | | | | |
| | | | | | 9,471,069 |
|
|
Oil, Gas & Consumable Fuels—4.3% | | | | | | |
|
Arch Coal, Inc.1 | | | 436 | | | 31,994 |
|
Canadian Natural Resources Ltd. | | | 133,867 | | | 4,248,653 |
|
Chevron Corp. | | | 114,077 | | | 11,949,566 |
|
ConocoPhillips | | | 156,278 | | | 6,790,279 |
|
EOG Resources, Inc. | | | 77,513 | | | 7,008,726 |
|
Newfield Exploration Co.1 | | | 129,963 | | | 5,275,198 |
|
Noble Energy, Inc.2 | | | 222,938 | | | 7,684,673 |
|
Occidental Petroleum Corp. | | | 162,072 | | | 11,816,670 |
|
Sabine Oil1 | | | 114 | | | 5,700 |
|
Templar Energy, Cl. A1 | | | 9,620 | | | 62,528 |
|
Valero Energy Corp. | | | 64,456 | | | 3,818,373 |
| | | | | | |
| | | | | | 58,692,360 |
|
|
Financials—8.0% | | | | | | |
|
Capital Markets—0.5% | | | | | | |
|
Aretec Group, Inc.1 | | | 3,448 | | | 27,584 |
|
Goldman Sachs Group, Inc. (The) | | | 36,180 | | | 6,448,723 |
| | | | | | |
| | | | | | 6,476,307 |
|
|
Commercial Banks—2.2% | | | | | | |
|
M&T Bank Corp.2 | | | 220,310 | | | 27,038,646 |
25 OPPENHEIMER FUNDAMENTAL ALTERNATIVES FUND
CONSOLIDATED STATEMENT OF INVESTMENTS Continued
| | | | | | |
| | | Shares | | | Value |
|
Commercial Banks (Continued) | | | | | | |
|
Wells Fargo & Co. | | | 68,160 | | | $ 3,136,042 |
| | | | | | |
| | | | | | 30,174,688 |
|
|
Insurance—3.1% | | | | | | |
|
Allstate Corp. (The) | | | 263,510 | | | 17,892,329 |
|
Chubb Ltd. | | | 199,670 | | | 25,358,090 |
| | | | | | |
| | | | | | 43,250,419 |
|
|
Real Estate Investment Trusts (REITs)—2.2% | | | | | | |
|
American Assets Trust, Inc. | | | 125,698 | | | 4,991,468 |
|
Blackstone Mortgage Trust, Inc., Cl. A2 | | | 401,180 | | | 12,115,636 |
|
Macerich Co. (The) | | | 97,290 | | | 6,886,186 |
|
Starwood Property Trust, Inc.2 | | | 266,400 | | | 5,924,736 |
| | | | | | |
| | | | | | 29,918,026 |
|
|
Health Care—8.2% | | | | | | |
|
Biotechnology—0.7% | | | | | | |
|
Shire plc, ADR | | | 55,790 | | | 9,408,425 |
|
|
Health Care Equipment & Supplies—0.9% | | | | | | |
|
Medtronic plc | | | 151,118 | | | 12,394,699 |
|
New Millennium Holdco, Inc.1 | | | 7,733 | | | 77 |
| | | | | | |
| | | | | | 12,394,776 |
|
|
Health Care Providers & Services—3.3% | | | | | | |
|
Cigna Corp. | | | 56,750 | | | 6,743,602 |
|
HCA Holdings, Inc.1 | | | 115,730 | | | 8,856,817 |
|
Millennium Corporate Claim Litigation Trust1 | | | 441 | | | 4 |
|
Millennium Lender Claim Litigation Trust1 | | | 882 | | | 9 |
|
UnitedHealth Group, Inc. | | | 155,620 | | | 21,993,775 |
|
Universal Health Services, Inc., Cl. B | | | 65,400 | | | 7,894,434 |
| | | | | | |
| | | | | | 45,488,641 |
|
|
Pharmaceuticals—3.3% | | | | | | |
|
Allergan plc1 | | | 63,680 | | | 13,305,299 |
|
Merck & Co., Inc.2 | | | 173,560 | | | 10,191,443 |
|
Novartis AG, ADR | | | 146,890 | | | 10,432,128 |
|
Roche Holding AG | | | 47,033 | | | 10,792,740 |
| | | | | | |
| | | | | | 44,721,610 |
|
|
Industrials—9.8% | | | | | | |
|
Aerospace & Defense—3.6% | | | | | | |
|
L-3 Communications Holdings, Inc. | | | 47,410 | | | 6,492,326 |
|
Lockheed Martin Corp.2 | | | 91,490 | | | 22,541,306 |
|
Northrop Grumman Corp. | | | 51,950 | | | 11,896,550 |
|
Raytheon Co. | | | 59,310 | | | 8,102,339 |
| | | | | | |
| | | | | | 49,032,521 |
|
|
Airlines—0.4% | | | | | | |
|
United Continental Holdings, Inc.1 | | | 99,096 | | | 5,572,168 |
|
|
Commercial Services & Supplies—2.2% | | | | | | |
|
Johnson Controls International plc | | | 208,591 | | | 8,410,389 |
26 OPPENHEIMER FUNDAMENTAL ALTERNATIVES FUND
| | | | | | |
| | | Shares | | | Value |
|
Commercial Services & Supplies (Continued) | | | | | | |
|
Republic Services, Inc., Cl. A2 | | | 422,050 | | | $ 22,212,492 |
| | | | | | |
| | | | | | 30,622,881 |
|
|
Industrial Conglomerates—3.1% | | | | | | |
|
General Electric Co. | | | 431,160 | | | 12,546,756 |
|
Honeywell International, Inc.2 | | | 275,600 | | | 30,227,808 |
| | | | | | |
| | | | | | 42,774,564 |
|
|
Road & Rail—0.5% | | | | | | |
|
Union Pacific Corp. | | | 75,740 | | | 6,678,753 |
|
|
Information Technology—6.8% | | | | | | |
|
Communications Equipment—0.4% | | | | | | |
|
Juniper Networks, Inc.2 | | | 195,520 | | | 5,149,997 |
|
|
Internet Software & Services—2.4% | | | | | | |
|
Alphabet, Inc., Cl. A1,2 | | | 41,150 | | | 33,327,385 |
|
|
Semiconductors & Semiconductor Equipment—2.4% | | | | | | |
|
QUALCOMM, Inc.2 | | | 218,040 | | | 14,983,709 |
|
Xilinx, Inc.2 | | | 360,170 | | | 18,321,848 |
| | | | | | |
| | | | | | 33,305,557 |
|
|
Technology Hardware, Storage & Peripherals—1.6% | | | | | | |
|
Apple, Inc.2 | | | 191,986 | | | 21,798,090 |
|
|
Materials—3.4% | | | | | | |
|
Chemicals—1.5% | | | | | | |
|
Celanese Corp., Cl. A | | | 166,840 | | | 12,165,973 |
|
Methanex Corp. | | | 245,295 | | | 8,916,473 |
| | | | | | |
| | | | | | 21,082,446 |
|
|
Containers & Packaging—1.9% | | | | | | |
|
Packaging Corp. of America | | | 130,620 | | | 10,776,150 |
|
Sonoco Products Co. | | | 301,270 | | | 15,150,868 |
| | | | | | |
| | | | | | 25,927,018 |
|
|
Telecommunication Services—2.4% | | | | | | |
|
Diversified Telecommunication Services—2.4% | | | | | | |
|
AT&T, Inc.2 | | | 273,480 | | | 10,061,329 |
|
BCE, Inc. | | | 267,420 | | | 12,151,565 |
|
Verizon Communications, Inc. | | | 210,150 | | | 10,108,215 |
| | | | | | |
| | | | | | 32,321,109 |
|
|
Utilities—2.5% | | | | | | |
|
Electric Utilities—2.1% | | | | | | |
|
Edison International | | | 251,900 | | | 18,509,612 |
|
PPL Corp.2 | | | 284,954 | | | 9,785,320 |
| | | | | | |
| | | | | | 28,294,932 |
|
|
Multi-Utilities—0.4% | | | | | | |
|
CMS Energy Corp. | | | 149,850 | | | 6,316,178 |
| | | | | | |
Total Common Stocks (Cost $621,774,487) | | | | | | 699,526,777 |
27 OPPENHEIMER FUNDAMENTAL ALTERNATIVES FUND
CONSOLIDATED STATEMENT OF INVESTMENTS Continued
| | | | | | |
| | | Shares | | | Value |
|
Preferred Stocks—0.9% | | | |
|
M&T Bank Corp., 6.375% Cum., Series A, Non-Vtg. | | | 5,167 | | | $ 5,216,087 |
|
M&T Bank Corp., 6.375% Cum., Series C, Non-Vtg. | | | 7,500 | | | 7,725,150 |
| | | | | | |
Total Preferred Stocks (Cost $12,684,599) | | | | | | 12,941,237 |
| | |
| | | Units | | | |
|
Rights, Warrants and Certificates—0.0% | | | |
|
Sabine Oil Tranche 1 Wts., Strike Price $4.49, Exp. 8/11/261 | | | 362 | | | 3,439 |
|
Sabine Oil Tranche 2 Wts., Strike Price $2.72, Exp. 8/11/261 | | | 64 | | | 544 |
| | | | | | |
Total Rights, Warrants and Certificates (Cost $48,406) | | | | | | 3,983 |
| | |
| | | Principal Amount | | | |
|
Asset-Backed Securities—6.7% | | | |
|
Airspeed Ltd.: | | | | | | |
Series 2007-1A, Cl. G1, 0.805%, 6/15/323,4 | | | $ 21,699,750 | | | 17,489,998 |
Series 2007-1A, Cl. G2, 0.815%, 6/15/323,4 | | | 6,238,678 | | | 5,122,660 |
|
Blade Engine Securitization Ltd., Series 2006-1AW, Cl. A1, 0.835%, 9/15/414,5 | | | 26,794,540 | | | 14,712,560 |
|
GSAMP Trust: | | | | | | |
Series 2005-HE4, Cl. M3, 1.054%, 7/25/454 | | | 3,300,000 | | | 2,823,953 |
Series 2005-HE5, Cl. M3, 0.994%, 11/25/354 | | | 8,121,777 | | | 6,572,662 |
|
New Century Home Equity Loan Trust, Series 2005-2, Cl. M3, 1.269%, 6/25/354 | | | 5,500,000 | | | 4,730,767 |
|
Park Place Securities, Inc., Series 2005-WCW3, Cl. M1, 1.014%, 8/25/354 | | | 5,000,000 | | | 4,758,845 |
|
RASC Series Trust: | | | | | | |
Series 2005-KS8, Cl. M5, 1.174%, 8/25/354 | | | 2,993,634 | | | 2,627,066 |
Series 2006-KS2, Cl. M2, 0.924%, 3/25/364 | | | 14,625,000 | | | 11,829,079 |
|
Raspro Trust, Series 2005-1A, Cl. G, 1.257%, 3/23/243,4 | | | 17,154,326 | | | 16,524,059 |
|
Saxon Asset Securities Trust, Series 2007-3, Cl. 2A4, 1.024%, 9/25/474 | | | 7,595,000 | | | 4,641,887 |
| | | | | | |
Total Asset-Backed Securities (Cost $95,244,039) | | | | | | 91,833,536 |
|
|
Mortgage-Backed Obligations—4.3% | | | |
|
Ameriquest Mortgage Securities, Inc., Series 2004-R2, Cl. M1, 1.179%, 4/25/344 | | | 3,558,338 | | | 3,110,539 |
|
Asset-Backed Funding Certificates Trust, Series 2005-HE2, Cl. M3, 1.314%, 6/25/354 | | | 4,000,000 | | | 3,821,445 |
|
Bear Stearns Asset Backed Securities I Trust, Series 2004-HE9, Cl. M2, 2.334%, 11/25/344 | | | 3,828,253 | | | 3,546,864 |
|
Citigroup Mortgage Loan Trust, Inc., Series 2004-OPT1, Cl. M3, 1.479%, 10/25/344 | | | 1,250,000 | | | 1,141,507 |
|
First NLC Trust, Series 2005-4, Cl. A4, 0.924%, 2/25/364 | | | 11,003,000 | | | 9,861,082 |
|
Home Equity Asset Trust, Series 2005-5, Cl. M2, 1.299%, 11/25/354 | | | 1,888,088 | | | 1,839,484 |
|
Home Equity Mortgage Loan Asset-Backed Trust, Series 2005-B, Cl. M3, 1.024%, 8/25/354 | | | 1,298,061 | | | 1,260,017 |
|
MASTR Adjustable Rate Mortgages Trust, Series 2004-13, Cl. 2A2, 3.032%, 4/21/344 | | | 407,043 | | | 414,558 |
|
RAMP Trust: | | | | | | |
Series 2005-RS2, Cl. M4, 1.254%, 2/25/354 | | | 4,469,000 | | | 4,111,614 |
Series 2005-RS6, Cl. M2, 1.299%, 6/25/354 | | | 816,301 | | | 807,224 |
Series 2006-EFC1, Cl. M2, 0.934%, 2/25/364 | | | 5,490,000 | | | 4,698,931 |
Series 2006-NC3, Cl. A3, 0.804%, 3/25/364 | | | 16,698,000 | | | 15,068,071 |
28 OPPENHEIMER FUNDAMENTAL ALTERNATIVES FUND
| | | | | | |
| | | Principal Amount | | | Value |
|
Mortgage-Backed Obligations (Continued) | | | |
|
| Structured Asset Securities Corp. Mortgage Loan Trust, Series 2007-GEL2, Cl. A2, 0.854%, 5/25/373,4 | | $ | 9,075,331 | | | $ 8,797,243 |
| | | | | | |
| Total Mortgage-Backed Obligations (Cost $45,809,185) | | | | | | 58,478,579 |
|
|
Non-Convertible Corporate Bonds and Notes—9.5% | | | |
|
| Altice US Finance I Corp., 5.50% Sr. Sec. Nts., 5/15/263 | | | 440,000 | | | 449,900 |
|
| Bank of America Corp.: | | | | | | |
| 2.00% Sr. Unsec. Nts., 1/11/18 | | | 2,000,000 | | | 2,010,610 |
| 8.00% Jr. Sub. Perpetual Bonds, Series K4,6 | | | 14,609,000 | | | 14,901,180 |
|
| Bank of Nova Scotia (The), 1.65% Sr. Unsec. Nts., 6/14/19 | | | 2,000,000 | | | 2,001,766 |
|
| Cheniere Corpus Christi Holdings LLC, 7% Sr. Sec. Nts., 6/30/243 | | | 210,000 | | | 223,650 |
|
| Citigroup, Inc.: | | | | | | |
| 1.55% Sr. Unsec. Nts., 8/14/17 | | | 2,000,000 | | | 2,004,138 |
| 5.875% Jr. Sub. Perpetual Bonds4,6 | | | 14,823,000 | | | 15,071,285 |
|
| Commonwealth Bank of Australia, 1.375% Sr. Unsec. Nts., 9/6/183 | | | 2,000,000 | | | 1,994,058 |
|
| Diamond 1 Finance Corp./Diamond 2 Finance Corp., 4.42% Sr. Sec. Nts., 6/15/213 | | | 210,000 | | | 219,795 |
|
| Energy Future Intermediate Holding Co. LLC/EFIH Finance, Inc., 12.25% Sec. Nts., 3/1/223,7 | | | 7,093,230 | | | 9,150,267 |
|
| Goldman Sachs Capital II, 4% Jr. Sub. Perpetual Bonds4,6 | | | 54,000 | | | 44,550 |
|
| JPMorgan Chase & Co., 7.90% Jr. Sub. Perpetual Bonds, Series 14,6 | | | 15,324,000 | | | 15,814,368 |
|
| Lukoil International Finance BV, 6.125% Sr. Unsec. Nts., 11/9/203 | | | 25,415,000 | | | 27,656,603 |
|
| Reynolds Group Issuer, Inc./Reynolds Group Issuer LLC/Reynolds Group Issuer Luxembourg, 4.38% Sr. Sec. Nts., 7/15/213,4 | | | 135,000 | | | 138,037 |
|
| Royal Bank of Canada, 1.625% Sr. Unsec. Nts., 4/15/19 | | | 2,000,000 | | | 2,000,448 |
|
| Sabine Pass Liquefaction LLC, 5.875% Sr. Sec. Nts., 6/30/263 | | | 210,000 | | | 227,104 |
|
| Svenska Handelsbanken AB, 1.50% Sr. Unsec. Nts., 9/6/19 | | | 1,500,000 | | | 1,491,191 |
|
| Wachovia Capital Trust III, 5.57% Jr. Sub. Perpetual Bonds4,6 | | | 19,666,000 | | | 19,715,165 |
|
| Wells Fargo & Co., 7.98% Jr. Sub. Perpetual Bonds, Series K4,6 | | | 14,821,000 | | | 15,469,419 |
| | | | | | |
| Total Non-Convertible Corporate Bonds and Notes (Cost $124,730,316) | | | | | | 130,583,534 |
|
|
Corporate Loans—9.6% | | | |
|
| 21st Century Oncology, Inc., Sr. Sec. Credit Facilities 1st Lien Term Loan, Tranche B, 7.125%, 4/30/224 | | | 95,220 | | | 88,078 |
|
| 4L Technologies, Inc., Sr. Sec. Credit Facilities 1st Lien Term Loan, Tranche B, 5.50%-7.00%, 5/8/204 | | | 147,283 | | | 139,643 |
|
| 84 Lumber Co., Sr. Sec. Credit Facilities 1st Lien Term Loan, Tranche B, 6.75%, 10/7/234,8 | | | 110,000 | | | 109,175 |
|
| Abacus Innovations Corp., Sr. Sec. Credit Facilities 1st Lien Term Loan, Tranche B, 3.284%, 8/16/234 | | | 270,000 | | | 272,447 |
|
| Access CIG LLC, Sr. Sec. Credit Facilities 1st Lien Term Loan, Tranche B, 6.00%, 10/18/214 | | | 123,065 | | | 123,219 |
|
| Acrisure LLC, Sr. Sec. Credit Facilities 1st Lien Term Loan, Tranche B, 6.50%, 5/13/224 | | | 193,921 | | | 194,648 |
|
| Active Network, Inc. (The), Sr. Sec. Credit Facilities 1st Lien Term Loan, 5.50%, 11/13/204 | | | 274,105 | | | 272,963 |
|
| Affinion Group, Inc., Sr. Sec. Credit Facilities 1st Lien Term Loan, Tranche B, 6.75%, 4/30/184 | | | 475,176 | | | 463,098 |
29 OPPENHEIMER FUNDAMENTAL ALTERNATIVES FUND
CONSOLIDATED STATEMENT OF INVESTMENTS Continued
| | | | | | |
| | | Principal Amount | | | Value |
| Corporate Loans (Continued) | | | | | | |
| Air Canada, Sr. Sec. Credit Facilities 1st Lien Term Loan, Tranche B, 3.614%, 10/6/234 | | $ | 95,000 | | | $ 95,416 |
| Air Medical Group Holdings, Inc., Sr. Sec. Credit Facilities 1st Lien Term Loan, Tranche B, 4.25%, 4/28/224 | | | 93,567 | | | 93,111 |
| Akorn, Inc., Sr. Sec. Credit Facilities 1st Lien Term Loan, Tranche B, 5.25%, 4/16/214 | | | 282,206 | | | 285,734 |
| Albertsons LLC, Sr. Sec. Credit Facilities 1st Lien Term Loan: | | | | | | |
| Tranche B4, 4.50%, 8/25/214 | | | 358,189 | | | 361,144 |
| Tranche B6, 4.75%, 6/22/234 | | | 248,518 | | | 251,205 |
| Alinta Energy Finance Pty Ltd., Sr. Sec. Credit Facilities 1st Lien Term Loan, Tranche B, 6.375%, 8/13/194 | | | 626,680 | | | 628,247 |
| Alinta Energy Finance Pty Ltd., Sr. Sec. Credit Facilities 1st Lien Term Loan, Tranche B, 6.375%, 8/13/184 | | | 41,656 | | | 41,760 |
| Alliance Healthcare Services, Inc., Sr. Sec. Credit Facilities 1st Lien Term Loan, Tranche B, 4.25%-4.357%, 6/3/194 | | | 222,487 | | | 214,329 |
| Alliant Holdings Intermediate LLC, Sr. Sec. Credit Facilities 1st Lien Term Loan, Tranche B, 4.50%, 8/12/224 | | | 107,093 | | | 107,305 |
| Allied Universal Holdco LLC, Sr. Sec. Credit Facilities 1st Lien Term Loan, 4.75%, 7/28/224 | | | 316,328 | | | 316,724 |
| Alpha Media Group, Inc., Sr. Sec. Credit Facilities 1st Lien Term Loan, Tranche B, 3.05%, 7/15/174,7,13 | | | 243,590 | | | 24 |
| Altice US Finance I Corp., Sr. Sec. Credit Facilities 1st Lien Term Loan, Tranche B, 3.75%, 10/20/244,8 | | | 65,000 | | | 65,325 |
| Alvogen Pharma US, Inc., Sr. Sec. Credit Facilities 1st Lien Term Loan, 6.00%, 4/1/224 | | | 124,769 | | | 125,159 |
| AM General LLC, Sr. Sec. Credit Facilities 1st Lien Term Loan, Tranche B, 10.25%, 3/22/184 | | | 155,250 | | | 154,668 |
| Amaya Holdings BV, Sr. Sec. Credit Facilities 1st Lien Term Loan, 5.00%, 7/29/214 | | | 597,356 | | | 597,869 |
| American Airlines, Inc., Sr. Sec. Credit Facilities 1st Lien Term Loan, 3.25%, 4/28/234,8 | | | 85,000 | | | 85,159 |
| American Airlines, Inc., Sr. Sec. Credit Facilities 1st Lien Term Loan, Tranche B, 3.25%, 10/10/214 | | | 98,990 | | | 99,220 |
| American Casino & Entertainment Properties, Sr. Sec. Credit Facilities 1st Lien Term Loan, 4.25%, 7/7/224 | | | 76,716 | | | 77,196 |
| American Energy-Marcellus LLC, Sr. Sec. Credit Facilities 1st Lien Term Loan, 5.25%, 8/4/204,8 | | | 253,584 | | | 144,384 |
| AMF Bowling Centers, Inc., Sr. Sec. Credit Facilities 1st Lien Term Loan, Tranche B, 6.00%, 9/19/234 | | | 221,345 | | | 220,585 |
| Apex Tool Group LLC, Sr. Sec. Credit Facilities 1st Lien Term Loan, Tranche B, 4.50%, 1/31/204 | | | 57,925 | | | 57,201 |
| Applied Systems, Inc., Sr. Sec. Credit Facilities 1st Lien Term Loan, Tranche B, 4.00%, 1/25/214 | | | 229,549 | | | 230,243 |
| Aptean, Inc., Sr. Sec. Credit Facilities 1st Lien Term Loan, Tranche B, 5.25%, 2/21/204 | | | 64,802 | | | 64,782 |
| Arch Coal, Inc., Sr. Sec. Credit Facilities 1st Lien Exit Term Loan, 10.00%, 10/5/214,8 | | | 6,059 | | | 6,182 |
| Ardagh Holdings USA, Inc., Sr. Sec. Credit Facilities 1st Lien Term Loan, Tranche B, 4.00%, 12/17/214,8 | | | 13,615,752 | | | 13,699,149 |
30 OPPENHEIMER FUNDAMENTAL ALTERNATIVES FUND
| | | | | | |
| | | Principal Amount | | | Value |
Corporate Loans (Continued) | | | |
| Ardent Legacy Acquisitions, Inc., Sr. Sec. Credit Facilities 1st Lien Term Loan, Tranche B, 6.50%, 8/4/214 | | $ | 103,875 | | | $ 103,875 |
| Aretec Group, Inc., Sr. Sec. Credit Facilities 1st Lien Exit Term Loan, 8.00%, 11/23/204 | | | 128,270 | | | 128,590 |
| Aretec Group, Inc., Sr. Sec. Credit Facilities 2nd Lien Term Loan, 5.398%, 5/23/214,8,13 | | | 5,019 | | | 4,065 |
| Aretec Group, Inc., Sr. Sec. Credit Facilities 2nd Lien Term Loan, 5.65%, 5/23/214,13 | | | 470,631 | | | 381,211 |
| Aricent Technologies, Sr. Sec. Credit Facilities 1st Lien Term Loan, 5.50%, 4/14/214 | | | 249,217 | | | 233,693 |
| Ascena Retail Group, Inc., Sr. Sec. Credit Facilities 1st Lien Term Loan, Tranche B, 5.25%, 7/29/224 | | | 377,532 | | | 368,880 |
Asurion LLC, Sr. Sec. Credit Facilities 1st Lien Term Loan: | | | | | | |
| Tranche B, 5.00%, 8/4/224 | | | 731,141 | | | 735,711 |
| Tranche B1, 5.00%, 5/24/194 | | | 213,933 | | | 214,535 |
| Tranche B5, 5.00%, 10/28/234,8 | | | 166,624 | | | 165,791 |
| Audio Visual Services Corp., Sr. Sec. Credit Facilities 1st Lien Term Loan, 4.50%, 1/22/214 | | | 455,706 | | | 457,415 |
| Avaya, Inc., Sr. Sec. Credit Facilities 1st Lien Term Loan, Tranche B7, 6.25%, 4/30/204 | | | 1,465,490 | | | 1,211,549 |
| Bass Pro Group LLC, Sr. Sec. Credit Facilities 1st Lien Term Loan, Tranche B, 4.00%, 6/5/204 | | | 408,782 | | | 409,418 |
| Berry Plastics Group, Inc., Sr. Sec. Credit Facilities 1st Lien Term Loan, Tranche H, 3.75%, 10/3/224 | | | 446,438 | | | 448,391 |
| Birch Communications, Inc., Sr. Sec. Credit Facilities 1st Lien Term Loan, Tranche B, 7.75%, 7/17/204 | | | 380,636 | | | 310,218 |
| BJ’s Wholesale Club, Inc., Sr. Sec. Credit Facilities 1st Lien Term Loan, Tranche B, 4.50%, 9/26/194 | | | 119,940 | | | 120,179 |
| Blackboard, Inc., Sr. Sec. Credit Facilities 1st Lien Term Loan, Tranche B4, 0.00%, 6/30/214 | | | 323,250 | | | 321,068 |
| BMC Foreign Holding Co., Sr. Sec. Credit Facilities 1st Lien Term Loan, Tranche B, 5.00%, 9/10/204 | | | 39,701 | | | 38,994 |
| BMC Software, Inc., Sr. Sec. Credit Facilities 1st Lien Term Loan, Tranche B, 5.00%, 9/10/204 | | | 330,932 | | | 327,036 |
| Boyd Corp., Sr. Sec. Credit Facilities 1st Lien Term Loan, 5.25%, 4/15/224 | | | 153,348 | | | 148,747 |
Boyd Gaming Corp., Sr. Sec. Credit Facilities 1st Lien Term Loan: Tranche B, 4.00%, 8/14/204 | | | 53,329 | | | 53,709 |
| Tranche B2, 3.534%, 9/15/234 | | | 320,000 | | | 322,640 |
| Burger King, Sr. Sec. Credit Facilities 1st Lien Term Loan, Tranche B, 3.75%, 12/10/214 | | | 229,424 | | | 230,761 |
| Burlington Coat Factory Warehouse Corp., Sr. Sec. Credit Facilities 1st Lien Term Loan, Tranche B3, 3.50%, 8/13/214 | | | 130,000 | | | 131,002 |
| BWAY Holdings Co., Sr. Sec. Credit Facilities 1st Lien Term Loan, Tranche B, 5.50%, 8/14/204 | | | 637,805 | | | 642,854 |
| Caesars Entertainment Operating Co., Inc., Extended Sr. Sec. Credit Facilities 1st Lien Term Loan, Tranche B5, 1.50%, 3/1/174,9 | | | 53,125 | | | 58,039 |
Caesars Entertainment Operating Co., Inc., Sr. Sec. Credit Facilities 1st Lien Term Loan: Tranche B4, 1.50%, 12/31/174,9 | | | 61,938 | | | 72,854 |
| Tranche B6, 1.50%, 3/1/174,8,9 | | | 176,047 | | | 195,193 |
31 OPPENHEIMER FUNDAMENTAL ALTERNATIVES FUND
CONSOLIDATED STATEMENT OF INVESTMENTS Continued
| | | | | | |
| | | Principal Amount | | | Value |
| Corporate Loans (Continued) | | | | | | |
| Caesars Entertainment Operating Co., Inc., Sr. Sec. Credit Facilities 1st Lien Term Loan: (Continued) | | | | | | |
| Tranche B7, 1.50%, 1/28/184,9 | | $ | 144,168 | | | $ 168,225 |
| Caesars Entertainment Resort Properties LLC, Sr. Sec. Credit Facilities 1st Lien Term Loan, Tranche B, 7.00%, 10/11/204 | | | 784,169 | | | 789,070 |
| Caesars Growth Properties Holdings LLC, Sr. Sec. Credit Facilities 1st Lien Term Loan, 6.25%, 5/10/214 | | | 1,637 | | | 1,639 |
| Caesars Growth Properties Holdings LLC, Sr. Sec. Credit Facilities 1st Lien Term Loan, 6.25%, 5/10/214,8 | | | 668,576 | | | 669,203 |
| California Resources Corp., Sr. Sec. Credit Facilities 1st Lien Term Loan, 11.375%, 12/31/214 | | | 85,000 | | | 91,127 |
| Calpine Corp., Sr. Sec. Credit Facilities 1st Lien Term Loan, Tranche B, 3.59%, 5/27/224 | | | 153,063 | | | 153,601 |
| Camelot Finance LP, Sr. Sec. Credit Facilities 1st Lien Term Loan, Tranche B, 4.75%, 10/3/234 | | | 205,000 | | | 205,544 |
| Capital Automotive LP, Sr. Sec. Credit Facilities 1st Lien Term Loan, Tranche B, 4.00%, 4/10/194 | | | 48,984 | | | 49,285 |
| Capital Automotive LP, Sr. Sec. Credit Facilities 2nd Lien Term Loan, 6.00%, 4/30/204 | | | 596,672 | | | 601,972 |
| CareCore National LLC, Sr. Sec. Credit Facilities 1st Lien Term Loan, Tranche B, 5.50%, 3/5/214 | | | 75,264 | | | 74,230 |
| Carestream Health, Inc., Sr. Sec. Credit Facilities 1st Lien Term Loan, Tranche B, 5.00%, 6/7/194,8 | | | 192,025 | | | 179,029 |
| Cavium, Inc., Sr. Sec. Credit Facilities 1st Lien Term Loan, Tranche B, 3.75%, 8/10/224 | | | 150,000 | | | 150,375 |
| CDW LLC, Sr. Sec. Credit Facilities 1st Lien Term Loan, Tranche B, 3.00%, 8/17/234 | | | 403,988 | | | 405,791 |
| CEC Entertainment, Inc., Sr. Sec. Credit Facilities 1st Lien Term Loan, Tranche B, 4.00%, 2/14/214 | | | 275,491 | | | 271,629 |
| CeramTec Acquisition Corp., Sr. Sec. Credit Facilities 1st Lien Term Loan, Tranche B2, 4.25%, 8/28/204,8 | | | 17,829 | | | 17,940 |
| CeramTec Service GmbH, Sr. Sec. Credit Facilities 1st Lien Term Loan: | | | | | | |
| Tranche B1, 4.25%, 8/28/204,8 | | | 160,718 | | | 161,723 |
| Tranche B3, 4.25%, 8/28/204,8 | | | 48,592 | | | 48,896 |
| Ceridian HCM Holdings, Inc., Extended Sr. Sec. Credit Facilities 1st Lien Term Loan, Tranche B, 4.50%, 9/15/204 | | | 217,233 | | | 213,613 |
| CEVA Group plc, Sr. Sec. Credit Facilities 1st Lien Term Loan, 6.50%, 3/14/214 | | | 80,319 | | | 64,255 |
| CEVA Group plc, Sr. Sec. Credit Facilities 1st Lien Term Loan, 6.50%, 3/19/214 | | | 68,271 | | | 54,617 |
| CEVA Group plc, Sr. Sec. Credit Facilities Letter of Credit 1st Lien Term Loan, 6.50%, 3/14/214 | | | 56,635 | | | 45,308 |
| Charter Communications Operating LLC, Sr. Sec. Credit Facilities 1st Lien Term Loan, Tranche 1, 3.50%, 1/23/234 | | | 572,125 | | | 576,257 |
| Checkout Holdings, Inc., Sr. Sec. Credit Facilities 1st Lien Term Loan, Tranche B, 4.50%, 4/1/214 | | | 517,752 | | | 469,212 |
| Chesapeake Energy Corp., Sr. Sec. Credit Facilities 1st Lien Term Loan, 8.50%, 8/23/214 | | | 135,000 | | | 144,517 |
| CHS/Community Health Systems, Inc., Sr. Sec. Credit Facilities 1st Lien Term Loan: | | | | | | |
| Tranche G, 3.75%, 12/31/194 | | | 142,346 | | | 135,723 |
| Tranche H, 4.00%, 1/27/214 | | | 453,032 | | | 430,550 |
32 OPPENHEIMER FUNDAMENTAL ALTERNATIVES FUND
| | | | | | |
| | | Principal Amount | | | Value |
Corporate Loans (Continued) | | | | | | |
| Cincinnati Bell, Inc., Sr. Sec. Credit Facilities 1st Lien Term Loan, Tranche B, 4.00%, 9/10/204 | | $ | 433,732 | | | $ 435,043 |
| Clear Channel Communications, Inc., Extended Sr. Sec. Credit Facilities 1st Lien Term Loan, Tranche D, 7.284%, 1/30/194 | | | 2,681,691 | | | 2,043,113 |
| Clear Channel Communications, Inc., Sr. Sec. Credit Facilities 1st Lien Term Loan, Tranche E, 8.034%, 7/30/194 | | | 57,055 | | | 43,683 |
| Commercial Barge Line Co., Sr. Sec. Credit Facilities 1st Lien Term Loan, Tranche B, 9.75%, 11/12/204 | | | 345,878 | | | 336,367 |
| CommScope, Inc., Sr. Sec. Credit Facilities 1st Lien Term Loan, Tranche B, 3.50%, 12/29/224,8 | | | 35,000 | | | 35,087 |
| Compass Group Diversified Holdings LLC, Sr. Sec. Credit Facilities 1st Lien Term Loan, Tranche B, 4.25%, 6/6/214,8 | | | 139,650 | | | 140,872 |
| Compuware Corp., Sr. Sec. Credit Facilities 1st Lien Term Loan, Tranche B2, 6.25%, 12/15/214 | | | 287,712 | | | 288,432 |
| Consolidated Communications, Inc., Sr. Sec. Credit Facilities 1st Lien Term Loan, Tranche B, 4.00%, 10/5/234 | | | 135,000 | | | 136,012 |
| Consolidated Container Holdings LLC, Sr. Sec. Credit Facilities 1st Lien Term Loan, Tranche B, 5.00%, 7/3/194 | | | 204,672 | | | 204,417 |
| Continental Building Products Operating Co. LLC, Sr. Sec. Credit Facilities 1st Lien Term Loan, Tranche B, 3.588%, 8/11/234,8 | | | 239,565 | | | 240,763 |
| Cooper Standard, Sr. Sec. Credit Facilities 1st Lien Term Loan, Tranche B, 4.00%, 3/26/214 | | | 276,238 | | | 277,504 |
| Corner Investment Propco LLC, Sr. Sec. Credit Facilities 1st Lien Term Loan, 11.00%, 11/2/194 | | | 275,475 | | | 276,163 |
| Cortes NP Acquisition Corp., Sr. Sec. Credit Facilities 1st Lien Term Loan, Tranche B, 5.00%, 9/29/234,8 | | | 375,000 | | | 374,297 |
| Coty, Inc., Sr. Sec. Credit Facilities 1st Lien Term Loan, Tranche B, 2.50%, 10/27/224,8 | | | 50,000 | | | 50,094 |
| CPG International, Inc., Sr. Sec. Credit Facilities 1st Lien Term Loan, Tranche B, 4.75%, 9/30/204 | | | 122,298 | | | 123,063 |
| CPI Acquisition, Inc., Sr. Sec. Credit Facilities 1st Lien Term Loan, Tranche B, 5.50%, 8/17/224 | | | 233,939 | | | 230,430 |
| Crossmark Holdings, Inc., Sr. Sec. Credit Facilities 1st Lien Term Loan, 4.50%, 12/20/194 | | | 209,974 | | | 150,131 |
| CSC Holdings LLC, Sr. Sec. Credit Facilities 1st Lien Term Loan, Tranche B, 3.876%, 10/11/244 | | | 75,000 | | | 75,359 |
| CSM Bakery Supplies, Sr. Sec. Credit Facilities 1st Lien Term Loan, Tranche B, 5.00%, 7/3/204,8 | | | 249,390 | | | 243,233 |
| CSM Bakery Supplies, Sr. Sec. Credit Facilities 2nd Lien Term Loan, 8.75%, 7/5/214,8 | | | 47,686 | | | 43,096 |
| CWGS Group LLC, Sr. Sec. Credit Facilities 1st Lien Term Loan, Tranche B, 5.75%, 2/20/204 | | | 224,159 | | | 225,139 |
| Cyanco Intermediate Corp., Sr. Sec. Credit Facilities 1st Lien Term Loan, Tranche B, 5.50%, 5/1/204 | | | 37,829 | | | 37,923 |
| Cypress Semiconductor Corp., Sr. Sec. Credit Facilities 1st Lien Term Loan, Tranche B, 6.50%, 7/5/214 | | | 395,000 | | | 399,773 |
| Dayco Products LLC, Sr. Sec. Credit Facilities 1st Lien Term Loan, Tranche B, 5.25%, 12/12/194 | | | 242,451 | | | 243,057 |
| Dayton Power & Light Co. (The), Sr. Sec. Credit Facilities 1st Lien Term Loan, Tranche B, 4.00%, 8/24/224 | | | 200,000 | | | 202,000 |
33 OPPENHEIMER FUNDAMENTAL ALTERNATIVES FUND
CONSOLIDATED STATEMENT OF INVESTMENTS Continued
| | | | | | |
| | | Principal Amount | | | Value |
Corporate Loans (Continued) | | | | | | |
| Del Monte Foods Co., Inc., Sr. Sec. Credit Facilities 1st Lien Term Loan, Tranche B, 4.25%, 2/18/214 | | $ | 69,883 | | | $ 65,050 |
| Dell International LLC, Sr. Sec. Credit Facilities 1st Lien Term Loan, Tranche B, 4.00%, 9/7/234,8 | | | 810,000 | | | 816,665 |
| Delos Finance Sarl, Sr. Sec. Credit Facilities 1st Lien Term Loan, Tranche B, 3.588%, 2/26/214 | | | 7,720,000 | | | 7,783,690 |
| Deltek, Inc., Sr. Sec. Credit Facilities 1st Lien Term Loan, 5.00%, 6/25/224 | | | 234,490 | | | 236,043 |
| Deluxe Entertainment Services, Sr. Sec. Credit Facilities 1st Lien Term Loan, Tranche B, 6.50%, 2/26/204,8 | | | 623,551 | | | 610,300 |
| DJO Finance LLC, Sr. Sec. Credit Facilities 1st Lien Term Loan, Tranche B, 4.25%, 6/8/204,8 | | | 388,069 | | | 383,897 |
| Dole Food Co., Inc., Sr. Sec. Credit Facilities 1st Lien Term Loan, Tranche B, 4.50%-6.00%, 11/1/184 | | | 92,470 | | | 92,932 |
| Dollar Tree, Inc., Sr. Sec. Credit Facilities 1st Lien Term Loan, Tranche B, 3.063%, 7/6/224 | | | 50,000 | | | 50,562 |
| Doncasters US Finance LLC, Sr. Sec. Credit Facilities 1st Lien Term Loan, Tranche B, 4.50%, 4/9/204 | | | 201,172 | | | 199,977 |
| Doosan Bobcat, Sr. Sec. Credit Facilities 1st Lien Term Loan, Tranche B, 4.50%, 5/28/214 | | | 140,509 | | | 140,918 |
| DPx Holdings BV, Sr. Sec. Credit Facilities 1st Lien Term Loan, Tranche B, 4.25%, 3/11/214 | | | 104,101 | | | 104,264 |
| Drillships Financing Holding, Inc., Sr. Sec. Credit Facilities 1st Lien Term Loan, Tranche B1, 6.00%, 3/31/214,8 | | | 184,472 | | | 94,849 |
| Drillships Ocean Ventures, Inc., Sr. Sec. Credit Facilities 1st Lien Term Loan, Tranche B, 5.50%, 7/25/214 | | | 104,719 | | | 74,285 |
| Drumm Investors LLC, Sr. Sec. Credit Facilities 1st Lien Term Loan, 9.50%, 5/4/184,8 | | | 233,920 | | | 233,335 |
| DTZ US Borrower LLC, Sr. Sec. Credit Facilities 1st Lien Term Loan, Tranche B, 4.25%, 11/4/214 | | | 248,116 | | | 248,116 |
Dynegy, Inc., Sr. Sec. Credit Facilities 1st Lien Term Loan: Tranche B, 5.00%, 6/27/234 | | | 235,000 | | | 236,583 |
| Tranche B2, 4.00%, 4/23/204 | | | 3,688,090 | | | 3,695,005 |
| Eastern Power LLC, Sr. Sec. Credit Facilities 1st Lien Term Loan, Tranche B, 5.00%, 10/2/214 | | | 496,519 | | | 503,346 |
| EFS Cogen Holdings I LLC, Sr. Sec. Credit Facilities 1st Lien Term Loan, Tranche B, 5.25%, 6/28/234 | | | 135,826 | | | 137,354 |
| Eldorado Resorts, Inc., Sr. Sec. Credit Facilities 1st Lien Term Loan, Tranche B, 4.25%, 7/25/224 | | | 221,292 | | | 222,813 |
| Emerald Performance Materials LLC, Sr. Sec. Credit Facilities 1st Lien Term Loan, 4.50%, 7/23/214 | | | 189,055 | | | 190,630 |
| Energy Transfer Equity LP, Sr. Sec. Credit Facilities 1st Lien Term Loan, 3.25%-4.00%, 12/2/194 | | | 140,000 | | | 139,521 |
| Engility Corp., Sr. Sec. Credit Facilities 1st Lien Term Loan: Tranche B1, 4.784%, 8/12/204 | | | 85,000 | | | 85,903 |
| Tranche B2, 5.75%-7.25%, 8/14/234 | | | 221,176 | | | 224,114 |
| Envision Healthcare Corp., Sr. Sec. Credit Facilities 1st Lien Term Loan, Tranche B2, 4.50%, 10/28/224,8 | | | 177,563 | | | 178,426 |
| Epicor Software Corp., Sr. Sec. Credit Facilities 1st Lien Term Loan, 4.75%, 6/1/224 | | | 181,628 | | | 180,492 |
34 OPPENHEIMER FUNDAMENTAL ALTERNATIVES FUND
| | | | | | |
| | | Principal Amount | | | Value |
Corporate Loans (Continued) | | | | | | |
| Excelitas Technologies Corp., Sr. Sec. Credit Facilities 1st Lien Term Loan, 6.00%, 11/2/204 | | $ | 16,776 | | | $ 16,399 |
| ExGen Texas Power LLC, Sr. Sec. Credit Facilities 1st Lien Term Loan, Tranche B, 5.75%, 9/20/214 | | | 312,933 | | | 253,476 |
| Exopack/Coveris Holdings SA, Sr. Sec. Credit Facilities 1st Lien Term Loan, Tranche B, 4.50%, 5/8/194 | | | 218,422 | | | 218,513 |
| FairPoint Communications, Inc., Sr. Sec. Credit Facilities 1st Lien Term Loan, Tranche B, 7.50%, 2/14/194 | | | 629,268 | | | 632,257 |
Federal-Mogul Holdings Corp., Sr. Sec. Credit Facilities 1st Lien Term Loan: Tranche B, 4.00%, 4/3/184 | | | 238,441 | | | 235,878 |
| Tranche C, 4.75%, 4/15/214 | | | 1,069,546 | | | 1,037,995 |
| Fieldwood Energy LLC, Sr. Sec. Credit Facilities 1st Lien Term Loan, 8.00%, 8/31/204,8 | | | 38,000 | | | 35,055 |
| Filtration Group, Inc., Sr. Sec. Credit Facilities 1st Lien Term Loan, Tranche B, 4.25%, 11/20/204,8 | | | 20,919 | | | 21,008 |
| First Advantage, Sr. Sec. Credit Facilities 1st Lien Term Loan, Tranche B, 6.25%, 6/30/224 | | | 202,904 | | | 200,241 |
| First Data Corp., Sr. Sec. Credit Facilities 1st Lien Term Loan, 3.524%, 3/24/214 | | | 349,829 | | | 352,162 |
| First Data Corp., Sr. Sec. Credit Facilities 1st Lien Term Loan, Tranche B, 4.275%, 7/8/224,8 | | | 150,000 | | | 151,229 |
| Floatel International Ltd., Sr. Sec. Credit Facilities 1st Lien Term Loan, Tranche B, 6.00%, 6/27/204,8 | | | 59,000 | | | 46,758 |
| Fly Funding II Sarl, Sr. Sec. Credit Facilities 1st Lien Term Loan, 3.50%, 8/9/194,8 | | | 60,000 | | | 60,178 |
| Formula One, Sr. Sec. Credit Facilities 1st Lien Term Loan, Tranche B, 4.75%, 7/30/214 | | | 597,240 | | | 599,479 |
| FPC Holdings, Inc., Sr. Sec. Credit Facilities 1st Lien Term Loan, 5.25%, 11/19/194 | | | 261,369 | | | 233,489 |
| Garda World Security Corp., Sr. Sec. Credit Facilities 1st Lien Term Loan, Tranche B, 4.00%, 11/6/204 | | | 897,468 | | | 891,298 |
| Gates Global LLC, Sr. Sec. Credit Facilities 1st Lien Term Loan, 4.25%, 7/5/214 | | | 323,728 | | | 319,299 |
| Generac Power Systems, Inc., Sr. Sec. Credit Facilities 1st Lien Term Loan, Tranche B, 3.50%, 5/31/234,8 | | | 134,000 | | | 134,335 |
| Genoa a QoL Healthcare Co. LLC, Sr. Sec. Credit Facilities 1st Lien Term Loan, 5.25%, 10/25/234,8 | | | 85,000 | | | 85,133 |
| Getty Images, Inc., Sr. Sec. Credit Facilities 1st Lien Term Loan, Tranche B, 4.75%, 10/18/194 | | | 207,480 | | | 176,047 |
| Global Tel*Link Corp., Sr. Sec. Credit Facilities 1st Lien Term Loan, 5.00%, 5/22/204 | | | 469,992 | | | 457,948 |
| Golden Nugget, Inc., Sr. Sec. Credit Facilities 1st Lien Term Loan, Tranche B, 0.00%, 11/21/194 | | | 524,764 | | | 531,323 |
| Goodyear Tire & Rubber Co. (The), Sr. Sec. Credit Facilities 2nd Lien Term Loan, 3.75%, 4/30/194 | | | 161,337 | | | 162,576 |
| Gulf Finance LLC, Sr. Sec. Credit Facilities 1st Lien Term Loan, Tranche B, 6.25%, 8/25/234,8 | | | 240,000 | | | 235,500 |
| Gymboree Corp. (The), Sr. Sec. Credit Facilities 1st Lien Term Loan, 5.00%, 2/23/184,8 | | | 880,512 | | | 564,261 |
35 OPPENHEIMER FUNDAMENTAL ALTERNATIVES FUND
CONSOLIDATED STATEMENT OF INVESTMENTS Continued
| | | | | | |
| | | Principal Amount | | | Value |
Corporate Loans (Continued) | | | | | | |
| Harbor Freight Tools USA, Inc., Sr. Sec. Credit Facilities 1st Lien Term Loan, 4.137%, 8/18/234 | | $ | 445,434 | | | $ 448,854 |
Harland Clarke Holdings Corp., Sr. Sec. Credit Facilities 1st Lien Term Loan: Tranche B3, 7.00%, 5/22/184,8 | | | 97,746 | | | 97,197 |
Tranche B4, 6.00%-6.993%, 8/4/194,8 | | | 283,865 | | | 281,559 |
| Tranche B5, 7.00%, 12/31/194,8 | | | 188,926 | | | 186,958 |
| Harsco Corp., Sr. Sec. Credit Facilities 1st Lien Term Loan, Tranche B, 6.50%, 10/27/234,8 | | | 100,000 | | | 101,250 |
| HCR Healthcare, Inc., Sr. Sec. Credit Facilities 1st Lien Term Loan, 5.00%, 4/6/184 | | | 169,522 | | | 149,179 |
HD Supply, Inc., Sr. Sec. Credit Facilities 1st Lien Term Loan: | | | | | | |
Tranche B1, 3.63%, 8/13/214 | | | 376,200 | | | 377,885 |
| Tranche B2, 3.63%, 10/17/234,8 | | | 170,000 | | | 170,478 |
| Henry Co. LLC, Sr. Sec. Credit Facilities 1st Lien Term Loan, Tranche B, 5.50%, 10/5/234,8 | | | 45,000 | | | 45,225 |
| HGIM Corp., Sr. Sec. Credit Facilities 1st Lien Term Loan, Tranche B, 5.50%, 6/18/204,8 | | | 125,000 | | | 92,500 |
| Hillman Group, Inc. (The), Sr. Sec. Credit Facilities 1st Lien Term Loan, Tranche B, 4.50%, 6/30/214 | | | 183,931 | | | 184,563 |
| Hilton Worldwide Finance LLC, Sr. Sec. Credit Facilities 1st Lien Term loan, Tranche B2, 2.50%, 10/25/234,8 | | | 19,950 | | | 20,084 |
| Hilton Worldwide Finance LLC, Sr. Sec. Credit Facilities 1st Lien Term Loan, Tranche B, 3.50%, 10/26/204 | | | 125,452 | | | 126,169 |
| Hostess Brands LLC, Sr. Sec. Credit Facilities 1st Lien Term Loan, 4.50%, 8/3/224 | | | 464,494 | | | 467,770 |
| HUB International Ltd., Sr. Sec. Credit Facilities 1st Lien Term Loan, Tranche B, 4.00%, 10/2/204 | | | 561,697 | | | 561,970 |
| Huntsman International LLC, Extended Sr. Sec. Credit Facilities 1st Lien Term Loan, Tranche B, 3.00%, 4/19/194,8 | | | 20,000 | | | 20,125 |
| Hyperion Insurance Group Ltd., Sr. Sec. Credit Facilities 1st Lien Term Loan, Tranche B, 5.50%, 4/9/224 | | | 262,102 | | | 258,129 |
| IG Investments Holdings LLC, Sr. Sec. Credit Facilities 1st Lien Term Loan, Tranche B, 6.00%, 10/31/214,8 | | | 556,833 | | | 562,053 |
| Ineos Styrolution US Holding LLC, Sr. Sec. Credit Facilities 1st Lien Term Loan, Tranche B, 4.75%, 9/30/214 | | | 160,000 | | | 160,950 |
Ineos US Finance LLC, Sr. Sec. Credit Facilities 1st Lien Term Loan: | | | | | | |
Tranche B, 3.75%, 5/4/184 | | | 311,594 | | | 312,495 |
Tranche B, 3.75%, 12/15/204,8 | | | 15,000 | | | 15,071 |
| Tranche B, 4.25%, 3/31/224 | | | 76,701 | | | 77,846 |
| Infor US, Inc., Sr. Sec. Credit Facilities 1st Lien Term Loan, Tranche B5, 3.75%, 6/3/204 | | | 375,443 | | | 374,974 |
| Informatica Corp., Sr. Sec. Credit Facilities 1st Lien Term Loan, Tranche B, 4.50%, 8/5/224,8 | | | 276,046 | | | 271,663 |
| Information Resources, Inc., Sr. Sec. Credit Facilities 1st Lien Term Loan, Tranche B, 4.75%, 9/30/204 | | | 21,987 | | | 22,054 |
| Inmar, Inc., Sr. Sec. Credit Facilities 1st Lien Term Loan, Tranche B, 4.25%, 1/27/214 | | | 155,188 | | | 154,509 |
| Intelsat Jackson Holdings SA, Sr. Sec. Credit Facilities 1st Lien Term Loan, Tranche B2, 3.75%, 6/30/194 | | | 185,000 | | | 177,253 |
36 OPPENHEIMER FUNDAMENTAL ALTERNATIVES FUND
| | | | | | |
| | | Principal Amount | | | Value |
Corporate Loans (Continued) | | | | | | |
| InterGen NV, Sr. Sec. Credit Facilities 1st Lien Term Loan, Tranche B, 5.50%, 6/15/204 | | $ | 297,027 | | | $ 283,661 |
| Internap Network Services Corp., Sr. Sec. Credit Facilities 1st Lien Term Loan, 7.00%, 11/22/194 | | | 111,017 | | | 106,298 |
| International Equipment Solutions LLC, Sr. Sec. Credit Facilities 1st Lien Term Loan, Tranche B, 7.25%, 8/16/194 | | | 122,993 | | | 110,694 |
| inVentiv Health, Inc., Sr. Sec. Credit Facilities 1st Lien Term Loan, Tranche B4, 8.75%, 5/15/184 | | | 213,985 | | | 214,654 |
| ION Media Networks, Inc., Sr. Sec. Credit Facilities 1st Lien Term Loan, 4.75%, 12/18/204 | | | 712,109 | | | 716,999 |
| IPC Corp., Sr. Sec. Credit Facilities 1st Lien Term Loan, Tranche B, 5.50%, 8/6/214 | | | 519,015 | | | 494,362 |
| IPC Corp., Sr. Sec. Credit Facilities 2nd Lien Term Loan, 10.50%, 2/4/224 | | | 161,028 | | | 130,835 |
| IQOR US, Inc., Sr. Sec. Credit Facilities 1st Lien Term Loan, Tranche B, 6.00%, 4/1/214 | | | 316,356 | | | 293,420 |
| IQOR US, Inc., Sr. Sec. Credit Facilities 2nd Lien Term Loan, 9.75%, 4/1/224 | | | 89,964 | | | 68,148 |
| iStar, Inc., Sr. Sec. Credit Facilities 1st Lien Term Loan, Tranche B, 5.50%, 7/1/204 | | | 304,207 | | | 308,580 |
| Jacobs Entertainment, Inc., Sr. Sec. Credit Facilities 1st Lien Term Loan, 5.25%, 10/29/184 | | | 248,179 | | | 249,110 |
| JC Penney Corp., Inc., Sr. Sec. Credit Facilities 1st Lien Term Loan, Tranche B, 5.25%, 6/23/234 | | | 347,813 | | | 350,747 |
| Kenan Advantage Group, Inc. (The), Sr. Sec. Credit Facilities 1st Lien Term Loan: | | | | | | |
| Tranche B1, 4.00%, 7/29/224 | | | 208,198 | | | 207,775 |
| Tranche B2, 4.00%, 7/29/224 | | | 61,787 | | | 61,661 |
| Kenan Advantage Group, Inc. (The), Sr. Sec. Credit Facilities 1st Lien Term Loan, Delayed Draw, 1.50%, 1/31/174 | | | 14,592 | | | 14,563 |
| Key Safety Systems, Inc., Sr. Sec. Credit Facilities 1st Lien Term Loan, 5.50%, 8/30/214 | | | 279,714 | | | 281,812 |
| KFC Holding Co., Sr. Sec. Credit Facilities 1st Lien Term Loan, Tranche B, 3.286%, 6/16/234 | | | 234,413 | | | 237,050 |
| KIK Custom Products, Inc., Sr. Sec. Credit Facilities 1st Lien Term Loan, Tranche B, 6.00%, 8/26/224 | | | 96,252 | | | 96,252 |
| Kindercare Education LLC, Sr. Sec. Credit Facilities 1st Lien Term Loan, 5.25%, 8/13/224,8 | | | 275,000 | | | 276,031 |
| Kindred Healthcare, Inc., Sr. Sec. Credit Facilities 1st Lien Term Loan, Tranche B, 4.25%, 4/9/214 | | | 464,294 | | | 465,258 |
| Kinetic Concepts, Inc., Sr. Sec. Credit Facilities 1st Lien Term Loan, Tranche F1, 5.00%, 11/4/204 | | | 390,948 | | | 393,840 |
| Kloeckner Pentaplast of America, Inc., Sr. Sec. Credit Facilities 1st Lien Term Loan, 5.00%, 4/22/204 | | | 130,421 | | | 131,236 |
| Kloeckner Pentaplast of America, Inc., Sr. Sec. Credit Facilities 1st Lien Term Loan, 5.00%, 4/28/204 | | | 306,628 | | | 308,545 |
| Koosharem LLC, Sr. Sec. Credit Facilities 1st Lien Exit Term Loan, 7.50%, 5/15/204 | | | 382,187 | | | 341,102 |
| Kraton Polymers LLC, Sr. Sec. Credit Facilities 1st Lien Term Loan, Tranche B, 6.00%, 1/6/224 | | | 500,000 | | | 504,271 |
37 OPPENHEIMER FUNDAMENTAL ALTERNATIVES FUND
CONSOLIDATED STATEMENT OF INVESTMENTS Continued
| | | | | | |
| | | Principal Amount | | | Value |
Corporate Loans (Continued) | | | | | | |
| Kronos, Inc., Sr. Sec. Credit Facilities 1st Lien Term Loan, 4.50%, 10/30/194 | | $ | 231,707 | | | $ 232,304 |
| La Quinta Intermediate Holdings LLC, Sr. Sec. Credit Facilities 1st Lien Term Loan, Tranche B, 3.75%, 4/14/214 | | | 233,498 | | | 233,351 |
| Landry’s, Inc., Sr. Sec. Credit Facilities 1st Lien Term Loan, 4.00%, 10/4/234 | | | 275,000 | | | 277,005 |
| Laureate Education, Inc., Sr. Sec. Credit Facilities 1st Lien Term Loan, Tranche B, 8.868%, 3/17/214 | | | 367,460 | | | 365,221 |
| Legendary Pictures, Inc., Sr. Sec. Credit Facilities 1st Lien Term Loan, Tranche B, 7.00%, 4/22/204 | | | 465,000 | | | 466,162 |
| Leslie’s Poolmart, Inc., Sr. Sec. Credit Facilities 1st Lien Term loan, Tranche B, 5.25%, 8/16/234 | | | 95,000 | | | 95,772 |
| LifeCare Holdings LLC, Sr. Sec. Credit Facilities 1st Lien Exit Term Loan, Tranche A, 6.50%, 11/30/184 | | | 154,335 | | | 129,256 |
| Lions Gate Entertainment Corp., Sr. Sec. Credit Facilities 1st Lien Term Loan, Tranche B, 3.75%, 10/12/234,8 | | | 470,000 | | | 471,371 |
| Live Nation Entertainment, Inc., Sr. Sec. Credit Facilities 1st Lien Term Loan, Tranche B, 2.50%, 10/26/234,8 | | | 35,000 | | | 35,088 |
| Livingston International, Inc., Sr. Sec. Credit Facilities 1st Lien Term Loan, Tranche B1, 5.50%, 4/18/194 | | | 102,400 | | | 97,920 |
| Livingston International, Inc., Sr. Sec. Credit Facilities 2nd Lien Term Loan, 9.50%, 4/17/204 | | | 45,073 | | | 41,355 |
| LS Deco LLC, Sr. Sec. Credit Facilities 1st Lien Term Loan, Tranche B, 5.00%, 5/23/224 | | | 182,188 | | | 184,237 |
| LTS Buyer LLC, Sr. Sec. Credit Facilities 1st Lien Term Loan, Tranche B, 4.088%, 4/13/204 | | | 774,481 | | | 775,933 |
| Media General, Inc., Sr. Sec. Credit Facilities 1st Lien Term Loan, Tranche B, 4.00%, 7/30/204 | | | 389,033 | | | 389,623 |
| MediArena Acquisition BV, Sr. Sec. Credit Facilities 1st Lien Term Loan, 6.75%, 8/11/214 | | | 357,972 | | | 324,636 |
| MEG Energy Corp., Sr. Sec. Credit Facilities 1st Lien Term Loan, Tranche B, 3.75%, 3/31/204 | | | 183,569 | | | 173,664 |
| Men’s Wearhouse, Inc. (The), Sr. Sec. Credit Facilities 1st Lien Term Loan, Tranche B, 4.50%, 6/18/214 | | | 154,852 | | | 153,044 |
| Mergermarket USA, Inc., Sr. Sec. Credit Facilities 1st Lien Term Loan, 4.50%, 2/4/214 | | | 146,428 | | | 144,232 |
| MH Sub I LLC, Sr. Sec. Credit Facilities 1st Lien Term Loan, Tranche B, 4.75%, 6/30/214,8 | | | 322,042 | | | 323,384 |
| Michaels Stores, Inc., Sr. Sec. Credit Facilities 1st Lien Term Loan, Tranche B1, 3.75%, 1/28/234,8 | | | 119,703 | | | 120,719 |
| Milacron LLC, Sr. Sec. Credit Facilities 1st Lien Term Loan, Tranche B, 4.25%, 9/28/204 | | | 163,627 | | | 164,543 |
| Mission Broadcasting, Inc., Sr. Sec. Credit Facilities 1st Lien Term Loan, Tranche B, 3.00%, 9/26/234,8 | | | 80,591 | | | 81,008 |
| Monitronics International, Inc., Sr. Sec. Credit Facilities 1st Lien Term Loan, Tranche B2, 6.50%, 9/30/224 | | | 485,000 | | | 482,575 |
| MPG Holdco I, Inc., Sr. Sec. Credit Facilities 1st Lien Term Loan, 3.75%, 10/20/214 | | | 94,491 | | | 94,989 |
| MPH Acquisition Holdings LLC, Sr. Sec. Credit Facilities 1st Lien Term Loan, Tranche B, 5.00%, 5/25/234 | | | 248,761 | | | 251,933 |
38 OPPENHEIMER FUNDAMENTAL ALTERNATIVES FUND
| | | | | | |
| | | Principal Amount | | | Value |
Corporate Loans (Continued) | | | | | | |
| MRP Generation Holdings LLC, Sr. Sec. Credit Facilities 1st Lien Term Loan, Tranche B, 8.00%, 9/29/224 | | $ | 75,000 | | | $ 72,937 |
| Murray Energy Corp., Sr. Sec. Credit Facilities 1st Lien Term Loan, Tranche B2, 8.25%, 4/16/204 | | | 69,817 | | | 64,813 |
| National Financial Partners Corp., Sr. Sec. Credit Facilities 1st Lien Term Loan, Tranche B, 4.50%, 7/1/204 | | | 371,939 | | | 373,300 |
| National Mentor, Inc., Sr. Sec. Credit Facilities 1st Lien Term Loan, Tranche B, 4.25%, 1/31/214 | | | 209,858 | | | 210,383 |
| National Surgical Hospitals, Inc., Sr. Sec. Credit Facilities 1st Lien Term Loan, Tranche B, 4.50%, 6/1/224 | | | 49,275 | | | 48,736 |
| Navistar, Inc., Sr. Sec. Credit Facilities 1st Lien Term Loan, Tranche B, 6.50%, 8/7/204 | | | 787,895 | | | 793,804 |
| NBTY, Inc., Sr. Sec. Credit Facilities 1st Lien Term Loan, Tranche B, 5.00%, 5/5/234 | | | 99,750 | | | 100,137 |
| Neiman Marcus Group Ltd. LLC, Sr. Sec. Credit Facilities 1st Lien Term Loan, 4.25%, 10/25/204,8 | | | 7,059,933 | | | 6,507,938 |
| NEP/NCP Holdco, Inc., Sr. Sec. Credit Facilities 1st Lien Term Loan, Tranche B, 4.25%, 1/22/204,8 | | | 211,272 | | | 211,008 |
| New Millennium Holdco, Inc., Sr. Sec. Credit Facilities 1st Lien Term Loan, 7.50%, 12/21/204,8 | | | 27,489 | | | 17,507 |
| New Trident Holdcorp, Inc., Sr. Sec. Credit Facilities 1st Lien Term Loan, Tranche B, 6.50%, 7/31/194 | | | 110,658 | | | 92,538 |
| Nexstar Broadcasting, Inc., Sr. Sec. Credit Facilities 1st Lien Term Loan, 3.00%, 9/26/234,8 | | | 889,409 | | | 894,015 |
| Nord Anglia Education Finance, Sr. Sec. Credit Facilities 1st Lien Term Loan, Tranche B, 5.00%, 3/31/214 | | | 438,369 | | | 441,109 |
| Novelis, Inc., Sr. Sec. Credit Facilities 1st Lien Term Loan, Tranche B, 4.00%, 6/2/224 | | | 227,893 | | | 228,861 |
| Novitex Acquisition LLC, Sr. Sec. Credit Facilities 1st Lien Term Loan, 8.00%, 7/1/204 | | | 162,419 | | | 154,856 |
| NRG Energy, Inc., Sr. Sec. Credit Facilities 1st Lien Term Loan, Tranche B, 3.50%, 6/30/234 | | | 358,836 | | | 360,002 |
| OCI Beaumont LLC, Sr. Sec. Credit Facilities 1st Lien Term Loan, Tranche B, 7.75%, 8/20/194 | | | 271,200 | | | 266,793 |
| Opal Acquisition, Inc., Sr. Sec. Credit Facilities 1st Lien Term Loan, Tranche B, 5.00%, 11/27/204 | | | 300,163 | | | 278,026 |
| Orchard Acquisition Co. LLC, Sr. Sec. Credit Facilities 1st Lien Term Loan, Tranche B, 7.00%, 2/8/194 | | | 406,682 | | | 172,840 |
| Ortho-Clinical Diagnostics, Inc., Sr. Sec Credit Facilities 1st Lien Term Loan, Tranche B, 4.75%, 6/30/214 | | | 119,486 | | | 116,779 |
| Party City Holdings, Inc., Sr. Sec. Credit Facilities 1st Lien Term Loan, Tranche B, 3.75%-4.24%, 8/19/224,8 | | | 135,000 | | | 135,591 |
| Penton Business Media, Inc., Sr. Sec. Credit Facilities 1st Lien Term Loan, 6.25%, 10/3/194 | | | 224,140 | | | 224,420 |
| PetSmart, Inc., Sr. Sec. Credit Facilities 1st Lien Term Loan, Tranche B, 4.00%, 3/10/224,8 | | | 556,651 | | | 558,390 |
| PGX Holdings, Inc., Sr. Sec. Credit Facilities 1st Lien Term Loan, 5.75%, 9/29/204 | | | 135,741 | | | 136,165 |
| PGX Holdings, Inc., Sr. Sec. Credit Facilities 2nd Lien Term Loan, 10.00%, 9/29/214 | | | 79,734 | | | 78,538 |
39 OPPENHEIMER FUNDAMENTAL ALTERNATIVES FUND
CONSOLIDATED STATEMENT OF INVESTMENTS Continued
| | | | | | |
| | | Principal Amount | | | Value |
Corporate Loans (Continued) | | | | | | |
| Pharmaceutical Product Development LLC, Sr. Sec. Credit Facilities 1st Lien Term Loan, Tranche D, 4.25%, 8/18/224 | | $ | 320,243 | | | $ 320,543 |
| Pinnacle Operating Corp., Sr. Sec. Credit Facilities 1st Lien Term Loan, Tranche B, 4.75%, 11/15/184 | | | 185,232 | | | 158,374 |
| Polycom, Inc., Sr. Sec. Credit Facilities 1st Lien Term Loan, 7.50%, 9/27/234 | | | 160,000 | | | 156,800 |
| PRA Holdings, Inc., Sr. Sec. Credit Facilities 1st Lien Term Loan, 4.50%, 9/24/204,8 | | | 231,605 | | | 233,114 |
| ProPetro Services, Inc., Sr. Sec. Credit Facilities 1st Lien Term Loan, Tranche B, 7.25%, 9/30/194 | | | 290,855 | | | 257,770 |
| Quikrete Holdings, Inc., Sr. Sec. Credit Facilities 1st Lien Term Loan, Tranche B, 4.00%, 9/28/204 | | | 229,964 | | | 231,134 |
| Quorum Health Corp., Sr. Sec. Credit Facilities 1st Lien Term Loan, 6.75%, 4/29/224,8 | | | 118,601 | | | 111,824 |
| Rackspace Hosting, Inc., Sr. Sec. Credit Facilities 1st Lien Term Loan, Tranche B, 5.25%, 10/26/234,8 | | | 425,000 | | | 427,998 |
| Realogy Group LLC, Sr. Sec. Credit Facilities 1st Lien Term Loan, Tranche B, 3.75%, 7/20/224 | | | 229,425 | | | 231,313 |
| Revlon Consumer Products Corp., Sr. Sec. Credit Facilities 1st Lien Term Loan, Tranche B, 4.25%, 9/7/234 | | | 41,667 | | | 41,816 |
| Revlon Consumer Products Corp., Sr. Sec. Credit Facilities 1st Lien Term Loan, Tranche B, 4.25%, 9/7/234,8 | | | 333,333 | | | 334,532 |
| Reynolds Group Holdings, Inc., Sr. Sec. Credit Facilities 1st Lien Term Loan, 4.25%, 2/5/234 | | | 415,959 | | | 417,401 |
| Rite Aid Corp., Sr. Sec. Credit Facilities 2nd Lien Term Loan, Tranche 1, 5.75%, 8/21/204 | | | 63,202 | | | 63,508 |
| Riverbed Technology, Inc., Sr. Sec. Credit Facilities 1st Lien Term Loan, Tranche B, 5.00%, 4/25/224 | | | 392,690 | | | 396,327 |
| Road Infrastructure Investment LLC, Sr. Sec. Credit Facilities 1st Lien Term Loan, Tranche B, 5.00%, 6/13/234 | | | 100,000 | | | 100,906 |
| Royal Holdings, Inc., Sr. Sec. Credit Facilities 1st Lien Term Loan, 4.50%, 6/20/224,8 | | | 227,638 | | | 228,823 |
| Sabre GLBL, Inc., Sr. Sec. Credit Facilities 1st Lien Term Loan, Tranche B, 4.00%, 2/19/194 | | | 330,241 | | | 332,010 |
| Sabre, Inc., Sr. Sec. Credit Facilities Incremental 1st Lien Term Loan, Tranche B2, 4.50%, 2/19/194 | | | 94,532 | | | 95,079 |
| Salem Communications Corp., Sr. Sec. Credit Facilities 1st Lien Term Loan, Tranche B, 4.50%, 3/13/204 | | | 295,339 | | | 291,094 |
| Sandy Creek Energy Associates LP, Sr. Sec. Credit Facilities 1st Lien Term Loan, Tranche B, 5.00%, 11/9/204 | | | 450,618 | | | 378,707 |
| Science Applications International Corp., Sr. Sec. Credit Facilities 1st Lien Term Loan, Tranche B, 3.25%, 5/4/224 | | | 135,000 | | | 136,097 |
Scientific Games International, Inc., Sr. Sec. Credit Facilities 1st Lien Term Loan: | | | | | | |
Tranche B1, 6.00%, 10/18/204 | | | 230,345 | | | 231,867 |
Tranche B2, 6.00%, 10/1/214 | | | 292,652 | | | 294,116 |
| Seadrill Operating LP, Sr. Sec. Credit Facilities 1st Lien Term Loan, Tranche B, 4.00%, 2/12/214,8 | | | 457,596 | | | 259,686 |
| Seahawk Holding Cayman Ltd., Sr. Sec. Credit Facilities 1st Lien Term Loan, 7.00%, 9/27/224,8 | | | 230,000 | | | 229,795 |
40 OPPENHEIMER FUNDAMENTAL ALTERNATIVES FUND
| | | | | | |
| | | Principal Amount | | | Value |
Corporate Loans (Continued) | | | | | | |
| SeaWorld Parks & Entertainment, Inc., Sr. Sec. Credit Facilities 1st Lien Term Loan, Tranche B3, 4.088%, 5/14/204 | | $ | 96,894 | | | $ 97,415 |
| Securus Technologies Holdings, Inc., Sr. Sec. Credit Facilities 1st Lien Term Loan: | | | | | | |
| Tranche B, 4.75%, 4/30/204 | | | 320,757 | | | 316,748 |
| Tranche B2, 5.25%, 4/30/204 | | | 9,975 | | | 9,850 |
| Securus Technologies Holdings, Inc., Sr. Sec. Credit Facilities 2nd Lien Term Loan, 9.00%, 4/30/214 | | | 27,678 | | | 26,727 |
| Serta Simmons Bedding LLC, Sr. Sec. Credit Facilities 1st Lien Term Loan: | | | | | | |
| Tranche B, 4.25%, 10/1/194,8 | | | 45,000 | | | 45,048 |
| Tranche B, 4.50%, 10/21/234,8 | | | 515,000 | | | 515,138 |
| SFR Group SA, Sr. Sec. Credit Facilities 1st Lien Term Loan: | | | | | | |
| Tranche B, 4.563%, 7/29/224,8 | | | 232,441 | | | 232,731 |
| Tranche B10, 4.00%, 1/31/254,8 | | | 340,000 | | | 339,256 |
| Sheridan Investment Partners II-A LLC, Sr. Sec. Credit Facilities 1st Lien Term Loan, Tranche B, 4.25%, 12/16/204,8 | | | 58,526 | | | 43,309 |
| Sheridan Production Partners II-A LP, Sr. Sec. Credit Facilities 1st Lien Term Loan, Tranche B, 4.25%, 12/16/204,8 | | | 6,055 | | | 4,481 |
| Sheridan Production Partners II-M LP, Sr. Sec. Credit Facilities 1st Lien Term Loan, Tranche B, 4.25%, 12/16/204,8 | | | 2,258 | | | 1,671 |
| SIG Combibloc US Acquisition, Inc., Sr. Sec. Credit Facilities 1st Lien Term Loan, Tranche B, 4.00%, 3/13/224,8 | | | 199,494 | | | 200,039 |
| Signode Industrial Group US, Inc., Sr. Sec. Credit Facilities 1st Lien Term Loan, Tranche B, 3.75%, 4/30/214 | | | 182,713 | | | 182,539 |
| SolarWinds Holdings. Inc., Sr. Sec. Credit Facilities 1st Lien Term Loan, Tranche B, 5.50%, 2/3/234 | | | 129,675 | | | 130,682 |
| Solenis International LP, Sr. Sec. Credit Facilities 1st Lien Term Loan, 4.25%, 8/2/214 | | | 56,718 | | | 56,655 |
| SourceHOV LLC, Sr. Sec. Credit Facilities 1st Lien Term Loan, Tranche B, 7.75%, 10/31/194 | | | 156,254 | | | 135,062 |
| Southcross Energy Partners LP, Sr. Sec. Credit Facilities 1st Lien Term Loan, Tranche B, 5.25%, 7/29/214 | | | 202,406 | | | 164,455 |
| SRAM LLC, Sr. Sec. Credit Facilities 1st Lien Term Loan, Tranche B, 4.00%-5.50%, 4/10/204 | | | 333,062 | | | 325,568 |
| Station Casinos LLC, Sr. Sec. Credit Facilities 1st Lien Term Loan, Tranche B, 3.75%, 6/8/234 | | | 438,900 | | | 441,148 |
| Sterigenics-Nordion Holdings LLC, Sr. Sec. Credit Facilities 1st Lien Term Loan, Tranche B, 4.25%, 5/15/224 | | | 187,526 | | | 187,526 |
| SUPERVALU, Inc., Sr. Sec. Credit Facilities 1st Lien Term Loan, 5.50%, 3/21/194 | | | 464,503 | | | 466,391 |
| Talen Energy Supply LLC, Sr. Sec. Credit Facilities 1st Lien Term Loan, Tranche B, 6.00%, 10/18/234,8 | | | 325,000 | | | 326,016 |
| Technicolor, Sr. Sec. Credit Facilities 1st Lien Term Loan, Tranche B, 5.00%, 7/11/204 | | | 394,129 | | | 395,114 |
| TI Group Automotive Systems LLC, Sr. Sec. Credit Facilities 1st Lien Term Loan, Tranche B, 4.50%, 6/30/224 | | | 568,689 | | | 570,580 |
| TIBCO Software, Inc., Sr. Sec. Credit Facilities 1st Lien Term Loan, Tranche B, 6.50%, 12/4/204 | | | 396,600 | | | 397,176 |
| Tower Automotive Holdings USA LLC, Sr. Sec. Credit Facilities 1st Lien Term Loan, Tranche B, 4.00%, 4/23/204 | | | 327,455 | | | 327,660 |
41 OPPENHEIMER FUNDAMENTAL ALTERNATIVES FUND
| | | | |
| CONSOLIDATED STATEMENT OF INVESTMENTS Continued | | |
| | | | | | |
| | | Principal Amount | | | Value |
Corporate Loans (Continued) | | | | | | |
| TransDigm, Inc., Sr. Sec. Credit Facilities 1st Lien Term Loan, Tranche F, 3.75%, 6/9/234,8 | | $ | 11,458,000 | | | $ 11,435,084 |
| Travelport Finance Luxembourg Sarl, Sr. Sec. Credit Facilities 1st Lien Term Loan, Tranche B, 5.00%, 9/2/214,8 | | | 733,929 | | | 738,899 |
| Tribune Co., Sr. Sec. Credit Facilities 1st Lien Term Loan, Tranche B, 3.75%, 12/27/204 | | | 465,526 | | | 468,435 |
| Tronox Pigments BV, Sr. Sec. Credit Facilities 1st Lien Term Loan, Tranche B, 4.50%, 3/19/204 | | | 316,904 | | | 315,445 |
| Tronox Pigments BV, Sr. Sec. Credit Facilities 1st Lien Term Loan, Tranche B, 4.50%, 3/19/204,8 | | | 105,000 | | | 104,517 |
| TTM Technologies, Inc., Sr. Sec. Credit Facilities 1st Lien Term Loan, Tranche B, 5.103%, 5/31/214 | | | 176,718 | | | 178,262 |
| Uber Technologies, Inc., Sr. Sec. Credit Facilities 1st Lien Term Loan, Tranche B, 5.00%, 7/13/234 | | | 60,000 | | | 60,337 |
| Univar, Inc., Sr. Sec. Credit Facilities 1st Lien Term Loan, Tranche B, 4.25%, 7/1/224 | | | 355,108 | | | 355,848 |
| Univar, Inc., Sr. Sec. Credit Facilities 1st Lien Term Loan, Tranche B, 4.25%, 7/1/224,8 | | | 60,000 | | | 60,125 |
| Univision Communications, Inc., Sr. Sec. Credit Facilities 1st Lien Term Loan, Tranche C3, 4.00%, 3/1/204 | | | 97,363 | | | 97,636 |
| UPC Financing Partnership, Sr. Sec. Credit Facilities 1st Lien Term Loan, 3.833%, 8/31/244,8 | | | 310,000 | | | 311,976 |
| US TelePacific Corp., Sr. Sec. Credit Facilities 1st Lien Term Loan, 6.00%, 11/25/204 | | | 213,966 | | | 211,091 |
| Valeant Pharmaceuticals International, Inc., Sr. Sec. Credit Facilities 1st Lien Term Loan, Tranche BE, 5.25%, 8/5/204,8 | | | 230,000 | | | 230,096 |
| Veritas US, Inc., Sr. Sec. Credit Facilities 1st Lien Term Loan, Tranche B1, 6.625%, 1/27/234 | | | 447,575 | | | 418,156 |
| Versum Materials, Inc., Sr. Sec. Credit Facilities 1st Lien Term Loan, Tranche B, 3.34%, 9/29/234 | | | 130,000 | | | 130,894 |
| Vitera Healthcare Solutions LLC, Sr. Sec. Credit Facilities 1st Lien Term Loan, 6.00%, 11/4/204 | | | 168,692 | | | 163,947 |
| Wabash National Corp., Sr. Sec. Credit Facilities 1st Lien Term Loan, Tranche B, 4.25%, 3/18/224 | | | 103,880 | | | 104,270 |
| WaveDivision Holdings LLC, Sr. Sec. Credit Facilities 1st Lien Term Loan, Tranche B, 4.00%, 10/12/194,8 | | | 357,770 | | | 359,111 |
| Weight Watchers International, Inc., Sr. Sec. Credit Facilities 1st Lien Term Loan, Tranche B2, 4.10%, 4/2/204 | | | 1,299,727 | | | 999,490 |
| Wencor Group, Sr. Sec. Credit Facilities 1st Lien Term Loan, 4.50%, 6/25/214,8 | | | 161,017 | | | 148,539 |
| West Corp., Sr. Sec. Credit Facilities 1st Lien Term Loan, Tranche B12, 3.75%, 6/17/234 | | | 992,513 | | | 999,584 |
| Western Digital Corp., Sr. Sec. Credit Facilities 1st Lien Term Loan, Tranche B, 4.50%, 4/29/234 | | | 418,950 | | | 424,318 |
| Western Express, Inc., Sr. Sec. Credit Facilities 2nd Lien Term Loan, 8.924%, 2/23/224 | | | 982,800 | | | 988,009 |
| WideOpenWest Finance LLC, Sr. Sec. Credit Facilities 1st Lien Term Loan, Tranche B, 4.50%, 8/18/234 | | | 695,000 | | | 694,403 |
| WideOpenWest Finance LLC, Sr. Sec. Credit Facilities 1st Lien Term Loan, Tranche B, 4.50%, 8/18/234,8 | | | 110,000 | | | 109,906 |
42 OPPENHEIMER FUNDAMENTAL ALTERNATIVES FUND
| | | | | | |
| | | Principal Amount | | | Value |
Corporate Loans (Continued) | | | | | | |
| William Morris Endeavor Entertainment LLC, Sr. Sec. Credit Facilities 1st Lien Term Loan, Tranche B, 5.25%, 5/6/214 | | $ | 657,613 | | | $ 662,049 |
| Wilton Brands LLC, Sr. Sec. Credit Facilities 1st Lien Term Loan, Tranche B, 8.50%, 8/30/184 | | | 164,111 | | | 142,914 |
| Windstream Services LLC, Sr. Sec. Credit Facilities 1st Lien Term Loan, Tranche B6, 4.75%, 3/29/214 | | | 100,000 | | | 100,484 |
| WMG Acquisition Corp., Sr. Sec. Credit Facilities 1st Lien Term Loan, 3.75%, 11/19/234,8 | | | 180,000 | | | 179,775 |
| WP CPP Holdings LLC, Sr. Sec. Credit Facilities 1st Lien Term Loan, 4.50%, 12/28/194 | | | 234,954 | | | 230,842 |
| XPO Logistics, Inc., Sr. Sec. Credit Facilities 1st Lien Term Loan, Tranche B2, 4.25%, 11/1/214 | | | 488,775 | | | 492,624 |
| Yankee Cable Acquisition LLC, Sr. Sec. Credit Facilities 1st Lien Term Loan, Tranche B, 4.25%, 3/1/204 | | | 426,075 | | | 427,362 |
| YP LLC, Sr. Sec. Credit Facilities 1st Lien Term Loan, Tranche B, 12.25%, 6/4/184 | | | 49,702 | | | 48,708 |
| YRC Worldwide, Inc., Sr. Sec. Credit Facilities 1st Lien Term Loan, 8.00%, 2/13/194 | | | 592,393 | | | 563,514 |
| Zayo Group LLC, Sr. Sec. Credit Facilities 1st Lien Term Loan, Tranche B, 3.75%, 5/6/214 | | | 288,984 | | | 290,700 |
| Zebra Technologies Corp., Sr. Sec. Credit Facilities 1st Lien Term Loan, Tranche B, 4.00%, 10/27/214 | | | 88,807 | | | 90,582 |
| | | | | | |
| Total Corporate Loans (Cost $132,003,667) | | | | | | 131,383,128 |
| | |
| | | Shares | | | |
Structured Security—0.1% | | | | | | |
Africa Telecommunications Media & Technology Fund 1 LLC1,5 (Cost $10,000,000) | | | 9,542,930 | | | 849,321 |
| | | | | | | | | | | | | | | | | | | | | | | | |
| | | | | | Exercise | | | Expiration | | | | | | | | | |
| | | | | | Price | | | Date | | | | | | Contracts | | | |
Exchange-Traded Option Purchased—0.1% | | | | | | | | | | | | | | | | | | | | | | | | |
S&P 500 Index Put1 (Cost $1,229,216) | | | | | | | USD 2,075.000 | | | | 12/16/16 | | | | USD | | | | 400.00 | | | | 1,240,000 | |
| | | | | | |
| | | Counter-
party | | | | | | | | | | | | Contracts | | | |
Over-the-Counter Options Purchased—0.1% | | | | | | | | | | | | | | | | | | | | | | | | |
CNH Currency Put1 | | | RBS | | | | CNH6.677 | | | | 3/15/17 | | | | CNH | | | | 27,000,000 | | | | 116,235 | |
CNH Currency Put1 | | | GSG | | | | CNH6.800 | | | | 4/5/17 | | | | CNH | | | | 578,000,000 | | | | 1,594,124 | |
CNH Currency Put1 | | | BOA | | | | CNH6.693 | | | | 3/6/17 | | | | CNH | | | | 27,000,000 | | | | 105,165 | |
CNH Currency Put1 | | | BOA | | | | CNH6.906 | | | | 1/24/17 | | | | CNH | | | | 28,000,000 | | | | 21,616 | |
CNH Currency Put1 | | | BOA | | | | CNH6.757 | | | | 2/14/17 | | | | CNH | | | | 33,000,000 | | | | 84,381 | |
| | | | | | | | | | | | | | | | | | | | | | | | |
Total Over-the-Counter Options Purchased (Cost $2,699,884) | | | | | | | | 1,921,521 | |
43 OPPENHEIMER FUNDAMENTAL ALTERNATIVES FUND
| | | | |
| CONSOLIDATED STATEMENT OF INVESTMENTS Continued | | |
| | | | | | | | | | | | | | | | | | | | | | | | | | | | | | | | |
| | | | | | Pay/Receive | | | | | | | | | | | | |
| | | Counter- | | | Floating | | | Floating | | | Fixed | | | Expiration | | | Notional Amount | | | |
| | | party | | | Rate | | | Rate | | | Rate | | | Date | | | (000’s) | | | Value |
Over-the-Counter Interest Rate Swaptions Purchased—0.1% | |
Interest Rate Swap maturing 1/24/29 Call1 | | | GSG | | | | Pay | | |
| Six-Month
JPY BBA
LIBOR |
| | | 0.708% | | | | 1/22/19 | | | | JPY | | | | 795,000 | | | $ | 79,331 | |
Interest Rate Swap maturing 11/21/28 Call1 | | | GSG | | | | Pay | | |
| Six-Month
JPY BBA
LIBOR |
| | | 0.850 | | | | 11/19/18 | | | | JPY | | | | 749,000 | | | | 59,495 | |
Interest Rate Swap maturing 11/22/27 Call1 | | | GSG | | | | Pay | | |
| Six-Month
JPY BBA
LIBOR |
| | | 1.070 | | | | 11/20/17 | | | | JPY | | | | 8,024,000 | | | | 223,101 | |
Interest Rate Swap maturing 7/25/28 Call1 | | | GSG | | | | Pay | | |
| Six-Month
JPY BBA
LIBOR |
| | | 1.050 | | | | 7/23/18 | | | | JPY | | | | 2,000,000 | | | | 98,942 | |
Interest Rate Swap maturing 9/6/28 Call1 | | | GOL | | | | Pay | | |
| Three-
Month USD
BBA LIBOR |
| | | 1.610 | | | | 9/4/18 | | | | USD | | | | 17,400 | | | | 868,315 | |
| | | | | | | | | | | | | | | | | | | | | | | | | | | | | | | | |
Total Over-the-Counter Interest Rate Swaptions Purchased (Cost $3,349,958) | | | | | | | | | | | | | | | | | | | | 1,329,184 | |
| | | | | | | | |
| | | Principal Amount | | | |
Short-Term Notes—4.1% | | | | | | | | |
Agrium, Inc., 0.801%, 12/1/1610 | | $ | 3,000,000 | | | | 2,998,000 | |
Air Liquide US LLC, 1.217%, 3/31/1710 | | | 3,000,000 | | | | 2,989,581 | |
American Water Capital Corp., 0.73%, 11/7/1610 | | | 3,000,000 | | | | 2,999,635 | |
Amphenol Corp., 0.75%, 11/21/16 | | | 3,000,000 | | | | 2,998,750 | |
Bank of Tokyo-Mitsubishi UFJ, 1.353%, 7/17/173 | | | 3,000,000 | | | | 2,970,280 | |
Bell Canada, 0.912%, 1/20/1710 | | | 3,000,000 | | | | 2,993,905 | |
Danske Corp., 1.461%, 10/20/1710 | | | 3,000,000 | | | | 2,956,664 | |
Duke Energy Corp., 0.831%, 1/3/1710 | | | 3,000,000 | | | | 2,995,285 | |
Eni Finance USA, Inc., 0.942%, 1/3/178,10 | | | 3,000,000 | | | | 2,995,851 | |
Ford Motor Credit Co. LLC, 1.623%, 9/1/1710 | | | 3,000,000 | | | | 2,960,680 | |
Harley-Davidson Financial Services, Inc., 0.801%, 1/19/1710 | | | 3,000,000 | | | | 2,993,613 | |
Mondelez International, Inc., 0.892%, 1/10/1710 | | | 3,000,000 | | | | 2,994,580 | |
Nissan Motor Acceptance Corp., 0.801%, 1/5/1710 | | | 3,000,000 | | | | 2,995,089 | |
Omnicom Capital, Inc., 0.76%, 11/21/1610 | | | 3,000,000 | | | | 2,998,733 | |
Sempra Energy, 0.851%, 11/22/1610 | | | 3,000,000 | | | | 2,998,513 | |
Toyota Motor Credit Corp., 1.211%, 7/14/17 | | | 3,000,000 | | | | 2,975,531 | |
United Technologies Corp., 0.811%, 12/21/1610 | | | 3,000,000 | | | | 2,996,625 | |
Virginia Electric & Power Co., 0.741%, 12/5/1610 | | | 3,000,000 | | | | 2,997,903 | |
Whirlpool Corp., 0.901%, 12/19/16 | | | 3,000,000 | | | | 2,996,400 | |
| | | | | | | | |
Total Short-Term Notes (Cost $56,802,080) | | | | | | | 56,805,618 | |
44 OPPENHEIMER FUNDAMENTAL ALTERNATIVES FUND
| | | | | | | | |
| | | Shares | | Value |
Investment Companies—13.7% | | | | | | | | |
Oppenheimer Institutional Government Money Market Fund, Cl. E, 0.28%11,12 | | | 149,404,417 | | | $ | 149,404,417 | |
SPDR Gold Trust Exchange Traded Fund1,14 | | | 320,310 | | | | 39,058,601 | |
| | | | | | | | |
Total Investment Companies (Cost $187,578,569) | | | | | | | 188,463,018 | |
| | | | | | | | | |
Total Investments, at Value (Cost $1,293,954,406) | | | 100.2% | | | | 1,375,359,436 | |
Net Other Assets (Liabilities) | | | (0.2) | | | | (3,018,108 | ) |
| | | | |
Net Assets | | | 100.0% | | | $ | 1,372,341,328 | |
| | | | |
Footnotes to Consolidated Statement of Investments
1. Non-income producing security.
2. All or portion of the security position is held in segregated accounts and pledged to cover margin requirements with respect to securities sold short. The aggregate market value of such securities is $134,592,857. See Note 10 of accompanying Consolidated Notes.
3. Represents securities sold under Rule 144A, which are exempt from registration under the Securities Act of 1933, as amended. These securities have been determined to be liquid under guidelines established by the Board of Trustees. These securities amount to $90,963,654 or 6.63% of the Fund’s net assets at period end.
4. Represents the current interest rate for a variable or increasing rate security.
5. Restricted security. The aggregate value of restricted securities at period end was $15,561,881, which represents 1.13% of the Fund’s net assets. See Note 4 of the accompanying Consolidated Notes. Information concerning restricted securities is as follows:
| | | | | | | | | | | | | | | | |
| Security | | Acquisition
Dates | | | Cost | | Value | | | Unrealized
Depreciation |
Africa Telecommunications Media & Technology Fund 1 LLC | | | 4/20/11 | | | $ | 10,000,000 | | | $ | 849,321 | | | $ | 9,150,679 | |
Blade Engine Securitization Ltd., Series 2006-1AW, Cl. A1, 0.835%, 9/15/41 | | | 4/19/13-5/29/13 | | | | 21,159,873 | | | | 14,712,560 | | | | 6,447,313 | |
| | | | | | | | |
| | | | | | $ | 31,159,873 | | | $ | 15,561,881 | | | $ | 15,597,992 | |
| | | | | | | | |
6. This bond has no contractual maturity date, is not redeemable and contractually pays an indefinite stream of interest.
7. This security is not accruing income because the issuer has missed an interest payment on it and/or is not anticipated to make future interest and/or principal payments. The rate shown is the contractual interest rate. See Note 4 of the accompanying Consolidated Notes.
8. All or a portion of the security position is when-issued or delayed delivery to be delivered and settled after period end. See Note 4 of the accompanying Consolidated Notes.
9. Subject to a forbearance agreement. Rate shown is the contractual interest rate. See Note 4 of the accompanying Consolidated Notes.
10. Security issued in an exempt transaction without registration under the Securities Act of 1933. Such securities amount to $44,864,657 or 3.27% of the Fund’s net assets, and have been determined to be liquid pursuant to guidelines adopted by the Board of Trustees.
11. Is or was an affiliate, as defined in the Investment Company Act of 1940, as amended, at or during the reporting period, by virtue of the Fund owning at least 5% of the voting securities of the issuer or as a result of the Fund and the issuer having the same investment adviser. Transactions during the reporting period in which the issuer was an affiliate are as follows:
| | | | | | | | | | | | | | | | |
| | | Shares
October 30,
2015a | | | Gross
Additions | | | Gross
Reductions | | | Shares October 31, 2016 | |
Oppenheimer Institutional Government Money Market Fund, Cl. Eb | | | 138,198,466 | | | | 602,900,682 | | | | 591,694,731 | | | | 149,404,417 | |
45 OPPENHEIMER FUNDAMENTAL ALTERNATIVES FUND
| | | | |
| CONSOLIDATED STATEMENT OF INVESTMENTS Continued | | |
Footnotes to Consolidated Statement of Investments (Continued)
| | | | | | | | | | | | | | | | |
| | | Shares
October 30,
2015 | | | Gross
Additions | | Gross
Reductions | | Shares
October 31,
2016 |
Oppenheimer Master Loan Fund, LLC | | | 1,370,520 | | | | — | | | | 1,370,520 | | | | — | |
| | | | |
| | | | | | Value | | Income | | Realized Loss |
Oppenheimer Institutional Government Money Market Fund, Cl. Eb | | | | | | $ | 149,404,417 | | | $ | 752,074 | | | $ | — | |
Oppenheimer Master Loan Fund, LLC | | | | | | | — | | | | 162,705 | c | | | 5,332,452 | c |
| | | | | | | | |
Total | | | | | | $ | 149,404,417 | | | $ | 914,779 | | | $ | 5,332,452 | |
| | | | | | | | |
a. Represents the last business day of the Fund’s reporting period.
b. Prior to September 28, 2016, this fund was named Oppenheimer Institutional Money Market Fund.
c. Represents the amount allocated to the Fund from Oppenheimer Master Loan Fund, LLC.
12. Rate shown is the 7-day yield at period end.
13. Interest or dividend is paid-in-kind, when applicable.
14. All or a portion of this security is owned by the subsidiary. See Note 2 of the accompanying Consolidated Notes.
| | | | | | | | |
| | | Shares Sold
Short | | | Value |
Securities Sold Short—(30.7)% | | | | | | | | |
Common Stock Securities Sold Short—(27.1)% | | | | | | | | |
AGCO Corp. | | | (264,990 | ) | | $ | (13,535,689 | ) |
Air Lease Corp., Cl. A | | | (497,670 | ) | | | (15,059,494 | ) |
Aircastle Ltd. | | | (232,224 | ) | | | (4,772,203 | ) |
Aker Solutions ASA1 | | | (2,765,821 | ) | | | (12,686,874 | ) |
athenahealth, Inc.1 | | | (45,130 | ) | | | (4,662,832 | ) |
Boeing Co. (The) | | | (127,184 | ) | | | (18,114,817 | ) |
Camden Property Trust | | | (218,990 | ) | | | (17,834,546 | ) |
Caterpillar, Inc. | | | (157,740 | ) | | | (13,164,980 | ) |
CBL & Associates Properties, Inc. | | | (580,920 | ) | | | (6,215,844 | ) |
Charter Communications, Inc., Cl. A1 | | | (83,785 | ) | | | (20,937,034 | ) |
Cheniere Energy, Inc.1 | | | (260,000 | ) | | | (9,802,000 | ) |
Cie Financiere Richemont SA | | | (202,057 | ) | | | (12,988,699 | ) |
CNH Industrial NV | | | (1,443,540 | ) | | | (11,230,741 | ) |
Colgate-Palmolive Co. | | | (153,360 | ) | | | (10,943,770 | ) |
Comcast Corp., Cl. A | | | (121,480 | ) | | | (7,509,894 | ) |
Comerica, Inc. | | | (104,620 | ) | | | (5,449,656 | ) |
Deere & Co. | | | (191,150 | ) | | | (16,878,545 | ) |
Fastenal Co. | | | (199,310 | ) | | | (7,769,104 | ) |
Franklin Resources, Inc. | | | (306,510 | ) | | | (10,317,127 | ) |
Intel Corp. | | | (177,960 | ) | | | (6,205,465 | ) |
Kennametal, Inc. | | | (160,380 | ) | | | (4,540,358 | ) |
Oracle Corp. | | | (430,080 | ) | | | (16,523,674 | ) |
Pennsylvania Real Estate Investment Trust | | | (666,870 | ) | | | (13,010,634 | ) |
Procter & Gamble Co. (The) | | | (129,140 | ) | | | (11,209,352 | ) |
Rio Tinto plc, Sponsored ADR | | | (181,687 | ) | | | (6,331,792 | ) |
RLJ Lodging Trust | | | (706,875 | ) | | | (13,939,575 | ) |
SAP SE, ADR | | | (181,250 | ) | | | (15,921,000 | ) |
46 OPPENHEIMER FUNDAMENTAL ALTERNATIVES FUND
| | | | | | | | |
| | | Shares Sold
Short | | | Value |
Common Stock Securities Sold Short (Continued) | | | | | | | | |
Southern Copper Corp. | | | (528,085 | ) | | $ | (14,992,333 | ) |
Subsea 7 SA1 | | | (1,503,502 | ) | | | (16,813,921 | ) |
Tiffany & Co. | | | (155,065 | ) | | | (11,384,872 | ) |
W.W. Grainger, Inc. | | | (38,985 | ) | | | (8,113,558 | ) |
Walt Disney Co. (The) | | | (58,552 | ) | | | (5,427,185 | ) |
Weingarten Realty Investors | | | (197,883 | ) | | | (7,165,343 | ) |
| | | | | | | | |
Total Common Stock Securities Sold Short (Proceeds $356,726,641) | | | | | | | (371,452,911 | ) |
Investment Company Securities Sold Short—(3.6)% | | | | | | | | |
iShares US Preferred Stock Exchange Traded Fund (Proceeds $49,868,136) | | | (1,265,340 | ) | | | (49,284,993 | ) |
| | | | | | | | |
Total Securities Sold Short (Proceeds $406,594,777) | | | | | | $ | (420,737,904 | ) |
| | | | | | | | |
| | | | | | | | | | | | | | | | | | | | | | | | | | | | |
Forward Currency Exchange Contracts as of October 31, 2016 | |
Counter -party | | Settlement
Month(s) | | | | | | Currency
Purchased
(000’s) | | | Currency Sold (000’s) | | | Unrealized
Appreciation | | Unrealized
Depreciation |
BOA | | | 12/2016 | | | | USD | | | | 17,056 | | | | CAD | | | | 22,460 | | | $ | 304,487 | | | $ | — | |
BOA | | | 12/2016 | | | | USD | | | | 16,812 | | | | CHF | | | | 16,245 | | | | 347,383 | | | | — | |
BOA | | | 12/2016 | | | | USD | | | | 21,081 | | | | THB | | | | 738,000 | | | | 12,272 | | | | — | |
CITNA-B | | | 12/2016 | | | | EUR | | | | 14,210 | | | | USD | | | | 16,024 | | | | — | | | | 389,226 | |
CITNA-B | | | 12/2016 | | | | NOK | | | | 255,290 | | | | USD | | | | 31,445 | | | | — | | | | 544,300 | |
CITNA-B | | | 12/2016 | | | | USD | | | | 26,527 | | | | EUR | | | | 23,535 | | | | 631,599 | | | | — | |
CITNA-B | | | 12/2016 | | | | USD | | | | 11,348 | | | | GBP | | | | 8,590 | | | | 820,686 | | | | — | |
DEU | | | 12/2016 | | | | CHF | | | | 16,245 | | | | USD | | | | 16,824 | | | | — | | | | 358,839 | |
DEU | | | 12/2016 | | | | NOK | | | | 255,290 | | | | USD | | | | 30,883 | | | | 17,925 | | | | — | |
DEU | | | 12/2016 | | | | USD | | | | 16,767 | | | | CHF | | | | 16,245 | | | | 302,509 | | | | — | |
DEU | | | 12/2016 | | | | USD | | | | 31,408 | | | | NOK | | | | 255,290 | | | | 506,704 | | | | — | |
GSCO-OT | | | 04/2017 | | | | USD | | | | 9,183 | | | | CNH | | | | 61,000 | | | | 285,628 | | | | — | |
JPM | | | 12/2016 | | | | USD | | | | 15,789 | | | | AUD | | | | 21,185 | | | | — | | | | 306,196 | |
JPM | | | 12/2016 | | | | USD | | | | 16,870 | | | | JPY | | | | 1,725,000 | | | | 386,332 | | | | — | |
| | | | | | | | | | | | | | | | | | | | | | | | |
Total Unrealized Appreciation and Depreciation | | | | | | | | | | | | | | | $ | 3,615,525 | | | $ | 1,598,561 | |
| | | | | | | | | | | | | | | | | | | | | | | | |
| | | | | | | | | | | | | | | | | | | | | | | | |
Futures Contracts as of October 31, 2016 | | | | | | | | | | | | | | | | | |
| Description | | Exchange | | | Buy/Sell | | | Expiration
Date | | | Number of Contracts | | | Value | | | Unrealized
Appreciation |
Euro-BTP | | | EUX | | | | Sell | | | | 12/8/16 | | | | 81 | | | $ | 12,320,443 | | | $ | 496,756 | |
United States Treasury Nts., 10 yr. | | | CBT | | | | Sell | | | | 12/20/16 | | | | 121 | | | | 15,684,625 | | | | 196,424 | |
| | | | | | | | | | | | | | | | | | | | | | | | |
| | | | | | | | | | | | | | | | | | | | | | $ | 693,180 | |
| | | | | | | | | | | | | | | | | | | | | | | | |
| | | | | | | | | | | | | | | | | | | | | | | | |
| | | | | | | | | | | | | | | | | | | | | | | | |
Over-the-Counter Options Written at October 31, 2016 | | | | | | | | | | | | | | | | | |
| | | | | | Exercise | | | Expiration | | | | | | Premiums | | | |
| Description | | Counterparty | | | Price | | | Date | | | Number of Contracts | | | Received | | | Value |
CNH Currency Put | | | GSG CNH | | | | 7.500 | | | | 4/5/17 | | | | CNH (637,500,000 | ) | | $ | 792,200 | | | $ | (53,550 | ) |
47 OPPENHEIMER FUNDAMENTAL ALTERNATIVES FUND
| | | | |
| CONSOLIDATED STATEMENT OF INVESTMENTS Continued | | |
| | | | | | | | | | | | | | | | | | | | | | | | | | | | |
Centrally Cleared Credit Default Swaps at October 31, 2016 | | | | | | | | | |
| | | | | | | | | | | | | | | Notional | | | | | |
| | | Buy/Sell | | | Fixed | | | Maturity | | | | | | Amount | | | Premiums | | |
| Reference Asset | | Protection | | | Rate | | | Date | | | | | | (000’s) | | | Received/(Paid) | | Value |
CDX.HY.24 | | | Buy | | | | 5.000% | | | | 6/20/20 | | | | USD | | | | 19,012 | | | $ | 1,470,492 | | | $ | (1,327,657 | ) |
CDX.IG.25 | | | Sell | | | | 1.000 | | | | 12/20/20 | | | | USD | | | | 4,110 | | | | (25,878 | ) | | | 58,107 | |
CDX.IG.25 | | | Sell | | | | 1.000 | | | | 12/20/20 | | | | USD | | | | 46,105 | | | | (488,724 | ) | | | 651,831 | |
CDX.IG.25 | | | Sell | | | | 1.000 | | | | 12/20/20 | | | | USD | | | | 1,400 | | | | (7,242 | ) | | | 19,793 | |
iTraxx.Main.24 | | | Buy | | | | 1.000 | | | | 12/20/20 | | | | EUR | | | | 2,750 | | | | 35,224 | | | | (48,448 | ) |
iTraxx.Main.24 | | | Buy | | | | 1.000 | | | | 12/20/20 | | | | EUR | | | | 40,044 | | | | 642,532 | | | | (705,474 | ) |
iTraxx.Main.26 | | | Buy | | | | 1.000 | | | | 12/20/21 | | | | EUR | | | | 4,640 | | | | 75,883 | | | | (72,283 | ) |
Neiman Marcus Group LLC (The) | | | Buy | | | | 5.000 | | | | 12/20/20 | | | | USD | | | | 6,190 | | | | 358,683 | | | | (319,512 | ) |
| | | | | | | | | | | | | | | | | | | | | | | | |
Total of Centrally Cleared Credit Default Swaps | | | | | | | | | | | | | | | $ | 2,060,970 | | | $ | (1,743,643 | ) |
| | | | | | | | | | | | | | | | | | | | | | | | |
| | | | | | | | | | | | | | | | | | | | | | | | | | | | | | | | |
Over-the-Counter Credit Default Swaps at October 31, 2016 | | | | | | | | | |
| | | | | | | | | | | | | | | | | | Notional | | | | | | |
| | | | | | Buy/Sell | | | Fixed | | | Maturity | | | | | | Amount | | | Premiums | | | |
| Reference Asset | | Counterparty | | | Protection | | | Rate | | | Date | | | | | | (000’s) | | | Received/(Paid) | | | Value |
CDX.HY.21 | | | CITNA-B | | | | Buy | | | | 5.000 | | | | 12/20/18 | | | | USD | | | | 1,407 | | | $ | 74,649 | | | $ | (127,516 | ) |
CDX.HY.25 | | | CITNA-B | | | | Buy | | | | 5.000 | | | | 12/20/20 | | | | USD | | | | 936 | | | | (109,330 | ) | | | 11,288 | |
CDX.HY.25 | | | CITNA-B | | | | Buy | | | | 5.000 | | | | 12/20/20 | | | | USD | | | | 471 | | | | (48,278 | ) | | | 5,680 | |
CDX.HY.25 | | | CITNA-B | | | | Sell | | | | 5.000 | | | | 12/20/20 | | | | USD | | | | 293 | | | | 190,563 | | | | (151,269 | ) |
CDX.HY.25 | | | CITNA-B | | | | Sell | | | | 5.000 | | | | 12/20/20 | | | | USD | | | | 148 | | | | 91,564 | | | | (76,119 | ) |
CDX.HY.25 | | | CITNA-B | | | | Sell | | | | 5.000 | | | | 12/20/18 | | | | USD | | | | 470 | | | | 178,894 | | | | (114,785 | ) |
CDX.NA.HY.21 | | | CITNA-B | | | | Buy | | | | 5.000 | | | | 12/20/18 | | | | USD | | | | 7,500 | | | | (230,208 | ) | | | (679,725 | ) |
CDX.NA.HY.21 | | | CITNA-B | | | | Sell | | | | 5.000 | | | | 12/20/18 | | | | USD | | | | 1,920 | | | | 1,071,501 | | | | (468,893 | ) |
CDX.NA.HY.21 | | | GSG | | | | Sell | | | | 5.000 | | | | 12/20/18 | | | | USD | | | | 583 | | | | 318,928 | | | | (142,544 | ) |
CDX.NA.HY.25 | | | GSG | | | | Buy | | | | 5.000 | | | | 12/20/20 | | | | USD | | | | 7,500 | | | | (1,297,917 | ) | | | 90,447 | |
CDX.NA.HY.25 | | | GSG | | | | Sell | | | | 5.000 | | | | 12/20/20 | | | | USD | | | | 2,352 | | | | 1,560,755 | | | | (1,212,088 | ) |
Kingdom of Spain | | | BAC | | | | Buy | | | | 1.000 | | | | 12/20/20 | | | | USD | | | | 1,070 | | | | 2,874 | | | | (17,454 | ) |
Kingdom of Spain | | | BAC | | | | Buy | | | | 1.000 | | | | 12/20/20 | | | | USD | | | | 953 | | | | 6,706 | | | | (15,545 | ) |
Kingdom of Spain | | | BAC | | | | Buy | | | | 1.000 | | | | 6/20/21 | | | | USD | | | | 4,330 | | | | (11,109 | ) | | | (67,228 | ) |
Kingdom of Spain | | | BAC | | | | Buy | | | | 1.000 | | | | 12/20/20 | | | | USD | | | | 2,050 | | | | 4,518 | | | | (33,439 | ) |
Kingdom of Spain | | | BAC | | | | Buy | | | | 1.000 | | | | 12/20/20 | | | | USD | | | | 1,897 | | | | (7,819 | ) | | | (30,944 | ) |
Kingdom of Spain | | | BOA | | | | Buy | | | | 1.000 | | | | 12/20/20 | | | | USD | | | | 28,700 | | | | 151,476 | | | | (468,152 | ) |
Kingdom of Spain Bonds | | | JPM | | | | Buy | | | | 1.000 | | | | 6/20/21 | | | | USD | | | | 3,380 | | | | 10,048 | | | | (52,479 | ) |
Malaysia | | | BAC | | | | Buy | | | | 1.000 | | | | 12/20/20 | | | | USD | | | | 2,900 | | | | (136,197 | ) | | | (3,201 | ) |
Malaysia | | | BAC | | | | Buy | | | | 1.000 | | | | 12/20/20 | | | | USD | | | | 854 | | | | (35,262 | ) | | | (943 | ) |
Malaysia | | | BNP | | | | Buy | | | | 1.000 | | | | 12/20/20 | | | | USD | | | | 1,811 | | | | (51,082 | ) | | | (1,999 | ) |
Malaysia | | | BNP | | | | Buy | | | | 1.000 | | | | 6/20/21 | | | | USD | | | | 3,000 | | | | (85,450 | ) | | | 14,882 | |
Malaysia | | | BNP | | | | Buy | | | | 1.000 | | | | 12/20/20 | | | | USD | | | | 10,000 | | | | (651,135 | ) | | | (11,039 | ) |
Malaysia | | | BNP | | | | Buy | | | | 1.000 | | | | 6/20/21 | | | | USD | | | | 3,820 | | | | (112,656 | ) | | | 18,949 | |
Malaysia | | | BNP | | | | Buy | | | | 1.000 | | | | 12/20/20 | | | | USD | | | | 761 | | | | (26,351 | ) | | | (840 | ) |
Malaysia | | | CITNA-B | | | | Buy | | | | 1.000 | | | | 12/20/20 | | | | USD | | | | 4,295 | | | | (209,624 | ) | | | (4,741 | ) |
Malaysia | | | MOS-A | | | | Buy | | | | 1.000 | | | | 12/20/20 | | | | USD | | | | 10,000 | | | | (502,319 | ) | | | (11,039 | ) |
Portugal Obrigacoes Do Tesouro | | | JPM | | | | Buy | | | | 1.000 | | | | 6/20/21 | | | | USD | | | | 2,240 | | | | (161,439 | ) | | | 150,854 | |
Portuguese Republic | | | BAC | | | | Buy | | | | 1.000 | | | | 12/20/20 | | | | USD | | | | 641 | | | | (24,558 | ) | | | 35,421 | |
Portuguese Republic | | | BAC | | | | Buy | | | | 1.000 | | | | 12/20/20 | | | | USD | | | | 570 | | | | (21,466 | ) | | | 31,498 | |
48 OPPENHEIMER FUNDAMENTAL ALTERNATIVES FUND
| | | | | | | | | | | | | | | | | | | | | | | | | | | | | | | | |
Over-the-Counter Credit Default Swaps (Continued) | | | | | | | | | | | | | | | | | | | | | | | | | |
| | | | | | | | | | | | | | | | | | Notional | | | | | |
| | | | | | Buy/Sell | | | Fixed | | | Maturity | | | | | | Amount | | | Premiums | | |
| Reference Asset | | Counterparty | | | Protection | | | Rate | | | Date | | | | | | (000’s) | | | Received/(Paid) | | Value |
Portuguese Republic | | | BAC | | | | Buy | | | | 1.000% | | | | 12/20/20 | | | | USD | | | | 3,226 | | | $ | (386,319 | ) | | $ | 178,266 | |
Portuguese Republic | | | BAC | | | | Buy | | | | 1.000 | | | | 12/20/20 | | | | USD | | | | 1,360 | | | | (97,694 | ) | | | 75,153 | |
Portuguese Republic | | | GSG | | | | Buy | | | | 1.000 | | | | 12/20/20 | | | | USD | | | | 17,200 | | | | (596,516 | ) | | | 950,459 | |
Portuguese Republic | | | GSG | | | | Buy | | | | 1.000 | | | | 6/20/21 | | | | USD | | | | 2,870 | | | | (236,484 | ) | | | 193,281 | |
Portuguese Republic | | | GSG | | | | Buy | | | | 1.000 | | | | 6/20/21 | | | | USD | | | | 12,000 | | | | (1,352,424 | ) | | | 808,146 | |
Republic of Austria | | | BAC | | | | Buy | | | | 1.000 | | | | 12/20/20 | | | | USD | | | | 767 | | | | 24,849 | | | | (25,380 | ) |
Republic of Austria | | | BAC | | | | Buy | | | | 1.000 | | | | 12/20/20 | | | | USD | | | | 322 | | | | 12,251 | | | | (10,655 | ) |
Republic of Austria | | | BAC | | | | Buy | | | | 1.000 | | | | 12/20/20 | | | | USD | | | | 1,819 | | | | 56,734 | | | | (60,191 | ) |
Republic of Austria | | | BAC | | | | Buy | | | | 1.000 | | | | 12/20/20 | | | | USD | | | | 362 | | | | 13,517 | | | | (11,979 | ) |
Republic of Austria | | | GSG | | | | Buy | | | | 1.000 | | | | 12/20/20 | | | | USD | | | | 9,700 | | | | 356,896 | | | | (320,976 | ) |
Republic of Austria | | | GSG | | | | Buy | | | | 1.000 | | | | 6/20/21 | | | | USD | | | | 1,620 | | | | 57,372 | | | | (57,239 | ) |
Republic of Austria | | | JPM | | | | Buy | | | | 1.000 | | | | 6/20/21 | | | | USD | | | | 1,260 | | | | 44,462 | | | | (44,519 | ) |
Republic of Italy | | | BAC | | | | Buy | | | | 1.000 | | | | 12/20/20 | | | | USD | | | | 1,140 | | | | 1,225 | | | | 13,442 | |
Republic of Italy | | | BAC | | | | Buy | | | | 1.000 | | | | 12/20/20 | | | | USD | | | | 2,273 | | | | (39,705 | ) | | | 26,802 | |
Republic of Italy | | | BAC | | | | Buy | | | | 1.000 | | | | 12/20/20 | | | | USD | | | | 2,457 | | | | (24,305 | ) | | | 28,971 | |
Republic of Italy | | | BAC | | | | Buy | | | | 1.000 | | | | 12/20/20 | | | | USD | | | | 1,282 | | | | (738 | ) | | | 15,116 | |
Republic of Italy | | | BAC | | | | Buy | | | | 1.000 | | | | 6/20/21 | | | | USD | | | | 5,190 | | | | (105,907 | ) | | | 87,884 | |
Republic of Italy | | | GSG | | | | Buy | | | | 1.000 | | | | 12/20/20 | | | | USD | | | | 34,400 | | | | (68,209 | ) | | | 405,620 | |
Republic of Italy | | | JPM | | | | Buy | | | | 1.000 | | | | 6/20/21 | | | | USD | | | | 4,050 | | | | (54,074 | ) | | | 68,580 | |
| | | | | | | | | | | | | | | | | | | | | | | | | | | | |
Total of Over-the-Counter Credit Default Swaps | | | | | | | | | | | | | | | | | | | $ | (2,454,793 | ) | | $ | (1,012,182 | ) |
| | | | | | | | | | | | | | | | | | | | | | | | | | | | |
| | | | | | | | | | | | |
| | | Total Maximum | | | | | | |
| | | Potential Payments for | | | | | Reference | |
| Type of Reference Asset on which | | Selling Credit Protection | | Amount | | | Asset Rating | |
| the Fund Sold Protection | | (Undiscounted) | | Recoverable* | | | Range** | |
Investment Grade Corporate Debt Indexes | | | $51,615,000 | | | | $— | | | | BBB+ | |
Non-Investment Grade Corporate Debt Indexes | | | 5,765,889 | | | | 17,814,000 | | | | B+ | |
| | | | |
Total | | | $57,380,889 | | | | $17,814,000 | | | | | |
| | | | |
*Amounts recoverable includes potential payments from related purchased protection for instances where the Fund is the seller of protection. In addition, the Fund has no recourse provisions under the credit derivatives and holds no collateral which can offset or reduce potential payments under a triggering event.
** The period end reference asset security ratings, as rated by any rating organization, are included in the equivalent Standard & Poor’s rating category. The reference asset rating represents the likelihood of a potential credit event on the reference asset which would result in a related payment by the Fund.
| | | | | | | | | | | | | | | | | | | | | | | | | | | | |
Over-the-Counter Interest Rate Swaps at October 31, 2016 | | | | | | | | | | | | | | | | | | | | | |
| | | Pay/Receive | | | | | | | | | | | | | | | | | | |
| | | Floating | | | Floating | | | Fixed | | | Maturity | | | Notional Amount | | | |
| Counterparty | | Rate | | | Rate | | | Rate | | | Date | | | | | | (000’s) | | | Value |
| | | | | | | Three-Month CNY | | | | | | | | | | | | | | | | | | | | | |
BOA | | | Receive | | | | CNREPOFIX=CFXS | | | | 2.595% | | | | 3/19/21 | | | | CNY | | | | 9,200 | | | $ | (14,882 | ) |
| | | | | | | Three-Month CNY | | | | | | | | | | | | | | | | | | | | | |
BOA | | | Receive | | | | CNREPOFIX=CFXS | | | | 2.660 | | | | 3/12/21 | | | | CNY | | | | 8,500 | | | | (11,393 | ) |
| | | | | | | Three-Month CNY | | | | | | | | | | | | | | | | | | | | | |
BOA | | | Receive | | | | CNREPOFIX=CFXS | | | | 3.055 | | | | 5/17/21 | | | | CNY | | | | 15,000 | | | | 2,225 | |
| | | | | | | Three-Month CNY | | | | | | | | | | | | | | | | | | | | | |
BOA | | | Receive | | | | CNREPOFIX=CFXS | | | | 2.605 | | | | 3/26/21 | | | | CNY | | | | 19,340 | | | | (30,539 | ) |
49 OPPENHEIMER FUNDAMENTAL ALTERNATIVES FUND
| | | | |
| CONSOLIDATED STATEMENT OF INVESTMENTS Continued | | |
| | | | | | | | | | | | | | | | | | | | | | | | | | | | |
Over-the-Counter Interest Rate Swaps (Continued) | | | | | | | | | | | | | | | | | | | | | |
| | | Pay/Receive | | | | | | | | | | | | | | | | | | |
| | | Floating | | | Floating | | | Fixed | | | Maturity | | | Notional Amount | | | |
| Counterparty | | Rate | | | Rate | | | Rate | | | Date | | | | | | (000’s) | | | Value |
| | | | | | | Three-Month CNY | | | | | | | | | | | | | | | | | | | | | |
BOA | | | Receive | | | | CNREPOFIX=CFXS | | | | 2.565% | | | | 2/22/21 | | | | CNY | | | | 11,000 | | | $ | (18,756 | ) |
| | | | | | | Three-Month CNY | | | | | | | | | | | | | | | | | | | | | |
BOA | | | Receive | | | | CNREPOFIX=CFXS | | | | 2.900 | | | | 7/24/20 | | | | CNY | | | | 84,000 | | | | 361 | |
| | | | | | | Three-Month CNY | | | | | | | | | | | | | | | | | | | | | |
BOA | | | Receive | | | | CNREPOFIX=CFXS | | | | 2.730 | | | | 11/6/20 | | | | CNY | | | | 15,000 | | | | (12,933 | ) |
| | | | | | | Three-Month CNY | | | | | | | | | | | | | | | | | | | | | |
BOA | | | Receive | | | | CNREPOFIX=CFXS | | | | 2.450 | | | | 1/25/21 | | | | CNY | | | | 8,250 | | | | (17,265 | ) |
| | | | | | | Three-Month CNY | | | | | | | | | | | | | | | | | | | | | |
GSG | | | Receive | | | | CNREPOFIX=CFXS | | | | 2.830 | | | | 8/14/20 | | | | CNY | | | | 19,000 | | | | (5,989 | ) |
| | | | | | | | | | | | | | | | | | | | | | | | | | | | |
Total of Over-the-Counter Interest Rate Swaps | | | | | | | | | | | | | | | | | | | $ | (109,171 | ) |
| | | | | | | | | | | | | | | | | | | | | | | | | | | | |
| | | | | | | | | | | | | | | | | | | | | | | | | | | | |
Over-the-Counter Total Return Swaps at October 31, 2016 | | | | | | | | | | | | | |
| | | | | | Pay/Receive | | | | | | | | | | | | Notional | | | |
| | | | | | Total | | | | | | Maturity | | | | | | Amount | | | |
| Reference Asset | | Counterparty | | | Return* | | | Floating Rate | | | Date | | | | | | (000’s) | | | Value |
| | | | | | | | | | | One-Month HKD | | | | | | | | | | | | | | | | | |
| | | | | | | | | | | HIBOR HKAB | | | | | | | | | | | | | | | | | |
GSEHOPCN Custom | | | | | | | | | | | minus 25 basis | | | | | | | | | | | | | | | | | |
Basket† | | | GSG | | | | Pay | | | | points | | | | 6/22/17 | | | | HKD | | | | 114,195 | | | $ | (4,202,603 | ) |
* Fund will pay or receive the total return of the reference asset depending on whether the return is positive or negative. For contracts where the Fund has elected to receive the total return of the reference asset if positive, it will be responsible for paying the floating rate and the total return of the reference asset if negative. If the Fund has elected to pay the total return of the reference asset if positive, it will receive the floating rate and the total return of the reference asset if negative.
| | | | | | | | |
Custom baskets of securities: The following are the components and weights of the underlying basket of securities GSEHOPCN† | |
| Description | | Shares | | | % of Basket |
Bank of Communications-HK BR | | | 47.272287 | | | | 27.54 | % |
China Citic Bank | | | 47.798711 | | | | 27.84 | |
China Everbright Bank Co. Ltd. | | | 33.039162 | | | | 19.24 | |
China Merchants Bank Co. Ltd. | | | 13.687244 | | | | 7.97 | |
China Minsheng Banking Corp. Ltd. | | | 29.890824 | | | | 17.41 | |
| | | | |
| | | 171.688228 | | | | 100.00 | % |
| | | | |
| | |
Glossary: | | |
Counterparty Abbreviations | | |
BAC | | Barclays Bank plc |
BNP | | BNP Paribas |
BOA | | Bank of America NA |
CITNA-B | | Citibank NA |
DEU | | Deutsche Bank AG |
GOL | | Goldman Sachs & Co. |
GSCO-OT | | Goldman Sachs Bank USA |
GSG | | Goldman Sachs Group, Inc. (The) |
JPM | | JPMorgan Chase Bank NA |
50 OPPENHEIMER FUNDAMENTAL ALTERNATIVES FUND
| | |
| Counterparty Abbreviations (Continued) |
| MOS-A | | Morgan Stanley |
| RBS | | Royal Bank of Scotland plc (The) |
|
| Currency abbreviations indicate amounts reporting in currencies |
| AUD | | Australian Dollar |
| CAD | | Canadian Dollar |
| CHF | | Swiss Franc |
| CNH | | Offshore Chinese Renminbi |
| CNY | | Chinese Renminbi |
| EUR | | Euro |
| GBP | | British Pound Sterling |
| HKD | | Hong Kong Dollar |
| JPY | | Japanese Yen |
| NOK | | Norwegian Krone |
| THB | | Thailand Baht |
|
| Definitions |
| BBA LIBOR | | British Bankers’ Association London-Interbank Offered Rate |
| BTP | | Italian Treasury Bonds |
| CDX.HY.21 | | Markit CDX High Yield Index |
| CDX.HY.24 | | Markit CDX High Yield Index |
| CDX.HY.25 | | Markit CDX High Yield Index |
| CDX.IG.25 | | Markit CDX Investment Grade Index |
| CDX.NA.HY.21 | | Markit CDX North American High Yield |
| CDX.NA.HY.25 | | Markit CDX North American High Yield |
| CNREPOFIX=CFXS | | Repurchase Fixing Rates |
| HIBOR | | Hong Kong Interbank Offered Rate |
| HKAB | | Hong Kong Association of Banks |
| iTraxx.Main.24 | | Credit Default Swap Trading Index for a Specific Basket of Securities |
| iTraxx.Main.26 | | Credit Default Swap Trading Index for a Specific Basket of Securities |
| S&P | | Standard & Poor’s |
|
| Exchange Abbreviations |
| CBT | | Chicago Board of Trade |
| EUX | | European Stock Exchange |
See accompanying Notes to Consolidated Financial Statements.
51 OPPENHEIMER FUNDAMENTAL ALTERNATIVES FUND
CONSOLIDATED STATEMENT OF
ASSETS AND LIABILITIES October 31, 2016
| | |
|
| Assets | | |
| Investments, at value—see accompanying consolidated statement of investments: | | |
| Unaffiliated companies (cost $1,144,549,989) | | $ 1,225,955,019 |
| Affiliated companies (cost $149,404,417) | | 149,404,417 |
| | 1,375,359,436 |
|
| Cash | | 15,672,848 |
|
| Cash used for collateral on futures | | 594,790 |
|
| Cash used for collateral on OTC derivatives | | 3,470,000 |
|
| Cash used for collateral on centrally cleared swaps | | 3,402,554 |
|
| Deposits with broker for securities sold short | | 363,913,900 |
|
| Deposits with broker for foreign securities sold short (cost $42,531,254) | | 42,901,876 |
|
| Unrealized appreciation on forward currency exchange contracts | | 3,615,525 |
|
| Swaps, at value (premiums paid $4,822,244) | | 3,213,325 |
|
| Centrally cleared swaps, at value(premiums paid $521,844) | | 729,731 |
|
| Receivables and other assets: | | |
| Investments sold (including $2,398,570 sold on a when-issued or delayed delivery basis) | | 10,154,985 |
| Shares of beneficial interest sold | | 4,935,566 |
| Interest and dividends | | 3,080,937 |
| Variation margin receivable | | 23,089 |
| Other | | 217,334 |
| Total assets | | 1,831,285,896 |
|
|
| Liabilities | | |
| Securities sold short, at value (proceeds $406,594,777)—see accompanying consolidated statement of investments | | 420,737,904 |
|
| Unrealized depreciation on forward currency exchange contracts | | 1,598,561 |
|
| Options written, at value (premiums received $792,200) | | 53,550 |
|
| Swaps, at value (net premiums received $2,367,451) | | 8,537,281 |
|
| Centrally cleared swaps, at value (premiums received $2,582,814) | | 2,473,374 |
|
| Payables and other liabilities: | | |
| Investments purchased (including $14,922,511 purchased on a when-issued or delayed delivery basis) | | 16,425,426 |
| Shares of beneficial interest redeemed | | 8,135,042 |
| Dividends on short sales | | 455,839 |
| Trustees’ compensation | | 209,417 |
| Distribution and service plan fees | | 179,451 |
| Shareholder communications | | 25,169 |
| Variation margin payable | | 9,453 |
| Other | | 104,101 |
| | |
| Total liabilities | | 458,944,568 |
|
|
Net Assets | | $ 1,372,341,328 |
| | |
52 OPPENHEIMER FUNDAMENTAL ALTERNATIVES FUND
| | |
|
| Composition of Net Assets | | |
| Par value of shares of beneficial interest | | $ 514,023 |
|
| Additional paid-in capital | | 1,323,219,867 |
|
| Accumulated net investment income | | 6,942,613 |
|
| Accumulated net realized loss on investments and foreign currency transactions | | (21,935,178) |
|
| Net unrealized appreciation on investments and translation of assets and liabilities denominated in foreign currencies | | 63,600,003 |
| | |
| Net Assets | | $ 1,372,341,328 |
| | |
|
|
| Net Asset Value Per Share | | |
| Class A Shares: | | |
| |
| Net asset value and redemption price per share (based on net assets of $675,557,494 and 25,194,076 shares of beneficial interest outstanding) | | $26.81 |
| Maximum offering price per share (net asset value plus sales charge of 5.75% of offering price) | | $28.45 |
|
| |
| Class B Shares: | | |
| |
| Net asset value, redemption price (excludes applicable contingent deferred sales charge) and offering price per share (based on net assets of $7,344,149 and 307,976 shares of beneficial interest outstanding) | | $23.85 |
|
| |
| Class C Shares: | | |
| |
| Net asset value, redemption price (excludes applicable contingent deferred sales charge) and offering price per share (based on net assets of $139,373,676 and 5,843,856 shares of beneficial interest outstanding) | | $23.85 |
|
| |
| Class I Shares: | | |
| |
| Net asset value, redemption price and offering price per share (based on net assets of $130,790,361 and 4,739,282 shares of beneficial interest outstanding) | | $27.60 |
|
| |
| Class R Shares: | | |
| |
| Net asset value, redemption price (excludes applicable contingent deferred sales charge) and offering price per share (based on net assets of $20,567,378 and 800,485 shares of beneficial interest outstanding) | | $25.69 |
|
| |
| Class Y Shares: | | |
| |
| Net asset value, redemption price and offering price per share (based on net assets of $398,708,270 and 14,516,636 shares of beneficial interest outstanding) | | $27.47 |
See accompanying Notes to Consolidated Financial Statements.
53 OPPENHEIMER FUNDAMENTAL ALTERNATIVES FUND
CONSOLIDATED STATEMENT OF
OPERATIONS For the Year Ended October 31, 2016
| | |
|
| Allocation of Income and Expenses from Master Funds1 | | |
| Net investment income allocated from Oppenheimer Master Loan Fund, LLC: | | |
| Interest | | $ 162,456 |
| Dividends | | 249 |
| Net expenses | | (10,367) |
| | |
| Net investment income allocated from Oppenheimer Master Loan Fund, LLC | | 152,338 |
|
|
| Investment Income | | |
| Interest | | 19,131,326 |
|
| Dividends: | | |
| Unaffiliated companies (net of foreign withholding taxes of $230,078) | | 16,509,028 |
| Affiliated companies | | 752,074 |
| | |
| Total investment income | | 36,392,428 |
|
|
| Expenses | | |
| Management fees | | 10,518,057 |
|
| Distribution and service plan fees: | | |
| Class A | | 1,644,367 |
| Class B | | 101,206 |
| Class C | | 1,357,325 |
| Class R | | 92,044 |
|
| Transfer and shareholder servicing agent fees: | | |
| Class A | | 1,494,496 |
| Class B | | 22,401 |
| Class C | | 299,896 |
| Class I | | 28,919 |
| Class R | | 40,806 |
| Class Y | | 608,879 |
|
| Shareholder communications: | | |
| Class A | | 35,474 |
| Class B | | 2,627 |
| Class C | | 11,391 |
| Class I | | 1,195 |
| Class R | | 1,440 |
| Class Y | | 15,137 |
|
| Dividends on short sales | | 7,357,906 |
|
| Financing expense from short sales | | 1,052,763 |
|
| Trustees’ compensation | | 34,639 |
|
| Borrowing fees | | 18,833 |
|
| Custodian fees and expenses | | 9,873 |
|
| Other | | 300,691 |
| | |
| Total expenses | | 25,050,365 |
| Less reduction to custodian expenses | | (100) |
| Less waivers and reimbursements of expenses | | (481,829) |
| | |
| Net expenses | | 24,568,436 |
|
|
| Net Investment Income | | 11,976,330 |
54 OPPENHEIMER FUNDAMENTAL ALTERNATIVES FUND
| | |
|
| Realized and Unrealized Gain (Loss) | | |
| Net realized loss on: | | |
| Investments from unaffiliated companies (includes premiums on options exercised) | | $ (2,502,830) |
| Closing and expiration of futures contracts | | (1,497,246) |
| Foreign currency transactions | | (3,296,973) |
| Short positions | | (3,489,600) |
| Swap contracts | | (7,425,088) |
|
| Net realized loss allocated from Oppenheimer Master Loan Fund, LLC | | (5,332,452) |
| | |
| Net realized loss | | (23,544,189) |
|
| Net change in unrealized appreciation/depreciation on: | | |
| Investments | | 22,102,690 |
| Translation of assets and liabilities denominated in foreign currencies | | 3,120,308 |
| Futures contracts | | 958,614 |
| Option contracts written | | 738,650 |
| Short positions | | (12,140,221) |
| Swap contracts | | (5,315,392) |
|
| Net change in unrealized appreciation/depreciation allocated from Oppenheimer Master Loan Fund, LLC | | 4,690,587 |
| | |
| Net change in unrealized appreciation/depreciation | | 14,155,236 |
|
| Net Increase in Net Assets Resulting from Operations | | $ 2,587,377 |
| | |
1. The Fund invests in a certain affiliated mutual fund that expects to be treated as a partnership for tax purposes. See Note 4 of the accompanying Consolidated Notes.
See accompanying Notes to Consolidated Financial Statements.
55 OPPENHEIMER FUNDAMENTAL ALTERNATIVES FUND
CONSOLIDATED STATEMENTS OF CHANGES IN NET ASSETS
| | | | | | | | |
| | | Year Ended October 31, 2016 | | | Year Ended
October 30, 20151 | |
| |
| Operations | | | | | | | | |
| Net investment income | | $ | 11,976,330 | | | $ | 8,416,093 | |
| |
| Net realized gain (loss) | | | (23,544,189) | | | | 37,862,034 | |
| |
| Net change in unrealized appreciation/depreciation | | | 14,155,236 | | | | (21,447,350) | |
| | | | |
| Net increase in net assets resulting from operations | | | 2,587,377 | | | | 24,830,777 | |
|
| |
| Dividends and/or Distributions to Shareholders | | | | | | | | |
| Dividends from net investment income: | | | | | | | | |
| Class A | | | (3,490,406) | | | | (11,377,733) | |
| Class B | | | (41,676) | | | | (264,034) | |
| Class C | | | (422,888) | | | | (1,406,772) | |
| Class I | | | (587,576) | | | | (245) | |
| Class R | | | (58,448) | | | | (264,122) | |
| Class Y | | | (1,050,986) | | | | (395,622) | |
| | | | |
| | | (5,651,980) | | | | (13,708,528) | |
|
| |
| Beneficial Interest Transactions | | | | | | | | |
| Net increase (decrease) in net assets resulting from beneficial interest transactions: | | | | | | | | |
| Class A | | | 36,883,516 | | | | (8,609,111) | |
| Class B | | | (6,679,262) | | | | (11,336,193) | |
| Class C | | | 23,668,449 | | | | 5,538,324 | |
| Class I | | | 71,247,215 | | | | 58,913,333 | |
| Class R | | | 3,542,247 | | | | (381,009) | |
| Class Y | | | 309,116,440 | | | | 67,220,726 | |
| | | | |
| | | 437,778,605 | | | | 111,346,070 | |
|
| |
| Net Assets | | | | | | | | |
| Total increase | | | 434,714,002 | | | | 122,468,319 | |
| |
| Beginning of period | | | 937,627,326 | | | | 815,159,007 | |
| | | | |
| End of period (including accumulated net investment income of $6,942,613 and $4,080,475, respectively) | | $ | 1,372,341,328 | | | $ | 937,627,326 | |
| | | | |
1. Represents the last business day of the Fund’s reporting period.
See accompanying Notes to Consolidated Financial Statements.
56 OPPENHEIMER FUNDAMENTAL ALTERNATIVES FUND
CONSOLIDATED FINANCIAL HIGHLIGHTS
| | | | | | | | | | | | | | | | | | |
| Class A | | Year Ended
October 31,
2016 | | | Year Ended
October 30,
20151 | | | Year Ended
October 31,
2014 | | | Year Ended
October 31,
2013 | | | Year Ended
October 31,
2012 |
|
| Per Share Operating Data | | | | | | | | | | | | | | | | | | |
| Net asset value, beginning of period | | | $27.00 | | | | $26.64 | | | | $24.48 | | | | $23.35 | | | $25.55 |
|
| Income (loss) from investment operations: | | | | | | | | | | | | | | | | | | |
| Net investment income2 | | | 0.27 | | | | 0.30 | | | | 0.29 | | | | 0.30 | | | 0.04 |
| Net realized and unrealized gain (loss) | | | (0.32) | | | | 0.53 | | | | 1.87 | | | | 0.83 | | | (0.10) |
| | | |
| Total from investment operations | | | (0.05) | | | | 0.83 | | | | 2.16 | | | | 1.13 | | | (0.06) |
|
| Dividends and/or distributions to shareholders: | | | | | | | | | | | | | | | | | | |
| Dividends from net investment income | | | (0.14) | | | | (0.47) | | | | 0.00 | | | | 0.00 | | | 0.00 |
| Distributions from net realized gain | | | 0.00 | | | | 0.00 | | | | 0.00 | | | | 0.00 | | | (2.13) |
| Tax return of capital distribution | | | 0.00 | | | | 0.00 | | | | 0.00 | | | | 0.00 | | | (0.01) |
| | | |
| Total dividends and/or distributions to shareholders | | | (0.14) | | | | (0.47) | | | | 0.00 | | | | 0.00 | | | (2.14) |
|
| Net asset value, end of period | | | $26.81 | | | | $27.00 | | | | $26.64 | | | | $24.48 | | | $23.35 |
| | | |
|
|
| Total Return, at Net Asset Value3 | | | (0.18)% | | | | 3.18% | | | | 8.82% | | | | 4.84% | | | 0.03% |
|
|
| Ratios/Supplemental Data | | | | | | | | | | | | | | | | | | |
| Net assets, end of period (in thousands) | | | $675,558 | | | | $642,670 | | | | $642,789 | | | | $668,235 | | | $774,007 |
|
| Average net assets (in thousands) | | | $679,471 | | | | $636,510 | | | | $662,351 | | | | $721,521 | | | $870,856 |
|
| Ratios to average net assets:4,5 | | | | | | | | | | | | | | | | | | |
| Net investment income | | | 1.02% | | | | 1.14% | | | | 1.12% | | | | 1.25% | | | 0.19% |
| Expenses excluding interest and fees from borrowings | | | 2.03%6 | | | | 2.17%6 | | | | 2.39% | | | | 2.04% | | | 1.85% |
| Interest and fees from borrowings | | | 0.00%7 | | | | 0.00%7 | | | | 0.00% | | | | 0.00% | | | 0.00% |
| | | |
| Total expenses8 | | | 2.03%6 | | | | 2.17%6 | | | | 2.39% | | | | 2.04% | | | 1.85% |
| Expenses after payments, waivers and/or reimbursements and reduction to custodian expenses | | | 1.99%6 | | | | 2.12%6 | | | | 2.25% | | | | 1.97% | | | 1.78% |
|
| Portfolio turnover rate | | | 131% | | | | 62% | | | | 44% | | | | 76% | | | 212% |
57 OPPENHEIMER FUNDAMENTAL ALTERNATIVES FUND
CONSOLIDATED FINANCIAL HIGHLIGHTS Continued
1. Represents the last business day of the Fund’s reporting period.
2. Per share amounts calculated based on the average shares outstanding during the period.
3. Assumes an initial investment on the business day before the first day of the fiscal period, with all dividends and distributions reinvested in additional shares on the reinvestment date, and redemption at the net asset value calculated on the last business day of the fiscal period. Sales charges are not reflected in the total returns. Total returns are not annualized for periods less than one full year. Returns do not reflect the deduction of taxes that a shareholder would pay on fund distributions or the redemption of fund shares.
4. Annualized for periods less than one full year.
5. Includes the Fund’s share of the allocated expenses and/or net investment income from the master funds.
6. Includes dividend and borrowing expense on securities sold short, respectively.
| | | | | | | | |
| | | Dividend Expense | | | Borrowing Expense | |
| |
Year Ended October 31, 2016 | | | 0.59% | | | | 0.09% | |
Year Ended October 30, 2015 | | | 0.60% | | | | 0.18% | |
7. Less than 0.005%.
8. Total expenses including indirect expenses from affiliated fund fees and expenses were as follows:
| | | | |
Year Ended October 31, 2016 | | | 2.05 | % |
Year Ended October 30, 2015 | | | 2.18 | % |
Year Ended October 31, 2014 | | | 2.40 | % |
Year Ended October 31, 2013 | | | 2.06 | % |
Year Ended October 31, 2012 | | | 1.90 | % |
See accompanying Notes to Consolidated Financial Statements.
58 OPPENHEIMER FUNDAMENTAL ALTERNATIVES FUND
| | | | | | | | | | | | | | | | | | |
| Class B | | Year Ended
October 31, 2016 | | | Year Ended
October 30, 20151 | | | Year Ended
October 31, 2014 | | | Year Ended
October 31,
2013 | | | Year Ended
October 31,
2012 |
|
| Per Share Operating Data | | | | | | | | | | | | | | | | | | |
Net asset value, beginning of period | | | $24.15 | | | | $23.84 | | | | $22.08 | | | | $21.25 | | | $23.63 |
|
Income (loss) from investment operations: | | | | | | | | | | | | | | | | | | |
Net investment income (loss)2 | | | 0.08 | | | | 0.15 | | | | 0.08 | | | | 0.08 | | | (0.15) |
Net realized and unrealized gain (loss) | | | (0.30) | | | | 0.42 | | | | 1.68 | | | | 0.75 | | | (0.09) |
| | | |
Total from investment operations | | | (0.22) | | | | 0.57 | | | | 1.76 | | | | 0.83 | | | (0.24) |
|
Dividends and/or distributions to shareholders: | | | | | | | | | | | | | | | | | | |
Dividends from net investment income | | | (0.08) | | | | (0.26) | | | | 0.00 | | | | 0.00 | | | 0.00 |
Distributions from net realized gain | | | 0.00 | | | | 0.00 | | | | 0.00 | | | | 0.00 | | | (2.13) |
Tax return of capital distribution | | | 0.00 | | | | 0.00 | | | | 0.00 | | | | 0.00 | | | (0.01) |
| | | |
Total dividends and/or distributions to shareholders | | | (0.08) | | | | (0.26) | | | | 0.00 | | | | 0.00 | | | (2.14) |
|
Net asset value, end of period | | | $23.85 | | | | $24.15 | | | | $23.84 | | | | $22.08 | | | $21.25 |
| | | |
|
|
| Total Return, at Net Asset Value3 | | | (0.92)% | | | | 2.40% | | | | 7.97% | | | | 3.91% | | | (0.79)% |
|
|
| Ratios/Supplemental Data | | | | | | | | | | | | | | | | | | |
Net assets, end of period (in thousands) | | | $7,344 | | | | $14,201 | | | | $25,296 | | | | $34,346 | | | $46,780 |
|
Average net assets (in thousands) | | | $10,159 | | | | $19,249 | | | | $30,329 | | | | $40,057 | | | $56,004 |
|
Ratios to average net assets:4,5 | | | | | | | | | | | | | | | | | | |
Net investment income (loss) | | | 0.34% | | | | 0.61% | | | | 0.34% | | | | 0.35% | | | (0.70)% |
Expenses excluding interest and fees from borrowings | | | 2.78%6 | | | | 2.94%6 | | | | 3.26% | | | | 3.06% | | | 2.85% |
Interest and fees from borrowings | | | 0.00%7 | | | | 0.00%7 | | | | 0.00% | | | | 0.00% | | | 0.00% |
| | | |
Total expenses8 | | | 2.78%6 | | | | 2.94%6 | | | | 3.26% | | | | 3.06% | | | 2.85% |
| Expenses after payments, waivers and/or reimbursements and reduction to custodian expenses | | | 2.74%6 | | | | 2.89%6 | | | | 3.06% | | | | 2.86% | | | 2.67% |
|
Portfolio turnover rate | | | 131% | | | | 62% | | | | 44% | | | | 76% | | | 212% |
59 OPPENHEIMER FUNDAMENTAL ALTERNATIVES FUND
CONSOLIDATED FINANCIAL HIGHLIGHTS Continued
1. Represents the last business day of the Fund’s reporting period.
2. Per share amounts calculated based on the average shares outstanding during the period.
3. Assumes an initial investment on the business day before the first day of the fiscal period, with all dividends and distributions reinvested in additional shares on the reinvestment date, and redemption at the net asset value calculated on the last business day of the fiscal period. Sales charges are not reflected in the total returns. Total returns are not annualized for periods less than one full year. Returns do not reflect the deduction of taxes that a shareholder would pay on fund distributions or the redemption of fund shares.
4. Annualized for periods less than one full year.
5. Includes the Fund’s share of the allocated expenses and/or net investment income from the master funds.
6. Includes dividend and borrowing expense on securities sold short, respectively.
| | | | | | | | |
| | | Dividend Expense | | | Borrowing Expense | |
| |
Year Ended October 31, 2016 | | | 0.59% | | | | 0.09% | |
Year Ended October 30, 2015 | | | 0.60% | | | | 0.18% | |
7. Less than 0.005%.
8. Total expenses including indirect expenses from affiliated fund fees and expenses were as follows:
| | | | |
Year Ended October 31, 2016 | | | 2.80 | % |
Year Ended October 30, 2015 | | | 2.95 | % |
Year Ended October 31, 2014 | | | 3.27 | % |
Year Ended October 31, 2013 | | | 3.08 | % |
Year Ended October 31, 2012 | | | 2.90 | % |
See accompanying Notes to Consolidated Financial Statements.
60 OPPENHEIMER FUNDAMENTAL ALTERNATIVES FUND
| | | | | | | | | | | | | | | | | | |
| Class C | | Year Ended
October 31,
2016 | | | Year Ended
October 30,
20151 | | | Year Ended
October 31,
2014 | | | Year Ended
October 31,
2013 | | | Year Ended
October 31,
2012 |
|
| Per Share Operating Data | | | | | | | | | | | | | | | | | | |
| Net asset value, beginning of period | | | $24.15 | | | | $23.89 | | | | $22.12 | | | | $21.26 | | | $23.62 |
|
| Income (loss) from investment operations: | | | | | | | | | | | | | | | | | | |
| Net investment income (loss)2 | | | 0.06 | | | | 0.09 | | | | 0.08 | | | | 0.10 | | | (0.12) |
| Net realized and unrealized gain (loss) | | | (0.28) | | | | 0.47 | | | | 1.69 | | | | 0.76 | | | (0.10) |
| | | |
| Total from investment operations | | | (0.22) | | | | 0.56 | | | | 1.77 | | | | 0.86 | | | (0.22) |
|
| Dividends and/or distributions to shareholders: | | | | | | | | | | | | | | | | | | |
| Dividends from net investment income | | | (0.08) | | | | (0.30) | | | | 0.00 | | | | 0.00 | | | 0.00 |
| Distributions from net realized gain | | | 0.00 | | | | 0.00 | | | | 0.00 | | | | 0.00 | | | (2.13) |
| Tax return of capital distribution | | | 0.00 | | | | 0.00 | | | | 0.00 | | | | 0.00 | | | (0.01) |
| | | |
| Total dividends and/or distributions to shareholders | | | (0.08) | | | | (0.30) | | | | 0.00 | | | | 0.00 | | | (2.14) |
|
| Net asset value, end of period | | | $23.85 | | | | $24.15 | | | | $23.89 | | | | $22.12 | | | $21.26 |
| | | |
|
|
| Total Return, at Net Asset Value3 | | | (0.91)% | | | | 2.39% | | | | 8.00% | | | | 4.05% | | | (0.71)% |
|
|
| Ratios/Supplemental Data | | | | | | | | | | | | | | | | | | |
| Net assets, end of period (in thousands) | | | $139,374 | | | | $117,152 | | | | $110,383 | | | | $112,993 | | | $135,750 |
|
| Average net assets (in thousands) | | | $136,400 | | | | $111,050 | | | | $112,984 | | | | $122,514 | | | $160,258 |
|
| Ratios to average net assets:4,5 | | | | | | | | | | | | | | | | | | |
| Net investment income (loss) | | | 0.25% | | | | 0.38% | | | | 0.36% | | | | 0.48% | | | (0.59)% |
| Expenses excluding interest and fees from borrowings | | | 2.79%6 | | | | 2.92%6 | | | | 3.16% | | | | 2.81% | | | 2.62% |
| Interest and fees from borrowings | | | 0.00%7 | | | | 0.00%7 | | | | 0.00% | | | | 0.00% | | | 0.00% |
| | | |
| Total expenses8 | | | 2.79%6 | | | | 2.92%6 | | | | 3.16% | | | | 2.81% | | | 2.62% |
| Expenses after payments, waivers and/or reimbursements and reduction to custodian expenses | | | 2.75%6 | | | | 2.87%6 | | | | 3.02% | | | | 2.74% | | | 2.55% |
|
| Portfolio turnover rate | | | 131% | | | | 62% | | | | 44% | | | | 76% | | | 212% |
61 OPPENHEIMER FUNDAMENTAL ALTERNATIVES FUND
CONSOLIDATED FINANCIAL HIGHLIGHTS Continued
1. Represents the last business day of the Fund’s reporting period.
2. Per share amounts calculated based on the average shares outstanding during the period.
3. Assumes an initial investment on the business day before the first day of the fiscal period, with all dividends and distributions reinvested in additional shares on the reinvestment date, and redemption at the net asset value calculated on the last business day of the fiscal period. Sales charges are not reflected in the total returns. Total returns are not annualized for periods less than one full year. Returns do not reflect the deduction of taxes that a shareholder would pay on fund distributions or the redemption of fund shares.
4. Annualized for periods less than one full year.
5. Includes the Fund’s share of the allocated expenses and/or net investment income from the master funds.
6. Includes dividend and borrowing expense on securities sold short, respectively.
| | | | | | | | |
| | | Dividend Expense | | | Borrowing Expense | |
| |
Year Ended October 31, 2016 | | | 0.59% | | | | 0.09% | |
Year Ended October 30, 2015 | | | 0.60% | | | | 0.18% | |
7. Less than 0.005%.
8. Total expenses including indirect expenses from affiliated fund fees and expenses were as follows:
| | | | |
Year Ended October 31, 2016 | | | 2.81 | % |
Year Ended October 30, 2015 | | | 2.93 | % |
Year Ended October 31, 2014 | | | 3.17 | % |
Year Ended October 31, 2013 | | | 2.83 | % |
Year Ended October 31, 2012 | | | 2.67 | % |
See accompanying Notes to Consolidated Financial Statements.
62 OPPENHEIMER FUNDAMENTAL ALTERNATIVES FUND
| | | | | | | | | | | | | | | | |
| Class I | | Year Ended
October 31,
2016 | | | Year Ended
October 30,
20151 | | | Year Ended
October 31,
2014 | | | Period Ended
October 31,
20132 | |
| |
| Per Share Operating Data | | | | | | | | | | | | | | | | |
| Net asset value, beginning of period | | | $27.79 | | | | $27.41 | | | | $25.09 | | | | $24.32 | |
| |
| Income (loss) from investment operations: | | | | | | | | | | | | | | | | |
| Net investment income3 | | | 0.37 | | | | 0.28 | | | | 0.42 | | | | 0.34 | |
| Net realized and unrealized gain (loss) | | | (0.29) | | | | 0.69 | | | | 1.90 | | | | 0.43 | |
| | | | |
| Total from investment operations | | | 0.08 | | | | 0.97 | | | | 2.32 | | | | 0.77 | |
| |
| Dividends and/or distributions to shareholders: | | | | | | | | | | | | | | | | |
| Dividends from net investment income | | | (0.27) | | | | (0.59) | | | | 0.00 | | | | 0.00 | |
| Distributions from net realized gain | | | 0.00 | | | | 0.00 | | | | 0.00 | | | | 0.00 | |
| Tax return of capital distribution | | | 0.00 | | | | 0.00 | | | | 0.00 | | | | 0.00 | |
| | | | |
| Total dividends and/or distributions to shareholders | | | (0.27) | | | | (0.59) | | | | 0.00 | | | | 0.00 | |
| |
| Net asset value, end of period | | | $27.60 | | | | $27.79 | | | | $27.41 | | | | $25.09 | |
| | | | |
|
| |
| Total Return, at Net Asset Value4 | | | 0.29% | | | | 3.62% | | | | 9.25% | | | | 3.17% | |
|
| |
| Ratios/Supplemental Data | | | | | | | | | | | | | | | | |
| Net assets, end of period (in thousands) | | | $130,790 | | | | $59,214 | | | | $11 | | | | $10 | |
| |
| Average net assets (in thousands) | | | $96,611 | | | | $8,550 | | | | $11 | | | | $10 | |
| |
| Ratios to average net assets:5,6 | | | | | | | | | | | | | | | | |
| Net investment income | | | 1.35% | | | | 1.06% | | | | 1.57% | | | | 2.07% | |
| Expenses excluding interest and fees from borrowings | | | 1.65%7 | | | | 1.60%7 | | | | 1.92% | | | | 1.86% | |
| Interest and fees from borrowings | | | 0.00%8 | | | | 0.00%8 | | | | 0.00% | | | | 0.00% | |
| | | | |
| Total expenses9 | | | 1.65%7 | | | | 1.60%7 | | | | 1.92% | | | | 1.86% | |
| Expenses after payments, waivers and/or reimbursements and reduction to custodian expenses | | | 1.61%7 | | | | 1.55%7 | | | | 1.79% | | | | 1.79% | |
| |
| Portfolio turnover rate | | | 131% | | | | 62% | | | | 44% | | | | 76% | |
63 OPPENHEIMER FUNDAMENTAL ALTERNATIVES FUND
CONSOLIDATED FINANCIAL HIGHLIGHTS Continued
1. Represents the last business day of the Fund’s reporting period.
2. For the period from February 28, 2013 (inception of offering) to October 31, 2013.
3. Per share amounts calculated based on the average shares outstanding during the period.
4. Assumes an initial investment on the business day before the first day of the fiscal period, with all dividends and distributions reinvested in additional shares on the reinvestment date, and redemption at the net asset value calculated on the last business day of the fiscal period. Sales charges are not reflected in the total returns. Total returns are not annualized for periods less than one full year. Returns do not reflect the deduction of taxes that a shareholder would pay on fund distributions or the redemption of fund shares.
5. Annualized for periods less than one full year.
6. Includes the Fund’s share of the allocated expenses and/or net investment income from the master funds.
7. Includes dividend and borrowing expense on securities sold short, respectively.
| | | | | | | | |
| | | Dividend Expense | | | Borrowing Expense | |
| |
Year Ended October 31, 2016 | | | 0.59% | | | | 0.09% | |
Year Ended October 30, 2015 | | | 0.60% | | | | 0.18% | |
8. Less than 0.005%.
9. Total expenses including indirect expenses from affiliated fund fees and expenses were as follows:
| | | | |
Year Ended October 31, 2016 | | | 1.67 | % |
Year Ended October 30, 2015 | | | 1.61 | % |
Year Ended October 31, 2014 | | | 1.93 | % |
Period Ended October 31, 2013 | | | 1.88 | % |
See accompanying Notes to Consolidated Financial Statements.
64 OPPENHEIMER FUNDAMENTAL ALTERNATIVES FUND
| | | | | | | | | | | | | | | | | | |
| Class R | | Year Ended
October 31,
2016 | | | Year Ended
October 30,
20151 | | | Year Ended
October 31,
2014 | | | Year Ended
October 31,
2013 | | | Year Ended
October 31,
2012 |
|
| Per Share Operating Data | | | | | | | | | | | | | | | | | | |
| Net asset value, beginning of period | | | $25.89 | | | | $25.55 | | | | $23.54 | | | | $22.53 | | | $24.80 |
|
| Income (loss) from investment operations: | | | | | | | | | | | | | | | | | | |
| Net investment income (loss)2 | | | 0.19 | | | | 0.22 | | | | 0.21 | | | | 0.21 | | | (0.03) |
| Net realized and unrealized gain (loss) | | | (0.30) | | | | 0.52 | | | | 1.80 | | | | 0.80 | | | (0.10) |
| | | |
| Total from investment operations | | | (0.11) | | | | 0.74 | | | | 2.01 | | | | 1.01 | | | (0.13) |
|
| Dividends and/or distributions to shareholders: | | | | | | | | | | | | | | | | | | |
| Dividends from net investment income | | | (0.09) | | | | (0.40) | | | | 0.00 | | | | 0.00 | | | 0.00 |
| Distributions from net realized gain | | | 0.00 | | | | 0.00 | | | | 0.00 | | | | 0.00 | | | (2.13) |
| Tax return of capital distribution | | | 0.00 | | | | 0.00 | | | | 0.00 | | | | 0.00 | | | (0.01) |
| | | |
| Total dividends and/or distributions to shareholders | | | (0.09) | | | | (0.40) | | | | 0.00 | | | | 0.00 | | | (2.14) |
|
| Net asset value, end of period | | | $25.69 | | | | $25.89 | | | | $25.55 | | | | $23.54 | | | $22.53 |
| | | |
|
|
| Total Return, at Net Asset Value3 | | | (0.44)% | | | | 2.92% | | | | 8.54% | | | | 4.48% | | | (0.27)% |
|
|
| Ratios/Supplemental Data | | | | | | | | | | | | | | | | | | |
| Net assets, end of period (in thousands) | | | $20,567 | | | | $17,141 | | | | $17,302 | | | | $20,410 | | | $27,181 |
|
| Average net assets (in thousands) | | | $18,565 | | | | $16,942 | | | | $19,224 | | | | $23,822 | | | $33,095 |
|
| Ratios to average net assets:4,5 | | | | | | | | | | | | | | | | | | |
| Net investment income (loss) | | | 0.75% | | | | 0.85% | | | | 0.85% | | | | 0.92% | | | (0.14)% |
| Expenses excluding interest and fees from borrowings | | | 2.30%6 | | | | 2.42%6 | | | | 2.69% | | | | 2.36% | | | 2.18% |
| Interest and fees from borrowings | | | 0.00%7 | | | | 0.00%7 | | | | 0.00% | | | | 0.00% | | | 0.00% |
| | | |
| Total expenses8 | | | 2.30%6 | | | | 2.42%6 | | | | 2.69% | | | | 2.36% | | | 2.18% |
| Expenses after payments, waivers and/or reimbursements and reduction to custodian expenses | | | 2.26%6 | | | | 2.37%6 | | | | 2.54% | | | | 2.29% | | | 2.11% |
|
| Portfolio turnover rate | | | 131% | | | | 62% | | | | 44% | | | | 76% | | | 212% |
65 OPPENHEIMER FUNDAMENTAL ALTERNATIVES FUND
CONSOLIDATED FINANCIAL HIGHLIGHTS Continued
1. Represents the last business day of the Fund’s reporting period.
2. Per share amounts calculated based on the average shares outstanding during the period.
3. Assumes an initial investment on the business day before the first day of the fiscal period, with all dividends and distributions reinvested in additional shares on the reinvestment date, and redemption at the net asset value calculated on the last business day of the fiscal period. Sales charges are not reflected in the total returns. Total returns are not annualized for periods less than one full year. Returns do not reflect the deduction of taxes that a shareholder would pay on fund distributions or the redemption of fund shares.
4. Annualized for periods less than one full year.
5. Includes the Fund’s share of the allocated expenses and/or net investment income from the master funds.
6. Includes dividend and borrowing expense on securities sold short, respectively.
| | | | | | | | |
| | | Dividend Expense | | | Borrowing Expense | |
| |
Year Ended October 31, 2016 | | | 0.59% | | | | 0.09% | |
Year Ended October 30, 2015 | | | 0.60% | | | | 0.18% | |
7. Less than 0.005%.
8. Total expenses including indirect expenses from affiliated fund fees and expenses were as follows:
| | | | |
Year Ended October 31, 2016 | | | 2.32 | % |
Year Ended October 30, 2015 | | | 2.43 | % |
Year Ended October 31, 2014 | | | 2.70 | % |
Year Ended October 31, 2013 | | | 2.38 | % |
Year Ended October 31, 2012 | | | 2.23 | % |
See accompanying Notes to Consolidated Financial Statements.
66 OPPENHEIMER FUNDAMENTAL ALTERNATIVES FUND
| | | | | | | | | | | | | | | | | | |
| Class Y | | Year Ended
October 31,
2016 | | | Year Ended
October 30,
20151 | | | Year Ended
October 31,
2014 | | | Year Ended
October 31,
2013 | | | Year Ended
October 31,
2012 |
|
| Per Share Operating Data | | | | | | | | | | | | | | | | | | |
| Net asset value, beginning of period | | | $27.68 | | | | $27.32 | | | | $25.05 | | | | $23.84 | | | $25.97 |
|
| Income (loss) from investment operations: | | | | | | | | | | | | | | | | | | |
| Net investment income2 | | | 0.32 | | | | 0.31 | | | | 0.34 | | | | 0.38 | | | 0.10 |
| Net realized and unrealized gain (loss) | | | (0.29) | | | | 0.60 | | | | 1.93 | | | | 0.83 | | | (0.09) |
| | | |
| Total from investment operations | | | 0.03 | | | | 0.91 | | | | 2.27 | | | | 1.21 | | | 0.01 |
|
| Dividends and/or distributions to shareholders: | | | | | | | | | | | | | | | | | | |
| Dividends from net investment income | | | (0.24) | | | | (0.55) | | | | 0.00 | | | | 0.00 | | | 0.00 |
| Distributions from net realized gain | | | 0.00 | | | | 0.00 | | | | 0.00 | | | | 0.00 | | | (2.13) |
| Tax return of capital distribution | | | 0.00 | | | | 0.00 | | | | 0.00 | | | | 0.00 | | | (0.01) |
| | | |
| Total dividends and/or distributions to shareholders | | | (0.24) | | | | (0.55) | | | | 0.00 | | | | 0.00 | | | (2.14) |
|
| Net asset value, end of period | | | $27.47 | | | | $27.68 | | | | $27.32 | | | | $25.05 | | | $23.84 |
| | | |
|
|
| Total Return, at Net Asset Value3 | | | 0.08% | | | | 3.43% | | | | 9.06% | | | | 5.08% | | | 0.32% |
|
|
| Ratios/Supplemental Data | | | | | | | | | | | | | | | | | | |
| Net assets, end of period (in thousands) | | | $398,708 | | | | $87,249 | | | | $19,378 | | | | $11,237 | | | $16,234 |
|
| Average net assets (in thousands) | | | $278,002 | | | | $34,589 | | | | $14,096 | | | | $12,213 | | | $28,561 |
|
| Ratios to average net assets:4,5 | | | | | | | | | | | | | | | | | | |
| Net investment income | | | 1.16% | | | | 1.13% | | | | 1.27% | | | | 1.52% | | | 0.41% |
| Expenses excluding interest and fees from borrowings | | | 1.85%6 | | | | 1.88%6 | | | | 2.75% | | | | 1.79% | | | 1.60% |
| Interest and fees from borrowings | | | 0.00%7 | | | | 0.00%7 | | | | 0.00% | | | | 0.00% | | | 0.00% |
| | | |
| Total expenses8 | | | 1.85%6 | | | | 1.88%6 | | | | 2.75% | | | | 1.79% | | | 1.60% |
| Expenses after payments, waivers and/or reimbursements and reduction to custodian expenses | | | 1.81%6 | | | | 1.83%6 | | | | 2.04% | | | | 1.72% | | | 1.53% |
|
| Portfolio turnover rate | | | 131% | | | | 62% | | | | 44% | | | | 76% | | | 212% |
67 OPPENHEIMER FUNDAMENTAL ALTERNATIVES FUND
CONSOLIDATED FINANCIAL HIGHLIGHTS Continued
1. Represents the last business day of the Fund’s reporting period.
2. Per share amounts calculated based on the average shares outstanding during the period.
3. Assumes an initial investment on the business day before the first day of the fiscal period, with all dividends and distributions reinvested in additional shares on the reinvestment date, and redemption at the net asset value calculated on the last business day of the fiscal period. Sales charges are not reflected in the total returns. Total returns are not annualized for periods less than one full year. Returns do not reflect the deduction of taxes that a shareholder would pay on fund distributions or the redemption of fund shares.
4. Annualized for periods less than one full year.
5. Includes the Fund’s share of the allocated expenses and/or net investment income from the master funds.
6. Includes dividend and borrowing expense on securities sold short, respectively.
| | | | | | | | |
| | | Dividend Expense | | | Borrowing Expense | |
| |
Year Ended October 31, 2016 | | | 0.59% | | | | 0.09% | |
Year Ended October 30, 2015 | | | 0.60% | | | | 0.18% | |
7. Less than 0.005%.
8. Total expenses including indirect expenses from affiliated fund fees and expenses were as follows:
| | | | |
Year Ended October 31, 2016 | | | 1.87 | % |
Year Ended October 30, 2015 | | | 1.89 | % |
Year Ended October 31, 2014 | | | 2.76 | % |
Year Ended October 31, 2013 | | | 1.81 | % |
Year Ended October 31, 2012 | | | 1.65 | % |
See accompanying Notes to Consolidated Financial Statements.
68 OPPENHEIMER FUNDAMENTAL ALTERNATIVES FUND
NOTES TO CONSOLIDATED FINANCIAL STATEMENTS October 31, 2016
1. Organization
Oppenheimer Fundamental Alternatives Fund (the “Fund”), a series of Oppenheimer Quest for Value Funds, is registered under the Investment Company Act of 1940 (“1940 Act”), as amended, as a diversified open-end management investment company. The Fund’s investment objective is to seek total return. The Fund’s investment adviser is OFI Global Asset Management, Inc. (“OFI Global” or the “Manager”), a wholly-owned subsidiary of OppenheimerFunds, Inc. (“OFI” or the “Sub-Adviser”). The Manager has entered into a sub-advisory agreement with OFI.
The Fund offers Class A, Class C, Class I, Class R and Class Y shares, and previously offered Class B shares for new purchase through June 29, 2012. Subsequent to that date, no new purchases of Class B shares are permitted, however reinvestment of dividend and/or capital gain distributions and exchanges of Class B shares into and from other Oppenheimer funds are allowed. As of July 1, 2014, Class N shares were renamed Class R shares. Class N shares subject to a contingent deferred sales charge (“CDSC”) on July 1, 2014, continue to be subject to a CDSC after the shares were renamed. Purchases of Class R shares occurring on or after July 1, 2014, are not subject to a CDSC upon redemption. Class A shares are sold at their offering price, which is normally net asset value plus a front-end sales charge. Class C and Class R shares are sold, and Class B shares were sold, without a front-end sales charge but may be subject to a CDSC. Class R shares are sold only through retirement plans. Retirement plans that offer Class R shares may impose charges on those accounts. Class I and Class Y shares are sold to certain institutional investors or intermediaries without either a front-end sales charge or a CDSC, however, the intermediaries may impose charges on their accountholders who beneficially own Class I and Class Y shares. All classes of shares have identical rights and voting privileges with respect to the Fund in general and exclusive voting rights on matters that affect that class alone. Earnings, net assets and net asset value per share may differ due to each class having its own expenses, such as transfer and shareholder servicing agent fees and shareholder communications, directly attributable to that class. Class A, B, C and R shares have separate distribution and/or service plans under which they pay fees. Class I and Class Y shares do not pay such fees. Class B shares will automatically convert to Class A shares 72 months after the date of purchase.
The following is a summary of significant accounting policies followed in the Fund’s preparation of financial statements in accordance with accounting principles generally accepted in the United States (“U.S. GAAP”).
2. Significant Accounting Policies
Security Valuation. All investments in securities are recorded at their estimated fair value, as described in Note 3.
Basis for Consolidation. The Fund has established a Cayman Islands exempted company, Oppenheimer Fundamental Alternatives Fund (Cayman) Ltd., which is wholly-owned and controlled by the Fund (the “Subsidiary”). The Fund and Subsidiary are both managed by the Manager. The Fund may invest up to 25% of its total assets in the Subsidiary. The
69 OPPENHEIMER FUNDAMENTAL ALTERNATIVES FUND
NOTES TO CONSOLIDATED FINANCIAL STATEMENTS Continued
2. Significant Accounting Policies (Continued)
Subsidiary invests primarily in commodity-linked derivatives (including commodity futures, financial futures, options and swap contracts) and certain fixed-income securities and other investments that may serve as margin or collateral for its derivatives positions. Investments in the Subsidiary are intended to provide the Fund with exposure to commodities market returns within the limitations of the federal tax requirements that apply to the Fund. The Subsidiary is subject to the same investment restrictions and guidelines, and follows the same compliance policies and procedures, as the Fund.
The financial statements have been consolidated and include accounts of the Fund and the Subsidiary. Accordingly, all inter-company transactions and balances have been eliminated. At period end, the Fund owned 12,983 shares with net assets of $39,005,291 in the Subsidiary.
Other financial information at period end:
| | | | |
Total market value of investments | | $ | 39,058,602 | |
Net assets | | $ | 39,005,291 | |
Net income (loss) | | $ | (318,162) | |
Net realized gain (loss) | | $ | — | |
Net change in unrealized appreciation/depreciation | | $ | 3,025,723 | |
Foreign Currency Translation. The Fund’s accounting records are maintained in U.S. dollars. The values of securities denominated in foreign currencies and amounts related to the purchase and sale of foreign securities and foreign investment income are translated into U.S. dollars as of the close of the New York Stock Exchange (the “Exchange”), normally 4:00 P.M. Eastern time, on each day the Exchange is open for trading. Foreign exchange rates may be valued primarily using a reliable bank, dealer or service authorized by the Board of Trustees.
Reported net realized gains and losses from foreign currency transactions arise from sales of portfolio securities, sales and maturities of short-term securities, sales of foreign currencies, exchange rate fluctuations between the trade and settlement dates on securities transactions, and the difference between the amounts of dividends, interest, and foreign withholding taxes recorded on the Fund’s books and the U.S. dollar equivalent of the amounts actually received or paid. Net unrealized appreciation and depreciation on the translation of assets and liabilities denominated in foreign currencies arise from changes in the values of assets and liabilities, including investments in securities at fiscal period end, resulting from changes in exchange rates.
The effect of changes in foreign currency exchange rates on investments is separately identified from the fluctuations arising from changes in market values of securities held and reported with all other foreign currency gains and losses in the Fund’s Consolidated Statement of Operations.
Allocation of Income, Expenses, Gains and Losses. Income, expenses (other than those attributable to a specific class), gains and losses are allocated on a daily basis to each class of shares based upon the relative proportion of net assets represented by such class. Operating expenses directly attributable to a specific class are charged against the operations of that class.
70 OPPENHEIMER FUNDAMENTAL ALTERNATIVES FUND
2. Significant Accounting Policies (Continued)
Dividends and Distributions to Shareholders. Dividends and distributions to shareholders, which are determined in accordance with income tax regulations and may differ from U.S. GAAP, are recorded on the ex-dividend date. Income and capital gain distributions, if any, are declared and paid annually or at other times as deemed necessary by the Manager.
Investment Income. Dividend income is recorded on the ex-dividend date or upon ex-dividend notification in the case of certain foreign dividends where the ex-dividend date may have passed. Non-cash dividends included in dividend income, if any, are recorded at the fair market value of the securities received. Interest income is recognized on an accrual basis. Discount and premium, which are included in interest income on the Consolidated Statement of Operations, are amortized or accreted daily.
Return of Capital Estimates. Distributions received from the Fund’s investments in Real Estate Investments Trusts (REITs), generally are comprised of income and return of capital. The Fund records investment income and return of capital based on estimates. Such estimates are based on historical information available from each REIT and other industry sources. These estimates may subsequently be revised based on information received from REITs after their tax reporting periods are concluded.
Custodian Fees. “Custodian fees and expenses” in the Consolidated Statement of Operations may include interest expense incurred by the Fund on any cash overdrafts of its custodian account during the period. Such cash overdrafts may result from the effects of failed trades in portfolio securities and from cash outflows resulting from unanticipated shareholder redemption activity. The Fund pays interest to its custodian on such cash overdrafts, to the extent they are not offset by positive cash balances maintained by the Fund, based on the negative rolling average balance at an average Federal Funds Rate plus 0.50%. The “Reduction to custodian expenses” line item, if applicable, represents earnings on cash balances maintained by the Fund during the period. Such interest expense and other custodian fees may be paid with these earnings.
Security Transactions. Security transactions are recorded on the trade date. Realized gains and losses on securities sold (except for the investments in the Subsidiary) are determined on the basis of identified cost.
Indemnifications. The Fund’s organizational documents provide current and former Trustees and officers with a limited indemnification against liabilities arising in connection with the performance of their duties to the Fund. In the normal course of business, the Fund may also enter into contracts that provide general indemnifications. The Fund’s maximum exposure under these arrangements is unknown as this would be dependent on future claims that may be made against the Fund. The risk of material loss from such claims is considered remote.
Federal Taxes. The Fund intends to comply with provisions of the Internal Revenue Code
71 OPPENHEIMER FUNDAMENTAL ALTERNATIVES FUND
NOTES TO CONSOLIDATED FINANCIAL STATEMENTS Continued
2. Significant Accounting Policies (Continued)
applicable to regulated investment companies and to distribute substantially all of its investment company taxable income, including any net realized gain on investments not offset by capital loss carryforwards, if any, to shareholders. Therefore, no federal income or excise tax provision is required. The Fund files income tax returns in U.S. federal and applicable state jurisdictions. The statute of limitations on the Fund’s tax return filings generally remains open for the three preceding fiscal reporting period ends. The Fund has analyzed its tax positions for the fiscal year ended October 31, 2016, including open tax years, and does not believe there are any uncertain tax positions requiring recognition in the Fund’s financial statements.
Subchapter M requires, among other things, that at least 90% of the Fund’s gross income be derived from securities or derived with respect to its business of investing in securities (typically referred to as “qualifying income”). Income from commodity-linked derivatives may not be treated as “qualifying income” for purposes of the 90% gross income requirement. The Internal Revenue Service (IRS) has previously issued a number of private letter rulings which conclude that income derived from commodity index-linked notes and investments in a wholly-owned subsidiary will be “qualifying income.” As a result, the Fund will gain exposure to commodities through commodity-linked notes and its wholly-owned subsidiary.
The IRS has suspended the granting of private letter rulings pending further review. As a result, there can be no assurance that the IRS will not change its position with respect to commodity-linked notes and wholly-owned subsidiaries. In addition, future legislation and guidance from the Treasury and the IRS may adversely affect the Fund’s ability to gain exposure to commodities through commodity-linked notes and its wholly-owned subsidiary.
The Fund is required to include in income for federal income tax purposes all of the subsidiary’s net income and gains whether or not such income is distributed by the subsidiary. Net income and gains from the subsidiary are generally treated as ordinary income by the Fund, regardless of the character of the subsidiary’s underlying income. Net losses from the subsidiary do not pass through to the Fund for federal income tax purposes.
The tax components of capital shown in the following table represent distribution requirements the Fund must satisfy under the income tax regulations, losses the Fund may be able to offset against income and gains realized in future years and unrealized appreciation or depreciation of securities and other investments for federal income tax purposes.
| | | | | | | | | | | | |
Undistributed Net Investment Income | | Undistributed
Long-Term
Gain | | | Accumulated
Loss
Carryforward1,2,3 | | | Net Unrealized
Appreciation
Based on cost of
Securities and
Other Investments
for Federal Income
Tax Purposes | |
| |
$1,880,684 | | | $— | | | | $7,237,145 | | | | $54,315,753 | |
72 OPPENHEIMER FUNDAMENTAL ALTERNATIVES FUND
2. Significant Accounting Policies (Continued)
1. At period end, the Fund had $7,237,145 of net capital loss carryforward available to offset future realized capital gains, if any, and thereby reduce future taxable gain distributions. Details of the capital loss carryforwards are included in the table below. Capital loss carryovers with no expiration, if any, must be utilized prior to those with expiration dates.
| | | | |
| Expiring | | | |
| |
No expiration | | $ | 7,237,145 | |
2. During the reporting period, the Fund did not utilize any capital loss carryforward.
3. During the previous reporting period, the Fund utilized $38,791,279 of capital loss carryforward to offset capital gains realized in that fiscal year.
Net investment income (loss) and net realized gain (loss) may differ for financial statement and tax purposes. The character of dividends and distributions made during the fiscal year from net investment income or net realized gains are determined in accordance with federal income tax requirements, which may differ from the character of net investment income or net realized gains presented in those financial statements in accordance with U.S. GAAP. Also, due to timing of dividends and distributions, the fiscal year in which amounts are distributed may differ from the fiscal year in which the income or net realized gain was recorded by the Fund.
Accordingly, the following amounts have been reclassified for the reporting period. Net assets of the Fund were unaffected by the reclassifications.
| | | | | | | | |
Increase to Paid-in Capital | | Reduction
to Accumulated
Net Investment
Income | | | Reduction
to Accumulated Net
Realized Loss on Investments | |
| |
$1,906 | | | $3,462,212 | | | | $3,460,306 | |
The tax character of distributions paid during the reporting periods:
| | | | | | | | |
| | | Year Ended
October 31, 2016 | | | Year Ended
October 31, 2015 | |
| |
Distributions paid from: | | | | | | | | |
Ordinary income | | | $ 5,651,980 | | | | $ 13,708,528 | |
The aggregate cost of securities and other investments and the composition of unrealized appreciation and depreciation of securities and other investments for federal income tax purposes at period end are noted in the following table. The primary difference between book and tax appreciation or depreciation of securities and other investments, if applicable, is attributable to the tax deferral of losses or tax realization of financial statement unrealized gain or loss.
| | | | |
Federal tax cost of securities | | $ | 1,307,893,036 | |
Federal tax cost of other investments | | | (341,804,392) | |
| | | | |
Total federal tax cost | | $ | 966,088,644 | |
| | | | |
Gross unrealized appreciation | | $ | 121,728,361 | |
Gross unrealized depreciation | | | (67,412,608) | |
| | | | |
Net unrealized appreciation | | $ | 54,315,753 | |
| | | | |
73 OPPENHEIMER FUNDAMENTAL ALTERNATIVES FUND
NOTES TO CONSOLIDATED FINANCIAL STATEMENTS Continued
2. Significant Accounting Policies (Continued)
Use of Estimates. The preparation of financial statements in conformity with U.S. GAAP requires management to make estimates and assumptions that affect the reported amounts of assets and liabilities and disclosure of contingent assets and liabilities at the date of the financial statements and the reported amounts of increases and decreases in net assets from operations during the reporting period. Actual results could differ from those estimates.
3. Securities Valuation
The Fund calculates the net asset value of its shares as of 4:00 P.M. Eastern time, on each day the New York Stock Exchange (the “Exchange”) is open for trading, except in the case of a scheduled early closing of the Exchange, in which case the Fund will calculate net asset value of the shares as of the scheduled early closing time of the Exchange.
The Fund’s Board has adopted procedures for the valuation of the Fund’s securities and has delegated the day-to-day responsibility for valuation determinations under those procedures to the Manager. The Manager has established a Valuation Committee which is responsible for determining a “fair valuation” for any security for which market quotations are not “readily available.” The Valuation Committee’s fair valuation determinations are subject to review, approval and ratification by the Fund’s Board at its next regularly scheduled meeting covering the calendar quarter in which the fair valuation was determined.
Valuation Methods and Inputs
Securities are valued using unadjusted quoted market prices, when available, as supplied primarily by third party pricing services or dealers.
The following methodologies are used to determine the market value or the fair value of the types of securities described below:
Securities traded on a registered U.S. securities exchange (including exchange-traded derivatives other than futures and futures options) are valued based on the last sale price of the security reported on the principal exchange on which it is traded, prior to the time when the Fund’s assets are valued. In the absence of a sale, the security is valued at the mean between the bid and asked price on the principal exchange or, if not available from the principal exchange, obtained from two dealers. If bid and asked prices are not available from either the exchange or two dealers, the security is valued by using one of the following methodologies (listed in order of priority): (1) a bid from the principal exchange, (2) the mean between the bid and asked price as provided by a single dealer, or (3) a bid from a single dealer. A security of a foreign issuer traded on a foreign exchange, but not listed on a registered U.S. securities exchange, is valued based on the last sale price on the principal exchange on which the security is traded, as identified by the third party pricing service used by the Manager, prior to the time when the Fund’s assets are valued. If the last sale price is unavailable, the security is valued at the most recent official closing price on the principal exchange on which it is traded. If the last sales price or official closing price for a foreign security is not available, the security is valued at the mean between the bid and asked price per the exchange or, if not available from the exchange, obtained from two dealers. If bid and
74 OPPENHEIMER FUNDAMENTAL ALTERNATIVES FUND
3. Securities Valuation (Continued)
asked prices are not available from either the exchange or two dealers, the security is valued by using one of the following methodologies (listed in order of priority): (1) a bid from the exchange, (2) the mean between the bid and asked price as provided by a single dealer, or (3) a bid from a single dealer.
Shares of a registered investment company that are not traded on an exchange are valued at that investment company’s net asset value per share.
Corporate and government debt securities (of U.S. or foreign issuers) and municipal debt securities, event-linked bonds, loans, mortgage-backed securities, collateralized mortgage obligations, and asset-backed securities are valued at the mean between the “bid” and “asked” prices utilizing evaluated prices obtained from third party pricing services or broker-dealers who may use matrix pricing methods to determine the evaluated prices.
Short-term money market type debt securities with a remaining maturity of sixty days or less are valued at cost adjusted by the amortization of discount or premium to maturity (amortized cost), which approximates market value. Short-term debt securities with a remaining maturity in excess of sixty days are valued at the mean between the “bid” and “asked” prices utilizing evaluated prices obtained from third party pricing services or broker-dealers.
Structured securities, swaps, swaptions, and other over-the-counter derivatives are valued utilizing evaluated prices obtained from third party pricing services or broker-dealers.
Forward foreign currency exchange contracts are valued utilizing current and forward currency rates obtained from third party pricing services. When the settlement date of a contract is an interim date for which a quotation is not available, interpolated values are derived using the nearest dated forward currency rate.
Futures contracts and futures options traded on a commodities or futures exchange will be valued at the final settlement price or official closing price on the principal exchange as reported by such principal exchange at its trading session ending at, or most recently prior to, the time when the Fund’s assets are valued.
A description of the standard inputs that may generally be considered by the third party pricing vendors in determining their evaluated prices is provided below.
| | | | | | |
| Security Type | | | | Standard inputs generally considered by third-party pricing vendors | | |
|
| Corporate debt, government debt, municipal, mortgage- backed and asset-backed securities | | | | Reported trade data, broker-dealer price quotations, benchmark yields, issuer spreads on comparable securities, the credit quality, yield, maturity, and other appropriate factors. | | |
|
| Loans | | | | Information obtained from market participants regarding reported trade data and broker-dealer price quotations. | | |
|
| Event-linked bonds | | | | Information obtained from market participants regarding reported trade data and broker-dealer price quotations. | | |
|
| Structured securities | | | | Relevant market information such as the price of underlying financial instruments, stock market indices, foreign currencies, interest rate spreads, commodities, or the occurrence of other specific events. | | |
|
| Swaps | | | | Relevant market information, including underlying reference assets such as credit spreads, credit event probabilities, index values, individual security values, forward interest rates, variable interest rates, volatility measures, and forward currency rates. | | |
75 OPPENHEIMER FUNDAMENTAL ALTERNATIVES FUND
NOTES TO CONSOLIDATED FINANCIAL STATEMENTS Continued
3. Securities Valuation (Continued)
If a market value or price cannot be determined for a security using the methodologies described above, or if, in the “good faith” opinion of the Manager, the market value or price obtained does not constitute a “readily available market quotation,” or a significant event has occurred that would materially affect the value of the security, the security is fair valued either (i) by a standardized fair valuation methodology applicable to the security type or the significant event as previously approved by the Valuation Committee and the Fund’s Board or (ii) as determined in good faith by the Manager’s Valuation Committee. The Valuation Committee considers all relevant facts that are reasonably available, through either public information or information available to the Manager, when determining the fair value of a security. Fair value determinations by the Manager are subject to review, approval and ratification by the Fund’s Board at its next regularly scheduled meeting covering the calendar quarter in which the fair valuation was determined. Those fair valuation standardized methodologies include, but are not limited to, valuing securities at the last sale price or initially at cost and subsequently adjusting the value based on: changes in company specific fundamentals, changes in an appropriate securities index, or changes in the value of similar securities which may be further adjusted for any discounts related to security-specific resale restrictions. When possible, such methodologies use observable market inputs such as unadjusted quoted prices of similar securities, observable interest rates, currency rates and yield curves. The methodologies used for valuing securities are not necessarily an indication of the risks associated with investing in those securities nor can it be assured that the Fund can obtain the fair value assigned to a security if it were to sell the security.
To assess the continuing appropriateness of security valuations, the Manager, or its third party service provider who is subject to oversight by the Manager, regularly compares prior day prices, prices on comparable securities, and sale prices to the current day prices and challenges those prices exceeding certain tolerance levels with the third party pricing service or broker source. For those securities valued by fair valuations, whether through a standardized fair valuation methodology or a fair valuation determination, the Valuation Committee reviews and affirms the reasonableness of the valuations based on such methodologies and fair valuation determinations on a regular basis after considering all relevant information that is reasonably available.
Classifications
Each investment asset or liability of the Fund is assigned a level at measurement date based on the significance and source of the inputs to its valuation. Various data inputs are used in determining the value of each of the Fund’s investments as of the reporting period end. These data inputs are categorized in the following hierarchy under applicable financial accounting standards:
1) Level 1-unadjusted quoted prices in active markets for identical assets or liabilities (including securities actively traded on a securities exchange)
2) Level 2-inputs other than unadjusted quoted prices that are observable for the asset or liability (such as unadjusted quoted prices for similar assets and market corroborated inputs such as interest rates, prepayment speeds, credit risks, etc.)
76 OPPENHEIMER FUNDAMENTAL ALTERNATIVES FUND
3. Securities Valuation (Continued)
3) Level 3-significant unobservable inputs (including the Manager’s own judgments about assumptions that market participants would use in pricing the asset or liability).
The inputs used for valuing securities are not necessarily an indication of the risks associated with investing in those securities.
The Fund classifies each of its investments in investment companies which are publicly offered as Level 1. Investment companies that are not publicly offered are measured using net asset value as a practical expedient, and are not classified in the fair value hierarchy.
The table below categorizes amounts that are included in the Fund’s Consolidated Statement of Assets and Liabilities at period end based on valuation input level:
| | | | | | | | | | | | | | | | |
| | | Level 1—
Unadjusted
Quoted Prices | | | Level 2—
Other Significant
Observable Inputs | | | Level 3—
Significant
Unobservable
Inputs | | | Value | |
| |
Assets Table | | | | | | | | | | | | | | | | |
Investments, at Value: | | | | | | | | | | | | | | | | |
Common Stocks | | | | | | | | | | | | | | | | |
Consumer Discretionary | | $ | 23,107,418 | | | $ | — | | | $ | 76,431 | | | $ | 23,183,849 | |
Consumer Staples | | | 44,143,008 | | | | — | | | | — | | | | 44,143,008 | |
Energy | | | 68,053,381 | | | | 110,048 | | | | — | | | | 68,163,429 | |
Financials | | | 109,791,856 | | | | 27,584 | | | | — | | | | 109,819,440 | |
Health Care | | | 101,220,622 | | | | 10,792,740 | | | | 90 | | | | 112,013,452 | |
Industrials | | | 134,680,887 | | | | — | | | | — | | | | 134,680,887 | |
Information Technology | | | 93,581,029 | | | | — | | | | — | | | | 93,581,029 | |
Materials | | | 47,009,464 | | | | — | | | | — | | | | 47,009,464 | |
Telecommunication Services | | | 32,321,109 | | | | — | | | | — | | | | 32,321,109 | |
Utilities | | | 34,611,110 | | | | — | | | | — | | | | 34,611,110 | |
Preferred Stocks | | | — | | | | 12,941,237 | | | | — | | | | 12,941,237 | |
Rights, Warrants and Certificates | | | — | | | | 3,983 | | | | — | | | | 3,983 | |
Asset-Backed Securities | | | — | | | | 77,120,976 | | | | 14,712,560 | | | | 91,833,536 | |
Mortgage-Backed Obligations | | | — | | | | 58,478,579 | | | | — | | | | 58,478,579 | |
Non-Convertible Corporate Bonds and Notes | | | — | | | | 130,583,534 | | | | — | | | | 130,583,534 | |
Corporate Loans | | | — | | | | 130,780,777 | | | | 602,351 | | | | 131,383,128 | |
Structured Security | | | — | | | | — | | | | 849,321 | | | | 849,321 | |
Exchange-Traded Option Purchased | | | 1,240,000 | | | | — | | | | — | | | | 1,240,000 | |
Over-the-Counter Options Purchased | | | — | | | | 1,921,521 | | | | — | | | | 1,921,521 | |
Over-the-Counter Interest Rate | | | | | | | | | | | | | | | | |
Swaptions Purchased | | | — | | | | 1,329,184 | | | | — | | | | 1,329,184 | |
Short-Term Notes | | | — | | | | 56,805,618 | | | | — | | | | 56,805,618 | |
Investment Companies | | | 188,463,018 | | | | — | | | | — | | | | 188,463,018 | |
| | | | |
Total Investments, at Value | | | 878,222,902 | | | | 480,895,781 | | | | 16,240,753 | | | | 1,375,359,436 | |
Other Financial Instruments: | | | | | | | | | | | | | | | | |
Swaps, at value | | | — | | | | 3,213,325 | | | | — | | | | 3,213,325 | |
Centrally cleared swaps, at value | | | — | | | | 729,731 | | | | — | | | | 729,731 | |
Futures contracts | | | 693,180 | | | | — | | | | — | | | | 693,180 | |
77 OPPENHEIMER FUNDAMENTAL ALTERNATIVES FUND
NOTES TO CONSOLIDATED FINANCIAL STATEMENTS Continued
3. Securities Valuation (Continued)
| | | | | | | | | | | | | | | | |
| | | Level 1—
Unadjusted
Quoted Prices | | | Level 2—
Other Significant
Observable Inputs | | | Level 3—
Significant
Unobservable
Inputs | | | Value | |
| |
Other Financial Instruments: (Continued) | | | | | | | | | | | | | | | | |
Forward currency exchange contracts | | $ | — | | | $ | 3,615,525 | | | $ | — | | | $ | 3,615,525 | |
| | | | |
Total Assets | | $ | 878,916,082 | | | $ | 488,454,362 | | | $ | 16,240,753 | | | $ | 1,383,611,197 | |
| | | | |
| | | | |
Liabilities Table | | | | | | | | | | | | | | | | |
Other Financial Instruments: | | | | | | | | | | | | | | | | |
Investment Company Securities Sold | | | | | | | | | | | | | | | | |
Short | | $ | (49,284,993 | ) | | $ | — | | | $ | — | | | $ | (49,284,993) | |
Common Stock Securities Sold Short | | | (328,963,417 | ) | | | (42,489,494 | ) | | | — | | | | (371,452,911) | |
Swaps, at value | | | — | | | | (8,537,281 | ) | | | — | | | | (8,537,281) | |
Centrally cleared swaps, at value | | | — | | | | (2,473,374 | ) | | | — | | | | (2,473,374) | |
Options written, at value | | | — | | | | (53,550 | ) | | | — | | | | (53,550) | |
Forward currency exchange contracts | | | — | | | | (1,598,561 | ) | | | — | | | | (1,598,561) | |
| | | | |
Total Liabilities | | $ | (378,248,410 | ) | | $ | (55,152,260 | ) | | $ | — | | | $ | (433,400,670) | |
| | | | |
Forward currency exchange contracts and futures contracts, if any, are reported at their unrealized appreciation/depreciation at measurement date, which represents the change in the contract’s value from trade date. All additional assets and liabilities included in the above table are reported at their market value at measurement date.
The table below shows the transfers between Level 2 and Level 3. The Fund’s policy is to recognize transfers in and transfers out as of the beginning of the reporting period.
| | | | | | | | | | | | | | | | |
| | | Transfers into
Level 2** | | | Transfers out of
Level 2* | | | Transfers into
Level 3* | | | Transfers out of
Level 3** | |
| |
Assets Table | | | | | | | | | | | | | | | | |
Investments, at Value: | | | | | | | | | | | | | | | | |
Common Stocks | | | | | | | | | | | | | | | | |
Consumer | | | | | | | | | | | | | | | | |
Discretionary | | $ | — | | | $ | (73,592) | | | $ | 73,592 | | | $ | — | |
Corporate Loans | | | 175,053 | | | | (142,504) | | | | 142,504 | | | | (175,053) | |
| | | | |
Total Assets | | $ | 175,053 | | | $ | (216,096) | | | $ | 216,096 | | | $ | (175,053) | |
| | | | |
*Transferred from Level 2 to Level 3 because of observable market data.
**Transferred from Level 3 to Level 2 due to the availability of market data for this security.
The following is a reconciliation of assets in which significant unobservable inputs (level 3) were used in determining fair value:
| | | | | | | | | | | | | | | | |
| | | Value as of
October 30,
2015 | | | Realized gain
(loss) | | | Change in
unrealized
appreciation/
depreciation | | | Accretion/
(amortization)
of premium/
discounta | |
| |
Assets Table | | | | | | | | | | | | | | | | |
Investments, at Value: | | | | | | | | | | | | | | | | |
Common Stocks | | $ | — | | | $ | — | | | $ | (152,979) | | | $ | — | |
Asset-Backed Securities | | | 20,581,739 | | | | 367,160 | | | | (6,641,835) | | | | 405,496 | |
78 OPPENHEIMER FUNDAMENTAL ALTERNATIVES FUND
3. Securities Valuation (Continued)
| | | | | | | | | | | | | | | | | | | | |
| | | | | | Value as of
October 30,
2015 | | | Realized gain
(loss) | | | Change in
unrealized
appreciation/
depreciation | | | Accretion/
(amortization)
of premium/
discounta | |
| |
Investments, at Value: (Continued) | | | | | | | | | | | | | |
Corporate Loans | | | | | | $ | 252,794 | | | $ | (270,809) | | | $ | 273,396 | | | $ | 2 | |
Structured Securities | | | | | | | 895,986 | | | | — | | | | (46,665) | | | | — | |
| | | | | | | | |
Total Assets | | | | | | $ | 21,730,519 | | | $ | 96,351 | | | $ | (6,568,083) | | | $ | 405,498 | |
| | | | | | | | |
| | | | | |
| a. Included in net investment income. | | | | | | | | | | | | | | | | | | | | |
| | | Purchases | | | Sales | | | Transfers into
Level 3 | | | Transfers out
of Level 3 | | | Value as of
October 31,
2016 | |
| |
Assets Table | | | | | | | | | | | | | | | | | | | | |
Investments, at Value: | | | | | | | | | | | | | | | | | | | | |
Common Stocks | | $ | 153,069 | | | $ | — | | | $ | 76,431 | | | $ | — | | | $ | 76,521 | |
Asset-Backed Securities | | | — | | | | — | | | | — | | | | — | | | | 14,712,560 | |
Corporate Loans | | | 465,003 | | | | (79,147) | | | | 136,165 | | | | (175,053) | | | | 602,351 | |
Structured Securities | | | — | | | | — | | | | — | | | | — | | | | 849,321 | |
| | | | |
Total Assets | | $ | 618,072 | | | $ | (79,147) | | | $ | 212,596 | | | $ | (175,053) | | | $ | 16,240,753 | |
| | | | |
The total change in unrealized appreciation/depreciation included in the Consolidated Statement of Operations attributable to Level 3 investments still held at period end:
| | | | |
| | | Change in unrealized appreciation/ depreciation | |
| |
Assets Table | | | | |
Investments, at Value | | | | |
Asset-Backed Securities | | $ | (6,641,835) | |
Corporate Loans | | | 273,396 | |
Common Stocks | | | (152,979) | |
Structured Securities | | | (46,665) | |
| | | | |
Total | | $ | (6,568,083) | |
| | | | |
The following table summarizes the valuation techniques and significant unobservable inputs used in determining fair value measurements for those investments classified as Level 3 at period end:
| | | | | | | | | | | | | | | | | | | | |
| | | Value as of
October 31, 2016 | | | Valuation Technique | | | Unobservable Input | | | Range of
Unobservable Inputs | | | Unobservable Input Used | |
| |
Assets Table | | | | | | | | | | | | | | | | | | | | |
Investments, at Value: | | | | | | | | | | | | | | | | | | | | |
Asset-Backed Security | | $ | 14,712,560 | | | | Pricing service | | | | N/A | | | | N/A | | | | N/A (a) | |
Common Stock | | | 76,431 | | | | Pricing service | | | | N/A | | | | N/A | | | | N/A (a) | |
Common Stocks | | | 90 | | |
| Estimated
recovery proceeds |
| | | Nominal value | | | | N/A | | | $
| 0.01 per share
(b) |
|
Corporate Loans | | | 602,327 | | | | Pricing service | | | | N/A | | | | N/A | | | | N/A (a) | |
79 OPPENHEIMER FUNDAMENTAL ALTERNATIVES FUND
NOTES TO CONSOLIDATED FINANCIAL STATEMENTS Continued
3. Securities Valuation (Continued)
| | | | | | | | | | | | | | | | | | | | |
| | | Value as of
October 31, 2016 | | | Valuation Technique | | | Unobservable Input | | | Range of
Unobservable Inputs | | | Unobservable Input Used | |
| |
Investments, at Value: Continued | | | | | | | | | | | | | | | | | | | | |
Corporate Loan | | $ | 24 | | |
| Estimated
recovery proceeds |
| | | Nominal value | | | | N/A | | |
| 0.01% of par
(c) |
|
Structured Security | | | 849,321 | | |
| Discount to
Capital Account
Balance |
| | | Discount rate | | | | N/A | | | | 84% (d) | |
| | | | | | | | | |
| Capital account
balance |
| | | N/A | | | $ | 5,343,050 (d) | |
| | | | | | | | | | | | | | | | | | | | |
Total | | $ | 16,240,753 | | | | | | | | | | | | | | | | | |
| | | | | | | | | | | | | | | | | | | | |
(a) Security classified as Level 3 whose unadjusted value was provided by a pricing service for which such inputs are unobservable. The Manager periodically reviews pricing vendor methodologies and inputs to confirm they are determined using unobservable inputs and have been appropriately classified. Such security’s fair valuation could change significantly based on changes in unobservable inputs used by the pricing service.
(b) The Fund fair values certain common stock using a nominal value to reflect the low probability of future recovery. The Manager monitors such investments for additional market information or the occurrence of a significant event which would warrant a re-evaluation of the security’s fair valuation. A significant increase (decrease) in the future distribution amount will result in a significant increase (decrease) to the fair value of the investment.
(c) The Fund fair values certain corporate loans using a nominal value to reflect the low probability of future recovery. The Manager monitors such investments for additional market information or the occurrence of a significant event which would warrant a re-evaluation of the security’s fair valuation. A significant increase (decrease) in the future distribution amount will result in a significant increase (decrease) to the fair value of the investment.
(d) The Fund fair values the structured security at a discount to the selected capital account balance to reflect uncertainty and illiquidity. A significant decrease (increase) to the discount rate, or a significant increase (decrease) to the capital account balance, will result in a significant increase (decrease) to the fair value of the investment.
4. Investments and Risks
Investments in Affiliated Funds. The Fund is permitted to invest in other mutual funds advised by the Manager (“Affiliated Funds”). Affiliated Funds are open-end management investment companies registered under the 1940 Act, as amended. The Manager is the investment adviser of, and the Sub-Adviser provides investment and related advisory services to, the Affiliated Funds. When applicable, the Fund’s investments in Affiliated Funds are included in the Consolidated Statement of Investments. Shares of Affiliated Funds are valued at their net asset value per share. As a shareholder, the Fund is subject to its proportional share of the Affiliated Funds’ expenses, including their management fee. The Manager will waive fees and/or reimburse Fund expenses in an amount equal to the indirect management fees incurred through the Fund’s investment in the Affiliated Funds.
Each of the Affiliated Funds in which the Fund invests has its own investment risks, and those risks can affect the value of the Fund’s investments and therefore the value of the Fund’s shares. To the extent that the Fund invests more of its assets in one Affiliated Fund than in another, the Fund will have greater exposure to the risks of that Affiliated Fund.
Investments in Money Market Instruments. The Fund is permitted to invest its free
80 OPPENHEIMER FUNDAMENTAL ALTERNATIVES FUND
4. Investments and Risks (Continued)
cash balances in money market instruments to provide liquidity or for defensive purposes. The Fund may invest in money market instruments by investing in Class E shares of Oppenheimer Institutional Government Money Market Fund (“IGMMF”), formerly known as Oppenheimer Institutional Money Market Fund, which is an Affiliated Fund. IGMMF is regulated as a money market fund under the 1940 Act, as amended. The Fund may also invest in money market instruments directly or in other affiliated or unaffiliated money market funds.
Investment in Oppenheimer Master Fund. The Fund is permitted to invest in entities sponsored and/or advised by the Manager or an affiliate. Certain of these entities in which the Fund invests are mutual funds registered under the 1940 Act, as amended, that expect to be treated as partnerships for tax purposes, specifically Oppenheimer Master Loan Fund, LLC (the “Master Fund”). The Master Fund has its own investment risks, and those risks can affect the value of the Fund’s investments and therefore the value of the Fund’s shares. To the extent that the Fund invests more of its assets in the Master Fund, the Fund will have greater exposure to the risks of the Master Fund.
The investment objective of the Master Fund is to seek income. The Fund’s investment in the Master Fund is included in the Consolidated Statement of Investments. The Fund recognizes income and gain/(loss) on its investment in the master fund according to its allocated pro-rata share, based on its relative proportion of total outstanding Master Fund shares held, of the total net income earned and the net gain/(loss) realized on investments sold by the Master Fund. As a shareholder, the Fund is subject to its proportional share of the Master Fund’s expenses, including its management fee. The Manager will waive fees and/ or reimburse Fund expenses in an amount equal to the indirect management fees incurred through the Fund’s investment in the Master Fund. At period end, the Fund no longer held the Master Fund.
Structured Securities. The Fund invests in structured securities whose market values, interest rates and/or redemption prices are linked to the performance of underlying foreign currencies, interest rate spreads, stock market indices, prices of individual securities, commodities or other financial instruments or the occurrence of other specific events. The structured securities are often leveraged, increasing the volatility of each note’s market value relative to the change in the underlying linked financial element or event. Fluctuations in value of these securities are recorded as unrealized gains and losses in the accompanying Statement of Operations in the annual and semiannual reports. The Fund records a realized gain or loss when a structured security is sold or matures.
Loans. The Fund invests in loans made to U.S. and foreign borrowers that are corporations, partnerships or other business entities. The Fund will do so directly as an original lender or by assignment or indirectly through participation agreements or certain derivative instruments. While many of these loans will be collateralized, the Fund can also invest in uncollateralized loans. Loans are often issued in connection with recapitalizations, acquisitions, leveraged buyouts, and refinancing of borrowers. The loans often pay interest at rates that float above
81 OPPENHEIMER FUNDAMENTAL ALTERNATIVES FUND
NOTES TO CONSOLIDATED FINANCIAL STATEMENTS Continued
4. Investments and Risks (Continued)
(or are adjusted periodically based on) a benchmark that reflects current interest rates although the Fund can also invest in loans with fixed interest rates.
Securities on a When-Issued or Delayed Delivery Basis. The Fund may purchase securities on a “when-issued” basis, and may purchase or sell securities on a “delayed delivery” basis. “When-issued” or “delayed delivery” refers to securities whose terms and indenture are available and for which a market exists, but which are not available for immediate delivery. Delivery and payment for securities that have been purchased by the Fund on a when-issued basis normally takes place within six months and possibly as long as two years or more after the trade date. During this period, such securities do not earn interest, are subject to market fluctuation and may increase or decrease in value prior to their delivery. The purchase of securities on a when-issued basis may increase the volatility of the Fund’s net asset value to the extent the Fund executes such transactions while remaining substantially fully invested. When the Fund engages in when-issued or delayed delivery transactions, it relies on the buyer or seller, as the case may be, to complete the transaction. Their failure to do so may cause the Fund to lose the opportunity to obtain or dispose of the security at a price and yield it considers advantageous. The Fund may also sell securities that it purchased on a when-issued basis or forward commitment prior to settlement of the original purchase.
At period end, the Fund had purchased securities issued on a when-issued or delayed delivery basis and sold securities issued on a delayed delivery basis as follows:
| | | | |
| | | When-Issued or Delayed Delivery
Basis Transactions | |
| |
Purchased securities | | | $14,922,511 | |
Sold securities | | | 2,398,570 | |
Restricted Securities. At period end, investments in securities included issues that are restricted. A restricted security may have a contractual restriction on its resale and is valued under methods approved by the Board of Trustees as reflecting fair value. Securities that are restricted are marked with an applicable footnote on the Consolidated Statement of Investments. Restricted securities are reported on a schedule following the Consolidated Statement of Investments.
Equity Security Risk. Stocks and other equity securities fluctuate in price. The value of the Fund’s portfolio may be affected by changes in the equity markets generally. Equity markets may experience significant short-term volatility and may fall sharply at times. Different markets may behave differently from each other and U.S. equity markets may move in the opposite direction from one or more foreign stock markets. Adverse events in any part of the equity or fixed-income markets may have unexpected negative effects on other market segments.
The prices of individual equity securities generally do not all move in the same direction at the same time and a variety of factors can affect the price of a particular company’s securities. These factors may include, but are not limited to, poor earnings reports, a loss of customers,
82 OPPENHEIMER FUNDAMENTAL ALTERNATIVES FUND
4. Investments and Risks (Continued)
litigation against the company, general unfavorable performance of the company’s sector or industry, or changes in government regulations affecting the company or its industry.
Credit Risk. Loans and debt securities are subject to credit risk. Credit risk relates to the ability of the borrower under a loan or issuer of a debt to meet interest or principal payments or both as they become due. The Fund may acquire securities that have missed an interest payment, and is not obligated to dispose of securities whose issuers subsequently miss an interest payment.
Information concerning securities not accruing income at period end is as follows:
| | | | |
Cost | | $ | 8,226,438 | |
Market Value | | $ | 9,150,291 | |
Market Value as % of Net Assets | | | 0.67% | |
The Fund has entered into forbearance agreements with certain obligors under which the Fund has agreed to temporarily forego receipt of the original principal or coupon interest rates. At period end, securities with an aggregate market value of $494,311, representing 0.04% of the Fund’s net assets, were subject to these forbearance agreements.
5. Market Risk Factors
The Fund’s investments in securities and/or financial derivatives may expose the Fund to various market risk factors:
Commodity Risk. Commodity risk relates to the change in value of commodities or commodity indexes as they relate to increases or decreases in the commodities market. Commodities are physical assets that have tangible properties. Examples of these types of assets are crude oil, heating oil, metals, livestock, and agricultural products.
Credit Risk. Credit risk relates to the ability of the issuer of debt to meet interest and principal payments, or both, as they come due. In general, lower-grade, higher-yield debt securities are subject to credit risk to a greater extent than lower-yield, higher-quality securities.
Equity Risk. Equity risk relates to the change in value of equity securities as they relate to increases or decreases in the general market.
Foreign Exchange Rate Risk. Foreign exchange rate risk relates to the change in the U.S. dollar value of a security held that is denominated in a foreign currency. The U.S. dollar value of a foreign currency denominated security will decrease as the dollar appreciates against the currency, while the U.S. dollar value will increase as the dollar depreciates against the currency.
Interest Rate Risk. Interest rate risk refers to the fluctuations in value of fixed-income securities resulting from the inverse relationship between price and yield. For example, an increase in general interest rates will tend to reduce the market value of already issued fixed-income investments, and a decline in general interest rates will tend to increase their
83 OPPENHEIMER FUNDAMENTAL ALTERNATIVES FUND
NOTES TO CONSOLIDATED FINANCIAL STATEMENTS Continued
5. Market Risk Factors (Continued)
value. In addition, debt securities with longer maturities, which tend to have higher yields, are subject to potentially greater fluctuations in value from changes in interest rates than obligations with shorter maturities.
Volatility Risk. Volatility risk refers to the magnitude of the movement, but not the direction of the movement, in a financial instrument’s price over a defined time period. Large increases or decreases in a financial instrument’s price over a relative time period typically indicate greater volatility risk, while small increases or decreases in its price typically indicate lower volatility risk.
6. Use of Derivatives
The Fund’s investment objective not only permits the Fund to purchase investment securities, it also allows the Fund to enter into various types of derivatives contracts, including, but not limited to, futures contracts, forward currency exchange contracts, credit default swaps, interest rate swaps, total return swaps, variance swaps and purchased and written options. In doing so, the Fund will employ strategies in differing combinations to permit it to increase, decrease, or change the level or types of exposure to market risk factors. These instruments may allow the Fund to pursue its objectives more quickly and efficiently than if it were to make direct purchases or sales of securities capable of effecting a similar response to market factors. Such contracts may be entered into through a bilateral over-the-counter (“OTC”) transaction, or through a securities or futures exchange and cleared through a clearinghouse.
Derivatives may have little or no initial cash investment relative to their market value exposure and therefore can produce significant gains or losses in excess of their cost due to unanticipated changes in the market risk factors and the overall market. This use of embedded leverage allows the Fund to increase its market value exposure relative to its net assets and can substantially increase the volatility of the Fund’s performance. In instances where the Fund is using derivatives to decrease, or hedge, exposures to market risk factors for securities held by the Fund, there are also risks that those derivatives may not perform as expected resulting in losses for the combined or hedged positions. Some derivatives have the potential for unlimited loss, regardless of the size of the Fund’s initial investment.
Additional associated risks from investing in derivatives also exist and potentially could have significant effects on the valuation of the derivative and the Fund. Typically, the associated risks are not the risks that the Fund is attempting to increase or decrease exposure to, per its investment objectives, but are the additional risks from investing in derivatives. Examples of these associated risks are liquidity risk, which is the risk that the Fund will not be able to sell the derivative in the open market in a timely manner, and counterparty credit risk, which is the risk that the counterparty will not fulfill its obligation to the Fund.
The Fund’s actual exposures to these market risk factors and associated risks during the period are discussed in further detail, by derivative type, below.
Forward Currency Exchange Contracts
The Fund may enter into forward currency exchange contracts (“forward contracts”) for the
84 OPPENHEIMER FUNDAMENTAL ALTERNATIVES FUND
6. Use of Derivatives (Continued)
purchase or sale of a foreign currency at a negotiated rate at a future date. Such contracts are traded in the OTC inter-bank currency dealer market.
Forward contracts are reported on a schedule following the Consolidated Statement of Investments. The unrealized appreciation (depreciation) is reported in the Consolidated Statement of Assets and Liabilities as a receivable (or payable) and in the Consolidated Statement of Operations within the change in unrealized appreciation (depreciation). At contract close, the difference between the original cost of the contract and the value at the close date is recorded as a realized gain (loss) in the Consolidated Statement of Operations.
The Fund has entered into forward contracts with the obligation to purchase specified foreign currencies in the future at a currently negotiated forward rate in order to take a positive investment perspective on the related currency. These forward contracts seek to increase exposure to foreign exchange rate risk.
The Fund has entered into forward contracts with the obligation to purchase specified foreign currencies in the future at a currently negotiated forward rate in order to decrease exposure to foreign exchange rate risk associated with foreign currency denominated securities held by the Fund.
The Fund has entered into forward contracts with the obligation to sell specified foreign currencies in the future at a currently negotiated forward rate in order to take a negative investment perspective on the related currency. These forward contracts seek to increase exposure to foreign exchange rate risk.
The Fund has entered into forward contracts with the obligation to sell specified foreign currencies in the future at a currently negotiated forward rate in order to decrease exposure to foreign exchange rate risk associated with foreign currency denominated securities held by the Fund.
During the reporting period, the Fund had daily average contract amounts on forward contracts to buy and sell of $39,474,183 and $132,931,748, respectively.
Additional associated risk to the Fund includes counterparty credit risk. Counterparty credit risk arises from the possibility that the counterparty to a forward contract will default and fail to perform its obligations to the Fund.
Futures Contracts
A futures contract is a commitment to buy or sell a specific amount of a commodity, financial instrument or currency at a negotiated price on a stipulated future date. The Fund may buy and sell futures contracts and may also buy or write put or call options on these futures contracts. Futures contracts and options thereon are generally entered into on a regulated futures exchange and cleared through a clearinghouse associated with the exchange.
Upon entering into a futures contract, the Fund is required to deposit either cash or securities (initial margin) in an amount equal to a certain percentage of the contract value in an account registered in the futures commission merchant’s name. Subsequent payments (variation margin) are paid to or from the futures commission merchant each day equal to the daily changes in the contract value. Such payments are recorded as unrealized gains and losses. Should the Fund fail to make requested variation margin payments, the futures
85 OPPENHEIMER FUNDAMENTAL ALTERNATIVES FUND
NOTES TO CONSOLIDATED FINANCIAL STATEMENTS Continued
6. Use of Derivatives (Continued)
commission merchant can gain access to the initial margin to satisfy the Fund’s payment obligations.
Futures contracts are reported on a schedule following the Consolidated Statement of Investments. Securities held by a futures commission merchant to cover initial margin requirements on open futures contracts are noted in the Consolidated Statement of Investments. Cash held by a futures commission merchant to cover initial margin requirements on open futures contracts and the receivable and/or payable for the daily mark to market for the variation margin are noted in the Consolidated Statement of Assets and Liabilities. The net change in unrealized appreciation and depreciation is reported in the Consolidated Statement of Operations. Realized gains (losses) are reported in the Consolidated Statement of Operations at the closing or expiration of futures contracts.
The Fund has sold futures contracts on various bonds and notes to decrease exposure to interest rate risk.
During the reporting period, the Fund had an ending monthly average market value of $24,272,296 on futures contracts sold.
Additional associated risks of entering into futures contracts (and related options) include the possibility that there may be an illiquid market where the Fund is unable to liquidate the contract or enter into an offsetting position and, if used for hedging purposes, the risk that the price of the contract will correlate imperfectly with the prices of the Fund’s securities.
Option Activity
The Fund may buy and sell put and call options, or write put and call options. When an option is written, the Fund receives a premium and becomes obligated to sell or purchase the underlying security, currency or other underlying financial instrument at a fixed price, upon exercise of the option.
Options can be traded through an exchange or through a privately negotiated arrangement with a dealer in an OTC transaction. Options traded through an exchange are generally cleared through a clearinghouse (such as The Options Clearing Corporation). The difference between the premium received or paid, and market value of the option, is recorded as unrealized appreciation or depreciation. The net change in unrealized appreciation or depreciation is reported in the Consolidated Statement of Operations. When an option is exercised, the cost of the security purchased or the proceeds of the security sale are adjusted by the amount of premium received or paid. Upon the expiration or closing of the option transaction, a gain or loss is reported in the Consolidated Statement of Operations.
The Fund has purchased put options on currencies to decrease exposure to foreign exchange rate risk. A purchased put option becomes more valuable as the price of the underlying financial instrument depreciates relative to the strike price.
The Fund has purchased put options on individual equity securities and/or equity indexes to decrease exposure to equity risk. A purchased put option becomes more valuable as the price of the underlying financial instrument depreciates relative to the strike price.
During the reporting period, the Fund had an ending monthly average market value of $1,935,099 purchased put options.
86 OPPENHEIMER FUNDAMENTAL ALTERNATIVES FUND
6. Use of Derivatives (Continued)
Options written, if any, are reported in a schedule following the Consolidated Statement of Investments and as a liability in the Consolidated Statement of Assets and Liabilities. Securities held in collateral accounts to cover potential obligations with respect to outstanding written options are noted in the Consolidated Statement of Investments.
The risk in writing a call option is that the market price of the security increases and if the option is exercised, the Fund must either purchase the security at a higher price for delivery or, if the Fund owns the underlying security, give up the opportunity for profit. The risk in writing a put option is that the Fund may incur a loss if the market price of the security decreases and the option is exercised. The risk in buying an option is that the Fund pays a premium whether or not the option is exercised. The Fund also has the additional risk that there may be an illiquid market where the Fund is unable to close the contract.
The Fund has written put options on currencies to increase exposure to foreign exchange rate risk. A written put option becomes more valuable as the price of the underlying financial instrument appreciates relative to the strike price.
During the reporting period, the Fund had an ending monthly average market value of $164,132 written put options.
Additional associated risks to the Fund include counterparty credit risk and liquidity risk.
Written option activity for the reporting period was as follows:
| | | | | | | | |
| | | Number of
Contracts | | | Amount of Premiums | |
| |
| Options outstanding as of October 30, 2015 | | | – | | | $ | – | |
| Options written | | | 637,500,000 | | | | 792,200 | |
| | | | |
| Options outstanding as of October 31, 2016 | | | 637,500,000 | | | $ | 792,200 | |
| | | | |
Swap Contracts
The Fund may enter into swap contract agreements with a counterparty to exchange a series of cash flows based on either specified reference rates, the price or volatility of asset or non-asset references, or the occurrence of a credit event, over a specified period. Swaps can be executed in a bi-lateral privately negotiated arrangement with a dealer in an OTC transaction (“OTC swaps”) or executed on a regulated market. Certain swaps, regardless of the venue of their execution, are required to be cleared through a clearinghouse (“centrally cleared swaps”). Swap contracts may include interest rate, equity, debt, index, total return, credit default, currency, and volatility swaps.
Swap contracts are reported on a schedule following the Consolidated Statement of Investments. The values of centrally cleared swap and OTC swap contracts are aggregated by positive and negative values and disclosed separately on the Consolidated Statement of Assets and Liabilities. The unrealized appreciation (depreciation) related to the change in the valuation of the notional amount of the swap is combined with the accrued interest due to (owed by) the Fund, if any, at termination or settlement. The net change in this amount during the period is included on the Consolidated Statement of Operations. The Fund also records any
87 OPPENHEIMER FUNDAMENTAL ALTERNATIVES FUND
NOTES TO CONSOLIDATED FINANCIAL STATEMENTS Continued
6. Use of Derivatives (Continued)
periodic payments received from (paid to) the counterparty, including at termination, under such contracts as realized gain (loss) on the Consolidated Statement of Operations.
Swap contract agreements are exposed to the market risk factor of the specific underlying reference rate or asset. Swap contracts are typically more attractively priced compared to similar investments in related cash securities because they isolate the risk to one market risk factor and eliminate the other market risk factors. Investments in cash securities (for instance bonds) have exposure to multiple risk factors (credit and interest rate risk). Because swaps have embedded leverage, they can expose the Fund to substantial risk in the isolated market risk factor.
Credit Default Swap Contracts. A credit default swap is a contract that enables an investor to buy or sell protection against a defined-issuer credit event, such as the issuer’s failure to make timely payments of interest or principal on a debt security, bankruptcy or restructuring. The Fund may enter into credit default swaps either by buying or selling protection on a corporate issuer, sovereign issuer, or a basket or index of issuers (the “reference asset”).
The buyer of protection pays a periodic fee to the seller of protection based on the notional amount of the swap contract. The seller of protection agrees to compensate the buyer of protection for future potential losses as a result of a credit event on the reference asset. The contract effectively transfers the credit event risk of the reference asset from the buyer of protection to the seller of protection.
The ongoing value of the contract will fluctuate throughout the term of the contract based primarily on the credit risk of the reference asset. If the credit quality of the reference asset improves relative to the credit quality at contract initiation, the buyer of protection may have an unrealized loss greater than the anticipated periodic fee owed. This unrealized loss would be the result of current credit protection being cheaper than the cost of credit protection at contract initiation. If the buyer elects to terminate the contract prior to its maturity, and there has been no credit event, this unrealized loss will become realized. If the contract is held to maturity, and there has been no credit event, the realized loss will be equal to the periodic fee paid over the life of the contract.
If there is a credit event, the buyer of protection can exercise its rights under the contract and receive a payment from the seller of protection equal to the notional amount of the swap less the market value of specified debt securities issued by the reference asset. Upon exercise of the contract the difference between such value and the notional amount is recorded as realized gain (loss) and is included on the Consolidated Statement of Operations.
The Fund has sold credit protection through credit default swaps to increase exposure to the credit risk of individual issuers and/or indexes of issuers that are either unavailable or considered to be less attractive in the bond market.
The Fund has purchased credit protection through credit default swaps to decrease exposure to the credit risk of individual issuers and/or indexes of issuers.
The Fund has engaged in spread curve trades by simultaneously purchasing and selling protection through credit default swaps referenced to the same reference asset but with
88 OPPENHEIMER FUNDAMENTAL ALTERNATIVES FUND
6. Use of Derivatives (Continued)
different maturities. Spread curve trades attempt to gain exposure to credit risk on a forward basis by realizing gains on the expected differences in spreads.
The Fund has purchased credit protection through credit default swaps to take an outright negative investment perspective on the credit risk of an individual issuer or basket or index of issuers as opposed to decreasing its credit risk exposure related to debt securities of such issuer(s) held by the Fund.
For the reporting period, the Fund had ending monthly average notional amounts of $230,586,822 and $57,579,198 on credit default swaps to buy protection and credit default swaps to sell protection, respectively.
Additional associated risks to the Fund include counterparty credit risk and liquidity risk.
Interest Rate Swap Contracts. An interest rate swap is an agreement between counterparties to exchange periodic payments based on interest rates. One cash flow stream will typically be a floating rate payment based upon a specified floating interest rate while the other is typically a fixed interest rate.
The Fund has entered into interest rate swaps in which it pays a floating interest rate and receives a fixed interest rate in order to increase exposure to interest rate risk. Typically, if relative interest rates rise, payments made by the Fund under a swap agreement will be greater than the payments received by the Fund.
The Fund has entered into interest rate swaps in which it pays a fixed interest rate and receives a floating interest rate in order to decrease exposure to interest rate risk. Typically, if relative interest rates rise, payments received by the Fund under the swap agreement will be greater than the payments made by the Fund.
For the reporting period, the Fund had ending monthly average notional amounts of $7,189,525 and $17,039,853 on interest rate swaps which pay a fixed rate and interest rate swaps which receive a fixed rate, respectively.
Additional associated risks to the Fund include counterparty credit risk and liquidity risk.
Total Return Swap Contracts. A total return swap is an agreement between counterparties to exchange periodic payments based on the value of asset or non-asset references. One cash flow is typically based on a non-asset reference (such as an interest rate) and the other on the total return of a reference asset (such as a security or a basket of securities or securities index). The total return of the reference asset typically includes appreciation or depreciation on the reference asset, plus any interest or dividend payments.
Total return swap contracts are exposed to the market risk factor of the specific underlying financial instrument or index. Total return swaps are less standard in structure than other types of swaps and can isolate and/or include multiple types of market risk factors including equity risk, credit risk, and interest rate risk.
The Fund has entered into total return swaps on various equity securities or indexes to increase exposure to equity risk. These equity risk related total return swaps require the Fund to pay a floating reference interest rate, and an amount equal to the negative price movement of securities or an index (expressed as a percentage) multiplied by the notional amount of the contract. The Fund will receive payments equal to the positive price movement of the same securities or index (expressed as a percentage) multiplied by the
89 OPPENHEIMER FUNDAMENTAL ALTERNATIVES FUND
NOTES TO CONSOLIDATED FINANCIAL STATEMENTS Continued
6. Use of Derivatives (Continued)
notional amount of the contract and, in some cases, dividends paid on the securities.
The Fund has entered into total return swaps on various equity securities or indexes to decrease exposure to equity risk. These equity risk related total return swaps require the Fund to pay an amount equal to the positive price movement of securities or an index (expressed as a percentage) multiplied by the notional amount of the contract and, in some cases, dividends paid on the securities. The Fund will receive payments of a floating reference interest rate and an amount equal to the negative price movement of the same securities or index (expressed as a percentage) multiplied by the notional amount of the contract.
The Fund has entered into total return swaps to decrease exposure to the credit risk of various indexes or basket of securities. These credit risk related total return swaps require the fund to pay to, or receive payments from, the counterparty based on the movement of credit spreads of the related indexes or securities.
For the reporting period, the Fund had ending monthly average notional amounts of $6,566,515 and $16,581,260 on total return swaps which are long the reference asset and total return swaps which are short the reference asset, respectively.
Additional associated risks to the Fund include counterparty credit risk and liquidity risk.
Swaption Transactions
The Fund may enter into a swaption contract which grants the purchaser the right, but not the obligation, to enter into a swap transaction at preset terms detailed in the underlying agreement within a specified period of time. The purchaser pays a premium to the swaption writer who bears the risk of unfavorable changes in the preset terms on the underlying swap.
Purchased swaptions are reported as a component of investments in the Consolidated Statement of Investments and the Consolidated Statement of Assets and Liabilities. Written swaptions are reported on a schedule following the Consolidated Statement of Investments and their value is reported as a separate asset or liability line item in the Consolidated Statement of Assets and Liabilities. The net change in unrealized appreciation or depreciation on written swaptions is separately reported in the Consolidated Statement of Operations. When a swaption is exercised, the cost of the swap is adjusted by the amount of premium paid or received. Upon the expiration or closing of an unexercised swaption contract, a gain or loss is reported in the Consolidated Statement of Operations for the amount of the premium paid or received.
The Fund generally will incur a greater risk when it writes a swaption than when it purchases a swaption. When the Fund writes a swaption it will become obligated, upon exercise of the swaption, according to the terms of the underlying agreement. Swaption contracts written by the Fund do not give rise to counterparty credit risk prior to exercise as they obligate the Fund, not its counterparty, to perform. When the Fund purchases a swaption it only risks losing the amount of the premium it paid if the swaption expires unexercised. However, when the Fund exercises a purchased swaption there is a risk that the counterparty will fail to perform or otherwise default on its obligations under the swaption contract.
The Fund has purchased swaptions which gives it the option to enter into an interest rate swap in which it pays a fixed interest rate and receives a floating interest rate in order to
90 OPPENHEIMER FUNDAMENTAL ALTERNATIVES FUND
6. Use of Derivatives (Continued)
decrease exposure to interest rate risk. A purchased swaption of this type becomes more valuable as the reference interest rate increases relative to the preset interest rate.
During the reporting period, the Fund had an ending monthly average market value of $3,162,738 on purchased swaptions.
Counterparty Credit Risk. Derivative positions are subject to the risk that the counterparty will not fulfill its obligation to the Fund. The Fund intends to enter into derivative transactions with counterparties that the Manager believes to be creditworthy at the time of the transaction.
The Fund’s risk of loss from counterparty credit risk on OTC derivatives is generally limited to the aggregate unrealized gain netted against any collateral held by the Fund. For OTC options purchased, the Fund bears the risk of loss of the amount of the premiums paid plus the positive change in market values net of any collateral held by the Fund should the counterparty fail to perform under the contracts. Options written by the Fund do not typically give rise to counterparty credit risk, as options written generally obligate the Fund and not the counterparty to perform.
To reduce counterparty risk with respect to OTC transactions, the Fund has entered into master netting arrangements, established within the Fund’s International Swap and Derivatives Association, Inc. (“ISDA”) master agreements, which allow the Fund to make (or to have an entitlement to receive) a single net payment in the event of default (close-out netting) for outstanding payables and receivables with respect to certain OTC positions in swaps, options, swaptions, and forward currency exchange contracts for each individual counterparty. In addition, the Fund may require that certain counterparties post cash and/or securities in collateral accounts to cover their net payment obligations for those derivative contracts subject to ISDA master agreements. If the counterparty fails to perform under these contracts and agreements, the cash and/or securities will be made available to the Fund.
At period end, the Fund has required certain counterparties to post collateral of $3,951,709.
ISDA master agreements include credit related contingent features which allow counterparties to OTC derivatives to terminate derivative contracts prior to maturity in the event that, for example, the Fund’s net assets decline by a stated percentage or the Fund fails to meet the terms of its ISDA master agreements, which would cause the Fund to accelerate payment of any net liability owed to the counterparty.
For financial reporting purposes, the Fund does not offset derivative assets and derivative liabilities that are subject to netting arrangements in the Consolidated Statement of Assets and Liabilities. Bankruptcy or insolvency laws of a particular jurisdiction may impose restrictions on or prohibitions against the right of offset in bankruptcy, insolvency or other events.
The Fund’s risk of loss from counterparty credit risk on exchange-traded derivatives cleared through a clearinghouse and for centrally cleared swaps is generally considered lower than as compared to OTC derivatives. However, counterparty credit risk exists with respect to initial and variation margin deposited/paid by the Fund that is held in futures commission merchant,
91 OPPENHEIMER FUNDAMENTAL ALTERNATIVES FUND
NOTES TO CONSOLIDATED FINANCIAL STATEMENTS Continued
6. Use of Derivatives (Continued)
broker and/or clearinghouse accounts for such exchange-traded derivatives and for centrally cleared swaps.
With respect to centrally cleared swaps, such transactions will be submitted for clearing, and if cleared, will be held in accounts at futures commission merchants or brokers that are members of clearinghouses. While brokers, futures commission merchants and clearinghouses are required to segregate customer margin from their own assets, in the event that a broker, futures commission merchant or clearinghouse becomes insolvent or goes into bankruptcy and at that time there is a shortfall in the aggregate amount of margin held by the broker, futures commission merchant or clearinghouse for all its customers, U.S. bankruptcy laws will typically allocate that shortfall on a pro-rata basis across all the broker’s, futures commission merchant’s or clearinghouse’s customers, potentially resulting in losses to the Fund.
There is the risk that a broker, futures commission merchant or clearinghouse will decline to clear a transaction on the Fund’s behalf, and the Fund may be required to pay a termination fee to the executing broker with whom the Fund initially enters into the transaction. Clearinghouses may also be permitted to terminate centrally cleared swaps at any time. The Fund is also subject to the risk that the broker or futures commission merchant will improperly use the Fund’s assets deposited/paid as initial or variation margin to satisfy payment obligations of another customer. In the event of a default by another customer of the broker or futures commission merchant, the Fund might not receive its variation margin payments from the clearinghouse, due to the manner in which variation margin payments are aggregated for all customers of the broker/futures commission merchant.
Collateral and margin requirements differ by type of derivative. Margin requirements are established by the broker, futures commission merchant or clearinghouse for exchange-traded and cleared derivatives, including centrally cleared swaps. Brokers, futures commission merchants and clearinghouses can ask for margin in excess of the regulatory minimum, or increase the margin amount, in certain circumstances.
Collateral terms are contract specific for OTC derivatives. For derivatives traded under an ISDA master agreement, the collateral requirements are typically calculated by netting the mark to market amount for each transaction under such agreement and comparing that amount to the value of any collateral currently pledged by the Fund or the counterparty.
For financial reporting purposes, cash collateral that has been pledged to cover obligations of the Fund, if any, is reported separately on the Consolidated Statement of Assets and Liabilities as cash pledged as collateral. Non-cash collateral pledged by the Fund, if any, is noted in the Consolidated Statement of Investments. Generally, the amount of collateral due from or to a party must exceed a minimum transfer amount threshold (e.g. $250,000) before a transfer has to be made. To the extent amounts due to the Fund from its counterparties are not fully collateralized, contractually or otherwise, the Fund bears the risk of loss from counterparty nonperformance.
The following table presents by counterparty the Fund’s OTC derivative assets net of the related collateral pledged by the Fund at period end:
92 OPPENHEIMER FUNDAMENTAL ALTERNATIVES FUND
6. Use of Derivatives (Continued)
| | | | | | | | | | | | | | | | | | | | |
| | | | | | Gross Amounts Not Offset in the Consolidated
Statement of Assets & Liabilities | | | | |
| Counterparty | | Gross Amounts
Not Offset in the
Consolidated
Statement of Assets &
Liabilities* | | | Financial
Instruments
Available for
Offset | | | Financial
Instruments
Collateral
Received** | | | Cash Collateral
Received** | | | Net Amount | |
| |
| Bank of America NA | | $ | 877,890 | | | $ | (573,920) | | | $ | – | | | $ | (303,970) | | | $ | – | |
| Barclays Bank plc | | | 492,553 | | | | (276,959) | | | | – | | | | (215,594) | | | | – | |
| BNP Paribas | | | 33,831 | | | | (13,878) | | | | (19,953) | | | | – | | | | – | |
| Citibank NA | | | 1,469,253 | | | | (1,469,253) | | | | – | | | | – | | | | – | |
| Deutsche Bank Securities, Inc. | | | 827,138 | | | | (358,839) | | | | – | | | | (440,000) | | | | 28,299 | |
| Goldman Sachs & Co. | | | 868,315 | | | | – | | | | – | | | | – | | | | 868,315 | |
| Goldman Sachs Bank USA | | | 285,628 | | | | – | | | | – | | | | – | | | | 285,628 | |
| Goldman Sachs Group, Inc. (The) | | | 4,502,946 | | | | (4,502,946) | | | | – | | | | – | | | | – | |
| JPMorgan Chase Bank NA | | | 605,766 | | | | (403,194) | | | | (202,572) | | | | – | | | | – | |
| Royal Bank of Scotland plc (The) | | | 116,235 | | | | – | | | | – | | | | – | | | | 116,235 | |
| | | | |
| | $ | 10,079,555 | | | $ | (7,598,989) | | | $ | (222,525) | | | $ | (959,564) | | | $ | 1,298,477 | |
| | | | |
*OTC derivatives are reported gross on the Consolidated Statement of Assets and Liabilities. Exchange traded options and margin related to centrally cleared swaps and futures, if any, are excluded from these reported amounts.
**Reported collateral posted for the benefit of the Fund within this table is limited to the net outstanding amount due from an individual counterparty. The collateral posted for the benefit of the Fund may exceed these amounts.
The following table presents by counterparty the Fund’s OTC derivative liabilities net of the related collateral pledged by the Fund at period end:
| | | | | | | | | | | | | | | | | | | | |
| | | | | | Gross Amounts Not Offset in the Consolidated
Statement of Assets & Liabilities | | | | |
| Counterparty | | Gross Amounts
Not Offset in the
Consolidated
Statement of Assets &
Liabilities* | | | Financial
Instruments
Available for Offset | | | Financial
Instruments Collateral
Pledged** | | | Cash Collateral
Pledged** | | | Net Amount | |
| |
| Bank of America NA | | $ | (573,920) | | | $ | 573,920 | | | $ | – | | | $ | – | | | $ | – | |
| Barclays Bank plc | | | (276,959) | | | | 276,959 | | | | – | | | | – | | | | – | |
| BNP Paribas | | | (13,878) | | | | 13,878 | | | | – | | | | – | | | | – | |
| Citibank NA | | | (2,556,574) | | | | 1,469,253 | | | | – | | | | 1,030,000 | | | | (57,321) | |
| Deutsche Bank Securities, Inc. | | | (358,839) | | | | 358,839 | | | | – | | | | – | | | | – | |
| Goldman Sachs Group, Inc. (The) | | | (5,994,989) | | | | 4,502,946 | | | | – | | | | – | | | | (1,492,043) | |
| JPMorgan Chase Bank NA | | | (403,194) | | | | 403,194 | | | | – | | | | – | | | | – | |
93 OPPENHEIMER FUNDAMENTAL ALTERNATIVES FUND
NOTES TO CONSOLIDATED FINANCIAL STATEMENTS Continued
6. Use of Derivatives (Continued)
| | | | | | | | | | | | | | | | | | | | |
| | | | | | Gross Amounts Not Offset in the Consolidated
Statement of Assets & Liabilities | | | | |
| Counterparty | | Gross Amounts
Not Offset in the
Consolidated
Statement of Assets &
Liabilities* | | | Financial
Instruments
Available for Offset | | | Financial
Instruments Collateral
Pledged** | | | Cash Collateral
Pledged** | | | Net Amount | |
| |
| Morgan Stanley | | $ | (11,039 | ) | | $ | – | | | $ | – | | | $ | – | | | $ | (11,039) | |
| | | | |
| | $ | (10,189,392 | ) | | $ | 7,598,989 | | | $ | – | | | $ | 1,030,000 | | | $ | (1,560,403) | |
| | | | |
*OTC derivatives are reported gross on the Consolidated Statement of Assets and Liabilities. Exchange traded options and margin related to centrally cleared swaps and futures, if any, are excluded from these reported amounts.
**Reported collateral pledged within this table is limited to the net outstanding amount due from the Fund. The securities pledged as collateral by the Fund as reported on the Consolidated Statements of Investments may exceed these amounts.
The following table presents the valuations of derivative instruments by risk exposure as reported within the Consolidated Statement of Assets and Liabilities at period end:
| | | | | | | | | | | | |
| | | Asset Derivatives | | | Liability Derivatives | |
| | | | | | |
Derivatives Not Accounted for as Hedging Instruments | | Consolidated Statement of Assets and Liabilities Location | | Value | | | Consolidated Statement of Assets and Liabilities Location | | Value | |
| |
| Credit contracts | | Swaps, at value | | | $ 3,210,739 | | | Swaps, at value | | | $ 4,222,921 | |
| Equity contracts | | | | | | | | Swaps, at value | | | 4,202,603 | |
| Interest rate contracts | | Swaps, at value | | | 2,586 | | | Swaps, at value | | | 111,757 | |
| Credit contracts | | Centrally cleared swaps, at value | | | 729,731 | | | Centrally cleared swaps, at value | | | 2,473,374 | |
| Interest rate contracts | | Variation margin receivable | | | 23,089* | | | Variation margin payable | | | 9,453* | |
| Forward currency exchange contracts | | Unrealized appreciation on forward currency exchange contracts | | | 3,615,525 | | | Unrealized depreciation on forward currency exchange contracts | | | 1,598,561 | |
| Forward currency exchange contracts | | | | | | | | Options written, at value | | | 53,550 | |
| Equity contracts | | Investments, at value | | | 1,240,000** | | | | | | | |
| Forward currency exchange contracts | | Investments, at value | | | 1,921,521** | | | | | | | |
| Interest rate contracts | | Investments, at value | | | 1,329,184** | | | | | | | |
| | | | | | | | | | | | |
| Total | | | | | $ 12,072,375 | | | | | | $ 12,672,219 | |
| | | | | | | | | | | | |
*Includes only the current day’s variation margin. Prior variation margin movements have been reflected in cash on the Consolidated Statement of Assets and Liabilities upon receipt or payment.
**Amounts relate to purchased option contracts and purchased swaption contracts, if any.
The effect of derivative instruments on the Consolidated Statement of Operations is as follows:
94 OPPENHEIMER FUNDAMENTAL ALTERNATIVES FUND
6. Use of Derivatives (Continued)
| | | | | | | | | | | | | | | | | | | | |
| Amount of Realized Gain or (Loss) Recognized on Derivatives | |
| |
Derivatives Not Accounted for as Hedging Instruments | | Investment from
unaffiliated companies
(including
premiums on options exercised)* | | | Closing and
expiration of futures contracts | | | Foreign
currency
transactions | | | Swap contracts | | | Total | |
| |
| Credit contracts | | $ | — | | | $ | — | | | $ | — | | | $ | (3,679,391) | | | $ | (3,679,391) | |
| Equity contracts | | | 101,960 | | | | — | | | | — | | | | (3,745,697) | | | | (3,643,737) | |
| Forward currency exchange contracts | | | 261,347 | | | | — | | | | (3,167,053) | | | | — | | | | (2,905,706) | |
| Interest rate contracts | | | (5,058,134) | | | | (1,497,246) | | | | — | | | | — | | | | (6,555,380) | |
| | | | |
| Total | | $ | (4,694,827) | | | $ | (1,497,246) | | | $ | (3,167,053) | | | $ | (7,425,088) | | | $ | (16,784,214) | |
| | | | |
*Includes purchased option contracts, purchased swaption contracts, written option contracts exercised and written swaption contracts exercised if any.
| | | | | | | | | | | | | | | | |
| Amount of Change in Unrealized Gain or (Loss) Recognized on Derivatives | |
| |
Derivatives Not Accounted for as Hedging Instruments | | Investments* | | | Option contracts
written | | | Futures
contracts | | | Translation
of assets and
liabilities
denominated in foreign
currencies | |
| |
| Credit contracts | | $ | — | | | $ | — | | | $ | — | | | $ | — | |
| Equity contracts | | | 1,240,000 | | | | — | | | | — | | | | — | |
| Forward currency exchange contracts | | | (1,040,407 | ) | | | 738,650 | | | | — | | | | 1,279,319 | |
| Interest rate contracts | | | 899,650 | | | | — | | | | 958,614 | | | | — | |
| | | | |
| Total | | $ | 1,099,243 | | | $ | 738,650 | | | $ | 958,614 | | | $ | 1,279,319 | |
| | | | |
| | | | | | | | |
| Amount of Change in Unrealized Gain or (Loss) Recognized on Derivatives | |
| |
Derivatives Not Accounted for as Hedging Instruments | | Swap contracts | | | Total | |
| |
Credit contracts | | $ | (3,145,426) | | | $ | (3,145,426) | |
Equity contracts | | | (1,999,526) | | | | (759,526) | |
Forward currency exchange contracts | | | — | | | | 977,562 | |
Interest rate contracts | | | (170,440) | | | | 1,687,824 | |
| | | | |
Total | | $ | (5,315,392) | | | $ | (1,239,566) | |
| | | | |
*Includes purchased option contracts and purchased swaption contracts, if any.
7. Shares of Beneficial Interest
The Fund has authorized an unlimited number of $0.01 par value shares of beneficial interest
95 OPPENHEIMER FUNDAMENTAL ALTERNATIVES FUND
NOTES TO CONSOLIDATED FINANCIAL STATEMENTS Continued
7. Shares of Beneficial Interest (Continued)
of each class. Transactions in shares of beneficial interest were as follows:
| | | | | | | | | | | | | | | | | | |
| | | Year Ended October 31, 2016 | | | | | Year Ended October 30, 20151 | |
| | | Shares | | | Amount | | | | | Shares | | | Amount | |
| |
Class A | | | | | | | | | | | | | | | | | | |
Sold | | | 6,402,109 | | | $ | 170,647,881 | | | | | | 2,747,796 | | | $ | 73,610,677 | |
Dividends and/or distributions reinvested | | | 126,225 | | | | 3,386,154 | | | | | | 419,970 | | | | 11,036,800 | |
Redeemed | | | (5,140,436 | ) | | | (137,150,519 | ) | | | | | (3,488,073 | ) | | | (93,256,588) | |
| | | | |
Net increase (decrease) | | | 1,387,898 | | | $ | 36,883,516 | | | | | | (320,307 | ) | | $ | (8,609,111) | |
| | | | |
| | | | | | | | | | | | | | | | | | |
| |
Class B | | | | | | | | | | | | | | | | | | |
Sold | | | 25,484 | | | $ | 605,272 | | | | | | 15,739 | | | $ | 377,454 | |
Dividends and/or distributions reinvested | | | 1,728 | | | | 41,404 | | | | | | 10,988 | | | | 260,095 | |
Redeemed | | | (307,360 | ) | | | (7,325,938 | ) | | | | | (499,532 | ) | | | (11,973,742) | |
| | | | |
Net decrease | | | (280,148 | ) | | $ | (6,679,262 | ) | | | | | (472,805 | ) | | $ | (11,336,193) | |
| | | | |
| | | | | | | | | | | | | | | | | | |
| |
Class C | | | | | | | | | | | | | | | | | | |
Sold | | | 2,234,739 | | | $ | 53,218,927 | | | | | | 947,430 | | | $ | 22,745,866 | |
Dividends and/or distributions reinvested | | | 16,779 | | | | 402,017 | | | | | | 56,544 | | | | 1,338,398 | |
Redeemed | | | (1,259,356 | ) | | | (29,952,495 | ) | | | | | (773,115 | ) | | | (18,545,940) | |
| | | | |
Net increase | | | 992,162 | | | $ | 23,668,449 | | | | | | 230,859 | | | $ | 5,538,324 | |
| | | | |
| | | | | | | | | | | | | | | | | | |
| |
Class I | | | | | | | | | | | | | | | | | | |
Sold | | | 3,768,914 | | | $ | 103,127,543 | | | | | | 2,344,685 | | | $ | 64,807,277 | |
Dividends and/or distributions reinvested | | | 18,652 | | | | 513,881 | | | | | | — | | | | — | |
Redeemed | | | (1,179,304 | ) | | | (32,394,209 | ) | | | | | (214,076 | ) | | | (5,893,944) | |
| | | | |
Net increase | | | 2,608,262 | | | $ | 71,247,215 | | | | | | 2,130,609 | | | $ | 58,913,333 | |
| | | | |
| | | | | | | | | | | | | | | | | | |
| |
Class R | | | | | | | | | | | | | | | | | | |
Sold | | | 308,286 | | | $ | 7,886,480 | | | | | | 126,438 | | | $ | 3,251,422 | |
Dividends and/or distributions reinvested | | | 2,175 | | | | 55,891 | | | | | | 10,202 | | | | 257,596 | |
Redeemed | | | (172,167 | ) | | | (4,400,124 | ) | | | | | (151,535 | ) | | | (3,890,027) | |
| | | | |
Net increase (decrease) | | | 138,294 | | | $ | 3,542,247 | | | | | | (14,895 | ) | | $ | (381,009) | |
| | | | |
| | | | | | | | | | | | | | | | | | |
| |
Class Y | | | | | | | | | | | | | | | | | | |
Sold | | | 16,851,836 | | | $ | 458,803,009 | | | | | | 3,035,636 | | | $ | 83,471,376 | |
Dividends and/or distributions reinvested | | | 29,335 | | | | 805,201 | | | | | | 13,913 | | | | 374,117 | |
Redeemed | | | (5,516,467 | ) | | | (150,491,770 | ) | | | | | (606,971 | ) | | | (16,624,767) | |
| | | | |
Net increase | | | 11,364,704 | | | $ | 309,116,440 | | | | | | 2,442,578 | | | $ | 67,220,726 | |
| | | | |
1. Represents the last business day of the Fund’s reporting period.
8. Purchases and Sales of Securities
The aggregate cost of purchases and proceeds from sales of securities, other than short-term obligations and investments in IGMMF, for the reporting period were as follows:
96 OPPENHEIMER FUNDAMENTAL ALTERNATIVES FUND
8. Purchases and Sales of Securities (Continued)
| | | | |
| | | Purchases | | Sales |
|
| Investment securities | | $1,041,306,820 | | $908,006,078 |
9. Fees and Other Transactions with Affiliates
Management Fees. Under the investment advisory agreement, the Fund pays the Manager a management fee based on the daily net assets of the Fund at an annual rate as shown in the following table:
| | | | |
| Fee Schedule | | | |
| |
| Up to $1.0 billion | | | 0.85% | |
| Next $500 million | | | 0.80 | |
| Next $500 million | | | 0.75 | |
| Next $500 million | | | 0.70 | |
| Next $500 million | | | 0.65 | |
| Next $500 million | | | 0.60 | |
| Next $500 million | | | 0.55 | |
| Over $4.0 billion | | | 0.50 | |
The Manager also provides investment management related services to the Subsidiary. The Subsidiary pays the Manager a monthly management fee at an annual rate according to the above schedule. The Subsidiary also pays certain other expenses including custody and directors’ fees.
The Fund’s effective management fee for the reporting period was 0.84% of average annual net assets before any Subsidiary management fees or any applicable waivers.
Sub-Adviser Fees. The Manager has retained the Sub-Adviser to provide the day-to-day portfolio management of the Fund and the Subsidiary. Under the Sub-Advisory Agreement, the Manager pays the Sub-Adviser an annual fee in monthly installments, equal to a percentage of the investment management fee collected by the Manager from the Fund and the Subsidiary, which shall be calculated after any investment management fee waivers. The fee paid to the Sub-Adviser is paid by the Manager, not by the Fund.
Transfer Agent Fees. OFI Global (the “Transfer Agent”) serves as the transfer and shareholder servicing agent for the Fund. The Fund pays the Transfer Agent a fee based on annual net assets. Fees incurred and average net assets for each class with respect to these services are detailed in the Consolidated Statement of Operations and Consolidated Financial Highlights, respectively.
Sub-Transfer Agent Fees. The Transfer Agent has retained Shareholder Services, Inc., a wholly-owned subsidiary of OFI (the “Sub-Transfer Agent”), to provide the day-to-day transfer agent and shareholder servicing of the Fund. Under the Sub-Transfer Agency Agreement, the Transfer Agent pays the Sub-Transfer Agent an annual fee in monthly installments, equal to a percentage of the transfer agent fee collected by the Transfer Agent from the Fund, which shall be calculated after any applicable fee waivers. The fee paid to the Sub-Transfer Agent is paid by the Transfer Agent, not by the Fund.
97 OPPENHEIMER FUNDAMENTAL ALTERNATIVES FUND
NOTES TO CONSOLIDATED FINANCIAL STATEMENTS Continued
9. Fees and Other Transactions with Affiliates (Continued)
Trustees’ Compensation. The Fund has adopted an unfunded retirement plan (the “Plan”) for the Fund’s Independent Trustees. Benefits are based on years of service and fees paid to each Trustee during their period of service. The Plan was frozen with respect to adding new participants effective December 31, 2006 (the “Freeze Date”) and existing Plan Participants as of the Freeze Date will continue to receive accrued benefits under the Plan. Active Independent Trustees as of the Freeze Date have each elected a distribution method with respect to their benefits under the Plan. During the reporting period, the Fund’s projected benefit obligations, payments to retired Trustees and accumulated liability were as follows:
| | | | |
Projected Benefit Obligations Increased | | $ | 1,328 | |
Payments Made to Retired Trustees | | | 29,914 | |
Accumulated Liability as of October 31, 2016 | | | 116,578 | |
The Fund’s Board of Trustees (“Board”) has adopted a compensation deferral plan for Independent Trustees that enables Trustees to elect to defer receipt of all or a portion of the annual compensation they are entitled to receive from the Fund. For purposes of determining the amount owed to the Trustee under the plan, deferred amounts are treated as though equal dollar amounts had been invested in shares of the Fund or in other Oppenheimer funds selected by the Trustee. The Fund purchases shares of the funds selected for deferral by the Trustee in amounts equal to his or her deemed investment, resulting in a Fund asset equal to the deferred compensation liability. Such assets are included as a component of “Other” within the asset section of the Consolidated Statement of Assets and Liabilities. Deferral of Trustees’ fees under the plan will not affect the net assets of the Fund and will not materially affect the Fund’s assets, liabilities or net investment income per share. Amounts will be deferred until distributed in accordance with the compensation deferral plan.
Distribution and Service Plan (12b-1) Fees. Under its General Distributor’s Agreement with the Fund, OppenheimerFunds Distributor, Inc. (the “Distributor”) acts as the Fund’s principal underwriter in the continuous public offering of the Fund’s classes of shares.
Distribution and Service Plan for Class A Shares. The Fund has adopted a Distribution and Service Plan (the “Plan”) for Class A shares pursuant to Rule 12b-1 under the 1940 Act. Under the Plan, the Fund pays a service fee to the Distributor at an annual rate of 0.25% of the daily net assets of Class A shares. The Distributor currently uses all of those fees to pay dealers, brokers, banks and other financial institutions periodically for providing personal services and maintenance of accounts of their customers that hold Class A shares. Under the Plan, the Fund may also pay an asset-based sales charge to the Distributor. However, the Fund’s Board has currently set the rate at zero. Fees incurred by the Fund under the Plan are detailed in the Consolidated Statement of Operations.
Distribution and Service Plans for Class B, Class C and Class R Shares. The Fund has adopted Distribution and Service Plans (the “Plans”) for Class B, Class C and Class R shares pursuant to Rule 12b-1 under the 1940 Act to compensate the Distributor for distributing
98 OPPENHEIMER FUNDAMENTAL ALTERNATIVES FUND
9. Fees and Other Transactions with Affiliates (Continued)
those share classes, maintaining accounts and providing shareholder services. Under the Plans, the Fund pays the Distributor an annual asset-based sales charge of 0.75% on Class B and Class C shares’ daily net assets and 0.25% on Class R shares’ daily net assets. The Fund also pays a service fee under the Plans at an annual rate of 0.25% of daily net assets. The Plans continue in effect from year to year only if the Fund’s Board of Trustees votes annually to approve their continuance at an in person meeting called for that purpose. Fees incurred by the Fund under the Plans are detailed in the Consolidated Statement of Operations.
Sales Charges. Front-end sales charges and CDSC do not represent expenses of the Fund. They are deducted from the proceeds of sales of Fund shares prior to investment or from redemption proceeds prior to remittance, as applicable. The sales charges retained by the Distributor from the sale of shares and the CDSC retained by the Distributor on the redemption of shares is shown in the following table for the period indicated.
| | | | | | | | | | | | | | | | | | | | |
| Year Ended | | Class A
Front-End
Sales Charges
Retained by
Distributor | | | Class A
Contingent
Deferred
Sales Charges
Retained by
Distributor | | | Class B
Contingent
Deferred
Sales Charges
Retained by
Distributor | | | Class C
Contingent
Deferred
Sales Charges
Retained by
Distributor | | | Class R Contingent Deferred Sales Charges Retained by Distributor | |
| |
October 31, 2016 | | | $166,145 | | | | $539 | | | | $12,741 | | | | $21,397 | | | | $— | |
Waivers and Reimbursements of Expenses. The Manager has contractually agreed to waive the management fee it receives from the Fund in an amount equal to the management fee it receives from the Subsidiary. During the reporting period, the Manager waived $279,743.
The Manager will waive fees and/or reimburse Fund expenses in an amount equal to the indirect management fees incurred through the Fund’s investments in underlying funds managed by the Manager or its affiliates. During the reporting period, the Manager waived fees and/or reimbursed the Fund $202,086 for management fees.
Waivers and/or reimbursements may be modified or terminated as set forth according to the terms in the prospectus.
10. Borrowings and Other Financing
Securities Sold Short. The Fund sells securities that it does not own, and it will therefore be obligated to purchase such securities at a future date. Upon entering into a short position, the Fund is required to segregate cash or securities at its custodian which are pledged for the benefit of the lending broker and/or to deposit and pledge cash directly at the lending broker, with a value equal to a certain percentage, exceeding 100%, of the value of the securities that it sold short. Cash that has been segregated and pledged for this purpose will be disclosed on the Consolidated Statement of Assets and Liabilities; securities that have been segregated and pledged for this purpose are disclosed as such in the Consolidated Statement of Investments. The aggregate market value of such cash and securities at period end is $541,408,633. The
99 OPPENHEIMER FUNDAMENTAL ALTERNATIVES FUND
NOTES TO CONSOLIDATED FINANCIAL STATEMENTS Continued
10. Borrowings and Other Financing (Continued)
value of the open short position is recorded as a liability, and the Fund records an unrealized gain or loss to the extent of the difference between the proceeds received and the change in value of the open short position. The Fund records a realized gain or loss when the short position is closed out. By entering into short sales, the Fund bears the market risk of increases in value of the security sold short in excess of the proceeds received. Until the security is replaced, the Fund is required to pay the lender any dividend or interest earned. Dividend expense on short sales is treated as an expense in the Consolidated Statement of Operations.
Joint Credit Facility. A number of mutual funds managed by the Manager participate in a $1.3 billion revolving credit facility (the “Facility”) intended to provide short-term financing, if necessary, subject to certain restrictions in connection with atypical redemption activity. Expenses and fees related to the Facility are paid by the participating funds and are disclosed separately or as other expenses on the Consolidated Statement of Operations. The Fund did not utilize the Facility during the reporting period.
Loan Commitments. Pursuant to the terms of certain credit agreements, the Fund has unfunded loan commitments of $14,592 at period end. The Fund generally will maintain with its custodian, liquid investments having an aggregate value at least equal to the par value of unfunded loan commitments. At period end, these commitments have a market value of $14,563 and have been included as Corporate Loans in the Consolidated Statement of Investments. The following commitments are subject to funding based on the borrower’s discretion. The Fund is obligated to fund these commitments at the time of the request by the borrower. These commitments have been excluded from the Consolidated Statement of Investments.
11. Pending Litigation
In 2009, several putative class action lawsuits were filed and later consolidated before the U.S. District Court for the District of Colorado in connection with the investment performance of Oppenheimer Rochester California Municipal Fund (the “California Fund”), a fund advised by OppenheimerFunds, Inc. (“OFI”) and distributed by OppenheimerFunds Distributor, Inc. (“OFDI”). The plaintiffs asserted claims against OFI, OFDI and certain present and former trustees and officers of the California Fund under the federal securities laws, alleging, among other things, that the disclosure documents of the California Fund contained misrepresentations and omissions and the investment policies of the California Fund were not followed. An amended complaint and a motion to dismiss were filed, and in 2011, the court issued an order which granted in part and denied in part the defendants’ motion to dismiss. In October 2015, following a successful appeal by defendants and a subsequent hearing, the court granted plaintiffs’ motion for class certification and appointed class representatives and class counsel.
OFI and OFDI believe the suit is without merit; that it is premature to render any opinion as to the likelihood of an outcome unfavorable to them in the suit; and that no estimate can yet
100 OPPENHEIMER FUNDAMENTAL ALTERNATIVES FUND
11. Pending Litigation (Continued)
be made as to the amount or range of any potential loss. Furthermore, OFI believes that the suit should not impair the ability of OFI or OFDI to perform their respective duties to the Fund and that the outcome of the suit should not have any material effect on the operations of any of the Oppenheimer funds.
101 OPPENHEIMER FUNDAMENTAL ALTERNATIVES FUND
REPORT OF INDEPENDENT REGISTERED PUBLIC ACCOUNTING FIRM
The Board of Trustees and Shareholders of Oppenheimer Quest For Value Funds:
We have audited the accompanying consolidated statement of assets and liabilities of Oppenheimer Fundamental Alternatives Fund (a series of Oppenheimer Quest For Value Funds) and subsidiary, including the consolidated statement of investments, as of October 31, 2016, and the related consolidated statement of operations for the year then ended, the consolidated statements of changes in net assets for each of the years in the two-year period then ended, and the consolidated financial highlights for each of the years or periods in the five-year period then ended. These consolidated financial statements and consolidated financial highlights are the responsibility of the Fund’s management. Our responsibility is to express an opinion on these consolidated financial statements and consolidated financial highlights based on our audits.
We conducted our audits in accordance with the standards of the Public Company Accounting Oversight Board (United States). Those standards require that we plan and perform the audit to obtain reasonable assurance about whether the financial statements and financial highlights are free of material misstatement. An audit includes examining, on a test basis, evidence supporting the amounts and disclosures in the financial statements. Our procedures included confirmation of securities owned as of October 31, 2016, by correspondence with the custodian, transfer agent and brokers, or by other appropriate auditing procedures where replies from brokers were not received. An audit also includes assessing the accounting principles used and significant estimates made by management, as well as evaluating the overall financial statement presentation. We believe that our audits provide a reasonable basis for our opinion.
In our opinion, the consolidated financial statements and consolidated financial highlights referred to above present fairly, in all material respects, the financial position of Oppenheimer Fundamental Alternatives Fund and subsidiary as of October 31, 2016, the results of their operations for the year then ended, the changes in their net assets for each of the years in the two-year period then ended, and the consolidated financial highlights for each of the years or periods in the five-year period then ended, in conformity with U.S. generally accepted accounting principles.
KPMG LLP
Denver, Colorado
December 22, 2016
102 OPPENHEIMER FUNDAMENTAL ALTERNATIVES FUND
FEDERAL INCOME TAX INFORMATION Unaudited
In early 2016, if applicable, shareholders of record received information regarding all dividends and distributions paid to them by the Fund during calendar year 2015.
Dividends, if any, paid by the Fund during the reporting period which are not designated as capital gain distributions should be multiplied by the maximum amount allowable but not less than 100.00% to arrive at the amount eligible for the corporate dividend-received deduction.
A portion, if any, of the dividends paid by the Fund during the reporting period which are not designated as capital gain distributions are eligible for lower individual income tax rates to the extent that the Fund has received qualified dividend income as stipulated by recent tax legislation. The maximum amount allowable but not less than $15,472,976 of the Fund’s fiscal year taxable income may be eligible for the lower individual income tax rates. In early 2016, shareholders of record received information regarding the percentage of distributions that are eligible for lower individual income tax rates.
Recent tax legislation allows a regulated investment company to designate distributions not designated as capital gain distributions, as either interest related dividends or short-term capital gain dividends, both of which are exempt from the U.S. withholding tax applicable to non U.S. taxpayers. For the reporting period, the maximum amount allowable but not less than $1,170,582 of the ordinary distributions to be paid by the Fund qualifies as an interest related dividend.
The foregoing information is presented to assist shareholders in reporting distributions received from the Fund to the Internal Revenue Service. Because of the complexity of the federal regulations which may affect your individual tax return and the many variations in state and local tax regulations, we recommend that you consult your tax advisor for specific guidance.
103 OPPENHEIMER FUNDAMENTAL ALTERNATIVES FUND
BOARD APPROVAL OF THE FUND’S INVESTMENT ADVISORY
AND SUB-ADVISORY AGREEMENTS Unaudited
The Fund has entered into an investment advisory agreement with OFI Global Asset Management, Inc. (“OFI Global” or the “Adviser”), a wholly-owned subsidiary of OppenheimerFunds, Inc. (“OFI” or the “Sub-Adviser”) (“OFI Global” and “OFI” together the “Managers”) and OFI Global has entered into a sub-advisory agreement with OFI whereby OFI provides investment sub-advisory services to the Fund (collectively, the “Agreements”). Each year, the Board of Trustees (the “Board”), including a majority of the independent Trustees, is required to determine whether to approve the terms of the Agreements and the renewal thereof. The Investment Company Act of 1940, as amended, requires that the Board request and evaluate, and that the Managers provide, such information as may be reasonably necessary to evaluate the terms of the Agreements. The Board employs an independent consultant to prepare a report that provides information, including comparative information that the Board requests for that purpose. In addition to in-person meetings focused on this evaluation, the Board receives information throughout the year regarding Fund services, fees, expenses and performance.
The Managers and the independent consultant provided information to the Board on the following factors: (i) the nature, quality and extent of the Managers’ services, (ii) the comparative investment performance of the Fund and the Managers, (iii) the fees and expenses of the Fund, including comparative fee and expense information, (iv) the profitability of the Managers and their affiliates, including an analysis of the cost of providing services, (v) whether economies of scale are realized as the Fund grows and whether fee levels reflect these economies of scale for Fund investors and (vi) other benefits to the Managers from their relationship with the Fund. The Board was aware that there are alternatives to retaining the Managers.
Outlined below is a summary of the principal information considered by the Board as well as the Board’s conclusions.
Nature, Quality and Extent of Services. The Board considered information about the nature, quality and extent of the services provided to the Fund and information regarding the Managers’ key personnel who provide such services. The Managers’ duties include providing the Fund with the services of the portfolio manager and the Sub-Adviser’s investment team, who provide research, analysis and other advisory services in regard to the Fund’s investments; and securities trading services. OFI Global is responsible for oversight of third-party service providers; monitoring compliance with applicable Fund policies and procedures and adherence to the Fund’s investment restrictions; risk management; and oversight of the Sub-Adviser. OFI Global is also responsible for providing certain administrative services to the Fund. Those services include providing and supervising all administrative and clerical personnel who are necessary in order to provide effective corporate administration for the Fund; compiling and maintaining records with respect to the Fund’s operations; preparing and filing reports required by the U.S. Securities and Exchange Commission; preparing periodic reports regarding the operations of the Fund for its shareholders; preparing proxy materials for shareholder meetings; and preparing the registration statements required by federal and state securities laws for the sale of the Fund’s shares. OFI Global also provides the Fund with office space, facilities and equipment.
104 OPPENHEIMER FUNDAMENTAL ALTERNATIVES FUND
The Board also considered the quality of the services provided and the quality of the Managers’ resources that are available to the Fund. The Board took account of the fact that the Sub-Adviser has over fifty years of experience as an investment adviser and that its assets under management rank it among the top mutual fund managers in the United States. The Board evaluated the Managers’ advisory, administrative, accounting, legal, compliance and risk management services, and information the Board has received regarding the experience and professional qualifications of the Managers’ key personnel and the size and functions of its staff. In its evaluation of the quality of the portfolio management services provided, the Board considered the experience of Michelle Borré, the portfolio manager for the Fund, and the Sub-Adviser’s investment team and analysts. The Board members also considered the totality of their experiences with the Managers as directors or trustees of the Fund and other funds advised by the Managers. The Board considered information regarding the quality of services provided by affiliates of the Managers, which the Board members have become knowledgeable about through their experiences with the Managers and in connection with the renewal of the Fund’s service agreements. The Board concluded, in light of the Managers’ experience, reputation, personnel, operations and resources that the Fund benefits from the services provided under the Agreements.
Investment Performance of the Managers and the Fund. Throughout the year, the Managers provided information on the investment performance of the Fund, the Adviser and the Sub-Adviser, including comparative performance information. The Board also reviewed information, prepared by the Managers and by the independent consultant, comparing the Fund’s historical performance to relevant benchmarks or market indices and to the performance of other retail funds in the multialternative category. The Board noted that the Fund’s one-year, three-year, and ten-year performance was better than its category median although its five-year performance was below its category median.
Fees and Expenses of the Fund. The Board reviewed the fees paid to the Adviser and the other expenses borne by the Fund. The independent consultant provided comparative data in regard to the fees and expenses of the Fund and other retail front-end load multialternative funds with comparable asset levels and distribution features. The Board noted that the Fund’s contractual management fee was lower than its peer group median and category median. The Board also noted that the Fund’s total expenses were higher than its peer group median category median.
Economies of Scale and Profits Realized by the Managers. The Board considered information regarding the Managers’ costs in serving as the Fund’s investment adviser and sub-adviser, including the costs associated with the personnel and systems necessary to manage the Fund, and information regarding the Managers’ profitability from their relationship with the Fund. The Board also considered that the Managers must be able to pay and retain experienced professional personnel at competitive rates to provide quality services to the Fund. The Board reviewed whether the Managers may realize economies of scale in managing and supporting the Fund. The Board noted that the Fund currently has management fee breakpoints, which are intended to share with Fund shareholders economies of scale that may exist as the Fund’s assets grow.
105 OPPENHEIMER FUNDAMENTAL ALTERNATIVES FUND
BOARD APPROVAL OF THE FUND’S INVESTMENT ADVISORY
AND SUB-ADVISORY AGREEMENTS Unaudited / Continued
Other Benefits to the Managers. In addition to considering the profits realized by the Managers, the Board considered information that was provided regarding the direct and indirect benefits the Managers receive as a result of their relationship with the Fund, including compensation paid to the Managers’ affiliates and research provided to the Adviser in connection with permissible brokerage arrangements (soft dollar arrangements).
Conclusions. These factors were also considered by the independent Trustees meeting separately from the full Board, assisted by experienced counsel to the Fund and to the independent Trustees. Fund counsel and the independent Trustees’ counsel are independent of the Managers within the meaning and intent of the Securities and Exchange Commission Rules.
Based on its review of the information it received and its evaluations described above, the Board, including a majority of the independent Trustees, decided to continue the Agreements through September 30, 2017. In arriving at its decision, the Board did not identify any factor or factors as being more important than others, but considered all of the above information, and considered the terms and conditions of the Agreements, including the management fees, in light of all the surrounding circumstances.
106 OPPENHEIMER FUNDAMENTAL ALTERNATIVES FUND
PORTFOLIO PROXY VOTING POLICES AND GUIDELINES;
UPDATES TO STATEMENTS OF INVESTMENTS Unaudited
The Fund has adopted Portfolio Proxy Voting Policies and Guidelines under which the Fund votes proxies relating to securities (“portfolio proxies”) held by the Fund. A description of the Fund’s Portfolio Proxy Voting Policies and Guidelines is available (i) without charge, upon request, by calling the Fund toll-free at 1.800.CALL OPP (225.5677), (ii) on the Fund’s website at www.oppenheimerfunds.com, and (iii) on the SEC’s website at www.sec.gov. In addition, the Fund is required to file Form N-PX, with its complete proxy voting record for the 12 months ended June 30th, no later than August 31st of each year. The Fund’s voting record is available (i) without charge, upon request, by calling the Fund toll-free at 1.800.CALL OPP (225.5677), and (ii) in the Form N-PX filing on the SEC’s website at www.sec.gov.
The Fund files its complete schedule of portfolio holdings with the SEC for the first quarter and the third quarter of each fiscal year on Form N-Q. The Fund’s Form N-Q filings are available on the SEC’s website at www.sec.gov. Those forms may be reviewed and copied at the SEC’s Public Reference Room in Washington, D.C. Information on the operation of the Public Reference Room may be obtained by calling 1-800-SEC-0330.
Householding—Delivery of Shareholder Documents
This is to inform you about OppenheimerFunds’ “householding” policy. If more than one member of your household maintains an account in a particular fund, OppenheimerFunds will mail only one copy of the fund’s prospectus (or, if available, the fund’s summary prospectus), annual and semiannual report and privacy policy. The consolidation of these mailings, called householding, benefits your fund through reduced mailing expense, and benefits you by reducing the volume of mail you receive from OppenheimerFunds. Householding does not affect the delivery of your account statements.
Please note that we will continue to household these mailings for as long as you remain an OppenheimerFunds shareholder, unless you request otherwise. If you prefer to receive multiple copies of these materials, please call us at 1.800.CALL-OPP (225-5677). You may also notify us in writing or via email. We will begin sending you individual copies of the prospectus (or, if available, the summary prospectus), reports and privacy policy within 30 days of receiving your request to stop householding.
107 OPPENHEIMER FUNDAMENTAL ALTERNATIVES FUND
TRUSTEES AND OFFICERS Unaudited
| | |
Name, Position(s) Held with the Fund, Length of Service, Year of Birth | | Principal Occupation(s) During the Past 5 Years; Other Trusteeships/ Directorships Held; Number of Portfolios in the Fund Complex Currently Overseen |
| |
| INDEPENDENT TRUSTEES | | The address of each Trustee in the chart below is 6803 S. Tucson Way, Centennial, Colorado 80112-3924. Each Trustee serves for an indefinite term, or until his or her resignation, retirement, death or removal. |
| |
Brian F. Wruble, Chairman of the Board of Trustees (since 2009), Trustee (since 2001) Year of Birth: 1943 | | Governor and Vice Chairman of Community Foundation of the Florida Keys (non- profit) (since July 2012); Director of TCP Capital, Inc. (since November 2015); Chairman Emeritus and Trustee (since August 2011) of The Jackson Laboratory (non-profit); Member of Zurich Insurance Group’s Investment Management Advisory Council (insurance) (since 2004); Treasurer (since 2007) and Trustee of the Institute for Advanced Study (non-profit educational institute) (since May 1992); Director of Special Value Opportunities Fund, LLC (registered investment company) (affiliate of the Sub-Adviser’s parent company) (September 2004- June 2015); General Partner of Odyssey Partners, L.P. (hedge fund) (September 1995-December 2007); Special Limited Partner of Odyssey Investment Partners, LLC (private equity investment) (January 1999-September 2004). Mr. Wruble has served on the Boards of certain Oppenheimer funds since April 2001, during which time he has become familiar with the Fund’s (and other Oppenheimer funds’) financial, accounting, regulatory and investment matters and has contributed to the Boards’ deliberations. Oversees 55 portfolios in the OppenheimerFunds complex. Mr. Wruble has served on the Boards of certain Oppenheimer funds since April 2001, during which time he has become familiar with the Fund’s (and other Oppenheimer funds’) financial, accounting, regulatory and investment matters and has contributed to the Boards’ deliberations. |
| |
Beth Ann Brown, Trustee (since 2016) Year of Birth: 1968 | | Advisor, Board of Advisors of Caron Engineering Inc. (since December 2014); Independent Consultant (since September 2012); held the following positions at Columbia Management Investment Advisers LLC: Head of Intermediary Distribution (2008-2012), Managing Director, Strategic Relations (2005-2008), Managing Director, Head of National Accounts (2004-2005); Senior Vice President, National Account Manager (2002-2004), Senior Vice President, Key Account Manager (1999-2002) and Vice President, Key Account Manager (1996-1999) of Liberty Funds Distributor, Inc.; President and Director, of Acton Shapleigh Youth Conservation Corps (non-profit) (since 2012); and Vice President and Director of Grahamtastic Connection (non-profit) (since May 2013). Oversees 55 portfolios in the OppenheimerFunds complex. Ms. Brown has served on the Boards of certain Oppenheimer funds since January 2016, during which time she has become familiar with the Fund’s (and other Oppenheimer funds’) financial, accounting, regulatory and investment matters and has contributed to the Boards’ deliberations. |
| |
Matthew P. Fink, Trustee (since 2009) Year of Birth: 1941 | | Trustee of the Committee for Economic Development (policy research foundation) (2005-2011); Director of ICI Education Foundation (education foundation) (October 1991-August 2006); President of the Investment Company Institute (trade association) (October 1991-June 2004); Director of ICI Mutual Insurance Company (insurance company) (October 1991-June 2004); Author of The Rise of Mutual Funds: An Insider’s View published by Oxford University Press (second edition 2011). Oversees 55 portfolios in the OppenheimerFunds complex. Mr. Fink has served on the Boards of certain Oppenheimer funds since January 2005, during which time he has become familiar with the Fund’s (and other Oppenheimer funds’) financial, accounting, regulatory and investment matters and has contributed to the Boards’ deliberations. |
108 OPPENHEIMER FUNDAMENTAL ALTERNATIVES FUND
| | |
| |
Edmund P. Giambastiani, Jr., Trustee (since 2013) Year of Birth: 1948 | | Advisory Board Member of the Maxwell School of Citizenship and Public Affairs of Syracuse University (since April 2012); Director of Mercury Defense Systems Inc. (information technology) (August 2011-February 2013); Trustee of the U.S. Naval Academy Foundation (since November 2010); Advisory Board Member of the Massachusetts Institute of Technology Lincoln Laboratory (federally-funded research development center) (since May 2010); Director of The Boeing Company (aerospace and defense) (since October 2009); Trustee of MITRE Corporation (federally-funded research development center) (since September 2008); Independent Director of QinetiQ Group Plc (defense technology and security) (February 2008-August 2011); Chairman of Monster Worldwide, Inc. (on-line career services) (since March 2015), Lead Director (June 2011-March 2015); Chairman of Alenia North America, Inc. (military and defense products) (January 2008-October 2009); Director of SRA International, Inc. (information technology and services) (January 2008-July 2011); President of Giambastiani Group LLC (national security and energy consulting) (since October 2007); United States Navy, career nuclear submarine officer (June 1970-October 2007), Vice Chairman of the Joint Chiefs of Staff (2005-October 2007), Supreme Allied Commander of NATO Commander Transformation (2003-2005), Commander, U.S. Joint Forces Command (2002-2005). Since his retirement from the U.S. Navy in October 2007, Admiral Giambastiani has also served on numerous U.S. Government advisory boards, investigations and task forces for the Secretaries of Defense, State and Interior and the Central Intelligence Agency. He currently serves as a federal commissioner on the Military Compensation and Retirement Modernization Commission. Oversees 55 portfolios in the OppenheimerFunds complex. Admiral Giambastiani has served on the Boards of certain Oppenheimer funds since February 2013, including as an Advisory Board Member for certain Oppenheimer funds, during which time he has become familiar with the Fund’s (and other Oppenheimer funds’) financial, accounting, regulatory and investment matters and has contributed to the Boards’ deliberations. For purposes of this report, Admiral Giambastiani is identified as a Trustee. |
| |
Elizabeth Krentzman, Trustee (since 2014) Year of Birth: 1959 | | Advisory Board Member of University of Florida Advisory Board, Washington, DC Alumni Group (since 2015); Advisory Board Member of the Securities and Exchange Commission Historical Society (since 2007); held the following positions at Deloitte & Touche LLP: Principal and Chief Regulatory Advisor for Asset Management Services (2007 - 2014) and U.S. Mutual Fund Leader (2011 - 2014); General Counsel of the Investment Company Institute (trade association) (June 2004 - April 2007); held the following positions at Deloitte & Touche LLP: National Director of the Investment Management Regulatory Consulting Practice (1997 - 2004), Principal (2003 - 2004), Director (1998 - 2003) and Senior Manager (1997 - 1998); Assistant Director of the Division of Investment Management - Office of Disclosure and Investment Adviser Regulation (1996 - 1997) and various positions with the Division of Investment Management – Office of Regulatory Policy (1991 - 1996) of the U.S. Securities and Exchange Commission; Associate at Ropes & Gray (1987 - 1991. Ms. Krentzman has served on the Boards of certain Oppenheimer funds since August 2014, during which time she has become familiar with the Fund’s (and other Oppenheimer funds’) financial, accounting, regulatory and investment matters and has contributed to the Boards’ deliberations. Oversees 55 portfolios in the OppenheimerFunds complex. Ms. Krentzman has served on the Boards of certain Oppenheimer funds since August 2014, during which time she has become familiar with the Fund’s (and other Oppenheimer funds’) financial, accounting, regulatory and investment matters and has contributed to the Boards’ deliberations. |
109 OPPENHEIMER FUNDAMENTAL ALTERNATIVES FUND
TRUSTEES AND OFFICERS Unaudited / Continued
| | |
Mary F. Miller, Trustee (since 2009) Year of Birth: 1942 | | Trustee of International House (not-for-profit) (since June 2007); Trustee of the American Symphony Orchestra (not-for-profit) (October 1998-November 2011); and Senior Vice President and General Auditor of American Express Company (financial services company) (July 1998-February 2003). Oversees 55 portfolios in the OppenheimerFunds complex. Ms. Miller has served on the Boards of certain Oppenheimer funds since August 2004, during which time she has become familiar with the Fund’s (and other Oppenheimer funds’) financial, accounting, regulatory and investment matters and has contributed to the Boards’ deliberations. |
| |
Joel W. Motley, Trustee (since 2009) Year of Birth: 1952 | | Director of Greenwall Foundation (since October 2013); Member of Board and Investment Committee of The Greenwall Foundation (since April 2013); Member of the Vestry of Trinity Wall Street (since April 2012); Director of Southern Africa Legal Services Foundation (since March 2012); Board Member of Pulitzer Center for Crisis Reporting (non-profit journalism) (since March 2011); Managing Director of Public Capital Advisors, LLC (privately-held financial advisor) (since January 2006); Managing Director of Carmona Motley, Inc. (privately-held financial advisor) (since January 2002); Director of Columbia Equity Financial Corp. (privately-held financial advisor) (2002-2007); Managing Director of Carmona Motley Hoffman Inc. (privately-held financial advisor) (January 1998-December 2001); Member of the Finance and Budget Committee of the Council on Foreign Relations, Member of the Investment Committee and Board of Human Rights Watch (since July 2000) and Member of the Investment Committee and Board of Historic Hudson Valley (since February 2010). Oversees 55 portfolios in the OppenheimerFunds complex. Mr. Motley has served on the Boards of certain Oppenheimer funds since October 2002, during which time he has become familiar with the Fund’s (and other Oppenheimer funds’) financial, accounting, regulatory and investment matters and has contributed to the Boards’ deliberations. |
| |
Joanne Pace, Trustee (since 2012) Year of Birth: 1958 | | Advisory Board Director of Massey Quick and Company, LLC (since October 2014); Board Director of Horizon Blue Cross Blue Shield of New Jersey (since November 2012); Advisory Board Director of The Alberleen Group LLC (since March, 2012); Board Member (since January 2015), Advisory Council Member (December 2012-December 2014) of 100 Women in Hedge Funds (non-profit) (since December, 2012); Advisory Council Member of Morgan Stanley Children’s Hospital (non-profit) (since May, 2012); Board Director of The Komera Project (non-profit) (since April, 2012); New York Advisory Board Director of Peace First (non-profit) (2010-2015); Senior Advisor of SECOR Asset Management, LP (2010-2011); Managing Director and Chief Operating Officer of Morgan Stanley Investment Management (2006-2010); Partner and Chief Operating Officer of FrontPoint Partners, LLC (hedge fund) (2005-2006); held the following positions at Credit Suisse: Managing Director (2003-2005); Global Head of Human Resources and member of Executive Board and Operating Committee (2004-2005), Global Head of Operations and Product Control (2003-2004); held the following positions at Morgan Stanley: Managing Director (1997-2003), Controller and Principal Accounting Officer (1999-2003); Chief Financial Officer (temporary assignment) for the Oversight Committee, Long Term Capital Management (1998-1999). Lead Independent Director and Chair of the Audit and Nominating Committee of The Global Chartist Fund, LLC of Oppenheimer Asset Management (2011-2012); Board Director of Managed Funds Association (2008-2010); Board Director of Morgan |
110 OPPENHEIMER FUNDAMENTAL ALTERNATIVES FUND
| | |
Joanne Pace, Continued | | Stanley Foundation (2007-2010) and Investment Committee Chair (2008-2010). Oversees 55 portfolios in the OppenheimerFunds complex. Ms. Pace has served on the Boards of certain Oppenheimer funds since November 2012, including as an Advisory Board Member for certain Oppenheimer funds, during which time she has become familiar with the Fund’s (and other Oppenheimer funds’) financial, accounting, regulatory and investment matters and has contributed to the Board’s deliberations. For purposes of this report, Ms. Pace is identified as a Trustee. |
| |
Daniel Vandivort, Trustee (since 2015) Year of Birth: 1954 | | Chairman and Lead Independent Director/Trustee (March 2010-September 2014), Chairman of the Audit Committee (March 2009-September 2014) and Director/ Trustee (December 2008-September 2014) of the Board of Directors/Trustees of Value Line Funds; Trustee, Board of Trustees of Huntington Disease Foundation of America (since January 2015 and June 2007-December 2013): Trustee, Board of Trustees, RIM Retirement Savings Plan (2005-2007); President and Chief Investment Officer, Robeco Investment Management, formerly known as Weiss Peck and Greer (January 2005-June 2007); Member, Management Committee of Robeco Investment Management (2001-2007); Chairman and Trustee of the Board of Trustees of Weiss, Peck and Greer Funds (2004-2005); Managing Director and Head of Fixed Income, Weiss, Peck and Greer (November 1994-January 2005); Managing Director and Head of Fixed Income, CS First Boston Investment Management (January 1992-November 1994); Director, Global Product Development, First Boston Asset Management (November 1989 to January 1992); Vice President, Fixed Income Sales, First Boston Corp. (May 1984-November 1989). Oversees 55 portfolios in the OppenheimerFunds complex. Mr. Vandivort has served on the Boards of certain Oppenheimer funds since 2014, during which time he has become familiar with the Fund’s (and other Oppenheimer funds’) financial, accounting, regulatory and investment matters and has contributed to the Boards’ deliberations. |
|
INTERESTED TRUSTEE AND OFFICER | | Mr. Steinmetz is an “Interested Trustee” because he is affiliated with the Manager and the Sub-Adviser by virtue of his positions as Chairman of the Sub-Adviser and officer and director of the Manager. Both as a Trustee and as an officer, Mr. Steinmetz serves for an indefinite term, or until his resignation, retirement, death or removal. Mr. Steinmetz’s address is 225 Liberty Street, New York, New York 10281-1008. |
| |
Arthur P. Steinmetz, Trustee (since 2015), President and Principal Executive Officer (since 2014) Year of Birth: 1958 | | Chairman of the Sub-Adviser (since January 2015); CEO and Chairman of the Manager (since July 2014), President of the Manager (since May 2013), a Director of the Manager (since January 2013), Director of the Sub-Adviser (since July 2014), President, Management Director and CEO of Oppenheimer Acquisition Corp. (the Sub-Adviser’s parent holding company) (since July 2014), and President and Director of OFI SteelPath, Inc. (since January 2013). Chief Investment Officer of the OppenheimerFunds advisory entities from (January 2013-December 2013); Executive Vice President of the Manager (January 2013-May 2013); Chief Investment Officer of the Sub-Adviser (October 2010-December 2012); Chief Investment Officer, Fixed-Income, of the Sub-Adviser (April 2009-October 2010); Executive Vice President of the Sub-Adviser (October 2009-December 2012); Director of Fixed Income of the Sub-Adviser (January 2009-April 2009); and a Senior Vice President of the Sub-Adviser (March 1993-September 2009). An officer of 100 portfolios in the OppenheimerFunds complex. |
|
OTHER OFFICERS OF THE FUND | | The addresses of the Officers in the chart below are as follows: for Mss. Borré, Lo Bessette, Foxson and Picciotto, 225 Liberty Street, New York, New York 10281-1008, for Mr. Petersen, 6803 S. Tucson Way, Centennial, Colorado 80112-3924. Each Officer serves for an indefinite term or until his or her resignation, retirement, death or removal. |
111 OPPENHEIMER FUNDAMENTAL ALTERNATIVES FUND
TRUSTEES AND OFFICERS Unaudited / Continued
| | |
Michelle Borré, Vice President (since 2011) Year of Birth: 1967 | | Vice President of the Sub-Adviser (since April 2003); Senior Portfolio Manager of the Sub-Adviser (since April 2009); Senior Research Analyst of the Sub-Adviser (February 2003-April 2009). Ms. Borre held various positions, including Managing Director and Partner, at J&W Seligman (July 1996 -January 2003). Adjunct Professor of Finance and Economics at Columbia Business School; Served on the Executive Advisory Board at the Heilbrunn Center for Graham and Dodd Investing at Columbia Business School (from 2004 to 2005). A portfolio manager and an officer of other portfolios in the OppenheimerFunds complex. |
| |
Cynthia Lo Bessette, Secretary and Chief Legal Officer (since 2016) Year of Birth: 1969 | | Executive Vice President, General Counsel and Secretary of the Manager (since February 2016); Chief Legal Officer of the Sub-Adviser and the Distributor (since February 2016); Vice President, General Counsel and Secretary of Oppenheimer Acquisition Corp. (since February 2016); General Counsel of OFI SteelPath, Inc., VTL Associates, LLC and Index Management Solutions, LLC (since February 2016); Chief Legal Officer of OFI Global Institutional, Inc., HarbourView Asset Management Corporation, OFI Global Trust Company, Oppenheimer Real Asset Management, Inc., OFI Private Investments Inc., Shareholder Services, Inc. and Trinity Investment Management Corporation (since February 2016); Senior Vice President and Deputy General Counsel (March 2015-February 2016); Vice President, Corporate Counsel (February 2012-March 2015) and Deputy Chief Legal Officer (April 2013-March 2015) of Jennison Associates LLC; Assistant General Counsel (April 2008-September 2009) and Deputy General Counsel (October 2009-February 2012) of Lord Abbett & Co. LLC. An officer of 100 portfolios in the OppenheimerFunds complex. |
| |
Jennifer Foxson, Vice President and Chief Business Officer (since 2014) Year of Birth: 1969 | | Senior Vice President of OppenheimerFunds Distributor, Inc. (since June 2014); Vice President of OppenheimerFunds Distributor, Inc. (April 2006-June 2014); Vice President of the Sub-Adviser (January 1998-March 2006); Assistant Vice President of the Sub-Adviser (October 1991-December 1998). An officer of 100 portfolios in the OppenheimerFunds complex. |
| |
Mary Ann Picciotto, Chief Compliance Officer and Chief Anti-Money Laundering Officer (since 2014) Year of Birth: 1973 | | Senior Vice President and Chief Compliance Officer of the Manager (since March 2014); Chief Compliance Officer of the Sub-Adviser, OFI SteelPath, Inc., OFI Global Trust Company, OFI Global Institutional, Inc., Oppenheimer Real Asset Management, Inc., OFI Private Investments, Inc., Harborview Asset Management Corporation, Trinity Investment Management Corporation, and Shareholder Services, Inc. (since March 2014); Managing Director of Morgan Stanley Investment Management Inc. and certain of its various affiliated entities; Chief Compliance Officer of various Morgan Stanley Funds (May 2010-January 2014); Chief Compliance Officer of Morgan Stanley Investment Management Inc. (April 2007-January 2014). An officer of 100 portfolios in the OppenheimerFunds complex. |
| |
Brian S. Petersen, Treasurer and Principal Financial & Accounting Officer (since 2016) Year of Birth: 1970 | | Vice President of the Manager (since January 2013); Vice President of the Sub-Adviser (February 2007-December 2012); Assistant Vice President of the Sub- Adviser (August 2002-2007). An officer of 100 portfolios in the OppenheimerFunds complex. |
The Fund’s Statement of Additional Information contains additional information about the Fund’s Trustees and Officers and is available without charge upon request by calling 1.800.CALL OPP (225.5677).
112 OPPENHEIMER FUNDAMENTAL ALTERNATIVES FUND
OPPENHEIMER FUNDAMENTAL ALTERNATIVES FUND
| | | | |
| Manager | | OFI Global Asset Management, Inc. | | |
| | |
| Sub-Adviser | | OppenheimerFunds, Inc. | | |
| | |
| Distributor | | OppenheimerFunds Distributor, Inc. | | |
| | |
| Transfer and Shareholder Servicing Agent | | OFI Global Asset Management, Inc. | | |
| | |
| Sub-Transfer Agent | | Shareholder Services, Inc. | | |
| | DBA OppenheimerFunds Services | | |
| | |
| Independent Registered Public Accounting Firm | | KPMG LLP | | |
| | |
| Legal Counsel | | Kramer Levin Naftalis & Frankel LLP | | |
© 2016 OppenheimerFunds, Inc. All rights reserved.
113 OPPENHEIMER FUNDAMENTAL ALTERNATIVES FUND
PRIVACY POLICY NOTICE
As an Oppenheimer fund shareholder, you are entitled to know how we protect your personal information and how we limit its disclosure.
Information Sources
We obtain nonpublic personal information about our shareholders from the following sources:
| ● | | Applications or other forms |
| ● | | When you create a user ID and password for online account access |
| ● | | When you enroll in eDocs Direct, our electronic document delivery service |
| ● | | Your transactions with us, our affiliates or others |
| ● | | Technologies on our website, including: “cookies” and web beacons, which are used to collect data on the pages you visit and the features you use. |
If you visit oppenheimerfunds.com and do not log on to the secure account information areas, we do not obtain any personal information about you. When you do log on to a secure area, we do obtain your user ID and password to identify you. We also use this information to provide you with products and services you have requested, to inform you about products and services that you may be interested in and assist you in other ways.
We do not collect personal information through our website unless you willingly provide it to us, either directly by email or in those areas of the website that request information. In order to update your personal information (including your mailing address, email address and phone number) you must first log on and visit your user profile.
If you have set your browser to warn you before accepting cookies, you will receive the warning message with each cookie. You can refuse cookies by turning them off in your browser. However, doing so may limit your access to certain sections of our website.
We use cookies to help us improve and manage our website. For example, cookies help us recognize new versus repeat visitors to the site, track the pages visited, and enable some special features on the website. This data helps us provide a better service for our website visitors.
Protection of Information
We do not disclose any non-public personal information (such as names on a customer list) about current or former customers to anyone, except as permitted by law.
Disclosure of Information
Copies of confirmations, account statements and other documents reporting activity in your fund accounts are made available to your financial advisor (as designated by you). We may also use details about you and your investments to help us, our financial service affiliates, or firms that jointly market their financial products and services with ours, to better serve your investment needs or suggest educational material that may be of interest to you. If this requires us to provide you with an opportunity to “opt in” or “opt out” of such information sharing with a firm not affiliated with us, you will receive notification on how to do so, before any such sharing takes place.
Right of Refusal
We will not disclose your personal information to unaffiliated third parties (except as permitted by law), unless we first offer you a reasonable opportunity to refuse or “opt out” of such disclosure.
114 OPPENHEIMER FUNDAMENTAL ALTERNATIVES FUND
Internet Security and Encryption
In general, the email services provided by our website are encrypted and provide a secure and private means of communication with us. To protect your own privacy, confidential and/or personal information should only be communicated via email when you are advised that you are using a secure website. As a security measure, we do not include personal or account information in non-secure emails, and we advise you not to send such information to us in non-secure emails. Instead, you may take advantage of the secure features of our website to encrypt your email correspondence. To do this, you will need to use a browser that supports Secure Sockets Layer (SSL) protocol.
| ● | | All transactions, including redemptions, exchanges and purchases, are secured by SSL and 256-bit encryption. SSL is used to establish a secure connection between your PC and OppenheimerFunds’ server. It transmits information in an encrypted and scrambled format. |
| ● | | Encryption is achieved through an electronic scrambling technology that uses a “key” to code and then decode the data. Encryption acts like the cable converter box you may have on your television set. It scrambles data with a secret code so that no one can make sense of it while it is being transmitted. When the data reaches its destination, the same software unscrambles the data. |
| ● | | You can exit the secure area by either closing your browser, or for added security, you can use the Log Out button before you close your browser. |
Other Security Measures
We maintain physical, electronic and procedural safeguards to protect your personal account information. Our employees and agents have access to that information only so that they may offer you products or provide services, for example, when responding to your account questions.
How You Can Help
You can also do your part to keep your account information private and to prevent unauthorized transactions. If you obtain a user ID and password for your account, safeguard that information. Also, take special precautions when accessing your account on a computer used by others.
Who We Are
This joint notice describes the privacy policies of the Oppenheimer funds, OppenheimerFunds, Inc., each of its investment adviser subsidiaries, OppenheimerFunds Distributor, Inc. and OFI Global Trust Co. It applies to all Oppenheimer fund accounts you presently have, or may open in the future, using your Social Security number—whether or not you remain a shareholder of our funds. This notice was last updated November 2016. In the event it is updated or changed, we will post an updated notice on our website at oppenheimerfunds.com. If you have any questions about this privacy policy, write to us at P.O. Box 5270, Denver, CO 80217-5270, email us by clicking on the Contact Us section of our website at oppenheimerfunds.com or call us at 1.800.CALL OPP (225.5677).
115 OPPENHEIMER FUNDAMENTAL ALTERNATIVES FUND
THIS PAGE INTENTIONALLY LEFT BLANK.
116 OPPENHEIMER FUNDAMENTAL ALTERNATIVES FUND
THIS PAGE INTENTIONALLY LEFT BLANK.
117 OPPENHEIMER FUNDAMENTAL ALTERNATIVES FUND
THIS PAGE INTENTIONALLY LEFT BLANK.
118 OPPENHEIMER FUNDAMENTAL ALTERNATIVES FUND
THIS PAGE INTENTIONALLY LEFT BLANK.
119 OPPENHEIMER FUNDAMENTAL ALTERNATIVES FUND
| | | | |
| | 
OppenheimerFunds® The Right Way to Invest Visit us at oppenheimerfunds.com for 24-hr access to account information and transactions or call us at 800.CALL OPP (800.225.5677) for 24-hr automated information and automated transactions. Representatives also available Mon–Fri 8am-8pm ET. | | |
Visit Us oppenheimerfunds.com Call Us 800 225 5677 Follow Us 
| | Oppenheimer funds are distributed by OppenheimerFunds Distributor, Inc. 225 Liberty Street, New York, NY 10281-1008 © 2016 OppenheimerFunds Distributor, Inc. All rights reserved. RA0236.001.1016 December 22, 2016 | | |
| | |
| | |
| | |
Table of Contents
Class A Shares
AVERAGE ANNUAL TOTAL RETURNS AT 10/31/16
| | | | | | | | |
| | | Class A Shares of the Fund | | | | |
| | | Without Sales Charge | | With Sales Charge | | Russell MidCap Value Index | | Russell 2500 Value Index |
1-Year | | 6.62% | | 0.50% | | 7.84% | | 7.78% |
|
5-Year | | 10.89 | | 9.58 | | 14.07 | | 12.61 |
|
10-Year | | 4.69 | | 4.07 | | 7.19 | | 6.11 |
|
Performance data quoted represents past performance, which does not guarantee future results. The investment return and principal value of an investment in the Fund will fluctuate so that an investor’s shares, when redeemed, may be worth more or less than their original cost. Fund returns include changes in share price, reinvested distributions, and a 5.75% maximum applicable sales charge except where “without sales charge” is indicated. Current performance may be lower or higher than the performance quoted. Returns do not consider capital gains or income taxes on an individual’s investment. For performance data current to the most recent month-end, visit oppenheimerfunds.com or call 1.800.CALL OPP (225.5677). See Fund prospectuses and summary prospectuses for more information on share classes and sales charges.
2 OPPENHEIMER MID CAP VALUE FUND
Fund Performance Discussion
The Fund’s Class A shares (without sales charge) returned 6.62% during the reporting period. On a relative basis, the Russell MidCap Value Index (the “Index”) returned 7.84%. The Fund’s underperformance versus the Index was primarily due to stock selection in the materials, industrials, consumer discretionary and financials sectors. The Fund outperformed the Index primarily within the health care and energy sectors due to stock selection.
MARKET OVERVIEW
The reporting period was a volatile time for global equity markets. 2016 was off to a strong start around commodity price recoveries, but growth concerns continued to weigh on equity markets. Global equity markets were both surprised and experienced a short-term sell-off around the United Kingdom’s vote to leave the European Union (commonly known as “Brexit”). Markets moved higher over the third quarter of 2016. Brexit had little impact on domestic markets. U.S. investors instead focused their attention
on two tug-of-wars: Federal Reserve (“Fed”) policy and anticipated interest rate moves and secondly, the upcoming Presidential election.
FUND REVIEW
Top performing stocks for the Fund this reporting period included WPX Energy, Inc., Applied Materials, Inc., and Reinsurance Group of America, Inc. As mentioned earlier, energy was a top contributing sector to the Fund’s performance. The Fund’s exposure to Exploration and Production companies
COMPARISON OF CHANGE IN VALUE OF $10,000 HYPOTHETICAL INVESTMENTS IN:
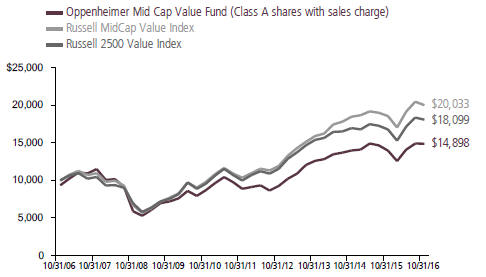
3 OPPENHEIMER MID CAP VALUE FUND
benefitted from oil prices firming. WPX Energy saw prices rally between 20%-30% during the second quarter of 2016. While we continue to see attractively valued ideas within the energy sector, we remain slightly underweight the Index as we believe we are unlikely to see significant gains in oil prices from current levels.
Shares of Applied Materials, maker of semiconductor equipment, rallied over the third quarter of 2016 as the company reported better than expected earnings. The company has successfully gained market share in existing businesses and could benefit from rapid growth in the organic light emitting diode (OLED) display market.
Reinsurance Group of America is a global life and health reinsurance company. The life reinsurance business is dominated by five major firms, which has led to stable pricing within the industry. The company’s leading market position and presence across global markets such as North America, Latin America, Europe, and Asia have led to positive earnings results in recent quarters.
Detractors from performance this reporting period included First NBC Bank Holding Co., Norwegian Cruise Line Holdings Ltd., and On Assignment, Inc.
Early in 2016, financials experienced a selloff, which impacted our investment First NBC Bank Holding. We exited our position. This sector weakness led to opportunity, however. For example, we were able to add to positions
at more favorable prices in Synchrony Financial. Synchrony, formerly a subsidiary of General Electric, provides private label credit products, and January weakness provided an attractive buying opportunity.
As mentioned earlier, the consumer discretionary sector was a detractor from performance. In this sector, Norwegian Cruise Line was negatively impacted due to concerns over the Zika virus and its impact on travel. We believe any impact will be short lived and see long-term value in this industry, as firms have rationalized capital allocation and are focused on return on invested capital (ROIC).
On Assignment is a provider of professionals in the technology, life sciences and creative sectors. It experienced declines early in 2016. Our view was centered on the growth of staff augmentation rather than outsourcing, which we believed would increase revenue growth. While the company was able to generate revenue growth, there were indications that growth would slow going forward. We exited our position.
STRATEGY & OUTLOOK
The market continues to be driven primarily by macroeconomic forces. Whether it is the election in the U.S. or the latest statements from the Fed, Bank of Japan or the European Central Bank, equity market performance has been dominated by the “Big Picture.” As a result, we have positioned the Fund more towards stock specific, idiosyncratic opportunities and shifted into areas such as
4 OPPENHEIMER MID CAP VALUE FUND
Financials and Industrials, where we have found companies that exhibit the combination of value and consistency.
While many investors focus on a short-term view when considering potential investments, the Fund utilizes in-depth fundamental research to identify companies that we believe are poised for an unanticipated acceleration in return on invested capital over a multi-year
| | |
 | |  |
| | Laton Spahr, CFA |
| | Portfolio Manager |
time horizon. We believe this longer-term approach provides a more comprehensive outlook of potential investments by focusing on all three financial statements—income statement, balance sheet and statement of cash flows—and helps us uncover companies whose generation and use of free cash flow we deem as yet to be fully reflected in the current stock price.
| | |
 | |  |
| | Eric Hewitt |
| | Portfolio Manager |
5 OPPENHEIMER MID CAP VALUE FUND
Top Holdings and Allocations
TOP TEN COMMON STOCK HOLDINGS
| | | | |
| Reinsurance Group of America, Inc., Cl. A | | | 2.9% | |
| Validus Holdings Ltd. | | | 2.2 | |
| Ally Financial, Inc. | | | 2.1 | |
| Synopsys, Inc. | | | 2.1 | |
| Associated Banc-Corp. | | | 2.0 | |
| Cimarex Energy Co. | | | 1.8 | |
| Avnet, Inc. | | | 1.8 | |
| SunTrust Banks, Inc. | | | 1.7 | |
| Indivior plc, Sponsored ADR | | | 1.7 | |
| Huntington Bancshares, Inc. | | | 1.6 | |
Portfolio holdings and allocations are subject to change. Percentages are as of October 31, 2016, and are based on net assets. For more current Fund holdings, please visit oppenheimerfunds.com.
TOP TEN COMMON STOCK INDUSTRIES
| | | | |
| Insurance | | | 8.2% | |
| Commercial Banks | | | 8.0 | |
| Oil, Gas & Consumable Fuels | | | 5.8 | |
| Real Estate Investment Trusts (REITs) | | | 4.7 | |
| Health Care Equipment & Supplies | | | 4.0 | |
| Electronic Equipment, Instruments, & Components | | | 3.6 | |
| Consumer Finance | | | 3.5 | |
| Semiconductors & Semiconductor Equipment | | | 3.5 | |
| Chemicals | | | 3.5 | |
| Aerospace & Defense | | | 3.5 | |
Portfolio holdings and allocations are subject to change. Percentages are as of October 31, 2016, and are based on net assets.
SECTOR ALLOCATION
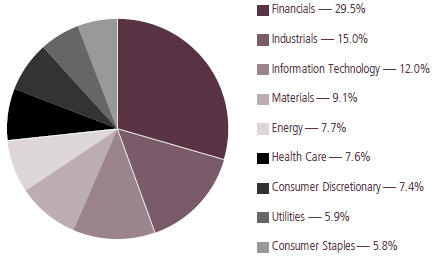
Portfolio holdings and allocations are subject to change. Percentages are as of October 31, 2016, and are based on the total market value of common stocks.
6 OPPENHEIMER MID CAP VALUE FUND
Share Class Performance
AVERAGE ANNUAL TOTAL RETURNS WITHOUT SALES CHARGE AS OF 10/31/16
| | | | | | | | | | | | | | | | |
| | | Inception
Date | | | 1-Year | | | 5-Year | | | 10-Year | |
Class A (QVSCX) | | | 1/3/89 | | | | 6.62% | | | | 10.89% | | | | 4.69% | |
Class B (QSCBX) | | | 9/1/93 | | | | 5.85 | | | | 10.01 | | | | 4.18 | |
Class C (QSCCX) | | | 9/1/93 | | | | 5.84 | | | | 10.04 | | | | 3.89 | |
Class I (QSCIX) | | | 2/28/12 | | | | 7.10 | | | | 10.38* | | | | N/A | |
Class R (QSCNX) | | | 3/1/01 | | | | 6.38 | | | | 10.60 | | | | 4.40 | |
Class Y (QSCYX) | | | 10/24/05 | | | | 6.92 | | | | 11.22 | | | | 5.03 | |
AVERAGE ANNUAL TOTAL RETURNS WITH SALES CHARGE AS OF 10/31/16 | |
| | | Inception
Date | | | 1-Year | | | 5-Year | | | 10-Year | |
Class A (QVSCX) | | | 1/3/89 | | | | 0.50% | | | | 9.58% | | | | 4.07% | |
Class B (QSCBX) | | | 9/1/93 | | | | 0.85 | | | | 9.74 | | | | 4.18 | |
Class C (QSCCX) | | | 9/1/93 | | | | 4.84 | | | | 10.04 | | | | 3.89 | |
Class I (QSCIX) | | | 2/28/12 | | | | 7.10 | | | | 10.38* | | | | N/A | |
Class R (QSCNX) | | | 3/1/01 | | | | 6.38 | | | | 10.60 | | | | 4.40 | |
Class Y (QSCYX) | | | 10/24/05 | | | | 6.92 | | | | 11.22 | | | | 5.03 | |
| * | Shows performance since inception. |
Performance data quoted represents past performance, which does not guarantee future results. The investment return and principal value of an investment in the Fund will fluctuate so that an investor’s shares, when redeemed, may be worth more or less than their original cost. Current performance may be lower or higher than the performance quoted. Returns do not consider capital gains or income taxes on an individual’s investment. For performance data current to the most recent month-end, visit oppenheimerfunds.com or call 1.800. CALL OPP (225.5677). Fund returns include changes in share price, reinvested distributions, and the applicable sales charge: for Class A shares, the current maximum initial sales charge of 5.75%; for Class B shares, the contingent deferred sales charge of 5% (1-year) and 2% (5-year); and for Class C shares, the contingent deferred sales charge (“CDSC”) of 1% for the 1-year period. There is no sales charge for Class I, Class R and Class Y shares. Because Class B shares convert to Class A shares 72 months after purchase, the 10-year return for Class B shares uses Class A performance for the period after conversion. See Fund prospectuses and summary prospectuses for more information on share classes and sales charges.
The Fund’s performance is compared to that of the Russell MidCap Value Index and the Russell 2500 Value Index. The Russell MidCap Value Index measures the performance of the mid-cap value segment of the U.S. equity universe. It includes those Russell MidCap Index companies with lower price-to-book ratios and lower forecasted growth values. The Russell 2500 Value Index measures the performance of the small to mid-cap value segment of the U.S. equity universe. It includes those Russell 2500 Index companies with lower price-to-book ratios and lower forecasted growth values. The Fund has changed its benchmark from the Russell 2500 Value Index to the Russell MidCap Value Index, which it believes is a more
7 OPPENHEIMER MID CAP VALUE FUND
appropriate measure of the Fund’s performance. The Fund will not show performance for the Russell 2500 Value Index in its next annual report. Indices are unmanaged and cannot be purchased directly by investors. While index comparisons may be useful to provide a benchmark for the Fund’s performance, it must be noted that the Fund’s investments are not limited to the investments comprising the indices. Index performance includes reinvestment of income, but does not reflect transaction costs, fees, expenses or taxes. Index performance is shown for illustrative purposes only as a benchmark for the Fund’s performance, and does not predict or depict performance of the Fund. The Fund’s performance reflects the effects of the Fund’s business and operating expenses.
The Fund’s investment strategy and focus can change over time. The mention of specific fund holdings does not constitute a recommendation by OppenheimerFunds, Inc. or its affiliates.
Before investing in any of the Oppenheimer funds, investors should carefully consider a fund’s investment objectives, risks, charges and expenses. Fund prospectuses and summary prospectuses contain this and other information about the funds, and may be obtained by asking your financial advisor, visiting oppenheimerfunds.com, or calling 1.800.CALL OPP (225.5677). Read prospectuses and summary prospectuses carefully before investing.
Shares of Oppenheimer funds are not deposits or obligations of any bank, are not guaranteed by any bank, are not insured by the FDIC or any other agency, and involve investment risks, including the possible loss of the principal amount invested.
8 OPPENHEIMER MID CAP VALUE FUND
Fund Expenses
Fund Expenses. As a shareholder of the Fund, you incur two types of costs: (1) transaction costs, which may include sales charges (loads) on purchase payments and/or contingent deferred sales charges on redemptions; and (2) ongoing costs, including management fees; distribution and service fees; and other Fund expenses. These examples are intended to help you understand your ongoing costs (in dollars) of investing in the Fund and to compare these costs with the ongoing costs of investing in other mutual funds.
The examples are based on an investment of $1,000.00 invested at the beginning of the period and held for the entire 6-month period ended October 31, 2016.
Actual Expenses. The first section of the table provides information about actual account values and actual expenses. You may use the information in this section for the class of shares you hold, together with the amount you invested, to estimate the expense that you paid over the period. Simply divide your account value by $1,000.00 (for example, an $8,600.00 account value divided by $1,000.00 = 8.60), then multiply the result by the number in the first section under the heading entitled “Expenses Paid During 6 Months Ended October 31, 2016” to estimate the expenses you paid on your account during this period.
Hypothetical Example for Comparison Purposes. The second section of the table provides information about hypothetical account values and hypothetical expenses based on the Fund’s actual expense ratio for each class of shares, and an assumed rate of return of 5% per year for each class before expenses, which is not the Fund’s actual return. The hypothetical account values and expenses may not be used to estimate the actual ending account balance or expenses you paid for the period. You may use this information to compare the ongoing costs of investing in the Fund and other funds. To do so, compare this 5% hypothetical example for the class of shares you hold with the 5% hypothetical examples that appear in the shareholder reports of the other funds.
Please note that the expenses shown in the table are meant to highlight your ongoing costs only and do not reflect any transactional costs, such as front-end or contingent deferred sales charges (loads). Therefore, the “hypothetical” section of the table is useful in comparing ongoing costs only, and will not help you determine the relative total costs of owning different funds. In addition, if these transactional costs were included, your costs would have been higher.
9 OPPENHEIMER MID CAP VALUE FUND
| | | | | | | | | | | | |
| Actual | | Beginning Account Value May 1, 2016 | | | Ending Account Value October 31, 2016 | | | Expenses Paid During 6 Months Ended
October 31, 2016 | |
| |
Class A | | | $ 1,000.00 | | | | $ 1,056.00 | | | | $ 6.17 | |
| |
Class B | | | 1,000.00 | | | | 1,052.00 | | | | 10.11 | |
| |
Class C | | | 1,000.00 | | | | 1,051.90 | | | | 10.11 | |
| |
Class I | | | 1,000.00 | | | | 1,058.30 | | | | 3.94 | |
| |
Class R | | | 1,000.00 | | | | 1,054.50 | | | | 7.46 | |
| |
Class Y | | | 1,000.00 | | | | 1,057.40 | | | | 4.92 | |
| | | |
| Hypothetical | | | | | | | | | |
| (5% return before expenses) | | | | | | | | | |
| |
Class A | | | 1,000.00 | | | | 1,019.15 | | | | 6.06 | |
| |
Class B | | | 1,000.00 | | | | 1,015.33 | | | | 9.93 | |
| |
Class C | | | 1,000.00 | | | | 1,015.33 | | | | 9.93 | |
| |
Class I | | | 1,000.00 | | | | 1,021.32 | | | | 3.87 | |
| |
Class R | | | 1,000.00 | | | | 1,017.90 | | | | 7.33 | |
| |
Class Y | | | 1,000.00 | | | | 1,020.36 | | | | 4.84 | |
Expenses are equal to the Fund’s annualized expense ratio for that class, multiplied by the average account value over the period, multiplied by 184/366 (to reflect the one-half year period). Those annualized expense ratios, excluding indirect expenses from affiliated funds, based on the 6-month period ended October 31, 2016 are as follows:
| | | | |
| Class | | Expense Ratios | |
| |
Class A | | | 1.19% | |
| |
Class B | | | 1.95 | |
| |
Class C | | | 1.95 | |
| |
Class I | | | 0.76 | |
| |
Class R | | | 1.44 | |
| |
Class Y | | | 0.95 | |
The expense ratios reflect voluntary and/or contractual waivers and/or reimbursements of expenses by the Fund’s Manager. Some of these undertakings may be modified or terminated at any time, as indicated in the Fund’s prospectus. The “Financial Highlights” tables in the Fund’s financial statements, included in this report, also show the gross expense ratios, without such waivers or reimbursements and reduction to custodian expenses, if applicable.
10 OPPENHEIMER MID CAP VALUE FUND
STATEMENT OF INVESTMENTS October 31, 2016
| | | | | | | | |
| | | Shares | | | Value | |
| |
| Common Stocks—98.3% | |
| |
Consumer Discretionary—7.3% | |
| |
Auto Components—1.1% | |
BorgWarner, Inc. | | | 416,800 | | | $ | 14,938,112 | |
|
| |
Automobiles—1.3% | | | | | | | | |
Thor Industries, Inc. | | | 211,010 | | | | 16,735,203 | |
|
| |
Hotels, Restaurants & Leisure—0.7% | |
| Norwegian Cruise Line Holdings Ltd.1 | | | 98,710 | | | | 3,836,858 | |
| |
Royal Caribbean Cruises Ltd. | | | 60,140 | | | | 4,622,962 | |
| | | | | | | | |
| | | | | | | 8,459,820 | |
|
| |
Household Durables—1.7% | | | | | | | | |
Lennar Corp., Cl. A | | | 187,380 | | | | 7,811,872 | |
| |
Whirlpool Corp. | | | 95,470 | | | | 14,303,316 | |
| | | | | | | | |
| | | | | | | 22,115,188 | |
|
| |
Leisure Products—1.1% | | | | | | | | |
Mattel, Inc. | | | 442,100 | | | | 13,939,413 | |
|
| |
Media—1.1% | | | | | | | | |
Cinemark Holdings, Inc. | | | 254,370 | | | | 10,123,926 | |
| |
Regal Entertainment Group, Cl. A | | | 221,700 | | | | 4,768,767 | |
| | | | | | | | |
| | | | | | | 14,892,693 | |
|
| |
Specialty Retail—0.3% | | | | | | | | |
Advance Auto Parts, Inc. | | | 27,780 | | | | 3,891,422 | |
|
| |
Consumer Staples—5.8% | |
| |
Beverages—1.4% | | | | | | | | |
Molson Coors Brewing Co., Cl. B | | | 180,090 | | | | 18,695,143 | |
|
| |
Food & Staples Retailing—1.3% | |
Rite Aid Corp.1 | | | 2,483,358 | | | | 16,663,332 | |
|
| |
Food Products—1.5% | | | | | | | | |
B&G Foods, Inc. | | | 293,094 | | | | 12,427,186 | |
| |
Tyson Foods, Inc., Cl. A | | | 97,110 | | | | 6,880,243 | |
| | | | | | | | |
| | | | | | | 19,307,429 | |
|
| |
Household Products—1.6% | |
Energizer Holdings, Inc. | | | 176,081 | | | | 8,189,528 | |
| |
| Spectrum Brands Holdings, Inc. | | | 88,780 | | | | 12,006,607 | |
| | | | | | | | |
| | | | | | | 20,196,135 | |
| | | | | | | | |
| | | Shares | | | Value | |
| |
Energy—7.6% | |
| |
Energy Equipment & Services—1.8% | |
FMC Technologies, Inc.1 | | | 167,266 | | | $ | 5,397,674 | |
| |
Helmerich & Payne, Inc. | | | 129,631 | | | | 8,181,012 | |
| |
Patterson-UTI Energy, Inc. | | | 446,946 | | | | 10,047,346 | |
| | | | | | | | |
| | | | | | | 23,626,032 | |
|
| |
Oil, Gas & Consumable Fuels—5.8% | |
Cimarex Energy Co. | | | 185,826 | | | | 23,995,711 | |
| |
Hess Corp. | | | 258,970 | | | | 12,422,791 | |
| |
Newfield Exploration Co.1 | | | 348,059 | | | | 14,127,715 | |
| |
PDC Energy, Inc.1 | | | 90,030 | | | | 5,521,540 | |
| |
Tesoro Corp. | | | 71,220 | | | | 6,051,564 | |
| |
WPX Energy, Inc.1 | | | 1,227,120 | | | | 13,326,523 | |
| | | | | | | | |
| | | | | | | 75,445,844 | |
|
| |
Financials—29.0% | | | | | | | | |
| |
Capital Markets—2.0% | | | | | | | | |
Ares Management LP2 | | | 801,442 | | | | 13,424,153 | |
| |
Nasdaq, Inc. | | | 196,010 | | | | 12,538,760 | |
| | | | | | | | |
| | | | | | | 25,962,913 | |
|
| |
Commercial Banks—8.0% | |
Associated Banc-Corp. | | | 1,282,400 | | | | 26,032,720 | |
| |
Glacier Bancorp, Inc. | | | 261,940 | | | | 7,402,425 | |
| |
Huntington Bancshares, Inc. | | | 1,981,940 | | | | 21,008,564 | |
| |
KeyCorp | | | 1,108,640 | | | | 15,653,997 | |
| |
SunTrust Banks, Inc. | | | 499,570 | | | | 22,595,551 | |
| |
SVB Financial Group1 | | | 95,520 | | | | 11,679,230 | |
| | | | | | | | |
| | | | | | | 104,372,487 | |
|
| |
Consumer Finance—3.5% | |
Ally Financial, Inc. | | | 1,546,510 | | | | 27,945,436 | |
| |
Synchrony Financial | | | 643,550 | | | | 18,399,094 | |
| | | | | | | | |
| | | | | | | 46,344,530 | |
|
| |
Diversified Financial Services—1.2% | |
Voya Financial, Inc. | | | 501,520 | | | | 15,321,436 | |
| |
Insurance—8.2% | |
Arthur J. Gallagher & Co. | | | 203,020 | | | | 9,791,654 | |
| |
CNO Financial Group, Inc. | | | 866,210 | | | | 13,062,447 | |
11 OPPENHEIMER MID CAP VALUE FUND
STATEMENT OF INVESTMENTS Continued
| | | | | | | | |
| | | Shares | | | Value | |
| |
Insurance (Continued) | |
| |
Everest Re Group Ltd. | | | 52,940 | | | $ | 10,774,349 | |
| |
| Reinsurance Group of America, Inc., Cl. A | | | 355,820 | | | | 38,378,745 | |
| |
Validus Holdings Ltd. | | | 549,470 | | | | 28,077,917 | |
| |
XL Group Ltd. | | | 187,040 | | | | 6,490,288 | |
| | | | | | | | |
| | | | | | | 106,575,400 | |
|
| |
Real Estate Investment Trusts (REITs)—4.7% | |
| Alexandria Real Estate Equities, Inc. | | | 74,690 | | | | 8,052,329 | |
| |
CubeSmart | | | 405,760 | | | | 10,578,163 | |
| |
Digital Realty Trust, Inc. | | | 127,260 | | | | 11,889,902 | |
| |
Equity LifeStyle Properties, Inc. | | | 84,850 | | | | 6,435,024 | |
| |
HCP, Inc. | | | 256,520 | | | | 8,785,810 | |
| |
Highwoods Properties, Inc. | | | 137,590 | | | | 6,828,591 | |
| |
| Omega Healthcare Investors, Inc. | | | 278,437 | | | | 8,862,650 | |
| | | | | | | | |
| | | | | | | 61,432,469 | |
|
| |
Thrifts & Mortgage Finance—1.4% | |
Radian Group, Inc. | | | 1,364,513 | | | | 18,543,732 | |
|
| |
Health Care—7.4% | |
| |
Health Care Equipment & Supplies—4.0% | |
Boston Scientific Corp.1 | | | 421,637 | | | | 9,276,014 | |
| |
Cooper Cos., Inc. (The) | | | 42,810 | | | | 7,536,272 | |
| |
Teleflex, Inc. | | | 102,537 | | | | 14,676,121 | |
| |
Zimmer Biomet Holdings, Inc. | | | 194,870 | | | | 20,539,298 | |
| | | | | | | | |
| | | | | | | 52,027,705 | |
|
| |
Life Sciences Tools & Services—0.8% | |
Quintiles IMS Holdings, Inc.1 | | | 157,793 | | | | 11,320,070 | |
|
| |
Pharmaceuticals—2.6% | |
Indivior plc | | | 341,380 | | | | 1,311,061 | |
| |
Indivior plc, Sponsored ADR | | | 1,112,564 | | | | 21,533,676 | |
| |
Jazz Pharmaceuticals plc1 | | | 97,880 | | | | 10,714,924 | |
| | | | | | | | |
| | | | | | | 33,559,661 | |
| | | | | | | | |
| | | Shares | | | Value | |
| |
Industrials—14.7% | |
| |
Aerospace & Defense—3.5% | |
Esterline Technologies Corp.1 | | | 255,780 | | | $ | 18,787,041 | |
| |
| Huntington Ingalls Industries, Inc. | | | 106,290 | | | | 17,150,954 | |
| |
Orbital ATK, Inc. | | | 124,850 | | | | 9,283,846 | |
| | | | | | | | |
| | | | | | | 45,221,841 | |
|
| |
Air Freight & Couriers—0.9% | |
XPO Logistics, Inc.1 | | | 344,940 | | | | 11,358,874 | |
|
| |
Airlines—1.1% | |
Air Canada1 | | | 1,472,443 | | | | 13,898,390 | |
|
| |
Commercial Services & Supplies—1.1% | |
Deluxe Corp. | | | 235,040 | | | | 14,384,448 | |
|
| |
Electrical Equipment—2.4% | |
Eaton Corp. plc | | | 307,720 | | | | 19,623,304 | |
| |
Hubbell, Inc., Cl. B | | | 119,080 | | | | 12,446,242 | |
| | | | | | | | |
| | | | | | | 32,069,546 | |
|
| |
Machinery—3.0% | |
Astec Industries, Inc. | | | 8,420 | | | | 466,131 | |
| |
Parker-Hannifin Corp. | | | 126,350 | | | | 15,509,462 | |
| |
Pentair plc | | | 202,150 | | | | 11,144,530 | |
| |
WABCO Holdings, Inc.1 | | | 40,510 | | | | 3,988,615 | |
| |
Xylem, Inc. | | | 176,340 | | | | 8,522,512 | |
| | | | | | | | |
| | | | | | | 39,631,250 | |
|
| |
Marine—0.8% | |
Kirby Corp.1 | | | 168,240 | | | | 9,917,748 | |
|
| |
Professional Services—0.7% | |
Nielsen Holdings plc | | | 196,830 | | | | 8,861,287 | |
|
| |
Road & Rail—0.5% | | | | | | | | |
Swift Transportation Co., Cl. A1 | | | 309,790 | | | | 6,933,100 | |
|
| |
Trading Companies & Distributors—0.7% | |
HD Supply Holdings, Inc.1 | | | 282,210 | | | | 9,312,930 | |
|
| |
Information Technology—11.8% | |
| |
Electronic Equipment, Instruments, & Components—3.6% | |
Avnet, Inc. | | | 553,930 | | | | 23,237,363 | |
| |
Dolby Laboratories, Inc., Cl. A | | | 226,220 | | | | 10,765,810 | |
| |
Flex Ltd.1 | | | 922,050 | | | | 13,083,890 | |
| | | | | | | | |
| | | | | | | 47,087,063 | |
12 OPPENHEIMER MID CAP VALUE FUND
| | | | | | | | |
| | | Shares | | | Value | |
| |
IT Services—0.5% | |
First Data Corp., Cl. A1 | | | 492,990 | | | $ | 6,896,930 | |
|
| |
Semiconductors & Semiconductor Equipment—3.5% | |
Applied Materials, Inc. | | | 264,577 | | | | 7,693,899 | |
| |
Lam Research Corp. | | | 173,350 | | | | 16,790,681 | |
| |
Micron Technology, Inc.1 | | | 328,120 | | | | 5,630,539 | |
| |
Semtech Corp.1 | | | 400,050 | | | | 9,681,210 | |
| |
Skyworks Solutions, Inc. | | | 81,850 | | | | 6,297,539 | |
| | | | | | | | |
| | | | | | | 46,093,868 | |
|
| |
Software—2.9% | |
Synopsys, Inc.1 | | | 454,070 | | | | 26,930,892 | |
| |
Verint Systems, Inc.1 | | | 282,190 | | | | 10,158,840 | |
| | | | | | | | |
| | | | | | | 37,089,732 | |
|
| |
Technology Hardware, Storage & Peripherals—1.3% | |
Western Digital Corp. | | | 280,950 | | | | 16,418,718 | |
|
| |
Materials—8.9% | |
| |
Chemicals—3.5% | |
Eastman Chemical Co. | | | 172,190 | | | | 12,382,183 | |
| |
| International Flavors & Fragrances, Inc. | | | 93,340 | | | | 12,207,005 | |
| |
PPG Industries, Inc. | | | 129,370 | | | | 12,048,228 | |
| |
RPM International, Inc. | | | 183,950 | | | | 8,744,983 | |
| | | | | | | | |
| | | | | | | 45,382,399 | |
|
| |
Construction Materials—0.6% | |
Eagle Materials, Inc. | | | 103,150 | | | | 8,352,055 | |
|
| |
Containers & Packaging—2.8% | |
Ball Corp. | | | 141,500 | | | | 10,905,405 | |
| |
Owens-Illinois, Inc.1 | | | 533,170 | | | | 10,290,181 | |
| |
WestRock Co. | | | 317,720 | | | | 14,675,487 | |
| | | | | | | | |
| | | | | | | 35,871,073 | |
|
| |
Metals & Mining—1.1% | |
Goldcorp, Inc. | | | 950,850 | | | | 14,452,920 | |
| | | | | | | | |
| | | Shares | | | Value | |
| |
Paper & Forest Products—0.9% | |
Louisiana-Pacific Corp.1 | | | 652,730 | | | $ | 11,977,596 | |
|
| |
Utilities—5.8% | |
| |
Electric Utilities—2.6% | |
ALLETE, Inc. | | | 120,290 | | | | 7,372,574 | |
| |
Alliant Energy Corp. | | | 243,420 | | | | 9,262,131 | |
| |
Avangrid, Inc. | | | 108,690 | | | | 4,283,473 | |
| |
Emera, Inc. | | | 179,174 | | | | 6,248,982 | |
| |
Portland General Electric Co. | | | 133,360 | | | | 5,819,831 | |
| | | | | | | | |
| | | | | | | 32,986,991 | |
|
| |
Independent Power and Renewable Electricity Producers—0.4% | |
AES Corp. | | | 468,570 | | | | 5,515,069 | |
|
| |
Multi-Utilities—2.0% | |
Ameren Corp. | | | 226,470 | | | | 11,312,176 | |
| |
Avista Corp. | | | 175,390 | | | | 7,261,146 | |
| |
DTE Energy Co. | | | 33,870 | | | | 3,251,859 | |
| |
MDU Resources Group, Inc. | | | 177,070 | | | | 4,641,005 | |
| | | | | | | | |
| | | | | | | 26,466,186 | |
|
| |
Water Utilities—0.8% | |
American Water Works Co., Inc. | | | 142,710 | | | | 10,566,248 | |
| | | | | | | | |
Total Common Stocks
(Cost $1,094,120,067) | | | | | | | 1,281,112,431 | |
|
| |
| Investment Company—1.8% | |
| |
| Oppenheimer Institutional Government Money Market Fund, Cl. E, 0.28%3,4 (Cost $23,638,621) | | | 23,638,621 | | | | 23,638,621 | |
|
| |
Total Investments, at Value
(Cost $1,117,758,688) | | | 100.1% | | | | 1,304,751,052 | |
| |
Net Other Assets (Liabilities) | | | (0.1) | | | | (1,083,908) | |
| | | | |
Net Assets | | | 100.0% | | | $ | 1,303,667,144 | |
| | | | |
Footnotes to Statement of Investments
1. Non-income producing security.
2. Security is a Master Limited Partnership.
3. Rate shown is the 7-day yield at period end.
13 OPPENHEIMER MID CAP VALUE FUND
STATEMENT OF INVESTMENTS Continued
Footnotes to Statement of Investments (Continued)
4. Is or was an affiliate, as defined in the Investment Company Act of 1940, as amended, at or during the reporting period, by virtue of the Fund owning at least 5% of the voting securities of the issuer or as a result of the Fund and the issuer having the same investment adviser. Transactions during the reporting period in which the issuer was an affiliate are as follows:
| | | | | | | | | | | | | | | | |
| | | Shares
October 30,
2015a | | | Gross
Additions | | | Gross
Reductions | | | Shares
October 31, 2016 | |
| |
| Oppenheimer Institutional Government Money Market Fund, Cl. Eb | | | 18,716,295 | | | | 265,072,756 | | | | 260,150,430 | | | | 23,638,621 | |
| | | | | | | | |
| | | Value | | | Income | |
| |
| Oppenheimer Institutional Government Money Market Fund, Cl. Eb | | $ | 23,638,621 | | | $ | 73,395 | |
a. Represents the last business day of the Fund’s reporting period.
b. Prior to September 28, 2016, this fund was named Oppenheimer Institutional Money Market Fund.
See accompanying Notes to Financial Statements.
14 OPPENHEIMER MID CAP VALUE FUND
STATEMENT OF ASSETS AND LIABILITIES October 31, 2016
| | | | |
| |
| Assets | | | | |
Investments, at value—see accompanying statement of investments: | | | | |
Unaffiliated companies (cost $1,094,120,067) | | $ | 1,281,112,431 | |
Affiliated companies (cost $23,638,621) | | | 23,638,621 | |
| | | | |
| | | 1,304,751,052 | |
| |
Cash | | | 999,999 | |
| |
Receivables and other assets: | | | | |
Investments sold | | | 7,302,766 | |
Shares of beneficial interest sold | | | 723,298 | |
Dividends | | | 621,312 | |
Other | | | 194,241 | |
| | | | |
Total assets | | | 1,314,592,668 | |
|
| |
| Liabilities | | | | |
Payables and other liabilities: | | | | |
Investments purchased | | | 7,503,224 | |
Shares of beneficial interest redeemed | | | 2,705,685 | |
Trustees’ compensation | | | 405,566 | |
Distribution and service plan fees | | | 268,821 | |
Shareholder communications | | | 16,652 | |
Other | | | 25,576 | |
| | | | |
Total liabilities | | | 10,925,524 | |
|
| |
Net Assets | | $ | 1,303,667,144 | |
| | | | |
| | | | |
| |
| Composition of Net Assets | | | | |
Par value of shares of beneficial interest | | | $274,300 | |
| |
Additional paid-in capital | | | 1,182,079,518 | |
| |
Accumulated net investment income | | | 352,870 | |
| |
Accumulated net realized loss on investments and foreign currency transactions | | | (66,031,714) | |
| |
Net unrealized appreciation on investments and translation of assets and liabilities denominated in foreign currencies | | | 186,992,170 | |
| | | | |
Net Assets | | $ | 1,303,667,144 | |
| | | | |
15 OPPENHEIMER MID CAP VALUE FUND
STATEMENT OF ASSETS AND LIABILITIES Continued
| | | | |
| |
| Net Asset Value Per Share | | | | |
| Class A Shares: | | | | |
| |
| Net asset value and redemption price per share (based on net assets of $920,276,689 and 18,673,184 shares of beneficial interest outstanding) | | $ | 49.28 | |
| |
| Maximum offering price per share (net asset value plus sales charge of 5.75% of offering price) | | $ | 52.29 | |
| |
| |
| Class B Shares: | | | | |
| |
| Net asset value, redemption price (excludes applicable contingent deferred sales charge) and offering price per share (based on net assets of $11,359,909 and 275,668 shares of beneficial interest outstanding) | | $ | 41.21 | |
| |
| |
| Class C Shares: | | | | |
| |
| Net asset value, redemption price (excludes applicable contingent deferred sales charge) and offering price per share (based on net assets of $226,455,604 and 5,488,374 shares of beneficial interest outstanding) | | $ | 41.26 | |
| |
| |
| Class I Shares: | | | | |
| |
| Net asset value, redemption price and offering price per share (based on net assets of $950,396 and 18,971 shares of beneficial interest outstanding) | | $ | 50.10 | |
| |
| |
| Class R Shares: | | | | |
| |
| Net asset value, redemption price (excludes applicable contingent deferred sales charge) and offering price per share (based on net assets of $82,660,886 and 1,747,161 shares of beneficial interest outstanding) | | $ | 47.31 | |
| |
| |
| Class Y Shares: | | | | |
| |
| Net asset value, redemption price and offering price per share (based on net assets of $61,963,660 and 1,226,598 shares of beneficial interest outstanding) | | $ | 50.52 | |
See accompanying Notes to Financial Statements.
16 OPPENHEIMER MID CAP VALUE FUND
STATEMENT OF OPERATIONS For the Year Ended October 31, 2016
| | | | |
| |
| Investment Income | | | | |
Dividends: | | | | |
Unaffiliated companies (net of foreign withholding taxes of $44,182) | | $ | 22,294,108 | |
Affiliated companies | | | 73,395 | |
| |
Interest | | | 2,162 | |
| | | | |
Total investment income | | | 22,369,665 | |
|
| |
| Expenses | | | | |
Management fees | | | 9,209,416 | |
| |
Distribution and service plan fees: | | | | |
Class A | | | 2,242,099 | |
Class B | | | 149,083 | |
Class C | | | 2,325,742 | |
Class R | | | 427,163 | |
| |
Transfer and shareholder servicing agent fees: | | | | |
Class A | | | 2,017,130 | |
Class B | | | 32,930 | |
Class C | | | 513,043 | |
Class I | | | 241 | |
Class R | | | 188,738 | |
Class Y | | | 109,846 | |
| |
Shareholder communications: | | | | |
Class A | | | 27,611 | |
Class B | | | 1,394 | |
Class C | | | 7,386 | |
Class I | | | 9 | |
Class R | | | 205 | |
Class Y | | | 799 | |
| |
Custodian fees and expenses | | | 42,438 | |
| |
Trustees’ compensation | | | 24,309 | |
| |
Borrowing fees | | | 23,779 | |
| |
Other | | | 152,485 | |
| | | | |
Total expenses | | | 17,495,846 | |
Less waivers and reimbursements of expenses | | | (18,923) | |
| | | | |
Net expenses | | | 17,476,923 | |
|
| |
Net Investment Income | | | 4,892,742 | |
17 OPPENHEIMER MID CAP VALUE FUND
STATEMENT OF OPERATIONS Continued
| | | | |
| |
| Realized and Unrealized Gain (Loss) | | | | |
Net realized gain on: | | | | |
Investments from unaffiliated companies | | $ | 17,047,493 | |
Foreign currency transactions | | | 848 | |
| | | | |
Net realized gain | | | 17,048,341 | |
| |
Net change in unrealized appreciation/depreciation on: | | | | |
Investments | | | 55,899,967 | |
Translation of assets and liabilities denominated in foreign currencies | | | (190,635) | |
| | | | |
Net change in unrealized appreciation/depreciation | | | 55,709,332 | |
|
| |
Net Increase in Net Assets Resulting from Operations | | $ | 77,650,415 | |
| | | | |
See accompanying Notes to Financial Statements.
18 OPPENHEIMER MID CAP VALUE FUND
STATEMENTS OF CHANGES IN NET ASSETS
| | | | | | | | |
| | | Year Ended
October 31, 2016 | | | Year Ended
October 30, 20151 | |
| |
| Operations | | | | | | | | |
Net investment income | | $ | 4,892,742 | | | $ | 5,197,297 | |
| |
Net realized gain | | | 17,048,341 | | | | 150,686,311 | |
| |
Net change in unrealized appreciation/depreciation | | | 55,709,332 | | | | (151,613,923) | |
| | | | |
Net increase in net assets resulting from operations | | | 77,650,415 | | | | 4,269,685 | |
|
| |
| Dividends and/or Distributions to Shareholders | | | | | | | | |
Dividends from net investment income: | | | | | | | | |
Class A | | | (4,445,239) | | | | (5,142,601) | |
Class B | | | (2,657) | | | | — | |
Class C | | | (92,283) | | | | — | |
Class I | | | (7,219) | | | | (5,660) | |
Class R | | | (224,750) | | | | (288,773) | |
Class Y | | | (369,015) | | | | (368,204) | |
| | | | |
| | | (5,141,163) | | | | (5,805,238) | |
|
| |
| Beneficial Interest Transactions | | | | | | | | |
Net increase (decrease) in net assets resulting from beneficial interest transactions: | | | | | | | | |
Class A | | | (98,528,211) | | | | (136,822,185) | |
Class B | | | (10,024,065) | | | | (16,687,522) | |
Class C | | | (39,228,116) | | | | (24,861,505) | |
Class I | | | 112,173 | | | | 370,030 | |
Class R | | | (20,417,502) | | | | (28,135,380) | |
Class Y | | | 10,169,570 | | | | (975,486) | |
| | | | |
| | | (157,916,151) | | | | (207,112,048) | |
|
| |
| Net Assets | | | | | | | | |
Total decrease | | | (85,406,899) | | | | (208,647,601) | |
| |
Beginning of period | | | 1,389,074,043 | | | | 1,597,721,644 | |
| | | | |
End of period (including accumulated net investment income of $352,870 and $521,706, respectively) | | $ | 1,303,667,144 | | | $ | 1,389,074,043 | |
| | | | |
1. Represents the last business day of the Fund’s reporting period.
See accompanying Notes to Financial Statements.
19 OPPENHEIMER MID CAP VALUE FUND
FINANCIAL HIGHLIGHTS
| | | | | | | | | | | | | | | | | | | | |
| Class A | | Year Ended
October 31,
2016 | | | Year Ended
October 30,
20151 | | | Year Ended
October 31,
2014 | | | Year Ended
October 31,
2013 | | | Year Ended
October 31,
2012 | |
| |
| Per Share Operating Data | | | | | | | | | | | | | | | | | | | | |
| Net asset value, beginning of period | | | $46.44 | | | | $46.72 | | | | $42.63 | | | | $31.33 | | | | $30.05 | |
| |
| Income (loss) from investment operations: | | | | | | | | | | | | | | | | | | | | |
| Net investment income2 | | | 0.24 | | | | 0.24 | | | | 0.36 | | | | 0.24 | | | | 0.07 | |
| Net realized and unrealized gain (loss) | | | 2.83 | | | | (0.29) | | | | 4.25 | | | | 11.09 | | | | 1.21 | |
| | | | |
| Total from investment operations | | | 3.07 | | | | (0.05) | | | | 4.61 | | | | 11.33 | | | | 1.28 | |
| |
| Dividends and/or distributions to shareholders: | | | | | | | | | | | | | | | | | | | | |
| Dividends from net investment income | | | (0.23) | | | | (0.23) | | | | (0.52) | | | | (0.03) | | | | 0.00 | |
| |
| Net asset value, end of period | | | $49.28 | | | | $46.44 | | | | $46.72 | | | | $42.63 | | | | $31.33 | |
| | | | |
| | | | | | | | | | | | | | | | | | | | |
| |
| Total Return, at Net Asset Value3 | | | 6.62% | | | | (0.13)% | | | | 10.91% | | | | 36.16% | | | | 4.26% | |
| | | | | | | | | | | | | | | | | | | | |
| |
| Ratios/Supplemental Data | | | | | | | | | | | | | | | | | | | | |
| Net assets, end of period (in thousands) | | | $920,277 | | | | $966,842 | | | | $1,104,252 | | | | $1,162,455 | | | | $938,427 | |
| |
| Average net assets (in thousands) | | | $916,503 | | | | $1,085,463 | | | | $1,151,106 | | | | $1,013,781 | | | | $1,099,549 | |
| |
| Ratios to average net assets:4 | | | | | | | | | | | | | | | | | | | | |
| Net investment income | | | 0.53% | | | | 0.49% | | | | 0.80% | | | | 0.65% | | | | 0.24% | |
| Expenses excluding specific expenses listed below | | | 1.19% | | | | 1.17% | | | | 1.18% | | | | 1.27% | | | | 1.31% | |
| Interest and fees from borrowings | | | 0.00%5 | | | | 0.00%5 | | | | 0.00% | | | | 0.00% | | | | 0.00% | |
| | | | |
| Total expenses6 | | | 1.19% | | | | 1.17% | | | | 1.18% | | | | 1.27% | | | | 1.31% | |
| Expenses after payments, waivers and/or reimbursements and reduction to custodian expenses | | | 1.19% | | | | 1.17% | | | | 1.18% | | | | 1.27% | | | | 1.26% | |
| |
| Portfolio turnover rate | | | 34% | | | | 47% | | | | 51% | | | | 128% | | | | 54% | |
1. Represents the last business day of the Fund’s reporting period.
2. Per share amounts calculated based on the average shares outstanding during the period.
3. Assumes an initial investment on the business day before the first day of the fiscal period, with all dividends and distributions reinvested in additional shares on the reinvestment date, and redemption at the net asset value calculated on the last business day of the fiscal period. Sales charges are not reflected in the total returns. Total returns are not annualized for periods less than one full year. Returns do not reflect the deduction of taxes that a shareholder would pay on fund distributions or the redemption of fund shares.
4. Annualized for periods less than one full year.
5. Less than 0.005%.
6. Total expenses including indirect expenses from affiliated fund fees and expenses were as follows:
| | | | |
| Year Ended October 31, 2016 | | 1.19% | |
| Year Ended October 30, 2015 | | 1.17% | |
| Year Ended October 31, 2014 | | 1.18% | |
| Year Ended October 31, 2013 | | 1.27% | |
| Year Ended October 31, 2012 | | 1.31% | |
See accompanying Notes to Financial Statements.
20 OPPENHEIMER MID CAP VALUE FUND
| | | | | | | | | | | | | | | | | | | | |
| Class B | | Year Ended October 31, 2016 | | | Year Ended October 30, 20151 | | | Year Ended October 31, 2014 | | | Year Ended October 31, 2013 | | | Year Ended October 31, 2012 | |
| |
| Per Share Operating Data | | | | | | | | | | | | | | | | | | | | |
| Net asset value, beginning of period | | | $38.94 | | | | $39.29 | | | | $35.74 | | | | $26.48 | | | | $25.60 | |
| |
| Income (loss) from investment operations: | | | | | | | | | | | | | | | | | | | | |
| Net investment income (loss)2 | | | (0.07) | | | | (0.10) | | | | 0.01 | | | | (0.08) | | | | (0.15) | |
| Net realized and unrealized gain (loss) | | | 2.35 | | | | (0.25) | | | | 3.57 | | | | 9.34 | | | | 1.03 | |
| | | | |
| Total from investment operations | | | 2.28 | | | | (0.35) | | | | 3.58 | | | | 9.26 | | | | 0.88 | |
| |
| Dividends and/or distributions to shareholders: | | | | | | | | | | | | | | | | | | | | |
| Dividends from net investment income | | | (0.01) | | | | 0.00 | | | | (0.03) | | | | 0.00 | | | | 0.00 | |
| |
| Net asset value, end of period | | | $41.21 | | | | $38.94 | | | | $39.29 | | | | $35.74 | | | | $26.48 | |
| | | | |
| | | | | | | | | | | | | | | | | | | | |
| |
| Total Return, at Net Asset Value3 | | | 5.85% | | | | (0.89)% | | | | 10.03% | | | | 34.97% | | | | 3.44% | |
| | | | | | | | | | | | | | | | | | | | |
| |
| Ratios/Supplemental Data | | | | | | | | | | | | | | | | | | | | |
| Net assets, end of period (in thousands) | | | $11,360 | | | | $20,774 | | | | $37,092 | | | | $48,927 | | | | $53,204 | |
| |
| Average net assets (in thousands) | | | $14,935 | | | | $29,531 | | | | $43,889 | | | | $48,518 | | | | $67,022 | |
| |
| Ratios to average net assets:4 | | | | | | | | | | | | | | | | | | | | |
| Net investment income (loss) | | | (0.18)% | | | | (0.23)% | | | | 0.04% | | | | (0.25)% | | | | (0.57)% | |
| Expenses excluding specific expenses listed below | | | 1.95% | | | | 1.92% | | | | 2.01% | | | | 2.35% | | | | 2.37% | |
| Interest and fees from borrowings | | | 0.00%5 | | | | 0.00%5 | | | | 0.00% | | | | 0.00% | | | | 0.00% | |
| | | | |
| Total expenses6 | | | 1.95% | | | | 1.92% | | | | 2.01% | | | | 2.35% | | | | 2.37% | |
| Expenses after payments, waivers and/or reimbursements and reduction to custodian expenses | | | 1.95% | | | | 1.92% | | | | 1.96% | | | | 2.15% | | | | 2.09% | |
| |
| Portfolio turnover rate | | | 34% | | | | 47% | | | | 51% | | | | 128% | | | | 54% | |
1. Represents the last business day of the Fund’s reporting period.
2. Per share amounts calculated based on the average shares outstanding during the period.
3. Assumes an initial investment on the business day before the first day of the fiscal period, with all dividends and distributions reinvested in additional shares on the reinvestment date, and redemption at the net asset value calculated on the last business day of the fiscal period. Sales charges are not reflected in the total returns. Total returns are not annualized for periods less than one full year. Returns do not reflect the deduction of taxes that a shareholder would pay on fund distributions or the redemption of fund shares.
4. Annualized for periods less than one full year.
5. Less than 0.005%.
6. Total expenses including indirect expenses from affiliated fund fees and expenses were as follows:
| | | | |
| Year Ended October 31, 2016 | | 1.95% | |
| Year Ended October 30, 2015 | | 1.92% | |
| Year Ended October 31, 2014 | | 2.01% | |
| Year Ended October 31, 2013 | | 2.35% | |
| Year Ended October 31, 2012 | | 2.37% | |
See accompanying Notes to Financial Statements.
21 OPPENHEIMER MID CAP VALUE FUND
FINANCIAL HIGHLIGHTS Continued
| | | | | | | | | | | | | | | | | | | | |
| Class C | | Year Ended
October 31,
2016 | | | Year Ended
October 30,
20151 | | | Year Ended
October 31,
2014 | | | Year Ended
October 31,
2013 | | | Year Ended
October 31,
2012 | |
| |
| Per Share Operating Data | | | | | | | | | | | | | | | | | | | | |
| Net asset value, beginning of period | | | $39.00 | | | | $39.35 | | | | $35.83 | | | | $26.52 | | | | $25.64 | |
| |
| Income (loss) from investment operations: | | | | | | | | | | | | | | | | | | | | |
| Net investment income (loss)2 | | | (0.09) | | | | (0.11) | | | | 0.02 | | | | (0.04) | | | | (0.14) | |
| Net realized and unrealized gain (loss) | | | 2.37 | | | | (0.24) | | | | 3.59 | | | | 9.35 | | | | 1.02 | |
| | | | |
| Total from investment operations | | | 2.28 | | | | (0.35) | | | | 3.61 | | | | 9.31 | | | | 0.88 | |
| |
| Dividends and/or distributions to shareholders: | | | | | | | | | | | | | | | | | | | | |
| Dividends from net investment income | | | (0.02) | | | | 0.00 | | | | (0.09) | | | | 0.00 | | | | 0.00 | |
| |
| Net asset value, end of period | | | $41.26 | | | | $39.00 | | | | $39.35 | | | | $35.83 | | | | $26.52 | |
| | | | |
| | | | | | | | | | | | | | | | | | | | |
| |
| Total Return, at Net Asset Value3 | | | 5.84% | | | | (0.87)% | | | | 10.05% | | | | 35.10% | | | | 3.43% | |
| | | | | | | | | | | | | | | | | | | | |
| |
| Ratios/Supplemental Data | | | | | | | | | | | | | | | | | | | | |
| Net assets, end of period (in thousands) | | | $226,455 | | | | $253,446 | | | | $279,925 | | | | $276,676 | | | | $234,237 | |
| |
| Average net assets (in thousands) | | | $233,067 | | | | $278,916 | | | | $283,792 | | | | $252,028 | | | | $258,974 | |
| |
| Ratios to average net assets:4 | | | | | | | | | | | | | | | | | | | | |
| Net investment income (loss) | | | (0.23)% | | | | (0.26)% | | | | 0.05% | | | | (0.13)% | | | | (0.56)% | |
| Expenses excluding specific expenses listed below | | | 1.95% | | | | 1.92% | | | | 1.93% | | | | 2.05% | | | | 2.08% | |
| Interest and fees from borrowings | | | 0.00%5 | | | | 0.00%5 | | | | 0.00% | | | | 0.00% | | | | 0.00% | |
| | | | |
| Total expenses6 | | | 1.95% | | | | 1.92% | | | | 1.93% | | | | 2.05% | | | | 2.08% | |
| Expenses after payments, waivers and/or reimbursements and reduction to custodian expenses | | | 1.95% | | | | 1.92% | | | | 1.93% | | | | 2.05% | | | | 2.06% | |
| |
| Portfolio turnover rate | | | 34% | | | | 47% | | | | 51% | | | | 128% | | | | 54% | |
1. Represents the last business day of the Fund’s reporting period.
2. Per share amounts calculated based on the average shares outstanding during the period.
3. Assumes an initial investment on the business day before the first day of the fiscal period, with all dividends and distributions reinvested in additional shares on the reinvestment date, and redemption at the net asset value calculated on the last business day of the fiscal period. Sales charges are not reflected in the total returns. Total returns are not annualized for periods less than one full year. Returns do not reflect the deduction of taxes that a shareholder would pay on fund distributions or the redemption of fund shares.
4. Annualized for periods less than one full year.
5. Less than 0.005%.
6. Total expenses including indirect expenses from affiliated fund fees and expenses were as follows:
| | | | |
| Year Ended October 31, 2016 | | 1.95% | |
| Year Ended October 30, 2015 | | 1.92% | |
| Year Ended October 31, 2014 | | 1.93% | |
| Year Ended October 31, 2013 | | 2.05% | |
| Year Ended October 31, 2012 | | 2.08% | |
See accompanying Notes to Financial Statements.
22 OPPENHEIMER MID CAP VALUE FUND
| | | | | | | | | | | | | | | | | | | | |
| Class I | | Year Ended
October 31,
2016 | | | Year Ended
October 30,
20151 | | | Year Ended
October 31,
2014 | | | Year Ended
October 31,
2013 | | | Period Ended
October 31,
20122 | |
| |
| Per Share Operating Data | | | | | | | | | | | | | | | | | | | | |
| Net asset value, beginning of period | | | $47.20 | | | | $47.49 | | | | $43.64 | | | | $31.88 | | | | $32.90 | |
| |
| Income (loss) from investment operations: | | | | | | | | | | | | | | | | | | | | |
| Net investment income3 | | | 0.44 | | | | 0.43 | | | | 0.47 | | | | 0.49 | | | | 0.21 | |
| Net realized and unrealized gain (loss) | | | 2.89 | | | | (0.27) | | | | 4.42 | | | | 11.27 | | | | (1.23) | |
| | | | |
| Total from investment operations | | | 3.33 | | | | 0.16 | | | | 4.89 | | | | 11.76 | | | | (1.02) | |
| |
| Dividends and/or distributions to shareholders: | | | | | | | | | | | | | | | | | | | | |
| Dividends from net investment income | | | (0.43) | | | | (0.45) | | | | (1.04) | | | | 0.00 | | | | 0.00 | |
| |
| Net asset value, end of period | | | $50.10 | | | | $47.20 | | | | $47.49 | | | | $43.64 | | | | $31.88 | |
| | | | |
| | | | | | | | | | | | | | | | | | | | |
| |
| Total Return, at Net Asset Value4 | | | 7.10% | | | | 0.31% | | | | 11.36% | | | | 36.85% | | | | (3.07)% | |
| | | | | | | | | | | | | | | | | | | | |
| |
| Ratios/Supplemental Data | | | | | | | | | | | | | | | | | | | | |
| Net assets, end of period (in thousands) | | | $950 | | | | $788 | | | | $427 | | | | $95 | | | | $10 | |
| |
| Average net assets (in thousands) | | | $803 | | | | $621 | | | | $178 | | | | $35 | | | | $422 | |
| |
| Ratios to average net assets:5 | | | | | | | | | | | | | | | | | | | | |
| Net investment income | | | 0.93% | | | | 0.88% | | | | 1.02% | | | | 1.23% | | | | 0.99% | |
| Expenses excluding specific expenses listed below | | | 0.76% | | | | 0.73% | | | | 0.76% | | | | 0.77% | | | | 0.74% | |
| Interest and fees from borrowings | | | 0.00%6 | | | | 0.00%6 | | | | 0.00% | | | | 0.00% | | | | 0.00% | |
| | | | |
| Total expenses7 | | | 0.76% | | | | 0.73% | | | | 0.76% | | | | 0.77% | | | | 0.74% | |
| Expenses after payments, waivers and/or reimbursements and reduction to custodian expenses | | | 0.76% | | | | 0.73% | | | | 0.76% | | | | 0.77% | | | | 0.74% | |
| |
| Portfolio turnover rate | | | 34% | | | | 47% | | | | 51% | | | | 128% | | | | 54% | |
1. Represents the last business day of the Fund’s reporting period.
2. For the period from February 28, 2012 (inception of offering) to October 31, 2012.
3. Per share amounts calculated based on the average shares outstanding during the period.
4. Assumes an initial investment on the business day before the first day of the fiscal period, with all dividends and distributions reinvested in additional shares on the reinvestment date, and redemption at the net asset value calculated on the last business day of the fiscal period. Sales charges are not reflected in the total returns. Total returns are not annualized for periods less than one full year. Returns do not reflect the deduction of taxes that a shareholder would pay on fund distributions or the redemption of fund shares.
5. Annualized for periods less than one full year.
6. Less than 0.005%.
7. Total expenses including indirect expenses from affiliated fund fees and expenses were as follows:
| | | | |
| Year Ended October 31, 2016 | | 0.76% | |
| Year Ended October 30, 2015 | | 0.73% | |
| Year Ended October 31, 2014 | | 0.76% | |
| Year Ended October 31, 2013 | | 0.77% | |
| Period Ended October 31, 2012 | | 0.74% | |
See accompanying Notes to Financial Statements.
23 OPPENHEIMER MID CAP VALUE FUND
FINANCIAL HIGHLIGHTS Continued
| | | | | | | | | | | | | | | | | | | | |
| Class R | | Year Ended
October 31,
2016 | | | Year Ended
October 30,
20151 | | | Year Ended
October 31,
2014 | | | Year Ended
October 31,
2013 | | | Year Ended
October 31,
2012 | |
| |
| Per Share Operating Data | | | | | | | | | | | | | | | | | | | | |
| Net asset value, beginning of period | | | $44.59 | | | | $44.88 | | | | $40.87 | | | | $30.09 | | | | $28.94 | |
| |
| Income (loss) from investment operations: | | | | | | | | | | | | | | | | | | | | |
| Net investment income (loss)2 | | | 0.13 | | | | 0.12 | | | | 0.23 | | | | 0.14 | | | | (0.02) | |
| Net realized and unrealized gain (loss) | | | 2.71 | | | | (0.30) | | | | 4.09 | | | | 10.64 | | | | 1.17 | |
| | | | |
| Total from investment operations | | | 2.84 | | | | (0.18) | | | | 4.32 | | | | 10.78 | | | | 1.15 | |
| |
| Dividends and/or distributions to shareholders: | | | | | | | | | | | | | | | | | | | | |
| Dividends from net investment income | | | (0.12) | | | | (0.11) | | | | (0.31) | | | | 0.00 | | | | 0.00 | |
| |
| Net asset value, end of period | | | $47.31 | | | | $44.59 | | | | $44.88 | | | | $40.87 | | | | $30.09 | |
| | | | |
| | | | | | | | | | | | | | | | | | | | |
| |
| Total Return, at Net Asset Value3 | | | 6.38% | | | | (0.38)% | | | | 10.61% | | | | 35.79% | | | | 3.97% | |
| | | | | | | | | | | | | | | | | | | | |
| |
| Ratios/Supplemental Data | | | | | | | | | | | | | | | | | | | | |
| Net assets, end of period (in thousands) | | | $82,661 | | | | $97,983 | | | | $125,703 | | | | $130,267 | | | | $132,365 | |
| |
| Average net assets (in thousands) | | | $85,721 | | | | $114,811 | | | | $129,580 | | | | $129,674 | | | | $154,101 | |
| |
| Ratios to average net assets:4 | | | | | | | | | | | | | | | | | | | | |
| Net investment income (loss) | | | 0.28% | | | | 0.25% | | | | 0.53% | | | | 0.39% | | | | (0.05)% | |
| Expenses excluding specific expenses listed below | | | 1.45% | | | | 1.42% | | | | 1.45% | | | | 1.53% | | | | 1.59% | |
| Interest and fees from borrowings | | | 0.00%5 | | | | 0.00%5 | | | | 0.00% | | | | 0.00% | | | | 0.00% | |
| | | | |
| Total expenses6 | | | 1.45% | | | | 1.42% | | | | 1.45% | | | | 1.53% | | | | 1.59% | |
| Expenses after payments, waivers and/or reimbursements and reduction to custodian expenses | | | 1.45% | | | | 1.42% | | | | 1.45% | | | | 1.53% | | | | 1.55% | |
| |
| Portfolio turnover rate | | | 34% | | | | 47% | | | | 51% | | | | 128% | | | | 54% | |
1. Represents the last business day of the Fund’s reporting period.
2. Per share amounts calculated based on the average shares outstanding during the period.
3. Assumes an initial investment on the business day before the first day of the fiscal period, with all dividends and distributions reinvested in additional shares on the reinvestment date, and redemption at the net asset value calculated on the last business day of the fiscal period. Sales charges are not reflected in the total returns. Total returns are not annualized for periods less than one full year. Returns do not reflect the deduction of taxes that a shareholder would pay on fund distributions or the redemption of fund shares.
4. Annualized for periods less than one full year.
5. Less than 0.005%.
6. Total expenses including indirect expenses from affiliated fund fees and expenses were as follows:
| | | | |
| Year Ended October 31, 2016 | | 1.45% | |
| Year Ended October 30, 2015 | | 1.42% | |
| Year Ended October 31, 2014 | | 1.45% | |
| Year Ended October 31, 2013 | | 1.53% | |
| Year Ended October 31, 2012 | | 1.59% | |
See accompanying Notes to Financial Statements.
24 OPPENHEIMER MID CAP VALUE FUND
| | | | | | | | | | | | | | | | | | | | |
| Class Y | | Year Ended
October 31,
2016 | | | Year Ended
October 30,
20151 | | | Year Ended
October 31,
2014 | | | Year Ended
October 31,
2013 | | | Year Ended
October 31,
2012 | |
| |
| Per Share Operating Data | | | | | | | | | | | | | | | | | | | | |
| Net asset value, beginning of period | | | $47.59 | | | | $47.88 | | | | $43.81 | | | | $32.20 | | | | $30.78 | |
| |
| Income (loss) from investment operations: | | | | | | | | | | | | | | | | | | | | |
| Net investment income2 | | | 0.36 | | | | 0.36 | | | | 0.52 | | | | 0.34 | | | | 0.19 | |
| Net realized and unrealized gain (loss) | | | 2.91 | | | | (0.30) | | | | 4.37 | | | | 11.40 | | | | 1.23 | |
| | | | |
| Total from investment operations | | | 3.27 | | | | 0.06 | | | | 4.89 | | | | 11.74 | | | | 1.42 | |
| |
| Dividends and/or distributions to shareholders: | | | | | | | | | | | | | | | | | | | | |
| Dividends from net investment income | | | (0.34) | | | | (0.35) | | | | (0.82) | | | | (0.13) | | | | 0.00 | |
| |
| Net asset value, end of period | | | $50.52 | | | | $47.59 | | | | $47.88 | | | | $43.81 | | | | $32.20 | |
| | | | |
| | | | | | | | | | | | | | | | | | | | |
| |
| Total Return, at Net Asset Value3 | | | 6.92% | | | | 0.12% | | | | 11.30% | | | | 36.55% | | | | 4.62% | |
| | | | | | | | | | | | | | | | | | | | |
| |
| Ratios/Supplemental Data | | | | | | | | | | | | | | | | | | | | |
| Net assets, end of period (in thousands) | | | $61,964 | | | | $49,241 | | | | $50,323 | | | | $49,589 | | | | $63,259 | |
| |
| Average net assets (in thousands) | | | $49,957 | | | | $51,876 | | | | $50,290 | | | | $50,572 | | | | $85,178 | |
| |
| Ratios to average net assets:4 | | | | | | | | | | | | | | | | | | | | |
| Net investment income | | | 0.74% | | | | 0.73% | | | | 1.13% | | | | 0.91% | | | | 0.60% | |
| Expenses excluding specific expenses listed below | | | 0.95% | | | | 0.92% | | | | 0.84% | | | | 0.98% | | | | 0.92% | |
| Interest and fees from borrowings | | | 0.00%5 | | | | 0.00%5 | | | | 0.00% | | | | 0.00% | | | | 0.00% | |
| | | | |
| Total expenses6 | | | 0.95% | | | | 0.92% | | | | 0.84% | | | | 0.98% | | | | 0.92% | |
| Expenses after payments, waivers and/or reimbursements and reduction to custodian expenses | | | 0.95% | | | | 0.92% | | | | 0.83% | | | | 0.98% | | | | 0.92% | |
| |
| Portfolio turnover rate | | | 34% | | | | 47% | | | | 51% | | | | 128% | | | | 54% | |
1. Represents the last business day of the Fund’s reporting period.
2. Per share amounts calculated based on the average shares outstanding during the period.
3. Assumes an initial investment on the business day before the first day of the fiscal period, with all dividends and distributions reinvested in additional shares on the reinvestment date, and redemption at the net asset value calculated on the last business day of the fiscal period. Sales charges are not reflected in the total returns. Total returns are not annualized for periods less than one full year. Returns do not reflect the deduction of taxes that a shareholder would pay on fund distributions or the redemption of fund shares.
4. Annualized for periods less than one full year.
5. Less than 0.005%.
6. Total expenses including indirect expenses from affiliated fund fees and expenses were as follows:
| | | | |
| Year Ended October 31, 2016 | | 0.95% | |
| Year Ended October 30, 2015 | | 0.92% | |
| Year Ended October 31, 2014 | | 0.84% | |
| Year Ended October 31, 2013 | | 0.98% | |
| Year Ended October 31, 2012 | | 0.92% | |
See accompanying Notes to Financial Statements.
25 OPPENHEIMER MID CAP VALUE FUND
NOTES TO FINANCIAL STATEMENTS October 31, 2016
1. Organization
Oppenheimer Mid Cap Value Fund (the “Fund”), a series of Oppenheimer Quest for Value Funds, is registered under the Investment Company Act of 1940 (“1940 Act”), as amended, as a diversified open-end management investment company. The Fund’s investment objective is to seek capital appreciation. The Fund’s investment adviser is OFI Global Asset Management, Inc. (“OFI Global” or the “Manager”), a wholly-owned subsidiary of OppenheimerFunds, Inc. (“OFI” or the “Sub-Adviser”). The Manager has entered into a sub-advisory agreement with OFI.
The Fund offers Class A, Class C, Class I, Class R and Class Y shares, and previously offered Class B shares for new purchase through June 29, 2012. Subsequent to that date, no new purchases of Class B shares are permitted, however reinvestment of dividend and/or capital gain distributions and exchanges of Class B shares into and from other Oppenheimer funds are allowed. As of July 1, 2014, Class N shares were renamed Class R shares. Class N shares subject to a contingent deferred sales charge (“CDSC”) on July 1, 2014, continue to be subject to a CDSC after the shares were renamed. Purchases of Class R shares occurring on or after July 1, 2014, are not subject to a CDSC upon redemption. Class A shares are sold at their offering price, which is normally net asset value plus a front-end sales charge. Class C and Class R shares are sold, and Class B shares were sold, without a front-end sales charge but may be subject to a CDSC. Class R shares are sold only through retirement plans. Retirement plans that offer Class R shares may impose charges on those accounts. Class I and Class Y shares are sold to certain institutional investors or intermediaries without either a front-end sales charge or a CDSC, however, the intermediaries may impose charges on their accountholders who beneficially own Class I and Class Y shares. All classes of shares have identical rights and voting privileges with respect to the Fund in general and exclusive voting rights on matters that affect that class alone. Earnings, net assets and net asset value per share may differ due to each class having its own expenses, such as transfer and shareholder servicing agent fees and shareholder communications, directly attributable to that class. Class A, B, C and R shares have separate distribution and/or service plans under which they pay fees. Class I and Class Y shares do not pay such fees. Class B shares will automatically convert to Class A shares 72 months after the date of purchase.
The following is a summary of significant accounting policies followed in the Fund’s preparation of financial statements in accordance with accounting principles generally accepted in the United States (“U.S. GAAP”).
2. Significant Accounting Policies
Security Valuation. All investments in securities are recorded at their estimated fair value, as described in Note 3.
Foreign Currency Translation. The Fund’s accounting records are maintained in U.S. dollars. The values of securities denominated in foreign currencies and amounts related to the purchase and sale of foreign securities and foreign investment income are translated into U.S. dollars as of the close of the New York Stock Exchange (the “Exchange”), normally 4:00 P.M.
26 OPPENHEIMER MID CAP VALUE FUND
2. Significant Accounting Policies (Continued)
Eastern time, on each day the Exchange is open for trading. Foreign exchange rates may be valued primarily using a reliable bank, dealer or service authorized by the Board of Trustees.
Reported net realized gains and losses from foreign currency transactions arise from sales of portfolio securities, sales and maturities of short-term securities, sales of foreign currencies, exchange rate fluctuations between the trade and settlement dates on securities transactions, and the difference between the amounts of dividends, interest, and foreign withholding taxes recorded on the Fund’s books and the U.S. dollar equivalent of the amounts actually received or paid. Net unrealized appreciation and depreciation on the translation of assets and liabilities denominated in foreign currencies arise from changes in the values of assets and liabilities, including investments in securities at fiscal period end, resulting from changes in exchange rates.
The effect of changes in foreign currency exchange rates on investments is separately identified from the fluctuations arising from changes in market values of securities held and reported with all other foreign currency gains and losses in the Fund’s Statement of Operations.
Allocation of Income, Expenses, Gains and Losses. Income, expenses (other than those attributable to a specific class), gains and losses are allocated on a daily basis to each class of shares based upon the relative proportion of net assets represented by such class. Operating expenses directly attributable to a specific class are charged against the operations of that class.
Dividends and Distributions to Shareholders. Dividends and distributions to shareholders, which are determined in accordance with income tax regulations and may differ from U.S. GAAP, are recorded on the ex-dividend date. Income distributions, if any, are declared and paid quarterly. Capital gain distributions, if any, are declared and paid annually or at other times as deemed necessary by the Manager.
Investment Income. Dividend income is recorded on the ex-dividend date or upon ex-dividend notification in the case of certain foreign dividends where the ex-dividend date may have passed. Non-cash dividends included in dividend income, if any, are recorded at the fair market value of the securities received. Interest income is recognized on an accrual basis. Discount and premium, which are included in interest income on the Statement of Operations, are amortized or accreted daily.
Return of Capital Estimates. Distributions received from the Fund’s investments in Master Limited Partnerships (MLPs) and Real Estate Investments Trusts (REITs), generally are comprised of income and return of capital. The Fund records investment income and return of capital based on estimates. Such estimates are based on historical information available from each MLP, REIT and other industry sources. These estimates may subsequently be revised based on information received from MLPs and REITs after their tax reporting periods are concluded.
27 OPPENHEIMER MID CAP VALUE FUND
NOTES TO FINANCIAL STATEMENTS Continued
2. Significant Accounting Policies (Continued)
Custodian Fees. “Custodian fees and expenses” in the Statement of Operations may include interest expense incurred by the Fund on any cash overdrafts of its custodian account during the period. Such cash overdrafts may result from the effects of failed trades in portfolio securities and from cash outflows resulting from unanticipated shareholder redemption activity. The Fund pays interest to its custodian on such cash overdrafts, to the extent they are not offset by positive cash balances maintained by the Fund, based on the negative rolling average balance at an average Federal Funds Rate plus 0.50%. The “Reduction to custodian expenses” line item, if applicable, represents earnings on cash balances maintained by the Fund during the period. Such interest expense and other custodian fees may be paid with these earnings.
Security Transactions. Security transactions are recorded on the trade date. Realized gains and losses on securities sold are determined on the basis of identified cost.
Indemnifications. The Fund’s organizational documents provide current and former Trustees and officers with a limited indemnification against liabilities arising in connection with the performance of their duties to the Fund. In the normal course of business, the Fund may also enter into contracts that provide general indemnifications. The Fund’s maximum exposure under these arrangements is unknown as this would be dependent on future claims that may be made against the Fund. The risk of material loss from such claims is considered remote.
Federal Taxes. The Fund intends to comply with provisions of the Internal Revenue Code applicable to regulated investment companies and to distribute substantially all of its investment company taxable income, including any net realized gain on investments not offset by capital loss carryforwards, if any, to shareholders. Therefore, no federal income or excise tax provision is required. The Fund files income tax returns in U.S. federal and applicable state jurisdictions. The statute of limitations on the Fund’s tax return filings generally remains open for the three preceding fiscal reporting period ends. The Fund has analyzed its tax positions for the fiscal year ended October 31, 2016, including open tax years, and does not believe there are any uncertain tax positions requiring recognition in the Fund’s financial statements.
The tax components of capital shown in the following table represent distribution requirements the Fund must satisfy under the income tax regulations, losses the Fund may be able to offset against income and gains realized in future years and unrealized appreciation or depreciation of securities and other investments for federal income tax purposes.
| | | | | | | | | | | | |
| Undistributed Net Investment Income | | Undistributed
Long-Term
Gain | | | Accumulated
Loss
Carryforward1,2,3 | | | Net Unrealized
Appreciation
Based on cost of
Securities and
Other Investments
for Federal Income
Tax Purposes | |
| |
$1,097,600 | | | $— | | | | $64,627,129 | | | | $185,520,776 | |
28 OPPENHEIMER MID CAP VALUE FUND
2. Significant Accounting Policies (Continued)
1. At period end, the Fund had $64,627,129 of net capital loss carryforward available to offset future realized capital gains, if any, and thereby reduce future taxable gain distributions. Details of the capital loss carryforwards are included in the table below. Capital loss carryovers with no expiration, if any, must be utilized prior to those with expiration dates.
| | | | |
| Expiring | | | | |
|
2017 | | $ | | 64,627,129 |
2. During the reporting period, the Fund utilized $15,695,567 of capital loss carryforward to offset capital gains realized in that fiscal year.
3. During the previous reporting period, the Fund utilized $151,137,619 of capital loss carryforward to offset capital gains realized in that fiscal year.
Net investment income (loss) and net realized gain (loss) may differ for financial statement and tax purposes. The character of dividends and distributions made during the fiscal year from net investment income or net realized gains are determined in accordance with federal income tax requirements, which may differ from the character of net investment income or net realized gains presented in those financial statements in accordance with U.S. GAAP. Also, due to timing of dividends and distributions, the fiscal year in which amounts are distributed may differ from the fiscal year in which the income or net realized gain was recorded by the Fund.
Accordingly, the following amounts have been reclassified for the reporting period. Net assets of the Fund were unaffected by the reclassifications.
| | | | |
Increase to Accumulated Net Investment Income | | Increase
to Accumulated Net
Realized Loss
on Investments | |
| |
$79,585 | | | $79,585 | |
The tax character of distributions paid during the reporting periods:
| | | | | | | | |
| | | Year Ended
October 31, 2016 | | | Year Ended
October 31, 2015 | |
| |
Distributions paid from: | | | | | | | | |
Ordinary income | | $ | 5,141,163 | | | $ | 5,805,238 | |
The aggregate cost of securities and other investments and the composition of unrealized appreciation and depreciation of securities and other investments for federal income tax purposes at period end are noted in the following table. The primary difference between book and tax appreciation or depreciation of securities and other investments, if applicable, is attributable to the tax deferral of losses or tax realization of financial statement unrealized gain or loss.
| | | | |
Federal tax cost of securities | | $ | 1,119,230,082 | |
| | | | |
Gross unrealized appreciation | | $ | 224,986,872 | |
Gross unrealized depreciation | | | (39,466,096) | |
| | | | |
Net unrealized appreciation | | $ | 185,520,776 | |
| | | | |
29 OPPENHEIMER MID CAP VALUE FUND
NOTES TO FINANCIAL STATEMENTS Continued
2. Significant Accounting Policies (Continued)
Use of Estimates. The preparation of financial statements in conformity with U.S. GAAP requires management to make estimates and assumptions that affect the reported amounts of assets and liabilities and disclosure of contingent assets and liabilities at the date of the financial statements and the reported amounts of increases and decreases in net assets from operations during the reporting period. Actual results could differ from those estimates.
3. Securities Valuation
The Fund calculates the net asset value of its shares as of 4:00 P.M. Eastern time, on each day the New York Stock Exchange (the “Exchange”) is open for trading, except in the case of a scheduled early closing of the Exchange, in which case the Fund will calculate net asset value of the shares as of the scheduled early closing time of the Exchange.
The Fund’s Board has adopted procedures for the valuation of the Fund’s securities and has delegated the day-to-day responsibility for valuation determinations under those procedures to the Manager. The Manager has established a Valuation Committee which is responsible for determining a “fair valuation” for any security for which market quotations are not “readily available.” The Valuation Committee’s fair valuation determinations are subject to review, approval and ratification by the Fund’s Board at its next regularly scheduled meeting covering the calendar quarter in which the fair valuation was determined.
Valuation Methods and Inputs
Securities are valued using unadjusted quoted market prices, when available, as supplied primarily by third party pricing services or dealers.
The following methodologies are used to determine the market value or the fair value of the types of securities described below:
Securities traded on a registered U.S. securities exchange (including exchange-traded derivatives other than futures and futures options) are valued based on the last sale price of the security reported on the principal exchange on which it is traded, prior to the time when the Fund’s assets are valued. In the absence of a sale, the security is valued at the mean between the bid and asked price on the principal exchange or, if not available from the principal exchange, obtained from two dealers. If bid and asked prices are not available from either the exchange or two dealers, the security is valued by using one of the following methodologies (listed in order of priority): (1) a bid from the principal exchange, (2) the mean between the bid and asked price as provided by a single dealer, or (3) a bid from a single dealer. A security of a foreign issuer traded on a foreign exchange, but not listed on a registered U.S. securities exchange, is valued based on the last sale price on the principal exchange on which the security is traded, as identified by the third party pricing service used by the Manager, prior to the time when the Fund’s assets are valued. If the last sale price is unavailable, the security is valued at the most recent official closing price on the principal exchange on which it is traded. If the last sales price or official closing price for a foreign security is not available, the security is valued at the mean between the bid and asked price per the exchange or, if not available from the exchange, obtained from two dealers. If bid and
30 OPPENHEIMER MID CAP VALUE FUND
3. Securities Valuation (Continued)
asked prices are not available from either the exchange or two dealers, the security is valued by using one of the following methodologies (listed in order of priority): (1) a bid from the exchange, (2) the mean between the bid and asked price as provided by a single dealer, or (3) a bid from a single dealer.
Shares of a registered investment company that are not traded on an exchange are valued at that investment company’s net asset value per share.
Corporate and government debt securities (of U.S. or foreign issuers) and municipal debt securities, event-linked bonds, loans, mortgage-backed securities, collateralized mortgage obligations, and asset-backed securities are valued at the mean between the “bid” and “asked” prices utilizing evaluated prices obtained from third party pricing services or broker-dealers who may use matrix pricing methods to determine the evaluated prices.
Short-term money market type debt securities with a remaining maturity of sixty days or less are valued at cost adjusted by the amortization of discount or premium to maturity (amortized cost), which approximates market value. Short-term debt securities with a remaining maturity in excess of sixty days are valued at the mean between the “bid” and “asked” prices utilizing evaluated prices obtained from third party pricing services or broker-dealers.
A description of the standard inputs that may generally be considered by the third party pricing vendors in determining their evaluated prices is provided below.
| | |
| Security Type | | Standard inputs generally considered by third-party pricing vendors |
|
| Corporate debt, government debt, municipal, mortgage- backed and asset-backed securities | | Reported trade data, broker-dealer price quotations, benchmark yields, issuer spreads on comparable securities, the credit quality, yield, maturity, and other appropriate factors. |
|
| Loans | | Information obtained from market participants regarding reported trade data and broker-dealer price quotations. |
|
| Event-linked bonds | | Information obtained from market participants regarding reported trade data and broker-dealer price quotations. |
If a market value or price cannot be determined for a security using the methodologies described above, or if, in the “good faith” opinion of the Manager, the market value or price obtained does not constitute a “readily available market quotation,” or a significant event has occurred that would materially affect the value of the security, the security is fair valued either (i) by a standardized fair valuation methodology applicable to the security type or the significant event as previously approved by the Valuation Committee and the Fund’s Board or (ii) as determined in good faith by the Manager’s Valuation Committee. The Valuation Committee considers all relevant facts that are reasonably available, through either public information or information available to the Manager, when determining the fair value of a security. Fair value determinations by the Manager are subject to review, approval and ratification by the Fund’s Board at its next regularly scheduled meeting covering the calendar quarter in which the fair valuation was determined. Those fair valuation standardized methodologies include, but are not limited to, valuing securities at the last sale price or initially at cost and subsequently adjusting the value based on: changes in company specific
31 OPPENHEIMER MID CAP VALUE FUND
NOTES TO FINANCIAL STATEMENTS Continued
3. Securities Valuation (Continued)
fundamentals, changes in an appropriate securities index, or changes in the value of similar securities which may be further adjusted for any discounts related to security-specific resale restrictions. When possible, such methodologies use observable market inputs such as unadjusted quoted prices of similar securities, observable interest rates, currency rates and yield curves. The methodologies used for valuing securities are not necessarily an indication of the risks associated with investing in those securities nor can it be assured that the Fund can obtain the fair value assigned to a security if it were to sell the security.
To assess the continuing appropriateness of security valuations, the Manager, or its third party service provider who is subject to oversight by the Manager, regularly compares prior day prices, prices on comparable securities, and sale prices to the current day prices and challenges those prices exceeding certain tolerance levels with the third party pricing service or broker source. For those securities valued by fair valuations, whether through a standardized fair valuation methodology or a fair valuation determination, the Valuation Committee reviews and affirms the reasonableness of the valuations based on such methodologies and fair valuation determinations on a regular basis after considering all relevant information that is reasonably available.
Classifications
Each investment asset or liability of the Fund is assigned a level at measurement date based on the significance and source of the inputs to its valuation. Various data inputs are used in determining the value of each of the Fund’s investments as of the reporting period end. These data inputs are categorized in the following hierarchy under applicable financial accounting standards:
1) Level 1-unadjusted quoted prices in active markets for identical assets or liabilities (including securities actively traded on a securities exchange)
2) Level 2-inputs other than unadjusted quoted prices that are observable for the asset or liability (such as unadjusted quoted prices for similar assets and market corroborated inputs such as interest rates, prepayment speeds, credit risks, etc.)
3) Level 3-significant unobservable inputs (including the Manager’s own judgments about assumptions that market participants would use in pricing the asset or liability).
The inputs used for valuing securities are not necessarily an indication of the risks associated with investing in those securities.
The Fund classifies each of its investments in investment companies which are publicly offered as Level 1. Investment companies that are not publicly offered are measured using net asset value as a practical expedient, and are not classified in the fair value hierarchy.
The table below categorizes amounts that are included in the Fund’s Statement of Assets and Liabilities at period end based on valuation input level:
32 OPPENHEIMER MID CAP VALUE FUND
3. Securities Valuation (Continued)
| | | | | | | | | | | | | | | | |
| | | Level 1—
Unadjusted
Quoted Prices | | | Level 2—
Other Significant
Observable Inputs | | | Level 3—
Significant
Unobservable
Inputs | | | Value | |
| |
Assets Table | | | | | | | | | | | | | | | | |
Investments, at Value: | | | | | | | | | | | | | | | | |
Common Stocks | | | | | | | | | | | | | | | | |
Consumer Discretionary | | $ | 94,971,851 | | | $ | — | | | $ | — | | | $ | 94,971,851 | |
Consumer Staples | | | 74,862,039 | | | | — | | | | — | | | | 74,862,039 | |
Energy | | | 99,071,876 | | | | — | | | | — | | | | 99,071,876 | |
Financials | | | 378,552,967 | | | | — | | | | — | | | | 378,552,967 | |
Health Care | | | 95,596,375 | | | | 1,311,061 | | | | — | | | | 96,907,436 | |
Industrials | | | 191,589,414 | | | | — | | | | — | | | | 191,589,414 | |
Information Technology | | | 153,586,311 | | | | — | | | | — | | | | 153,586,311 | |
Materials | | | 116,036,043 | | | | — | | | | — | | | | 116,036,043 | |
Utilities | | | 75,534,494 | | | | — | | | | — | | | | 75,534,494 | |
Investment Company | | | 23,638,621 | | | | — | | | | — | | | | 23,638,621 | |
| | | | |
Total Assets | | $ | 1,303,439,991 | | | $ | 1,311,061 | | | $ | — | | | $ | 1,304,751,052 | |
| | | | |
Forward currency exchange contracts and futures contracts, if any, are reported at their unrealized appreciation/depreciation at measurement date, which represents the change in the contract’s value from trade date. All additional assets and liabilities included in the above table are reported at their market value at measurement date.
4. Investments and Risks
Investments in Affiliated Funds. The Fund is permitted to invest in other mutual funds advised by the Manager (“Affiliated Funds”). Affiliated Funds are open-end management investment companies registered under the 1940 Act, as amended. The Manager is the investment adviser of, and the Sub-Adviser provides investment and related advisory services to, the Affiliated Funds. When applicable, the Fund’s investments in Affiliated Funds are included in the Statement of Investments. Shares of Affiliated Funds are valued at their net asset value per share. As a shareholder, the Fund is subject to its proportional share of the Affiliated Funds’ expenses, including their management fee. The Manager will waive fees and/or reimburse Fund expenses in an amount equal to the indirect management fees incurred through the Fund’s investment in the Affiliated Funds.
Each of the Affiliated Funds in which the Fund invests has its own investment risks, and those risks can affect the value of the Fund’s investments and therefore the value of the Fund’s shares. To the extent that the Fund invests more of its assets in one Affiliated Fund than in another, the Fund will have greater exposure to the risks of that Affiliated Fund.
Investments in Money Market Instruments. The Fund is permitted to invest its free cash balances in money market instruments to provide liquidity or for defensive purposes. The Fund may invest in money market instruments by investing in Class E shares of Oppenheimer Institutional Government Money Market Fund (“IGMMF”), formerly known as Oppenheimer Institutional Money Market Fund, which is an Affiliated Fund. IGMMF is regulated as a money
33 OPPENHEIMER MID CAP VALUE FUND
NOTES TO FINANCIAL STATEMENTS Continued
4. Investments and Risks (Continued)
market fund under the 1940 Act, as amended. The Fund may also invest in money market instruments directly or in other affiliated or unaffiliated money market funds.
Master Limited Partnerships (“MLPs”). MLPs issue common units that represent an equity ownership interest in a partnership and provide limited voting rights. MLP common units are registered with the Securities and Exchange Commission (“SEC”), and are freely tradable on securities exchanges such as the NYSE and the NASDAQ Stock Market (“NASDAQ”), or in the over-the-counter (“OTC”) market. An MLP consists of one or more general partners, who conduct the business, and one or more limited partners, who contribute capital. MLP common unit holders have a limited role in the partnership’s operations and management. The Fund, as a limited partner, normally would not be liable for the debts of the MLP beyond the amounts the Fund has contributed, but would not be shielded to the same extent that a shareholder of a corporation would be. In certain circumstances creditors of an MLP would have the right to seek return of capital distributed to a limited partner. This right of an MLP’s creditors would continue after the Fund sold its investment in the MLP.
Equity Security Risk. Stocks and other equity securities fluctuate in price. The value of the Fund’s portfolio may be affected by changes in the equity markets generally. Equity markets may experience significant short-term volatility and may fall sharply at times. Different markets may behave differently from each other and U.S. equity markets may move in the opposite direction from one or more foreign stock markets. Adverse events in any part of the equity or fixed-income markets may have unexpected negative effects on other market segments.
The prices of individual equity securities generally do not all move in the same direction at the same time and a variety of factors can affect the price of a particular company’s securities. These factors may include, but are not limited to, poor earnings reports, a loss of customers, litigation against the company, general unfavorable performance of the company’s sector or industry, or changes in government regulations affecting the company or its industry.
5. Market Risk Factors
The Fund’s investments in securities and/or financial derivatives may expose the Fund to various market risk factors:
Commodity Risk. Commodity risk relates to the change in value of commodities or commodity indexes as they relate to increases or decreases in the commodities market. Commodities are physical assets that have tangible properties. Examples of these types of assets are crude oil, heating oil, metals, livestock, and agricultural products.
Credit Risk. Credit risk relates to the ability of the issuer of debt to meet interest and principal payments, or both, as they come due. In general, lower-grade, higher-yield debt securities are subject to credit risk to a greater extent than lower-yield, higher-quality securities.
Equity Risk. Equity risk relates to the change in value of equity securities as they relate to increases or decreases in the general market.
34 OPPENHEIMER MID CAP VALUE FUND
5. Market Risk Factors (Continued)
Foreign Exchange Rate Risk. Foreign exchange rate risk relates to the change in the U.S. dollar value of a security held that is denominated in a foreign currency. The U.S. dollar value of a foreign currency denominated security will decrease as the dollar appreciates against the currency, while the U.S. dollar value will increase as the dollar depreciates against the currency.
Interest Rate Risk. Interest rate risk refers to the fluctuations in value of fixed-income securities resulting from the inverse relationship between price and yield. For example, an increase in general interest rates will tend to reduce the market value of already issued fixed-income investments, and a decline in general interest rates will tend to increase their value. In addition, debt securities with longer maturities, which tend to have higher yields, are subject to potentially greater fluctuations in value from changes in interest rates than obligations with shorter maturities.
Volatility Risk. Volatility risk refers to the magnitude of the movement, but not the direction of the movement, in a financial instrument’s price over a defined time period. Large increases or decreases in a financial instrument’s price over a relative time period typically indicate greater volatility risk, while small increases or decreases in its price typically indicate lower volatility risk.
6. Shares of Beneficial Interest
The Fund has authorized an unlimited number of $0.01 par value shares of beneficial interest of each class. Transactions in shares of beneficial interest were as follows:
| | | | | | | | | | | | | | | | |
| | | Year Ended October 31, 2016 | | | Year Ended October 30, 20151 | |
| | | Shares | | | Amount | | | Shares | | | Amount | |
| |
Class A | | | | | | | | | | | | | | | | |
Sold | | | 1,851,803 | | | $ | 86,644,637 | | | | 2,255,940 | | | $ | 109,086,400 | |
Dividends and/or distributions reinvested | | | 89,358 | | | | 4,213,612 | | | | 101,546 | | | | 4,867,198 | |
Redeemed | | | (4,088,581) | | | | (189,386,460) | | | | (5,170,323) | | | | (250,775,783) | |
| | | | |
Net decrease | | | (2,147,420) | | | $ | (98,528,211) | | | | (2,812,837) | | | $ | (136,822,185) | |
| | | | |
|
| |
Class B | | | | | | | | | | | | | | | | |
Sold | | | 10,608 | | | $ | 420,083 | | | | 17,119 | | | $ | 701,094 | |
Dividends and/or distributions reinvested | | | 66 | | | | 2,602 | | | | — | | | | — | |
Redeemed | | | (268,433) | | | | (10,446,750) | | | | (427,628) | | | | (17,388,616) | |
| | | | |
Net decrease | | | (257,759) | | | $ | (10,024,065) | | | | (410,509) | | | $ | (16,687,522) | |
| | | | |
|
| |
Class C | | | | | | | | | | | | | | | | |
Sold | | | 474,878 | | | $ | 18,404,532 | | | | 739,635 | | | $ | 30,223,895 | |
Dividends and/or distributions reinvested | | | 2,043 | | | | 81,782 | | | | — | | | | — | |
Redeemed | | | (1,487,283) | | | | (57,714,430) | | | | (1,355,102) | | | | (55,085,400) | |
| | | | |
Net decrease | | | (1,010,362) | | | $ | (39,228,116) | | | | (615,467) | | | $ | (24,861,505) | |
| | | | |
35 OPPENHEIMER MID CAP VALUE FUND
NOTES TO FINANCIAL STATEMENTS Continued
6. Shares of Beneficial Interest (Continued)
| | | | | | | | | | | | | | | | |
| | | Year Ended October 31, 2016 | | | Year Ended October 30, 20151 | |
| | | Shares | | | Amount | | | Shares | | | Amount | |
| |
Class I | | | | | | | | | | | | | | | | |
Sold | | | 4,994 | | | $ | 239,851 | | | | 9,008 | | | $ | 434,194 | |
Dividends and/or distributions reinvested | | | 148 | | | | 7,088 | | | | 114 | | | | 5,524 | |
Redeemed | | | (2,869) | | | | (134,766) | | | | (1,407) | | | | (69,688) | |
| | | | |
Net increase | | | 2,273 | | | $ | 112,173 | | | | 7,715 | | | $ | 370,030 | |
| | | | |
|
| |
Class R | | | | | | | | | | | | | | | | |
Sold | | | 291,716 | | | $ | 12,963,141 | | | | 377,495 | | | $ | 17,567,746 | |
Dividends and/or distributions reinvested | | | 4,454 | | | | 203,088 | | | | 5,671 | | | | 262,387 | |
Redeemed | | | (746,286) | | | | (33,583,731) | | | | (986,856) | | | | (45,965,513) | |
| | | | |
Net decrease | | | (450,116) | | | $ | (20,417,502) | | | | (603,690) | | | $ | (28,135,380) | |
| | | | |
|
| |
Class Y | | | | | | | | | | | | | | | | |
Sold | | | 549,994 | | | $ | 27,281,166 | | | | 282,520 | | | $ | 13,973,036 | |
Dividends and/or distributions reinvested | | | 6,580 | | | | 318,941 | | | | 6,385 | | | | 312,843 | |
Redeemed | | | (364,634) | | | | (17,430,537) | | | | (305,180) | | | | (15,261,365) | |
| | | | |
Net increase (decrease) | | | 191,940 | | | $ | 10,169,570 | | | | (16,275) | | | $ | (975,486) | |
| | | | |
1. Represents the last business day of the Fund’s reporting period.
7. Purchases and Sales of Securities
The aggregate cost of purchases and proceeds from sales of securities, other than short-term obligations and investments in IGMMF, for the reporting period were as follows:
| | | | | | | | |
| | | Purchases | | | Sales | |
| |
Investment securities | | $ | 437,119,162 | | | $ | 605,083,282 | |
8. Fees and Other Transactions with Affiliates
Management Fees. Under the investment advisory agreement, the Fund pays the Manager a management fee based on the daily net assets of the Fund at an annual rate as shown in the following table:
| | |
| Fee Schedule | | |
|
Up to $400 million | | 0.80% |
Next $400 million | | 0.75 |
Next $1.2 billion | | 0.60 |
Next $4 billion | | 0.58 |
Over $6 billion | | 0.56 |
The Fund’s effective management fee for the reporting period was 0.71% of average annual net assets before any applicable waivers.
Sub-Adviser Fees. The Manager has retained the Sub-Adviser to provide the day-to-day portfolio management of the Fund. Under the Sub-Advisory Agreement, the Manager pays the Sub-Adviser an annual fee in monthly installments, equal to a percentage of the investment
36 OPPENHEIMER MID CAP VALUE FUND
8. Fees and Other Transactions with Affiliates (Continued)
management fee collected by the Manager from the Fund, which shall be calculated after any investment management fee waivers. The fee paid to the Sub-Adviser is paid by the Manager, not by the Fund.
Transfer Agent Fees. OFI Global (the “Transfer Agent”) serves as the transfer and shareholder servicing agent for the Fund. The Fund pays the Transfer Agent a fee based on annual net assets. Fees incurred and average net assets for each class with respect to these services are detailed in the Statement of Operations and Financial Highlights, respectively.
Sub-Transfer Agent Fees. The Transfer Agent has retained Shareholder Services, Inc., a wholly-owned subsidiary of OFI (the “Sub-Transfer Agent”), to provide the day-to-day transfer agent and shareholder servicing of the Fund. Under the Sub-Transfer Agency Agreement, the Transfer Agent pays the Sub-Transfer Agent an annual fee in monthly installments, equal to a percentage of the transfer agent fee collected by the Transfer Agent from the Fund, which shall be calculated after any applicable fee waivers. The fee paid to the Sub-Transfer Agent is paid by the Transfer Agent, not by the Fund.
Trustees’ Compensation. The Fund has adopted an unfunded retirement plan (the “Plan”) for the Fund’s Independent Trustees. Benefits are based on years of service and fees paid to each Trustee during their period of service. The Plan was frozen with respect to adding new participants effective December 31, 2006 (the “Freeze Date”) and existing Plan Participants as of the Freeze Date will continue to receive accrued benefits under the Plan. Active Independent Trustees as of the Freeze Date have each elected a distribution method with respect to their benefits under the Plan. During the reporting period, the Fund’s projected benefit obligations, payments to retired Trustees and accumulated liability were as follows:
| | | | |
Projected Benefit Obligations Increased | | $ | 2,380 | |
Payments Made to Retired Trustees | | | 63,860 | |
Accumulated Liability as of October 31, 2016 | | | 248,683 | |
The Fund’s Board of Trustees (“Board”) has adopted a compensation deferral plan for Independent Trustees that enables Trustees to elect to defer receipt of all or a portion of the annual compensation they are entitled to receive from the Fund. For purposes of determining the amount owed to the Trustee under the plan, deferred amounts are treated as though equal dollar amounts had been invested in shares of the Fund or in other Oppenheimer funds selected by the Trustee. The Fund purchases shares of the funds selected for deferral by the Trustee in amounts equal to his or her deemed investment, resulting in a Fund asset equal to the deferred compensation liability. Such assets are included as a component of “Other” within the asset section of the Statement of Assets and Liabilities. Deferral of Trustees’ fees under the plan will not affect the net assets of the Fund and will not materially affect the Fund’s assets, liabilities or net investment income per share. Amounts will be deferred until distributed in accordance with the compensation deferral plan.
37 OPPENHEIMER MID CAP VALUE FUND
NOTES TO FINANCIAL STATEMENTS Continued
8. Fees and Other Transactions with Affiliates (Continued)
Distribution and Service Plan (12b-1) Fees. Under its General Distributor’s Agreement with the Fund, OppenheimerFunds Distributor, Inc. (the “Distributor”) acts as the Fund’s principal underwriter in the continuous public offering of the Fund’s classes of shares.
Distribution and Service Plan for Class A Shares. The Fund has adopted a Distribution and Service Plan (the “Plan”) for Class A shares pursuant to Rule 12b-1 under the 1940 Act. Under the Plan, the Fund pays a service fee to the Distributor at an annual rate of 0.25% of the daily net assets of Class A shares. The Distributor currently uses all of those fees to pay dealers, brokers, banks and other financial institutions periodically for providing personal services and maintenance of accounts of their customers that hold Class A shares. Under the Plan, the Fund may also pay an asset-based sales charge to the Distributor. However, the Fund’s Board has currently set the rate at zero. Fees incurred by the Fund under the Plan are detailed in the Statement of Operations.
Distribution and Service Plans for Class B, Class C and Class R Shares. The Fund has adopted Distribution and Service Plans (the “Plans”) for Class B, Class C and Class R shares pursuant to Rule 12b-1 under the 1940 Act to compensate the Distributor for distributing those share classes, maintaining accounts and providing shareholder services. Under the Plans, the Fund pays the Distributor an annual asset-based sales charge of 0.75% on Class B and Class C shares’ daily net assets and 0.25% on Class R shares’ daily net assets. The Fund also pays a service fee under the Plans at an annual rate of 0.25% of daily net assets. The Plans continue in effect from year to year only if the Fund’s Board of Trustees votes annually to approve their continuance at an in person meeting called for that purpose. Fees incurred by the Fund under the Plans are detailed in the Statement of Operations.
Sales Charges. Front-end sales charges and CDSC do not represent expenses of the Fund. They are deducted from the proceeds of sales of Fund shares prior to investment or from redemption proceeds prior to remittance, as applicable. The sales charges retained by the Distributor from the sale of shares and the CDSC retained by the Distributor on the redemption of shares is shown in the following table for the period indicated.
| | | | | | | | | | | | | | | | | | | | |
| Year Ended | | Class A
Front-End
Sales Charges
Retained by
Distributor | | | Class A
Contingent
Deferred
Sales Charges
Retained by
Distributor | | | Class B
Contingent
Deferred
Sales Charges
Retained by
Distributor | | | Class C
Contingent
Deferred
Sales Charges
Retained by
Distributor | | | Class R
Contingent
Deferred
Sales Charges
Retained by
Distributor | |
October 31, 2016 | | | $209,220 | | | | $2,003 | | | | $13,583 | | | | $9,830 | | | | $3 | |
Waivers and Reimbursements of Expenses. The Manager will waive fees and/or reimburse Fund expenses in an amount equal to the indirect management fees incurred through the Fund’s investment in IGMMF. During the reporting period, the Manager waived fees and/or reimbursed the Fund $18,923 for IGMMF management fees.
Waivers and/or reimbursements may be modified or terminated as set forth according to
38 OPPENHEIMER MID CAP VALUE FUND
8. Fees and Other Transactions with Affiliates (Continued)
the terms in the prospectus.
9. Borrowings and Other Financing
Joint Credit Facility. A number of mutual funds managed by the Manager participate in a $1.3 billion revolving credit facility (the “Facility”) intended to provide short-term financing, if necessary, subject to certain restrictions in connection with atypical redemption activity. Expenses and fees related to the Facility are paid by the participating funds and are disclosed separately or as other expenses on the Statement of Operations. The Fund did not utilize the Facility during the reporting period.
10. Pending Litigation
In 2009, several putative class action lawsuits were filed and later consolidated before the U.S. District Court for the District of Colorado in connection with the investment performance of Oppenheimer Rochester California Municipal Fund (the “California Fund”), a fund advised by OppenheimerFunds, Inc. (“OFI”) and distributed by OppenheimerFunds Distributor, Inc. (“OFDI”). The plaintiffs asserted claims against OFI, OFDI and certain present and former trustees and officers of the California Fund under the federal securities laws, alleging, among other things, that the disclosure documents of the California Fund contained misrepresentations and omissions and the investment policies of the California Fund were not followed. An amended complaint and a motion to dismiss were filed, and in 2011, the court issued an order which granted in part and denied in part the defendants’ motion to dismiss. In October 2015, following a successful appeal by defendants and a subsequent hearing, the court granted plaintiffs’ motion for class certification and appointed class representatives and class counsel.
OFI and OFDI believe the suit is without merit; that it is premature to render any opinion as to the likelihood of an outcome unfavorable to them in the suit; and that no estimate can yet be made as to the amount or range of any potential loss. Furthermore, OFI believes that the suit should not impair the ability of OFI or OFDI to perform their respective duties to the Fund and that the outcome of the suit should not have any material effect on the operations of any of the Oppenheimer funds.
39 OPPENHEIMER MID CAP VALUE FUND
REPORT OF INDEPENDENT REGISTERED PUBLIC ACCOUNTING FIRM
The Board of Trustees and Shareholders of Oppenheimer Quest For Value Funds:
We have audited the accompanying statement of assets and liabilities of Oppenheimer Mid Cap Value Fund, a series of Oppenheimer Quest For Value Funds, including the statement of investments, as of October 31, 2016, and the related statement of operations for the year then ended, the statements of changes in net assets for each of the years in the two-year period then ended, and the financial highlights for each of the years or periods in the five-year period then ended. These financial statements and financial highlights are the responsibility of the Fund’s management. Our responsibility is to express an opinion on these financial statements and financial highlights based on our audits.
We conducted our audits in accordance with the standards of the Public Company Accounting Oversight Board (United States). Those standards require that we plan and perform the audit to obtain reasonable assurance about whether the financial statements and financial highlights are free of material misstatement. An audit includes examining, on a test basis, evidence supporting the amounts and disclosures in the financial statements. Our procedures included confirmation of securities owned as of October 31, 2016, by correspondence with the custodian, transfer agent and brokers, or by other appropriate auditing procedures where replies from brokers were not received. An audit also includes assessing the accounting principles used and significant estimates made by management, as well as evaluating the overall financial statement presentation. We believe that our audits provide a reasonable basis for our opinion.
In our opinion, the financial statements and financial highlights referred to above present fairly, in all material respects, the financial position of Oppenheimer Mid Cap Value Fund as of October 31, 2016, the results of its operations for the year then ended, the changes in its net assets for each of the years in the two-year period then ended, and the financial highlights for each of the years or periods in the five-year period then ended, in conformity with U.S. generally accepted accounting principles.
KPMGLLP
Denver, Colorado
December 22, 2016
40 OPPENHEIMER MID CAP VALUE FUND
FEDERAL INCOME TAX INFORMATION Unaudited
In early 2016, if applicable, shareholders of record received information regarding all dividends and distributions paid to them by the Fund during calendar year 2015.
Dividends, if any, paid by the Fund during the reporting period which are not designated as capital gain distributions should be multiplied by the maximum amount allowable but not less than 100% to arrive at the amount eligible for the corporate dividend-received deduction.
A portion, if any, of the dividends paid by the Fund during the reporting period which are not designated as capital gain distributions are eligible for lower individual income tax rates to the extent that the Fund has received qualified dividend income as stipulated by recent tax legislation. The maximum amount allowable but not less than $17,683,192 of the Fund’s fiscal year taxable income may be eligible for the lower individual income tax rates. In early 2016, shareholders of record received information regarding the percentage of distributions that are eligible for lower individual income tax rates.
Recent tax legislation allows a regulated investment company to designate distributions not designated as capital gain distributions, as either interest related dividends or short-term capital gain dividends, both of which are exempt from the U.S. withholding tax applicable to non U.S. taxpayers. For the reporting period, the maximum amount allowable but not less than $16,836 of the ordinary distributions to be paid by the Fund qualifies as an interest related dividend.
The foregoing information is presented to assist shareholders in reporting distributions received from the Fund to the Internal Revenue Service. Because of the complexity of the federal regulations which may affect your individual tax return and the many variations in state and local tax regulations, we recommend that you consult your tax advisor for specific guidance.
41 OPPENHEIMER MID CAP VALUE FUND
BOARD APPROVAL OF THE FUND’S INVESTMENT ADVISORY
AND SUB-ADVISORY AGREEMENTS Unaudited
The Fund has entered into an investment advisory agreement with OFI Global Asset Management, Inc. (“OFI Global” or the “Adviser”), a wholly-owned subsidiary of OppenheimerFunds, Inc. (“OFI” or the “Sub-Adviser”) (“OFI Global” and “OFI” together the “Managers”) and OFI Global has entered into a sub-advisory agreement with OFI whereby OFI provides investment sub-advisory services to the Fund (collectively, the “Agreements”). Each year, the Board of Trustees (the “Board”), including a majority of the independent Trustees, is required to determine whether to approve the terms of the Agreements and the renewal thereof. The Investment Company Act of 1940, as amended, requires that the Board request and evaluate, and that the Managers provide, such information as may be reasonably necessary to evaluate the terms of the Agreements. The Board employs an independent consultant to prepare a report that provides information, including comparative information that the Board requests for that purpose. In addition to in-person meetings focused on this evaluation, the Board receives information throughout the year regarding Fund services, fees, expenses and performance.
The Managers and the independent consultant provided information to the Board on the following factors: (i) the nature, quality and extent of the Managers’ services, (ii) the comparative investment performance of the Fund and the Managers, (iii) the fees and expenses of the Fund, including comparative fee and expense information, (iv) the profitability of the Managers and their affiliates, including an analysis of the cost of providing services, (v) whether economies of scale are realized as the Fund grows and whether fee levels reflect these economies of scale for Fund investors and (vi) other benefits to the Managers from their relationship with the Fund. The Board was aware that there are alternatives to retaining the Managers.
Outlined below is a summary of the principal information considered by the Board as well as the Board’s conclusions.
Nature, Quality and Extent of Services. The Board considered information about the nature, quality and extent of the services provided to the Fund and information regarding the Managers’ key personnel who provide such services. The Managers’ duties include providing the Fund with the services of the portfolio managers and the Sub-Adviser’s investment team, who provide research, analysis and other advisory services in regard to the Fund’s investments; and securities trading services. OFI Global is responsible for oversight of third-party service providers; monitoring compliance with applicable Fund policies and procedures and adherence to the Fund’s investment restrictions; risk management; and oversight of the Sub-Adviser. OFI Global is also responsible for providing certain administrative services to the Fund. Those services include providing and supervising all administrative and clerical personnel who are necessary in order to provide effective corporate administration for the Fund; compiling and maintaining records with respect to the Fund’s operations; preparing and filing reports required by the U.S. Securities and Exchange Commission; preparing periodic reports regarding the operations of the Fund for its shareholders; preparing proxy materials for shareholder meetings; and preparing the registration statements required by federal and state securities laws for the sale of the Fund’s shares. OFI Global also provides the Fund with office space, facilities and equipment.
42 OPPENHEIMER MID CAP VALUE FUND
The Board also considered the quality of the services provided and the quality of the Managers’ resources that are available to the Fund. The Board took account of the fact that the Sub-Adviser has over fifty years of experience as an investment adviser and that its assets under management rank it among the top mutual fund managers in the United States. The Board evaluated the Managers’ advisory, administrative, accounting, legal, compliance and risk management services, and information the Board has received regarding the experience and professional qualifications of the Managers’ key personnel and the size and functions of its staff. In its evaluation of the quality of the portfolio management services provided, the Board considered the experience of Laton Spahr and Eric Hewitt, the portfolio managers for the Fund, and the Sub-Adviser’s investment team and analysts. The Board members also considered the totality of their experiences with the Managers as directors or trustees of the Fund and other funds advised by the Managers. The Board considered information regarding the quality of services provided by affiliates of the Managers, which the Board members have become knowledgeable about through their experiences with the Managers and in connection with the renewal of the Fund’s service agreements. The Board concluded, in light of the Managers’ experience, reputation, personnel, operations and resources that the Fund benefits from the services provided under the Agreements.
Investment Performance of the Managers and the Fund. Throughout the year, the Managers provided information on the investment performance of the Fund, the Adviser and the Sub-Adviser, including comparative performance information. The Board also reviewed information, prepared by the Managers and by the independent consultant, comparing the Fund’s historical performance to relevant benchmarks or market indices and to the performance of other retail funds in the mid-cap value category. The Board noted that the Fund’s three-year performance was better than its category median although its one-year, five-year and ten-year performance was below its category median.
Fees and Expenses of the Fund. The Board reviewed the fees paid to the Adviser and the other expenses borne by the Fund. The independent consultant provided comparative data in regard to the fees and expenses of the Fund and other retail front-end load mid-cap value funds with comparable asset levels and distribution features. The Board noted that the Fund’s contractual management fee was higher than its peer group median and lower than its category median. The Board also noted that the Fund’s total expenses were lower than its peer group median and category median.
Economies of Scale and Profits Realized by the Managers. The Board considered information regarding the Managers’ costs in serving as the Fund’s investment adviser and sub-adviser, including the costs associated with the personnel and systems necessary to manage the Fund, and information regarding the Managers’ profitability from their relationship with the Fund. The Board also considered that the Managers must be able to pay and retain experienced professional personnel at competitive rates to provide quality services to the Fund. The Board reviewed whether the Managers may realize economies of scale in managing and supporting the Fund. The Board noted that the Fund currently has management fee breakpoints, which are intended to share with Fund shareholders economies of scale that may exist as the Fund’s assets grow.
43 OPPENHEIMER MID CAP VALUE FUND
BOARD APPROVAL OF THE FUND’S INVESTMENT ADVISORY
AND SUB-ADVISORY AGREEMENTS Unaudited / Continued
Other Benefits to the Managers. In addition to considering the profits realized by the Managers, the Board considered information that was provided regarding the direct and indirect benefits the Managers receive as a result of their relationship with the Fund, including compensation paid to the Managers’ affiliates and research provided to the Adviser in connection with permissible brokerage arrangements (soft dollar arrangements).
Conclusions. These factors were also considered by the independent Trustees meeting separately from the full Board, assisted by experienced counsel to the Fund and to the independent Trustees. Fund counsel and the independent Trustees’ counsel are independent of the Managers within the meaning and intent of the Securities and Exchange Commission Rules.
Based on its review of the information it received and its evaluations described above, the Board, including a majority of the independent Trustees, decided to continue the Agreements through September 30, 2017. In arriving at its decision, the Board did not identify any factor or factors as being more important than others, but considered all of the above information, and considered the terms and conditions of the Agreements, including the management fees, in light of all the surrounding circumstances.
44 OPPENHEIMER MID CAP VALUE FUND
PORTFOLIO PROXY VOTING POLICIES AND GUIDELINES;
UPDATES TO STATEMENTS OF INVESTMENTS Unaudited
The Fund has adopted Portfolio Proxy Voting Policies and Guidelines under which the Fund votes proxies relating to securities (“portfolio proxies”) held by the Fund. A description of the Fund’s Portfolio Proxy Voting Policies and Guidelines is available (i) without charge, upon request, by calling the Fund toll-free at 1.800.CALL OPP (225.5677), (ii) on the Fund’s website at www.oppenheimerfunds.com, and (iii) on the SEC’s website at www.sec.gov. In addition, the Fund is required to file Form N-PX, with its complete proxy voting record for the 12 months ended June 30th, no later than August 31st of each year. The Fund’s voting record is available (i) without charge, upon request, by calling the Fund toll-free at 1.800.CALL OPP (225.5677), and (ii) in the Form N-PX filing on the SEC’s website at www.sec.gov.
The Fund files its complete schedule of portfolio holdings with the SEC for the first quarter and the third quarter of each fiscal year on Form N-Q. The Fund’s Form N-Q filings are available on the SEC’s website at www.sec.gov. Those forms may be reviewed and copied at the SEC’s Public Reference Room in Washington, D.C. Information on the operation of the Public Reference Room may be obtained by calling 1-800-SEC-0330.
Householding—Delivery of Shareholder Documents
This is to inform you about OppenheimerFunds’ “householding” policy. If more than one member of your household maintains an account in a particular fund, OppenheimerFunds will mail only one copy of the fund’s prospectus (or, if available, the fund’s summary prospectus), annual and semiannual report and privacy policy. The consolidation of these mailings, called householding, benefits your fund through reduced mailing expense, and benefits you by reducing the volume of mail you receive from OppenheimerFunds. Householding does not affect the delivery of your account statements.
Please note that we will continue to household these mailings for as long as you remain an OppenheimerFunds shareholder, unless you request otherwise. If you prefer to receive multiple copies of these materials, please call us at 1.800.CALL-OPP (225-5677). You may also notify us in writing or via email. We will begin sending you individual copies of the prospectus (or, if available, the summary prospectus), reports and privacy policy within 30 days of receiving your request to stop householding.
45 OPPENHEIMER MID CAP VALUE FUND
DISTRIBUTION SOURCES Unaudited
For any distribution that took place over the last six months of the Fund’s reporting period, the table below details on a per-share basis the percentage of the Fund’s total distribution payment amount that was derived from the following sources: net income, net profit from the sale of securities, and other capital sources. This information is based upon income and capital gains using generally accepted accounting principles as of the date of each distribution. For certain securities, such as Master Limited Partnerships (“MLPs”) and Real Estate Investment Trusts (“REITs”), the percentages attributed to each category (net income, net profit from sale and other capital sources) are estimated using historical information because the character of the amounts received from the MLPs and REITs in which the fund invests is unknown until after the end of the calendar year. Because the Fund is actively managed, the relative amount of the Fund’s total distributions derived from various sources over the calendar year may change. Please note that this information should not be used for tax reporting purposes as the tax character of distributable income may differ from the amounts used for this notification. You will receive IRS tax forms in the first quarter of each calendar year detailing the actual amount of the taxable and non-taxable portion of distributions paid to you during the tax year.
For the most current information, please go to oppenheimerfunds.com. Select your Fund, then the ’Detailed’ tab; where ‘Dividends’ are shown, the Fund’s latest pay date will be followed by the sources of any distribution, updated daily.
| | | | | | | | | | | | | | | | |
| Fund Name | | Pay
Date | | | Net Income | | | Net Profit
from Sale | | | Other
Capital
Sources | |
| |
Oppenheimer Mid Cap Value Fund | | | 6/21/16 | | | | 63.6% | | | | 0.0% | | | | 36.4% | |
| |
Oppenheimer Mid Cap Value Fund | | | 9/20/16 | | | | 63.6% | | | | 0.0% | | | | 36.4% | |
| |
46 OPPENHEIMER MID CAP VALUE FUND
TRUSTEES AND OFFICERS Unaudited
| | |
Name, Position(s) Held with the
Fund, Length of Service, Year of
Birth | | Principal Occupation(s) During the Past 5 Years; Other Trusteeships/ Directorships Held; Number of Portfolios in the Fund Complex Currently Overseen |
| |
| INDEPENDENT TRUSTEES | | The address of each Trustee in the chart below is 6803 S. Tucson Way, Centennial, Colorado 80112-3924. Each Trustee serves for an indefinite term, or until his or her resignation, retirement, death or removal. |
| |
Brian F. Wruble, Chairman of the Board of Trustees (since 2009), Trustee (since 2001) Year of Birth: 1943 | | Governor and Vice Chairman of Community Foundation of the Florida Keys (non-profit) (since July 2012); Director of TCP Capital, Inc. (since November 2015); Chairman Emeritus and Trustee (since August 2011) of The Jackson Laboratory (non-profit); Member of Zurich Insurance Group’s Investment Management Advisory Council (insurance) (since 2004); Treasurer (since 2007) and Trustee of the Institute for Advanced Study (non-profit educational institute) (since May 1992); Director of Special Value Opportunities Fund, LLC (registered investment company) (affiliate of the Sub-Adviser’s parent company) (September 2004- June 2015); General Partner of Odyssey Partners, L.P. (hedge fund) (September 1995-December 2007); Special Limited Partner of Odyssey Investment Partners, LLC (private equity investment) (January 1999-September 2004). Mr. Wruble has served on the Boards of certain Oppenheimer funds since April 2001, during which time he has become familiar with the Fund’s (and other Oppenheimer funds’) financial, accounting, regulatory and investment matters and has contributed to the Boards’ deliberations. Oversees 55 portfolios in the OppenheimerFunds complex. Mr. Wruble has served on the Boards of certain Oppenheimer funds since April 2001, during which time he has become familiar with the Fund’s (and other Oppenheimer funds’) financial, accounting, regulatory and investment matters and has contributed to the Boards’ deliberations. |
| |
Beth Ann Brown, Trustee (since 2016) Year of Birth: 1968 | | Advisor, Board of Advisors of Caron Engineering Inc. (since December 2014); Independent Consultant (since September 2012); held the following positions at Columbia Management Investment Advisers LLC: Head of Intermediary Distribution (2008-2012), Managing Director, Strategic Relations (2005-2008), Managing Director, Head of National Accounts (2004-2005); Senior Vice President, National Account Manager (2002-2004), Senior Vice President, Key Account Manager (1999-2002) and Vice President, Key Account Manager (1996-1999) of Liberty Funds Distributor, Inc.; President and Director, of Acton Shapleigh Youth Conservation Corps (non-profit) (since 2012); and Vice President and Director of Grahamtastic Connection (non-profit) (since May 2013). Oversees 55 portfolios in the OppenheimerFunds complex. Ms. Brown has served on the Boards of certain Oppenheimer funds since January 2016, during which time she has become familiar with the Fund’s (and other Oppenheimer funds’) financial, accounting, regulatory and investment matters and has contributed to the Boards’ deliberations. |
| |
Matthew P. Fink, Trustee (since 2009) Year of Birth: 1941 | | Trustee of the Committee for Economic Development (policy research foundation) (2005-2011); Director of ICI Education Foundation (education foundation) (October 1991-August 2006); President of the Investment Company Institute (trade association) (October 1991-June 2004); Director of ICI Mutual Insurance Company (insurance company) (October 1991-June 2004); Author of The Rise of Mutual Funds: An Insider’s View published by Oxford University Press (second edition 2011). Oversees 55 portfolios in the OppenheimerFunds complex. Mr. Fink has served on the Boards of certain Oppenheimer funds since January 2005, during which time he has become familiar with the Fund’s (and other Oppenheimer funds’) financial, accounting, regulatory and investment matters and has contributed to the Boards’ deliberations. |
47 OPPENHEIMER MID CAP VALUE FUND
TRUSTEES AND OFFICERS Unaudited / Continued
| | |
| |
Edmund P. Giambastiani, Jr., Trustee (since 2013) Year of Birth: 1948 | | Advisory Board Member of the Maxwell School of Citizenship and Public Affairs of Syracuse University (since April 2012); Director of Mercury Defense Systems Inc. (information technology) (August 2011-February 2013); Trustee of the U.S. Naval Academy Foundation (since November 2010); Advisory Board Member of the Massachusetts Institute of Technology Lincoln Laboratory (federally-funded research development center) (since May 2010); Director of The Boeing Company (aerospace and defense) (since October 2009); Trustee of MITRE Corporation (federally-funded research development center) (since September 2008); Independent Director of QinetiQ Group Plc (defense technology and security) (February 2008-August 2011); Chairman of Monster Worldwide, Inc. (on-line career services) (since March 2015), Lead Director (June 2011-March 2015); Chairman of Alenia North America, Inc. (military and defense products) (January 2008-October 2009); Director of SRA International, Inc. (information technology and services) (January 2008-July 2011); President of Giambastiani Group LLC (national security and energy consulting) (since October 2007); United States Navy, career nuclear submarine officer (June 1970-October 2007), Vice Chairman of the Joint Chiefs of Staff (2005-October 2007), Supreme Allied Commander of NATO Commander Transformation (2003-2005), Commander, U.S. Joint Forces Command (2002-2005). Since his retirement from the U.S. Navy in October 2007, Admiral Giambastiani has also served on numerous U.S. Government advisory boards, investigations and task forces for the Secretaries of Defense, State and Interior and the Central Intelligence Agency. He currently serves as a federal commissioner on the Military Compensation and Retirement Modernization Commission. Oversees 55 portfolios in the OppenheimerFunds complex. Admiral Giambastiani has served on the Boards of certain Oppenheimer funds since February 2013, including as an Advisory Board Member for certain Oppenheimer funds, during which time he has become familiar with the Fund’s (and other Oppenheimer funds’) financial, accounting, regulatory and investment matters and has contributed to the Boards’ deliberations. For purposes of this report, Admiral Giambastiani is identified as a Trustee. |
| |
Elizabeth Krentzman, Trustee (since 2014) Year of Birth: 1959 | | Advisory Board Member of University of Florida Advisory Board, Washington, DC Alumni Group (since 2015); Advisory Board Member of the Securities and Exchange Commission Historical Society (since 2007); held the following positions at Deloitte & Touche LLP: Principal and Chief Regulatory Advisor for Asset Management Services (2007 - 2014) and U.S. Mutual Fund Leader (2011 - 2014); General Counsel of the Investment Company Institute (trade association) (June 2004 - April 2007); held the following positions at Deloitte & Touche LLP: National Director of the Investment Management Regulatory Consulting Practice (1997 - 2004), Principal (2003 - 2004), Director (1998 - 2003) and Senior Manager (1997 - 1998); Assistant Director of the Division of Investment Management - Office of Disclosure and Investment Adviser Regulation (1996 - 1997) and various positions with the Division of Investment Management – Office of Regulatory Policy (1991 - 1996) of the U.S. Securities and Exchange Commission; Associate at Ropes & Gray (1987 - 1991. Ms. Krentzman has served on the Boards of certain Oppenheimer funds since August 2014, during which time she has become familiar with the Fund’s (and other Oppenheimer funds’) financial, accounting, regulatory and investment matters and has contributed to the Boards’ deliberations. Oversees 55 portfolios in the OppenheimerFunds complex. Ms. Krentzman has served on the Boards of certain Oppenheimer funds since August 2014, during which time she has become familiar with the Fund’s (and other Oppenheimer funds’) financial, accounting, regulatory and investment matters and has contributed to the Boards’ deliberations. |
48 OPPENHEIMER MID CAP VALUE FUND
| | |
Mary F. Miller, Trustee (since 2009) Year of Birth: 1942 | | Trustee of International House (not-for-profit) (since June 2007); Trustee of the American Symphony Orchestra
(not-for-profit) (October 1998-November 2011); and Senior Vice President and General Auditor of American
Express Company (financial services company) (July 1998-February 2003). Oversees 55 portfolios in the
OppenheimerFunds complex. Ms. Miller has served on the Boards of certain Oppenheimer funds since August
2004, during which time she has become familiar with the Fund’s (and other Oppenheimer funds’) financial,
accounting, regulatory and investment matters and has contributed to the Boards’ deliberations. |
| |
Joel W. Motley, Trustee (since 2009) Year of Birth: 1952 | | Director of Greenwall Foundation (since October 2013); Member of Board and Investment Committee of The Greenwall Foundation (since April 2013); Member of the Vestry of Trinity Wall Street (since April 2012); Director of Southern Africa Legal Services Foundation (since March 2012); Board Member of Pulitzer Center for Crisis Reporting (non-profit journalism) (since March 2011); Managing Director of Public Capital Advisors, LLC (privately-held financial advisor) (since January 2006); Managing Director of Carmona Motley, Inc. (privately-held financial advisor) (since January 2002); Director of Columbia Equity Financial Corp. (privately-held financial advisor) (2002-2007); Managing Director of Carmona Motley Hoffman Inc. (privately-held financial advisor) (January 1998-December 2001); Member of the Finance and Budget Committee of the Council on Foreign Relations, Member of the Investment Committee and Board of Human Rights Watch (since July 2000) and Member of the Investment Committee and Board of Historic Hudson Valley (since February 2010). Oversees 55 portfolios in the OppenheimerFunds complex. Mr. Motley has served on the Boards of certain Oppenheimer funds since October 2002, during which time he has become familiar with the Fund’s (and other Oppenheimer funds’) financial, accounting, regulatory and investment matters and has contributed to the Boards’ deliberations. |
| |
Joanne Pace, Trustee (since 2012) Year of Birth: 1958 | | Advisory Board Director of Massey Quick and Company, LLC (since October 2014); Board Director of Horizon Blue Cross Blue Shield of New Jersey (since November 2012); Advisory Board Director of The Alberleen Group LLC (since March, 2012); Board Member (since January 2015), Advisory Council Member (December 2012-December 2014) of 100 Women in Hedge Funds (non-profit) (since December, 2012); Advisory Council Member of Morgan Stanley Children’s Hospital (non-profit) (since May, 2012); Board Director of The Komera Project (non-profit) (since April, 2012); New York Advisory Board Director of Peace First (non-profit) (2010-2015); Senior Advisor of SECOR Asset Management, LP (2010-2011); Managing Director and Chief Operating Officer of Morgan Stanley Investment Management (2006-2010); Partner and Chief Operating Officer of FrontPoint Partners, LLC (hedge fund) (2005-2006); held the following positions at Credit Suisse: Managing Director (2003-2005); Global Head of Human Resources and member of Executive Board and Operating Committee (2004-2005), Global Head of Operations and Product Control (2003-2004); held the following positions at Morgan Stanley: Managing Director (1997-2003), Controller and Principal Accounting Officer (1999-2003); Chief Financial Officer (temporary assignment) for the Oversight Committee, Long Term Capital Management (1998-1999). Lead Independent Director and Chair of the Audit and Nominating Committee of The Global Chartist Fund, LLC of Oppenheimer Asset Management (2011-2012); Board Director of Managed Funds Association (2008-2010); Board Director of Morgan |
49 OPPENHEIMER MID CAP VALUE FUND
TRUSTEES AND OFFICERS Unaudited / Continued
| | |
Joanne Pace, Continued | | Stanley Foundation (2007-2010) and Investment Committee Chair (2008-2010). Oversees 55 portfolios in the
OppenheimerFunds complex. Ms. Pace has served on the Boards of certain Oppenheimer funds since
November 2012, including as an Advisory Board Member for certain Oppenheimer funds, during which time she
has become familiar with the Fund’s (and other Oppenheimer funds’) financial, accounting, regulatory and
investment matters and has contributed to the Board’s deliberations. For purposes of this report, Ms. Pace is
identified as a Trustee. |
| |
Daniel Vandivort, Trustee (since 2015) Year of Birth: 1954 | | Chairman and Lead Independent Director/Trustee (March 2010-September 2014), Chairman of the Audit Committee (March 2009-September 2014) and Director/ Trustee (December 2008-September 2014) of the Board of Directors/Trustees of Value Line Funds; Trustee, Board of Trustees of Huntington Disease Foundation of America (since January 2015 and June 2007-December 2013): Trustee, Board of Trustees, RIM Retirement Savings Plan (2005-2007); President and Chief Investment Officer, Robeco Investment Management, formerly known as Weiss Peck and Greer (January 2005-June 2007); Member, Management Committee of Robeco Investment Management (2001-2007); Chairman and Trustee of the Board of Trustees of Weiss, Peck and Greer Funds (2004-2005); Managing Director and Head of Fixed Income, Weiss, Peck and Greer (November 1994-January 2005); Managing Director and Head of Fixed Income, CS First Boston Investment Management (January 1992-November 1994); Director, Global Product Development, First Boston Asset Management (November 1989 to January 1992); Vice President, Fixed Income Sales, First Boston Corp. (May 1984-November 1989). Oversees 55 portfolios in the OppenheimerFunds complex. Mr. Vandivort has served on the Boards of certain Oppenheimer funds since 2014, during which time he has become familiar with the Fund’s (and other Oppenheimer funds’) financial, accounting, regulatory and investment matters and has contributed to the Boards’ deliberations. |
|
| INTERESTED TRUSTEE AND OFFICER | | Mr. Steinmetz is an “Interested Trustee” because he is affiliated with the Manager and the Sub-Adviser by virtue of his positions as Chairman of the Sub-Adviser and officer and director of the Manager. Both as a Trustee and as an officer, Mr. Steinmetz serves for an indefinite term, or until his resignation, retirement, death or removal. Mr. Steinmetz’s address is 225 Liberty Street, New York, New York 10281-1008. |
| |
Arthur P. Steinmetz, Trustee (since 2015), President and Principal Executive Officer (since 2014) Year of Birth: 1958 | | Chairman of the Sub-Adviser (since January 2015); CEO and Chairman of the Manager (since July 2014), President of the Manager (since May 2013), a Director of the Manager (since January 2013), Director of the Sub-Adviser (since July 2014), President, Management Director and CEO of Oppenheimer Acquisition Corp. (the Sub-Adviser’s parent holding company) (since July 2014), and President and Director of OFI SteelPath, Inc. (since January 2013). Chief Investment Officer of the OppenheimerFunds advisory entities from (January 2013-December 2013); Executive Vice President of the Manager (January 2013-May 2013); Chief Investment Officer of the Sub-Adviser (October 2010-December 2012); Chief Investment Officer, Fixed-Income, of the Sub-Adviser (April 2009-October 2010); Executive Vice President of the Sub-Adviser (October 2009-December 2012); Director of Fixed Income of the Sub-Adviser (January 2009-April 2009); and a Senior Vice President of the Sub-Adviser (March 1993-September 2009). An officer of 100 portfolios in the OppenheimerFunds complex. |
|
| OTHER OFFICERS OF THE FUND | | The addresses of the Officers in the chart below are as follows: for Mss. Lo Bessette, Foxson and Picciotto, 225 Liberty Street, New York, New York 10281-1008, for Messrs. Spahr, Hewitt and Petersen, 6803 S. Tucson Way, Centennial, Colorado 80112-3924. Each Officer serves for an indefinite term or until his or her resignation, retirement, death or removal. |
50 OPPENHEIMER MID CAP VALUE FUND
| | |
Laton Spahr, Vice President (since 2013) Year of Birth: 1975 | | Senior Vice President of the Sub-Adviser since March 2013. Senior portfolio manager (2003-2013) and equity
analyst (2001-2002) for Columbia Management Investment Advisers, LLC. A portfolio manager and an officer of
other portfolios in the OppenheimerFunds complex. |
| |
Eric Hewitt, Vice President (since 2013) Year of Birth: 1971 | | Vice President of the Sub-Adviser (since March 2013). Customer portfolio manager and product manager for Columbia Management Investment Advisors, LLC (2012-2013). Senior Equity Analyst with Diamondback/Harbor Watch Capital Management, LLC (2009–2012) and a Senior Equity Analyst and Portfolio Manager with AllianceBernstein LP (1999–2009). A portfolio manager and an officer in the OppenheimerFunds complex. |
| |
Cynthia Lo Bessette, Secretary and Chief Legal Officer (since 2016) Year of Birth: 1969 | | Executive Vice President, General Counsel and Secretary of the Manager (since February 2016); Chief Legal Officer of the Sub-Adviser and the Distributor (since February 2016); Vice President, General Counsel and Secretary of Oppenheimer Acquisition Corp. (since February 2016); General Counsel of OFI SteelPath, Inc., VTL Associates, LLC and Index Management Solutions, LLC (since February 2016); Chief Legal Officer of OFI Global Institutional, Inc., HarbourView Asset Management Corporation, OFI Global Trust Company, Oppenheimer Real Asset Management, Inc., OFI Private Investments Inc., Shareholder Services, Inc. and Trinity Investment Management Corporation (since February 2016); Senior Vice President and Deputy General Counsel (March 2015-February 2016); Vice President, Corporate Counsel (February 2012-March 2015) and Deputy Chief Legal Officer (April 2013-March 2015) of Jennison Associates LLC; Assistant General Counsel (April 2008-September 2009) and Deputy General Counsel (October 2009-February 2012) of Lord Abbett & Co. LLC. An officer of 100 portfolios in the OppenheimerFunds complex. |
| |
Jennifer Foxson, Vice President and Chief Business Officer (since 2014) Year of Birth: 1969 | | Senior Vice President of OppenheimerFunds Distributor, Inc. (since June 2014); Vice President of OppenheimerFunds Distributor, Inc. (April 2006-June 2014); Vice President of the Sub-Adviser (January 1998-March 2006); Assistant Vice President of the Sub-Adviser (October 1991-December 1998). An officer of 100 portfolios in the OppenheimerFunds complex. |
| |
Mary Ann Picciotto, Chief Compliance Officer and Chief Anti-Money Laundering Officer (since 2014) Year of Birth: 1973 | | Senior Vice President and Chief Compliance Officer of the Manager (since March 2014); Chief Compliance Officer of the Sub-Adviser, OFI SteelPath, Inc., OFI Global Trust Company, OFI Global Institutional, Inc., Oppenheimer Real Asset Management, Inc., OFI Private Investments, Inc., Harborview Asset Management Corporation, Trinity Investment Management Corporation, and Shareholder Services, Inc. (since March 2014); Managing Director of Morgan Stanley Investment Management Inc. and certain of its various affiliated entities; Chief Compliance Officer of various Morgan Stanley Funds (May 2010-January 2014); Chief Compliance Officer of Morgan Stanley Investment Management Inc. (April 2007-January 2014). An officer of 100 portfolios in the OppenheimerFunds complex. |
| |
Brian S. Petersen, Treasurer and Principal Financial & Accounting Officer (since 2016) Year of Birth: 1970 | | Vice President of the Manager (since January 2013); Vice President of the Sub-Adviser (February 2007-December 2012); Assistant Vice President of the Sub- Adviser (August 2002-2007). An officer of 100 portfolios in the OppenheimerFunds complex. |
The Fund’s Statement of Additional Information contains additional information about the Fund’s Trustees and Officers and is available without charge upon request by calling 1.800.CALL OPP (225.5677).
51 OPPENHEIMER MID CAP VALUE FUND
OPPENHEIMER MID CAP VALUE FUND
| | |
| Manager | | OFI Global Asset Management, Inc. |
| |
| Sub-Adviser | | OppenheimerFunds, Inc. |
| |
| Distributor | | OppenheimerFunds Distributor, Inc. |
| |
| Transfer and Shareholder Servicing Agent | | OFI Global Asset Management, Inc. |
| |
| Sub-Transfer Agent | | Shareholder Services, Inc. DBA OppenheimerFunds Services |
| |
| Independent Registered Public Accounting Firm | | KPMG LLP |
| |
| Legal Counsel | | Kramer Levin Naftalis & Frankel LLP |
© 2016 OppenheimerFunds, Inc. All Rights reserved.
52 OPPENHEIMER MID CAP VALUE FUND
PRIVACY POLICY NOTICE
As an Oppenheimer fund shareholder, you are entitled to know how we protect your personal information and how we limit its disclosure.
Information Sources
We obtain nonpublic personal information about our shareholders from the following sources:
● Applications or other forms
● When you create a user ID and password for online account access
● When you enroll in eDocs Direct, our electronic document delivery service
● Your transactions with us, our affiliates or others
● Technologies on our website, including: “cookies” and web beacons, which are used to collect data on the pages you visit and the features you use.
If you visit oppenheimerfunds.com and do not log on to the secure account information areas, we do not obtain any personal information about you. When you do log on to a secure area, we do obtain your user ID and password to identify you. We also use this information to provide you with products and services you have requested, to inform you about products and services that you may be interested in and assist you in other ways.
We do not collect personal information through our website unless you willingly provide it to us, either directly by email or in those areas of the website that request information. In order to update your personal information (including your mailing address, email address and phone number) you must first log on and visit your user profile.
If you have set your browser to warn you before accepting cookies, you will receive the warning message with each cookie. You can refuse cookies by turning them off in your browser. However, doing so may limit your access to certain sections of our website.
We use cookies to help us improve and manage our website. For example, cookies help us recognize new versus repeat visitors to the site, track the pages visited, and enable some special features on the website. This data helps us provide a better service for our website visitors.
Protection of Information
We do not disclose any non-public personal information (such as names on a customer list) about current or former customers to anyone, except as permitted by law.
Disclosure of Information
Copies of confirmations, account statements and other documents reporting activity in your fund accounts are made available to your financial advisor (as designated by you). We may also use details about you and your investments to help us, our financial service affiliates, or firms that jointly market their financial products and services with ours, to better serve your investment needs or suggest educational material that may be of interest to you. If this requires us to provide you with an opportunity to “opt in” or “opt out” of such information sharing with a firm not affiliated with us, you will receive notification on how to do so, before any such sharing takes place.
Right of Refusal
We will not disclose your personal information to unaffiliated third parties (except as permitted by law), unless we first offer you a reasonable opportunity to refuse or “opt out” of such disclosure.
53 OPPENHEIMER MID CAP VALUE FUND
PRIVACY POLICY NOTICE Continued
Internet Security and Encryption
In general, the email services provided by our website are encrypted and provide a secure and private means of communication with us. To protect your own privacy, confidential and/or personal information should only be communicated via email when you are advised that you are using a secure website. As a security measure, we do not include personal or account information in non-secure emails, and we advise you not to send such information to us in non-secure emails. Instead, you may take advantage of the secure features of our website to encrypt your email correspondence. To do this, you will need to use a browser that supports Secure Sockets Layer (SSL) protocol.
● All transactions, including redemptions, exchanges and purchases, are secured by SSL and 256-bit encryption. SSL is used to establish a secure connection between your PC and OppenheimerFunds’ server. It transmits information in an encrypted and scrambled format.
● Encryption is achieved through an electronic scrambling technology that uses a “key” to code and then decode the data. Encryption acts like the cable converter box you may have on your television set. It scrambles data with a secret code so that no one can make sense of it while it is being transmitted. When the data reaches its destination, the same software unscrambles the data.
● You can exit the secure area by either closing your browser, or for added security, you can use the Log Out button before you close your browser.
Other Security Measures
We maintain physical, electronic and procedural safeguards to protect your personal account information. Our employees and agents have access to that information only so that they may offer you products or provide services, for example, when responding to your account questions.
How You Can Help
You can also do your part to keep your account information private and to prevent unauthorized transactions. If you obtain a user ID and password for your account, safeguard that information. Also, take special precautions when accessing your account on a computer used by others.
Who We Are
This joint notice describes the privacy policies of the Oppenheimer funds, OppenheimerFunds, Inc., each of its investment adviser subsidiaries, OppenheimerFunds Distributor, Inc. and OFI Global Trust Co. It applies to all Oppenheimer fund accounts you presently have, or may open in the future, using your Social Security number—whether or not you remain a shareholder of our funds. This notice was last updated November 2016. In the event it is updated or changed, we will post an updated notice on our website at oppenheimerfunds.com. If you have any questions about this privacy policy, write to us at P.O. Box 5270, Denver, CO 80217-5270, email us by clicking on the Contact Us section of our website at oppenheimerfunds.com or call us at 1.800.CALL OPP (225.5677).
54 OPPENHEIMER MID CAP VALUE FUND
THIS PAGE INTENTIONALLY LEFT BLANK.
55 OPPENHEIMER MID CAP VALUE FUND
| | | | |
| |  | | |
| | |
| | Visit us at oppenheimerfunds.com for 24-hr access to account information and transactions or call us at 800.CALL OPP (800.225.5677) for 24-hr automated information and automated transactions. Representatives also available Mon–Fri 8am-8pm ET. | | |
| | |
| | | | |
| | |
| | | | |
Visit Us oppenheimerfunds.com | | | | |
| | |
Call Us 800 225 5677 | | | | |
Follow Us | | | | |

| | Oppenheimer funds are distributed by OppenheimerFunds Distributor, Inc. 225 Liberty Street, New York, NY 10281-1008 © 2016 OppenheimerFunds Distributor, Inc. All rights reserved. | | |
| | | |
| | RA0251.001.1016 December 22, 2016 | | |
Item 2. Code of Ethics.
The registrant has adopted a code of ethics that applies to the registrant’s principal executive officer, principal financial officer, principal accounting officer or controller or persons performing similar functions.
Item 3. Audit Committee Financial Expert.
The Board of Trustees of the registrant has determined that Joanne Pace, the Board’s Audit Committee Chairwoman, is an audit committee financial expert and that Ms. Pace is “independent” for purposes of this Item 3.
Item 4. Principal Accountant Fees and Services.
The principal accountant for the audit of the registrant’s annual financial statements billed $152,800 in fiscal 2016 and $122,100 in fiscal 2015.
The principal accountant for the audit of the registrant’s annual financial statements billed $21,147 in fiscal 2016 and no such fees in fiscal 2015.
The principal accountant for the audit of the registrant’s annual financial statements billed $598,285 in fiscal 2016 and $185,479 in fiscal 2015 to the registrant’s investment adviser or any entity controlling, controlled by, or under common control with the adviser that provides ongoing services to the registrant.
Such services include: GIPS attestation procedures, system conversion testing, internal controls, custody audits and additional audit services
The principal accountant for the audit of the registrant’s annual financial statements billed $29,440 in fiscal 2016 and $67,856 in fiscal 2015.
The principal accountant for the audit of the registrant’s annual financial statements billed $690,716 in fiscal 2016 and $476,233 in fiscal 2015 to the registrant’s investment adviser or any entity controlling, controlled by, or under common control with the adviser that provides ongoing services to the registrant.
Such services include: tax compliance, tax planning and tax advice. Tax compliance generally involves preparation of original and amended tax returns, claims for a refund and tax payment-planning services. Tax planning and tax advice includes assistance with tax audits and appeals, tax advice related to mergers and acquisitions and requests for rulings or technical advice from taxing authorities.
The principal accountant for the audit of the registrant’s annual financial statements billed no such fees in fiscal 2016 and no such fees in fiscal 2015.
The principal accountant for the audit of the registrant’s annual financial statements billed no such fees in fiscal 2016 and no such fees in fiscal 2015 to the registrant’s investment adviser or any entity controlling, controlled by, or under common control with the adviser that provides ongoing services to the registrant.
Such fees would include the cost to the principal accountant of attending audit committee meetings and consultations regarding the registrant’s retirement plan with respect to its Trustees.
| (e) | (1) During its regularly scheduled periodic meetings, the registrant’s audit committee will pre-approve all audit, audit-related, tax and other services to be provided by the principal accountants of the registrant. |
| | The audit committee has delegated pre-approval authority to its Chairwoman for any subsequent new engagements that arise between regularly scheduled meeting dates provided that any fees such pre-approved are presented to the audit committee at its next regularly scheduled meeting. |
| | Under applicable laws, pre-approval of non-audit services may be waived provided that: 1) the aggregate amount of all such services provided constitutes no more than five percent of the total amount of fees paid by the registrant to its principal accountant during the fiscal year in which services are provided 2) such services were not recognized by the registrant at the time of engagement as non-audit services and 3) such services are promptly brought to the attention of the audit committee of the registrant and approved prior to the completion of the audit. |
| (f) | Not applicable as less than 50%. |
| (g) | The principal accountant for the audit of the registrant’s annual financial statements billed $1,339,588 in fiscal 2016 and $729,568 in fiscal 2015 to the registrant and the registrant’s investment adviser or any entity controlling, controlled by, or under common control with the adviser that provides ongoing services to the registrant related to non-audit fees. Those billings did not include any prohibited non-audit services as defined by the Securities Exchange Act of 1934. |
| (h) | The registrant’s audit committee of the board of Trustees has considered whether the provision of non-audit services that were rendered to the registrant’s investment adviser, and any entity controlling, controlled by, or under common control with the investment adviser that provides ongoing services to the registrant that were not pre-approved pursuant to paragraph (c)(7)(ii) of Rule 2-01 of Regulation S-X is compatible with maintaining the principal accountant’s independence. No such services were rendered. |
Item 5. Audit Committee of Listed Registrants
Not applicable.
Item 6. Schedule of Investments.
a) Not applicable. The complete schedule of investments is included in Item 1 of this Form N-CSR.
b) Not applicable.
Item 7. Disclosure of Proxy Voting Policies and Procedures for Closed-End Management Investment Companies.
Not applicable.
Item 8. Portfolio Managers of Closed-End Management Investment Companies.
Not applicable.
Item 9. Purchases of Equity Securities by Closed-End Management Investment Company and Affiliated Purchasers.
Not applicable.
Item 10. Submission of Matters to a Vote of Security Holders.
The Fund’s Governance Committee Provisions with Respect to Nominations of Directors/Trustees to the Respective Boards
None
Item 11. Controls and Procedures.
Based on their evaluation of the registrant’s disclosure controls and procedures (as defined in rule 30a-3(c) under the Investment Company Act of 1940 (17 CFR 270.30a-3(c)) as of 10/31/2016, the registrant’s principal executive officer and principal financial officer found the registrant’s disclosure controls and procedures to provide reasonable assurances that information required to be disclosed by the registrant in the reports that it files under the Securities Exchange Act of 1934 (a) is accumulated and communicated to registrant’s management, including its principal executive officer and principal financial officer, to allow timely decisions regarding required disclosure, and (b) is recorded, processed, summarized and reported, within the time periods specified in the rules and forms adopted by the U.S. Securities and Exchange Commission.
There have been no changes in the registrant’s internal controls over financial reporting that occurred during the registrant’s second fiscal quarter of the period covered by this report that
have materially affected, or are reasonably likely to materially affect, the registrant’s internal control over financial reporting.
Item 12. Exhibits.
| (a) | (1) Exhibit attached hereto. |
| | (2) Exhibits attached hereto. |
| (b) | Exhibit attached hereto. |
SIGNATURES
Pursuant to the requirements of the Securities Exchange Act of 1934 and the Investment Company Act of 1940, the registrant has duly caused this report to be signed on its behalf by the undersigned, thereunto duly authorized.
| | |
| Oppenheimer Quest for Value Funds |
| |
| By: | | /s/ Arthur P. Steinmetz |
| | Arthur P. Steinmetz |
| | Principal Executive Officer |
| Date: | | 12/14/2016 |
Pursuant to the requirements of the Securities Exchange Act of 1934 and the Investment Company Act of 1940, this report has been signed below by the following persons on behalf of the registrant and in the capacities and on the dates indicated.
| | |
| By: | | /s/ Arthur P. Steinmetz |
| | Arthur P. Steinmetz |
| | Principal Executive Officer |
| Date: | | 12/14/2016 |
| |
| By: | | /s/ Brian S. Petersen |
| | Brian S. Petersen |
| | Principal Financial Officer |
| Date: | | 12/14/2016 |