UNITED STATES
SECURITIES AND EXCHANGE COMMISSION
Washington, D.C. 20549
Form N-CSR
CERTIFIED SHAREHOLDER REPORT OF REGISTERED
MANAGEMENT INVESTMENT COMPANIES
Investment Company Act File Number 811-5344
William Blair Funds
(Exact name of registrant as specified in charter)
| 150 North Riverside Plaza, Chicago, IL | | 60606 |
| (Address of principal executive offices) | | (Zip Code) |
Stephanie G. Braming, Principal Executive Officer
William Blair Funds
150 North Riverside Plaza, Chicago, IL 60606
(Name and address of agent for service)
Registrant’s telephone number, including area code: 312-236-1600
Date of fiscal year end: December 31
Date of reporting period: June 30, 2019
Form N-CSR is to be used by management investment companies to file reports with the Commission not later than 10 days after the transmission to stockholders of any report that is required to be transmitted to stockholders under Rule 30e-1 under the Investment Company Act of 1940 (17 CFR 270.30e-1). The Commission may use the information provided on Form N-CSR in its regulatory, disclosure review, inspection, and policymaking roles.
A registrant is required to disclose the information specified by Form N-CSR, and the Commission will make this information public. A Registrant is not required to respond to the collection of information contained in Form N-CSR unless the form displays a currently valid Office of Management and Budget (“OMB”) control number. Please direct comments concerning the accuracy of the information collection burden estimates and any suggestions for reducing the burden to Secretary, Securities and Exchange Commission, 100 F Street, NE, Washington, DC 20549. The OMB has reviewed this collection of information under the clearance requirements of 44 U.S.C. (ss) 3507.
Item 1. June 30, 2019 Semiannual Reports transmitted to shareholders.
 | |
| | |
| | |
| | |
| | |
| | June 30, 2019 |
William Blair Funds Semiannual Report | |
| | IMPORTANT NOTE: Beginning on January 1, 2021, as permitted by regulations adopted by the Securities and Exchange Commission, paper copies of the William Blair Funds’ (the “Funds”) annual and semi-annual shareholder reports will no longer be sent by mail, unless you specifically request paper copies of the shareholder reports from the Funds or from your financial intermediary, such as a broker-dealer or bank. Instead, shareholder reports will be available on the Funds’ website (https://www.williamblairfunds.com/investor_services/prospectus_reports_forms.fs), and you will be notified by mail each time a report is posted and provided with a website link to access the report. If you already elected to receive shareholder reports electronically, you will not be affected by this change and you need not take any action. You may elect to receive shareholder reports and other communications from the Funds electronically by notifying your financial intermediary or, if you are a direct investor, by calling 1-800-635-2886. You may elect to receive all future shareholder reports in paper free of charge. You can inform your financial intermediary that you wish to continue receiving paper copies of your shareholder reports, or if you are a direct investor, by calling 1-800-635-2886. Your election to receive reports in paper will apply to all Funds you hold directly or through your financial intermediary, as applicable. | | |
| | |
| | |
| June 30, 2019 | William Blair Funds | 1 |
The views expressed in the commentary for each Fund reflect those of the portfolio management team only through the end of the period of the report as stated on the cover. The portfolio management team’s views are subject to change at any time based on market and other conditions and should not be construed as a recommendation. Statements involving predictions, assessments, analyses, or outlook for individual securities, industries, market sectors, and/or markets involve risks and uncertainties, and there is no guarantee they will come to pass.
This report is submitted for the general information of the shareholders of William Blair Funds. It is not authorized for distribution to prospective Fund investors unless accompanied or preceded by the Fund’s prospectus. Please carefully consider a Fund’s investment objectives, risks, charges, and expenses before investing. This and other information is contained in the Fund’s prospectus, which you may obtain by calling 1-800-742-7272. Read it carefully before you invest or send money.
| 2 | Semiannual Report | June 30, 2019 |
Performance as of June 30, 2019—Class N Shares (Unaudited)
| | | | | | | | | | | 10 yr | | | | Overall |
| | | Year | | | | | | | | (or since | | Inception | | Morningstar |
| | | to Date | | 1 yr | | 3 yr | | 5 yr | | inception) | | Date | | Rating |
| |
| Growth Fund | | | | | | | | | | | | | | | | | | | |
| Class N | | 22.38 | | | 14.07 | | | 17.32 | | | 11.44 | | | 13.87 | | | 3/20/1946 | | *** |
| Morningstar Large Growth | | 21.11 | | | 10.02 | | | 16.97 | | | 11.33 | | | 14.71 | | | | | Among 1,235 |
| Russell 3000®Growth Index | | 21.41 | | | 10.60 | | | 17.81 | | | 13.02 | | | 16.13 | | | | | Large Growth Funds |
| S&P 500®Index | | 18.54 | | | 10.42 | | | 14.19 | | | 10.71 | | | 14.70 | | | | | |
| |
| Large Cap Growth Fund | | | | | | | | | | | | | | | | | | | |
| Class N | | 24.10 | | | 16.01 | | | 20.40 | | | 14.73 | | | 16.11 | | | 12/27/1999 | | **** |
| Morningstar Large Growth | | 21.11 | | | 10.02 | | | 16.97 | | | 11.33 | | | 14.71 | | | | | Among 1,235 |
| Russell 1000®Growth Index | | 21.49 | | | 11.56 | | | 18.07 | | | 13.39 | | | 16.28 | | | | | Large Growth Funds |
| |
| Mid Cap Growth Fund | | | | | | | | | | | | | | | | | | | |
| Class N | | 27.40 | | | 12.75 | | | 15.38 | | | 9.88 | | | 13.42 | | | 2/1/2006 | | *** |
| Morningstar Mid-Cap Growth | | 24.97 | | | 9.88 | | | 15.59 | | | 9.78 | | | 14.53 | | | | | Among 539 |
| Russell Midcap®Growth Index | | 26.08 | | | 13.94 | | | 16.49 | | | 11.10 | | | 16.02 | | | | | Mid-Cap Growth Funds |
| |
| Small-Mid Cap Growth Fund | | | | | | | | | | | | | | | | | | | |
| Class N | | 24.27 | | | 9.65 | | | 18.07 | | | 12.99 | | | 15.99 | | | 12/29/2003 | | **** |
| Morningstar Mid-Cap Growth | | 24.97 | | | 9.88 | | | 15.59 | | | 9.78 | | | 14.53 | | | | | Among 539 |
| Russell 2500TMGrowth Index | | 23.92 | | | 6.13 | | | 16.14 | | | 9.98 | | | 15.67 | | | | | Mid-Cap Growth Funds |
| |
| Small-Mid Cap Value Fund | | | | | | | | | | | | | | | | | | | |
| Class N | | 16.67 | | | (2.03 | ) | | 7.18 | | | 5.04 | | | 10.42 | | | 12/15/2011 | | *** |
| Morningstar Small Blend | | 15.74 | | | (3.76 | ) | | 10.09 | | | 5.65 | | | — | | | | | Among 633 |
| Russell 2500TMValue Index | | 15.26 | | | (1.92 | ) | | 8.98 | | | 5.55 | | | 11.93 | | | | | Small Blend Funds |
| |
| Small Cap Growth Fund | | | | | | | | | | | | | | | | | | | |
| Class N | | 18.98 | | | 0.89 | | | 19.06 | | | 11.20 | | | 14.31 | | | 12/27/1999 | | **** |
| Morningstar Small Growth | | 21.82 | | | 3.22 | | | 16.12 | | | 9.18 | | | 14.47 | | | | | Among 583 |
| Russell 2000®Growth Index | | 20.36 | | | (0.49 | ) | | 14.69 | | | 8.63 | | | 14.41 | | | | | Small Growth Funds |
| |
| Small Cap Value Fund | | | | | | | | | | | | | | | | | | | |
| Class N | | 16.22 | | | (3.35 | ) | | 7.48 | | | 4.87 | | | 12.18 | | | 12/23/1996 | | ** |
| Morningstar Small Blend | | 15.74 | | | (3.76 | ) | | 10.09 | | | 5.65 | | | 12.70 | | | | | Among 633 |
| Russell 2000®Value Index | | 13.47 | | | (6.24 | ) | | 9.81 | | | 5.39 | | | 12.40 | | | | | Small Blend Funds |
| |
| Global Leaders Fund | | | | | | | | | | | | | | | | | | | |
| Class N | | 20.66 | | | 4.14 | | | 13.86 | | | 8.11 | | | 11.89 | | | 10/15/2007 | | **** |
| Morningstar World Large Stock | | 16.46 | | | 4.89 | | | 11.07 | | | 5.96 | | | 10.24 | | | | | Among 722 |
| MSCI ACW IMI (net) | | 16.07 | | | 4.56 | | | 11.42 | | | 6.03 | | | 10.32 | | | | | World Large Stock Funds |
| |
| International Leaders Fund | | | | | | | | | | | | | | | | | | | |
| Class N | | 20.58 | | | 4.18 | | | 11.77 | | | 6.72 | | | 9.14 | | | 8/16/2012 | | **** |
| Morningstar Foreign Large Growth | | 18.29 | | | 2.25 | | | 9.63 | | | 4.09 | | | — | | | | | Among 396 |
| MSCI ACW Ex-U.S. IMI (net) | | 13.33 | | | 0.26 | | | 9.17 | | | 2.25 | | | 5.96 | | | | | Foreign Large Growth Funds |
| | | |
| June 30, 2019 | William Blair Funds | 3 |
Performance as of June 30, 2019—Class N Shares (Unaudited)—continued
| | | | | | | | | | | 10 yr | | | | Overall |
| | | Year | | | | | | | | (or since | | Inception | | Morningstar |
| | | to Date | | 1 yr | | 3 yr | | 5 yr | | inception) | | Date | | Rating |
| | | | | | | | | | | | | | | | | | | | |
| International Developed Plus Fund | | | | | | | | | | | | | | | | | | | |
| Class N | | 21.02 | | | 3.51 | | | 8.15 | | | 3.14 | | | 7.17 | | | 5/24/2004 | | ** |
| Morningstar Foreign Large Growth | | 18.29 | | | 2.25 | | | 9.63 | | | 4.09 | | | 8.20 | | | | | Among 396 |
| MSCI World Ex-U.S. Index (net) | | 14.64 | | | 1.29 | | | 9.01 | | | 2.04 | | | 6.75 | | | | | Foreign Large Growth Funds |
| |
| International Growth Fund | | | | | | | | | | | | | | | | | | | |
| Class N | | 19.27 | | | (0.43 | ) | | 8.44 | | | 2.84 | | | 8.04 | | | 10/1/1992 | | *** |
| Morningstar Foreign Large Growth | | 18.29 | | | 2.25 | | | 9.63 | | | 4.09 | | | 8.20 | | | | | Among 396 |
| MSCI ACW Ex-U.S. IMI (net) | | 13.33 | | | 0.26 | | | 9.17 | | | 2.25 | | | 6.78 | | | | | Foreign Large Growth Funds |
| |
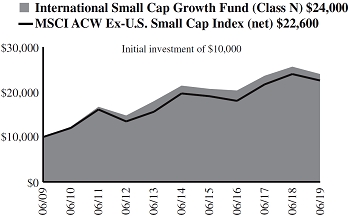
| International Small Cap Growth Fund | | | | | | | | | | | | | | | | | | | |
| Class N | | 18.73 | | | (6.34 | ) | | 5.68 | | | 2.31 | | | 9.15 | | | 11/1/2005 | | ** |
| Morningstar Foreign Small/Mid Growth | | 17.12 | | | (4.52 | ) | | 9.50 | | | 4.65 | | | 10.59 | | | | | Among 122 |
| MSCI ACW Ex-U.S. Small Cap Index (net) | | 11.60 | | | (5.94 | ) | | 7.76 | | | 2.77 | | | 8.48 | | | | | Foreign Small/Mid Growth Funds |
| |
| Emerging Markets Leaders Fund | | | | | | | | | | | | | | | | | | | |
| Class N | | 16.71 | | | 3.20 | | | 9.74 | | | 2.56 | | | 3.50 | | | 5/3/2010 | | *** |
| Morningstar Diversified Emerging Markets | | 12.06 | | | 1.16 | | | 8.92 | | | 1.71 | | | — | | | | | Among 712 |
| MSCI Emerging Markets Index (net) | | 10.58 | | | 1.21 | | | 10.66 | | | 2.49 | | | 2.97 | | | | | Diversified Emerging Markets Funds |
| |
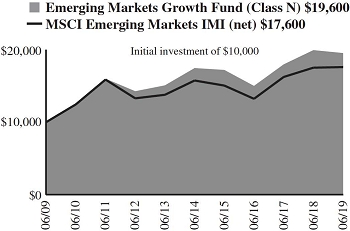
| Emerging Markets Growth Fund | | | | | | | | | | | | | | | | | | | |
| Class N | | 15.80 | | | (2.03 | ) | | 9.20 | | | 2.27 | | | 6.94 | | | 6/6/2005 | | **** |
| Morningstar Diversified Emerging Markets | | 12.06 | | | 1.16 | | | 8.92 | | | 1.71 | | | 5.82 | | | | | Among 712 |
| MSCI Emerging Markets IMI (net) | | 10.14 | | | 0.47 | | | 10.01 | | | 2.25 | | | 5.83 | | | | | Diversified Emerging Markets Funds |
| |
| Emerging Markets Small Cap Growth Fund | | | | | | | | | | | | | | | | | | | |
| Class N | | 8.88 | | | (8.06 | ) | | 3.04 | | | 1.24 | | | 7.92 | | | 10/24/2011 | | ** |
| Morningstar Diversified Emerging Markets | | 12.06 | | | 1.16 | | | 8.92 | | | 1.71 | | | — | | | | | Among 712 |
| MSCI Emerging Markets Small Cap Index (net) | | 6.70 | | | (5.12 | ) | | 5.46 | | | 0.53 | | | 3.41 | | | | | Diversified Emerging Markets Funds |
| |
| Bond Fund | | | | | | | | | | | | | | | | | | | |
| Class N | | 8.05 | | | 7.89 | | | 2.74 | | | 2.80 | | | 4.62 | | | 5/1/2007 | | *** |
| Morningstar Intermediate Core-Plus Bond | | 6.40 | | | 7.35 | | | 2.95 | | | 2.84 | | | 4.82 | | | | | Among 539 |
| Bloomberg Barclays U.S. Aggregate Index | | 6.11 | | | 7.87 | | | 2.31 | | | 2.95 | | | 3.90 | | | | | Intermediate Core-Plus Bond Funds |
| |
| Income Fund | | | | | | | | | | | | | | | | | | | |
| Class N | | 4.33 | | | 4.60 | | | 1.45 | | | 1.63 | | | 3.07 | | | 10/1/1990 | | *** |
| Morningstar Short-Term Bond | | 3.20 | | | 4.19 | | | 1.97 | | | 1.60 | | | 2.48 | | | | | Among 478 |
| Bloomberg Barclays Intermediate Government/Credit Bond Index | | 4.97 | | | 6.93 | | | 1.99 | | | 2.39 | | | 3.24 | | | | | Short-Term Bond Funds |
| | | | | | | | | | | | | | | | | | | | |
| 4 | Semiannual Report | June 30, 2019 |
Performance as of June 30, 2019—Class N Shares (Unaudited)—continued
| | | | | | | | | | | 10 yr | | | | Overall |
| | | Year | | | | | | | | (or since | | Inception | | Morningstar |
| | | to Date | | 1 yr | | 3 yr | | 5 yr | | inception) | | Date | | Rating |
| | | | | | | | | | | | | | | | | | | | |
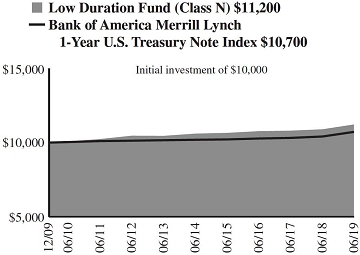
| Low Duration Fund | | | | | | | | | | | | | | |
| Class N | | 2.46 | | | 2.97 | | | 1.38 | | | 1.14 | | | 1.21 | | | 12/1/2009 | | ** |
| Morningstar Ultrashort Bond | | 1.85 | | | 2.76 | | | 1.85 | | | 1.32 | | | — | | | | | Among 151 |
| Bank of America Merrill Lynch 1-Year U.S. Treasury Note Index | | 1.76 | | | 2.98 | | | 1.43 | | | 1.02 | | | 0.73 | | | | | Ultrashort Bond Funds |
| |
| Macro Allocation Fund | | | | | | | | | | | | | | | | | | | |
| Class N | | 2.45 | | | 2.77 | | | 2.63 | | | 0.43 | | | 4.35 | | | 11/29/2011 | | ** |
| Morningstar Multialternative | | 5.39 | | | 1.81 | | | 2.85 | | | 1.19 | | | — | | | | | Among 265 |
| Bank of America Merrill Lynch 3-Month U.S. Treasury Bill Index | | 1.24 | | | 2.31 | | | 1.38 | | | 0.87 | | | 0.60 | | | | | Multialternative Funds |
Performance cited represents past performance. Past performance does not guarantee future results and current performance may be lower or higher than the data quoted.Results shown are average annual total returns, which assume reinvestment of dividends and capital gains. Investment returns and principal will fluctuate and you may have a gain or a loss when you sell shares.For the most current month-end performance information, please call 1-800-742-7272, or visit our Web site atwww.williamblairfunds.com. From time to time, the investment adviser may waive fees or reimburse expenses for the Fund. Without these waivers, performance would be lower. Investing in smaller companies involves special risks, including higher volatility and lower liquidity. International and emerging markets investing involves special risk considerations, including currency fluctuations, lower liquidity, economic and political risk. As interest rates rise, bond prices will typically fall and bond funds may become more volatile.Class N shares are available to the general public without a sales load.
Morningstar RatingsTMare as of 6/30/2019 and are subject to change every month. The ratings are based on a risk-adjusted return measure that accounts for variation in a fund’s monthly performance, placing more emphasis on downward variations and rewarding consistent performance. The top 10% of funds in each Category receive 5 stars, the next 22.5% receive 4 stars, the middle 35% receive 3 stars, the next 22.5% receive 2 stars, and the bottom 10% receive 1 star. The Overall Morningstar Rating for a fund is derived from a weighted-average of the performance figures associated with its three-, five- and ten-year (if applicable) Morningstar Rating metrics. The 3/5/10 year Morningstar ratings were as follows: Growth Fund ***/***/** and Large Cap Growth Fund ****/*****/**** out of 1,235/1,100/812 large growth funds; Mid Cap Growth Fund ***/***/*** and Small-Mid Cap Growth Fund ****/****/**** out of 539/484/367 mid-cap growth funds; Small Cap Growth Fund ****/****/***, out of 583/515/393 small growth funds; Small-Mid Cap Value Fund **/***/NA and Small Cap Value Fund **/**/** out of 633/516/375 small blend funds; Global Leaders Fund ****/****/**** out of 722/594/350 world large stock funds; International Developed Plus Fund **/***/**, International Growth Fund **/**/***, and International Leaders Fund ****/****/NA out of 396/336/247 foreign large growth funds; International Small Cap Growth Fund */*/*** out of 122/99/59 foreign small/mid growth funds; Emerging Markets Leaders Fund ***/***/****, Emerging Markets Growth Fund ***/***/****, and Emerging Markets Small Cap Growth */***/NA out of 712/560/240 diversified emerging markets funds; Bond Fund ***/***/*** out of 539/453/332 intermediate core-plus bond funds; Income Fund **/***/**** out of 478/421/269 short-term bond funds; Low Duration Fund **/**/NA out of 151/128/NA ultrashort bond funds; and Macro Allocation Fund ***/**/NA out of 265/177/NA multialternative funds.
Please carefully consider a Fund’s investment objectives, risks, charges, and expenses before investing. This and other information is contained in the Fund’s prospectus, which you may obtain by calling 1-800-742-7272. Read it carefully before you invest or send money.
| June 30, 2019 | William Blair Funds | 5 |
U.S. Growth Market Review and Outlook
Following a pronounced sell-off to end 2018, U.S. equities had a strong start to 2019. Spurring the first quarter recovery were comments from the Federal Open Market Committee (“FOMC”) indicating that it would be patient and flexible with future monetary policy decisions. A solid U.S. economic backdrop and healthy corporate earnings trends further supported the market.
Relative to the robust first quarter, positive performance was more moderate in the second quarter of 2019 and included significant swings on a monthly basis. U.S. corporations reported first quarter earnings that were broadly better than investors’ previously-lowered expectations, providing support for equities to move higher during the month of April. From there, macro considerations, most notably rising trade tensions and a perceived shift in U.S. Federal Reserve (the “Fed”) policy, seemed to drive the direction of the market. As trade threats dominated the news, rising investor angst around the possible impacts of protectionism on global economic growth and corporate earnings corresponded with a decline in equities. A subsequent recovery during the month of June was helped by the perception of a shift in Fed policy and its increased willingness to cut interest rates if economic conditions deteriorate.
While equities moved higher over the course of the second quarter, the 10 year Treasury yield declined and the 10 year to 3 month yield curve inverted, which some view as a leading indicator of a potential recession. Further supporting the notion of slowing economic growth, U.S. manufacturing activity weakened, while growth in housing prices slowed. However, strength in consumption and retail sales, bolstered by low unemployment and moderate wage growth, allowed investors to look through some of the more cautionary indicators, bringing U.S. equities back near all-time highs to close out the second quarter.
Despite strong equity market performance during the first half of 2019, many of the risks that contributed to the late 2018 selloff remain on the horizon. From a Fed policy perspective, it is not clear how much impact the interest rate increases implemented in 2017 and 2018 will have on the economy or how effective monetary policy will be in stimulating the economy from here, given that financial conditions are already quite supportive. Global interest rates have declined year-to-date with continued monetary stimulus from China and other central banks. In addition, the Fed faces the challenge of managing the economy against investor expectations, which call for several interest rate cuts over the next twelve months, and a trade policy that is in flux and could ultimately have varying effects on U.S. economic growth. In the meantime, tariff uncertainty can have a real economic impact by disrupting supply chains and causing corporations to delay investment activity. Ongoing trade negotiations, as well as political disruption leading into the 2020 U.S. presidential election, are likely to result in continued market volatility.
Balancing some of these uncertainties are data points that indicate a still healthy U.S. economy, now in its eleventh year of expansion. The labor market, in particular, remains robust with continued low unemployment and moderate wage growth. U.S. consumer confidence remains high and spending healthy, while corporate bond yields have declined, reducing interest expense for corporations. Corporate profit margins are strong, notwithstanding the fact that they broadly contracted during the second quarter of 2019 as many companies have not been able to fully offset wage growth and higher input costs with price increases. We feel relatively well positioned in this regard as our investment approach has always emphasized companies with strong value propositions that enable better than average pricing flexibility.
We believe our longstanding focus on identifying durable businesses, whose stocks present attractive risk/reward opportunities, will serve us well in an environment of uncertainty where business fundamentals are especially important.
| 6 | Semiannual Report | June 30, 2019 |
U.S. Value Market Review and Outlook
U.S. equities drifted higher during the second quarter of 2019, adding to the robust returns from earlier in the year. The dramatic bounce-back from a dismal finish to 2018 was largely the result of a dovish pivot by the Federal Reserve (“Fed”) and the Fed’s lack of commitment to future rate moves as it takes a more patient approach to future monetary policy decisions. Healthy corporate earnings and expectations for a trade deal between the U.S. and China helped boost investor confidence and fueled strong U.S. equity returns early in the year.
In contrast to the robust returns in the first quarter of 2019, positive market performance was more moderate during the second quarter. Although corporate earnings growth continued to be solid and contributed to positive market performance in April, relatively uninspiring economic data and increased geopolitical instability, mainly around trade, seemed to temper returns during the quarter. As the exchanges surrounding trade intensified and dominated the news, bond yields plummeted as concerns regarding the potential implications of protectionism on global economic growth and corporate earnings contributed to the market decline in May. Late in the quarter, the Fed signaled its willingness to lower short-term interest rates in an effort to sustain economic expansion, which was positively received by investors. Generally speaking, it appears that a more dovish Fed and its patience regarding future monetary policy decisions is helping to offset a more volatile trade situation overall.
Despite the strong rebound in U.S. equity performance through the second quarter, many of the risks that contributed to the dramatic market sell-off late in 2018 remain intact. The constantly evolving trade/tariff landscape seems to present a challenge for the Fed and complicates future monetary policy decisions as it is forced to make assumptions about harder-to-predict geopolitical risks and their impact on the economy. Continued trade policy uncertainty may result in supply chain disruption and delayed corporate investment activity, which could alter the trajectory of global growth. The Fed may be proactive and move more quickly than in previous cycles in an effort to spark growth and prolong the current economic expansion.
We remain cognizant that corporate debt levels continue to rise and could contribute to higher market volatility should these more highly levered companies feel pressure as a greater percentage of their cash flow is needed to service their rising debt levels. The main difference between this cycle and what transpired during the global financial crisis is that these higher debt levels are not on bank balance sheets, but rather have been privately financed. Should these lower quality/more highly levered companies have trouble accessing the capital markets or get squeezed as high yield spreads increase, this could be the impetus for sustained higher quality stock outperformance. We remain focused on companies with solid balance sheets and have gravitated towards companies with even stronger balance sheets given our concern about corporate debt levels and expectations for increased market volatility. As always, our focus remains on identifying quality companies at discount prices and corporate transformation opportunities. We continue to find opportunities across multiple sectors and believe the Fund is well-suited to withstand a variety of market scenarios and add value over the long-term.
| June 30, 2019 | William Blair Funds | 7 |
| | Growth Fund |
| | |
| | The Growth Fund seeks long-term capital appreciation. |
| | |
| | AN OVERVIEW FROM THE PORTFOLIO MANAGER |
| | |

David C. Fording | The William Blair Growth Fund (Class N shares) posted a 22.38% increase, net of fees, for the six months ended June 30, 2019. By comparison, the Fund’s benchmark index, the Russell 3000®Growth Index (the “Index”), increased 21.41%. Outperformance for the year-to-date period was driven by stock selection and a tailwind for our investment style. From a stock selection perspective, Industrials and Health Care were standout sectors, in part due to our positions in CoStar Group, Inc. (Industrials), Copart, Inc. (Industrials) and Veeva Systems, Inc. (Health Care). Real estate information services company CoStar Group advanced on business trends that were consistent with our investment thesis, including strong growth in its commercial real estate business and continued market share gains in its apartment rental advertising business. Other top contributors were metal packaging provider Ball Corporation (Materials), as strong demand drove volume growth for aluminum cans, and Worldpay, Inc. (Information Technology). From a style perspective, our higher valuation exposure, driven by the Fund’s quality growth bias, was a tailwind as stocks with higher valuations generally outperformed during the period. Conversely, top detractors from performance year-to-date included Healthcare Services Group, Inc. (Industrials), UnitedHealth Group, Inc. (Health Care), Pure Storage, Inc. (Information Technology) and Weight Watchers International, Inc. (Consumer Discretionary). Healthcare Services Group provides outsourced housekeeping, facility maintenance and food services to nursing homes and other care facilities. The stock’s underperformance was most notable during the first quarter, as the company reported revenue that disappointed investors and was attributable to a contract change with one of its food service customers that would dampen revenue, but ultimately lift margins. In addition, the Communication Services sector was a detractor as our position in Alphabet, Inc. and not owning Facebook, Inc. contributed to lagging returns in the sector. We sold Facebook in late 2018 on concerns over slowing revenue growth, margin compression and stepped up regulatory scrutiny around privacy and use of personal data; the latter of which remains a fundamental threat to Facebook’s long term business model. Please refer to the U.S. Growth Market Review and Outlook relating to the Fund on page 6 for additional information. |
| 8 | Semiannual Report | June 30, 2019 |
Growth Fund
Performance Highlights (Unaudited)
| Average Annual Total Return through 6/30/2019 |
| | | Year
to Date | | 1 Year | | 3 Year | | 5 Year | | 10 Year | | Since
Inception(a) |
| Class N | | | 22.38 | % | | | 14.07 | % | | | 17.32 | % | | | 11.44 | % | | | 13.87 | % | | | — | |
| Class I | | | 22.59 | | | | 14.43 | | | | 17.66 | | | | 11.77 | | | | 14.23 | | | | — | |
| Class R6 | | | — | | | | — | | | | — | | | | — | | | | — | | | | 2.53 | % |
| Russell 3000® Growth Index | | | 21.41 | | | | 10.60 | | | | 17.81 | | | | 13.02 | | | | 16.13 | | | | 0.81 | |
| S&P 500®Index | | | 18.54 | | | | 10.42 | | | | 14.19 | | | | 10.71 | | | | 14.70 | | | | 1.00 | |
| (a) | Since inception is for the period from May 2, 2019 (Commencement of Operations) to June 30, 2019. |
Performance cited represents past performance. Past performance does not guarantee future results and current performance may be lower or higher than the data quoted. Results shown are average annual returns, which assume reinvestment of dividends and capital gains. Investment returns and principal will fluctuate and you may have a gain or loss when you sell shares. For the most current month-end performance information, please call 1-800-742-7272, or visit our Web site atwww.williamblairfunds.com. From time to time, the investment adviser may waive fees or reimburse expenses for the Fund. Without these waivers/reimbursements, performance would be lower. Class N shares are not subject to a sales load. Class I shares are not subject to a sales load or distribution (Rule 12b-1) fees. Class R6 shares are not subject to a sales load, distribution (Rule 12b-1) fees, or sub-transfer agent fees.
The performance highlights and graph presented above do not reflect the deduction of taxes that a shareholder would pay on fund distributions or the redemption of fund shares.
The Russell 3000® Growth Index consists of large, medium, and small capitalization companies with above average price-to-book ratios and forecasted growth rates. The index is weighted by market capitalization and large/medium/small companies make up approximately 80%/15%/5% of the index.
The S&P 500® Index indicates broad larger capitalization equity market performance.
This report identifies the Fund’s investments on June 30, 2019. These holdings are subject to change. Not all stocks in the Fund performed the same, nor is there any guarantee that these stocks will perform as well in the future. Market forecasts provided in this report may not necessarily come to pass.
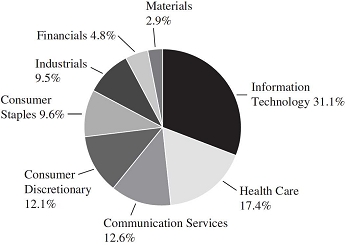
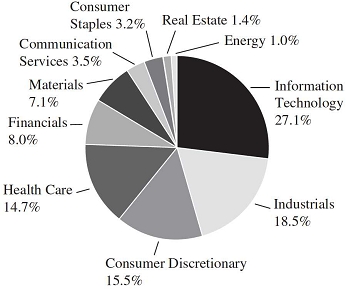
Sector Diversification (Unaudited)

The sector diversification shown is based on the total long-term securities.
| June 30, 2019 | William Blair Funds | 9 |
Growth Fund
Portfolio of Investments, June 30, 2019(all dollar amounts in thousands) (unaudited)
| | | | | | | | |
| | | | | | | | |
| | Issuer | | Shares | | | Value | |
| | |
| | Common Stocks | | | | | | | | |
| | Information Technology—30.1% | | | | | | | | |
| * | Adobe, Inc. | | | 17,315 | | | $ | 5,102 | |
| * | Arista Networks, Inc. | | | 7,980 | | | | 2,072 | |
| | Booz Allen Hamilton Holding Corporation | | | 64,052 | | | | 4,241 | |
| | Dolby Laboratories, Inc. | | | 57,743 | | | | 3,730 | |
| | Genpact, Ltd.† | | | 89,815 | | | | 3,421 | |
| * | Guidewire Software, Inc. | | | 25,832 | | | | 2,619 | |
| | Mastercard, Inc. Class “A” | | | 45,773 | | | | 12,108 | |
| * | MaxLinear, Inc. | | | 86,201 | | | | 2,021 | |
| | Microsoft Corporation | | | 159,227 | | | | 21,330 | |
| | National Instruments Corporation | | | 58,571 | | | | 2,459 | |
| * | Pure Storage, Inc. | | | 162,374 | | | | 2,479 | |
| * | Rogers Corporation | | | 10,013 | | | | 1,728 | |
| | Sabre Corporation | | | 150,569 | | | | 3,343 | |
| | Texas Instruments, Inc. | | | 47,508 | | | | 5,452 | |
| * | Verra Mobility Corporation | | | 146,920 | | | | 1,923 | |
| * | Worldpay, Inc. Class “A” | | | 34,044 | | | | 4,172 | |
| | | | | | | | | 78,200 | |
| | Consumer Discretionary—15.2% | | | | | | | | |
| | Advance Auto Parts, Inc. | | | 18,432 | | | | 2,841 | |
| * | Amazon.com, Inc. | | | 9,185 | | | | 17,393 | |
| * | Burlington Stores, Inc. | | | 27,931 | | | | 4,752 | |
| | Domino’s Pizza, Inc. | | | 8,959 | | | | 2,493 | |
| * | Grand Canyon Education, Inc. | | | 28,985 | | | | 3,392 | |
| * | GrubHub, Inc. | | | 27,027 | | | | 2,108 | |
| * | Laureate Education, Inc. | | | 175,293 | | | | 2,754 | |
| * | Ulta Salon Cosmetics & Fragrance, Inc. | | | 11,249 | | | | 3,902 | |
| | | | | | | | | 39,635 | |
| | Health Care—14.5% | | | | | | | | |
| * | Veeva Systems, Inc. Class “A” | | | 17,918 | | | | 2,905 | |
| | Abbott Laboratories | | | 48,107 | | | | 4,046 | |
| * | ABIOMED, Inc. | | | 10,029 | | | | 2,612 | |
| | Agilent Technologies, Inc. | | | 34,104 | | | | 2,547 | |
| * | Codexis, Inc. | | | 72,198 | | | | 1,331 | |
| * | Horizon Therapeutics plc† | | | 96,598 | | | | 2,324 | |
| * | Portola Pharmaceuticals, Inc. | | | 72,527 | | | | 1,968 | |
| | Stryker Corporation | | | 19,800 | | | | 4,070 | |
| | Teleflex, Inc. | | | 7,798 | | | | 2,582 | |
| | UnitedHealth Group, Inc. | | | 36,212 | | | | 8,836 | |
| | Zoetis, Inc. | | | 39,750 | | | | 4,511 | |
| | | | | | | | | 37,732 | |
| | Industrials—11.4% | | | | | | | | |
| | BWX Technologies, Inc. | | | 116,151 | | | | 6,051 | |
| * | Copart, Inc. | | | 65,272 | | | | 4,878 | |
| * | CoStar Group, Inc. | | | 9,651 | | | | 5,347 | |
| | Healthcare Services Group, Inc. | | | 77,543 | | | | 2,351 | |
| | Luxfer Holdings plc† | | | 61,357 | | | | 1,505 | |
| | Raytheon Co. | | | 26,878 | | | | 4,674 | |
| * | The Middleby Corporation | | | 23,790 | | | | 3,228 | |
| * | Trex Co., Inc. | | | 20,779 | | | | 1,490 | |
| | | | | | | | | 29,524 | |
| | | | Shares or | | | | |
| | | | Principal | | | | |
| | Issuer | | Amount | | | Value | |
| | | | | | | | | | |
| | Common Stocks—(continued) | | | | | | | | |
| | Communication Services—9.9% | | | | | | | | |
| | Activision Blizzard, Inc. | | | 68,249 | | | $ | 3,221 | |
| * | Alphabet, Inc. Class “A” | | | 14,876 | | | | 16,108 | |
| * | Cars.com, Inc. | | | 51,495 | | | | 1,016 | |
| * | Live Nation Entertainment, Inc. | | | 47,354 | | | | 3,137 | |
| * | Take-Two Interactive Software, Inc. | | | 19,122 | | | | 2,171 | |
| | | | | | | | | 25,653 | |
| | Consumer Staples—7.6% | | | | | | | | |
| | Costco Wholesale Corporation | | | 21,306 | | | | 5,630 | |
| * | Primo Water Corporation | | | 135,512 | | | | 1,667 | |
| | The Coca-Cola Co. | | | 161,109 | | | | 8,204 | |
| | The Estee Lauder Cos., Inc. Class “A” | | | 22,986 | | | | 4,209 | |
| | | | | | | | | 19,710 | |
| | Financials—5.3% | | | | | | | | |
| | East West Bancorp, Inc. | | | 48,408 | | | | 2,264 | |
| * | Encore Capital Group, Inc. | | | 49,311 | | | | 1,670 | |
| | Intercontinental Exchange, Inc. | | | 84,168 | | | | 7,233 | |
| | Virtu Financial, Inc. | | | 123,894 | | | | 2,699 | |
| | | | | | | | | 13,866 | |
| | Materials—4.6% | | | | | | | | |
| | Ball Corporation | | | 98,773 | | | | 6,913 | |
| | Linde plc† | | | 24,618 | | | | 4,943 | |
| | | | | | | | | 11,856 | |
| | Energy—0.8% | | | | | | | | |
| | Cameco Corporation† | | | 190,907 | | | | 2,049 | |
| | Total Common Stocks—99.4%
(cost $168,795) | | | | | | | 258,225 | |
| | | | | | | | | | |
| | Repurchase Agreement | | | | | | | | |
| | Fixed Income Clearing Corporation, 0.500% dated 6/28/19, due 7/1/19, repurchase price $1,760, collateralized by U.S. Treasury Note, 1.500%, due 8/15/26 | | | $1,760 | | | | 1,760 | |
| | Total Repurchase Agreement—0.7%
(cost $1,760) | | | | | | | 1,760 | |
| | Total Investments—100.1%
(cost $170,555) | | | | | | | 259,985 | |
| | Liabilities, plus cash and other assets—(0.1)% | | | | | | | (201 | ) |
| | Net assets—100.0% | | | | | | $ | 259,784 | |
* = Non-income producing security
† = U.S. listed foreign security
See accompanying Notes to Financial Statements.
| 10 | Semiannual Report | June 30, 2019 |
| | Large Cap Growth Fund |
| | |
| | The Large Cap Growth Fund seeks long-term capital appreciation. |
| | |
| | AN OVERVIEW FROM THE PORTFOLIO MANAGERS |
| | |

James S. Golan 
David P. Ricci | The William Blair Large Cap Growth Fund (Class N shares) posted a 24.10% increase, net of fees, for the six months ended June 30, 2019. By comparison, the Fund’s benchmark index, the Russell 1000®Growth Index (the “Index”), increased 21.49%. Outperformance for the year-to-date period was driven by stock selection and a tailwind for our investment style. From a stock selection perspective, Industrials and Health Care were standout sectors, in part due to our positions in Copart, Inc. (Industrials), Equifax, Inc. (Industrials) and Veeva Systems, Inc. (Health Care). Veeva Systems and Copart were easily the Fund’s top contributors during the period as generally strong business fundamentals persisted year-to-date. Shares of Copart, an online auction platform for salvage vehicles, outperformed as a growing buyer base drove higher average selling prices and as Copart raised buyer fees on select vehicles. Veeva Systems, a cloud-based software and data solutions provider primarily for the life sciences industry, outperformed after reporting record-high customer additions and strong subscription revenue growth. Other notable contributors to performance were PayPal Holdings, Inc. (Information Technology) and The Estee Lauder Cos., Inc. (Consumer Staples). From a style perspective, our higher valuation exposure, driven by the Fund’s quality growth bias, was a tailwind as stocks with higher valuations generally outperformed during the period. Conversely, top detractors from performance year-to-date included advanced medical technologies company, ABIOMED, Inc. (Health Care), UnitedHealth Group, Inc. (Health Care) and Red Hat, Inc. (Information Technology). ABIOMED underperformed as uncertainty related to FDA guidance around the appropriate patient population for its Impella heart pump caused shares to decline. Concern around a potential competitive entrant also pressured shares of ABIOMED during the first quarter. Communication Services was also a detractor as our positions in Alphabet, Inc. and Activision Blizzard, Inc., as well as not owning Facebook, Inc., contributed to lagging returns in the sector. We sold Facebook in late 2018 on concerns over slowing revenue growth, margin compression, governance issues and stepped up regulatory scrutiny around privacy and use of personal data; the latter of which remains a fundamental threat to Facebook’s long term business model. Please refer to the U.S. Growth Market Review and Outlook relating to the Fund on page 6 for additional information. |
| June 30, 2019 | William Blair Funds | 11 |
Large Cap Growth Fund
Performance Highlights (Unaudited)
| Average Annual Total Return through 6/30/2019 |
| | | Year
to Date | | 1 Year | | 3 Year | | 5 Year | | 10 Year | | Since
Inception(a) |
| Class N | | | 24.10 | % | | | 16.01 | % | | | 20.40 | % | | | 14.73 | % | | | 16.11 | % | | | — | |
| Class I | | | 24.25 | | | | 16.32 | | | | 20.73 | | | | 15.02 | | | | 16.39 | | | | — | |
| Class R6 | | | — | | | | — | | | | — | | | | — | | | | — | | | | 4.03 | % |
| Russell 1000® Growth Index | | | 21.49 | | | | 11.56 | | | | 18.07 | | | | 13.39 | | | | 16.28 | | | | 0.81 | |
| (a) | Since inception is for the period from May 2, 2019 (Commencement of Operations) to June 30, 2019. |
Performance cited represents past performance. Past performance does not guarantee future results and current performance may be lower or higher than the data quoted. Results shown are average annual total returns, which assume reinvestment of dividends and capital gains. Investment returns and principal will fluctuate and you may have a gain or loss when you sell shares. For the most current month-end performance information, please call 1-800-742-7272, or visit our Web site atwww.williamblairfunds.com. From time to time, the investment adviser may waive fees or reimburse expenses for the Fund. Without these waivers/reimbursements, performance would be lower. Class N shares are not subject to a sales load. Class I shares are not subject to a sales load or distribution (Rule 12b-1) fees. Class R6 shares are not subject to a sales load, distribution (Rule 12b-1) fees, or sub-transfer agent fees.
The performance highlights and graph presented above do not reflect the deduction of taxes that a shareholder would pay on fund distributions or the redemption of fund shares.
The Russell 1000®Growth Index consists of large capitalization companies with above average price-to-book ratios and forecasted growth rates.
This report identifies the Fund’s investments on June 30, 2019. These holdings are subject to change. Not all stocks in the Fund performed the same, nor is there any guarantee that these stocks will perform as well in the future. Market forecasts provided in this report may not necessarily come to pass.
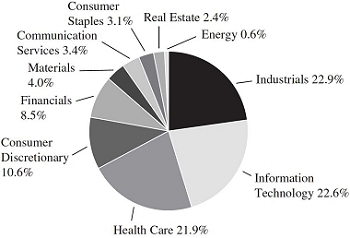
Sector Diversification (Unaudited)
The sector diversification shown is based on the total long-term securities.
| 12 | Semiannual Report | June 30, 2019 |
Large Cap Growth Fund
Portfolio of Investments, June 30, 2019(all dollar amounts in thousands) (unaudited)
| | | | | | | | |
| | | | | | | | |
| | Issuer | | Shares | | | Value | |
| | | | | | | | |
| | Common Stocks | | | | | | | | |
| | Information Technology—30.9% | | | | | | | | |
| | Accenture plc† | | | 45,790 | | | $ | 8,461 | |
| * | Adobe, Inc. | | | 23,900 | | | | 7,042 | |
| * | Guidewire Software, Inc. | | | 44,980 | | | | 4,560 | |
| | Intuit, Inc. | | | 26,230 | | | | 6,855 | |
| | Mastercard, Inc. | | | 30,810 | | | | 8,150 | |
| | Microsoft Corporation | | | 151,020 | | | | 20,231 | |
| * | PayPal Holdings, Inc. | | | 75,950 | | | | 8,693 | |
| | Texas Instruments, Inc. | | | 63,170 | | | | 7,249 | |
| | | | | | | | | 71,241 | |
| | Health Care—17.2% | | | | | | | | |
| | Abbott Laboratories | | | 69,920 | | | | 5,880 | |
| * | ABIOMED, Inc. | | | 15,010 | | | | 3,910 | |
| | Stryker Corporation | | | 28,260 | | | | 5,810 | |
| | UnitedHealth Group, Inc. | | | 42,190 | | | | 10,295 | |
| * | Veeva Systems, Inc. Class “A” | | | 36,830 | | | | 5,970 | |
| | Zoetis, Inc. | | | 68,360 | | | | 7,758 | |
| | | | | | | | | 39,623 | |
| | Communication Services—12.4% | | | | | | | | |
| | Activision Blizzard, Inc. | | | 112,880 | | | | 5,328 | |
| * | Alphabet, Inc. Class “A” | | | 9,410 | | | | 10,189 | |
| * | Alphabet, Inc. Class “C” | | | 4,096 | | | | 4,428 | |
| * | Live Nation Entertainment, Inc. | | | 75,340 | | | | 4,991 | |
| * | Netflix, Inc. | | | 10,040 | | | | 3,688 | |
| | | | | | | | | 28,624 | |
| | Consumer Discretionary—11.9% | | | | | | | | |
| * | Amazon.com, Inc. | | | 9,320 | | | | 17,648 | |
| | McDonald’s Corporation | | | 20,080 | | | | 4,170 | |
| | Starbucks Corporation | | | 67,360 | | | | 5,647 | |
| | | | | | | | | 27,465 | |
| | Consumer Staples—9.5% | | | | | | | | |
| | Costco Wholesale Corporation | | | 18,070 | | | | 4,775 | |
| * | Monster Beverage Corporation | | | 99,810 | | | | 6,371 | |
| | The Coca-Cola Co. | | | 100,190 | | | | 5,102 | |
| | The Estee Lauder Cos., Inc. Class “A” | | | 30,160 | | | | 5,522 | |
| | | | | | | | | 21,770 | |
| | Industrials—9.4% | | | | | | | | |
| * | Copart, Inc. | | | 86,330 | | | | 6,452 | |
| | Equifax, Inc. | | | 43,010 | | | | 5,817 | |
| | Fortive Corporation | | | 42,100 | | | | 3,432 | |
| | Raytheon Co. | | | 33,960 | | | | 5,905 | |
| | | | | | | | | 21,606 | |
| | Financials—4.7% | | | | | | | | |
| | Aon plc† | | | 24,530 | | | | 4,734 | |
| | Intercontinental Exchange, Inc. | | | 72,200 | | | | 6,205 | |
| | | | | | | | | 10,939 | |
| | Materials—2.9% | | | | | | | | |
| | Linde plc† | | | 32,730 | | | | 6,573 | |
| | Total Common Stocks—98.9%
(cost $156,334) | | | | | | | 227,841 | |
| | | | | | | | | | |
| | Issuer | | Principal
Amount | | | | Value | |
| | | | | | | | | | |
| | Repurchase Agreement | | | | | | | | |
| | Fixed Income Clearing Corporation, 0.500% dated 6/28/19, due 7/1/19, repurchase price $2,803, collateralized by U.S. Treasury Note, 1.500%, due 8/15/26 | | | $2,803 | | | $ | 2,803 | |
| | Total Repurchase Agreement—1.2%
(cost $2,803) | | | | | | | 2,803 | |
| | Total Investments—100.1%
(cost $159,137) | | | | | | | 230,644 | |
| | Liabilities, plus cash and other assets—(0.1)% | | | | | | | (242 | ) |
| | Net assets—100.0% | | | | | | $ | 230,402 | |
† = U.S. listed foreign security
* = Non-income producing security
See accompanying Notes to Financial Statements.
| June 30, 2019 | William Blair Funds | 13 |
| | Mid Cap Growth Fund |
| | |
| | The Mid Cap Growth Fund seeks long-term capital appreciation. |
| | |
| | AN OVERVIEW FROM THE PORTFOLIO MANAGERS |
| | |

Daniel Crowe 
Robert C. Lanphier, IV | The William Blair Mid Cap Growth Fund (Class N shares) posted a 27.40% increase, net of fees, for the six months ended June 30, 2019. By comparison, the Fund’s benchmark index, the Russell Midcap®Growth Index (the “Index”), increased 26.08%. With the Index up approximately 26% year-to-date, Fund outperformance over the period was driven by strong stock selection. The Fund generally lagged during the strongest periods of benchmark returns, but that was more than offset by outperformance during other periods and attributable to the generally strong fundamental performance of the companies held by the Fund. Stock selection in the Industrials sector was a standout contributor to performance, in part due to our positions in CoStar Group, Inc. and Copart, Inc. Real estate information services company CoStar Group outperformed on business trends that were consistent with our investment thesis, including strong growth in its commercial real estate business and continued market share gains in its apartment rental advertising business. Other top contributors were metal packaging provider, Ball Corporation (Materials), Worldpay, Inc. (Information Technology) and Wayfair, Inc. (Consumer Discretionary). Ball Corporation benefited as strong demand drove volume growth for aluminum cans. Conversely, top detractors from performance year-to-date included Lamb Weston Holdings, Inc. (Consumer Staples) and Pure Storage, Inc. (Information Technology). Flash-based storage solutions provider Pure Storage underperformed due to an increased focus on large enterprise accounts with lengthened sales cycles. Shares of potato processor Lamb Weston were weighed down as some investors became concerned that incremental industry capacity coming online over the next two years could pressure margins. Other notable laggards were Health Care holdings Centene Corporation and ABIOMED, Inc. In addition, stock selection in Financials, including our position in Cboe Global Markets, Inc., detracted from relative results. Please refer to the U.S. Growth Market Review and Outlook relating to the Fund on page 6 for additional information. |
| 14 | Semiannual Report | June 30, 2019 |
Mid Cap Growth Fund
Performance Highlights (Unaudited)
| Average Annual Total Return through 6/30/2019 |
| | | Year
to Date | | 1 Year | | 3 Year | | 5 Year | | 10 Year | | Since
Inception(a) |
| Class N | | | 27.40 | % | | | 12.75 | % | | | 15.38 | % | | | 9.88 | % | | | 13.42 | % | | | — | |
| Class I | | | 27.43 | | | | 13.05 | | | | 15.67 | | | | 10.15 | | | | 13.71 | | | | — | |
| Class R6 | | | — | | | | — | | | | — | | | | — | | | | — | | | | 2.01 | % |
| Russell Midcap® Growth Index | | | 26.08 | | | | 13.94 | | | | 16.49 | | | | 11.10 | | | | 16.02 | | | | 1.99 | |
| (a) | Since inception is for the period from May 2, 2019 (Commencement of Operations) to June 30, 2019. |
Performance cited represents past performance. Past performance does not guarantee future results and current performance may be lower or higher than the data quoted. Results shown are average annual total returns, which assume reinvestment of dividends and capital gains. Investment returns and principal will fluctuate and you may have a gain or loss when you sell shares. For the most current month-end performance information, please call 1-800-742-7272, or visit our Web site atwww.williamblairfunds.com. Investing in medium capitalization companies involves special risks, including higher volatility and lower liquidity. Medium capitalization stocks are also more sensitive to purchase/sale transactions and changes in the issuer’s financial condition. From time to time, the investment adviser may waive fees or reimburse expenses for the Fund. Without these waivers/reimbursements, performance would be lower. Class N shares are not subject to a sales load. Class I shares are not subject to a sales load or distribution (Rule 12b-1) fees. Class R6 shares are not subject to a sales load, distribution (Rule 12b-1) fees, or sub-transfer agent fees.
The performance highlights and graph presented above do not reflect the deduction of taxes that a shareholder would pay on fund distributions or the redemption of fund shares.
The Russell Midcap®Growth Index is an index that is constructed to provide a comprehensive and unbiased barometer of the mid-cap growth market.
This report identifies the Fund’s investments on June 30, 2019. These holdings are subject to change. Not all stocks in the Fund performed the same, nor is there any guarantee that these stocks will perform as well in the future. Market forecasts provided in this report may not necessarily come to pass.
Sector Diversification (Unaudited)
The sector diversification shown is based on the total long-term securities.
| June 30, 2019 | William Blair Funds | 15 |
Mid Cap Growth Fund
Portfolio of Investments, June 30, 2019(all dollar amounts in thousands) (unaudited)
| | | | | | | | |
| | | | | | | | |
| | Issuer | | Shares | | | Value | |
| | | | | | | | | | |
| | Common Stocks | | | | | | | | |
| | Information Technology—27.1% | | | | | | | | |
| * | Advanced Micro Devices, Inc. | | | 40,575 | | | $ | 1,232 | |
| * | Arista Networks, Inc. | | | 2,860 | | | | 742 | |
| * | Autodesk, Inc. | | | 9,900 | | | | 1,613 | |
| | Booz Allen Hamilton Holding Corporation | | | 19,084 | | | | 1,264 | |
| | Dolby Laboratories, Inc. | | | 19,885 | | | | 1,285 | |
| * | EPAM Systems, Inc. | | | 4,945 | | | | 856 | |
| | Global Payments, Inc. | | | 11,100 | | | | 1,777 | |
| * | GoDaddy, Inc. | | | 17,745 | | | | 1,245 | |
| * | Guidewire Software, Inc. | | | 6,863 | | | | 696 | |
| | j2 Global, Inc. | | | 7,265 | | | | 646 | |
| | MAXIMUS, Inc. | | | 11,705 | | | | 849 | |
| | Microchip Technology, Inc. | | | 15,980 | | | | 1,385 | |
| * | Pure Storage, Inc. | | | 58,910 | | | | 900 | |
| | Sabre Corporation | | | 63,008 | | | | 1,399 | |
| * | WEX, Inc. | | | 8,570 | | | | 1,783 | |
| * | Worldpay, Inc. Class “A” | | | 7,694 | | | | 943 | |
| | | | | | | | | 18,615 | |
| | Industrials—18.4% | | | | | | | | |
| | BWX Technologies, Inc. | | | 39,044 | | | | 2,034 | |
| * | Copart, Inc. | | | 28,200 | | | | 2,108 | |
| * | CoStar Group, Inc. | | | 3,709 | | | | 2,055 | |
| | Equifax, Inc. | | | 9,785 | | | | 1,323 | |
| | Fortive Corporation | | | 16,125 | | | | 1,314 | |
| * | The Middleby Corporation | | | 10,250 | | | | 1,391 | |
| | Verisk Analytics, Inc. | | | 3,500 | | | | 513 | |
| | Waste Connections, Inc.† | | | 11,585 | | | | 1,107 | |
| | Xylem, Inc. | | | 9,800 | | | | 820 | |
| | | | | | | | | 12,665 | |
| | Consumer Discretionary—15.5% | | | | | | | | |
| | Advance Auto Parts, Inc. | | | 8,470 | | | | 1,305 | |
| | Aptiv plc† | | | 7,965 | | | | 644 | |
| * | Burlington Stores, Inc. | | | 9,655 | | | | 1,643 | |
| * | CarMax, Inc. | | | 10,575 | | | | 918 | |
| | Domino’s Pizza, Inc. | | | 2,080 | | | | 579 | |
| | Ross Stores, Inc. | | | 11,410 | | | | 1,131 | |
| | Service Corporation International | | | 20,200 | | | | 945 | |
| * | Ulta Salon Cosmetics & Fragrance, Inc. | | | 4,235 | | | | 1,469 | |
| | Vail Resorts, Inc. | | | 6,035 | | | | 1,347 | |
| * | Wayfair, Inc. | | | 4,395 | | | | 642 | |
| | | | | | | | | 10,623 | |
| | Health Care—14.6% | | | | | | | | |
| * | ABIOMED, Inc. | | | 3,600 | | | | 938 | |
| | Agilent Technologies, Inc. | | | 15,410 | | | | 1,151 | |
| * | Align Technology, Inc. | | | 3,010 | | | | 824 | |
| * | Centene Corporation | | | 21,826 | | | | 1,144 | |
| * | DexCom, Inc. | | | 2,805 | | | | 420 | |
| | Encompass Health Corporation | | | 18,385 | | | | 1,165 | |
| * | IDEXX Laboratories, Inc. | | | 2,890 | | | | 796 | |
| * | Mettler-Toledo International, Inc. | | | 1,405 | | | | 1,180 | |
| | Teleflex, Inc. | | | 4,335 | | | | 1,435 | |
| * | Veeva Systems, Inc. Class “A” | | | 5,941 | | | | 963 | |
| | | | | | | | | 10,016 | |
| | Issuer | | Shares or
Principal
Amount | | | Value | |
| | | | | | | | | | |
| | Common Stocks—(continued) | | | | | | | | |
| | Financials—7.9% | | | | | | | | |
| | Arthur J Gallagher & Co. | | | 19,130 | | | $ | 1,675 | |
| | Cboe Global Markets, Inc. | | | 13,005 | | | | 1,348 | |
| | East West Bancorp, Inc. | | | 21,450 | | | | 1,003 | |
| | Signature Bank | | | 4,980 | | | | 602 | |
| * | SVB Financial Group | | | 3,625 | | | | 814 | |
| | | | | | | | | 5,442 | |
| | Materials—7.1% | | | | | | | | |
| | Ball Corporation | | | 33,950 | | | | 2,376 | |
| | Celanese Corporation | | | 6,920 | | | | 746 | |
| | Vulcan Materials Co. | | | 12,715 | | | | 1,746 | |
| | | | | | | | | 4,868 | |
| | Communication Services—3.4% | | | | | | | | |
| * | Live Nation Entertainment, Inc. | | | 15,910 | | | | 1,054 | |
| * | Take-Two Interactive Software, Inc. | | | 11,520 | | | | 1,308 | |
| | | | | | | | | 2,362 | |
| | Consumer Staples—3.2% | | | | | | | | |
| | Conagra Brands, Inc. | | | 32,000 | | | | 849 | |
| | Lamb Weston Holdings, Inc. | | | 20,835 | | | | 1,320 | |
| | | | | | | | | 2,169 | |
| | Real Estate—1.4% | | | | | | | | |
| * | SBA Communications Corporation | | | 4,260 | | | | 958 | |
| | Energy—0.9% | | | | | | | | |
| * | Parsley Energy, Inc. | | | 34,380 | | | | 654 | |
| | Total Common Stocks—99.5%
(cost $55,237) | | | | | | | 68,372 | |
| | | | | | | | | | |
| | Repurchase Agreement | | | | | | | | |
| | Fixed Income Clearing Corporation, 0.500% dated 6/28/19, due 7/1/19, repurchase price $925, collateralized by U.S. Treasury Note, 1.500%, due 8/15/26 | | | $925 | | | | 925 | |
| | Total Repurchase Agreement—1.3%
(cost $925) | | | | | | | 925 | |
| | Total Investments—100.8%
(cost $56,162) | | | | | | | 69,297 | |
| | Liabilities, plus cash and other assets—(0.8)% | | | | | | | (550 | ) |
| | Net assets—100.0% | | | | | | $ | 68,747 | |
* = Non-income producing security
† = U.S. listed foreign security
See accompanying Notes to Financial Statements.
| 16 | Semiannual Report | June 30, 2019 |
| | Small-Mid Cap Growth Fund |
| | |
| | The Small-Mid Cap Growth Fund seeks long-term capital appreciation. |
| | |
| | AN OVERVIEW FROM THE PORTFOLIO MANAGERS |
| | |

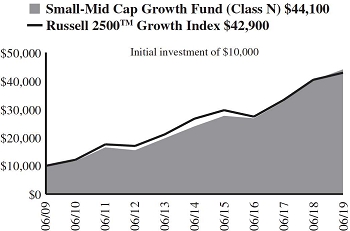
Daniel Crowe  Robert C. Lanphier, IV | The William Blair Small-Mid Cap Growth Fund (Class N shares) posted a 24.27% increase, net of fees, for the six months ended June 30, 2019. By comparison, the Fund’s benchmark index, the Russell 2500TMGrowth Index (the “Index”), increased 23.92%. The Fund outperformed for the year-to-date period as stock selection and a tailwind for our investment style contributed to excess returns. From a stock selection perspective, selection in the Industrials and Health Care sectors was positive, helped by positions in CoStar Group, Inc. (Industrials), Copart, Inc. (Industrials) and Catalent, Inc. (Health Care). Real estate information services company CoStar Group advanced on business trends that were consistent with our investment thesis, including strong growth in its commercial real estate business and continued share gains in its apartment rental advertising business. Outperformance from Information Technology holdings Euronet Worldwide, Inc. and Rogers Corporation also added to relative returns. Shares of Euronet Worldwide, an electronic payment and transaction processing solutions company, advanced as all three business segments performed well and the company disclosed details about a new cloud-based payments platform which could add to growth over the long term. From a style perspective, our typical larger market cap bias provided a tailwind as the larger cap stocks within our small-mid cap universe outperformed the smaller cap stocks. This year-to-date style dynamic was strongest during the second quarter. Top detractors from performance during the period included Inogen, Inc. (Health Care), Healthcare Services Group, Inc. (Industrials), Pure Storage, Inc. (Information Technology) and Lamb Weston Holdings, Inc. (Consumer Staples). Shares of Inogen, a manufacturer of portable oxygen concentrators, underperformed on a decline in sales growth that resulted from the combination of lower sales productivity and a large customer that was restructuring. In addition, our Consumer Discretionary holdings lagged those of the benchmark. Notable among them was Adtalem Global Education, Inc., which underperformed due to lowered earnings expectations for its Brazil programs and escalating rhetoric around free education ahead of the forthcoming U.S. presidential primaries. Please refer to the U.S. Growth Market Review and Outlook relating to the Fund on page 6 for additional information. |
| June 30, 2019 | William Blair Funds | 17 |
Small-Mid Cap Growth Fund
Performance Highlights (Unaudited)
| Average Annual Total Return through 6/30/2019 |
| | | Year
to Date | | 1 Year | | 3 Year | | 5 Year | | 10 Year | | Since
Inception(a) |
| Class N | | | 24.27 | % | | | 9.65 | % | | | 18.07 | % | | | 12.99 | % | | | 15.99 | % | | | — | |
| Class I | | | 24.46 | | | | 9.91 | | | | 18.37 | | | | 13.29 | | | | 16.28 | | | | — | |
| Class R6 | | | — | | | | — | | | | — | | | | — | | | | — | | | | 2.91 | % |
| Russell 2500TM Growth Index | | | 23.92 | | | | 6.13 | | | | 16.14 | | | | 9.98 | | | | 15.67 | | | | 1.81 | |
| (a) | Since inception is for the period from May 2, 2019 (Commencement of Operations) to June 30, 2019. |
Performance cited represents past performance. Past performance does not guarantee future results and current performance may be lower or higher than the data quoted. Results shown are average annual total returns, which assume reinvestment of dividends and capital gains. Investment returns and principal will fluctuate and you may have a gain or loss when you sell shares. For the most current month-end performance information, please call 1-800-742-7272, or visit our Web site atwww.williamblairfunds.com. Investing in smaller and medium capitalization companies involves special risks, including higher volatility and lower liquidity. Smaller and medium capitalization stocks are also more sensitive to purchase/sale transactions and changes in the issuer’s financial condition. From time to time, the investment adviser may waive fees or reimburse expenses for the Fund. Without these waivers/reimbursements, performance would be lower. Class N shares are not subject to a sales load. Class I shares are not subject to a sales load or distribution (Rule 12b-1) fees. Class R6 shares are not subject to a sales load, distribution (Rule 12b-1) fees, or sub-transfer agent fees.
The performance highlights and graph presented above do not reflect the deduction of taxes that a shareholder would pay on fund distributions or the redemption of fund shares.
The Russell 2500TMGrowth Index measures the performance of those Russell 2500 companies with above average price-to-book ratios and forecasted growth rates.
This report identifies the Fund’s investments on June 30, 2019. These holdings are subject to change. Not all stocks in the Fund performed the same, nor is there any guarantee that these stocks will perform as well in the future. Market forecasts provided in this report may not necessarily come to pass.
Sector Diversification (Unaudited)
The sector diversification shown is based on the total long-term securities.
| 18 | Semiannual Report | June 30, 2019 |
Small-Mid Cap Growth Fund
Portfolio of Investments, June 30, 2019(all dollar amounts in thousands) (unaudited)
| | | | | | | | |
| | | | | | | | |
| | Issuer | | Shares | | | Value | |
| | | | | | | | |
| | Common Stocks | | | | | | | | |
| | Industrials—22.5% | | | | | | | | |
| | BWX Technologies, Inc. | | | 1,558,221 | | | $ | 81,183 | |
| * | Copart, Inc. | | | 1,150,220 | | | | 85,967 | |
| * | CoStar Group, Inc. | | | 77,938 | | | | 43,182 | |
| * | Genesee & Wyoming, Inc. | | | 350,736 | | | | 35,074 | |
| | Healthcare Services Group, Inc. | | | 934,721 | | | | 28,341 | |
| | HEICO Corporation | | | 428,457 | | | | 44,290 | |
| | Ritchie Bros Auctioneers, Inc.† | | | 806,250 | | | | 26,784 | |
| * | SiteOne Landscape Supply, Inc. | | | 323,681 | | | | 22,431 | |
| * | Teledyne Technologies, Inc. | | | 208,751 | | | | 57,171 | |
| | The Brink’s Co. | | | 345,000 | | | | 28,007 | |
| * | The Middleby Corporation | | | 346,137 | | | | 46,971 | |
| | The Toro Co. | | | 178,063 | | | | 11,912 | |
| | TransUnion | | | 850,076 | | | | 62,489 | |
| * | Trex Co., Inc. | | | 908,763 | | | | 65,158 | |
| | | | | | | | | 638,960 | |
| | Information Technology—22.1% | | | | | | | | |
| * | Aspen Technology, Inc. | | | 430,563 | | | | 53,510 | |
| * | Avalara, Inc. | | | 474,308 | | | | 34,245 | |
| | Booz Allen Hamilton Holding Corporation | | | 799,236 | | | | 52,917 | |
| * | Euronet Worldwide, Inc. | | | 545,604 | | | | 91,793 | |
| * | GoDaddy, Inc. | | | 554,737 | | | | 38,915 | |
| * | Guidewire Software, Inc. | | | 274,787 | | | | 27,858 | |
| | j2 Global, Inc. | | | 312,415 | | | | 27,771 | |
| * | MaxLinear, Inc. | | | 581,160 | | | | 13,622 | |
| | National Instruments Corporation | | | 590,876 | | | | 24,811 | |
| * | Nice, Ltd.-ADR | | | 323,640 | | | | 44,339 | |
| * | Novanta, Inc.† | | | 242,277 | | | | 22,847 | |
| * | Pure Storage, Inc. | | | 2,801,019 | | | | 42,772 | |
| * | Qualys, Inc. | | | 309,122 | | | | 26,918 | |
| * | Rogers Corporation | | | 286,419 | | | | 49,430 | |
| | Sabre Corporation | | | 1,621,125 | | | | 35,989 | |
| * | WEX, Inc. | | | 193,803 | | | | 40,330 | |
| | | | | | | | | 628,067 | |
| | Health Care—21.4% | | | | | | | | |
| * | ABIOMED, Inc. | | | 157,000 | | | | 40,897 | |
| * | Amedisys, Inc. | | | 238,400 | | | | 28,944 | |
| * | Cambrex Corporation | | | 589,830 | | | | 27,610 | |
| * | Catalent, Inc. | | | 563,959 | | | | 30,572 | |
| * | DexCom, Inc. | | | 116,498 | | | | 17,456 | |
| | Encompass Health Corporation | | | 828,504 | | | | 52,494 | |
| * | Exact Sciences Corporation | | | 271,368 | | | | 32,032 | |
| * | Glaukos Corporation | | | 593,968 | | | | 44,785 | |
| * | Halozyme Therapeutics, Inc. | | | 865,956 | | | | 14,877 | |
| * | Horizon Therapeutics plc† | | | 1,574,146 | | | | 37,874 | |
| * | Inspire Medical Systems, Inc. | | | 257,454 | | | | 15,615 | |
| * | Insulet Corporation | | | 638,567 | | | | 76,232 | |
| * | Ligand Pharmaceuticals, Inc. | | | 208,886 | | | | 23,844 | |
| * | Penumbra, Inc. | | | 259,356 | | | | 41,497 | |
| * | Portola Pharmaceuticals, Inc. | | | 1,117,940 | | | | 30,330 | |
| * | STERIS plc† | | | 275,844 | | | | 41,068 | |
| | Teleflex, Inc. | | | 155,548 | | | | 51,510 | |
| | | | | | | | | 607,637 | |
| | Issuer | | Shares or
Principal
Amount | | | Value | |
| | | | | | | | |
| | Common Stocks—(continued) | | | | | | | | |
| | Consumer Discretionary—10.3% | | | | | | | | |
| * | Adtalem Global Education, Inc. | | | 1,063,747 | | | $ | 47,922 | |
| * | Burlington Stores, Inc. | | | 419,546 | | | | 71,386 | |
| | Domino’s Pizza, Inc. | | | 138,204 | | | | 38,459 | |
| * | Grand Canyon Education, Inc. | | | 565,020 | | | | 66,119 | |
| | Vail Resorts, Inc. | | | 192,788 | | | | 43,026 | |
| * | Wayfair, Inc. | | | 182,675 | | | | 26,671 | |
| | | | | | | | | 293,583 | |
| | Financials—8.3% | | | | | | | | |
| | BrightSphere Investment Group plc† | | | 1,012,271 | | | | 11,550 | |
| | Cboe Global Markets, Inc. | | | 592,080 | | | | 61,357 | |
| | East West Bancorp, Inc. | | | 885,718 | | | | 41,425 | |
| * | Encore Capital Group, Inc. | | | 689,276 | | | | 23,346 | |
| | FirstCash, Inc. | | | 455,138 | | | | 45,523 | |
| | Signature Bank | | | 207,400 | | | | 25,062 | |
| | Virtu Financial, Inc. | | | 1,260,564 | | | | 27,455 | |
| | | | | | | | | 235,718 | |
| | Materials—3.9% | | | | | | | | |
| * | Axalta Coating Systems, Ltd.† | | | 794,580 | | | | 23,655 | |
| * | Crown Holdings, Inc. | | | 390,536 | | | | 23,862 | |
| | Martin Marietta Materials, Inc. | | | 274,280 | | | | 63,114 | |
| | | | | | | | | 110,631 | |
| | Communication Services—3.3% | | | | | | | | |
| | Cable One, Inc. | | | 29,958 | | | | 35,080 | |
| * | Live Nation Entertainment, Inc. | | | 877,916 | | | | 58,162 | |
| | | | | | | | | 93,242 | |
| | Consumer Staples—3.1% | | | | | | | | |
| * | BJ’s Wholesale Club Holdings, Inc. | | | 1,335,347 | | | | 35,253 | |
| | Lamb Weston Holdings, Inc. | | | 809,146 | | | | 51,268 | |
| | | | | | | | | 86,521 | |
| | Real Estate—2.4% | | | | | | | | |
| | Colliers International Group, Inc.† | | | 224,479 | | | | 16,077 | |
| | FirstService Corporation† | | | 338,448 | | | | 32,464 | |
| | Jones Lang LaSalle, Inc. | | | 134,588 | | | | 18,935 | |
| | | | | | | | | 67,476 | |
| | Energy—0.6% | | | | | | | | |
| * | Parsley Energy, Inc. | | | 863,444 | | | | 16,414 | |
| | Total Common Stocks—97.9%
(cost $2,306,990) | | | | | | | 2,778,249 | |
| | | | | | | | | | |
| | Repurchase Agreement | | | | | | | | |
| | Fixed Income Clearing Corporation, 0.500% dated 6/28/19, due 7/1/19, repurchase price $58,029, collateralized by U.S. Treasury Note, 1.500%, due 8/15/26 | | | $58,026 | | | | 58,026 | |
| | Total Repurchase Agreement—2.0%
(cost $58,026) | | | | | | | 58,026 | |
| | Total Investments—99.9%
(cost $2,365,016) | | | | | | | 2,836,275 | |
| | Cash and other assets, less liabilities—0.1% | | | | | | | 3,086 | |
| | Net assets—100.0% | | | | | | $ | 2,839,361 | |
ADR = American Depository Receipt
* = Non-income producing security
† = U.S. listed foreign security
See accompanying Notes to Financial Statements.
| June 30, 2019 | William Blair Funds | 19 |
| | Small-Mid Cap Value Fund |
| | |
| | The Small-Mid Cap Value Fund seeks long-term capital appreciation. |
| | |
| | AN OVERVIEW FROM THE PORTFOLIO MANAGERS |
| | |

Chad M. Kilmer 
Mark T. Leslie 
David S. Mitchell | The William Blair Small-Mid Cap Value Fund (Class N shares) posted a 16.67% increase, net of fees, for the six months ended June 30, 2019. By comparison, the Fund’s benchmark index, the Russell 2500TMValue Index (the “Index”), increased 15.26%. The Fund’s outperformance relative to the Index was due to the combination of stock selection and style tailwinds given the strategy’s higher growth profile and lack of exposure to deeper value stocks. At the sector level, the most significant contributor to the Fund’s relative performance was Industrials due to strong stock selection within Road & Rail, Machinery, and Building Products. Within Information Technology, the best performing sector of the market during the period, the Fund’s relative performance was primarily the result of strong stock selection within Software. Strong stock selection within Banks and Diversified Financial Services contributed to the relative returns within Financials. Consumer Discretionary was the most significant detractor from the Fund’s relative returns due to stock selection within Diversified Consumer Services and Hotels, Restaurants & Leisure. The relative underperformance within Energy was the result of stock selection within Oil & Gas Exploration & Production. The Fund’s relative performance within Consumer Staples, the worst performing sector of the market during the period, was driven by stock selection within Packaged Food & Meats. Looking specifically at stock selection, the Fund’s largest contributors to relative performance were Gardner Denver Holdings, Inc. (Industrials), Booz Allen Hamilton Holding Corporation (Information Technology), and TopBuild Corporation (Consumer Discretionary). Offsetting these contributors were our investments in Whiting Petroleum Corporation (Energy), Lamb Weston Holdings, Inc. (Consumer Staples), and Range Resources Corporation (Energy). Please refer to the U.S. Value Market Review and Outlook relating to the Fund on page 7 for additional information. |
| 20 | Semiannual Report | June 30, 2019 |
Small-Mid Cap Value Fund
Performance Highlights (Unaudited)
| Average Annual Total Return through 6/30/2019 |
| | | Year
to Date | | 1 Year | | 3 Year | | 5 Year | | Since
Inception |
| Class N(a) | | | 16.67 | % | | | (2.03 | )% | | | 7.18 | % | | | 5.04 | % | | | 10.42 | % |
| Class I(a) | | | 16.79 | | | | (1.73 | ) | | | 7.45 | | | | 5.32 | | | | 10.72 | |
| Russell 2500TMValue Index(a) | | | 15.26 | | | | (1.92 | ) | | | 8.98 | | | | 5.55 | | | | 11.93 | |
| Class R6(b) | | | — | | | | — | | | | — | | | | — | | | | (1.28 | ) |
| Russell 2500TMValue Index(b) | | | — | | | | — | | | | — | | | | — | | | | (0.73 | ) |
| | |
| (a) | Since inception is for the period from December 15, 2011 (Commencement of Operations) to June 30, 2019. |
| (b) | Since inception is for the period from May 2, 2019 (Commencement of Operations) to June 30, 2019. |
Performance cited represents past performance. Past performance does not guarantee future results and current performance may be lower or higher than the data quoted. Results shown are average annual total returns, which assume reinvestment of dividends and capital gains. Investment returns and principal will fluctuate and you may have a gain or loss when you sell shares. For the most current month-end performance information, please call 1-800-742-7272, or visit our Web site atwww.williamblairfunds.com. Investing in smaller and medium capitalization companies involves special risks, including higher volatility and lower liquidity. Smaller and medium capitalization stocks are also more sensitive to purchase/sale transactions and changes in the issuer’s financial condition. From time to time, the investment adviser may waive fees or reimburse expenses for the Fund. Without these waivers/reimbursements, performance would be lower. Class N shares are not subject to a sales load. Class I shares are not subject to a sales load or distribution (Rule 12b-1) fees. Class R6 shares are not subject to a sales load, distribution (Rule 12b-1) fees, or sub-transfer agent fees.
The performance highlights and graph presented above do not reflect the deduction of taxes that a shareholder would pay on fund distributions or the redemption of fund shares.
The Russell 2500TMValue Index consists of small to mid-capitalization companies with below average price-to-book ratios and forecasted growth rates.
This report identifies the Fund’s investments on June 30, 2019. These holdings are subject to change. Not all stocks in the Fund performed the same, nor is there any guarantee that these stocks will perform as well in the future. Market forecasts provided in this report may not necessarily come to pass.
Sector Diversification (Unaudited)

The sector diversification shown is based on the total long-term securities.
| June 30, 2019 | William Blair Funds | 21 |
Small-Mid Cap Value Fund
Portfolio of Investments, June 30, 2019(all dollar amounts in thousands) (unaudited)
| | | | | | | | |
| | | | | | | | |
| | Issuer | | Shares | | | Value | |
| | | | | | | | | | |
| | Common Stocks | | | | | | | | |
| | Financials—22.4% | | | | | | | | |
| | American Financial Group, Inc. | | | 185 | | | $ | 19 | |
| | CNO Financial Group, Inc. | | | 865 | | | | 14 | |
| | E*TRADE Financial Corporation | | | 308 | | | | 14 | |
| | East West Bancorp, Inc. | | | 394 | | | | 18 | |
| | First American Financial Corporation | | | 275 | | | | 15 | |
| | FNB Corporation | | | 1,594 | | | | 19 | |
| | Hancock Whitney Corporation | | | 416 | | | | 17 | |
| | Hanover Insurance Group, Inc. | | | 174 | | | | 22 | |
| | Home BancShares, Inc. | | | 993 | | | | 19 | |
| | Iberiabank Corporation | | | 283 | | | | 22 | |
| | National Bank Holdings Corporation | | | 499 | | | | 18 | |
| | PacWest Bancorp | | | 756 | | | | 29 | |
| | Radian Group, Inc. | | | 948 | | | | 22 | |
| | Selective Insurance Group, Inc. | | | 326 | | | | 24 | |
| | Sterling Bancorp | | | 1,060 | | | | 23 | |
| * | SVB Financial Group | | | 80 | | | | 18 | |
| | Umpqua Holdings Corporation | | | 815 | | | | 14 | |
| | Voya Financial, Inc. | | | 496 | | | | 27 | |
| * | Western Alliance Bancorp | | | 390 | | | | 17 | |
| | WSFS Financial Corporation | | | 416 | | | | 17 | |
| | | | | | | | | 388 | |
| | Real Estate—14.6% | | | | | | | | |
| | Acadia Realty Trust | | | 769 | | | | 21 | |
| | American Assets Trust, Inc. | | | 379 | | | | 18 | |
| | American Campus Communities, Inc. | | | 603 | | | | 28 | |
| | Americold Realty Trust | | | 709 | | | | 23 | |
| | Camden Property Trust | | | 247 | | | | 26 | |
| | Douglas Emmett, Inc. | | | 588 | | | | 23 | |
| | EPR Properties | | | 300 | | | | 22 | |
| | Equity LifeStyle Properties, Inc. | | | 179 | | | | 22 | |
| | Healthcare Realty Trust, Inc. | | | 884 | | | | 28 | |
| | Pebblebrook Hotel Trust | | | 652 | | | | 18 | |
| | Terreno Realty Corporation | | | 484 | | | | 24 | |
| | | | | | | | | 253 | |
| | Industrials—13.3% | | | | | | | | |
| | Acuity Brands, Inc. | | | 170 | | | | 24 | |
| | AGCO Corporation | | | 287 | | | | 22 | |
| | Brady Corporation | | | 461 | | | | 23 | |
| | Curtiss-Wright Corporation | | | 204 | | | | 26 | |
| | Fortune Brands Home & Security, Inc. | | | 455 | | | | 26 | |
| * | Gardner Denver Holdings, Inc. | | | 645 | | | | 22 | |
| | Jacobs Engineering Group, Inc. | | | 300 | | | | 25 | |
| | Kansas City Southern | | | 177 | | | | 22 | |
| | Simpson Manufacturing Co., Inc. | | | 262 | | | | 17 | |
| | Watsco, Inc. | | | 143 | | | | 23 | |
| | | | | | | | | 230 | |
| | Consumer Discretionary—10.4% | | | | | | | | |
| * | Adtalem Global Education, Inc. | | | 490 | | | | 22 | |
| | Carter’s, Inc. | | | 238 | | | | 23 | |
| * | Cavco Industries, Inc. | | | 115 | | | | 18 | |
| | Dana, Inc. | | | 951 | | | | 19 | |
| | | | | | | | |
| | | | | | | | |
| | Issuer | | Shares | | | Value | |
| | | | | | | | | | |
| | Common Stocks—(continued) | | | | | | | | |
| | Consumer Discretionary—(continued) | | | | | | | | |
| | Dick’s Sporting Goods, Inc. | | | 543 | | | $ | 19 | |
| | Foot Locker, Inc. | | | 525 | | | | 22 | |
| * | Grand Canyon Education, Inc. | | | 179 | | | | 21 | |
| * | TopBuild Corporation | | | 221 | | | | 18 | |
| | Wolverine World Wide, Inc. | | | 640 | | | | 18 | |
| | | | | | | | | 180 | |
| | Information Technology—10.1% | | | | | | | | |
| | Avnet, Inc. | | | 545 | | | | 25 | |
| | Belden, Inc. | | | 321 | | | | 19 | |
| | Booz Allen Hamilton Holding Corporation | | | 450 | | | | 30 | |
| * | Ciena Corporation | | | 337 | | | | 14 | |
| | j2 Global, Inc. | | | 320 | | | | 28 | |
| * | LiveRamp Holdings, Inc. | | | 397 | | | | 19 | |
| | MAXIMUS, Inc. | | | 374 | | | | 27 | |
| * | SolarWinds Corporation | | | 740 | | | | 14 | |
| | | | | | | | | 176 | |
| | Materials—6.3% | | | | | | | | |
| | Carpenter Technology Corporation | | | 441 | | | | 21 | |
| | FMC Corporation | | | 222 | | | | 18 | |
| | Minerals Technologies, Inc. | | | 276 | | | | 15 | |
| | PolyOne Corporation | | | 598 | | | | 19 | |
| | Sensient Technologies Corporation | | | 246 | | | | 18 | |
| | Steel Dynamics, Inc. | | | 579 | | | | 18 | |
| | | | | | | | | 109 | |
| | Utilities—5.7% | | | | | | | | |
| | Alliant Energy Corporation | | | 453 | | | | 22 | |
| | Atmos Energy Corporation | | | 243 | | | | 26 | |
| | Black Hills Corporation | | | 177 | | | | 14 | |
| | IDACORP, Inc. | | | 194 | | | | 20 | |
| | ONE Gas, Inc. | | | 202 | | | | 18 | |
| | | | | | | | | 100 | |
| | Energy—5.1% | | | | | | | | |
| | Murphy Oil Corporation | | | 660 | | | | 16 | |
| | Patterson-UTI Energy, Inc. | | | 1,896 | | | | 22 | |
| | Range Resources Corporation | | | 1,486 | | | | 11 | |
| | Targa Resources Corporation | | | 564 | | | | 22 | |
| * | WPX Energy, Inc. | | | 1,592 | | | | 18 | |
| | | | | | | | | 89 | |
| | Health Care—5.1% | | | | | | | | |
| | CONMED Corporation | | | 171 | | | | 15 | |
| | Encompass Health Corporation | | | 347 | | | | 22 | |
| * | Hologic, Inc. | | | 520 | | | | 25 | |
| | PerkinElmer, Inc. | | | 275 | | | | 26 | |
| | | | | | | | | 88 | |
| | Consumer Staples—3.1% | | | | | | | | |
| | Ingredion, Inc. | | | 164 | | | | 13 | |
| | J&J Snack Foods Corporation | | | 109 | | | | 18 | |
| | Lamb Weston Holdings, Inc. | | | 363 | | | | 23 | |
| | | | | | | | | 54 | |
See accompanying Notes to Financial Statements.
| 22 | Semiannual Report | June 30, 2019 |
Small-Mid Cap Value Fund
Portfolio of Investments, June 30, 2019(all dollar amounts in thousands) (unaudited)
| | | | | | | | |
| | | | | | | | |
| | Issuer | | Shares | | | Value | |
| | | | | | | | | | |
| | Common Stocks—(continued) | | | | | | | | |
| | Communication Services—2.9% | | | | | | | | |
| | Cinemark Holdings, Inc. | | | 531 | | | $ | 19 | |
| | Meredith Corporation | | | 230 | | | | 13 | |
| | The Interpublic Group of Cos., Inc. | | | 815 | | | | 18 | |
| | | | | | | | | 50 | |
| | Total Common Stocks—99.0%
(cost $1,514) | | | | | | | 1,717 | |
| | Total Investments—99.0%
(cost $1,514) | | | | | | | 1,717 | |
| | Cash and other assets, less liabilities—1.0% | | | | | | | 17 | |
| | Net assets—100.0% | | | | | | $ | 1,734 | |
* = Non-income producing security
See accompanying Notes to Financial Statements.
| June 30, 2019 | William Blair Funds | 23 |
| | Small Cap Growth Fund |
| | |
| | The Small Cap Growth Fund seeks long-term capital appreciation. |
| | |
| | AN OVERVIEW FROM THE PORTFOLIO MANAGERS |
| | |

Michael P. Balkin 
Ward D. Sexton | The William Blair Small Cap Growth Fund (Class N shares) posted an 18.98% increase, net of fees, for the six months ended June 30, 2019. By comparison, the Fund’s benchmark index, the Russell 2000®Growth Index (the “Index”), increased 20.36%. For the year-to-date period, relative underperformance versus the Index was attributable to both stock specific and style dynamics. From a style perspective, and given the Fund’s sensitivity to the valuation of the stocks held, our typical underweight to the most expensive stocks in the benchmark, including within the Biotechnology sector, was a headwind as these groups generally outperformed. From a stock specific perspective, top detractors from the Fund’s relative returns were At Home Group, Inc. (Consumer Discretionary) and Healthcare Services Group, Inc. (Industrials). Shares of home furnishings retailer At Home Group declined on lower-than-expected same store sales growth and a reduced growth outlook. Healthcare Services Group provides outsourced housekeeping, facility maintenance and food services to nursing homes and other care facilities. The stock’s underperformance was most notable during the first quarter, as the company reported revenue that disappointed investors and was primarily attributable to a contract change with one of its food service customers that would dampen revenue, but ultimately lift margins. Other notable underperformers included Inogen, Inc. (Health Care), 2U, Inc. (Information Technology) and Virtu Financial, Inc. (Financials). Conversely, top contributors to performance for the period were Boot Barn Holdings, Inc. (Consumer Discretionary) and Euronet Worldwide, Inc. (Information Technology). Western and work wear retailer Boot Barn outperformed as strong execution against internal initiatives, including the company’s opportunity in private label sales, drove shares higher. Shares of Euronet Worldwide, an electronic payment and transaction processing solutions company, advanced as all three business segments performed well and the company disclosed details about a new cloud-based payments platform which could add to growth over the long term. Other standout performers were Catalent, Inc. (Health Care), Armstrong World Industries, Inc. (Industrials) and OneSpaWorld Holdings, Ltd. (Consumer Discretionary). Please refer to the U.S. Growth Market Review and Outlook relating to the Fund on page 6 for additional information. |
| 24 | Semiannual Report | June 30, 2019 |
Small Cap Growth Fund
Performance Highlights (Unaudited)
| Average Annual Total Return through 6/30/2019 |
| | | Year
to Date | | 1 Year | | 3 Year | | 5 Year | | 10 Year | | Since
Inception(a) |
| Class N | | | 18.98 | | | | 0.89 | | | | 19.06 | | | | 11.20 | | | | 14.31 | | | | — | |
| Class I | | | 19.12 | | | | 1.14 | | | | 19.36 | | | | 11.48 | | | | 14.61 | | | | — | |
| Class R6 | | | — | | | | — | | | | — | | | | — | | | | — | | | | (0.13 | )% |
| Russell 2000® Growth Index | | | 20.36 | | | | (0.49 | ) | | | 14.69 | | | | 8.63 | | | | 14.41 | | | | 0.77 | |
| (a) | Since inception is for the period from May 2, 2019 (Commencement of Operations) to June 30, 2019. |
Performance cited represents past performance. Past performance does not guarantee future results and current performance may be lower or higher than the data quoted. Results shown are average annual total returns, which assume reinvestment of dividends and capital gains. Investment returns and principal will fluctuate and you may have a gain or loss when you sell shares. For the most current month-end performance information, please call 1-800-742-7272, or visit our Web site atwww.williamblairfunds.com. Investing in smaller companies involves special risks, including higher volatility and lower liquidity. Smaller capitalization stocks are also more sensitive to purchase/sale transactions and changes in the issuer’s financial condition. From time to time, the investment adviser may waive fees or reimburse expenses for the Fund. Without these waivers/reimbursements, performance would be lower. Class N shares are not subject to a sales load. Class I shares are not subject to a sales load or distribution (Rule 12b-1) fees. Class R6 shares are not subject to a sales load, distribution (Rule 12b-1) fees, or sub-transfer agent fees.
The performance highlights and graph presented above do not reflect the deduction of taxes that a shareholder would pay on fund distributions or the redemption of fund shares.
The Russell 2000®Growth Index is an unmanaged composite of the smallest 2000 stocks of the Russell 3000®Growth Index.
This report identifies the Fund’s investments on June 30, 2019. These holdings are subject to change. Not all stocks in the Fund performed the same, nor is there any guarantee that these stocks will perform as well in the future. Market forecasts provided in this report may not necessarily come to pass.
Sector Diversification (Unaudited)

The sector diversification shown is based on the total long-term securities.
| June 30, 2019 | William Blair Funds | 25 |
Small Cap Growth Fund
Portfolio of Investments, June 30, 2019(all dollar amounts in thousands) (unaudited)
| | | | | | | | |
| | | | | | | | |
| | Issuer | | Shares | | | Value | |
| | | | | | | | | | |
| | Common Stocks | | | | | | | | |
| | Industrials—24.5% | | | | | | | | |
| | Albany International Corporation | | | 116,685 | | | $ | 9,674 | |
| | Argan, Inc. | | | 211,130 | | | | 8,563 | |
| | Armstrong World Industries, Inc. | | | 89,753 | | | | 8,724 | |
| * | Blue Bird Corporation | | | 562,140 | | | | 11,069 | |
| | BWX Technologies, Inc. | | | 267,589 | | | | 13,941 | |
| * | Casella Waste Systems, Inc. | | | 277,170 | | | | 10,984 | |
| | Douglas Dynamics, Inc. | | | 237,817 | | | | 9,463 | |
| | ESCO Technologies, Inc. | | | 89,306 | | | | 7,378 | |
| * | Genesee & Wyoming, Inc. | | | 87,937 | | | | 8,794 | |
| | Healthcare Services Group, Inc. | | | 270,767 | | | | 8,210 | |
| | John Bean Technologies Corporation | | | 80,760 | | | | 9,782 | |
| | Luxfer Holdings plc† | | | 473,515 | | | | 11,611 | |
| * | Mercury Systems, Inc. | | | 143,236 | | | | 10,077 | |
| | Ritchie Bros Auctioneers, Inc.† | | | 286,755 | | | | 9,526 | |
| * | SiteOne Landscape Supply, Inc. | | | 82,468 | | | | 5,715 | |
| | The Brink’s Co. | | | 179,990 | | | | 14,612 | |
| * | Trex Co., Inc. | | | 140,980 | | | | 10,108 | |
| * | Willdan Group, Inc. | | | 138,894 | | | | 5,174 | |
| | | | | | | | | 173,405 | |
| | Health Care—21.5% | | | | | | | | |
| * | Amedisys, Inc. | | | 68,780 | | | | 8,350 | |
| * | AxoGen, Inc. | | | 266,270 | | | | 5,272 | |
| * | Cambrex Corporation | | | 223,583 | | | | 10,466 | |
| * | CareDx, Inc. | | | 145,530 | | | | 5,238 | |
| * | Catalent, Inc. | | | 171,438 | | | | 9,294 | |
| * | Codexis, Inc. | | | 353,481 | | | | 6,515 | |
| * | CryoLife, Inc. | | | 291,032 | | | | 8,710 | |
| | Encompass Health Corporation | | | 130,917 | | | | 8,295 | |
| * | Glaukos Corporation | | | 143,543 | | | | 10,823 | |
| * | Halozyme Therapeutics, Inc. | | | 221,050 | | | | 3,798 | |
| * | Hanger, Inc. | | | 463,560 | | | | 8,877 | |
| * | Horizon Therapeutics plc† | | | 453,672 | | | | 10,915 | |
| * | Inspire Medical Systems, Inc. | | | 126,270 | | | | 7,658 | |
| * | LHC Group, Inc. | | | 77,335 | | | | 9,248 | |
| * | Ligand Pharmaceuticals, Inc. | | | 77,179 | | | | 8,810 | |
| * | Penumbra, Inc. | | | 6,423 | | | | 1,028 | |
| * | PolarityTE, Inc. | | | 276,805 | | | | 1,578 | |
| * | Portola Pharmaceuticals, Inc. | | | 357,580 | | | | 9,701 | |
| | Simulations Plus, Inc. | | | 264,780 | | | | 7,562 | |
| * | Veracyte, Inc. | | | 368,880 | | | | 10,517 | |
| | | | | | | | | 152,655 | |
| | Information Technology—18.8% | | | | | | | | |
| * | 2U, Inc. | | | 190,645 | | | | 7,176 | |
| * | Agilysys, Inc. | | | 643,860 | | | | 13,824 | |
| * | Avalara, Inc. | | | 91,808 | | | | 6,629 | |
| * | Euronet Worldwide, Inc. | | | 76,600 | | | | 12,887 | |
| | j2 Global, Inc. | | | 143,992 | | | | 12,799 | |
| | Littelfuse, Inc. | | | 38,323 | | | | 6,780 | |
| * | LivePerson, Inc. | | | 275,117 | | | | 7,714 | |
| * | MaxLinear, Inc. | | | 422,739 | | | | 9,909 | |
| * | Nice, Ltd.-ADR | | | 56,123 | | | | 7,689 | |
| * | Pure Storage, Inc. | | | 506,746 | | | | 7,738 | |
| * | Qualys, Inc. | | | 80,410 | | | | 7,002 | |
| * | Rogers Corporation | | | 50,574 | | | | 8,728 | |
| | | | | | | | |
| | | | | | | | |
| | Issuer | | Shares | | | Value | |
| | | | | | | | | | |
| | Common Stocks—(continued) | | | | | | | | |
| | Information Technology—(continued) | | | | | | | | |
| * | Varonis Systems, Inc. | | | 142,660 | | | $ | 8,836 | |
| * | Verra Mobility Corporation | | | 503,590 | | | | 6,592 | |
| * | WNS Holdings, Ltd.-ADR | | | 153,982 | | | | 9,116 | |
| | | | | | | | | 133,419 | |
| | Consumer Discretionary—12.0% | | | | | | | | |
| * | Adtalem Global Education, Inc. | | | 178,963 | | | | 8,062 | |
| * | Aspen Group, Inc.§ | | | 724,410 | | | | 2,753 | |
| * | Boot Barn Holdings, Inc. | | | 304,385 | | | | 10,848 | |
| | Dine Brands Global, Inc. | | | 71,170 | | | | 6,795 | |
| * | Etsy, Inc. | | | 64,402 | | | | 3,952 | |
| * | Gentherm, Inc. | | | 150,563 | | | | 6,298 | |
| * | Grand Canyon Education, Inc. | | | 100,943 | | | | 11,812 | |
| * | Hilton Grand Vacations, Inc. | | | 89,804 | | | | 2,858 | |
| * | Laureate Education, Inc. | | | 768,823 | | | | 12,078 | |
| | Lithia Motors, Inc. | | | 73,859 | | | | 8,773 | |
| * | OneSpaWorld Holdings, Ltd.† | | | 705,930 | | | | 10,942 | |
| | | | | | | | | 85,171 | |
| | Financials—6.3% | | | | | | | | |
| * | Encore Capital Group, Inc. | | | 297,738 | | | | 10,084 | |
| | FirstCash, Inc. | | | 113,438 | | | | 11,346 | |
| | Glacier Bancorp, Inc. | | | 161,165 | | | | 6,535 | |
| | Home BancShares, Inc. | | | 385,644 | | | | 7,428 | |
| | Virtu Financial, Inc. | | | 420,576 | | | | 9,160 | |
| | | | | | | | | 44,553 | |
| | Communication Services—4.8% | | | | | | | | |
| | Cable One, Inc. | | | 11,630 | | | | 13,619 | |
| * | Cars.com, Inc. | | | 238,508 | | | | 4,703 | |
| * | ORBCOMM, Inc. | | | 967,525 | | | | 7,015 | |
| * | QuinStreet, Inc. | | | 538,660 | | | | 8,538 | |
| | | | | | | | | 33,875 | |
| | Consumer Staples—4.1% | | | | | | | | |
| * | BJ’s Wholesale Club Holdings, Inc. | | | 275,350 | | | | 7,269 | |
| | Calavo Growers, Inc. | | | 83,151 | | | | 8,044 | |
| * | Darling Ingredients, Inc. | | | 342,880 | | | | 6,820 | |
| * | Primo Water Corporation | | | 568,403 | | | | 6,991 | |
| | | | | | | | | 29,124 | |
| | Real Estate—3.4% | | | | | | | | |
| | Colliers International Group, Inc.† | | | 103,274 | | | | 7,396 | |
| | CoreSite Realty Corporation | | | 63,984 | | | | 7,369 | |
| | FirstService Corporation† | | | 94,617 | | | | 9,076 | |
| | | | | | | | | 23,841 | |
| | Energy—1.7% | | | | | | | | |
| * | Callon Petroleum Co. | | | 432,183 | | | | 2,848 | |
| | Cameco Corporation† | | | 601,220 | | | | 6,451 | |
| | Centennial Resource Development, Inc. | | | 342,190 | | | | 2,597 | |
| | | | | | | | | 11,896 | |
| | Materials—0.9% | | | | | | | | |
| | Orion Engineered Carbons S.A.† | | | 287,092 | | | | 6,147 | |
| | Total Common Stocks—98.0%
(cost $578,636) | | | | | | | 694,086 | |
See accompanying Notes to Financial Statements.
| 26 | Semiannual Report | June 30, 2019 |
Small Cap Growth Fund
Portfolio of Investments, June 30, 2019(all dollar amounts in thousands) (unaudited)
| | | | | | | | |
| | | | Principal | | | | |
| | Issuer | | Amount | | | Value | |
| | | | | | | | | | |
| | Repurchase Agreement | | | | | | | | |
| | Fixed Income Clearing Corporation, 0.500% dated 6/28/19, due 7/1/19, repurchase price $11,412, collateralized by U.S. Treasury Note, 1.500%, due 8/15/26 | | | $11,412 | | | $ | 11,412 | |
| | Total Repurchase Agreement—1.6%
(cost $11,412) | | | | | | | 11,412 | |
| | Total Investments—99.6%
(cost $590,048) | | | | | | | 705,498 | |
| | Cash and other assets, less liabilities—0.4% | | | | | | | 2,534 | |
| | Net assets—100.0% | | | | | | $ | 708,032 | |
ADR = American Depository Receipt
* = Non-income producing security
† = U.S. listed foreign security
§ = Deemed illiquid pursuant to a Liquidity Risk Management Program approved by the Board of Trustees. This holding represents 0.39% of the Fund’s net assets at June 30, 2019.
See accompanying Notes to Financial Statements.
| June 30, 2019 | William Blair Funds | 27 |
| | Small Cap Value Fund |
| | |
| | The Small Cap Value Fund seeks long-term capital appreciation. |
| | |
| | AN OVERVIEW FROM THE PORTFOLIO MANAGERS |
| | |

Chad M. Kilmer 
Mark T. Leslie 
David S. Mitchell | The William Blair Small Cap Value Fund (Class N shares) posted a 16.22% increase, net of fees, for the six months ended June 30, 2019. By comparison, the Fund’s benchmark index, the Russell 2000®Value Index (the “Index”), increased 13.47%. The Fund’s outperformance relative to the Index was due to the combination of stock selection and style tailwinds primarily due to the strategy’s larger market cap bias and lack of exposure to deeper value stocks. At the sector level, the most significant contributor to relative performance was Information Technology, the best performing sector of the market during the period, due to strong stock selection that was broad-based across most industries. Stock selection within Software, Communication Equipment, IT Services, and Electronic Equipment, Instruments & Components were the most significant contributors to relative performance within the sector. Within Consumer Discretionary, stock selection within Household Durables and Auto Components contributed to the relative outperformance within the sector. The Fund’s relative outperformance within Health Care was due to strong stock selection within Health Care Equipment & Supplies and the lack of exposure to Pharmaceutical and Biotechnology stocks. Real Estate was the most significant detractor from relative performance during the period due to stock selection within Office, Hotel & Resort, and Health Care Real Estate Investment Trusts (“REITs”). Cash was a notable detractor during the period given the strong benchmark return during the first half of the year. Looking specifically at stock selection, the Fund’s largest contributors to relative performance were TopBuild Corporation (Consumer Discretionary), Gardner Denver Holdings, Inc. (Industrials), and Booz Allen Hamilton Holding Corporation (Information Technology). Offsetting these contributors were our investments in Weight Watchers International, Inc. (Consumer Discretionary), Wolverine World Wide, Inc. (Consumer Discretionary), and Range Resources Corporation (Energy). Please refer to the U.S. Value Market Review and Outlook relating to the Fund on page 7 for additional information. |
| 28 | Semiannual Report | June 30, 2019 |
Small Cap Value Fund
Performance Highlights (Unaudited)
| Average Annual Total Return through 6/30/2019 |
| | | Year
to Date | | 1 Year | | 3 Year | | 5 Year | | 10 Year | | Since
Inception(a) |
| Class N | | | 16.22 | % | | | (3.35 | )% | | | 7.48 | % | | | 4.87 | % | | | 12.18 | % | | | — | |
| Class I | | | 16.39 | | | | (3.10 | ) | | | 7.74 | | | | 5.14 | | | | 12.46 | | | | — | |
| Class R6 | | | — | | | | — | | | | — | | | | — | | | | — | | | | (0.77 | )% |
| Russell 2000®Value Index | | | 13.47 | | | | (6.24 | ) | | | 9.81 | | | | 5.39 | | | | 12.40 | | | | (1.54 | ) |
| (a) | Since inception is for the period from May 2, 2019 (Commencement of Operations) to June 30, 2019. |
Performance cited represents past performance. Past performance does not guarantee future results and current performance may be lower or higher than the data quoted. Results shown are average annual total returns, which assume reinvestment of dividends and capital gains. Investment returns and principal will fluctuate and you may have a gain or loss when you sell shares. For the most current month-end performance information, please call 1-800-742-7272, or visit our Web site atwww.williamblairfunds.com. Investing in smaller companies involves special risks, including higher volatility and lower liquidity. Smaller capitalization stocks are also more sensitive to purchase/sale transactions and changes in the issuer’s financial condition. From time to time, the investment adviser may waive fees or reimburse expenses for the Fund. Without these waivers/reimbursements, performance would be lower. Class N shares are not subject to a sales load. Class I shares are not subject to a sales load or distribution (Rule 12b-1) fees. Class R6 shares are not subject to a sales load, distribution (Rule 12b-1) fees, or sub-transfer agent fees.
The performance highlights and graph presented above do not reflect the deduction of taxes that a shareholder would pay on fund distributions or the redemption of fund shares.
The Russell 2000®Value Index consists of small-capitalization companies with below average price-to-book ratios and forecasted growth rates.
This report identifies the Fund’s investments on June 30, 2019. These holdings are subject to change. Not all stocks in the Fund performed the same, nor is there any guarantee that these stocks will perform as well in the future. Market forecasts provided in this report may not necessarily come to pass.
Sector Diversification (Unaudited)

The sector diversification shown is based on the total long-term securities.
| June 30, 2019 | William Blair Funds | 29 |
Small Cap Value Fund
Portfolio of Investments, June 30, 2019(all dollar amounts in thousands) (unaudited)
| | | | | | | | |
| | | | | | | | |
| | Issuer | | Shares | | | Value | |
| | | | | | | | | | |
| | Common Stocks | | | | | | | | |
| | Financials—26.3% | | | | | | | | |
| | Banc of California, Inc. | | | 244,137 | | | $ | 3,411 | |
| | Banner Corporation | | | 96,290 | | | | 5,214 | |
| | Boston Private Financial Holdings, Inc. | | | 310,693 | | | | 3,750 | |
| | CNO Financial Group, Inc. | | | 252,519 | | | | 4,212 | |
| | CVB Financial Corporation | | | 161,926 | | | | 3,405 | |
| | FNB Corporation | | | 447,308 | | | | 5,265 | |
| | Glacier Bancorp, Inc. | | | 83,634 | | | | 3,391 | |
| | Hancock Whitney Corporation | | | 154,672 | | | | 6,196 | |
| | Hanover Insurance Group, Inc. | | | 44,271 | | | | 5,680 | |
| | Home BancShares, Inc. | | | 318,473 | | | | 6,134 | |
| | Horace Mann Educators Corporation | | | 86,460 | | | | 3,483 | |
| | Iberiabank Corporation | | | 72,295 | | | | 5,484 | |
| | National Bank Holdings Corporation | | | 148,364 | | | | 5,386 | |
| | OceanFirst Financial Corporation | | | 187,682 | | | | 4,664 | |
| | PacWest Bancorp | | | 121,564 | | | | 4,720 | |
| | Radian Group, Inc. | | | 293,198 | | | | 6,700 | |
| | Renasant Corporation | | | 144,672 | | | | 5,199 | |
| | Sandy Spring Bancorp, Inc. | | | 151,817 | | | | 5,295 | |
| * | Seacoast Banking Corporation of Florida | | | 199,945 | | | | 5,087 | |
| | Selective Insurance Group, Inc. | | | 90,995 | | | | 6,815 | |
| | Sterling Bancorp | | | 278,195 | | | | 5,920 | |
| | Umpqua Holdings Corporation | | | 244,942 | | | | 4,064 | |
| * | Western Alliance Bancorp | | | 107,120 | | | | 4,790 | |
| | WSFS Financial Corporation | | | 117,872 | | | | 4,868 | |
| | | | | | | | | 119,133 | |
| | Industrials—12.5% | | | | | | | | |
| | Acuity Brands, Inc. | | | 41,583 | | | | 5,735 | |
| | Brady Corporation | | | 137,594 | | | | 6,786 | |
| * | Continental Building Products, Inc. | | | 198,888 | | | | 5,285 | |
| | Curtiss-Wright Corporation | | | 55,480 | | | | 7,053 | |
| | ESCO Technologies, Inc. | | | 69,792 | | | | 5,766 | |
| | Kennametal, Inc. | | | 131,980 | | | | 4,882 | |
| | Matson, Inc. | | | 122,461 | | | | 4,758 | |
| | Simpson Manufacturing Co., Inc. | | | 78,861 | | | | 5,241 | |
| | Watsco, Inc. | | | 36,950 | | | | 6,042 | |
| | Watts Water Technologies, Inc. | | | 55,878 | | | | 5,207 | |
| | | | | | | | | 56,755 | |
| | Real Estate—11.2% | | | | | | | | |
| | Acadia Realty Trust | | | 199,398 | | | | 5,458 | |
| | Agree Realty Corporation | | | 50,952 | | | | 3,264 | |
| | American Assets Trust, Inc. | | | 97,651 | | | | 4,601 | |
| | Americold Realty Trust | | | 182,245 | | | | 5,908 | |
| | Columbia Property Trust, Inc. | | | 157,187 | | | | 3,260 | |
| | Equity Commonwealth | | | 100,941 | | | | 3,283 | |
| | Healthcare Realty Trust, Inc. | | | 227,721 | | | | 7,132 | |
| | Highwoods Properties, Inc. | | | 142,349 | | | | 5,879 | |
| | Pebblebrook Hotel Trust | | | 202,311 | | | | 5,701 | |
| | Terreno Realty Corporation | | | 129,349 | | | | 6,343 | |
| | | | | | | | | 50,829 | |
| | | | | | | | |
| | | | | | | | |
| | Issuer | | Shares | | | Value | |
| | | | | | | | | | |
| | Common Stocks—(continued) | | | | | | | | |
| | Consumer Discretionary—9.9% | | | | | | | | |
| | Abercrombie & Fitch Co. | | | 239,506 | | | $ | 3,842 | |
| * | Adtalem Global Education, Inc. | | | 124,547 | | | | 5,611 | |
| | Carter’s, Inc. | | | 58,001 | | | | 5,657 | |
| * | Cavco Industries, Inc. | | | 29,728 | | | | 4,683 | |
| | Dana, Inc. | | | 258,777 | | | | 5,160 | |
| | Dave & Buster’s Entertainment, Inc. | | | 78,787 | | | | 3,188 | |
| | Dick’s Sporting Goods, Inc. | | | 131,009 | | | | 4,537 | |
| | Foot Locker, Inc. | | | 108,315 | | | | 4,541 | |
| * | TopBuild Corporation | | | 47,126 | | | | 3,900 | |
| | Wolverine World Wide, Inc. | | | 137,691 | | | | 3,792 | |
| | | | | | | | | 44,911 | |
| | Information Technology—9.5% | | | | | | | | |
| | Avnet, Inc. | | | 120,681 | | | | 5,463 | |
| | Belden, Inc. | | | 91,071 | | | | 5,425 | |
| * | Inphi Corporation | | | 81,908 | | | | 4,104 | |
| | j2 Global, Inc. | | | 69,487 | | | | 6,177 | |
| * | LiveRamp Holdings, Inc. | | | 88,329 | | | | 4,282 | |
| | MAXIMUS, Inc. | | | 64,192 | | | | 4,656 | |
| * | Semtech Corporation | | | 83,691 | | | | 4,021 | |
| * | SolarWinds Corporation | | | 187,925 | | | | 3,447 | |
| * | Viavi Solutions, Inc. | | | 420,447 | | | | 5,588 | |
| | | | | | | | | 43,163 | |
| | Energy—6.5% | | | | | | | | |
| | Archrock, Inc. | | | 460,262 | | | | 4,879 | |
| * | Callon Petroleum Co. | | | 771,222 | | | | 5,082 | |
| * | Helix Energy Solutions Group, Inc. | | | 437,968 | | | | 3,780 | |
| * | Newpark Resources, Inc. | | | 438,363 | | | | 3,253 | |
| * | PDC Energy, Inc. | | | 134,883 | | | | 4,864 | |
| | Range Resources Corporation | | | 446,502 | | | | 3,116 | |
| | Solaris Oilfield Infrastructure, Inc. | | | 236,178 | | | | 3,538 | |
| * | Talos Energy, Inc. | | | 31,302 | | | | 753 | |
| | | | | | | | | 29,265 | |
| | Health Care—6.0% | | | | | | | | |
| | CONMED Corporation | | | 97,651 | | | | 8,356 | |
| | Encompass Health Corporation | | | 109,209 | | | | 6,920 | |
| * | Integer Holdings Corporation | | | 92,999 | | | | 7,804 | |
| * | Magellan Health, Inc. | | | 53,601 | | | | 3,979 | |
| | | | | | | | | 27,059 | |
| | Utilities—6.0% | | | | | | | | |
| | Black Hills Corporation | | | 50,822 | | | | 3,973 | |
| | Chesapeake Utilities Corporation | | | 33,542 | | | | 3,187 | |
| | IDACORP, Inc. | | | 45,933 | | | | 4,613 | |
| | ONE Gas, Inc. | | | 61,705 | | | | 5,572 | |
| | PNM Resources, Inc. | | | 99,765 | | | | 5,079 | |
| | South Jersey Industries, Inc. | | | 136,003 | | | | 4,587 | |
| | | | | | | | | 27,011 | |
See accompanying Notes to Financial Statements.
| 30 | Semiannual Report | June 30, 2019 |
Small Cap Value Fund
Portfolio of Investments, June 30, 2019(all dollar amounts in thousands) (unaudited)
| | Issuer | | Shares or
Principal
Amount | | | Value | |
| | | | | | | | | | |
| | Common Stocks—(continued) | | | | | | | | |
| | Materials—4.5% | | | | | | | | |
| | Carpenter Technology Corporation | | | 94,844 | | | $ | 4,551 | |
| | Minerals Technologies, Inc. | | | 62,589 | | | | 3,349 | |
| | PolyOne Corporation | | | 109,929 | | | | 3,451 | |
| | Sensient Technologies Corporation | | | 66,197 | | | | 4,864 | |
| | Silgan Holdings, Inc. | | | 126,842 | | | | 3,881 | |
| | | | | | | | | 20,096 | |
| | Communication Services—2.7% | | | | | | | | |
| | Cinemark Holdings, Inc. | | | 114,583 | | | | 4,136 | |
| * | IMAX Corporation† | | | 131,135 | | | | 2,649 | |
| | Meredith Corporation | | | 98,939 | | | | 5,448 | |
| | | | | | | | | 12,233 | |
| | Consumer Staples—2.6% | | | | | | | | |
| * | Darling Ingredients, Inc. | | | 265,436 | | | | 5,279 | |
| | J&J Snack Foods Corporation | | | 40,360 | | | | 6,496 | |
| | | | | | | | | 11,775 | |
| | Total Common Stocks—97.7%
(cost $351,482) | | | | | | | 442,230 | |
| | | | | | | | | | |
| | Repurchase Agreement | | | | | | | | |
| | Fixed Income Clearing Corporation, 0.500% dated 6/28/19, due 7/1/19, repurchase price $6,411, collateralized by U.S. Treasury Note, 1.500%, due 8/15/26 | | | $6,410 | | | | 6,410 | |
| | Total Repurchase Agreement—1.4%
(cost $6,410) | | | | | | | 6,410 | |
| | Total Investments—99.1%
(cost $357,892) | | | | | | | 448,640 | |
| | Cash and other assets, less liabilities—0.9% | | | | | | | 4,297 | |
| | Net assets—100.0% | | | | | | $ | 452,937 | |
* = Non-income producing security
† = U.S. listed foreign security
See accompanying Notes to Financial Statements.
| June 30, 2019 | William Blair Funds | 31 |
Global Markets Review and Outlook
Global equities posted strong results for the first half of 2019 despite signals of decelerating global growth and mounting uncertainty surrounding trade relations between the U.S. and China. Gains across most markets were primarily driven by the more accommodative tone out of major central banks. From a geopolitical perspective, the prospect of a trade deal between the U.S. and China, which fueled equity markets to start the year, quickly soured in the month of May following news that the U.S. would increase tariffs from 10% to 25% on nearly half the goods purchased from China (roughly $200 billion in U.S. Dollar terms). Despite the unexpected volatility in May, equities rebounded in June to close out a strong first six months of the year with the MSCI ACWI Investable Market Index (“IMI”) up 16.07% year-to-date.
U.S. equities rallied in the first half of 2019 (+18.42% as measured by the MSCI USA IMI) after the large selloff in the fourth quarter of 2018. Growth in the U.S. remained solid but started to decelerate off of last year’s previous highs. The Federal Reserve’s acknowledgment of slower economic growth and dovish stance on interest rates helped ease investor sentiment and boosted returns across sectors, especially cyclically-oriented sectors such as Information Technology, Industrials and Consumer Discretionary.
European equities also advanced despite signs of significant deceleration in manufacturing growth. Specifically, purchasing manager surveys continued to point to deceleration in the pace of industrial orders growth and subsequent industrial production growth in the Euro Area. This was especially evident in Germany where manufacturing growth has been shrinking and business sentiment has weakened over the past year. As European sovereign 10-year bond yields hit record lows in June, the European Central Bank announced that further monetary stimulus to boost inflation was ready if needed. The MSCI Europe ex U.K. IMI advanced 5.64% for the second quarter and 16.74% year-to-date in U.S. dollar terms.
Ambiguity surrounding Brexit continued to weigh on the economic conditions within the U.K. Equities felt some relief to start the year after the U.K. was granted two extensions from the European Union to delay the Brexit process past the March 29, 2019 deadline and then against past the April 12, 2019 deadline to the current October 31, 2010 deadline. But political woes returned following the failed final bid to get a Brexit deal through parliament and the subsequent resignation of Prime Minister Theresa May. While the Conservative Party began the process of selecting its new leader, who will also become Prime Minister, political uncertainty drove Sterling weakness amid increased expectations of a disorderly Brexit. The MSCI U.K. IMI advanced modestly for the second quarter (+0.74%), but was up 13.16% year-to-date in US dollar terms.
Equity performance across Emerging Market countries was mixed year-to-date. China equities declined 4.11% in the second quarter amid the trade war re-escalation and lower expectations regarding the level of government stimulus measures. Despite this correction, Chinese shares (including Hong Kong and New York-listed companies) were up 12.73% for the six-month period, while China’s mainland-listed securities (A-shares) advanced 28.28% (as measured by the MSCI China A Onshore Index). Higher crude prices contributed to strong equity market gains across oil exporting countries such as Russia (+30.70%) and Brazil (+16.39%), but negatively impacted oil importing countries such as India (+6.43%) and Indonesia (+6.88%) year-to-date (as measured by the MSCI Emerging Markets IMI).
The global growth environment appears to be stabilizing after a period of deceleration in economic activity over the past year. Among the higher frequency data that we monitor, we have been encouraged by recent stabilization in the orders minus inventories component of the Manufacturing Purchasing Managers’ Indexes (“PMIs”) in the U.S., Euro Area, U.K. and Japan, signaling a rebound in industrial production volumes.
Looking forward to the second half of the year, we see geopolitical risks to economic activity abating: U.S.-China trade talks are back on, European Parliamentary elections are behind us, and the recently announced key European appointments (European Central Bank and European Commission presidents) suggest a better policy mix going forward.
U.S.-China tariff threats moderated toward the end of the period, which was particularly important as the escalation in hostilities and uncertainty about a potential trade deal weighed on industrial activity and order flows in the first half of 2019. At the same time, we saw signs of a bottoming in activity even before the announced truce in Osaka-notably that sales of semiconductors had troughed. This is an increasingly valuable indicator of near-term economic momentum. While the industry has consolidated and matured, semiconductors are used increasingly widely in almost all areas of industrial manufacturing and production.
Bond market investors are suggesting a different verdict on the global economy, however. The dichotomy of views expressed by equities and fixed income investors is best encapsulated by the decoupling of economic growth (equities) and inflation (bonds). Specifically, U.S. inflation continues to edge lower (1.6% year-over-year), even as the U.S. economy enters its tenth year of expansion. The situation is broadly repeated across many developed economies. It is little surprise then that the U.S. Federal Reserve feels compelled to lower rates.
| 32 | Semiannual Report | June 30, 2019 |
Global Markets Review and Outlook (continued)
From a corporate earnings perspective, net income growth appears to be bottoming in the Euro Area, the U.K., Japan and China after an 18 month period of steady deceleration. U.S. earnings growth has recently stabilized at 19% after weakening from 27% in December 2018, although consensus growth estimates for the next twelve months are significantly lower at 6%. This discrepancy in actual versus future U.S. growth expectations starkly contrasts with non-U.S. markets, where forward expectations are more in line with current growth rates, reflecting the shrinking economic growth wedge that has favored the U.S.
Equity valuations have stabilized and are broadly similar across different geographic regions following the sizable de-rating that occurred during the fourth quarter 2018 market selloff. Price/Earnings multiples in the U.S. and Euro Area are roughly in line with their respective ten year averages, while China is trading modestly below its ten year average multiple.
Although positioning changes by sector and geography varied across our strategies during the first half of the year, there were some broadly consistent themes reflecting the market environment and company fundamentals. From a sector perspective, Information Technology and Industrials weightings were generally higher due to our active repositioning into relatively attractive areas like software, payments and machinery. From a country perspective, exposures to China and India were incrementally increased across most strategies, while Japan weightings were reduced in our global/non-U.S. strategies.
| June 30, 2019 | William Blair Funds | 33 |
| | Global Leaders Fund |
| | |
| | The Global Leaders Fund seeks long-term capital appreciation. |
| | |
| | AN OVERVIEW FROM THE PORTFOLIO MANAGERS |
| | |

Andrew G. Flynn 
Kenneth J. McAtamney | The William Blair Global Leaders Fund (Class N shares) posted a 20.66% increase, net of fees, for the six months ended June 30, 2019. By comparison, the Fund’s benchmark index, the MSCI All Country World IMI Index (net) (the “Index”), increased 16.07%. Six-month outperformance versus the Index was primarily driven by positive stock selection across most sectors. The Consumer Staples, Health Care and Financials sectors were the most significant sources of the Fund’s relative return. Within Consumer Staples, The Estee Lauder Cos., Inc. aided relative performance as results came in stronger than expected driven by strength in Asia, travel retail, and skincare. Estee Lauder is a leading global prestige cosmetics company with more than 30,000 points of distribution in over 150 countries across various channels, including department stores, specialty cosmetics stores, travel retail, and online. We expect the company to benefit from the rapid growth of newly acquired brands, the continued expansion in the specialty retail and online channels, and strong growth from China and travel retail. Within Healthcare, Zoetis, Inc., the largest global provider of animal healthcare products, was an additional source of outperformance as the company reported another solid quarter by beating estimates. Zoetis is a unique company with strong secular growth drivers such as population growth and a rising middle class with increasing per capita income in developed markets. In addition, the animal healthcare industry compares favorably to human health care as there are no patent cliffs threatening sales, the pricing environment is benign, and R&D productivity is higher. Within Financials, AIA Group, Ltd. bolstered relative results. AIA is a leading provider of life insurance throughout Asia. The company continues to benefit from strong demand for its products due to its dominant brand and competitive advantages in distribution and product innovation, coupled with rising affluence and insurance penetration within Asia. Furthermore, China announced plans to further open up its insurance markets to foreign competition, boosting sentiment in the sector. Partially offsetting these effects was an underweight allocation to the Consumer Staples sector, coupled with below average stock selection within the Materials sector. Within Materials, Nissan Chemical Corp. hindered relative returns due to results that were weaker than consensus, mostly due to slower smartphone sales. Nissan Chemical is an innovative Japanese producer of niche chemicals for the electronics, agriculture, and pharmaceutical industries. It has a leading position in its core products and a track record of innovation supported by its commitment to high levels of research and development. While Nissan Chemical’s business model remains unchanged, we trimmed the position to reflect uncertainty around the company’s near-term conditions. Victrex plc, a chemicals company that is the world’s leading producer of a niche, high performance plastic, also underperformed in the period due to weak demand from automotive and electronic end-markets. Over the long-term, we believe Victrex will deliver above-average growth rates relative to its chemical peer group due to increasing demand for high performance plastics across a large and growing number of end markets. Please refer to the Global Markets Review and Outlook relating to the Fund beginning on page 32 for additional information. |
| 34 | Semiannual Report | June 30, 2019 |
Global Leaders Fund
Performance Highlights (Unaudited)
| Average Annual Total Return through 6/30/2019 |
| | | Year
to Date | | 1 Year | | 3 Year | | 5 Year | | 10 Year | | Since
Inception |
| Class N | | | 20.66 | % | | | 4.14 | % | | | 13.86 | % | | | 8.11 | % | | | 11.89 | % | | | — | |
| Class I | | | 20.92 | | | | 4.44 | | | | 14.19 | | | | 8.43 | | | | 12.19 | | | | — | |
| MSCI ACW IMI (net) | | | 16.07 | | | | 4.56 | | | | 11.42 | | | | 6.03 | | | | 10.32 | | | | — | |
| Class R6(a) | | | 20.92 | | | | 4.44 | | | | 14.26 | | | | 8.48 | | | | — | | | | 10.37 | % |
| MSCI ACW IMI (net)(a) | | | 16.07 | | | | 4.56 | | | | 11.42 | | | | 6.03 | | | | — | | | | 8.97 | |
| | |
| (a) | Since inception is for the period from December 19, 2012 (Commencement of Operations) to June 30, 2019. |
Performance cited represents past performance. Past performance does not guarantee future results and current performance may be lower or higher than the data quoted. Results shown are average annual total returns, which assume reinvestment of dividends and capital gains. Investment returns and principal will fluctuate and you may have a gain or loss when you sell shares. For the most current month-end performance information, please call 1-800-742-7272, or visit our Web site atwww.williamblairfunds.com. Investing in smaller and medium capitalization companies involves special risks, including higher volatility and lower liquidity. Smaller and medium capitalization stocks are also more sensitive to purchase/sale transactions and changes in the issuer’s financial condition. International investing involves special risk considerations, including currency fluctuations, lower liquidity, economic and political risk. From time to time, the investment adviser may waive fees or reimburse expenses for the Fund. Without these waivers/reimbursements, performance would be lower. Class N shares are not subject to a sales load. Class I shares are not subject to a sales load or distribution (Rule 12b-1) fees. Class R6 shares are not subject to a sales load, distribution (Rule 12b-1) fees, or sub-transfer agent fees.
The performance highlights and graph presented above do not reflect the deduction of taxes that a shareholder would pay on fund distributions or the redemption of fund shares.
The Morgan Stanley Capital International (MSCI) All Country World (ACW) Investable Market Index (IMI) (net) is a free float-adjusted market capitalization weighted index that is designed to measure the equity market of developed and emerging markets. This index approximates the minimum possible dividend reinvestment by deducting for the highest possible withholding tax rates of those markets.
This report identifies the Fund’s investments on June 30, 2019. These holdings are subject to change. Not all stocks in the Fund performed the same, nor is there any guarantee that these stocks will perform as well in the future. Market forecasts provided in this report may not necessarily come to pass.
Sector Diversification (Unaudited)

The sector diversification shown is based on the total long-term securities.
| June 30, 2019 | William Blair Funds | 35 |
Global Leaders Fund
Portfolio of Investments, June 30, 2019(all dollar amounts in thousands) (unaudited)
| | | | | | | | |
| | | | | | | | |
| | Issuer | | Shares | | | Value | |
| | | | | | | | | | |
| | Common Stocks | | | | | | | | |
| | | | | | | | | | |
| | Western Hemisphere—52.7% | | | | | | | | |
| | Canada—1.6% | | | | | | | | |
| | Brookfield Asset Management, Inc. Class “A” (Capital markets)† | | | 69,884 | | | $ | 3,339 | |
| | United States—51.1% | | | | | | | | |
| * | ABIOMED, Inc. (Health care equipment & supplies) | | | 5,791 | | | | 1,508 | |
| * | Adobe, Inc. (Software) | | | 13,187 | | | | 3,886 | |
| * | Align Technology, Inc. (Health care equipment & supplies) | | | 3,869 | | | | 1,059 | |
| * | Alphabet, Inc. Class “A” (Interactive Media & Services) | | | 4,982 | | | | 5,394 | |
| * | Amazon.com, Inc. (Internet & direct marketing retail) | | | 3,268 | | | | 6,188 | |
| | BlackRock, Inc. (Capital markets) | | | 7,869 | | | | 3,693 | |
| * | CoStar Group, Inc. (Professional services) | | | 3,833 | | | | 2,124 | |
| | Domino’s Pizza, Inc. (Hotels, restaurants & leisure) | | | 9,357 | | | | 2,604 | |
| * | Facebook, Inc. Class “A” (Interactive Media & Services) | | | 23,267 | | | | 4,491 | |
| | Fifth Third Bancorp (Banks) | | | 70,390 | | | | 1,964 | |
| * | Guidewire Software, Inc. (Software) | | | 16,472 | | | | 1,670 | |
| * | IDEXX Laboratories, Inc. (Health care equipment & supplies) | | | 8,945 | | | | 2,463 | |
| * | Illumina, Inc. (Life sciences tools & services) | | | 4,339 | | | | 1,597 | |
| | Intercontinental Exchange, Inc. (Capital markets) | | | 41,800 | | | | 3,592 | |
| * | Intuitive Surgical, Inc. (Health care equipment & supplies) | | | 4,059 | | | | 2,129 | |
| | JPMorgan Chase & Co. (Banks) | | | 33,138 | | | | 3,705 | |
| | Mastercard, Inc. Class “A” (IT services) | | | 20,580 | | | | 5,444 | |
| | NextEra Energy, Inc. (Electric utilities) | | | 14,847 | | | | 3,042 | |
| * | PayPal Holdings, Inc. (IT services) | | | 31,842 | | | | 3,645 | |
| | Prologis, Inc. (Equity REIT) | | | 27,361 | | | | 2,192 | |
| | Roper Technologies, Inc. (Industrial conglomerates) | | | 11,463 | | | | 4,198 | |
| * | salesforce.com, Inc. (Software) | | | 25,835 | | | | 3,920 | |
| | Southwest Airlines Co. (Airlines) | | | 20,620 | | | | 1,047 | |
| | The Boeing Co. (Aerospace & defense) | | | 8,014 | | | | 2,917 | |
| | The Estee Lauder Cos., Inc. Class “A” (Personal products) | | | 20,285 | | | | 3,714 | |
| | The Goldman Sachs Group, Inc. (Capital markets) | | | 10,503 | | | | 2,149 | |
| | Thermo Fisher Scientific, Inc. (Life sciences tools & services) | | | 12,510 | | | | 3,674 | |
| * | Ulta Salon Cosmetics & Fragrance, Inc. (Specialty retail) | | | 8,382 | | | | 2,908 | |
| | Union Pacific Corporation (Road & rail) | | | 25,144 | | | | 4,252 | |
| | UnitedHealth Group, Inc. (Health care providers & services) | | | 18,469 | | | | 4,507 | |
| | Vail Resorts, Inc. (Hotels, restaurants & leisure) | | | 11,226 | | | | 2,505 | |
| * | Veeva Systems, Inc. Class “A” (Health care technology) | | | 8,688 | | | | 1,408 | |
| * | Worldpay, Inc. Class “A” (IT services) | | | 32,188 | | | | 3,945 | |
| | Zoetis, Inc. (Pharmaceuticals) | | | 30,582 | | | | 3,471 | |
| | | | | | | | | 107,005 | |
| | | | | | | | |
| | | | | | | | |
| | Issuer | | Shares | | | Value | |
| | | | | | | | | | |
| | Common Stocks—(continued) | | | | | | | | |
| | | | | | | | | | |
| | Europe—17.6% | | | | | | | | |
| | Denmark—2.5% | | | | | | | | |
| | Chr Hansen Holding A/S (Chemicals) | | | 25,609 | | | $ | 2,405 | |
| | DSV A/S (Road & rail) | | | 28,058 | | | | 2,755 | |
| | | | | | | | | 5,160 | |
| | France—2.1% | | | | | | | | |
| | LVMH Moet Hennessy Louis Vuitton SE (Textiles, apparel & luxury goods) | | | 10,232 | | | | 4,355 | |
| | Germany—2.5% | | | | | | | | |
| | Infineon Technologies AG (Semiconductors & semiconductor equipment) | | | 138,275 | | | | 2,445 | |
| | MTU Aero Engines AG (Aerospace & defense) | | | 11,512 | | | | 2,742 | |
| | | | | | | | | 5,187 | |
| | Ireland—2.0% | | | | | | | | |
| | Allegion plc (Building products)† | | | 18,893 | | | | 2,089 | |
| | Aptiv plc (Auto components)† | | | 27,092 | | | | 2,190 | |
| | | | | | | | | 4,279 | |
| | Netherlands—1.3% | | | | | | | | |
| | Royal Dutch Shell plc Class “A” (Oil, gas & consumable fuels) | | | 86,568 | | | | 2,826 | |
| | Sweden—4.1% | | | | | | | | |
| | Atlas Copco AB Class “A” (Machinery) | | | 115,318 | | | | 3,686 | |
| | Hexagon AB Class “B” (Electronic equipment, instruments & components) | | | 66,806 | | | | 3,709 | |
| | Indutrade AB (Trading companies & distributors) | | | 34,507 | | | | 1,103 | |
| | | | | | | | | 8,498 | |
| | Switzerland—3.1% | | | | | | | | |
| * | Lonza Group AG (Life sciences tools & services) | | | 9,431 | | | | 3,182 | |
| | Partners Group Holding AG (Capital markets) | | | 4,148 | | | | 3,259 | |
| | | | | | | | | 6,441 | |
| | | | | | | | | | |
| | Emerging Asia—9.7% | | | | | | | | |
| | China—5.7% | | | | | | | | |
| * | Alibaba Group Holding, Ltd.—ADR (Internet & direct marketing retail) | | | 28,272 | | | | 4,791 | |
| | Huazhu Group, Ltd.—ADR (Hotels, restaurants & leisure) | | | 36,291 | | | | 1,315 | |
| | Shenzhou International Group Holdings, Ltd. (Textiles, apparel & luxury goods) | | | 120,000 | | | | 1,650 | |
| | Tencent Holdings, Ltd. (Interactive Media & Services) | | | 94,000 | | | | 4,243 | |
| | | | | | | | | 11,999 | |
| | India—1.6% | | | | | | | | |
| | HDFC Bank, Ltd.—ADR (Banks) | | | 26,241 | | | | 3,412 | |
| | Taiwan—2.4% | | | | | | | | |
| | Taiwan Semiconductor Manufacturing Co., Ltd.—ADR (Semiconductors & semiconductor equipment) | | | 126,833 | | | | 4,968 | |
See accompanying Notes to Financial Statements.
| 36 | Semiannual Report | June 30, 2019 |
Global Leaders Fund
Portfolio of Investments, June 30, 2019(all dollar amounts in thousands) (unaudited)
| | | | | | | | |
| | | | | | | | |
| | Issuer | | Shares | | | Value | |
| | | | | | | | | | |
| | Common Stocks—(continued) | | | | | | | | |
| | | | | | | | | | |
| | Asia—8.1% | | | | | | | | |
| | Australia—4.6% | | | | | | | | |
| | Aristocrat Leisure, Ltd. (Hotels, restaurants & leisure) | | | 96,919 | | | $ | 2,090 | |
| | CSL, Ltd. (Biotechnology) | | | 28,899 | | | | 4,362 | |
| | Macquarie Group, Ltd. (Capital markets) | | | 35,714 | | | | 3,144 | |
| | | | | | | | | 9,596 | |
| | Hong Kong—3.5% | | | | | | | | |
| | AIA Group, Ltd. (Insurance) | | | 415,400 | | | | 4,480 | |
| | Galaxy Entertainment Group, Ltd. (Hotels, restaurants & leisure) | | | 415,000 | | | | 2,797 | |
| | | | | | | | | 7,277 | |
| | | | | | | | | | |
| | Japan—6.5% | | | | | | | | |
| | Daikin Industries, Ltd. (Building products) | | | 27,700 | | | | 3,614 | |
| | Keyence Corporation (Electronic equipment, instruments & components) | | | 5,700 | | | | 3,496 | |
| | M3, Inc. (Health care technology) | | | 9,300 | | | | 170 | |
| | MISUMI Group, Inc. (Machinery) | | | 34,400 | | | | 862 | |
| | Nihon M&A Center, Inc. (Professional services) | | | 74,900 | | | | 1,795 | |
| | Nissan Chemical Corp. (Chemicals) | | | 19,200 | | | | 865 | |
| | SMC Corporation (Machinery) | | | 3,500 | | | | 1,304 | |
| | ZOZO Inc. (Internet & direct marketing retail) | | | 82,300 | | | | 1,541 | |
| | | | | | | | | 13,647 | |
| | | | | | | | | | |
| | United Kingdom—3.6% | | | | | | | | |
| | Burford Capital, Ltd. (Capital markets) | | | 68,704 | | | | 1,352 | |
| | Compass Group plc (Hotels, restaurants & leisure) | | | 148,460 | | | | 3,558 | |
| | Fevertree Drinks plc (Beverages) | | | 33,351 | �� | | | 982 | |
| | Victrex plc (Chemicals) | | | 64,172 | | | | 1,763 | |
| | | | | | | | | 7,655 | |
| | | | | | | | | | |
| | Emerging Latin America—0.7% | | | | | | | | |
| | Argentina—0.7% | | | | | | | | |
| * | Globant S.A. (Software)† | | | 14,216 | | | | 1,437 | |
| | Total Common Stocks—98.9%
(cost $152,185) | | | | | | | 207,081 | |
| | | | | | | | |
| | Issuer | | Principal
Amount | | | Value | |
| | | | | | | | | | |
| | Repurchase Agreement | | | | | | | | |
| | Fixed Income Clearing Corporation, 0.500% dated 6/28/19, due 7/1/19, repurchase price $4,765, collateralized by U.S. Treasury Note, 1.500%, due 8/15/26 | | | $4,765 | | | $ | 4,765 | |
| | Total Repurchase Agreement—2.3%
(cost $4,765) | | | | | | | 4,765 | |
| | Total Investments—101.2%
(cost $156,950) | | | | | | | 211,846 | |
| | Liabilities, plus cash and other assets—(1.2)% | | | | | | | (2,560 | ) |
| | Net assets—100.0% | | | | | | $ | 209,286 | |
ADR = American Depository Receipt
REIT = Real Estate Investment Trust
† = U.S. listed foreign security
* = Non-income producing security
For securities primarily traded on exchanges or markets that close before the close of regular trading on the New York Stock Exchange, the Fund may use an independent pricing service to fair value price the securities pursuant to Valuation Procedures approved by the Board of Trustees.
At June 30, 2019, the Fund’s Portfolio of Investments includes the following industry categories (as a percentage of long-term investments):
| Information Technology | | 18.5 | % |
| Consumer Discretionary | | 18.5 | % |
| Industrials | | 16.7 | % |
| Financials | | 16.5 | % |
| Health Care | | 14.3 | % |
| Communication Services | | 6.8 | % |
| Materials | | 2.4 | % |
| Consumer Staples | | 2.3 | % |
| Utilities | | 1.5 | % |
| Energy | | 1.4 | % |
| Real Estate | | 1.1 | % |
| Total | | 100.0 | % |
At June 30, 2019, the Fund’s Portfolio of Investments includes the following currency categories (as a percentage of long-term investments):
| U.S. Dollar | | 63.0 | % |
| Japanese Yen | | 6.6 | % |
| Hong Kong Dollar | | 6.4 | % |
| Euro | | 6.0 | % |
| Australian Dollar | | 4.6 | % |
| Swedish Krona | | 4.1 | % |
| British Pound Sterling | | 3.7 | % |
| Swiss Franc | | 3.1 | % |
| Danish Krone | | 2.5 | % |
| Total | | 100.0 | % |
See accompanying Notes to Financial Statements.
| June 30, 2019 | William Blair Funds | 37 |
| | International Leaders Fund |
| | |
| | The International Leaders Fund seeks long-term capital appreciation. |
| | |
| | AN OVERVIEW FROM THE PORTFOLIO MANAGERS |
| | |

Simon Fennell 
Kenneth J. McAtamney | The William Blair International Leaders Fund (Class N shares) posted a 20.58% increase, net of fees, for the six months ended June 30, 2019. By comparison, the Fund’s benchmark index, the MSCI All Country World ex-U.S. IMI Index (net) (the “Index”), increased 13.33%. Six-month outperformance versus the Index was primarily driven by positive stock selection across most sectors. The Financials, Materials and Industrials sectors were the most significant contributors to the Fund’s relative return. Within Financials, AIA Group, Ltd. helped relative returns as the company continued to generate strong double-digit VNB (value of new business) growth, a key financial metric. AIA is a leading provider of life insurance throughout Asia. The company continues to benefit from strong demand for its products due to its dominant brand position and competitive advantages in distribution and product innovation, coupled with rising affluence and insurance penetration within Asia. Furthermore, China announced plans to further open up its insurance markets to foreign competition, booting sentiment in the sector. Sika AG, a construction materials company within the Materials sector, was an additional source of outperformance. Sika boasts a diversified set of value-added products that simplify construction projects, lower completion time, and enhance building efficiency and sustainability. Increasing urbanization along with a heightened focus on sustainability provides Sika with a favorable structural backdrop and a market more receptive to innovation. Competitive dynamics are currently positive as well, as Sika’s two main competitors, BASF SE and W.R. Grace & Co., are facing challenges, allowing Sika a unique opportunity to gain market share both organically and via M&A. Within the Industrials sector, Airbus SE boosted relative performance. Product transitions to the next generation of aircrafts that have pressured earnings and cash flows at the company over the last several years have peaked, leaving the company in a favorable position where investment is moderating and profitability is poised to improve. Partially offsetting these effects were underweight allocations to the Materials and Consumer Staples sectors, which outperformed the Index during the period, coupled with below average stock selection within the Communication Services sector. Within Communication Services, Rogers Communications, Inc. and Tencent Holdings, Ltd. detracted from relative performance. Rogers Communications, an industry leader with high quality customers and a favorable spectrum position in Canada, reported soft wireless subscription growth during the period, leading us to trim the position. Tencent, the Chinese online gaming and social network giant, reported weaker-than-expected advertising revenue growth during the period. While results were disappointing, the economic backdrop was difficult and the company still has very high demand for the limited advertising slots it is making available to its engaged social media user base. We believe Tencent can continue to manage advertising growth at a relatively high level while delivering relevant advertisements to users, supporting our investment thesis. Please refer to the Global Markets Review and Outlook relating to the Fund beginning on page 32 for additional information. |
| 38 | Semiannual Report | June 30, 2019 |
International Leaders Fund
Performance Highlights (Unaudited)
| Average Annual Total Return through 6/30/2019 |
| | | Year
to Date | | 1 Year | | 3 Year | | 5 Year | | Since
Inception |
| Class N(a) | | | 20.58 | % | | | 4.18 | % | | | 11.77 | % | | | 6.72 | % | | | 9.14 | % |
| Class I(a) | | | 20.66 | | | | 4.44 | | | | 12.07 | | | | 6.98 | | | | 9.41 | |
| MSCI ACW Ex-U.S. IMI (net)(a) | | | 13.33 | | | | 0.26 | | | | 9.17 | | | | 2.25 | | | | 5.96 | |
| Class R6(b) | | | 20.75 | | | | 4.53 | | | | 12.19 | | | | 7.08 | | | | 9.46 | |
| MSCI ACW Ex-U.S. IMI (net)(b) | | | 13.33 | | | | 0.26 | | | | 9.17 | | | | 2.25 | | | | 5.56 | |
| (a) | Since inception is for the period from August 16, 2012 (Commencement of Operations) to June 30, 2019. |
| (b) | Since inception is for the period from November 2, 2012 (Commencement of Operations) to June 30, 2019. |
Performance cited represents past performance. Past performance does not guarantee future results and current performance may be lower or higher than the data quoted. Results shown are average annual returns, which assume reinvestment of dividends and capital gains. Investment returns and principal will fluctuate and you may have a gain or loss when you sell shares. For the most current month-end performance information, please call 1-800-742-7272, or visit our Web site atwww.williamblairfunds.com. Investing in smaller and medium capitalization companies involves special risks, including higher volatility and lower liquidity. Smaller and medium capitalization stocks are also more sensitive to purchase/sale transactions and changes in the issuer’s financial condition. International investing involves special risk considerations, including currency fluctuations, lower liquidity, economic and political risk. From time to time the investment adviser may waive fees or reimburse expenses for the Fund. Without these waivers/reimbursements, performance would be lower. Class N shares are not subject to a sales load. Class I shares are not subject to a sales load or distribution (Rule 12b-1) fees. Class R6 shares are not subject to a sales load, distribution (Rule 12b-1) fees, or sub-transfer agent fees.
The performance highlights presented above do not reflect the deduction of taxes that a shareholder would pay on fund distributions or the redemption of fund shares.
The Morgan Stanley Capital International (MSCI) All Country World (ACW) Ex-U.S. Investable Market Index (IMI) (net) is a free float-adjusted market capitalization weighted index that is designed to measure the equity market performance of developed and emerging markets, excluding the United States. This index approximates the minimum possible dividend reinvestment by deducting for the highest possible withholding tax rates of those markets.
This report identifies the Fund’s investments on June 30, 2019. These holdings are subject to change. Not all stocks in the Fund performed the same, nor is there any guarantee that these stocks will perform as well in the future. Market forecasts provided in this report may not necessarily come to pass.
Sector Diversification (Unaudited)

The sector diversification shown is based on the total long-term securities.
| June 30, 2019 | William Blair Funds | 39 |
International Leaders Fund
Portfolio of Investments, June 30, 2019(all dollar amounts in thousands) (unaudited)
| | | | | | | | |
| | | | | | |
| | Issuer | | Shares | | Value | |
| | | | | | |
| | Common Stocks | | | | | | | | |
| | | | | | | | | | |
| | Europe, Mid-East—43.0% | | | | | | | | |
| | Denmark—4.2% | | | | | | | | |
| | Coloplast A/S Class “B” (Health care equipment & supplies) | | | 83,860 | | | $ | 9,477 | |
| | DSV A/S (Road & rail) | | | 44,293 | | | | 4,349 | |
| | Orsted A/S (Electric utilities) | | | 104,312 | | | | 9,020 | |
| | | | | | | | | 22,846 | |
| | Finland—0.4% | | | | | | | | |
| | Neste Oyj (Oil, gas & consumable fuels) | | | 73,231 | | | | 2,485 | |
| | France—9.4% | | | | | | | | |
| | Airbus SE (Aerospace & defense) | | | 94,486 | | | | 13,395 | |
| | Capgemini SE (IT services) | | | 82,713 | | | | 10,285 | |
| | LVMH Moet Hennessy Louis Vuitton SE (Textiles, apparel & luxury goods) | | | 34,286 | | | | 14,593 | |
| | Safran S.A. (Aerospace & defense) | | | 89,469 | | | | 13,108 | |
| | | | | | | | | 51,381 | |
| | Germany—4.9% | | | | | | | | |
| | Infineon Technologies AG (Semiconductors & semiconductor equipment) | | | 424,292 | | | | 7,502 | |
| | Rational AG (Machinery) | | | 8,791 | | | | 6,053 | |
| | SAP SE (Software) | | | 94,423 | | | | 12,966 | |
| | | | | | | | | 26,521 | |
| | Ireland—1.8% | | | | | | | | |
| | Kingspan Group plc (Building products) | | | 179,200 | | | | 9,732 | |
| | Israel—1.6% | | | | | | | | |
| * | Check Point Software Technologies, Ltd. (Software)† | | | 74,722 | | | | 8,639 | |
| | Italy—0.6% | | | | | | | | |
| | Ferrari N.V. (Automobiles) | | | 19,307 | | | | 3,135 | |
| | Luxembourg—0.8% | | | | | | | | |
| | Tenaris S.A. (Energy equipment & services) | | | 316,710 | | | | 4,145 | |
| | Netherlands—4.9% | | | | | | | | |
| * | Adyen N.V. (IT services) | | | 7,020 | | | | 5,417 | |
| | Koninklijke Philips N.V. (Health care equipment & supplies) | | | 266,090 | | | | 11,554 | |
| | Royal Dutch Shell plc Class “A” (Oil, gas & consumable fuels) | | | 296,306 | | | | 9,673 | |
| | | | | | | | | 26,644 | |
| | Spain—3.7% | | | | | | | | |
| | ACS Actividades de Construccion y Servicios S.A. (Construction & engineering) | | | 245,583 | | | | 9,805 | |
| | Amadeus IT Group S.A. (IT services) | | | 134,293 | | | | 10,637 | |
| | | | | | | | | 20,442 | |
| | Sweden—3.3% | | | | | | | | |
| | Atlas Copco AB Class “A” (Machinery) | | | 314,949 | | | | 10,066 | |
| | Hexagon AB Class “B” (Electronic equipment, instruments & components) | | | 148,654 | | | | 8,254 | |
| | | | | | | | | 18,320 | |
| | | | | | | | |
| | | | | | |
| | Issuer | | Shares | | Value | |
| | | | | | |
| | Common Stocks—(continued) | | | | | | | | |
| | | | | | | | | | |
| | Europe, Mid-East—(continued) | | | | | | | | |
| | Switzerland—7.4% | | | | | | | | |
| * | Lonza Group AG (Life sciences tools & services) | | | 37,003 | | | $ | 12,486 | |
| | Partners Group Holding AG (Capital markets) | | | 11,797 | | | | 9,269 | |
| | Sika AG (Chemicals) | | | 47,290 | | | | 8,070 | |
| * | Temenos AG (Software) | | | 59,007 | | | | 10,557 | |
| | | | | | | | | 40,382 | |
| | | | | | | | | | |
| | United Kingdom—13.6% | | | | | | | | |
| | Abcam plc (Biotechnology) | | | 133,853 | | | | 2,505 | |
| | Compass Group plc (Hotels, restaurants & leisure) | | | 443,907 | | | | 10,638 | |
| | Diageo plc (Beverages) | | | 257,349 | | | | 11,059 | |
| | Experian plc (Professional services) | | | 384,132 | | | | 11,630 | |
| * | Ferguson plc (Trading companies & distributors) | | | 99,930 | | | | 7,107 | |
| | London Stock Exchange Group plc (Capital markets) | | | 115,112 | | | | 8,020 | |
| | RELX plc (Professional services) | | | 446,282 | | | | 10,822 | |
| | Segro plc (Equity REIT) | | | 853,098 | | | | 7,911 | |
| | St James’s Place plc (Capital markets) | | | 328,153 | | | | 4,576 | |
| | | | | | | | | 74,268 | |
| | | | | | | | | | |
| | Emerging Asia—12.5% | | | | | | | | |
| | China—8.5% | | | | | | | | |
| * | Alibaba Group Holding, Ltd.—ADR (Internet & direct marketing retail) | | | 87,315 | | | | 14,795 | |
| | China Merchants Bank Co., Ltd. Class “H” (Banks) | | | 2,246,500 | | | | 11,201 | |
| | NetEase, Inc.-ADR (Entertainment) | | | 31,153 | | | | 7,968 | |
| | Tencent Holdings, Ltd. (Interactive Media & Services) | | | 275,000 | | | | 12,413 | |
| | | | | | | | | 46,377 | |
| | India—1.6% | | | | | | | | |
| | Housing Development Finance Corporation, Ltd. (Thrifts & mortgage finance) | | | 277,223 | | | | 8,813 | |
| | Taiwan—2.4% | | | | | | | | |
| | Taiwan Semiconductor Manufacturing Co., Ltd. (Semiconductors & semiconductor equipment) | | | 1,692,000 | | | | 13,020 | |
| | | | | | | | | | |
| | Asia—9.7% | | | | | | | | |
| | Australia—5.1% | | | | | | | | |
| | Aristocrat Leisure, Ltd. (Hotels, restaurants & leisure) | | | 274,593 | | | | 5,922 | |
| | CSL, Ltd. (Biotechnology) | | | 72,903 | | | | 11,004 | |
| | Macquarie Group, Ltd. (Capital markets) | | | 123,695 | | | | 10,889 | |
| | | | | | | | | 27,815 | |
See accompanying Notes to Financial Statements.
| 40 | Semiannual Report | June 30, 2019 |
International Leaders Fund
Portfolio of Investments, June 30, 2019(all dollar amounts in thousands) (unaudited)
| | | | | | | | |
| | | | | | |
| | Issuer | | Shares | | Value | |
| | | | | | |
| | Common Stocks—(continued) | | | | | | | | |
| | | | | | | | | | |
| | Asia—(continued) | | | | | | | | |
| | Hong Kong—4.6% | | | | | | | | |
| | AIA Group, Ltd. (Insurance) | | | 1,670,800 | | | $ | 18,020 | |
| | Galaxy Entertainment Group, Ltd. (Hotels, restaurants & leisure) | | | 1,050,000 | | | | 7,077 | |
| | | | | | | | | 25,097 | |
| | | | | | | | | | |
| | Canada—9.3% | | | | | | | | |
| | Brookfield Asset Management, Inc. Class “A” (Capital markets)† | | | 240,836 | | | | 11,507 | |
| | Canadian National Railway Co. (Road & rail) | | | 151,816 | | | | 14,051 | |
| | Dollarama, Inc. (Multiline retail) | | | 183,201 | | | | 6,445 | |
| | Rogers Communications, Inc. Class “B” (Wireless telecommunication services) | | | 128,845 | | | | 6,897 | |
| | The Toronto-Dominion Bank (Banks) | | | 204,127 | | | | 11,928 | |
| | | | | | | | | 50,828 | |
| | | | | | | | | | |
| | Japan—8.0% | | | | | | | | |
| | Daikin Industries, Ltd. (Building products) | | | 60,700 | | | $ | 7,919 | |
| | Keyence Corporation (Electronic equipment, instruments & components) | | | 22,200 | | | | 13,617 | |
| | Nitori Holdings Co., Ltd. (Specialty retail) | | | 50,600 | | | | 6,702 | |
| | Shiseido Co., Ltd. (Personal products) | | | 131,000 | | | | 9,867 | |
| | SMC Corporation (Machinery) | | | 15,700 | | | | 5,849 | |
| | | | | | | | | 43,954 | |
| | | | | | | | | | |
| | Emerging Europe, Mid-East, Africa—0.8% | | | |
| | South Africa—0.8% | | | | | | | | |
| | Bid Corporation, Ltd. (Food & staples retailing) | | | 190,867 | | | | 4,160 | |
| | Total Common Stocks—96.9%
(cost $427,877) | | | | | | | 529,004 | |
| | | | | | | | | | |
| | Rights | | | | | | | | |
| | Spain—0.1% | | | | | | | | |
| * | ACS Actividades de Construccion y Servicios S.A.
(Construction & engineering) | | | 242,788 | | | | 381 | |
| | Total Rights—0.1%
(cost $400) | | | | | | | 381 | |
| | | | | | | | |
| | Issuer | | Principal
Amount | | Value | |
| | | | | | |
| | Repurchase Agreement | | | | | | | | |
| | Fixed Income Clearing Corporation, 0.500% dated 6/28/19, due 7/1/19, repurchase price $17,338, collateralized by U.S. Treasury Note, 1.500%, due 8/15/26 | | $ | 17,337 | | | $ | 17,337 | |
| | Total Repurchase Agreement—3.2%
(cost $17,337) | | | | | | | 17,337 | |
| | Total Investments—100.2%
(cost $445,614) | | | | | | | 546,722 | |
| | Liabilities, plus cash and other assets—(0.2)% | | | | | | | (1,102 | ) |
| | Net assets—100.0% | | | | | | $ | 545,620 | |
ADR = American Depository Receipt
REIT = Real Estate Investment Trust
* = Non-income producing security
† = U.S. listed foreign security
For securities primarily traded on exchanges or markets that close before the close of regular trading on the New York Stock Exchange, the Fund may use an independent pricing service to fair value price the securities pursuant to Valuation Procedures approved by the Board of Trustees.
At June 30, 2019, the Fund’s Portfolio of Investments includes the following industry categories (as a percentage of long-term investments):
| Industrials | | | 23.4 | % |
| Information Technology | | | 19.1 | % |
| Financials | | | 17.8 | % |
| Consumer Discretionary | | | 13.1 | % |
| Health Care | | | 8.9 | % |
| Communication Services | | | 5.2 | % |
| Consumer Staples | | | 4.7 | % |
| Energy | | | 3.1 | % |
| Utilities | | | 1.7 | % |
| Materials | | | 1.5 | % |
| Real Estate | | | 1.5 | % |
| Total | | | 100.0 | % |
At June 30, 2019, the Fund’s Portfolio of Investments includes the following currency categories (as a percentage of long-term investments):
| Euro | | | 27.4 | % |
| British Pound Sterling | | | 14.0 | % |
| Hong Kong Dollar | | | 9.2 | % |
| Japanese Yen | | | 8.3 | % |
| U.S. Dollar | | | 8.1 | % |
| Swiss Franc | | | 7.6 | % |
| Canadian Dollar | | | 7.4 | % |
| Australian Dollar | | | 5.2 | % |
| Danish Krone | | | 4.3 | % |
| Swedish Krona | | | 3.5 | % |
| New Taiwan Dollar | | | 2.5 | % |
| Indian Rupee | | | 1.7 | % |
| All Other Currencies | | | 0.8 | % |
| Total | | | 100.0 | % |
See accompanying Notes to Financial Statements.
| June 30, 2019 | William Blair Funds | 41 |
| | International Developed Plus Fund (In Liquidation) |
| | |
| | The International Developed Plus Fund seeks long-term capital appreciation. |
| | |
| | AN OVERVIEW FROM THE PORTFOLIO MANAGERS |
| | |

David Merjan 
John C. Murphy | The William Blair International Developed Plus Fund (Class N shares) posted a 21.02% increase, net of fees, for the six months ended June 30, 2019. By comparison, the Fund’s benchmark index, the MSCI World ex-U.S. Index (net) (the “Index”), increased 14.64%. Six-month outperformance versus the Index was primarily driven by positive stock selection across most sectors. The Financials and Industrials sectors were the most notable contributors to the Fund’s relative return. Within the Financials sector, Partners Group Holding AG and AIA Group Ltd. enhanced relative performance. Switzerland-based asset manager Partners Group’s share price was supported by solid fiscal year 2018 results, including base management fees, EBITDA and dividend payouts that were above consensus estimates. Client demand remains strong for private market investments and Partners Group remains selective on asset purchases given structurally high valuations. AIA Group is a leading pan-Asian insurer. The company continues to benefit from strong demand for its products due to its dominant brand position and competitive advantages in distribution and product innovation, coupled with rising affluence and insurance penetration within Asia. Furthermore, China announced plans to further open up its insurance markets to foreign competition, booting sentiment in the sector. France aircraft manufacturer Airbus SE led performance within the Industrials sector. Product transitions to the next generation of aircrafts that have pressured earnings and cash flows at the company over the last several years have peaked, leaving Airbus in a favorable position where investment is moderating and profitability is poised to improve. Partially offsetting these effects were underweight allocations to Europe and Japan, which outperformed the Index during the period, coupled with below average stock selection within the Communication Services and Energy sectors. Within the Communications Services sector, Canadian telecom company Rogers Communications, Inc. detracted from performance, as the share price was hampered by weaker wireless subscriber growth. While still generally healthy, the wireless market outlook is more moderated in 2019 versus the prior two years where we saw solid subscriber growth and strong pricing trends. Returns from Rogers’ wireless segment in the first quarter of 2019, coupled with some market share loss, underscored this reality. We sold the position as a result. Within Energy, Canada-based oil and gas company Enerplus Corporation detracted from performance, due to weaker oil prices and mixed financial results. Enerplus’s overall production declined 9.5% sequentially as the company lowered operating activity following weaker oil pricing. Please refer to the Global Markets Review and Outlook relating to the Fund beginning on page 32 for additional information. |
| 42 | Semiannual Report | June 30, 2019 |
International Developed Plus Fund (In Liquidation)
Performance Highlights (Unaudited)
| Average Annual Total Return through 6/30/2019 | | | |
| | | | Year
to Date | | | 1 Year | | | 3 Year | | | 5 Year | | | 10 Year |
| Class N | | | 21.02 | % | | | 3.51 | % | | | 8.15 | % | | | 3.14 | % | | | 7.17 | % |
| Class I | | | 21.16 | | | | 3.74 | | | | 8.42 | | | | 3.40 | | | | 7.43 | |
| MSCI World Ex-U.S. Index (net) | | | 14.64 | | | | 1.29 | | | | 9.01 | | | | 2.04 | | | | 6.75 | |
Performance cited represents past performance. Past performance does not guarantee future results and current performance may be lower or higher than the data quoted. Results shown are average annual returns, which assume reinvestment of dividends and capital gains. Investment returns and principal will fluctuate and you may have a gain or loss when you sell shares. For the most current month-end performance information, please call 1-800-742-7272, or visit our Web site atwww.williamblairfunds.com. Investing in smaller and medium capitalization companies involves special risks, including higher volatility and lower liquidity. Smaller and medium capitalization stocks are also more sensitive to purchase/sale transactions and changes in the issuer’s financial condition. International investing involves special risk considerations, including currency fluctuations, lower liquidity, economic and political risk. From time to time the investment adviser may waive fees or reimburse expenses for the Fund. Without these waivers/reimbursements, performance would be lower. Class N shares are not subject to a sales load. Class I shares are not subject to a sales load or distribution (Rule 12b-1) fees.
The performance highlights and graph presented above do not reflect the deduction of taxes that a shareholder would pay on fund distributions or the redemption of fund shares.
The Morgan Stanley Capital International (MSCI) World Ex-U.S. Index (net) is a free float-adjusted market capitalization weighted index that is designed to measure the equity market performance of developed markets, excluding the United States. This index approximates the minimum possible dividend reinvestment by deducting for the highest possible withholding tax rates of those markets.
This report identifies the Fund’s investments on June 30, 2019. These holdings are subject to change. Not all stocks in the Fund performed the same, nor is there any guarantee that these stocks will perform as well in the future. Market forecasts provided in this report may not necessarily come to pass.
Sector Diversification (Unaudited)
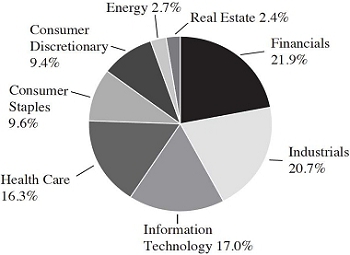
The sector diversification shown is based on the total long-term securities.
| June 30, 2019 | William Blair Funds | 43 |
International Developed Plus Fund (In Liquidation)
Portfolio of Investments, June 30, 2019(all dollar amounts in thousands) (unaudited)
| | | | | | | | |
| | | | | | | | |
| | Issuer | | Shares | | | Value | |
| | | | | | | | |
| | Common Stocks | | | | | | | | |
| | | | | | | | | | |
| | Europe—58.2% | | | | | | | | |
| | Denmark—2.7% | | | | | | | | |
| | DSV A/S (Road & rail) | | | 4,368 | | | $ | 429 | |
| | France—13.4% | | | | | | | | |
| | Airbus SE (Aerospace & defense) | | | 4,725 | | | | 670 | |
| | Capgemini SE (IT services) | | | 3,862 | | | | 480 | |
| | LVMH Moet Hennessy Louis Vuitton SE (Textiles, apparel & luxury goods) | | | 1,198 | | | | 510 | |
| | Safran S.A. (Aerospace & defense) | | | 3,368 | | | | 494 | |
| | | | | | | | | 2,154 | |
| | Germany—13.1% | | | | | | | | |
| | Infineon Technologies AG (Semiconductors & semiconductor equipment) | | | 21,914 | | | | 387 | |
| | MTU Aero Engines AG (Aerospace & defense) | | | 3,483 | | | | 830 | |
| * | QIAGEN N.V. (Life sciences tools & services)† | | | 6,956 | | | | 282 | |
| | SAP SE (Software) | | | 4,355 | | | | 598 | |
| | | | | | | | | 2,097 | |
| | Ireland—6.3% | | | | | | | | |
| | Accenture plc Class “A” (IT services)† | | | 2,169 | | | | 401 | |
| | Kerry Group plc Class “A” (Food products) | | | 5,060 | | | | 604 | |
| | | | | | | | | 1,005 | |
| | Netherlands—4.8% | | | | | | | | |
| * | Adyen N.V. (IT services) | | | 210 | | | | 162 | |
| | Royal Dutch Shell plc Class “A” (Oil, gas & consumable fuels) | | | 18,420 | | | | 601 | |
| | | | | | | | | 763 | |
| | Sweden—2.2% | | | | | | | | |
| | Atlas Copco AB Class “A” (Machinery) | | | 11,303 | | | | 361 | |
| | Switzerland—15.7% | | | | | | | | |
| * | Alcon, Inc. (Health care equipment & supplies) | | | 6,197 | | | | 383 | |
| | Novartis AG (Pharmaceuticals) | | | 5,196 | | | | 475 | |
| | Partners Group Holding AG (Capital markets) | | | 1,057 | | | | 830 | |
| | Straumann Holding AG (Health care equipment & supplies) | | | 547 | | | | 483 | |
| | Tecan Group AG (Life sciences tools & services) | | | 1,322 | | | | 343 | |
| | | | | | | | | 2,514 | |
| | | | | | | | | | |
| | United Kingdom—26.0% | | | | | | | | |
| | AstraZeneca plc (Pharmaceuticals) | | | 8,275 | | | | 677 | |
| | Compass Group plc (Hotels, restaurants & leisure) | | | 44,198 | | | | 1,059 | |
| | Diageo plc (Beverages) | | | 24,747 | | | | 1,063 | |
| | Halma plc (Electronic equipment, instruments & components) | | | 18,303 | | | | 470 | |
| | Legal & General Group plc (Insurance) | | | 88,671 | | | | 303 | |
| | Prudential plc (Insurance) | | | 27,059 | | | | 590 | |
| | | | | | | | | 4,162 | |
| | | | | | | | |
| | | | | | | | |
| | Issuer | | Shares | | | Value | |
| | | | | | | | |
| | Common Stocks—(continued) | | | | | | | | |
| | | | | | | | | | |
| | Japan—15.0% | | | | | | | | |
| | Daikin Industries, Ltd. (Building products) | | | 4,118 | | | $ | 537 | |
| | Hoya Corporation (Health care equipment & supplies) | | | 5,800 | | | | 444 | |
| | Keyence Corporation (Electronic equipment, instruments & components) | | | 1,100 | | | | 675 | |
| | Nihon M&A Center, Inc. (Professional services) | | | 11,380 | | | | 273 | |
| | Shiseido Co., Ltd. (Personal products) | | | 6,300 | | | | 474 | |
| | | | | | | | | 2,403 | |
| | | | | | | | | | |
| | Canada—14.2% | | | | | | | | |
| | Brookfield Asset Management, Inc. Class “A” (Capital markets)† | | | 9,850 | | | | 471 | |
| | Canadian National Railway Co. (Road & rail)† | | | 10,565 | | | | 977 | |
| | The Toronto-Dominion Bank (Banks)† | | | 14,213 | | | | 829 | |
| | | | | | | | | 2,277 | |
| | | | | | | | | | |
| | Asia—12.4% | | | | | | | | |
| | Australia—6.6% | | | | | | | | |
| | CSL, Ltd. (Biotechnology) | | | 3,576 | | | | 540 | |
| | Goodman Group (Equity REIT) | | | 49,863 | | | | 526 | |
| | | | | | | | | 1,066 | |
| | Hong Kong—5.8% | | | | | | | | |
| | AIA Group, Ltd. (Insurance) | | | 85,586 | | | | 923 | |
| | | | | | | | | | |
| | Emerging Asia—10.8% | | | | | | | | |
| | China—3.2% | | | | | | | | |
| * | Alibaba Group Holding, Ltd.—ADR (Internet & direct marketing retail) | | | 3,063 | | | | 519 | |
| | India—3.8% | | | | | | | | |
| | HDFC Bank, Ltd.-ADR (Banks) | | | 4,636 | | | | 603 | |
| | Taiwan—3.8% | | | | | | | | |
| | Taiwan Semiconductor Manufacturing Co., Ltd.—ADR (Semiconductors & semiconductor equipment) | | | 15,423 | | | | 604 | |
| | | | | | | | | | |
| | Emerging Latin America—2.0% | | | | | | | | |
| | Peru—2.0% | | | | | | | | |
| | Credicorp, Ltd. (Banks)† | | | 1,405 | | | | 322 | |
| | Total Common Stocks—138.6%
(cost $18,183) | | | | | | | 22,202 | |
See accompanying Notes to Financial Statements.
| 44 | Semiannual Report | June 30, 2019 |
International Developed Plus Fund (In Liquidation)
Portfolio of Investments, June 30, 2019(all dollar amounts in thousands) (unaudited)
| | | | | | | | |
| | Issuer | | Principal
Amount | | | Value | |
| | | | | | | | |
| | Repurchase Agreement | | | | | | | | |
| | Fixed Income Clearing Corporation, 0.500% dated 6/28/19, due 7/1/19, repurchase price $2,046, collateralized by U.S. Treasury Note, 1.500%, due 8/15/26 | | | $2,046 | | | $ | 2,046 | |
| | Total Repurchase Agreement—12.8%
(cost $2,046) | | | | | | | 2,046 | |
| | Total Investments—151.4%
(cost $20,229) | | | | | | | 24,248 | |
| | Liabilities, plus cash and other assets—(51.4)% | | | | | | | (8,237 | ) |
| | Net assets—100.0% | | | | | | $ | 16,011 | |
ADR = American Depository Receipt
REIT = Real Estate Investment Trust
* = Non-income producing security
† = U.S. listed foreign security
For securities primarily traded on exchanges or markets that close before the close of regular trading on the New York Stock Exchange, the Fund may use an independent pricing service to fair value price the securities pursuant to Valuation Procedures approved by the Board of Trustees.
At June 30, 2019, the Fund’s Portfolio of Investments includes the following industry categories (as a percentage of long-term investments):
| Financials | | | 21.9 | % |
| Industrials | | | 20.7 | % |
| Information Technology | | | 17.0 | % |
| Health Care | | | 16.3 | % |
| Consumer Staples | | | 9.6 | % |
| Consumer Discretionary | | | 9.4 | % |
| Energy | | | 2.7 | % |
| Real Estate | | | 2.4 | % |
| Total | | | 100.0 | % |
At June 30, 2019, the Fund’s Portfolio of Investments includes the following currency categories (as a percentage of long-term investments):
| Euro | | | 24.0 | % |
| U.S. Dollar | | | 22.6 | % |
| British Pound Sterling | | | 18.8 | % |
| Swiss Franc | | | 11.3 | % |
| Japanese Yen | | | 10.8 | % |
| Australian Dollar | | | 4.8 | % |
| Hong Kong Dollar | | | 4.2 | % |
| Danish Krone | | | 1.9 | % |
| Swedish Krona | | | 1.6 | % |
| Total | | | 100.0 | % |
See accompanying Notes to Financial Statements.
| June 30, 2019 | William Blair Funds | 45 |
| | Institutional International Developed Plus Fund (In Liquidation) |
| | |
| | The Institutional International Developed Plus Fund seeks long-term capital appreciation. |
| | |
| | AN OVERVIEW FROM THE PORTFOLIO MANAGERS |
| | |

David Merjan 
John C. Murphy | The William Blair Institutional International Developed Plus Fund posted a 20.69% increase, net of fees, for the six months ended June 30, 2019. By comparison, the Fund’s benchmark index, the MSCI World ex-U.S. Index (net) (the “Index”), increased 14.64%. Six-month outperformance versus the Index was primarily driven by positive stock selection across most sectors. The Financials and Industrials sectors were the most notable contributors to the Fund’s relative return. Within the Financials sector, Partners Group Holding AG and AIA Group Ltd. enhanced relative performance. Switzerland-based asset manager Partners Group’s share price was supported by solid fiscal year 2018 results, including base management fees, EBITDA and dividend payouts that were above consensus estimates. Client demand remains strong for private market investments and Partners Group remains selective on asset purchases given structurally high valuations. AIA Group is a leading pan-Asian insurer. The company continues to benefit from strong demand for its products due to its dominant brand position and competitive advantages in distribution and product innovation, coupled with rising affluence and insurance penetration within Asia. Furthermore, China announced plans to further open up its insurance markets to foreign competition, booting sentiment in the sector. France aircraft manufacturer Airbus SE led performance within the Industrials sector. Product transitions to the next generation of aircrafts that have pressured earnings and cash flows at the company over the last several years have peaked, leaving Airbus in a favorable position where investment is moderating and profitability is poised to improve. Partially offsetting these effects were underweight allocations to Europe and Japan, which outperformed the Index during the period, coupled with below average stock selection within the Communication Services and Energy sectors. Within the Communications Services sector, Canadian telecom company Rogers Communications, Inc. detracted from performance, as the share price was hampered by weaker wireless subscriber growth. While still generally healthy, the wireless market outlook is more moderated in 2019 versus the prior two years where we saw solid subscriber growth and strong pricing trends. Returns from Rogers’ wireless segment in the first quarter of 2019, coupled with some market share loss, underscored this reality. We sold the position as a result. Within Energy, Canada-based oil and gas company Enerplus Corporation detracted from performance, due to weaker oil prices and mixed financial results. Enerplus’s overall production declined 9.5% sequentially as the company lowered operating activity following weaker oil pricing. Please refer to the Global Markets Review and Outlook relating to the Fund beginning on page 32 for additional information. |
| 46 | Semiannual Report | June 30, 2019 |
Institutional International Developed Plus Fund (In Liquidation)
Performance Highlights (Unaudited)
Average Annual Total Return through 6/30/2019
| | | Year
to Date | | 1 Year | | 3 Year | | 5 Year | | 10 Year |
| Institutional International Developed Plus Fund | | | 20.69 | % | | | 3.43 | % | | | 8.92 | % | | | 3.74 | % | | | 7.63 | % |
| MSCI World Ex-U.S. Index (net) | | | 14.64 | | | | 1.29 | | | | 9.01 | | | | 2.04 | | | | 6.75 | |
During the first quarter of 2018, the Fund received a litigation settlement that positively impacted the Fund’s performance. This was a one-time event that is not likely to be repeated. With the passage of time the impact of this settlement on the Fund’s performance is likely to diminish.
Performance cited represents past performance. Past performance does not guarantee future results and current performance may be lower or higher than the data quoted. Results shown are average annual returns, which assume reinvestment of dividends and capital gains. Investment returns and principal will fluctuate and you may have a gain or loss when you sell shares. For the most current month end performance information, please call 1-800-742-7272, or visit our Web site atwww.williamblairfunds.com. Investing in smaller and medium capitalization companies involves special risks, including higher volatility and lower liquidity. Smaller and medium capitalization stocks are also more sensitive to purchase/sale transactions and changes in the issuer’s financial condition. International investing involves special risk considerations, including currency fluctuations, lower liquidity, economic and political risk. From time to time, the investment adviser may waive fees or reimburse expenses for the Fund. Without these waivers/reimbursements, performance would be lower. Shares of the Fund are not subject to a sales load, distribution (Rule 12b-1) fees, or sub-transfer agent fees.
The performance highlights and graph presented above do not reflect the deduction of taxes that a shareholder would pay on fund distributions or the redemption of fund shares.
The Morgan Stanley Capital International (MSCI) World Ex-U.S. Index (net) is a free float-adjusted market capitalization weighted index that is designed to measure the equity market performance of developed markets, excluding the United States. This index approximates the minimum possible dividend reinvestment by deducting for the highest possible withholding tax rates of those markets.
This report identifies the Fund’s investments on June 30, 2019. These holdings are subject to change. Not all stocks in the Fund performed the same, nor is there any guarantee that these stocks will perform as well in the future. Market forecasts provided in this report may not necessarily come to pass.
Sector Diversification (Unaudited)

The sector diversification shown is based on the total long-term securities.
| June 30, 2019 | William Blair Funds | 47 |
Institutional International Developed Plus Fund (In Liquidation)
Portfolio of Investments, June 30, 2019(all dollar amounts in thousands) (unaudited)
| | | | | | | | |
| | | | | | | | |
| | Issuer | | Shares | | | Value | |
| | | | | | | | | | |
| | Common Stocks | | | | | | | | |
| | | | | | | | | | |
| | Europe—38.4% | | | | | | | | |
| | Denmark—1.8% | | | | | | | | |
| | DSV A/S (Road & rail) | | | 3,696 | | | $ | 363 | |
| | France—8.9% | | | | | | | | |
| | Airbus SE (Aerospace & defense) | | | 3,998 | | | | 567 | |
| | Capgemini SE (IT services) | | | 3,268 | | | | 406 | |
| | LVMH Moet Hennessy Louis Vuitton SE (Textiles, apparel & luxury goods) | | | 1,014 | | | | 432 | |
| | Safran S.A. (Aerospace & defense) | | | 2,850 | | | | 417 | |
| | | | | | | | | 1,822 | |
| | Germany—8.6% | | | | | | | | |
| | Infineon Technologies AG (Semiconductors & semiconductor equipment) | | | 18,542 | | | | 328 | |
| | MTU Aero Engines AG (Aerospace & defense) | | | 2,947 | | | | 702 | |
| * | QIAGEN N.V. (Life sciences tools & services)† | | | 5,886 | | | | 239 | |
| | SAP SE (Software) | | | 3,685 | | | | 506 | |
| | | | | | | | | 1,775 | |
| | Ireland—4.1% | | | | | | | | |
| | Accenture plc Class “A” (IT services)† | | | 1,835 | | | | 339 | |
| | Kerry Group plc Class “A” (Food products) | | | 4,281 | | | | 511 | |
| | | | | | | | | 850 | |
| | Netherlands—3.1% | | | | | | | | |
| * | Adyen N.V. (IT services) | | | 178 | | | | 137 | |
| | Royal Dutch Shell plc Class “A” (Oil, gas & consumable fuels) | | | 15,586 | | | | 509 | |
| | | | | | | | | 646 | |
| | Sweden—1.5% | | | | | | | | |
| | Atlas Copco AB Class “A” (Machinery) | | | 9,564 | | | | 306 | |
| | Switzerland—10.4% | | | | | | | | |
| * | Alcon, Inc. (Health care equipment & supplies) | | | 5,243 | | | | 324 | |
| | Novartis AG (Pharmaceuticals) | | | 4,397 | | | | 402 | |
| | Partners Group Holding AG (Capital markets) | | | 894 | | | | 702 | |
| | Straumann Holding AG (Health care equipment & supplies) | | | 463 | | | | 409 | |
| | Tecan Group AG (Life sciences tools & services) | | | 1,119 | | | | 290 | |
| | | | | | | | | 2,127 | |
| | | | | | | | | | |
| | United Kingdom—17.2% | | | | | | | | |
| | AstraZeneca plc (Pharmaceuticals) | | | 7,002 | | | | 572 | |
| | Compass Group plc (Hotels, restaurants & leisure) | | | 37,397 | | | | 896 | |
| | Diageo plc (Beverages) | | | 20,939 | | | | 900 | |
| | Halma plc (Electronic equipment, instruments & components) | | | 15,487 | | | | 397 | |
| | Legal & General Group plc (Insurance) | | | 75,028 | | | | 257 | |
| | Prudential plc (Insurance) | | | 22,895 | | | | 499 | |
| | | | | | | | | 3,521 | |
| | | | | | | | |
| | | | | | | | |
| | Issuer | | Shares | | | Value | |
| | | | | | | | | | |
| | Common Stocks—(continued) | | | | | | | | |
| | | | | | | | | | |
| | Japan—9.7% | | | | | | | | |
| | Daikin Industries, Ltd. (Building products) | | | 3,406 | | | $ | 445 | |
| | Hoya Corporation (Health care equipment & supplies) | | | 4,900 | | | | 375 | |
| | Keyence Corporation (Electronic equipment, instruments & components) | | | 900 | | | | 552 | |
| | Nihon M&A Center, Inc. (Professional services) | | | 9,600 | | | | 230 | |
| | Shiseido Co., Ltd. (Personal products) | | | 5,300 | | | | 399 | |
| | | | | | | | | 2,001 | |
| | | | | | | | | | |
| | Canada—9.4% | | | | | | | | |
| | Brookfield Asset Management, Inc. Class “A” (Capital markets)† | | | 8,334 | | | | 398 | |
| | Canadian National Railway Co. (Road & rail)† | | | 8,939 | | | | 827 | |
| | The Toronto-Dominion Bank (Banks)† | | | 12,026 | | | | 702 | |
| | | | | | | | | 1,927 | |
| | | | | | | | | | |
| | Asia—8.2% | | | | | | | | |
| | Australia—4.4% | | | | | | | | |
| | CSL, Ltd. (Biotechnology) | | | 3,026 | | | | 457 | |
| | Goodman Group (Equity REIT) | | | 42,190 | | | | 445 | |
| | | | | | | | | 902 | |
| | Hong Kong—3.8% | | | | | | | | |
| | AIA Group, Ltd. (Insurance) | | | 72,471 | | | | 782 | |
| | | | | | | | | | |
| | Emerging Asia—7.1% | | | | | | | | |
| | China—2.1% | | | | | | | | |
| * | Alibaba Group Holding, Ltd.-ADR (Internet & direct marketing retail) | | | 2,592 | | | | 439 | |
| | India—2.5% | | | | | | | | |
| | HDFC Bank, Ltd.-ADR (Banks) | | | 3,923 | | | | 510 | |
| | Taiwan—2.5% | | | | | | | | |
| | Taiwan Semiconductor Manufacturing Co., Ltd.—ADR (Semiconductors & semiconductor equipment) | | | 13,050 | | | | 511 | |
| | | | | | | | | | |
| | Emerging Latin America—1.3% | | | | | | | | |
| | Peru—1.3% | | | | | | | | |
| | Credicorp, Ltd. (Banks)† | | | 1,189 | | | | 271 | |
| | Total Common Stocks—91.3%
(cost $14,801) | | | | | | | 18,753 | |
See accompanying Notes to Financial Statements.
| 48 | Semiannual Report | June 30, 2019 |
Institutional International Developed Plus Fund (In Liquidation)
Portfolio of Investments, June 30, 2019(all dollar amounts in thousands) (unaudited)
| | | | | | | | |
| | Issuer | | Principal
Amount | | | Value | |
| | | | | | | | | | |
| | Repurchase Agreement | | | | | | | | |
| | Fixed Income Clearing Corporation, 0.500% dated 6/28/19, due 7/1/19, repurchase price $1,760, collateralized by U.S. Treasury Note, 1.500%, due 8/15/26 | | | $1,760 | | | $ | 1,760 | |
| | Total Repurchase Agreement—8.6%
(cost $1,760) | | | | | | | 1,760 | |
| | Total Investments—99.9%
(cost $16,561) | | | | | | | 20,513 | |
| | Cash and other assets, less liabilities—0.1% | | | | | | | 16 | |
| | Net assets—100.0% | | | | | | $ | 20,529 | |
ADR = American Depository Receipt
REIT = Real Estate Investment Trust
* = Non-income producing security
† = U.S. listed foreign security
For securities primarily traded on exchanges or markets that close before the close of regular trading on the New York Stock Exchange, the Fund may use an independent pricing service to fair value price the securities pursuant to Valuation Procedures approved by the Board of Trustees.
At June 30, 2019, the Fund’s Portfolio of Investments includes the following industry categories (as a percentage of long-term investments):
| Financials | | | 22.0 | % |
| Industrials | | | 20.5 | % |
| Information Technology | | | 16.9 | % |
| Health Care | | | 16.4 | % |
| Consumer Staples | | | 9.7 | % |
| Consumer Discretionary | | | 9.4 | % |
| Energy | | | 2.7 | % |
| Real Estate | | | 2.4 | % |
| Total | | | 100.0 | % |
At June 30, 2019, the Fund’s Portfolio of Investments includes the following currency categories (as a percentage of long-term investments):
| Euro | | | 24.1 | % |
| U.S. Dollar | | | 22.6 | % |
| British Pound Sterling | | | 18.8 | % |
| Swiss Franc | | | 11.3 | % |
| Japanese Yen | | | 10.7 | % |
| Australian Dollar | | | 4.8 | % |
| Hong Kong Dollar | | | 4.2 | % |
| Danish Krone | | | 1.9 | % |
| Swedish Krona | | | 1.6 | % |
| Total | | | 100.0 | % |
See accompanying Notes to Financial Statements.
| June 30, 2019 | William Blair Funds | 49 |
| | International Growth Fund |
| | |
| | The International Growth Fund seeks long-term capital appreciation. |
| | |
| | AN OVERVIEW FROM THE PORTFOLIO MANAGERS |
| | |
 Simon Fennell 
Kenneth J. McAtamney | The William Blair International Growth Fund (Class N shares) posted a 19.27% increase, net of fees, for the six months ended June 30, 2019. By comparison, the Fund’s benchmark index, the MSCI All Country World ex-U.S. IMI Index (net) (the “Index”), increased 13.33%. |
| |
| Six-month outperformance versus the Index was primarily driven by positive stock selection across most sectors. The Financials, Industrials and Consumer Discretionary sectors were the most notable contributors to relative return. Within Financials, Ping An Insurance Group Co. of China, Ltd., an integrated financial services platform comprising insurance, banking and asset management businesses propelled relative results, as the company posted strong operating results in the first quarter. |
| |
| Within Industrials, Airbus SE was an additional source of outperformance. Product transitions to the next generation of aircrafts that have pressured earnings and cash flows at the company over the last several years have peaked, leaving the company in a favorable position where investment is moderating and profitability is poised to improve. |
| |
| Within the Consumer Discretionary sector, Li Ning Co., Ltd. enhanced the Fund’s relative performance. Li Ning sells footwear, apparel, equipment, and accessories for professional and leisure purposes, primarily under the LI-NING brand. The company is in the fourth year of a major turnaround with growth from here most likely to be driven by margin expansion. Overall, the consumer spending environment is supportive and Li Ning is making significant strides in strengthening its execution capabilities in e-commerce and new product development (kids’ and women’s). |
| |
| Partially offsetting these positive effects were underweight allocations to the Emerging Asia region and the Financials sector, coupled with below average stock selection within the Communication Services sector. Within the Communication Services sector, Rogers Communications, Inc., an industry leader with high quality customers and a favorable spectrum position in Canada, reported soft wireless subscription growth, leading us to trim the position. |
| |
| Please refer to the Global Markets Review and Outlook relating to the Fund beginning on page 32 for additional information. |
| 50 | Semiannual Report | June 30, 2019 |
International Growth Fund
Performance Highlights (Unaudited)
| Average Annual Total Return through 6/30/2019 |
| | | Year
to Date | | 1 Year | | 3 Year | | 5 Year | | 10 Year | | Since
Inception(a) |
| Class N | | | 19.27 | % | | | (0.43 | )% | | | 8.44 | % | | | 2.84 | % | | | 8.04 | % | | | — | |
| Class I | | | 19.44 | | | | (0.10 | ) | | | 8.78 | | | | 3.14 | | | | 8.36 | | | | — | |
| Class R6 | | | — | | | | — | | | | — | | | | — | | | | — | | | | 2.10 | % |
| MSCI ACW Ex-U.S. IMI (net) | | | 13.33 | | | | 0.26 | | | | 9.17 | | | | 2.25 | | | | 6.78 | | | | (0.01 | ) |
| (a) | Since inception is for the period from May 2, 2019 (Commencement of Operations) to June 30, 2019. |
Performance cited represents past performance. Past performance does not guarantee future results and current performance may be lower or higher than the data quoted. Results shown are average annual total returns, which assume reinvestment of dividends and capital gains. Investment returns and principal will fluctuate and you may have a gain or loss when you sell shares. For the most current month-end performance information, please call 1-800-742-7272, or visit our Web site atwww.williamblairfunds.com. Investing in smaller and medium capitalization companies involves special risks, including higher volatility and lower liquidity. Smaller and medium capitalization stocks are also more sensitive to purchase/sale transactions and changes in the issuer’s financial condition. International investing involves special risk considerations, including currency fluctuations, lower liquidity, economic and political risk. From time to time, the investment adviser may waive fees or reimburse expenses for the Fund. Without these waivers/reimbursements, performance would be lower. Class N shares are not subject to a sales load. Class I shares are not subject to a sales load or distribution (Rule 12b-1) fees. Class R6 shares are not subject to a sales load, distribution (Rule 12b-1) fees, or sub-transfer agent fees.
The performance highlights and graph presented above do not reflect the deduction of taxes that a shareholder would pay on fund distributions or the redemption of fund shares.
The Morgan Stanley Capital International (MSCI) All Country World (ACW) Ex-U.S. Investable Market Index (IMI) (net) is a free float-adjusted market capitalization weighted index that is designed to measure the equity market performance of developed and emerging markets, excluding the United States. This index approximates the minimum possible dividend reinvestment by deducting for the highest possible withholding tax rates of those markets.
This report identifies the Fund’s investments on June 30, 2019. These holdings are subject to change. Not all stocks in the Fund performed the same, nor is there any guarantee that these stocks will perform as well in the future. Market forecasts provided in this report may not necessarily come to pass.
Sector Diversification (Unaudited)

The sector diversification shown is based on the total long-term securities.
| June 30, 2019 | William Blair Funds | 51 |
International Growth Fund
Portfolio of Investments, June 30, 2019(all dollar amounts in thousands) (unaudited)
| | | | | | | | | | |
| | | | | | | | | | |
| | Issuer | | Shares | | | Value | |
| | | | | | | | | | |
| | Common Stocks | | | | | | | | |
| | | | | | | | | | |
| | Europe, Mid-East—42.6% | | | | | | | | |
| | Belgium—0.1% | | | | | | | | |
| | Melexis N.V. (Semiconductors & semiconductor equipment) | | | 39,947 | | | $ | 2,703 | |
| | Warehouses De Pauw CVA (Equity REIT) | | | 2,558 | | | | 430 | |
| | | | | | | | | 3,133 | |
| | Denmark—3.7% | | | | | | | | |
| | Ambu A/S Class “B” (Health care equipment & supplies) | | | 46,975 | | | | 761 | |
| | Chr Hansen Holding A/S (Chemicals) | | | 98,960 | | | | 9,293 | |
| | Coloplast A/S Class “B” (Health care equipment & supplies) | | | 124,759 | | | | 14,099 | |
| | DSV A/S (Road & rail) | | | 205,404 | | | | 20,171 | |
| * | Genmab A/S (Biotechnology) | | | 61,795 | | | | 11,363 | |
| | Orsted A/S (Electric utilities) | | | 196,973 | | | | 17,032 | |
| | Royal Unibrew A/S (Beverages) | | | 57,254 | | | | 4,178 | |
| | Tryg A/S (Insurance) | | | 108,622 | | | | 3,531 | |
| | | | | | | | | 80,428 | |
| | Finland—0.8% | | | | | | | | |
| | Neste Oyj (Oil, gas & consumable fuels) | | | 519,865 | | | | 17,640 | |
| | France—11.2% | | | | | | | | |
| | Airbus SE (Aerospace & defense) | | | 246,257 | | | | 34,913 | |
| | Alten S.A. (IT services) | | | 26,134 | | | | 3,132 | |
| | Capgemini SE (IT services) | | | 183,676 | | | | 22,839 | |
| | Dassault Systemes SE (Software) | | | 113,831 | | | | 18,160 | |
| | Hermes International (Textiles, apparel & luxury goods) | | | 11,894 | | | | 8,577 | |
| | Ipsen S.A. (Pharmaceuticals) | | | 36,122 | | | | 4,929 | |
| | Kering S.A. (Textiles, apparel & luxury goods) | | | 35,507 | | | | 20,999 | |
| | L’Oreal S.A. (Personal products) | | | 94,196 | | | | 26,831 | |
| | LVMH Moet Hennessy Louis Vuitton SE (Textiles, apparel & luxury goods) | | | 73,279 | | | | 31,189 | |
| | Nexity S.A. (Real estate management & development) | | | 36,865 | | | | 1,593 | |
| | Orpea (Health care providers & services) | | | 51,501 | | | | 6,213 | |
| | Rubis SCA (Gas utilities) | | | 68,282 | | | | 3,845 | |
| | Safran S.A. (Aerospace & defense) | | | 189,236 | | | | 27,726 | |
| | Teleperformance (Professional services) | | | 50,870 | | | | 10,192 | |
| | Thales S.A. (Aerospace & defense) | | | 140,292 | | | | 17,333 | |
| * | Worldline S.A. (IT services) | | | 54,564 | | | | 3,971 | |
| | | | | | | | | 242,442 | |
| | Germany—5.0% | | | | | | | | |
| | Carl Zeiss Meditec AG (Health care equipment & supplies) | | | 54,902 | | | | 5,416 | |
| | GRENKE AG (Diversified financial services) | | | 25,680 | | | | 2,756 | |
| | KION Group AG (Machinery) | | | 59,381 | | | | 3,743 | |
| | MTU Aero Engines AG (Aerospace & defense) | | | 94,098 | | | | 22,416 | |
| | Puma SE (Textiles, apparel & luxury goods) | | | 99,622 | | | | 6,644 | |
| * | QIAGEN N.V. (Life sciences tools & services)† | | | 303,792 | | | | 12,319 | |
| | SAP SE (Software) | | | 233,970 | | | | 32,128 | |
| | | | | | | | | | |
| | | | | | | | | | |
| | Issuer | | Shares | | | Value | |
| | | | | | | | | | |
| | Common Stocks—(continued) | | | | | | | | |
| | | | | | | | | | |
| | Europe, Mid-East—(continued) | | | | | | | | |
| | Germany—(continued) | | | | | | | | |
| | Vonovia SE (Real estate management & development) | | | 466,407 | | | $ | 22,275 | |
| | Washtec AG (Machinery) | | | 16,765 | | | | 1,140 | |
| | | | | | | | | 108,837 | |
| | Ireland—1.8% | | | | | | | | |
| * | ICON plc (Life sciences tools & services)† | | | 82,595 | | | | 12,717 | |
| | Kerry Group plc Class “A” (Food products) | | | 110,087 | | | | 13,144 | |
| | Kingspan Group plc (Building products) | | | 222,160 | | | | 12,065 | |
| | | | | | | | | 37,926 | |
| | Israel—1.2% | | | | | | | | |
| * | Check Point Software Technologies, Ltd. (Software)† | | | 135,746 | | | | 15,693 | |
| * | CyberArk Software, Ltd. (Software)† | | | 25,185 | | | | 3,220 | |
| * | Wix.com, Ltd. (IT services)† | | | 47,924 | | | | 6,810 | |
| | | | | | | | | 25,723 | |
| | Italy—1.9% | | | | | | | | |
| | Amplifon SpA (Health care providers & services) | | | 103,777 | | | | 2,426 | |
| | Banca Generali SpA (Capital markets) | | | 165,635 | | | | 4,769 | |
| | Enel SpA (Electric utilities) | | | 1,555,640 | | | | 10,861 | |
| | Ferrari N.V. (Automobiles) | | | 70,945 | | | | 11,520 | |
| | Interpump Group SpA (Machinery) | | | 116,415 | | | | 3,582 | |
| | Moncler SpA (Textiles, apparel & luxury goods) | | | 99,363 | | | | 4,248 | |
| | Technogym SpA (Leisure products) | | | 273,518 | | | | 3,045 | |
| | | | | | | | | 40,451 | |
| | Luxembourg—0.3% | | | | | | | | |
| | Tenaris S.A. (Energy equipment & services) | | | 440,726 | | | | 5,768 | |
| | Netherlands—5.0% | | | | | | | | |
| * | Adyen N.V. (IT services) | | | 11,091 | | | | 8,558 | |
| | ASML Holding N.V. (Semiconductors & semiconductor equipment) | | | 123,850 | | | | 25,876 | |
| | Euronext N.V. (Capital markets) | | | 57,967 | | | | 4,387 | |
| | Koninklijke Philips N.V. (Health care equipment & supplies) | | | 500,214 | | | | 21,720 | |
| | Royal Dutch Shell plc Class “A” (Oil, gas & consumable fuels) | | | 853,155 | | | | 27,852 | |
| | Wolters Kluwer N.V. (Professional services) | | | 275,864 | | | | 20,082 | |
| | | | | | | | | 108,475 | |
| | Spain—1.9% | | | | | | | | |
| | ACS Actividades de Construccion y Servicios S.A. (Construction & engineering) | | | 302,333 | | | | 12,070 | |
| | Amadeus IT Group S.A. (IT services) | | | 354,576 | | | | 28,086 | |
| | | | | | | | | 40,156 | |
See accompanying Notes to Financial Statements.
| 52 | Semiannual Report | June 30, 2019 |
International Growth Fund
Portfolio of Investments, June 30, 2019(all dollar amounts in thousands) (unaudited)
| | | | | | | | | | |
| | | | | | | | | | |
| | Issuer | | Shares | | | Value | |
| | | | | | | | | | |
| | Common Stocks—(continued) | | | | | | | | |
| | | | | | | | | | |
| | Europe, Mid-East—(continued) | | | | | | | | |
| | Sweden—2.9% | | | | | | | | |
| | Atlas Copco AB Class “A” (Machinery) | | | 551,774 | | | $ | 17,636 | |
| | Evolution Gaming Group AB (Hotels, restaurants & leisure) | | | 231,325 | | | | 4,579 | |
| | Fabege AB (Real estate management & development) | | | 297,615 | | | | 4,479 | |
| | Hexagon AB Class “B” (Electronic equipment, instruments & components) | | | 278,568 | | | | 15,467 | |
| | Indutrade AB (Trading companies & distributors) | | | 137,385 | | | | 4,391 | |
| | Lifco AB Class “B” (Industrial conglomerates) | | | 37,904 | | | | 2,100 | |
| | Nibe Industrier AB Class “B” (Building products) | | | 252,727 | | | | 3,700 | |
| | Nolato AB Class “B” (Industrial conglomerates) | | | 50,999 | | | | 3,111 | |
| * | Swedish Orphan Biovitrum AB (Biotechnology) | | | 247,417 | | | | 4,765 | |
| | Vitrolife AB (Biotechnology) | | | 133,508 | | | | 2,602 | |
| | | | | | | | | 62,830 | |
| | Switzerland—6.8% | | | | | | | | |
| * | Alcon, Inc. (Health care equipment & supplies) | | | 167,198 | | | | 10,325 | |
| | Belimo Holding AG (Building products) | | | 465 | | | | 2,858 | |
| | Logitech International S.A. (Technology hardware, storage & peripherals) | | | 174,816 | | | | 6,986 | |
| * | Lonza Group AG (Life sciences tools & services) | | | 98,423 | | | | 33,211 | |
| | Novartis AG (Pharmaceuticals) | | | 372,053 | | | | 33,996 | |
| | Partners Group Holding AG (Capital markets) | | | 22,915 | | | | 18,004 | |
| | Sika AG (Chemicals) | | | 116,523 | | | | 19,886 | |
| | Tecan Group AG (Life sciences tools & services) | | | 9,705 | | | | 2,517 | |
| * | Temenos AG (Software) | | | 89,664 | | | | 16,042 | |
| * | VAT Group AG (Machinery) | | | 34,569 | | | | 4,258 | |
| | | | | | | | | 148,083 | |
| | | | | | | | | | |
| | Emerging Asia—15.1% | | | | | | | | |
| | China—9.9% | | | | | | | | |
| * | Alibaba Group Holding, Ltd.-ADR (Internet & direct marketing retail) | | | 240,264 | | | | 40,713 | |
| | Centre Testing International Group Co., Ltd. Class “A” (Professional services) | | | 2,955,900 | | | | 4,648 | |
| * | China Mengniu Dairy Co., Ltd. (Food products) | | | 1,893,000 | | | | 7,331 | |
| | China Merchants Bank Co., Ltd. Class “H” (Banks) | | | 4,843,500 | | | | 24,150 | |
| | Country Garden Services Holdings Co., Ltd. (Commercial services & supplies) | | | 1,696,000 | | | | 3,921 | |
| | Huazhu Group, Ltd.-ADR (Hotels, restaurants & leisure) | | | 111,760 | | | | 4,051 | |
| | Kweichow Moutai Co., Ltd. Class “A” (Beverages) | | | 95,953 | | | | 13,747 | |
| | | | | | | | | | |
| | | | | | | | | | |
| | Issuer | | Shares | | | Value | |
| | | | | | | | | | |
| | Common Stocks—(continued) | | | | | | | | |
| | | | | | | | | | |
| | Emerging Asia—(continued) | | | | | | | | |
| | China—(continued) | | | | | | | | |
| | Li Ning Co., Ltd. (Textiles, apparel & luxury goods) | | | 3,854,000 | | | $ | 9,088 | |
| | NetEase, Inc.—ADR (Entertainment) | | | 58,994 | | | | 15,089 | |
| | Ping An Insurance Group Co. of China, Ltd. Class “H” (Insurance) | | | 2,651,500 | | | | 31,838 | |
| | Shenzhou International Group Holdings, Ltd. (Textiles, apparel & luxury goods) | | | 600,000 | | | | 8,249 | |
| | Tencent Holdings, Ltd. (Interactive Media & Services) | | | 988,200 | | | | 44,605 | |
| * | Tencent Music Entertainment Group-ADR (Entertainment) | | | 215,616 | | | | 3,232 | |
| | Vitasoy International Holdings, Ltd. (Food products) | | | 610,000 | | | | 2,932 | |
| | | | | | | | | 213,594 | |
| | India—1.7% | | | | | | | | |
| | HDFC Bank, Ltd. (Banks) | | | 314,520 | | | | 11,122 | |
| | Hexaware Technologies, Ltd. (IT services) | | | 545,847 | | | | 2,983 | |
| | Hindustan Unilever, Ltd. (Household products) | | | 278,220 | | | | 7,210 | |
| | Maruti Suzuki India, Ltd. (Automobiles) | | | 67,132 | | | | 6,360 | |
| | Pidilite Industries, Ltd. (Chemicals) | | | 208,010 | | | | 3,664 | |
| | Titan Co., Ltd. (Textiles, apparel & luxury goods) | | | 296,246 | | | | 5,714 | |
| | | | | | | | | 37,053 | |
| | Indonesia—1.1% | | | | | | | | |
| | PT Astra International Tbk (Automobiles) | | | 1,427,300 | | | | 753 | |
| | PT Bank Central Asia Tbk (Banks) | | | 11,466,200 | | | | 24,328 | |
| | | | | | | | | 25,081 | |
| | South Korea—0.4% | | | | | | | | |
| | Samsung SDI Co., Ltd. (Electronic equipment, instruments & components) | | | 39,355 | | | | 8,061 | |
| | Taiwan—1.5% | | | | | | | | |
| | Eclat Textile Co., Ltd. (Textiles, apparel & luxury goods) | | | 268,000 | | | | 3,434 | |
| | Taiwan Semiconductor Manufacturing Co., Ltd.—ADR (Semiconductors & semiconductor equipment) | | | 737,405 | | | | 28,884 | |
| | | | | | | | | 32,318 | |
| | Thailand—0.5% | | | | | | | | |
| | Airports of Thailand PCL (Transportation infrastructure) | | | 1,861,200 | | | | 4,461 | |
| | Bangkok Dusit Medical Services PCL Class “F” (Health care providers & services) | | | 4,394,500 | | | | 3,725 | |
| | Tisco Financial Group PCL (Banks) | | | 1,100,700 | | | | 3,356 | |
| | | | | | | | | 11,542 | |
See accompanying Notes to Financial Statements.
| June 30, 2019 | William Blair Funds | 53 |
International Growth Fund
Portfolio of Investments, June 30, 2019(all dollar amounts in thousands) (unaudited)
| | | | | | | | | | |
| | | | | | | | | | |
| | Issuer | | Shares | | | Value | |
| | | | | | | | | | |
| | Common Stocks—(continued) | | | | | | | | |
| | | | | | | | | | |
| | United Kingdom—14.6% | | | | | | | | |
| | 3i Group plc (Capital markets) | | | 701,412 | | | $ | 9,919 | |
| | Abcam plc (Biotechnology) | | | 178,637 | | | | 3,344 | |
| | Avast plc (Software) | | | 764,391 | | | | 2,912 | |
| | AVEVA Group plc (Software) | | | 137,305 | | | | 7,048 | |
| | Beazley plc (Insurance) | | | 708,765 | | | | 4,964 | |
| | Big Yellow Group plc (Equity REIT) | | | 345,477 | | | | 4,341 | |
| | Burford Capital, Ltd. (Capital markets) | | | 212,987 | | | | 4,192 | |
| | Close Brothers Group plc (Capital markets) | | | 139,034 | | | | 2,497 | |
| | Compass Group plc (Hotels, restaurants & leisure) | | | 1,460,072 | | | | 34,989 | |
| | Croda International plc (Chemicals) | | | 142,909 | | | | 9,292 | |
| | Diageo plc (Beverages) | | | 719,497 | | | | 30,920 | |
| | Experian plc (Professional services) | | | 1,028,981 | | | | 31,153 | |
| | Fevertree Drinks plc (Beverages) | | | 127,370 | | | | 3,749 | |
| | Greggs plc (Hotels, restaurants & leisure) | | | 317,667 | | | | 9,271 | |
| | Halma plc (Electronic equipment, instruments & components) | | | 473,211 | | | | 12,139 | |
| | Hiscox, Ltd. (Insurance) | | | 429,058 | | | | 9,219 | |
| | Intermediate Capital Group plc (Capital markets) | | | 398,888 | | | | 6,996 | |
| | Intertek Group plc (Professional services) | | | 93,911 | | | | 6,562 | |
| | London Stock Exchange Group plc (Capital markets) | | | 233,267 | | | | 16,252 | |
| | Melrose Industries plc (Electrical equipment) | | | 3,608,177 | | | | 8,287 | |
| | RELX plc (Professional services) | | | 1,017,608 | | | | 24,677 | |
| | Renishaw plc (Electronic equipment, instruments & components) | | | 60,428 | | | | 3,268 | |
| | Rentokil Initial plc (Commercial services & supplies) | | | 2,263,393 | | | | 11,426 | |
| | Rotork plc (Machinery) | | | 1,273,319 | | | | 5,120 | |
| | Segro plc (Equity REIT) | | | 1,374,124 | | | | 12,742 | |
| | Softcat plc (IT services) | | | 212,857 | | | | 2,626 | |
| | Spirax-Sarco Engineering plc (Machinery) | | | 83,503 | | | | 9,740 | |
| | SSP Group plc (Hotels, restaurants & leisure) | | | 506,182 | | | | 4,410 | |
| | St James’s Place plc (Capital markets) | | | 723,232 | | | | 10,085 | |
| | The Weir Group plc (Machinery) | | | 256,452 | | | | 5,037 | |
| | Victrex plc (Chemicals) | | | 190,582 | | | | 5,237 | |
| | WH Smith plc (Specialty retail) | | | 185,552 | | | | 4,642 | |
| | | | | | | | | 317,056 | |
| | | | | | | | | | |
| | Japan—10.6% | | | | | | | | |
| | Asahi Intecc Co., Ltd. (Health care equipment & supplies) | | | 368,400 | | | | 9,069 | |
| | Daikin Industries, Ltd. (Building products) | | | 129,500 | | | | 16,894 | |
| | Digital Arts, Inc. (Software) | | | 23,200 | | | | 2,044 | |
| | GMO Payment Gateway, Inc. (IT services) | | | 64,900 | | | | 4,461 | |
| | Harmonic Drive Systems, Inc. (Machinery) | | | 107,600 | | | | 4,147 | |
| | Hoya Corporation (Health care equipment & supplies) | | | 301,600 | | | | 23,090 | |
| | Keyence Corporation (Electronic equipment, instruments & components) | | | 55,100 | | | | 33,796 | |
| | M3, Inc. (Health care technology) | | | 276,100 | | | | 5,042 | |
| | MISUMI Group, Inc. (Machinery) | | | 276,000 | | | | 6,917 | |
| | MonotaRO Co., Ltd. (Trading companies & distributors) | | | 174,000 | | | | 4,238 | |
| | | | | | | | | | |
| | | | | | | | | | |
| | Issuer | | Shares | | | Value | |
| | | | | | | | | | |
| | Common Stocks—(continued) | | | | | | | | |
| | | | | | | | | | |
| | Japan—(continued) | | | | | | | | |
| | Nichias Corporation (Building products) | | | 105,700 | | | $ | 1,899 | |
| | Nihon M&A Center, Inc. (Professional services) | | | 206,500 | | | | 4,949 | |
| | Nitori Holdings Co., Ltd. (Specialty retail) | | | 43,400 | | | | 5,748 | |
| | Nomura Research Institute, Ltd. (IT services) | | | 379,500 | | | | 6,079 | |
| | Sankyu, Inc. (Road & rail) | | | 76,520 | | | | 4,017 | |
| | Shimadzu Corporation (Electronic equipment, instruments & components) | | | 217,000 | | | | 5,318 | |
| | Shiseido Co., Ltd. (Personal products) | | | 294,600 | | | | 22,190 | |
| | SMC Corporation (Machinery) | | | 38,700 | | | | 14,419 | |
| | TechnoPro Holdings, Inc. (Professional services) | | | 142,400 | | | | 7,555 | |
| | Terumo Corporation (Health care equipment & supplies) | | | 675,300 | | | | 20,106 | |
| | TIS, Inc. (IT services) | | | 152,600 | | | | 7,770 | |
| | Yakult Honsha Co., Ltd. (Food products) | | | 164,700 | | | | 9,700 | |
| | Zenkoku Hosho Co., Ltd. (Diversified financial services) | | | 94,700 | | | | 3,632 | |
| | ZOZO Inc. (Internet & direct marketing retail) | | | 282,800 | | | | 5,296 | |
| | | | | | | | | 228,376 | |
| | | | | | | | | | |
| | Canada—6.7% | | | | | | | | |
| | Alimentation Couche-Tard, Inc. Class “B” (Food & staples retailing) | | | 334,757 | | | | 21,066 | |
| | Brookfield Asset Management, Inc. Class “A” (Capital markets)† | | | 553,360 | | | | 26,440 | |
| | Canadian National Railway Co. (Road & rail) | | | 279,058 | | | | 25,827 | |
| | Canadian Pacific Railway, Ltd. (Road & rail)† | | | 77,407 | | | | 18,209 | |
| * | Lululemon Athletica, Inc. (Textiles, apparel & luxury goods) | | | 49,272 | | | | 8,879 | |
| | Rogers Communications, Inc. Class “B” (Wireless telecommunication services) | | | 406,313 | | | | 21,750 | |
| | The Bank of NT Butterfield & Son, Ltd. (Banks)† | | | 39,637 | | | | 1,346 | |
| | The Toronto-Dominion Bank (Banks) | | | 355,058 | | | | 20,747 | |
| | | | | | | | | 144,264 | |
| | | | | | | | | | |
| | Asia—5.3% | | | | | | | | |
| | Australia—2.6% | | | | | | | | |
| | Aristocrat Leisure, Ltd. (Hotels, restaurants & leisure) | | | 423,329 | | | | 9,130 | |
| | CSL, Ltd. (Biotechnology) | | | 138,657 | | | | 20,929 | |
| | Goodman Group (Equity REIT) | | | 863,748 | | | | 9,114 | |
| | Macquarie Group, Ltd. (Capital markets) | | | 200,714 | | | | 17,669 | |
| | | | | | | | | 56,842 | |
| | Hong Kong—2.5% | | | | | | | | |
| | AIA Group, Ltd. (Insurance) | | | 3,956,800 | | | | 42,674 | |
| | Galaxy Entertainment Group, Ltd. (Hotels, restaurants & leisure) | | | 1,666,000 | | | | 11,229 | |
| | | | | | | | | 53,903 | |
See accompanying Notes to Financial Statements.
| 54 | Semiannual Report | June 30, 2019 |
International Growth Fund
Portfolio of Investments, June 30, 2019(all dollar amounts in thousands) (unaudited)
| | | | | | | | | | |
| | | | | | | | | | |
| | Issuer | | Shares | | | Value | |
| | | | | | | | | | |
| | Common Stocks—(continued) | | | | | | | | |
| | | | | | | | | | |
| | Asia—(continued) | | | | | | | | |
| | New Zealand—0.2% | | | | | | | | |
| | Auckland International Airport, Ltd. (Transportation infrastructure) | | | 515,984 | | | $ | 3,414 | |
| | | | | | | | | | |
| | Emerging Latin America—2.1% | | | | | | | | |
| | Argentina—0.2% | | | | | | | | |
| * | Globant S.A. (Software)† | | | 41,334 | | | | 4,177 | |
| | Brazil—1.0% | | | | | | | | |
| | B3 S.A.-Brasil Bolsa Balcao (Capital markets) | | | 910,100 | | | | 8,878 | |
| | Localiza Rent a Car S.A. (Road & rail) | | | 444,400 | | | | 4,743 | |
| | Lojas Renner S.A. (Multiline retail) | | | 365,100 | | | | 4,484 | |
| | Magazine Luiza S.A. (Multiline retail) | | | 78,900 | | | | 4,338 | |
| | | | | | | | | 22,443 | |
| | Mexico—0.2% | | | | | | | | |
| | Grupo Aeroportuario del Sureste S.A.B. de C.V.-ADR (Transportation infrastructure) | | | 25,206 | | | | 4,086 | |
| | Peru—0.7% | | | | | | | | |
| | Credicorp, Ltd. (Banks)† | | | 62,032 | | | | 14,200 | |
| | | | | | | | | | |
| | Emerging Europe, Mid-East, Africa—1.3% | | | | | | | | |
| | Russia—0.4% | | | | | | | | |
| * | Yandex N.V. Class “A” (Interactive Media & Services)† | | | 241,715 | | | | 9,185 | |
| | South Africa—0.7% | | | | | | | | |
| | Bid Corporation, Ltd. (Food & staples retailing) | | | 160,187 | | | | 3,491 | |
| | Bidvest Group, Ltd. (Industrial conglomerates) | | | 160,187 | | | | 2,154 | |
| | Mr. Price Group, Ltd. (Specialty retail) | | | 215,102 | | | | 3,032 | |
| | RMB Holdings, Ltd. (Diversified financial services) | | | 1,002,657 | | | | 6,008 | |
| | | | | | | | | 14,685 | |
| | United Arab Emirates—0.2% | | | | | | | | |
| | First Abu Dhabi Bank PJSC (Banks) | | | 1,266,854 | | | | 5,125 | |
| | Total Common Stocks—98.3%
(cost $1,736,828) | | | | | | | 2,127,297 | |
| | | | | | | | | | |
| | Rights | | | | | | | | |
| | Spain—0.0% | | | | | | | | |
| * | ACS Actividades de Construccion y Servicios S.A. (Construction & engineering) | | | 305,556 | | | | 479 | |
| | Total Rights—0.0%
(cost $504) | | | | | | | 479 | |
| | | | | | | | | | |
| | Issuer | | Principal
Amount | | | Value | |
| | | | | | | | | | |
| | Repurchase Agreement | | | | | | | | |
| | Fixed Income Clearing Corporation, 0.500% dated 6/28/19, due 7/1/19, repurchase price $10,767, collateralized by U.S. Treasury Note, 1.500%, due 8/15/26 | | | $10,766 | | | $ | 10,766 | |
| | Total Repurchase Agreement—0.5%
(cost $10,766) | | | | | | | 10,766 | |
| | Total Investments—98.8%
(cost $1,748,098) | | | | | | | 2,138,542 | |
| | Cash and other assets, less liabilities—1.2% | | | | | | | 26,374 | |
| | Net assets—100.0% | | | | | | $ | 2,164,916 | |
ADR = American Depository Receipt
REIT = Real Estate Investment Trust
* = Non-income producing security
† = U.S. listed foreign security
For securities primarily traded on exchanges or markets that close before the close of regular trading on the New York Stock Exchange, the Fund may use an independent pricing service to fair value price the securities pursuant to Valuation Procedures approved by the Board of Trustees.
At June 30, 2019, the Fund’s Portfolio of Investments includes the following industry categories (as a percentage of long-term investments):
| Industrials | | | 21.9 | % |
| Information Technology | | | 16.0 | % |
| Financials | | | 15.9 | % |
| Consumer Discretionary | | | 12.9 | % |
| Health Care | | | 12.4 | % |
| Consumer Staples | | | 7.8 | % |
| Communication Services | | | 4.4 | % |
| Real Estate | | | 2.6 | % |
| Energy | | | 2.4 | % |
| Materials | | | 2.2 | % |
| Utilities | | | 1.5 | % |
| Total | | | 100.0 | % |
At June 30, 2019, the Fund’s Portfolio of Investments includes the following currency categories (as a percentage of long-term investments):
| Euro | | | 27.3 | % |
| British Pound Sterling | | | 14.9 | % |
| U.S. Dollar | | | 10.8 | % |
| Japanese Yen | | | 10.7 | % |
| Hong Kong Dollar | | | 8.7 | % |
| Swiss Franc | | | 7.0 | % |
| Canadian Dollar | | | 4.2 | % |
| Danish Krone | | | 3.8 | % |
| Swedish Krona | | | 2.9 | % |
| Australian Dollar | | | 2.7 | % |
| Indian Rupee | | | 1.7 | % |
| Indonesian Rupiah | | | 1.2 | % |
| Brazilian Real | | | 1.1 | % |
| All Other Currencies | | | 3.0 | % |
| Total | | | 100.0 | % |
See accompanying Notes to Financial Statements.
| June 30, 2019 | William Blair Funds | 55 |
| | Institutional International Growth Fund |
| | |
| | The Institutional International Growth Fund seeks long-term capital appreciation. |
| | |
| | AN OVERVIEW FROM THE PORTFOLIO MANAGERS |
| | |
 Simon Fennell 
Kenneth J. McAtamney | The William Blair Institutional International Growth Fund posted a 19.40% increase, net of fees, for the six months ended June 30, 2019. By comparison, the Fund’s benchmark index, the MSCI All Country World ex-U.S. IMI Index (net) (the “Index”), increased 13.33%. Six-month outperformance versus the Index was primarily driven by positive stock selection across most sectors. The Financials, Industrials and Consumer Discretionary sectors were the most notable contributors to relative return. Within Financials, Ping An Insurance Group Co. of China, Ltd., an integrated financial services platform comprising insurance, banking and asset management businesses propelled relative results, as the company posted strong operating results in the first quarter. Within Industrials, Airbus SE was an additional source of outperformance. Product transitions to the next generation of aircrafts that have pressured earnings and cash flows at the company over the last several years have peaked, leaving the company in a favorable position where investment is moderating and profitability is poised to improve. Within the Consumer Discretionary sector, Li Ning Co., Ltd. enhanced the Fund’s relative performance. Li Ning sells footwear, apparel, equipment, and accessories for professional and leisure purposes, primarily under the LI-NING brand. The company is in the fourth year of a major turnaround with growth from here most likely to be driven by margin expansion. Overall, the consumer spending environment is supportive and Li Ning is making significant strides in strengthening its execution capabilities in e-commerce and new product development (kids’ and women’s). Partially offsetting these positive effects were underweight allocations to the Emerging Asia region and the Financials sector, coupled with below average stock selection within the Communication Services sector. Within the Communication Services sector, Rogers Communications, Inc., an industry leader with high quality customers and a favorable spectrum position in Canada, reported soft wireless subscription growth, leading us to trim the position. Please refer to the Global Markets Review and Outlook relating to the Fund beginning on page 32 for additional information. |
| 56 | Semiannual Report | June 30, 2019 |
Institutional International Growth Fund
Performance Highlights (Unaudited)
| Average Annual Total Return through 6/30/2019 |
| | | | Year
to Date | | | 1 Year | | | 3 Year | | | 5 Year | | | 10 Year |
| Institutional International Growth Fund | | | 19.40 | % | | | 0.11 | % | | | 8.90 | % | | | 3.28 | % | | | 8.53 | % |
| MSCI ACW Ex-U.S. IMI (net) | | | 13.33 | | | | 0.26 | | | | 9.17 | | | | 2.25 | | | | 6.78 | |
Performance cited represents past performance. Past performance does not guarantee future results and current performance may be lower or higher than the data quoted. Results shown are average annual returns, which assume reinvestment of dividends and capital gains. Investment returns and principal will fluctuate and you may have a gain or loss when you sell shares. For the most current month-end performance information, please call 1-800-742-7272, or visit our Web site atwww.williamblairfunds.com. From time to time, the investment adviser may waive fees or reimburse expenses for the Fund. Without these waivers/reimbursements, performance would be lower. Investing in smaller and medium capitalization companies involves special risks, including higher volatility and lower liquidity. Smaller and medium capitalization stocks are also more sensitive to purchase/sale transactions and changes in the issuer’s financial condition. International investing involves special risk considerations, including currency fluctuations, lower liquidity, economic and political risk. Shares of the Fund are not subject to a sales load, distribution (Rule 12b-1) fees, or sub-transfer agent fees.
The performance highlights and graph presented above do not reflect the deduction of taxes that a shareholder would pay on fund distributions or the redemption of fund shares.
The Morgan Stanley Capital International (MSCI) All Country World (ACW) Ex-U.S. Investable Market Index (IMI) (net) is a free float-adjusted market capitalization weighted index that is designed to measure the equity market performance of developed and emerging markets, excluding the United States. This index approximates the minimum possible dividend reinvestment by deducting for the highest possible withholding tax rates of those markets.
This report identifies the Fund’s investments on June 30, 2019. These holdings are subject to change. Not all stocks in the Fund performed the same, nor is there any guarantee that these stocks will perform as well in the future. Market forecasts provided in this report may not necessarily come to pass.
Sector Diversification (Unaudited)

The sector diversification shown is based on the total long-term securities.
| June 30, 2019 | William Blair Funds | 57 |
Institutional International Growth Fund
Portfolio of Investments, June 30, 2019(all dollar amounts in thousands) (unaudited)
| | | | | | | | |
| | | | | | | | |
| | Issuer | | Shares | | | Value | |
| | | | | | | | | | |
| | Common Stocks | | | | | | | | |
| | | | | | | | | | |
| | Europe, Mid-East—42.8% | | | | | | | | |
| | Belgium—0.1% | | | | | | | | |
| | Melexis N.V. (Semiconductors & semiconductor equipment) | | | 33,329 | | | $ | 2,255 | |
| | Warehouses De Pauw CVA (Equity REIT) | | | 2,115 | | | | 356 | |
| | | | | | | | | 2,611 | |
| | Denmark—3.7% | | | | | | | | |
| | Ambu A/S Class “B” (Health care equipment & supplies) | | | 38,780 | | | | 628 | |
| | Chr Hansen Holding A/S (Chemicals) | | | 82,566 | | | | 7,753 | |
| | Coloplast A/S Class “B” (Health care equipment & supplies) | | | 104,090 | | | | 11,763 | |
| | DSV A/S (Road & rail) | | | 171,375 | | | | 16,829 | |
| * | Genmab A/S (Biotechnology) | | | 51,558 | | | | 9,481 | |
| | Orsted A/S (Electric utilities) | | | 164,342 | | | | 14,211 | |
| | Royal Unibrew A/S (Beverages) | | | 47,769 | | | | 3,486 | |
| | Tryg A/S (Insurance) | | | 90,628 | | | | 2,946 | |
| | | | | | | | | 67,097 | |
| | Finland—0.8% | | | | | | | | |
| | Neste Oyj (Oil, gas & consumable fuels) | | | 433,741 | | | | 14,717 | |
| | France—11.3% | | | | | | | | |
| | Airbus SE (Aerospace & defense) | | | 205,460 | | | | 29,129 | |
| | Alten S.A. (IT services) | | | 21,600 | | | | 2,589 | |
| | Capgemini SE (IT services) | | | 153,247 | | | | 19,055 | |
| | Dassault Systemes SE (Software) | | | 94,973 | | | | 15,151 | |
| | Hermes International (Textiles, apparel & luxury goods) | | | 9,924 | | | | 7,157 | |
| | Ipsen S.A. (Pharmaceuticals) | | | 30,137 | | | | 4,112 | |
| | Kering S.A. (Textiles, apparel & luxury goods) | | | 29,625 | | | | 17,520 | |
| | L’Oreal S.A. (Personal products) | | | 78,590 | | | | 22,386 | |
| | LVMH Moet Hennessy Louis Vuitton SE (Textiles, apparel & luxury goods) | | | 61,139 | | | | 26,022 | |
| | Nexity S.A. (Real estate management & development) | | | 30,434 | | | | 1,315 | |
| | Orpea (Health care providers & services) | | | 42,968 | | | | 5,184 | |
| | Rubis SCA (Gas utilities) | | | 56,971 | | | | 3,208 | |
| | Safran S.A. (Aerospace & defense) | | | 157,886 | | | | 23,133 | |
| | Teleperformance (Professional services) | | | 42,443 | | | | 8,504 | |
| | Thales S.A. (Aerospace & defense) | | | 117,051 | | | | 14,461 | |
| * | Worldline S.A. (IT services) | | | 45,525 | | | | 3,313 | |
| | | | | | | | | 202,239 | |
| | Germany—5.0% | | | | | | | | |
| | Carl Zeiss Meditec AG (Health care equipment & supplies) | | | 45,806 | | | | 4,519 | |
| | GRENKE AG (Diversified financial services) | | | 21,225 | | | | 2,278 | |
| | KION Group AG (Machinery) | | | 49,543 | | | | 3,123 | |
| | MTU Aero Engines AG (Aerospace & defense) | | | 78,510 | | | | 18,703 | |
| | Puma SE (Textiles, apparel & luxury goods) | | | 83,120 | | | | 5,543 | |
| * | QIAGEN N.V. (Life sciences tools & services)† | | | 253,463 | | | | 10,278 | |
| | SAP SE (Software) | | | 195,209 | | | | 26,806 | |
| | | | | | | | |
| | | | | | | | |
| | Issuer | | Shares | | | Value | |
| | | | | | | | | | |
| | Common Stocks—(continued) | | | | | | | | |
| | | | | | | | | | |
| | Europe, Mid-East—(continued) | | | | | | | | |
| | Germany—(continued) | | | | | | | | |
| | Vonovia SE (Real estate management & development) | | | 389,254 | | | $ | 18,590 | |
| | Washtec AG (Machinery) | | | 13,840 | | | | 941 | |
| | | | | | | | | 90,781 | |
| | Ireland—1.8% | | | | | | | | |
| * | ICON plc (Life sciences tools & services)† | | | 68,912 | | | | 10,611 | |
| | Kerry Group plc Class “A” (Food products) | | | 91,849 | | | | 10,966 | |
| | Kingspan Group plc (Building products) | | | 185,355 | | | | 10,066 | |
| | | | | | | | | 31,643 | |
| | Israel—1.2% | | | | | | | | |
| * | Check Point Software Technologies, Ltd. (Software)† | | | 113,258 | | | | 13,094 | |
| * | CyberArk Software, Ltd. (Software)† | | | 21,012 | | | | 2,686 | |
| * | Wix.com, Ltd. (IT services)† | | | 39,984 | | | | 5,682 | |
| | | | | | | | | 21,462 | |
| | Italy—1.9% | | | | | | | | |
| | Amplifon SpA (Health care providers & services) | | | 85,811 | | | | 2,006 | |
| | Banca Generali SpA (Capital markets) | | | 138,195 | | | | 3,979 | |
| | Enel SpA (Electric utilities) | | | 1,297,924 | | | | 9,062 | |
| | Ferrari N.V. (Automobiles) | | | 59,192 | | | | 9,612 | |
| | Interpump Group SpA (Machinery) | | | 95,306 | | | | 2,933 | |
| | Moncler SpA (Textiles, apparel & luxury goods) | | | 82,902 | | | | 3,544 | |
| | Technogym SpA (Leisure products) | | | 228,206 | | | | 2,540 | |
| | | | | | | | | 33,676 | |
| | Luxembourg—0.3% | | | | | | | | |
| | Tenaris S.A. (Energy equipment & services) | | | 367,714 | | | | 4,812 | |
| | Netherlands—5.0% | | | | | | | | |
| * | Adyen N.V. (IT services) | | | 9,255 | | | | 7,142 | |
| | ASML Holding N.V. (Semiconductors & semiconductor equipment) | | | 103,333 | | | | 21,590 | |
| | Euronext N.V. (Capital markets) | | | 48,170 | | | | 3,645 | |
| | Koninklijke Philips N.V. (Health care equipment & supplies) | | | 417,347 | | | | 18,121 | |
| | Royal Dutch Shell plc Class “A” (Oil, gas & consumable fuels) | | | 711,818 | | | | 23,238 | |
| | Wolters Kluwer N.V. (Professional services) | | | 230,163 | | | | 16,755 | |
| | | | | | | | | 90,491 | |
| | Spain—1.9% | | | | | | | | |
| | ACS Actividades de Construccion y Servicios S.A. (Construction & engineering) | | | 252,247 | | | | 10,071 | |
| | Amadeus IT Group S.A. (IT services) | | | 295,836 | | | | 23,433 | |
| | | | | | | | | 33,504 | |
| | Sweden—2.9% | | | | | | | | |
| | Atlas Copco AB Class “A” (Machinery) | | | 460,364 | | | | 14,714 | |
| | Evolution Gaming Group AB (Hotels, restaurants & leisure) | | | 192,227 | | | | 3,805 | |
See accompanying Notes to Financial Statements.
| 58 | Semiannual Report | June 30, 2019 |
Institutional International Growth Fund
Portfolio of Investments, June 30, 2019(all dollar amounts in thousands) (unaudited)
| | | | | | | | |
| | | | | | | | |
| | Issuer | | Shares | | | Value | |
| | | | | | | | | | |
| | Common Stocks—(continued) | | | | | | | | |
| | | | | | | | | | |
| | Europe, Mid-East—(continued) | | | | | | | | |
| | Sweden—(continued) | | | | | | | | |
| | Fabege AB (Real estate management & development) | | | 248,311 | | | $ | 3,737 | |
| | Hexagon AB Class “B” (Electronic equipment, instruments & components) | | | 232,419 | | | | 12,904 | |
| | Indutrade AB (Trading companies & distributors) | | | 114,165 | | | | 3,649 | |
| | Lifco AB Class “B” (Industrial conglomerates) | | | 31,329 | | | | 1,736 | |
| | Nibe Industrier AB Class “B” (Building products) | | | 210,859 | | | | 3,087 | |
| | Nolato AB Class “B” (Industrial conglomerates) | | | 42,132 | | | | 2,570 | |
| * | Swedish Orphan Biovitrum AB (Biotechnology) | | | 206,429 | | | | 3,976 | |
| | Vitrolife AB (Biotechnology) | | | 111,391 | | | | 2,171 | |
| | | | | | | | | 52,349 | |
| | Switzerland—6.9% | | | | | | | | |
| * | Alcon, Inc. (Health care equipment & supplies) | | | 139,500 | | | | 8,614 | |
| | Belimo Holding AG (Building products) | | | 388 | | | | 2,385 | |
| | Logitech International S.A. (Technology hardware, storage & peripherals) | | | 145,856 | | | | 5,828 | |
| * | Lonza Group AG (Life sciences tools & services) | | | 82,118 | | | | 27,709 | |
| | Novartis AG (Pharmaceuticals) | | | 310,417 | | | | 28,364 | |
| | Partners Group Holding AG (Capital markets) | | | 19,118 | | | | 15,021 | |
| | Sika AG (Chemicals) | | | 97,219 | | | | 16,592 | |
| | Tecan Group AG (Life sciences tools & services) | | | 8,021 | | | | 2,080 | |
| * | Temenos AG (Software) | | | 74,809 | | | | 13,384 | |
| * | VAT Group AG (Machinery) | | | 28,842 | | | | 3,553 | |
| | | | | | | | | 123,530 | |
| | | | | | | | | | |
| | Emerging Asia—15.2% | | | | | | | | |
| | China—9.9% | | | | | | | | |
| * | Alibaba Group Holding, Ltd.—ADR (Internet & direct marketing retail) | | | 200,460 | | | | 33,968 | |
| | Centre Testing International Group Co., Ltd. Class “A” (Professional services) | | | 2,457,000 | | | | 3,863 | |
| * | China Mengniu Dairy Co., Ltd. (Food products) | | | 1,580,000 | | | | 6,118 | |
| | China Merchants Bank Co., Ltd. Class “H” (Banks) | | | 4,041,500 | | | | 20,151 | |
| | Country Garden Services Holdings Co., Ltd. (Commercial services & supplies) | | | 1,414,000 | | | | 3,269 | |
| | Huazhu Group, Ltd.—ADR (Hotels, restaurants & leisure) | | | 92,386 | | | | 3,349 | |
| | Kweichow Moutai Co., Ltd. Class “A” (Beverages) | | | 80,017 | | | | 11,464 | |
| | Li Ning Co., Ltd. (Textiles, apparel & luxury goods) | | | 3,215,500 | | | | 7,582 | |
| | NetEase, Inc.—ADR (Entertainment) | | | 49,221 | | | | 12,589 | |
| | Ping An Insurance Group Co. of China, Ltd. Class “H” (Insurance) | | | 2,212,000 | | | | 26,561 | |
| | | | | | | | |
| | | | | | | | |
| | Issuer | | Shares | | | Value | |
| | | | | | | | | | |
| | Common Stocks—(continued) | | | | | | | | |
| | | | | | | | | | |
| | Emerging Asia—(continued) | | | | | | | | |
| | China—(continued) | | | | | | | | |
| | Shenzhou International Group Holdings, Ltd. (Textiles, apparel & luxury goods) | | | 500,900 | | | $ | 6,887 | |
| | Tencent Holdings, Ltd. (Interactive Media & Services) | | | 824,500 | | | | 37,216 | |
| * | Tencent Music Entertainment Group-ADR (Entertainment) | | | 179,896 | | | | 2,697 | |
| | Vitasoy International Holdings, Ltd. (Food products) | | | 508,000 | | | | 2,442 | |
| | | | | | | | | 178,156 | |
| | India—1.7% | | | | | | | | |
| | HDFC Bank, Ltd. (Banks) | | | 262,415 | | | | 9,280 | |
| | Hexaware Technologies, Ltd. (IT services) | | | 455,419 | | | | 2,489 | |
| | Hindustan Unilever, Ltd. (Household products) | | | 232,129 | | | | 6,016 | |
| | Maruti Suzuki India, Ltd. (Automobiles) | | | 56,010 | | | | 5,306 | |
| | Pidilite Industries, Ltd. (Chemicals) | | | 173,551 | | | | 3,057 | |
| | Titan Co., Ltd. (Textiles, apparel & luxury goods) | | | 247,168 | | | | 4,767 | |
| | | | | | | | | 30,915 | |
| | Indonesia—1.2% | | | | | | | | |
| | PT Astra International Tbk (Automobiles) | | | 1,178,268 | | | | 621 | |
| | PT Bank Central Asia Tbk (Banks) | | | 9,566,606 | | | | 20,298 | |
| | | | | | | | | 20,919 | |
| | South Korea—0.4% | | | | | | | | |
| | Samsung SDI Co., Ltd. (Electronic equipment, instruments & components) | | | 32,835 | | | | 6,725 | |
| | Taiwan—1.5% | | | | | | | | |
| | Eclat Textile Co., Ltd. (Textiles, apparel & luxury goods) | | | 223,000 | | | | 2,858 | |
| | Taiwan Semiconductor Manufacturing Co., Ltd.—ADR (Semiconductors & semiconductor equipment) | | | 615,244 | | | | 24,099 | |
| | | | | | | | | 26,957 | |
| | Thailand—0.5% | | | | | | | | |
| | Airports of Thailand PCL (Transportation infrastructure) | | | 1,552,900 | | | | 3,722 | |
| | Bangkok Dusit Medical Services PCL Class “F” (Health care providers & services) | | | 3,666,500 | | | | 3,108 | |
| | Tisco Financial Group PCL (Banks) | | | 909,800 | | | | 2,774 | |
| | | | | | | | | 9,604 | |
| | | | | | | | | | |
| | United Kingdom—14.7% | | | | | | | | |
| | 3i Group plc (Capital markets) | | | 585,213 | | | | 8,275 | |
| | Abcam plc (Biotechnology) | | | 149,042 | | | | 2,790 | |
| | Avast plc (Software) | | | 637,758 | | | | 2,430 | |
| | AVEVA Group plc (Software) | | | 114,558 | | | | 5,880 | |
| | Beazley plc (Insurance) | | | 591,348 | | | | 4,142 | |
| | Big Yellow Group plc (Equity REIT) | | | 288,244 | | | | 3,622 | |
| | Burford Capital, Ltd. (Capital markets) | | | 177,605 | | | | 3,496 | |
| | Close Brothers Group plc (Capital markets) | | | 116,002 | | | | 2,083 | |
| | Compass Group plc (Hotels, restaurants & leisure) | | | 1,218,190 | | | | 29,193 | |
See accompanying Notes to Financial Statements.
| June 30, 2019 | William Blair Funds | 59 |
Institutional International Growth Fund
Portfolio of Investments, June 30, 2019(all dollar amounts in thousands) (unaudited)
| | | | | | | | |
| | | | | | | | |
| | Issuer | | Shares | | | Value | |
| | | | | | | | | | |
| | Common Stocks—(continued) | | | | | | | | |
| | | | | | | | | | |
| | United Kingdom—(continued) | | | | | | | | |
| | Croda International plc (Chemicals) | | | 119,234 | | | $ | 7,753 | |
| | Diageo plc (Beverages) | | | 600,301 | | | | 25,798 | |
| | Experian plc (Professional services) | | | 858,514 | | | | 25,992 | |
| | Fevertree Drinks plc (Beverages) | | | 106,269 | | | | 3,128 | |
| | Greggs plc (Hotels, restaurants & leisure) | | | 265,041 | | | | 7,735 | |
| | Halma plc (Electronic equipment, instruments & components) | | | 394,816 | | | | 10,128 | |
| | Hiscox, Ltd. (Insurance) | | | 357,978 | | | | 7,692 | |
| | Intermediate Capital Group plc (Capital markets) | | | 332,807 | | | | 5,837 | |
| | Intertek Group plc (Professional services) | | | 78,353 | | | | 5,475 | |
| | London Stock Exchange Group plc (Capital markets) | | | 194,623 | | | | 13,559 | |
| | Melrose Industries plc (Electrical equipment) | | | 3,010,429 | | | | 6,914 | |
| | RELX plc (Professional services) | | | 849,026 | | | | 20,589 | |
| | Renishaw plc (Electronic equipment, instruments & components) | | | 50,417 | | | | 2,726 | |
| | Rentokil Initial plc (Commercial services & supplies) | | | 1,888,429 | | | | 9,533 | |
| | Rotork plc (Machinery) | | | 1,062,376 | | | | 4,271 | |
| | Segro plc (Equity REIT) | | | 1,146,480 | | | | 10,632 | |
| | Softcat plc (IT services) | | | 176,016 | | | | 2,172 | |
| | Spirax-Sarco Engineering plc (Machinery) | | | 69,670 | | | | 8,127 | |
| | SSP Group plc (Hotels, restaurants & leisure) | | | 422,324 | | | | 3,679 | |
| | St James’s Place plc (Capital markets) | | | 603,418 | | | | 8,414 | |
| | The Weir Group plc (Machinery) | | | 213,967 | | | | 4,202 | |
| | Victrex plc (Chemicals) | | | 159,009 | | | | 4,370 | |
| | WH Smith plc (Specialty retail) | | | 154,812 | | | | 3,873 | |
| | | | | | | | | 264,510 | |
| | | | | | | | | | |
| | Japan—10.6% | | | | | | | | |
| | Asahi Intecc Co., Ltd. (Health care equipment & supplies) | | | 304,200 | | | | 7,488 | |
| | Daikin Industries, Ltd. (Building products) | | | 108,000 | | | | 14,089 | |
| | Digital Arts, Inc. (Software) | | | 19,100 | | | | 1,683 | |
| | GMO Payment Gateway, Inc. (IT services) | | | 53,800 | | | | 3,698 | |
| | Harmonic Drive Systems, Inc. (Machinery) | | | 89,900 | | | | 3,465 | |
| | Hoya Corporation (Health care equipment & supplies) | | | 251,600 | | | | 19,262 | |
| | Keyence Corporation (Electronic equipment, instruments & components) | | | 46,000 | | | | 28,215 | |
| | M3, Inc. (Health care technology) | | | 227,800 | | | | 4,160 | |
| | MISUMI Group, Inc. (Machinery) | | | 230,300 | | | | 5,772 | |
| | MonotaRO Co., Ltd. (Trading companies & distributors) | | | 145,200 | | | | 3,536 | |
| | Nichias Corporation (Building products) | | | 87,400 | | | | 1,570 | |
| | Nihon M&A Center, Inc. (Professional services) | | | 172,200 | | | | 4,127 | |
| | Nitori Holdings Co., Ltd. (Specialty retail) | | | 36,200 | | | | 4,795 | |
| | Nomura Research Institute, Ltd. (IT services) | | | 313,200 | | | | 5,017 | |
| | Sankyu, Inc. (Road & rail) | | | 63,760 | | | | 3,347 | |
| | Shimadzu Corporation (Electronic equipment, instruments & components) | | | 181,000 | | | | 4,435 | |
| | | | | | | | |
| | | | | | | | |
| | Issuer | | Shares | | | Value | |
| | | | | | | | | | |
| | Common Stocks—(continued) | | | | | | | | |
| | | | | | | | | | |
| | Japan—(continued) | | | | | | | | |
| | Shiseido Co., Ltd. (Personal products) | | | 245,900 | | | $ | 18,522 | |
| | SMC Corporation (Machinery) | | | 32,200 | | | | 11,997 | |
| | TechnoPro Holdings, Inc. (Professional services) | | | 118,800 | | | | 6,303 | |
| | Terumo Corporation (Health care equipment & supplies) | | | 563,400 | | | | 16,774 | |
| | TIS, Inc. (IT services) | | | 127,300 | | | | 6,482 | |
| | Yakult Honsha Co., Ltd. (Food products) | | | 137,300 | | | | 8,087 | |
| | Zenkoku Hosho Co., Ltd. (Diversified financial services) | | | 79,100 | | | | 3,034 | |
| | ZOZO Inc. (Internet & direct marketing retail) | | | 236,000 | | | | 4,419 | |
| | | | | | | | | 190,277 | |
| | | | | | | | | | |
| | Canada—6.7% | | | | | | | | |
| | Alimentation Couche-Tard, Inc. Class “B” (Food & staples retailing) | | | 279,299 | | | | 17,576 | |
| | Brookfield Asset Management, Inc. Class “A” (Capital markets)† | | | 461,687 | | | | 22,060 | |
| | Canadian National Railway Co. (Road & rail) | | | 232,828 | | | | 21,549 | |
| | Canadian Pacific Railway, Ltd. (Road & rail)† | | | 64,582 | | | | 15,192 | |
| * | Lululemon Athletica, Inc. (Textiles, apparel & luxury goods) | | | 41,109 | | | | 7,408 | |
| | Rogers Communications, Inc. Class “B” (Wireless telecommunication services) | | | 339,002 | | | | 18,147 | |
| | The Bank of NT Butterfield & Son, Ltd. (Banks)† | | | 32,723 | | | | 1,111 | |
| | The Toronto-Dominion Bank (Banks) | | | 296,237 | | | | 17,310 | |
| | | | | | | | | 120,353 | |
| | | | | | | | | | |
| | Asia—5.3% | | | | | | | | |
| | Australia—2.6% | | | | | | | | |
| | Aristocrat Leisure, Ltd. (Hotels, restaurants & leisure) | | | 353,198 | | | | 7,617 | |
| | CSL, Ltd. (Biotechnology) | | | 115,686 | | | | 17,462 | |
| | Goodman Group (Equity REIT) | | | 720,655 | | | | 7,604 | |
| | Macquarie Group, Ltd. (Capital markets) | | | 167,463 | | | | 14,742 | |
| | | | | | | | | 47,425 | |
| | Hong Kong—2.5% | | | | | | | | |
| | AIA Group, Ltd. (Insurance) | | | 3,301,063 | | | | 35,602 | |
| | Galaxy Entertainment Group, Ltd. (Hotels, restaurants & leisure) | | | 1,390,000 | | | | 9,369 | |
| | | | | | | | | 44,971 | |
| | New Zealand—0.2% | | | | | | | | |
| | Auckland International Airport, Ltd. (Transportation infrastructure) | | | 430,504 | | | | 2,849 | |
See accompanying Notes to Financial Statements.
| 60 | Semiannual Report | June 30, 2019 |
Institutional International Growth Fund
Portfolio of Investments, June 30, 2019(all dollar amounts in thousands) (unaudited)
| | | | | | | | |
| | | | | | | | |
| | Issuer | | Shares | | | Value | |
| | | | | | | | | | |
| | Common Stocks—(continued) | | | | | | | | |
| | | | | | | | | | |
| | Emerging Latin America—2.1% | | | | | | | | |
| | Argentina—0.2% | | | | | | | | |
| * | Globant S.A. (Software)† | | | 34,163 | | | $ | 3,452 | |
| | Brazil—1.0% | | | | | | | | |
| | B3 S.A. - Brasil Bolsa Balcao (Capital markets) | | | 759,300 | | | | 7,407 | |
| | Localiza Rent a Car S.A. (Road & rail) | | | 370,700 | | | | 3,956 | |
| | Lojas Renner S.A. (Multiline retail) | | | 304,660 | | | | 3,742 | |
| | Magazine Luiza S.A. (Multiline retail) | | | 65,200 | | | | 3,585 | |
| | | | | | | | | 18,690 | |
| | Mexico—0.2% | | | | | | | | |
| | Grupo Aeroportuario del Sureste S.A.B. de C.V.—ADR (Transportation infrastructure) | | | 20,833 | | | | 3,377 | |
| | Peru—0.7% | | | | | | | | |
| | Credicorp, Ltd. (Banks)† | | | 51,755 | | | | 11,847 | |
| | | | | | | | | | |
| | Emerging Europe, Mid-East, Africa—1.3% | | | | | | | | |
| | Russia—0.4% | | | | | | | | |
| * | Yandex N.V. Class “A” (Interactive Media & Services)† | | | 201,671 | | | | 7,663 | |
| | South Africa—0.7% | | | | | | | | |
| | Bid Corporation, Ltd. (Food & staples retailing) | | | 133,650 | | | | 2,913 | |
| | Bidvest Group, Ltd. (Industrial conglomerates) | | | 133,650 | | | | 1,797 | |
| | Mr. Price Group, Ltd. (Specialty retail) | | | 179,468 | | | | 2,529 | |
| | RMB Holdings, Ltd. (Diversified financial services) | | | 836,552 | | | | 5,013 | |
| | | | | | | | | 12,252 | |
| | United Arab Emirates—0.2% | | | | | | | | |
| | First Abu Dhabi Bank PJSC (Banks) | | | 1,056,981 | | | | 4,276 | |
| | Total Common Stocks—98.7%
(cost $1,455,108) | | | | | | | 1,774,130 | |
| | | | | | | | | | |
| | Rights | | | | | | | | |
| | Spain—0.0% | | | | | | | | |
| * | ACS Actividades de Construccion y Servicios S.A. (Construction & engineering) | | | 252,247 | | | | 396 | |
| | Total Rights—0.0%
(cost $416) | | | | | | | 396 | |
| | | | | | | | |
| | Issuer | | Principal
Amount | | | Value | |
| | | | | | | | | | |
| | Repurchase Agreement | | | | | | | | |
| | Fixed Income Clearing Corporation, 0.500% dated 6/28/19, due 7/1/19, repurchase price $13,848, collateralized by U.S. Treasury Note, 1.500%, due 8/15/26 | | | $13,848 | | | $ | 13,848 | |
| | Total Repurchase Agreement—0.8%
(cost $13,848) | | | | | | | 13,848 | |
| | Total Investments—99.5%
(cost $1,469,372) | | | | | | | 1,788,374 | |
| | Cash and other assets, less liabilities—0.5% | | | | | | | 8,943 | |
| | Net assets—100.0% | | | | | | $ | 1,797,317 | |
ADR = American Depository Receipt
REIT = Real Estate Investment Trust
* = Non-income producing security
† = U.S. listed foreign security
For securities primarily traded on exchanges or markets that close before the close of regular trading on the New York Stock Exchange, the Fund may use an independent pricing service to fair value price the securities pursuant to Valuation Procedures approved by the Board of Trustees.
At June 30, 2019, the Fund’s Portfolio of Investments includes the following industry categories (as a percentage of long-term investments):
| | Industrials | | | 21.9% | |
| | Information Technology | | | 16.0% | |
| | Financials | | | 15.9% | |
| | Consumer Discretionary | | | 12.9% | |
| | Health Care | | | 12.4% | |
| | Consumer Staples | | | 7.8% | |
| | Communication Services | | | 4.4% | |
| | Real Estate | | | 2.6% | |
| | Energy | | | 2.4% | |
| | Materials | | | 2.2% | |
| | Utilities | | | 1.5% | |
| | Total | | | 100.0% | |
At June 30, 2019, the Fund’s Portfolio of Investments includes the following currency categories (as a percentage of long-term investments):
| | Euro | | | 27.3% | |
| | British Pound Sterling | | | 14.9% | |
| | U.S. Dollar | | | 10.8% | |
| | Japanese Yen | | | 10.7% | |
| | Hong Kong Dollar | | | 8.7% | |
| | Swiss Franc | | | 7.0% | |
| | Canadian Dollar | | | 4.2% | |
| | Danish Krone | | | 3.8% | |
| | Swedish Krona | | | 2.9% | |
| | Australian Dollar | | | 2.7% | |
| | Indian Rupee | | | 1.7% | |
| | Indonesian Rupiah | | | 1.2% | |
| | Brazilian Real | | | 1.1% | |
| | All Other Currencies | | | 3.0% | |
| | Total | | | 100.0% | |
See accompanying Notes to Financial Statements.
| June 30, 2019 | William Blair Funds | 61 |
| | International Small Cap Growth Fund |
| | |
| | The International Small Cap Growth Fund seeks long-term capital appreciation. |
| | |
| | AN OVERVIEW FROM THE PORTFOLIO MANAGERS |
| | |

Simon Fennell 
Andrew G. Flynn | The William Blair International Small Cap Growth Fund (Class N shares) posted an 18.73% increase, net of fees, for the six months ended June 30, 2019. By comparison, the Fund’s benchmark index, the MSCI All Country World ex-U.S. Small Cap Index (net) (the “Index”), increased 11.60%. Six-month outperformance versus the Index was primarily driven by positive stock selection across most sectors. The Consumer Discretionary, Financials and Industrials sectors were the most notable contributors to the Fund’s relative return. Within Consumer Discretionary, Chinese sportswear company Li Ning Co., Ltd. was the leading contributor. Li Ning sells footwear, apparel, equipment, and accessories for professional and leisure purposes, primarily under the LI-NING brand. The company is in the fourth year of a major turnaround with growth from here most likely to be driven by margin expansion. Overall, the consumer spending environment is supportive and Li Ning is making significant strides in strengthening its execution capabilities in e-commerce and new product development (kids and women’s). Within Financials, Euronext N.V., a leading pan-European exchange, was an additional source of outperformance. Around 45% of Euronext’s revenue is generated from recurring, non-transaction businesses. Management’s operational execution has been solid with significant cost savings and margin expansion since the IPO in 2014. A strong balance sheet (net cash) provides significant optionality through bolt-on or larger M&A transactions to deliver on revenue diversification and accelerate growth. Within Industrials, Sweden-based Indutrade AB was the top contributor for the six-month period. Indutrade is a leader in the Northern European market for industrial component distribution. The company is differentiated by its high proportion of proprietary products (38% of sales), a range of product offerings from high-quality suppliers, and a technically-savvy sales team, all of which help to reinforce close relationships with customers. Partially offsetting these positive effects were weak stock selection in the Consumer Staples and Materials sectors. Within Consumer Staples, Costa Group Holdings, Ltd., Australia’s leading fresh produce and vegetable company, detracted from performance as the share price sold off on the company’s downward revision to earnings expectations for the fiscal year ended June 2019. The disappointment was driven by pricing weakness for key products including berries, tomatoes and avocados due to unfavorable demand and supply conditions. Within the Materials sector, U.K.-based Scapa Group plc was the largest detractor. Scapa is a niche-focused producer of specialty tapes, where competition is limited and new entrants are deterred by stringent technical specifications and lengthy qualification processes. As Scapa’s engineered products are used in mission-critical components but represent a small portion of overall costs, the company is able to maintain pricing power despite the large size of its customers (e.g. large cable manufacturers, automotive original equipment manufacturers (OEMs), consumer electronics companies). The share price was negatively impacted by the early termination of a large North American contract. Please refer to the Global Markets Review and Outlook relating to the Fund beginning on page 32 for additional information. |
| 62 | Semiannual Report | June 30, 2019 |
International Small Cap Growth Fund
Performance Highlights (Unaudited)
| Average Annual Total Return through 6/30/2019 | | | |
| | | Year
to Date | | 1 Year | | 3 Year | | 5 Year | | 10 Year |
| Class N | | | 18.73 | % | | | (6.34 | )% | | | 5.68 | % | | | 2.31 | % | | | 9.15 | % |
| Class I | | | 18.95 | | | | (6.11 | ) | | | 6.00 | | | | 2.60 | | | | 9.47 | |
| Class R6 | | | 18.95 | | | | (6.06 | ) | | | 6.08 | | | | 2.69 | | | | 9.64 | |
| MSCI ACW Ex-U.S. Small Cap Index (net) | | | 11.60 | | | | (5.94 | ) | | | 7.76 | | | | 2.77 | | | | 8.48 | |
Performance cited represents past performance. Past performance does not guarantee future results and current performance may be lower or higher than the data quoted. Results shown are average annual returns, which assume reinvestment of dividends and capital gains. Investment returns and principal will fluctuate and you may have a gain or loss when you sell shares. For the most current month-end performance information, please call 1-800-742-7272, or visit our Web site atwww.williamblairfunds.com. From time to time, the investment adviser may waive fees or reimburse expenses for the Fund. Without these waivers/reimbursements, performance would be lower. Investing in smaller companies involves special risks, including higher volatility and lower liquidity. Smaller capitalization stocks are also more sensitive to purchase/sale transactions and changes in the issuer’s financial condition. International investing involves special risk considerations, including currency fluctuations, lower liquidity, economic and political risk. Class N shares are not subject to a sales load. Class I shares are not subject to a sales load or distribution (Rule 12b-1) fees. Class R6 shares are not subject to a sales load, distribution (Rule 12b-1) fees, or sub-transfer agent fees.
The performance highlights and graph presented above do not reflect the deduction of taxes that a shareholder would pay on fund distributions or the redemption of fund shares.
The Morgan Stanley Capital International (MSCI) All Country World (ACW) Ex-U.S. Small Cap Index (net) is a free float-adjusted market capitalization weighted index that is designed to measure the equity market performance of small capitalization developed and emerging markets, excluding the United States. This index approximates the minimum possible dividend reinvestment by deducting for the highest possible withholding tax rates of those markets.
This report identifies the Fund’s investments on June 30, 2019. These holdings are subject to change. Not all stocks in the Fund performed the same, nor is there any guarantee that these stocks will perform as well in the future. Market forecasts provided in this report may not necessarily come to pass.
Sector Diversification (Unaudited)

The sector diversification shown is based on the total long-term securities.
| June 30, 2019 | William Blair Funds | 63 |
International Small Cap Growth Fund
Portfolio of Investments, June 30, 2019(all dollar amounts in thousands) (unaudited)
| | | | | | | | |
| | Issuer | | Shares | | | Value | |
| | | | | | | | | | |
| | Common Stocks | | | | | | | | |
| | | | | | | | | | |
| | Europe, Mid-East—35.5% | | | | | | | | |
| | Belgium—2.0% | | | | | | | | |
| | Melexis N.V. (Semiconductors & semiconductor equipment) | | | 34,550 | | | $ | 2,338 | |
| | Warehouses De Pauw CVA (Equity REIT) | | | 21,965 | | | | 3,696 | |
| | | | | | | | | 6,034 | |
| | Denmark—3.1% | | | | | | | | |
| | Ambu A/S Class “B” (Health care equipment & supplies) | | | 22,370 | | | | 362 | |
| * | Netcompany Group A/S (Software) | | | 89,660 | | | | 3,611 | |
| | Royal Unibrew A/S (Beverages) | | | 47,057 | | | | 3,434 | |
| | Tryg A/S (Insurance) | | | 67,936 | | | | 2,209 | |
| | | | | | | | | 9,616 | |
| | Foroe Islands—0.7% | | | | | | | | |
| | Bakkafrost P/F (Food products) | | | 36,336 | | | | 2,028 | |
| | France—6.1% | | | | | | | | |
| | Alten S.A. (IT services) | | | 49,911 | | | | 5,982 | |
| | Ipsen S.A. (Pharmaceuticals) | | | 15,910 | | | | 2,171 | |
| | Nexity S.A. (Real estate management & development) | | | 65,050 | | | | 2,811 | |
| | Rubis SCA (Gas utilities) | | | 65,411 | | | | 3,683 | |
| * | Worldline S.A. (IT services) | | | 59,384 | | | | 4,322 | |
| | | | | | | | | 18,969 | |
| | Germany—3.6% | | | | | | | | |
| | AURELIUS Equity Opportunities SE & Co KGaA (Capital markets) | | | 45,060 | | | | 2,140 | |
| | Carl Zeiss Meditec AG (Health care equipment & supplies) | | | 25,254 | | | | 2,491 | |
| | CTS Eventim AG & Co. KGaA (Entertainment) | | | 32,532 | | | | 1,514 | |
| | GRENKE AG (Diversified financial services) | | | 29,006 | | | | 3,113 | |
| | Norma Group SE (Machinery) | | | 44,290 | | | | 1,835 | |
| | | | | | | | | 11,093 | |
| | Israel—2.7% | | | | | | | | |
| * | CyberArk Software, Ltd. (Software)† | | | 14,284 | | | | 1,826 | |
| | Elbit Systems, Ltd. (Aerospace & defense) | | | 15,557 | | | | 2,315 | |
| | Mizrahi Tefahot Bank, Ltd. (Banks) | | | 109,152 | | | | 2,516 | |
| * | Wix.com, Ltd. (IT services)† | | | 12,956 | | | | 1,841 | |
| | | | | | | | | 8,498 | |
| | Italy—2.1% | | | | | | | | |
| | Amplifon SpA (Health care providers & services) | | | 168,595 | | | | 3,942 | |
| | Brunello Cucinelli SpA (Textiles, apparel & luxury goods) | | | 50,249 | | | | 1,695 | |
| | Technogym SpA (Leisure products) | | | 76,569 | | | | 852 | |
| | | | | | | | | 6,489 | |
| | Jersey—0.9% | | | | | | | | |
| | Sanne Group plc (Capital markets) | | | 297,172 | | | | 2,653 | |
| | | | | | | | |
| | Issuer | | Shares | | | Value | |
| | | | | | | | | | |
| | Common Stocks—(continued) | | | | | | | | |
| | | | | | | | | | |
| | Europe, Mid-East—(continued) | | | | | | | | |
| | Netherlands—2.8% | | | | | | | | |
| * | Basic-Fit N.V. (Hotels, restaurants & leisure) | | | 63,293 | | | $ | 2,227 | |
| | Euronext N.V. (Capital markets) | | | 84,280 | | | | 6,378 | |
| | | | | | | | | 8,605 | |
| | Sweden—7.9% | | | | | | | | |
| | Biotage AB (Life sciences tools & services) | | | 68,871 | | | | 808 | |
| | Evolution Gaming Group AB (Hotels, restaurants & leisure) | | | 224,469 | | | | 4,443 | |
| | Indutrade AB (Trading companies & distributors) | | | 191,771 | | | | 6,129 | |
| | Lifco AB Class “B” (Industrial conglomerates) | | | 32,767 | | | | 1,815 | |
| | Nibe Industrier AB Class “B” (Building products) | | | 163,510 | | | | 2,394 | |
| | Nolato AB Class “B” (Industrial conglomerates) | | | 40,808 | | | | 2,489 | |
| * | Swedish Orphan Biovitrum AB (Biotechnology) | | | 94,610 | | | | 1,822 | |
| | Thule Group AB (Leisure products) | | | 135,352 | | | | 3,344 | |
| | Vitrolife AB (Biotechnology) | | | 65,339 | | | | 1,274 | |
| | | | | | | | | 24,518 | |
| | Switzerland—3.6% | | | | | | | | |
| * | Galenica AG (Pharmaceuticals) | | | 51,472 | | | | 2,584 | |
| | Kardex AG (Machinery) | | | 16,547 | | | | 2,888 | |
| | Tecan Group AG (Life sciences tools & services) | | | 15,221 | | | | 3,948 | |
| * | VAT Group AG (Machinery) | | | 12,592 | | | | 1,551 | |
| | | | | | | | | 10,971 | |
| | | | | | | | | | |
| | Japan—17.5% | | | | | | | | |
| | Asahi Intecc Co., Ltd. (Health care equipment & supplies) | | | 155,000 | | | | 3,816 | |
| | Benefit One, Inc. (Professional services) | | | 142,400 | | | | 2,454 | |
| | Digital Arts, Inc. (Software) | | | 25,100 | | | | 2,212 | |
| | GMO Payment Gateway, Inc. (IT services) | | | 33,000 | | | | 2,268 | |
| | Harmonic Drive Systems, Inc. (Machinery) | | | 51,300 | | | | 1,977 | |
| | Kose Corporation (Personal products) | | | 10,300 | | | | 1,726 | |
| | Matsumotokiyoshi Holdings Co., Ltd. (Food & staples retailing) | | | 119,200 | | | | 3,483 | |
| | Meitec Corporation (Professional services) | | | 35,700 | | | | 1,831 | |
| | MonotaRO Co., Ltd. (Trading companies & distributors) | | | 67,300 | | | | 1,639 | |
| | Nihon M&A Center, Inc. (Professional services) | | | 167,200 | | | | 4,007 | |
| | Nihon Unisys, Ltd. (IT services) | | | 182,500 | | | | 6,119 | |
| | PALTAC Corporation (Distributors) | | | 83,600 | | | | 4,591 | |
| | Park24 Co., Ltd. (Commercial services & supplies) | | | 82,900 | | | | 1,929 | |
| | Sankyu, Inc. (Road & rail) | | | 32,520 | | | | 1,707 | |
| | Stanley Electric Co., Ltd. (Auto components) | | | 57,900 | | | | 1,422 | |
See accompanying Notes to Financial Statements.
| 64 | Semiannual Report | June 30, 2019 |
International Small Cap Growth Fund
Portfolio of Investments, June 30, 2019(all dollar amounts in thousands) (unaudited)
| | | | | | | | |
| | Issuer | | Shares | | | Value | |
| | | | | | | | | | |
| | Common Stocks—(continued) | | | | | | | | |
| | | | | | | | | | |
| | Japan—(continued) | | | | | | | | |
| | TechnoPro Holdings, Inc. (Professional services) | | | 47,400 | | | $ | 2,515 | |
| | TIS, Inc. (IT services) | | | 93,800 | | | | 4,776 | |
| | Tokyo Century Corporation (Diversified financial services) | | | 74,700 | | | | 3,149 | |
| | United Arrows, Ltd. (Specialty retail) | | | 72,800 | | | | 2,272 | |
| | | | | | | | | 53,893 | |
| | | | | | | | | | |
| | United Kingdom—17.4% | | | | | | | | |
| | Abcam plc (Biotechnology) | | | 186,918 | | | | 3,499 | |
| | Avast plc (Software) | | | 640,720 | | | | 2,441 | |
| | AVEVA Group plc (Software) | | | 84,642 | | | | 4,345 | |
| | Beazley plc (Insurance) | | | 752,942 | | | | 5,273 | |
| | Big Yellow Group plc (Equity REIT) | | | 168,816 | | | | 2,121 | |
| | Burford Capital, Ltd. (Capital markets) | | | 166,326 | | | | 3,274 | |
| | Diploma plc (Trading companies & distributors) | | | 184,185 | | | | 3,583 | |
| | Electrocomponents plc (Electronic equipment, instruments & components) | | | 432,892 | | | | 3,479 | |
| | Fevertree Drinks plc (Beverages) | | | 65,746 | | | | 1,935 | |
| | Hill & Smith Holdings plc (Metals & mining) | | | 114,662 | | | | 1,705 | |
| | Intermediate Capital Group plc (Capital markets) | | | 158,976 | | | | 2,788 | |
| | Renishaw plc (Electronic equipment, instruments & components) | | | 26,698 | | | | 1,444 | |
| | Rotork plc (Machinery) | | | 610,575 | | | | 2,455 | |
| | Safestore Holdings plc (Equity REIT) | | | 91,633 | | | | 714 | |
| | Scapa Group plc (Chemicals) | | | 287,914 | | | | 678 | |
| | Softcat plc (IT services) | | | 195,798 | | | | 2,416 | |
| | SSP Group plc (Hotels, restaurants & leisure) | | | 466,842 | | | | 4,067 | |
| | The UNITE Group plc (Equity REIT) | | | 336,525 | | | | 4,165 | |
| | Victrex plc (Chemicals) | | | 69,788 | | | | 1,918 | |
| | Workspace Group plc (Equity REIT) | | | 122,393 | | | | 1,359 | |
| | | | | | | | | 53,659 | |
| | | | | | | | | | |
| | Emerging Asia—9.4% | | | | | | | | |
| | Cambodia—0.9% | | | | | | | | |
| | NagaCorp, Ltd. (Hotels, restaurants & leisure) | | | 2,288,000 | | | | 2,815 | |
| | China—4.7% | | | | | | | | |
| | Huazhu Group, Ltd.-ADR (Hotels, restaurants & leisure) | | | 93,539 | | | | 3,391 | |
| * | Kingsoft Corporation, Ltd. (Software) | | | 439,000 | | | | 950 | |
| | Li Ning Co., Ltd. (Textiles, apparel & luxury goods) | | | 3,061,500 | | | | 7,219 | |
| | Silergy Corporation (Semiconductors & semiconductor equipment) | | | 88,000 | | | | 1,722 | |
| | Travelsky Technology, Ltd. Class “H” (IT services) | | | 546,000 | | | | 1,097 | |
| | | | | | | | | 14,379 | |
| | India—0.6% | | | | | | | | |
| | Crompton Greaves Consumer Electricals, Ltd. (Household durables) | | | 566,648 | | | | 1,912 | |
| | | | | | | | |
| | Issuer | | Shares | | | Value | |
| | | | | | | | | | |
| | Common Stocks—(continued) | | | | | | | | |
| | | | | | | | | | |
| | Emerging Asia—(continued) | | | | | | | | |
| | Philippines—0.3% | | | | | | | | |
| | Jollibee Foods Corporation (Hotels, restaurants & leisure) | | | 193,100 | | | $ | 1,062 | |
| | Taiwan—2.0% | | | | | | | | |
| | Chailease Holding Co., Ltd. (Diversified financial services) | | | 357,200 | | | | 1,478 | |
| | Eclat Textile Co., Ltd. (Textiles, apparel & luxury goods) | | | 212,000 | | | | 2,717 | |
| | Feng TAY Enterprise Co., Ltd. (Textiles, apparel & luxury goods) | | | 258,000 | | | | 2,010 | |
| | | | | | | | | 6,205 | |
| | Thailand—0.9% | | | | | | | | |
| | Tisco Financial Group PCL (Banks) | | | 901,200 | | | | 2,748 | |
| | | | | | | | | | |
| | Emerging Latin America—5.7% | | | | | | | | |
| | Argentina—2.1% | | | | | | | | |
| * | Globant S.A. (Software)† | | | 64,511 | | | | 6,519 | |
| | Brazil—2.0% | | | | | | | | |
| | CVC Brasil Operadora e Agencia de Viagens S.A. (Hotels, restaurants & leisure) | | | 144,400 | | | | 1,873 | |
| | Localiza Rent a Car S.A. (Road & rail) | | | 403,885 | | | | 4,310 | |
| | | | | | | | | 6,183 | |
| | Mexico—1.6% | | | | | | | | |
| | Grupo Aeroportuario del Centro Norte S.A.B. de C.V. (Transportation infrastructure) | | | 307,300 | | | | 1,878 | |
| | Grupo Aeroportuario del Sureste S.A.B. de C.V.—ADR (Transportation infrastructure) | | | 18,288 | | | | 2,964 | |
| | | | | | | | | 4,842 | |
| | | | | | | | | | |
| | Asia—5.1% | | | | | | | | |
| | Australia—1.9% | | | | | | | | |
| | Corporate Travel Management, Ltd. (Hotels, restaurants & leisure) | | | 114,960 | | | | 1,816 | |
| | Orora, Ltd. (Containers & packaging) | | | 1,340,548 | | | | 3,049 | |
| | SmartGroup Corporation, Ltd. (Commercial services & supplies) | | | 184,753 | | | | 1,082 | |
| | | | | | | | | 5,947 | |
| | Hong Kong—0.7% | | | | | | | | |
| | MGM China Holdings, Ltd. (Hotels, restaurants & leisure) | | | 1,169,200 | | | | 1,988 | |
| | New Zealand—2.5% | | | | | | | | |
| | Fisher & Paykel Healthcare Corp., Ltd. (Health care equipment & supplies) | | | 220,774 | | | | 2,293 | |
| | Ryman Healthcare, Ltd. (Health care providers & services) | | | 344,553 | | | | 2,720 | |
| | Spark New Zealand, Ltd. (Diversified telecommunication services) | | | 1,039,225 | | | | 2,792 | |
| | | | | | | | | 7,805 | |
See accompanying Notes to Financial Statements.
| June 30, 2019 | William Blair Funds | 65 |
International Small Cap Growth Fund
Portfolio of Investments, June 30, 2019(all dollar amounts in thousands) (unaudited)
| | | | Shares or | | | | |
| | | | Principal | | | | |
| | Issuer | | Amount | | | Value | |
| | | | | | | | | | |
| | Common Stocks—(continued) | | | | | | | | |
| | | | | | | | | | |
| | Canada—2.7% | | | | | | | | |
| | Finning International, Inc. (Trading companies & distributors) | | | 69,888 | | | $ | 1,274 | |
| * | Kinaxis, Inc. (Software) | | | 24,431 | | | | 1,524 | |
| | Parkland Fuel Corporation (Oil, gas & consumable fuels) | | | 80,228 | | | | 2,545 | |
| | The Bank of NT Butterfield & Son, Ltd. (Banks)† | | | 42,324 | | | | 1,437 | |
| | Toromont Industries, Ltd. (Trading companies & distributors) | | | 34,767 | | | | 1,648 | |
| | | | | | | | | 8,428 | |
| | | | | | | | | | |
| | Emerging Europe, Mid-East, Africa—2.5% | | | | | | | | |
| | South Africa—2.5% | | | | | | | | |
| | AVI, Ltd. (Food products) | | | 405,988 | | | | 2,633 | |
| | Bidvest Group, Ltd. (Industrial conglomerates) | | | 161,274 | | | | 2,168 | |
| | Clicks Group, Ltd. (Food & staples retailing) | | | 199,172 | | | | 2,903 | |
| | | | | | | | | 7,704 | |
| | Total Common Stocks—95.8%
(cost $259,885) | | | | | | | 295,563 | |
| | | | | | | | | | |
| | Repurchase Agreement | | | | | | | | |
| | Fixed Income Clearing Corporation, 0.500% dated 6/28/19, due 7/1/19, repurchase price $13,281, collateralized by U.S. Treasury Note, 1.500%, due 8/15/26 | | $ | 13,280 | | | | 13,280 | |
| | Total Repurchase Agreement—4.3%
(cost $13,280) | | | | | | | 13,280 | |
| | Total Investments—100.1%
(cost $273,165) | | | | | | | 308,843 | |
| | Liabilities, plus cash and other assets—(0.1)% | | | | | | | (389 | ) |
| | Net assets—100.0% | | | | | | $ | 308,454 | |
ADR = American Depository Receipt
REIT = Real Estate Investment Trust
* = Non-income producing security
† = U.S. listed foreign security
For securities primarily traded on exchanges or markets that close before the close of regular trading on the New York Stock Exchange, the Fund may use an independent pricing service to fair value price the securities pursuant to Valuation Procedures approved by the Board of Trustees.
At June 30, 2019, the Fund’s Portfolio of Investments includes the following industry categories (as a percentage of long-term investments):
| Information Technology | | | 20.8 | % |
| Industrials | | | 20.6 | % |
| Consumer Discretionary | | | 17.5 | % |
| Financials | | | 13.2 | % |
| Health Care | | | 10.7 | % |
| Consumer Staples | | | 6.1 | % |
| Real Estate | | | 5.0 | % |
| Materials | | | 2.5 | % |
| Communication Services | | | 1.5 | % |
| Utilities | | | 1.2 | % |
| Energy | | | 0.9 | % |
| Total | | | 100.0 | % |
At June 30, 2019, the Fund’s Portfolio of Investments includes the following currency categories (as a percentage of long-term investments):
| British Pound Sterling | | | 19.0 | % |
| Japanese Yen | | | 18.2 | % |
| Euro | | | 17.3 | % |
| Swedish Krona | | | 8.3 | % |
| U.S. Dollar | | | 6.1 | % |
| Hong Kong Dollar | | | 4.8 | % |
| Swiss Franc | | | 3.7 | % |
| Danish Krone | | | 3.3 | % |
| New Taiwan Dollar | | | 2.7 | % |
| New Zealand Dollar | | | 2.6 | % |
| South African Rand | | | 2.6 | % |
| Canadian Dollar | | | 2.4 | % |
| Brazilian Real | | | 2.1 | % |
| Australian Dollar | | | 2.0 | % |
| Israeli Shekel | | | 1.6 | % |
| All Other Currencies | | | 3.3 | % |
| Total | | | 100.0 | % |
See accompanying Notes to Financial Statements.
| 66 | Semiannual Report | June 30, 2019 |
| | Emerging Markets Leaders Fund |
| | |
| | The Emerging Markets Leaders Fund seeks long-term capital appreciation. |
| | |
| | AN OVERVIEW FROM THE PORTFOLIO MANAGERS |
| | |

Todd M. McClone 
John C. Murphy | The William Blair Emerging Markets Leaders Fund (Class N shares) posted a 16.71% increase, net of fees, for the six months ended June 30, 2019. By comparison, the Fund’s benchmark index, the MSCI Emerging Markets Index (net) (the “Index”) increased 10.58%. Six-month outperformance versus the Index was primarily driven by positive stock selection across most sectors. In particular, stock selection in the Financials, Health Care and Communication Services sectors were the most notable contributors to relative return. Within Financials, Ping An Insurance Group Co. of China, Ltd. contributed to relative performance as the company continued to deliver better-than-expected results, driven by strong operating trends and high investment income amid improved equity markets. Jiangsu Hengrui Medicine Co., Ltd., the leading pharmaceutical company in China was an additional source of outperformance. The stock rebounded from policy-driven, sector-wide weakness in the second half of 2018 amid the company’s strong operating momentum and growth outlook, supported by favorable trends in oncology and new product approvals. Within the Communication Services sector, Yandex N.V. helped relative returns on the back of continued strong growth in advertising and an increased contribution from its expanded multi-services platform. Based in Russia, Yandex is Russia’s leading online search engine company that is transitioning beyond its core search business into ventures such as ride-hailing and e-commerce. Partially offsetting these positive effects were underweight allocations to Russia and the Health Care sector, coupled with below average stock selection within the Energy sector. Within Energy, the Fund’s lack of exposure to Russian Energy companies and the Fund’s position in the Australian company Oil Search, Ltd. detracted from relative results. Oil Search was dragged down by market concerns about political instability in Papua New Guinea. Please refer to the Global Markets Review and Outlook relating to the Fund beginning on page 32 for additional information. |
| June 30, 2019 | William Blair Funds | 67 |
Emerging Markets Leaders Fund
Performance Highlights (Unaudited)
| Average Annual Total Return through 6/30/2019 | | | |
| | | Year
to Date | | 1 Year | | 3 Year | | 5 Year | | 10 Year | | Since
Inception |
| Class N(a) | | | 16.71 | % | | | 3.20 | % | | | 9.74 | % | | | 2.56 | % | | | — | | | | 3.50 | % |
| MSCI Emerging Markets Index (net)(a) | | | 10.58 | | | | 1.21 | | | | 10.66 | | | | 2.49 | | | | — | | | | 2.97 | |
| Class I | | | 16.93 | | | | 3.52 | | | | 10.04 | | | | 2.87 | | | | 6.78 | % | | | — | |
| Class R6 | | | 16.95 | | | | 3.53 | | | | 10.08 | | | | 2.93 | | | | 6.87 | | | | — | |
| MSCI Emerging Markets Index (net) | | | 10.58 | | | | 1.21 | | | | 10.66 | | | | 2.49 | | | | 5.81 | | | | — | |
| (a) | Since inception is for the period from May 3, 2010 (Commencement ofOperations) to June 30, 2019. |
Performance cited represents past performance. Past performance does not guarantee future results and current performance may be lower or higher than the data quoted. Results shown are average annual total returns, which assume reinvestment of dividends and capital gains. Investment returns and principal will fluctuate and you may have a gain or loss when you sell shares. For the most current month-end performance information, please call 1-800-742-7272, or visit our Web site atwww.williamblairfunds.com. International investing involves special risk considerations, including currency fluctuations, lower liquidity, economic and political risk. These risks may be magnified when investing in emerging markets. From time to time, the investment adviser may waive fees or reimburse expenses for the Fund. Without these waivers/reimbursements, performance would be lower. Class N shares are not subject to a sales load. Class I shares are not subject to a sales load or distribution (Rule 12b-1) fees. Class R6 shares are not subject to a sales load, distribution (Rule 12b-1) fees, or sub-transfer agent fees.
The performance highlights and graph presented above do not reflect the deduction of taxes that a shareholder would pay on fund distributions or the redemption of fund shares.
The Morgan Stanley Capital International (MSCI) Emerging Markets Index (net) is a free float-adjusted market-capitalization-weighted index that is designed to measure equity market performance of emerging markets. This index approximates the minimum possible dividend reinvestment by deducting for the highest possible withholding tax rates of those markets.
This report identifies the Fund’s investments on June 30, 2019. These holdings are subject to change. Not all stocks in the Fund performed the same, nor is there any guarantee that these stocks will perform as well in the future. Market forecasts provided in this report may not necessarily come to pass.
Sector Diversification (Unaudited)
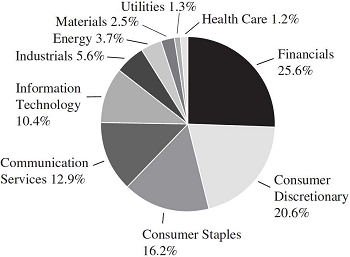
The sector diversification shown is based on the total long-term securities.
| 68 | Semiannual Report | June 30, 2019 |
Emerging Markets Leaders Fund
Portfolio of Investments, June 30, 2019(all dollar amounts in thousands) (unaudited)
| | | | | | | | |
| | Issuer | | Shares | | | Value | |
| | | | | | | | | | |
| | Common Stocks | | | | | | | | |
| | | | | | | | | | |
| | Emerging Asia—73.1% | | | | | | | | |
| | Australia—0.9% | | | | | | | | |
| | Oil Search, Ltd. (Oil, gas & consumable fuels) | | | 410,642 | | | $ | 2,038 | |
| | China—33.5% | | | | | | | | |
| * | Alibaba Group Holding, Ltd.—ADR (Internet & direct marketing retail) | | | 84,534 | | | | 14,324 | |
| | China International Travel Service Corporation, Ltd. Class “A” (Hotels, restaurants & leisure) | | | 373,956 | | | | 4,827 | |
| | CNOOC, Ltd. (Oil, gas & consumable fuels) | | | 2,091,000 | | | | 3,576 | |
| | ENN Energy Holdings, Ltd. (Gas utilities) | | | 293,200 | | | | 2,852 | |
| | Haier Electronics Group Co., Ltd. (Household durables) | | | 1,144,000 | | | | 3,163 | |
| | Huazhu Group, Ltd.—ADR (Hotels, restaurants & leisure) | | | 112,463 | | | | 4,077 | |
| | Jiangsu Hengrui Medicine Co., Ltd. Class “A” (Pharmaceuticals) | | | 218,192 | | | | 2,097 | |
| | Kweichow Moutai Co., Ltd. Class “A” (Beverages) | | | 40,859 | | | | 5,854 | |
| | NetEase, Inc.—ADR (Entertainment) | | | 9,920 | | | | 2,537 | |
| | Ping An Insurance Group Co. of China, Ltd. Class “H” (Insurance) | | | 654,000 | | | | 7,853 | |
| | Shenzhou International Group Holdings, Ltd. (Textiles, apparel & luxury goods) | | | 276,200 | | | | 3,797 | |
| * | TAL Education Group—ADR (Diversified consumer services) | | | 66,961 | | | | 2,551 | |
| | Tencent Holdings, Ltd. (Interactive Media & Services) | | | 298,900 | | | | 13,492 | |
| * | Tencent Music Entertainment Group—ADR (Entertainment) | | | 266,765 | | | | 3,999 | |
| | | | | | | | | 74,999 | |
| | India—17.8% | | | | | | | | |
| | Asian Paints, Ltd. (Chemicals) | | | 100,352 | | | | 1,976 | |
| | Bajaj Finance, Ltd. (Consumer finance) | | | 76,669 | | | | 4,093 | |
| | Britannia Industries, Ltd. (Food products) | | | 44,127 | | | | 1,756 | |
| | HDFC Bank, Ltd. (Banks) | | | 107,977 | | | | 3,818 | |
| | HDFC Bank, Ltd.—ADR (Banks) | | | 7,422 | | | | 965 | |
| | HDFC Life Insurance Co. Ltd.—144A (Insurance) | | | 335,682 | | | | 2,259 | |
| | Hindustan Unilever, Ltd. (Household products) | | | 70,235 | | | | 1,820 | |
| | Housing Development Finance Corporation, Ltd. (Thrifts & mortgage finance) | | | 134,968 | | | | 4,291 | |
| | IndusInd Bank, Ltd. (Banks) | | | 142,671 | | | | 2,935 | |
| | Infosys, Ltd. (IT services) | | | 403,301 | | | | 4,275 | |
| | Maruti Suzuki India, Ltd. (Automobiles) | | | 17,881 | | | | 1,694 | |
| | Motherson Sumi Systems, Ltd. (Auto components) | | | 902,481 | | | | 1,597 | |
| | MRF, Ltd. (Auto components) | | | 3,219 | | | | 2,648 | |
| | Petronet LNG, Ltd. (Oil, gas & consumable fuels) | | | 677,429 | | | | 2,414 | |
| | UPL, Ltd. (Chemicals) | | | 247,189 | | | | 3,370 | |
| | | | | | | | | 39,911 | |
| | | | | | | | |
| | Issuer | | Shares | | | Value | |
| | | | | | | | | | |
| | Common Stocks—(continued) | | | | | | | | |
| | | | | | | | | | |
| | Emerging Asia—(continued) | | | | | | | | |
| | Indonesia—5.2% | | | | | | | | |
| | PT Bank Rakyat Indonesia Persero Tbk (Banks) | | | 16,294,300 | | | $ | 5,029 | |
| | PT Telekomunikasi Indonesia Persero Tbk (Diversified telecommunication services) | | | 14,317,800 | | | | 4,196 | |
| | PT Unilever Indonesia Tbk (Household products) | | | 742,500 | | | | 2,365 | |
| | | | | | | | | 11,590 | |
| | South Korea—3.6% | | | | | | | | |
| | LG Household & Health Care, Ltd. (Personal products) | | | 2,345 | | | | 2,667 | |
| | Samsung Electronics Co., Ltd. (Technology hardware, storage & peripherals) | | | 131,611 | | | | 5,357 | |
| | | | | | | | | 8,024 | |
| | Taiwan—8.5% | | | | | | | | |
| | E.Sun Financial Holding Co., Ltd. (Banks) | | | 2,822,000 | | | | 2,362 | |
| | Taiwan Semiconductor Manufacturing Co., Ltd.—ADR (Semiconductors & semiconductor equipment) | | | 320,832 | | | | 12,567 | |
| | Uni-President Enterprises Corporation (Food products) | | | 1,558,000 | | | | 4,149 | |
| | | | | | | | | 19,078 | |
| | Thailand—3.6% | | | | | | | | |
| | Airports of Thailand PCL (Transportation infrastructure) | | | 1,865,800 | | | | 4,471 | |
| | CP ALL PCL (Food & staples retailing) | | | 1,327,900 | | | | 3,724 | |
| | | | | | | | | 8,195 | |
| | | | | | | | | | |
| | Emerging Latin America—12.9% | | | | | | | | |
| | Brazil—7.6% | | | | | | | | |
| | AMBEV S.A.—ADR (Beverages) | | | 543,223 | | | | 2,537 | |
| | B3 S.A. - Brasil Bolsa Balcao (Capital markets) | | | 385,600 | | | | 3,762 | |
| | IRB Brasil Resseguros S.A. (Insurance) | | | 156,400 | | | | 4,012 | |
| | Odontoprev S.A. (Health care providers & services) | | | 94,753 | | | | 450 | |
| | Raia Drogasil S.A. (Food & staples retailing) | | | 182,400 | | | | 3,615 | |
| | WEG S.A. (Machinery) | | | 451,800 | | | | 2,513 | |
| | | | | | | | | 16,889 | |
| | Mexico—3.5% | | | | | | | | |
| | Grupo Aeroportuario del Pacifico S.A.B. de C.V. Class “B” (Transportation infrastructure) | | | 310,900 | | | | 3,238 | |
| | Grupo Financiero Banorte S.A.B. de C.V. Class “O” (Banks) | | | 468,000 | | | | 2,718 | |
| | Wal-Mart de Mexico S.A.B. de C.V. (Food & staples retailing) | | | 721,000 | | | | 1,968 | |
| | | | | | | | | 7,924 | |
| | Peru—1.8% | | | | | | | | |
| | Credicorp, Ltd. (Banks)† | | | 17,905 | | | | 4,099 | |
See accompanying Notes to Financial Statements.
| June 30, 2019 | William Blair Funds | 69 |
Emerging Markets Leaders Fund
Portfolio of Investments, June 30, 2019(all dollar amounts in thousands) (unaudited)
| | | | Shares or | | | | |
| | | | Principal | | | | |
| | Issuer | | Amount | | | Value | |
| | | | | | | | | | |
| | Common Stocks—(continued) | | | | | | | | |
| | | | | | | | | | |
| | Emerging Europe, Mid-East, Africa—9.7% | | | | | | | | |
| | Russia—1.6% | | | | | | | | |
| * | Yandex N.V. Class “A” (Interactive Media & Services)† | | | 91,856 | | | $ | 3,490 | |
| | South Africa—8.1% | | | | | | | | |
| | Bid Corporation, Ltd. (Food & staples retailing) | | | 89,859 | | | | 1,958 | |
| | Capitec Bank Holdings, Ltd. (Banks) | | | 39,831 | | | | 3,673 | |
| | Clicks Group, Ltd. (Food & staples retailing) | | | 163,502 | | | | 2,383 | |
| | FirstRand, Ltd. (Diversified financial services) | | | 573,447 | | | | 2,791 | |
| | Naspers, Ltd. (Media) | | | 22,476 | | | | 5,457 | |
| | The Bidvest Group, Ltd. (Industrial conglomerates) | | | 136,253 | | | | 1,832 | |
| | | | | | | | | 18,094 | |
| | Total Common Stocks—95.7%
(cost $183,319) | | | | | | | 214,331 | |
| | | | | | | | | | |
| | Repurchase Agreement | | | | | | | | |
| | Fixed Income Clearing Corporation, 0.500% dated 6/28/19, due 7/1/19, repurchase price $9,084, collateralized by U.S. Treasury Note, 1.500%, due 8/15/26 | | | $9,083 | | | $ | 9,083 | |
| | Total Repurchase Agreement—4.0%
(cost $9,083) | | | | | | | 9,083 | |
| | Total Investments—99.7%
(cost $192,402) | | | | | | | 223,414 | |
| | Cash and other assets, less liabilities—0.3% | | | | | | | 649 | |
| | Net assets—100.0% | | | | | | $ | 224,063 | |
ADR = American Depository Receipt
* = Non-income producing security
† = U.S. listed foreign security
For securities primarily traded on exchanges or markets that close before the close of regular trading on the New York Stock Exchange, the Fund may use an independent pricing service to fair value price the securities pursuant to Valuation Procedures approved by the Board of Trustees.
At June 30, 2019, the Fund’s Portfolio of Investments includes the following industry categories (as a percentage of long-term investments):
| Financials | | | 25.6 | % |
| Consumer Discretionary | | | 20.6 | % |
| Consumer Staples | | | 16.2 | % |
| Communication Services | | | 12.9 | % |
| Information Technology | | | 10.4 | % |
| Industrials | | | 5.6 | % |
| Energy | | | 3.7 | % |
| Materials | | | 2.5 | % |
| Utilities | | | 1.3 | % |
| Health Care | | | 1.2 | % |
| Total | | | 100.0 | % |
At June 30, 2019, the Fund’s Portfolio of Investments includes the following currency categories (as a percentage of long-term investments):
| U.S. Dollar | | | 23.9 | % |
| Indian Rupee | | | 18.2 | % |
| Hong Kong Dollar | | | 16.2 | % |
| South African Rand | | | 8.4 | % |
| Brazilian Real | | | 6.7 | % |
| Yuan Renminbi | | | 6.0 | % |
| Indonesian Rupiah | | | 5.4 | % |
| Thai Baht | | | 3.8 | % |
| South Korean Won | | | 3.7 | % |
| Mexican Peso | | | 3.7 | % |
| New Taiwan Dollar | | | 3.0 | % |
| All Other Currencies | | | 1.0 | % |
| Total | | | 100.0 | % |
See accompanying Notes to Financial Statements.
| 70 | Semiannual Report | June 30, 2019 |
| | Emerging Markets Growth Fund |
| | |
| | The Emerging Markets Growth Fund seeks long-term capital appreciation. |
| | |
| | AN OVERVIEW FROM THE PORTFOLIO MANAGERS |
| | |

Todd M. McClone 
Casey K. Preyss | The William Blair Emerging Markets Growth Fund (Class N shares) posted a 15.80% increase, net of fees, for the six months ended June 30, 2019. By comparison, the Fund’s benchmark index, the MSCI Emerging Markets IMI (net) (the “Index”), increased 10.14%. Six-month outperformance versus the Index was primarily driven by positive stock selection across most sectors. Financials and Industrials were the most notable sources of the Fund’s relative return. Within the Financials sector, Chinese holdings Ping An Insurance Group Co. of China, Ltd. and China Merchants Bank Co., Ltd. bolstered relative returns. Ping An Insurance continued to deliver better-than-expected results, with net profit growth of 77% year-over-year, driven by strong growth across business segments and high investment income amid improved equity markets. Shares of China Merchants Bank, the leading private retail bank in China, continued to climb amid an improved macro backdrop and solid fundamental results. The bank’s growth and profitability continue to stand out relative to large peers. Within Industrials, Shanghai International Airport Co., Ltd., the owner and operator of the third busiest airport in China, was an additional source of outperformance amid solid first quarter results driven by a newly implemented higher duty-free revenue sharing agreement. Partially offsetting these effects was the underweight allocation to the Information Technology sector, coupled with negative stock selection within the Energy and Real Estate sectors. Within Energy, the lack of exposure to Russian Energy, which outperformed on higher crude oil prices, and the position in Reliance Industries Limited, which pared gains from prior quarters, hampered relative results. Multiplan Empreendimentos Imobiliarios S.A., a premier mall operator in Brazil, within the Real Estate sector, was a drag amid weaker first quarter results driven by higher than expected financial expenses and slower operational momentum. Please refer to the Global Markets Review and Outlook relating to the Fund beginning on page 32 for additional information. |
| June 30, 2019 | William Blair Funds | 71 |
Emerging Markets Growth Fund
Performance Highlights (Unaudited)
Average Annual Total Return through 6/30/2019
| | | Year
to Date | | 1 Year | | 3 Year | | 5 Year | | 10 Year |
| Class N | | | 15.80 | % | | | (2.03 | )% | | | 9.20 | % | | | 2.27 | % | | | 6.94 | % |
| Class I | | | 15.91 | | | | (1.77 | ) | | | 9.47 | | | | 2.52 | | | | 7.22 | |
| Class R6 | | | 15.95 | | | | (1.70 | ) | | | 9.58 | | | | 2.62 | | | | 7.38 | |
| MSCI Emerging Markets IMI (net) | | | 10.14 | | | | 0.47 | | | | 10.01 | | | | 2.25 | | | | 5.83 | |
Performance cited represents past performance. Past performance does not guarantee future results and current performance may be lower or higher than the data quoted. Results shown are average annual returns, which assume reinvestment of dividends and capital gains. Investment returns and principal will fluctuate and you may have a gain or loss when you sell shares. For the most current month-end performance information, please call 1-800-742-7272, or visit our Web site atwww.williamblairfunds.com. From time to time, the investment adviser may waive fees or reimburse expenses for the Fund. Without these waivers/reimbursements, performance would be lower. International investing involves special risk considerations, including currency fluctuations, lower liquidity, economic and political risk. These risks may be magnified when investing in emerging markets. Class N shares are not subject to a sales load. Class I shares are not subject to a sales load or distribution (Rule 12b-1) fees. Class R6 shares are not subject to a sales load, distribution (Rule 12b-1) fees, or sub-transfer agent fees.
The performance highlights and graph presented above do not reflect the deduction of taxes that a shareholder would pay on fund distributions or the redemption of fund shares.
The Morgan Stanley Capital International (MSCI) Emerging Markets Investable Market Index (IMI) (net) is a free float-adjusted market capitalization weighted index that is designed to measure the equity market performance of emerging markets. This index approximates the minimum possible dividend reinvestment by deducting for the highest possible withholding tax rates of those markets.
This report identifies the Fund’s investments on June 30, 2019. These holdings are subject to change. Not all stocks in the Fund performed the same, nor is there any guarantee that these stocks will perform as well in the future. Market forecasts provided in this report may not necessarily come to pass.
Sector Diversification (Unaudited)

The sector diversification shown is based on the total long-term securities.
| 72 | Semiannual Report | June 30, 2019 |
Emerging Markets Growth Fund
Portfolio of Investments, June 30, 2019(all dollar amounts in thousands) (unaudited)
| | | | | | | | |
| | | | | | | | |
| | Issuer | | Shares | | | Value | |
| | | | | | | | | | |
| | Common Stocks | | | | | | | | |
| | | | | | | | | | |
| | Emerging Asia—71.0% | | | | | | | | |
| | China—31.5% | | | | | | | | |
| | Aier Eye Hospital Group Co., Ltd. Class “A” (Health care providers & services) | | | 672,920 | | | $ | 3,034 | |
| * | Alibaba Group Holding, Ltd.—ADR (Internet & direct marketing retail) | | | 291,055 | | | | 49,319 | |
| | ANTA Sports Products, Ltd. (Textiles, apparel & luxury goods) | | | 878,000 | | | | 6,030 | |
| | Centre Testing International Group Co., Ltd. Class “A” (Professional services) | | | 1,602,400 | | | | 2,520 | |
| | China International Travel Service Corporation, Ltd. Class “A” (Hotels, restaurants & leisure) | | | 704,240 | | | | 9,090 | |
| * | China Mengniu Dairy Co., Ltd. (Food products) | | | 1,499,000 | | | | 5,805 | |
| | China Merchants Bank Co., Ltd. Class “H” (Banks) | | | 3,934,500 | | | | 19,618 | |
| | Country Garden Services Holdings Co., Ltd. (Commercial services & supplies) | | | 1,302,000 | | | | 3,010 | |
| * | Ctrip.com International, Ltd.—ADR (Internet & direct marketing retail) | | | 129,564 | | | | 4,782 | |
| | Foshan Haitian Flavouring & Food Co., Ltd. Class “A” (Food products) | | | 566,216 | | | | 8,656 | |
| | Huazhu Group, Ltd.—ADR (Hotels, restaurants & leisure) | | | 82,156 | | | | 2,978 | |
| | Kingdee International Software Group Co., Ltd. (Software) | | | 2,610,000 | | | | 2,823 | |
| | Kweichow Moutai Co., Ltd. Class “A” (Beverages) | | | 59,442 | | | | 8,516 | |
| | Li Ning Co., Ltd. (Textiles, apparel & luxury goods) | | | 1,622,000 | | | | 3,825 | |
| | Midea Group Co., Ltd. Class “A” (Household durables) | | | 512,576 | | | | 3,870 | |
| | NetEase, Inc.—ADR (Entertainment) | | | 14,322 | | | | 3,663 | |
| * | New Oriental Education & Technology Group, Inc.—ADR (Diversified consumer services) | | | 64,966 | | | | 6,274 | |
| | Ping An Insurance Group Co. of China, Ltd. Class “H” (Insurance) | | | 2,458,000 | | | | 29,515 | |
| | Shanghai International Airport Co., Ltd. Class “A” (Transportation infrastructure) | | | 571,865 | | | | 6,976 | |
| | Shenzhen Mindray Bio-Medical Electronics Co., Ltd. Class “A” (Health care equipment & supplies) | | | 109,000 | | | | 2,590 | |
| | Shenzhou International Group Holdings, Ltd. (Textiles, apparel & luxury goods) | | | 465,000 | | | | 6,393 | |
| | Silergy Corporation (Semiconductors & semiconductor equipment) | | | 24,000 | | | | 470 | |
| | Tencent Holdings, Ltd. (Interactive Media & Services) | | | 809,460 | | | | 36,537 | |
| | Wuliangye Yibin Co., Ltd. Class “A” (Beverages) | | | 506,294 | | | | 8,695 | |
| * | Wuxi Biologics Cayman, Inc. (Life sciences tools & services) | | | 269,000 | | | | 2,416 | |
| * | Yihai International Holding, Ltd. (Food products) | | | 594,000 | | | | 3,083 | |
| | | | | | | | |
| | | | | | | | |
| | Issuer | | Shares | | | Value | |
| | | | | | | | | | |
| | Common Stocks—(continued) | | | | | | | | |
| | | | | | | | | | |
| | Emerging Asia—(continued) | | | | | | | | |
| | China—(continued) | | | | | | | | |
| | Yum China Holdings, Inc. (Hotels, restaurants & leisure) | | | 140,898 | | | $ | 6,510 | |
| | Zhejiang Supor Co., Ltd. Class “A” (Household durables) | | | 546,282 | | | | 6,031 | |
| | | | | | | | | 253,029 | |
| | India—18.3% | | | | | | | | |
| | Asian Paints, Ltd. (Chemicals) | | | 243,801 | | | | 4,800 | |
| | Bajaj Finance, Ltd. (Consumer finance) | | | 310,066 | | | | 16,554 | |
| | Havells India, Ltd. (Electrical equipment) | | | 350,134 | | | | 3,974 | |
| | HDFC Asset Management Co., Ltd. (Capital markets) | | | 93,754 | | | | 2,799 | |
| | HDFC Bank, Ltd. (Banks) | | | 766,016 | | | | 27,088 | |
| | HDFC Life Insurance Co. Ltd. (Insurance) | | | 594,796 | | | | 4,003 | |
| | Hindustan Unilever, Ltd. (Household products) | | | 213,589 | | | | 5,535 | |
| | Housing Development Finance Corporation, Ltd. (Thrifts & mortgage finance) | | | 536,341 | | | | 17,050 | |
| | Indraprastha Gas, Ltd. (Gas utilities) | | | 546,120 | | | | 2,491 | |
| | Info Edge India, Ltd. (Interactive Media & Services) | | | 85,861 | | | | 2,796 | |
| | Infosys, Ltd. (IT services) | | | 790,795 | | | | 8,383 | |
| | Nestle India, Ltd. (Food products) | | | 18,802 | | | | 3,249 | |
| | Pidilite Industries, Ltd. (Chemicals) | | | 146,463 | | | | 2,580 | |
| | PVR, Ltd. (Entertainment) | | | 93,239 | | | | 2,259 | |
| | Reliance Industries, Ltd. (Oil, gas & consumable fuels) | | | 986,029 | | | | 17,913 | |
| | SRF, Ltd. (Chemicals) | | | 28,899 | | | | 1,274 | |
| | Tata Consultancy Services, Ltd. (IT services) | | | 385,201 | | | | 12,433 | |
| | Titan Co., Ltd. (Textiles, apparel & luxury goods) | | | 320,729 | | | | 6,186 | |
| | UPL, Ltd. (Chemicals) | | | 387,731 | | | | 5,286 | |
| | | | | | | | | 146,653 | |
| | Indonesia—3.4% | | | | | | | | |
| | PT Bank Central Asia Tbk (Banks) | | | 7,592,300 | | | | 16,109 | |
| | PT Bank Rakyat Indonesia Persero Tbk (Banks) | | | 35,625,605 | | | | 10,995 | |
| | PT Gudang Garam Tbk (Tobacco) | | | 26,000 | | | | 141 | |
| | | | | | | | | 27,245 | |
| | Philippines—0.8% | | | | | | | | |
| | Ayala Land, Inc. (Real estate management & development) | | | 4,465,300 | | | | 4,428 | |
| | Jollibee Foods Corporation (Hotels, restaurants & leisure) | | | 344,040 | | | | 1,892 | |
| | | | | | | | | 6,320 | |
| | South Korea—4.3% | | | | | | | | |
| | Douzone Bizon Co., Ltd. (Software) | | | 39,719 | | | | 2,140 | |
| | Fila Korea, Ltd. (Textiles, apparel & luxury goods) | | | 63,680 | | | | 4,230 | |
| | Korea Investment Holdings Co., Ltd. (Capital markets) | | | 24,636 | | | | 1,722 | |
| | LG Household & Health Care, Ltd. (Personal products) | | | 8,464 | | | | 9,625 | |
See accompanying Notes to Financial Statements.
| June 30, 2019 | William Blair Funds | 73 |
Emerging Markets Growth Fund
Portfolio of Investments, June 30, 2019(all dollar amounts in thousands) (unaudited)
| | | | | | | | |
| | | | | | | | |
| | Issuer | | Shares | | | Value | |
| | | | | | | | | | |
| | Common Stocks (continued) | | | | | | | | |
| | | | | | | | | | |
| | Emerging Asia—(continued) | | | | | | | | |
| | South Korea—(continued) | | | | | | | | |
| | Macquarie Korea Infrastructure Fund (Capital markets) | | | 293,179 | | | $ | 2,996 | |
| | Samsung Electronics Co., Ltd. (Technology hardware, storage & peripherals) | | | 329,477 | | | | 13,411 | |
| | | | | | | | | 34,124 | |
| | Taiwan—8.2% | | | | | | | | |
| | Airtac International Group (Machinery) | | | 149,000 | | | | 1,669 | |
| | Bizlink Holding, Inc. (Electrical equipment) | | | 21,000 | | | | 145 | |
| | Chailease Holding Co., Ltd. (Diversified financial services) | | | 870,380 | | | | 3,601 | |
| | E.Sun Financial Holding Co., Ltd. (Banks) | | | 10,535,171 | | | | 8,819 | |
| | Eclat Textile Co., Ltd. (Textiles, apparel & luxury goods) | | | 196,000 | | | | 2,512 | |
| | Feng TAY Enterprise Co., Ltd. (Textiles, apparel & luxury goods) | | | 381,000 | | | | 2,968 | |
| | Giant Manufacturing Co., Ltd. (Leisure products) | | | 290,000 | | | | 2,269 | |
| | ITEQ Corporation (Electronic equipment, instruments & components) | | | 593,000 | | | | 2,081 | |
| | Makalot Industrial Co., Ltd. (Textiles, apparel & luxury goods) | | | 433,000 | | | | 2,928 | |
| | Parade Technologies, Ltd. (Semiconductors & semiconductor equipment) | | | 115,000 | | | | 1,955 | |
| | Sinbon Electronics Co., Ltd. (Electronic equipment, instruments & components) | | | 115,000 | | | | 420 | |
| | Taiwan Semiconductor Manufacturing Co., Ltd. (Semiconductors & semiconductor equipment) | | | 1,830,000 | | | | 14,082 | |
| | Taiwan Semiconductor Manufacturing Co., Ltd.—ADR (Semiconductors & semiconductor equipment) | | | 455,675 | | | | 17,849 | |
| | Taiwan Union Technology Corporation (Electronic equipment, instruments & components) | | | 471,000 | | | | 1,888 | |
| | Tripod Technology Corporation (Electronic equipment, instruments & components) | | | 631,000 | | | | 2,235 | |
| | | | | | | | | 65,421 | |
| | Thailand—4.1% | | | | | | | | |
| | Airports of Thailand PCL (Transportation infrastructure) | | | 2,207,500 | | | | 5,291 | |
| | Bangkok Dusit Medical Services PCL Class “F” (Health care providers & services) | | | 4,947,800 | | | | 4,195 | |
| | Bangkok Expressway & Metro PCL (Transportation infrastructure) | | | 7,450,500 | | | | 2,769 | |
| | CP ALL PCL (Food & staples retailing) | | | 3,018,300 | | | | 8,464 | |
| | Home Product Center PCL (Specialty retail) | | | 6,502,300 | | | | 3,710 | |
| | Muangthai Capital PCL (Consumer finance) | | | 1,154,900 | | | | 2,128 | |
| * | Sea, Ltd.—ADR (Entertainment) | | | 189,887 | | | | 6,308 | |
| | | | | | | | | 32,865 | |
| | | | | | | | |
| | | | | | | | |
| | Issuer | | Shares | | | Value | |
| | | | | | | | | | |
| | Common Stocks (continued) | | | | | | | | |
| | | | | | | | | | |
| | Emerging Asia—(continued) | | | | | | | | |
| | Vietnam—0.4% | | | | | | | | |
| | Vietjet Aviation JSC (Airlines) | | | 4 | | | $ | —@ | |
| | Vincom Retail JSC (Real estate management & development) | | | 1,076,801 | | | | 1,561 | |
| * | Vingroup JSC (Real estate management & development) | | | 388,498 | | | | 1,929 | |
| | | | | | | | | 3,490 | |
| | | | | | | | | | |
| | Emerging Latin America—15.9% | | | | | | | | |
| | Argentina—2.0% | | | | | | | | |
| * | Globant S.A. (Software)† | | | 46,658 | | | | 4,715 | |
| * | MercadoLibre, Inc. (Interactive Media & Services) | | | 18,252 | | | | 11,166 | |
| | | | | | | | | 15,881 | |
| | Brazil—10.1% | | | | | | | | |
| | B3 S.A.-Brasil Bolsa Balcao (Capital markets) | | | 1,404,900 | | | | 13,705 | |
| | Banco BTG Pactual S.A. (Capital markets) | | | 313,600 | | | | 4,155 | |
| | BK Brasil Operacao e Assessoria a Restaurantes S.A. (Hotels, restaurants & leisure) | | | 337,900 | | | | 1,957 | |
| | Cyrela Brazil Realty SA Empreendimentos e Participacoes (Household durables) | | | 526,000 | | | | 2,849 | |
| | Energisa S.A. (Electric utilities) | | | 246,975 | | | | 2,964 | |
| | Engie Brasil Energia S.A. (Independent power & renewable electricity producers) | | | 277,150 | | | | 3,138 | |
| | IRB Brasil Resseguros S.A. (Insurance) | | | 305,000 | | | | 7,824 | |
| | Localiza Rent a Car S.A. (Road & rail) | | | 944,220 | | | | 10,077 | |
| | Lojas Renner S.A. (Multiline retail) | | | 943,280 | | | | 11,585 | |
| | Magazine Luiza S.A. (Multiline retail) | | | 89,200 | | | | 4,904 | |
| | Notre Dame Intermedica Participacoes S.A. (Health care providers & services) | | | 250,500 | | | | 2,630 | |
| | Odontoprev S.A. (Health care providers & services) | | | 415,200 | | | | 1,974 | |
| * | Rumo S.A. (Road & rail) | | | 716,900 | | | | 3,870 | |
| | Sul America S.A. (Insurance) | | | 256,400 | | | | 2,505 | |
| | TOTVS S.A. (Software) | | | 237,400 | | | | 2,719 | |
| | WEG S.A. (Machinery) | | | 793,120 | | | | 4,412 | |
| | | | | | | | | 81,268 | |
| | Chile—0.3% | | | | | | | | |
| | Banco Santander Chile—ADR (Banks) | | | 80,807 | | | | 2,418 | |
| | Colombia—0.3% | | | | | | | | |
| | Bancolombia S.A.—ADR (Banks) | | | 46,778 | | | | 2,387 | |
| | Mexico—2.2% | | | | | | | | |
| | Grupo Aeroportuario del Centro Norte S.A.B. de C.V. (Transportation infrastructure) | | | 306,400 | | | | 1,873 | |
| | Grupo Aeroportuario del Sureste S.A.B. de C.V.—ADR (Transportation infrastructure) | | | 9,994 | | | | 1,620 | |
See accompanying Notes to Financial Statements.
| 74 | Semiannual Report | June 30, 2019 |
Emerging Markets Growth Fund
Portfolio of Investments, June 30, 2019(all dollar amounts in thousands) (unaudited)
| | | | | | | | |
| | | | | | | | |
| | Issuer | | Shares | | | Value | |
| | | | | | | | | | |
| | Common Stocks—(continued) | | | | | | | | |
| | | | | | | | | | |
| | Emerging Latin America—(continued) | | | | | | | | |
| | Mexico—(continued) | | | | | | | | |
| | Grupo Financiero Banorte S.A.B. de C.V. Class “O” (Banks) | | | 1,065,600 | | | $ | 6,189 | |
| | Wal-Mart de Mexico S.A.B. de C.V. (Food & staples retailing) | | | 2,933,500 | | | | 8,007 | |
| | | | | | | | | 17,689 | |
| | Peru—1.0% | | | | | | | | |
| | Credicorp, Ltd. (Banks)† | | | 35,431 | | | | 8,110 | |
| | | | | | | | | | |
| | Emerging Europe, Mid-East, Africa—9.5% | | | | | | | | |
| | Czech Republic—0.3% | | | | | | | | |
| | Moneta Money Bank A.S. (Banks) | | | 699,893 | | | | 2,398 | |
| | Greece—0.3% | | | | | | | | |
| | JUMBO S.A. (Specialty retail) | | | 132,432 | | | | 2,560 | |
| | Hungary—1.2% | | | | | | | | |
| | OTP Bank Nyrt (Banks) | | | 243,586 | | | | 9,688 | |
| | Kenya—0.3% | | | | | | | | |
| | Safaricom plc (Wireless telecommunication services) | | | 7,648,554 | | | | 2,088 | |
| | Poland—0.7% | | | | | | | | |
| | CD Projekt S.A. (Entertainment) | | | 50,101 | | | | 2,889 | |
| * | Dino Polska S.A. (Food & staples retailing) | | | 78,948 | | | | 2,768 | |
| | | | | | | | | 5,657 | |
| | Romania—0.3% | | | | | | | | |
| | Banca Transilvania S.A. (Banks) | | | 4,144,906 | | | | 2,389 | |
| | Russia—0.9% | | | | | | | | |
| | TCS Group Holding plc—GDR (Banks) | | | 91,000 | | | | 1,784 | |
| * | Yandex N.V. Class “A” (Interactive Media & Services)† | | 150,022 | | | | 5,701 | |
| | | | | | | | | 7,485 | |
| | South Africa—4.1% | | | | | | | | |
| | Bidvest Group, Ltd. (Industrial conglomerates) | | | 135,760 | | | | 1,825 | |
| | Capitec Bank Holdings, Ltd. (Banks) | | | 75,177 | | | | 6,932 | |
| | Clicks Group, Ltd. (Food & staples retailing) | | | 255,447 | | | | 3,723 | |
| | FirstRand, Ltd. (Diversified financial services) | | | 811,309 | | | | 3,948 | |
| | Naspers, Ltd. (Media) | | | 69,029 | | | | 16,759 | |
| | | | | | | | | 33,187 | |
| | United Arab Emirates—1.4% | | | | | | | | |
| | Aramex PJSC (Air freight & logistics) | | | 1,467,823 | | | | 1,658 | |
| | First Abu Dhabi Bank PJSC (Banks) | | | 1,309,262 | | | | 5,297 | |
| * | Network International Holdings plc (IT services) | | | 519,419 | | | | 3,912 | |
| | | | | | | | | 10,867 | |
| | Total Common Stocks—96.4%
(cost $627,532) | | | | | | | 773,219 | |
| | | | Shares or | | | | |
| | | | Principal | | | | |
| | Issuer | | Amount | | | Value | |
| | | | | | | | | | |
| | Preferred Stock | | | | | | | | |
| | Brazil—1.7% | | | | | | | | |
| | Itau Unibanco Holding S.A. (Banks) | | | 1,444,990 | | | $ | 13,645 | |
| | Total Preferred Stock—1.7%
(cost $13,838) | | | | | | | 13,645 | |
| | | | | | | | | | |
| | Repurchase Agreement | | | | | | | | |
| | Fixed Income Clearing Corporation, 0.500% dated 6/28/19, due 7/1/19, repurchase price $14,764, collateralized by U.S. Treasury Note, 1.500%, due 8/15/26 | | | $14,763 | | | $ | 14,763 | |
| | Total Repurchase Agreement—1.8%
(cost $14,763) | | | | | | | 14,763 | |
| | Total Investments—99.9%
(cost $656,133) | | | | | | | 801,627 | |
| | Cash and other assets, less liabilities—0.1% | | | | | | | 703 | |
| | Net assets—100.0% | | | | | | $ | 802,330 | |
ADR = American Depository Receipt
* = Non-income producing security
† = U.S. listed foreign security
@ = Value is less than the minimum amount disclosed.
For securities primarily traded on exchanges or markets that close before the close of regular trading on the New York Stock Exchange, the Fund may use an independent pricing service to fair value price the securities pursuant to Valuation Procedures approved by the Board of Trustees.
See accompanying Notes to Financial Statements.
| June 30, 2019 | William Blair Funds | 75 |
Emerging Markets Growth Fund
Portfolio of Investments, June 30, 2019(unaudited)
At June 30, 2019, the Fund’s Portfolio of Investments includes the following industry categories (as a percentage of long-term investments):
| Financials | | | 32.6 | % |
| Consumer Discretionary | | | 23.3 | % |
| Information Technology | | | 11.6 | % |
| Consumer Staples | | | 9.7 | % |
| Communication Services | | | 7.9 | % |
| Industrials | | | 6.6 | % |
| Energy | | | 2.3 | % |
| Health Care | | | 2.1 | % |
| Materials | | | 1.8 | % |
| Utilities | | | 1.1 | % |
| Real Estate | | | 1.0 | % |
| Total | | | 100.0 | % |
At June 30, 2019, the Fund’s Portfolio of Investments includes the following currency categories (as a percentage of long-term investments):
| Indian Rupee | | | 18.6 | % |
| U.S. Dollar | | | 17.2 | % |
| Hong Kong Dollar | | | 15.1 | % |
| Brazilian Real | | | 12.1 | % |
| Yuan Renminbi | | | 7.6 | % |
| New Taiwan Dollar | | | 6.1 | % |
| South Korean Won | | | 4.3 | % |
| South African Rand | | | 4.2 | % |
| Indonesian Rupiah | | | 3.5 | % |
| Thai Baht | | | 3.4 | % |
| Mexican Peso | | | 2.1 | % |
| Hungarian Forint | | | 1.2 | % |
| All Other Currencies | | | 4.6 | % |
| Total | | | 100.0 | % |
See accompanying Notes to Financial Statements.
| 76 | Semiannual Report | June 30, 2019 |
| | Emerging Markets Small Cap Growth Fund |
| | |
| | The Emerging Markets Small Cap Growth Fund seeks long-term capital appreciation. |
| | |
| | AN OVERVIEW FROM THE PORTFOLIO MANAGERS |
| | |

Todd M. McClone 
Casey K. Preyss | The William Blair Emerging Markets Small Cap Growth Fund (Class N shares) posted an 8.88% increase, net of fees, for the six months ended June 30, 2019. By comparison, the Fund’s benchmark index, the MSCI Emerging Markets Small Cap Index (net) (the “Index”), increased 6.70%. Six-month outperformance versus the Index was primarily driven by positive stock selection across most sectors. Stock selection within the Industrials sector was particularly positive, enhanced by Centre Testing International Group Co., Ltd. and Localiza Rent a Car S.A. . Centre Testing International is a leading testing, inspection and certification company in a highly fragmented market. The stock price accelerated on the back of the company’s strong operating momentum amid solid sales growth across all business segments and management’s increased focus on profitability, which led to impressive gross margin growth. The share price of Brazilian rental car company Localiza Rent a Car strengthened due to the company’s robust operating performance and positive growth outlook amid an improved macro backdrop in Brazil, continued industry consolidation, and efficiency gains. Partially offsetting these positive effects was negative stock selection within the Utilities and Materials sectors. Within Utilities, Mahanagar Gas, Ltd. hampered relative returns, due to disappointing results from the fourth quarter of 2019. Within Materials, Posco Chemical Co., Ltd., a Korean-based leading producer of carbon-based battery anode and other advanced materials, detracted from relative performance as weaker needle coke prices weighed on the stock. Needle coke is a key raw material for electric steel-making equipment, which Posco Chemical is heavily reliant upon. Please refer to the Global Markets Review and Outlook relating to the Fund beginning on page 32 for additional information. |
| June 30, 2019 | William Blair Funds | 77 |
Emerging Markets Small Cap Growth Fund
Performance Highlights (Unaudited)
Average Annual Total Return through 6/30/2019
| | | Year
to Date | | 1 Year | | 3 Year | | 5 Year | | Since
Inception |
| Class N(a) | | | 8.88 | % | | | (8.06 | )% | | | 3.04 | % | | | 1.24 | % | | | 7.92 | % |
| Class I(a) | | | 8.97 | | | | (7.81 | ) | | | 3.36 | | | | 1.54 | | | | 8.23 | |
| MSCI Emerging Markets Small Cap Index (net)(a) | | | 6.70 | | | | (5.12 | ) | | | 5.46 | | | | 0.53 | | | | 3.41 | |
| Class R6(b) | | | 9.03 | | | | (7.75 | ) | | | 3.42 | | | | 1.62 | | | | 5.66 | |
| MSCI Emerging Markets Small Cap Index (net)(b) | | | 6.70 | | | | (5.12 | ) | | | 5.46 | | | | 0.53 | | | | 2.12 | |
| (a) | Since inception is for the period from October 24, 2011 (Commencement of Operations) to June 30, 2019. |
| (b) | Since inception is for the period from December 20, 2012 (Commencement of Operations) to June 30, 2019. |
Performance cited represents past performance. Past performance does not guarantee future results and current performance may be lower or higher than the data quoted. Results shown are average annual returns, which assume reinvestment of dividends and capital gains. Investment returns and principal will fluctuate and you may have a gain or loss when you sell shares. For the most current month-end performance information, please call 1-800-742-7272, or visit our Web site atwww.williamblairfunds.com. From time to time, the investment adviser may waive fees or reimburse expenses for the Fund. Without these waivers/reimbursements, performance would be lower. International investing involves special risk considerations, including currency fluctuations, lower liquidity, economic and political risk. These risks may be magnified when investing in emerging markets. Smaller capitalization stocks are also more sensitive to purchase/sale transactions and changes in the issuer’s financial condition. Class N shares are not subject to a sales load. Class I shares are not subject to a sales load or distribution (Rule 12b-1) fees. Class R6 shares are not subject to a sales load, distribution (Rule 12b-1) fees, or sub-transfer agent fees.
The performance highlights and graph presented above do not reflect the deduction of taxes that a shareholder would pay on fund distributions or the redemption of fund shares.
The Morgan Stanley Capital International (MSCI) Emerging Markets Small Cap Index (net) is a free float-adjusted market capitalization index that is designed to measure the equity market performance of emerging markets. This index approximates the minimum possible dividend reinvestment by deducting for the highest possible withholding tax rates of those markets.
This report identifies the Fund’s investments on June 30, 2019. These holdings are subject to change. Not all stocks in the Fund performed the same, nor is there any guarantee that these stocks will perform as well in the future. Market forecasts provided in this report may not necessarily come to pass.
Sector Diversification (Unaudited)
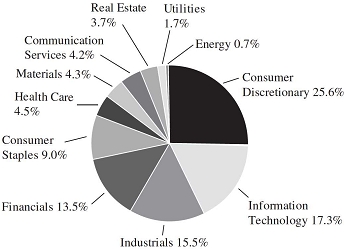
The sector diversification shown is based on the total long-term securities.
| 78 | Semiannual Report | June 30, 2019 |
Emerging Markets Small Cap Growth Fund
Portfolio of Investments, June 30, 2019(all dollar amounts in thousands) (unaudited)
| | | | | | | | |
| | | | | | | | |
| | Issuer | | Shares | | | Value | |
| | | | | | | | | | |
| | Common Stocks | | | | | | | | |
| | | | | | | | | | |
| | Emerging Asia—75.4% | | | | | | | | |
| | Cambodia—0.7% | | | | | | | | |
| | NagaCorp, Ltd. (Hotels, restaurants & leisure) | | | 1,578,000 | | | $ | 1,941 | |
| | China—20.5% | | | | | | | | |
| | A-Living Services Co. Ltd. Class “H” (Commercial services & supplies) | | | 1,071,250 | | | | 1,810 | |
| | Anhui Gujing Distillery Co., Ltd. Class “A” (Beverages) | | | 73,700 | | | | 1,272 | |
| * | Ausnutria Dairy Corporation, Ltd. (Food products) | | | 44,000 | | | | 88 | |
| | Centre Testing International Group Co., Ltd. Class “A” (Professional services) | | | 1,214,105 | | | | 1,909 | |
| | China Education Group Holdings, Ltd. (Diversified consumer services) | | | 2,291,000 | | | | 3,578 | |
| | China Suntien Green Energy Corporation, Ltd. Class “H” (Oil, gas & consumable fuels) | | | 7,344,000 | | | | 1,955 | |
| | China Water Affairs Group, Ltd. (Water utilities) | | | 1,460,000 | | | | 1,437 | |
| | CIFI Holdings Group Co., Ltd. (Real estate management & development) | | | 1,660,000 | | | | 1,094 | |
| | Country Garden Services Holdings Co., Ltd. (Commercial services & supplies) | | | 1,045,000 | | | | 2,416 | |
| * | GSX Techedu, Inc.—ADR (Diversified consumer services) | | | 85,359 | | | | 921 | |
| | Guangdong Haid Group Co., Ltd. Class “A” (Food products) | | | 516,204 | | | | 2,322 | |
| | Hangzhou Tigermed Consulting Co., Ltd. Class “A” (Life sciences tools & services) | | | 100,000 | | | | 1,123 | |
| | Hua Hong Semiconductor Ltd. (Semiconductors & semiconductor equipment) | | | 486,600 | | | | 942 | |
| | Jiangsu Hengli Hydraulic Co., Ltd. Class “A” (Machinery) | | | 267,466 | | | | 1,222 | |
| | Jiangsu Hengshun Vinegar Industry Co., Ltd. Class “A” (Food products) | | | 669,500 | | | | 1,796 | |
| | JNBY Design, Ltd. (Textiles, apparel & luxury goods) | | | 906,000 | | | | 1,661 | |
| | Jonjee Hi-Tech Industrial And Commercial Holding Co., Ltd. Class “A” (Food products) | | | 327,529 | | | | 2,042 | |
| | Kingdee International Software Group Co., Ltd. (Software) | | | 1,714,000 | | | | 1,854 | |
| * | Kingsoft Corporation, Ltd. (Software) | | | 563,000 | | | | 1,218 | |
| * | KWG Group Holdings, Ltd. (Real estate management & development) | | | 1,401,000 | | | | 1,422 | |
| | Li Ning Co., Ltd. (Textiles, apparel & luxury goods) | | | 1,999,000 | | | | 4,714 | |
| | Logan Property Holdings Co., Ltd. (Real estate management & development) | | | 1,060,000 | | | | 1,715 | |
| * | Noah Holdings, Ltd.—ADR (Capital markets) | | | 9,181 | | | | 391 | |
| | Qiaqia Food Co., Ltd. Class “A” (Food products) | | | 535,913 | | | | 1,970 | |
| | | | | | | | |
| | | | | | | | |
| | Issuer | | Shares | | | Value | |
| | | | | | | | | | |
| | Common Stocks—(continued) | | | | | | | | |
| | | | | | | | | | |
| | Emerging Asia—(continued) | | | | | | | | |
| | China—(continued) | | | | | | | | |
| | Silergy Corporation (Semiconductors & semiconductor equipment) | | | 78,000 | | | $ | 1,527 | |
| | Toly Bread Co., Ltd. Class “A” (Food products) | | | 119,400 | | | | 724 | |
| * | Topchoice Medical Investment Corporation Class “A” (Health care providers & services) | | | 122,700 | | | | 1,583 | |
| | TravelSky Technology, Ltd. Class “H” (IT services) | | | 235,000 | | | | 472 | |
| | Venustech Group, Inc. Class “A” (Software) | | | 226,383 | | | | 887 | |
| | Vitasoy International Holdings, Ltd. (Food products) | | | 382,000 | | | | 1,836 | |
| | Xtep International Holdings, Ltd. (Textiles, apparel & luxury goods) | | | 1,369,000 | | | | 825 | |
| * | Yihai International Holding, Ltd. (Food products) | | | 749,000 | | | | 3,888 | |
| | Zhejiang Dingli Machinery Co., Ltd. Class “A” (Machinery) | | | 175,654 | | | | 1,502 | |
| | Zhejiang Supor Co., Ltd. Class “A” (Household durables) | | | 223,308 | | | | 2,465 | |
| | Zhejiang Weixing New Building Materials Co., Ltd. Class “A” (Building products) | | | 525,976 | | | | 1,333 | |
| | | | | | | | | 57,914 | |
| | India—22.6% | | | | | | | | |
| | Aarti Industries, Ltd. (Chemicals) | | | 138,963 | | | | 3,577 | |
| | Astral Poly Technik, Ltd. (Building products) | | | 219,534 | | | | 4,214 | |
| | Bandhan Bank Ltd. (Banks) | | | 196,962 | | | | 1,541 | |
| | Bata India, Ltd. (Textiles, apparel & luxury goods) | | | 132,730 | | | | 2,776 | |
| | Berger Paints India, Ltd. (Chemicals) | | | 354,377 | | | | 1,632 | |
| | City Union Bank, Ltd. (Banks) | | | 716,507 | | | | 2,263 | |
| | Endurance Technologies Ltd. (Auto components) | | | 82,048 | | | | 1,311 | |
| * | Gruh Finance, Ltd. (Thrifts & mortgage finance) | | | 717,244 | | | | 2,893 | |
| | Havells India, Ltd. (Electrical equipment) | | | 338,718 | | | | 3,845 | |
| | HDFC Asset Management Co. Ltd. (Capital markets) | | | 45,106 | | | | 1,347 | |
| | Indraprastha Gas, Ltd. (Gas utilities) | | | 387,115 | | | | 1,766 | |
| | Info Edge India, Ltd. (Interactive Media & Services) | | | 121,472 | | | | 3,956 | |
| | Ipca Laboratories, Ltd. (Pharmaceuticals) | | | 169,619 | | | | 2,265 | |
| | Jubilant Foodworks, Ltd. (Hotels, restaurants & leisure) | | | 72,809 | | | | 1,300 | |
| | Kajaria Ceramics, Ltd. (Building products) | | | 182,433 | | | | 1,538 | |
| | KEI Industries, Ltd. (Electrical equipment) | | | 143,933 | | | | 1,001 | |
| | Larsen & Toubro Infotech Ltd. (IT services) | | | 35,531 | | | | 949 | |
See accompanying Notes to Financial Statements.
| June 30, 2019 | William Blair Funds | 79 |
Emerging Markets Small Cap Growth Fund
Portfolio of Investments, June 30, 2019(all dollar amounts in thousands) (unaudited)
| | | | | | | | |
| | | | | | | | |
| | Issuer | | Shares | | | Value | |
| | | | | | | | | | |
| | Common Stocks—(continued) | | | | | | | | |
| | | | | | | | | | |
| | Emerging Asia—(continued) | | | | | | | | |
| | India—(continued) | | | | | | | | |
| | Mahanagar Gas, Ltd. (Gas utilities) | | | 126,266 | | | $ | 1,557 | |
| | NIIT Technologies, Ltd. (IT services) | | | 115,022 | | | | 2,241 | |
| | Oberoi Realty, Ltd. (Real estate management & development) | | | 106,412 | | | | 931 | |
| | PI Industries, Ltd. (Chemicals) | | | 73,965 | | | | 1,258 | |
| | Pidilite Industries, Ltd. (Chemicals) | | | 144,477 | | | | 2,545 | |
| | PVR, Ltd. (Entertainment) | | | 117,660 | | | | 2,850 | |
| | RBL Bank Ltd. (Banks) | | | 213,730 | | | | 1,988 | |
| | SRF, Ltd. (Chemicals) | | | 65,973 | | | | 2,908 | |
| | Sundram Fasteners, Ltd. (Auto components) | | | 117,014 | | | | 866 | |
| | Titan Co., Ltd. (Textiles, apparel & luxury goods) | | | 282,923 | | | | 5,457 | |
| | V-Mart Retail, Ltd. (Multiline retail) | | | 33,702 | | | | 1,076 | |
| | Varun Beverages, Ltd. (Beverages) | | | 128,738 | | | | 1,762 | |
| | | | | | | | | 63,613 | |
| | Indonesia—4.0% | | | | | | | | |
| | PT Ace Hardware Indonesia Tbk (Specialty retail) | | | 38,995,000 | | | | 4,996 | |
| * | PT Bank Tabungan Pensiunan Nasional Syariah Tbk (Banks) | | | 8,533,400 | | | | 2,084 | |
| | PT Gudang Garam Tbk (Tobacco) | | | 19,900 | | | | 108 | |
| | PT Media Nusantara Citra Tbk (Media) | | | 11,106,900 | | | | 818 | |
| | PT Pakuwon Jati Tbk (Real estate management & development) | | | 62,172,500 | | | | 3,213 | |
| | | | | | | | | 11,219 | |
| | Philippines—4.0% | | | | | | | | |
| | Bloomberry Resorts Corporation (Hotels, restaurants & leisure) | | | 10,471,300 | | | | 2,309 | |
| | International Container Terminal Services, Inc. (Transportation infrastructure) | | | 1,166,630 | | | | 3,334 | |
| | Jollibee Foods Corporation (Hotels, restaurants & leisure) | | | 345,940 | | | | 1,903 | |
| | Security Bank Corporation (Banks) | | | 635,640 | | | | 2,109 | |
| | Wilcon Depot, Inc. (Specialty retail) | | | 4,956,500 | | | | 1,625 | |
| | | | | | | | | 11,280 | |
| | South Korea—5.6% | | | | | | | | |
| | Dentium Co., Ltd. (Health care equipment & supplies) | | | 11,512 | | | | 733 | |
| | Douzone Bizon Co., Ltd. (Software) | | | 55,190 | | | | 2,973 | |
| | Fila Korea, Ltd. (Textiles, apparel & luxury goods) | | | 48,557 | | | | 3,226 | |
| | JYP Entertainment Corporation (Entertainment) | | | 97,243 | | | | 2,013 | |
| | Koh Young Technology, Inc. (Semiconductors & semiconductor equipment) | | | 42,453 | | | | 3,055 | |
| | Korea Investment Holdings Co., Ltd. (Capital markets) | | | 23,844 | | | | 1,666 | |
| | Macquarie Korea Infrastructure Fund (Capital markets) | | | 201,593 | | | | 2,060 | |
| | | | | | | | | 15,726 | |
| | | | | | | | |
| | | | | | | | |
| | Issuer | | Shares | | | Value | |
| | | | | | | | | | |
| | Common Stocks—(continued) | | | | | | | | |
| | | | | | | | | | |
| | Emerging Asia—(continued) | | | | | | | | |
| | Taiwan—14.8% | | | | | | | | |
| | Airtac International Group (Machinery) | | | 206,000 | | | $ | 2,308 | |
| | ASMedia Technology, Inc. (Semiconductors & semiconductor equipment) | | | 122,000 | | | | 1,901 | |
| | ASPEED Technology, Inc. (Semiconductors & semiconductor equipment) | | | 71,000 | | | | 1,353 | |
| | Bizlink Holding, Inc. (Electrical equipment) | | | 285,000 | | | | 1,973 | |
| | Chailease Holding Co., Ltd. (Diversified financial services) | | | 292,000 | | | | 1,208 | |
| | Chroma ATE, Inc. (Electronic equipment, instruments & components) | | | 507,000 | | | | 2,253 | |
| | Eclat Textile Co., Ltd. (Textiles, apparel & luxury goods) | | | 43,000 | | | | 551 | |
| | Feng TAY Enterprise Co., Ltd. (Textiles, apparel & luxury goods) | | | 440,000 | | | | 3,428 | |
| | Giant Manufacturing Co., Ltd. (Leisure products) | | | 201,000 | | | | 1,573 | |
| | Globalwafers Co., Ltd. (Semiconductors & semiconductor equipment) | | | 130,000 | | | | 1,316 | |
| | ITEQ Corporation (Electronic equipment, instruments & components) | | | 515,000 | | | | 1,807 | |
| | King Yuan Electronics Co., Ltd. (Semiconductors & semiconductor equipment) | | | 1,293,000 | | | | 1,116 | |
| | Land Mark Optoelectronics Corporation (Semiconductors & semiconductor equipment) | | | 114,000 | | | | 960 | |
| | Makalot Industrial Co., Ltd. (Textiles, apparel & luxury goods) | | | 488,000 | | | | 3,300 | |
| | Nanya Technology Corporation (Semiconductors & semiconductor equipment) | | | 357,000 | | | | 741 | |
| | Parade Technologies, Ltd. (Semiconductors & semiconductor equipment) | | | 221,000 | | | | 3,757 | |
| | Sinbon Electronics Co., Ltd. (Electronic equipment, instruments & components) | | | 962,000 | | | | 3,515 | |
| | Sporton International, Inc. (Professional services) | | | 210,000 | | | | 1,241 | |
| | Taiwan Paiho, Ltd. (Textiles, apparel & luxury goods) | | | 530,000 | | | | 1,531 | |
| | Taiwan Union Technology Corporation (Electronic equipment, instruments & components) | | | 511,000 | | | | 2,048 | |
| | Tripod Technology Corporation (Electronic equipment, instruments & components) | | | 432,000 | | | | 1,530 | |
| | Voltronic Power Technology Corporation (Electrical equipment) | | | 105,000 | | | | 2,289 | |
| | | | | | | | | 41,699 | |
| | Thailand—3.2% | | | | | | | | |
| | Bangkok Expressway & Metro PCL (Transportation infrastructure) | | | 6,046,100 | | | | 2,247 | |
See accompanying Notes to Financial Statements.
| 80 | Semiannual Report | June 30, 2019 |
Emerging Markets Small Cap Growth Fund
Portfolio of Investments, June 30, 2019(all dollar amounts in thousands) (unaudited)
| | | | | | | | |
| | | | | | | | |
| | Issuer | | Shares | | | Value | |
| | | | | | | | | | |
| | Common Stocks—(continued) | | | | | | | | |
| | | | | | | | | | |
| | Emerging Asia—(continued) | | | | | | | | |
| | Thailand—(continued) | | | | | | | | |
| | Home Product Center PCL (Specialty retail) | | | 4,783,400 | | | $ | 2,730 | |
| | Muangthai Capital PCL (Consumer finance) | | | 1,066,700 | | | | 1,965 | |
| | Tisco Financial Group PCL (Banks) | | | 725,500 | | | | 2,212 | |
| | | | | | | | | 9,154 | |
| | | | | | | | | | |
| | Emerging Latin America—14.1% | | | | | | | | |
| | Argentina—1.3% | | | | | | | | |
| * | Globant S.A. (Software)† | | | 37,623 | | | | 3,802 | |
| | Brazil—12.8% | | | | | | | | |
| * | Azul S.A.—ADR (Airlines) | | | 14,400 | | | | 482 | |
| | BK Brasil Operacao e Assessoria a Restaurantes S.A. (Hotels, restaurants & leisure) | | | 475,200 | | | | 2,752 | |
| | Construtora Tenda S.A. (Household durables) | | | 522,372 | | | | 3,251 | |
| | Cyrela Brazil Realty SA Empreendimentos e Participacoes (Household durables) | | | 605,600 | | | | 3,280 | |
| | IRB Brasil Resseguros S.A. (Insurance) | | | 129,700 | | | | 3,327 | |
| | Localiza Rent a Car S.A. (Road & rail) | | | 348,995 | | | | 3,725 | |
| | Magazine Luiza S.A. (Multiline retail) | | | 58,300 | | | | 3,205 | |
| | MRV Engenharia e Participacoes S.A. (Household durables) | | | 297,400 | | | | 1,516 | |
| | Multiplan Empreendimentos Imobiliarios S.A. (Real estate management & development) | | | 272,200 | | | | 1,968 | |
| | Notre Dame Intermedica Participacoes S.A. (Health care providers & services) | | | 418,500 | | | | 4,394 | |
| | OdontoPrev S.A. (Health care providers & services) | | | 523,100 | | | | 2,488 | |
| | Sul America S.A. (Insurance) | | | 90,000 | | | | 879 | |
| | Tegma Gestao Logistica S.A. (Road & rail) | | | 331,700 | | | | 2,483 | |
| | TOTVS S.A. (Software) | | | 210,100 | | | | 2,406 | |
| | | | | | | | | 36,156 | |
| | | | | | | | | | |
| | Emerging Europe, Mid-East, Africa—7.9% | | | | | | | | |
| | Greece—0.2% | | | | | | | | |
| | JUMBO S.A. (Specialty retail) | | | 25,696 | | | | 497 | |
| | Kenya—0.4% | | | | | | | | |
| | Safaricom, Ltd. (Wireless telecommunication services) | | | 3,974,400 | | | | 1,085 | |
| | Poland—1.6% | | | | | | | | |
| | CD Projekt S.A. (Entertainment) | | | 15,191 | | | | 876 | |
| * | Dino Polska S.A. (Food & staples retailing) | | | 101,753 | | | | 3,567 | |
| | | | | | | | | 4,443 | |
| | | | Shares or | | | | |
| | | | Principal | | | | |
| | Issuer | | Amount | | | Value | |
| | | | | | | | | | |
| | Common Stocks—(continued) | | | | | | | | |
| | | | | | | | | | |
| | Emerging Europe, Mid-East, Africa—(continued) | | | | | | | | |
| | Russia—0.5% | | | | | | | | |
| | TCS Group Holding plc—GDR (Banks) | | | 74,333 | | | $ | 1,457 | |
| | South Africa—4.0% | | | | | | | | |
| | AVI, Ltd. (Food products) | | | 180,074 | | | | 1,168 | |
| | Capitec Bank Holdings, Ltd. (Banks) | | | 34,381 | | | | 3,170 | |
| | Clicks Group, Ltd. (Food & staples retailing) | | | 162,265 | | | | 2,365 | |
| | PSG Group, Ltd. (Diversified financial services) | | | 211,465 | | | | 3,589 | |
| | Santam, Ltd. (Insurance) | | | 53,720 | | | | 1,144 | |
| | | | | | | | | 11,436 | |
| | United Arab Emirates—1.2% | | | | | | | | |
| * | Network International Holdings plc (IT services) | | | 446,857 | | | | 3,365 | |
| | Total Common Stocks—97.4%
(cost $236,249) | | | | | | | 274,787 | |
| | | | | | | | | | |
| | Preferred Stock | | | | | | | | |
| | Brazil—0.8% | | | | | | | | |
| | Randon Participacoes S.A. (Machinery) | | | 908,350 | | | | 2,138 | |
| | Total Preferred Stock—0.8%
(cost $1,810) | | | | | | | 2,138 | |
| | | | | | | | | | |
| | Repurchase Agreement | | | | | | | | |
| | Fixed Income Clearing Corporation, 0.500% dated 6/28/19, due 7/1/19, repurchase price $224, collateralized by U.S. Treasury Note, 1.500%, due 8/15/26 | | | $224 | | | | 224 | |
| | Total Repurchase Agreement—0.1%
(cost $224) | | | | | | | 224 | |
| | Total Investments—98.3%
(cost $238,283) | | | | | | | 277,149 | |
| | Cash and other assets, less liabilities—1.7% | | | | | | | 4,843 | |
| | Net assets—100.0% | | | | | | $ | 281,992 | |
ADR = American Depository Receipt
GDR = Global Depository Receipt
* = Non-income producing security
† = U.S. listed foreign security
For securities primarily traded on exchanges or markets that close before the close of regular trading on the New York Stock Exchange, the Fund may use an independent pricing service to fair value price the securities pursuant to Valuation Procedures approved by the Board of Trustees.
See accompanying Notes to Financial Statements.
| June 30, 2019 | William Blair Funds | 81 |
Emerging Markets Small Cap Growth Fund
Portfolio of Investments, June 30, 2019(unaudited)
At June 30, 2019, the Fund’s Portfolio of Investments includes the following industry categories (as a percentage of long-term investments):
| Consumer Discretionary | | | 25.6 | % |
| Information Technology | | | 17.3 | % |
| Industrials | | | 15.5 | % |
| Financials | | | 13.5 | % |
| Consumer Staples | | | 9.0 | % |
| Health Care | | | 4.5 | % |
| Materials | | | 4.3 | % |
| Communication Services | | | 4.2 | % |
| Real Estate | | | 3.7 | % |
| Utilities | | | 1.7 | % |
| Energy | | | 0.7 | % |
| Total | | | 100.0 | % |
At June 30, 2019, the Fund’s Portfolio of Investments includes the following currency categories (as a percentage of long-term investments):
| Indian Rupee | | | 23.0 | % |
| New Taiwan Dollar | | | 15.6 | % |
| Brazilian Real | | | 13.7 | % |
| Hong Kong Dollar | | | 12.6 | % |
| Yuan Renminbi | | | 8.0 | % |
| South Korean Won | | | 5.7 | % |
| South African Rand | | | 4.1 | % |
| Philippine Peso | | | 4.1 | % |
| Indonesian Rupiah | | | 4.0 | % |
| Thai Baht | | | 3.3 | % |
| U.S. Dollar | | | 2.5 | % |
| Polish Zloty | | | 1.6 | % |
| British Pound Sterling | | | 1.2 | % |
| All Other Currencies | | | 0.6 | % |
| Total | | | 100.0 | % |
See accompanying Notes to Financial Statements.
| 82 | Semiannual Report | June 30, 2019 |
Fixed Income Market Review and Outlook
The Bloomberg Barclays U.S. Aggregate Index (the “Index”) returned 3.08% during the second quarter of 2019 and 6.11% for the year-to-date period ending June 30, 2019. It has been a favorable environment for high-quality bonds year-to-date. Interest rates declined throughout the first half of the year, as the 10 Year U.S. Treasury Note’s yield declined by roughly 0.70% year-to-date and traded at levels below 2.00% during June before closing the quarter with a yield of 2.01%. Corporate risk spreads declined during the first quarter of 2019 and changed little during the second quarter.
The Federal Open Market Committee (“FOMC”) made no changes to the target range of the federal funds rate year-to-date. However, the market’s expectations of FOMC activity has changed drastically. The market’s implied expectations indicated a belief that the FOMC would keep the target range of the Federal Funds rate unchanged during 2019, with more market participants protecting against rate hikes during the year than there were market participants protecting against rate cuts. At the end of the second quarter, the market’s implied expectations revealed expectations of two rate cuts during the last six months of 2019 (by 0.25% each time) with an immeasurably low number of market participants protecting against a rate hike. Interest rates on most tenors of U.S. Treasury securities (“Treasuries”) responded by declining to levels below the yield on three-month Treasury bills.
The FOMC also updated its plans regarding the size and composition of its balance sheet. The FOMC had been permitting the balance sheet to reduce by no more than $50 billion per month since October 2017. The FOMC will now permit the balance sheet to reduce by no more than $35 billion per month from May through September 2019 and by no more than $20 billion per month starting in October 2019. The FOMC communicated plans to change the composition of the balance sheet so that it is comprised of primarily Treasuries. The FOMC intends to allow the balance sheet’s agency mortgage-backed securities (“MBS”) to decline at a rate of no more than $20 billion per month, while any cash flows generated in excess of $20 billion per month will be reinvested into Treasuries. The FOMC also stated that “limited sales of agency MBS might be warranted in the longer run to reduce or eliminate residual holdings. The timing and pace of any sales would be communicated to the public well in advance.”
U.S. Treasury Inflation-Protected Securities (“TIPS”) performed in-line with comparable fixed-rate Treasuries year-to-date. Market-implied breakeven inflation rates changed little since the beginning of year, although the implied expectations increased significantly during the first quarter and decreased significantly during the second quarter. The current implied inflation expectations are below the FOMC’s stated objective of 2.0% to 2.5% per year.
Agency MBS outperformed comparable duration U.S. Treasuries year-to-date despite underperforming during the second quarter. The best-performing segments of the market year-to-date were higher-coupon 30-year pools (coupons of 6.0% and 6.5%) and 30-year 3.0% pools that became the production coupon (the coupon of pools given the prevailing level of mortgage rates) amid the declining interest rate environment during the first half of 2019.
Corporate bonds of all tenors, credit qualities, and sectors outperformed similar-maturity Treasury instruments during the second quarter and year-to-date. Longer-maturity corporate bonds outperformed shorter-maturity corporate bonds after adjusting for the effects of duration. Lower-quality segments of the market outperformed higher-quality segments of the market year-to-date. Emerging market corporate bonds also generated strong returns during the first half of 2019.
We believe that the FOMC will be measured in its decisions to decrease the target range of the federal funds rate in 2019. The U.S. economy is growing; forecasters predict a real GDP growth rate of approximately 2.1% during 2019. In addition, the U.S. labor market is adding jobs and the unemployment rate is at 3.7% as of June 30, 2019. Estimates of wage inflation are roughly 3.7%, while estimates of core personal consumption expenditures (“PCE”) are 1.5% as of June 30, 2019. We believe that the FOMC will not cut rates to levels that may spur undesired inflationary pressures.
We believe TIPS are an attractive alternative to fixed-rate Treasuries to mitigate the effects of rising rates driven by accelerating inflationary pressures. We believe that spread sectors remain attractive relative to Treasuries over the intermediate-to-long term. Corporate risk premiums are at levels above their longer-term averages, and we believe there are attractive opportunities in this market. Risk premiums of higher-coupon segments of the agency MBS market remain attractive.
| June 30, 2019 | William Blair Funds | 83 |
Fixed Income Market Review and Outlook (continued)
We believe that higher-coupon segments (30-year MBS coupon rates of 5.0% and above) of the agency MBS market offer compelling value. In our view, these segments of the agency MBS market offer attractive spreads and a defensive duration profile. The key risk of these securities is that the underlying borrowers are in-the-money to refinance their loan. We believe this risk can be mitigated by focusing on pools comprised of borrowers that do not have the economic incentive to refinance their loans: low-loan balance pools.
We believe that there are opportunities in the corporate bond market. We remain concerned about company-specific risks, including shareholder-friendly activities such as leveraged finance mergers and acquisitions, large share repurchases, and special dividends. Importantly, we do not believe the market will enter a period of excessive leveraged buy-out activity.
| 84 | Semiannual Report | June 30, 2019 |
| | Bond Fund |
| | |
| | The Bond Fund seeks to outperform the Bloomberg Barclays U.S. Aggregate Index by maximizing total return through a combination of income and capital appreciation. |
| | |
| | AN OVERVIEW FROM THE PORTFOLIO MANAGERS |
| | |

Paul J. Sularz 
Christopher T. Vincent | The William Blair Bond Fund (Class N shares) returned 8.05%, net of fees, for the six month period ended June 30, 2019. By comparison, the Fund’s benchmark, the Bloomberg Barclays U.S. Aggregate Index (the “Index”), returned 6.11%. A couple of factors contributed to the Fund’s performance relative to the Index year-to-date. The Fund’s overweight to longer-maturity investment-grade corporate bonds was additive to performance. Positions that contributed to performance included bonds issued by AT&T, Inc., HSBC Holdings plc, Citigroup, Inc., and Toll Brothers Finance Corporation. The Fund experienced contributions from an allocation to high-yield corporate bonds coupled with favorable selection results, with specific contributions from positions in bonds issued by Navient Corporation, United Rentals North America, Inc., and Penske Automotive Group, Inc. Positioning in corporate bonds issued by companies domiciled in emerging markets also impacted results favorably, as holdings in bonds issued by Petrobras Global Finance B.V. and Mexichem S.A.B. de C.V. were additive. An overweight allocation to higher-coupon segments of the agency mortgage-backed securities market impacted results favorably. There were a couple of factors that detracted from the Fund’s performance relative to the Index year-to-date. Credit risk hedging detracted from the Fund’s results as corporate bonds generated strong returns. Residual cash dragged on performance as bonds experienced gains. Please refer to the Fixed Income Market Review and Outlook relating to the Fund beginning on page 83 for additional information. |
| June 30, 2019 | William Blair Funds | 85 |
Bond Fund
Performance Highlights (Unaudited)
| Average Annual Total Return through 6/30/2019 |
| | | Year
to Date | | 1 Year | | 3 Year | | 5 Year | | 10 Year |
| Class N | | 8.05 | % | | 7.89 | % | | 2.74 | % | | 2.80 | % | | 4.62 | % |
| Class I | | 8.09 | | | 7.99 | | | 2.94 | | | 2.98 | | | 4.80 | |
| Class R6 | | 8.12 | | | 8.05 | | | 3.00 | | | 3.05 | | | 4.91 | |
| Bloomberg Barclays U.S. Aggregate Index | | 6.11 | | | 7.87 | | | 2.31 | | | 2.95 | | | 3.90 | |
Performance cited represents past performance. Past performance does not guarantee future results and current performance may be lower or higher than the data quoted. Results shown are average annual total returns, which assume reinvestment of dividends and capital gains. Investment returns and principal will fluctuate and you may have a gain or loss when you sell shares. For the most current month-end performance information, please call 1-800-742-7272, or visit our Web site atwww.williamblairfunds.com. From time to time, the investment adviser may waive fees or reimburse expenses for the Fund. Without these waivers/reimbursements, performance would be lower. Class N shares are not subject to a sales load. Class I shares are not subject to a sales load or distribution (Rule 12b-1) fees. Class R6 shares are not subject to a sales load, distribution (Rule 12b-1) fees, or sub-transfer agent fees.
The performance highlights and graph presented above do not reflect the deduction of taxes that a shareholder would pay on fund distributions or the redemption of fund shares.
The Bloomberg Barclays U.S. Aggregate Index indicates broad intermediate government/corporate bond market performance.
This report identifies the Fund’s investments on June 30, 2019. These holdings are subject to change. Not all investments in the Fund performed the same, nor is there any guarantee that these investments will perform as well in the future. Market forecasts provided in this report may not necessarily come to pass.
Sector Diversification (Unaudited)
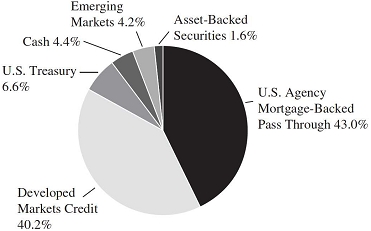
The sector diversification shown is based on the total investments.
| 86 | Semiannual Report | June 30, 2019 |
Bond Fund
Portfolio of Investments, June 30, 2019(all dollar amounts in thousands) (unaudited)
| | | | | | | | |
| | Issuer | | Principal
Amount | | | Value | |
| | | | | | | | | | |
| | U.S. Government and U.S. Government Agency—51.8% |
| | U.S. Treasury Inflation Indexed Notes/Bonds—6.4% |
| | U.S. Treasury Inflation Indexed Bond, 3.875%, due 4/15/29 | | $ | 19,894 | | | $ | 26,645 | |
| | U.S. Treasury—0.1% | | | | | | | | |
| | U.S. Treasury Floating Rate Note, 2.235%, due 4/30/21(a) | | | 500 | | | | 500 | |
| | Federal Home Loan Mortgage Corp.(FHLMC)—13.5% | | | | | | | | |
| | #J02986, 6.500%, due 7/1/21 | | | 5 | | | | 5 | |
| | #G12720, 5.500%, due 6/1/22 | | | 12 | | | | 12 | |
| | #D95621, 6.500%, due 7/1/22 | | | 257 | | | | 267 | |
| | #G14150, 4.500%, due 4/1/26 | | | 858 | | | | 910 | |
| | #J16051, 4.500%, due 7/1/26 | | | 503 | | | | 536 | |
| | #G02210, 7.000%, due 12/1/28 | | | 43 | | | | 49 | |
| | #G02183, 6.500%, due 3/1/30 | | | 7 | | | | 8 | |
| | #G01400, 7.000%, due 4/1/32 | | | 432 | | | | 502 | |
| | #G01728, 7.500%, due 7/1/32 | | | 73 | | | | 89 | |
| | #C01385, 6.500%, due 8/1/32 | | | 56 | | | | 66 | |
| | #C01623, 5.500%, due 9/1/33 | | | 67 | | | | 74 | |
| | #A15039, 5.500%, due 10/1/33 | | | 2 | | | | 2 | |
| | #A17603, 5.500%, due 1/1/34 | | | 1,438 | | | | 1,606 | |
| | #G01843, 6.000%, due 6/1/35 | | | 13 | | | | 15 | |
| | #G03711, 6.000%, due 6/1/37 | | | 411 | | | | 472 | |
| | #G04126, 6.000%, due 6/1/37 | | | 1,297 | | | | 1,491 | |
| | #A62858, 6.500%, due 7/1/37 | | | 71 | | | | 80 | |
| | #G03170, 6.500%, due 8/1/37 | | | 136 | | | | 158 | |
| | #A66843, 6.500%, due 10/1/37 | | | 602 | | | | 718 | |
| | #G07837, 6.500%, due 2/1/38 | | | 1,907 | | | | 2,263 | |
| | #G04053, 5.500%, due 3/1/38 | | | 552 | | | | 613 | |
| | #A78138, 5.500%, due 6/1/38 | | | 206 | | | | 233 | |
| | #G04641, 6.000%, due 6/1/38 | | | 992 | | | | 1,131 | |
| | #G04466, 5.500%, due 7/1/38 | | | 10,987 | | | | 12,397 | |
| | #G04544, 6.000%, due 8/1/38 | | | 575 | | | | 653 | |
| | #A81799, 6.500%, due 9/1/38 | | | 308 | | | | 343 | |
| | #G06964, 5.500%, due 11/1/38 | | | 1,513 | | | | 1,699 | |
| | #G05723, 6.500%, due 11/1/38 | | | 878 | | | | 1,039 | |
| | #G60366, 6.000%, due 10/1/39 | | | 11,406 | | | | 13,036 | |
| | #G05875, 5.500%, due 2/1/40 | | | 406 | | | | 453 | |
| | #G61450, 6.000%, due 4/1/40 | | | 11,311 | | | | 13,013 | |
| | #G61050, 5.500%, due 3/1/41 | | | 418 | | | | 469 | |
| | #C03665, 9.000%, due 4/1/41 | | | 359 | | | | 420 | |
| | #G06583, 5.000%, due 6/1/41 | | | 1,225 | | | | 1,354 | |
| | Total FHLMC Mortgage Obligations | | | | | | | 56,176 | |
| | Federal National Mortgage Association(FNMA)—31.8% | | | | | | | | |
| | #900725, 6.000%, due 8/1/21 | | | 10 | | | | 10 | |
| | #893325, 7.000%, due 9/1/21 | | | 3 | | | | 3 | |
| | #949589, 5.500%, due 8/1/22 | | | 916 | | | | 943 | |
| | #949592, 6.000%, due 8/1/22 | | | 1,345 | | | | 1,392 | |
| | #AC5410, 4.500%, due 10/1/24 | | | 183 | | | | 191 | |
| | #AL8529, 6.000%, due 11/1/24 | | | 2,112 | | | | 2,202 | |
| | #AC9560, 5.000%, due 1/1/25 | | | 742 | | | | 773 | |
| | #255956, 5.500%, due 10/1/25 | | | 9 | | | | 9 | |
| | #AL2853, 4.500%, due 6/1/26 | | | 3,766 | | | | 4,007 | |
| | #AL9730, 4.500%, due 2/1/27 | | | 1,194 | | | | 1,270 | |
| | #AL2134, 4.000%, due 7/1/27 | | | 184 | | | | 194 | |
| | #AL9857, 4.000%, due 2/1/29 | | | 7,176 | | | | 7,546 | |
| | | | | | | | |
| | Issuer | | Principal
Amount | | | Value | |
| | | | | | | | | | |
| | U.S. Government and U.S. Government Agency—(continued) |
| | Federal National Mortgage Association (FNMA)—(continued) |
| | #252925, 7.500%, due 12/1/29 | | $ | 1 | | | $ | 1 | |
| | #AD0729, 7.500%, due 12/1/30 | | | 6,721 | | | | 7,899 | |
| | #535977, 6.500%, due 4/1/31 | | | 5 | | | | 6 | |
| | #253907, 7.000%, due 7/1/31 | | | 1 | | | | 1 | |
| | #545339, 6.500%, due 11/1/31 | | | 29 | | | | 33 | |
| | #587849, 6.500%, due 11/1/31 | | | 7 | | | | 7 | |
| | #618547, 6.500%, due 11/1/31 | | | 3,576 | | | | 4,104 | |
| | #545437, 7.000%, due 2/1/32 | | | 34 | | | | 39 | |
| | #545759, 6.500%, due 7/1/32 | | | 283 | | | | 327 | |
| | #545869, 6.500%, due 7/1/32 | | | 923 | | | | 1,065 | |
| | #670385, 6.500%, due 9/1/32 | | | 439 | | | | 511 | |
| | #254548, 5.500%, due 12/1/32 | | | 28 | | | | 31 | |
| | #703391, 5.000%, due 5/1/33 | | | 95 | | | | 104 | |
| | #708993, 5.000%, due 6/1/33 | | | 18 | | | | 20 | |
| | #730131, 5.000%, due 8/1/33 | | | 45 | | | | 49 | |
| | #741850, 5.500%, due 9/1/33 | | | 326 | | | | 362 | |
| | #555800, 5.500%, due 10/1/33 | | | 32 | | | | 35 | |
| | #CA2754, 4.500%, due 11/1/33 | | | 859 | | | | 924 | |
| | #756153, 5.500%, due 11/1/33 | | | 363 | | | | 403 | |
| | #AL3455, 5.500%, due 11/1/33 | | | 4,470 | | | | 4,994 | |
| | #AL3401, 5.500%, due 2/1/34 | | | 885 | | | | 989 | |
| | #763798, 5.500%, due 3/1/34 | | | 57 | | | | 63 | |
| | #725611, 5.500%, due 6/1/34 | | | 70 | | | | 78 | |
| | #745563, 5.500%, due 8/1/34 | | | 413 | | | | 459 | |
| | #794474, 6.000%, due 10/1/34 | | | 34 | | | | 39 | |
| | #745092, 6.500%, due 7/1/35 | | | 223 | | | | 259 | |
| | #357944, 6.000%, due 9/1/35 | | | 10 | | | | 12 | |
| | #AD0979, 7.500%, due 10/1/35 | | | 48 | | | | 56 | |
| | #745349, 6.500%, due 2/1/36 | | | 193 | | | | 232 | |
| | #888305, 7.000%, due 3/1/36 | | | 7 | | | | 8 | |
| | #895637, 6.500%, due 5/1/36 | | | 42 | | | | 48 | |
| | #831540, 6.000%, due 6/1/36 | | | 15 | | | | 17 | |
| | #893318, 6.500%, due 8/1/36 | | | 8 | | | | 9 | |
| | #310037, 6.500%, due 10/1/36 | | | 120 | | | | 143 | |
| | #831926, 6.000%, due 12/1/36 | | | 444 | | | | 504 | |
| | #902974, 6.000%, due 12/1/36 | | | 116 | | | | 131 | |
| | #AB0265, 6.000%, due 2/1/37 | | | 9,291 | | | | 10,680 | |
| | #938440, 6.000%, due 7/1/37 | | | 66 | | | | 75 | |
| | #948689, 6.000%, due 8/1/37 | | | 106 | | | | 118 | |
| | #888703, 6.500%, due 8/1/37 | | | 2,880 | | | | 3,456 | |
| | #888530, 7.500%, due 8/1/37 | | | 817 | | | | 995 | |
| | #AL6411, 7.000%, due 12/1/37 | | | 1,731 | | | | 1,984 | |
| | #AL0904, 5.500%, due 1/1/38 | | | 86 | | | | 96 | |
| | #889371, 6.000%, due 1/1/38 | | | 2,068 | | | | 2,376 | |
| | #962058, 6.500%, due 3/1/38 | | | 967 | | | | 1,130 | |
| | #934006, 6.500%, due 9/1/38 | | | 244 | | | | 296 | |
| | #986856, 6.500%, due 9/1/38 | | | 101 | | | | 123 | |
| | #991911, 7.000%, due 11/1/38 | | | 103 | | | | 117 | |
| | #AL3775, 5.000%, due 1/1/39 | | | 1,255 | | | | 1,378 | |
| | #AD0752, 7.000%, due 1/1/39 | | | 432 | | | | 522 | |
| | #AA7611, 5.000%, due 5/1/39 | | | 499 | | | | 549 | |
| | #AA8443, 5.000%, due 6/1/39 | | | 139 | | | | 154 | |
| | #AC1619, 5.500%, due 8/1/39 | | | 300 | | | | 332 | |
| | #AD0315, 6.500%, due 8/1/39 | | | 1,503 | | | | 1,775 | |
| | #AC9569, 5.000%, due 2/1/40 | | | 1,165 | | | | 1,287 | |
| | #AD0761, 5.000%, due 2/1/40 | | | 174 | | | | 192 | |
| | #AD1594, 5.000%, due 2/1/40 | | | 176 | | | | 195 | |
See accompanying Notes to Financial Statements.
| June 30, 2019 | William Blair Funds | 87 |
Bond Fund
Portfolio of Investments, June 30, 2019(all dollar amounts in thousands) (unaudited)
| | Issuer | | NRSRO
Rating
(unaudited) | | Principal
Amount | | Value | |
| | | | | | | | |
| | U.S. Government and U.S. Government Agency—(continued) |
| | Federal National Mortgage Association (FNMA)—(continued) |
| | #932751, 5.000%, due 4/1/40 | | | | $ | 2,477 | | | $ | 2,735 | |
| | #AD7137, 5.500%, due 7/1/40 | | | | | 3,239 | | | | 3,662 | |
| | #BM1689, 5.500%, due 8/1/40 | | | | | 2,619 | | | | 2,911 | |
| | #AH5585, 5.000%, due 2/1/41 | | | | | 123 | | | | 136 | |
| | #AI1201, 5.500%, due 4/1/41 | | | | | 3,849 | | | | 4,350 | |
| | #AL5815, 5.500%, due 4/1/41 | | | | | 3,177 | | | | 3,589 | |
| | #BM3525, 6.000%, due 4/1/41 | | | | | 11,178 | | | | 12,766 | |
| | #AI6071, 5.000%, due 6/1/41 | | | | | 1,119 | | | | 1,236 | |
| | #AI4222, 5.000%, due 7/1/41 | | | | | 88 | | | | 96 | |
| | #AL0672, 5.000%, due 7/1/41 | | | | | 1,982 | | | | 2,189 | |
| | #AL0913, 6.000%, due 7/1/41 | | | | | 1,167 | | | | 1,324 | |
| | #AL9226, 5.500%, due 12/1/41 | | | | | 13,305 | | | | 14,939 | |
| | #AL9225, 6.000%, due 1/1/42 | | | | | 5,908 | | | | 6,776 | |
| | #BM1328, 6.000%, due 1/1/42 | | | | | 2,945 | | | | 3,383 | |
| | #AK2733, 5.000%, due 2/1/42 | | | | | 1,339 | | | | 1,477 | |
| | Total FNMA Mortgage Obligations | | | | | | | | | 131,901 | |
| | Asset-Backed Securities—1.6% | | | | | | | | | | |
| | Tesla Auto Lease Trust—144A, 2018-A, Tranche D,
3.300%, 5/20/20 | | Baa1 | | | 1,325 | | | | 1,329 | |
| | Centre Point Funding LLC—144A, 2012-2A, Tranche 1,
2.610%, 8/20/21 | | Baa1 | | | 967 | | | | 962 | |
| | Oxford Finance Funding LLC—144A, 2019-1A, Tranche B,
5.438%, 2/15/27 | | BB | | | 1,180 | | | | 1,209 | |
| | SLM Private Education Loan Trust—144A, 2011-A,
Tranche A3, 1M USD LIBOR + 2.500%, 4.894%, 1/15/43, VRN | | AAA | | | 3,071 | | | | 3,089 | |
| | Total Asset-Backed Securities | | | | | | | | | 6,589 | |
| | | | | | | | | | | | |
| | Corporate Obligations—44.1% | | | | | | | | | | |
| | UBS Group Funding Switzerland AG,
5 year USD ICE Swap + 5.497%, 6.875%, due 3/22/21, VRN | | BBB- | | | 2,000 | | | | 2,085 | |
| | Fresenius Medical Care US Finance II, Inc.—144A,
5.875%, due 1/31/22 | | BBB | | | 2,460 | | | | 2,628 | |
| | Masco Corporation,
5.950%, due 3/15/22 | | BBB | | | 4,050 | | | | 4,383 | |
| | Discover Financial Services,
5.200%, due 4/27/22 | | BBB+ | | | 3,000 | | | | 3,213 | |
| | Jones Lang LaSalle, Inc.,
4.400%, due 11/15/22 | | BBB+ | | | 3,900 | | | | 4,058 | |
| | Toll Brothers Finance Corporation,
4.375%, due 4/15/23 | | BBB- | | | 4,250 | | | | 4,415 | |
| | Itau Unibanco Holding S.A.—144A,
5.125%, due 5/13/23 | | Ba3 | | | 2,500 | | | | 2,630 | |
| | Wells Fargo & Co.,
4.480%, due 1/16/24 | | A | | | 4,250 | | | | 4,559 | |
| | Lennar Corporation,
4.500%, due 4/30/24 | | BBB- | | | 2,450 | | | | 2,582 | |
| | Banco Inbursa S.A. Institucion de Banca Multiple-144A,
4.125%, due 6/6/24 | | BBB+ | | | 2,500 | | | | 2,531 | |
| | Issuer | | NRSRO
Rating
(unaudited) | | Principal
Amount | | Value | |
| | | | | | | | |
| | Corporate Obligations—(continued) |
| | Grupo Bimbo S.A.B. de C.V.—144A,
3.875%, due 6/27/24 | | BBB | | $ | 2,600 | | | $ | 2,689 | |
| | Iron Mountain, Inc.,
5.750%, due 8/15/24 | | B | | | 675 | | | | 684 | |
| | SBA Communications Corporation,
4.875%, due 9/1/24 | | BB- | | | 2,500 | | | | 2,584 | |
| | HSBC Holdings plc,
5 year USD ICE Swap + 3.705%, 6.375%, due 9/17/24, VRN | | BBB | | | 4,250 | | | | 4,402 | |
| | JPMorgan Chase & Co.,
3M USD LIBOR + 3.330%,
6.100%, due 10/1/24, VRN | | Baa2 | | | 4,265 | | | | 4,598 | |
| | Cemex S.A.B. de C.V.—144A,
5.700%, due 1/11/25 | | BB | | | 3,000 | | | | 3,124 | |
| | Centene Corporation,
4.750%, due 1/15/25 | | BB+ | | | 2,000 | | | | 2,069 | |
| | Booz Allen Hamilton, Inc.—144A,
5.125%, due 5/1/25 | | B+ | | | 2,500 | | | | 2,550 | |
| | DaVita, Inc.,
5.000%, due 5/1/25 | | Ba3 | | | 2,500 | | | | 2,478 | |
| | Simon Property Group L.P.,
3.300%, due 1/15/26 | | A | | | 4,500 | | | | 4,650 | |
| | Penske Automotive Group, Inc.,
5.500%, due 5/15/26 | | Ba3 | | | 2,200 | | | | 2,302 | |
| | Post Holdings, Inc.—144A,
5.000%, due 8/15/26 | | B+ | | | 2,500 | | | | 2,544 | |
| | Xylem, Inc.,
3.250%, due 11/1/26 | | BBB | | | 2,225 | | | | 2,242 | |
| | Netflix, Inc.,
4.375%, due 11/15/26 | | BB- | | | 2,000 | | | | 2,051 | |
| | Glencore Funding LLC—144A,
4.000%, due 3/27/27 | | BBB+ | | | 4,000 | | | | 4,043 | |
| | Hess Corporation,
4.300%, due 4/1/27 | | BBB- | | | 4,500 | | | | 4,672 | |
| | The Chemours Co.,
5.375%, due 5/15/27 | | BB- | | | 2,500 | | | | 2,394 | |
| | Sirius XM Radio, Inc.—144A,
5.000%, due 8/1/27 | | BB | | | 2,500 | | | | 2,553 | |
| | Lear Corporation,
3.800%, due 9/15/27 | | Baa2 | | | 3,000 | | | | 2,972 | |
| | Motorola Solutions, Inc.,
4.600%, due 2/23/28 | | BBB- | | | 4,250 | | | | 4,463 | |
| | The Kroger Co.,
8.000%, due 9/15/29 | | Baa1 | | | 3,500 | | | | 4,670 | |
| | United Rentals North America, Inc.,
5.250%, due 1/15/30 | | BB- | | | 2,500 | | | | 2,575 | |
| | Owens Corning,
7.000%, due 12/1/36 | | BBB | | | 3,800 | | | | 4,515 | |
| | Yum! Brands, Inc.,
6.875%, due 11/15/37 | | B+ | | | 2,500 | | | | 2,644 | |
| | ConocoPhillips,
6.500%, due 2/1/39 | | A | | | 3,250 | | | | 4,570 | |
| | Citigroup, Inc.,
5.875%, due 1/30/42 | | A | | | 3,500 | | | | 4,628 | |
| | Bank of America Corporation,
5.875%, due 2/7/42 | | A+ | | | 3,500 | | | | 4,658 | |
| | Cox Communications, Inc.—144A,
4.700%, due 12/15/42 | | BBB+ | | | 4,300 | | | | 4,288 | |
| | Mexichem S.A.B. de C.V.—144A,
5.875%, due 9/17/44 | | BBB | | | 3,000 | | | | 3,142 | |
See accompanying Notes to Financial Statements.
| 88 | Semiannual Report | June 30, 2019 |
Bond Fund
Portfolio of Investments, June 30, 2019(all dollar amounts in thousands) (unaudited)
| | Issuer | | NRSRO
Rating
(unaudited) | | Principal
Amount | | Value | |
| | | | | | | | |
| | Corporate Obligations—(continued) |
| | AbbVie, Inc.,
4.700%, due 5/14/45 | | A- | | $ | 4,500 | | | $ | 4,589 | |
| | ERP Operating L.P.,
4.500%, due 6/1/45 | | A | | | 4,000 | | | | 4,579 | |
| | Apple, Inc.,
4.650%, due 2/23/46 | | AA+ | | | 3,500 | | | | 4,157 | |
| | PepsiCo, Inc.,
4.450%, due 4/14/46 | | A+ | | | 3,500 | | | | 4,193 | |
| | Verizon Communications, Inc.,
4.125%, due 8/15/46 | | A- | | | 4,000 | | | | 4,182 | |
| | Brookfield Finance, Inc.,
4.700%, due 9/20/47§ | | A- | | | 4,500 | | | | 4,711 | |
| | CVS Health Corporation,
5.050%, due 3/25/48 | | BBB | | | 4,250 | | | | 4,534 | |
| | Microsoft Corporation,
4.750%, due 11/3/55 | | AAA | | | 3,500 | | | | 4,449 | |
| | AT&T, Inc.,
5.700%, due 3/1/57 | | A- | | | 3,750 | | | | 4,421 | |
| | Comcast Corporation,
4.950%, due 10/15/58 | | A- | | | 2,000 | | | | 2,445 | |
| | Altria Group, Inc.,
6.200%, due 2/14/59 | | A3 | | | 4,000 | | | | 4,565 | |
| | Corning, Inc.,
5.850%, due 11/15/68 | | BBB+ | | | 4,000 | | | | 4,695 | |
| | Petrobras Global Finance BV,
6.850%, due 6/5/15 | | Ba2 | | | 3,000 | | | | 3,117 | |
| | Total Corporate Obligations | | | | | | | | | 183,475 | |
| | Total Long-Term Investments—97.5%
(cost $391,771) | | | | | | | | | 405,286 | |
| | | | | | | | | | | | |
| | Repurchase Agreements | | | | | | | | | | |
| | Fixed Income Clearing Corporation, 0.500% dated 6/28/19, due 7/1/19, repurchase price $1,083, collateralized by U.S. Treasury Note, 1.500%, due 8/15/26 | | | | | 1,083 | | | | 1,083 | |
| | Total Repurchase Agreement—0.2%
(cost $1,083) | | | | | | | | | 1,083 | |
| | | | | | | | |
| | Issuer | | Principal
Amount | | | Value | |
| | | | | | |
| | Commercial Paper | | | | | | | | |
| | Cargill Global Funding plc,
2.353%, due 7/1/19 | | $ | 3,500 | | | $ | 3,500 | |
| | The Western Union Co.,
2.586%, due 7/1/19 | | | 3,500 | | | | 3,500 | |
| | Total Commercial Paper—1.7%
(cost $7,000) | | | | | | | 7,000 | |
| | Total Investments—99.4%
(cost $399,854) | | | | | | | 413,369 | |
| | | | | | | | | | |
| | Securities Sold, Not Yet Purchased | | | | | | | | |
| | | | | | | | | | |
| | U.S. Government Agency—(2.4)% | | | | | | | | |
| | Federal National Mortgage Association (FNMA)—(2.4)% | | | | | | | | |
| | TBA, 3.000%, due 7/15/49 | | | (10,000 | ) | | | (10,086 | ) |
| | Total Securities Sold, Not Yet Purchased—(2.4)%
(proceeds $10,043) | | | | | | | (10,086 | ) |
| | Cash and other assets, less liabilities—3.0% | | | | | | | 12,489 | |
| | Net assets—100.0% | | | | | | $ | 415,772 | |
The obligations of certain U.S. Government-sponsored securities are neither issued nor guaranteed by the U.S. Treasury.
144A = Security exempt from registration under Rule 144A of the Securities Act of 1933. These securities may be resold in transactions exempt from registration, normally to qualified institutional buyers.
NRSRO = Nationally Recognized Statistical Rating Organization—The credit quality ratings of the securities in the Fund reflect the highest category rating by any of Fitch Ratings, Moody’s Investors Service Inc., or Standard & Poor’s, a division of the McGraw-Hill Companies, Inc.
TBA = To Be Announced-TBAs are mortgage-backed securities traded under delayed delivery commitments, settling after June 30, 2019. The term TBA comes from the fact that the specific mortgage-backed security that will be delivered to fulfill a TBA trade is not designated at the time the trade is made.
VRN = Variable Rate Note
§ = Deemed illiquid pursuant to a Liquidity Risk Management Program approved by the Board of Trustees. This holding represents 1.13% of the Fund’s net assets at June 30, 2019.
(a) Security, or a portion of security, is segregated as collateral for the centrally cleared credit default swap, aggregating a total of $200.
Centrally Cleared Credit Default Swap
| Reference Entity | | Buy/Sell
Protection | | Fixed Deal
Pay Rate | | Payment
Frequency | | Maturity
Date | | Cleared
Exchange | | Notional
Amount
(in thousands) | | Upfront
Payment
Paid
(Received) | | Value | | Unrealized
Appreciation
(Depreciation) |
| CDX.IG-31 | | Buy | | 1.000% | | 3M | | December
2023 | | ICE | | $25,000 | | $ (423) | | (573) | | $(150) |
See accompanying Notes to Financial Statements.
| June 30, 2019 | William Blair Funds | 89 |
| | Income Fund |
| | |
| | The Income Fund seeks a high level of current income with relative stability of principal. |
| | |
| | AN OVERVIEW FROM THE PORTFOLIO MANAGER |
| | |

Christopher T. Vincent | The William Blair Income Fund (Class N shares) returned 4.33%, net of fees, for the six month period ended June 30, 2019. By comparison, the Fund’s benchmark, the Bloomberg Barclays Intermediate Government/Credit Bond Index (the “Index”), returned 4.97%. A couple of factors detracted from the Fund’s performance relative to the Index year-to-date. Interest rate positioning detracted from results, as the Fund had a defensive duration posture during a period of declining interest rates. In addition, the Fund was underweight to BBB-rated corporate bonds, and that hindered relative results as BBB-rated corporate bonds generated strong performance during the period. There were a couple of factors that contributed to the Fund’s relative performance year-to-date. An allocation to higher-coupon segments of the agency mortgage-backed securities market impacted results favorably. Some corporate bond holdings were additive to performance, including positions in bonds issued by Vale Overseas, Ltd., Apple, Inc., and Citigroup, Inc. Please refer to the Fixed Income Market Review and Outlook relating to the Fund beginning on page 83 for additional information. |
| 90 | Semiannual Report | June 30, 2019 |
Income Fund
Performance Highlights (Unaudited)
| Average Annual Total Return through 6/30/2019 |
| | | Year
to Date | | 1 Year | | 3 Year | | 5 Year | | 10 Year | | Since
Inception(a) |
| Class N | | | 4.33 | % | | | 4.60 | % | | | 1.45 | % | | | 1.63 | % | | | 3.07 | % | | | — | |
| Class I | | | 4.57 | | | | 4.93 | | | | 1.70 | | | | 1.90 | | | | 3.31 | | | | — | |
| Class R6 | | | — | | | | — | | | | — | | | | — | | | | — | | | | 1.47 | % |
| Bloomberg Barclays Intermediate Government/ Credit Bond Index | | | 4.97 | | | | 6.93 | | | | 1.99 | | | | 2.39 | | | | 3.24 | | | | 2.45 | |
| (a) | Since inception is for the period from May 2, 2019 (Commencement of Operations) to June 30, 2019. |
Performance cited represents past performance. Past performance does not guarantee future results and current performance may be lower or higher than the data quoted. Results shown are average annual total returns, which assume reinvestment of dividends and capital gains. Investment returns and principal will fluctuate and you may have a gain or loss when you sell shares. For the most current month-end performance information, please call 1-800-742-7272, or visit our Web site atwww.williamblairfunds.com. From time to time, the investment adviser may waive fees or reimburse expenses for the Fund. Without these waivers/reimbursements, performance would be lower. Class N shares are not subject to a sales load. Class I shares are not subject to a sales load or distribution (Rule 12b-1) fees. Class R6 shares are not subject to a sales load, distribution (Rule 12b-1) fees, or sub-transfer agent fees.
The performance highlights and graph presented above do not reflect the deduction of taxes that a shareholder would pay on fund distributions or the redemption of fund shares.
The Bloomberg Barclays Intermediate Government/Credit Bond Index indicates broad intermediate government/corporate bond market performance.
This report identifies the Fund’s investments on June 30, 2019. These holdings are subject to change. Not all investments in the Fund performed the same, nor is there any guarantee that these investments will perform as well in the future. Market forecasts provided in this report may not necessarily come to pass.
Sector Diversification (Unaudited)

The sector diversification shown is based on the total investments.
| June 30, 2019 | William Blair Funds | 91 |
Income Fund
Portfolio of Investments, June 30, 2019(all dollar amounts in thousands) (unaudited)
| | | | | | | | |
| | | | Principal | | | | |
| | Issuer | | Amount | | | Value | |
| | | | | | | | | | |
| | U.S. Government and U.S. Government Agency—55.0% |
| | U.S. Treasury Inflation Indexed Notes/Bonds—2.4% |
| | U.S. Treasury Inflation Indexed Bond, 3.875%, due 4/15/29 | | $ | 1,166 | | | $ | 1,561 | |
| | Federal Home Loan Mortgage Corp. (FHLMC)—14.0% |
| | #J05444, 6.000%, due 8/1/22 | | | 19 | | | | 19 | |
| | #E02388, 6.000%, due 9/1/22 | | | 27 | | | | 28 | |
| | #E02490, 6.000%, due 4/1/23 | | | 33 | | | | 34 | |
| | #J13022, 4.000%, due 9/1/25 | | | 295 | | | | 310 | |
| | #G14150, 4.500%, due 4/1/26 | | | 81 | | | | 86 | |
| | #J16051, 4.500%, due 7/1/26 | | | 568 | | | | 604 | |
| | #A17603, 5.500%, due 1/1/34 | | | 416 | | | | 465 | |
| | #G01705, 5.500%, due 6/1/34 | | | 819 | | | | 899 | |
| | #A45790, 7.500%, due 5/1/35 | | | 85 | | | | 96 | |
| | #G04126, 6.000%, due 6/1/37 | | | 197 | | | | 227 | |
| | #G03201, 6.500%, due 6/1/37 | | | 117 | | | | 138 | |
| | #A66843, 6.500%, due 10/1/37 | | | 192 | | | | 230 | |
| | #G03534, 6.500%, due 10/1/37 | | | 1,460 | | | | 1,719 | |
| | #G04564, 6.000%, due 12/1/37 | | | 159 | | | | 182 | |
| | #A81799, 6.500%, due 9/1/38 | | | 173 | | | | 192 | |
| | #G05566, 5.500%, due 12/1/38 | | | 108 | | | | 121 | |
| | #G60366, 6.000%, due 10/1/39 | | | 851 | | | | 972 | |
| | #G05875, 5.500%, due 2/1/40 | | | 81 | | | | 91 | |
| | #G61450, 6.000%, due 4/1/40 | | | 1,102 | | | | 1,268 | |
| | #C03665, 9.000%, due 4/1/41 | | | 174 | | | | 204 | |
| | #G06583, 5.000%, due 6/1/41 | | | 965 | | | | 1,066 | |
| | Total FHLMC Mortgage Obligations | | | | | | | 8,951 | |
| | Federal National Mortgage Association (FNMA)—38.6% |
| | #880991, 5.500%, due 1/1/22 | | | 33 | | | | 33 | |
| | #735574, 8.000%, due 3/1/22 | | | 23 | | | | 24 | |
| | FNR G93-19 SH, 1M LIBOR + 56.169%, 11.234%, due 4/25/23, VRN | | | 11 | | | | 12 | |
| | #982885, 5.000%, due 5/1/23 | | | 164 | | | | 171 | |
| | #AL0955, 6.000%, due 5/1/23 | | | 76 | | | | 77 | |
| | #933985, 5.500%, due 8/1/23 | | | 86 | | | | 89 | |
| | #AL7213, 5.500%, due 12/1/23 | | | 454 | | | | 469 | |
| | #AL8529, 6.000%, due 11/1/24 | | | 1,800 | | | | 1,877 | |
| | #255956, 5.500%, due 10/1/25 | | | 26 | | | | 28 | |
| | #AH0971, 4.000%, due 12/1/25 | | | 296 | | | | 312 | |
| | #AL2853, 4.500%, due 6/1/26 | | | 487 | | | | 518 | |
| | #AJ6954, 4.000%, due 11/1/26 | | | 128 | | | | 135 | |
| | #AL9730, 4.500%, due 2/1/27 | | | 955 | | | | 1,016 | |
| | #256639, 5.000%, due 2/1/27 | | | 5 | | | | 6 | |
| | #806458, 8.000%, due 6/1/28 | | | 72 | | | | 80 | |
| | #AL9857, 4.000%, due 2/1/29 | | | 5,646 | | | | 5,937 | |
| | #880155, 8.500%, due 7/1/29 | | | 142 | | | | 161 | |
| | #797846, 7.000%, due 3/1/32 | | | 35 | | | | 35 | |
| | #745519, 8.500%, due 5/1/32 | | | 49 | | | | 56 | |
| | #654674, 6.500%, due 9/1/32 | | | 34 | | | | 38 | |
| | #254693, 5.500%, due 4/1/33 | | | 5 | | | | 5 | |
| | #555531, 5.500%, due 6/1/33 | | | 46 | | | | 51 | |
| | #711736, 5.500%, due 6/1/33 | | | 70 | | | | 77 | |
| | #555591, 5.500%, due 7/1/33 | | | 8 | | | | 8 | |
| | #CA2754, 4.500%, due 11/1/33 | | | 470 | | | | 505 | |
| | #AL3455, 5.500%, due 11/1/33 | | | 1,313 | | | | 1,467 | |
| | #776964, 5.000%, due 4/1/34 | | | 219 | | | | 240 | |
| | Issuer | | NRSRO
Rating
(unaudited) | | Principal
Amount | | | Value | |
| | | | | | | | | | |
| | U.S. Government Agency—(continued) | | | |
| | Federal National Mortgage Association (FNMA)—(continued) |
| | #725424, 5.500%, due 4/1/34 | | | | $ | 49 | | | $ | 55 | |
| | #888884, 5.500%, due 12/1/35 | | | | | 109 | | | | 121 | |
| | #888703, 6.500%, due 8/1/37 | | | | | 608 | | | | 730 | |
| | #928658, 6.500%, due 9/1/37 | | | | | 19 | | | | 22 | |
| | #AL6411, 7.000%, due 12/1/37 | | | | | 554 | | | | 635 | |
| | #962058, 6.500%, due 3/1/38 | | | | | 313 | | | | 365 | |
| | #991911, 7.000%, due 11/1/38 | | | | | 66 | | | | 75 | |
| | #AC9569, 5.000%, due 2/1/40 | | | | | 155 | | | | 171 | |
| | #BM1689, 5.500%, due 8/1/40 | | | | | 354 | | | | 393 | |
| | #AL5815, 5.500%, due 4/1/41 | | | | | 454 | | | | 513 | |
| | #BM3525, 6.000%, due 4/1/41 | | | | | 992 | | | | 1,133 | |
| | #AL9226, 5.500%, due 12/1/41 | | | | | 4,205 | | | | 4,721 | |
| | #BM1328, 6.000%, due 1/1/42 | | | | | 449 | | | | 516 | |
| | #AL9225, 6.000%, due 1/1/42 | | | | | 1,625 | | | | 1,863 | |
| | Total FNMA Mortgage Obligations | | | | | | | | | 24,740 | |
| | | | | | | | | | | | |
| | Asset-Backed Securities—4.4% | | | | | |
| | Tesla Auto Lease Trust-144A,
2018-A, Tranche C, 2.970%, 4/20/20 | | Aa3 | | | 150 | | | | 150 | |
| | Capital One Multi-Asset Execution Trust, 2015-A3, Tranche A3,
1M LIBOR + 0.400%, 2.794%, 3/15/23, VRN | | AAA | | | 750 | | | | 752 | |
| | Chase Issuance Trust, 2018-A1, Tranche A1,
1M LIBOR + 0.200%, 2.594%, 4/17/23, VRN | | AAA | | | 500 | | | | 500 | |
| | Verizon Owner Trust, 2018-A, Tranche A1B,
1M LIBOR + 0.240%, 2.623%, 4/20/23, VRN | | AAA | | | 598 | | | | 598 | |
| | Oxford Finance Funding LLC—144A,
2019-1A, Tranche A2, 4.459%, 2/15/27 | | BB | | | 500 | | | | 514 | |
| | SLM Private Education Loan Trust-144A,
2011-A, Tranche A3, | | | | | | | | | | |
| | 1M USD LIBOR + 2.500%,
4.894%, 1/15/43, VRN | | AAA | | | 307 | | | | 309 | |
| | Total Asset-Backed Securities | | | | | | | | | 2,823 | |
| | | | | | | | | | | | |
| | Corporate Obligations—35.4% | | | | | |
| | Burlington Northern Santa Fe LLC,
4.700%, due 10/1/19 | | A+ | | | 650 | | | | 653 | |
| | JPMorgan Chase & Co.,
3M USD LIBOR + 3.320%, 5.639%, due 10/1/19, VRN | | Baa2 | | | 500 | | | | 499 | |
| | Citigroup, Inc.,
2.450%, due 1/10/20 | | A | | | 650 | | | | 650 | |
| | Branch Banking & Trust Co.,
3M USD LIBOR + 0.450%, 3.047%, due 1/15/20, VRN | | A1 | | | 500 | | | | 501 | |
| | American Express Credit Corporation,
3M USD LIBOR + 0.730%, 3.251%, due 5/26/20, VRN | | A2 | | | 500 | | | | 503 | |
See accompanying Notes to Financial Statements.
| 92 | Semiannual Report | June 30, 2019 |
Income Fund
Portfolio of Investments, June 30, 2019(all dollar amounts in thousands) (unaudited)
| | Issuer | | NRSRO
Rating
(unaudited) | | Principal
Amount | | | Value | |
| | | | | | | | | | | | |
| | U.S. Government Agency—(continued) | | |
| | Corporate Obligations—(continued) | | |
| | Georgia-Pacific LLC—144A,
5.400%, due 11/1/20 | | A+ | | $ | 600 | | | $ | 624 | |
| | HSBC Holdings plc,
3M USD LIBOR + 2.240%, 4.693%, due 3/8/21, VRN | | AA- | | | 500 | | | | 514 | |
| | Westpac Banking Corporation,
3M USD LIBOR + 1.000%, 3.535%, due 5/13/21, VRN | | AA- | | | 500 | | | | 507 | |
| | Chevron Corporation,
3M USD LIBOR + 0.950%, 3.475%, due 5/16/21, VRN | | AA | | | 500 | | | | 508 | |
| | The Charles Schwab Corporation,
3M USD LIBOR + 0.320%, 2.842%, due 5/21/21, VRN | | A | | | 500 | | | | 501 | |
| | Capital One Financial Corporation,
4.750%, due 7/15/21 | | A- | | | 650 | | | | 680 | |
| | Apple, Inc.,
1.550%, due 8/4/21 | | AA+ | | | 650 | | | | 644 | |
| | Lloyds Banking Group plc,
3.000%, due 1/11/22 | | A+ | | | 650 | | | | 657 | |
| | FedEx Corporation,
3.400%, due 1/14/22 | | BBB | | | 500 | | | | 513 | |
| | Bancolombia S.A.,
5.125%, due 9/11/22 | | BBB- | | | 400 | | | | 419 | |
| | Jones Lang LaSalle, Inc.,
4.400%, due 11/15/22 | | BBB+ | | | 500 | | | | 520 | |
| | Toll Brothers Finance Corporation,
4.375%, due 4/15/23 | | BBB- | | | 500 | | | | 519 | |
| | Ryder System, Inc.,
3.750%, due 6/9/23 | | A- | | | 650 | | | | 677 | |
| | Wells Fargo & Co.,
4.480%, due 1/16/24 | | A | | | 650 | | | | 697 | |
| | The Goldman Sachs Group, Inc.,
4.000%, due 3/3/24 | | A | | | 650 | | | | 690 | |
| | Bank of America Corporation,
3M USD LIBOR + 0.780%, 3.550%, due 3/5/24, VRN | | A+ | | | 650 | | | | 674 | |
| | Mitsubishi UFJ Financial Group, Inc.,
3.407%, due 3/7/24 | | A1 | | | 650 | | | | 675 | |
| | Grupo Bimbo S.A.B. de C.V—144A,
3.875%, due 6/27/24 | | BBB | | | 500 | | | | 517 | |
| | BNP Paribas S.A.,
4.250%, due 10/15/24 | | A | | | 650 | | | | 684 | |
| | CVS Health Corporation,
4.100%, due 3/25/25 | | BBB | | | 500 | | | | 528 | |
| | AbbVie, Inc.,
3.600%, due 5/14/25 | | A- | | | 650 | | | | 672 | |
| | ERP Operating L.P.,
3.375%, due 6/1/25 | | A | | | 650 | | | | 680 | |
| | Comcast Corporation,
3.950%, due 10/15/25 | | A- | | | 650 | | | | 702 | |
| | Intercontinental Exchange, Inc.,
3.750%, due 12/1/25 | | A | | | 650 | | | | 695 | |
| | Simon Property Group L.P.,
3.300%, due 1/15/26 | | A | | | 650 | | | | 672 | |
| | AT&T, Inc.,
4.125%, due 2/17/26 | | A- | | | 650 | | | | 692 | |
| | Issuer | | NRSRO
Rating
(unaudited) | | Principal
Amount | | | Value | |
| | | |
| | U.S. Government Agency—(continued) | |
| | Corporate Obligations—(continued) | | |
| | ConocoPhillips Co.,
4.950%, due 3/15/26 | | A | | $ | 650 | | | $ | 743 | |
| | Brookfield Finance, Inc.,
4.250%, due 6/2/26 | | A- | | | 650 | | | | 679 | |
| | Amazon.com, Inc.,
3.150%, due 8/22/27 | | AA- | | | 650 | | | | 684 | |
| | Motorola Solutions, Inc.,
4.600%, due 2/23/28 | | BBB- | | | 500 | | | | 525 | |
| | Quest Diagnostics, Inc.,
4.200%, due 6/30/29 | | BBB+ | | | 675 | | | | 722 | |
| | The Kroger Co.,
8.000%, due 9/15/29 | | Baa1 | | | 500 | | | | 667 | |
| | Total Corporate Obligations | | | | | | | | | 22,687 | |
| | Total Long-Term Investments—94.8%
(cost $60,420) | | | | | | | | | 60,762 | |
| | | | | | | | | | | | |
| | Repurchase Agreement | | | | | | | | | | |
| | Fixed Income Clearing Corporation, 0.500% dated 6/28/19, due 7/1/19, repurchase price $1,878, collateralized by U.S. Treasury Note, 1.500%, due 8/15/26 | | | | | 1,878 | | | | 1,878 | |
| | Total Repurchase Agreement—2.9%
(cost $1,878) | | | | | | | | | 1,878 | |
| | | | | | | | | | | | |
| | Commercial Paper | | | | | | | | | | |
| | Cargill Global Funding plc,
2.353%, due 7/1/19 | | | | | 600 | | | | 600 | |
| | Eli Lilly & Co.,
2.383%, due 7/2/19 | | | | | 600 | | | | 600 | |
| | Total Commercial Paper—1.9%
(cost $1,200) | | | | | | | | | 1,200 | |
| | Total Investments—99.6%
(cost $63,498) | | | | | | | | | 63,840 | |
See accompanying Notes to Financial Statements.
| June 30, 2019 | William Blair Funds | 93 |
Income Fund
Portfolio of Investments, June 30, 2019(all dollar amounts in thousands) (unaudited)
| | | | | | | | |
| | | | Principal | | | | |
| | Issuer | | Amount | | | Value | |
| | | | | | | | | | |
| | Securities Sold, Not Yet Purchased | | | | | | | | |
| | | | | | | | | | |
| | U.S. Government Agency—(4.7)% | | | | | | | | |
| | Federal National Mortgage Association (FNMA)—(4.7)%
TBA, 2.500%, due 7/1/34 | | $ | (3,000 | ) | | $ | (3,021 | ) |
| | Total Securities Sold, Not Yet Purchased—(4.7)%(proceeds $3,003) | | | | | | | (3,021 | ) |
| | Cash and other assets,less liabilities—5.1% | | | | | | | 3,252 | |
| | Net assets—100.0% | | | | | | $ | 64,071 | |
The obligations of certain U.S. Government-sponsored securities are neither issued nor guaranteed by the U.S. Treasury.
144A = Security exempt from registration under Rule 144A of the Securities Act of 1933. These securities may be resold in transactions exempt from registration, normally to qualified institutional buyers.
NRSRO = Nationally Recognized Statistical Rating Organization—The credit quality ratings of the securities in the Fund reflect the highest category rating by any of Fitch Ratings, Moody’s Investors Service Inc., or Standard & Poor’s, a division of the McGraw-Hill Companies, Inc.
TBA = To Be Announced—TBAs are mortgage-backed securities traded under delayed delivery commitments, settling after June 30, 2019. The term TBA comes from the fact that the specific mortgage-backed security that will be delivered to fulfill a TBA trade is not designated at the time the trade is made.
VRN = Variable Rate Note
See accompanying Notes to Financial Statements.
| 94 | Semiannual Report | June 30, 2019 |
| | Low Duration Fund |
| | |
| | The Low Duration Fund seeks to maximize total return. Total return includes both income and capital appreciation. |
| | |
| | AN OVERVIEW FROM THE PORTFOLIO MANAGERS |
| | |
 Paul J. Sularz  Christopher T. Vincent | The William Blair Low Duration Fund (Class N shares) returned 2.46%, net of fees, for the six month period ended June 30, 2019. By comparison, the Fund’s benchmark, the Bank of America/Merrill Lynch 1-Year U.S. Treasury Note Index (the “Index”), returned 1.76%. A couple of factors contributed to the Fund’s performance relative to the Index year-to-date. The Fund’s holdings of higher-coupon agency mortgage-backed securities was additive to results. An allocation to floating-rate corporate and asset-backed securities positively contributed to performance due to the additional income the securities offered. The Fund’s interest rate positioning also impacted results favorably, as the Fund had more duration during a period of declining short-term interest rates. A couple of factors detracted from the Fund’s performance relative to the Index year-to-date. Residual cash held in the portfolio detracted from performance as short-term bonds outperformed cash during the period. The Fund also hedged some of its interest rate risk, and these hedges detracted from results as interest rates declined. Please refer to the Fixed Income Market Review and Outlook relating to the Fund beginning on page 83 for additional information. |
| June 30, 2019 | William Blair Funds | 95 |
Low Duration Fund
Performance Highlights (Unaudited)
| Average Annual Total Return through 6/30/2019 |
| | | Year
to Date | | 1 Year | | 3 Year | | 5 Year | | Since
Inception(a) |
| Class N | | | 2.46 | % | | | 2.97 | % | | | 1.38 | % | | | 1.14 | % | | | 1.21 | % |
| Class I | | | 2.54 | | | | 3.26 | | | | 1.57 | | | | 1.33 | | | | 1.38 | |
| Class R6 | | | 2.56 | | | | 3.29 | | | | 1.61 | | | | 1.38 | | | | 1.48 | |
| Bank of America Merrill Lynch 1-Year U.S. Treasury Note Index | | | 1.76 | | | | 2.98 | | | | 1.43 | | | | 1.02 | | | | 0.73 | |
| (a) | Since inception is for the period from December 1, 2009 (Commencement of Operations) to June 30, 2019. |
Performance cited represents past performance. Past performance does not guarantee future results and current performance may be lower or higher than the data quoted. Results shown are average annual total returns, which assume reinvestment of dividends and capital gains. Investment returns and principal will fluctuate and you may have a gain or loss when you sell shares. For the most current month-end performance information, please call 1-800-742-7272, or visit our Web site atwww.williamblairfunds.com. From time to time, the investment adviser may waive fees or reimburse expenses for the Fund. Without these waivers/reimbursements, performance would be lower. Class N shares are not subject to a sales load. Class I shares are not subject to a sales load or distribution (Rule 12b-1) fees. Class R6 shares are not subject to a sales load, distribution (Rule 12b-1) fees, or sub-transfer agent fees.
The performance highlights and graph presented above do not reflect the deduction of taxes that a shareholder would pay on fund distributions or the redemption of fund shares.
The Bank of America Merrill Lynch 1-Year U.S. Treasury Note Index is comprised of a single U.S. Treasury Note issue purchased at the beginning of the month and held for a full month. Each month the index is rebalanced and the issue selected is the outstanding U.S. Treasury Note that matures closest to, but not beyond one year from the rebalancing date.
This report identifies the Fund’s investments on June 30, 2019. These holdings are subject to change. Not all investments in the Fund performed the same, nor is there any guarantee that these investments will perform as well in the future. Market forecasts provided in this report may not necessarily come to pass.
Sector Diversification (Unaudited)
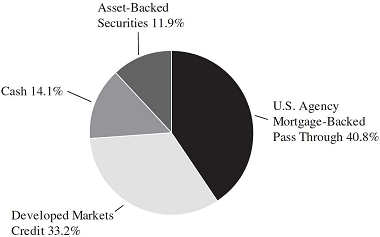
The sector diversification shown is based on the total investments.
| 96 | Semiannual Report | June 30, 2019 |
Low Duration Fund
Portfolio of Investments, June 30, 2019(all dollar amounts in thousands) (Unaudited)
| | | | | | | |
| | Issuer | | Principal
Amount | | Value | |
| | | | | | |
| | U.S. Government Agency—53.0% | | | | | | | | |
| | Federal Home Loan Mortgage Corp. (FHLMC)—13.8% | | | | | |
| | #B17294, 5.000%, due 11/1/19 | | $ | 6 | | | $ | 6 | |
| | #B19222, 4.500%, due 4/1/20 | | | 9 | | | | 9 | |
| | #J02537, 5.000%, due 9/1/20 | | | 5 | | | | 6 | |
| | #G11836, 5.500%, due 12/1/20 | | | 2 | | | | 2 | |
| | #E02322, 5.500%, due 5/1/22 | | | 11 | | | | 11 | |
| | #G12725, 6.000%, due 6/1/22 | | | 49 | | | | 50 | |
| | #G13124, 6.000%, due 12/1/22 | | | 123 | | | | 127 | |
| | #J06871, 5.500%, due 1/1/23 | | | 26 | | | | 27 | |
| | #J08450, 5.500%, due 7/1/23 | | | 17 | | | | 18 | |
| | #J08703, 5.500%, due 9/1/23 | | | 20 | | | | 20 | |
| | #C00351, 8.000%, due 7/1/24 | | | 26 | | | | 28 | |
| | #J11208, 5.000%, due 11/1/24 | | | 39 | | | | 40 | |
| | #G00363, 8.000%, due 6/1/25 | | | 41 | | | | 45 | |
| | #C80329, 8.000%, due 8/1/25 | | | 8 | | | | 9 | |
| | #G04821, 8.500%, due 7/1/31 | | | 1,478 | | | | 1,802 | |
| | #G07837, 6.500%, due 2/1/38 | | | 1,035 | | | | 1,228 | |
| | #G04641, 6.000%, due 6/1/38 | | | 1,163 | | | | 1,326 | |
| | #A81372, 6.000%, due 8/1/38 | | | 196 | | | | 224 | |
| | #G04687, 6.000%, due 9/1/38 | | | 50 | | | | 57 | |
| | #G04745, 6.000%, due 9/1/38 | | | 180 | | | | 205 | |
| | #A81799, 6.500%, due 9/1/38 | | | 162 | | | | 180 | |
| | #G06085, 6.500%, due 9/1/38 | | | 47 | | | | 55 | |
| | #G05723, 6.500%, due 11/1/38 | | | 798 | | | | 944 | |
| | #G61450, 6.000%, due 4/1/40 | | | 5,934 | | | | 6,827 | |
| | #4122, Tranche FP, 1M LIBOR + 0.400%, 2.794%, due 10/15/42, VRN | | | 606 | | | | 605 | |
| | Total FHLMC Mortgage Obligations | | | | | | | 13,851 | |
| | Federal National Mortgage Association (FNMA)—39.2% | | | | | |
| | #785259, 5.000%, due 8/1/19 | | | 1 | | | | 1 | |
| | #761530, 5.500%, due 8/1/19 | | | 1 | | | | 1 | |
| | #761489, 5.500%, due 9/1/19 | | | 1 | | | | 1 | |
| | #725953, 5.000%, due 10/1/19 | | | 1 | | | | 1 | |
| | #357865, 5.000%, due 7/1/20 | | | 10 | | | | 11 | |
| | #879607, 5.500%, due 4/1/21 | | | 8 | | | | 8 | |
| | #831497, 6.000%, due 4/1/21 | | | 39 | | | | 39 | |
| | #831525, 5.500%, due 6/1/21 | | | 12 | | | | 12 | |
| | #880993, 6.000%, due 1/1/22 | | | 3 | | | | 3 | |
| | #888982, 6.000%, due 12/1/22 | | | 56 | | | | 58 | |
| | #972934, 5.500%, due 2/1/23 | | | 73 | | | | 75 | |
| | #889670, 5.500%, due 6/1/23 | | | 15 | | | | 16 | |
| | #AE0011, 5.500%, due 9/1/23 | | | 16 | | | | 16 | |
| | #AL7213, 5.500%, due 12/1/23 | | | 724 | | | | 748 | |
| | #995395, 6.000%, due 12/1/23 | | | 42 | | | | 44 | |
| | #AL7638, 5.500%, due 1/1/24 | | | 2,130 | | | | 2,204 | |
| | #190988, 9.000%, due 6/1/24 | | | 11 | | | | 11 | |
| | #AL8529, 6.000%, due 11/1/24 | | | 6,939 | | | | 7,235 | |
| | #AL2853, 4.500%, due 6/1/26 | | | 1,469 | | | | 1,563 | |
| | #AL9730, 4.500%, due 2/1/27 | | | 1,433 | | | | 1,524 | |
| | #AL9857, 4.000%, due 2/1/29 | | | 2,126 | | | | 2,236 | |
| | #555933, 7.000%, due 6/1/32 | | | 406 | | | | 462 | |
| | #886762, 7.000%, due 9/1/36 | | | 223 | | | | 264 | |
| | #948637, 6.500%, due 8/1/37 | | | 208 | | | | 241 | |
| | Issuer | | NRSRO
Rating
(unaudited) | | Principal
Amount | | Value | |
| | | | | | | | |
| | U.S. Government Agency—(continued) |
| | Federal National Mortgage Association (FNMA)—(continued) |
| | #888703, 6.500%, due 8/1/37 | | | | $ | 2,273 | | | $ | 2,727 | |
| | #888530, 7.500%, due 8/1/37 | | | | | 1,634 | | | | 1,990 | |
| | #AL6411, 7.000%, due 12/1/37 | | | | | 1,731 | | | | 1,984 | |
| | #AD0100, 7.000%, due 12/1/38 | | | | | 563 | | | | 674 | |
| | #AE0934, 6.500%, due 10/1/39 | | | | | 1,891 | | | | 2,243 | |
| | #BM3525, 6.000%, due 4/1/41 | | | | | 3,571 | | | | 4,078 | |
| | #AL9226, 5.500%, due 12/1/41 | | | | | 3,138 | | | | 3,523 | |
| | #BM1328, 6.000%, due 1/1/42 | | | | | 1,603 | | | | 1,841 | |
| | #AL9225, 6.000%, due 1/1/42 | | | | | 2,954 | | | | 3,388 | |
| | Total FNMA Mortgage Obligations | | | | | | | | | 39,222 | |
| | | | | | | | | | | | |
| | Asset-Backed Securities—12.0% | | |
| | Tesla Auto Lease Trust-144A,
2018-A, Tranche A, 2.320%, 12/20/19 | | Aaa | | | 80 | | | | 80 | |
| | Nissan Auto Lease Trust, 2018-A, Tranche A2B,
1M USD LIBOR + 0.150%, 2.634%, 2/16/21, VRN | | AAA | | | 1,380 | | | | 1,379 | |
| | GM Financial Consumer Automobile Receivables Trust, 2018-3, Tranche A2B,
1M USD LIBOR + 0.110%, 2.504%, 7/16/21, VRN | | AAA | | | 1,267 | | | | 1,267 | |
| | Ford Credit Auto Owner Trust, 2018-B, Tranche A2B,
1M USD LIBOR + 0.120%, 2.514%, 9/15/21, VRN | | Aaa | | | 536 | | | | 536 | |
| | PFS Financing Corporation-144A, 2018-A, Tranche A,
1M USD LIBOR + 0.400%, 2.794%, 2/15/22, VRN | | AAA | | | 1,500 | | | | 1,500 | |
| | Verizon Owner Trust-144A, 2017-3A, Tranche A1B,
1M LIBOR + 0.270%, 2.653%, 4/20/22, VRN | | AAA | | | 1,500 | | | | 1,502 | |
| | Mercedes-Benz Master Owner Trust-144A, 2017-BA, Tranche A,
1M LIBOR + 0.420%, 2.814%, 5/16/22, VRN | | Aaa | | | 2,280 | | | | 2,284 | |
| | GMF Floorplan Owner Revolving Trust-144A, 2017-2, Tranche A2,
1M USD LIBOR + 0.430%, 2.824%, 7/15/22, VRN | | Aaa | | | 1,000 | | | | 1,002 | |
| | Oxford Finance Funding LLC-144A,
2019-1A, Tranche A2, 4.459%, 2/15/27 | | BB | | | 1,000 | | | | 1,028 | |
| | SLM Private Education Loan Trust-144A, 2011-A, Tranche A3,
1M USD LIBOR + 2.500%, 4.894%, 1/15/43, VRN | | AAA | | | 1,443 | | | | 1,452 | |
| | Total Asset-Backed Securities | | | | | | | | | 12,030 | |
See accompanying Notes to Financial Statements.
| June 30, 2019 | William Blair Funds | 97 |
Low Duration Fund
Portfolio of Investments, June 30, 2019(all dollar amounts in thousands) (Unaudited)
| | Issuer | | NRSRO
Rating
(unaudited) | | Principal
Amount | | Value | |
| | | | | | | | |
| | Corporate Obligations—33.3% | | | | | | | | | | |
| | Mondelez International Holdings Netherlands BV-144A,
3M USD LIBOR + 0.610%, 3.192%, due 10/28/19, VRN | | A3 | | $ | 1,750 | | | $ | 1,752 | |
| | Daimler Finance North America LLC-144A,
3M USD LIBOR + 0.620%, 3.203%, due 10/30/19, VRN | | A | | | 1,600 | | | | 1,603 | |
| | Citigroup, Inc.,
3M USD LIBOR + 0.790%, 3.374%, due 1/10/20, VRN | | A | | | 1,853 | | | | 1,859 | |
| | Branch Banking & Trust Co.,
3M USD LIBOR + 0.450%, 3.047%, due 1/15/20, VRN | | A1 | | | 1,700 | | | | 1,703 | |
| | Capital One Financial Corporation,
3M USD LIBOR + 0.760%, 3.295%, due 5/12/20, VRN | | A- | | | 1,750 | | | | 1,758 | |
| | Diageo Capital plc,
3M USD LIBOR + 0.240%, 2.760%, due 5/18/20, VRN | | A- | | | 750 | | | | 751 | |
| | Harley-Davidson Financial Services, Inc.-144A,
3M USD LIBOR + 0.500%, 3.022%, due 5/21/20, VRN | | A | | | 1,000 | | | | 1,000 | |
| | National Australia Bank Ltd.-144A,
3M USD LIBOR + 0.510%, 3.033%, due 5/22/20, VRN | | AA- | | | 1,750 | | | | 1,758 | |
| | John Deere Capital Corporation,
3M USD LIBOR + 0.290%, 2.633%, due 6/22/20, VRN | | A | | | 1,000 | | | | 1,002 | |
| | Nissan Motor Acceptance Corp.-144A,
3M USD LIBOR + 0.390%, 2.987%, due 7/13/20, VRN | | A- | | | 1,250 | | | | 1,250 | |
| | Caterpillar Financial Services Corporation,
3M USD LIBOR + 0.290%, 2.793%, due 9/4/20, VRN | | A | | | 1,000 | | | | 1,002 | |
| | Apple, Inc.,
3M USD LIBOR + 1.130%, 3.654%, due 2/23/21, VRN | | AA+ | | | 1,000 | | | | 1,017 | |
| | JPMorgan Chase & Co.,
3M USD LIBOR + 1.480%, 4.000%, due 3/1/21, VRN | | AA- | | | 1,750 | | | | 1,781 | |
| | Wells Fargo & Co.,
3M USD LIBOR + 1.340%, 3.843%, due 3/4/21, VRN | | A+ | | | 1,750 | | | | 1,777 | |
| | HSBC Holdings plc,
3M USD LIBOR + 2.240%, 4.693%, due 3/8/21, VRN | | AA- | | | 1,750 | | | | 1,801 | |
| | Issuer | | NRSRO
Rating
(unaudited) | | Principal
Amount | | | Value | |
| | | | | | | | |
| | Corporate Obligations—(continued) | | |
| | Bank of America Corporation,
3M USD LIBOR + 1.420%, 4.012%, due 4/19/21, VRN | | A+ | | $ | 1,000 | | | $ | 1,019 | |
| | The Goldman Sachs Group, Inc.,
3M USD LIBOR + 1.360%, 3.940%, due 4/23/21, VRN | | A | | | 1,000 | | | | 1,015 | |
| | Westpac Banking Corporation,
3M USD LIBOR + 1.000%, 3.535%, due 5/13/21, VRN | | AA- | | | 1,750 | | | | 1,774 | |
| | The Charles Schwab Corporation,
3M USD LIBOR + 0.320%, 2.842%, due 5/21/21, VRN | | A | | | 1,000 | | | | 1,002 | |
| | The Toronto-Dominion Bank,
3M USD LIBOR + 0.430%, 2.881%, due 6/11/21, VRN | | Aa1 | | | 1,000 | | | | 1,004 | |
| | Barclays plc,
3M USD LIBOR + 2.110%, 4.655%, due 8/10/21, VRN | | A | | | 1,750 | | | | 1,789 | |
| | KeyBank NA,
3M USD LIBOR + 0.810%, 3.333%, due 11/22/21, VRN | | A- | | | 1,750 | | | | 1,766 | |
| | Bristol-Myers Squibb Co.-144A,
2.600%, due 5/16/22 | | A+ | | | 1,000 | | | | 1,013 | |
| | Ryder System, Inc.,
2.875%, due 6/1/22 | | A- | | | 1,150 | | | | 1,164 | |
| | Total Corporate Obligations | | | | | | | | | 33,360 | |
| | Total Long-Term Investments—98.3%
(cost $98,667) | | | | | | | | | 98,463 | |
| | | | | | | | | | | | |
| | Repurchase Agreement | | | | | | | | | | |
| | Fixed Income Clearing Corporation, 0.500% dated 6/28/19, due 7/1/19, repurchase price $731, collateralized by U.S. Treasury Note, 1.500%, due 8/15/26 | | | | | 731 | | | | 731 | |
| | Total Repurchase Agreement—0.7%
(cost $731) | | | | | | | | | 731 | |
| | | | | | | | | | | | |
| | Commercial Paper | | | | | | | | | | |
| | Cargill Global Funding plc,
2.353%, due 7/1/19 | | | | | 1,500 | | | | 1,500 | |
| | Total Commercial Paper—1.5%
(cost $1,500) | | | | | | | | | 1,500 | |
| | Total Investments—100.5%
(cost $100,898) | | | | | | | | | 100,694 | |
See accompanying Notes to Financial Statements.
| 98 | Semiannual Report | June 30, 2019 |
Low Duration Fund
Portfolio of Investments, June 30, 2019(all dollar amounts in thousands) (Unaudited)
| | | | | | | |
| | Issuer | | Principal
Amount | | Value | |
| | | | | | | | | | |
| | Securities Sold, Not Yet Purchased | | | | | | | | |
| | | | | | | | | | |
| | U.S. Government Agency | | | | | | | | |
| | Federal National Mortgage Association (FNMA)—(12.1)% | | | | |
| | TBA, 2.500%, due 7/1/34 | | $ | (12,000 | ) | | $ | (12,085 | ) |
| | Total Securities Sold, Not Yet Purchased—(12.1)%
(proceeds $12,013) | | | | | | | (12,085 | ) |
| | Cash and other assets, less liabilities—11.6% | | | | | | | 11,584 | |
| | Net assets—100.0% | | | | | | $ | 100,193 | |
The obligations of certain U.S. Government-sponsored securities are neither issued nor guaranteed by the U.S. Treasury.
144A = Security exempt from registration under Rule 144A of the Securities Act of 1933. These securities may be resold in transactions exempt from registration, normally to qualified institutional buyers.
NRSRO = Nationally Recognized Statistical Rating Organization—The credit quality ratings of the securities in the Fund reflect the highest category rating by any of Fitch Ratings, Moody’s Investors Service Inc., or Standard & Poor’s, a division of the McGraw-Hill Companies, Inc.
TBA = To Be Announced—TBAs are mortgage-backed securities traded under delayed delivery commitments, settling after June 30, 2019. The term TBA comes from the fact that the specific mortgage-backed security that will be delivered to fulfill a TBA trade is not designated at the time the trade is made.
VRN = Variable Rate Note
See accompanying Notes to Financial Statements.
| June 30, 2019 | William Blair Funds | 99 |
| | Macro Allocation Fund |
| | |
| | AN OVERVIEW FROM THE PORTFOLIO MANAGERS |
| | |

Thomas Clarke 
Brian D. Singer | The William Blair Macro Allocation Fund (Class N shares) posted a 2.45% increase, net of fees, for the six-month period ending June 30, 2019. By comparison, the Fund’s benchmark index, the Bank of America/Merrill Lynch 3-Month U.S. Treasury Bill Index (the “Index”), increased 1.24%. After a turbulent end to calendar year 2018, equity markets rebounded handsomely over the past six months, with the MSCI All Country World Index gaining +16.38% in fully hedged terms. Strong performance came from European, U.S., and Australian equity markets while Japanese and emerging markets lagged (though still positive). Bond yields fell, generally speaking, providing strong positive returns to bond indices. Within currencies, strong performance can be seen in energy-sensitive currencies such as the Russian ruble and Mexican peso, while underperformers have been developed European currencies such as the Swedish krona, euro, and British pound. The Fund’s market and currency strategies were both positive during the period. Within markets, the Fund saw positive contributions from long exposure to Europe, the U.K., Singapore, and emerging market equities. Detracting from the Fund’s market strategy performance was short exposure to Canadian and Swiss equities, short exposure to European sovereign bonds, and sector positioning within U.S. equities. Within the Fund’s active currency strategy, positive performance was gained from long exposure to the Philippine peso, Mexican peso, and Russian ruble. Negative contribution to performance came from the Fund’s short exposure to the Thai baht, Indonesian rupiah, and long exposure to the Swedish krona. We have observed for some time that a large part of the influence on equities, when they have been rallying, has been central bank policy. This includes direct communication from monetary authorities about what they might do, as well as changes in market expectations ahead of such communication when investors collectively predict what central bank committees might do. More specifically, the perception that the Federal Reserve (the “Fed”) and the European Central Bank (the “ECB”) will continue to act to contain equity declines and fuel price recoveries has become pervasive. Linking the developments in equities and bonds in the last six months reveals as much, and repeats a pattern very similar to what happened in the fourth quarter of 2018 and earlier this year. As stocks fall—as they did in May [of 2019] and also October through December of 2018—interest rate markets sharply revise downward monetary expectations, changing them from expected rate increases, to no changes, to cuts, and to longer periods at low or negative levels. In both recent episodes, this adjustment has mostly happened before central bank spokespeople have commented. Subsequently, more dovish (than before) statements from Fed Chairman Powell and ECB President Draghi confirm these changed expectations—anchoring them at lower levels, after which equities rebounded. We have opined that such apparent “ceding of control” of policy to market sentiment is not a good thing, even though it has ostensibly been effective if its aim was indeed to underwrite stock markets. What appears to have developed is that the “cycle” outlined previously has recurred with increasing frequency; the May 2019 market downturn produced a response from central banks (ratifying more dovish monetary assessments) after less time and after a smaller price decline than the downturn seen at the end of 2018. In this sense, it is less of an issue in our eyes that central banks can support markets, than that they are having to do so at more frequent intervals. While we find some equity markets fundamentally attractive (several in Europe and developed Asia-Pacific, also Brazil, India, Vietnam), we remain reluctant to assume significant aggregate long equity exposure in portfolios because, overall, our analysis leads us to expect relatively meager equity returns and largely unpredictable negative shocks to the downside that seem to increasingly lead to additional ratchets in expectations toward ever |
| 100 | Semiannual Report | June 30, 2019 |
| | Macro Allocation Fund |
| | |
| | AN OVERVIEW FROM THE PORTFOLIO MANAGERS (CONTINUED) |
| | |
| | greater monetary accommodation, and which likely require major central banks to confirm the same. Furthermore, global economic activity is slowing and has been doing so for more than a year, which is reflected in Industrial Purchasing Managers’ Index (“PMI”) reports across the world. Such indicators are consistent with almost flat growth (i.e. no expansion) on an aggregate basis. While this data provides justification for easier monetary expectations (justification other than just market price weakness), it leads us to believe that the forward-looking environment for equities is not as strong right now. In the current environment, we have continued our stance of carrying low total equity exposure (systematic “beta”), and employing linear option replication, which involves selling equities as they depreciate and buying as they appreciate, as a means of navigating what we’ve discussed previously. Contrastingly, we have looked to increase risk exposure to areas of our investment universe where we believe that opportunities are not exposed to systematic risk, and this has mostly involved our currency strategy. Generally, we remain long emerging market currencies and short developed market currencies, but recent strategy changes have not been in this direction. Also, we continue to see a lack of correlation between movements in exchange rates and equity markets so far in 2019. It is especially notable that we have not seen emerging currencies depreciate along with equity markets so far, providing the breadth and diversification that we seek when investing in currencies. |
| June 30, 2019 | William Blair Funds | 101 |
Macro Allocation Fund
Performance Highlights (Unaudited)
| Average Annual Total Return through 6/30/2019 |
| | | Year
to Date | | 1 Year | | 3 Year | | 5 Year | | Since
Inception |
| Class N(a) | | | 2.45 | % | | | 2.77 | % | | | 2.63 | % | | | 0.43 | % | | | 4.35 | % |
| Class I(a) | | | 2.64 | | | | 3.09 | | | | 2.93 | | | | 0.72 | | | | 4.64 | |
| BofA Merrill Lynch 3-Month U.S. Treasury Bill Index(a) | | | 1.24 | | | | 2.31 | | | | 1.38 | | | | 0.87 | | | | 0.60 | |
| Class R6(b) | | | 2.64 | | | | 3.14 | | | | 3.01 | | | | 0.81 | | | | 1.44 | |
| BofA Merrill Lynch 3-Month U.S. Treasury Bill Index(b) | | | 1.24 | | | | 2.31 | | | | 1.38 | | | | 0.87 | | | | 0.77 | |
| (a) | Since inception is for the period from November 29, 2011 (Commencement of Operations) to June 30, 2019. |
| (b) | Since inception is for the period from October 21, 2013 (Commencement of Operations) to June 30, 2019. |
Performance cited represents past performance. Past performance does not guarantee future results and current performance may be lower or higher than the data quoted. Results shown are average annual total returns, which assume reinvestment of dividends and capital gains. Investment returns and principal will fluctuate and you may have a gain or loss when you sell shares. For the most current month-end performance information, please call 1-800-742-7272, or visit our Web site atwww.williamblairfunds.com. The Fund involves a high level of risk and may not be appropriate for everyone. You could lose money by investing in the Fund. There can be no assurance that the Fund’s investment objective will be achieved or that the Fund’s investment strategies will be successful. The Fund is not a complete investment program. From time to time, the investment adviser may waive fees or reimburse expenses for the Fund. Without these waivers/reimbursements, performance would be lower. Class N shares are not subject to a sales load. Class I shares are not subject to a sales load or distribution (Rule 12b-1) fees. Class R6 shares are not subject to a sales load, distribution (Rule 12b-1) fees, or sub-transfer agent fees.
The performance highlights and graph presented above do not reflect the deduction of taxes that a shareholder would pay on fund distributions or the redemption of fund shares.
The Bank of America (“BofA”) Merrill Lynch 3-Month U.S. Treasury Bill Index measures total return on cash, including price and interest income, based on short-term government Treasury Bills of about 90-day maturity. The Index is unmanaged, does not incur fees or expenses, and cannot be invested in directly.
This report identifies the Fund’s investments on June 30, 2019. These holdings are subject to change. Not all investments in the Fund performed the same, nor is there any guarantee that these investments will perform as well in the future. Market forecasts provided in this report may not necessarily come to pass.
Portfolio Allocation (Unaudited)
The table below provides the allocation of the Fund’s holdings as a percent of net assets as of June 30, 2019.
| Category | | % of net
assets |
| Equity Exchange-Traded Funds | | | 59.6 | % |
| Fixed Income Exchange-Traded Funds | | | 4.3 | |
| Foreign Government Bond | | | 2.3 | |
| Repurchase Agreement | | | 7.5 | |
| U.S. Government | | | 23.5 | |
| Cash and Other Assets, Less Liabilities | | | 2.8 | |
| Net Assets | | | 100.0 | % |
See accompanying Notes to Financial Statements.
| 102 | Semiannual Report | June 30, 2019 |
Macro Allocation Fund
Portfolio of Investments, June 30, 2019(all dollar amounts in thousands) (unaudited)
| | Issuer | | Shares or
Principal
Amount | | | Value | |
| | | | | | | | |
| | Exchange-Traded Funds—63.9% | | | | | | | | |
| | Equity Exchange-Traded Funds—59.6% | | | | | | | | |
| | Consumer Staples Select Sector SPDR Fund | | | 231,600 | | | $ | 13,449 | |
| | Dragon Capital-Vietnam Enterprise Investments, Ltd. Class “C”§ | | | 3,275,100 | | | | 18,134 | |
| | Energy Select Sector SPDR Fund | | | 307,900 | | | | 19,616 | |
| | Global X MSCI Greece ETF | | | 2,607,200 | | | | 24,925 | |
| | iShares Core MSCI Emerging Markets ETF | | | 694,600 | | | | 35,730 | |
| | iShares MSCI Brazil ETF | | | 826,300 | | | | 36,126 | |
| | iShares MSCI India ETF | | | 274,500 | | | | 9,690 | |
| | iShares MSCI Malaysia ETF | | | 297,500 | | | | 8,845 | |
| | iShares Russell 1000 Value ETF | | | 283,100 | | | | 36,016 | |
| | SPDR S&P 500 ETF Trust | | | 1,095,700 | | | | 321,040 | |
| | Utilities Select Sector SPDR Fund | | | 77,800 | | | | 4,639 | |
| | VanEck Vectors Russia ETF | | | 98,700 | | | | 2,332 | |
| | Total Equity Exchange-Traded Funds | | | | | | | 530,542 | |
| | Fixed Income Exchange-Traded Funds—4.3% | | | | | | | | |
| | iShares iBoxx $ Investment Grade Corporate Bond ETF | | | 220,300 | | | | 27,399 | |
| | SPDR Bloomberg Barclays High Yield Bond ETF | | | 95,000 | | | | 10,349 | |
| | Total Fixed Income Exchange-Traded Funds | | | | | | | 37,748 | |
| | Total Exchange-Traded Funds—63.9%
(cost $519,931) | | | | | | | 568,290 | |
| | | | | | | | | | |
| | Foreign Government Bond—2.3% | | | | | | | | |
| | Malaysia | | | | | | | | |
| | Malaysia Government Bond, 3.492%, due 3/31/20 | | MYR 85,568 | | | | 20,759 | |
| | Total Foreign Government Bonds—2.3%
(cost $20,817) | | | | | | | 20,759 | |
| | | | | | | | | | |
| | Repurchase Agreement—7.5% | | | | | | | | |
| | Fixed Income Clearing Corporation, 0.500% dated 6/28/19, due 7/1/19, repurchase price $66,872, collateralized by U.S. Treasury Note, 1.500%, due 8/15/26 | | | 66,869 | | | | 66,869 | |
| | Total Repurchase Agreement—7.5%
(cost $66,869) | | | | | | | 66,869 | |
| | | | | | | | |
| | Issuer | | Principal
Amount | | | Value | |
| | | | | | | | |
| | U.S. Government—23.5% | | | | | | | | |
| | U.S. Treasury Bill, 2.243%, due 7/18/19 | | | 23,000 | | | $ | 22,978 | |
| | U.S. Treasury Bill, 2.348%, due 8/15/19(a) | | | 23,000 | | | | 22,940 | |
| | U.S. Treasury Bill, 2.446%, due 9/12/19 | | | 15,000 | | | | 14,937 | |
| | U.S. Treasury Bill, 2.512%, due 10/10/19 | | | 15,000 | | | | 14,912 | |
| | U.S. Treasury Bill, 2.557%, due 11/7/19 | | | 15,000 | | | | 14,889 | |
| | U.S. Treasury Bill, 2.543%, due 12/5/19(b) | | | 15,000 | | | | 14,869 | |
| | U.S. Treasury Bill, 2.530%, due 1/2/20(a)(b) | | | 15,000 | | | | 14,844 | |
| | U.S. Treasury Bill, 2.540%, due 1/30/20(a)(b) | | | 15,000 | | | | 14,832 | |
| | U.S. Treasury Bill, 2.499%, due 2/27/20(a)(b) | | | 15,000 | | | | 14,805 | |
| | U.S. Treasury Bill, 2.370%, due 3/26/20(a)(b) | | | 15,000 | | | | 14,782 | |
| | U.S. Treasury Bill, 2.405%, due 4/23/20(a)(b) | | | 15,000 | | | | 14,762 | |
| | U.S. Treasury Bill, 2.350%, due 5/21/20(b) | | | 15,000 | | | | 14,742 | |
| | U.S. Treasury Bill, 2.063%, due 6/18/20 | | | 15,000 | | | | 14,724 | |
| | | | | | | | | | |
| | U.S. Government—(continued) | | | | | | | | |
| | Total U.S. Government—23.5%
(cost $208,624) | | | | | | $ | 209,016 | |
| | Total Investments in Securities—97.2%
(cost $816,241) | | | | | | | 864,934 | |
| | Cash and other assets, less liabilities—2.8% | | | | | | | 25,343 | |
| | Net assets—100.0% | | | | | | $ | 890,277 | |
§ = Deemed illiquid pursuant to a Liquidity Risk Management Program approved by the Board of Trustees. This holding represents 2.04% of the Fund’s net assets at June 30, 2019.
(a) Security, or portion of security, is segregated as collateral for centrally cleared swaps and to cover initial margin requirements on open futures contracts aggregating a total value of $38,766 (in thousands).
(b) Security, or portion of security, is pledged as collateral for OTC swap contracts aggregating a total value of $5,925 (in thousands).
For securities primarily traded on exchanges or markets that close before the close of regular trading on the New York Stock Exchange, the Fund may use an independent pricing service to fair value price the securities pursuant to Valuation Procedures approved by the Board of Trustees.
See accompanying Notes to Financial Statements.
| June 30, 2019 | William Blair Funds | 103 |
Macro Allocation Fund
Portfolio of Investments, June 30, 2019(all dollar amounts in thousands) (unaudited)
Forward Foreign Currency Contracts
Settlement
Date | | Deliver/Receive | | Counterparty | | Local Currency
(in thousands) | | USD (Base)
Purchased
or Sold | | Current
Value | | Net Unrealized
Appreciation
(Depreciation) |
| Purchased | | | | | | | | | | | | | | | | | | | |
| 7/17/19 | | New Turkish Lira | | Citibank N.A. London | | | 423,404 | | | | $ | 72,001 | | | | $ | 72,422 | | | | $ | 421 | |
| 9/18/19 | | Australian Dollar | | Citibank N.A. London | | | 4,713 | | | | | 3,318 | | | | | 3,317 | | | | | (1 | ) |
| 9/18/19 | | Yuan Renminbi | | Citibank N.A. London | | | 7,045 | | | | | 1,025 | | | | | 1,025 | | | | | — | |
| 9/18/19 | | Colombian Peso | | Citibank N.A. London | | | 124,106,120 | | | | | 37,888 | | | | | 38,434 | | | | | 546 | |
| 9/18/19 | | Czech Koruna | | Citibank N.A. London | | | 57,208 | | | | | 2,562 | | | | | 2,561 | | | | | (1 | ) |
| 9/18/19 | | Euro | | Citibank N.A. London | | | 2,235 | | | | | 2,557 | | | | | 2,557 | | | | | — | |
| 9/18/19 | | Hong Kong Dollar | | Citibank N.A. London | | | 12,847 | | | | | 1,646 | | | | | 1,645 | | | | | (1 | ) |
| 9/18/19 | | Indian Rupee | | Citibank N.A. London | | | 3,521,344 | | | | | 50,112 | | | | | 50,531 | | | | | 419 | |
| 9/18/19 | | Indonesian Rupiah | | Citibank N.A. London | | | 45,209,161 | | | | | 3,177 | | | | | 3,168 | | | | | (9 | ) |
| 9/18/19 | | Israeli Shekel | | Citibank N.A. London | | | 6,052 | | | | | 1,704 | | | | | 1,704 | | | | | — | |
| 9/18/19 | | Japanese Yen | | Citibank N.A. London | | | 6,136,233 | | | | | 57,004 | | | | | 57,247 | | | | | 243 | |
| 9/18/19 | | Mexican Peso | | Citibank N.A. London | | | 1,673,178 | | | | | 86,150 | | | | | 86,020 | | | | | (130 | ) |
| 9/18/19 | | New Zealand Dollar | | Citibank N.A. London | | | 5,749 | | | | | 3,869 | | | | | 3,868 | | | | | (1 | ) |
| 9/18/19 | | Norwegian Krone | | Citibank N.A. London | | | 334,496 | | | | | 38,837 | | | | | 39,298 | | | | | 461 | |
| 9/18/19 | | Philippine Peso | | Citibank N.A. London | | | 6,302,576 | | | | | 120,623 | | | | | 122,530 | | | | | 1,907 | |
| 9/18/19 | | Polish Zloty | | Citibank N.A. London | | | 102,574 | | | | | 27,337 | | | | | 27,522 | | | | | 185 | |
| 9/18/19 | | Russian Ruble | | Citibank N.A. London | | | 1,648,886 | | | | | 25,230 | | | | | 25,790 | | | | | 560 | |
| 9/18/19 | | Singapore Dollar | | Citibank N.A. London | | | 133,285 | | | | | 97,827 | | | | | 98,630 | | | | | 803 | |
| 9/18/19 | | South African Rand | | Citibank N.A. London | | | 516,104 | | | | | 34,426 | | | | | 36,278 | | | | | 1,852 | |
| 9/18/19 | | South Korean Won | | Citibank N.A. London | | | 2,169,310 | | | | | 1,880 | | | | | 1,879 | | | | | (1 | ) |
| 9/18/19 | | Swedish Krona | | Citibank N.A. London | | | 715,028 | | | | | 76,294 | | | | | 77,436 | | | | | 1,142 | |
| 9/18/19 | | Swiss Franc | | Citibank N.A. London | | | 4,625 | | | | | 4,772 | | | | | 4,772 | | | | | — | |
| 9/18/19 | | Taiwan Dollar | | Citibank N.A. London | | | 74,120 | | | | | 2,404 | | | | | 2,402 | | | | | (2 | ) |
| 9/18/19 | | Thai Baht | | Citibank N.A. London | | | 309,205 | | | | | 10,104 | | | | | 10,102 | | | | | (2 | ) |
| | | | | | | | | | | | | | | | | | | | | | $ | 8,391 | |
| Sold | | | | | | | | | | | | | | | | | | | | | | | |
| 9/18/19 | | Australian Dollar | | Citibank N.A. London | | | 82,676 | | | | $ | 57,583 | | | | $ | 58,182 | | | | $ | (599 | ) |
| 9/18/19 | | Brazilian Real | | Citibank N.A. London | | | 46,895 | | | | | 12,124 | | | | | 12,120 | | | | | 4 | |
| 9/18/19 | | Yuan Renminbi | | Citibank N.A. London | | | 186,430 | | | | | 26,859 | | | | | 27,121 | | | | | (262 | ) |
| 9/18/19 | | Colombian Peso | | Citibank N.A. London | | | 7,011,806 | | | | | 2,160 | | | | | 2,171 | | | | | (11 | ) |
| 9/18/19 | | Czech Koruna | | Citibank N.A. London | | | 1,000,568 | | | | | 44,328 | | | | | 44,797 | | | | | (469 | ) |
| 9/18/19 | | Euro | | Citibank N.A. London | | | 85,166 | | | | | 97,106 | | | | | 97,452 | | | | | (346 | ) |
| 9/18/19 | | Hong Kong Dollar | | Citibank N.A. London | | | 250,025 | | | | | 31,947 | | | | | 32,018 | | | | | (71 | ) |
| 9/18/19 | | Hungarian Forint | | Citibank N.A. London | | | 4,949,472 | | | | | 17,501 | | | | | 17,507 | | | | | (6 | ) |
| 9/18/19 | | Indian Rupee | | Citibank N.A. London | | | 1,337,096 | | | | | 19,036 | | | | | 19,187 | | | | | (151 | ) |
| 9/18/19 | | Indonesian Rupiah | | Citibank N.A. London | | | 826,987,275 | | | | | 56,955 | | | | | 57,952 | | | | | (997 | ) |
| 9/18/19 | | Israeli Shekel | | Citibank N.A. London | | | 105,493 | | | | | 29,604 | | | | | 29,705 | | | | | (101 | ) |
| 9/18/19 | | Japanese Yen | | Citibank N.A. London | | | 278,874 | | | | | 2,601 | | | | | 2,602 | | | | | (1 | ) |
| 9/18/19 | | Mexican Peso | | Citibank N.A. London | | | 73,492 | | | | | 3,777 | | | | | 3,778 | | | | | (1 | ) |
| 9/18/19 | | New Zealand Dollar | | Citibank N.A. London | | | 126,579 | | | | | 83,506 | | | | | 85,163 | | | | | (1,657 | ) |
| 9/18/19 | | Norwegian Krone | | Citibank N.A. London | | | 19,128 | | | | | 2,246 | | | | | 2,247 | | | | | (1 | ) |
| 9/18/19 | | Philippine Peso | | Citibank N.A. London | | | 283,727 | | | | | 5,506 | | | | | 5,516 | | | | | (10 | ) |
| 9/18/19 | | Polish Zloty | | Citibank N.A. London | | | 5,782 | | | | | 1,551 | | | | | 1,551 | | | | | — | |
| 9/18/19 | | Russian Ruble | | Citibank N.A. London | | | 94,082 | | | | | 1,472 | | | | | 1,471 | | | | | 1 | |
| 9/18/19 | | Singapore Dollar | | Citibank N.A. London | | | 5,882 | | | | | 4,352 | | | | | 4,353 | | | | | (1 | ) |
| 9/18/19 | | South African Rand | | Citibank N.A. London | | | 27,788 | | | | | 1,953 | | | | | 1,953 | | | | | — | |
| 9/18/19 | | South Korean Won | | Citibank N.A. London | | | 50,414,029 | | | | | 42,702 | | | | | 43,658 | | | | | (956 | ) |
| 9/18/19 | | Swedish Krona | | Citibank N.A. London | | | 32,942 | | | | | 3,567 | | | | | 3,568 | | | | | (1 | ) |
| 9/18/19 | | Swiss Franc | | Citibank N.A. London | | | 101,840 | | | | | 103,355 | | | | | 105,075 | | | | | (1,720 | ) |
| 9/18/19 | | Taiwan Dollar | | Citibank N.A. London | | | 1,199,235 | | | | | 38,198 | | | | | 38,867 | | | | | (669 | ) |
| 9/18/19 | | Thai Baht | | Citibank N.A. London | | | 4,036,345 | | | | | 129,552 | | | | | 131,864 | | | | | (2,312 | ) |
| | | | | | | | | | | | | | | | | | | | | | $ | (10,337 | ) |
| Total net unrealized appreciation (depreciation) on forward foreign currency contracts | | | | | $ | (1,946 | ) |
See accompanying Notes to Financial Statements.
| 104 | Semiannual Report | June 30, 2019 |
Macro Allocation Fund
Portfolio of Investments, June 30, 2019(all dollar amounts in thousands) (unaudited)
Futures Contracts
Number of
Contracts | | Description | | Expiration Date | | Local Currency | | Notional Value
(Local,
in Thousands) | | Notional
Amount
(USD) | | Notional
Value
(USD) | | Net Unrealized
Appreciation
(Depreciation) |
| Long | | | | | | | | | | | | | | | | | | | | | |
| 469 | | CAC 40 Index | | July 2019 | | Euro | | | 25,950 | | | | $ | 28,612 | | | | $ | 29,507 | | | | $ | 895 | |
| 343 | | IBEX 35 Index | | July 2019 | | Euro | | | 31,463 | | | | | 35,452 | | | | | 35,777 | | | | | 325 | |
| 78 | | HSCEI Future | | July 2019 | | Hong Kong Dollar | | | 42,257 | | | | | 5,421 | | | | | 5,409 | | | | | (12 | ) |
| 1,296 | | MSCI Singapore ETS Index | | July 2019 | | Singapore Dollar | | | 49,008 | | | | | 35,995 | | | | | 36,222 | | | | | 227 | |
| 208 | | KOSPI 200 Index | | September 2019 | | South Korean Won | | | 14,476,800 | | | | | 12,220 | | | | | 12,538 | | | | | 318 | |
| 14 | | NIKKEI 225 Index | | September 2019 | | Japanese Yen | | | 148,540 | | | | | 1,367 | | | | | 1,378 | | | | | 11 | |
| 87 | | SPI 200 Index | | September 2019 | | Australian Dollar | | | 14,266 | | | | | 9,873 | | | | | 10,015 | | | | | 142 | |
| 35 | | DAX Index | | September 2019 | | Euro | | | 10,840 | | | | | 12,033 | | | | | 12,326 | | | | | 293 | |
| 3,547 | | EURO STOXX 600 Banks Index | | September 2019 | | Euro | | | 23,534 | | | | | 26,504 | | | | | 26,761 | | | | | 257 | |
| 200 | | FTSE 100 Index | | September 2019 | | British Pound Sterling | | | 14,738 | | | | | 18,509 | | | | | 18,717 | | | | | 208 | |
| | | | | | | | | | | | | | | | | | | | | | | | $ | 2,664 | |
| Short | | | | | | | | | | | | | | | | | | | | | | | | | |
| 108 | | Amsterdam Index | | July 2019 | | Euro | | | 12,116 | | | | $ | 13,593 | | | | $ | 13,777 | | | | $ | (184 | ) |
| 91 | | OMXS 30 Index | | July 2019 | | Swedish Krona | | | 14,749 | | | | | 1,552 | | | | | 1,588 | | | | | (36 | ) |
| 52 | | HANG SENG Index | | July 2019 | | Hong Kong Dollar | | | 74,113 | | | | | 9,449 | | | | | 9,488 | | | | | (39 | ) |
| 347 | | MSCI Taiwan Index | | July 2019 | | U.S. Dollar | | | 13,412 | | | | | 13,437 | | | | | 13,412 | | | | | 25 | |
| 273 | | 10YR Can Bond | | September 2019 | | Canadian Dollar | | | 39,020 | | | | | 29,465 | | | | | 29,797 | | | | | (332 | ) |
| 585 | | FTSE/JSE Top 40 Index | | September 2019 | | South African Rand | | | 306,727 | | | | | 21,908 | | | | | 21,777 | | | | | 131 | |
| 217 | | S+P TSE 60 Index | | September 2019 | | Canadian Dollar | | | 42,432 | | | | | 32,319 | | | | | 32,402 | | | | | (83 | ) |
| 802 | | EURO STOXX 50 Index | | September 2019 | | Euro | | | 27,797 | | | | | 30,762 | | | | | 31,608 | | | | | (846 | ) |
| 343 | | MSCI Emerging Markets Index BIC | | September 2019 | | U.S. Dollar | | | 18,066 | | | | | 17,278 | | | | | 18,066 | | | | | (788 | ) |
| 1,247 | | MSCI Mexico Index | | September 2019 | | U.S. Dollar | | | 28,650 | | | | | 29,172 | | | | | 28,650 | | | | | 522 | |
| 2,372 | | S&P 500 E Mini Index | | September 2019 | | U.S. Dollar | | | 349,182 | | | | | 343,482 | | | | | 349,182 | | | | | (5,700 | ) |
| 69 | | S&P E Mini Com Ser Index | | September 2019 | | U.S. Dollar | | | 4,458 | | | | | 4,350 | | | | | 4,458 | | | | | (108 | ) |
| 143 | | XAK Technology | | September 2019 | | U.S. Dollar | | | 11,258 | | | | | 10,968 | | | | | 11,258 | | | | | (290 | ) |
| 48 | | XAV Health Care | | September 2019 | | U.S. Dollar | | | 4,471 | | | | | 4,405 | | | | | 4,471 | | | | | (66 | ) |
| 204 | | XAY Cons Discret | | September 2019 | | U.S. Dollar | | | 24,623 | | | | | 24,464 | | | | | 24,623 | | | | | (159 | ) |
| | | | | | | | | | | | | | | | | | | | | | | | $ | (7,953 | ) |
| Total net unrealized appreciation (depreciation) on futures contracts | | | | $ | (5,289 | ) |
Centrally Cleared Interest Rate Swap
Floating Rate
Reference | | Pay/Receive
Floating Rate | | Fixed
Rate | | Pay/Receive
Payment
Frequency | | Maturity
Date | | Cleared
Exchange | | Notional
Amount
(in thousands) | | Upfront
Payment
Paid
(Received) | | Value | | | Unrealized
Appreciation
(Depreciation) | |
| SEK 3M STIBOR | | Receive | | 1.330% | | 1YR/3M | | March 2029 | | LCH | | SEK 160,260 | | $(141) | | $(1,406) | | | | $(1,265) | |
Centrally Cleared Credit Default Swap
Reference
Entity | | Buy/Sell
Protection | | Fixed Deal
Pay Rate | | Payment
Frequency | | Maturity
Date | | Cleared
Exchange | | Notional
Amount
(in thousands | ) | Upfront
Payment
Paid
(Received | ) | Value | | Unrealized
Appreciation
(Depreciation) | |
| iTRAXX Europe S31 | | Sell | | 1.000% | | 3M | | June 2024 | | ICE | | EUR 16,900 | | $390 | | $465 | | | $ | 75 | |
See accompanying Notes to Financial Statements.
| June 30, 2019 | William Blair Funds | 105 |
Macro Allocation Fund
Portfolio of Investments, June 30, 2019(all dollar amounts in thousands) (unaudited)
Total Return Swaps
Reference
Entity | | Pay/
Receive
Floating
Rate | | Floating Rates | | Maturity
Dates | | Counterparty | | Notional
Amount
(in thousands | ) | Market
Value | | Unrealized
Appreciation
(Depreciation) |
| Euro-OAT Future | | Receive | | 0 bp | | Sep 2019 | | Credit Suisse International | | EUR 69,029 | | $ | (1,184 | ) | | $ | (1,184 | ) |
| Euro-BUND Future | | Receive | | 0 bp | | Sep 2019 | | Credit Suisse International | | EUR 5,122 | | | (68 | ) | | | (68 | ) |
| 10YR T-Note Future | | Pay | | 0 bp | | Sep 2019 | | Credit Suisse International | | $57,306 | | | 919 | | | | 919 | |
| 5YR T-Notes Future | | Receive | | 0 bp | | Sep 2019 | | Credit Suisse International | | 9,084 | | | (133 | ) | | | (133 | ) |
| MSCI Emerging Markets India Net Total Return Index | | Pay | | 3 Month LIBOR minus 21 bp | | Dec 2019 | | Goldman Sachs International | | 15,810 | | | 1,773 | | | | 1,773 | |
| MSCI Emerging Markets Indonesia Net Total Return USD | | Pay | | 3 Month LIBOR minus 5 bp | | Jun 2020 | | Citibank N.A. | | 15,198 | | | 2,259 | | | | 2,259 | |
| Swiss Market Index (Total Return) | | Receive | | 3 Month CHF LIBOR minus 20 bp | | Sep 2019 | | Goldman Sachs International | | CHF 12,092 | | | 31 | | | | 31 | |
| | | | | | | | | | | | | | | | | $ | 3,597 | |
| Total net unrealized appreciation (depreciation) on swaps | | | $ | 2,407 | |
See accompanying Notes to Financial Statements.
| 106 | Semiannual Report | June 30, 2019 |
Statements of Assets and Liabilities
As of June 30, 2019(dollar amounts in thousands) (unaudited)
| | | Growth
Fund | | | Large Cap
Growth
Fund | | | Mid Cap
Growth
Fund | |
| Assets | | | | | | | | | | | | |
| Investments in securities, at cost | | $ | 170,555 | | | $ | 159,137 | | | $ | 56,162 | |
| Investments in securities, at value | | $ | 259,985 | | | $ | 230,644 | | | $ | 69,297 | |
| Receivable for securities sold | | | — | | | | 1,238 | | | | 328 | |
| Receivable for fund shares sold | | | 62 | | | | 296 | | | | 39 | |
| Receivable from Adviser | | | 1 | | | | 27 | | | | 18 | |
| Dividend and interest receivable | | | 76 | | | | 54 | | | | 16 | |
| Total assets | | | 260,124 | | | | 232,259 | | | | 69,698 | |
| Liabilities | | | | | | | | | | | | |
| Payable for investment securities purchased | | | — | | | | 1,457 | | | | 850 | |
| Payable for fund shares redeemed | | | 113 | | | | 244 | | | | 6 | |
| Payable to custodian | | | 6 | | | | 4 | | | | 2 | |
| Management fee payable | | | 157 | | | | 110 | | | | 50 | |
| Distribution fee payable | | | 8 | | | | 11 | | | | 1 | |
| Other payables and accrued expenses | | | 56 | | | | 31 | | | | 42 | |
| Total liabilities | | | 340 | | | | 1,857 | | | | 951 | |
| Net assets | | $ | 259,784 | | | $ | 230,402 | | | $ | 68,747 | |
| Capital | | | | | | | | | | | | |
| Composition of net assets | | | | | | | | | | | | |
| Paid in capital | | $ | 148,558 | | | $ | 147,302 | | | $ | 48,413 | |
| Total distributable earnings (loss) | | | 111,226 | | | | 83,100 | | | | 20,334 | |
| Net assets | | $ | 259,784 | | | $ | 230,402 | | | $ | 68,747 | |
| | | | | | | | | | | | | |
| Class N shares | | | | | | | | | | | | |
| Net assets | | $ | 40,589 | | | $ | 56,605 | | | $ | 5,974 | |
| Shares outstanding | | | 4,191,446 | | | | 3,804,408 | | | | 528,563 | |
| Net asset value per share | | $ | 9.68 | | | $ | 14.88 | | | $ | 11.30 | |
| Class I shares | | | | | | | | | | | | |
| Net assets | | $ | 219,144 | | | $ | 173,745 | | | $ | 62,722 | |
| Shares outstanding | | | 19,326,621 | | | | 11,046,706 | | | | 5,152,513 | |
| Net asset value per share | | $ | 11.34 | | | $ | 15.73 | | | $ | 12.17 | |
| Class R6 shares | | | | | | | | | | | | |
| Net assets | | $ | 51 | | | $ | 52 | | | $ | 51 | |
| Shares outstanding | | | 4,521 | | | | 3,307 | | | | 4,191 | |
| Net asset value per share | | $ | 11.34 | | | $ | 15.73 | | | $ | 12.17 | |
See accompanying Notes to Financial Statements.
| June 30, 2019 | William Blair Funds | 107 |
Statements of Operations
For the Period Ended June 30, 2019(all amounts in thousands) (unaudited)
| | | Growth
Fund | | | Large Cap
Growth
Fund | | | Mid Cap
Growth
Fund | |
| Investment income | | | | | | | | | | | | | | |
| Dividends | | $ | 1,192 | | | | $ | 1,084 | | | | $ | 241 | |
| Less foreign tax withheld | | | — | | | | | — | | | | | (1 | ) |
| Interest | | | 5 | | | | | 5 | | | | | 2 | |
| Total income | | | 1,197 | | | | | 1,089 | | | | | 242 | |
| Expenses | | | | | | | | | | | | | | |
| Investment advisory fees | | | 929 | | | | | 684 | | | | | 300 | |
| Distribution fees | | | 50 | | | | | 62 | | | | | 7 | |
| Custodian fees | | | 38 | | | | | 23 | | | | | 20 | |
| Transfer agent fees | | | 30 | | | | | 14 | | | | | 6 | |
| Sub-transfer agent fees | | | | | | | | | | | | | | |
| Class N | | | 24 | | | | | 32 | | | | | 3 | |
| Class I | | | 58 | | | | | 59 | | | | | 36 | |
| Professional fees | | | 25 | | | | | 22 | | | | | 21 | |
| Registration fees | | | 25 | | | | | 21 | | | | | 19 | |
| Shareholder reporting fees | | | 8 | | | | | 7 | | | | | 1 | |
| Trustee fees | | | 12 | | | | | 7 | | | | | 2 | |
| Other expenses | | | 12 | | | | | 11 | | | | | 6 | |
| Total expenses before expense limitation | | | 1,211 | | | | | 942 | | | | | 421 | |
| Expenses waived or reimbursed by the Adviser | | | (8 | ) | | | | (112 | ) | | | | (109 | ) |
| Net expenses | | | 1,203 | | | | | 830 | | | | | 312 | |
| Net investment income (loss) | | | (6 | ) | | | | 259 | | | | | (70 | ) |
| Realized and unrealized gain (loss) | | | | | | | | | | | | | | |
| Net realized gain (loss) on transactions from: | | | | | | | | | | | | | | |
| Investments in securities | | | 14,964 | | | | | 8,820 | | | | | 5,243 | |
| Total net realized gain (loss) | | | 14,964 | | | | | 8,820 | | | | | 5,243 | |
| Change in net unrealized appreciation (depreciation) of: | | | | | | | | | | | | | | |
| Investments in securities | | | 34,949 | | | | | 34,565 | | | | | 10,069 | |
| Change in net unrealized appreciation (depreciation) | | | 34,949 | | | | | 34,565 | | | | | 10,069 | |
| Net increase (decrease) in net assets resulting from operations | | $ | 49,907 | | | | $ | 43,644 | | | | $ | 15,242 | |
See accompanying Notes to Financial Statements.
| 108 | Semiannual Report | June 30, 2019 |
Statements of Changes in Net Assets
For the Period Ended June 30, 2019(unaudited)and the Year Ended December 31, 2018(all amounts in thousands)
| | | Growth Fund | | | Large Cap
Growth Fund | | | Mid Cap
Growth Fund | |
| | | 2019 | | | 2018 | | | 2019 | | | 2018 | | | 2019 | | | 2018 | |
| Operations | | | | | | | | | | | | | | | | | | | | | | | | |
| Net investment income (loss) | | $ | (6 | ) | | $ | (311 | ) | | $ | 259 | | | $ | 86 | | | $ | (70 | ) | | $ | (180 | ) |
| Net realized gain (loss) on investments, and other assets and liabilities | | | 14,964 | | | | 81,637 | | | | 8,820 | | | | 32,604 | | | | 5,243 | | | | 13,079 | |
| Change in net unrealized appreciation (depreciation) on investments, and other assets and liabilities | | | 34,949 | | | | (49,663 | ) | | | 34,565 | | | | (17,587 | ) | | | 10,069 | | | | (12,543 | ) |
| Net increase (decrease) in net assets resulting from operations | | | 49,907 | | | | 31,663 | | | | 43,644 | | | | 15,103 | | | | 15,242 | | | | 356 | |
| Distributions to shareholders from | | | | | | | | | | | | | | | | | | | | | | | | |
| Class N | | | — | | | | (12,048 | ) | | | — | | | | (6,522 | ) | | | — | | | | (982 | ) |
| Class I | | | — | | | | (51,103 | ) | | | — | | | | (20,739 | ) | | | — | | | | (9,097 | ) |
| Class R6 | | | — | | | | — | | | | — | | | | — | | | | — | | | | — | |
| Total distributions | | | — | | | | (63,151 | ) | | | — | | | | (27,261 | ) | | | — | | | | (10,079 | ) |
| Capital stock transactions | | | | | | | | | | | | | | | | | | | | | | | | |
| Proceeds from sale of shares | | | 11,310 | | | | 42,834 | | | | 32,388 | | | | 60,009 | | | | 4,135 | | | | 10,781 | |
| Shares issued in reinvestment of income dividends and capital gain distributions | | | — | | | | 60,277 | | | | — | | | | 23,837 | | | | — | | | | 9,695 | |
| Less cost of shares redeemed | | | (27,109 | ) | | | (199,681 | ) | | | (24,590 | ) | | | (96,291 | ) | | | (6,747 | ) | | | (32,171 | ) |
| Net increase (decrease) in net assets resulting from capital share transactions | | | (15,799 | ) | | | (96,570 | ) | | | 7,798 | | | | (12,445 | ) | | | (2,612 | ) | | | (11,695 | ) |
| Increase (decrease) in net assets | | | 34,108 | | | | (128,058 | ) | | | 51,442 | | | | (24,603 | ) | | | 12,630 | | | | (21,418 | ) |
| Net assets | | | | | | | | | | | | | | | | | | | | | | | | |
| Beginning of period | | | 225,676 | | | | 353,734 | | | | 178,960 | | | | 203,563 | | | | 56,117 | | | | 77,535 | |
| End of period | | $ | 259,784 | | | $ | 225,676 | | | $ | 230,402 | | | $ | 178,960 | | | $ | 68,747 | | | $ | 56,117 | |
See accompanying Notes to Financial Statements.
| June 30, 2019 | William Blair Funds | 109 |
Statements of Assets and Liabilities
As of June 30, 2019(dollar amounts in thousands) (unaudited)
| | | Small-Mid
Cap Growth
Fund | | | Small-Mid
Cap Value
Fund | | | Small Cap
Growth
Fund | | | Small Cap
Value
Fund | |
| Assets | | | | | | | | | | | | | | | | | | |
| Investments in securities, at cost | | | $ | 2,365,016 | | | | $ | 1,514 | | | $ | 590,048 | | | $ | 357,892 | |
| Investments in securities, at value | | | $ | 2,836,275 | | | | $ | 1,717 | | | $ | 705,498 | | | $ | 448,640 | |
| Cash | | | | 67 | | | | | — | | | | — | | | | — | |
| Receivable for securities sold | | | | 12,391 | | | | | 110 | | | | 6,946 | | | | 16,325 | |
| Receivable for fund shares sold | | | | 3,648 | | | | | — | | | | 1,759 | | | | 630 | |
| Receivable from Adviser | | | | 158 | | | | | 10 | | | | 21 | | | | 23 | |
| Dividend and interest receivable | | | | 714 | | | | | 2 | | | | 203 | | | | 468 | |
| Total assets | | | | 2,853,253 | | | | | 1,839 | | | | 714,427 | | | | 466,086 | |
| Liabilities | | | | | | | | | | | | | | | | | | |
| Payable for investment securities purchased | | | | 7,864 | | | | | 48 | | | | 5,069 | | | | 12,494 | |
| Payable for fund shares redeemed | | | | 3,197 | | | | | — | | | | 537 | | | | 130 | |
| Payable to custodian | | | | — | | | | | 22 | | | | 10 | | | | 5 | |
| Management fee payable | | | | 2,282 | | | | | 1 | | | | 625 | | | | 402 | |
| Distribution fee payable | | | | 73 | | | | | — | | | | 40 | | | | 3 | |
| Other payables and accrued expenses | | | | 476 | | | | | 34 | | | | 114 | | | | 115 | |
| Total liabilities | | | | 13,892 | | | | | 105 | | | | 6,395 | | | | 13,149 | |
| Net assets | | | $ | 2,839,361 | | | | $ | 1,734 | | | $ | 708,032 | | | $ | 452,937 | |
| Capital | | | | | | | | | | | | | | | | | | |
| Composition of net assets | | | | | | | | | | | | | | | | | | |
| Paid in capital | | | $ | 2,209,562 | | | | $ | 1,529 | | | $ | 595,418 | | | $ | 349,409 | |
| Total distributable earnings (loss) | | | | 629,799 | | | | | 205 | | | | 112,614 | | | | 103,528 | |
| Net assets | | | $ | 2,839,361 | | | | $ | 1,734 | | | $ | 708,032 | | | $ | 452,937 | |
| | | | | | | | | | | | | | | | | | | |
| Class N shares | | | | | | | | | | | | | | | | | | |
| Net assets | | | $ | 357,654 | | | | $ | 237 | | | $ | 198,064 | | | $ | 16,055 | |
| Shares outstanding | | | | 13,726,766 | | | | | 21,841 | | | | 7,165,444 | | | | 918,192 | |
| Net asset value per share | | | $ | 26.06 | | | | $ | 10.85 | | | $ | 27.64 | | | $ | 17.48 | |
| Class I shares | | | | | | | | | | | | | | | | | | |
| Net assets | | | $ | 2,469,870 | | | | $ | 1,487 | | | $ | 491,045 | | | $ | 436,832 | |
| Shares outstanding | | | | 89,725,644 | | | | | 138,001 | | | | 15,862,359 | | | | 24,208,335 | |
| Net asset value per share | | | $ | 27.53 | | | | $ | 10.78 | | | $ | 30.96 | | | $ | 18.04 | |
| Class R6 shares | | | | | | | | | | | | | | | | | | |
| Net assets | | | $ | 11,837 | | | | $ | 10 | | | $ | 18,923 | | | $ | 50 | |
| Shares outstanding | | | | 429,867 | | | | | 915 | | | | 611,182 | | | | 2,749 | |
| Net asset value per share | | | $ | 27.54 | | | | $ | 10.79 | | | $ | 30.96 | | | $ | 18.05 | |
See accompanying Notes to Financial Statements.
| 110 | Semiannual Report | June 30, 2019 |
Statements of Operations
For the Period Ended June 30, 2019(all amounts in thousands) (unaudited)
| | | Small-Mid
Cap Growth
Fund | | | Small-Mid
Cap Value
Fund | | | Small Cap
Growth
Fund | | | Small Cap
Value
Fund | |
| Investment income | | | | | | | | | | | | | | | | | | | | |
| Dividends | | | $ | 8,066 | | | | $ | 19 | | | | $ | 2,067 | | | | $ | 4,823 | |
| Less foreign tax withheld | | | | (60 | ) | | | | — | | | | | (36 | ) | | | | — | |
| Interest | | | | 169 | | | | | — | | | | | 50 | | | | | 32 | |
| Total income | | | | 8,175 | | | | | 19 | | | | | 2,081 | | | | | 4,855 | |
| Expenses | | | | | | | | | | | | | | | | | | | | |
| Investment advisory fees | | | | 13,396 | | | | | 9 | | | | | 3,768 | | | | | 2,737 | |
| Distribution fees | | | | 467 | | | | | — | | | | | 247 | | | | | 21 | |
| Custodian fees | | | | 27 | | | | | 27 | | | | | 28 | | | | | 26 | |
| Transfer agent fees | | | | 122 | | | | | — | | | | | 39 | | | | | 25 | |
| Sub-transfer agent fees | | | | | | | | | | | | | | | | | | | | |
| Class N | | | | 269 | | | | | — | | | | | 128 | | | | | 13 | |
| Class I | | | | 1,224 | | | | | — | | | | | 221 | | | | | 349 | |
| Professional fees | | | | 106 | | | | | 16 | | | | | 38 | | | | | 34 | |
| Registration fees | | | | 58 | | | | | 35 | | | | | 38 | | | | | 23 | |
| Shareholder reporting fees | | | | 140 | | | | | — | | | | | 33 | | | | | 15 | |
| Trustee fees | | | | 85 | | | | | — | | | | | 22 | | | | | 22 | |
| Other expenses | | | | 95 | | | | | 4 | | | | | 27 | | | | | 23 | |
| Total expenses before expense limitation | | | | 15,989 | | | | | 91 | | | | | 4,589 | | | | | 3,288 | |
| Expenses waived or reimbursed by the Adviser | | | | (787 | ) | | | | (83 | ) | | | | (59 | ) | | | | (157 | ) |
| Net expenses | | | | 15,202 | | | | | 8 | | | | | 4,530 | | | | | 3,131 | |
| Net investment income (loss) | | | | (7,027 | ) | | | | 11 | | | | | (2,449 | ) | | | | 1,724 | |
| Realized and unrealized gain (loss) | | | | | | | | | | | | | | | | | | | | |
| Net realized gain (loss) on transactions from: | | | | | | | | | | | | | | | | | | | | |
| Investments in securities | | | | 123,591 | | | | | 50 | | | | | 167 | | | | | 12,260 | |
| Redemptions in-kind | | | | 40,038 | | | | | — | | | | | — | | | | | — | |
| Total net realized gain (loss) | | | | 163,629 | | | | | 50 | | | | | 167 | | | | | 12,260 | |
| Change in net unrealized appreciation (depreciation) of: | | | | | | | | | | | | | | | | | | | | |
| Investments in securities | | | | 418,478 | | | | | 221 | | | | | 115,901 | | | | | 63,618 | |
| Change in net unrealized appreciation (depreciation) | | | | 418,478 | | | | | 221 | | | | | 115,901 | | | | | 63,618 | |
| Net increase (decrease) in net assets resulting from operations | | | $ | 575,080 | | | | $ | 282 | | | | $ | 113,619 | | | | $ | 77,602 | |
See accompanying Notes to Financial Statements.
| June 30, 2019 | William Blair Funds | 111 |
Statements of Changes in Net Assets
For the Period Ended June 30, 2019(unaudited)and the Year Ended December 31, 2018(all amounts in thousands)
| | | Small-Mid
Cap Growth Fund | | | Small-Mid
Cap Value Fund | | | Small Cap
Growth Fund | | | Small Cap
Value Fund | |
| | | 2019 | | | 2018 | | | 2019 | | | 2018 | | | 2019 | | | 2018 | | | 2019 | | | 2018 | |
| Operations | | | | | | | | | | | | | | | | | | | | | | | | | | | | | | | | | | |
| Net investment income (loss) | | $ | (7,027 | ) | | $ | (12,353 | ) | | | $ | 11 | | | | $ | 18 | | | $ | (2,449 | ) | | $ | (4,419 | ) | | $ | 1,724 | | | $ | 2,500 | |
| Net realized gain (loss) on investments, and other assets and liabilities | | | 163,629 | | | | 188,474 | | | | | 50 | | | | | 479 | | | | 167 | | | | 81,093 | | | | 12,260 | | | | 61,842 | |
| Change in net unrealized appreciation (depreciation) on investments, and other assets and liabilities | | | 418,478 | | | | (287,618 | ) | | | | 221 | | | | | (852 | ) | | | 115,901 | | | | (111,007 | ) | | | 63,618 | | | | (157,546 | ) |
| Net increase (decrease) in net assets resulting from operations | | | 575,080 | | | | (111,497 | ) | | | | 282 | | | | | (355 | ) | | | 113,619 | | | | (34,333 | ) | | | 77,602 | | | | (93,204 | ) |
| Distributions to shareholders from | | | | | | | | | | | | | | | | | | | | | | | | | | | | | | | | | | |
| Class N | | | — | | | | (37,426 | ) | | | | — | | | | | (59 | ) | | | — | | | | (23,655 | ) | | | — | | | | (2,248 | ) |
| Class I | | | — | | | | (160,129 | ) | | | | — | | | | | (381 | ) | | | — | | | | (47,224 | ) | | | — | | | | (57,005 | ) |
| Class R6 | | | — | | | | — | | | | | — | | | | | — | | | | — | | | | — | | | | — | | | | — | |
| Total distributions | | | — | | | | (197,555 | ) | | | | — | | | | | (440 | ) | | | — | | | | (70,879 | ) | | | — | | | | (59,253 | ) |
| Capital stock transactions | | | | | | | | | | | | | | | | | | | | | | | | | | | | | | | | | | |
| Proceeds from sale of shares | | | 497,946 | | | | 1,291,881 | | | | | 469 | | | | | 488 | | | | 151,027 | | | | 326,138 | | | | 29,774 | | | | 71,840 | |
| Shares issued in reinvestment of income dividends and capital gain distributions | | | — | | | | 193,965 | | | | | — | | | | | 439 | | | | — | | | | 70,242 | | | | — | | | | 58,395 | |
| Less cost of shares redeemed | | | (637,635 | ) | | | (577,832 | ) | | | | (696 | ) | | | | (2,096 | ) | | | (135,921 | ) | | | (201,271 | ) | | | (145,954 | ) | | | (160,283 | ) |
| Net increase (decrease) in net assets resulting from capital share transactions | | | (139,689 | ) | | | 908,014 | | | | | (227 | ) | | | | (1,169 | ) | | | 15,106 | | | | 195,109 | | | | (116,180 | ) | | | (30,048 | ) |
| Increase (decrease) in net assets | | | 435,391 | | | | 598,962 | | | | | 55 | | | | | (1,964 | ) | | | 128,725 | | | | 89,897 | | | | (38,578 | ) | | | (182,505 | ) |
| Net assets | | | | | | | | | | | | | | | | | | | | | | | | | | | | | | | | | | |
| Beginning of period | | | 2,403,970 | | | | 1,805,008 | | | | | 1,679 | | | | | 3,643 | | | | 579,307 | | | | 489,410 | | | | 491,515 | | | | 674,020 | |
| End of period | | $ | 2,839,361 | | | $ | 2,403,970 | | | | $ | 1,734 | | | | $ | 1,679 | | | $ | 708,032 | | | $ | 579,307 | | | $ | 452,937 | | | $ | 491,515 | |
See accompanying Notes to Financial Statements.
| 112 | Semiannual Report | June 30, 2019 |
Statements of Assets and Liabilities
As of June 30, 2019(dollar amounts in thousands) (unaudited)
| | | Global
Leaders
Fund | | | International
Leaders
Fund | | | International
Developed
Plus Fund
(In Liquidation) | | | Institutional
International
Developed
Plus Fund
(In Liquidation) | |
| Assets | | | | | | | | | | | | | | | | | | | |
| Investments in securities, at cost | | $ | 156,950 | | | | $ | 445,614 | | | | $ | 20,229 | | | | $ | 16,561 | |
| Investments in securities, at value | | $ | 211,846 | | | | $ | 546,722 | | | | $ | 24,248 | | | | $ | 20,513 | |
| Cash | | | 4 | | | | | — | | | | | 23 | | | | | — | |
| Foreign currency, at value (cost $31; $94; $14; $3) | | | 31 | | | | | 94 | | | | | 14 | | | | | 3 | |
| Receivable for securities sold | | | 58 | | | | | — | | | | | — | | | | | — | |
| Receivable for fund shares sold | | | 15 | | | | | 683 | | | | | — | | | | | — | |
| Receivable from Adviser | | | 19 | | | | | 32 | | | | | 12 | | | | | 4 | |
| Dividend and interest receivable | | | 451 | | | | | 1,488 | | | | | 201 | | | | | 68 | |
| Total assets | | | 212,424 | | | | | 549,019 | | | | | 24,498 | | | | | 20,588 | |
| Liabilities | | | | | | | | | | | | | | | | | | | |
| Payable for investment securities purchased | | | 2,901 | | | | | 2,664 | | | | | — | | | | | — | |
| Payable for fund shares redeemed | | | — | | | | | 77 | | | | | 8,416 | | | | | — | |
| Payable to custodian | | | — | | | | | 3 | | | | | — | | | | | — | |
| Management fee payable | | | 143 | | | | | 367 | | | | | 21 | | | | | 15 | |
| Distribution fee payable | | | 2 | | | | | 2 | | | | | — | | | | | — | |
| Foreign capital gains tax liability | | | — | | | | | 130 | | | | | — | | | | | — | |
| Other payables and accrued expenses | | | 92 | | | | | 156 | | | | | 50 | | | | | 44 | |
| Total liabilities | | | 3,138 | | | | | 3,399 | | | | | 8,487 | | | | | 59 | |
| Net assets | | $ | 209,286 | | | | $ | 545,620 | | | | $ | 16,011 | | | | $ | 20,529 | |
| Capital | | | | | | | | | | | | | | | | | | | |
| Composition of net assets | | | | | | | | | | | | | | | | | | | |
| Paid in capital | | $ | 153,312 | | | | $ | 446,223 | | | | $ | (1,470 | ) | | | $ | 16,672 | |
| Total distributable earnings (loss) | | | 55,974 | | | | | 99,397 | | | | | 17,481 | | | | | 3,857 | |
| Net assets | | $ | 209,286 | | | | $ | 545,620 | | | | $ | 16,011 | | | | $ | 20,529 | |
| | | | | | | | | | | | | | | | | | | | |
| Class N shares | | | | | | | | | | | | | | | | | | | |
| Net assets | | $ | 8,263 | | | | $ | 10,341 | | | | $ | 1,963 | | | | $ | — | |
| Shares outstanding | | | 596,915 | | | | | 621,454 | | | | | 119,643 | | | | | — | |
| Net asset value per share | | $ | 13.84 | | | | $ | 16.64 | | | | $ | 16.41 | | | | $ | — | |
| Class I shares | | | | | | | | | | | | | | | | | | | |
| Net assets | | $ | 103,148 | | | | $ | 126,671 | | | | $ | 14,048 | | | | $ | — | |
| Shares outstanding | | | 7,438,720 | | | | | 7,585,393 | | | | | 848,829 | | | | | — | |
| Net asset value per share | | $ | 13.87 | | | | $ | 16.70 | | | | $ | 16.55 | | | | $ | — | |
| Institutional/Class R6 shares | | | | | | | | | | | | | | | | | | | |
| Net assets | | $ | 97,875 | | | | $ | 408,608 | | | | $ | — | | | | $ | 20,529 | |
| Shares outstanding | | | 7,054,845 | | | | | 24,470,592 | | | | | — | | | | | 1,425,129 | |
| Net asset value per share | | $ | 13.87 | | | | $ | 16.70 | | | | $ | — | | | | $ | 14.41 | |
See accompanying Notes to Financial Statements.
| June 30, 2019 | William Blair Funds | 113 |
Statements of Operations
For the Period Ended June 30, 2019(all amounts in thousands) (unaudited)
| | | Global
Leaders
Fund | | | International
Leaders
Fund | | | International
Developed
Plus Fund
(In Liquidation) | | | Institutional
International
Developed
Plus Fund
(In Liquidation) | |
| Investment income | | | | | | | | | | | | | | | | | | | |
| Dividends | | $ | 1,762 | | | | $ | 6,597 | | | | $ | 798 | | | | $ | 253 | |
| Less foreign tax withheld | | | (102 | ) | | | | (572 | ) | | | | (65 | ) | | | | (26 | ) |
| Interest | | | 9 | | | | | 33 | | | | | 9 | | | | | 3 | |
| Total income | | | 1,669 | | | | | 6,058 | | | | | 742 | | | | | 230 | |
| Expenses | | | | | | | | | | | | | | | | | | | |
| Investment advisory fees | | | 894 | | | | | 2,122 | | | | | 296 | | | | | 84 | |
| Distribution fees | | | 10 | | | | | 12 | | | | | 2 | | | | | — | |
| Custodian fees | | | 35 | | | | | 46 | | | | | 30 | | | | | 24 | |
| Transfer agent fees | | | 6 | | | | | 9 | | | | | 2 | | | | | — | |
| Sub-transfer agent fees | | | | | | | | | | | | | | | | | | | |
| Class N | | | 5 | | | | | 7 | | | | | 1 | | | | | — | |
| Class I | | | 30 | | | | | 35 | | | | | 45 | | | | | — | |
| Professional fees | | | 31 | | | | | 43 | | | | | 22 | | | | | 19 | |
| Registration fees | | | 25 | | | | | 31 | | | | | 16 | | | | | 10 | |
| Shareholder reporting fees | | | 2 | | | | | 5 | | | | | 1 | | | | | — | |
| Trustee fees | | | 7 | | | | | 15 | | | | | 4 | | | | | 1 | |
| Other expenses | | | 12 | | | | | 21 | | | | | 6 | | | | | 2 | |
| Total expenses before expense limitation | | | 1,057 | | | | | 2,346 | | | | | 425 | | | | | 140 | |
| Expenses waived or reimbursed by the Adviser | | | (94 | ) | | | | (108 | ) | | | | (94 | ) | | | | (56 | ) |
| Net expenses | | | 963 | | | | | 2,238 | | | | | 331 | | | | | 84 | |
| Net investment income (loss) | | | 706 | | | | | 3,820 | | | | | 411 | | | | | 146 | |
| Realized and unrealized gain (loss) | | | | | | | | | | | | | | | | | | | |
| Net realized gain (loss) on transactions from: | | | | | | | | | | | | | | | | | | | |
| Investments in securities, net of foreign taxes, if applicable | | | 1,374 | | | | | (1,450 | ) | | | | 14,102 | | | | | 2 | |
| Foreign currency transactions | | | (2 | ) | | | | (30 | ) | | | | (15 | ) | | | | — | |
| Total net realized gain (loss) | | | 1,372 | | | | | (1,480 | ) | | | | 14,087 | | | | | 2 | |
| Change in net unrealized appreciation (depreciation) of: | | | | | | | | | | | | | | | | | | | |
| Investments in securities | | | 33,907 | | | | | 86,081 | | | | | 296 | | | | | 3,225 | |
| Foreign currency translations | | | 1 | | | | | (105 | ) | | | | 3 | | | | | 1 | |
| Change in net unrealized appreciation (depreciation) | | | 33,908 | | | | | 85,976 | | | | | 299 | | | | | 3,226 | |
| Net increase (decrease) in net assets resulting from operations | | $ | 35,986 | | | | $ | 88,316 | | | | $ | 14,797 | | | | $ | 3,374 | |
See accompanying Notes to Financial Statements.
| 114 | Semiannual Report | June 30, 2019 |
Statements of Changes in Net Assets
For the Period Ended June 30, 2019(unaudited)and the Year Ended December 31, 2018(all amounts in thousands)
| | | Global
Leaders Fund | | | International
Leaders Fund | | | International
Developed
Plus Fund
(In Liquidation) | | | Institutional
International
Developed
Plus Fund
(In Liquidation) | |
| | | 2019 | | | 2018 | | | 2019 | | | 2018 | | | 2019 | | | 2018 | | | 2019 | | | 2018 | |
| Operations | | | | | | | | | | | | | | | | | | | | | | | | | | | | | | | | | | |
| Net investment income (loss) | | $ | 706 | | | $ | 813 | | | $ | 3,820 | | | $ | 4,623 | | | $ | 411 | | | $ | 1,273 | | | | $ | 146 | | | | $ | 233 | |
| Net realized gain (loss) on investments, and other assets and liabilities | | | 1,372 | | | | 28,281 | | | | (1,480 | ) | | | 6,745 | | | | 14,087 | | | | 405 | | | | | 2 | | | | | 405 | |
| Change in net unrealized appreciation (depreciation) on investments, and other assets and liabilities | | | 33,908 | | | | (39,539 | ) | | | 85,976 | | | | (70,725 | ) | | | 299 | | | | (19,925 | ) | | | | 3,226 | | | | | (3,523 | ) |
| Net increase (decrease) in net assets resulting from operations | | | 35,986 | | | | (10,445 | ) | | | 88,316 | | | | (59,357 | ) | | | 14,797 | | | | (18,247 | ) | | | | 3,374 | | | | | (2,885 | ) |
| Distributions to shareholders from | | | | | | | | | | | | | | | | | | | | | | | | | | | | | | | | | | |
| Class N | | | — | | | | (1,089 | ) | | | — | | | | (312 | ) | | | — | | | | (37 | ) | | | | — | | | | | — | |
| Class I | | | — | | | | (13,017 | ) | | | — | | | | (3,051 | ) | | | — | | | | (2,203 | ) | | | | — | | | | | — | |
| Institutional/Class R6 | | | — | | | | (12,002 | ) | | | — | | | | (13,274 | ) | | | — | | | | — | | | | | — | | | | | (554 | ) |
| Total distributions | | | — | | | | (26,108 | ) | | | — | | | | (16,637 | ) | | | — | | | | (2,240 | ) | | | | — | | | | | (554 | ) |
| Capital stock transactions | | | | | | | | | | | | | | | | | | | | | | | | | | | | | | | | | | |
| Proceeds from sale of shares | | | 7,933 | | | | 46,840 | | | | 68,495 | | | | 153,690 | | | | 50 | | | | 799 | | | | | 2,000 | | | | | — | |
| Shares issued in reinvestment of income dividends and capital gain distributions | | | — | | | | 25,924 | | | | — | | | | 15,804 | | | | — | | | | 2,156 | | | | | — | | | | | 554 | |
| Less cost of shares redeemed | | | (5,333 | ) | | | (76,860 | ) | | | (21,190 | ) | | | (62,329 | ) | | | (87,417 | ) | | | (14,626 | ) | | | | (1,000 | ) | | | | (50 | ) |
| Net increase (decrease) in net assets resulting from capital share transactions | | | 2,600 | | | | (4,096 | ) | | | 47,305 | | | | 107,165 | | | | (87,367 | ) | | | (11,671 | ) | | | | 1,000 | | | | | 504 | |
| Increase (decrease) in net assets | | | 38,586 | | | | (40,649 | ) | | | 135,621 | | | | 31,171 | | | | (72,570 | ) | | | (32,158 | ) | | | | 4,374 | | | | | (2,935 | ) |
| Net assets | | | | | | | | | | | | | | | | | | | | | | | | | | | | | | | | | | |
| Beginning of period | | | 170,700 | | | | 211,349 | | | | 409,999 | | | | 378,828 | | | | 88,581 | | | | 120,739 | | | | | 16,155 | | | | | 19,090 | |
| End of period | | $ | 209,286 | | | $ | 170,700 | | | $ | 545,620 | | | $ | 409,999 | | | $ | 16,011 | | | $ | 88,581 | | | | $ | 20,529 | | | | $ | 16,155 | |
See accompanying Notes to Financial Statements.
| June 30, 2019 | William Blair Funds | 115 |
Statements of Assets and Liabilities
As of June 30, 2019(dollar amounts in thousands) (unaudited)
| | | International
Growth
Fund | | | Institutional
International
Growth
Fund | | | International
Small Cap
Growth
Fund | |
| Assets | | | | | | | | | | | | | | |
| Investments in securities, at cost | | | $ | 1,748,098 | | | $ | 1,469,372 | | | | $ | 273,165 | |
| Investments in securities, at value | | | $ | 2,138,542 | | | $ | 1,788,374 | | | | $ | 308,843 | |
| Foreign currency, at value (cost $1,621; $1,376; $102) | | | | 1,621 | | | | 1,376 | | | | | 102 | |
| Receivable for securities sold | | | | 32,109 | | | | 8,828 | | | | | — | |
| Receivable for fund shares sold | | | | 563 | | | | 173 | | | | | 1,120 | |
| Receivable from Adviser | | | | 2 | | | | — | | | | | — | |
| Dividend and interest receivable | | | | 7,711 | | | | 5,841 | | | | | 965 | |
| Total assets | | | | 2,180,548 | | | | 1,804,592 | | | | | 311,030 | |
| Liabilities | | | | | | | | | | | | | | |
| Payable for investment securities purchased | | | | 6,494 | | | | 5,355 | | | | | 2,005 | |
| Payable for fund shares redeemed | | | | 6,425 | | | | 135 | | | | | 115 | |
| Payable to custodian | | | | 16 | | | | 7 | | | | | 2 | |
| Management fee payable | | | | 1,770 | | | | 1,360 | | | | | 257 | |
| Distribution fee payable | | | | 101 | | | | — | | | | | 1 | |
| Other payables and accrued expenses | | | | 826 | | | | 418 | | | | | 196 | |
| Total liabilities | | | | 15,632 | | | | 7,275 | | | | | 2,576 | |
| Net assets | | | $ | 2,164,916 | | | $ | 1,797,317 | | | | $ | 308,454 | |
| Capital | | | | | | | | | | | | | | |
| Composition of net assets | | | | | | | | | | | | | | |
| Paid in capital | | | $ | 1,794,573 | | | $ | 1,513,110 | | | | $ | 302,294 | |
| Total distributable earnings (loss) | | | | 370,343 | | | | 284,207 | | | | | 6,160 | |
| Net assets | | | $ | 2,164,916 | | | $ | 1,797,317 | | | | $ | 308,454 | |
| | | | | | | | | | | | | | | |
| Class N shares | | | | | | | | | | | | | | |
| Net assets | | | $ | 502,011 | | | | — | | | | $ | 3,534 | |
| Shares outstanding | | | | 18,267,928 | | | | — | | | | | 287,365 | |
| Net asset value per share | | | $ | 27.48 | | | | — | | | | $ | 12.30 | |
| Class I shares | | | | | | | | | | | | | | |
| Net assets | | | $ | 1,662,854 | | | | — | | | | $ | 158,003 | |
| Shares outstanding | | | | 59,093,578 | | | | — | | | | | 12,714,685 | |
| Net asset value per share | | | $ | 28.14 | | | | — | | | | $ | 12.43 | |
| Institutional/Class R6 shares | | | | | | | | | | | | | | |
| Net assets | | | $ | 51 | | | $ | 1,797,317 | | | | $ | 146,917 | |
| Shares outstanding | | | | 1,814 | | | | 112,302,798 | | | | | 11,758,084 | |
| Net asset value per share | | | $ | 28.14 | | | $ | 16.00 | | | | $ | 12.49 | |
See accompanying Notes to Financial Statements.
| 116 | Semiannual Report | June 30, 2019 |
Statements of Operations
For the Period Ended June 30, 2019(all amounts in thousands) (unaudited)
| | | International
Growth
Fund | | | Institutional
International
Growth
Fund | | | International
Small Cap
Growth
Fund | |
| Investment income | | | | | | | | | | | | | | | |
| Dividends | | | $ | 30,305 | | | | $ | 26,123 | | | | $ | 4,863 | |
| Less foreign tax withheld | | | | (2,560 | ) | | | | (2,219 | ) | | | | (447 | ) |
| Interest | | | | 44 | | | | | 57 | | | | | 26 | |
| Total income | | | | 27,789 | | | | | 23,961 | | | | | 4,442 | |
| Expenses | | | | | | | | | | | | | | | |
| Investment advisory fees | | | | 10,797 | | | | | 8,649 | | | | | 1,686 | |
| Distribution fees | | | | 610 | | | | | — | | | | | 4 | |
| Custodian fees | | | | 132 | | | | | 105 | | | | | 68 | |
| Transfer agent fees | | | | 87 | | | | | 39 | | | | | 14 | |
| Sub-transfer agent fees | | | | | | | | | | | | | | | |
| Class N | | | | 354 | | | | | — | | | | | 2 | |
| Class I | | | | 648 | | | | | — | | | | | 91 | |
| Professional fees | | | | 122 | | | | | 110 | | | | | 50 | |
| Registration fees | | | | 28 | | | | | 14 | | | | | 27 | |
| Shareholder reporting fees | | | | 88 | | | | | 6 | | | | | 19 | |
| Trustee fees | | | | 100 | | | | | 76 | | | | | 19 | |
| Other expenses | | | | 85 | | | | | 66 | | | | | 21 | |
| Total expenses before expense limitation | | | | 13,051 | | | | | 9,065 | | | | | 2,001 | |
| Expenses waived or reimbursed by the Adviser | | | | (41 | ) | | | | — | | | | | — | |
| Net expenses | | | | 13,010 | | | | | 9,065 | | | | | 2,001 | |
| Net investment income (loss) | | | | 14,779 | | | | | 14,896 | | | | | 2,441 | |
| Realized and unrealized gain (loss) | | | | | | | | | | | | | | | |
| Net realized gain (loss) on transactions from: | | | | | | | | | | | | | | | |
| Investments in securities, net of foreign taxes, if applicable | | | | 238 | | | | | (14,269 | ) | | | | (10,667 | ) |
| Redemptions in-kind | | | | — | | | | | 7,223 | | | | | — | |
| Foreign currency transactions | | | | (836 | ) | | | | (421 | ) | | | | (48 | ) |
| Total net realized gain (loss) | | | | (598 | ) | | | | (7,467 | ) | | | | (10,715 | ) |
| Change in net unrealized appreciation (depreciation) of: | | | | | | | | | | | | | | | |
| Investments in securities | | | | 376,087 | | | | | 319,149 | | | | | 67,523 | |
| Foreign currency translations | | | | 34 | | | | | 12 | | | | | 8 | |
| Change in net unrealized appreciation (depreciation) | | | | 376,121 | | | | | 319,161 | | | | | 67,531 | |
| Net increase (decrease) in net assets resulting from operations | | | $ | 390,302 | | | | $ | 326,590 | | | | $ | 59,257 | |
See accompanying Notes to Financial Statements.
| June 30, 2019 | William Blair Funds | 117 |
Statements of Changes in Net Assets
For the Period Ended June 30, 2019(unaudited)and the Year Ended December 31, 2018(all amounts in thousands)
| | | International
Growth Fund | | | Institutional
International
Growth Fund | | | International
Small Cap
Growth Fund | |
| | | 2019 | | | 2018 | | | 2019 | | | 2018 | | | 2019 | | | 2018 | |
| Operations | | | | | | | | | | | | | | | | | | | | | | | | |
| Net investment income (loss) | | $ | 14,779 | | | $ | 22,467 | | | $ | 14,896 | | | $ | 21,963 | | | $ | 2,441 | | | $ | 3,491 | |
| Net realized gain (loss) on investments, and other assets and liabilities | | | (598 | ) | | | 132,672 | | | | (7,467 | ) | | | 98,966 | | | | (10,715 | ) | | | 16,217 | |
| Change in net unrealized appreciation (depreciation) on investments, and other assets and liabilities | | | 376,121 | | | | (661,540 | ) | | | 319,161 | | | | (496,584 | ) | | | 67,531 | | | | (159,626 | ) |
| Net increase (decrease) in net assets resulting from operations | | | 390,302 | | | | (506,401 | ) | | | 326,590 | | | | (375,655 | ) | | | 59,257 | | | | (139,918 | ) |
| Distributions to shareholders from | | | | | | | | | | | | | | | | | | | | | | | | |
| Class N | | | — | | | | (39,208 | ) | | | — | | | | — | | | | — | | | | (462 | ) |
| Class I | | | — | | | | (145,771 | ) | | | — | | | | — | | | | — | | | | (25,473 | ) |
| Institutional/Class R6 | | | — | | | | — | | | | — | | | | (186,678 | ) | | | — | | | | (21,100 | ) |
| Total distributions | | | — | | | | (184,979 | ) | | | — | | | | (186,678 | ) | | | — | | | | (47,035 | ) |
| Capital stock transactions | | | | | | | | | | | | | | | | | | | | | | | | |
| Proceeds from sale of shares | | | 191,097 | | | | 309,595 | | | | 91,490 | | | | 268,610 | | | | 31,067 | | | | 95,395 | |
| Shares issued in reinvestment of income dividends and capital gain distributions | | | — | | | | 172,803 | | | | — | | | | 180,253 | | | | — | | | | 40,939 | |
| Less cost of shares redeemed | | | (519,827 | ) | | | (826,740 | ) | | | (405,198 | ) | | | (432,394 | ) | | | (122,594 | ) | | | (210,410 | ) |
| Net increase (decrease) in net assets resulting from capital share transactions | | | (328,730 | ) | | | (344,342 | ) | | | (313,708 | ) | | | 16,469 | | | | (91,527 | ) | | | (74,076 | ) |
| Increase (decrease) in net assets | | | 61,572 | | | | (1,035,722 | ) | | | 12,882 | | | | (545,864 | ) | | | (32,270 | ) | | | (261,029 | ) |
| Net assets | | | | | | | | | | | | | | | | | | | | | | | | |
| Beginning of period | | | 2,103,344 | | | | 3,139,066 | | | | 1,784,435 | | | | 2,330,299 | | | | 340,724 | | | | 601,753 | |
| End of period | | $ | 2,164,916 | | | $ | 2,103,344 | | | $ | 1,797,317 | | | $ | 1,784,435 | | | $ | 308,454 | | | $ | 340,724 | |
See accompanying Notes to Financial Statements.
| 118 | Semiannual Report | June 30, 2019 |
Statements of Assets and Liabilities
As of June 30, 2019(dollar amounts in thousands) (unaudited)
| | | Emerging
Markets
Leaders
Fund | | | Emerging
Markets
Growth
Fund | | | Emerging
Markets
Small Cap
Growth Fund | |
| Assets | | | | | | | | | | | | | |
| Investments in securities, at cost | | $ | 192,402 | | | $ | 656,133 | | | | $ | 238,283 | |
| Investments in securities, at value | | $ | 223,414 | | | $ | 801,627 | | | | $ | 277,149 | |
| Foreign currency, at value (cost $325; $2,003; $798) | | | 326 | | | | 2,003 | | | | | 798 | |
| Receivable for securities sold | | | — | | | | 17,075 | | | | | 4,360 | |
| Receivable for fund shares sold | | | 592 | | | | 166 | | | | | 217 | |
| Receivable from Adviser | | | 23 | | | | — | | | | | 10 | |
| Dividend and interest receivable | | | 733 | | | | 3,092 | | | | | 1,363 | |
| Total assets | | | 225,088 | | | | 823,963 | | | | | 283,897 | |
| Liabilities | | | | | | | | | | | | | |
| Payable for investment securities purchased | | | — | | | | 4,449 | | | | | 1,109 | |
| Payable for fund shares redeemed | | | — | | | | 13,369 | | | | | 56 | |
| Payable to custodian | | | 1 | | | | 4 | | | | | 6 | |
| Management fee payable | | | 196 | | | | 728 | | | | | 250 | |
| Distribution fee payable | | | — | | | | 2 | | | | | 1 | |
| Foreign capital gains tax liability | | | 626 | | | | 2,528 | | | | | 2 | |
| Other payables and accrued expenses | | | 202 | | | | 553 | | | | | 481 | |
| Total liabilities | | | 1,025 | | | | 21,633 | | | | | 1,905 | |
| Net assets | | $ | 224,063 | | | $ | 802,330 | | | | $ | 281,992 | |
| Capital | | | | | | | | | | | | | |
| Composition of net assets | | | | | | | | | | | | | |
| Paid in capital | | $ | 197,508 | | | $ | 668,599 | | | | $ | 296,327 | |
| Total distributable earnings (loss) | | | 26,555 | | | | 133,731 | | | | | (14,335 | ) |
| Net assets | | $ | 224,063 | | | $ | 802,330 | | | | $ | 281,992 | |
| Class N shares | | | | | | | | | | | | | |
| Net assets | | $ | 2,260 | | | $ | 7,833 | | | | $ | 5,816 | |
| Shares outstanding | | | 234,405 | | | | 607,294 | | | | | 382,521 | |
| Net asset value per share | | $ | 9.64 | | | $ | 12.90 | | | | $ | 15.20 | |
| Class I shares | | | | | | | | | | | | | |
| Net assets | | $ | 43,233 | | | $ | 74,224 | | | | $ | 155,857 | |
| Shares outstanding | | | 4,472,033 | | | | 5,692,732 | | | | | 10,184,514 | |
| Net asset value per share | | $ | 9.67 | | | $ | 13.04 | | | | $ | 15.30 | |
| Class R6 shares | | | | | | | | | | | | | |
| Net assets | | $ | 178,570 | | | $ | 720,273 | | | | $ | 120,319 | |
| Shares outstanding | | | 18,491,174 | | | | 54,754,239 | | | | | 7,847,524 | |
| Net asset value per share | | $ | 9.66 | | | $ | 13.16 | | | | $ | 15.33 | |
See accompanying Notes to Financial Statements.
| June 30, 2019 | William Blair Funds | 119 |
Statements of Operations
For the Period Ended June 30, 2019(all amounts in thousands) (unaudited)
| | | Emerging
Markets
Leaders
Fund | | | Emerging
Markets
Growth
Fund | | Emerging
Markets
Small Cap
Growth
Fund | |
| Investment income | | | | | | | | | | | | | | |
| Dividends | | | $ | 2,622 | | | | $ | 10,562 | | | $ | 2,259 | |
| Less foreign tax withheld | | | | (254 | ) | | | | (838 | ) | | | (196 | ) |
| Interest | | | | 25 | | | | | 25 | | | | 7 | |
| Total income | | | | 2,393 | | | | | 9,749 | | | | 2,070 | |
| Expenses | | | | | | | | | | | | | | |
| Investment advisory fees | | | | 1,170 | | | | | 4,438 | | | | 1,592 | |
| Distribution fees | | | | 3 | | | | | 9 | | | | 8 | |
| Custodian fees | | | | 43 | | | | | 162 | | | | 161 | |
| Transfer agent fees | | | | 6 | | | | | 20 | | | | 35 | |
| Sub-transfer agent fees | | | | | | | | | | | | | | |
| Class N | | | | 1 | | | | | 3 | | | | 5 | |
| Class I | | | | 12 | | | | | 31 | | | | 69 | |
| Professional fees | | | | 45 | | | | | 82 | | | | 112 | |
| Registration fees | | | | 25 | | | | | 32 | | | | 33 | |
| Shareholder reporting fees | | | | 5 | | | | | 3 | | | | 24 | |
| Trustee fees | | | | 13 | | | | | 37 | | | | 15 | |
| Other expenses | | | | 13 | | | | | 31 | | | | 18 | |
| Total expenses before expense limitation | | | | 1,336 | | | | | 4,848 | | | | 2,072 | |
| Expenses waived or reimbursed by the Adviser | | | | (51 | ) | | | | — | | | | (210 | ) |
| Net expenses | | | | 1,285 | | | | | 4,848 | | | | 1,862 | |
| Net investment income (loss) | | | | 1,108 | | | | | 4,901 | | | | 208 | |
| Realized and unrealized gain (loss) | | | | | | | | | | | | | | |
| Net realized gain (loss) on transactions from: | | | | | | | | | | | | | | |
| Investments in securities, net of foreign taxes, if applicable | | | | 269 | | | | | 2,583 | | | | (4,504 | ) |
| Foreign currency transactions | | | | (48 | ) | | | | (438 | ) | | | (403 | ) |
| Total net realized gain (loss) | | | | 221 | | | | | 2,145 | | | | (4,907 | ) |
| Change in net unrealized appreciation (depreciation) of: | | | | | | | | | | | | | | |
| Investments in securities | | | | 32,556 | | | | | 111,999 | | | | 29,568 | |
| Foreign currency translations | | | | (594 | ) | | | | (2,486 | ) | | | (6 | ) |
| Change in net unrealized appreciation (depreciation) | | | | 31,962 | | | | | 109,513 | | | | 29,562 | |
| Net increase (decrease) in net assets resulting from operations | | | $ | 33,291 | | | | $ | 116,559 | | | $ | 24,863 | |
See accompanying Notes to Financial Statements.
| 120 | Semiannual Report | June 30, 2019 |
Statements of Changes in Net Assets
For the Period Ended June 30, 2019(unaudited)and the Year Ended December 31, 2018(all amounts in thousands)
| | | Emerging Markets
Leaders Fund | | | Emerging Markets
Growth Fund | | | Emerging Markets
Small Cap
Growth Fund | |
| | | 2019 | | | 2018 | | | 2019 | | | 2018 | | | 2019 | | | 2018 | |
| Operations | | | | | | | | | | | | | | | | | | | | | | | | |
| Net investment income (loss) | | $ | 1,108 | | | $ | 2,757 | | | $ | 4,901 | | | $ | 4,704 | | | $ | 208 | | | $ | 931 | |
| Net realized gain (loss) on investments, and other assets and liabilities | | | 221 | | | | 38,309 | | | | 2,145 | | | | 136,983 | | | | (4,907 | ) | | | (40,803 | ) |
| Change in net unrealized appreciation (depreciation) on investments, and other assets and liabilities | | | 31,962 | | | | (116,117 | ) | | | 109,513 | | | | (369,221 | ) | | | 29,562 | | | | (81,984 | ) |
| Net increase (decrease) in net assets resulting from operations | | | 33,291 | | | | (75,051 | ) | | | 116,559 | | | | (227,534 | ) | | | 24,863 | | | | (121,856 | ) |
| Distributions to shareholders from | | | | | | | | | | | | | | | | | | | | | | | | |
| Class N | | | — | | | | (179 | ) | | | — | | | | (966 | ) | | | — | | | | (201 | ) |
| Class I | | | — | | | | (3,674 | ) | | | — | | | | (11,141 | ) | | | — | | | | (4,413 | ) |
| Class R6 | | | — | | | | (16,113 | ) | | | — | | | | (81,475 | ) | | | — | | | | (2,353 | ) |
| Total distributions | | | — | | | | (19,966 | ) | | | — | | | | (93,582 | ) | | | — | | | | (6,967 | ) |
| Capital stock transactions | | | | | | | | | | | | | | | | | | | | | | | | |
| Proceeds from sale of shares | | | 17,634 | | | | 45,869 | | | | 82,724 | | | | 228,271 | | | | 49,731 | | | | 157,577 | |
| Shares issued in reinvestment of income dividends and capital gain distributions | | | — | | | | 19,766 | | | | — | | | | 81,112 | | | | — | | | | 6,516 | |
| Less cost of shares redeemed | | | (25,776 | ) | | | (249,616 | ) | | | (137,924 | ) | | | (566,109 | ) | | | (69,537 | ) | | | (222,964 | ) |
| Net increase (decrease) in net assets resulting from capital share transactions | | | (8,142 | ) | | | (183,981 | ) | | | (55,200 | ) | | | (256,726 | ) | | | (19,806 | ) | | | (58,871 | ) |
| Increase (decrease) in net assets | | | 25,149 | | | | (278,998 | ) | | | 61,359 | | | | (577,842 | ) | | | 5,057 | | | | (187,694 | ) |
| Net assets | | | | | | | | | | | | | | | | | | | | | | | | |
| Beginning of period | | | 198,914 | | | | 477,912 | | | | 740,971 | | | | 1,318,813 | | | | 276,935 | | | | 464,629 | |
| End of period | | $ | 224,063 | | | $ | 198,914 | | | $ | 802,330 | | | $ | 740,971 | | | $ | 281,992 | | | $ | 276,935 | |
See accompanying Notes to Financial Statements.
| June 30, 2019 | William Blair Funds | 121 |
Statements of Assets and Liabilities
As of June 30, 2019(dollar amounts in thousands) (unaudited)
| | | Bond
Fund | | | Income
Fund | | | Low
Duration
Fund | | | Macro
Allocation
Fund | |
| Assets | | | | | | | | | | | | | | | | | |
| Investments in securities, at cost | | $ | 399,854 | | | $ | 63,498 | | | $ | 100,898 | | | | $ | 816,241 | |
| Investments in securities, at value | | $ | 413,369 | | | $ | 63,840 | | | $ | 100,694 | | | | $ | 864,934 | |
| Cash | | | — | | | | 1 | | | | — | | | | | — | |
| Receivable for securities sold | | | 10,043 | | | | 3,003 | | | | 12,013 | | | | | 36,165 | |
| Receivable for fund shares sold | | | 382 | | | | 23 | | | | 4 | | | | | 537 | |
| Receivable for variation margin on centrally cleared swaps | | | — | | | | — | | | | — | | | | | 9 | |
| Receivable from Adviser | | | 8 | | | | 3 | | | | 11 | | | | | — | |
| Dividend and interest receivable | | | 3,177 | | | | 373 | | | | 396 | | | | | 1,859 | |
| Unrealized appreciation on swap contracts | | | — | | | | — | | | | — | | | | | 4,982 | |
| Unrealized appreciation on forward foreign currency contracts | | | — | | | | — | | | | — | | | | | 8,544 | |
| Total assets | | | 426,979 | | | | 67,243 | | | | 113,118 | | | | | 917,030 | |
| Liabilities | | | | | | | | | | | | | | | | | |
| Security sold, not yet purchased (proceeds $10,043; $3,003; $12,013; $—) | | | 10,086 | | | | 3,021 | | | | 12,085 | | | | | — | |
| Payable for futures variation margin | | | — | | | | — | | | | — | | | | | 1,130 | |
| Payable for variation margin on centrally cleared swaps | | | 15 | | | | — | | | | — | | | | | — | |
| Payable for investment securities purchased | | | — | | | | — | | | | — | | | | | 7,081 | |
| Payable for fund shares redeemed | | | 763 | | | | 91 | | | | 721 | | | | | 1,879 | |
| Payable to custodian | | | 6 | | | | 1 | | | | 1 | | | | | 21 | |
| Cash received as collateral, due to broker | | | — | | | | — | | | | — | | | | | 3,922 | |
| Unrealized depreciation on swap contracts | | | — | | | | — | | | | — | | | | | 1,385 | |
| Unrealized depreciation on forward foreign currency contracts | | | — | | | | — | | | | — | | | | | 10,490 | |
| Management fee payable | | | 102 | | | | 21 | | | | 25 | | | | | 600 | |
| Distribution fee payable | | | 8 | | | | 3 | | | | — | | | | | 8 | |
| Distributions payable to shareholders | | | 162 | | | | 9 | | | | 62 | | | | | — | |
| Other payables and accrued expenses | | | 65 | | | | 26 | | | | 31 | | | | | 237 | |
| Total liabilities | | | 11,207 | | | | 3,172 | | | | 12,925 | | | | | 26,753 | |
| Net assets | | $ | 415,772 | | | $ | 64,071 | | | $ | 100,193 | | | | $ | 890,277 | |
| Capital | | | | | | | | | | | | | | | | | |
| Composition of net assets | | | | | | | | | | | | | | | | | |
| Paid in capital | | $ | 427,920 | | | $ | 69,966 | | | $ | 127,247 | | | | $ | 1,018,440 | |
| Total distributable earnings (loss) | | | (12,148 | ) | | | (5,895 | ) | | | (27,054 | ) | | | | (128,163 | ) |
| Net assets | | $ | 415,772 | | | $ | 64,071 | | | $ | 100,193 | | | | $ | 890,277 | |
| Class N shares | | | | | | | | | | | | | | | | | |
| Net assets | | $ | 67,493 | | | $ | 21,319 | | | $ | 1,632 | | | | $ | 37,918 | |
| Shares outstanding | | | 6,541,351 | | | | 2,483,698 | | | | 186,407 | | | | | 3,243,490 | |
| Net asset value per share | | $ | 10.32 | | | $ | 8.58 | | | $ | 8.75 | | | | $ | 11.69 | |
| Class I shares | | | | | | | | | | | | | | | | | |
| Net assets | | $ | 281,303 | | | $ | 42,701 | | | $ | 54,744 | | | | $ | 440,655 | |
| Shares outstanding | | | 27,553,950 | | | | 5,008,512 | | | | 6,258,559 | | | | | 37,752,463 | |
| Net asset value per share | | $ | 10.21 | | | $ | 8.53 | | | $ | 8.75 | | | | $ | 11.68 | |
| Class R6 shares | | | | | | | | | | | | | | | | | |
| Net assets | | $ | 66,976 | | | $ | 51 | | | $ | 43,817 | | | | $ | 411,704 | |
| Shares outstanding | | | 6,564,107 | | | | 5,951 | | | | 5,006,245 | | | | | 35,248,111 | |
| Net asset value per share | | $ | 10.20 | | | $ | 8.53 | | | $ | 8.75 | | | | $ | 11.68 | |
See accompanying Notes to Financial Statements.
| 122 | Semiannual Report | June 30, 2019 |
Statements of Operations
For the Period Ended June 30, 2019(all amounts in thousands) (unaudited)
| | | Bond
Fund | | | Income
Fund | | | Low
Duration
Fund | | | Macro
Allocation
Fund | |
| Investment income | | | | | | | | | | | | | | | | | | | | |
| Dividends | | $ | — | | | | $ | — | | | | $ | — | | | | $ | 6,216 | |
| Interest | | | 7,675 | | | | | 908 | | | | | 1,458 | | | | | 3,118 | |
| Total income | | | 7,675 | | | | | 908 | | | | | 1,458 | | | | | 9,334 | |
| Expenses | | | | | | | | | | | | | | | | | | | |
| Investment advisory fees | | | 620 | | | | | 123 | | | | | 151 | | | | | 3,679 | |
| Distribution fees | | | 50 | | | | | 16 | | | | | 1 | | | | | 54 | |
| Custodian fees | | | 36 | | | | | 27 | | | | | 29 | | | | | 60 | |
| Transfer agent fees | | | 33 | | | | | 5 | | | | | 4 | | | | | 129 | |
| Sub-transfer agent fees | | | | | | | | | | | | | | | | | | | |
| Class N | | | 47 | | | | | 15 | | | | | 1 | | | | | 17 | |
| Class I | | | 103 | | | | | 8 | | | | | 9 | | | | | 188 | |
| Professional fees | | | 43 | | | | | 20 | | | | | 23 | | | | | 59 | |
| Registration fees | | | 31 | | | | | 19 | | | | | 24 | | | | | 38 | |
| Shareholder reporting fees | | | 21 | | | | | 3 | | | | | 1 | | | | | 24 | |
| Trustee fees | | | 18 | | | | | 3 | | | | | 6 | | | | | 41 | |
| Other expenses | | | 22 | | | | | 6 | | | | | 10 | | | | | 93 | |
| Total expenses before expense limitation | | | 1,024 | | | | | 245 | | | | | 259 | | | | | 4,382 | |
| Expenses waived or reimbursed by the Adviser | | | (62 | ) | | | | (12 | ) | | | | (70 | ) | | | | — | |
| Net expenses | | | 962 | | | | | 233 | | | | | 189 | | | | | 4,382 | |
| Net investment income (loss) | | | 6,713 | | | | | 675 | | | | | 1,269 | | | | | 4,952 | |
| Realized and unrealized gain (loss) | | | | | | | | | | | | | | | | | | | |
| Net realized gain (loss) on transactions from: | | | | | | | | | | | | | | | | | | | |
| Investments in securities | | | (918 | ) | | | | (183 | ) | | | | (582 | ) | | | | 29,018 | |
| Options | | | — | | | | | — | | | | | — | | | | | (3,270 | ) |
| Futures contracts | | | — | | | | | — | | | | | — | | | | | (60,739 | ) |
| Swaps | | | (126 | ) | | | | — | | | | | — | | | | | (3,756 | ) |
| Forward foreign currency contracts | | | — | | | | | — | | | | | — | | | | | 15,943 | |
| Foreign currency transactions | | | — | | | | | — | | | | | — | | | | | (36 | ) |
| Total net realized gain (loss) | | | (1,044 | ) | | | | (183 | ) | | | | (582 | ) | | | | (22,840 | ) |
| Change in net unrealized appreciation (depreciation) of: | | | | | | | | | | | | | | | | | | | |
| Investments in securities | | | 27,278 | | | | | 2,207 | | | | | 1,864 | | | | | 58,061 | |
| Options | | | — | | | | | — | | | | | — | | | | | 921 | |
| Futures contracts | | | — | | | | | — | | | | | — | | | | | (13,442 | ) |
| Swaps | | | (426 | ) | | | | — | | | | | — | | | | | 3,621 | |
| Forward foreign currency contracts | | | — | | | | | — | | | | | — | | | | | (7,141 | ) |
| Foreign currency translations | | | — | | | | | — | | | | | — | | | | | 67 | |
| Change in net unrealized appreciation (depreciation) | | | 26,852 | | | | | 2,207 | | | | | 1,864 | | | | | 42,087 | |
| Net increase (decrease) in net assets resulting from operations | | $ | 32,521 | | | | $ | 2,699 | | | | $ | 2,551 | | | | $ | 24,199 | |
See accompanying Notes to Financial Statements.
| June 30, 2019 | William Blair Funds | 123 |
Statements of Changes in Net Assets
For the Period Ended June 30, 2019(unaudited)and the Year Ended December 31, 2018(all amounts in thousands)
| | | Bond Fund | | | Income Fund | | | Low Duration
Fund | | | Macro Allocation
Fund | |
| | | 2019 | | | 2018 | | | 2019 | | | 2018 | | | 2019 | | | 2018 | | | 2019 | | | 2018 | |
| Operations | | | | | | | | | | | | | | | | | | | | | | | | | | | | | | | | |
| Net investment income (loss) | | $ | 6,713 | | | $ | 16,661 | | | $ | 675 | | | $ | 1,481 | | | $ | 1,269 | | | $ | 3,651 | | | $ | 4,952 | | | $ | 11,691 | |
| Net realized gain (loss) on investments, and other assets and liabilities | | | (1,044 | ) | | | (4,154 | ) | | | (183 | ) | | | (654 | ) | | | (582 | ) | | | (1,308 | ) | | | (22,840 | ) | | | 78,431 | |
| Change in net unrealized appreciation (depreciation) on investments, and other assets and liabilities | | | 26,852 | | | | (25,201 | ) | | | 2,207 | | | | (1,488 | ) | | | 1,864 | | | | (410 | ) | | | 42,087 | | | | (109,906 | ) |
| Net increase (decrease) in net assets resulting from operations | | | 32,521 | | | | (12,694 | ) | | | 2,699 | | | | (661 | ) | | | 2,551 | | | | 1,933 | | | | 24,199 | | | | (19,784 | ) |
| Distributions to shareholders from | | | | | | | | | | | | | | | | | | | | | | | | | | | | | | | | |
| Class N | | | (1,394 | ) | | | (3,412 | ) | | | (358 | ) | | | (993 | ) | | | (31 | ) | | | (62 | ) | | | — | | | | (675 | ) |
| Class I | | | (6,014 | ) | | | (14,892 | ) | | | (709 | ) | | | (1,404 | ) | | | (1,054 | ) | | | (2,632 | ) | | | — | | | | (15,790 | ) |
| Class R6 | | | (1,504 | ) | | | (3,657 | ) | | | — | | | | — | | | | (894 | ) | | | (3,226 | ) | | | — | | | | (13,220 | ) |
| Total distributions | | | (8,912 | ) | | | (21,961 | ) | | | (1,067 | ) | | | (2,397 | ) | | | (1,979 | ) | | | (5,920 | ) | | | — | | | | (29,685 | ) |
| Capital stock transactions | | | | | | | | | | | | | | | | | | | | | | | | | | | | | | | | |
| Proceeds from sale of shares | | | 36,804 | | | | 117,343 | | | | 15,250 | | | | 10,624 | | | | 8,500 | | | | 16,290 | | | | 176,292 | | | | 301,576 | |
| Shares issued in reinvestment of income dividends and capital gain distributions | | | 7,909 | | | | 20,114 | | | | 1,006 | | | | 2,283 | | | | 1,564 | | | | 5,084 | | | | — | | | | 25,916 | |
| Less cost of shares redeemed | | | (75,096 | ) | | | (240,011 | ) | | | (11,032 | ) | | | (43,412 | ) | | | (15,809 | ) | | | (145,098 | ) | | | (232,032 | ) | | | (664,845 | ) |
| Net increase (decrease) in net assets resulting from capital share transactions | | | (30,383 | ) | | | (102,554 | ) | | | 5,224 | | | | (30,505 | ) | | | (5,745 | ) | | | (123,724 | ) | | | (55,740 | ) | | | (337,353 | ) |
| Increase (decrease) in net assets | | | (6,774 | ) | | | (137,209 | ) | | | 6,856 | | | | (33,563 | ) | | | (5,173 | ) | | | (127,711 | ) | | | (31,541 | ) | | | (386,822 | ) |
| Net assets | | | | | | | | | | | | | | | | | | | | | | | | | | | | | | | | |
| Beginning of period | | | 422,546 | | | | 559,755 | | | | 57,215 | | | | 90,778 | | | | 105,366 | | | | 233,077 | | | | 921,818 | | | | 1,308,640 | |
| End of period | | $ | 415,772 | | | $ | 422,546 | | | $ | 64,071 | | | $ | 57,215 | | | $ | 100,193 | | | $ | 105,366 | | | $ | 890,277 | | | $ | 921,818 | |
See accompanying Notes to Financial Statements.
| 124 | Semiannual Report | June 30, 2019 |
Notes to Financial Statements(information as of June 30, 2019 is unaudited)
(1) Organization
(a) Description of the Trust
William Blair Funds (the “Trust”) is a mutual fund registered under the Investment Company Act of 1940, as amended (the “1940 Act”), as an open-end management investment company. The Trust currently consists of the following twenty-one funds (the “Funds”), each with its own investment objective and policies. For each Fund, the number of shares authorized is unlimited.
| U.S. Equity Funds | International Equity Funds | Fixed Income Funds |
| Growth | International Leaders | Bond |
| Large Cap Growth | International Developed Plus | Income |
| Mid Cap Growth | Institutional International Developed Plus | Low Duration |
| Small-Mid Cap Growth | International Growth | |
| Small-Mid Cap Value | Institutional International Growth | Multi-Asset and Alternative Fund |
| Small Cap Growth | International Small Cap Growth | Macro Allocation |
| Small Cap Value | Emerging Markets Leaders | |
| | | |
| Global Equity Fund | Emerging Markets Growth | |
| Global Leaders | Emerging Markets Small Cap Growth | |
William Blair Investment Management, LLC (the “Adviser”) serves as the Trust’s investment adviser. William Blair & Company, L.L.C. (“WBC” or the “Distributor”), an affiliate of the Adviser, serves as the Trust’s principal underwriter and distributor.
Upon recommendation of the Adviser, the Board of Trustees of the Trust determined that it was in the best interests of the International Developed Plus Fund and the Institutional International Developed Plus Fund to redeem all the shares of the International Developed Plus Fund and the Institutional International Developed Plus Fund on or before September 30, 2019, and then terminate the International Developed Plus Fund and the Institutional International Developed Plus Fund.
(b) Share Classes
Each Fund is comprised of Class N, Class I and Class R6 shares, except the International Developed Plus Fund which is comprised of Class N and Class I shares and the Institutional International Developed Plus Fund and Institutional International Growth Fund.
Effective May 1, 2019, Institutional Class shares of Global Leaders, International Leaders, International Small Cap Growth, Emerging Markets Leaders, Emerging Markets Growth, Emerging Markets Small Cap Growth, Bond, Low Duration and Macro Allocation Funds were redesignated as Class R6 shares. On that same date, the Growth, Large Cap Growth, Mid Cap Growth, Small-Mid Cap Growth, Small-Mid Cap Value, Small Cap Growth, Small Cap Value, International Growth and Income Funds began offering Class R6 shares.
Class Nshares are available to the general public, either directly through the Trust’s distributor or through a select number of financial intermediaries. Class N shares are sold without any sales load and carry an annual 12b-1 distribution fee at a fixed rate (0.25% for the U.S. Equity, Global Equity, International Equity and Multi-Asset and Alternative Funds and 0.15% for the Fixed Income Funds as discussed inNote 4(b) – Transactions with Affiliates – Underwriting Distribution Services and Shareholder Administration Agreements) and a sub-transfer agent fee that is not a fixed rate and varies by Fund and class, as discussed below.
Class Ishares are available to certain retirement and deferred compensation plans, clients of certain financial intermediaries, and asset-based fee advisory clients of William Blair. The minimum initial investment for a Class I account is $500,000, subject to certain exceptions. Class I shares do not carry any sales load or distribution fees and generally have lower ongoing expenses than Class N shares. Class I shares have a sub-transfer agent fee that is not a fixed rate and varies by Fund and class, as discussed below.
Class R6shares are available to certain retirement and deferred compensation plans, clients of certain financial intermediaries, asset-based fee advisory clients of William Blair, and additional types of investors, provided that neither the investor nor the financial intermediary requires the Funds to make any type of servicing or administrative payment. The minimum initial investment for a Class R6 account is $1 million, subject to certain exceptions.
| June 30, 2019 | William Blair Funds | 125 |
Notes to Financial Statements(information as of June 30, 2019 is unaudited)
Shares of the Institutional International Developed Plus Fund and Institutional International Growth Fund require a minimum initial investment of $5 million, subject to certain exceptions.
Class R6 shares and the Institutional International Developed Plus Fund and the Institutional International Growth Fund do not carry any sales load, distribution fees or sub-transfer agents fees. Class R6 shares of a Fund generally have lower ongoing expenses than the Fund’s Class N and Class I shares.
Sub-transfer agent fees:For Class N and Class I shares, the Funds may reimburse WBC for fees paid to intermediaries such as banks, broker-dealers, financial advisers or other financial institutions for sub-administration, sub-transfer agency and other services provided to investors whose shares of record are held in omnibus, other group accounts, retirement plans or accounts traded through registered securities clearing agents. These fees may vary based on, for example, the nature of services provided, but generally range up to 0.15% of the assets of the class serviced or maintained by the intermediary or up to $15 per sub-account maintained by the intermediary, depending on the method by which the intermediary charges for the services.
(c) Fund Objectives
The investment objectives of the Funds are as follows:
| U.S. Equity Funds | Long-term capital appreciation. |
| Global Equity Fund | Long-term capital appreciation. |
| International Equity Funds | Long-term capital appreciation. |
| Bond Fund | Outperform the Bloomberg Barclays U.S. Aggregate Index by maximizing total return through a combination of income and capital appreciation. |
| Income Fund | High level of current income with relative stability of principal. |
| Low Duration Fund | Maximize total return. Total return includes both income and capital appreciation. |
| Macro Allocation Fund | Maximize long-term risk-adjusted total return. |
(2) Significant Accounting Policies
The following is a summary of the Trust’s significant accounting policies in effect during the periods covered by the financial statements, which are in accordance with U.S. generally accepted accounting principles (“US GAAP”), which includes the accounting and reporting guidelines under Accounting Standards Topic 946,Financial Services—Investment Companies.
(a) Investment income and transactions
Investment income, realized and unrealized gains and losses, and certain Fund level expenses and expense reductions, if any, are allocated based on the relative net assets of each class, except for certain class specific expenses, which are charged directly to the appropriate class. Differences in class expenses may result in the payment of different per share dividends by class. All share classes of the Funds have equal rights with respect to voting, subject to class specific arrangements.
Dividend income and expenses are recorded on the ex-dividend date, except for those dividends from certain foreign securities that are recorded when the information is available.
Interest income is recorded on an accrual basis, adjusted for amortization of premium or accretion of discount. Variable rate bonds and floating rate notes earn interest at coupon rates that fluctuate at specific time intervals. The interest rates shown in the Portfolio of Investments for the Bond, Income, Low Duration and Macro Allocation Funds were the rates in effect on June 30, 2019. Put bonds may be redeemed at the discretion of the holder on specified dates prior to maturity.
Premiums and discounts are amortized and accreted on a straight-line basis for short-term investments and on an effective interest method for long-term investments.
Paydown gains and losses on mortgage-backed and asset-backed securities are treated as an adjustment to interest income. For the period ended June 30, 2019, the Bond, Income and Low Duration Funds recognized a reduction of interest income and a corresponding increase in net realized gain of $2,180, $391 and $712, respectively (in thousands). This reclassification had no effect on the net increase (decrease) in net assets resulting from operations, net asset value or the net assets of the Funds.
| 126 | Semiannual Report | June 30, 2019 |
Notes to Financial Statements(information as of June 30, 2019 is unaudited)
The Funds do not isolate the portion of operations resulting from fluctuations in foreign currency exchange rates on investments from the fluctuations arising from changes in the value of securities held. Such currency fluctuations are included with the net realized and unrealized gain or loss from investments.
Reported net realized foreign currency gains or losses arise from disposition of foreign currency, the difference in the foreign exchange rates between the trade and settlement dates on securities transactions, and the difference between the amounts of dividends, interest and foreign withholding taxes recorded on the ex-date or accrual date and the U.S. dollar equivalent of the amounts actually received or paid. Net unrealized foreign exchange gains and losses arise from changes (due to the changes in the exchange rate) in the value of foreign currency and other assets and liabilities denominated in foreign currencies held at period end.
For financial reporting purposes, security and shareholder transactions are recorded on trade date in accordance with US GAAP. Realized gains and losses from securities transactions are recognized on a specifically identified cost basis.
Awards from class action litigation may be recorded as a reduction of cost. If the Funds no longer own the applicable securities, the proceeds are recorded as realized gains.
(b) Share Valuation and Distributions to Shareholders
Shares are sold and redeemed on a continuous basis at net asset value. The net asset value per share is determined separately for each class by dividing the Fund’s net assets attributable to that class by the number of shares of the class outstanding as of the close of regular trading on the New York Stock Exchange (the “NYSE”), which is generally 4:00 p.m. Eastern time, on each day the NYSE is open.
Distributions from net investment income, if any, for all Equity and Multi-Asset and Alternative Funds are declared and paid at least annually. Distributions from net investment income for the Fixed Income Funds are declared daily and paid monthly. Capital gain distributions, if any, for all Funds, are declared and paid at least annually in December. Distributions payable to shareholders are recorded on the ex-dividend date.
(c) Foreign Currency Translation
The Funds may invest in securities denominated in foreign currencies. As such, assets and liabilities denominated in foreign currencies are translated into U.S. dollar amounts at the current exchange rate on the date of valuation. The values of foreign investments, open forward foreign currency contracts, and cash denominated in foreign currencies are translated into U.S. dollars using a spot market rate of exchange as of the time of the determination of each Fund’s net asset value, typically 4:00 p.m. Eastern time on days when there is regular trading on the NYSE. Payables and receivables for securities transactions, dividends, interest income and tax reclaims are translated into U.S. dollars using a spot market rate of exchange as of 4:00 p.m. Eastern time. Settlement of purchases and sales and dividend and interest receipts are translated into U.S. dollars using a spot market rate of exchange as of 11:00 a.m. Eastern time.
(d) Income Taxes
Each Fund intends to comply with the provisions of Subchapter M of the Internal Revenue Code of 1986, as amended (the “Code”), in order to qualify as regulated investment companies. Each Fund intends to make the requisite distributions of income and capital gains to its shareholders sufficient to relieve it from all, or substantially all, federal income and excise taxes. No provision for federal income and excise taxes has been made.
Certain Funds may be subject to foreign income taxes imposed on realized gains on securities of issuers from certain foreign countries. Such taxes, if applicable, are included within Net realized gain (loss) on transactions from Investments in securities in the Statement of Operations.
Management has evaluated all of the uncertain tax positions of the Funds and has determined that no liability is required to be recorded in the financial statements.
The statute of limitations on the Funds’ tax returns for the prior three years remains open and the returns are subject to examination.
| June 30, 2019 | William Blair Funds | 127 |
Notes to Financial Statements(information as of June 30, 2019 is unaudited)
Adjustments to the cost of investments for tax purposes may be due to the deferred loss associated with current and prior year wash sales, income recognition from investments in real estate investment trusts and partnerships, and the Funds’ election to mark-to-market their investments in Passive Foreign Investment Companies (“PFICs”). The cost of investments, including derivatives, for federal income tax purposes and related gross unrealized appreciation (depreciation) and net unrealized appreciation/(depreciation) at June 30, 2019, were as follows (in thousands):
| Fund | | Cost of
Investments | | | Gross
Unrealized
Appreciation | | Gross
Unrealized
Depreciation | | Net
Unrealized
Appreciation/
(Depreciation) |
| Growth | | $ | 171,370 | | | $ | 93,271 | | | $ | 4,656 | | | $ | 88,615 | |
| Large Cap Growth | | | 159,599 | | | | 73,939 | | | | 2,894 | | | | 71,045 | |
| Mid Cap Growth | | | 56,422 | | | | 14,563 | | | | 1,688 | | | | 12,875 | |
| Small-Mid Cap Growth | | | 2,378,453 | | | | 528,220 | | | | 70,398 | | | | 457,822 | |
| Small-Mid Cap Value | | | 1,562 | | | | 201 | | | | 46 | | | | 155 | |
| Small Cap Growth | | | 593,579 | | | | 139,490 | | | | 27,571 | | | | 111,919 | |
| Small Cap Value | | | 361,036 | | | | 100,332 | | | | 12,728 | | | | 87,604 | |
| Global Leaders | | | 157,963 | | | | 56,325 | | | | 2,442 | | | | 53,883 | |
| International Leaders | | | 450,189 | | | | 99,795 | | | | 3,262 | | | | 96,533 | |
| International Developed Plus | | | 20,311 | | | | 3,939 | | | | 2 | | | | 3,937 | |
| Institutional International Developed Plus | | | 16,569 | | | | 3,984 | | | | 40 | | | | 3,944 | |
| International Growth | | | 1,762,985 | | | | 404,208 | | | | 28,651 | | | | 375,557 | |
| Institutional International Growth | | | 1,478,763 | | | | 334,632 | | | | 25,021 | | | | 309,611 | |
| International Small Cap Growth | | | 279,615 | | | | 44,584 | | | | 15,356 | | | | 29,228 | |
| Emerging Markets Leaders | | | 195,215 | | | | 32,682 | | | | 4,483 | | | | 28,199 | |
| Emerging Markets Growth | | | 654,959 | | | | 152,114 | | | | 5,446 | | | | 146,668 | |
| Emerging Markets Small Cap Growth | | | 245,163 | | | | 37,077 | | | | 5,091 | | | | 31,986 | |
| Bond | | | 400,066 | | | | 16,287 | | | | 3,177 | | | | 13,110 | |
| Income | | | 63,506 | | | | 936 | | | | 620 | | | | 316 | |
| Low Duration | | | 100,899 | | | | 569 | | | | 846 | | | | (277 | ) |
| Macro Allocation | | | 828,501 | | | | 53,955 | | | | 22,351 | | | | 31,604 | |
In addition, the Funds may periodically record reclassifications among certain capital accounts to reflect differences between financial reporting and income tax basis distributions. The reclassifications were reported in order to reflect the tax treatment for certain permanent differences that exist between income tax regulations and US GAAP. The reclassifications generally relate to the tax treatment of net operating losses, expiration of capital loss carryforwards, redemptions in-kind, and utilization of earnings and profits distributed to shareholders on redemption of shares. These reclassifications have no impact on the net asset values or the net assets of the Funds. Accordingly, at December 31, 2018 (the Funds’ most recent fiscal year end), the following reclassifications were recorded (in thousands):
| 128 | Semiannual Report | June 30, 2019 |
Notes to Financial Statements(information as of June 30, 2019 is unaudited)
| Fund | | Paid in
Capital | | Total
Distributable
Earnings
(Loss) |
| Growth | | $ | 19,805 | | | $ | (19,805 | ) |
| Large Cap Growth | | | 5,048 | | | | (5,048 | ) |
| Mid Cap Growth | | | 2,417 | | | | (2,417 | ) |
| Small-Mid Cap Growth | | | 31,047 | | | | (31,047 | ) |
| Small-Mid Cap Value | | | 98 | | | | (98 | ) |
| Small Cap Growth | | | 12,551 | | | | (12,551 | ) |
| Small Cap Value | | | 6,948 | | | | (6,948 | ) |
| Global Leaders | | | 4,894 | | | | (4,894 | ) |
| International Leaders | | | — | | | | — | |
| International Developed Plus | | | — | | | | — | |
| Institutional International Developed Plus | | | (11 | ) | | | 11 | |
| International Growth | | | 18 | | | | (18 | ) |
| Institutional International Growth | | | — | | | | — | |
| International Small Cap Growth | | | (274 | ) | | | 274 | |
| Emerging Markets Leaders | | | 24,198 | | | | (24,198 | ) |
| Emerging Markets Growth | | | 32,994 | | | | (32,994 | ) |
| Emerging Markets Small Cap Growth | | | (3,217 | ) | | | 3,217 | |
| Bond | | | — | | | | — | |
| Income | | | — | | | | — | |
| Low Duration | | | (955 | ) | | | 955 | |
| Macro Allocation | | | — | | | | — | |
The timing and characterization of certain income and capital gain distributions are determined annually in accordance with federal income tax regulations that may differ from US GAAP. As a result, net investment income or loss and net realized gain or loss for a reporting period may differ from the amount distributed during such period.
Distributions from net realized gains for book purposes may include short-term capital gains, which are included as ordinary income for tax purposes. The tax character of distributions paid during 2018 and 2017 was as follows (in thousands):
| | | Distributions Paid in 2018 | | | Distributions Paid in 2017 | |
| | | Ordinary
Income | | | Long-Term
Capital Gains | | | Ordinary
Income | | | Long-Term
Capital Gains | |
| Fund | | Class N | | | Class I | | | Class N | | | Class I | | | Class N | | | Class I | | | Class N | | | Class I | |
| Growth | | $ | 815 | | | $ | 3,461 | | | $ | 11,233 | | | $ | 47,642 | | | $ | 351 | | | $ | 3,113 | | | $ | 10,311 | | | $ | 80,701 | |
| Large Cap Growth | | | 503 | | | | 1,744 | | | | 6,019 | | | | 18,995 | | | | — | | | | — | | | | 146 | | | | 993 | |
| Mid Cap Growth | | | — | | | | — | | | | 982 | | | | 9,097 | | | | — | | | | — | | | | 986 | | | | 10,476 | |
| Small-Mid Cap Growth | | | 576 | | | | 2,467 | | | | 36,850 | | | | 157,662 | | | | — | | | | — | | | | 11,906 | | | | 81,736 | |
| Small-Mid Cap Value | | | 11 | | | | 75 | | | | 47 | | | | 307 | | | | — | | | | 12 | | | | 28 | | | | 320 | |
| Small Cap Growth | | | 2,543 | | | | 5,077 | | | | 21,112 | | | | 42,147 | | | | 4,158 | | | | 8,754 | | | | 19,362 | | | | 40,764 | |
| Small Cap Value | | | — | | | | 1,274 | | | | 2,248 | | | | 55,731 | | | | 46 | | | | 2,095 | | | | 2,057 | | | | 45,472 | |
| Global Leaders | | | 107 | | | | 1,617 | | | | 982 | | | | 11,400 | | | | 71 | | | | 739 | | | | 215 | | | | 1,738 | |
| International Leaders | | | 37 | | | | 672 | | | | 275 | | | | 2,379 | | | | 117 | | | | 844 | | | | 71 | | | | 437 | |
| International Developed Plus | | | 23 | | | | 1,522 | | | | 14 | | | | 681 | | | | 55 | | | | 2,202 | | | | — | | | | — | |
| International Growth | | | 2,365 | | | | 19,058 | | | | 36,843 | | | | 126,713 | | | | 9,771 | | | | 36,754 | | | | — | | | | — | |
| International Small Cap Growth | | | 61 | | | | 4,260 | | | | 402 | | | | 21,212 | | | | 121 | | | | 8,233 | | | | 425 | | | | 23,214 | |
| June 30, 2019 | William Blair Funds | 129 |
Notes to Financial Statements(information as of June 30, 2019 is unaudited)
| | | Distributions Paid in 2018 | | | Distributions Paid in 2017 | |
| | | Ordinary
Income | | | Long-Term
Capital Gains | | | Ordinary
Income | | | Long-Term
Capital Gains | |
| Fund | | Class N | | | Class I | | | Class N | | | Class I | | | Class N | | | Class I | | | Class N | | | Class I | |
| Emerging Markets Leaders | | $ | 15 | | | $ | 477 | | | $ | 164 | | | $ | 3,197 | | | $ | 12 | | | $ | 327 | | | | $ — | | | $ | — | |
| Emerging Markets Growth | | | 69 | | | | 1,152 | | | | 897 | | | | 9,989 | | | | 77 | | | | 1,188 | | | | — | | | | — | |
| Emerging Markets Small Cap Growth | | | — | | | | 303 | | | | 201 | | | | 4,110 | | | | 391 | | | | 8,028 | | | | 35 | | | | 651 | |
| Bond | | | 3,412 | | | | 14,892 | | | | — | | | | — | | | | 3,978 | | | | 14,049 | | | | — | | | | — | |
| Income | | | 993 | | | | 1,404 | | | | — | | | | — | | | | 1,426 | | | | 1,849 | | | | — | | | | — | |
| Low Duration | | | 62 | | | | 2,632 | | | | — | | | | — | | | | 96 | | | | 4,594 | | | | — | | | | — | |
| Macro Allocation | | | 675 | | | | 15,790 | | | | — | | | | — | | | | 260 | | | | 8,252 | | | | — | | | | — | |
| | | Distributions Paid in 2018 | | Distributions Paid in 2017 |
| | | Ordinary
Income | | Long-Term
Capital Gains | | Ordinary
Income | | Long-Term
Capital Gains |
| | | Institutional/
Class R6 | | Institutional/
Class R6 | | Institutional/
Class R6 | | Institutional/
Class R6 |
| Global Leaders | | $ | 1,539 | | | $ | 10,463 | | | $ | 1,836 | | | $ | 4,097 | |
| International Leaders | | | 3,148 | | | | 10,126 | | | | 4,501 | | | | 2,201 | |
| Institutional International Developed Plus | | | 554 | | | | — | | | | 212 | | | | — | |
| Institutional International Growth | | | 20,298 | | | | 166,380 | | | | 54,743 | | | | 39,224 | |
| International Small Cap Growth | | | 3,872 | | | | 17,228 | | | | 6,246 | | | | 17,011 | |
| Emerging Markets Leaders | | | 2,228 | | | | 13,885 | | | | 3,069 | | | | — | |
| Emerging Markets Growth | | | 9,103 | | | | 72,372 | | | | 11,908 | | | | — | |
| Emerging Markets Small Cap Growth | | | 257 | | | | 2,096 | | | | 4,880 | | | | 389 | |
| Bond | | | 3,657 | | | | — | | | | 3,890 | | | | — | |
| Low Duration | | | 3,226 | | | | — | | | | 2,290 | | | | — | |
| Macro Allocation | | | 13,220 | | | | — | | | | 6,654 | | | | — | |
As of December 31, 2018, the components of distributable earnings on a tax basis were as follows (in thousands):
| Fund | | Undistributed
Ordinary
Income | | Accumulated
Capital and
Other Losses | | | Undistributed
Long-Term
Capital Gain | | Net Unrealized
Appreciation/
(Depreciation) | | | Total | |
| Growth | | $ | 876 | | | $ | — | | | $ | 6,732 | | | $ | 53,711 | | | $ | 61,319 | |
| Large Cap Growth | | | 86 | | | | (924 | ) | | | 3,728 | | | | 36,566 | | | | 39,456 | |
| Mid Cap Growth | | | 50 | | | | — | | | | 2,260 | | | | 2,782 | | | | 5,092 | |
| Small-Mid Cap Growth | | | — | | | | — | | | | 8,545 | | | | 46,174 | | | | 54,719 | |
| Small-Mid Cap Value | | | 5 | | | | (32 | ) | | | — | | | | (50 | ) | | | (77 | ) |
| Small Cap Growth | | | — | | | | (7,883 | ) | | | 11,445 | | | | (4,567 | ) | | | (1,005 | ) |
| Small Cap Value | | | 487 | | | | — | | | | 2,276 | | | | 23,163 | | | | 25,926 | |
| Global Leaders | | | 70 | | | | (719 | ) | | | 1,532 | | | | 19,105 | | | | 19,988 | |
| International Leaders | | | 354 | | | | (32 | ) | | | — | | | | 10,759 | | | | 11,081 | |
| International Developed Plus | | | — | | | | (854 | ) | | | — | | | | 3,538 | | | | 2,684 | |
| Institutional International Developed Plus | | | — | | | | (226 | ) | | | — | | | | 709 | | | | 483 | |
| International Growth | | | 16,855 | | | | (39,676 | ) | | | — | | | | 2,862 | | | | (19,959 | ) |
| Institutional International Growth | | | — | | | | (33,348 | ) | | | — | | | | (9,035 | ) | | | (42,383 | ) |
| International Small Cap Growth | | | — | | | | (15,671 | ) | | | — | | | | (37,426 | ) | | | (53,097 | ) |
| Emerging Markets Leaders | | | 1,130 | | | | (3,768 | ) | | | — | | | | (4,098 | ) | | | (6,736 | ) |
| Emerging Markets Growth | | | 4,115 | | | | (6,519 | ) | | | — | | | | 19,576 | | | | 17,172 | |
| Emerging Markets Small Cap Growth | | | — | | | | (38,594 | ) | | | — | | | | (604 | ) | | | (39,198 | ) |
| Bond | | | 353 | | | | (22,047 | ) | | | — | | | | (13,975 | ) | | | (35,669 | ) |
| Income | | | 15 | | | | (5,656 | ) | | | — | | | | (1,882 | ) | | | (7,523 | ) |
| Low Duration | | | 61 | | | | (25,492 | ) | | | — | | | | (2,140 | ) | | | (27,571 | ) |
| Macro Allocation | | | 16,690 | | | | (150,674 | ) | | | — | | | | (18,378 | ) | | | (152,362 | ) |
| 130 | Semiannual Report | June 30, 2019 |
Notes to Financial Statements(information as of June 30, 2019 is unaudited)
As of December 31, 2018, the Funds may have unused capital loss carryforwards available for federal income tax purposes to be applied against future capital gains, if any. Under current law, the Funds may carry forward net capital losses indefinitely to use to offset capital gains realized in future years. The following table details the Funds’ available capital loss carryforwards as of December 31, 2018, the capital loss carryforwards utilized by the Funds in 2018, and the capital loss carryforwards that expired in 2018 (in thousands):
| | | Available Capital Loss Carryforwards | | | Capital Loss
Carryforwards | | Capital Loss
Carryforwards |
| Fund | | Short Term | | Long Term | | Total | | | Utilized in 2018 | | Expired in 2018 |
| Institutional International Developed Plus | | $ | 91 | | | $ | — | | | $ | 91 | | | $ | 122 | | | $ | — | |
| Emerging Markets Growth | | | — | | | | — | | | | — | | | | 21,948 | | | | — | |
| Emerging Markets Small Cap Growth | | | 38,594 | | | | — | | | | 38,594 | | | | — | | | | — | |
| Bond | | | 10,433 | | | | 11,614 | | | | 22,047 | | | | — | | | | — | |
| Income | | | 2,100 | | | | 3,556 | | | | 5,656 | | | | — | | | | — | |
| Low Duration | | | 11,653 | | | | 13,839 | | | | 25,492 | | | | — | | | | 955 | |
| Macro Allocation | | | 150,674 | | | | — | | | | 150,674 | | | | 67,739 | | | | — | |
In order to meet certain excise tax distribution requirements, the Funds are required to measure and distribute annually, net capital gains realized during a twelve month period ending October 31 and net investment income earned during a twelve month period ending December 31. In connection with this, the Funds are permitted for tax purposes to defer into their next fiscal year qualified late year losses. Qualified late year capital losses are any short term or long term capital losses incurred between November 1 and the end of their fiscal year, December 31, 2018. Qualified late year ordinary losses are comprised of losses related to foreign currency and PFICs incurred between November 1 and the end of their fiscal year, December 31, 2018.
As of December 31, 2018, the following Funds deferred, on a tax basis, qualified late year losses of (in thousands):
| | | Qualified Late Year Losses | |
| Fund | | Ordinary
Income | | | Net
Capital | |
| Large Cap Growth | | $ | — | | | $ | 924 | |
| Small-Mid Cap Value | | | — | | | | 32 | |
| Small Cap Growth | | | — | | | | 7,883 | |
| Global Leaders | | | — | | | | 719 | |
| International Leaders | | | — | | | | 32 | |
| International Developed Plus | | | 120 | | | | 734 | |
| Institutional International Developed Plus | | | 26 | | | | 109 | |
| International Growth | | | — | | | | 39,676 | |
| Institutional International Growth | | | 1,197 | | | | 32,151 | |
| International Small Cap Growth | | | 2,349 | | | | 13,322 | |
| Emerging Markets Leaders | | | — | | | | 3,768 | |
| Emerging Markets Growth | | | — | | | | 6,519 | |
(e) Repurchase Agreements
In a repurchase agreement, a Fund buys a security at one price and at the time of sale, the seller agrees to repurchase the security at a mutually agreed upon time and price (usually within seven days). The repurchase agreement thereby determines the yield during the purchaser’s holding period, while the seller’s obligation to repurchase is secured by the value of the underlying collateral. The Adviser monitors, on an ongoing basis, the value of the underlying collateral to ensure that the value always equals or exceeds the repurchase price plus accrued interest. Repurchase agreements may involve certain risks in the event of a default or insolvency of the other party to the agreement, including possible delays or restrictions upon a Fund’s ability to dispose of the underlying collateral. The risk to a Fund is limited to the ability of the seller to pay the agreed upon sum on the delivery date. In the event of default, a repurchase agreement provides that a Fund is entitled to sell the underlying collateral. The loss, if any, to a Fund will be the difference between the proceeds from the sale and the repurchase price. However, if bankruptcy proceedings are commenced with respect to the seller of the security, disposition of the collateral by the Fund may be delayed or limited. The Funds have master repurchase agreements which allow the Funds to offset amounts owed to a counterparty with amounts owed from the same counterparty, including any collateral, in the event the counterparty defaults. As of June 30, 2019, each Fund’s outstanding repurchase agreements, if any, and related collateral, are shown on the Fund’s Portfolio of Investments. Although no definitive creditworthiness criteria are used, the Adviser reviews the creditworthiness of the banks and non-bank dealers with which a Fund
| June 30, 2019 | William Blair Funds | 131 |
Notes to Financial Statements(information as of June 30, 2019 is unaudited)
enters into repurchase agreements to evaluate those risks. A Fund may, for tax purposes, deem repurchase agreements collateralized by U.S. Government securities to be investments in U.S. Government securities.
(f) TBA Securities
The Fixed Income Funds may invest in mortgage pass-through securities eligible to be sold in the “to-be announced” market (“TBAs”). TBAs provide for the forward or delayed delivery of the underlying instrument with settlement in up to 180 days. The term TBA comes from the fact that the specific mortgage-backed security that will be delivered to fulfill a TBA trade is not designated at the time the trade is made, but rather is generally announced 48 hours before the settlement date. A Fund generally has the ability to close out a TBA obligation on or before the settlement date, rather than take delivery of the security. When a Fund sells TBAs, it incurs risks similar to those incurred in short sales. For example, when a Fund sells TBAs without owning or having the right to obtain the deliverable securities it incurs a risk of loss because it could have to purchase the securities at a price that is higher than the price at which it sold the securities.
(g) Securities Sold, Not Yet Purchased
A Fund may sell a security it does not own (known as selling a security short) in anticipation of a decline in the fair value of that security. When a Fund sells a security short, it must borrow the security sold short and deliver it to the broker through which it made the short sale. A gain, limited to the price at which the fund sold the security short, or a loss, unlimited in size, will be recognized upon the termination of the short sale. A Fund is also subject to the risk that it may be unable to acquire a security to terminate a short position except at a price substantially in excess of the price at which it sold the security short.
(h) Use of Estimates
The preparation of financial statements in conformity with US GAAP requires management to make estimates and assumptions that affect the amounts reported in the financial statements. Actual results may differ from those estimates.
(i) Indemnification
In the normal course of business, the Funds have entered into contracts in which the Funds agree to indemnify the other party or parties against various potential costs or liabilities. The Funds’ maximum exposure under these arrangements is unknown. No claim has been made for indemnification pursuant to any such agreement of the Funds.
(j) Redemption In-Kind
In accordance with the Trust’s prospectus, the Funds may distribute portfolio securities rather than cash as payment for a redemption of Fund shares (in-kind redemption). For financial reporting purposes, the Fund recognizes a gain or loss on the transfer of securities depending on the value of those securities on the date of redemption. Gains and losses realized on in-kind redemptions may not be recognized for tax purposes and are reclassified from accumulated net realized gain (loss) to capital paid in excess of par value. During the period ended June 30, 2019, the Small-Mid Cap Growth and Institutional International Growth Funds redeemed $122,137 and $50,390 (in thousands), respectively, of Fund shares in-kind rather than with cash and recognized net realized gains of $40,038 and $7,223 (in thousands), respectively, on the securities distributed to shareholders.
(k) Recent Accounting Pronouncements
In March 2017, the Financial Accounting Standards Board (the “FASB”) issued Accounting Standards Update 2017-08 –Receivables – Nonrefundable Fees and Other Costs (Subtopic 310-20): Premium Amortization on Purchased Callable Debt Securities(“ASU 2017-08”). ASU 2017-08 changes the amortization of premium on certain debt securities with explicit noncontingent call features that are callable at fixed prices on preset dates by reducing the amortization period from maturity date to the earliest date a bond could be called. As of June 30, 2019, the Funds have adopted ASU 2017-08, which did not have a material impact on the financial statements, and had no effect on the net increase (decrease) in net assets resulting from operations, net asset value or the net assets of the Funds.
(3) Valuation
(a) Investment Valuation
The value of U.S. equity securities, including exchange-traded funds, is determined by valuing securities traded on national securities markets or in the over-the-counter markets at the last sale price or, if applicable, the official closing price or, in the absence of a recent sale on the date of determination, at the mean between the last reported bid and ask prices.
| 132 | Semiannual Report | June 30, 2019 |
Notes to Financial Statements(information as of June 30, 2019 is unaudited)
The value of foreign equity securities is generally determined based upon the last sale price on the foreign exchange or market on which it is primarily traded and in the currency of that market as of the close of the appropriate exchange or, if there have been no sales during that day, at the mean between the last reported bid and ask prices. The Board of Trustees has determined that the passage of time between when the foreign exchanges or markets close and when the Funds compute their net asset values could cause the value of foreign equity securities to no longer be representative or accurate and, as a result, may necessitate that such securities be fair valued. Accordingly, for foreign equity securities, the Funds may use an independent pricing service to fair value price the security as of the close of regular trading on the NYSE. As a result, a Fund’s value for a foreign security may be different from the last sale price (or the mean between the last reported bid and ask prices). As of June 30, 2019, fair valuation estimates for foreign equity securities were not obtained.
Fixed income securities are generally valued using evaluated prices provided by an independent pricing service. The evaluated prices are formed using various market inputs that the pricing service believes accurately represent the market value of a security at a particular point in time. The pricing service determines evaluated prices for fixed income securities using inputs including, but not limited to, recent transaction prices for such securities, dealer quotes, transaction prices for other securities with similar characteristics, collateral characteristics, credit quality, payment history, liquidity and market conditions.
Repurchase agreements and commercial paper are valued at cost, which approximates fair value.
Option contracts on securities, currencies and other financial instruments traded on one or more exchanges are valued at their most recent sale price on the exchange on which they are traded most extensively. Option contracts on foreign indices are valued at the settlement price. If there were no sales that day or if no settlement price is available, such option contracts are valued at the mean between the last reported bid and ask prices. Option contracts traded in the Over-the-Counter (“OTC”) market shall be valued by an independent pricing service. Futures contracts are valued at the most recent settlement price on the exchange on which they are traded most extensively, or if no settlement price is available, at the last sale price as of the close of the exchange. Forward foreign currency contracts are valued on the basis of the value of the underlying currencies at the prevailing currency exchange rate as supplied by an independent pricing service.
Swaps that are centrally cleared through an exchange are valued at the most recent settlement price provided by the exchange on which they are cleared. Total return swaps on equities, equity baskets, indices and other financial instruments are valued by an independent pricing service, or if unavailable, based on the security’s or instrument’s underlying reference asset. All other swap contracts are valued by an independent pricing service. Depending on the product and the terms of the transaction, the independent pricing service may use a series of techniques, including simulation pricing models. The pricing models use inputs that are observed from actively quoted markets such as issuer details, indices, spreads, interest rates, yield curves, dividends and exchange rates.
Securities, and other assets, for which a market price is not available or is deemed unreliable (e.g., securities affected by unusual or extraordinary events, such as natural disasters or securities affected by market or economic events, such as bankruptcy filings), or the value of which is affected by a significant valuation event, are valued at a fair value as determined in good faith by, or under the direction of, the Board of Trustees and in accordance with the Valuation Procedures approved by the Board of Trustees. The value of these fair valued securities may be different from the last sale price (or the mean between the last reported bid and ask prices), and there is no guarantee that a fair valued security will be sold at the price at which a Fund is carrying the security.
(b) Fair Value Measurements
Fair value is defined as the price that a Fund would receive upon selling a security in an orderly transaction to an independent buyer in the principal or most advantageous market for the investment. Various inputs are used in determining the value of a Fund’s investments. A three-tier hierarchy of inputs is used to classify fair value measurements for disclosure purposes. The three-tier hierarchy of inputs is summarized in the three broad levels listed below:
| | • | Level 1—Quoted prices (unadjusted) in active markets for an identical security. |
| | | |
| | • | Level 2—Prices determined using other significant observable inputs. Observable inputs are inputs that other market participants would use in pricing a security. These may include quoted prices for similar securities, interest rates, prepayment speeds, credit risk, and others. In addition, other observable inputs such as foreign exchange rates, benchmark securities indices and foreign futures contracts may be utilized in the valuation of certain foreign securities when significant events occur between the last sale on the foreign securities exchange and the time at which the net asset value of the Fund is calculated. |
| | | |
| | • | Level 3—Prices determined using significant unobservable inputs. In situations where quoted prices or observable inputs are unavailable (for example, when there is little or no market activity for an investment), unobservable inputs may be used. Unobservable inputs reflect the Fund’s own assumptions about the factors market participants would use in pricing an investment, and are based on the best information available. |
| June 30, 2019 | William Blair Funds | 133 |
Notes to Financial Statements(information as of June 30, 2019 is unaudited)
The inputs or methodology used for valuing an investment are not necessarily an indication of the risk associated with investing in those securities.
A description of the valuation methodologies applied to the Funds’ major categories of assets and liabilities measured at fair value on a recurring basis is as follows:
Exchange-Traded Securities
Securities traded on a national securities exchange (or reported on the NASDAQ national market), including exchange-traded funds, are stated at the last reported sales price on the day of valuation. Other securities traded in the over-the-counter market and listed securities for which no sale was reported on that date are stated at the mean between the last reported bid and ask prices. To the extent these securities are actively traded and valuation adjustments are not applied, they are categorized as Level 1 of the fair value hierarchy. Securities traded on inactive markets or valued by reference to similar instruments are generally categorized as Level 2 of the fair value hierarchy.
Fixed Income Securities
Fixed income securities including corporate, convertible and municipal bonds and notes, U.S. government agency obligations, U.S. treasury obligations, sovereign issues, bank loans, convertible preferred securities, asset-backed securities and non-U.S. bonds are generally valued using evaluated prices provided by an independent pricing service. The evaluated prices are formed using various market inputs that the pricing service believes accurately represent the fair value of a security at a particular point in time. The pricing service determines evaluated prices for fixed income securities using inputs including, but not limited to, recent transaction prices for such securities, dealer quotes, transaction prices for other securities with similar characteristics, collateral characteristics, credit quality, payment history, liquidity and market conditions. Securities that use similar valuation techniques and observable inputs as described above are categorized as Level 2 of the fair value hierarchy.
Short-Term Investments
Repurchase agreements and commercial paper are valued at cost, which approximates fair value. These investments are categorized as Level 2 of the fair value hierarchy.
Derivative Instruments
Listed derivatives, such as certain options and futures contracts, that are actively traded are valued based on quoted prices from the exchange on which they are traded most extensively and are categorized as Level 1 of the fair value hierarchy. OTC derivative contracts include forward foreign currency contracts, swap and certain option contracts related to interest rates, foreign currencies, the credit standing of reference entities, equity prices, or commodity prices. Depending on the product and the terms of the transaction, the fair value of OTC derivative products can be modeled by independent pricing services taking into account the counterparties’ creditworthiness and using a series of techniques, including simulation models. Many pricing models do not entail material subjectivity because the methodologies employed do not necessitate significant judgments and the pricing inputs are observed from actively quoted markets, as is the case of forward foreign currency contracts and interest rate swaps. A substantial majority of OTC derivative products valued by a Fund using pricing models fall into this category and are categorized as Level 2 of the fair value hierarchy.
| 134 | Semiannual Report | June 30, 2019 |
Notes to Financial Statements(information as of June 30, 2019 is unaudited)
As of June 30, 2019, the value of securities and other assets, segregated by their hierarchical input levels used in determining fair value and by security class or other financial instruments, are shown below (in thousands).
| Investments in securities | | | | | | | | | | Growth | | | Large Cap
Growth | | | Mid Cap
Growth | |
| Level 1—Quoted prices | | | | | | | | | | | | | | | | | | | | | | | | | |
| Common Stocks | | | | | | | | | | | | | $ | 258,225 | | | | $ | 227,841 | | | | $ | 68,372 | |
| Level 2—Other significant observable inputs | | | | | | | | | | | | | | | | | | | | | | | | | |
| Short-Term Investments | | | | | | | | | | | | | | 1,760 | | | | | 2,803 | | | | | 925 | |
| Level 3—Significant unobservable inputs | | | | | | | | | | | | | | | | | | | | | | | | | |
| None | | | | | | | | | | | | | | — | | | | | — | | | | | — | |
| Total investments in securities | | | | | | | | | | | | | $ | 259,985 | | | | $ | 230,644 | | | | $ | 69,297 | |
| | | | | | | | | | | | | | | | | | | | | | | | | | |
| Investments in securities | | | | | | | Small-Mid
Cap Growth | | | Small-Mid
Cap Value | | | Small Cap
Growth | | | Small Cap
Value | |
| Level 1—Quoted prices | | | | | | | | | | | | | | | | | | | | | | | | | |
| Common Stocks | | | | | | | | $ | 2,778,249 | | | | $ | 1,717 | | | | $ | 694,086 | | | | $ | 442,230 | |
| Level 2—Other significant observable inputs | | | | | | | | | | | | | | | | | | | | | | | | | |
| Short-Term Investments | | | | | | | | | 58,026 | | | | | — | | | | | 11,412 | | | | | 6,410 | |
| Level 3—Significant unobservable inputs | | | | | | | | | | | | | | | | | | | | | | | | | |
| None | | | | | | | | | — | | | | | — | | | | | — | | | | | — | |
| Total investments in securities | | | | | | | | $ | 2,836,275 | | | | $ | 1,717 | | | | $ | 705,498 | | | | $ | 448,640 | |
| | | | | | | | | | | | | | | | | | | | | | | | | | |
| Investments in securities | | Global
Leaders | | | International
Leaders | | | International
Developed
Plus | | | Institutional
International
Developed
Plus | | | International
Growth | |
| Level 1—Quoted prices | | | | | | | | | | | | | | | | | | | | | | | | | |
| Common Stocks | | | $ | 207,081 | | | | $ | 529,004 | | | | $ | 22,202 | | | | $ | 18,753 | | | | $ | 2,115,755 | |
| Rights | | | | — | | | | | 381 | | | | | — | | | | | — | | | | | 479 | |
| Level 2—Other significant observable inputs | | | | | | | | | | | | | | | | | | | | | | | | | |
| Common Stocks | | | | — | | | | | — | | | | | — | | | | | — | | | | | 11,542 | |
| Short-Term Investments | | | | 4,765 | | | | | 17,337 | | | | | 2,046 | | | | | 1,760 | | | | | 10,766 | |
| Level 3—Significant unobservable inputs | | | | | | | | | | | | | | | | | | | | | | | | | |
| None | | | | — | | | | | — | | | | | — | | | | | — | | | | | — | |
| Total investments in securities | | | $ | 211,846 | | | | $ | 546,722 | | | | $ | 24,248 | | | | $ | 20,513 | | | | $ | 2,138,542 | |
| | | | | | | | | | | | | | | | | | | | | | | | | | |
| Investments in securities | | Institutional
International
Growth | | | International
Small Cap
Growth | | | Emerging
Markets
Leaders | | | Emerging
Markets
Growth | | | Emerging
Markets
Small Cap
Growth | |
| Level 1—Quoted prices | | | | | | | | | | | | | | | | | | | | | | | | | |
| Common Stocks | | | $ | 1,764,526 | | | | $ | 292,815 | | | | $ | 206,136 | | | | $ | 746,662 | | | | $ | 265,633 | |
| Preferred Stocks | | | | — | | | | | — | | | | | — | | | | | 13,645 | | | | | 2,138 | |
| Rights | | | | 396 | | | | | — | | | | | — | | | | | — | | | | | — | |
| Level 2—Other significant observable inputs | | | | | | | | | | | | | | | | | | | | | | | | | |
| Common Stocks | | | | 9,604 | | | | | 2,748 | | | | | 8,195 | | | | | 26,557 | | | | | 9,154 | |
| Short-Term Investments | | | | 13,848 | | | | | 13,280 | | | | | 9,083 | | | | | 14,763 | | | | | 224 | |
| Level 3—Significant unobservable inputs | | | | | | | | | | | | | | | | | | | | | | | | | |
| None | | | | — | | | | | — | | | | | — | | | | | — | | | | | — | |
| Total investments in securities | | | $ | 1,788,374 | | | | $ | 308,843 | | | | $ | 223,414 | | | | $ | 801,627 | | | | $ | 277,149 | |
| June 30, 2019 | William Blair Funds | 135 |
Notes to Financial Statements(information as of June 30, 2019 is unaudited)
| Investments in securities | | Bond | | | Income | | | Low
Duration | | | Macro
Allocation | |
| Assets | | | | | | | | | | | | | | | | | | | |
| Level 1—Quoted Prices | | | | | | | | | | | | | | | | | | | |
| Exchange-Traded Funds | | $ | — | | | | $ | — | | | | $ | — | | | | $ | 568,290 | |
| Level 2—Other significant observable inputs | | | | | | | | | | | | | | | | | | | |
| Asset-Backed Securities | | | 6,589 | | | | | 2,823 | | | | | 12,030 | | | | | — | |
| Commercial Paper | | | 7,000 | | | | | 1,200 | | | | | 1,500 | | | | | — | |
| Corporate Obligations | | | 183,475 | | | | | 22,687 | | | | | 33,360 | | | | | — | |
| Foreign Government Bond | | | — | | | | | — | | | | | — | | | | | 20,759 | |
| Short-Term Investments | | | 1,083 | | | | | 1,878 | | | | | 731 | | | | | 66,869 | |
| U.S. Government and U.S. Government Agency | | | 215,222 | | | | | 35,252 | | | | | 53,073 | | | | | 209,016 | |
| Level 3—Significant unobservable inputs | | | | | | | | | | | | | | | | | | | |
| None | | | — | | | | | — | | | | | — | | | | | — | |
| Liabilities | | | | | | | | | | | | | | | | | | | |
| Level 1—Quoted Prices | | | | | | | | | | | | | | | | | | | |
| None | | | — | | | | | — | | | | | — | | | | | — | |
| Level 2—Other significant observable inputs | | | | | | | | | | | | | | | | | | | |
| None | | | — | | | | | — | | | | | — | | | | | — | |
| Level 3—Significant unobservable inputs | | | | | | | | | | | | | | | | | | | |
| None | | | — | | | | | — | | | | | — | | | | | — | |
| Total investments in securities | | $ | 413,369 | | | | $ | 63,840 | | | | $ | 100,694 | | | | $ | 864,934 | |
| | | | | | | | | | | | | | | | | | | | |
| Other financial instruments | | | | | | | | | | | | | | | | | | | |
| | | | | | | | | | | | | | | | | | | | |
| Assets | | | | | | | | | | | | | | | | | | | |
| Level 1—Quoted Prices | | | | | | | | | | | | | | | | | | | |
| Futures Contracts | | $ | — | | | | $ | — | | | | $ | — | | | | $ | 3,354 | |
| Level 2—Other significant observable inputs | | | | | | | | | | | | | | | | | | | |
| Forward Foreign Currency Contracts | | | — | | | | | — | | | | | — | | | | | 8,544 | |
| Swaps | | | (150 | ) | | | | — | | | | | — | | | | | 5,057 | |
| Level 3—Significant unobservable inputs | | | | | | | | | | | | | | | | | | | |
| None | | | — | | | | | — | | | | | — | | | | | — | |
| Liabilities | | | | | | | | | | | | | | | | | | | |
| Level 1—Quoted Prices | | | | | | | | | | | | | | | | | | | |
| Futures Contracts | | | — | | | | | — | | | | | — | | | | | (8,643 | ) |
| Level 2—Other significant observable inputs | | | | | | | | | | | | | | | | | | | |
| Forward Foreign Currency Contracts | | | — | | | | | — | | | | | — | | | | | (10,490 | ) |
| Swaps | | | — | | | | | — | | | | | — | | | | | (2,650 | ) |
| U.S. Government Agency | | | (10,086 | ) | | | | (3,021 | ) | | | | (12,085 | ) | | | | — | |
| Level 3—Significant unobservable inputs | | | | | | | | | | | | | | | | | | | |
| None | | | — | | | | | — | | | | | — | | | | | — | |
| Total Other Financial Instruments | | $ | (10,236 | ) | | | $ | (3,021 | ) | | | $ | (12,085 | ) | | | $ | (4,828 | ) |
Level 1 Common Stocks are exchange-traded securities with a quoted price. See Portfolio of Investments for Sector Classification.
| 136 | Semiannual Report | June 30, 2019 |
Notes to Financial Statements(information as of June 30, 2019 is unaudited)
(4) Transactions with Affiliates
(a) Management and Expense Limitation Agreements
Each Fund has a management agreement with the Adviser for investment management, clerical, bookkeeping and administrative services. Each Fund pays the Adviser an annual management fee, which is accrued daily and paid monthly, based on a specified percentage of the Fund’s average daily net assets. Each Fund’s annual management fee rate is as follows:
| U.S. Equity Funds | | | |
| Growth | | | 0.75 | % |
| Large Cap Growth2 | | | 0.60 | % |
| Mid Cap Growth3 | | | 0.90 | % |
| Small-Mid Cap Growth | | | 1.00 | % |
| Small-Mid Cap Value4 | | | 0.95 | % |
| Small Cap Growth | | | 1.10 | % |
| Small Cap Value | | | 1.10 | % |
| | | | | |
| Fixed Income Funds | | | | |
| Bond | | | 0.30 | % |
| Income1: | | | | |
| First $250 million | | | 0.25 | % |
| In excess of $250 million | | | 0.20 | % |
| Low Duration | | | 0.30 | % |
| | | | | |
| Multi-Asset and Alternative Fund | | | | |
| Macro Allocation | | | 0.80 | % |
| | | | | |
| Global Equity Fund | | | | |
| Global Leaders5 | | | 0.85 | % |
| International Equity Funds | | | | |
| International Leaders6 | | | 0.85 | % |
| International Developed Plus | | | 0.90 | % |
| Institutional International Developed Plus: | | | | |
| First $500 million | | | 0.90 | % |
| Next $500 million | | | 0.85 | % |
| In excess of $1 billion | | | 0.80 | % |
| International Growth: | | | | |
| First $250 million | | | 1.10 | % |
| Next $2.25 billion | | | 1.00 | % |
| Next $2.5 billion | | | 0.975 | % |
| Next $5 billion | | | 0.95 | % |
| Next $5 billion | | | 0.925 | % |
| In excess of $15 billion | | | 0.90 | % |
| Institutional International Growth: | | | | |
| First $500 million | | | 1.00 | % |
| Next $500 million | | | 0.95 | % |
| Next $1.5 billion | | | 0.90 | % |
| Next $2.5 billion | | | 0.875 | % |
| Next $5 billion | | | 0.85 | % |
| Next $5 billion | | | 0.825 | % |
| In excess of $15 billion | | | 0.80 | % |
| International Small Cap Growth | | | 1.00 | % |
| Emerging Markets Leaders | | | 1.10 | % |
| Emerging Markets Growth | | | 1.10 | % |
| Emerging Markets Small Cap Growth | | | 1.10 | % |
| 1 | Management fee also includes a charge of 5% of gross income. |
| 2 | Prior to May 1, 2019, the Large Cap Growth Fund paid a management fee at a rate of 0.70% of the Fund’s average daily net assets. Effective May 1, 2019, the management fee paid to the Adviser was reduced to 0.60%. |
| 3 | Prior to May 1, 2019, the Mid Cap Growth Fund paid a management fee at a rate of 0.95% of the Fund’s average daily net assets. Effective May 1, 2019, the management fee paid to the Adviser was reduced to 0.90%. |
| 4 | Prior to May 1, 2019, the Small-Mid Cap Value Fund paid a management fee at a rate of 1.00% of the Fund’s average daily net assets. Effective May 1, 2019, the management fee paid to the Adviser was reduced to 0.95%. |
| 5 | Prior to May 1, 2019, the Global Leaders Fund paid a management fee at a rate of 0.95% of the Fund’s average daily net assets. Effective May 1, 2019, the management fee paid to the Adviser was reduced to 0.85%. |
| 6 | Prior to May 1, 2019, the International Leaders Fund paid a management fee at a rate of 0.90% of the Fund’s average daily net assets. Effective May 1, 2019, the management fee paid to the Adviser was reduced to 0.85%. |
| June 30, 2019 | William Blair Funds | 137 |
Notes to Financial Statements(information as of June 30, 2019 is unaudited)
The Funds have also entered into an Amended and Restated Expense Limitation Agreement with the Adviser. Under the terms of the agreement, the Adviser will waive its management fee and/or reimburse a Fund for certain operating expenses, subject to certain excluded expenses, in excess of the agreed upon rate through April 30, 2020. The amount the Adviser owes a Fund as of the reporting date is recorded as Receivable from Adviser in the Statements of Assets and Liabilities. The Adviser reimburses the Funds on a monthly basis. The Adviser will waive fees and/or reimburse expenses to the extent that the total operating expenses for the stated class of the Funds, subject to certain excluded expenses, exceed the following rates (as a percentage of average daily net assets):
| | | Class N | | Class I | | Class R6/Institutional Class |
| Fund | | Effective
May 1, 2019
through
April 30,
2020 | | Effective
May 1, 2018
through
April 30,
2019 | | Effective
May 1, 2019
through
April 30,
2020 | | Effective
May 1, 2018
through
April 30,
2019 | | Effective
May 1, 2019
through
April 30,
2020 | | Effective
May 1, 2018
through
April 30,
2019 |
| Growth | | | 1.20 | % | | | 1.20 | % | | | 0.95 | % | | | 0.95 | % | | | 0.90 | % | | | N/A | |
| Large Cap Growth | | | 0.90 | % | | | 1.05 | % | | | 0.65 | % | | | 0.80 | % | | | 0.60 | % | | | N/A | |
| Mid Cap Growth | | | 1.20 | % | | | 1.20 | % | | | 0.95 | % | | | 0.95 | % | | | 0.90 | % | | | N/A | |
| Small-Mid Cap Growth | | | 1.35 | % | | | 1.35 | % | | | 1.10 | % | | | 1.10 | % | | | 1.05 | % | | | N/A | |
| Small-Mid Cap Value | | | 1.25 | % | | | 1.25 | % | | | 1.00 | % | | | 1.00 | % | | | 0.95 | % | | | N/A | |
| Small Cap Growth | | | 1.50 | % | | | 1.50 | % | | | 1.25 | % | | | 1.25 | % | | | 1.20 | % | | | N/A | |
| Small Cap Value | | | 1.50 | % | | | 1.50 | % | | | 1.25 | % | | | 1.25 | % | | | 1.20 | % | | | N/A | |
| Global Leaders | | | 1.15 | % | | | 1.30 | % | | | 0.90 | % | | | 1.05 | % | | | 0.85 | % | | | 1.00 | % |
| International Leaders | | | 1.15 | % | | | 1.25 | % | | | 0.90 | % | | | 1.00 | % | | | 0.85 | % | | | 0.95 | % |
| International Developed Plus | | | 1.25 | % | | | 1.25 | % | | | 1.00 | % | | | 1.00 | % | | | N/A | | | | N/A | |
| Institutional International Developed Plus | | | N/A | | | | N/A | | | | N/A | | | | N/A | | | | 0.90 | % | | | 0.90 | % |
| International Growth | | | 1.45 | % | | | 1.45 | % | | | 1.20 | % | | | 1.20 | % | | | 1.15 | % | | | N/A | |
| Institutional International Growth | | | N/A | | | | N/A | | | | N/A | | | | N/A | | | | 1.05 | % | | | 1.05 | % |
| International Small Cap Growth | | | 1.55 | % | | | 1.55 | % | | | 1.30 | % | | | 1.30 | % | | | 1.25 | % | | | 1.25 | % |
| Emerging Markets Leaders | | | 1.40 | % | | | 1.55 | % | | | 1.15 | % | | | 1.30 | % | | | 1.10 | % | | | 1.25 | % |
| Emerging Markets Growth | | | 1.60 | % | | | 1.60 | % | | | 1.35 | % | | | 1.35 | % | | | 1.30 | % | | | 1.30 | % |
| Emerging Markets Small Cap Growth | | | 1.55 | % | | | 1.55 | % | | | 1.30 | % | | | 1.30 | % | | | 1.25 | % | | | 1.25 | % |
| Bond | | | 0.60 | % | | | 0.60 | % | | | 0.45 | % | | | 0.45 | % | | | 0.40 | % | | | 0.40 | % |
| Income | | | 0.85 | % | | | 0.85 | % | | | 0.70 | % | | | 0.70 | % | | | 0.65 | % | | | N/A | |
| Low Duration | | | 0.55 | % | | | 0.55 | % | | | 0.40 | % | | | 0.40 | % | | | 0.35 | % | | | 0.35 | % |
| Macro Allocation | | | 1.25 | % | | | 1.25 | % | | | 1.00 | % | | | 1.00 | % | | | 0.95 | % | | | 0.95 | % |
| 138 | Semiannual Report | June 30, 2019 |
Notes to Financial Statements(information as of June 30, 2019 is unaudited)
For the period ended June 30, 2019, the fee waivers and/or expense reimbursements received by each Fund were as follows (in thousands):
| Fund | | Class N
Waiver | | | Class I
Waiver | | | Institutional/Class R6
Waiver | | | Total
Waiver | |
| Growth | | | $8 | | | | $— | | | | $— | | | | $8 | |
| Large Cap Growth | | | 37 | | | | 75 | | | | — | | | | 112 | |
| Mid Cap Growth | | | 9 | | | | 100 | | | | — | | | | 109 | |
| Small-Mid Cap Growth | | | 171 | | | | 616 | | | | — | | | | 787 | |
| Small-Mid Cap Value | | | 13 | | | | 70 | | | | — | | | | 83 | |
| Small Cap Growth | | | 44 | | | | 15 | | | | — | | | | 59 | |
| Small Cap Value | | | 6 | | | | 151 | | | | — | | | | 157 | |
| Global Leaders | | | 7 | | | | 48 | | | | 39 | | | | 94 | |
| International Leaders | | | 6 | | | | 30 | | | | 72 | | | | 108 | |
| International Developed Plus | | | 3 | | | | 91 | | | | — | | | | 94 | |
| Institutional International Developed Plus | | | — | | | | — | | | | 56 | | | | 56 | |
| International Growth | | | 41 | | | | — | | | | — | | | | 41 | |
| Institutional International Growth | | | — | | | | — | | | | — | | | | — | |
| International Small Cap Growth | | | — | | | | — | | | | — | | | | — | |
| Emerging Markets Leaders | | | 1 | | | | 11 | | | | 39 | | | | 51 | |
| Emerging Markets Growth | | | — | | | | — | | | | — | | | | — | |
| Emerging Markets Small Cap Growth | | | 7 | | | | 133 | | | | 70 | | | | 210 | |
| Bond | | | 30 | | | | 32 | | | | — | | | | 62 | |
| Income | | | 11 | | | | 1 | | | | — | | | | 12 | |
| Low Duration | | | 2 | | | | 36 | | | | 32 | | | | 70 | |
| Macro Allocation | | | — | | | | — | | | | — | | | | — | |
(b)Underwriting, Distribution Services, and Shareholder Administration Agreements
Pursuant to separate Underwriting and Distribution Agreements, WBC is the principal underwriter and distributor for the continuous offering of shares of the Trust and acts as agent of the Trust in the sale of its shares. The Underwriting Agreement provides that the Distributor will use its best efforts to distribute the Trust’s shares. The Distributor is not compensated under the Underwriting Agreement.
Each Fund, except the Institutional International Developed Plus Fund and Institutional International Growth Fund, has a Distribution Agreement with WBC for distribution services to the Funds’ Class N shares. Each Fund pays WBC an annual fee, payable monthly, based on a specified percentage of its average daily net assets of Class N shares. The annual rate expressed as a percentage of average daily net assets for Class N is 0.25% for all Funds except the Bond, Income and Low Duration Funds, which is 0.15%. Pursuant to the Distribution Agreement, WBC enters into related selling group agreements with various firms at various rates for sales of the Funds’ Class N shares.
The Global Leaders, International Leaders, International Small Cap Growth, Emerging Markets Leaders, Emerging Markets Growth, Emerging Markets Small Cap Growth, Bond, Low Duration and Macro Allocation Funds have a Shareholder Administration Agreement with WBC to provide shareholder administration services to Class N and Class I shares. Class N and Class I shares of the Funds previously agreed to pay an annual fee, payable monthly, of 0.15% of average daily net assets attributable to each class, respectively, all of which had been waived by WBC since January 2015. Effective January 1, 2018, the fee was reduced to 0.00%. WBC has provided, and continues to provide, shareholder administration services pursuant to the Shareholder Administration Agreements.
| June 30, 2019 | William Blair Funds | 139 |
Notes to Financial Statements(information as of June 30, 2019 is unaudited)
(5) Investment Transactions
Investment transactions, excluding U.S. government securities and securities whose maturities or expiration dates at the time of purchase were one year or less, for the period ended June 30, 2019, were as follows (in thousands):
| Fund | | Purchases | | | Sales | |
| Growth | | $ | 44,023 | | | $ | 60,904 | |
| Large Cap Growth | | | 40,070 | | | | 32,964 | |
| Mid Cap Growth | | | 18,527 | | | | 20,538 | |
| Small-Mid Cap Growth | | | 790,598 | | | | 904,654 | |
| Small-Mid Cap Value | | | 1,008 | | | | 1,223 | |
| Small Cap Growth | | | 201,656 | | | | 199,305 | |
| Small Cap Value | | | 155,163 | | | | 262,950 | |
| Global Leaders | | | 31,760 | | | | 27,332 | |
| International Leaders | | | 108,900 | | | | 61,159 | |
| International Developed Plus | | | 14,481 | | | | 89,764 | |
| Institutional International Developed Plus | | | 5,194 | | | | 4,833 | |
| International Growth | | | 494,386 | | | | 833,873 | |
| Institutional International Growth | | | 400,619 | | | | 693,761 | |
| International Small Cap Growth | | | 59,050 | | | | 154,059 | |
| Emerging Markets Leaders | | | 27,288 | | | | 38,773 | |
| Emerging Markets Growth | | | 311,413 | | | | 365,103 | |
| Emerging Markets Small Cap Growth | | | 247,689 | | | | 273,933 | |
| Bond | | | 116,071 | | | | 149,913 | |
| Income | | | 37,830 | | | | 33,447 | |
| Low Duration | | | 93,828 | | | | 94,561 | |
| Macro Allocation | | | 75,329 | | | | 174,152 | |
Investment transactions in U.S. government securities whose maturities at the time of purchase were greater than one year for the period ended June 30, 2019, were as follows (in thousands):
| Fund | | Purchases | | | Sales | |
| Bond | | $ | 500 | | | $ | 1,374 | |
| Income | | | — | | | | 295 | |
| Low Duration | | | — | | | | — | |
| Macro Allocation | | | 87,878 | | | | 69,000 | |
| 140 | Semiannual Report | June 30, 2019 |
Notes to Financial Statements(information as of June 30, 2019 is unaudited)
(6) Financial Derivative Instruments
Each Fund may use derivative instruments to maintain liquidity, to provide hedging, or in anticipation of changes in the composition of its portfolio holdings or as otherwise provided in each Fund’s prospectus. Macro Allocation Fund may also use derivative instruments to obtain investment exposures. The derivative instruments held as of June 30, 2019, as disclosed in each Fund’s Portfolios of Investments, are representative of each Fund’s derivative instrument trading activity during the period ended June 30, 2019.
Derivative transactions carry counterparty risk as they are based on contracts between a Fund and the applicable counterparty. For exchange-traded or cleared derivative contracts, such counterparty risk is limited due to the role of the exchange or clearinghouse. OTC derivative contracts, however, are exposed to counterparty risk in the amount of unrealized gains, net of collateral held, for the duration of the contract.
Macro Allocation Fund is subject to certain netting arrangements through International Swaps and Derivatives Association, Inc. Master Agreements and Credit Support Annexes (“ISDAs”). The ISDAs maintain provisions for general obligations, representations, agreements, collateral and events of default or termination. The ISDAs cover certain OTC derivative securities entered into by Macro Allocation Fund with various counterparties and allow Macro Allocation Fund to close out and net its total exposure to a counterparty in the event of a default.
Futures Contracts
A futures contract provides for the future sale by one party and purchase by another party of a specified amount of a specific financial instrument for a specified price at a designated date, time and place. An index futures contract is an agreement pursuant to which the parties agree to take or make delivery of an amount of cash equal to the difference between the value of the index at the close of the last trading day of the contract and the price at which the index futures contract was originally written. A futures contract can be closed out prior to delivery by entering into an offsetting transaction in a matching futures contract. Although the value of an index might be a function of the value of certain specified securities, no physical delivery of those securities is made. If the offsetting purchase price is less than the original sale price, a Fund realizes a gain; if it is more, a Fund realizes a loss. Conversely, if the offsetting sale price is more than the original purchase price, a Fund realizes a gain; if it is less, a Fund realizes a loss. The transaction costs must also be included in these calculations. There can be no assurance, however, that a Fund will be able to enter into an offsetting transaction with respect to a particular futures contract at a particular time. If a Fund is not able to enter into an offsetting transaction, a Fund will continue to be required to maintain the margin deposits on the futures contract.
Upon entering into a futures contract, a Fund is required to pledge to the broker an amount of cash, U.S. government securities, or other liquid assets equal to a certain percentage of the contract amount (“initial margin deposit”). Futures contracts are marked to market daily and an appropriate payable or receivable for the change in value (“variation margin”) is recorded by a Fund and a cash payment is either made to or received from the broker each day. Gains or losses on futures contracts are recognized but not considered realized until the contracts expire or are closed and are included in the Statement of Operations.
Options
The purchase or sale of an option by a Fund involves the payment or receipt of a premium by the investor and the corresponding right or obligation, as the case may be, either to purchase or sell the underlying security, commodity, or other instrument for a specific price at a certain time or during a certain period. Purchasing options involves the risk that the underlying instrument will not change price in the manner expected, so the investor loses its premium. Writing options involves potentially greater risk because the investor is exposed to the extent of the actual price movement in the underlying security rather than only the amount of the premium paid (which could result in a potentially unlimited loss). OTC options also involve counterparty credit risk. Purchased options are shown as an asset in the Statement of Assets and Liabilities and are included in Investments in securities. Premiums received for written options are shown as a liability in the Statement of Assets and Liabilities. Realized gains and losses on the sale, expiration or assignment of an option are disclosed in the Statement of Operations.
Forward Foreign Currency Contracts
The Global Equity, International Equity and Multi-Asset and Alternative Funds may enter into forward foreign currency contracts. When entering into a forward foreign currency contract, a Fund agrees to receive or deliver a fixed quantity of foreign currency for an agreed-upon price on an agreed future date. A Fund’s net equity therein, representing unrealized gain or loss on the contracts as measured by the difference between the forward foreign exchange rates at the dates of entry into the contracts and
| June 30, 2019 | William Blair Funds | 141 |
Notes to Financial Statements(information as of June 30, 2019 is unaudited)
the forward rates at the reporting date, is included in the Statement of Assets and Liabilities as unrealized appreciation/depreciation on forward foreign currency contracts. Realized and unrealized gains and losses are included in the Statement of Operations. These instruments may involve market risk, credit risk, or both kinds of risks in excess of the amount recognized in the Statement of Assets and Liabilities. Risks arise from the possible inability of counterparties to meet the terms of their contracts and from the price movements in currencies.
Swap Contracts
Swap agreements may include total return, interest rate, securities index, commodity, security, currency exchange rate, credit default index, volatility and variance swaps. Cleared swaps are transacted through futures commission merchants that are members of central clearing houses with the clearing house serving as a central counterparty similar to transactions in futures contracts. In a standard “swap” transaction, two parties agree to exchange the returns (or differentials in rates of return) earned or realized on particular predetermined investments or instruments. The gross returns to be exchanged or “swapped” between the parties are calculated with respect to a “notional amount” (i.e., the change in the value of a particular dollar amount invested, for example, at a particular interest rate, in a particular foreign currency, or in a “basket” of securities representing a particular index). Swap agreements are subject to the risk that the counterparty to the swap will default on its obligation to pay a Fund and the risk that a Fund will not be able to meet its obligations to pay the counterparty to the swap. Swap agreements may also involve fees, commissions or other costs that may reduce a Fund’s gains from a swap agreement or may cause a Fund to lose money. To the extent permitted by its investment policies and restrictions, a Fund may invest in the following types of swaps:
Credit Default Swaps—A Fund may invest in credit default swaps as a means of “buying” credit protection (i.e., attempting to mitigate the risk of default or credit quality deterioration in some portion of a Fund’s holdings) or “selling” credit protection (i.e., attempting to gain exposure to an underlying issuer’s credit quality characteristics without directly investing in that issuer). A credit default swap is a contract between a buyer and a seller of protection against a pre-defined credit event (e.g., a ratings downgrade or default) on an underlying reference obligation, which may be a single debt instrument or baskets or indices of securities. A Fund may be a buyer or seller of a credit default swap. As a seller of protection on credit default swap agreements, a Fund will generally receive from the buyer of protection a fixed rate of income throughout the term of the swap provided that there is no credit event. A Fund adds leverage to its portfolio because the Fund is subject to investment exposure on the notional amount of the swap. The maximum potential amount of future payments that a Fund as a seller of protection could be required to make under a credit default swap agreement equals the notional amount of the agreement. Notional amounts of each individual credit default swap agreement outstanding as of the period end for which a Fund is the seller of protection are disclosed in the Fund’s Portfolio of Investments. These potential amounts would be partially offset by any recovery values of the respective referenced obligations, upfront payments received upon entering into the agreement, or net amounts received from the settlement of buy protection credit default swap agreements entered into by the same Fund for the same referenced entity or entities. For credit default swap contracts on credit indices, the quoted market prices and resulting values serve as an indicator of the payment performance risk. Increasing market values, in absolute terms when compared to the notional amount of the swap, typically represent deterioration of the referenced entities’ credit soundness and a greater likelihood or risk of default or other credit event occurring as defined under the terms of the swap.
Interest Rate Swap—A Fund may invest in interest rate swaps to gain or mitigate exposure to changes in interest rates. Interest rate swap agreements involve a commitment between parties to pay either a fixed interest rate or a floating interest rate based on a notional amount of principal. The parties make payments at predetermined intervals throughout the life of the swap. As a payer, a Fund would make the fixed payment and receive the floating payment. As a receiver, a Fund would make the floating payment and receive the fixed payment.
Total Return Swap—A Fund may invest in total return swaps to gain or mitigate exposure to an underlying security, or securities. Total return swap agreements may involve commitments to pay interest in exchange for the return on the underlying security, or securities. At maturity, a net cash flow is exchanged between the parties based on the total return of the underlying security, or securities, less a financing rate. As a receiver in the transaction, a Fund would receive a payment for a positive return and would make a payment for a negative return. As a payer in the transaction, a Fund would make a payment for a positive return and would receive a payment for a negative return.
Variance Swap—A Fund may invest in variance swaps in order to gain or mitigate its exposure to an underlying reference entity such as a broad based index. A variance swap is an agreement between two parties to exchange cash flows based on the measured variance of a reference entity. The payer agrees to exchange the fixed rate, which is the variance strike price of the reference
| 142 | Semiannual Report | June 30, 2019 |
Notes to Financial Statements(information as of June 30, 2019 is unaudited)
entity, to the receiver for the floating rate, which is the realized variance price of the reference entity. At the time the trade is originated, the agreed upon variance strike price is generally set so that the fair value of the swap is near zero. At maturity, a net cash flow is exchanged between the parties based on the difference between the final realized variance price of the swap and the variance strike price multiplied by the notional, or vega amount. As a receiver of the floating rate, a Fund would receive a payment if the final realized variance price is greater than the variance strike price and would make a payment if the final realized variance price is less than the variance strike price. As a payer of the floating rate, a Fund would receive a payment if the final realized variance price is less than the variance strike price and would make a payment if the final realized variance price is greater than the variance strike price.
The following table presents the value of financial derivative instruments, by Fund and primary risk exposure, as of June 30, 2019, and their respective location in the Statements of Assets and Liabilities (in thousands):
| | | Assets | | | Liabilities | |
Fund and
Primary Risk Exposure | | Statements of Assets
and Liabilities | | Value | | | Statements of Assets
and Liabilities | | Value | |
| Bond | | | | | | | | | | | | |
| Credit | | Receivable for variation margin on centrally cleared swaps | | $ | — | | | Payable for variation margin on centrally cleared swaps | | $ | 150 | |
| Macro Allocation | | | | | | | | | | | | |
| Credit | | Receivable for variation margin on centrally cleared swaps | | | 75 | | | Payable for variation margin on centrally cleared swaps | | | — | |
| Currency | | Unrealized appreciation on forward foreign currency contracts | | | 8,544 | | | Unrealized depreciation on forward foreign currency contracts | | | 10,490 | |
| Equity | | Receivable for variation margin on futures | | | 3,354 | | | Payable for variation margin on futures | | | 8,311 | |
| Equity | | Unrealized appreciation on swap contracts | | | 4,063 | | | Unrealized depreciation on swap contracts | | | — | |
| Interest rate | | Unrealized appreciation on swap contracts | | | 919 | | | Unrealized depreciation on swap contracts | | | 1,385 | |
| Interest rate | | Receivable for variation margin on futures | | | — | | | Payable for variation margin on futures | | | 332 | |
| Interest rate | | Receivable for variation margin on centrally cleared swaps | | | — | | | Payable for variation margin on centrally cleared swaps | | | 1,265 | |
The table above includes cumulative appreciation/(depreciation) on futures contracts and centrally cleared swaps as reported in the applicable Fund’s Portfolio of Investments. Variation margin receivable/payable on futures contracts and centrally cleared swaps is reported within the Statements of Assets and Liabilities.
| June 30, 2019 | William Blair Funds | 143 |
Notes to Financial Statements(information as of June 30, 2019 is unaudited)
The following table indicates the effect of derivatives, by Fund and primary risk exposure, in the Statements of Operations for the period ended June 30, 2019 (in thousands):
| | | Realized Gain (Loss) | | | Change in Net Unrealized
Appreciation (Depreciation) | |
Fund and
Primary Risk Exposure | | Statements of Operations | | Value | | | Statements of Operations | | Value | |
| Bond | | | | | | | | | | | | |
| Credit | | Swaps | | $ | (126 | ) | | Swaps | | $ | (426 | ) |
| Macro Allocation | | | | | | | | | | | | |
| Credit | | Swaps | | | 275 | | | Swaps | | | 193 | |
| Currency | | Forward foreign currency contracts | | | 15,943 | | | Forward foreign currency contracts | | | (7,141 | ) |
| Currency | | Options | | | (1,844 | ) | | Options | | | 1,484 | |
| Equity | | Futures contracts | | | (58,877 | ) | | Futures contracts | | | (13,552 | ) |
| Equity | | Options | | | (566 | ) | | Options | | | (154 | ) |
| Equity | | Swaps | | | 130 | | | Swaps | | | 4,222 | |
| Interest rate | | Futures contracts | | | (1,862 | ) | | Futures contracts | | | 110 | |
| Interest rate | | Options | | | (860 | ) | | Options | | | (409 | ) |
| Interest rate | | Swaps | | | (4,161 | ) | | Swaps | | | (794 | ) |
The following table is a summary by counterparty of the derivative instruments and collateral pledged/(received) included in the Macro Allocation Fund’s Statement of Assets and Liabilities at June 30, 2019 (in thousands):
| | | Financial Derivative Assets | | Financial Derivative Liabilities | | | | | | |
| Counterparty | | Forward
Foreign
Currency
Contracts | | Swaps | | Total | | Forward
Foreign
Currency
Contracts | | Swaps | | Total | | Net
Market
Value | | Collateral
Pledged
(Received) | | Net
Exposure |
| Citibank N.A. | | $ | 8,544 | | | $ | 2,259 | | | $ | 10,803 | | | $ | (10,490 | ) | | $ | — | | | $ | (10,490 | ) | | $ | 313 | | | $ | (313 | ) | | $ | — | |
| Credit Suisse | | | — | | | | 919 | | | | 919 | | | | — | | | | (1,385 | ) | | | (1,385 | ) | | | (466 | ) | | | 5,925 | | | | 5,459 | |
| Goldman Sachs | | | — | | | | 1,804 | | | | 1,804 | | | | — | | | | — | | | | — | | | | 1,804 | | | | (1,804 | ) | | | — | |
| | | $ | 8,544 | | | $ | 4,982 | | | $ | 13,526 | | | $ | (10,490 | ) | | $ | (1,385 | ) | | $ | (11,875 | ) | | $ | 1,651 | | | $ | 3,808 | | | $ | 5,459 | |
The net exposure represents the amount due from the counterparty in the event of default. Any net exposure is generally due to changes in market value of the underlying derivative instruments on the last day of the period as timing of collateral movement occurs the following day. For Credit Suisse, the collateral pledged is due to initial margin requirements of approximately $5,037 (in thousands) for total return swaps on futures contracts and $888 (in thousands) for the net market value of all OTC swaps. The table does not include additional collateral received in the amounts of $1,759 (in thousands) and $46 (in thousands) for Citibank N.A. and Goldman Sachs, respectively.
| 144 | Semiannual Report | June 30, 2019 |
Notes to Financial Statements(information as of June 30, 2019 is unaudited)
(7) Fund Share Transactions
The following tables summarize the activity in capital shares of each Fund for the period ended June 30, 2019 (in thousands):
| | | | | | | | | | | | | | | | | | | | | | | | Class N |
| | | | | | | | | | | | Dollars | | | | | | | | | | | | Shares |
| Fund | | Sales | | | Reinvest | | | Redemptions | | | Total | | | Sales | | | Reinvest | | | Redemptions | | | Total |
| Growth | | $ | 2,811 | | | $ | — | | | $ | 8,671 | | | $ | (5,860 | ) | | | 319 | | | | — | | | | 981 | | | | (662 | ) |
| Large Cap Growth | | | 13,195 | | | | — | | | | 8,329 | | | | 4,866 | | | | 964 | | | | — | | | | 609 | | | | 355 | |
| Mid Cap Growth | | | 147 | | | | — | | | | 436 | | | | (289 | ) | | | 14 | | | | — | | | | 42 | | | | (28 | ) |
| Small-Mid Cap Growth | | | 45,480 | | | | — | | | | 200,334 | | | | (154,854 | ) | | | 1,892 | | | | — | | | | 8,428 | | | | (6,536 | ) |
| Small-Mid Cap Value | | | 31 | | | | — | | | | 68 | | | | (37 | ) | | | 3 | | | | — | | | | 6 | | | | (3 | ) |
| Small Cap Growth | | | 34,350 | | | | — | | | | 38,509 | | | | (4,159 | ) | | | 1,320 | | | | — | | | | 1,432 | | | | (112 | ) |
| Small Cap Value | | | 894 | | | | — | | | | 3,791 | | | | (2,897 | ) | | | 52 | | | | — | | | | 223 | | | | (171 | ) |
| Global Leaders | | | 688 | | | | — | | | | 1,104 | | | | (416 | ) | | | 53 | | | | — | | | | 86 | | | | (33 | ) |
| International Leaders | | | 961 | | | | — | | | | 1,131 | | | | (170 | ) | | | 62 | | | | — | | | | 72 | | | | (10 | ) |
| International Developed Plus | | | 31 | | | | — | | | | 221 | | | | (190 | ) | | | 3 | | | | — | | | | 15 | | | | (12 | ) |
| International Growth | | | 35,917 | | | | — | | | | 75,596 | | | | (39,679 | ) | | | 1,406 | | | | — | | | | 2,951 | | | | (1,545 | ) |
| International Small Cap Growth | | | 38 | | | | — | | | | 559 | | | | (521 | ) | | | 3 | | | | — | | | | 48 | | | | (45 | ) |
| Emerging Markets Leaders | | | 2,278 | | | | — | | | | 2,582 | | | | (304 | ) | | | 242 | | | | — | | | | 279 | | | | (37 | ) |
| Emerging Markets Growth | | | 1,321 | | | | — | | | | 1,683 | | | | (362 | ) | | | 110 | | | | — | | | | 140 | | | | (30 | ) |
| Emerging Markets Small Cap Growth | | | 545 | | | | — | | | | 4,283 | | | | (3,738 | ) | | | 36 | | | | — | | | | 296 | | | | (260 | ) |
| Bond | | | 5,599 | | | | 1,378 | | | | 13,552 | | | | (6,575 | ) | | | 556 | | | | 137 | | | | 1,358 | | | | (665 | ) |
| Income | | | 903 | | | | 351 | | | | 2,926 | | | | (1,672 | ) | | | 107 | | | | 41 | | | | 346 | | | | (198 | ) |
| Low Duration | | | 121 | | | | 27 | | | | 187 | | | | (39 | ) | | | 13 | | | | 3 | | | | 21 | | | | (5 | ) |
| Macro Allocation | | | 6,512 | | | | — | | | | 13,185 | | | | (6,673 | ) | | | 570 | | | | — | | | | 1,138 | | | | (568 | ) |
| | | | | | | | | | | | | | | | | | | | | | | | Class I |
| | | | | | | | | | | | Dollars | | | | | | | | | | | | Shares |
| Fund | | Sales | | | Reinvest | | | Redemptions | | | Total | | | Sales | | | Reinvest | | | Redemptions | | | Total |
| Growth | | $ | 8,449 | | | $ | — | | | $ | 18,438 | | | $ | (9,989 | ) | | | 807 | | | | — | | | | 1,738 | | | | (931 | ) |
| Large Cap Growth | | | 19,141 | | | | — | | | | 16,261 | | | | 2,880 | | | | 1,333 | | | | — | | | | 1,155 | | | | 178 | |
| Mid Cap Growth | | | 3,938 | | | | — | | | | 6,311 | | | | (2,373 | ) | | | 349 | | | | — | | | | 556 | | | | (207 | ) |
| Small-Mid Cap Growth | | | 441,120 | | | | — | | | | 437,301 | | | | 3,819 | | | | 17,129 | | | | — | | | | 16,854 | | | | 275 | |
| Small-Mid Cap Value | | | 430 | | | | — | | | | 628 | | | | (198 | ) | | | 40 | | | | — | | | | 59 | | | | (19 | ) |
| Small Cap Growth | | | 98,261 | | | | — | | | | 97,412 | | | | 849 | | | | 3,329 | | | | — | | | | 3,251 | | | | 78 | |
| Small Cap Value | | | 28,829 | | | | — | | | | 142,163 | | | | (113,334 | ) | | | 1,630 | | | | — | | | | 8,070 | | | | (6,440 | ) |
| Global Leaders | | | 5,776 | | | | — | | | | 4,169 | | | | 1,607 | | | | 449 | | | | — | | | | 316 | | | | 133 | |
| International Leaders | | | 41,606 | | | | — | | | | 8,949 | | | | 32,657 | | | | 2,652 | | | | — | | | | 588 | | | | 2,064 | |
| International Developed Plus | | | 19 | | | | — | | | | 87,196 | | | | (87,177 | ) | | | 1 | | | | — | | | | 5,505 | | | | (5,504 | ) |
| International Growth | | | 155,129 | | | | — | | | | 444,231 | | | | (289,102 | ) | | | 5,958 | | | | — | | | | 16,762 | | | | (10,804 | ) |
| International Small Cap Growth | | | 27,334 | | | | — | | | | 63,082 | | | | (35,748 | ) | | | 2,372 | | | | — | | | | 5,490 | | | | (3,118 | ) |
| Emerging Markets Leaders | | | 4,307 | | | | — | | | | 1,799 | | | | 2,508 | | | | 459 | | | | — | | | | 192 | | | | 267 | |
| Emerging Markets Growth | | | 3,912 | | | | — | | | | 21,106 | | | | (17,194 | ) | | | 314 | | | | — | | | | 1,680 | | | | (1,366 | ) |
| Emerging Markets Small Cap Growth | | | 27,540 | | | | — | | | | 56,237 | | | | (28,697 | ) | | | 1,903 | | | | — | | | | 3,816 | | | | (1,913 | ) |
| Bond | | | 29,095 | | | | 5,037 | | | | 50,142 | | | | (16,010 | ) | | | 2,944 | | | | 505 | | | | 5,071 | | | | (1,622 | ) |
| Income | | | 14,297 | | | | 655 | | | | 8,106 | | | | 6,846 | | | | 1,709 | | | | 78 | | | | 969 | | | | 818 | |
| Low Duration | | | 4,575 | | | | 1,036 | | | | 7,302 | | | | (1,691 | ) | | | 526 | | | | 119 | | | | 838 | | | | (193 | ) |
| Macro Allocation | | | 68,581 | | | | — | | | | 126,596 | | | | (58,015 | ) | | | 5,954 | | | | — | | | | 10,953 | | | | (4,999 | ) |
| June 30, 2019 | William Blair Funds | 145 |
Notes to Financial Statements(information as of June 30, 2019 is unaudited)
| | | | | | | | | | | | | | | | | | | | | Institutional/Class R6 |
| | | | | | | | | | | | Dollars | | | | | | | | | | | | Shares |
| Fund | | Sales | | | Reinvest | | | Redemptions | | | Total | | | Sales | | | Reinvest | | | Redemptions | | | Total |
| Growth (a) | | $ | 50 | | | $ | — | | | $ | — | | | $ | 50 | | | | 5 | | | | — | | | | — | | | | 5 | |
| Large Cap Growth (a) | | | 52 | | | | — | | | | — | | | | 52 | | | | 3 | | | | — | | | | — | | | | 3 | |
| Mid Cap Growth (a) | | | 50 | | | | — | | | | — | | | | 50 | | | | 4 | | | | — | | | | — | | | | 4 | |
| Small-Mid Cap Growth (a) | | | 11,346 | | | | — | | | | — | | | | 11,346 | | | | 430 | | | | — | | | | — | | | | 430 | |
| Small-Mid Cap Value (a) | | | 18 | | | | — | | | | — | | | | 8 | | | | 1 | | | | — | | | | — | | | | 1 | |
| Small Cap Growth (a) | | | 18,416 | | | | — | | | | — | | | | 18,416 | | | | 611 | | | | — | | | | — | | | | 611 | |
| Small Cap Value (a) | | | 51 | | | | — | | | | — | | | | 51 | | | | 3 | | | | — | | | | — | | | | 3 | |
| Global Leaders | | | 1,469 | | | | — | | | | 60 | | | | 1,409 | | | | 114 | | | | — | | | | 5 | | | | 109 | |
| International Leaders | | | 25,928 | | | | — | | | | 11,110 | | | | 14,818 | | | | 1,669 | | | | — | | | | 689 | | | | 980 | |
| Institutional International Developed Plus | | | 2,000 | | | | — | | | | 1,000 | | | | 1,000 | | | | 142 | | | | — | | | | 70 | | | | 72 | |
| International Growth (a) | | | 51 | | | | — | | | | — | | | | 51 | | | | 2 | | | | — | | | | — | | | | 2 | |
| Institutional International Growth | | | 91,490 | | | | — | | | | 405,198 | | | | (313,708 | ) | | | 6,149 | | | | — | | | | 27,024 | | | | (20,875 | ) |
| International Small Cap Growth | | | 3,695 | | | | — | | | | 58,953 | | | | (55,258 | ) | | | 315 | | | | — | | | | 4,919 | | | | (4,604 | ) |
| Emerging Markets Leaders | | | 11,049 | | | | — | | | | 21,395 | | | | (10,346 | ) | | | 1,218 | | | | — | | | | 2,324 | | | | (1,106 | ) |
| Emerging Markets Growth | | | 77,491 | | | | — | | | | 115,135 | | | | (37,644 | ) | | | 6,344 | | | | — | | | | 9,265 | | | | (2,921 | ) |
| Emerging Markets Small Cap Growth | | | 21,646 | | | | — | | | | 9,017 | | | | 12,629 | | | | 1,474 | | | | — | | | | 612 | | | | 862 | |
| Bond | | | 2,110 | | | | 1,494 | | | | 11,402 | | | | (7,798 | ) | | | 214 | | | | 150 | | | | 1,149 | | | | (785 | ) |
| Income (a) | | | 50 | | | | — | | | | — | | | | 50 | | | | 6 | | | | — | | | | — | | | | 6 | |
| Low Duration | | | 3,804 | | | | 501 | | | | 8,320 | | | | (4,015 | ) | | | 437 | | | | 57 | | | | 955 | | | | (461 | ) |
| Macro Allocation | | | 101,199 | | | | — | | | | 92,251 | | | | 8,948 | | | | 8,782 | | | | — | | | | 7,962 | | | | 820 | |
| | | Net Change in Net Assets Relating to Fund Share Activity |
| | | | | | | | | | | | Dollars | | | | | | | | | | | | Shares |
| Fund | | Sales | | | Reinvest | | | Redemptions | | | Total | | | Sales | | | Reinvest | | | Redemptions | | | Total |
| Growth | | $ | 11,310 | | | $ | — | | | $ | 27,109 | | | $ | (15,799 | ) | | | 1,131 | | | | — | | | | 2,719 | | | | (1,588 | ) |
| Large Cap Growth | | | 32,388 | | | | — | | | | 24,590 | | | | 7,798 | | | | 2,300 | | | | — | | | | 1,764 | | | | 536 | |
| Mid Cap Growth | | | 4,135 | | | | — | | | | 6,747 | | | | (2,612 | ) | | | 367 | | | | — | | | | 598 | | | | (231 | ) |
| Small-Mid Cap Growth | | | 497,946 | | | | — | | | | 637,635 | | | | (139,689 | ) | | | 19,451 | | | | — | | | | 25,282 | | | | (5,831 | ) |
| Small-Mid Cap Value | | | 469 | | | | — | | | | 696 | | | | (227 | ) | | | 44 | | | | — | | | | 65 | | | | (21 | ) |
| Small Cap Growth | | | 151,027 | | | | — | | | | 135,921 | | | | 15,106 | | | | 5,260 | | | | — | | | | 4,683 | | | | 577 | |
| Small Cap Value | | | 29,774 | | | | — | | | | 145,954 | | | | (116,180 | ) | | | 1,685 | | | | — | | | | 8,293 | | | | (6,608 | ) |
| Global Leaders | | | 7,933 | | | | — | | | | 5,333 | | | | 2,600 | | | | 616 | | | | — | | | | 407 | | | | 209 | |
| International Leaders | | | 68,495 | | | | — | | | | 21,190 | | | | 47,305 | | | | 4,383 | | | | — | | | | 1,349 | | | | 3,034 | |
| International Developed Plus | | | 50 | | | | — | | | | 87,417 | | | | (87,367 | ) | | | 4 | | | | — | | | | 5,520 | | | | (5,516 | ) |
| Institutional International Developed Plus | | | 2,000 | | | | — | | | | 1,000 | | | | 1,000 | | | | 142 | | | | — | | | | 70 | | | | 72 | |
| International Growth | | | 191,097 | | | | — | | | | 519,827 | | | | (328,730 | ) | | | 7,366 | | | | — | | | | 19,713 | | | | (12,347 | ) |
| Institutional International Growth | | | 91,490 | | | | — | | | | 405,198 | | | | (313,708 | ) | | | 6,149 | | | | — | | | | 27,024 | | | | (20,875 | ) |
| International Small Cap Growth | | | 31,067 | | | | — | | | | 122,594 | | | | (91,527 | ) | | | 2,690 | | | | — | | | | 10,457 | | | | (7,767 | ) |
| Emerging Markets Leaders | | | 17,634 | | | | — | | | | 25,776 | | | | (8,142 | ) | | | 1,919 | | | | — | | | | 2,795 | | | | (876 | ) |
| Emerging Markets Growth | | | 82,724 | | | | — | | | | 137,924 | | | | (55,200 | ) | | | 6,768 | | | | — | | | | 11,085 | | | | (4,317 | ) |
| Emerging Markets Small Cap Growth | | | 49,731 | | | | — | | | | 69,537 | | | | (19,806 | ) | | | 3,413 | | | | — | | | | 4,724 | | | | (1,311 | ) |
| Bond | | | 36,804 | | | | 7,909 | | | | 75,096 | | | | (30,383 | ) | | | 3,714 | | | | 792 | | | | 7,578 | | | | (3,072 | ) |
| Income | | | 15,250 | | | | 1,006 | | | | 11,032 | | | | 5,224 | | | | 1,822 | | | | 119 | | | | 1,315 | | | | 626 | |
| Low Duration | | | 8,500 | | | | 1,564 | | | | 15,809 | | | | (5,745 | ) | | | 976 | | | | 179 | | | | 1,814 | | | | (659 | ) |
| Macro Allocation | | | 176,292 | | | | — | | | | 232,032 | | | | (55,740 | ) | | | 15,306 | | | | — | | | | 20,053 | | | | (4,747 | ) |
| (a) | For the period from May 2, 2019 (Commencement of Operations) to June 30, 2019. |
| 146 | Semiannual Report | June 30, 2019 |
Notes to Financial Statements(information as of June 30, 2019 is unaudited)
The following tables summarize the activity in capital shares of each Fund for the year ended December 31, 2018 (in thousands):
| | | Class N |
| | | | | | | | | | | | Dollars | | | | | | | | | | | | Shares |
| Fund | | Sales | | | Reinvest | | | Redemptions | | | Total | | | Sales | | | Reinvest | | | Redemptions | | | Total |
| Growth | | $ | 23,472 | | | $ | 11,875 | | | $ | 21,376 | | | $ | 13,971 | | | | 2,069 | | | | 1,409 | | | | 2,022 | | | | 1,456 | |
| Large Cap Growth | | | 29,850 | | | | 6,475 | | | | 14,335 | | | | 21,990 | | | | 2,017 | | | | 509 | | | | 994 | | | | 1,532 | |
| Mid Cap Growth | | | 708 | | | | 913 | | | | 1,816 | | | | (195 | ) | | | 60 | | | | 98 | | | | 165 | | | | (7 | ) |
| Small-Mid Cap Growth | | | 380,723 | | | | 37,279 | | | | 163,129 | | | | 254,873 | | | | 15,220 | | | | 1,679 | | | | 6,431 | | | | 10,468 | |
| Small-Mid Cap Value | | | 113 | | | | 58 | | | | 122 | | | | 49 | | | | 7 | | | | 6 | | | | 8 | | | | 5 | |
| Small Cap Growth | | | 123,547 | | | | 23,316 | | | | 86,965 | | | | 59,898 | | | | 4,080 | | | | 939 | | | | 3,187 | | | | 1,832 | |
| Small Cap Value | | | 5,677 | | | | 2,217 | | | | 14,925 | | | | (7,031 | ) | | | 281 | | | | 138 | | | | 782 | | | | (363 | ) |
| Global Leaders | | | 1,661 | | | | 1,030 | | | | 1,425 | | | | 1,266 | | | | 109 | | | | 85 | | | | 98 | | | | 96 | |
| International Leaders | | | 3,308 | | | | 312 | | | | 2,911 | | | | 709 | | | | 200 | | | | 22 | | | | 181 | | | | 41 | |
| International Developed Plus | | | 210 | | | | 37 | | | | 1,229 | | | | (982 | ) | | | 12 | | | | 3 | | | | 77 | | | | (62 | ) |
| International Growth | | | 108,982 | | | | 38,814 | | | | 295,580 | | | | (147,784 | ) | | | 3,862 | | | | 1,621 | | | | 10,783 | | | | (5,300 | ) |
| International Small Cap Growth | | | 239 | | | | 429 | | | | 1,644 | | | | (976 | ) | | | 17 | | | | 40 | | | | 130 | | | | (73 | ) |
| Emerging Markets Leaders | | | 4,063 | | | | 179 | | | | 4,196 | | | | 46 | | | | 410 | | | | 21 | | | | 410 | | | | 21 | |
| Emerging Markets Growth | | | 1,881 | | | | 889 | | | | 2,909 | | | | (139 | ) | | | 116 | | | | 79 | | | | 205 | | | | (10 | ) |
| Emerging Markets Small Cap Growth | | | 3,416 | | | | 201 | | | | 6,551 | | | | (2,934 | ) | | | 198 | | | | 14 | | | | 377 | | | | (165 | ) |
| Bond | | | 23,108 | | | | 3,396 | | | | 34,380 | | | | (7,876 | ) | | | 2,284 | | | | 340 | | | | 3,453 | | | | (829 | ) |
| Income | | | 2,428 | | | | 983 | | | | 19,283 | | | | (15,872 | ) | | | 286 | | | | 116 | | | | 2,264 | | | | (1,862 | ) |
| Low Duration | | | 1,165 | | | | 56 | | | | 1,495 | | | | (274 | ) | | | 132 | | | | 6 | | | | 169 | | | | (31 | ) |
| Macro Allocation | | | 22,540 | | | | 666 | | | | 19,962 | | | | 3,244 | | | | 1,959 | | | | 59 | | | | 1,710 | | | | 308 | |
| | | | | | | | | | | | | | | | | | | | | | | | Class I |
| | | | | | | | | | | | Dollars | | | | | | | | | | | | Shares |
| Fund | | Sales | | | Reinvest | | | Redemptions | | | Total | | | Sales | | | Reinvest | | | Redemptions | | | Total |
| Growth | | $ | 19,362 | | | $ | 48,402 | | | $ | 178,305 | | | $ | (110,541 | ) | | | 1,521 | | | | 4,909 | | | | 13,868 | | | | (7,438 | ) |
| Large Cap Growth | | | 30,159 | | | | 17,362 | | | | 81,956 | | | | (34,435 | ) | | | 1,958 | | | | 1,293 | | | | 5,120 | | | | (1,869 | ) |
| Mid Cap Growth | | | 10,073 | | | | 8,782 | | | | 30,355 | | | | (11,500 | ) | | | 806 | | | | 873 | | | | 2,485 | | | | (806 | ) |
| Small-Mid Cap Growth | | | 911,158 | | | | 156,686 | | | | 414,703 | | | | 653,141 | | | | 34,323 | | | | 6,690 | | | | 15,937 | | | | 25,076 | |
| Small-Mid Cap Value | | | 375 | | | | 381 | | | | 1,974 | | | | (1,218 | ) | | | 27 | | | | 39 | | | | 145 | | | | (79 | ) |
| Small Cap Growth | | | 202,591 | | | | 46,926 | | | | 114,306 | | | | 135,211 | | | | 6,183 | | | | 1,690 | | | | 3,677 | | | | 4,196 | |
| Small Cap Value | | | 66,163 | | | | 56,178 | | | | 145,358 | | | | (23,017 | ) | | | 3,311 | | | | 3,405 | | | | 7,213 | | | | (497 | ) |
| Global Leaders | | | 41,290 | | | | 12,892 | | | | 9,995 | | | | 44,187 | | | | 2,836 | | | | 1,066 | | | | 722 | | | | 3,180 | |
| International Leaders | | | 56,269 | | | | 2,896 | | | | 28,827 | | | | 30,338 | | | | 3,554 | | | | 202 | | | | 1,902 | | | | 1,854 | |
| International Developed Plus | | | 589 | | | | 2,119 | | | | 13,397 | | | | (10,689 | ) | �� | | 36 | | | | 150 | | | | 843 | | | | (657 | ) |
| International Growth | | | 200,613 | | | | 133,989 | | | | 531,160 | | | | (196,558 | ) | | | 6,692 | | | | 5,473 | | | | 18,564 | | | | (6,399 | ) |
| International Small Cap Growth | | | 82,715 | | | | 19,411 | | | | 169,747 | | | | (67,621 | ) | | | 5,533 | | | | 1,796 | | | | 13,158 | | | | (5,829 | ) |
| Emerging Markets Leaders | | | 9,820 | | | | 3,475 | | | | 14,210 | | | | (915 | ) | | | 917 | | | | 412 | | | | 1,420 | | | | (91 | ) |
| Emerging Markets Growth | | | 26,970 | | | | 10,009 | | | | 49,600 | | | | (12,621 | ) | | | 1,675 | | | | 876 | | | | 3,405 | | | | (854 | ) |
| Emerging Markets Small Cap Growth | | | 101,685 | | | | 4,171 | | | | 141,110 | | | | (35,254 | ) | | | 5,901 | | | | 296 | | | | 9,187 | | | | (2,990 | ) |
| Bond | | | 89,791 | | | | 13,105 | | | | 182,485 | | | | (79,589 | ) | | | 9,041 | | | | 1,324 | | | | 18,497 | | | | (8,132 | ) |
| Income | | | 8,196 | | | | 1,300 | | | | 24,129 | | | | (14,633 | ) | | | 976 | | | | 154 | | | | 2,848 | | | | (1,718 | ) |
| Low Duration | | | 9,060 | | | | 2,567 | | | | 84,883 | | | | (73,256 | ) | | | 1,029 | | | | 291 | | | | 9,591 | | | | (8,271 | ) |
| Macro Allocation | | | 204,410 | | | | 14,124 | | | | 483,628 | | | | (265,094 | ) | | | 17,377 | | | | 1,250 | | | | 41,548 | | | | (22,921 | ) |
| June 30, 2019 | William Blair Funds | 147 |
Notes to Financial Statements(information as of June 30, 2019 is unaudited)
| | | | | | | | | | | | | | | | | | | | | Institutional/Class R6 |
| | | | | | | | | | | | Dollars | | | | | | | | | | | | Shares |
| Fund | | Sales | | | Reinvest | | | Redemptions | | | Total | | | Sales | | | Reinvest | | | Redemptions | | | Total |
| Global Leaders | | $ | 3,889 | | | $ | 12,002 | | | $ | 65,440 | | | $ | (49,549 | ) | | | 268 | | | | 993 | | | | 4,170 | | | | (2,909 | ) |
| International Leaders | | | 94,113 | | | | 12,596 | | | | 30,591 | | | | 76,118 | | | | 5,729 | | | | 881 | | | | 1,917 | | | | 4,693 | |
| Institutional International Developed Plus | | | — | | | | 554 | | | | 50 | | | | 504 | | | | — | | | | 45 | | | | 4 | | | | 41 | |
| Institutional International Growth | | | 268,610 | | | | 180,253 | | | | 432,394 | | | | 16,469 | | | | 15,659 | | | | 12,959 | | | | 24,320 | | | | 4,298 | |
| International Small Cap Growth | | | 12,441 | | | | 21,099 | | | | 39,019 | | | | (5,479 | ) | | | 833 | | | | 1,941 | | | | 2,717 | | | | 57 | |
| Emerging Markets Leaders | | | 31,986 | | | | 16,112 | | | | 231,210 | | | | (183,112 | ) | | | 2,961 | | | | 1,911 | | | | 23,818 | | | | (18,946 | ) |
| Emerging Markets Growth | | | 199,420 | | | | 70,214 | | | | 513,600 | | | | (243,966 | ) | | | 14,257 | | | | 6,095 | | | | 34,162 | | | | (13,810 | ) |
| Emerging Markets Small Cap Growth | | | 52,476 | | | | 2,144 | | | | 75,303 | | | | (20,683 | ) | | | 2,989 | | | | 152 | | | | 5,051 | | | | (1,910 | ) |
| Bond | | | 4,444 | | | | 3,613 | | | | 23,146 | | | | (15,089 | ) | | | 448 | | | | 366 | | | | 2,364 | | | | (1,550 | ) |
| Low Duration | | | 6,065 | | | | 2,461 | | | | 58,720 | | | | (50,194 | ) | | | 687 | | | | 279 | | | | 6,709 | | | | (5,743 | ) |
| Macro Allocation | | | 74,626 | | | | 11,126 | | | | 161,255 | | | | (75,503 | ) | | | 6,351 | | | | 985 | | | | 13,863 | | | | (6,527 | ) |
| | | | | | | | | | | Net Change in Net Assets Relating to Fund Share Activity |
| | | | | | | | | | | | Dollars | | | | | | | | | | | | Shares |
| Fund | | Sales | | | Reinvest | | | Redemptions | | | Total | | | Sales | | | Reinvest | | | Redemptions | | | Total |
| Growth | | $ | 42,834 | | | $ | 60,277 | | | $ | 199,681 | | | $ | (96,570 | ) | | | 3,590 | | | | 6,318 | | | | 15,890 | | | | (5,982 | ) |
| Large Cap Growth | | | 60,009 | | | | 23,837 | | | | 96,291 | | | | (12,445 | ) | | | 3,975 | | | | 1,802 | | | | 6,114 | | | | (337 | ) |
| Mid Cap Growth | | | 10,781 | | | | 9,695 | | | | 32,171 | | | | (11,695 | ) | | | 866 | | | | 971 | | | | 2,650 | | | | (813 | ) |
| Small-Mid Cap Growth | | | 1,291,881 | | | | 193,965 | | | | 577,832 | | | | 908,014 | | | | 49,543 | | | | 8,369 | | | | 22,368 | | | | 35,544 | |
| Small-Mid Cap Value | | | 488 | | | | 439 | | | | 2,096 | | | | (1,169 | ) | | | 34 | | | | 45 | | | | 153 | | | | (74 | ) |
| Small Cap Growth | | | 326,138 | | | | 70,242 | | | | 201,271 | | | | 195,109 | | | | 10,263 | | | | 2,629 | | | | 6,864 | | | | 6,028 | |
| Small Cap Value | | | 71,840 | | | | 58,395 | | | | 160,283 | | | | (30,048 | ) | | | 3,592 | | | | 3,543 | | | | 7,995 | | | | (860 | ) |
| Global Leaders | | | 46,840 | | | | 25,924 | | | | 76,860 | | | | (4,096 | ) | | | 3,213 | | | | 2,144 | | | | 4,990 | | | | 367 | |
| International Leaders | | | 153,690 | | | | 15,804 | | | | 62,329 | | | | 107,165 | | | | 9,483 | | | | 1,105 | | | | 4,000 | | | | 6,588 | |
| International Developed Plus | | | 799 | | | | 2,156 | | | | 14,626 | | | | (11,671 | ) | | | 48 | | | | 153 | | | | 920 | | | | (719 | ) |
| Institutional International Developed Plus | | | — | | | | 554 | | | �� | 50 | | | | 504 | | | | — | | | | 45 | | | | 4 | | | | 41 | |
| International Growth | | | 309,595 | | | | 172,803 | | | | 826,740 | | | | (344,342 | ) | | | 10,554 | | | | 7,094 | | | | 29,347 | | | | (11,699 | ) |
| Institutional International Growth | | | 268,610 | | | | 180,253 | | | | 432,394 | | | | 16,469 | | | | 15,659 | | | | 12,959 | | | | 24,320 | | | | 4,298 | |
| International Small Cap Growth | | | 95,395 | | | | 40,939 | | | | 210,410 | | | | (74,076 | ) | | | 6,383 | | | | 3,777 | | | | 16,005 | | | | (5,845 | ) |
| Emerging Markets Leaders | | | 45,869 | | | | 19,766 | | | | 249,616 | | | | (183,981 | ) | | | 4,288 | | | | 2,344 | | | | 25,648 | | | | (19,016 | ) |
| Emerging Markets Growth | | | 228,271 | | | | 81,112 | | | | 566,109 | | | | (256,726 | ) | | | 16,048 | | | | 7,050 | | | | 37,772 | | | | (14,674 | ) |
| Emerging Markets Small Cap Growth | | | 157,577 | | | | 6,516 | | | | 222,964 | | | | (58,871 | ) | | | 9,088 | | | | 462 | | | | 14,615 | | | | (5,065 | ) |
| Bond | | | 117,343 | | | | 20,114 | | | | 240,011 | | | | (102,554 | ) | | | 11,773 | | | | 2,030 | | | | 24,314 | | | | (10,511 | ) |
| Income | | | 10,624 | | | | 2,283 | | | | 43,412 | | | | (30,505 | ) | | | 1,262 | | | | 270 | | | | 5,112 | | | | (3,580 | ) |
| Low Duration | | | 16,290 | | | | 5,084 | | | | 145,098 | | | | (123,724 | ) | | | 1,848 | | | | 576 | | | | 16,469 | | | | (14,045 | ) |
| Macro Allocation | | | 301,576 | | | | 25,916 | | | | 664,845 | | | | (337,353 | ) | | | 25,687 | | | | 2,294 | | | | 57,121 | | | | (29,140 | ) |
(8) Subsequent Events
The Funds have evaluated subsequent events through the date of issuance of the Funds’ financial statements and have determined there is no impact to the Funds’ financial statements.
| 148 | Semiannual Report | June 30, 2019 |
Financial Highlights— For a share outstanding throughout each period
Growth Fund
| | | Class N | |
| | (unaudited)
Period Ended
June 30, | | | Years Ended December 31, | |
| | | | 2019 | | | | 2018 | | | | 2017 | | | | 2016 | | | | 2015 | | | | 2014 | |
| Net asset value, beginning of year | | $ | 7.91 | | | $ | 10.27 | | | $ | 11.41 | | | $ | 12.52 | | | $ | 13.55 | | | $ | 14.79 | |
| Income (loss) from investment operations: | | | | | | | | | | | | | | | | | | | | | | | | |
| Net investment income (loss) | | | (0.01 | ) | | | (0.04 | ) | | | (0.02 | ) | | | (0.02 | ) | | | (0.04 | ) | | | (0.07 | ) |
| Net realized and unrealized gain (loss) on investments | | | 1.78 | | | | 0.75 | | | | 2.78 | | | | (0.08 | ) | | | 0.75 | | | | 1.03 | |
| Total from investment operations | | | 1.77 | | | | 0.71 | | | | 2.76 | | | | (0.10 | ) | | | 0.71 | | | | 0.96 | |
| Less distributions from: | | | | | | | | | | | | | | | | | | | | | | | | |
| Net investment income | | | — | | | | — | | | | — | | | | — | | | | — | | | | — | |
| Net realized gain | | | — | | | | 3.07 | | | | 3.90 | | | | 1.01 | | | | 1.74 | | | | 2.20 | |
| Total distributions | | | — | | | | 3.07 | | | | 3.90 | | | | 1.01 | | | | 1.74 | | | | 2.20 | |
| Net asset value, end of year | | $ | 9.68 | | | $ | 7.91 | | | $ | 10.27 | | | $ | 11.41 | | | $ | 12.52 | | | $ | 13.55 | |
| Total return (%)* | | | 22.38 | | | | 5.10 | | | | 24.35 | | | | (0.98 | ) | | | 5.31 | | | | 6.59 | |
| Ratios to average daily net assets (%)**: | | | | | | | | | | | | | | | | | | | | | | | | |
| Expenses, before waivers and reimbursements | | | 1.24 | | | | 1.22 | | | | 1.20 | | | | 1.21 | | | | 1.19 | | | | 1.18 | |
| Expenses, net of waivers and reimbursements | | | 1.20 | | | | 1.20 | | | | 1.20 | | | | 1.21 | | | | 1.19 | | | | 1.18 | |
| Net investment income (loss), before waivers and reimbursements | | | (0.27 | ) | | | (0.36 | ) | | | (0.14 | ) | | | (0.15 | ) | | | (0.29 | ) | | | (0.50 | ) |
| Net investment income (loss), net of waivers and reimbursements | | | (0.23 | ) | | | (0.34 | ) | | | (0.14 | ) | | | (0.15 | ) | | | (0.29 | ) | | | (0.50 | ) |
| Class N net assets at the end of the year (in thousands) | | $ | 40,589 | | | $ | 38,370 | | | $ | 34,886 | | | $ | 62,936 | | | $ | 149,754 | | | $ | 272,765 | |
| Portfolio turnover rate (%)* | | | 18 | | | | 46 | | | | 38 | | | | 79 | | | | 78 | | | | 100 | |
| | | | | | | | | | | | | | | | | | | | | | | | | |
| | | Class I | |
| | (unaudited)
Period Ended
June 30, | | | Years Ended December 31, | |
| | | | 2019 | | | | 2018 | | | | 2017 | | | | 2016 | | | | 2015 | | | | 2014 | |
| Net asset value, beginning of year | | $ | 9.25 | | | $ | 11.51 | | | $ | 12.39 | | | $ | 13.50 | | | $ | 14.43 | | | $ | 15.56 | |
| Income (loss) from investment operations: | | | | | | | | | | | | | | | | | | | | | | | | |
| Net investment income (loss) | | | 0.00 | ^ | | | (0.01 | ) | | | 0.02 | | | | 0.03 | | | | 0.01 | | | | (0.03 | ) |
| Net realized and unrealized gain (loss) on investments | | | 2.09 | | | | 0.82 | | | | 3.02 | | | | (0.10 | ) | | | 0.80 | | | | 1.10 | |
| Total from investment operations | | | 2.09 | | | | 0.81 | | | | 3.04 | | | | (0.07 | ) | | | 0.81 | | | | 1.07 | |
| Less distributions from: | | | | | | | | | | | | | | | | | | | | | | | | |
| Net investment income | | | — | | | | 0.00 | ^ | | | 0.02 | | | | 0.03 | | | | — | | | | — | |
| Net realized gain | | | — | | | | 3.07 | | | | 3.90 | | | | 1.01 | | | | 1.74 | | | | 2.20 | |
| Total distributions | | | — | | | | 3.07 | | | | 3.92 | | | | 1.04 | | | | 1.74 | | | | 2.20 | |
| Net asset value, end of year | | $ | 11.34 | | | $ | 9.25 | | | $ | 11.51 | | | $ | 12.39 | | | $ | 13.50 | | | $ | 14.43 | |
| Total return (%)* | | | 22.59 | | | | 5.42 | | | | 24.64 | | | | (0.69 | ) | | | 5.69 | | | | 6.96 | |
| Ratios to average daily net assets (%)**: | | | | | | | | | | | | | | | | | | | | | | | | |
| Expenses | | | 0.93 | | | | 0.91 | | | | 0.92 | | | | 0.90 | | | | 0.89 | | | | 0.86 | |
| Net investment income (loss) | | | 0.04 | | | | (0.06 | ) | | | 0.12 | | | | 0.20 | | | | 0.06 | | | | (0.20 | ) |
| Class I net assets at the end of the year (in thousands) | | $ | 219,144 | | | $ | 187,306 | | | $ | 318,848 | | | $ | 514,870 | | | $ | 696,744 | | | $ | 688,038 | |
| Portfolio turnover rate (%)* | | | 18 | | | | 46 | | | | 38 | | | | 79 | | | | 78 | | | | 100 | |
| * | Rates are not annualized for periods less than a year. |
| ** | Rates are annualized for periods less than a year. |
| ^ | Amount is less than $0.005 per share. |
Note: Net investment income (loss) per share is based on the average shares outstanding during the year.
Performance cited represents past performance. Past performance does not guarantee future results and current performance may be lower or higher than the data quoted. Results shown are annual returns, which assume reinvestment of dividends and capital gains. Investment returns and principal will fluctuate and you may have a gain or loss when you sell shares. For the most current month-end performance information, please call 1-800-742-7272 or visit our Web site atwww.williamblairfunds.com.
| June 30, 2019 | William Blair Funds | 149 |
Financial Highlights— For a share outstanding throughout each period
Growth Fund
| | | Class R6 | |
| | (unaudited) | |
| | Period Ended | |
| | June 30, | |
| | | | 2019(a) | |
| Net asset value, beginning of year | | $ | 11.06 | |
| Income (loss) from investment operations: | | | | |
| Net investment income (loss) | | | 0.00 | ^ |
| Net realized and unrealized gain (loss) on investments | | | 0.28 | |
| Total from investment operations | | | 0.28 | |
| Less distributions from: | | | | |
| Net investment income | | | — | |
| Net realized gain | | | — | |
| Total distributions | | | — | |
| Net asset value, end of year | | $ | 11.34 | |
| Total return (%)* | | | 2.53 | |
| Ratios to average daily net assets (%)**: | | | | |
| Expenses | | | 0.87 | |
| Net investment income (loss) | | | 0.23 | |
| Class R6 net assets at the end of the year (in thousands) | | $ | 51 | |
| Portfolio turnover rate (%)* | | | 18 | |
| (a) | For the period from May 2, 2019 (Commencement of Operations) to June 30, 2019. |
| * | Rates are not annualized for periods less than a year. |
| ** | Rates are annualized for periods less than a year. |
| ^ | Amount is less than $0.005 per share. |
Note: Net investment income (loss) per share is based on the average shares outstanding during the year.
Performance cited represents past performance. Past performance does not guarantee future results and current performance may be lower or higher than the data quoted. Results shown are annual returns, which assume reinvestment of dividends and capital gains. Investment returns and principal will fluctuate and you may have a gain or loss when you sell shares. For the most current month-end performance information, please call 1-800-742-7272 or visit our Web site atwww.williamblairfunds.com.
| 150 | Semiannual Report | June 30, 2019 |
Financial Highlights— For a share outstanding throughout each period
Large Cap Growth Fund
| | | Class N | |
| | (unaudited)
Period Ended
June 30, | | | Years Ended December 31, | |
| | | | 2019 | | | | 2018 | | | | 2017 | | | | 2016 | | | | 2015 | | | | 2014 | |
| Net asset value, beginning of year | | $ | 11.99 | | | $ | 13.35 | | | $ | 10.26 | | | $ | 10.15 | | | $ | 10.46 | | | $ | 10.03 | |
| Income (loss) from investment operations: | | | | | | | | | | | | | | | | | | | | | | | | |
| Net investment income (loss) | | | 0.00 | ^ | | | (0.02 | ) | | | (0.02 | ) | | | 0.02 | | | | (0.02 | ) | | | (0.02 | ) |
| Net realized and unrealized gain (loss) on investments | | | 2.89 | | | | 0.81 | | | | 3.19 | | | | 0.18 | | | | 0.75 | | | | 1.46 | |
| Total from investment operations | | | 2.89 | | | | 0.79 | | | | 3.17 | | | | 0.20 | | | | 0.73 | | | | 1.44 | |
| Less distributions from: | | | | | | | | | | | | | | | | | | | | | | | | |
| Net investment income | | | — | | | | — | | | | — | | | | 0.01 | | | | — | | | | — | |
| Net realized gain | | | — | | | | 2.15 | | | | 0.08 | | | | 0.08 | | | | 1.04 | | | | 1.01 | |
| Total distributions | | | — | | | | 2.15 | | | | 0.08 | | | | 0.09 | | | | 1.04 | | | | 1.01 | |
| Net asset value, end of year | | $ | 14.88 | | | $ | 11.99 | | | $ | 13.35 | | | $ | 10.26 | | | $ | 10.15 | | | $ | 10.46 | |
| Total return (%)* | | | 24.10 | | | | 4.96 | | | | 30.88 | | | | 1.97 | | | | 7.04 | | | | 14.29 | |
| Ratios to average daily net assets (%)**: | | | | | | | | | | | | | | | | | | | | | | | | |
| Expenses, before waivers and reimbursements | | | 1.15 | | | | 1.21 | | | | 1.19 | | | | 1.23 | | | | 1.28 | | | | 1.31 | |
| Expenses, net of waivers and reimbursements | | | 1.00 | | | | 1.05 | | | | 1.05 | | | | 1.05 | | | | 1.07 | | | | 1.13 | |
| Net investment income (loss), before waivers and reimbursements | | | (0.09 | ) | | | (0.33 | ) | | | (0.27 | ) | | | (0.01 | ) | | | (0.43 | ) | | | (0.41 | ) |
| Net investment income (loss), net of waivers and reimbursements | | | 0.06 | | | | (0.17 | ) | | | (0.13 | ) | | | 0.17 | | | | (0.22 | ) | | | (0.23 | ) |
| Class N net assets at the end of the year (in thousands) | | $ | 56,605 | | | $ | 41,361 | | | $ | 25,604 | | | $ | 11,860 | | | $ | 10,443 | | | $ | 8,831 | |
| Portfolio turnover rate (%)* | | | 16 | | | | 47 | | | | 29 | | | | 44 | | | | 38 | | | | 50 | |
| | | | | | | | | | | | | | | | | | | | | | | | | |
| | | Class I | |
| | (unaudited)
Period Ended
June 30, | | | Years Ended December 31, | |
| | | | 2019 | | | | 2018 | | | | 2017 | | | | 2016 | | | | 2015 | | | | 2014 | |
| Net asset value, beginning of year | | $ | 12.66 | | | $ | 13.97 | | | $ | 10.70 | | | $ | 10.58 | | | $ | 10.84 | | | $ | 10.33 | |
| Income (loss) from investment operations: | | | | | | | | | | | | | | | | | | | | | | | | |
| Net investment income (loss) | | | 0.02 | | | | 0.01 | | | | 0.02 | | | | 0.04 | | | | (0.00 | )^ | | | 0.00 | ^ |
| Net realized and unrealized gain (loss) on investments | | | 3.05 | | | | 0.85 | | | | 3.33 | | | | 0.19 | | | | 0.78 | | | | 1.52 | |
| Total from investment operations | | | 3.07 | | | | 0.86 | | | | 3.35 | | | | 0.23 | | | | 0.78 | | | | 1.52 | |
| Less distributions from: | | | | | | | | | | | | | | | | | | | | | | | | |
| Net investment income | | | — | | | | 0.02 | | | | — | | | | 0.03 | | | | — | | | | — | |
| Net realized gain | | | — | | | | 2.15 | | | | 0.08 | | | | 0.08 | | | | 1.04 | | | | 1.01 | |
| Total distributions | | | — | | | | 2.17 | | | | 0.08 | | | | 0.11 | | | | 1.04 | | | | 1.01 | |
| Net asset value, end of year | | $ | 15.73 | | | $ | 12.66 | | | $ | 13.97 | | | $ | 10.70 | | | $ | 10.58 | | | $ | 10.84 | |
| Total return (%)* | | | 24.25 | | | | 5.21 | | | | 31.29 | | | | 2.22 | | | | 7.26 | | | | 14.65 | |
| Ratios to average daily net assets (%)**: | | | | | | | | | | | | | | | | | | | | | | | | |
| Expenses, before waivers and reimbursements | | | 0.84 | | | | 0.90 | | | | 0.90 | | | | 0.91 | | | | 0.95 | | | | 1.00 | |
| Expenses, net of waivers and reimbursements | | | 0.75 | | | | 0.80 | | | | 0.80 | | | | 0.80 | | | | 0.82 | | | | 0.88 | |
| Net investment income (loss), before waivers and reimbursements | | | 0.22 | | | | (0.01 | ) | | | 0.03 | | | | 0.30 | | | | (0.10 | ) | | | (0.10 | ) |
| Net investment income (loss), net of waivers and reimbursements | | | 0.31 | | | | 0.09 | | | | 0.13 | | | | 0.41 | | | | 0.03 | | | | 0.02 | |
| Class I net assets at the end of the year (in thousands) | | $ | 173,745 | | | $ | 137,599 | | | $ | 177,959 | | | $ | 110,475 | | | $ | 59,038 | | | $ | 50,778 | |
| Portfolio turnover rate (%)* | | | 16 | | | | 47 | | | | 29 | | | | 44 | | | | 38 | | | | 50 | |
| * | Rates are not annualized for periods less than a year. |
| ** | Rates are annualized for periods less than a year. |
| ^ | Amount is less than $0.005 per share. |
Note: Net investment income (loss) per share is based on the average shares outstanding during the year.
Performance cited represents past performance. Past performance does not guarantee future results and current performance may be lower or higher than the data quoted. Results shown are annual returns, which assume reinvestment of dividends and capital gains. Investment returns and principal will fluctuate and you may have a gain or loss when you sell shares. For the most current month-end performance information, please call 1-800-742-7272 or visit our Web site atwww.williamblairfunds.com.
| June 30, 2019 | William Blair Funds | 151 |
Financial Highlights— For a share outstanding throughout each period
Large Cap Growth Fund
| | | Class R6 | |
| | (unaudited) | |
| | Period Ended | |
| | June 30, | |
| | 2019(a) | |
| Net asset value, beginning of year | | $ | 15.12 | |
| Income (loss) from investment operations: | | | | |
| Net investment income (loss) | | | 0.01 | |
| Net realized and unrealized gain (loss) on investments | | | 0.60 | |
| Total from investment operations | | | 0.61 | |
| Less distributions from: | | | | |
| Net investment income | | | — | |
| Net realized gain | | | — | |
| Total distributions | | | — | |
| Net asset value, end of year | | $ | 15.73 | |
| Total return (%)* | | | 4.03 | |
| Ratios to average daily net assets (%)**: | | | | |
| Expenses, before waivers and reimbursements | | | 0.70 | |
| Expenses, net of waivers and reimbursements | | | 0.60 | |
| Net investment income (loss), before waivers and reimbursements | | | 0.26 | |
| Net investment income (loss), net of waivers and reimbursements | | | 0.36 | |
| Class R6 net assets at the end of the year (in thousands) | | $ | 52 | |
| Portfolio turnover rate (%)* | | | 16 | |
| (a) | For the period from May 2, 2019 (Commencement of Operations) to June 30, 2019 |
| * | Rates are not annualized for periods less than a year. |
| ** | Rates are annualized for periods less than a year. |
Note: Net investment income (loss) per share is based on the average shares outstanding during the year.
Performance cited represents past performance. Past performance does not guarantee future results and current performance may be lower or higher than the data quoted. Results shown are annual returns, which assume reinvestment of dividends and capital gains. Investment returns and principal will fluctuate and you may have a gain or loss when you sell shares. For the most current month-end performance information, please call 1-800-742-7272 or visit our Web site atwww.williamblairfunds.com.
| 152 | Semiannual Report | June 30, 2019 |
Financial Highlights— For a share outstanding throughout each period
Mid Cap Growth Fund
| | | Class N | |
| | (unaudited)
Period Ended
June 30, | | | Years Ended December 31, | |
| | | | 2019 | | | | 2018 | | | | 2017 | | | | 2016 | | | | 2015 | | | | 2014 | |
| Net asset value, beginning of year | | $ | 8.87 | | | $ | 10.92 | | | $ | 10.69 | | | $ | 11.28 | | | $ | 14.20 | | | $ | 15.21 | |
| Income (loss) from investment operations: | | | | | | | | | | | | | | | | | | | | | | | | |
| Net investment income (loss) | | | (0.02 | ) | | | (0.06 | ) | | | (0.08 | ) | | | (0.06 | ) | | | (0.09 | ) | | | (0.12 | ) |
| Net realized and unrealized gain (loss) on investments | | | 2.45 | | | | 0.03 | | | | 2.29 | | | | 0.09 | | | | 0.04 | | | | 1.26 | |
| Total from investment operations | | | 2.43 | | | | (0.03 | ) | | | 2.21 | | | | 0.03 | | | | (0.05 | ) | | | 1.14 | |
| Less distributions from: | | | | | | | | | | | | | | | | | | | | | | | | |
| Net investment income | | | — | | | | — | | | | — | | | | — | | | | — | | | | — | |
| Net realized gain | | | — | | | | 2.02 | | | | 1.98 | | | | 0.62 | | | | 2.87 | | | | 2.15 | |
| Total distributions | | | — | | | | 2.02 | | | | 1.98 | | | | 0.62 | | | | 2.87 | | | | 2.15 | |
| Net asset value, end of year | | $ | 11.30 | | | $ | 8.87 | | | $ | 10.92 | | | $ | 10.69 | | | $ | 11.28 | | | $ | 14.20 | |
| Total return (%)* | | | 27.40 | | | | (1.20 | ) | | | 20.88 | | | | 0.23 | | | | (0.20 | ) | | | 7.53 | |
| Ratios to average daily net assets (%)**: | | | | | | | | | | | | | | | | | | | | | | | | |
| Expenses, before waivers and reimbursements | | | 1.53 | | | | 1.57 | | | | 1.49 | | | | 1.45 | | | | 1.43 | | | | 1.35 | |
| Expenses, net of waivers and reimbursements | | | 1.20 | | | | 1.23 | | | | 1.30 | | | | 1.30 | | | | 1.32 | | | | 1.35 | |
| Net investment income (loss), before waivers and reimbursements | | | (0.78 | ) | | | (0.85 | ) | | | (0.84 | ) | | | (0.68 | ) | | | (0.76 | ) | | | (0.80 | ) |
| Net investment income (loss), net of waivers and reimbursements | | | (0.45 | ) | | | (0.51 | ) | | | (0.65 | ) | | | (0.53 | ) | | | (0.65 | ) | | | (0.80 | ) |
| Class N net assets at the end of the year (in thousands) | | $ | 5,974 | | | $ | 4,944 | | | $ | 6,166 | | | $ | 16,234 | | | $ | 25,105 | | | $ | 37,413 | |
| Portfolio turnover rate (%)* | | | 29 | | | | 58 | | | | 59 | | | | 60 | | | | 65 | | | | 81 | |
| | | | | | | | | | | | | | | | | | | | | | | | | |
| | | Class I | |
| | (unaudited)
Period Ended
June 30, | | | Years Ended December 31, | |
| | | | 2019 | | | | 2018 | | | | 2017 | | | | 2016 | | | | 2015 | | | | 2014 | |
| Net asset value, beginning of year | | $ | 9.55 | | | $ | 11.57 | | | $ | 11.20 | | | $ | 11.76 | | | $ | 14.65 | | | $ | 15.58 | |
| Income (loss) from investment operations: | | | | | | | | | | | | | | | | | | | | | | | | |
| Net investment income (loss) | | | (0.01 | ) | | | (0.03 | ) | | | (0.05 | ) | | | (0.03 | ) | | | (0.06 | ) | | | (0.09 | ) |
| Net realized and unrealized gain (loss) on investments | | | 2.63 | | | | 0.03 | | | | 2.40 | | | | 0.09 | | | | 0.04 | | | | 1.31 | |
| Total from investment operations | | | 2.62 | | | | — | | | | 2.35 | | | | 0.06 | | | | (0.02 | ) | | | 1.22 | |
| Less distributions from: | | | | | | | | | | | | | | | | | | | | | | | | |
| Net investment income | | | — | | | | — | | | | — | | | | — | | | | — | | | | — | |
| Net realized gain | | | — | | | | 2.02 | | | | 1.98 | | | | 0.62 | | | | 2.87 | | | | 2.15 | |
| Total distributions | | | — | | | | 2.02 | | | | 1.98 | | | | 0.62 | | | | 2.87 | | | | 2.15 | |
| Net asset value, end of year | | $ | 12.17 | | | $ | 9.55 | | | $ | 11.57 | | | $ | 11.20 | | | $ | 11.76 | | | $ | 14.65 | |
| Total return (%)* | | | 27.43 | | | | (0.86 | ) | | | 21.18 | | | | 0.48 | | | | 0.00 | | | | 7.87 | |
| Ratios to average daily net assets (%)**: | | | | | | | | | | | | | | | | | | | | | | | | |
| Expenses, before waivers and reimbursements | | | 1.29 | | | | 1.31 | | | | 1.23 | | | | 1.18 | | | | 1.14 | | | | 1.10 | |
| Expenses, net of waivers and reimbursements | | | 0.95 | | | | 0.98 | | | | 1.05 | | | | 1.05 | | | | 1.07 | | | | 1.10 | |
| Net investment income (loss), before waivers and reimbursements | | | (0.53 | ) | | | (0.58 | ) | | | (0.58 | ) | | | (0.39 | ) | | | (0.48 | ) | | | (0.55 | ) |
| Net investment income (loss), net of waivers and reimbursements | | | (0.19 | ) | | | (0.25 | ) | | | (0.40 | ) | | | (0.26 | ) | | | (0.41 | ) | | | (0.55 | ) |
| Class I net assets at the end of the year (in thousands) | | $ | 62,722 | | | $ | 51,173 | | | $ | 71,369 | | | $ | 119,424 | | | $ | 174,617 | | | $ | 302,373 | |
| Portfolio turnover rate (%)* | | | 29 | | | | 58 | | | | 59 | | | | 60 | | | | 65 | | | | 81 | |
| * | Rates are not annualized for periods less than a year. |
| ** | Rates are annualized for periods less than a year. |
Note: Net investment income (loss) per share is based on the average shares outstanding during the year.
Performance cited represents past performance. Past performance does not guarantee future results and current performance may be lower or higher than the data quoted. Results shown are annual returns, which assume reinvestment of dividends and capital gains. Investment returns and principal will fluctuate and you may have a gain or loss when you sell shares. For the most current month-end performance information, please call 1-800-742-7272 or visit our Web site atwww.williamblairfunds.com.
| June 30, 2019 | William Blair Funds | 153 |
Financial Highlights— For a share outstanding throughout each period
Mid Cap Growth Fund
| | | Class R6 | |
| | (unaudited) | |
| | Period Ended | |
| | June 30, | |
| | 2019(a) | |
| Net asset value, beginning of year | | $ | 11.93 | |
| Income (loss) from investment operations: | | | | |
| Net investment income (loss) | | | 0.00 | ^ |
| Net realized and unrealized gain (loss) on investments | | | 0.24 | |
| Total from investment operations | | | 0.24 | |
| Less distributions from: | | | | |
| Net investment income | | | — | |
| Net realized gain | | | — | |
| Total distributions | | | — | |
| Net asset value, end of year | | $ | 12.17 | |
| Total return (%)* | | | 2.01 | |
| Ratios to average daily net assets (%)**: | | | | |
| Expenses, before waivers and reimbursements | | | 1.14 | |
| Expenses, net of waivers and reimbursements | | | 0.90 | |
| Net investment income (loss), before waivers and reimbursements. | | | (0.23 | ) |
| Net investment income (loss), net of waivers and reimbursements | | | 0.01 | |
| Class R6 net assets at the end of the year (in thousands) | | $ | 51 | |
| Portfolio turnover rate (%)* | | | 29 | |
| (a) | For the period from May 2, 2019 (Commencement of Operations) to June 30, 2019. |
| * | Rates are not annualized for periods less than a year. |
| ** | Rates are annualized for periods less than a year. |
| ^ | Amount is less than $0.005 per share. |
Note: Net investment income (loss) per share is based on the average shares outstanding during the year.
Performance cited represents past performance. Past performance does not guarantee future results and current performance may be lower or higher than the data quoted. Results shown are annual returns, which assume reinvestment of dividends and capital gains. Investment returns and principal will fluctuate and you may have a gain or loss when you sell shares. For the most current month-end performance information, please call 1-800-742-7272 or visit our Web site atwww.williamblairfunds.com.
| 154 | Semiannual Report | June 30, 2019 |
Financial Highlights— For a share outstanding throughout each period
Small-Mid Cap Growth Fund
| | Class N | |
| | (unaudited)
Period Ended
June 30, | | | Years Ended December 31, | |
| | | 2019 | | | 2018 | | | 2017 | | | 2016 | | | 2015 | | | 2014 | |
| Net asset value, beginning of year | | $ | 20.97 | | | $ | 23.36 | | | $ | 19.20 | | | $ | 18.53 | | | $ | 18.72 | | | $ | 18.80 | |
| Income (loss) from investment operations: | | | | | | | | | | | | | | | | | | | | | | | | |
| Net investment income (loss) | | | (0.09 | ) | | | (0.18 | ) | | | (0.16 | ) | | | (0.09 | ) | | | (0.10 | ) | | | (0.12 | ) |
| Net realized and unrealized gain (loss) on investments | | | 5.18 | | | | (0.25 | ) | | | 5.62 | | | | 1.29 | | | | 0.93 | | | | 1.68 | |
| Total from investment operations | | | 5.09 | | | | (0.43 | ) | | | 5.46 | | | | 1.20 | | | | 0.83 | | | | 1.56 | |
| Less distributions from: | | | | | | | | | | | | | | | | | | | | | | | | |
| Net investment income | | | — | | | | — | | | | — | | | | — | | | | — | | | | — | |
| Net realized gain | | | — | | | | 1.96 | | | | 1.30 | | | | 0.53 | | | | 1.02 | | | | 1.64 | |
| Total distributions | | | — | | | | 1.96 | | | | 1.30 | | | | 0.53 | | | | 1.02 | | | | 1.64 | |
| Net asset value, end of year | | $ | 26.06 | | | $ | 20.97 | | | $ | 23.36 | | | $ | 19.20 | | | $ | 18.53 | | | $ | 18.72 | |
| Total return (%)* | | | 24.27 | | | | (2.29 | ) | | | 28.57 | | | | 6.45 | | | | 4.47 | | | | 8.33 | |
| Ratios to average daily net assets (%)**: | | | | | | | | | | | | | | | | | | | | | | | | |
| Expenses, before waivers and reimbursements | | | 1.44 | | | | 1.44 | | | | 1.43 | | | | 1.43 | | | | 1.42 | | | | 1.38 | |
| Expenses, net of waivers and reimbursements | | | 1.35 | | | | 1.35 | | | | 1.35 | | | | 1.35 | | | | 1.35 | | | | 1.35 | |
| Net investment income (loss), before waivers and reimbursements | | | (0.86 | ) | | | (0.81 | ) | | | (0.82 | ) | | | (0.59 | ) | | | (0.58 | ) | | | (0.66 | ) |
| Net investment income (loss), net of waivers and reimbursements | | | (0.77 | ) | | | (0.72 | ) | | | (0.74 | ) | | | (0.51 | ) | | | (0.51 | ) | | | (0.63 | ) |
| Class N net assets at the end of the year (in thousands) | | $ | 357,654 | | | $ | 424,865 | | | $ | 228,828 | | | $ | 171,638 | | | $ | 169,595 | | | $ | 83,047 | |
| Portfolio turnover rate (%)* | | | 30 | | | | 46 | | | | 64 | | | | 66 | | | | 44 | | | | 49 | |
| | | | | | | | | | | | | | | | | | | | | | | | | |
| | Class I | |
| | (unaudited)
Period Ended
June 30, | | | Years Ended December 31, | |
| | | 2019 | | | 2018 | | | 2017 | | | 2016 | | | 2015 | | | 2014 | |
| Net asset value, beginning of year | | $ | 22.12 | | | $ | 24.48 | | | $ | 20.02 | | | $ | 19.25 | | | $ | 19.36 | | | $ | 19.34 | |
| Income (loss) from investment operations: | | | | | | | | | | | | | | | | | | | | | | | | |
| Net investment income (loss) | | | (0.06 | ) | | | (0.12 | ) | | | (0.11 | ) | | | (0.05 | ) | | | (0.06 | ) | | | (0.08 | ) |
| Net realized and unrealized gain (loss) on investments | | | 5.47 | | | | (0.28 | ) | | | 5.87 | | | | 1.35 | | | | 0.97 | | | | 1.74 | |
| Total from investment operations | | | 5.41 | | | | (0.40 | ) | | | 5.76 | | | | 1.30 | | | | 0.91 | | | | 1.66 | |
| Less distributions from: | | | | | | | | | | | | | | | | | | | | | | | | |
| Net investment income | | | — | | | | — | | | | — | | | | — | | | | — | | | | — | |
| Net realized gain | | | — | | | | 1.96 | | | | 1.30 | | | | 0.53 | | | | 1.02 | | | | 1.64 | |
| Total distributions | | | — | | | | 1.96 | | | | 1.30 | | | | 0.53 | | | | 1.02 | | | | 1.64 | |
| Net asset value, end of year | | $ | 27.53 | | | $ | 22.12 | | | $ | 24.48 | | | $ | 20.02 | | | $ | 19.25 | | | $ | 19.36 | |
| Total return (%)* | | | 24.46 | | | | (2.06 | ) | | | 28.90 | | | | 6.72 | | | | 4.74 | | | | 8.62 | |
| Ratios to average daily net assets (%)**: | | | | | | | | | | | | | | | | | | | | | | | | |
| Expenses, before waivers and reimbursements | | | 1.15 | | | | 1.16 | | | | 1.16 | | | | 1.16 | | | | 1.15 | | | | 1.15 | |
| Expenses, net of waivers and reimbursements | | | 1.10 | | | | 1.10 | | | | 1.10 | | | | 1.10 | | | | 1.10 | | | | 1.10 | |
| Net investment income (loss), before waivers and reimbursements | | | (0.53 | ) | | | (0.53 | ) | | | (0.55 | ) | | | (0.34 | ) | | | (0.33 | ) | | | (0.43 | ) |
| Net investment income (loss), net of waivers and reimbursements | | | (0.48 | ) | | | (0.47 | ) | | | (0.49 | ) | | | (0.28 | ) | | | (0.28 | ) | | | (0.38 | ) |
| Class I net assets at the end of the year (in thousands) | | $ | 2,469,870 | | | $ | 1,979,105 | | | $ | 1,576,180 | | | $ | 1,090,939 | | | $ | 1,019,544 | | | $ | 793,789 | |
| Portfolio turnover rate (%)* | | | 30 | | | | 46 | | | | 64 | | | | 66 | | | | 44 | | | | 49 | |
| * | Rates are not annualized for periods less than a year. |
| ** | Rates are annualized for periods less than a year. |
Note: Net investment income (loss) per share is based on the average shares outstanding during the year.
Performance cited represents past performance. Past performance does not guarantee future results and current performance may be lower or higher than the data quoted. Results shown are annual returns, which assume reinvestment of dividends and capital gains. Investment returns and principal will fluctuate and you may have a gain or loss when you sell shares. For the most current month-end performance information, please call 1-800-742-7272 or visit our Web site atwww.williamblairfunds.com.
| June 30, 2019 | William Blair Funds | 155 |
Financial Highlights— For a share outstanding throughout each period
Small-Mid Cap Growth Fund
| | Class R6 | |
| | (unaudited)
Period Ended
June 30, | |
| | 2019(a) | |
| Net asset value, beginning of year | | $ | 26.76 | |
| Income (loss) from investment operations: | | | | |
| Net investment income (loss) | | | (0.01 | ) |
| Net realized and unrealized gain (loss) on investments | | | 0.79 | |
| Total from investment operations | | | 0.78 | |
| Less distributions from: | | | | |
| Net investment income | | | — | |
| Net realized gain | | | — | |
| Total distributions | | | — | |
| Net asset value, end of year | | $ | 27.54 | |
| Total return (%)* | | | 2.91 | |
| Ratios to average daily net assets (%)**: | | | | |
| Expenses, before waivers and reimbursements | | | 1.06 | |
| Expenses, net of waivers and reimbursements | | | 1.05 | |
| Net investment income (loss), before waivers and reimbursements | | | (0.31 | ) |
| Net investment income (loss), net of waivers and reimbursements | | | (0.30 | ) |
| Class R6 net assets at the end of the year (in thousands) | | $ | 11,837 | |
| Portfolio turnover rate (%)* | | | 30 | |
| (a) | For the period from May 2, 2019 (Commencement of Operations) to June 30, 2019. |
| * | Rates are not annualized for periods less than a year. |
| ** | Rates are annualized for periods less than a year. |
Note: Net investment income (loss) per share is based on the average shares outstanding during the year.
Performance cited represents past performance. Past performance does not guarantee future results and current performance may be lower or higher than the data quoted. Results shown are annual returns, which assume reinvestment of dividends and capital gains. Investment returns and principal will fluctuate and you may have a gain or loss when you sell shares. For the most current month-end performance information, please call 1-800-742-7272 or visit our Web site atwww.williamblairfunds.com.
| 156 | Semiannual Report | June 30, 2019 |
Financial Highlights— For a share outstanding throughout each period
Small-Mid Cap Value Fund
| | Class N | |
| | (unaudited)
Period Ended
June 30, | | | Years Ended December 31, | |
| | | 2019 | | | 2018 | | | 2017 | | | 2016 | | | 2015 | | | 2014 | |
| Net asset value, beginning of year | | $ | 9.31 | | | $ | 14.31 | | | $ | 14.53 | | | $ | 12.54 | | | $ | 13.63 | | | $ | 14.11 | |
| Income (loss) from investment operations: | | | | | | | | | | | | | | | | | | | | | | | | |
| Net investment income (loss) | | | 0.05 | | | | 0.09 | | | | 0.04 | | | | 0.04 | | | | 0.04 | | | | 0.00 | ^ |
| Net realized and unrealized gain (loss) on investments | | | 1.49 | | | | (2.08 | ) | | | 1.33 | | | | 2.55 | | | | (0.47 | ) | | | 0.64 | |
| Total from investment operations | | | 1.54 | | | | (1.99 | ) | | | 1.37 | | | | 2.59 | | | | (0.43 | ) | | | 0.64 | |
| Less distributions from: | | | | | | | | | | | | | | | | | | | | | | | | |
| Net investment income | | | — | | | | 0.03 | | | | 0.02 | | | | 0.01 | | | | 0.01 | | | | — | |
| Net realized gain | | | — | | | | 2.98 | | | | 1.57 | | | | 0.59 | | | | 0.65 | | | | 1.12 | |
| Total distributions | | | — | | | | 3.01 | | | | 1.59 | | | | 0.60 | | | | 0.66 | | | | 1.12 | |
| Net asset value, end of year | | $ | 10.85 | | | $ | 9.31 | | | $ | 14.31 | | | $ | 14.53 | | | $ | 12.54 | | | $ | 13.63 | |
| Total return (%)* | | | 16.67 | | | | (15.32 | ) | | | 9.59 | | | | 20.69 | | | | (3.13 | ) | | | 4.66 | |
| Ratios to average daily net assets (%)**: | | | | | | | | | | | | | | | | | | | | | | | | |
| Expenses, before waivers and reimbursements | | | 10.81 | | | | 6.88 | | | | 4.83 | | | | 4.15 | | | | 3.93 | | | | 4.50 | |
| Expenses, net of waivers and reimbursements | | | 1.25 | | | | 1.28 | | | | 1.35 | | | | 1.35 | | | | 1.37 | | | | 1.40 | |
| Net investment income (loss), before waivers and reimbursements | | | (8.65 | ) | | | (4.97 | ) | | | (3.21 | ) | | | (2.51 | ) | | | (2.29 | ) | | | (3.08 | ) |
| Net investment income (loss), net of waivers and reimbursements | | | 0.91 | | | | 0.63 | | | | 0.27 | | | | 0.29 | | | | 0.27 | | | | 0.02 | |
| Class N net assets at the end of the year (in thousands) | | $ | 237 | | | $ | 234 | | | $ | 284 | | | $ | 267 | | | $ | 855 | | | $ | 946 | |
| Portfolio turnover rate (%)* | | | 58 | | | | 104 | | | | 70 | | | | 45 | | | | 35 | | | | 69 | |
| | | | | | | | | | | | | | | | | | | | | | | | | |
| | Class I | |
| | (unaudited)
Period Ended
June 30, | | | Years Ended December 31, | |
| | | 2019 | | | 2018 | | | 2017 | | | 2016 | | | 2015 | | | 2014 | |
| Net asset value, beginning of year | | $ | 9.23 | | | $ | 14.24 | | | $ | 14.47 | | | $ | 12.54 | | | $ | 13.63 | | | $ | 14.12 | |
| Income (loss) from investment operations: | | | | | | | | | | | | | | | | | | | | | | | | |
| Net investment income (loss) | | | 0.06 | | | | 0.11 | | | | 0.07 | | | | 0.08 | | | | 0.07 | | | | 0.05 | |
| Net realized and unrealized gain (loss) on investments | | | 1.49 | | | | (2.06 | ) | | | 1.33 | | | | 2.55 | | | | (0.47 | ) | | | 0.63 | |
| Total from investment operations | | | 1.55 | | | | (1.95 | ) | | | 1.40 | | | | 2.63 | | | | (0.40 | ) | | | 0.68 | |
| Less distributions from: | | | | | | | | | | | | | | | | | | | | | | | | |
| Net investment income | | | — | | | | 0.08 | | | | 0.06 | | | | 0.11 | | | | 0.04 | | | | 0.05 | |
| Net realized gain | | | — | | | | 2.98 | | | | 1.57 | | | | 0.59 | | | | 0.65 | | | | 1.12 | |
| Total distributions | | | — | | | | 3.06 | | | | 1.63 | | | | 0.70 | | | | 0.69 | | | | 1.17 | |
| Net asset value, end of year | | $ | 10.78 | | | $ | 9.23 | | | $ | 14.24 | | | $ | 14.47 | | | $ | 12.54 | | | $ | 13.63 | |
| Total return (%)* | | | 16.79 | | | | (15.03 | ) | | | 9.84 | | | | 21.00 | | | | (2.86 | ) | | | 4.96 | |
| Ratios to average daily net assets (%)**: | | | | | | | | | | | | | | | | | | | | | | | | |
| Expenses, before waivers and reimbursements | | | 10.39 | | | | 6.54 | | | | 4.55 | | | | 3.92 | | | | 3.72 | | | | 4.16 | |
| Expenses, net of waivers and reimbursements | | | 1.00 | | | | 1.03 | | | | 1.10 | | | | 1.10 | | | | 1.12 | | | | 1.15 | |
| Net investment income (loss), before waivers and reimbursements | | | (8.21 | ) | | | (4.69 | ) | | | (2.94 | ) | | | (2.20 | ) | | | (2.08 | ) | | | (2.65 | ) |
| Net investment income (loss), net of waivers and reimbursements | | | 1.18 | | | | 0.82 | | | | 0.51 | | | | 0.62 | | | | 0.52 | | | | 0.36 | |
| Class I net assets at the end of the year (in thousands) | | $ | 1,487 | | | $ | 1,445 | | | $ | 3,359 | | | $ | 3,186 | | | $ | 3,220 | | | $ | 3,407 | |
| Portfolio turnover rate (%)* | | | 58 | | | | 104 | | | | 70 | | | | 45 | | | | 35 | | | | 69 | |
| * | Rates are not annualized for periods less than a year. |
| ** | Rates are annualized for periods less than a year. |
| ^ | Amount is less than $0.005 per share. |
Note: Net investment income (loss) per share is based on the average shares outstanding during the year.
Performance cited represents past performance. Past performance does not guarantee future results and current performance may be lower or higher than the data quoted. Results shown are annual returns, which assume reinvestment of dividends and capital gains. Investment returns and principal will fluctuate and you may have a gain or loss when you sell shares. For the most current month-end performance information, please call 1-800-742-7272 or visit our Web site atwww.williamblairfunds.com.
| June 30, 2019 | William Blair Funds | 157 |
Financial Highlights— For a share outstanding throughout each period
Small-Mid Cap Value Fund
| | Class R6 | |
| | (unaudited)
Period Ended
June 30, | |
| | 2019(a) | |
| Net asset value, beginning of year | | $ | 10.93 | |
| Income (loss) from investment operations: | | | | |
| Net investment income (loss) | | | 0.03 | |
| Net realized and unrealized gain (loss) on investments | | | (0.17 | ) |
| Total from investment operations | | | (0.14 | ) |
| Less distributions from: | | | | |
| Net investment income | | | — | |
| Net realized gain | | | — | |
| Total distributions | | | — | |
| Net asset value, end of year | | $ | 10.79 | |
| Total Return (%)* | | | (1.28 | ) |
| Ratios to average daily net assets (%)**: | | | | |
| Expenses, before waivers and reimbursements | | | 14.63 | |
| Expenses, net of waivers and reimbursements | | | 0.95 | |
| Net investment income (loss), before waivers and reimbursements | | | (12.04 | ) |
| Net investment income (loss), net of waivers and reimbursements | | | 1.64 | |
| Class R6 net assets at the end of the year (in thousands) | | $ | 10 | |
| Portfolio turnover rate (%)* | | | 58 | |
| (a) | For the period from May 2, 2019 (Commencement of Operations) to June 30, 2019. |
| * | Rates are not annualized for periods less than a year. |
| ** | Rates are annualized for periods less than a year. |
Note: Net investment income (loss) per share is based on the average shares outstanding during the year.
Performance cited represents past performance. Past performance does not guarantee future results and current performance may be lower or higher than the data quoted. Results shown are annual returns, which assume reinvestment of dividends and capital gains. Investment returns and principal will fluctuate and you may have a gain or loss when you sell shares. For the most current month-end performance information, please call 1-800-742-7272 or visit our Web site atwww.williamblairfunds.com.
| 158 | Semiannual Report | June 30, 2019 |
Financial Highlights— For a share outstanding throughout each period
Small Cap Growth Fund
| | Class N | |
| | (unaudited)
Period Ended
June 30, | | | Years Ended December 31, | |
| | | 2019 | | | 2018 | | | 2017 | | | 2016 | | | 2015 | | | 2014 | |
| Net asset value, beginning of year | | $ | 23.23 | | | $ | 26.87 | | | $ | 25.24 | | | $ | 22.47 | | | $ | 25.61 | | | $ | 30.02 | |
| Income (loss) from investment operations: | | | | | | | | | | | | | | | | | | | | | | | | |
| Net investment income (loss) | | | (0.12 | ) | | | (0.27 | ) | | | (0.25 | ) | | | (0.18 | ) | | | (0.22 | ) | | | (0.30 | ) |
| Net realized and unrealized gain (loss) on investments | | | 4.53 | | | | (0.10 | ) | | | 6.88 | | | | 4.43 | | | | (0.93 | ) | | | 1.02 | |
| Total from investment operations | | | 4.41 | | | | (0.37 | ) | | | 6.63 | | | | 4.25 | | | | (1.15 | ) | | | 0.72 | |
| Less distributions from: | | | | | | | | | | | | | | | | | | | | | | | | |
| Net investment income | | | — | | | | — | | | | — | | | | — | | | | — | | | | — | |
| Net realized gain | | | — | | | | 3.27 | | | | 5.00 | | | | 1.48 | | | | 1.99 | | | | 5.13 | |
| Total distributions | | | — | | | | 3.27 | | | | 5.00 | | | | 1.48 | | | | 1.99 | | | | 5.13 | |
| Net asset value, end of year | | $ | 27.64 | | | $ | 23.23 | | | $ | 26.87 | | | $ | 25.24 | | | $ | 22.47 | | | $ | 25.61 | |
| Total return (%)* | | | 18.98 | | | | (2.14 | ) | | | 26.70 | | | | 18.89 | | | | (4.44 | ) | | | 2.62 | |
| Ratios to average daily net assets (%)**: | | | | | | | | | | | | | | | | | | | | | | | | |
| Expenses, before waivers and reimbursements | | | 1.54 | | | | 1.55 | | | | 1.54 | | | | 1.55 | | | | 1.59 | | | | 1.56 | |
| Expenses, net of waivers and reimbursements | | | 1.50 | | | | 1.50 | | | | 1.50 | | | | 1.50 | | | | 1.50 | | | | 1.50 | |
| Net investment income (loss), before waivers and reimbursements | | | (0.93 | ) | | | (0.94 | ) | | | (0.93 | ) | | | (0.84 | ) | | | (0.94 | ) | | | (1.06 | ) |
| Net investment income (loss), net of waivers and reimbursements | | | (0.89 | ) | | | (0.89 | ) | | | (0.89 | ) | | | (0.79 | ) | | | (0.85 | ) | | | (1.00 | ) |
| Class N net assets at the end of the year (in thousands) | | $ | 198,064 | | | $ | 169,074 | | | $ | 146,291 | | | $ | 117,068 | | | $ | 111,944 | | | $ | 148,201 | |
| Portfolio turnover rate (%)* | | | 29 | | | | 74 | | | | 81 | | | | 90 | | | | 91 | | | | 82 | |
| | | | | | | | | | | | | | | | | | | | | | | | | |
| | Class I | |
| | (unaudited)
Period Ended
June 30, | | | Years Ended December 31, | |
| | | 2019 | | | 2018 | | | 2017 | | | 2016 | | | 2015 | | | 2014 | |
| Net asset value, beginning of year | | $ | 25.99 | | | $ | 29.61 | | | $ | 27.34 | | | $ | 24.17 | | | $ | 27.32 | | | $ | 31.61 | |
| Income (loss) from investment operations: | | | | | | | | | | | | | | | | | | | | | | | | |
| Net investment income (loss) | | | (0.10 | ) | | | (0.21 | ) | | | (0.20 | ) | | | (0.13 | ) | | | (0.17 | ) | | | (0.23 | ) |
| Net realized and unrealized gain (loss) on investments | | | 5.07 | | | | (0.14 | ) | | | 7.47 | | | | 4.78 | | | | (0.99 | ) | | | 1.07 | |
| Total from investment operations | | | 4.97 | | | | (0.35 | ) | | | 7.27 | | | | 4.65 | | | | (1.16 | ) | | | 0.84 | |
| Less distributions from: | | | | | | | | | | | | | | | | | | | | | | | | |
| Net investment income | | | — | | | | — | | | | — | | | | — | | | | — | | | | — | |
| Net realized gain | | | — | | | | 3.27 | | | | 5.00 | | | | 1.48 | | | | 1.99 | | | | 5.13 | |
| Total distributions | | | — | | | | 3.27 | | | | 5.00 | | | | 1.48 | | | | 1.99 | | | | 5.13 | |
| Net asset value, end of year | | $ | 30.96 | | | $ | 25.99 | | | $ | 29.61 | | | $ | 27.34 | | | $ | 24.17 | | | $ | 27.32 | |
| Total return (%)* | | | 19.12 | | | | (1.88 | ) | | | 26.99 | | | | 19.22 | | | | (4.20 | ) | | | 2.87 | |
| Ratios to average daily net assets (%)**: | | | | | | | | | | | | | | | | | | | | | | | | |
| Expenses, before waivers and reimbursements | | | 1.26 | | | | 1.25 | | | | 1.25 | | | | 1.27 | | | | 1.30 | | | | 1.30 | |
| Expenses, net of waivers and reimbursements | | | 1.25 | | | | 1.25 | | | | 1.25 | | | | 1.25 | | | | 1.25 | | | | 1.25 | |
| Net investment income (loss), before waivers and reimbursements | | | (0.65 | ) | | | (0.65 | ) | | | (0.64 | ) | | | (0.56 | ) | | | (0.66 | ) | | | (0.80 | ) |
| Net investment income (loss), net of waivers and reimbursements | | | (0.64 | ) | | | (0.65 | ) | | | (0.64 | ) | | | (0.54 | ) | | | (0.61 | ) | | | (0.75 | ) |
| Class I net assets at the end of the year (in thousands) | | $ | 491,045 | | | $ | 410,233 | | | $ | 343,119 | | | $ | 271,830 | | | $ | 261,269 | | | $ | 364,241 | |
| Portfolio turnover rate (%)* | | | 29 | | | | 74 | | | | 81 | | | | 90 | | | | 91 | | | | 82 | |
| * | Rates are not annualized for periods less than a year. |
| ** | Rates are annualized for periods less than a year. |
Note: Net investment income (loss) per share is based on the average shares outstanding during the year.
Performance cited represents past performance. Past performance does not guarantee future results and current performance may be lower or higher than the data quoted. Results shown are annual returns, which assume reinvestment of dividends and capital gains. Investment returns and principal will fluctuate and you may have a gain or loss when you sell shares. For the most current month-end performance information, please call 1-800-742-7272 or visit our Web site atwww.williamblairfunds.com.
| June 30, 2019 | William Blair Funds | 159 |
Financial Highlights— For a share outstanding throughout each period
Small Cap Growth Fund
| | Class R6 | |
| | (unaudited)
Period Ended
June 30, | |
| | 2019(a) | |
| Net asset value, beginning of year | | $ | 31.00 | |
| Income (loss) from investment operations: | | | | |
| Net investment income (loss) | | | 0.03 | |
| Net realized and unrealized gain (loss) on investments | | | (0.07 | ) |
| Total from investment operations | | | (0.04 | ) |
| Less distributions from: | | | | |
| Net investment income | | | — | |
| Net realized gain | | | — | |
| Total distributions | | | — | |
| Net asset value, end of year | | $ | 30.96 | |
| Total Return (%)* | | | (0.13 | ) |
| Ratios to average daily net assets (%)**: | | | | |
| Expenses | | | 1.17 | |
| Net investment income (loss) | | | 0.49 | |
| Class R6 net assets at the end of the year (in thousands) | | $ | 18,923 | |
| Portfolio turnover rate (%)* | | | 29 | |
| (a) | For the period from May 2, 2019 (Commencement of Operations) to June 30, 2019. |
| * | Rates are not annualized for periods less than a year. |
| ** | Rates are annualized for periods less than a year. |
Note: Net investment income (loss) per share is based on the average shares outstanding during the year.
Performance cited represents past performance. Past performance does not guarantee future results and current performance may be lower or higher than the data quoted. Results shown are annual returns, which assume reinvestment of dividends and capital gains. Investment returns and principal will fluctuate and you may have a gain or loss when you sell shares. For the most current month-end performance information, please call 1-800-742-7272 or visit our Web site atwww.williamblairfunds.com.
| 160 | Semiannual Report | June 30, 2019 |
Financial Highlights— For a share outstanding throughout each period
Small Cap Value Fund
| | | | | | | Class N | |
| | (unaudited) | | | | | | | | | | | | | | | | |
| | Period Ended | | | | | | | | | | | | | | | | |
| | June 30, | | | Years Ended December 31, | |
| | | 2019 | | | 2018 | | | 2017 | | | 2016 | | | 2015 | | | 2014 | |
| Net asset value, beginning of year | | $ | 15.04 | | | $ | 20.15 | | | $ | 20.18 | | | $ | 16.68 | | | $ | 17.76 | | | $ | 17.63 | |
| Income (loss) from investment operations: | | | | | | | | | | | | | | | | | | | | | | | | |
| Net investment income (loss) | | | 0.04 | | | | 0.03 | | | | 0.01 | | | | 0.04 | | | | 0.02 | | | | (0.03 | ) |
| Net realized and unrealized gain (loss) on investments | | | 2.40 | | | | (3.12 | ) | | | 1.50 | | | | 4.34 | | | | (1.05 | ) | | | 0.81 | |
| Total from investment operations | | | 2.44 | | | | (3.09 | ) | | | 1.51 | | | | 4.38 | | | | (1.03 | ) | | | 0.78 | |
| Less distributions from: | | | | | | | | | | | | | | | | | | | | | | | | |
| Net investment income | | | — | | | | — | | | | — | | | | 0.04 | | | | — | | | | — | |
| Net realized gain | | | — | | | | 2.02 | | | | 1.54 | | | | 0.84 | | | | 0.05 | | | | 0.65 | |
| Total distributions | | | — | | | | 2.02 | | | | 1.54 | | | | 0.88 | | | | 0.05 | | | | 0.65 | |
| Net asset value, end of year | | $ | 17.48 | | | $ | 15.04 | | | $ | 20.15 | | | $ | 20.18 | | | $ | 16.68 | | | $ | 17.76 | |
| Total return (%)* | | | 16.22 | | | | (15.93 | ) | | | 7.57 | | | | 26.19 | | | | (5.77 | ) | | | 4.49 | |
| Ratios to average daily net assets (%)**: | | | | | | | | | | | | | | | | | | | | | | | | |
| Expenses, before waivers and reimbursements | | | 1.57 | | | | 1.56 | | | | 1.55 | | | | 1.53 | | | | 1.54 | | | | 1.53 | |
| Expenses, net of waivers and reimbursements | | | 1.50 | | | | 1.50 | | | | 1.50 | | | | 1.50 | | | | 1.50 | | | | 1.50 | |
| Net investment income (loss), before waivers and reimbursements | | | 0.37 | | | | 0.08 | | | | (0.01 | ) | | | 0.19 | | | | 0.10 | | | | (0.20 | ) |
| Net investment income (loss), net of waivers and reimbursements | | | 0.44 | | | | 0.14 | | | | 0.04 | | | | 0.22 | | | | 0.14 | | | | (0.17 | ) |
| Class N net assets at the end of the year (in thousands) | | $ | 16,055 | | | $ | 16,381 | | | $ | 29,271 | | | $ | 33,359 | | | $ | 33,351 | | | $ | 40,223 | |
| Portfolio turnover rate (%)* | | | 32 | | | | 56 | | | | 38 | | | | 33 | | | | 30 | | | | 39 | |
| | | | | | | | | | | | | | | | | | | | | | | | | |
| | | | | | | | Class I | |
| | (unaudited) | | | | | | | | | | | | | | | | | |
| | Period Ended | | | | | | | | | | | | | | | | | |
| | June 30, | | | Years Ended December 31, | |
| | | 2019 | | | | 2018 | | | 2017 | | | 2016 | | | 2015 | | | 2014 | |
| Net asset value, beginning of year | | $ | 15.50 | | | $ | 20.70 | | | $ | 20.68 | | | $ | 17.08 | | | $ | 18.17 | | | $ | 18.00 | |
| Income (loss) from investment operations: | | | | | | | | | | | | | | | | | | | | | | | | |
| Net investment income (loss) | | | 0.06 | | | | 0.08 | | | | 0.06 | | | | 0.09 | | | | 0.08 | | | | 0.02 | |
| Net realized and unrealized gain (loss) on investments | | | 2.48 | | | | (3.21 | ) | | | 1.54 | | | | 4.44 | | | | (1.08 | ) | | | 0.82 | |
| Total from investment operations | | | 2.54 | | | | (3.13 | ) | | | 1.60 | | | | 4.53 | | | | (1.00 | ) | | | 0.84 | |
| Less distributions from: | | | | | | | | | | | | | | | | | | | | | | | | |
| Net investment income | | | — | | | | 0.05 | | | | 0.04 | | | | 0.09 | | | | 0.04 | | | | 0.02 | |
| Net realized gain | | | — | | | | 2.02 | | | | 1.54 | | | | 0.84 | | | | 0.05 | | | | 0.65 | |
| Total distributions | | | — | | | | 2.07 | | | | 1.58 | | | | 0.93 | | | | 0.09 | | | | 0.67 | |
| Net asset value, end of year | | $ | 18.04 | | | $ | 15.50 | | | $ | 20.70 | | | $ | 20.68 | | | $ | 17.08 | | | $ | 18.17 | |
| Total return (%)* | | | 16.39 | | | | (15.74 | ) | | | 7.85 | | | | 26.46 | | | | (5.47 | ) | | | 4.73 | |
| Ratios to average daily net assets (%)**: | | | | | | | | | | | | | | | | | | | | | | | | |
| Expenses, before waivers and reimbursements | | | 1.31 | | | | 1.30 | | | | 1.29 | | | | 1.29 | | | | 1.24 | | | | 1.23 | |
| Expenses, net of waivers and reimbursements | | | 1.25 | | | | 1.25 | | | | 1.25 | | | | 1.25 | | | | 1.24 | | | | 1.23 | |
| Net investment income (loss), before waivers and reimbursements | | | 0.64 | | | | 0.36 | | | | 0.25 | | | | 0.43 | | | | 0.43 | | | | 0.12 | |
| Net investment income (loss), net of waivers and reimbursements | | | 0.70 | | | | 0.41 | | | | 0.29 | | | | 0.47 | | | | 0.43 | | | | 0.12 | |
| Class I net assets at the end of the year (in thousands) | | $ | 436,832 | | | $ | 475,134 | | | $ | 644,749 | | | $ | 675,272 | | | $ | 579,010 | | | $ | 544,963 | |
| Portfolio turnover rate (%)* | | | 32 | | | | 56 | | | | 38 | | | | 33 | | | | 30 | | | | 39 | |
| * | Rates are not annualized for periods less than a year. |
| ** | Rates are annualized for periods less than a year. |
Note: Net investment income (loss) per share is based on the average shares outstanding during the year.
Performance cited represents past performance. Past performance does not guarantee future results and current performance may be lower or higher than the data quoted. Results shown are annual returns, which assume reinvestment of dividends and capital gains. Investment returns and principal will fluctuate and you may have a gain or loss when you sell shares. For the most current month-end performance information, please call 1-800-742-7272 or visit our Web site atwww.williamblairfunds.com.
| June 30, 2019 | William Blair Funds | 161 |
Financial Highlights— For a share outstanding throughout each period
Small Cap Value Fund
| | | Class R6 | |
| | | (unaudited) | |
| | | Period Ended | |
| | | June 30, | |
| | | 2019(a) | |
| Net asset value, beginning of year | | | $ | 18.19 | |
| Income (loss) from investment operations: | | | | | |
| Net investment income (loss) | | | | 0.04 | |
| Net realized and unrealized gain (loss) on investments | | | | (0.18 | ) |
| Total from investment operations | | | | (0.14 | ) |
| Less distributions from: | | | | | |
| Net investment income | | | | — | |
| Net realized gain | | | | — | |
| Total distributions | | | | — | |
| Net asset value, end of year | | | $ | 18.05 | |
| Total Return (%)* | | | | (0.77 | ) |
| Ratios to average daily net assets (%)**: | | | | | |
| Expenses | | | | 1.17 | |
| Net investment income (loss) | | | | 1.30 | |
| Class R6 net assets at the end of the year (in thousands) | | | $ | 50 | |
| Portfolio turnover rate (%)* | | | | 32 | |
| (a) | For the period from May 2, 2019 (Commencement of Operations) to June 30, 2019. |
| * | Rates are not annualized for periods less than a year. |
| ** | Rates are annualized for periods less than a year. |
Note: Net investment income (loss) per share is based on the average shares outstanding during the year.
Performance cited represents past performance. Past performance does not guarantee future results and current performance may be lower or higher than the data quoted. Results shown are annual returns, which assume reinvestment of dividends and capital gains. Investment returns and principal will fluctuate and you may have a gain or loss when you sell shares. For the most current month-end performance information, please call 1-800-742-7272 or visit our Web site atwww.williamblairfunds.com.
| 162 | Semiannual Report | June 30, 2019 |
Financial Highlights— For a share outstanding throughout each period
Global Leaders Fund
| | | | | | | Class N | |
| | (unaudited) | | | | | | | | | | | | | | | | |
| | Period Ended | | | | | | | | | | | | | | | | |
| | June 30, | | | Years Ended December 31, | |
| | | 2019 | | | 2018 | | | 2017 | | | 2016 | | | 2015 | | | 2014 | |
| Net asset value, beginning of year | | $ | 11.47 | | | $ | 14.53 | | | $ | 11.60 | | | $ | 11.58 | | | $ | 11.84 | | | $ | 11.43 | |
| Income (loss) from investment operations: | | | | | | | | | | | | | | | | | | | | | | | | |
| Net investment income (loss) | | | 0.03 | | | | 0.02 | | | | 0.05 | | | | 0.03 | | | | 0.02 | | | | 0.02 | |
| Net realized and unrealized gain (loss) on investments | | | 2.34 | | | | (1.12 | ) | | | 3.46 | | | | 0.04 | | | | 0.27 | | | | 0.41 | |
| Total from investment operations | | | 2.37 | | | | (1.10 | ) | | | 3.51 | | | | 0.07 | | | | 0.29 | | | | 0.43 | |
| Less distributions from: | | | | | | | | | | | | | | | | | | | | | | | | |
| Net investment income | | | — | | | | — | | | | 0.10 | | | | — | | | | 0.01 | | | | — | |
| Net realized gain | | | — | | | | 1.96 | | | | 0.48 | | | | 0.05 | | | | 0.54 | | | | 0.02 | |
| Total distributions | | | — | | | | 1.96 | | | | 0.58 | | | | 0.05 | | | | 0.55 | | | | 0.02 | |
| Net asset value, end of year | | $ | 13.84 | | | $ | 11.47 | | | $ | 14.53 | | | $ | 11.60 | | | $ | 11.58 | | | $ | 11.84 | |
| Total return (%)* | | | 20.66 | | | | (8.23 | ) | | | 30.31 | | | | 0.62 | | | | 2.49 | | | | 3.76 | |
| Ratios to average daily net assets (%)**: | | | | | | | | | | | | | | | | | | | | | | | | |
| Expenses, before waivers and reimbursements | | | 1.42 | | | | 1.47 | | | | 1.63 | | | | 1.62 | | | | 1.61 | | | | 1.62 | |
| Expenses, net of waivers and reimbursements | | | 1.25 | | | | 1.33 | | | | 1.37 | | | | 1.36 | | | | 1.39 | | | | 1.50 | |
| Net investment income (loss), before waivers and reimbursements | | | 0.29 | | | | (0.01 | ) | | | 0.09 | | | | (0.03 | ) | | | (0.10 | ) | | | 0.04 | |
| Net investment income (loss), net of waivers and reimbursements | | | 0.46 | | | | 0.13 | | | | 0.35 | | | | 0.23 | | | | 0.12 | | | | 0.16 | |
| Class N net assets at the end of the year (in thousands) | | $ | 8,263 | | | $ | 7,225 | | | $ | 7,761 | | | $ | 5,760 | | | $ | 5,588 | | | $ | 5,007 | |
| Portfolio turnover rate (%)* | | | 14 | | | | 49 | | | | 41 | | | | 75 | | | | 55 | | | | 60 | |
| | | | | | | | | | | | | | | | | | | | | | | | | |
| | | | | | | Class I | |
| | (unaudited) | | | | | | | | | | | | | |
| | Period Ended | | | | | | | | | | | | | |
| | June 30, | | | Years Ended December 31, | |
| | | 2019 | | | 2018 | | | 2017 | | | 2016 | | | 2015 | | | 2014 | |
| Net asset value, beginning of year | | $ | 11.47 | | | $ | 14.56 | | | $ | 11.62 | | | $ | 11.59 | | | $ | 11.85 | | | $ | 11.42 | |
| Income (loss) from investment operations: | | | | | | | | | | | | | | | | | | | | | | | | |
| Net investment income (loss) | | | 0.05 | | | | 0.06 | | | | 0.09 | | | | 0.06 | | | | 0.06 | | | | 0.04 | |
| Net realized and unrealized gain (loss) on investments | | | 2.35 | | | | (1.13 | ) | | | 3.47 | | | | 0.05 | | | | 0.26 | | | | 0.43 | |
| Total from investment operations | | | 2.40 | | | | (1.07 | ) | | | 3.56 | | | | 0.11 | | | | 0.32 | | | | 0.47 | |
| Less distributions from: | | | | | | | | | | | | | | | | | | | | | | | | |
| Net investment income | | | — | | | | 0.06 | | | | 0.14 | | | | 0.03 | | | | 0.04 | | | | 0.02 | |
| Net realized gain | | | — | | | | 1.96 | | | | 0.48 | | | | 0.05 | | | | 0.54 | | | | 0.02 | |
| Total distributions | | | — | | | | 2.02 | | | | 0.62 | | | | 0.08 | | | | 0.58 | | | | 0.04 | |
| Net asset value, end of year | | $ | 13.87 | | | $ | 11.47 | | | $ | 14.56 | | | $ | 11.62 | | | $ | 11.59 | | | $ | 11.85 | |
| Total return (%)* | | | 20.92 | | | | (8.06 | ) | | | 30.69 | | | | 0.98 | | | | 2.77 | | | | 4.08 | |
| Ratios to average daily net assets (%)**: | | | | | | | | | | | | | | | | | | | | | | | | |
| Expenses, before waivers and reimbursements | | | 1.10 | | | | 1.15 | | | | 1.33 | | | | 1.31 | | | | 1.32 | | | | 1.33 | |
| Expenses, net of waivers and reimbursements | | | 1.00 | | | | 1.07 | | | | 1.07 | | | | 1.05 | | | | 1.10 | | | | 1.25 | |
| Net investment income (loss), before waivers and reimbursements | | | 0.61 | | | | 0.31 | | | | 0.39 | | | | 0.28 | | | | 0.23 | | | | 0.30 | |
| Net investment income (loss), net of waivers and reimbursements | | | 0.71 | | | | 0.39 | | | | 0.65 | | | | 0.54 | | | | 0.45 | | | | 0.38 | |
| Class I net assets at the end of the year (in thousands) | | $ | 103,148 | | | $ | 83,790 | | | $ | 60,067 | | | $ | 45,772 | | | $ | 45,853 | | | $ | 52,090 | |
| Portfolio turnover rate (%)* | | | 14 | | | | 49 | | | | 41 | | | | 75 | | | | 55 | | | | 60 | |
| * | Rates are not annualized for periods less than a year. |
| ** | Rates are annualized for periods less than a year. |
Note: Net investment income (loss) per share is based on the average shares outstanding during the year.
Performance cited represents past performance. Past performance does not guarantee future results and current performance may be lower or higher than the data quoted. Results shown are annual returns, which assume reinvestment of dividends and capital gains. Investment returns and principal will fluctuate and you may have a gain or loss when you sell shares. For the most current month-end performance information, please call 1-800-742-7272 or visit our Web site atwww.williamblairfunds.com.
| June 30, 2019 | William Blair Funds | 163 |
Financial Highlights— For a share outstanding throughout each period
Global Leaders Fund
| | | | | | | Class R6 | |
| | (unaudited) | | | | | | | | | | | | | | | | |
| | Period Ended | | | | | | | | | | | | | | | | |
| | June 30, | | | Years Ended December 31, | |
| | | 2019 | | | 2018 | | | 2017 | | | 2016 | | | 2015 | | | 2014 | |
| Net asset value, beginning of year | | $ | 11.47 | | | $ | 14.56 | | | $ | 11.62 | | | $ | 11.59 | | | $ | 11.85 | | | $ | 11.42 | |
| Income (loss) from investment operations: | | | | | | | | | | | | | | | | | | | | | | | | |
| Net investment income (loss) | | | 0.05 | | | | 0.07 | | | | 0.10 | | | | 0.07 | | | | 0.06 | | | | 0.06 | |
| Net realized and unrealized gain (loss) on investments | | | 2.35 | | | | (1.13 | ) | | | 3.47 | | | | 0.05 | | | | 0.27 | | | | 0.43 | |
| Total from investment operations | | | 2.40 | | | | (1.06 | ) | | | 3.57 | | | | 0.12 | | | | 0.33 | | | | 0.49 | |
| Less distributions from: | | | | | | | | | | | | | | | | | | | | | | | | |
| Net investment income | | | — | | | | 0.07 | | | | 0.15 | | | | 0.04 | | | | 0.05 | | | | 0.04 | |
| Net realized gain | | | — | | | | 1.96 | | | | 0.48 | | | | 0.05 | | | | 0.54 | | | | 0.02 | |
| Total distributions | | | — | | | | 2.03 | | | | 0.63 | | | | 0.09 | | | | 0.59 | | | | 0.06 | |
| Net asset value, end of year | | $ | 13.87 | | | $ | 11.47 | | | $ | 14.56 | | | $ | 11.62 | | | $ | 11.59 | | | $ | 11.85 | |
| Total return (%)* | | | 20.92 | | | | (7.99 | ) | | | 30.78 | | | | 1.03 | | | | 2.85 | | | | 4.24 | |
| Ratios to average daily net assets (%)**: | | | | | | | | | | | | | | | | | | | | | | | | |
| Expenses, before waivers and reimbursements | | | 1.03 | | | | 1.08 | | | | 1.10 | | | | 1.11 | | | | 1.11 | | | | 1.13 | |
| Expenses, net of waivers and reimbursements | | | 0.95 | | | | 1.00 | | | | 1.00 | | | | 1.00 | | | | 1.03 | | | | 1.10 | |
| Net investment income (loss), before waivers and reimbursements | | | 0.68 | | | | 0.39 | | | | 0.65 | | | | 0.48 | | | | 0.39 | | | | 0.48 | |
| Net investment income (loss), net of waivers and reimbursements | | | 0.76 | | | | 0.47 | | | | 0.75 | | | | 0.59 | | | | 0.47 | | | | 0.51 | |
| Class R6 net assets at the end of the year (in thousands) | | $ | 97,875 | | | $ | 79,685 | | | $ | 143,521 | | | $ | 125,199 | | | $ | 137,527 | | | $ | 106,565 | |
| Portfolio turnover rate (%)* | | | 14 | | | | 49 | | | | 41 | | | | 75 | | | | 55 | | | | 60 | |
| * | Rates are not annualized for periods less than a year. |
| ** | Rates are annualized for periods less than a year. |
Note: Net investment income (loss) per share is based on the average shares outstanding during the year.
Performance cited represents past performance. Past performance does not guarantee future results and current performance may be lower or higher than the data quoted. Results shown are annual returns, which assume reinvestment of dividends and capital gains. Investment returns and principal will fluctuate and you may have a gain or loss when you sell shares. For the most current month-end performance information, please call 1-800-742-7272 or visit our Web site atwww.williamblairfunds.com.
| 164 | Semiannual Report | June 30, 2019 |
Financial Highlights— For a share outstanding throughout each period
International Leaders Fund
| | | | | | | Class N | |
| | (unaudited) | | | | | | | | | | | | | | | | |
| | Period Ended | | | | | | | | | | | | | | | | |
| | June 30, | | | Years Ended December 31, | |
| | | 2019 | | | 2018 | | | 2017 | | | 2016 | | | 2015 | | | 2014 | |
| Net asset value, beginning of year | | $ | 13.80 | | | $ | 16.37 | | | $ | 12.88 | | | $ | 12.89 | | | $ | 12.25 | | | $ | 12.65 | |
| Income (loss) from investment operations: | | | | | | | | | | | | | | | | | | | | | | | | |
| Net investment income (loss) | | | 0.10 | | | | 0.13 | | | | 0.11 | | | | 0.03 | | | | 0.07 | | | | 0.13 | |
| Net realized and unrealized gain (loss) on investments | | | 2.74 | | | | (2.19 | ) | | | 3.70 | | | | 0.08 | | | | 0.66 | | | | (0.47 | ) |
| Total from investment operations | | | 2.84 | | | | (2.06 | ) | | | 3.81 | | | | 0.11 | | | | 0.73 | | | | (0.34 | ) |
| Less distributions from: | | | | | | | | | | | | | | | | | | | | | | | | |
| Net investment income | | | — | | | | 0.06 | | | | 0.20 | | | | 0.12 | | | | 0.02 | | | | 0.06 | |
| Net realized gain | | | — | | | | 0.45 | | | | 0.12 | | | | — | | | | 0.07 | | | | — | |
| Total distributions | | | — | | | | 0.51 | | | | 0.32 | | | | 0.12 | | | | 0.09 | | | | 0.06 | |
| Net asset value, end of year | | $ | 16.64 | | | $ | 13.80 | | | $ | 16.37 | | | $ | 12.88 | | | $ | 12.89 | | | $ | 12.25 | |
| Total return (%)* | | | 20.58 | | | | (12.70 | ) | | | 29.65 | | | | 0.88 | | | | 6.01 | | | | (2.67 | ) |
| Ratios to average daily net assets (%)**: | | | | | | | | | | | | | | | | | | | | | | | | |
| Expenses, before waivers and reimbursements | | | 1.34 | | | | 1.39 | | | | 1.59 | | | | 1.56 | | | | 1.56 | | | | 1.59 | |
| Expenses, net of waivers and reimbursements | | | 1.22 | | | | 1.28 | | | | 1.35 | | | | 1.30 | | | | 1.24 | | | | 1.45 | |
| Net investment income (loss), before waivers and reimbursements | | | 1.16 | | | | 0.70 | | | | 0.48 | | | | (0.02 | ) | | | 0.19 | | | | 0.86 | |
| Net investment income (loss), net of waivers and reimbursements | | | 1.28 | | | | 0.81 | | | | 0.72 | | | | 0.24 | | | | 0.51 | | | | 1.00 | |
| Class N net assets at the end of the year (in thousands) | | $ | 10,341 | | | $ | 8,715 | | | $ | 9,651 | | | $ | 2,922 | | | $ | 377 | | | $ | 150 | |
| Portfolio turnover rate (%)* | | | 13 | | | | 33 | | | | 41 | | | | 59 | | | | 29 | | | | 79 | |
| | | | | | | | | | | | | | | | | | | | | | | | | |
| | | | | | | Class I | |
| | (unaudited) | | | | | | | | | | | | | | | | |
| | Period Ended | | | | | | | | | | | | | | | | |
| | June 30, | | | Years Ended December 31, | |
| | | | 2019 | | | 2018 | | | 2017 | | | 2016 | | | 2015 | | | 2014 | |
| Net asset value, beginning of year | | $ | 13.84 | | | $ | 16.44 | | | $ | 12.92 | | | $ | 12.91 | | | $ | 12.25 | | | $ | 12.65 | |
| Income (loss) from investment operations: | | | | | | | | | | | | | | | | | | | | | | | | |
| Net investment income (loss) | | | 0.13 | | | | 0.17 | | | | 0.16 | | | | 0.10 | | | | 0.10 | | | | 0.16 | |
| Net realized and unrealized gain (loss) on investments | | | 2.73 | | | | (2.19 | ) | | | 3.71 | | | | 0.04 | | | | 0.65 | | | | (0.47 | ) |
| Total from investment operations | | | 2.86 | | | | (2.02 | ) | | | 3.87 | | | | 0.14 | | | | 0.75 | | | | (0.31 | ) |
| Less distributions from: | | | | | | | | | | | | | | | | | | | | | | | | |
| Net investment income | | | — | | | | 0.13 | | | | 0.23 | | | | 0.13 | | | | 0.02 | | | | 0.09 | |
| Net realized gain | | | — | | | | 0.45 | | | | 0.12 | | | | — | | | | 0.07 | | | | — | |
| Total distributions | | | — | | | | 0.58 | | | | 0.35 | | | | 0.13 | | | | 0.09 | | | | 0.09 | |
| Net asset value, end of year | | $ | 16.70 | | | $ | 13.84 | | | $ | 16.44 | | | $ | 12.92 | | | $ | 12.91 | | | $ | 12.25 | |
| Total return (%)* | | | 20.66 | | | | (12.45 | ) | | | 30.05 | | | | 1.10 | | | | 6.18 | | | | (2.43 | ) |
| Ratios to average daily net assets (%)**: | | | | | | | | | | | | | | | | | | | | | | | | |
| Expenses, before waivers and reimbursements | | | 1.02 | | | | 1.07 | | | | 1.28 | | | | 1.30 | | | | 1.46 | | | | 1.29 | |
| Expenses, net of waivers and reimbursements | | | 0.96 | | | | 1.03 | | | | 1.05 | | | | 1.04 | | | | 1.13 | | | | 1.20 | |
| Net investment income (loss), before waivers and reimbursements | | | 1.55 | | | | 1.02 | | | | 0.86 | | | | 0.48 | | | | 0.42 | | | | 1.16 | |
| Net investment income (loss), net of waivers and reimbursements | | | 1.61 | | | | 1.06 | | | | 1.09 | | | | 0.74 | | | | 0.75 | | | | 1.25 | |
| Class I net assets at the end of the year (in thousands) | | $ | 126,671 | | | $ | 76,382 | | | $ | 60,279 | | | $ | 30,944 | | | $ | 13,474 | | | $ | 9,561 | |
| Portfolio turnover rate (%)* | | | 13 | | | | 33 | | | | 41 | | | | 59 | | | | 29 | | | | 79 | |
| * | Rates are not annualized for periods less than a year. |
| ** | Rates are annualized for periods less than a year. |
Note: Net investment income (loss) per share is based on the average shares outstanding during the year.
Performance cited represents past performance. Past performance does not guarantee future results and current performance may be lower or higher than the data quoted. Results shown are annual returns, which assume reinvestment of dividends and capital gains. Investment returns and principal will fluctuate and you may have a gain or loss when you sell shares. For the most current month-end performance information, please call 1-800-742-7272 or visit our Web site atwww.williamblairfunds.com.
| June 30, 2019 | William Blair Funds | 165 |
Financial Highlights— For a share outstanding throughout each period
International Leaders Fund
| | | | | | | Class R6 | |
| | (unaudited) | | | | | | | | | | | | | | | | |
| | Period Ended | | | | | | | | | | | | | | | | |
| | June 30, | | | Years Ended December 31, | |
| | | 2019 | | | 2018 | | | 2017 | | | 2016 | | | 2015 | | | 2014 | |
| Net asset value, beginning of year | | $ | 13.83 | | | $ | 16.43 | | | $ | 12.92 | | | $ | 12.90 | | | $ | 12.24 | | | $ | 12.65 | |
| Income (loss) from investment operations: | | | | | | | | | | | | | | | | | | | | | | | | |
| Net investment income (loss) | | | 0.12 | | | | 0.18 | | | | 0.18 | | | | 0.12 | | | | 0.11 | | | | 0.17 | |
| Net realized and unrealized gain (loss) on investments | | | 2.75 | | | | (2.19 | ) | | | 3.70 | | | | 0.04 | | | | 0.66 | | | | (0.47 | ) |
| Total from investment operations | | | 2.87 | | | | (2.01 | ) | | | 3.88 | | | | 0.16 | | | | 0.77 | | | | (0.30 | ) |
| Less distributions from: | | | | | | | | | | | | | | | | | | | | | | | | |
| Net investment income | | | — | | | | 0.14 | | | | 0.25 | | | | 0.14 | | | | 0.04 | | | | 0.11 | |
| Net realized gain | | | — | | | | 0.45 | | | | 0.12 | | | | — | | | | 0.07 | | | | — | |
| Total distributions | | | — | | | | 0.59 | | | | 0.37 | | | | 0.14 | | | | 0.11 | | | | 0.11 | |
| Net asset value, end of year | | $ | 16.70 | | | $ | 13.83 | | | $ | 16.43 | | | $ | 12.92 | | | $ | 12.90 | | | $ | 12.24 | |
| Total return (%)* | | | 20.75 | | | | (12.38 | ) | | | 30.08 | | | | 1.25 | | | | 6.33 | | | | (2.34 | ) |
| Ratios to average daily net assets (%)**: | | | | | | | | | | | | | | | | | | | | | | | | |
| Expenses, before waivers and reimbursements | | | 0.95 | | | | 0.99 | | | | 1.03 | | | | 1.06 | | | | 1.15 | | | | 1.14 | |
| Expenses, net of waivers and reimbursements | | | 0.91 | | | | 0.95 | | | | 0.95 | | | | 0.95 | | | | 0.98 | | | | 1.05 | |
| Net investment income (loss), before waivers and reimbursements | | | 1.55 | | | | 1.07 | | | | 1.10 | | | | 0.81 | | | | 0.71 | | | | 1.24 | |
| Net investment income (loss), net of waivers and reimbursements | | | 1.59 | | | | 1.11 | | | | 1.18 | | | | 0.92 | | | | 0.88 | | | | 1.33 | |
| Class R6 net assets at the end of the year (in thousands) | | $ | 408,608 | | | $ | 324,902 | | | $ | 308,898 | | | $ | 221,356 | | | $ | 102,227 | | | $ | 78,251 | |
| Portfolio turnover rate (%)* | | | 13 | | | | 33 | | | | 41 | | | | 59 | | | | 29 | | | | 79 | |
| * | Rates are not annualized for periods less than a year. |
| ** | Rates are annualized for periods less than a year. |
Note: Net investment income (loss) per share is based on the average shares outstanding during the year.
Performance cited represents past performance. Past performance does not guarantee future results and current performance may be lower or higher than the data quoted. Results shown are annual returns, which assume reinvestment of dividends and capital gains. Investment returns and principal will fluctuate and you may have a gain or loss when you sell shares. For the most current month-end performance information, please call 1-800-742-7272 or visit our Web site atwww.williamblairfunds.com.
| 166 | Semiannual Report | June 30, 2019 |
Financial Highlights— For a share outstanding throughout each period
International Developed Plus Fund (In Liquidation)
| | Class N | |
| | (unaudited)
Period Ended
June 30, | | | Years Ended December 31, | |
| | | 2019 | | | 2018 | | | 2017 | | | 2016 | | | 2015 | | | 2014 | |
| Net asset value, beginning of year | | $ | 13.56 | | | $ | 16.60 | | | $ | 13.68 | | | $ | 13.85 | | | $ | 13.76 | | | $ | 14.28 | |
| Income (loss) from investment operations: | | | | | | | | | | | | | | | | | | | | | | | | |
| Net investment income (loss) | | �� | 0.09 | | | | 0.17 | | | | 0.12 | | | | 0.18 | | | | 0.15 | | | | 0.16 | |
| Net realized and unrealized gain (loss) on investments | | | 2.76 | | | | (2.93 | ) | | | 3.08 | | | | (0.22 | ) | | | 0.06 | | | | (0.60 | ) |
| Total from investment operations | | | 2.85 | | | | (2.76 | ) | | | 3.20 | | | | (0.04 | ) | | | 0.21 | | | | (0.44 | ) |
| Less distributions from: | | | | | | | | | | | | | | | | | | | | | | | | |
| Net investment income | | | — | | | | 0.17 | | | | 0.28 | | | | 0.13 | | | | 0.12 | | | | 0.08 | |
| Net realized gain | | | — | | | | 0.11 | | | | — | | | | — | | | | — | | | | — | |
| Total distributions | | | — | | | | 0.28 | | | | 0.28 | | | | 0.13 | | | | 0.12 | | | | 0.08 | |
| Net asset value, end of year | | $ | 16.41 | | | $ | 13.56 | | | $ | 16.60 | | | $ | 13.68 | | | $ | 13.85 | | | $ | 13.76 | |
| Total return (%)* | | | 21.02 | | | | (16.68 | ) | | | 23.43 | | | | (0.27 | ) | | | 1.54 | | | | (3.09 | ) |
| Ratios to average daily net assets (%)**: | | | | | | | | | | | | | | | | | | | | | | | | |
| Expenses, before waivers and reimbursements | | | 1.51 | | | | 1.48 | | | | 1.54 | | | | 1.60 | | | | 1.60 | | | | 1.56 | |
| Expenses, net of waivers and reimbursements | | | 1.25 | | | | 1.27 | | | | 1.30 | | | | 1.30 | | | | 1.32 | | | | 1.38 | |
| Net investment income (loss), before waivers and reimbursements | | | 0.94 | | | | 0.83 | | | | 0.54 | | | | 1.00 | | | | 0.73 | | | | 0.93 | |
| Net investment income (loss), net of waivers and reimbursements | | | 1.20 | | | | 1.04 | | | | 0.78 | | | | 1.30 | | | | 1.01 | | | | 1.11 | |
| Class N net assets at the end of the year (in thousands) | | $ | 1,963 | | | $ | 1,794 | | | $ | 3,219 | | | $ | 2,954 | | | $ | 3,020 | | | $ | 3,497 | |
| Portfolio turnover rate (%)* | | | 23 | | | | 65 | | | | 80 | | | | 70 | | | | 54 | | | | 73 | |
| | | | | | | | | | | | | | | | | | | | | | | | | |
| | Class I | |
| | (unaudited)
Period Ended
June 30, | | | Years Ended December 31, | |
| | | | 2019 | | | | 2018 | | | | 2017 | | | | 2016 | | | | 2015 | | | | 2014 | |
| Net asset value, beginning of year | | $ | 13.66 | | | $ | 16.76 | | | $ | 13.81 | | | $ | 13.98 | | | $ | 13.91 | | | $ | 14.43 | |
| Income (loss) from investment operations: | | | | | | | | | | | | | | | | | | | | | | | | |
| Net investment income (loss) | | | 0.09 | | | | 0.19 | | | | 0.15 | | | | 0.21 | | | | 0.18 | | | | 0.19 | |
| Net realized and unrealized gain (loss) on investments | | | 2.80 | | | | (2.94 | ) | | | 3.12 | | | | (0.22 | ) | | | 0.07 | | | | (0.59 | ) |
| Total from investment operations | | | 2.89 | | | | (2.75 | ) | | | 3.27 | | | | (0.01 | ) | | | 0.25 | | | | (0.40 | ) |
| Less distributions from: | | | | | | | | | | | | | | | | | | | | | | | | |
| Net investment income | | | — | | | | 0.24 | | | | 0.32 | | | | 0.16 | | | | 0.18 | | | | 0.12 | |
| Net realized gain | | | — | | | | 0.11 | | | | — | | | | — | | | | — | | | | — | |
| Total distributions | | | — | | | | 0.35 | | | | 0.32 | | | | 0.16 | | | | 0.18 | | | | 0.12 | |
| Net asset value, end of year | | $ | 16.55 | | | $ | 13.66 | | | $ | 16.76 | | | $ | 13.81 | | | $ | 13.98 | | | $ | 13.91 | |
| Total return (%)* | | | 21.16 | | | | (16.47 | ) | | | 23.72 | | | | (0.02 | ) | | | 1.80 | | | | (2.80 | ) |
| Ratios to average daily net assets (%)**: | | | | | | | | | | | | | | | | | | | | | | | | |
| Expenses, before waivers and reimbursements | | | 1.28 | | | | 1.22 | | | | 1.26 | | | | 1.34 | | | | 1.34 | | | | 1.32 | |
| Expenses, net of waivers and reimbursements | | | 1.00 | | | | 1.02 | | | | 1.05 | | | | 1.05 | | | | 1.07 | | | | 1.13 | |
| Net investment income (loss), before waivers and reimbursements | | | 0.97 | | | | 0.96 | | | | 0.72 | | | | 1.23 | | | | 0.99 | | | | 1.16 | |
| Net investment income (loss), net of waivers and reimbursements | | | 1.25 | | | | 1.16 | | | | 0.93 | | | | 1.52 | | | | 1.26 | | | | 1.35 | |
| Class I net assets at the end of the year (in thousands) | | $ | 14,048 | | | $ | 86,787 | | | $ | 117,520 | | | $ | 84,383 | | | $ | 60,886 | | | $ | 65,012 | |
| Portfolio turnover rate (%)* | | | 23 | | | | 65 | | | | 80 | | | | 70 | | | | 54 | | | | 73 | |
| * | Rates are not annualized for periods less than a year. |
| ** | Rates are annualized for periods less than a year. |
Note: Net investment income (loss) per share is based on the average shares outstanding during the year.
Performance cited represents past performance. Past performance does not guarantee future results and current performance may be lower or higher than the data quoted. Results shown are annual returns, which assume reinvestment of dividends and capital gains. Investment returns and principal will fluctuate and you may have a gain or loss when you sell shares. For the most current month-end performance information, please call 1-800-742-7272 or visit our Web site atwww.williamblairfunds.com.
| June 30, 2019 | William Blair Funds | 167 |
Financial Highlights— For a share outstanding throughout each period
Institutional International Developed Plus Fund (In Liquidation)
| | Institutional | |
| | (unaudited)
Period Ended
June 30, | | | Years Ended December 31, | |
| | | 2019 | | | 2018 | | | 2017 | | | 2016 | | | 2015 | | | 2014 | |
| Net asset value, beginning of year | | $ | 11.94 | | | $ | 14.55 | | | $ | 11.84 | | | $ | 12.12 | | | $ | 12.01 | | | $ | 12.70 | |
| Income (loss) from investment operations: | | | | | | | | | | | | | | | | | | | | | | | | |
| Net investment income (loss) | | | 0.10 | | | | 0.18 | | | | 0.16 | | | | 0.20 | | | | 0.15 | | | | 0.21 | |
| Net realized and unrealized gain (loss) on investments | | | 2.37 | | | | (2.37 | ) | | | 2.71 | | | | (0.24 | ) | | | 0.08 | | | | (0.65 | ) |
| Total from investment operations | | | 2.47 | | | | (2.19 | ) | | | 2.87 | | | | (0.04 | ) | | | 0.23 | | | | (0.44 | ) |
| Less distributions from: | | | | | | | | | | | | | | | | | | | | | | | | |
| Net investment income | | | — | | | | 0.42 | | | | 0.16 | | | | 0.24 | | | | 0.12 | | | | 0.25 | |
| Net realized gain | | | — | | | | — | | | | — | | | | — | | | | — | | | | — | |
| Total distributions | | | — | | | | 0.42 | | | | 0.16 | | | | 0.24 | | | | 0.12 | | | | 0.25 | |
| Net asset value, end of year | | $ | 14.41 | | | $ | 11.94 | | | $ | 14.55 | | | $ | 11.84 | | | $ | 12.12 | | | $ | 12.01 | |
| Total return (%)* | | | 20.69 | | | | (15.12 | ) | | | 24.28 | | | | (0.27 | ) | | | 1.91 | | | | (3.50 | ) |
| Ratios to average daily net assets (%)**: | | | | | | | | | | | | | | | | | | | | | | | | |
| Expenses, before waivers and reimbursements | | | 1.50 | | | | 1.62 | | | | 1.68 | | | | 1.77 | | | | 1.76 | | | | 1.63 | |
| Expenses, net of waivers and reimbursements | | | 0.90 | | | | 0.90 | | | | 0.93 | | | | 1.00 | | | | 1.00 | | | | 1.03 | |
| Net investment income (loss), before waivers and reimbursements | | | 0.96 | | | | 0.53 | | | | 0.41 | | | | 0.92 | | | | 0.47 | | | | 1.01 | |
| Net investment income (loss), net of waivers and reimbursements | | | 1.56 | | | | 1.25 | | | | 1.16 | | | | 1.69 | | | | 1.23 | | | | 1.61 | |
| Net assets at the end of the year (in thousands) | | $ | 20,529 | | | $ | 16,155 | | | $ | 19,090 | | | $ | 16,565 | | | $ | 16,030 | | | $ | 14,574 | |
| Portfolio turnover rate (%)* | | | 27 | | | | 68 | | | | 73 | | | | 75 | | | | 54 | | | | 61 | |
| * | Rates are not annualized for periods less than a year. |
| ** | Rates are annualized for periods less than a year. |
Note: Net investment income (loss) per share is based on the average shares outstanding during the year.
Performance cited represents past performance. Past performance does not guarantee future results and current performance may be lower or higher than the data quoted. Results shown are annual returns, which assume reinvestment of dividends and capital gains. Investment returns and principal will fluctuate and you may have a gain or loss when you sell shares. For the most current month-end performance information, please call 1-800-742-7272 or visit our Web site atwww.williamblairfunds.com.
| 168 | Semiannual Report | June 30, 2019 |
Financial Highlights— For a share outstanding throughout each period
International Growth Fund
| | Class N | |
| | (unaudited)
Period Ended
June 30, | | | Years Ended December 31, | |
| | | 2019 | | | 2018 | | | 2017 | | | 2016 | | | 2015 | | | 2014 | |
| Net asset value, beginning of year | | $ | 23.04 | | | $ | 30.41 | | | $ | 23.86 | | | $ | 24.94 | | | $ | 25.24 | | | $ | 26.30 | |
| Income (loss) from investment operations: | | | | | | | | | | | | | | | | | | | | | | | | |
| Net investment income (loss) | | | 0.15 | | | | 0.16 | | | | 0.21 | | | | 0.20 | | | | 0.18 | | | | 0.31 | |
| Net realized and unrealized gain (loss) on investments | | | 4.29 | | | | (5.56 | ) | | | 6.73 | | | | (0.92 | ) | | | (0.25 | ) | | | (1.15 | ) |
| Total from investment operations | | | 4.44 | | | | (5.40 | ) | | | 6.94 | | | | (0.72 | ) | | | (0.07 | ) | | | (0.84 | ) |
| Less distributions from: | | | | | | | | | | | | | | | | | | | | | | | | |
| Net investment income | | | — | | | | 0.12 | | | | 0.39 | | | | 0.36 | | | | 0.23 | | | | 0.22 | |
| Net realized gain | | | — | | | | 1.85 | | | | — | | | | — | | | | — | | | | — | |
| Total distributions | | | — | | | | 1.97 | | | | 0.39 | | | | 0.36 | | | | 0.23 | | | | 0.22 | |
| Net asset value, end of year | | $ | 27.48 | | | $ | 23.04 | | | $ | 30.41 | | | $ | 23.86 | | | $ | 24.94 | | | $ | 25.24 | |
| Total return (%)* | | | 19.27 | | | | (18.00 | ) | | | 29.11 | | | | (2.88 | ) | | | (0.27 | ) | | | (3.19 | ) |
| Ratios to average daily net assets (%)**: | | | | | | | | | | | | | | | | | | | | | | | | |
| Expenses, before waivers and reimbursements | | | 1.47 | | | | 1.46 | | | | 1.47 | | | | 1.43 | | | | 1.42 | | | | 1.44 | |
| Expenses, net of waivers and reimbursements | | | 1.45 | | | | 1.45 | | | | 1.45 | | | | 1.43 | | | | 1.42 | | | | 1.44 | |
| Net investment income (loss), before waivers and reimbursements | | | 1.17 | | | | 0.54 | | | | 0.76 | | | | 0.84 | | | | 0.71 | | | | 1.17 | |
| Net investment income (loss), net of waivers and reimbursements | | | 1.19 | | | | 0.55 | | | | 0.78 | | | | 0.84 | | | | 0.71 | | | | 1.17 | |
| Class N net assets at the end of the year (in thousands) | | $ | 502,011 | | | $ | 456,533 | | | $ | 763,740 | | | $ | 729,544 | | | $ | 1,023,588 | | | $ | 978,433 | |
| Portfolio turnover rate (%)* | | | 23 | | | | 78 | | | | 82 | | | | 101 | | | | 70 | | | | 79 | |
| | | | | | | | | | | | | | | | | | | | | | | | | |
| | Class I | |
| | (unaudited)
Period Ended
June 30, | | | Years Ended December 31, | |
| | | | 2019 | | | | 2018 | | | | 2017 | | | | 2016 | | | | 2015 | | | | 2014 | |
| Net asset value, beginning of year | | $ | 23.56 | | | $ | 31.13 | | | $ | 24.42 | | | $ | 25.51 | | | $ | 25.82 | | | $ | 26.91 | |
| Income (loss) from investment operations: | | | | | | | | | | | | | | | | | | | | | | | | |
| Net investment income (loss) | | | 0.19 | | | | 0.26 | | | | 0.30 | | | | 0.29 | | | | 0.27 | | | | 0.36 | |
| Net realized and unrealized gain (loss) on investments | | | 4.39 | | | | (5.70 | ) | | | 6.89 | | | | (0.94 | ) | | | (0.28 | ) | | | (1.13 | ) |
| Total from investment operations | | | 4.58 | | | | (5.44 | ) | | | 7.19 | | | | (0.65 | ) | | | (0.01 | ) | | | (0.77 | ) |
| Less distributions from: | | | | | | | | | | | | | | | | | | | | | | | | |
| Net investment income | | | — | | | | 0.28 | | | | 0.48 | | | | 0.44 | | | | 0.30 | | | | 0.32 | |
| Net realized gain | | | — | | | | 1.85 | | | | — | | | | — | | | | — | | | | — | |
| Total distributions | | | — | | | | 2.13 | | | | 0.48 | | | | 0.44 | | | | 0.30 | | | | 0.32 | |
| Net asset value, end of year | | $ | 28.14 | | | $ | 23.56 | | | $ | 31.13 | | | $ | 24.42 | | | $ | 25.51 | | | $ | 25.82 | |
| Total return (%)* | | | 19.44 | | | | (17.73 | ) | | | 29.49 | | | | (2.54 | ) | | | (0.03 | ) | | | (2.86 | ) |
| Ratios to average daily net assets (%)**: | | | | | | | | | | | | | | | | | | | | | | | | |
| Expenses | | | 1.15 | | | | 1.13 | | | | 1.14 | | | | 1.13 | | | | 1.14 | | | | 1.14 | |
| Net investment income (loss) | | | 1.44 | | | | 0.86 | | | | 1.08 | | | | 1.16 | | | | 1.02 | | | | 1.36 | |
| Class I net assets at the end of the year (in thousands) | | $ | 1,662,854 | | | $ | 1,646,811 | | | $ | 2,375,326 | | | $ | 2,251,701 | | | $ | 2,655,156 | | | $ | 2,705,054 | |
| Portfolio turnover rate (%)* | | | 23 | | | | 78 | | | | 82 | | | | 101 | | | | 70 | | | | 79 | |
| * | Rates are not annualized for periods less than a year. |
| ** | Rates are annualized for periods less than a year. |
Note: Net investment income (loss) per share is based on the average shares outstanding during the year.
Performance cited represents past performance. Past performance does not guarantee future results and current performance may be lower or higher than the data quoted. Results shown are annual returns, which assume reinvestment of dividends and capital gains. Investment returns and principal will fluctuate and you may have a gain or loss when you sell shares. For the most current month-end performance information, please call 1-800-742-7272 or visit our Web site atwww.williamblairfunds.com.
| June 30, 2019 | William Blair Funds | 169 |
Financial Highlights— For a share outstanding throughout each period
International Growth Fund
| | Class R6 | |
| | (unaudited)
Period Ended
June 30, | |
| | 2019(a) | |
| Net asset value, beginning of year | | $ | 27.56 | |
| Income (loss) from investment operations: | | | | |
| Net investment income (loss) | | | 0.11 | |
| Net realized and unrealized gain (loss) on investments | | | 0.47 | |
| Total from investment operations | | | 0.58 | |
| Less distributions from: | | | | |
| Net investment income | | | — | |
| Net realized gain | | | — | |
| Total distributions | | | — | |
| Net asset value, end of year | | $ | 28.14 | |
| Total Return (%)* | | | 2.10 | |
| Ratios to average daily net assets (%)**: | | | | |
| Expenses | | | 1.08 | |
| Net investment income (loss) | | | 2.30 | |
| Class R6 net assets at end of year (in thousands) | | $ | 51 | |
| Portfolio turnover rate (%)* | | | 23 | |
| (a) | For the period from May 2, 2019 (Commencement of Operations) to June 30, 2019. |
| * | Rates are not annualized for periods less than a year. |
| ** | Rates are annualized for periods less than a year. |
Note: Net investment income (loss) per share is based on the average shares outstanding during the year.
Performance cited represents past performance. Past performance does not guarantee future results and current performance may be lower or higher than the data quoted. Results shown are annual returns, which assume reinvestment of dividends and capital gains. Investment returns and principal will fluctuate and you may have a gain or loss when you sell shares. For the most current month-end performance information, please call 1-800-742-7272 or visit our Web site atwww.williamblairfunds.com.
| | | |
| 170 | Semiannual Report | June 30, 2019 |
Financial Highlights— For a share outstanding throughout each period
Institutional International Growth Fund
| | Institutional | |
| | (unaudited)
Period Ended
June 30, | | | Years Ended December 31, | |
| | | 2019 | | | 2018 | | | 2017 | | | 2016 | | | 2015 | | | 2014 | |
| Net asset value, beginning of year | | $ | 13.40 | | | $ | 18.08 | | | $ | 14.55 | | | $ | 15.08 | | | $ | 15.26 | | | $ | 17.40 | |
| Income (loss) from investment operations: | | | | | | | | | | | | | | | | | | | | | | | | |
| Net investment income (loss) | | | 0.12 | | | | 0.18 | | | | 0.21 | | | | 0.18 | | | | 0.19 | | | | 0.26 | |
| Net realized and unrealized gain (loss) on investments | | | 2.48 | | | | (3.29 | ) | | | 4.07 | | | | (0.54 | ) | | | (0.18 | ) | | | (0.71 | ) |
| Total from investment operations | | | 2.60 | | | | (3.11 | ) | | | 4.28 | | | | (0.36 | ) | | | 0.01 | | | | (0.45 | ) |
| Less distributions from: | | | | | | | | | | | | | | | | | | | | | | | | |
| Net investment income | | | — | | | | 0.17 | | | | 0.44 | | | | 0.17 | | | | 0.09 | | | | 0.32 | |
| Net realized gain | | | — | | | | 1.40 | | | | 0.31 | | | | — | | | | 0.10 | | | | 1.37 | |
| Total distributions | | | — | | | | 1.57 | | | | 0.75 | | | | 0.17 | | | | 0.19 | | | | 1.69 | |
| Net asset value, end of year | | $ | 16.00 | | | $ | 13.40 | | | $ | 18.08 | | | $ | 14.55 | | | $ | 15.08 | | | $ | 15.26 | |
| Total return (%)* | | | 19.40 | | | | (17.50 | ) | | | 29.53 | | | | (2.40 | ) | | | 0.09 | | | | (2.66 | ) |
| Ratios to average daily net assets (%)**: | | | | | | | | | | | | | | | | | | | | | | | | |
| Expenses | | | 0.99 | | | | 0.97 | | | | 0.97 | | | | 0.98 | | | | 0.96 | | | | 0.97 | |
| Net investment income (loss), | | | 1.62 | | | | 1.01 | | | | 1.22 | | | | 1.25 | | | | 1.18 | | | | 1.50 | |
| Net assets at the end of the year (in thousands) | | $ | 1,797,317 | | | $ | 1,784,435 | | | $ | 2,330,299 | | | $ | 2,093,971 | | | $ | 2,335,632 | | | $ | 2,339,169 | |
| Portfolio turnover rate (%)* | | | 22 | | | | 82 | | | | 84 | | | | 105 | | | | 70 | | | | 83 | |
| * | Rates are not annualized for periods less than a year. |
| ** | Rates are annualized for periods less than a year. |
Note: Net investment income (loss) per share is based on the average shares outstanding during the year.
Performance cited represents past performance. Past performance does not guarantee future results and current performance may be lower or higher than the data quoted. Results shown are annual returns, which assume reinvestment of dividends and capital gains. Investment returns and principal will fluctuate and you may have a gain or loss when you sell shares. For the most current month-end performance information, please call 1-800-742-7272 or visit our Web site atwww.williamblairfunds.com.
| June 30, 2019 | William Blair Funds | 171 |
Financial Highlights— For a share outstanding throughout each period
International Small Cap Growth Fund
| | Class N | |
| | (unaudited)
Period Ended
June 30, | | | Years Ended December 31, | |
| | | 2019 | | | 2018 | | | 2017 | | | 2016 | | | 2015 | | | 2014 | |
| Net asset value, beginning of year | | $ | 10.36 | | | $ | 15.49 | | | $ | 12.87 | | | $ | 13.50 | | | $ | 12.56 | | | $ | 16.08 | |
| Income (loss) from investment operations: | | | | | | | | | | | | | | | | | | | | | | | | |
| Net investment income (loss) | | | 0.07 | | | | 0.04 | | | | 0.12 | | | | 0.10 | | | | 0.05 | | | | 0.03 | |
| Net realized and unrealized gain (loss) on investments | | | 1.87 | | | | (3.78 | ) | | | 3.98 | | | | (0.72 | ) | | | 1.16 | | | | (1.38 | ) |
| Total from investment operations | | | 1.94 | | | | (3.74 | ) | | | 4.10 | | | | (0.62 | ) | | | 1.21 | | | | (1.35 | ) |
| Less distributions from: | | | | | | | | | | | | | | | | | | | | | | | | |
| Net investment income | | | — | | | | 0.08 | | | | 0.32 | | | | 0.01 | | | | 0.24 | | | | 0.18 | |
| Net realized gain | | | — | | | | 1.31 | | | | 1.16 | | | | 0.00 | ^ | | | 0.03 | | | | 1.99 | |
| Total distributions | | | — | | | | 1.39 | | | | 1.48 | | | | 0.01 | | | | 0.27 | | | | 2.17 | |
| Net asset value, end of year | | $ | 12.30 | | | $ | 10.36 | | | $ | 15.49 | | | $ | 12.87 | | | $ | 13.50 | | | $ | 12.56 | |
| Total return (%)* | | | 18.73 | | | | (24.48 | ) | | | 32.17 | | | | (4.60 | ) | | | 9.67 | | | | (8.43 | ) |
| Ratios to average daily net assets (%)**: | | | | | | | | | | | | | | | | | | | | | | | | |
| Expenses, before waivers and reimbursements | | | 1.50 | | | | 1.48 | | | | 1.62 | | | | 1.59 | | | | 1.62 | | | | 1.58 | |
| Expenses, net of waivers and reimbursements | | | 1.50 | | | | 1.48 | | | | 1.47 | | | | 1.44 | | | | 1.47 | | | | 1.58 | |
| Net investment income (loss), before waivers and reimbursements | | | 1.15 | | | | 0.29 | | | | 0.70 | | | | 0.62 | | | | 0.19 | | | | 0.20 | |
| Net investment income (loss), net of waivers and reimbursements | | | 1.15 | | | | 0.29 | | | | 0.85 | | | | 0.77 | | | | 0.34 | | | | 0.20 | |
| Class N net assets at the end of the year (in thousands) | | $ | 3,534 | | | $ | 3,440 | | | $ | 6,275 | | | $ | 10,361 | | | $ | 11,350 | | | $ | 13,676 | |
| Portfolio turnover rate (%)* | | | 18 | | | | 88 | | | | 64 | | | | 73 | | | | 90 | | | | 127 | |
| | | | | | | | | | | | | | | | | | | | | | | | | |
| | Class I | |
| | (unaudited)
Period Ended
June 30, | | | Years Ended December 31, | |
| | | | 2019 | | | | 2018 | | | | 2017 | | | | 2016 | | | | 2015 | | | | 2014 | |
| Net asset value, beginning of year | | $ | 10.45 | | | $ | 15.65 | | | $ | 13.00 | | | $ | 13.65 | | | $ | 12.70 | | | $ | 16.23 | |
| Income (loss) from investment operations: | | | | | | | | | | | | | | | | | | | | | | | | |
| Net investment income (loss) | | | 0.08 | | | | 0.09 | | | | 0.14 | | | | 0.14 | | | | 0.09 | | | | 0.09 | |
| Net realized and unrealized gain (loss) on investments | | | 1.90 | | | | (3.84 | ) | | | 4.07 | | | | (0.75 | ) | | | 1.18 | | | | (1.40 | ) |
| Total from investment operations | | | 1.98 | | | | (3.75 | ) | | | 4.21 | | | | (0.61 | ) | | | 1.27 | | | | (1.31 | ) |
| Less distributions from: | | | | | | | | | | | | | | | | | | | | | | | | |
| Net investment income | | | — | | | | 0.14 | | | | 0.40 | | | | 0.04 | | | | 0.29 | | | | 0.23 | |
| Net realized gain | | | — | | | | 1.31 | | | | 1.16 | | | | 0.00^ | | | | 0.03 | | | | 1.99 | |
| Total distributions | | | — | | | | 1.45 | | | | 1.56 | | | | 0.04 | | | | 0.32 | | | | 2.22 | |
| Net asset value, end of year | | $ | 12.43 | | | $ | 10.45 | | | $ | 15.65 | | | $ | 13.00 | | | $ | 13.65 | | | $ | 12.70 | |
| Total return (%)* | | | 18.95 | | | | (24.29 | ) | | | 32.70 | | | | (4.41 | ) | | | 10.00 | | | | (8.10 | ) |
| Ratios to average daily net assets (%)**: | | | | | | | | | | | | | | | | | | | | | | | | |
| Expenses, before waivers and reimbursements | | | 1.24 | | | | 1.18 | | | | 1.31 | | | | 1.30 | | | | 1.31 | | | | 1.28 | |
| Expenses, net of waivers and reimbursements | | | 1.24 | | | | 1.18 | | | | 1.16 | | | | 1.15 | | | | 1.16 | | | | 1.28 | |
| Net investment income (loss), before waivers and reimbursements | | | 1.38 | | | | 0.60 | | | | 0.77 | | | | 0.91 | | | | 0.51 | | | | 0.56 | |
| Net investment income (loss), net of waivers and reimbursements | | | 1.38 | | | | 0.60 | | | | 0.92 | | | | 1.06 | | | | 0.66 | | | | 0.56 | |
| Class I net assets at the end of the year (in thousands) | | $ | 158,003 | | | $ | 165,451 | | | $ | 338,920 | | | $ | 306,526 | | | $ | 342,232 | | | $ | 364,161 | |
| Portfolio turnover rate (%)* | | | 18 | | | | 88 | | | | 64 | | | | 73 | | | | 90 | | | | 127 | |
| * | Rates are not annualized for periods less than a year. |
| ** | Rates are annualized for periods less than a year. |
| ^ | Amount is less than $0.005 per share. |
Note: Net investment income (loss) per share is based on the average shares outstanding during the year.
Performance cited represents past performance. Past performance does not guarantee future results and current performance may be lower or higher than the data quoted. Results shown are annual returns, which assume reinvestment of dividends and capital gains. Investment returns and principal will fluctuate and you may have a gain or loss when you sell shares. For the most current month-end performance information, please call 1-800-742-7272 or visit our Web site atwww.williamblairfunds.com.
| 172 | Semiannual Report | June 30, 2019 |
Financial Highlights— For a share outstanding throughout each period
International Small Cap Growth Fund
| | Class R6 | |
| | (unaudited)
Period Ended
June 30, | | | Years Ended December 31, | |
| | | 2019 | | | 2018 | | | 2017 | | | 2016 | | | 2015 | | | 2014 | |
| Net asset value, beginning of year | | $ | 10.50 | | | $ | 15.73 | | | $ | 13.07 | | | $ | 13.72 | | | $ | 12.77 | | | $ | 16.32 | |
| Income (loss) from investment operations: | | | | | | | | | | | | | | | | | | | | | | | | |
| Net investment income (loss) | | | 0.09 | | | | 0.10 | | | | 0.15 | | | | 0.15 | | | | 0.10 | | | | 0.12 | |
| Net realized and unrealized gain (loss) on investments | | | 1.90 | | | | (3.85 | ) | | | 4.08 | | | | (0.74 | ) | | | 1.18 | | | | (1.41 | ) |
| Total from investment operations | | | 1.99 | | | | (3.75 | ) | | | 4.23 | | | | (0.59 | ) | | | 1.28 | | | | (1.29 | ) |
| Less distributions from: | | | | | | | | | | | | | | | | | | | | | | | | |
| Net investment income | | | — | | | | 0.17 | | | | 0.41 | | | | 0.06 | | | | 0.30 | | | | 0.27 | |
| Net realized gain | | | — | | | | 1.31 | | | | 1.16 | | | | 0.00 | ^ | | | 0.03 | | | | 1.99 | |
| Total distributions | | | — | | | | 1.48 | | | | 1.57 | | | | 0.06 | | | | 0.33 | | | | 2.26 | |
| Net asset value, end of year | | $ | 12.49 | | | $ | 10.50 | | | $ | 15.73 | | | $ | 13.07 | | | $ | 13.72 | | | $ | 12.77 | |
| Total return (%)* | | | 18.95 | | | | (24.19 | ) | | | 32.70 | | | | (4.31 | ) | | | 10.03 | | | | (7.91 | ) |
| Ratios to average daily net assets (%)**: | | | | | | | | | | | | | | | | | | | | | | | | |
| Expenses | | | 1.13 | | | | 1.08 | | | | 1.08 | | | | 1.07 | | | | 1.08 | | | | 1.06 | |
| Net investment income (loss) | | | 1.52 | | | | 0.67 | | | | 0.99 | | | | 1.13 | | | | 0.76 | | | | 0.74 | |
| Class R6 net assets at the end of the year (in thousands) | | $ | 146,917 | | | $ | 171,833 | | | $ | 256,558 | | | $ | 199,746 | | | $ | 221,018 | | | $ | 245,103 | |
| Portfolio turnover rate (%)* | | | 18 | | | | 88 | | | | 64 | | | | 73 | | | | 90 | | | | 127 | |
| * | Rates are not annualized for periods less than a year. |
| ** | Rates are annualized for periods less than a year. |
| ^ | Amount is less than $0.005 per share. |
Note: Net investment income (loss) per share is based on the average shares outstanding during the year.
Performance cited represents past performance. Past performance does not guarantee future results and current performance may be lower or higher than the data quoted. Results shown are annual returns, which assume reinvestment of dividends and capital gains. Investment returns and principal will fluctuate and you may have a gain or loss when you sell shares. For the most current month-end performance information, please call 1-800-742-7272 or visit our Web site atwww.williamblairfunds.com.
| June 30, 2019 | William Blair Funds | 173 |
Financial Highlights— For a share outstanding throughout each period
Emerging Markets Leaders Fund
| | Class N | |
| | (unaudited)
Period Ended
June 30, | | | Years Ended December 31, | |
| | | 2019 | | | 2018 | | | 2017 | | | 2016 | | | 2015 | | | 2014 | |
| Net asset value, beginning of year | | $ | 8.26 | | | $ | 11.06 | | | $ | 7.84 | | | $ | 7.73 | | | $ | 9.06 | | | $ | 9.10 | |
| Income (loss) from investment operations: | | | | | | | | | | | | | | | | | | | | | | | | |
| Net investment income (loss) | | | 0.03 | | | | 0.03 | | | | 0.01 | | | | 0.02 | | | | 0.02 | | | | 0.05 | |
| Net realized and unrealized gain (loss) on investments | | | 1.35 | | | | (1.97 | ) | | | 3.26 | | | | 0.09 | | | | (1.34 | ) | | | 0.14 | |
| Total from investment operations | | | 1.38 | | | | (1.94 | ) | | | 3.27 | | | | 0.11 | | | | (1.32 | ) | | | 0.19 | |
| Less distributions from: | | | | | | | | | | | | | | | | | | | | | | | | |
| Net investment income | | | — | | | | 0.07 | | | | 0.05 | | | | — | | | | — | | | | 0.00 | ^ |
| Net realized gain | | | — | | | | 0.79 | | | | — | | | | — | | | | 0.01 | | | | 0.23 | |
| Total distributions | | | — | | | | 0.86 | | | | 0.05 | | | | — | | | | 0.01 | | | | 0.23 | |
| Net asset value, end of year | | $ | 9.64 | | | $ | 8.26 | | | $ | 11.06 | | | $ | 7.84 | | | $ | 7.73 | | | $ | 9.06 | |
| Total return (%)* | | | 16.71 | | | | (17.73 | ) | | | 41.68 | | | | 1.42 | | | | (14.56 | ) | | | 2.17 | |
| Ratios to average daily net assets (%)**: | | | | | | | | | | | | | | | | | | | | | | | | |
| Expenses, before waivers and reimbursements | | | 1.62 | | | | 1.60 | | | | 1.62 | | | | 1.81 | | | | 1.89 | | | | 1.82 | |
| Expenses, net of waivers and reimbursements | | | 1.50 | | | | 1.58 | | | | 1.47 | | | | 1.57 | | | | 1.64 | | | | 1.65 | |
| Net investment income (loss), before waivers and reimbursements | | | 0.61 | | | | 0.27 | | | | (0.01 | ) | | | 0.05 | | | | (0.07 | ) | | | 0.34 | |
| Net investment income (loss), net of waivers and reimbursements | | | 0.73 | | | | 0.29 | | | | 0.14 | | | | 0.29 | | | | 0.18 | | | | 0.51 | |
| Class N net assets at the end of the year (in thousands) | | $ | 2,260 | | | $ | 2,239 | | | $ | 2,766 | | | $ | 2,479 | | | $ | 1,599 | | | $ | 1,832 | |
| Portfolio turnover rate (%)* | | | 13 | | | | 52 | | | | 59 | | | | 135 | | | | 110 | | | | 131 | |
| | | | | | | | | | | | | | | | | | | | | | | | | |
| | Class I | |
| | (unaudited)
Period Ended
June 30, | | | Years Ended December 31, | |
| | | | 2019 | | | | 2018 | | | | 2017 | | | | 2016 | | | | 2015 | | | | 2014 | |
| Net asset value, beginning of year | | $ | 8.27 | | | $ | 11.09 | | | $ | 7.87 | | | $ | 7.74 | | | $ | 9.08 | | | $ | 9.10 | |
| Income (loss) from investment operations: | | | | | | | | | | | | | | | | | | | | | | | | |
| Net investment income (loss) | | | 0.05 | | | | 0.06 | | | | 0.02 | | | | 0.04 | | | | 0.05 | | | | 0.08 | |
| Net realized and unrealized gain (loss) on investments | | | 1.35 | | | | (1.97 | ) | | | 3.27 | | | | 0.10 | | | | (1.36 | ) | | | 0.15 | |
| Total from investment operations | | | 1.40 | | | | (1.91 | ) | | | 3.29 | | | | 0.14 | | | | (1.31 | ) | | | 0.23 | |
| Less distributions from: | | | | | | | | | | | | | | | | | | | | | | | | |
| Net investment income | | | — | | | | 0.12 | | | | 0.07 | | | | 0.01 | | | | 0.02 | | | | 0.02 | |
| Net realized gain | | | — | | | | 0.79 | | | | — | | | | — | | | | 0.01 | | | | 0.23 | |
| Total distributions | | | — | | | | 0.91 | | | | 0.07 | | | | 0.01 | | | | 0.03 | | | | 0.25 | |
| Net asset value, end of year | | $ | 9.67 | | | $ | 8.27 | | | $ | 11.09 | | | $ | 7.87 | | | $ | 7.74 | | | $ | 9.08 | |
| Total return (%)* | | | 16.93 | | | | (17.45 | ) | | | 41.89 | | | | 1.82 | | | | (14.37 | ) | | | 2.62 | |
| Ratios to average daily net assets (%)**: | | | | | | | | | | | | | | | | | | | | | | | | |
| Expenses, before waivers and reimbursements | | | 1.30 | | | | 1.27 | | | | 1.40 | | | | 1.54 | | | | 1.54 | | | | 1.60 | |
| Expenses, net of waivers and reimbursements | | | 1.25 | | | | 1.27 | | | | 1.25 | | | | 1.30 | | | | 1.29 | | | | 1.40 | |
| Net investment income (loss), before waivers and reimbursements | | | 1.00 | | | | 0.58 | | | | 0.09 | | | | 0.28 | | | | 0.28 | | | | 0.64 | |
| Net investment income (loss), net of waivers and reimbursements | | | 1.05 | | | | 0.58 | | | | 0.24 | | | | 0.52 | | | | 0.53 | | | | 0.84 | |
| Class I net assets at the end of the year (in thousands) | | $ | 43,233 | | | $ | 34,786 | | | $ | 47,666 | | | $ | 30,346 | | | $ | 32,862 | | | $ | 28,475 | |
| Portfolio turnover rate (%)* | | | 13 | | | | 52 | | | | 59 | | | | 135 | | | | 110 | | | | 131 | |
| * | Rates are not annualized for periods less than a year. |
| ** | Rates are annualized for periods less than a year. |
| ^ | Amount is less than $0.005 per share. |
Note: Net investment income (loss) per share is based on the average shares outstanding during the year.
Performance cited represents past performance. Past performance does not guarantee future results and current performance may be lower or higher than the data quoted. Results shown are annual returns, which assume reinvestment of dividends and capital gains. Investment returns and principal will fluctuate and you may have a gain or loss when you sell shares. For the most current month-end performance information, please call 1-800-742-7272 or visit our Web site atwww.williamblairfunds.com.
| 174 | Semiannual Report | June 30, 2019 |
Financial Highlights— For a share outstanding throughout each period
Emerging Markets Leaders Fund
| | Class R6 | |
| | (unaudited)
Period Ended
June 30, | | | Years Ended December 31, | |
| | | 2019 | | | 2018 | | | 2017 | | | 2016 | | | 2015 | | | 2014 | |
| Net asset value, beginning of year | | $ | 8.26 | | | $ | 11.09 | | | $ | 7.86 | | | $ | 7.74 | | | $ | 9.07 | | | $ | 9.10 | |
| Income (loss) from investment operations: | | | | | | | | | | | | | | | | | | | | | | | | |
| Net investment income (loss) | | | 0.05 | | | | 0.07 | | | | 0.03 | | | | 0.03 | | | | 0.04 | | | | 0.08 | |
| Net realized and unrealized gain (loss) on investments | | | 1.35 | | | | (1.98 | ) | | | 3.28 | | | | 0.10 | | | | (1.33 | ) | | | 0.16 | |
| Total from investment operations | | | 1.40 | | | | (1.91 | ) | | | 3.31 | | | | 0.13 | | | | (1.29 | ) | | | 0.24 | |
| Less distributions from: | | | | | | | | | | | | | | | | | | | | | | | | |
| Net investment income | | | — | | | | 0.13 | | | | 0.08 | | | | 0.01 | | | | 0.03 | | | | 0.04 | |
| Net realized gain | | | — | | | | 0.79 | | | | — | | | | — | | | | 0.01 | | | | 0.23 | |
| Total distributions | | | — | | | | 0.92 | | | | 0.08 | | | | 0.01 | | | | 0.04 | | | | 0.27 | |
| Net asset value, end of year | | $ | 9.66 | | | $ | 8.26 | | | $ | 11.09 | | | $ | 7.86 | | | $ | 7.74 | | | $ | 9.07 | |
| Total return (%)* | | | 16.95 | | | | (17.46 | ) | | | 42.15 | | | | 1.74 | | | | (14.24 | ) | | | 2.68 | |
| Ratios to average daily net assets (%)**: | | | | | | | | | | | | | | | | | | | | | | | | |
| Expenses, before waivers and reimbursements | | | 1.24 | | | | 1.20 | | | | 1.19 | | | | 1.34 | | | | 1.35 | | | | 1.42 | |
| Expenses, net of waivers and reimbursements | | | 1.20 | | | | 1.20 | | | | 1.19 | | | | 1.25 | | | | 1.25 | | | | 1.25 | |
| Net investment income (loss), before waivers and reimbursements | | | 1.00 | | | | 0.71 | | | | 0.33 | | | | 0.30 | | | | 0.39 | | | | 0.66 | |
| Net investment income (loss), net of waivers and reimbursements | | | 1.04 | | | | 0.71 | | | | 0.33 | | | | 0.39 | | | | 0.49 | | | | 0.83 | |
| Class R6 net assets at the end of the year (in thousands) | | $ | 178,570 | | | $ | 161,889 | | | $ | 427,480 | | | $ | 272,678 | | | $ | 93,217 | | | $ | 75,875 | |
| Portfolio turnover rate (%)* | | | 13 | | | | 52 | | | | 59 | | | | 135 | | | | 110 | | | | 131 | |
| * | Rates are not annualized for periods less than a year. |
| ** | Rates are annualized for periods less than a year. |
Note: Net investment income (loss) per share is based on the average shares outstanding during the year.
Performance cited represents past performance. Past performance does not guarantee future results and current performance may be lower or higher than the data quoted. Results shown are annual returns, which assume reinvestment of dividends and capital gains. Investment returns and principal will fluctuate and you may have a gain or loss when you sell shares. For the most current month-end performance information, please call 1-800-742-7272 or visit our Web site atwww.williamblairfunds.com.
| June 30, 2019 | William Blair Funds | 175 |
Financial Highlights— For a share outstanding throughout each period
Emerging Markets Growth Fund
| | Class N | |
| | (unaudited)
Period Ended
June 30, | | | Years Ended December 31, | |
| | | 2019 | | | 2018 | | | 2017 | | | 2016 | | | 2015 | | | 2014 | |
| Net asset value, beginning of year | | $ | 11.14 | | | $ | 16.20 | | | $ | 10.99 | | | $ | 10.85 | | | $ | 12.91 | | | $ | 13.28 | |
| Income (loss) from investment operations: | | | | | | | | | | | | | | | | | | | | | | | | |
| Net investment income (loss) | | | 0.05 | | | | 0.01 | | | | (0.02 | ) | | | 0.03 | | | | 0.04 | | | | 0.08 | |
| Net realized and unrealized gain (loss) on investments | | | 1.71 | | | | (3.49 | ) | | | 5.35 | | | | 0.13 | | | | (1.98 | ) | | | 0.37 | |
| Total from investment operations | | | 1.76 | | | | (3.48 | ) | | | 5.33 | | | | 0.16 | | | | (1.94 | ) | | | 0.45 | |
| Less distributions from: | | | | | | | | | | | | | | | | | | | | | | | | |
| Net investment income | | | — | | | | 0.11 | | | | 0.12 | | | | 0.02 | | | | — | | | | 0.08 | |
| Net realized gain | | | — | | | | 1.47 | | | | — | | | | — | | | | 0.12 | | | | 0.74 | |
| Total distributions | | | — | | | | 1.58 | | | | 0.12 | | | | 0.02 | | | | 0.12 | | | | 0.82 | |
| Net asset value, end of year | | $ | 12.90 | | | $ | 11.14 | | | $ | 16.20 | | | $ | 10.99 | | | $ | 10.85 | | | $ | 12.91 | |
| Total return (%)* | | | 15.80 | | | | (21.61 | ) | | | 48.53 | | | | 1.49 | | | | (15.03 | ) | | | 3.40 | |
| Ratios to average daily net assets (%)**: | | | | | | | | | | | | | | | | | | | | | | | | |
| Expenses, before waivers and reimbursements | | | 1.52 | | | | 1.52 | | | | 1.65 | | | | 1.65 | | | | 1.65 | | | | 1.64 | |
| Expenses, net of waivers and reimbursements | | | 1.52 | | | | 1.52 | | | | 1.50 | | | | 1.50 | | | | 1.50 | | | | 1.64 | |
| Net investment income (loss), before waivers and reimbursements | | | 0.91 | | | | 0.09 | | | | (0.29 | ) | | | 0.13 | | | | 0.18 | | | | 0.55 | |
| Net investment income (loss), net of waivers and reimbursements | | | 0.91 | | | | 0.09 | | | | (0.14 | ) | | | 0.28 | | | | 0.33 | | | | 0.55 | |
| Class N net assets at the end of the year (in thousands) | | $ | 7,833 | | | $ | 7,103 | | | $ | 10,479 | | | $ | 8,488 | | | $ | 9,367 | | | $ | 12,638 | |
| Portfolio turnover rate (%)* | | | 39 | | | | 113 | | | | 91 | | | | 105 | | | | 121 | | | | 101 | |
| | | | | | | | | | | | | | | | | | | | | | | | | |
| | Class I | |
| | (unaudited)
Period Ended
June 30, | | | Years Ended December 31, | |
| | | 2019 | | | 2018 | | | 2017 | | | 2016 | | | 2015 | | | 2014 | |
| Net asset value, beginning of year | | $ | 11.25 | | | $ | 16.36 | | | $ | 11.10 | | | $ | 10.96 | | | $ | 13.01 | | | $ | 13.38 | |
| Income (loss) from investment operations: | | | | | | | | | | | | | | | | | | | | | | | | |
| Net investment income (loss) | | | 0.07 | | | | 0.05 | | | | 0.01 | | | | 0.06 | | | | 0.07 | | | | 0.11 | |
| Net realized and unrealized gain (loss) on investments | | | 1.72 | | | | (3.52 | ) | | | 5.40 | | | | 0.13 | | | | (2.00 | ) | | | 0.37 | |
| Total from investment operations | | | 1.79 | | | | (3.47 | ) | | | 5.41 | | | | 0.19 | | | | (1.93 | ) | | | 0.48 | |
| Less distributions from: | | | | | | | | | | | | | | | | | | | | | | | | |
| Net investment income | | | — | | | | 0.17 | | | | 0.15 | | | | 0.05 | | | | — | | | | 0.11 | |
| Net realized gain | | | — | | | | 1.47 | | | | — | | | | — | | | | 0.12 | | | | 0.74 | |
| Total distributions | | | — | | | | 1.64 | | | | 0.15 | | | | 0.05 | | | | 0.12 | | | | 0.85 | |
| Net asset value, end of year | | $ | 13.04 | | | $ | 11.25 | | | $ | 16.36 | | | $ | 11.10 | | | $ | 10.96 | | | $ | 13.01 | |
| Total return (%)* | | | 15.91 | | | | (21.37 | ) | | | 48.83 | | | | 1.73 | | | | (14.83 | ) | | | 3.65 | |
| Ratios to average daily net assets (%)**: | | | | | | | | | | | | | | | | | | | | | | | | |
| Expenses, before waivers and reimbursements | | | 1.27 | | | | 1.27 | | | | 1.42 | | | | 1.41 | | | | 1.40 | | | | 1.40 | |
| Expenses, net of waivers and reimbursements | | | 1.27 | | | | 1.27 | | | | 1.27 | | | | 1.26 | | | | 1.25 | | | | 1.40 | |
| Net investment income (loss), before waivers and reimbursements | | | 1.10 | | | | 0.34 | | | | (0.07 | ) | | | 0.38 | | | | 0.43 | | | | 0.79 | |
| Net investment income (loss), net of waivers and reimbursements | | | 1.10 | | | | 0.34 | | | | 0.08 | | | | 0.53 | | | | 0.58 | | | | 0.79 | |
| Class I net assets at the end of the year (in thousands) | | $ | 74,224 | | | $ | 79,427 | | | $ | 129,481 | | | $ | 93,668 | | | $ | 130,491 | | | $ | 166,488 | |
| Portfolio turnover rate (%)* | | | 39 | | | | 113 | | | | 91 | | | | 105 | | | | 121 | | | | 101 | |
| * | Rates are not annualized for periods less than a year. |
| ** | Rates are annualized for periods less than a year. |
Note: Net investment income (loss) per share is based on the average shares outstanding during the year.
Performance cited represents past performance. Past performance does not guarantee future results and current performance may be lower or higher than the data quoted. Results shown are annual returns, which assume reinvestment of dividends and capital gains. Investment returns and principal will fluctuate and you may have a gain or loss when you sell shares. For the most current month-end performance information, please call 1-800-742-7272 or visit our Web site atwww.williamblairfunds.com.
| 176 | Semiannual Report | June 30, 2019 |
Financial Highlights— For a share outstanding throughout each period
Emerging Markets Growth Fund
| | Class R6 | |
| | (unaudited)
Period Ended
June 30, | | | Years Ended December 31, | |
| | | 2019 | | | 2018 | | | 2017 | | | 2016 | | | 2015 | | | 2014 | |
| Net asset value, beginning of year | | $ | 11.35 | | | $ | 16.49 | | | $ | 11.18 | | | $ | 11.05 | | | $ | 13.09 | | | $ | 13.46 | |
| Income (loss) from investment operations: | | | | | | | | | | | | | | | | | | | | | | | | |
| Net investment income (loss) | | | 0.08 | | | | 0.07 | | | | 0.02 | | | | 0.07 | | | | 0.08 | | | | 0.14 | |
| Net realized and unrealized gain (loss) on investments | | | 1.73 | | | | (3.56 | ) | | | 5.46 | | | | 0.12 | | | | (2.00 | ) | | | 0.37 | |
| Total from investment operations | | | 1.81 | | | | (3.49 | ) | | | 5.48 | | | | 0.19 | | | | (1.92 | ) | | | 0.51 | |
| Less distributions from: | | | | | | | | | | | | | | | | | | | | | | | | |
| Net investment income | | | — | | | | 0.18 | | | | 0.17 | | | | 0.06 | | | | — | | | | 0.14 | |
| Net realized gain | | | — | | | | 1.47 | | | | — | | | | — | | | | 0.12 | | | | 0.74 | |
| Total distributions | | | — | | | | 1.65 | | | | 0.17 | | | | 0.06 | | | | 0.12 | | | | 0.88 | |
| Net asset value, end of year | | $ | 13.16 | | | $ | 11.35 | | | $ | 16.49 | | | $ | 11.18 | | | $ | 11.05 | | | $ | 13.09 | |
| Total return (%)* | | | 15.95 | | | | (21.29 | ) | | | 49.06 | | | | 1.71 | | | | (14.67 | ) | | | 3.85 | |
| Ratios to average daily net assets (%)**: | | | | | | | | | | | | | | | | | | | | | | | | |
| Expenses | | | 1.19 | | | | 1.19 | | | | 1.17 | | | | 1.19 | | | | 1.17 | | | | 1.18 | |
| Net investment income (loss) | | | 1.23 | | | | 0.46 | | | | 0.17 | | | | 0.60 | | | | 0.61 | | | | 1.00 | |
| Class R6 net assets at the end of the year (in thousands) | | $ | 720,273 | | | $ | 654,441 | | | $ | 1,178,853 | | | $ | 831,587 | | | $ | 739,253 | | | $ | 806,708 | |
| Portfolio turnover rate (%)* | | | 39 | | | | 113 | | | | 91 | | | | 105 | | | | 121 | | | | 101 | |
| * | Rates are not annualized for periods less than a year. |
| ** | Rates are annualized for periods less than a year. |
Note: Net investment income (loss) per share is based on the average shares outstanding during the year.
Performance cited represents past performance. Past performance does not guarantee future results and current performance may be lower or higher than the data quoted. Results shown are annual returns, which assume reinvestment of dividends and capital gains. Investment returns and principal will fluctuate and you may have a gain or loss when you sell shares. For the most current month-end performance information, please call 1-800-742-7272 or visit our Web site atwww.williamblairfunds.com.
| June 30, 2019 | William Blair Funds | 177 |
Financial Highlights— For a share outstanding throughout each period
Emerging Markets Small Cap Growth Fund
| | Class N | |
| | (unaudited)
Period Ended
June 30, | | | Years Ended December 31, | |
| | | 2019 | | | 2018 | | | 2017 | | | 2016 | | | 2015 | | | 2014 | |
| Net asset value, beginning of year | | $ | 13.96 | | | $ | 18.66 | | | $ | 13.73 | | | $ | 14.84 | | | $ | 16.52 | | | $ | 15.12 | |
| Income (loss) from investment operations: | | | | | | | | | | | | | | | | | | | | | | | | |
| Net investment income (loss) | | | (0.01 | ) | | | (0.02 | ) | | | 0.01 | | | | 0.09 | | | | (0.01 | ) | | | 0.04 | |
| Net realized and unrealized gain (loss) on investments | | | 1.25 | | | | (4.38 | ) | | | 5.46 | | | | (0.88 | ) | | | (1.05 | ) | | | 2.13 | |
| Total from investment operations | | | 1.24 | | | | (4.40 | ) | | | 5.47 | | | | (0.79 | ) | | | (1.06 | ) | | | 2.17 | |
| Less distributions from: | | | | | | | | | | | | | | | | | | | | | | | | |
| Net investment income | | | — | | | | — | | | | 0.50 | | | | 0.32 | | | | — | | | | 0.03 | |
| Net realized gain | | | — | | | | 0.30 | | | | 0.04 | | | | — | | | | 0.62 | | | | 0.74 | |
| Total distributions | | | — | | | | 0.30 | | | | 0.54 | | | | 0.32 | | | | 0.62 | | | | 0.77 | |
| Net asset value, end of year | | $ | 15.20 | | | $ | 13.96 | | | $ | 18.66 | | | $ | 13.73 | | | $ | 14.84 | | | $ | 16.52 | |
| Total return (%)* | | | 8.88 | | | | (23.57 | ) | | | 40.09 | | | | (5.33 | ) | | | (6.40 | ) | | | 14.41 | |
| Ratios to average daily net assets (%)**: | | | | | | | | | | | | | | | | | | | | | | | | |
| Expenses, before waivers and reimbursements | | | 1.78 | | | | 1.70 | | | | 1.83 | | | | 1.82 | | | | 1.94 | | | | 1.74 | |
| Expenses, net of waivers and reimbursements | | | 1.55 | | | | 1.58 | | | | 1.64 | | | | 1.61 | | | | 1.65 | | | | 1.65 | |
| Net investment income (loss), before waivers and reimbursements | | | (0.42 | ) | | | (0.22 | ) | | | (0.11 | ) | | | 0.41 | | | | (0.35 | ) | | | 0.12 | |
| Net investment income (loss), net of waivers and reimbursements | | | (0.19 | ) | | | (0.10 | ) | | | 0.08 | | | | 0.62 | | | | (0.06 | ) | | | 0.21 | |
| Class N net assets at the end of the year (in thousands) | | $ | 5,816 | | | $ | 8,977 | | | $ | 15,082 | | | $ | 9,263 | | | $ | 11,306 | | | $ | 10,745 | |
| Portfolio turnover rate (%)* | | | 86 | | | | 187 | | | | 183 | | | | 157 | | | | 167 | | | | 124 | |
| | | | | | | | | | | | | | | | | | | | | | | | | |
| | Class I | |
| | (unaudited)
Period Ended
June 30, | | | Years Ended December 31, | |
| | | 2019 | | | 2018 | | | 2017 | | | 2016 | | | 2015 | | | 2014 | |
| Net asset value, beginning of year | | $ | 14.03 | | | $ | 18.73 | | | $ | 13.77 | | | $ | 14.90 | | | $ | 16.52 | | | $ | 15.13 | |
| Income (loss) from investment operations: | | | | | | | | | | | | | | | | | | | | | | | | |
| Net investment income (loss) | | | 0.01 | | | | 0.03 | | | | 0.08 | | | | 0.13 | | | | 0.05 | | | | 0.02 | |
| Net realized and unrealized gain (loss) on investments | | | 1.26 | | | | (4.41 | ) | | | 5.47 | | | | (0.89 | ) | | | (1.05 | ) | | | 2.20 | |
| Total from investment operations | | | 1.27 | | | | (4.38 | ) | | | 5.55 | | | | (0.76 | ) | | | (1.00 | ) | | | 2.22 | |
| Less distributions from: | | | | | | | | | | | | | | | | | | | | | | | | |
| Net investment income | | | — | | | | 0.02 | | | | 0.55 | | | | 0.37 | | | | — | | | | 0.09 | |
| Net realized gain | | | — | | | | 0.30 | | | | 0.04 | | | | — | | | | 0.62 | | | | 0.74 | |
| Total distributions | | | — | | | | 0.32 | | | | 0.59 | | | | 0.37 | | | | 0.62 | | | | 0.83 | |
| Net asset value, end of year | | $ | 15.30 | | | $ | 14.03 | | | $ | 18.73 | | | $ | 13.77 | | | $ | 14.90 | | | $ | 16.52 | |
| Total return (%)* | | | 8.97 | | | | (23.31 | ) | | | 40.53 | | | | (5.11 | ) | | | (6.03 | ) | | | 14.73 | |
| Ratios to average daily net assets (%)**: | | | | | | | | | | | | | | | | | | | | | | | | |
| Expenses, before waivers and reimbursements | | | 1.46 | | | | 1.38 | | | | 1.50 | | | | 1.51 | | | | 1.52 | | | | 1.49 | |
| Expenses, net of waivers and reimbursements | | | 1.30 | | | | 1.33 | | | | 1.31 | | | | 1.30 | | | | 1.31 | | | | 1.40 | |
| Net investment income (loss), before waivers and reimbursements | | | (0.05 | ) | | | 0.13 | | | | 0.30 | | | | 0.66 | | | | 0.09 | | | | 0.06 | |
| Net investment income (loss), net of waivers and reimbursements | | | 0.11 | | | | 0.18 | | | | 0.49 | | | | 0.87 | | | | 0.30 | | | | 0.15 | |
| Class I net assets at the end of the year (in thousands) | | $ | 155,857 | | | $ | 169,770 | | | $ | 282,620 | | | $ | 147,949 | | | $ | 162,375 | | | $ | 119,662 | |
| Portfolio turnover rate (%)* | | | 86 | | | | 187 | | | | 183 | | | | 157 | | | | 167 | | | | 124 | |
| * | Rates are not annualized for periods less than a year. |
| ** | Rates are annualized for periods less than a year. |
Note: Net investment income (loss) per share is based on the average shares outstanding during the year.
Performance cited represents past performance. Past performance does not guarantee future results and current performance may be lower or higher than the data quoted. Results shown are annual returns, which assume reinvestment of dividends and capital gains. Investment returns and principal will fluctuate and you may have a gain or loss when you sell shares. For the most current month-end performance information, please call 1-800-742-7272 or visit our Web site atwww.williamblairfunds.com.
| 178 | Semiannual Report | June 30, 2019 |
Financial Highlights— For a share outstanding throughout each period
Emerging Markets Small Cap Growth Fund
| | Class R6 | |
| | (unaudited)
Period Ended
June 30, | | | Years Ended December 31, | |
| | | 2019 | | | 2018 | | | 2017 | | | 2016 | | | 2015 | | | 2014 | |
| Net asset value, beginning of year | | $ | 14.06 | | | $ | 18.76 | | | $ | 13.79 | | | $ | 14.92 | | | $ | 16.53 | | | $ | 15.14 | |
| Income (loss) from investment operations: | | | | | | | | | | | | | | | | | | | | | | | | |
| Net investment income (loss) | | | 0.02 | | | | 0.05 | | | | 0.10 | | | | 0.14 | | | | 0.06 | | | | 0.06 | |
| Net realized and unrealized gain (loss) on investments | | | 1.25 | | | | (4.41 | ) | | | 5.47 | | | | (0.89 | ) | | | (1.05 | ) | | | 2.18 | |
| Total from investment operations | | | 1.27 | | | | (4.36 | ) | | | 5.57 | | | | (0.75 | ) | | | (0.99 | ) | | | 2.24 | |
| Less distributions from: | | | | | | | | | | | | | | | | | | | | | | | | |
| Net investment income | | | — | | | | 0.04 | | | | 0.56 | | | | 0.38 | | | | 0.00 | ^ | | | 0.11 | |
| Net realized gain | | | — | | | | 0.30 | | | | 0.04 | | | | — | | | | 0.62 | | | | 0.74 | |
| Total distributions | | | — | | | | 0.34 | | | | 0.60 | | | | 0.38 | | | | 0.62 | | | | 0.85 | |
| Net asset value, end of year | | $ | 15.33 | | | $ | 14.06 | | | $ | 18.76 | | | $ | 13.79 | | | $ | 14.92 | | | $ | 16.53 | |
| Total return (%)* | | | 9.03 | | | | (23.24 | ) | | | 40.62 | | | | (5.05 | ) | | | (5.97 | ) | | | 14.85 | |
| Ratios to average daily net assets (%)**: | | | | | | | | | | | | | | | | | | | | | | | | |
| Expenses, before waivers and reimbursements | | | 1.37 | | | | 1.30 | | | | 1.29 | | | | 1.31 | | | | 1.31 | | | | 1.34 | |
| Expenses, net of waivers and reimbursements | | | 1.25 | | | | 1.25 | | | | 1.25 | | | | 1.25 | | | | 1.25 | | | | 1.25 | |
| Net investment income (loss), before waivers and reimbursements | | | 0.10 | | | | 0.22 | | | | 0.53 | | | | 0.88 | | | | 0.28 | | | | 0.28 | |
| Net investment income (loss), net of waivers and reimbursements | | | 0.22 | | | | 0.27 | | | | 0.57 | | | | 0.94 | | | | 0.34 | | | | 0.37 | |
| Class R6 net assets at the end of the year (in thousands) | | $ | 120,319 | | | $ | 98,188 | | | $ | 166,927 | | | $ | 125,650 | | | $ | 123,160 | | | $ | 123,496 | |
| Portfolio turnover rate (%)* | | | 86 | | | | 187 | | | | 183 | | | | 157 | | | | 167 | | | | 124 | |
| * | Rates are not annualized for periods less than a year. |
| ** | Rates are annualized for periods less than a year. |
| ^ | Amount is less than $0.005 per share. |
Note: Net investment income (loss) per share is based on the average shares outstanding during the year.
Performance cited represents past performance. Past performance does not guarantee future results and current performance may be lower or higher than the data quoted. Results shown are annual returns, which assume reinvestment of dividends and capital gains. Investment returns and principal will fluctuate and you may have a gain or loss when you sell shares. For the most current month-end performance information, please call 1-800-742-7272 or visit our Web site atwww.williamblairfunds.com.
| June 30, 2019 | William Blair Funds | 179 |
Financial Highlights— For a share outstanding throughout each period
Bond Fund
| | Class N | |
| | (unaudited)
Period Ended
June 30, | | | Years Ended December 31, | |
| | | 2019 | | | 2018 | | | 2017 | | | 2016 | | | 2015 | | | 2014 | |
| Net asset value, beginning of year | | $ | 9.75 | | | $ | 10.41 | | | $ | 10.41 | | | $ | 10.34 | | | $ | 10.74 | | | $ | 10.60 | |
| Income (loss) from investment operations: | | | | | | | | | | | | | | | | | | | | | | | | |
| Net investment income (loss) | | | 0.15 | | | | 0.31 | | | | 0.27 | | | | 0.27 | | | | 0.27 | | | | 0.31 | |
| Net realized and unrealized gain (loss) on investments | | | 0.63 | | | | (0.56 | ) | | | 0.12 | | | | 0.18 | | | | (0.29 | ) | | | 0.23 | |
| Total from investment operations | | | 0.78 | | | | (0.25 | ) | | | 0.39 | | | | 0.45 | | | | (0.02 | ) | | | 0.54 | |
| Less distributions from: | | | | | | | | | | | | | | | | | | | | | | | | |
| Net investment income | | | 0.21 | | | | 0.41 | | | | 0.39 | | | | 0.38 | | | | 0.38 | | | | 0.40 | |
| Net realized gain | | | — | | | | — | | | | — | | | | — | | | | — | | | | 0.00 | ^ |
| Total distributions | | | 0.21 | | | | 0.41 | | | | 0.39 | | | | 0.38 | | | | 0.38 | | | | 0.40 | |
| Net asset value, end of year | | $ | 10.32 | | | $ | 9.75 | | | $ | 10.41 | | | $ | 10.41 | | | $ | 10.34 | | | $ | 10.74 | |
| Total return (%)* | | | 8.05 | | | | (2.42 | ) | | | 3.83 | | | | 4.40 | | | | (0.23 | ) | | | 5.10 | |
| Ratios to average daily net assets (%)**: | | | | | | | | | | | | | | | | | | | | | | | | |
| Expenses, before waivers and reimbursements | | | 0.69 | | | | 0.69 | | | | 0.82 | | | | 0.82 | | | | 0.79 | | | | 0.85 | |
| Expenses, net of waivers and reimbursements | | | 0.60 | | | | 0.62 | | | | 0.65 | | | | 0.65 | | | | 0.61 | | | | 0.65 | |
| Net investment income (loss), before waivers and reimbursements | | | 3.03 | | | | 3.01 | | | | 2.40 | | | | 2.43 | | | | 2.42 | | | | 2.70 | |
| Net investment income (loss), net of waivers and reimbursements | | | 3.12 | | | | 3.08 | | | | 2.57 | | | | 2.60 | | | | 2.60 | | | | 2.90 | |
| Class N net assets at the end of the year (in thousands) | | $ | 67,493 | | | $ | 70,253 | | | $ | 83,662 | | | $ | 125,866 | | | $ | 139,303 | | | $ | 16,720 | |
| Portfolio turnover rate (%)* | | | 27 | | | | 40 | | | | 17 | | | | 17 | | | | 32 | | | | 35 | |
| | | | | | | | | | | | | | | | | | | | | | | | | |
| | Class I | |
| | (unaudited)
Period Ended
June 30, | | | Years Ended December 31, | |
| | | 2019 | | | 2018 | | | 2017 | | | 2016 | | | 2015 | | | 2014 | |
| Net asset value, beginning of year | | $ | 9.65 | | | $ | 10.31 | | | $ | 10.30 | | | $ | 10.24 | | | $ | 10.64 | | | $ | 10.49 | |
| Income (loss) from investment operations: | | | | | | | | | | | | | | | | | | | | | | | | |
| Net investment income (loss) | | | 0.16 | | | | 0.32 | | | | 0.29 | | | | 0.30 | | | | 0.31 | | | | 0.33 | |
| Net realized and unrealized gain (loss) on investments | | | 0.61 | | | | (0.56 | ) | | | 0.13 | | | | 0.16 | | | | (0.31 | ) | | | 0.23 | |
| Total from investment operations | | | 0.77 | | | | (0.24 | ) | | | 0.42 | | | | 0.46 | | | | — | | | | 0.56 | |
| Less distributions from: | | | | | | | | | | | | | | | | | | | | | | | | |
| Net investment income | | | 0.21 | | | | 0.42 | | | | 0.41 | | | | 0.40 | | | | 0.40 | | | | 0.41 | |
| Net realized gain | | | — | | | | — | | | | — | | | | — | | | | — | | | | 0.00 | ^ |
| Total distributions | | | 0.21 | | | | 0.42 | | | | 0.41 | | | | 0.40 | | | | 0.40 | | | | 0.41 | |
| Net asset value, end of year | | $ | 10.21 | | | $ | 9.65 | | | $ | 10.31 | | | $ | 10.30 | | | $ | 10.24 | | | $ | 10.64 | |
| Total return (%)* | | | 8.09 | | | | (2.31 | ) | | | 4.16 | | | | 4.55 | | | | (0.05 | ) | | | 5.37 | |
| Ratios to average daily net assets (%)**: | | | | | | | | | | | | | | | | | | | | | | | | |
| Expenses, before waivers and reimbursements | | | 0.47 | | | | 0.46 | | | | 0.60 | | | | 0.58 | | | | 0.59 | | | | 0.60 | |
| Expenses, net of waivers and reimbursements | | | 0.45 | | | | 0.46 | | | | 0.43 | | | | 0.41 | | | | 0.41 | | | | 0.50 | |
| Net investment income (loss), before waivers and reimbursements | | | 3.25 | | | | 3.24 | | | | 2.62 | | | | 2.66 | | | | 2.75 | | | | 2.97 | |
| Net investment income (loss), net of waivers and reimbursements | | | 3.27 | | | | 3.24 | | | | 2.79 | | | | 2.83 | | | | 2.93 | | | | 3.07 | |
| Class I net assets at the end of the year (in thousands) | | $ | 281,303 | | | $ | 281,442 | | | $ | 384,464 | | | $ | 322,174 | | | $ | 237,587 | | | $ | 149,466 | |
| Portfolio turnover rate (%)* | | | 27 | | | | 40 | | | | 17 | | | | 17 | | | | 32 | | | | 35 | |
| * | Rates are not annualized for periods less than a year. |
| ** | Rates are annualized for periods less than a year. |
| ^ | Amount is less than $0.005 per share. |
Note: Net investment income (loss) per share is based on the average shares outstanding during the year.
Performance cited represents past performance. Past performance does not guarantee future results and current performance may be lower or higher than the data quoted. Results shown are annual returns, which assume reinvestment of dividends and capital gains. Investment returns and principal will fluctuate and you may have a gain or loss when you sell shares. For the most current month-end performance information, please call 1-800-742-7272 or visit our Web site atwww.williamblairfunds.com.
| 180 | Semiannual Report | June 30, 2019 |
Financial Highlights— For a share outstanding throughout each period
Bond Fund
| | Class R6 | |
| | (unaudited) Period Ended June 30, | | | Years Ended December 31, | |
| | | 2019 | | | 2018 | | | 2017 | | | 2016 | | | 2015 | | | 2014 | |
| Net asset value, beginning of year | | $ | 9.64 | | | $ | 10.30 | | | $ | 10.29 | | | $ | 10.23 | | | $ | 10.63 | | | $ | 10.48 | |
| Income (loss) from investment operations: | | | | | | | | | | | | | | | | | | | | | | | | |
| Net investment income (loss) | | | 0.16 | | | | 0.33 | | | | 0.30 | | | | 0.30 | | | | 0.32 | | | | 0.34 | |
| Net realized and unrealized gain (loss) on investments | | | 0.61 | | | | (0.56 | ) | | | 0.13 | | | | 0.17 | | | | (0.31 | ) | | | 0.23 | |
| Total from investment operations | | | 0.77 | | | | (0.23 | ) | | | 0.43 | | | | 0.47 | | | | 0.01 | | | | 0.57 | |
| Less distributions from: | | | | | | | | | | | | | | | | | | | | | | | | |
| Net investment income | | | 0.21 | | | | 0.43 | | | | 0.42 | | | | 0.41 | | | | 0.41 | | | | 0.42 | |
| Net realized gain | | | — | | | | — | | | | — | | | | — | | | | — | | | | 0.00 | ^ |
| Total distributions | | | 0.21 | | | | 0.43 | | | | 0.42 | | | | 0.41 | | | | 0.41 | | | | 0.42 | |
| Net asset value, end of year | | $ | 10.20 | | | $ | 9.64 | | | $ | 10.30 | | | $ | 10.29 | | | $ | 10.23 | | | $ | 10.63 | |
| Total return (%)* | | | 8.12 | | | | (2.26 | ) | | | 4.24 | | | | 4.61 | | | | 0.01 | | | | 5.53 | |
| Ratios to average daily net assets (%)**: | | | | | | | | | | | | | | | | | | | | | | | | |
| Expenses, before waivers and reimbursements | | | 0.40 | | | | 0.38 | | | | 0.37 | | | | 0.37 | | | | 0.38 | | | | 0.41 | |
| Expenses, net of waivers and reimbursements | | | 0.40 | | | | 0.38 | | | | 0.35 | | | | 0.35 | | | | 0.35 | | | | 0.35 | |
| Net investment income (loss), before waivers and reimbursements | | | 3.32 | | | | 3.32 | | | | 2.85 | | | | 2.88 | | | | 2.98 | | | | 3.17 | |
| Net investment income (loss), net of waivers and reimbursements | | | 3.32 | | | | 3.32 | | | | 2.87 | | | | 2.90 | | | | 3.01 | | | | 3.23 | |
| Class R6 net assets at the end of the year (in thousands) | | $ | 66,976 | | | $ | 70,851 | | | $ | 91,629 | | | $ | 95,216 | | | $ | 103,904 | | | $ | 97,341 | |
| Portfolio turnover rate (%)* | | | 27 | | | | 40 | | | | 17 | | | | 17 | | | | 32 | | | | 35 | |
| * | Rates are not annualized for periods less than a year. |
| ** | Rates are annualized for periods less than a year. |
| ^ | Amount is less than $0.005 per share. |
Note: Net investment income (loss) per share is based on the average shares outstanding during the year.
Performance cited represents past performance. Past performance does not guarantee future results and current performance may be lower or higher than the data quoted. Results shown are annual returns, which assume reinvestment of dividends and capital gains. Investment returns and principal will fluctuate and you may have a gain or loss when you sell shares. For the most current month-end performance information, please call 1-800-742-7272 or visit our Web site atwww.williamblairfunds.com.
| June 30, 2019 | William Blair Funds | 181 |
Financial Highlights— For a share outstanding throughout each period
Income Fund
| | Class N | |
| | (unaudited)
Period Ended
June 30, | | | Years Ended December 31, | |
| | | 2019 | | | 2018 | | | 2017 | | | 2016 | | | 2015 | | | 2014 | |
| Net asset value, beginning of year | | $ | 8.36 | | | $ | 8.72 | | | $ | 8.86 | | | $ | 8.90 | | | $ | 9.12 | | | $ | 9.11 | |
| Income (loss) from investment operations: | | | | | | | | | | | | | | | | | | | | | | | | |
| Net investment income (loss) | | | 0.09 | | | | 0.17 | | | | 0.16 | | | | 0.16 | | | | 0.15 | | | | 0.18 | |
| Net realized and unrealized gain (loss) on investments | | | 0.27 | | | | (0.25 | ) | | | (0.03 | ) | | | 0.06 | | | | (0.11 | ) | | | 0.10 | |
| Total from investment operations | | | 0.36 | | | | (0.08 | ) | | | 0.13 | | | | 0.22 | | | | 0.04 | | | | 0.28 | |
| Less distributions from: | | | | | | | | | | | | | | | | | | | | | | | | |
| Net investment income | | | 0.14 | | | | 0.28 | | | | 0.27 | | | | 0.26 | | | | 0.26 | | | | 0.27 | |
| Net realized gain | | | — | | | | — | | | | — | | | | — | | | | — | | | | — | |
| Total distributions | | | 0.14 | | | | 0.28 | | | | 0.27 | | | | 0.26 | | | | 0.26 | | | | 0.27 | |
| Net asset value, end of year | | $ | 8.58 | | | $ | 8.36 | | | $ | 8.72 | | | $ | 8.86 | | | $ | 8.90 | | | $ | 9.12 | |
| Total return (%)* | | | 4.33 | | | | (0.86 | ) | | | 1.46 | | | | 2.44 | | | | 0.39 | | | | 3.06 | |
| Ratios to average daily net assets (%)**: | | | | | | | | | | | | | | | | | | | | | | | | |
| Expenses, before waivers and reimbursements | | | 0.95 | | | | 0.91 | | | | 0.88 | | | | 0.79 | | | | 0.81 | | | | 0.84 | |
| Expenses, net of waivers and reimbursements | | | 0.85 | | | | 0.85 | | | | 0.85 | | | | 0.79 | | | | 0.81 | | | | 0.84 | |
| Net investment income (loss), before waivers and reimbursements | | | 1.97 | | | | 1.96 | | | | 1.77 | | | | 1.80 | | | | 1.71 | | | | 1.99 | |
| Net investment income (loss), net of waivers and reimbursements | | | 2.07 | | | | 2.02 | | | | 1.80 | | | | 1.80 | | | | 1.71 | | | | 1.99 | |
| Class N net assets at the end of the year (in thousands) | | $ | 21,319 | | | $ | 22,422 | | | $ | 39,625 | | | $ | 52,710 | | | $ | 32,942 | | | $ | 34,020 | |
| Portfolio turnover rate (%)* | | | 51 | | | | 97 | | | | 37 | | | | 22 | | | | 21 | | | | 30 | |
| | | | | | | | | | | | | | | | | | | | | | | | | |
| | Class I | |
| | (unaudited)
Period Ended
June 30, | | | Years Ended December 31, | |
| | | 2019 | | | 2018 | | | 2017 | | | 2016 | | | 2015 | | | 2014 | |
| Net asset value, beginning of year | | $ | 8.30 | | | $ | 8.66 | | | $ | 8.80 | | | $ | 8.83 | | | $ | 9.05 | | | $ | 9.05 | |
| Income (loss) from investment operations: | | | | | | | | | | | | | | | | | | | | | | | | |
| Net investment income (loss) | | | 0.09 | | | | 0.19 | | | | 0.18 | | | | 0.18 | | | | 0.18 | | | | 0.20 | |
| Net realized and unrealized gain (loss) on investments | | | 0.29 | | | | (0.25 | ) | | | (0.03 | ) | | | 0.06 | | | | (0.12 | ) | | | 0.09 | |
| Total from investment operations | | | 0.38 | | | | (0.06 | ) | | | 0.15 | | | | 0.24 | | | | 0.06 | | | | 0.29 | |
| Less distributions from: | | | | | | | | | | | | | | | | | | | | | | | | |
| Net investment income | | | 0.15 | | | | 0.30 | | | | 0.29 | | | | 0.27 | | | | 0.28 | | | | 0.29 | |
| Net realized gain | | | — | | | | — | | | | — | | | | — | | | | — | | | | — | |
| Total distributions | | | 0.15 | | | | 0.30 | | | | 0.29 | | | | 0.27 | | | | 0.28 | | | | 0.29 | |
| Net asset value, end of year | | $ | 8.53 | | | $ | 8.30 | | | $ | 8.66 | | | $ | 8.80 | | | $ | 8.83 | | | $ | 9.05 | |
| Total return (%)* | | | 4.57 | | | | (0.69 | ) | | | 1.68 | | | | 2.78 | | | | 0.63 | | | | 3.20 | |
| Ratios to average daily net assets (%)**: | | | | | | | | | | | | | | | | | | | | | | | | |
| Expenses | | | 0.70 | | | | 0.65 | | | | 0.62 | | | | 0.57 | | | | 0.55 | | | | 0.59 | |
| Net investment income (loss) | | | 2.24 | | | | 2.22 | | | | 2.03 | | | | 2.05 | | | | 1.97 | | | | 2.24 | |
| Class I net assets at the end of the year (in thousands) | | $ | 42,701 | | | $ | 34,793 | | | $ | 51,153 | | | $ | 58,160 | | | $ | 62,722 | | | $ | 64,834 | |
| Portfolio turnover rate (%)* | | | 51 | | | | 97 | | | | 37 | | | | 22 | | | | 21 | | | | 30 | |
| * | Rates are not annualized for periods less than a year. |
| ** | Rates are annualized for periods less than a year. |
Note: Net investment income (loss) per share is based on the average shares outstanding during the year.
Performance cited represents past performance. Past performance does not guarantee future results and current performance may be lower or higher than the data quoted. Results shown are annual returns, which assume reinvestment of dividends and capital gains. Investment returns and principal will fluctuate and you may have a gain or loss when you sell shares. For the most current month-end performance information, please call 1-800-742-7272 or visit our Web site atwww.williamblairfunds.com.
| 182 | Semiannual Report | June 30, 2019 |
Financial Highlights— For a share outstanding throughout each period
Income Fund
| | Class R6 | |
| | (unaudited)
Period Ended
June 30, | |
| | 2019(a) | |
| Net asset value, beginning of year | | $ | 8.45 | |
| Income (loss) from investment operations: | | | | |
| Net investment income (loss) | | | (0.00 | )^ |
| Net realized and unrealized gain (loss) on investments | | | 0.13 | |
| Total from investment operations | | | 0.13 | |
| Less distributions from: | | | | |
| Net investment income | | | 0.05 | |
| Net realized gain | | | — | |
| Total distributions | | | 0.05 | |
| Net asset value, end of year | | $ | 8.53 | |
| Total Return (%)* | | | 1.47 | |
| Ratios to average daily net assets (%)**: | | | | |
| Expenses, before of waivers and reimbursements | | | 0.68 | |
| Expenses, net waivers and reimbursements | | | 0.65 | |
| Net investment income (loss), before of waivers and reimbursements | | | (0.31 | ) |
| Net investment income (loss), net waivers and reimbursements | | | (0.28 | ) |
| Class R6 net assets at end of year (in thousands) | | $ | 51 | |
| Portfolio turnover rate (%)* | | | 51 | |
| * | Rates are not annualized for periods less than a year. |
| ** | Rates are annualized for periods less than a year. |
| (a) | For the period from May 2, 2019 (Commencement of Operations) to June 30, 2019. |
| ^ | Amount is less than $0.05 per share. |
Note: Net investment income (loss) per share is based on the average shares outstanding during the year.
Performance cited represents past performance. Past performance does not guarantee future results and current performance may be lower or higher than the data quoted. Results shown are annual returns, which assume reinvestment of dividends and capital gains. Investment returns and principal will fluctuate and you may have a gain or loss when you sell shares. For the most current month-end performance information, please call 1-800-742-7272 or visit our Web site atwww.williamblairfunds.com.
| June 30, 2019 | William Blair Funds | 183 |
Financial Highlights— For a share outstanding throughout each period
Low Duration Fund
| | Class N | |
| | (unaudited)
Period Ended
June 30, | | | Years Ended December 31, | |
| | | 2019 | | | 2018 | | | 2017 | | | 2016 | | | 2015 | | | 2014 | |
| Net asset value, beginning of year | | $ | 8.70 | | | $ | 8.92 | | | $ | 9.07 | | | $ | 9.16 | | | $ | 9.38 | | | $ | 9.52 | |
| Income (loss) from investment operations: | | | | | | | | | | | | | | | | | | | | | | | | |
| Net investment income (loss) | | | 0.10 | | | | 0.17 | | | | 0.11 | | | | 0.09 | | | | 0.07 | | | | 0.11 | |
| Net realized and unrealized gain (loss) on investments | | | 0.11 | | | | (0.10 | ) | | | (0.04 | ) | | | 0.02 | | | | (0.07 | ) | | | (0.00 | )^ |
| Total from investment operations | | | 0.21 | | | | 0.07 | | | | 0.07 | | | | 0.11 | | | | — | | | | 0.11 | |
| Less distributions from: | | | | | | | | | | | | | | | | | | | | | | | | |
| Net investment income | | | 0.16 | | | | 0.29 | | | | 0.22 | | | | 0.20 | | | | 0.22 | | | | 0.25 | |
| Net realized gain | | | — | | | | — | | | | — | | | | — | | | | — | | | | — | |
| Total distributions | | | 0.16 | | | | 0.29 | | | | 0.22 | | | | 0.20 | | | | 0.22 | | | | 0.25 | |
| Net asset value, end of year | | $ | 8.75 | | | $ | 8.70 | | | $ | 8.92 | | | $ | 9.07 | | | $ | 9.16 | | | $ | 9.38 | |
| Total return (%)* | | | 2.46 | | | | 0.80 | | | | 0.84 | | | | 1.16 | | | | 0.01 | | | | 1.20 | |
| Ratios to average daily net assets (%)**: | | | | | | | | | | | | | | | | | | | | | | | | |
| Expenses, before waivers and reimbursements | | | 0.75 | | | | 0.72 | | | | 0.79 | | | | 0.83 | | | | 0.77 | | | | 0.75 | |
| Expenses, net of waivers and reimbursements | | | 0.55 | | | | 0.58 | | | | 0.61 | | | | 0.68 | | | | 0.60 | | | | 0.70 | |
| Net investment income (loss), before waivers and reimbursements | | | 2.14 | | | | 1.83 | | | | 1.04 | | | | 0.83 | | | | 0.54 | | | | 1.14 | |
| Net investment income (loss), net of waivers and reimbursements | | | 2.34 | | | | 1.97 | | | | 1.22 | | | | 0.98 | | | | 0.71 | | | | 1.19 | |
| Class N net assets at the end of the year (in thousands) | | $ | 1,632 | | | $ | 1,661 | | | $ | 1,979 | | | $ | 7,237 | | | $ | 2,712 | | | $ | 4,969 | |
| Portfolio turnover rate (%)* | | | 82 | | | | 122 | | | | 109 | | | | 81 | | | | 106 | | | | 83 | |
| | | | | | | | | | | | | | | | | | | | | | | | | |
| | Class I | |
| | (unaudited)
Period Ended
June 30, | | | Years Ended December 31, | |
| | | 2019 | | | 2018 | | | | 2017 | | | | 2016 | | | | 2015 | | | | 2014 | |
| Net asset value, beginning of year | | $ | 8.70 | | | $ | 8.91 | | | $ | 9.07 | | | $ | 9.16 | | | $ | 9.37 | | | $ | 9.52 | |
| Income (loss) from investment operations: | | | | | | | | | | | | | | | | | | | | | | | | |
| Net investment income (loss) | | | 0.11 | | | | 0.19 | | | | 0.13 | | | | 0.11 | | | | 0.08 | | | | 0.13 | |
| Net realized and unrealized gain (loss) on investments | | | 0.11 | | | | (0.09 | ) | | | (0.05 | ) | | | 0.02 | | | | (0.05 | ) | | | (0.01 | ) |
| Total from investment operations | | | 0.22 | | | | 0.10 | | | | 0.08 | | | | 0.13 | | | | 0.03 | | | | 0.12 | |
| Less distributions from: | | | | | | | | | | | | | | | | | | | | | | | | |
| Net investment income | | | 0.17 | | | | 0.31 | | | | 0.24 | | | | 0.22 | | | | 0.24 | | | | 0.27 | |
| Net realized gain | | | — | | | | — | | | | — | | | | — | | | | — | | | | — | |
| Total distributions | | | 0.17 | | | | 0.31 | | | | 0.24 | | | | 0.22 | | | | 0.24 | | | | 0.27 | |
| Net asset value, end of year | | $ | 8.75 | | | $ | 8.70 | | | $ | 8.91 | | | $ | 9.07 | | | $ | 9.16 | | | $ | 9.37 | |
| Total return (%)* | | | 2.54 | | | | 1.12 | | | | 0.91 | | | | 1.40 | | | | 0.30 | | | | 1.24 | |
| Ratios to average daily net assets (%)**: | | | | | | | | | | | | | | | | | | | | | | | | |
| Expenses, before waivers and reimbursements | | | 0.52 | | | | 0.46 | | | | 0.59 | | | | 0.59 | | | | 0.59 | | | | 0.60 | |
| Expenses, net of waivers and reimbursements | | | 0.39 | | | | 0.39 | | | | 0.41 | | | | 0.44 | | | | 0.42 | | | | 0.55 | |
| Net investment income (loss), before waivers and reimbursements | | | 2.37 | | | | 2.05 | | | | 1.27 | | | | 1.05 | | | | 0.70 | | | | 1.30 | |
| Net investment income (loss), net of waivers and reimbursements | | | 2.50 | | | | 2.12 | | | | 1.45 | | | | 1.20 | | | | 0.87 | | | | 1.35 | |
| Class I net assets at the end of the year (in thousands) | | $ | 54,744 | | | $ | 56,120 | | | $ | 131,186 | | | $ | 219,714 | | | $ | 107,137 | | | $ | 104,433 | |
| Portfolio turnover rate (%)* | | | 82 | | | | 122 | | | | 109 | | | | 81 | | | | 106 | | | | 83 | |
| * | Rates are not annualized for periods less than a year. |
| ** | Rates are annualized for periods less than a year. |
| ^ | Amount is less than $0.005 per share. |
Note: Net investment income (loss) per share is based on the average shares outstanding during the year.
Performance cited represents past performance. Past performance does not guarantee future results and current performance may be lower or higher than the data quoted. Results shown are annual returns, which assume reinvestment of dividends and capital gains. Investment returns and principal will fluctuate and you may have a gain or loss when you sell shares. For the most current month-end performance information, please call 1-800-742-7272 or visit our Web site atwww.williamblairfunds.com.
| 184 | Semiannual Report | June 30, 2019 |
Financial Highlights— For a share outstanding throughout each period
Low Duration Fund
| | Class R6 | |
| | (unaudited)
Period Ended
June 30, | | | Years Ended December 31, | |
| | | 2019 | | | 2018 | | | 2017 | | | 2016 | | | 2015 | | | 2014 | |
| Net asset value, beginning of year | | $ | 8.70 | | | $ | 8.91 | | | $ | 9.07 | | | $ | 9.16 | | | $ | 9.38 | | | $ | 9.53 | |
| Income (loss) from investment operations: | | | | | | | | | | | | | | | | | | | | | | | | |
| Net investment income (loss) | | | 0.11 | | | | 0.19 | | | | 0.14 | | | | 0.11 | | | | 0.09 | | | | 0.14 | |
| Net realized and unrealized gain (loss) on investments | | | 0.11 | | | | (0.09 | ) | | | (0.05 | ) | | | 0.02 | | | | (0.07 | ) | | | (0.01 | ) |
| Total from investment operations | | | 0.22 | | | | 0.10 | | | | 0.09 | | | | 0.13 | | | | 0.02 | | | | 0.13 | |
| Less distributions from: | | | | | | | | | | | | | | | | | | | | | | | | |
| Net investment income | | | 0.17 | | | | 0.31 | | | | 0.25 | | | | 0.22 | | | | 0.24 | | | | 0.28 | |
| Net realized gain | | | — | | | | — | | | | — | | | | — | | | | — | | | | — | |
| Total distributions | | | 0.17 | | | | 0.31 | | | | 0.25 | | | | 0.22 | | | | 0.24 | | | | 0.28 | |
| Net asset value, end of year | | $ | 8.75 | | | $ | 8.70 | | | $ | 8.91 | | | $ | 9.07 | | | $ | 9.16 | | | $ | 9.38 | |
| Total return (%)* | | | 2.56 | | | | 1.15 | | | | 0.96 | | | | 1.43 | | | | 0.22 | | | | 1.40 | |
| Ratios to average daily net assets (%)**: | | | | | | | | | | | | | | | | | | | | | | | | |
| Expenses, before waivers and reimbursements | | | 0.49 | | | | 0.42 | | | | 0.40 | | | | 0.40 | | | | 0.42 | | | | 0.43 | |
| Expenses, net of waivers and reimbursements | | | 0.35 | | | | 0.35 | | | | 0.37 | | | | 0.40 | | | | 0.40 | | | | 0.40 | |
| Net investment income (loss), before waivers and reimbursements | | | 2.41 | | | | 2.10 | | | | 1.48 | | | | 1.25 | | | | 0.92 | | | | 1.42 | |
| Net investment income (loss), net of waivers and reimbursements | | | 2.55 | | | | 2.17 | | | | 1.51 | | | | 1.25 | | | | 0.94 | | | | 1.45 | |
| Class R6 net assets at the end of the year (in thousands) | | $ | 43,817 | | | $ | 47,585 | | | $ | 99,912 | | | $ | 53,122 | | | $ | 21,863 | | | $ | 68,095 | |
| Portfolio turnover rate (%)* | | | 82 | | | | 122 | | | | 109 | | | | 81 | | | | 106 | | | | 83 | |
| * | Rates are not annualized for periods less than a year. |
| ** | Rates are annualized for periods less than a year. |
Note: Net investment income (loss) per share is based on the average shares outstanding during the year.
Performance cited represents past performance. Past performance does not guarantee future results and current performance may be lower or higher than the data quoted. Results shown are annual returns, which assume reinvestment of dividends and capital gains. Investment returns and principal will fluctuate and you may have a gain or loss when you sell shares. For the most current month-end performance information, please call 1-800-742-7272 or visit our Web site atwww.williamblairfunds.com.
| June 30, 2019 | William Blair Funds | 185 |
Financial Highlights— For a share outstanding throughout each period
Macro Allocation Fund
| | Class N | |
| | (unaudited)
Period Ended
June 30, | | | Periods Ended December 31, | | Year Ended
October 31, | |
| | | 2019 | | | | 2018 | | | | 2017 | | | | 2016 | | | | 2015 | | | | 2014(a) | | 2014 | |
| Net asset value, beginning of year | | $ | 11.41 | | | $ | 11.84 | | | $ | 11.34 | | | $ | 11.32 | | | $ | 12.14 | | | $ | 13.07 | | | $ | 12.61 | |
| Income (loss) from investment operations: | | | | | | | | | | | | | | | | | | | | | | | | | | | | |
| Net investment income (loss) | | | 0.04 | | | | 0.08 | | | | 0.06 | | | | 0.04 | | | | 0.04 | | | | 0.04 | | | | 0.02 | |
| Net realized and unrealized gain (loss) on investments | | | 0.24 | | | | (0.24 | ) | | | 0.51 | | | | 0.19 | | | | (0.80 | ) | | | (0.31 | ) | | | 0.76 | |
| Total from investment operations | | | 0.28 | | | | (0.16 | ) | | | 0.57 | | | | 0.23 | | | | (0.76 | ) | | | (0.27 | ) | | | 0.78 | |
| Less distributions from: | | | | | | | | | | | | | | | | | | | | | | | | | | | | |
| Net investment income | | | — | | | | 0.27 | | | | 0.07 | | | | 0.21 | | | | 0.06 | | | | 0.66 | | | | 0.09 | |
| Net realized gain | | | — | | | | — | | | | — | | | | — | | | | — | | | | — | | | | 0.23 | |
| Total distributions | | | — | | | | 0.27 | | | | 0.07 | | | | 0.21 | | | | 0.06 | | | | 0.66 | | | | 0.32 | |
| Net asset value, end of year | | $ | 11.69 | | | $ | 11.41 | | | $ | 11.84 | | | $ | 11.34 | | | $ | 11.32 | | | $ | 12.14 | | | $ | 13.07 | |
| Total return (%)* | | | 2.45 | | | | (1.30 | ) | | | 5.06 | | | | 2.01 | | | | (6.24 | ) | | | (2.00 | ) | | | 6.34 | |
| Ratios to average daily net assets (%)**: | | | | | | | | | | | | | | | | | | | | | | | | | | | | |
| Expenses, before waivers and reimbursements | | | 1.23 | | | | 1.30 | | | | 1.52 | | | | 1.38 | | | | 1.42 | | | | 1.46 | | | | 1.60 | |
| Expenses, net of waivers and reimbursements | | | 1.23 | | | | 1.30 | | | | 1.37 | | | | 1.23 | | | | 1.27 | | | | 1.38 | | | | 1.47 | |
| Expenses (excluding interest or short dividend expense), net of waivers and reimbursements | | | 1.21 | | | | 1.28 | | | | 1.31 | | | | 1.23 | | | | 1.27 | | | | 1.35 | | | | 1.35 | |
| Net investment income (loss), before waivers and reimbursements | | | 0.73 | | | | 0.66 | | | | 0.35 | | | | 0.17 | | | | 0.17 | | | | 1.98 | | | | 0.07 | |
| Net investment income (loss), net of waivers and reimbursements | | | 0.73 | | | | 0.66 | | | | 0.50 | | | | 0.32 | | | | 0.32 | | | | 2.06 | | | | 0.20 | |
| Class N net assets at the end of the year (in thousands) | | $ | 37,918 | | | $ | 43,463 | | | $ | 41,483 | | | $ | 61,376 | | | $ | 150,606 | | | $ | 150,778 | | | $ | 150,785 | |
| Portfolio turnover rate (%)* | | | 12 | | | | 36 | | | | 43 | | | | 50 | | | | 34 | | | | 17 | | | | 59 | |
| | | | | | | | | | | | | | | | | | | | | | | | | | | | | |
| | Class I | |
| | (unaudited)
Period Ended
June 30, | | | Periods Ended December 31, | | Year Ended
October 31, | |
| | | 2019 | | | | 2018 | | | | 2017 | | | | 2016 | | | | 2015 | | | | 2014(a) | | 2014 | |
| Net asset value, beginning of year | | $ | 11.38 | | | $ | 11.88 | | | $ | 11.38 | | | $ | 11.38 | | | $ | 12.22 | | | $ | 13.15 | | | $ | 12.66 | |
| Income (loss) from investment operations: | | | | | | | | | | | | | | | | | | | | | | | | | | | | |
| Net investment income (loss) | | | 0.06 | | | | 0.11 | | | | 0.11 | | | | 0.08 | | | | 0.09 | | | | 0.05 | | | | 0.04 | |
| Net realized and unrealized gain (loss) on investments | | | 0.24 | | | | (0.24 | ) | | | 0.51 | | | | 0.18 | | | | (0.82 | ) | | | (0.31 | ) | | | 0.78 | |
| Total from investment operations | | | 0.30 | | | | (0.13 | ) | | | 0.62 | | | | 0.26 | | | | (0.73 | ) | | | (0.26 | ) | | | 0.82 | |
| Less distributions from: | | | | | | | | | | | | | | | | | | | | | | | | | | | | |
| Net investment income | | | — | | | | 0.37 | | | | 0.12 | | | | 0.26 | | | | 0.11 | | | | 0.67 | | | | 0.10 | |
| Net realized gain | | | — | | | | — | | | | — | | | | — | | | | — | | | | — | | | | 0.23 | |
| Total distributions | | | — | | | | 0.37 | | | | 0.12 | | | | 0.26 | | | | 0.11 | | | | 0.67 | | | | 0.33 | |
| Net asset value, end of year | | $ | 11.68 | | | $ | 11.38 | | | $ | 11.88 | | | $ | 11.38 | | | $ | 11.38 | | | $ | 12.22 | | | $ | 13.15 | |
| Total return (%)* | | | 2.64 | | | | (1.08 | ) | | | 5.50 | | | | 2.26 | | | | (6.00 | ) | | | (1.94 | ) | | | 6.60 | |
| Ratios to average daily net assets (%)**: | | | | | | | | | | | | | | | | | | | | | | | | | | | | |
| Expenses, before waivers and reimbursements | | | 0.98 | | | | 0.99 | | | | 1.17 | | | | 1.12 | | | | 1.14 | | | | 1.10 | | | | 1.27 | |
| Expenses, net of waivers and reimbursements | | | 0.98 | | | | 0.99 | | | | 1.02 | | | | 0.97 | | | | 0.99 | | | | 1.10 | | | | 1.22 | |
| Expenses (excluding interest or short dividend expense), net of waivers and reimbursements | | | 0.96 | | | | 0.97 | | | | 0.96 | | | | 0.97 | | | | 0.98 | | | | 1.07 | | | | 1.10 | |
| Net investment income (loss), before waivers and reimbursements | | | 1.02 | | | | 0.95 | | | | 0.75 | | | | 0.52 | | | | 0.58 | | | | 2.33 | | | | 0.27 | |
| Net investment income (loss), net of waivers and reimbursements | | | 1.02 | | | | 0.95 | | | | 0.90 | | | | 0.67 | | | | 0.73 | | | | 2.33 | | | | 0.32 | |
| Class I net assets at the end of the year (in thousands) | | $ | 440,655 | | | $ | 486,543 | | | $ | 780,075 | | | $ | 937,244 | | | $ | 1,155,051 | | | $ | 649,756 | | | $ | 617,531 | |
| Portfolio turnover rate (%)* | | | 12 | | | | 36 | | | | 43 | | | | 50 | | | | 34 | | | | 17 | | | | 59 | |
| (a) | For the period November 1, 2014 to December 31, 2014. |
| * | Rates are not annualized for periods that are less than a year. |
| ** | Rates are annualized for periods that are less than a year. |
Note: Net investment income (loss) per share is based on the average shares outstanding during the year.
Performance cited represents past performance. Past performance does not guarantee future results and current performance may be lower or higher than the data quoted. Results shown are annual returns, which assume reinvestment of dividends and capital gains. Investment returns and principal will fluctuate and you may have a gain or loss when you sell shares. For the most current month-end performance information, please call 1-800-742-7272 or visit our Web site atwww.williamblairfunds.com.
| 186 | Semiannual Report | June 30, 2019 |
Financial Highlights— For a share outstanding throughout each period
Macro Allocation Fund
| | Class R6 | |
| | (unaudited)
Period Ended
June 30, | | | Periods Ended December 31, | | Year Ended
October 31, | |
| | | 2019 | | | | 2018 | | | | 2017 | | | | 2016 | | | | 2015 | | | | 2014(a) | | 2014 | |
| Net asset value, beginning of year | | $ | 11.38 | | | $ | 11.89 | | | $ | 11.40 | | | $ | 11.39 | | | $ | 12.23 | | | $ | 13.16 | | | $ | 12.66 | |
| Income (loss) from investment operations: | | | | | | | | | | | | | | | | | | | | | | | | | | | | |
| Net investment income (loss) | | | 0.07 | | | | 0.13 | | | | 0.12 | | | | 0.09 | | | | 0.12 | | | | 0.05 | | | | 0.04 | |
| Net realized and unrealized gain (loss) on investments | | | 0.23 | | | | (0.24 | ) | | | 0.51 | | | | 0.19 | | | | (0.84 | ) | | | (0.31 | ) | | | 0.79 | |
| Total from investment operations | | | 0.30 | | | | (0.11 | ) | | | 0.63 | | | | 0.28 | | | | (0.72 | ) | | | (0.26 | ) | | | 0.83 | |
| Less distributions from: | | | | | | | | | | | | | | | | | | | | | | | | | | | | |
| Net investment income | | | — | | | | 0.40 | | | | 0.14 | | | | 0.27 | | | | 0.12 | | | | 0.67 | | | | 0.10 | |
| Net realized gain | | | — | | | | — | | | | — | | | | — | | | | — | | | | — | | | | 0.23 | |
| Total distributions | | | — | | | | 0.40 | | | | 0.14 | | | | 0.27 | | | | 0.12 | | | | 0.67 | | | | 0.33 | |
| Net asset value, end of year | | $ | 11.68 | | | $ | 11.38 | | | $ | 11.89 | | | $ | 11.40 | | | $ | 11.39 | | | $ | 12.23 | | | $ | 13.16 | |
| Total return (%)* | | | 2.64 | | | | (0.94 | ) | | | 5.51 | | | | 2.44 | | | | (5.92 | ) | | | (1.91 | ) | | | 6.71 | |
| Ratios to average daily net assets (%)**: | | | | | | | | | | | | | | | | | | | | | | | | | | | | |
| Expenses, before waivers and reimbursements | | | 0.90 | | | | 0.91 | | | | 0.92 | | | | 0.89 | | | | 0.90 | | | | 0.91 | | | | 1.05 | |
| Expenses, net of waivers and reimbursements | | | 0.90 | | | | 0.91 | | | | 0.92 | | | | 0.89 | | | | 0.90 | | | | 0.91 | | | | 1.05 | |
| Expenses (excluding interest or short dividend expense), net of waivers and reimbursements | | | 0.88 | | | | 0.89 | | | | 0.86 | | | | 0.89 | | | | 0.90 | | | | 0.88 | | | | 0.93 | |
| Net investment income (loss), before waivers and reimbursements | | | 1.18 | | | | 1.10 | | | | 1.04 | | | | 0.81 | | | | 0.95 | | | | 2.54 | | | | 0.32 | |
| Net investment income (loss), net of waivers and reimbursements | | | 1.18 | | | | 1.10 | | | | 1.04 | | | | 0.81 | | | | 0.95 | | | | 2.54 | | | | 0.32 | |
| Class R6 net assets at the end of the year (in thousands) | | $ | 411,704 | | | $ | 391,812 | | | $ | 487,082 | | | $ | 582,298 | | | $ | 426,230 | | | $ | 158,152 | | | $ | 150,447 | |
| Portfolio turnover rate (%)* | | | 12 | | | | 36 | | | | 43 | | | | 50 | | | | 34 | | | | 17 | | | | 59 | |
| (a) | For the period November 1, 2014 to December 31, 2014. |
| * | Rates are not annualized for periods that are less than a year. |
| ** | Rates are annualized for periods that are less than a year. |
Note: Net investment income (loss) per share is based on the average shares outstanding during the year.
Performance cited represents past performance. Past performance does not guarantee future results and current performance may be lower or higher than the data quoted. Results shown are annual returns, which assume reinvestment of dividends and capital gains. Investment returns and principal will fluctuate and you may have a gain or loss when you sell shares. For the most current month-end performance information, please call 1-800-742-7272 or visit our Web site atwww.williamblairfunds.com.
| June 30, 2019 | William Blair Funds | 187 |
Renewal of the Management Agreement
On April 25, 2019, the Board of Trustees (the “Board”) of the William Blair Funds (the “Trust”) including the Trustees who are not “interested persons” of the Trust as defined by the Investment Company Act of 1940, as amended (the “Independent Trustees”), approved the renewal for an additional one-year term of the Trust’s Management Agreement with William Blair Investment Management, LLC (“WBIM” or the “Adviser”) on behalf of each of the William Blair Funds (each, a “Fund” and collectively, the “Funds”). In deciding to approve the renewal of the Management Agreement, the Board did not identify any single factor or group of factors as all important or controlling and considered all factors together. The Board did not allot a particular weight to any one factor or group of factors.
The information in this summary outlines the Board’s considerations associated with its renewal of the Management Agreement. In connection with its deliberations regarding the continuation of the Management Agreement, the Board considered such information and factors as it believed to be relevant. As described below, the Board considered the nature, quality and extent of the services performed by the Adviser under the Management Agreement; the investment performance of each Fund and the Adviser; comparative management fees and expense ratios as prepared by an independent provider (Broadridge); the estimated profitability realized by the Adviser; the extent to which the Adviser realizes economies of scale as a Fund grows; and whether fall-out benefits are being realized by the Adviser. In addition, the Independent Trustees discussed the renewal of the Management Agreement with Trust management and in private sessions with independent legal counsel at which no representatives of the Adviser were present.
The Board, including the Independent Trustees, considered the renewal of the Management Agreement pursuant to a process that concluded at the Board’s April 25, 2019 meeting. In preparation for the review process, the Independent Trustees considered the type and nature of information to be requested, and independent legal counsel sent a formal request for information to the Adviser. The Adviser provided extensive information in response to the request. After reviewing the information received, the Independent Trustees requested supplemental information, which the Adviser provided. The Board also received a memorandum from legal counsel advising it of their duties and responsibilities in connection with the consideration of the Management Agreement. The Independent Trustees reviewed comparative performance for a performance peer universe and peer group of funds and comparative management fees and expense ratios for an expense peer group and an expense peer universe of funds provided by Broadridge for each Fund. In addition, the Independent Trustees considered: (1) the nature, quality and extent of services provided by the Adviser; (2) information comparing the performance of each Fund to one or more relevant securities indexes; (3) information comparing management fees of each Fund to fees charged by the Adviser to other funds and client accounts with similar investment strategies; (4) the estimated allocated direct or indirect costs of services provided and estimated profits realized by the Adviser for both the Trust as a whole and each Fund individually; and (5) information describing other benefits to the Adviser and its affiliate, William Blair & Company, L.L.C. (the “Distributor,” and collectively with the Adviser, “William Blair”), resulting from their relationship with the Funds. The Independent Trustees also noted that they receive information from the Adviser regarding the Funds throughout the year in connection with regular Board meetings, including presentations from portfolio managers. In addition, the Adviser made an in-person presentation to the Board regarding the contract review information, including addressing the supplemental information requests, and answered questions from the Independent Trustees. The Board, including the Independent Trustees, determined that, given the totality of the information provided with respect to the Management Agreement, the Board had received sufficient information to renew the Management Agreement. The Independent Trustees noted that in evaluating the Management Agreement, they were taking into account their accumulated experience as Board members in working with the Adviser on matters relating to the Funds. Based on their review, the Independent Trustees concluded that it was in the best interest of each Fund to renew the Management Agreement and, accordingly, recommended to the Board of the Trust the renewal of the Management Agreement for each Fund. The Board considered the recommendation of the Independent Trustees along with other factors that the Board deemed relevant.
Nature, Quality and Extent of Services.In evaluating the nature, quality and extent of the services provided by the Adviser to the Funds, the Board noted that the Adviser is a quality firm with a reputation for integrity and honesty that employs high-quality people and has a long association with the Funds, in each case other than the Growth Fund, since the inception of the Funds. The Board believes that a long-term relationship with a capable, conscientious adviser is in the best interests of shareholders and that shareholders have invested in the Funds knowing that the Adviser manages the Funds and knowing the management fees. The Board considered the Adviser’s fundamental research approach in actively managed, process oriented investing. The Board considered biographical information about the Trust’s officers, other Adviser personnel and the Funds’ portfolio managers, including information on the portfolio managers’ personal investments in the Fund(s) they manage. The Board also considered the administrative services performed by the Adviser, financial information regarding the Adviser, the Adviser’s execution quality and use of soft dollars, risk management oversight, compliance program and the expense limitations proposed for each of the Funds’ share classes. The Board also considered the nature, quality and extent of services that the Adviser provides to the Funds compared to the services that the Adviser provides to other clients. The Board noted that the
| 188 | Semiannual Report | June 30, 2019 |
Adviser pays the compensation of all of the officers and the interested Trustees of the Trust. Based upon all relevant factors, the Board concluded that the nature, quality and extent of the services provided by the Adviser to each Fund were appropriate.
Performance.The Board reviewed information on the annualized total returns of each share class of the Funds for the one-, three-, five- and ten-year periods ended December 31, 2018, as applicable, along with annualized total return information for a Morningstar performance peer universe of funds and one or more benchmark securities indexes. The Morningstar performance peer universe for each Fund included all funds in the same Morningstar category as the Fund. For purposes of this report, Class N shares were used for comparison purposes as the Board noted that Class N shares have additional costs related to distribution and shareholder services provided and therefore provide a more conservative representation of Fund performance.
The Board considered that the Adviser seeks to provide superior performance over the long term and was committed to managing each Fund consistently with the Fund’s stated investment strategies and that at times relative performance will be affected by whether the market environment favors or disfavors particular investments, styles and/or market capitalizations. The Board considered that since the Global Financial Crisis in 2008-2009, the low interest rate environment globally has fostered relatively low stock market volatility, with notable bouts of volatility in 2015, 2016, and 2018. The Board concluded that the Adviser had managed the equity Funds in the U.S., International and Emerging Markets growth strategies consistent with its disciplined quality growth philosophy. Based on the information provided, the Board considered the following with respect to the total returns of each Fund.
Growth Fund. The Board considered that the Fund’s total return was above the average of its Morningstar performance peer universe for the one-year period, the same as the average of its Morningstar performance peer universe for the three-year period and below the average of its Morningstar performance peer universe for the five-year period ended December 31, 2018. The Board also considered that the Fund outperformed the benchmark (Russell 3000®Growth Index) for the one-year period and underperformed the benchmark for the three- and five-year periods ended December 31, 2018.
Large Cap Growth Fund. The Board considered that the Fund’s total return was above the average of its Morningstar performance peer universe and the benchmark (Russell 1000®Growth Index) for the one-, three- and five-year periods ended December 31, 2018.
Mid Cap Growth Fund. The Board considered that the Fund’s total return was above the average of its Morningstar performance peer universe for the one-year period and below the average of its Morningstar performance peer universe for the three- and five- year periods ended December 31, 2018. The Board also considered that the Fund outperformed the benchmark (Russell Midcap®Growth Index) for the one-year period and underperformed the benchmark for the three- and five-year periods ended December 31, 2018. The Board considered the Adviser’s report that stock selection in certain sectors detracted from the Fund’s performance. The Board considered changes to the Adviser’s portfolio management team, the addition of analysts to the investment team and the Adviser’s other investment team modifications over the past three years to align coverage by sector and market capitalization, with the goal of improving relative performance.
Small-Mid Cap Growth Fund. The Board considered that the Fund’s total return was above the average of its Morningstar performance peer universe and the benchmark (Russell 2500TMGrowth Index) for the one-, three- and five-year periods ended December 31, 2018.
Small-Mid Cap Value Fund. The Board considered that the Fund’s total return was below the average of its Morningstar performance peer universe and the benchmark (Russell 2500TMValue Index) for the one-, three- and five-year periods ended December 31, 2018. The Board considered the Adviser’s view that while better stock selection would have lessened underperformance over the three- and five- year periods, that the rally in deeper value stocks and the outperformance of smaller cap and lower quality stocks contributed to underperformance.
Small Cap Growth Fund. The Board considered that the Fund’s total return was above the average of its Morningstar performance peer universe and the benchmark (Russell 2000®Growth Index) for the one-, three- and five-year periods ended December 31, 2018.
Small Cap Value Fund. The Board considered that the Fund’s total return was below the average of its Morningstar performance peer universe and the benchmark (Russell 2000®Value Index) for the one-, three- and five- year periods ended December 31, 2018. The Board considered the Adviser’s view that while better stock selection would have lessened underperformance over the three- and five- year periods, that the rally in deeper value stocks and the outperformance of smaller cap and lower quality stocks contributed to underperformance.
Global Leaders Fund. The Board considered that the Fund’s total return was above the average of its Morningstar performance peer universe for the one-, three- and five-year periods ended December 31, 2018. The Board also considered that the Fund
| June 30, 2019 | William Blair Funds | 189 |
outperformed the benchmark (MSCI All Country World IMI (net) Index) for the one- and five-year periods and underperformed the benchmark for the three-year period ended December 31, 2018.
International Leaders Fund. The Board considered that the Fund’s total return was above the average of its Morningstar performance peer universe and the benchmark (MSCI All Country World Ex-U.S. IMI (net) Index) for the one-, three- and five-year periods ended December 31, 2018.
International Developed Plus Fund. The Board considered that the Fund’s total return was below the average of its Morningstar performance peer universe and the benchmark (MSCI World Ex-U.S. (net) Index) for the one-, three- and five-year periods ended December 31, 2018. The Board considered that the Adviser proposed to liquidate the Fund.
Institutional International Developed Plus Fund. The Board considered that the Fund’s total return was below the average of its Morningstar performance peer universe for the one-, three- and five-year periods ended December 31, 2018. The Board also considered that the Fund underperformed the benchmark (MSCI World Ex-U.S. (net) Index) for the one- and three- year periods and outperformed the benchmark for the five-year period ended December 31, 2018. The Board considered that the Adviser proposed to liquidate the Fund.
International Growth Fund. The Board considered that the Fund’s total return was below the average of its Morningstar performance peer universe and the benchmark (MSCI All Country World Ex-U.S. IMI (net) Index) for the one-, three- and five-year periods ended December 31, 2018. The Board considered the Adviser’s report that underperformance in 2018 primarily occurred in the second half of the year as companies with low valuations and poor earnings trends led the index amid the broad sell off in global equity markets and that weak stock selection in certain sectors and countries detracted from performance in 2016. The Board also considered that the Fund outperformed the benchmark in 2017, 2015 and 2014.
Institutional International Growth Fund. The Board considered that the Fund’s total return was below the average of its Morningstar performance peer universe and the benchmark (MSCI All Country World Ex-U.S. IMI (net) Index) for the one-, three- and five-year periods ended December 31, 2018. The Board considered the Adviser’s report that underperformance in 2018 primarily occurred in the second half of the year as companies with low valuations and poor earnings trends led the index amid the broad sell off in global equity markets and that weak stock selection in certain sectors and countries detracted from performance in 2016. The Board also considered that the Fund outperformed the benchmark in 2017, 2015 and 2014.
International Small Cap Growth Fund. The Board considered that the Fund’s total return was below the average of its Morningstar performance peer universe and the benchmark (MSCI All Country World Ex-U.S. Small Cap (net) Index) for the one-, three-and five-year periods ended December 31, 2018. The Board considered the Adviser’s report that the Fund’s underperformance was driven by relative weakness in calendar years 2018, 2016 and 2014 attributable to weak stock selection in certain sectors, offsetting the positive effects of 2015 and 2017 outperformance. The Board also considered the investment process improvements and portfolio construction changes that had been implemented.
Emerging Markets Leaders Fund. The Board considered that the Fund’s total return was below the average of its Morningstar performance peer universe for the one- and three-year periods and above the average of its Morningstar performance peer universe for the five-year period ended December 31, 2018. The Board considered that the Fund underperformed the benchmark (MSCI Emerging Markets (net) Index) for the one-, three- and five-year periods ended December 31, 2018. The Board also considered that the Adviser attributed underperformance in part to stock selection and to market dynamics that did not favor the Adviser’s quality growth investing style.
Emerging Markets Growth Fund. The Board considered that the Fund’s total return was below the average of its Morningstar performance peer universe for the one- and three-year periods and above the average of its Morningstar performance peer universe for the five-year period ended December 31, 2018. The Board also considered that the Fund underperformed the benchmark (MSCI Emerging Markets IMI (net) Index) for the one-, three- and five-year periods ended December 31, 2018. The Board also considered the Adviser’s view that relative performance was significantly negatively impacted by outlier quarters in 2016 and 2018 characterized as style headwinds.
Emerging Markets Small Cap Growth Fund. The Board considered that the Fund’s total return was below the average of its Morningstar performance peer universe for the one- and three-year periods and above the average of its Morningstar performance peer universe for the five-year period ended December 31, 2018. The Board also considered that the Fund underperformed the benchmark for the one- and three-year periods and outperformed the benchmark (MSCI Emerging Markets Small Cap (net) Index) for the five-year period ended December 31, 2018. The Board also considered the Adviser’s report that underperformance was largely driven by exogenous factors that negatively impacted the Fund’s relative performance in the third quarter of 2018, and style headwinds in 2016.
| 190 | Semiannual Report | June 30, 2019 |
Bond Fund. The Board considered that the Fund’s total return was below the average of its Morningstar performance peer universe and the benchmark (Bloomberg Barclays U.S. Aggregate Bond Index) for the one-, three- and five-year periods ended December 31, 2018. The Board considered the Adviser’s report that during the fourth quarter of 2018, security selection themes impacted performance negatively and overwhelmed the one-, three-, and five-year results.
Income Fund. The Board considered that the Fund’s total return was below the average of its Morningstar performance peer universe for the one- and three- year periods and above its Morningstar performance peer universe for the five-year period ended December 31, 2018. The Board also considered that the Fund underperformed the benchmark (Bloomberg Barclays Intermediate Government/Credit Bond Index) for the one-, three- and five-year periods ended December 31, 2018. The Board considered the Adviser’s report that the Fund’s investment limitation on lower quality securities negatively impacted the Fund’s benchmark-relative and peer group performance due to the outperformance of lower quality securities over the one-, three-, and five-year periods.
Low Duration Fund. The Board considered that the Fund’s total return was below the average of its Morningstar performance peer universe for the one-, three- and five-year periods ended December 31, 2018. The Board also considered that the Fund underperformed the benchmark (Bank of America Merrill Lynch 1-Year U.S. Treasury Note Index) for the one- and three-year periods and outperformed the benchmark for the five-year period ended December 31, 2018. The Board considered the Adviser’s report that the Fund’s exposure to short term securities with longer durations compared to the benchmark negatively impacted the Fund’s performance in 2016 and 2018 when interest rates increased.
Macro Allocation Fund. The Board considered that the Fund’s total return was above its Morningstar performance peer universe for the one- and three-year periods and below the average of its Morningstar performance peer universe for the five-year period ended December 31, 2018. The Board also considered that the Fund outperformed the benchmark (Bank of America Merrill Lynch 3-Month U.S. Treasury Bill Index) for the three-year period and underperformed the benchmark for the one- and five-year periods ended December 31, 2018.
Management Fees.The Board reviewed each Fund’s management fee and reviewed information comparing the management fee to those of an expense peer group and an expense peer universe of funds provided by Broadridge for each share class of the Funds. The Broadridge expense peer group for Class N shares of each Fund (“Class N Broadridge Expense Group”) consisted of a group of retail no-load funds with a similar investment strategy and asset size, as classified by Broadridge. The Broadridge expense peer group for Class I and the Institutional Class of each Fund (“Class I Broadridge Expense Group” and “Institutional Class Broadridge Expense Group,” respectively) consisted of a group of institutional funds with a similar investment strategy and asset size, as classified by Broadridge. The Broadridge expense peer universe for each share class of each Fund consisted of the Fund’s Broadridge expense peer group and all other no-load funds with an investment strategy as classified by Broadridge similar to the Fund’s. In considering the Broadridge information and giving effect to the contractual management fee reductions proposed by the Adviser, the Board noted that the contractual management fees for the Emerging Markets Small Cap Growth Fund, the Bond Fund, and the Income Fund were below the average contractual management fee of their Class I Broadridge Expense Group. The Board also noted that the contractual management fees for the Growth Fund, the Large Cap Growth Fund, the Mid Cap Growth Fund, the Small-Mid Cap Growth Fund, the Small Mid Cap Value Fund, the Small Cap Growth Fund, the Small Cap Value Fund, the Global Leaders Fund, the International Leaders Fund, the International Developed Plus Fund, the International Growth Fund, the International Small Cap Growth Fund, the Emerging Markets Leaders Fund, the Emerging Markets Growth Fund, the Low Duration Fund and the Macro Allocation Fund were above the average contractual management fee of their Class I Broadridge Expense Group. The Board also considered the Adviser’s proposal to reduce the contractual management fee for the Large Cap Growth Fund, Mid Cap Growth Fund, Small-Mid Cap Value Fund, Global Leaders Fund, and International Leaders Fund.
In considering the management fee for the Institutional International Developed Plus Fund and the Institutional International Growth Fund, which do not have Class I shares, the Board noted that the contractual management fees for each Fund were above the average contractual management fee of their Institutional Class Broadridge Expense Group.
The Board noted the current and proposed contractual expense limitations for the Funds and further noted that the Adviser proposed reducing the contractual limit on operating expenses for the Large Cap Growth Fund, Global Leaders Fund, International Leaders Fund and Emerging Markets Leaders Fund. The Board considered that the Adviser proposed to contractually limit operating expenses until April 30, 2020 for each share class of the Funds including the new Class R6. The Board considered the amount of management fees waived and other expenses reimbursed by the Adviser on behalf of the Funds in 2018, noting that the Adviser waived its entire management fee for and reimbursed other expenses to the Small-Mid Cap Value Fund. The Board also considered that the shareholder administration fee applicable to Class N and Class I had been reduced to zero.
| June 30, 2019 | William Blair Funds | 191 |
For each Fund, the Board also reviewed amounts charged by the Adviser to other pooled investment vehicles, including other registered funds for which the Adviser acts as a sub-adviser, and the Adviser’s fee schedule for institutional accounts. With respect to other pooled investment vehicles and institutional accounts, the Board considered the Adviser’s statements to the effect that the level of services provided to the Funds and the regulatory responsibilities associated with sponsoring registered investment companies were greater as compared to the work involved for other pooled investment vehicles, including other registered funds for which the Adviser acts as a sub-adviser, and institutional accounts. In addition, the Board considered the Adviser’s statements to the effect that institutional accounts are distributed differently, operate under different investment and regulatory structures and have different business risks as compared to the Funds and that there are responsibilities and duties involved in sponsoring a registered fund that are not present in sub-advising a registered fund.
On the basis of all the information provided, the Board concluded that each Fund’s management fee, coupled with the applicable expense limitations, was reasonable.
Profitability.With respect to the profitability of the Management Agreement to the Adviser, the Board considered the overall fees paid under the Management Agreement, including the estimated allocated costs of the services provided, management fees waived and other expenses reimbursed, if any, and profits realized by the Adviser from its relationship with the Trust as a whole and each Fund individually. The Board concluded that the estimated profits realized by the Adviser were not unreasonable.
Economies of Scale.The Board considered the extent to which economies of scale would be realized as the Funds grow and whether fee levels reflect these economies of scale for the benefit of investors. The Board noted the Adviser’s statements to the effect that the resources required for the Adviser’s fundamental investment process typically increase as a Fund increases in size. The Board also considered that certain of the Funds were part of investment strategies that were capacity constrained by the Adviser so that opportunities for economies of scale were limited. The Board further considered that of the Funds that are subject to capacity constraints, the International Growth Fund, Institutional International Growth Fund, International Small Cap Growth Fund, Emerging Markets Growth Fund and Emerging Markets Small Cap Growth Fund are closed.
In considering whether fee levels reflect economies of scale for the benefit of Fund investors, the Board considered each Fund’s asset size, management fee breakpoints for applicable Funds, the expense limitations in place for each Fund and the proposed reduction in management fees and/or expense limits for certain Funds and each Fund’s expense ratios. The Board concluded that in the aggregate the Funds’ fee levels reasonably reflect appropriate recognition of economies of scale.
Other Benefits.The Board considered benefits derived by the Adviser and its affiliates from their relationship with the Funds, including (1) receipt of research from brokerage firms; (2) soft dollars, which pertain primarily to the Funds investing in equity securities; (3) reimbursement of some intermediary fees in the nature of sub-transfer agency fees; (4) fees from Class N shares of the Funds to the Distributor pursuant to the Rule 12b-1 Plan, nearly all of which are paid to third parties; and (5) favorable media coverage. The Board determined that management fees were reasonable in light of these benefits.
Conclusion.Based upon all of the information considered and the conclusions reached, the Board determined that the terms of the Management Agreement continue to be fair and reasonable and that the continuation of the Management Agreement is in the best interests of each Fund.
| 192 | Semiannual Report | June 30, 2019 |
Trustees and Officers (Unaudited).†The trustees and officers of the William Blair Funds, their year of birth, their principal occupations during the last five years, their affiliations, if any, with William Blair, and their other significant affiliations are set forth below. The address of each officer and trustee is 150 North Riverside Plaza, Chicago, Illinois 60606.
| Name and Year of Birth | | Position(s)
Held with
Trust | | Term of
Office(1)and
Length of
Time
Served | | Principal
Occupation(s)
During Past 5 Years | | Number of
Portfolios
in Trust
Complex
Overseen
by Trustee | | Other Directorships
Held by Trustee
During Past 5 Years |
| Interested Trustees | | | | | | | | |
Stephanie G. Braming,
1970(2) | | Chairman of the Board and President, previously Senior Vice President | | Chairman of the Board and President since 2018, and Senior Vice President 2014-2018 | | Global Head of Investment Management since 2017, portfolio manager (2014– 2017) and Partner, William Blair | | 21 | | Chairman, William Blair SICAV. |
Arthur J. Simon,
1954(2) | | Trustee | | Since 2018 | | General Counsel and Partner, William Blair | | 21 | | Director, William Blair SICAV. |
| Non-Interested Trustees | | | | | | | | |
Vann A. Avedisian,
1964(3) | | Trustee | | Since 2012 | | Principal, Highgate Holdings (hotel investments) (since 2009); formerly, co-founder and Managing Director, Oxford Capital Partners Inc. (1994 to 2006) | | 21 | | Potbelly Corporation (2001 to 2015) |
Kathleen T. Barr,
1955 | | Trustee | | Since 2013 | | Retired; formerly, President, Productive Capital Management, Inc. (registered investment adviser to public entities) and Owner, KT Barr Consulting, LLC (mutual fund and investment management consulting) (2010 to 2013); prior thereto, Chief Administrative Officer, Senior Vice President and Senior Managing Director of Allegiant Asset Management Company (merged with PNC Capital Advisors, LLC in 2009) (2004 to 2010); Chief Administrative Officer, Chief Compliance Officer and Senior Vice President of PNC Funds and PNC Advantage Funds (f/k/a Allegiant Funds) (2003 to 2010) | | 21 | | Professionally Managed Portfolios (since 2018); Council Member, Independent Directors Council; AmericaFirst Quantitative Funds (5 portfolios) (2012 to 2016) |
| † | William Blair Investment Management, LLC and William Blair & Company, L.L.C. are collectively referred to in this section as “William Blair”, each of which is a wholly owned subsidiary of WBC Holdings, L.P., which is wholly owned by certain William Blair employees (employee owners are referred to as ‘partners’). |
| June 30, 2019 | William Blair Funds | 193 |
| Name and Year of Birth | | Position(s)
Held with
Trust | | Term of
Office(1)and
Length of
Time
Served | | Principal
Occupation(s)
During Past 5 Years | | Number of
Portfolios
in Trust
Complex
Overseen
by Trustee | | Other Directorships
Held by Trustee
During Past 5 Years |
Daniel N. Leib,
1966(4) | | Trustee | | Since 2016 | | Chief Executive Officer, Donnelley Financial Solutions, Inc. (since 2016); formerly, Executive Vice President and Chief Financial Officer, (2011 to 2016) and Group Chief Financial Officer (2009 to 2011), R.R. Donnelley & Sons Company | | 21 | | Donnelly Financial Solutions, Inc. (since 2016) |
Dorri C. McWhorter,
1973 | | Trustee | | Since 2019 | | Chief Executive Officer, YWCA Metropolitan Chicago (since 2013); formerly Partner, Crowe LLP(2008-2013)(5) | | 21 | | Skyway Concession Company, LLC (since 2018); Illinois CPA Society (since 2017); American Institute of Certified Public Accountants (2013- 2016); Chicago Finance Exchange (2009-2017) |
Thomas J. Skelly,
1951 | | Trustee | | Since 2007 | | Advisory Board Member for various U.S. companies (since 2005); formerly, Managing Partner of various divisions at Accenture (1994-2004) | | 21 | | Mutual Trust Financial Group (provider of insurance and investment products) |
Steven R. Zenz,
1954 | | Trustee | | Since 2018 | | Consultant, Steven R. Zenz Consulting LLC (merger and acquisition transactions and SEC reporting and filings) (since 2011); formerly, Partner, KPMG LLP (1987-2010)(6) | | 21 | | Frankly Inc. (technology products and services for media industry) (since 2016); Insignia Systems, Inc. (in-store advertising services for consumer packaged goods manufacturers) (since 2013) |
| (1) | Each Trustee serves until the election and qualification of a successor, or until death, resignation or retirement, or removal as provided in the Trust’s Declaration of Trust. Retirement for Non-Interested Trustees occurs no later than at the conclusion of the first regularly scheduled Board meeting of the calendar year that occurs after the earlier of (a) the Non-Interested Trustee’s 72nd birthday or (b) the 15th anniversary of the date that the Non-Interested Trustee became a member of the Board of Trustees. |
| (2) | Ms. Braming and Mr. Simon are interested persons of the Trust because they are partners of William Blair, and with respect to Ms. Braming also due to her position as an officer of the Trust. |
| (3) | Mr. Avedisian served as a member of the Board of Directors of Potbelly Corporation (“Potbelly”) from 2001 to 2015. In October 2013, Potbelly completed an underwritten initial public offering of its common stock (the “Offering”). William Blair served as a member of the underwriting syndicate. At the time of the Offering, Mr. Avedisian, through entities he owns or controls, indirectly beneficially owned 1,607,448 shares of Potbelly common stock and warrants to purchase 241,704 shares of common stock representing approximately 8.9% of the shares before the Offering. Mr. Avedisian disclaimed beneficial ownership of the shares except to the extent of his pecuniary interest therein. Potbelly sold 8,474,869 shares and certain stockholders, including two entities affiliated with William Blair, sold 150,131 shares in the Offering at a price to the public of $14.00 per share. Neither Mr. Avedisian nor the entities he owns or controls was a selling stockholder in the Offering. A portion of the net proceeds received by Potbelly from the Offering was used to pay a previously declared cash dividend, in an aggregate amount of approximately $49.9 million, on Potbelly common and preferred shares outstanding immediately prior to the closing of the Offering, which included the outstanding shares indirectly beneficially owned by Mr. Avedisian, William Blair and two entities affiliated with William Blair. |
| (4) | The Funds and William Blair use Donnelley Financial Solutions, Inc. (‘’DFS’’), formerly a company of R.R. Donnelley & Sons Company (‘’RRD’’), for financial printing and other services. DFS was formed as a spin-off from RRD in October 2016 and is a public company. The Funds and William Blair in the aggregate paid DFS approximately $172,000 and $122,000 in 2017 and 2018, respectively, for the services provided. DFS’s revenue was approximately $1 billion in each of 2017 and 2018. Mr. Leib, as the Chief Executive Officer of DFS, is not directly involved in any of the services provided to the Funds or William Blair and his compensation is not materially affected by the fees DFS receives from the Funds and William Blair. The Funds and William Blair engaged RRD for financial printing and other services prior to the spin-off and the amounts involved were not material. Mr. Leib, as former Executive Vice President and Chief Financial Officer of RRD, was not directly involved in any of the services provided to the Funds or William Blair and his compensation was not materially affected by the fees RRD received from the Funds and William Blair. |
| (5) | As a former partner of the audit firm Crowe LLP (formerly, Crowe Horwath LLP), Ms. McWhorter receives distributions of her capital in the firm over time and those distributions are expected to be completed in March 2021. The Funds and William Blair made no payments to Crowe LLP over the past three years. |
| (6) | The Funds engage KPMG to provide foreign tax services in Taiwan. KPMG does not provide audit or audit-related services to the Funds. Mr. Zenz is a former partner of KPMG and receives pension/retirement funds from KPMG. |
| 194 | Semiannual Report | June 30, 2019 |
| Name and Year of Birth | | Position(s) Held
with Trust | | | Term of Office
and Length of
Time Served(1) | | | Principal Occupation(s)
During Past 5 Years |
| | | | | | | | | | | |
| Officers | | | | | | |
| | | | | | | |
Michael P. Balkin,
1959 | | Senior Vice President | | Since 2008 | | Partner, William Blair |
| | | | | | | |
Thomas Clarke,
1968 | | Senior Vice President | | Since 2011 | | Partner, William Blair (since 2014); formerly, Associate, William Blair (2011-2014) |
| | | | | | | |
Daniel Crowe,
1972 | | Senior Vice President | | Since 2016 | | Partner, William Blair (since 2015); formerly, Associate, William Blair |
| | | | | | | |
Robert J. Duwa,
1967 | | Senior Vice President | | Since 2019 | | Partner, William Blair |
| | | | | | | |
Simon Fennell,
1969 | | Senior Vice President | | Since 2013 | | Partner, William Blair (since 2013); formerly, Associate, William Blair (2011-2013) |
| | | | | | | |
Andrew G. Flynn,
1961 | | Senior Vice President | | Since 2013 | | Partner, William Blair |
| | | | | | | |
David C. Fording,
1967 | | Senior Vice President | | Since 2006 | | Partner, William Blair |
| | | | | | | |
James S. Golan,
1961 | | Senior Vice President | | Since 2005 | | Partner, William Blair |
| | | | | | | |
Chad M. Kilmer,
1975 | | Senior Vice President | | Since 2006 | | Partner, William Blair |
| | | | | | | |
Robert C. Lanphier IV,
1956 | | Senior Vice President | | Since 2003 | | Partner, William Blair |
| | | | | | | |
Mark T. Leslie,
1967 | | Senior Vice President | | Since 2005 | | Partner, William Blair |
| | | | | | | |
Kenneth J. McAtamney,
1966 | | Senior Vice President | | Since 2008 | | Partner, William Blair |
| | | | | | | |
Todd M. McClone,
1968 | | Senior Vice President | | Since 2005 | | Partner, William Blair |
| | | | | | | |
David Merjan,
1960 | | Senior Vice President | | Since 2008 | | Partner, William Blair |
| | | | | | | |
David S. Mitchell,
1960 | | Senior Vice President | | Since 2003 | | Partner, William Blair |
| | | | | | | |
John C. Murphy,
1969 | | Senior Vice President | | Since 2014 | | Partner, William Blair |
| | | | | | | |
Casey K. Preyss,
1976 | | Senior Vice President | | Since 2015 | | Partner, William Blair |
| | | | | | | |
David P. Ricci,
1958 | | Senior Vice President | | Since 2006 | | Partner, William Blair |
| | | | | | | |
Ward D. Sexton,
1974 | | Senior Vice President | | Since 2016 | | Partner, William Blair |
| | | | | | | |
Brian D. Singer,
1960 | | Senior Vice President | | Since 2011 | | Partner, William Blair |
| | | | | | | |
Christopher T. Vincent,
1956 | | Senior Vice President | | Since 2002 | | Partner, William Blair |
| June 30, 2019 | William Blair Funds | 195 |
| Name and Year of Birth | | Position(s) Held
with Trust | | | Term of Office
and Length of
Time Served(1) | | | Principal Occupation(s)
During Past 5 Years |
| | | | | | | | | | | |
Dan Zelanzy,
1971 | | Senior Vice President | | Since 2019 | | Associate, William Blair (since 2019); formerly Managing Director, AQR Capital Management (2011-2019) |
| | | | | | | |
Lisa D. Rusch,
1970 | | Vice President | | Since 2018 | | Associate, William Blair |
| | | | | | | |
Paul J. Sularz,
1967 | | Vice President | | Since 2009 | | Associate, William Blair (2006-2012 and since 2014); Partner, William Blair (2012-2014) |
| | | | | | | |
Colette M. Garavalia,
1961 | | Treasurer | | Since 2000 | | Associate, William Blair |
| | | | | | | |
Andrew T. Pfau,
1970 | | Secretary | | Since 2009 | | Associate, William Blair |
| | | | | | | |
John M. Raczek,
1970 | | Assistant Treasurer | | Since 2010 | | Associate, William Blair |
| | | | | | | |
Walter R. Randall, Jr.,
1960 | | Chief Compliance Officer and Assistant Secretary | | Since 2009 | | Associate, William Blair |
| | | | | | | |
Robert J. Toner,
1967 | | Assistant Secretary | | Since 2016 | | Associate, William Blair (since 2015); formerly, Managing Director and Counsel, Wellington Management & Company LLP (2007-2015) |
| (1) | The Trust’s officers, except the Chief Compliance Officer, are elected annually by the Board of Trustees. The Trust’s Chief Compliance Officer is designated by the Board of Trustees and may only be removed by action of the Board of Trustees, including a majority of independent trustees. Length of Time Served for all officers indicates the year the individual became an officer of the Trust. |
The Statement of Additional Information for the William Blair Funds includes additional information about the trustees and is available without charge by calling 1-800-635-2886 (in Massachusetts 1-800-635-2840) or by writing the Fund.
| 196 | Semiannual Report | June 30, 2019 |
(Unaudited)
Proxy Voting
A description of the policies and procedures that the Funds use to determine how to vote proxies relating to portfolio securities and information regarding how the Funds voted proxies relating to portfolio securities for the most recent 12-month period ended December 31 are available without charge, upon request, by calling 1-800-635-2886 (in Massachusetts 1-800-635-2840), atwww.williamblairfunds.com and on the SEC’s website athttp://www.sec.gov.
Quarterly Portfolio Schedules
Each Fund files its complete schedule of portfolio holdings with the SEC for the first and third fiscal quarters of each fiscal year (quarters ended March 31 and September 30) on Form N-PORT. The Funds’ Forms N-PORT are available on the SEC’s website athttp://www.sec.gov.
Additional Federal Income Tax Information: (unaudited)
Under Section 852(b)(3)(C) of the Code, the Funds hereby designate the following amounts as capital gain dividends for the fiscal year ended December 31, 2018 (in thousands):
| Fund | | Capital Gain Dividend |
| Growth | | $ | 78,680 | |
| Large Cap Growth | | | 30,062 | |
| Mid Cap Growth | | | 12,496 | |
| Small-Mid Cap Growth | | | 224,256 | |
| Small-Mid Cap Value | | | 451 | |
| Small Cap Growth | | | 73,556 | |
| Small Cap Value | | | 64,927 | |
| Global Leaders | | | 27,739 | |
| International Leaders | | | 12,780 | |
| International Developed Plus | | | 695 | |
| International Growth | | | 163,556 | |
| Institutional International Growth | | | 166,380 | |
| International Small Cap Growth | | | 38,842 | |
| Emerging Markets Leaders | | | 17,246 | |
| Emerging Markets Growth | | | 116,253 | |
| Emerging Markets Small Cap Growth | | | 6,407 | |
| June 30, 2019 | William Blair Funds | 197 |
Useful Information About Your Report (Unaudited)
Please refer to this information when reviewing the Expense Example for each Fund.
Expense Example
As a shareholder of a Fund, you incur two types of costs: (1) transaction costs and (2) ongoing costs, including management fees, distribution (12b-1) fees (for Class N shares except for the Institutional International Growth Fund and the Institutional International Developed Plus Fund) and other Fund expenses. The example is intended to help you understand your ongoing costs (in dollars) of investing in the Fund and to compare these costs with the ongoing costs of investing in other mutual funds. To do so, compare the Fund’s 5% hypothetical example with the 5% hypothetical examples that appear in the shareholder reports of other funds. The example is based on an investment of $1,000 invested at the beginning of the period and held for the entire six-month period from January 1, 2019 to June 30, 2019.
Actual Expenses
In each example, the first line for each share class in the table provides information about theactualaccount values andactualexpenses. These expenses reflect the effect of any expense cap applicable to the share class during the period. Without this expense cap, the costs shown in the table would have been higher. You may use the information in this line, together with the amount you invested, to estimate the expenses that you paid over the period. Simply divide your account value by $1,000 (example, an $8,600 account value divided by $1,000 = 8.6), then multiply the result by the number in the first line under the heading entitled “Expenses Paid During the Period” to estimate the expenses you paid on your account during the period.
Hypothetical Example for Comparison Purposes
In each example, the second line for each share class in the table provides information abouthypotheticalaccount values andhypotheticalexpenses based on the Fund’s actual expense ratio and an assumed rate of return of 5% per year before expenses. This is not the Fund’s actual return. The hypothetical account values and expenses may not be used to estimate your actual ending account balance or the expenses you paid for the period. You may use this information to compare the ongoing costs of investing in the Fund to the costs of investing in other funds. To do so, compare this 5% hypothetical example with the 5% hypothetical examples that appear in the shareholder reports of other funds.
Please note that the expenses shown in both examples are meant to highlight your ongoing costs only and do not reflect any transactional costs or account type fees, such as IRA administration fees. These fees are discussed in the prospectus. Therefore, the second line of each share class in the table is useful in comparing ongoing costs only and will not help you determine the relative costs of owning different funds. In addition, if these transactional costs or account fees were included, your costs would have been higher.
| 198 | Semiannual Report | June 30, 2019 |
Fund Expenses (Unaudited)
| Expense Example | | Beginning
Account Value
1/1/2019 | | Ending
Account Value 06/30/2019 | | Expenses Paid
During
the Period (a) | | Annualized
Expense Ratio |
| Growth Fund | | | | | | | | | | | | | | | | |
| Class N-actual return | | $ | 1,000.00 | | | $ | 1,223.77 | | | $ | 6.62 | | | | 1.20 | % |
| Class N-hypothetical 5% return | | $ | 1,000.00 | | | $ | 1,044.05 | | | $ | 6.08 | | | | 1.20 | |
| Class I-actual return | | $ | 1,000.00 | | | $ | 1,225.95 | | | $ | 5.13 | | | | 0.93 | |
| Class I-hypothetical 5% return | | $ | 1,000.00 | | | $ | 1,045.39 | | | $ | 4.72 | | | | 0.93 | |
| Class R6-actual return (b) | | $ | 1,000.00 | | | $ | 1,025.32 | | | $ | 1.45 | | | | 0.87 | |
| Class R6-hypothetical 5% return (6 month period) | | $ | 1,000.00 | | | $ | 1,045.69 | | | $ | 4.41 | | | | 0.87 | |
| Large Cap Growth Fund | | | | | | | | | | | | | | | | |
| Class N-actual return | | $ | 1,000.00 | | | $ | 1,241.03 | | | $ | 5.56 | | | | 1.00 | |
| Class N-hypothetical 5% return | | $ | 1,000.00 | | | $ | 1,045.04 | | | $ | 5.07 | | | | 1.00 | |
| Class I-actual return | | $ | 1,000.00 | | | $ | 1,242.50 | | | $ | 4.17 | | | | 0.75 | |
| Class I-hypothetical 5% return | | $ | 1,000.00 | | | $ | 1,046.28 | | | $ | 3.81 | | | | 0.75 | |
| Class R6-actual return (b) | | $ | 1,000.00 | | | $ | 1,040.34 | | | $ | 1.01 | | | | 0.60 | |
| Class R6-hypothetical 5% return (6 month period) | | $ | 1,000.00 | | | $ | 1,047.02 | | | $ | 3.05 | | | | 0.60 | |
| Mid Cap Growth Fund | | | | | | | | | | | | | | | | |
| Class N-actual return | | $ | 1,000.00 | | | $ | 1,273.96 | | | $ | 6.77 | | | | 1.20 | |
| Class N-hypothetical 5% return | | $ | 1,000.00 | | | $ | 1,044.05 | | | $ | 6.08 | | | | 1.20 | |
| Class I-actual return | | $ | 1,000.00 | | | $ | 1,274.35 | | | $ | 5.36 | | | | 0.95 | |
| Class I-hypothetical 5% return | | $ | 1,000.00 | | | $ | 1,045.29 | | | $ | 4.82 | | | | 0.95 | |
| Class R6-actual return (b) | | $ | 1,000.00 | | | $ | 1,020.12 | | | $ | 1.49 | | | | 0.90 | |
| Class R6-hypothetical 5% return (6 month period) | | $ | 1,000.00 | | | $ | 1,045.54 | | | $ | 4.56 | | | | 0.90 | |
| Small-Mid Cap Growth Fund | | | | | | | | | | | | | | | | |
| Class N-actual return | | $ | 1,000.00 | | | $ | 1,242.73 | | | $ | 7.51 | | | | 1.35 | |
| Class N-hypothetical 5% return | | $ | 1,000.00 | | | $ | 1,043.31 | | | $ | 6.84 | | | | 1.35 | |
| Class I-actual return | | $ | 1,000.00 | | | $ | 1,244.58 | | | $ | 6.12 | | | | 1.10 | |
| Class I-hypothetical 5% return | | $ | 1,000.00 | | | $ | 1,044.55 | | | $ | 5.58 | | | | 1.10 | |
| Class R6-actual return (b) | | $ | 1,000.00 | | | $ | 1,029.15 | | | $ | 1.75 | | | | 1.05 | |
| Class R6-hypothetical 5% return (6 month period) | | $ | 1,000.00 | | | $ | 1,044.79 | | | $ | 5.32 | | | | 1.05 | |
| Small-Mid Cap Value Fund | | | | | | | | | | | | | | | | |
| Class N-actual return | | $ | 1,000.00 | | | $ | 1,166.67 | | | $ | 6.72 | | | | 1.25 | |
| Class N-hypothetical 5% return | | $ | 1,000.00 | | | $ | 1,043.80 | | | $ | 6.33 | | | | 1.25 | |
| Class I-actual return | | $ | 1,000.00 | | | $ | 1,167.93 | | | $ | 5.38 | | | | 1.00 | |
| Class I-hypothetical 5% return | | $ | 1,000.00 | | | $ | 1,045.04 | | | $ | 5.07 | | | | 1.00 | |
| Class R6-actual return (b) | | $ | 1,000.00 | | | $ | 987.19 | | | $ | 1.55 | | | | 0.95 | |
| Class R6-hypothetical 5% return (6 month period) | | $ | 1,000.00 | | | $ | 1,045.29 | | | $ | 4.82 | | | | 0.95 | |
| Small Cap Growth Fund | | | | | | | | | | | | | | | | |
| Class N-actual return | | $ | 1,000.00 | | | $ | 1,189.84 | | | $ | 8.14 | | | | 1.50 | |
| Class N-hypothetical 5% return | | $ | 1,000.00 | | | $ | 1,042.56 | | | $ | 7.60 | | | | 1.50 | |
| Class I-actual return | | $ | 1,000.00 | | | $ | 1,191.23 | | | $ | 6.79 | | | | 1.25 | |
| Class I-hypothetical 5% return | | $ | 1,000.00 | | | $ | 1,043.80 | | | $ | 6.33 | | | | 1.25 | |
| Class R6-actual return (b) | | $ | 1,000.00 | | | $ | 998.71 | | | $ | 1.92 | | | | 1.17 | |
| Class R6-hypothetical 5% return (6 month period) | | $ | 1,000.00 | | | $ | 1,044.20 | | | $ | 5.93 | | | | 1.17 | |
| Small Cap Value Fund | | | | | | | | | | | | | | | | |
| Class N-actual return | | $ | 1,000.00 | | | $ | 1,162.23 | | | $ | 8.04 | | | | 1.50 | |
| Class N-hypothetical 5% return | | $ | 1,000.00 | | | $ | 1,042.56 | | | $ | 7.60 | | | | 1.50 | |
| Class I-actual return | | $ | 1,000.00 | | | $ | 1,163.87 | | | $ | 6.71 | | | | 1.25 | |
| Class I-hypothetical 5% return | | $ | 1,000.00 | | | $ | 1,043.80 | | | $ | 6.33 | | | | 1.25 | |
| Class R6-actual return (b) | | $ | 1,000.00 | | | $ | 992.30 | | | $ | 1.92 | | | | 1.17 | |
| Class R6-hypothetical 5% return (6 month period) | | $ | 1,000.00 | | | $ | 1,044.20 | | | $ | 5.93 | | | | 1.17 | |
| Global Leaders Fund | | | | | | | | | | | | | | | | |
| Class N-actual return | | $ | 1,000.00 | | | $ | 1,206.63 | | | $ | 6.84 | | | | 1.25 | |
| Class N-hypothetical 5% return | | $ | 1,000.00 | | | $ | 1,043.80 | | | $ | 6.33 | | | | 1.25 | |
| Class I-actual return | | $ | 1,000.00 | | | $ | 1,209.24 | | | $ | 5.48 | | | | 1.00 | |
| Class I-hypothetical 5% return | | $ | 1,000.00 | | | $ | 1,045.04 | | | $ | 5.07 | | | | 1.00 | |
| Class R6-actual return | | $ | 1,000.00 | | | $ | 1,209.24 | | | $ | 5.20 | | | | 0.95 | |
| Class R6-hypothetical 5% return | | $ | 1,000.00 | | | $ | 1,045.29 | | | $ | 4.82 | | | | 0.95 | |
| June 30, 2019 | William Blair Funds | 199 |
Fund Expenses (Unaudited)
| Expense Example | | Beginning
Account Value
1/1/2019 | | Ending
Account Value 06/30/2019 | | Expenses Paid
During
the Period (a) | | Annualized
Expense Ratio |
| International Leaders Fund | | | | | | | | | | | | | | | | |
| Class N-actual return | | $ | 1,000.00 | | | $ | 1,205.80 | | | $ | 6.67 | | | | 1.22 | % |
| Class N-hypothetical 5% return | | $ | 1,000.00 | | | $ | 1,043.95 | | | $ | 6.18 | | | | 1.22 | |
| Class I-actual return | | $ | 1,000.00 | | | $ | 1,206.65 | | | $ | 5.25 | | | | 0.96 | |
| Class I-hypothetical 5% return | | $ | 1,000.00 | | | $ | 1,045.24 | | | $ | 4.87 | | | | 0.96 | |
| Class R6-actual return | | $ | 1,000.00 | | | $ | 1,207.52 | | | $ | 4.98 | | | | 0.91 | |
| Class R6-hypothetical 5% return | | $ | 1,000.00 | | | $ | 1,045.49 | | | $ | 4.62 | | | | 0.91 | |
| International Developed Plus Fund (In Liquidation) | | | | | | | | | | | | | | | | |
| Class N-actual return | | $ | 1,000.00 | | | $ | 1,210.18 | | | $ | 6.85 | | | | 1.25 | |
| Class N-hypothetical 5% return | | $ | 1,000.00 | | | $ | 1,043.80 | | | $ | 6.33 | | | | 1.25 | |
| Class I-actual return | | $ | 1,000.00 | | | $ | 1,211.57 | | | $ | 5.48 | | | | 1.00 | |
| Class I-hypothetical 5% return | | $ | 1,000.00 | | | $ | 1,045.04 | | | $ | 5.07 | | | | 1.00 | |
| Institutional International Developed Plus Fund (In Liquidation) | | | | | | | | | | | | | | | | |
| Institutional-actual return | | $ | 1,000.00 | | | $ | 1,206.87 | | | $ | 4.92 | | | | 0.90 | |
| Institutional-hypothetical 5% return | | $ | 1,000.00 | | | $ | 1,045.54 | | | $ | 4.56 | | | | 0.90 | |
| International Growth Fund | | | | | | | | | | | | | | | | |
| Class N-actual return | | $ | 1,000.00 | | | $ | 1,192.71 | | | $ | 7.88 | | | | 1.45 | |
| Class N-hypothetical 5% return | | $ | 1,000.00 | | | $ | 1,042.81 | | | $ | 7.34 | | | | 1.45 | |
| Class I-actual return | | $ | 1,000.00 | | | $ | 1,194.40 | | | $ | 6.26 | | | | 1.15 | |
| Class I-hypothetical 5% return | | $ | 1,000.00 | | | $ | 1,044.30 | | | $ | 5.83 | | | | 1.15 | |
| Class R6-actual return (b) | | $ | 1,000.00 | | | $ | 1,021.04 | | | $ | 1.79 | | | | 1.08 | |
| Class R6-hypothetical 5% return (6 month period) | | $ | 1,000.00 | | | $ | 1,044.64 | | | $ | 5.48 | | | | 1.08 | |
| Institutional International Growth Fund | | | | | | | | | | | | | | | | |
| Institutional-actual return | | $ | 1,000.00 | | | $ | 1,194.03 | | | $ | 5.39 | | | | 0.99 | |
| Institutional-hypothetical 5% return | | $ | 1,000.00 | | | $ | 1,045.09 | | | $ | 5.02 | | | | 0.99 | |
| International Small Cap Growth Fund | | | | | | | | | | | | | | | | |
| Class N-actual return | | $ | 1,000.00 | | | $ | 1,187.26 | | | $ | 8.13 | | | | 1.50 | |
| Class N-hypothetical 5% return | | $ | 1,000.00 | | | $ | 1,042.56 | | | $ | 7.60 | | | | 1.50 | |
| Class I-actual return | | $ | 1,000.00 | | | $ | 1,189.47 | | | $ | 6.73 | | | | 1.24 | |
| Class I-hypothetical 5% return | | $ | 1,000.00 | | | $ | 1,043.85 | | | $ | 6.28 | | | | 1.24 | |
| Class R6-actual return | | $ | 1,000.00 | | | $ | 1,189.52 | | | $ | 6.13 | | | | 1.13 | |
| Class R6-hypothetical 5% return | | $ | 1,000.00 | | | $ | 1,044.40 | | | $ | 5.73 | | | | 1.13 | |
| Emerging Markets Leaders Fund | | | | | | | | | | | | | | | | |
| Class N-actual return | | $ | 1,000.00 | | | $ | 1,167.07 | | | $ | 8.06 | | | | 1.50 | |
| Class N-hypothetical 5% return | | $ | 1,000.00 | | | $ | 1,042.56 | | | $ | 7.60 | | | | 1.50 | |
| Class I-actual return | | $ | 1,000.00 | | | $ | 1,169.29 | | | $ | 6.72 | | | | 1.25 | |
| Class I-hypothetical 5% return | | $ | 1,000.00 | | | $ | 1,043.80 | | | $ | 6.33 | | | | 1.25 | |
| Class R6-actual return | | $ | 1,000.00 | | | $ | 1,169.49 | | | $ | 6.45 | | | | 1.20 | |
| Class R6-hypothetical 5% return | | $ | 1,000.00 | | | $ | 1,044.05 | | | $ | 6.08 | | | | 1.20 | |
| Emerging Markets Growth Fund | | | | | | | | | | | | | | | | |
| Class N-actual return | | $ | 1,000.00 | | | $ | 1,157.99 | | | $ | 8.13 | | | | 1.52 | |
| Class N-hypothetical 5% return | | $ | 1,000.00 | | | $ | 1,042.46 | | | $ | 7.70 | | | | 1.52 | |
| Class I-actual return | | $ | 1,000.00 | | | $ | 1,159.11 | | | $ | 6.80 | | | | 1.27 | |
| Class I-hypothetical 5% return | | $ | 1,000.00 | | | $ | 1,043.70 | | | $ | 6.44 | | | | 1.27 | |
| Class R6-actual return | | $ | 1,000.00 | | | $ | 1,159.47 | | | $ | 6.37 | | | | 1.19 | |
| Class R6-hypothetical 5% return | | $ | 1,000.00 | | | $ | 1,044.10 | | | $ | 6.03 | | | | 1.19 | |
| Emerging Markets Small Cap Growth Fund | | | | | | | | | | | | | | | | |
| Class N-actual return | | $ | 1,000.00 | | | $ | 1,088.83 | | | $ | 8.03 | | | | 1.55 | |
| Class N-hypothetical 5% return | | $ | 1,000.00 | | | $ | 1,042.31 | | | $ | 7.85 | | | | 1.55 | |
| Class I-actual return | | $ | 1,000.00 | | | $ | 1,089.74 | | | $ | 6.74 | | | | 1.30 | |
| Class I-hypothetical 5% return | | $ | 1,000.00 | | | $ | 1,043.55 | | | $ | 6.59 | | | | 1.30 | |
| Class R6-actual return | | $ | 1,000.00 | | | $ | 1,090.33 | | | $ | 6.48 | | | | 1.25 | |
| Class R6-hypothetical 5% return | | $ | 1,000.00 | | | $ | 1,043.80 | | | $ | 6.33 | | | | 1.25 | |
| 200 | Semiannual Report | June 30, 2019 |
Fund Expenses (Unaudited)
| Expense Example | | Beginning
Account Value
1/1/2019 | | Ending
Account Value 06/30/2019 | | Expenses Paid
During
the Period (a) | | Annualized
Expense Ratio |
| Bond Fund | | | | | | | | | | | | | | | | |
| Class N-actual return | | $ | 1,000.00 | | | $ | 1,080.40 | | | $ | 3.09 | | | | 0.60 | % |
| Class N-hypothetical 5% return | | $ | 1,000.00 | | | $ | 1,047.02 | | | $ | 3.05 | | | | 0.60 | |
| Class I-actual return | | $ | 1,000.00 | | | $ | 1,080.75 | | | $ | 2.32 | | | | 0.45 | |
| Class I-hypothetical 5% return | | $ | 1,000.00 | | | $ | 1,047.77 | | | $ | 2.28 | | | | 0.45 | |
| Class R6-actual return | | $ | 1,000.00 | | | $ | 1,081.09 | | | $ | 2.06 | | | | 0.40 | |
| Class R6-hypothetical 5% return | | $ | 1,000.00 | | | $ | 1,048.02 | | | $ | 2.03 | | | | 0.40 | |
| Income Fund | | | | | | | | | | | | | | | | |
| Class N-actual return | | $ | 1,000.00 | | | $ | 1,043.20 | | | $ | 4.31 | | | | 0.85 | |
| Class N-hypothetical 5% return | | $ | 1,000.00 | | | $ | 1,045.78 | | | $ | 4.31 | | | | 0.85 | |
| Class I-actual return | | $ | 1,000.00 | | | $ | 1,045.61 | | | $ | 3.55 | | | | 0.70 | |
| Class I-hypothetical 5% return | | $ | 1,000.00 | | | $ | 1,046.53 | | | $ | 3.55 | | | | 0.70 | |
| Class R6-actual return (b) | | $ | 1,000.00 | | | $ | 1,014.54 | | | $ | 1.08 | | | | 0.65 | |
| Class R6-hypothetical 5% return (6 month period) | | $ | 1,000.00 | | | $ | 1,046.78 | | | $ | 3.30 | | | | 0.65 | |
| Low Duration Fund | | | | | | | | | | | | | | | | |
| Class N-actual return | | $ | 1,000.00 | | | $ | 1,024.42 | | | $ | 2.76 | | | | 0.55 | |
| Class N-hypothetical 5% | | $ | 1,000.00 | | | $ | 1,047.27 | | | $ | 2.79 | | | | 0.55 | |
| Class I-actual return | | $ | 1,000.00 | | | $ | 1,025.21 | | | $ | 1.96 | | | | 0.39 | |
| Class I-hypothetical 5% | | $ | 1,000.00 | | | $ | 1,048.07 | | | $ | 1.98 | | | | 0.39 | |
| Class R6-actual return | | $ | 1,000.00 | | | $ | 1,025.42 | | | $ | 1.76 | | | | 0.35 | |
| Class R6-hypothetical 5% return | | $ | 1,000.00 | | | $ | 1,048.26 | | | $ | 1.78 | | | | 0.35 | |
| Macro Allocation Fund | | | | | | | | | | | | | | | | |
| Class N-actual return | | $ | 1,000.00 | | | $ | 1,024.54 | | | $ | 6.17 | | | | 1.23 | |
| Class N-hypothetical 5% | | $ | 1,000.00 | | | $ | 1,043.90 | | | $ | 6.23 | | | | 1.23 | |
| Class I-actual return | | $ | 1,000.00 | | | $ | 1,026.36 | | | $ | 4.92 | | | | 0.98 | |
| Class I-hypothetical 5% | | $ | 1,000.00 | | | $ | 1,045.14 | �� | | $ | 4.97 | | | | 0.98 | |
| Class R6-actual return | | $ | 1,000.00 | | | $ | 1,026.36 | | | $ | 4.52 | | | | 0.90 | |
| Class R6-hypothetical 5% return | | $ | 1,000.00 | | | $ | 1,045.54 | | | $ | 4.56 | | | | 0.90 | |
| (a) | Expenses are equal to the annualized expense ratio, multiplied by the average account value over the period, multiplied by the number of days in the period, 181 and divided by 365 (to reflect the one-half year period). |
| (b) | For the period May 2, 2019 (Commencement of Operations) to June 30, 2019. |
| June 30, 2019 | William Blair Funds | 201 |
| | BOARD OF TRUSTEES |
| | |
| | Vann A. Avedisian Principal, Highgate Holdings Kathleen T. Barr Retired Senior Managing Director, PNC Capital Advisors, LLC Stephanie G. Braming, Chairman and President Partner, William Blair Daniel N. Leib Chief Executive Officer, Donnelley Financial Solutions, Inc. Dorri C. McWhorter Chief Executive Officer, YWCA Metropolitan Chicago Arthur J. Simon Partner, William Blair Thomas J. Skelly Retired Managing Partner, Accenture Steven R. Zenz Retired Partner, KPMG LLP |
| | Officers |
| | Michael P. Balkin,Senior Vice President Thomas Clarke,Senior Vice President Daniel Crowe,Senior Vice President Robert J. Duwa,Senior Vice President Simon Fennell,Senior Vice President Andrew G. Flynn,Senior Vice President David C. Fording,Senior Vice President James S. Golan,Senior Vice President Chad M. Kilmer,Senior Vice President Robert C. Lanphier, IV,Senior Vice President Mark T. Leslie,Senior Vice President Kenneth J. McAtamney,Senior Vice President Todd M. McClone,Senior Vice President David Merjan,Senior Vice President David S. Mitchell,Senior Vice President John C. Murphy,Senior Vice President Casey K. Preyss,Senior Vice President David P. Ricci,Senior Vice President Ward D. Sexton,Senior Vice President Brian D. Singer,Senior Vice President Christopher T. Vincent,Senior Vice President Dan Zelanzy,Senior Vice President Lisa D. Rusch,Vice President Paul J. Sularz,Vice President Colette M. Garavalia,Treasurer Andrew T. Pfau,Secretary John M. Raczek,Assistant Treasurer Walter R. Randall, Jr.,Chief Compliance Officer and Assistant Secretary Robert J. Toner,Assistant Secretary Investment Adviser William Blair Investment Management, LLC Distributor William Blair & Company, L.L.C. Independent Registered Public Accounting Firm Ernst & Young LLP Legal Counsel Vedder Price P.C. Transfer Agent DST Asset Manager Solutions, Inc. (formerly known as Boston Financial Data Services, Inc.) For customer assistance, call 1-800-635-2886 P.O. Box 219137 Kansas City, Missouri 64121-9137 |
| 202 | Semiannual Report | June 30, 2019 |
| | | | | | |
| | William Blair Funds | | |
| | | | | | |
| | | | | | |
| | U.S. EQUITY | | GLOBAL EQUITY | | FIXED INCOME |
| | Growth Fund | | Global Leaders Fund | | Bond Fund |
| | Large Cap Growth Fund | | | | Income Fund |
| | Mid Cap Growth Fund | | INTERNATIONAL EQUITY | | Low Duration Fund |
| | Small-Mid Cap Growth Fund | | International Leaders Fund | | |
| | Small-Mid Cap Value Fund | | International Developed Plus Fund | | MULTI-ASSET AND |
| | Small Cap Growth Fund | | Institutional International Developed Plus Fund | | ALTERNATIVE |
| | Small Cap Value Fund | | International Growth Fund | | Macro Allocation Fund |
| | | | Institutional International Growth Fund | | |
| | | | International Small Cap Growth Fund | | |
| | | | Emerging Markets Leaders Fund | | |
| | | | Emerging Markets Growth Fund | | |
| | | | Emerging Markets Small Cap Growth Fund | | |
 | | © | William Blair & Company, L.L.C., distributor | |
| +1 800 742 7272 | | 150 North Riverside Plaza | |
| williamblairfunds.com | | Chicago, Illinois 60606 | 00103188 |
Not applicable to this filing.
| Item 3. | Audit Committee Financial Expert |
Not applicable to this filing.
| Item 4. | Principal Accountant Fees and Services |
Not applicable to this filing.
| Item 5. | Audit Committee of Listed Registrants |
Not Applicable to this Registrant, insofar as the Registrant is not a listed company.
| Item 6. | Schedule of Investments |
See Schedule of Investments in Item 1.
| Item 7. | Disclosure of Proxy Voting Policies and Procedures for Closed-End Management Investment Companies |
Not applicable to this Registrant, insofar as the Registrant is not a closed-end management investment company.
| Item 8. | Portfolio Managers of Closed Investment Companies |
Not applicable to this Registrant, insofar as the Registrant is not a closed-end management investment company.
| Item 9. | Purchase of Equity Securities by Closed-End Management Investment Companies and Affiliated Purchasers |
Not applicable to this Registrant, insofar as the Registrant is not a closed-end management investment company.
| Item 10. | Submission of Matters to a Vote of Security Holders |
There have been no material changes to the procedures by which shareholders may recommend nominees to the Registrant’s Board of Trustees since the Registrant last provided disclosure in response to this item.
Controls and Procedures
(a) The Registrant’s principal executive and principal financial officer, or persons performing similar functions, have concluded that the Registrant’s Disclosure Controls and Procedures (as defined in Rule 30a-3(c) under the Investment Company Act of 1940, as amended (the “1940 Act”) (17 CFR 270.30a-3(c)) are effective, as of a date within 90 days of the filing date of this report that includes the disclosure required by this paragraph, based on their evaluation of these controls and procedures required by Rule 30a-3 (b) under the 1940 Act (17 CFR 270.30a-3(b) and Rules 13a-15(b) or 15d-15(b) under the Exchange Act (17 CFR 240.13a-15(b) or 240.15d-15(b)).
(b) There were no changes in the Registrant’s internal control over financial reporting (as defined in Rule 30a-3(d) under the 1940 Act (17 CFR 270.30a-3(d)) that occurred during the final quarter of the period covered by this report that has materially affected, or is reasonably likely to materially affect, the Registrant’s internal control over financial reporting.
| Item 12. | Disclosure of Securities Lending Activities for Closed-End Management Investment Companies |
Not applicable to this Registrant, insofar as the Registrant is not a closed-end management investment company.
13. (a) (1) Code of Ethics
Not applicable to this filing.
13. (a) (2) (1)
Certification of Principal Executive Officer Required by Rule 30a-2(a) of the Investment Company Act is filed as an exhibit hereto.
13. (a) (2) (2)
Certification of Principal Financial Officer Required by Rule 30a-2(a) of the Investment Company Act is filed as an exhibit hereto.
13. (a) (3)
Not applicable to this Registrant.
13. (a) (4)
Not applicable to this filing.
13. (b)
Certifications of the Principal Executive Officer and Principal Financial Officer of the issuer as required by Rule 30a-2(b) of the Investment Company Act of 1940 are filed as exhibits hereto.
SIGNATURES
Pursuant to the requirements of the Securities Exchange Act of 1934 and the Investment Company Act of 1940, the Registrant has duly caused this report to be signed on its behalf by the undersigned, thereunto duly authorized.
| | | William Blair Funds |
| | |
| | | /s/ Stephanie G. Braming |
| By: | | Stephanie G. Braming |
| | | President (Principal Executive Officer) |
Date: August 29, 2019
Pursuant to the requirements of the Securities Exchange Act of 1934 and the Investment Company Act of 1940, this report has been signed below by the following persons on behalf of the Registrant and in the capacities and on the dates indicated.
| | | /s/ Stephanie G. Braming |
| By: | | Stephanie G. Braming |
| | | President (Principal Executive Officer) |
Date: August 29, 2019
| | | /s/ Colette M. Garavalia |
| By: | | Colette M. Garavalia |
| | | Treasurer (Principal Financial Officer) |
Date: August 29, 2019