UNITED STATES
SECURITIES AND EXCHANGE COMMISSION
Washington, D.C. 20549
Form N-CSR
CERTIFIED SHAREHOLDER REPORT OF REGISTERED
MANAGEMENT INVESTMENT COMPANIES
Investment Company Act File Number 811-5344
William Blair Funds
(Exact name of registrant as specified in charter)
| 150 North Riverside Plaza, Chicago, IL | | 60606 |
| (Address of principal executive offices) | | (Zip Code) |
Stephanie G. Braming, Principal Executive Officer
William Blair Funds
150 North Riverside Plaza, Chicago, IL 60606
(Name and address of agent for service)
Registrant’s telephone number, including area code: 312-236-1600
Date of fiscal year end: December 31
Date of reporting period: June 30, 2022
Item 1. June 30, 2022 Semiannual Reports transmitted to shareholders.
 | |
| | |
| | |
| | |
| | |
| | |
| | |
| | |
| | June 30, 2022 |
William Blair Funds
Semiannual Report | |
| | | | |
| | | | |
| | | | |
| | | | |
| | | | |
| | | | |
| | | | |
| | | | |
| | | | |
| | | | |
| | | | |
| | | | |
| June 30, 2022 | William Blair Funds | 1 |
The views expressed in the commentary for each Fund reflect those of the portfolio management team only through the end of the period of the report as stated on the cover. The portfolio management team’s views are subject to change at any time based on market and other conditions and should not be construed as a recommendation. Statements involving predictions, assessments, analyses, or outlook for individual securities, industries, market sectors, and/or markets involve risks and uncertainties, and there is no guarantee they will come to pass.
This report is submitted for the general information of the shareholders of William Blair Funds. It is not authorized for distribution to prospective Fund investors unless accompanied or preceded by the Fund’s prospectus. Please carefully consider a Fund’s investment objectives, risks, charges, and expenses before investing. This and other information is contained in the Fund’s prospectus, which you may obtain by calling 1-800-742-7272. Read it carefully before you invest or send money.
| 2 | Semiannual Report | June 30, 2022 |
U.S. Growth & Core Market Review and Outlook
Following the first quarter of 2022 equity market decline, performance of U.S. equity indices worsened during the second quarter. Using the S&P 500 Index as a proxy for U.S. equity market performance, it was the weakest first half of a year since 1970.
In a volatile first quarter, the Omicron wave, inflation concerns, and the invasion of Ukraine weighed on equity valuations. Elevated inflation drove expectations for faster monetary tightening by the Federal Open Market Committee (FOMC) and corresponded with a rise in 10-year U.S. Treasury bond yields and U.S. mortgage rates. During March, the FOMC increased the target federal funds rate by 25 basis points for the first increase in this cycle.
The second quarter was characterized by tightening financial conditions and weakening economic data. The Consumer Price Index hit a multi-decade high and the Federal Reserve (Fed) implemented two additional rate increases. In total, the Fed raised rates by 150 basis points year-to-date, and signaled further increases for the balance of the year. With record-high gas prices, elevated mortgage rates, lower asset prices and higher food costs, consumer sentiment declined in the second quarter. Other economic data points, including U.S. manufacturing trends and housing-related indicators, also weakened. While these dynamics pressured stock prices, U.S. corporate earnings remained solid.
Recent data points suggest a slow-down in economic activity relative to the extremely strong levels experienced in 2021. Supply chain disruptions present continued challenges as over-ordering amid shortages is now yielding excessive inventories in some pockets of the economy. U.S. consumers are increasingly feeling the pressures of inflation, dampening real income and confidence, while a supportive labor market and healthy post-COVID demand for experiential purchases remain bright spots.
With the backdrop of inflationary pressures and rising interest rates, equity market weakness year-to-date has been driven primarily by valuation compression while corporate earnings have exhibited resilience thus far. It is broadly anticipated that in the coming quarters, corporate earnings will begin to reflect the challenges observed in other parts of the economy.
As investor focus shifts from higher rates to the potential for an economic slowdown, we believe it is increasingly likely that investors will differentiate among stocks on the basis of quality attributes, such as the durability of margins and earnings, and growth, as fewer companies will exhibit that characteristic. In our view, companies with these attributes are in a better position than many of their peers to navigate turbulence. We believe our philosophy of identifying durable growth businesses whose stocks present attractive risk/reward opportunities should add value in this economic environment.
| June 30, 2022 | William Blair Funds | 3 |
U.S. Value Market Review and Outlook
The first half of 2022 was historically challenging for U.S. small cap investors, as the 23.43% decline in the Russell 2000 Index was its worst quarterly decline ever. Small cap value shares, which declined 17.3%, fared somewhat better, but the loss was nonetheless severe. The markets were weak throughout the first half of 2022 as the Federal Reserve (Fed) became increasingly hawkish even as the economy began to show increasing strains such as declining consumer confidence and manufacturing activity. The watershed moment in the second quarter was the June Consumer Price Index reading of 8.6%, a 40 year high, followed by the Fed’s aggressive 75 basis point increase in its policy rate. The market has concluded that the Fed is willing to induce an economic recession to cool inflation. In our view, the near-term trajectory of the stock market will depend on the level and direction of inflation. As discussed above, the Fed has put its price stability mandate ahead of its employment mandate. Thus, the longer inflation remains elevated, the more likely it becomes in our view that the Fed’s actions will result in a recession for the U.S. economy. The good news is that, in our view, there are growing signs that inflation has peaked and that the Fed’s recent rate moves and future signaling are beginning to work. Even oil and agricultural commodity prices, which are beyond the Fed’s control, have begun to ease as of late.
During this period of economic uncertainty, we are comforted by the historically low valuation of the Small Cap Value Fund’s holdings, which trade at just 10.2x estimated earnings for the next twelve months. We agree with the growing number of commentators arguing that earnings estimates for many companies are too high, but much of this is already discounted in current prices. If estimates prove to be 30% too high, this still leaves the portfolio trading for just 14.3x earnings, a level in line with the historical average for small cap value shares. Of course, one can never be certain what exactly is priced into the market, but the upcoming reporting season is likely to give us a clearer picture.
| 4 | Semiannual Report | June 30, 2022 |
| | Growth Fund |
| | |
| | The Growth Fund seeks long-term capital appreciation. |
| | |
| | AN OVERVIEW FROM THE PORTFOLIO MANAGER |
| | |

David C. Fording, CFA | The William Blair Growth Fund (Class N shares) (the “Fund”) posted a 28.54% decrease, net of fees, for the six months ended June 30, 2022. By comparison, the Fund’s benchmark index, the Russell 3000® Growth Index (the “Index”), decreased 28.15%. For the year-to-date period, style factors and stock-specific dynamics were largely offsetting. From a style standpoint, our emphasis on longer duration growth companies was a headwind as companies with lower growth characteristics outperformed during the period. From a stock-specific perspective, Information Technology holdings PayPal Holdings and Advanced Micro Devices, as well as not owning Apple, detracted from relative returns. Shares of PayPal declined due to forward looking revenue guidance that was below expectations, driven in part by e-commerce spending headwinds. Stock selection in Consumer Discretionary, including our positions in Farfetch and Burlington Stores, and Industrials, including our position in Kornit Digital, also dampened performance. Among top contributors were UnitedHealth (Health Care), New Fortress (Energy), Coca-Cola (Consumer Staples) and Mastercard (Information Technology). Positive stock selection in Communication Services, including our position in Zynga and not owning Meta Platforms, also added value during the period. Shares of Meta Platforms lagged due to slowing advertising revenue growth; thus, not owning this laggard resulted in a tailwind to relative performance. Please refer to the U.S. Growth & Core Market Review and Outlook relating to the Fund on page 3. |
| June 30, 2022 | William Blair Funds | 5 |
Growth Fund
Performance Highlights (Unaudited)
Average Annual Total Returns through 6/30/2022
| | | Year to
Date | | 1 Year | | 3 Year | | 5 Year | | 10 Year | | Since
Inception(a) |
| Class N | | | (28.54 | )% | | | (22.85 | )% | | | 8.56 | % | | | 12.97 | % | | | 12.54 | % | | | — | % |
| Class I | | | (28.44 | ) | | | (22.58 | ) | | | 8.87 | | | | 13.29 | | | | 12.89 | | | | — | |
| Class R6 | | | (28.36 | ) | | | (22.52 | ) | | | 8.98 | | | | — | | | | — | | | | 9.36 | |
| Russell 3000® Growth Index | | | (28.15 | ) | | | (19.78 | ) | | | 11.84 | | | | 13.63 | | | | 14.41 | | | | 11.46 | |
| S&P 500® Index | | | (19.96 | ) | | | (10.62 | ) | | | 10.60 | | | | 11.31 | | | | 12.96 | | | | 10.36 | |
| | |
| (a) | Since inception is for the period from May 2, 2019 (Commencement of Operations) to June 30, 2022. |
Performance cited represents past performance. Past performance does not guarantee future results and current performance may be lower or higher than the data quoted. Results shown are average annual total returns, which assume reinvestment of dividends and capital gains. Investment returns and principal will fluctuate and you may have a gain or loss when you sell shares. For the most current month-end performance information, please call 1-800-742-7272, or visit our Web site at www.williamblairfunds.com. From time to time, the investment adviser may waive fees or reimburse expenses for the Fund. Without these waivers/reimbursements, performance would be lower. Class N shares are not subject to a sales load. Class I shares are not subject to a sales load or distribution (Rule 12b-1) fees. Class R6 shares are not subject to a sales load, distribution (Rule 12b-1) fees, or sub-transfer agent fees.
The performance highlights and graph presented above do not reflect the deduction of taxes that a shareholder would pay on fund distributions or the redemption of fund shares.
The Russell 3000® Growth Index consists of large, medium, and small capitalization companies with above average price-to-book ratios and forecasted growth rates. The index is weighted by market capitalization and large/medium/small companies make up approximately 80%/15%/5% of the index.
The S&P 500® Index indicates broad larger capitalization equity market performance.
This report identifies the Fund’s investments on June 30, 2022. These holdings are subject to change. Not all stocks in the Fund performed the same, nor is there any guarantee that these stocks will perform as well in the future. Market forecasts provided in this report may not necessarily come to pass.
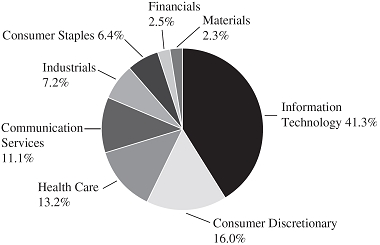
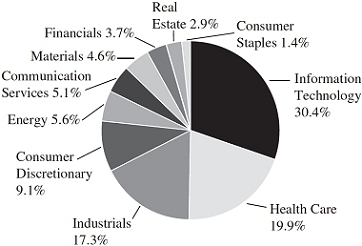
Sector Diversification (Unaudited)

The sector diversification shown is based on the total long-term securities.
| 6 | Semiannual Report | June 30, 2022 |
Growth Fund
Portfolio of Investments, June 30, 2022 (all dollar amounts in thousands) (unaudited)
| | | | | | | | |
| | | | | | | | |
| | Issuer | | Shares | | | Value | |
| | | | | | | | | | |
| | Common Stocks | | | | | | | | |
| | Information Technology—35.6% | | | | | | | | |
| * | Adobe, Inc. | | | 13,866 | | | $ | 5,076 | |
| * | Advanced Micro Devices, Inc. | | | 53,884 | | | | 4,121 | |
| * | Dynatrace, Inc. | | | 54,015 | | | | 2,130 | |
| | Fidelity National Information Services, Inc. | | | 47,287 | | | | 4,335 | |
| | Mastercard, Inc. | | | 33,762 | | | | 10,651 | |
| | Microsoft Corporation | | | 88,325 | | | | 22,685 | |
| * | MongoDB, Inc. | | | 5,491 | | | | 1,425 | |
| | National Instruments Corporation | | | 101,961 | | | | 3,184 | |
| * | Nice, Ltd.—ADR | | | 13,143 | | | | 2,529 | |
| | NVIDIA Corporation | | | 33,666 | | | | 5,103 | |
| * | PayPal Holdings, Inc. | | | 43,495 | | | | 3,038 | |
| * | Pure Storage, Inc. | | | 153,195 | | | | 3,939 | |
| | Texas Instruments, Inc. | | | 32,157 | | | | 4,941 | |
| * | Verra Mobility Corporation | | | 236,237 | | | | 3,711 | |
| * | Workday, Inc. | | | 20,977 | | | | 2,928 | |
| | | | | | | | | 79,796 | |
| | Health Care—14.9% | | | | | | | | |
| | Agilent Technologies, Inc. | | | 16,118 | | | | 1,914 | |
| | Azenta, Inc. | | | 22,676 | | | | 1,635 | |
| * | HealthEquity, Inc. | | | 36,344 | | | | 2,231 | |
| * | Horizon Therapeutics plc† | | | 39,546 | | | | 3,154 | |
| * | Intuitive Surgical, Inc. | | | 13,959 | | | | 2,802 | |
| * | Penumbra, Inc. | | | 9,955 | | | | 1,240 | |
| | STERIS plc† | | | 15,821 | | | | 3,261 | |
| | Stryker Corporation | | | 17,276 | | | | 3,437 | |
| | UnitedHealth Group, Inc. | | | 14,561 | | | | 7,479 | |
| * | Veeva Systems, Inc. | | | 13,229 | | | | 2,620 | |
| | Zoetis, Inc. | | | 20,796 | | | | 3,575 | |
| | | | | | | | | 33,348 | |
| | Consumer Discretionary—12.8% | | | | | | | | |
| * | Amazon.com, Inc. | | | 135,280 | | | | 14,368 | |
| * | Bright Horizons Family Solutions, Inc. | | | 34,962 | | | | 2,955 | |
| * | Burlington Stores, Inc. | | | 15,683 | | | | 2,136 | |
| * | Etsy, Inc. | | | 14,461 | | | | 1,059 | |
| * | Farfetch, Ltd.† | | | 126,695 | | | | 907 | |
| | NIKE, Inc. | | | 37,479 | | | | 3,830 | |
| * | Overstock.com, Inc. | | | 24,256 | | | | 607 | |
| * | Revolve Group, Inc. | | | 44,008 | | | | 1,140 | |
| * | Skyline Champion Corporation | | | 37,845 | | | | 1,795 | |
| | | | | | | | | 28,797 | |
| | Communication Services—11.1% | | | | | | | | |
| * | Alphabet, Inc. Class “A” | | | 7,966 | | | | 17,360 | |
| * | Take-Two Interactive Software, Inc. | | | 23,031 | | | | 2,822 | |
| | Warner Music Group Corporation | | | 127,039 | | | | 3,094 | |
| * | ZipRecruiter, Inc. | | | 115,511 | | | | 1,712 | |
| | | | | | | | | 24,988 | |
| | Industrials—6.9% | | | | | | | | |
| * | ACV Auctions, Inc. | | | 100,855 | | | | 659 | |
| * | Copart, Inc. | | | 41,440 | | | | 4,503 | |
| * | CoStar Group, Inc. | | | 43,099 | | | | 2,604 | |
| * | Energy Recovery, Inc. | | | 124,874 | | | | 2,425 | |
| * | Kornit Digital, Ltd.† | | | 19,671 | | | | 623 | |
| | The Brink’s Co. | | | 56,531 | | | | 3,432 | |
| * | Trex Co., Inc. | | | 20,465 | | | | 1,114 | |
| | | | | | | | | 15,360 | |
| | Issuer | | Shares or
Principal
Amount | | | Value | |
| | | | | | | | | | |
| | Common Stocks—(continued) | | | | | | | | |
| | Consumer Staples—5.7% | | | | | | | | |
| * | Performance Food Group Co. | | | 73,913 | | | $ | 3,399 | |
| | The Coca-Cola Co. | | | 98,998 | | | | 6,228 | |
| | The Estee Lauder Cos., Inc. | | | 12,523 | | | | 3,189 | |
| | | | | | | | | 12,816 | |
| | Energy—4.0% | | | | | | | | |
| | Cameco Corporation | | | 192,384 | | | | 4,044 | |
| * | Green Plains, Inc. | | | 67,237 | | | | 1,827 | |
| | New Fortress Energy, Inc. | | | 80,964 | | | | 3,203 | |
| | | | | | | | | 9,074 | |
| | Financials—3.3% | | | | | | | | |
| | Aon plc† | | | 11,264 | | | | 3,038 | |
| | Ares Management Corporation | | | 49,657 | | | | 2,823 | |
| | Bridge Investment Group Holdings, Inc. | | | 98,524 | | | | 1,433 | |
| | | | | | | | | 7,294 | |
| | Real Estate—2.0% | | | | | | | | |
| | SBA Communications Corporation | | | 9,047 | | | | 2,895 | |
| * | Zillow Group, Inc. | | | 46,852 | | | | 1,488 | |
| | | | | | | | | 4,383 | |
| | Materials—1.8% | | | | | | | | |
| | Ball Corporation | | | 57,375 | | | | 3,946 | |
| | Total Common Stocks—98.1%
(cost $158,474) | | | | | | | 219,802 | |
| | | | | | | | | | |
| | Repurchase Agreement | | | | | | | | |
| | Fixed Income Clearing Corporation, 0.240% dated 6/30/22, due 7/1/22, repurchase price $4,963, collateralized by U.S. Treasury Note, 1.250%, due 06/30/28, valued at $5,062 | | | $4,963 | | | | 4,963 | |
| | Total Repurchase Agreement—2.2%
(cost $4,963) | | | | | | | 4,963 | |
| | Total Investments—100.3%
(cost $163,437) | | | | | | | 224,765 | |
| | Liabilities, plus cash and other assets—(0.3)% | | | | | | | (709 | ) |
| | Net assets—100.0% | | | | | | $ | 224,056 | |
ADR = American Depository Receipt
* = Non-income producing security
† = U.S. listed foreign security
See accompanying Notes to Financial Statements.
| June 30, 2022 | William Blair Funds | 7 |
| | Large Cap Growth Fund |
| | |
| | The Large Cap Growth Fund seeks long-term capital appreciation. |
| | |
| | AN OVERVIEW FROM THE PORTFOLIO MANAGERS |
| | |

James S. Golan, CFA 
David P. Ricci, CFA | The William Blair Large Cap Growth Fund (Class N shares) (the “Fund”) posted a 31.81% decrease, net of fees, for the six months ended June 30, 2022. By comparison, the Fund’s benchmark index, the Russell 1000® Growth Index (the “Index”), decreased 28.07%. The Fund underperformed the Index during the period. Trailing returns on a year-to-date basis were driven by a combination of style factors and stock-specific dynamics. From a style standpoint, our emphasis on longer duration growth companies was a headwind as companies with lower growth characteristics outperformed during the period. From a stock-specific perspective, selection in Information Technology, including our positions in PayPal Holdings, Unity Software and Advanced Micro Devices, as well as not owning Apple, detracted from relative returns. Shares of PayPal declined due to forward looking revenue guidance that was below expectations, driven in part by e-commerce spending headwinds. Other top detractors were Netflix (Communication Services) and Amazon.com (Consumer Discretionary). Netflix reported a decline in subscribers and announced related business initiatives in hope of re-igniting subscriber growth. Top contributors for the year-to-date period included UnitedHealth (Health Care) and Mastercard (Information Technology), largely due to the reasons outlined above. Other notable outperformers included Costco (Consumer Staples), Marriott (Consumer Discretionary) and Linde (Materials). Our decision to not own Meta Platforms (Communication Services) also aided relative returns as shares lagged due to slowing advertising revenue growth. Please refer to the U.S. Growth & Core Market Review and Outlook relating to the Fund on page 3. |
| 8 | Semiannual Report | June 30, 2022 |
Large Cap Growth Fund
Performance Highlights (Unaudited)
| Average Annual Total Returns through 6/30/2022 |
| | | Year to
Date | | 1 Year | | 3 Year | | 5 Year | | 10 Year | | Since
Inception(a) |
| Class N | | | (31.81 | )% | | | (23.54 | )% | | | 9.25 | % | | | 14.62 | % | | | 14.56 | % | | | — | % |
| Class I | | | (31.74 | ) | | | (23.34 | ) | | | 9.52 | | | | 14.89 | | | | 14.85 | | | | — | |
| Class R6 | | | (31.73 | ) | | | (23.32 | ) | | | 9.56 | | | | — | | | | — | | | | 10.41 | |
| Russell 1000® Growth Index | | | (28.07 | ) | | | (18.77 | ) | | | 12.58 | | | | 14.29 | | | | 14.80 | | | | 12.17 | |
| (a) | Since inception is for the period from May 2, 2019 (Commencement of Operations) to June 30, 2022. |
Performance cited represents past performance. Past performance does not guarantee future results and current performance may be lower or higher than the data quoted. Results shown are average annual total returns, which assume reinvestment of dividends and capital gains. Investment returns and principal will fluctuate and you may have a gain or loss when you sell shares. For the most current month-end performance information, please call 1-800-742-7272, or visit our Web site at www.williamblairfunds.com. From time to time, the investment adviser may waive fees or reimburse expenses for the Fund. Without these waivers/reimbursements, performance would be lower. Class N shares are not subject to a sales load. Class I shares are not subject to a sales load or distribution (Rule 12b-1) fees. Class R6 shares are not subject to a sales load, distribution (Rule 12b-1) fees, or sub-transfer agent fees.
The performance highlights and graph presented above do not reflect the deduction of taxes that a shareholder would pay on fund distributions or the redemption of fund shares.
The Russell 1000® Growth Index consists of large capitalization companies with above average price-to-book ratios and forecasted growth rates.
This report identifies the Fund’s investments on June 30, 2022. These holdings are subject to change. Not all stocks in the Fund performed the same, nor is there any guarantee that these stocks will perform as well in the future. Market forecasts provided in this report may not necessarily come to pass.
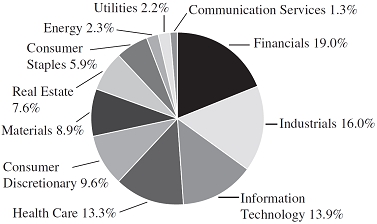
Sector Diversification (Unaudited)
The sector diversification shown is based on the total long-term securities.
| June 30, 2022 | William Blair Funds | 9 |
Large Cap Growth Fund
Portfolio of Investments, June 30, 2022 (all dollar amounts in thousands) (unaudited)
| | | | | | | | |
| | | | | | |
| | Issuer | | Shares | | | Value | |
| | | | | | | | | | |
| | Common Stocks | | | | | | | | |
| | Information Technology—40.7% | | | | | | | | |
| | Accenture plc† | | | 126,290 | | | $ | 35,064 | |
| * | Adobe, Inc. | | | 66,060 | | | | 24,182 | |
| * | Advanced Micro Devices, Inc. | | | 159,088 | | | | 12,166 | |
| * | Guidewire Software, Inc. | | | 173,670 | | | | 12,329 | |
| | Intuit, Inc. | | | 73,070 | | | | 28,164 | |
| | Lam Research Corporation | | | 40,650 | | | | 17,323 | |
| | Mastercard, Inc. | | | 183,510 | | | | 57,894 | |
| | Microsoft Corporation | | | 573,890 | | | | 147,392 | |
| | NVIDIA Corporation | | | 184,840 | | | | 28,020 | |
| * | PayPal Holdings, Inc. | | | 334,320 | | | | 23,349 | |
| * | salesforce.com, Inc. | | | 148,980 | | | | 24,588 | |
| | Texas Instruments, Inc. | | | 129,290 | | | | 19,865 | |
| * | Unity Software, Inc. | | | 220,050 | | | | 8,102 | |
| | | | | | | | | 438,438 | |
| | Consumer Discretionary—15.8% | | | | | | | | |
| * | Amazon.com, Inc. | | | 784,100 | | | | 83,279 | |
| | Marriott International, Inc. | | | 241,900 | | | | 32,901 | |
| | NIKE, Inc. | | | 245,070 | | | | 25,046 | |
| | Starbucks Corporation | | | 381,700 | | | | 29,158 | |
| | | | | | | | | 170,384 | |
| | Health Care—13.0% | | | | | | | | |
| * | ABIOMED, Inc. | | | 77,738 | | | | 19,241 | |
| | Stryker Corporation | | | 130,460 | | | | 25,952 | |
| | UnitedHealth Group, Inc. | | | 111,140 | | | | 57,085 | |
| * | Veeva Systems, Inc. | | | 26,980 | | | | 5,343 | |
| | Zoetis, Inc. | | | 188,670 | | | | 32,431 | |
| | | | | | | | | 140,052 | |
| | Communication Services—10.9% | | | | | | | | |
| * | Alphabet, Inc. Class “A” | | | 37,200 | | | | 81,068 | |
| * | Alphabet, Inc. Class “C” | | | 4,330 | | | | 9,472 | |
| * | Live Nation Entertainment, Inc. | | | 327,150 | | | | 27,016 | |
| | | | | | | | | 117,556 | |
| | Industrials—7.1% | | | | | | | | |
| * | Copart, Inc. | | | 298,090 | | | | 32,390 | |
| * | CoStar Group, Inc. | | | 396,620 | | | | 23,960 | |
| | Equifax, Inc. | | | 110,300 | | | | 20,161 | |
| | | | | | | | | 76,511 | |
| | Consumer Staples—6.4% | | | | | | | | |
| | Costco Wholesale Corporation | | | 95,540 | | | | 45,791 | |
| | The Estee Lauder Cos., Inc. | | | 88,920 | | | | 22,645 | |
| | | | | | | | | 68,436 | |
| | Financials—2.4% | | | | | | | | |
| | Apollo Global Management, Inc. | | | 539,150 | | | | 26,138 | |
| | Materials—2.2% | | | | | | | | |
| | Linde plc† | | | 83,910 | | | | 24,126 | |
| | Total Common Stocks—98.5%
(cost $1,090,689) | | | | | | | 1,061,641 | |
| | | | | | | | | | |
| | Issuer | | Principal
Amount | | | Value | |
| | | | | | | | | | |
| | Repurchase Agreement | | | | | | | | |
| | Fixed Income Clearing Corporation, 0.240% dated 6/30/22, due 7/1/22, repurchase price $13,037, collateralized by U.S. Treasury Bond, 3.000%, due 02/15/49, valued at $13,297 | | | $13,037 | | | $ | 13,037 | |
| | Total Repurchase Agreement—1.2%
(cost $13,037) | | | | | | | 13,037 | |
| | Total Investments—99.7%
(cost $1,103,726) | | | | | | | 1,074,678 | |
| | Cash and other assets, less liabilities—0.3% | | | | | | | 2,964 | |
| | Net assets—100.0% | | | | | | $ | 1,077,642 | |
† = U.S. listed foreign security
* = Non-income producing security
See accompanying Notes to Financial Statements.
| 10 | Semiannual Report | June 30, 2022 |
| | Mid Cap Growth Fund |
| | |
| | The Mid Cap Growth Fund seeks long-term capital appreciation. |
| | |
| | AN OVERVIEW FROM THE PORTFOLIO MANAGERS |
| | |

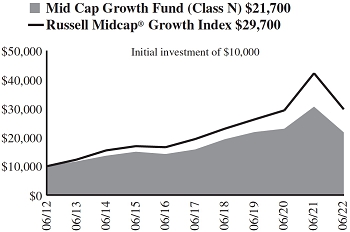
Daniel Crowe, CFA 
James E. Jones, CFA | The William Blair Mid Cap Growth Fund (Class N shares) (the “Fund”) posted a 32.05% decrease, net of fees, for the six months ended June 30, 2022. By comparison, the Fund’s benchmark index, the Russell Midcap® Growth Index (the “Index”), decreased 31.00%. The Fund modestly trailed the Index in the year-to-date period. Relative performance was driven by both style factors and stock-specific dynamics. From a style perspective, similar to second quarter dynamics, our emphasis on longer duration growth companies was a headwind. From a stock-specific perspective, our top individual detractors included Coupa Software (Information Technology), Align Technology (Health Care) and Burlington Stores (Consumer Discretionary). Coupa Software, provider of a cloud-based business spend management platform, reported a slowdown of demand in Europe, primarily due to the ongoing Russia/Ukraine crisis. Stock selection in Consumer Discretionary, including our positions in Farfetch and Etsy, was also a detractor. Farfetch is a leading e-commerce marketplace focused on the luxury market whose shares were pressured by macro-related issues, including the company’s exposure to consumers in Europe and China, and difficult year-over-year comparisons. Conversely, our top individual contributors included New Fortress Energy (Energy), BWX Technologies (Industrials) and Veeva Systems (Health Care). New Fortress Energy develops, finances and constructs liquified natural gas assets and related infrastructure. The company announced a number of project milestones and shares were further supported by a strong backdrop to sign new deals. Shares of BWX Technologies advanced for the reasons outlined above. Stock selection in Information Technology, including our positions in SolarEdge Technologies and Teledyne Technologies, contributed positively to relative returns. Please refer to the U.S. Growth & Core Market Review and Outlook relating to the Fund on page 3. |
| June 30, 2022 | William Blair Funds | 11 |
Mid Cap Growth Fund
Performance Highlights (Unaudited)
| Average Annual Total Returns through 6/30/2022 |
| | | Year to
Date | | 1 Year | | 3 Year | | 5 Year | | 10 Year | | Since
Inception(a) |
| Class N | | | (32.05 | )% | | | (29.08 | )% | | | (0.19 | )% | | | 6.54 | % | | | 8.06 | % | | | — | % |
| Class I | | | (31.97 | ) | | | (28.84 | ) | | | 0.07 | | | | 6.81 | | | | 8.34 | | | | — | |
| Class R6 | | | (31.93 | ) | | | (28.80 | ) | | | 0.14 | | | | — | | | | — | | | | 0.76 | |
| Russell Midcap® Growth Index | | | (31.00 | ) | | | (29.57 | ) | | | 4.25 | | | | 8.88 | | | | 11.50 | | | | 4.67 | |
| (a) | Since inception is for the period from May 2, 2019 (Commencement of Operations) to June 30, 2022. |
Performance cited represents past performance. Past performance does not guarantee future results and current performance may be lower or higher than the data quoted. Results shown are average annual total returns, which assume reinvestment of dividends and capital gains. Investment returns and principal will fluctuate and you may have a gain or loss when you sell shares. For the most current month-end performance information, please call 1-800-742-7272, or visit our Web site at www.williamblairfunds.com. Investing in medium capitalization companies involves special risks, including higher volatility and lower liquidity. Medium capitalization stocks are also more sensitive to purchase/sale transactions and changes in the issuer’s financial condition. From time to time, the investment adviser may waive fees or reimburse expenses for the Fund. Without these waivers/reimbursements, performance would be lower. Class N shares are not subject to a sales load. Class I shares are not subject to a sales load or distribution (Rule 12b-1) fees. Class R6 shares are not subject to a sales load, distribution (Rule 12b-1) fees, or sub-transfer agent fees.
The performance highlights and graph presented above do not reflect the deduction of taxes that a shareholder would pay on fund distributions or the redemption of fund shares.
The Russell Midcap® Growth Index is an index that is constructed to provide a comprehensive and unbiased barometer of the mid-cap growth market.
This report identifies the Fund’s investments on June 30, 2022. These holdings are subject to change. Not all stocks in the Fund performed the same, nor is there any guarantee that these stocks will perform as well in the future. Market forecasts provided in this report may not necessarily come to pass.
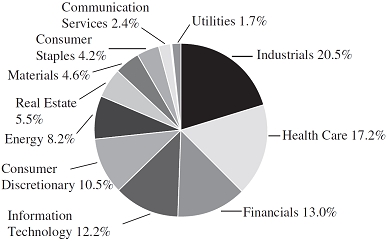
Sector Diversification (Unaudited)
The sector diversification shown is based on the total long-term securities.
| 12 | Semiannual Report | June 30, 2022 |
Mid Cap Growth Fund
Portfolio of Investments, June 30, 2022 (all dollar amounts in thousands) (unaudited)
| | | | | | | | |
| | | | | | |
| | Issuer | | Shares | | | Value | |
| | | | | | | | | | |
| | Common Stocks | | | | | | | | |
| | Information Technology—29.8% | | | | | | | | |
| * | Cadence Design Systems, Inc. | | | 8,360 | | | $ | 1,254 | |
| * | Coupa Software, Inc. | | | 5,488 | | | | 313 | |
| * | Dynatrace, Inc. | | | 28,670 | | | | 1,131 | |
| * | EPAM Systems, Inc. | | | 2,565 | | | | 756 | |
| * | Euronet Worldwide, Inc. | | | 9,820 | | | | 988 | |
| * | Guidewire Software, Inc. | | | 4,012 | | | | 285 | |
| | MKS Instruments, Inc. | | | 6,955 | | | | 714 | |
| * | MongoDB, Inc. | | | 1,815 | | | | 471 | |
| * | Nice, Ltd.—ADR | | | 3,830 | | | | 737 | |
| * | Palo Alto Networks, Inc. | | | 2,295 | | | | 1,134 | |
| * | Pure Storage, Inc. | | | 33,895 | | | | 872 | |
| * | SolarEdge Technologies, Inc. | | | 3,220 | | | | 881 | |
| * | Teledyne Technologies, Inc. | | | 2,680 | | | | 1,005 | |
| | | | | | | | | 10,541 | |
| | Health Care—19.6% | | | | | | | | |
| * | ABIOMED, Inc. | | | 3,233 | | | | 800 | |
| | Agilent Technologies, Inc. | | | 6,325 | | | | 751 | |
| * | Align Technology, Inc. | | | 1,240 | | | | 293 | |
| * | Charles River Laboratories International, Inc. | | | 2,440 | | | | 522 | |
| * | DexCom, Inc. | | | 8,800 | | | | 656 | |
| * | Horizon Therapeutics plc† | | | 11,190 | | | | 893 | |
| * | IDEXX Laboratories, Inc. | | | 1,385 | | | | 486 | |
| * | Mettler-Toledo International, Inc. | | | 545 | | | | 626 | |
| | STERIS plc† | | | 2,145 | | | | 442 | |
| * | Veeva Systems, Inc. | | | 7,290 | | | | 1,444 | |
| | | | | | | | | 6,913 | |
| | Industrials—17.0% | | | | | | | | |
| * | Axon Enterprise, Inc. | | | 6,300 | | | | 587 | |
| * | Builders FirstSource, Inc. | | | 11,375 | | | | 611 | |
| | BWX Technologies, Inc. | | | 20,679 | | | | 1,139 | |
| * | Clarivate plc† | | | 53,005 | | | | 734 | |
| * | Copart, Inc. | | | 11,897 | | | | 1,293 | |
| * | CoStar Group, Inc. | | | 21,805 | | | | 1,317 | |
| * | Generac Holdings, Inc. | | | 1,500 | | | | 316 | |
| | | | | | | | | 5,997 | |
| | Consumer Discretionary—8.9% | | | | | | | | |
| * | Aptiv plc† | | | 5,455 | | | | 486 | |
| * | Bright Horizons Family Solutions, Inc. | | | 8,120 | | | | 686 | |
| * | Burlington Stores, Inc. | | | 4,385 | | | | 597 | |
| * | Chipotle Mexican Grill, Inc. | | | 704 | | | | 920 | |
| * | Etsy, Inc. | | | 4,479 | | | | 328 | |
| * | Farfetch, Ltd.† | | | 18,920 | | | | 136 | |
| | | | | | | | | 3,153 | |
| | Energy—5.5% | | | | | | | | |
| | Cameco Corporation | | | 21,770 | | | | 458 | |
| | Hess Corporation | | | 7,205 | | | | 763 | |
| | New Fortress Energy, Inc. | | | 18,658 | | | | 738 | |
| | | | | | | | | 1,959 | |
| | Issuer | | Shares or
Principal
Amount | | | Value | |
| | | | | | |
| | Common Stocks—(continued) | | | | | | | | |
| | Communication Services—5.0% | | | | | | | | |
| | Cable One, Inc. | | | 176 | | | $ | 227 | |
| * | Live Nation Entertainment, Inc. | | | 6,379 | | | | 527 | |
| * | Take-Two Interactive Software, Inc. | | | 3,495 | | | | 428 | |
| | Warner Music Group Corporation | | | 23,505 | | | | 573 | |
| | | | | | | | | 1,755 | |
| | Materials—4.5% | | | | | | | | |
| | Crown Holdings, Inc. | | | 6,495 | | | | 599 | |
| | Vulcan Materials Co. | | | 7,065 | | | | 1,004 | |
| | | | | | | | | 1,603 | |
| | Financials—3.7% | | | | | | | | |
| | Ares Management Corporation | | | 5,880 | | | | 334 | |
| | PacWest Bancorp | | | 13,555 | | | | 362 | |
| | Western Alliance Bancorp | | | 8,470 | | | | 598 | |
| | | | | | | | | 1,294 | |
| | Real Estate—2.9% | | | | | | | | |
| | SBA Communications Corporation | | | 1,940 | | | | 621 | |
| * | Zillow Group, Inc. | | | 12,390 | | | | 393 | |
| | | | | | | | | 1,014 | |
| | Consumer Staples—1.3% | | | | | | | | |
| * | Performance Food Group Co. | | | 10,210 | | | | 469 | |
| | Total Common Stocks—98.2%
(cost $38,052) | | | | | | | 34,698 | |
| | | | | | | | | | |
| | Repurchase Agreement | | | | | | | | |
| | Fixed Income Clearing Corporation, 0.240% dated 6/30/22, due 7/1/22, repurchase price $692, collateralized by U.S. Treasury Bond, 3.000%, due 02/15/49, valued at $705 | | | $692 | | | | 692 | |
| | Total Repurchase Agreement—1.9%
(cost $692) | | | | | | | 692 | |
| | Total Investments—100.1%
(cost $38,744) | | | | | | | 35,390 | |
| | Liabilities, plus cash and other assets—(0.1)% | | | | | (50 | ) |
| | Net assets—100.0% | | | | | | $ | 35,340 | |
ADR = American Depository Receipt
* = Non-income producing security
† = U.S. listed foreign security
See accompanying Notes to Financial Statements.
| June 30, 2022 | William Blair Funds | 13 |
| | Mid Cap Value Fund |
| | |
| | The Mid Cap Value Fund seeks long-term capital appreciation. |
| | |
| | AN OVERVIEW FROM THE PORTFOLIO MANAGERS |
| | |

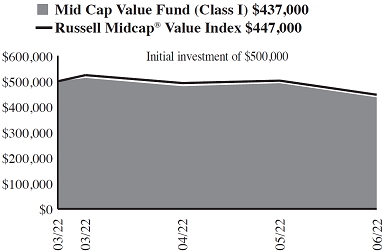
William Heaphy, CFA 
Matthew Fleming, CFA | The William Blair Mid Cap Value Fund (Class I shares) (the “Fund”) posted a 12.60% decrease, net of fees, for the period from inception on March 16, 2022 to June 30, 2022. By comparison, the Fund’s benchmark index, the Russell Midcap® Value Index (the “Index”), decreased 10.57%. The Fund’s sector allocation was a headwind to relative performance in the partial period. A small cash holding, an overweight to the Health Care sector, and an underweight to the Communication Services sector were offset by an above Index allocation to the Information Technology sector and underweight to the Energy and Utilities sectors. Positively impacting performance for the partial period were the Fund’s investments in the Consumer Staples sector. The Fund’s investments in brewer Molson Coors Beveridge Company and food ingredient manufacturer Ingredion Inc. were both strong contributors as these companies reported solid earnings as their strong pricing power has allowed them to maintain margins in the current inflationary environment. On the negative side, the Fund’s investments in the Industrials segment were the worst performers and negatively impacted relative performance. Airline Alaska Air Group, Inc. and agricultural equipment manufacturer AGCO Corporation were large detractors to relative performance for the partial period. The Fund was also significantly underweight Energy shares, which was a large drag on relative performance as oil and natural gas prices spiked on the heels of the Russian invasion of Ukraine. An underweight position to the richly valued yet defensive Utilities sector also detracted from relative performance for the partial period. Please refer to the U.S. Value Market Review and Outlook relating to the Fund on page 4. |
| 14 | Semiannual Report | June 30, 2022 |
Mid Cap Value Fund
Performance Highlights (Unaudited)
| Average Annual Total Returns through 6/30/2022 |
| | | Since
Inception(a) |
| Class I | | | (12.60 | )% |
| Class R6 | | | (12.60 | ) |
| Russell Midcap® Value Index | | | (10.57 | ) |
| (a) | Since inception is for the period from March 16, 2022 (Commencement of Operations) to June 30, 2022. |
Performance cited represents past performance. Past performance does not guarantee future results and current performance may be lower or higher than the data quoted. Results shown are average annual total returns, which assume reinvestment of dividends and capital gains. Investment returns and principal will fluctuate and you may have a gain or loss when you sell shares. For the most current month-end performance information, please call 1-800-742-7272, or visit our Web site at www.williamblairfunds.com. Investing in smaller and medium capitalization companies involves special risks, including higher volatility and lower liquidity. Smaller and medium capitalization stocks are also more sensitive to purchase/sale transactions and changes in the issuer’s financial condition. From time to time, the investment adviser may waive fees or reimburse expenses for the Fund. Without these waivers/reimbursements, performance would be lower. Class I shares are not subject to a sales load or distribution (Rule 12b-1) fees. Class R6 shares are not subject to a sales load, distribution (Rule 12b-1) fees, or sub-transfer agent fees.
The performance highlights and graph presented above do not reflect the deduction of taxes that a shareholder would pay on fund distributions or the redemption of fund shares.
The Russell Midcap® Value Index measures the performance of the mid-cap value segment of the U.S. equity universe. It includes those Russell Midcap companies with lower price-to-book ratios and lower forecasted growth values.
This report identifies the Fund’s investments on June 30, 2022. These holdings are subject to change. Not all stocks in the Fund performed the same, nor is there any guarantee that these stocks will perform as well in the future. Market forecasts provided in this report may not necessarily come to pass.
Sector Diversification (Unaudited)
The sector diversification shown is based on the total long-term securities.
| June 30, 2022 | William Blair Funds | 15 |
Mid Cap Value Fund
Portfolio of Investments, June 30, 2022 (all dollar amounts in thousands) (unaudited)
| | | | | | | | |
| | | | | | | | |
| | Issuer | | Shares | | | Value | |
| | | | | | | | |
| | Common Stocks | | | | | | |
| | Financials—16.7% | | | | | | |
| * | Arch Capital Group, Ltd.† | | | 700 | | | $ | 32 | |
| | Comerica, Inc. | | | 326 | | | | 24 | |
| | East West Bancorp, Inc. | | | 368 | | | | 24 | |
| | Huntington Bancshares, Inc. | | | 1,942 | | | | 24 | |
| | Invesco, Ltd.† | | | 1,306 | | | | 21 | |
| | SLM Corporation | | | 1,960 | | | | 31 | |
| | Synovus Financial Corporation | | | 590 | | | | 21 | |
| | The Hartford Financial Services Group, Inc. | | | 398 | | | | 26 | |
| | Willis Towers Watson plc† | | | 132 | | | | 26 | |
| | | | | | | | | 229 | |
| | Industrials—16.2% | | | | | | | | |
| | Acuity Brands, Inc. | | | 200 | | | | 31 | |
| | AGCO Corporation | | | 246 | | | | 24 | |
| * | Alaska Air Group, Inc. | | | 533 | | | | 21 | |
| | Flowserve Corporation | | | 590 | | | | 17 | |
| | Knight-Swift Transportation Holdings, Inc. | | | 592 | | | | 28 | |
| | MSC Industrial Direct Co., Inc. | | | 250 | | | | 19 | |
| | Regal Rexnord Corporation | | | 293 | | | | 33 | |
| | Snap-on, Inc. | | | 135 | | | | 27 | |
| | The Timken Co. | | | 420 | | | | 22 | |
| | | | | | | | | 222 | |
| | Information Technology—14.0% | | | | | | | | |
| * | Check Point Software Technologies, Ltd.† | | | 243 | | | | 30 | |
| | Cognizant Technology Solutions Corporation | | | 358 | | | | 24 | |
| * | DXC Technology Co. | | | 876 | | | | 26 | |
| * | F5, Inc. | | | 142 | | | | 22 | |
| * | Flex, Ltd.† | | | 1,540 | | | | 22 | |
| | Hewlett Packard Enterprise Co. | | | 1,897 | | | | 25 | |
| | Jabil, Inc. | | | 451 | | | | 23 | |
| | Skyworks Solutions, Inc. | | | 213 | | | | 20 | |
| | | | | | | | | 192 | |
| | Health Care—13.4% | | | | | | | | |
| | AmerisourceBergen Corporation | | | 170 | | | | 24 | |
| * | Centene Corporation | | | 439 | | | | 37 | |
| | Encompass Health Corporation | | | 408 | | | | 23 | |
| * | Henry Schein, Inc. | | | 359 | | | | 28 | |
| * | Hologic, Inc. | | | 396 | | | | 27 | |
| | Laboratory Corporation of America Holdings | | | 104 | | | | 24 | |
| | Viatris, Inc. | | | 2,020 | | | | 21 | |
| | | | | | | | | 184 | |
| | Consumer Discretionary—9.7% | | | | | | | | |
| | Brunswick Corporation | | | 287 | | | | 19 | |
| | LKQ Corporation | | | 577 | | | | 29 | |
| * | Mohawk Industries, Inc. | | | 162 | | | | 20 | |
| | Ralph Lauren Corporation | | | 260 | | | | 23 | |
| | Toll Brothers, Inc. | | | 495 | | | | 22 | |
| | Whirlpool Corporation | | | 131 | | | | 20 | |
| | | | | | | | | 133 | |
| | | | | | | | |
| | | | | | | | |
| | Issuer | | Shares | | | Value | |
| | | | | | | | |
| | Common Stocks—(continued) | | | | | | |
| | Materials—9.0% | | | | | | |
| * | Axalta Coating Systems, Ltd.† | | | 977 | | | $ | 22 | |
| | Crown Holdings, Inc. | | | 262 | | | | 24 | |
| | Huntsman Corporation | | | 988 | | | | 28 | |
| | Sealed Air Corporation | | | 481 | | | | 28 | |
| | Westlake Corporation | | | 218 | | | | 21 | |
| | | | | | | | | 123 | |
| | Real Estate—7.7% | | | | | | | | |
| | Camden Property Trust | | | 183 | | | | 25 | |
| | Duke Realty Corporation | | | 617 | | | | 34 | |
| | Highwoods Properties, Inc. | | | 611 | | | | 21 | |
| | Host Hotels & Resorts, Inc. | | | 1,676 | | | | 26 | |
| | | | | | | | | 106 | |
| | Consumer Staples—6.0% | | | | | | | | |
| | Ingredion, Inc. | | | 301 | | | | 27 | |
| | Molson Coors Brewing Co. | | | 590 | | | | 32 | |
| | Tyson Foods, Inc. | | | 271 | | | | 23 | |
| | | | | | | | | 82 | |
| | Energy—2.3% | | | | | | | | |
| | Diamondback Energy, Inc. | | | 266 | | | | 32 | |
| | Utilities—2.3% | | | | | | | | |
| | Entergy Corporation | | | 274 | | | | 31 | |
| | Communication Services—1.3% | | | | | | | | |
| * | Warner Bros Discovery, Inc. | | | 1,345 | | | | 18 | |
| | Total Common Stocks—98.6%
(cost $1,563) | | | | | | | 1,352 | |
| | Total Investments—98.6%
(cost $1,563) | | | | | | | 1,352 | |
| | Cash and other assets, less liabilities—1.4% | | | | | | | 20 | |
| | Net assets—100.0% | | | | | | $ | 1,372 | |
* = Non-income producing security
† = U.S. listed foreign security
See accompanying Notes to Financial Statements.
| 16 | Semiannual Report | June 30, 2022 |
| | Small-Mid Cap Core Fund |
| | |
| | The Small-Mid Cap Core Fund seeks long-term capital appreciation. |
| | |
| | AN OVERVIEW FROM THE PORTFOLIO MANAGERS |
| | |

Daniel Crowe, CFA 
Ward D. Sexton, CFA | The William Blair Small-Mid Cap Core Fund (Class I shares) (the “Fund”) posted a 21.77% decrease, net of fees, for the six months ended June 30, 2022. By comparison, the Fund’s benchmark index, the Russell 2500™ Index (the “Index”), decreased 21.81%. The Fund modestly trailed its Index in the year-to-date period, driven by a combination of style factors and stock-specific dynamics. From a style perspective, while our typical underweight to companies without earnings was a modest tailwind, our underweight to the cheapest stocks in the Index was an offsetting headwind. Notably, among companies with earnings, there was minimal performance differentiation on quality factors, which did not provide their typical down-market benefit. From a stock perspective, our top detractors included Kornit Digital (Industrials), Coupa Software (Information Technology), Trex Company (Industrials) and Builders FirstSource (Industrials). Kornit Digital, a manufacturer of innovative digital textile printers and inks, experienced macro-related headwinds that impacted orders. Coupa Software, a provider of a cloud-based business spending management platform, reported a slowdown of demand in Europe, primarily due to the ongoing Russia/Ukraine crisis. Stock selection in Consumer Discretionary, including our position in Burlington Stores, also detracted from relative returns. Conversely, our top contributors included New Fortress Energy (Energy), Whitecap Resources (Energy), CF Industries (Materials), BWX Technologies (Industrials) and Mercury Systems (Industrials). New Fortress Energy develops, finances and constructs liquified natural gas assets and related infrastructure. The company announced a number of project milestones and shares were further supported by a strong backdrop to sign new deals. Whitecap Resources is a Canadian exploration & production company that sources a portion of its production from tertiary oil recovery (CO2 injections), which lowers its carbon footprint. A number of accretive acquisitions by the company, a material share buyback and a dividend raise all contributed to outperformance in the period. Please refer to the U.S. Growth & Core Market Review and Outlook relating to the Fund on page 3. |
| June 30, 2022 | William Blair Funds | 17 |
Small-Mid Cap Core Fund
Performance Highlights (Unaudited)
| Average Annual Total Returns through 6/30/2022 |
| | | Year to
Date | | 1 Year | | Since
Inception(a) |
| Class I | | | (21.77 | )% | | | (16.27 | )% | | | 9.29 | % |
| Class R6 | | | (21.75 | ) | | | (16.26 | ) | | | 9.33 | |
| Russell 2500TM Index | | | (21.81 | ) | | | (21.00 | ) | | | 6.96 | |
| (a) | Since inception is for the period from October 1, 2019 (Commencement of Operations) to June 30, 2022. |
Performance cited represents past performance. Past performance does not guarantee future results and current performance may be lower or higher than the data quoted. Results shown are average annual total returns, which assume reinvestment of dividends and capital gains. Investment returns and principal will fluctuate and you may have a gain or loss when you sell shares. For the most current month-end performance information, please call 1-800-742-7272, or visit our Web site at www.williamblairfunds.com. Investing in smaller and medium capitalization companies involves special risks, including higher volatility and lower liquidity. Smaller and medium capitalization stocks are also more sensitive to purchase/sale transactions and changes in the issuer’s financial condition. From time to time, the investment adviser may waive fees or reimburse expenses for the Fund. Without these waivers/reimbursements, performance would be lower. Class I shares are not subject to a sales load or distribution (Rule 12b-1) fees. Class R6 shares are not subject to a sales load, distribution (Rule 12b-1) fees, or sub-transfer agent fees.
The performance highlights and graph presented above do not reflect the deduction of taxes that a shareholder would pay on fund distributions or the redemption of fund shares.
The Russell 2500TMIndex measures the performance of those Russell 2500 companies with above average price-to-book ratios and forecasted growth rates.
This report identifies the Fund’s investments on June 30, 2022. These holdings are subject to change. Not all stocks in the Fund performed the same, nor is there any guarantee that these stocks will perform as well in the future. Market forecasts provided in this report may not necessarily come to pass.
Sector Diversification (Unaudited)
The sector diversification shown is based on the total long-term securities.
| 18 | Semiannual Report | June 30, 2022 |
Small-Mid Cap Core Fund
Portfolio of Investments, June 30, 2022 (all dollar amounts in thousands) (unaudited)
| | | | | | | | |
| | | | | | | | |
| | Issuer | | Shares | | | Value | |
| | | | | | | | |
| | Common Stocks | | | | | | |
| | Industrials—20.0% | | | | | | |
| * | Axon Enterprise, Inc. | | | 19,148 | | | $ | 1,784 | |
| * | Builders FirstSource, Inc. | | | 37,916 | | | | 2,036 | |
| | BWX Technologies, Inc. | | | 37,661 | | | | 2,075 | |
| * | Casella Waste Systems, Inc. | | | 22,198 | | | | 1,613 | |
| * | Chart Industries, Inc. | | | 12,312 | | | | 2,061 | |
| | Douglas Dynamics, Inc. | | | 21,093 | | | | 606 | |
| * | Energy Recovery, Inc. | | | 64,235 | | | | 1,247 | |
| * | Kornit Digital, Ltd.† | | | 18,560 | | | | 588 | |
| | Lincoln Electric Holdings, Inc. | | | 11,290 | | | | 1,393 | |
| * | Mercury Systems, Inc. | | | 36,717 | | | | 2,362 | |
| | Owens Corning | | | 14,483 | | | | 1,076 | |
| * | Shoals Technologies Group, Inc. | | | 72,184 | | | | 1,190 | |
| * | Stem, Inc. | | | 110,453 | | | | 791 | |
| | The Brink’s Co. | | | 29,417 | | | | 1,786 | |
| * | Trex Co., Inc. | | | 22,786 | | | | 1,240 | |
| * | WillScot Mobile Mini Holdings Corporation | | | 55,279 | | | | 1,792 | |
| | | | | | | | | 23,640 | |
| | Health Care—16.7% | | | | | | | | |
| * | Acadia Healthcare Co., Inc. | | | 27,589 | | | | 1,866 | |
| | Azenta, Inc. | | | 16,679 | | | | 1,203 | |
| * | Certara, Inc. | | | 46,985 | | | | 1,008 | |
| | Chemed Corporation | | | 2,866 | | | | 1,345 | |
| * | Globus Medical, Inc. | | | 29,290 | | | | 1,644 | |
| * | Halozyme Therapeutics, Inc. | | | 29,203 | | | | 1,285 | |
| * | Hanger, Inc. | | | 50,969 | | | | 730 | |
| * | Horizon Therapeutics plc† | | | 11,219 | | | | 895 | |
| * | Ligand Pharmaceuticals, Inc. | | | 8,582 | | | | 766 | |
| * | Merit Medical Systems, Inc. | | | 37,373 | | | | 2,028 | |
| | Owens & Minor, Inc. | | | 86,774 | | | | 2,729 | |
| * | Penumbra, Inc. | | | 5,509 | | | | 686 | |
| * | Repligen Corporation | | | 7,485 | | | | 1,216 | |
| * | Sotera Health Co. | | | 54,634 | | | | 1,070 | |
| | STERIS plc† | | | 6,043 | | | | 1,246 | |
| | | | | | | | | 19,717 | |
| | Financials—12.7% | | | | | | | | |
| | Ares Management Corporation | | | 25,483 | | | | 1,449 | |
| | Columbia Banking System, Inc. | | | 43,711 | | | | 1,252 | |
| | East West Bancorp, Inc. | | | 29,629 | | | | 1,920 | |
| | Hannon Armstrong Sustainable Infrastructure Capital, Inc. | | | 32,843 | | | | 1,244 | |
| | LPL Financial Holdings, Inc. | | | 8,452 | | | | 1,559 | |
| | PacWest Bancorp | | | 63,851 | | | | 1,702 | |
| | Virtu Financial, Inc. | | | 81,973 | | | | 1,919 | |
| | Western Alliance Bancorp | | | 33,754 | | | | 2,383 | |
| | Wintrust Financial Corporation | | | 19,073 | | | | 1,529 | |
| | | | | | | | | 14,957 | |
| | Information Technology—11.9% | | | | | | | | |
| * | Alarm.com Holdings, Inc. | | | 15,475 | | | | 957 | |
| * | Coupa Software, Inc. | | | 15,148 | | | | 865 | |
| * | Dynatrace, Inc. | | | 28,145 | | | | 1,110 | |
| | Entegris, Inc. | | | 8,913 | | | | 821 | |
| * | Euronet Worldwide, Inc. | | | 16,873 | | | | 1,697 | |
| | MKS Instruments, Inc. | | | 7,829 | | | | 804 | |
| * | Nice, Ltd.—ADR | | | 5,889 | | | | 1,133 | |
| | Power Integrations, Inc. | | | 15,801 | | | | 1,185 | |
| * | Pure Storage, Inc. | | | 47,626 | | | | 1,225 | |
| * | SolarEdge Technologies, Inc. | | | 5,702 | | | | 1,561 | |
| * | Verra Mobility Corporation | | | 132,362 | | | | 2,079 | |
| * | Wolfspeed, Inc. | | | 8,809 | | | | 559 | |
| | | | | | | | | 13,996 | |
| | | | | | | | |
| | | | | | | | |
| | Issuer | | Shares | | | Value | |
| | | | | | | | |
| | Common Stocks—(continued) | | | | | | |
| | Consumer Discretionary—10.2% | | | | | | |
| | Aramark | | | 46,311 | | | $ | 1,418 | |
| * | Boot Barn Holdings, Inc. | | | 9,954 | | | | 686 | |
| * | Bright Horizons Family Solutions, Inc. | | | 9,532 | | | | 806 | |
| * | Burlington Stores, Inc. | | | 6,338 | | | | 863 | |
| * | Fox Factory Holding Corporation | | | 10,505 | | | | 846 | |
| * | Leslie’s, Inc. | | | 69,343 | | | | 1,053 | |
| * | National Vision Holdings, Inc. | | | 60,945 | | | | 1,676 | |
| * | Overstock.com, Inc. | | | 16,178 | | | | 405 | |
| * | Petco Health & Wellness Co., Inc. | | | 69,160 | | | | 1,019 | |
| * | Revolve Group, Inc. | | | 29,684 | | | | 769 | |
| * | Skyline Champion Corporation | | | 28,459 | | | | 1,349 | |
| | Wyndham Hotels & Resorts, Inc. | | | 18,360 | | | | 1,207 | |
| | | | | | | | | 12,097 | |
| | Energy—7.9% | | | | | | | | |
| | Cameco Corporation | | | 100,352 | | | | 2,110 | |
| * | Denbury, Inc. | | | 23,501 | | | | 1,410 | |
| * | Green Plains, Inc. | | | 41,967 | | | | 1,140 | |
| | New Fortress Energy, Inc. | | | 37,320 | | | | 1,477 | |
| * | TechnipFMC plc† | | | 212,538 | | | | 1,430 | |
| | Whitecap Resources, Inc. | | | 257,289 | | | | 1,793 | |
| | | | | | | | | 9,360 | |
| | Real Estate—5.4% | | | | | | | | |
| | Americold Realty Trust | | | 45,890 | | | | 1,379 | |
| | Equity LifeStyle Properties, Inc. | | | 23,775 | | | | 1,675 | |
| | Healthcare Realty Trust, Inc. | | | 75,811 | | | | 2,062 | |
| | Pebblebrook Hotel Trust | | | 43,339 | | | | 718 | |
| * | The Howard Hughes Corporation | | | 7,187 | | | | 489 | |
| | | | | | | | | 6,323 | |
| | Materials—4.5% | | | | | | | | |
| * | Century Aluminum Co. | | | 70,161 | | | | 517 | |
| | CF Industries Holdings, Inc. | | | 20,674 | | | | 1,773 | |
| | Crown Holdings, Inc. | | | 21,915 | | | | 2,020 | |
| | Eagle Materials, Inc. | | | 9,098 | | | | 1,000 | |
| | | | | | | | | 5,310 | |
| | Consumer Staples—4.1% | | | | | | | | |
| | Inter Parfums, Inc. | | | 15,619 | | | | 1,141 | |
| * | Performance Food Group Co. | | | 29,575 | | | | 1,360 | |
| | Primo Water Corporation | | | 60,898 | | | | 815 | |
| | Spectrum Brands Holdings, Inc. | | | 17,986 | | | | 1,475 | |
| | | | | | | | | 4,791 | |
| | Communication Services—2.3% | | | | | | | | |
| | Cable One, Inc. | | | 773 | | | | 997 | |
| * | Live Nation Entertainment, Inc. | | | 8,020 | | | | 662 | |
| * | ZipRecruiter, Inc. | | | 70,179 | | | | 1,040 | |
| | | | | | | | | 2,699 | |
| | Utilities—1.6% | | | | | | | | |
| | IDACORP, Inc. | | | 18,313 | | | | 1,940 | |
| | Total Common Stocks—97.3%
(cost $133,302) | | | | | | | 114,830 | |
See accompanying Notes to Financial Statements.
| June 30, 2022 | William Blair Funds | 19 |
Small-Mid Cap Core Fund
Portfolio of Investments, June 30, 2022 (all dollar amounts in thousands) (unaudited)
| | | | | | | | |
| | Issuer | | Principal
Amount | | | Value | |
| | | | | | | | |
| | Repurchase Agreement | | | | | | |
| | Fixed Income Clearing Corporation, 0.240% dated 6/30/22, due 7/1/22, repurchase price $3,125, collateralized by U.S. Treasury Note, 1.625%, due 05/15/31, valued at $3,188 | | | $3,125 | | | $ | 3,125 | |
| | Total Repurchase Agreement—2.6%
(cost $3,125) | | | | | | | 3,125 | |
| | Total Investments—99.9%
(cost $136,427) | | | | | | | 117,955 | |
| | Cash and other assets, less liabilities—0.1% | | | | | | | 124 | |
| | Net assets—100.0% | | | | | | $ | 118,079 | |
ADR = American Depository Receipt
* = Non-income producing security
† = U.S. listed foreign security
See accompanying Notes to Financial Statements.
| 20 | Semiannual Report | June 30, 2022 |
| | Small-Mid Cap Growth Fund |
| | |
| | The Small-Mid Cap Growth Fund seeks long-term capital appreciation. |
| | |
| | AN OVERVIEW FROM THE PORTFOLIO MANAGERS |
| | |

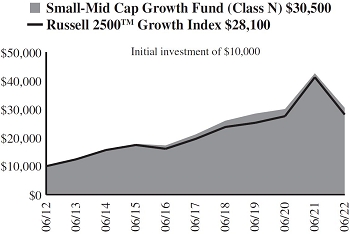
Daniel Crowe, CFA 
James E. Jones, CFA | The William Blair Small-Mid Cap Growth Fund (Class N shares) (the “Fund”) posted a 28.60% decrease, net of fees, for the six months ended June 30, 2022. By comparison, the Fund’s benchmark index, the Russell 2500™ Growth Index (the “Index”), decreased 29.45%. The Fund modestly outperformed its Index in the year-to-date period, driven by a combination of style factors and stock-specific dynamics. From a style perspective, our typical underweight to companies without earnings was a modest tailwind. Notably, among companies with earnings, there was minimal performance differentiation on quality factors, which did not provide their typical down-market benefit. From a stock-specific perspective, our top individual contributors were BWX Technologies (Industrials), Mercury Systems (Industrials), Acadia Healthcare (Health Care), New Fortress (Energy) and HealthEquity (Health Care). Shares of BWX Technologies advanced for the reasons outlined above. Mercury Systems, a provider of sensor processing subsystems, reported strong organic revenue growth and orders against a more supportive backdrop for defense spending. Conversely, our top individual detractors included Trex Company (Industrials), Coupa Software (Information Technology), Revolve Group (Consumer Discretionary), Penumbra (Health Care) and Kornit Digital (Industrials). Shares of Trex, the industry leader in composite residential decking, were pressured by higher-than-expected sales and marketing expense forecasts and concerns that higher interest rates could dampen demand. Coupa Software, provider of a cloud-based business spend management platform, reported a slowdown of demand in Europe, primarily due to the ongoing Russia/Ukraine crisis. Please refer to the U.S. Growth & Core Market Review and Outlook relating to the Fund on page 3. |
| June 30, 2022 | William Blair Funds | 21 |
Small-Mid Cap Growth Fund
Performance Highlights (Unaudited)
| Average Annual Total Returns through 6/30/2022 |
| | | Year to
Date | | 1 Year | | 3 Year | | 5 Year | | 10 Year | | Since
Inception(a) |
| Class N | | | (28.60 | )% | | | (28.45 | )% | | | 2.32 | % | | | 7.60 | % | | | 11.78 | % | | | — | % |
| Class I | | | (28.51 | ) | | | (28.26 | ) | | | 2.57 | | | | 7.86 | | | | 12.06 | | | | — | |
| Class R6 | | | (28.49 | ) | | | (28.21 | ) | | | 2.63 | | | | — | | | | — | | | | 3.43 | |
| Russell 2500TM Growth Index | | | (29.45 | ) | | | (31.81 | ) | | | 3.68 | | | | 7.53 | | | | 10.88 | | | | 4.07 | |
| (a) | Since inception is for the period from May 2, 2019 (Commencement of Operations) to June 30, 2022. |
Performance cited represents past performance. Past performance does not guarantee future results and current performance may be lower or higher than the data quoted. Results shown are average annual total returns, which assume reinvestment of dividends and capital gains. Investment returns and principal will fluctuate and you may have a gain or loss when you sell shares. For the most current month-end performance information, please call 1-800-742-7272, or visit our Web site at www.williamblairfunds.com. Investing in smaller and medium capitalization companies involves special risks, including higher volatility and lower liquidity. Smaller and medium capitalization stocks are also more sensitive to purchase/sale transactions and changes in the issuer’s financial condition. From time to time, the investment adviser may waive fees or reimburse expenses for the Fund. Without these waivers/reimbursements, performance would be lower. Class N shares are not subject to a sales load. Class I shares are not subject to a sales load or distribution (Rule 12b-1) fees. Class R6 shares are not subject to a sales load, distribution (Rule 12b-1) fees, or sub-transfer agent fees.
The performance highlights and graph presented above do not reflect the deduction of taxes that a shareholder would pay on fund distributions or the redemption of fund shares.
The Russell 2500TM Growth Index measures the performance of those Russell 2500 companies with above average price-to-book ratios and forecasted growth rates.
This report identifies the Fund’s investments on June 30, 2022. These holdings are subject to change. Not all stocks in the Fund performed the same, nor is there any guarantee that these stocks will perform as well in the future. Market forecasts provided in this report may not necessarily come to pass.
Sector Diversification (Unaudited)

The sector diversification shown is based on the total long-term securities.
| 22 | Semiannual Report | June 30, 2022 |
Small-Mid Cap Growth Fund
Portfolio of Investments, June 30, 2022 (all dollar amounts in thousands) (unaudited)
| | | | | | | | |
| | | | | | | | |
| | Issuer | | Shares | | | Value | |
| | | | | | | | | | |
| | Common Stocks | | | | | | | | |
| | Information Technology—22.7% | | | | | | | | |
| * | Alarm.com Holdings, Inc. | | | 425,741 | | | $ | 26,336 | |
| * | Avalara, Inc. | | | 380,549 | | | | 26,867 | |
| | Cognex Corporation | | | 440,247 | | | | 18,719 | |
| * | Coupa Software, Inc. | | | 223,609 | | | | 12,768 | |
| * | Dynatrace, Inc. | | | 1,073,286 | | | | 42,330 | |
| | Entegris, Inc. | | | 315,376 | | | | 29,056 | |
| * | Euronet Worldwide, Inc. | | | 451,480 | | | | 45,414 | |
| * | Guidewire Software, Inc. | | | 320,755 | | | | 22,770 | |
| | MKS Instruments, Inc. | | | 194,765 | | | | 19,989 | |
| | National Instruments Corporation | | | 965,848 | | | | 30,164 | |
| * | Nice, Ltd.—ADR | | | 149,468 | | | | 28,765 | |
| * | Novanta, Inc.† | | | 179,054 | | | | 21,714 | |
| * | PagerDuty, Inc. | | | 797,309 | | | | 19,757 | |
| * | Pure Storage, Inc. | | | 1,121,848 | | | | 28,843 | |
| * | SolarEdge Technologies, Inc. | | | 177,241 | | | | 48,507 | |
| * | Varonis Systems, Inc. | | | 968,432 | | | | 28,395 | |
| * | Wolfspeed, Inc. | | | 202,213 | | | | 12,831 | |
| * | Workiva, Inc. | | | 165,892 | | | | 10,947 | |
| | | | | | | | | 474,172 | |
| | Health Care—21.5% | | | | | | | | |
| * | ABIOMED, Inc. | | | 129,433 | | | | 32,036 | |
| * | Acadia Healthcare Co., Inc. | | | 638,780 | | | | 43,201 | |
| | Azenta, Inc. | | | 523,316 | | | | 37,731 | |
| * | Blueprint Medicines Corporation | | | 193,004 | | | | 9,749 | |
| * | Certara, Inc. | | | 775,535 | | | | 16,643 | |
| * | Charles River Laboratories International, Inc. | | | 165,037 | | | | 35,313 | |
| | Chemed Corporation | | | 77,684 | | | | 36,464 | |
| * | Globus Medical, Inc. | | | 233,195 | | | | 13,091 | |
| * | Halozyme Therapeutics, Inc. | | | 738,877 | | | | 32,510 | |
| * | HealthEquity, Inc. | | | 470,708 | | | | 28,897 | |
| * | Horizon Therapeutics plc† | | | 288,306 | | | | 22,995 | |
| * | Insmed, Inc. | | | 645,551 | | | | 12,730 | |
| * | Inspire Medical Systems, Inc. | | | 111,542 | | | | 20,375 | |
| * | Insulet Corporation | | | 106,546 | | | | 23,221 | |
| * | Merit Medical Systems, Inc. | | | 455,026 | | | | 24,694 | |
| * | Penumbra, Inc. | | | 158,021 | | | | 19,677 | |
| * | Repligen Corporation | | | 135,300 | | | | 21,973 | |
| * | Twist Bioscience Corporation | | | 505,773 | | | | 17,682 | |
| | | | | | | | | 448,982 | |
| | Industrials—20.5% | | | | | | | | |
| | Advanced Drainage Systems, Inc. | | | 186,000 | | | | 16,753 | |
| * | Axon Enterprise, Inc. | | | 392,948 | | | | 36,611 | |
| * | Builders FirstSource, Inc. | | | 940,115 | | | | 50,484 | |
| | BWX Technologies, Inc. | | | 1,093,252 | | | | 60,227 | |
| * | Casella Waste Systems, Inc. | | | 279,461 | | | | 20,311 | |
| * | Chart Industries, Inc. | | | 221,544 | | | | 37,082 | |
| | HEICO Corporation | | | 179,156 | | | | 18,880 | |
| | Lincoln Electric Holdings, Inc. | | | 174,735 | | | | 21,555 | |
| * | Mercury Systems, Inc. | | | 758,501 | | | | 48,795 | |
| | Ritchie Bros Auctioneers, Inc. | | | 341,503 | | | | 22,218 | |
| * | Shoals Technologies Group, Inc. | | | 945,768 | | | | 15,586 | |
| * | Stem, Inc. | | | 803,329 | | | | 5,752 | |
| | The Brink’s Co. | | | 710,416 | | | | 43,129 | |
| * | Trex Co., Inc. | | | 569,221 | | | | 30,977 | |
| | | | | | | | | 428,360 | |
| | Consumer Discretionary—12.9% | | | | | | | | |
| * | Bright Horizons Family Solutions, Inc. | | | 238,501 | | | | 20,158 | |
| * | Burlington Stores, Inc. | | | 123,961 | | | | 16,887 | |
| * | Fox Factory Holding Corporation | | | 287,006 | | | | 23,115 | |
| | Issuer | | Shares or
Principal
Amount | | | Value | |
| | | | | | | | | | |
| | Common Stocks—(continued) | | | | | | | | |
| | Consumer Discretionary—(continued) | | | | | | | | |
| * | Helen of Troy, Ltd.† | | | 4,502 | | | $ | 731 | |
| * | Leslie’s, Inc. | | | 2,016,774 | | | | 30,615 | |
| * | National Vision Holdings, Inc. | | | 1,259,162 | | | | 34,627 | |
| * | Overstock.com, Inc. | | | 503,901 | | | | 12,602 | |
| * | Petco Health & Wellness Co., Inc. | | | 1,426,100 | | | | 21,021 | |
| * | Planet Fitness, Inc. | | | 245,400 | | | | 16,690 | |
| | Pool Corporation | | | 65,082 | | | | 22,859 | |
| * | Revolve Group, Inc. | | | 1,010,992 | | | | 26,195 | |
| | Wyndham Hotels & Resorts, Inc. | | | 680,245 | | | | 44,706 | |
| | | | | | | | | 270,206 | |
| | Energy—5.7% | | | | | | | | |
| | Cameco Corporation | | | 1,911,062 | | | | 40,171 | |
| * | Denbury, Inc. | | | 534,685 | | | | 32,076 | |
| | New Fortress Energy, Inc. | | | 735,212 | | | | 29,092 | |
| | Whitecap Resources, Inc. | | | 2,565,700 | | | | 17,883 | |
| | | | | | | | | 119,222 | |
| | Materials—5.1% | | | | | | | | |
| | CF Industries Holdings, Inc. | | | 395,631 | | | | 33,918 | |
| | Crown Holdings, Inc. | | | 582,287 | | | | 53,669 | |
| | Martin Marietta Materials, Inc. | | | 65,496 | | | | 19,599 | |
| | | | | | | | | 107,186 | |
| | Financials—4.4% | | | | | | | | |
| | Ares Management Corporation | | | 528,540 | | | | 30,053 | |
| | Virtu Financial, Inc. | | | 1,279,536 | | | | 29,954 | |
| | Western Alliance Bancorp | | | 468,082 | | | | 33,046 | |
| | | | | | | | | 93,053 | |
| | Consumer Staples—3.2% | | | | | | | | |
| * | Celsius Holdings, Inc. | | | 267,258 | | | | 17,441 | |
| * | Performance Food Group Co. | | | 821,795 | | | | 37,786 | |
| * | The Beauty Health Co. | | | 868,022 | | | | 11,163 | |
| | | | | | | | | 66,390 | |
| | Communication Services—1.9% | | | | | | | | |
| | Cable One, Inc. | | | 19,646 | | | | 25,330 | |
| * | Live Nation Entertainment, Inc. | | | 183,060 | | | | 15,117 | |
| | | | | | | | | 40,447 | |
| | Real Estate—1.0% | | | | | | | | |
| | FirstService Corporation | | | 167,968 | | | | 20,358 | |
| | Total Common Stocks—98.9%
(cost $2,136,540) | | | | | | | 2,068,376 | |
| | | | | | | | | | |
| | Repurchase Agreement | | | | | | | | |
| | Fixed Income Clearing Corporation, 0.240% dated 6/30/22, due 7/1/22, repurchase price $51,493, collateralized by U.S. Treasury Note, 1.625%, due 05/15/31, valued at $52,522 | | | $51,492 | | | | 51,492 | |
| | Total Repurchase Agreement—2.4%
(cost $51,492) | | | | | | | 51,492 | �� |
| | Total Investments—101.3%
(cost $2,188,032) | | | | | | | 2,119,868 | |
| | Liabilities, plus cash and other assets—(1.3)% | | | | | | | (28,199 | ) |
| | Net assets—100.0% | | | | | | $ | 2,091,669 | |
ADR = American Depository Receipt
* = Non-income producing security
† = U.S. listed foreign security
See accompanying Notes to Financial Statements.
| June 30, 2022 | William Blair Funds | 23 |
| | Small Cap Growth Fund |
| | |
| | The Small Cap Growth Fund seeks long-term capital appreciation. |
| | |
| | AN OVERVIEW FROM THE PORTFOLIO MANAGERS |
| | |

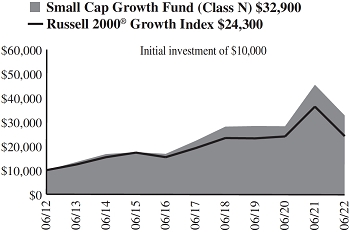
Ward D. Sexton, CFA 
Mark C. Thompson, CFA | The William Blair Small Cap Growth Fund (Class N shares) (the “Fund”) posted a 27.96% decrease, net of fees, for the six months ended June 30, 2022. By comparison, the Fund’s benchmark index, the Russell 2000® Growth Index (the “Index”), decreased 29.45%. The Fund outperformed the Index in the year-to-date period, driven by a combination of style factors and stock-specific dynamics. From a style perspective, our typical valuation sensitivity was a modest tailwind as the more attractively valued stocks in the Index outperformed during the period. From a stock-specific perspective, selection in Information Technology, including our position in Verra Mobility, contributed positively to relative returns. Our top individual contributors included BWX Technologies (Industrials), Gogo (Communication Services), Acadia Healthcare (Health Care) and Mercury Systems (Industrials). Shares of BWX Technologies advanced for the reasons outlined above. Gogo, a provider of telecommunication services to the business aviation market, reported strong earnings results across all important metrics. Conversely, our top individual detractors included Kornit Digital (Industrials), Health Catalyst (Health Care), Codexis (Health Care), Montrose Environmental Group (Industrials) and Overstock.com (Consumer Discretionary). Kornit Digital, a manufacturer of innovative digital textile printers and inks, experienced macro-related headwinds that impacted orders. We liquidated our position in Health Catalyst, a provider of healthcare software solutions, during the period as we believe the market downturn is likely to slow future booking for the company, delaying the path of sustainable profit generation. Please refer to the U.S. Growth & Core Market Review and Outlook relating to the Fund on page 3. |
| 24 | Semiannual Report | June 30, 2022 |
Small Cap Growth Fund
Performance Highlights (Unaudited)
| Average Annual Total Returns through 6/30/2022 |
| | | Year to
Date | | 1 Year | | 3 Year | | 5 Year | | 10 Year | | Since
Inception(a) |
| Class N | | | (27.96 | )% | | | (27.92 | )% | | | 4.95 | % | | | 8.11 | % | | | 12.63 | % | | | — | % |
| Class I | | | (27.88 | ) | | | (27.74 | ) | | | 5.21 | | | | 8.39 | | | | 12.91 | | | | — | |
| Class R6 | | | (27.85 | ) | | | (27.68 | ) | | | 5.29 | | | | — | | | | — | | | | 4.96 | |
| Russell 2000® Growth Index | | | (29.45 | ) | | | (33.43 | ) | | | 1.40 | | | | 4.80 | | | | 9.30 | | | | 1.57 | |
| (a) | Since inception is for the period from May 2, 2019 (Commencement of Operations) to June 30, 2022. |
Performance cited represents past performance. Past performance does not guarantee future results and current performance may be lower or higher than the data quoted. Results shown are average annual total returns, which assume reinvestment of dividends and capital gains. Investment returns and principal will fluctuate and you may have a gain or loss when you sell shares. For the most current month-end performance information, please call 1-800-742-7272, or visit our Web site at www.williamblairfunds.com. Investing in smaller companies involves special risks, including higher volatility and lower liquidity. Smaller capitalization stocks are also more sensitive to purchase/sale transactions and changes in the issuer’s financial condition. From time to time, the investment adviser may waive fees or reimburse expenses for the Fund. Without these waivers/reimbursements, performance would be lower. Class N shares are not subject to a sales load. Class I shares are not subject to a sales load or distribution (Rule 12b-1) fees. Class R6 shares are not subject to a sales load, distribution (Rule 12b-1) fees, or sub-transfer agent fees.
The performance highlights and graph presented above do not reflect the deduction of taxes that a shareholder would pay on fund distributions or the redemption of fund shares.
The Russell 2000® Growth Index is an unmanaged composite of the smallest 2000 stocks of the Russell 3000® Growth Index.
This report identifies the Fund’s investments on June 30, 2022. These holdings are subject to change. Not all stocks in the Fund performed the same, nor is there any guarantee that these stocks will perform as well in the future. Market forecasts provided in this report may not necessarily come to pass.
Sector Diversification (Unaudited)
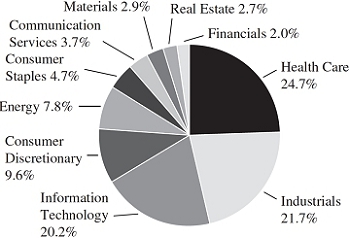
The sector diversification shown is based on the total long-term securities.
| June 30, 2022 | William Blair Funds | 25 |
Small Cap Growth Fund
Portfolio of Investments, June 30, 2022 (all dollar amounts in thousands) (unaudited)
| | | | | | | | |
| | | | | | | | |
| | Issuer | | Shares | | | Value | |
| | | | | | | | | | |
| | Common Stocks | | | | | | | | |
| | Health Care—24.2% | | | | | | | | |
| * | Acadia Healthcare Co., Inc. | | | 113,229 | | | $ | 7,658 | |
| * | Amicus Therapeutics, Inc. | | | 718,590 | | | | 7,718 | |
| * | Artivion, Inc. | | | 14,550 | | | | 275 | |
| * | Axogen, Inc. | | | 462,234 | | | | 3,786 | |
| | Azenta, Inc. | | | 139,815 | | | | 10,081 | |
| * | Blueprint Medicines Corporation | | | 43,880 | | | | 2,216 | |
| * | Certara, Inc. | | | 315,013 | | | | 6,760 | |
| * | Codexis, Inc. | | | 291,311 | | | | 3,047 | |
| * | Globus Medical, Inc. | | | 74,370 | | | | 4,175 | |
| * | Halozyme Therapeutics, Inc. | | | 198,880 | | | | 8,751 | |
| * | Hanger, Inc. | | | 359,665 | | | | 5,150 | |
| * | HealthEquity, Inc. | | | 111,295 | | | | 6,832 | |
| * | Insmed, Inc. | | | 136,770 | | | | 2,697 | |
| * | Inspire Medical Systems, Inc. | | | 39,040 | | | | 7,131 | |
| * | Ligand Pharmaceuticals, Inc. | | | 80,348 | | | | 7,169 | |
| * | Merit Medical Systems, Inc. | | | 175,520 | | | | 9,525 | |
| | Owens & Minor, Inc. | | | 175,230 | | | | 5,511 | |
| * | Penumbra, Inc. | | | 39,470 | | | | 4,915 | |
| * | Pulmonx Corporation | | | 197,001 | | | | 2,900 | |
| * | Treace Medical Concepts, Inc. | | | 231,080 | | | | 3,314 | |
| * | Twist Bioscience Corporation | | | 94,366 | | | | 3,299 | |
| * | Veracyte, Inc. | | | 148,450 | | | | 2,954 | |
| * | Vericel Corporation | | | 129,930 | | | | 3,272 | |
| | | | | | | | | 119,136 | |
| | Industrials—21.1% | | | | | | | | |
| * | ACV Auctions, Inc. | | | 302,590 | | | | 1,979 | |
| | Albany International Corporation | | | 102,855 | | | | 8,104 | |
| * | Builders FirstSource, Inc. | | | 91,750 | | | | 4,927 | |
| | BWX Technologies, Inc. | | | 234,209 | | | | 12,903 | |
| * | Casella Waste Systems, Inc. | | | 137,620 | | | | 10,002 | |
| | Douglas Dynamics, Inc. | | | 169,843 | | | | 4,881 | |
| * | Ducommun, Inc. | | | 147,682 | | | | 6,356 | |
| * | Energy Recovery, Inc. | | | 372,116 | | | | 7,227 | |
| * | IAA, Inc. | | | 55,849 | | | | 1,830 | |
| * | Kornit Digital, Ltd.† | | | 87,190 | | | | 2,764 | |
| | Lincoln Electric Holdings, Inc. | | | 50,720 | | | | 6,257 | |
| | Luxfer Holdings plc† | | | 482,386 | | | | 7,294 | |
| * | Mercury Systems, Inc. | | | 147,476 | | | | 9,487 | |
| * | Montrose Environmental Group, Inc. | | | 172,978 | | | | 5,840 | |
| * | Stem, Inc. | | | 482,466 | | | | 3,454 | |
| | The Brink’s Co. | | | 174,236 | | | | 10,578 | |
| | | | | | | | | 103,883 | |
| | Information Technology—19.6% | | | | | | | | |
| * | Alarm.com Holdings, Inc. | | | 97,160 | | | | 6,010 | |
| | American Software, Inc. | | | 271,250 | | | | 4,383 | |
| * | BTRS Holdings, Inc. | | | 344,190 | | | | 1,714 | |
| | Computer Services, Inc. | | | 110,579 | | | | 4,087 | |
| * | Coupa Software, Inc. | | | 77,220 | | | | 4,409 | |
| * | Euronet Worldwide, Inc. | | | 59,830 | | | | 6,018 | |
| * | Grid Dynamics Holdings, Inc. | | | 295,928 | | | | 4,978 | |
| * | Novanta, Inc.† | | | 38,750 | | | | 4,699 | |
| * | PagerDuty, Inc. | | | 162,410 | | | | 4,025 | |
| | | | | | | | |
| | | | | | | | |
| | Issuer | | Shares | | | Value | |
| | | | | | | | | | |
| | Common Stocks—(continued) | | | | | | | | |
| | Information Technology—(continued) | | | | | | | | |
| * | PDF Solutions, Inc. | | | 223,787 | | | $ | 4,814 | |
| | Power Integrations, Inc. | | | 57,270 | | | | 4,296 | |
| * | PROS Holdings, Inc. | | | 190,330 | | | | 4,992 | |
| * | Pure Storage, Inc. | | | 187,166 | | | | 4,812 | |
| * | SiTime Corporation | | | 29,575 | | | | 4,822 | |
| * | Upland Software, Inc. | | | 107,526 | | | | 1,561 | |
| * | Varonis Systems, Inc. | | | 189,960 | | | | 5,570 | |
| * | Verra Mobility Corporation | | | 714,459 | | | | 11,224 | |
| * | Vertex, Inc. | | | 331,019 | | | | 3,751 | |
| * | WNS Holdings, Ltd.—ADR | | | 92,312 | | | | 6,890 | |
| * | Workiva, Inc. | | | 53,850 | | | | 3,554 | |
| | | | | | | | | 96,609 | |
| | Consumer Discretionary—9.3% | | | | | | | | |
| * | Boot Barn Holdings, Inc. | | | 49,174 | | | | 3,389 | |
| * | Fox Factory Holding Corporation | | | 52,430 | | | | 4,223 | |
| * | National Vision Holdings, Inc. | | | 293,478 | | | | 8,071 | |
| * | Overstock.com, Inc. | | | 229,650 | | | | 5,743 | |
| * | Revolve Group, Inc. | | | 166,227 | | | | 4,307 | |
| * | Rush Street Interactive, Inc. | | | 394,340 | | | | 1,841 | |
| * | Skyline Champion Corporation | | | 159,270 | | | | 7,553 | |
| | The Cheesecake Factory, Inc. | | | 200,590 | | | | 5,300 | |
| | Winmark Corporation | | | 27,920 | | | | 5,460 | |
| | | | | | | | | 45,887 | |
| | Energy—7.6% | | | | | | | | |
| | Cameco Corporation | | | 468,140 | | | | 9,840 | |
| | ChampionX Corporation | | | 168,960 | | | | 3,354 | |
| * | Denbury, Inc. | | | 91,609 | | | | 5,496 | |
| * | Green Plains, Inc. | | | 185,462 | | | | 5,039 | |
| * | TechnipFMC plc† | | | 1,061,880 | | | | 7,146 | |
| | Whitecap Resources, Inc. | | | 910,920 | | | | 6,349 | |
| | | | | | | | | 37,224 | |
| | Consumer Staples—4.6% | | | | | | | | |
| * | Celsius Holdings, Inc. | | | 78,360 | | | | 5,114 | |
| * | Performance Food Group Co. | | | 160,700 | | | | 7,389 | |
| * | The Beauty Health Co. | | | 551,360 | | | | 7,090 | |
| * | Vital Farms, Inc. | | | 341,910 | | | | 2,992 | |
| | | | | | | | | 22,585 | |
| | Communication Services—3.6% | | | | | | | | |
| * | Gogo, Inc. | | | 266,120 | | | | 4,308 | |
| * | QuinStreet, Inc. | | | 264,155 | | | | 2,657 | |
| * | Ziff Davis Inc | | | 85,503 | | | | 6,373 | |
| * | ZipRecruiter, Inc. | | | 286,350 | | | | 4,244 | |
| | | | | | | | | 17,582 | |
| | Materials—2.9% | | | | | | | | |
| | Ardagh Metal Packaging S.A.† | | | 696,080 | | | | 4,246 | |
| * | Century Aluminum Co. | | | 231,930 | | | | 1,709 | |
| | Orion Engineered Carbons S.A.† | | | 521,187 | | | | 8,094 | |
| | | | | | | | | 14,049 | |
See accompanying Notes to Financial Statements.
| 26 | Semiannual Report | June 30, 2022 |
Small Cap Growth Fund
Portfolio of Investments, June 30, 2022 (all dollar amounts in thousands) (unaudited)
| Issuer | | Shares or
Principal
Amount | | | Value | |
| | | | | | | | | |
| Common Stocks—(continued) | | | | | | | | |
| Real Estate—2.6% | | | | | | | | |
| Colliers International Group, Inc. | | | 52,228 | | | $ | 5,730 | |
| FirstService Corporation | | | 59,697 | | | | 7,235 | |
| | | | | | | | 12,965 | |
| Financials—2.0% | | | | | | | | |
| PacWest Bancorp | | | 181,500 | | | | 4,839 | |
| Wintrust Financial Corporation | | | 61,540 | | | | 4,932 | |
| | | | | | | | 9,771 | |
Total Common Stocks—97.5%
(cost $499,005) | | | | | | | 479,691 | |
| | | | | | | | | |
| Repurchase Agreement | | | | | | | | |
| Fixed Income Clearing Corporation, 0.240% dated 6/30/22, due 7/1/22, repurchase price $12,729, collateralized by U.S. Treasury Note, 1.625%, due 05/15/31, valued at $12,984 | | | $12,729 | | | | 12,729 | |
Total Repurchase Agreement—2.6%
(cost $12,729) | | | | | | | 12,729 | |
Total Investments—100.1%
(cost $511,734) | | | | | | | 492,420 | |
| Liabilities, plus cash and other assets—(0.1)% | | | | | | | (528 | ) |
| Net assets—100.0% | | | | | | $ | 491,892 | |
ADR = American Depository Receipt
* = Non-income producing security
† = U.S. listed foreign security
See accompanying Notes to Financial Statements.
| June 30, 2022 | William Blair Funds | 27 |
| | Small Cap Value Fund |
| | |
| | The Small Cap Value Fund seeks long-term capital appreciation. |
| | |
| | AN OVERVIEW FROM THE PORTFOLIO MANAGERS |
| | |

William Heaphy, CFA 
Gary Merwitz | The William Blair Small Cap Value Fund (Class N shares) (the “Fund”) posted a 15.37% decrease, net of fees, for the six months ended June 30, 2022. By comparison, the Fund’s benchmark index, the Russell 2000® Value Index (the “Index”), decreased 17.31%. The Fund’s relative outperformance was driven by the combination of stock selection and style observations during the period. From a style perspective, the value indices have continued to witness a pronounced shift in investor preference for higher quality stocks with cheaper valuations which provided the Fund with a tailwind in the first half of 2022 despite a difficult equity market. At the sector level, the Fund’s Health Care holdings were the largest contributor to relative performance in the first half of 2022. A lack of exposure to the biotechnology subsector was a major contributor to this result, but several of the Fund’s Health Care holdings posted impressive returns, including health care supplier Lantheus Holdings. The Fund also benefitted from substantial outperformance from its Materials sector investments, which declined a modest 8.7% for the first half of 2022 versus a much larger 20.4% fall for the Index constituents. Much of this outperformance came from our industrial packaging companies which gained 9.9% collectively. These companies have reported solid earnings as their strong pricing power has allowed them to maintain margins in the current inflationary environment. The Fund also benefitted from very little exposure to commodity metals and chemical companies that struggled late in the second quarter as fears of weakening global growth increased. On the negative side, the Fund’s Energy sector holdings struggled during the first half of 2022 to keep pace with the Index constituents. The Fund was significantly underweight Energy shares in the first half of the year, which was a large drag on relative performance as oil and natural gas prices spiked. However, this trend reversed abruptly in the last two weeks of June when commodities plunged. While the Fund’s holdings in exploration and production stocks held up relative to the Index, the Fund’s Energy equipment and services companies holdings underperformed. The Fund’s exposure to companies serving the offshore drilling market was the cause of this relative underperformance as the market favored companies benefitting from the increase in onshore shale drilling which is ramping up faster. An underweight position to the richly valued yet defensive Utilities sector also detracted from relative performance for the first half of 2022. Please refer to the U.S. Value Market Review and Outlook relating to the Fund on page 4. |
| | | |
| 28 | Semiannual Report | June 30, 2022 |
Small Cap Value Fund
Performance Highlights (Unaudited)
Average Annual Total Returns through 6/30/2022
| | | Year to
Date | | 1 Year | | 3 Year | | 5 Year | | 10 Year | | Since
Inception(a) |
| Class N | | | (15.37 | )% | | | — | % | | | — | % | | | — | % | | | — | % | | | (8.10 | )% |
| Class I | | | (15.25 | ) | | | (12.36 | ) | | | 6.64 | | | | 6.22 | | | | 10.35 | | | | — | |
| Class R6 | | | (15.19 | ) | | | — | | | | — | | | | — | | | | — | | | | (7.75 | ) |
| Russell 2000® Value Index | | | (17.31 | ) | | | (16.28 | ) | | | 6.18 | | | | 4.89 | | | | 9.05 | | | | (11.20 | ) |
| | |
| (a) | Since inception is for the period from July 17, 2021 (Commencement of Operations) to June 30, 2022. |
Performance cited represents past performance. Past performance does not guarantee future results and current performance may be lower or higher than the data quoted. Results shown are average annual total returns, which assume reinvestment of dividends and capital gains. Investment returns and principal will fluctuate and you may have a gain or loss when you sell shares. For the most current month-end performance information, please call 1-800-742-7272, or visit our Web site at www.williamblairfunds.com. Investing in smaller companies involves special risks, including higher volatility and lower liquidity. Smaller capitalization stocks are also more sensitive to purchase/sale transactions and changes in the issuer’s financial condition. From time to time, the investment adviser may waive fees or reimburse expenses for the Fund. Without these waivers/reimbursements, performance would be lower. Class N shares are not subject to a sales load. Class I shares are not subject to a sales load or distribution (Rule 12b-1) fees. Class R6 shares are not subject to a sales load, distribution (Rule 12b-1) fees, or sub-transfer agent fees.
The performance highlights and graph presented above do not reflect the deduction of taxes that a shareholder would pay on fund distributions or the redemption of fund shares.
The Russell 2000® Value Index consists of small-capitalization companies with below average price-to-book ratios and forecasted growth rates.
This report identifies the Fund’s investments on June 30, 2022. These holdings are subject to change. Not all stocks in the Fund performed the same, nor is there any guarantee that these stocks will perform as well in the future. Market forecasts provided in this report may not necessarily come to pass.
Sector Diversification (Unaudited)
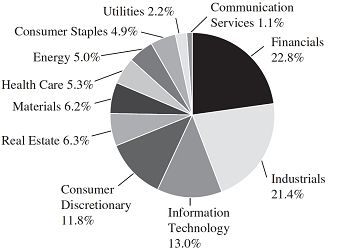
The sector diversification shown is based on the total long-term securities.
| June 30, 2022 | William Blair Funds | 29 |
Small Cap Value Fund
Portfolio of Investments, June 30, 2022 (all dollar amounts in thousands) (unaudited)
| | | | | | | | |
| | | | | | | | |
| | Issuer | | Shares | | | Value | |
| | | | | | | | |
| | Common Stocks | | | | | | | | |
| | Financials—22.5% | | | | | | | | |
| | Ameris Bancorp | | | 343,335 | | | $ | 13,795 | |
| | Argo Group International Holdings, Ltd.† | | | 351,322 | | | | 12,950 | |
| | Atlantic Union Bankshares Corporation | | | 402,084 | | | | 13,639 | |
| | Banc of California, Inc. | | | 808,956 | | | | 14,254 | |
| | Berkshire Hills Bancorp, Inc. | | | 523,377 | | | | 12,964 | |
| | Brightsphere Investment Group, Inc. | | | 520,792 | | | | 9,379 | |
| | Compass Diversified Holdings | | | 634,471 | | | | 13,590 | |
| | ConnectOne Bancorp, Inc. | | | 453,352 | | | | 11,084 | |
| | Dime Community Bancshares, Inc. | | | 462,010 | | | | 13,699 | |
| | Eastern Bankshares, Inc. | | | 812,761 | | | | 15,004 | |
| | Enterprise Financial Services Corporation | | | 304,714 | | | | 12,646 | |
| | First Bancorp | | | 289,892 | | | | 10,117 | |
| | First Merchants Corporation | | | 360,059 | | | | 12,825 | |
| | MGIC Investment Corporation | | | 1,023,594 | | | | 12,897 | |
| | Old National Bancorp | | | 902,500 | | | | 13,348 | |
| | Pacific Premier Bancorp, Inc. | | | 377,703 | | | | 11,044 | |
| | PJT Partners, Inc. | | | 48,054 | | | | 3,377 | |
| * | PRA Group, Inc. | | | 415,499 | | | | 15,108 | |
| | Seacoast Banking Corporation of Florida | | | 423,059 | | | | 13,978 | |
| | Simmons First National Corporation | | | 561,718 | | | | 11,942 | |
| * | Texas Capital Bancshares, Inc. | | | 280,316 | | | | 14,756 | |
| | Veritex Holdings, Inc. | | | 367,303 | | | | 10,747 | |
| | Washington Federal, Inc. | | | 404,625 | | | | 12,147 | |
| | | | | | | | | 285,290 | |
| | Industrials—21.2% | | | | | | | | |
| | ABM Industries, Inc. | | | 354,422 | | | | 15,389 | |
| | Albany International Corporation | | | 188,092 | | | | 14,820 | |
| | Armstrong World Industries, Inc. | | | 167,907 | | | | 12,586 | |
| | Astec Industries, Inc. | | | 130,276 | | | | 5,313 | |
| | Brady Corporation | | | 295,410 | | | | 13,955 | |
| * | CBIZ, Inc. | | | 410,610 | | | | 16,408 | |
| | Deluxe Corporation | | | 451,594 | | | | 9,786 | |
| | Federal Signal Corporation | | | 428,830 | | | | 15,266 | |
| | GrafTech International, Ltd. | | | 1,335,219 | | | | 9,440 | |
| | Granite Construction, Inc. | | | 386,154 | | | | 11,252 | |
| * | Great Lakes Dredge & Dock Corporation | | | 1,055,725 | | | | 13,840 | |
| * | Harsco Corporation | | | 770,106 | | | | 5,475 | |
| | Hillenbrand, Inc. | | | 328,532 | | | | 13,457 | |
| | *Hub Group, Inc. | | | 226,033 | | | | 16,035 | |
| | ICF International, Inc. | | | 85,811 | | | | 8,152 | |
| | Kaman Corporation | | | 139,735 | | | | 4,367 | |
| * | KAR Auction Services, Inc. | | | 624,627 | | | | 9,226 | |
| | Marten Transport, Ltd. | | | 670,508 | | | | 11,278 | |
| | MillerKnoll, Inc. | | | 484,618 | | | | 12,731 | |
| | Mueller Water Products, Inc. | | | 544,854 | | | | 6,391 | |
| * | PGT Innovations, Inc. | | | 619,045 | | | | 10,301 | |
| * | SP Plus Corporation | | | 344,364 | | | | 10,579 | |
| | Terex Corporation | | | 413,183 | | | | 11,309 | |
| | Werner Enterprises, Inc. | | | 304,949 | | | | 11,753 | |
| | | | | | | | | 269,109 | |
| | | | | | | | |
| | | | | | | | |
| | Issuer | | Shares | | | Value | |
| | | | | | | | |
| | Common Stocks—(continued) | | | | | | | | |
| | Information Technology—12.9% | | | | | | | | |
| | Advanced Energy Industries, Inc. | | | 122,745 | | | $ | 8,958 | |
| | AudioCodes, Ltd.† | | | 455,159 | | | | 10,032 | |
| | Belden, Inc. | | | 376,327 | | | | 20,047 | |
| * | Cognyte Software, Ltd.† | | | 1,192,969 | | | | 5,070 | |
| * | Conduent, Inc. | | | 2,386,136 | | | | 10,308 | |
| | CSG Systems International, Inc. | | | 217,897 | | | | 13,004 | |
| * | Knowles Corporation | | | 739,830 | | | | 12,821 | |
| | Kulicke & Soffa Industries, Inc. | | | 234,682 | | | | 10,047 | |
| | Maximus, Inc. | | | 189,302 | | | | 11,833 | |
| | Methode Electronics, Inc. | | | 376,698 | | | | 13,953 | |
| * | NetScout Systems, Inc. | | | 496,661 | | | | 16,812 | |
| * | Plexus Corporation | | | 179,116 | | | | 14,061 | |
| | Progress Software Corporation | | | 359,192 | | | | 16,271 | |
| | | | | | | | | 163,217 | |
| | Consumer Discretionary—11.7% | | | | | | | | |
| * | Adient plc† | | | 326,970 | | | | 9,688 | |
| | Bloomin’ Brands, Inc. | | | 688,405 | | | | 11,441 | |
| | Carter’s, Inc. | | | 171,094 | | | | 12,059 | |
| | Cracker Barrel Old Country Store, Inc. | | | 97,028 | | | | 8,101 | |
| | Designer Brands, Inc. | | | 809,445 | | | | 10,572 | |
| * | El Pollo Loco Holdings, Inc. | | | 621,574 | | | | 6,116 | |
| | La-Z-Boy, Inc. | | | 527,163 | | | | 12,499 | |
| | Oxford Industries, Inc. | | | 159,638 | | | | 14,166 | |
| | Standard Motor Products, Inc. | | | 411,785 | | | | 18,526 | |
| * | Taylor Morrison Home Corporation | | | 424,275 | | | | 9,911 | |
| * | Tri Pointe Homes, Inc. | | | 539,176 | | | | 9,096 | |
| * | Universal Electronics, Inc. | | | 237,226 | | | | 6,066 | |
| * | Urban Outfitters, Inc. | | | 480,239 | | | | 8,961 | |
| | Winnebago Industries, Inc. | | | 219,195 | | | | 10,644 | |
| | | | | | | | | 147,846 | |
| | Real Estate—6.2% | | | | | | | | |
| | Brandywine Realty Trust | | | 720,012 | | | | 6,941 | |
| | CareTrust REIT, Inc. | | | 210,636 | | | | 3,884 | |
| | CatchMark Timber Trust, Inc. | | | 194,326 | | | | 1,955 | |
| | Empire State Realty Trust, Inc. | | | 1,258,988 | | | | 8,851 | |
| | Four Corners Property Trust, Inc. | | | 404,189 | | | | 10,747 | |
| | Kite Realty Group Trust | | | 874,358 | | | | 15,118 | |
| | Pebblebrook Hotel Trust | | | 629,135 | | | | 10,425 | |
| * | Sunstone Hotel Investors, Inc. | | | 1,047,178 | | | | 10,388 | |
| | UMH Properties, Inc. | | | 612,875 | | | | 10,823 | |
| | | | | | | | | 79,132 | |
| | Materials—6.1% | | | | | | | | |
| | Greif, Inc. | | | 226,544 | | | | 14,132 | |
| | Kaiser Aluminum Corporation | | | 146,357 | | | | 11,575 | |
| | Materion Corporation | | | 200,039 | | | | 14,749 | |
| | Minerals Technologies, Inc. | | | 179,067 | | | | 10,984 | |
| | Myers Industries, Inc. | | | 567,359 | | | | 12,896 | |
| | Orion Engineered Carbons S.A.† | | | 856,092 | | | | 13,295 | |
| | | | | | | | | 77,631 | |
See accompanying Notes to Financial Statements.
| 30 | Semiannual Report | June 30, 2022 |
Small Cap Value Fund
Portfolio of Investments, June 30, 2022 (all dollar amounts in thousands) (unaudited)
| | Issuer | | Shares or
Principal
Amount | | | Value | |
| | | | | | | | |
| | Common Stocks—(continued) | | | | | | | | |
| | Health Care—5.2% | | | | | | | | |
| * | ANI Pharmaceuticals, Inc. | | | 211,822 | | | $ | 6,285 | |
| * | Hanger, Inc. | | | 633,700 | | | | 9,074 | |
| * | Lantheus Holdings, Inc. | | | 295,106 | | | | 19,486 | |
| * | ModivCare, Inc. | | | 111,723 | | | | 9,441 | |
| * | NextGen Healthcare, Inc. | | | 410,198 | | | | 7,154 | |
| * | NuVasive, Inc. | | | 52,772 | | | | 2,594 | |
| | Owens & Minor, Inc. | | | 385,997 | | | | 12,140 | |
| | | | | | | | | 66,174 | |
| | Energy—4.9% | | | | | | | | |
| * | Dril-Quip, Inc. | | | 426,348 | | | | 11,000 | |
| * | Earthstone Energy, Inc. | | | 596,341 | | | | 8,140 | |
| * | Expro Group Holdings N.V.† | | | 833,906 | | | | 9,607 | |
| | Matador Resources Co. | | | 431,861 | | | | 20,120 | |
| | SM Energy Co. | | | 407,370 | | | | 13,928 | |
| | | | | | | | | 62,795 | |
| | Consumer Staples—4.9% | | | | | | | | |
| | Cal-Maine Foods, Inc. | | | 286,258 | | | | 14,144 | |
| * | Central Garden & Pet Co. | | | 277,891 | | | | 11,119 | |
| | Edgewell Personal Care Co. | | | 382,420 | | | | 13,201 | |
| | Spectrum Brands Holdings, Inc. | | | 117,841 | | | | 9,665 | |
| * | TreeHouse Foods, Inc. | | | 331,477 | | | | 13,862 | |
| | | | | | | | | 61,991 | |
| | Utilities—2.2% | | | | | | | | |
| | NorthWestern Corporation | | | 240,117 | | | | 14,150 | |
| | Spire, Inc. | | | 178,311 | | | | 13,261 | |
| | | | | | | | | 27,411 | |
| | Communication Services—1.1% | | | | | | | | |
| | John Wiley & Sons, Inc. | | | 301,770 | | | | 14,413 | |
| | Total Common Stocks—98.9%
(cost $1,300,140) | | | | | | | 1,255,009 | |
| | | | | | | | | | |
| | Repurchase Agreement | | | | | | | | |
| | Fixed Income Clearing Corporation,
0.240% dated 6/30/22, due 7/1/22,
repurchase price $9,674, collateralized
by U.S. Treasury Note, 1.625%,
due 05/15/31, valued at $9,868 | | | $9,674 | | | | 9,674 | |
| | Total Repurchase Agreement—0.8%
(cost $9,674) | | | | | | | 9,674 | |
| | Total Investments—99.7%
(cost $1,309,814) | | | | | | | 1,264,683 | |
| | Cash and other assets, less liabilities—0.3% | | | | | | | 4,017 | |
| | Net assets—100.0% | | | | | | $ | 1,268,700 | |
| | | | | | | | | | |
REIT = Real Estate Investment Trust
† = U.S. listed foreign security
* = Non-income producing security
See accompanying Notes to Financial Statements.
| June 30, 2022 | William Blair Funds | 31 |
Global Markets Review and Outlook
Financial markets remained turbulent through the second quarter of 2022 as heightened inflationary pressures, the prospect for more aggressive interest rate hikes, and the ongoing war in Ukraine continued to weigh on investor sentiment. Global equities declined further (the MSCI ACWI IMI returned -15.83% in the second quarter and -20.44% for the six months ended June 30, 2022, in USD terms). Growth equities continued to underperform value-oriented equities (the MSCI ACWI IMI Growth declined 20.10% for the second quarter and 27.95% for the six months ended June 30, 2022, while the MSCI ACWI IMI Value declined 11.88% for the second quarter and 12.83% for the six months ended June 30, 2022). This was evident from a global sector perspective as Information Technology (-21.67% for the second quarter and -29.8% for the six months ended June 30, 2022, measured by the MSCI AC World IMI) and Consumer Discretionary (-20.09% for the second quarter and -29.38% for the six months ended June 30, 2022, measured by the MSCI AC World IMI) declined while energy stocks continued to stay positive on a year-to-date basis (-5.77% for the second quarter and +15.57% for the six months ended June 30, 2022, measured by the MSCI AC World IMI) on strong crude oil prices. The underperformance of growth equities has been highly correlated to inflationary pressures and rapid increase in interest rates, which has led to significant multiple contraction for growth and long-duration companies in particular.
Developed markets declined (-16.31% for the second quarter and -20.76% for the six months ended June 30, 2022) as measured by the MSCI World IMI. U.S. equities declined (-16.85% for the second quarter and -21.33% for the six months ended June 30, 2022, measured by the MSCI USA IMI) as U.S. yields hit levels that haven’t been seen in nearly a decade. In June, headline inflation surged to 8.6% year-on-year, hitting yet another 40-year high, modestly higher than consensus. The Federal Reserve approved an interest rate increase of 0.75%, noting this type of front-loading rate hikes provides optionality and alluded to a potential 0.50%-0.75% increase in July.
European equities also declined (-15.22% for the second quarter and -21.97% for the six months ended June 30, 2022) as measured by the MSCI Europe IMI. Within the U.K. (-11.88% for the second quarter and -12.91% for the six months ended June 30, 2022, measured by the MSCI United Kingdom IMI), inflation hit a new record in June of 9.1% year-on-year. Similarly, Europe ex-U.K. also declined (-16.32% for the second quarter and -24.72% for the six months ended June 30, 2022, measured by the MSCI Europe ex-U.K. IMI) with intensifying inflation, hawkish interest rate expectations and recessionary fears looming. Growth in Germany and France slowed, and estimates of French, German, and Euro Zone purchasing managers index readings came in weaker than expected in June, further fueling recessionary fears.
Emerging markets declined (-12.10% for the second quarter and -17.94% for the six months ended June 30, 2022 as measured by the MSCI EM IMI) broadly across countries. Chinese equities rallied (+3.28% for the second quarter and -11.46% for the six months ended June 30, 2022, measured by the MSCI China IMI) as COVID lockdowns continued to ease, for the time being, leading to accelerated demand. The prospect of government stimulus to help offset headwinds to growth also bolstered investor sentiment. Nevertheless, the regulatory overhang and heightened geopolitical risks remain in the forefront. Conversely, Latin America returns sharply reversed from the first quarter (-22.42% for the second quarter and -1.99% for the six months ended June 30, 2022, measured by the MSCI EM Latin America IMI) as global inflation takes its toll. Brazil (-25.21% for the second quarter and +0.36% for the six months ended June 30, 2022, measured by the MSCI Brazil IMI) declined amid soaring inflation and the Selic policy rate spiking to 13.25% in June from 2% in early 2021.
Financial markets remained turbulent through the second quarter of 2022 as inflationary pressures, the prospect for more aggressive interest rate hikes and the ongoing war in Ukraine continued to weigh on investor sentiment. Looking to the balance of this year, we expect a number of these macroeconomic and market trends to persist at least for the near future, however we feel the market impacts of these factors are waning and the potential for a deep or prolonged recession is still unlikely.
As we discussed in the prior shareholder report commentary, the previous two years have been unique in many ways. Our assessment of a post-pandemic world has changed based on the implications of Russia’s invasion of Ukraine where the risk of higher prices and lower growth have increased from our original forecasts. We now expect U.S. inflation to peak later this summer and to roll over much more gradually than previously expected. Within Europe, we expect the peak to come later, as compared to the U.S., as energy and commodity prices continue to drive inflation. We also continue to monitor wage growth, which remains a key variable but remains negative in real terms and has not added to inflationary pressure at this point.
We expect growth to continue to slow, settling to levels below our earlier projections. In our view, European growth is most at risk, and will likely be materially lower, approaching zero sequentially as the impacts of the war will limit the European economy’s ability to reach its pre-COVID GDP trajectories this year. Within the U.S., we expect growth to increase +2-3% for the year, but sequential growth will also fall to near-zero. While the probability of a recession will increase, we believe a deep or prolonged recession remains unlikely.
| 32 | Semiannual Report | June 30, 2022 |
Global Markets Review and Outlook
The rising rate and strong dollar backdrop can be problematic for emerging markets, but every cycle is unique, and our outlook remains region and country specific. The major Latin America and the Middle East countries are actually well-positioned for the environment in our view. In Asia, India may be more vulnerable given their commodity dependence, and generally high market valuation. We have begun to see some easing of the COVID lockdowns in China that will likely lead to accelerating demand, however the low vaccination rate amongst the older population and potential for a resurgence and its effect on growth remains in the forefront. The regulatory overhang and heightened geopolitical risks continue to weigh on sentiment, though the recent regulatory cycle has peaked. Conversely, we think the government’s focus on stable economic growth will lead to moderate fiscal stimulus and potential for monetary easing, in stark contrast to many other major countries. Valuations in China appear far more attractive.
Corporate earnings growth, especially outside the U.S., is widely expected to decelerate throughout much of 2022, yet we have seen very few negative revisions. Given the persistent inflation and macro-economic uncertainty, we expect that to change with second quarter corporate reports and the related outlook commentary for the balance of the year. While some of that expected deceleration has been reflected in multiple contraction, negative earnings revisions may continue to put further downward pressure on multiples.
We’ve created a framework that combines the growth and inflation influences with corporate profit growth and stock valuations so we can understand portfolio positioning and risks. While our base case is that we avoid a deep recession and inflation ultimately proves manageable, we are broadening out the growth and valuation profiles of our strategies to create more balance in this time of economic uncertainty.
For at least the balance of this year, we will focus our research on companies that can manage input costs and pricing power, protecting their growth and margins. Higher quality companies should be able to demonstrate their leadership, and with the valuation contraction of quality, we think this will be fruitful for us. Markets are likely to focus on visibility of growth, relative changes to growth rates, and lower duration equities.
Longer term, we believe the outlook for equity investing may be shifting as well, with increased risk that the growth, inflation, and interest rate environment may be different than what we have experienced in the recent past. Thus, the backdrop for growth equities and risk assets may continue to be under some pressure.
While the foregoing may seem to present a style headwind, we will continue to focus on innovation and disruption, which has arguably accelerated, and our unique approach as equity investors. We have continued to see a dynamic shifting of corporate winners and losers. We believe the durability or improvements in corporate competitive advantage remain underappreciated. While the precise value of those anticipated advantages will need to be recalibrated slightly, we believe that our continued understanding of companies that have differentiated, durable competitive advantages will remain integral to our growth investment strategy.
We continue to see the ongoing shift towards digitalization across myriad industries, particularly accelerating in the industrial side of the economy. We reflect on what 4G did for the consumer side of the economy, and what 5G could do for industrials, healthcare, and other sectors.
In addition, in the last decade we have seen a unique concentration of winners, both within entire industries as well as individual companies. We think this may be at risk of shifting back into something more balanced, similar to what we have seen in decades prior. We are also interested in industries that fit into this notion of a shifting opportunity set, including those that have not experienced much growth recently but could benefit from the environment we are likely to be in. Examples may include banks and natural resource companies in different parts of the world.
Last, we believe we have the advantage of breadth. Our investment eligibility list has always been inclusive of high-quality, high-return companies with varying growth rates across several industries and countries. We expect to identify similarly diverse growth opportunities in the future.
| June 30, 2022 | William Blair Funds | 33 |
| | Global Leaders Fund |
| | |
| | The Global Leaders Fund seeks long-term capital appreciation. |
| | |
| | AN OVERVIEW FROM THE PORTFOLIO MANAGERS |
| | |

Andrew G. Flynn, CFA 
Kenneth J. McAtamney 
Hugo Scott-Gall | The William Blair Global Leaders Fund (Class N shares) (the “Fund”) posted a 30.99% decrease, net of fees, for the six months ended June 30, 2022. By comparison, the Fund’s benchmark index, the MSCI All Country World IMI (net) (the “Index”), decreased 20.44%. Underperformance versus the Index was largely due to style headwinds amid strong outperformance of low-valuation stocks. From an attribution perspective, stock selection was weak across most sectors, especially Health Care and Industrials. Within Health Care, Align Technology (“Align”), the maker of Invisalign clear aligners for the orthodontics market, weighed on relative performance. Align is the technology leader in the orthodontics space, with a strong track record of innovation in clear aligners and the digital orthodontics ecosystem such as intraoral scanners. Since Align’s U.S. patent expirations in 2017-2018, competition from traditional orthodontic players has only reinforced the company’s long-standing claim that clear aligners are a highly effective way of treating malocclusion for mild, moderate, and complex cases. As a result, the adoption of clear aligners is accelerating and appears to be nearing an inflection point. The share price came under pressure after the company reported first quarter results below expectations, primarily driven by lockdowns in China, waning consumer confidence driven by increasing inflationary pressures and supply chain disruptions, and the military conflict in Ukraine and resulting fallout across Europe. An overweight allocation and weaker stock selection within Information Technology also hampered performance. Within Information Technology, Infineon Technologies (“Infineon”), a leading semiconductor company based in Germany, hampered relative performance. Infineon is a leader in structural opportunities in automotive and power markets. We believe that this should continue to enable superior growth driven by content gains and supportive regulation. Despite solid quarterly earnings, Infineon’s share price softened alongside semiconductor peers as a part of the broad style rotation early in the period. Management also reiterated that supply constraints continue to limit overall growth, but shortages have started to ease. Partially offsetting these effects was the benefit of underweighting within Communication Services and overweighting within Health Care. Positive stock selection within the specialty retail industry within Consumer Discretionary was primarily driven by Ulta Beauty. We believe that Ulta Beauty is well-positioned to expand share in the structurally attractive beauty category, benefiting from strong customer engagement due to its well-managed loyalty program, a continued shift away from department stores, and an expanding portfolio of products, including a higher mix of more profitable prestige brands and skincare products. The company has strong digital capabilities, coupled with an attractive retail experience that continues to drive in-store traffic, making Ulta Beauty’s business more defensible against disruption from online competitors. The share price strengthened on strong fourth-quarter results as top-line growth was primarily driven by better-than-expected holiday sales and a rational promotional environment. From a regional perspective, overweighting within Developed Asia ex-Japan was also beneficial, especially given strength from AIA. AIA is the leading life insurer across Asia ex-Japan. We believe it should continue to benefit from strong secular growth as a result of rising affluence, low insurance penetration, and favorable demographics given its strong brand and distribution. AIA is also a key beneficiary of China’s liberalization of the life insurance industry. Its competitive advantages include business process (strong underwriting), brand distinction (well-known, established in Shanghai in 1919), and culture. Eased border restrictions with Hong Kong and a broader reopening within China, increasing U.S. yields, and rising awareness of the value of insurance protection post-pandemic position AIA as a strong recovery opportunity. Please refer to the Global Markets Review and Outlook relating to the Fund beginning on page 32. |
| | | |
| 34 | Semiannual Report | June 30, 2022 |
Global Leaders Fund
Performance Highlights (Unaudited)
Average Annual Total Returns through 6/30/2022
| | | Year to
Date | | 1 Year | | 3 Year | | 5 Year | | 10 Year | | Since
Inception(a) |
| Class N | | | (30.99 | )% | | | (27.40 | )% | | | 4.87 | % | | | 7.87 | % | | | 8.79 | % | | | — | % |
| Class I | | | (30.86 | ) | | | (27.22 | ) | | | 5.12 | | | | 8.15 | | | | 9.09 | | | | — | |
| Class R6 | | | (30.83 | ) | | | (27.15 | ) | | | 5.21 | | | | 8.23 | | | | — | | | | 8.72 | |
| MSCI ACW IMI (net) | | | (20.44 | ) | | | (16.52 | ) | | | 5.98 | | | | 6.70 | | | | 8.71 | | | | 8.02 | |
| | |
| (a) | Since inception is for the period from December 19, 2012 (Commencement of Operations) to June 30, 2022. |
Performance cited represents past performance. Past performance does not guarantee future results and current performance may be lower or higher than the data quoted. Results shown are average annual total returns, which assume reinvestment of dividends and capital gains. Investment returns and principal will fluctuate and you may have a gain or loss when you sell shares. For the most current month-end performance information, please call 1-800-742-7272, or visit our Web site at www.williamblairfunds.com. Investing in smaller and medium capitalization companies involves special risks, including higher volatility and lower liquidity. Smaller and medium capitalization stocks are also more sensitive to purchase/sale transactions and changes in the issuer’s financial condition. International investing involves special risk considerations, including currency fluctuations, lower liquidity, economic and political risk. From time to time, the investment adviser may waive fees or reimburse expenses for the Fund. Without these waivers/reimbursements, performance would be lower. Class N shares are not subject to a sales load. Class I shares are not subject to a sales load or distribution (Rule 12b-1) fees. Class R6 shares are not subject to a sales load, distribution (Rule 12b-1) fees, or sub-transfer agent fees.
The performance highlights and graph presented above do not reflect the deduction of taxes that a shareholder would pay on fund distributions or the redemption of fund shares.
The Morgan Stanley Capital International (MSCI) All Country World (ACW) Investable Market Index (IMI) (net) is a free float-adjusted market capitalization weighted index that is designed to measure the equity market of developed and emerging markets. This index approximates the minimum possible dividend reinvestment by deducting for the highest possible withholding tax rates of those markets.
This report identifies the Fund’s investments on June 30, 2022. These holdings are subject to change. Not all stocks in the Fund performed the same, nor is there any guarantee that these stocks will perform as well in the future. Market forecasts provided in this report may not necessarily come to pass.
Sector Diversification (Unaudited)
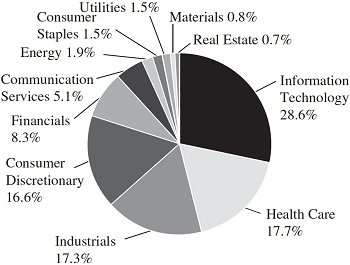
The sector diversification shown is based on the total long-term securities.
| June 30, 2022 | William Blair Funds | 35 |
Global Leaders Fund
Portfolio of Investments, June 30, 2022 (all dollar amounts in thousands) (unaudited)
| | | | | | | | |
| | | | | | | | |
| | Issuer | | Shares | | | Value | |
| | | | | | | | |
| | Common Stocks | | | | | | | | |
| | | | | | | | | | |
| | Western Hemisphere—52.9% | | | | | | | | |
| | Canada—1.3% | | | | | | | | |
| * | Lululemon Athletica, Inc. (Textiles, apparel & luxury goods) | | | 4,655 | | | $ | 1,269 | |
| | United States—51.6% | | | | | | | | |
| * | Adobe, Inc. (Software) | | | 2,977 | | | | 1,090 | |
| * | Align Technology, Inc. (Health care equipment & supplies) | | | 2,080 | | | | 492 | |
| * | Alphabet, Inc. Class “A” (Interactive Media & Services) | | | 1,485 | | | | 3,236 | |
| * | Amazon.com, Inc. (Internet & direct marketing retail) | | | 22,947 | | | | 2,437 | |
| * | Autodesk, Inc. (Software) | | | 6,634 | | | | 1,141 | |
| | BlackRock, Inc. (Capital markets) | | | 2,147 | | | | 1,308 | |
| * | Charles River Laboratories International, Inc. (Life sciences tools & services) | | | 6,287 | | | | 1,345 | |
| * | CoStar Group, Inc. (Professional services) | | | 18,729 | | | | 1,131 | |
| | Ecolab, Inc. (Chemicals) | | | 5,115 | | | | 786 | |
| * | Edwards Lifesciences Corporation (Health care equipment & supplies) | | | 14,272 | | | | 1,357 | |
| | Fidelity National Information Services, Inc. (IT services) | | | 7,078 | | | | 649 | |
| * | IDEXX Laboratories, Inc. (Health care equipment & supplies) | | | 2,960 | | | | 1,038 | |
| | Intercontinental Exchange, Inc. (Capital markets) | | | 13,852 | | | | 1,303 | |
| * | Intuitive Surgical, Inc. (Health care equipment & supplies) | | | 4,609 | | | | 925 | |
| | Mastercard, Inc. Class “A” (IT services) | | | 9,661 | | | | 3,048 | |
| * | Meta Platforms, Inc. Class “A” (Interactive Media & Services) | | | 9,369 | | | | 1,511 | |
| | Microsoft Corporation (Software) | | | 13,696 | | | | 3,518 | |
| | NextEra Energy, Inc. (Electric utilities) | | | 18,002 | | | | 1,394 | |
| | NIKE, Inc. Class “B” (Textiles, apparel & luxury goods) | | | 13,268 | | | | 1,356 | |
| * | PayPal Holdings, Inc. (IT services) | | | 9,711 | | | | 678 | |
| | Prologis, Inc. (Equity REIT) | | | 5,941 | | | | 699 | |
| | Roper Technologies, Inc. (Industrial conglomerates) | | | 3,184 | | | | 1,257 | |
| * | salesforce.com, Inc. (Software) | | | 13,048 | | | | 2,153 | |
| * | SVB Financial Group (Banks) | | | 2,095 | | | | 827 | |
| * | Synopsys, Inc. (Software) | | | 5,697 | | | | 1,730 | |
| | The Estee Lauder Cos., Inc. Class “A” (Personal products) | | | 5,543 | | | | 1,412 | |
| | Thermo Fisher Scientific, Inc. (Life sciences tools & services) | | | 3,615 | | | | 1,964 | |
| * | Ulta Beauty, Inc. (Specialty retail) | | | 5,195 | | | | 2,003 | |
| | Union Pacific Corporation (Road & rail) | | | 9,099 | | | | 1,941 | |
| | UnitedHealth Group, Inc. (Health care providers & services) | | | 4,529 | | | | 2,326 | |
| * | Veeva Systems, Inc. Class “A” (Health care technology) | | | 2,813 | | | | 557 | |
| * | Workday, Inc. Class “A” (Software) | | | 8,433 | | | | 1,177 | |
| | Zoetis, Inc. (Pharmaceuticals) | | | 8,265 | | | | 1,421 | |
| | | | | | | | | 49,210 | |
| | | | | | | | |
| | | | | | | | |
| | Issuer | | Shares | | | Value | |
| | | | | | | | |
| | Common Stocks—(continued) | | | | | | | | |
| | | | | | | | | | |
| | Europe—23.9% | | | | | | | | |
| | Denmark—3.6% | | | | | | | | |
| | DSV A/S (Air freight & logistics) | | | 9,298 | | | $ | 1,298 | |
| | Novo Nordisk A/S Class “B” (Pharmaceuticals) | | | 19,755 | | | | 2,191 | |
| | | | | | | | | 3,489 | |
| | France—4.6% | | | | | | | | |
| | Airbus SE (Aerospace & defense) | | | 28,013 | | | | 2,714 | |
| | LVMH Moet Hennessy Louis Vuitton SE (Textiles, apparel & luxury goods) | | | 2,780 | | | | 1,695 | |
| | | | | | | | | 4,409 | |
| | Germany—3.9% | | | | | | | | |
| | Infineon Technologies AG (Semiconductors & semiconductor equipment) | | | 60,934 | | | | 1,475 | |
| | MTU Aero Engines AG (Aerospace & defense) | | | 9,719 | | | | 1,769 | |
| | Rational AG (Machinery) | | | 828 | | | | 481 | |
| | | | | | | | | 3,725 | |
| | Ireland—2.3% | | | | | | | | |
| * | Aptiv plc (Auto components)† | | | 14,625 | | | | 1,303 | |
| * | Ryanair Holdings plc—ADR (Airlines) | | | 12,936 | | | | 870 | |
| | | | | | | | | 2,173 | |
| | Netherlands—1.5% | | | | | | | | |
| * | Adyen N.V. (IT services) | | | 979 | | | | 1,424 | |
| | Sweden—5.3% | | | | | | | | |
| | Atlas Copco AB Class “A” (Machinery) | | | 150,335 | | | | 1,404 | |
| | Evolution AB (Hotels, restaurants & leisure) | | | 11,302 | | | | 1,028 | |
| | Hexagon AB Class “B” (Electronic equipment, instruments & components) | | | 182,833 | | | | 1,899 | |
| | Indutrade AB (Machinery) | | | 38,908 | | | | 709 | |
| | | | | | | | | 5,040 | |
| | Switzerland—2.7% | | | | | | | | |
| | Lonza Group AG (Life sciences tools & services) | | | 2,605 | | | | 1,389 | |
| | Partners Group Holding AG (Capital markets) | | | 1,322 | | | | 1,191 | |
| | | | | | | | | 2,580 | |
| | | | | | | | | | |
| | Asia—6.1% | | | | | | | | |
| | Australia—3.8% | | | | | | | | |
| | Aristocrat Leisure, Ltd. (Hotels, restaurants & leisure) | | | 62,789 | | | | 1,490 | |
| * | Atlassian Corporation plc Class “A” (Software)† | | | 5,688 | | | | 1,066 | |
| | CSL, Ltd. (Biotechnology) | | | 5,957 | | | | 1,106 | |
| | | | | | | | | 3,662 | |
| | Hong Kong—1.8% | | | | | | | | |
| | AIA Group, Ltd. (Insurance) | | | 157,200 | | | | 1,704 | |
| | New Zealand—0.5% | | | | | | | | |
| | Fisher & Paykel Healthcare Corp., Ltd. (Health care equipment & supplies) | | | 41,225 | | | | 515 | |
See accompanying Notes to Financial Statements.
| 36 | Semiannual Report | June 30, 2022 |
Global Leaders Fund
Portfolio of Investments, June 30, 2022 (all dollar amounts in thousands) (unaudited)
| | | | | | | | |
| | | | | | | | |
| | Issuer | | Shares | | | Value | |
| | | | | | | | |
| | Common Stocks—(continued) | | | | | | | | |
| | | | | | | | | | |
| | Emerging Asia—5.5% | | | | | | | | |
| | India—3.4% | | | | | | | | |
| | HDFC Bank, Ltd.—ADR (Banks) | | | 26,158 | | | $ | 1,438 | |
| * | Reliance Industries, Ltd. (Oil, gas & consumable fuels) | | | 53,534 | | | | 1,755 | |
| | | | | | | | | 3,193 | |
| | Taiwan—2.1% | | | | | | | | |
| | Taiwan Semiconductor Manufacturing Co., Ltd.—ADR (Semiconductors & semiconductor equipment) | | | 24,974 | | | | 2,041 | |
| | | | | | | | | | |
| | United Kingdom—5.2% | | | | | | | | |
| | Compass Group plc (Hotels, restaurants & leisure) | | | 120,275 | | | | 2,460 | |
| | Experian plc (Professional services) | | | 38,552 | | | | 1,129 | |
| | Halma plc (Electronic equipment, instruments & components) | | | 14,530 | | | | 355 | |
| | Rentokil Initial plc (Commercial services & supplies) | | | 179,934 | | | | 1,040 | |
| | | | | | | | | 4,984 | |
| | | | | | | | | | |
| | Japan—3.0% | | | | | | | | |
| | Daikin Industries, Ltd. (Building products) | | | 7,400 | | | | 1,187 | |
| | Keyence Corporation (Electronic equipment, instruments & components) | | | 3,200 | | | | 1,094 | |
| | Nihon M&A Center Holdings, Inc. (Professional services) | | | 53,900 | | | | 573 | |
| | | | | | | | | 2,854 | |
| | | | | | | | | | |
| | Emerging Latin America—1.5% | | | | | | | | |
| | Argentina—1.5% | | | | | | | | |
| * | Globant S.A. (IT services)† | | | 5,343 | | | | 930 | |
| * | MercadoLibre, Inc. (Internet & direct marketing retail) | | | 742 | | | | 472 | |
| | | | | | | | | 1,402 | |
| | Total Common Stocks—98.1%
(cost $70,474) | | | | | | | 93,674 | |
| | | | | | | | |
| | Issuer | | Principal
Amount | | | Value | |
| | | | | | | | |
| | Repurchase Agreement | | | | | | | | |
| | Fixed Income Clearing Corporation, 0.240% dated 6/30/22, due 7/1/22, repurchase price $630, collateralized by U.S. Treasury Note, 1.625%, due 05/15/31, valued at $643 | | | $630 | | | $ | 630 | |
| | Total Repurchase Agreement—0.7%
(cost $630) | | | | | | | 630 | |
| | Total Investments—98.8%
(cost $71,104) | | | | | | | 94,304 | |
| | Cash and other assets, less liabilities—1.2% | | | | | | | 1,129 | |
| | Net assets—100.0% | | | | | | $ | 95,433 | |
ADR = American Depository Receipt
REIT = Real Estate Investment Trust
* = Non-income producing security
† = U.S. listed foreign security
At June 30, 2022, the Fund’s Portfolio of Investments includes the following industry categories (as a percentage of long-term investments):
| Information Technology | | 28.6 | % |
| Health Care | | 17.7 | % |
| Industrials | | 17.3 | % |
| Consumer Discretionary | | 16.6 | % |
| Financials | | 8.3 | % |
| Communication Services | | 5.1 | % |
| Energy | | 1.9 | % |
| Consumer Staples | | 1.5 | % |
| Utilities | | 1.5 | % |
| Materials | | 0.8 | % |
| Real Estate | | 0.7 | % |
| Total | | 100.0 | % |
At June 30, 2022, the Fund’s Portfolio of Investments includes the following currency categories (as a percentage of long-term investments):
| U.S. Dollar | | 62.6 | % |
| Euro | | 10.2 | % |
| Swedish Krona | | 5.4 | % |
| British Pound Sterling | | 5.3 | % |
| Danish Krone | | 3.7 | % |
| Japanese Yen | | 3.0 | % |
| Australian Dollar | | 2.8 | % |
| Swiss Franc | | 2.8 | % |
| Indian Rupee | | 1.9 | % |
| Hong Kong Dollar | | 1.8 | % |
| All Other Currencies | | 0.5 | % |
| Total | | 100.0 | % |
See accompanying Notes to Financial Statements.
| June 30, 2022 | William Blair Funds | 37 |
| | International Leaders Fund |
| | |
| | The International Leaders Fund seeks long-term capital appreciation. |
| | |
| | AN OVERVIEW FROM THE PORTFOLIO MANAGERS |
| | |

Simon Fennell 
Kenneth J. McAtamney 
Alaina Anderson, CFA | The William Blair International Leaders Fund (Class N shares) (the “Fund”) posted a 31.18% decrease, net of fees, for the six months ended June 30, 2022. By comparison, the Fund’s benchmark index, the MSCI All Country World ex-U.S. IMI (net) (the “Index”), decreased 19.08%. Underperformance versus the Index was primarily driven by negative stock selection across most sectors. The Industrials and Health Care sectors were the largest sources of relative returns. Within the Industrials sector, Kingspan and Ashtead were the largest sources of underperformance. Kingspan is a leading building materials company that has developed a differentiated technology within insulated panels. We believe it should continue to gain market share globally given the strong value proposition it offers customers. The primary advantage of its insulation products is energy efficiency, improved durability, reduced maintenance costs, and faster construction times. We expect that these “green” products also stand to benefit from existing and future legislation from nations looking to reduce their carbon footprint. While recent results were strong, with revenue up 48% year-over-year and ahead of consensus, the company signaled a slowdown in orders amid economic weakness. Kingspan was one of the top-performing stocks in our portfolio last year, and we trimmed back the position prior to the deterioration in outlook. With a P/E multiple of 16 times, the company is trading near decade-low multiples. Ashtead, which operates under the Sunbelt brand, rents a broad range of construction and industrial equipment from general tools to specialty equipment. The rental business is simple, with the rental provider offering customers homogenous products. While simplistic, Ashtead has the key benefit of scale in a largely fragmented market. The benefits of scale are significant. Ashtead is able to buy equipment cheaper than the competition, it has a large and well-invested fleet to meet customer needs, and it has a wide-reaching and growing distribution network, ensuring that equipment is closer to the customer. These advantages have driven growth in cash flow, in turn driving further investment that has resulted in share gains and greater scale. The company’s recent results were above consensus, with rental revenue up 22%. Despite these results, the stock is down year-to-date as valuations have compressed. Within the Health Care sector, Lonza was the largest detractor to performance. Lonza is a leader in custom manufacturing of biopharmaceuticals and specialty ingredients. It is a premier contract development and manufacturing company with technical expertise in biologics, high-potency active pharma ingredients, and cell and gene therapies. As a preferred global partner to the biopharma industry, Lonza has enduring relationships that span the lifecycle of its partners’ portfolios of pharmaceuticals. It has a pipeline of more than 800 drugs and in our view is well positioned to sustainably grow faster than the industry. Demand remains strong. The level of cash on hand at biotech companies is expected to be very robust for the next two to three years, and the company’s pipeline is tilted toward later stages of development. We trimmed the position in the second quarter at higher levels, and despite strong corporate performance, the Stock declined as valuations have compressed. Straumann, the global leader in esthetic dentistry, also detracted from performance. The categories that the company participates in–implants, clear aligners, and digital dentistry–are growing well above global dental market rates. Straumann is more than just a products company. As a total solution provider, it offers training, support, and a wide range of services to the dental industry all over the world. In addition, the company is investing in technology and expanding capacity to make clear aligners a second long-term growth pillar. Straumann was the best performing stock in our portfolio last year, and we trimmed the position earlier this year. Recent results have been strong, with revenue up 27% in the second quarter. Despite those results, the stock declined as valuations have compressed. Partially offsetting these effects was an underweight to the Consumer Discretionary, an underweight to Emerging Middle East and Africa, and an overweight to U.K. Please refer to the Global Markets Review and Outlook relating to the Fund beginning on page 32. |
| | | |
| 38 | Semiannual Report | June 30, 2022 |
International Leaders Fund
Performance Highlights (Unaudited)
Average Annual Total Returns through 6/30/2022
| | | Year to
Date | | 1 Year | | 3 Year | | 5 Year | | Since
Inception |
| Class N(a) | | | (31.18 | )% | | | (28.77 | )% | | | 1.42 | % | | | 4.32 | % | | | 6.73 | % |
| Class I(a) | | | (31.09 | ) | | | (28.59 | ) | | | 1.67 | | | | 4.58 | | | | 7.00 | |
| MSCI ACW ex-U.S. IMI (net)(a) | | | (19.08 | ) | | | (19.86 | ) | | | 1.55 | | | | 2.50 | | | | 4.60 | |
| Class R6(b) | | | (31.09 | ) | | | (28.59 | ) | | | 1.71 | | | | 4.64 | | | | 6.99 | |
| MSCI ACW ex-U.S. IMI (net)(b) | | | (19.08 | ) | | | (19.86 | ) | | | 1.55 | | | | 2.50 | | | | 4.30 | |
| | |
| (a) | Since inception is for the period from August 16, 2012 (Commencement of Operations) to June 30, 2022. |
| (b) | Since inception is for the period from November 2, 2012 (Commencement of Operations) to June 30, 2022. |
Performance cited represents past performance. Past performance does not guarantee future results and current performance may be lower or higher than the data quoted. Results shown are average annual total returns, which assume reinvestment of dividends and capital gains. Investment returns and principal will fluctuate and you may have a gain or loss when you sell shares. For the most current month-end performance information, please call 1-800-742-7272, or visit our Web site at www.williamblairfunds.com. Investing in smaller and medium capitalization companies involves special risks, including higher volatility and lower liquidity. Smaller and medium capitalization stocks are also more sensitive to purchase/sale transactions and changes in the issuer’s financial condition. International investing involves special risk considerations, including currency fluctuations, lower liquidity, economic and political risk. From time to time the investment adviser may waive fees or reimburse expenses for the Fund. Without these waivers/reimbursements, performance would be lower. Class N shares are not subject to a sales load. Class I shares are not subject to a sales load or distribution (Rule 12b-1) fees. Class R6 shares are not subject to a sales load, distribution (Rule 12b-1) fees, or sub-transfer agent fees.
The performance highlights presented above do not reflect the deduction of taxes that a shareholder would pay on fund distributions or the redemption of fund shares.
The Morgan Stanley Capital International (MSCI) All Country World (ACW) ex-U.S. Investable Market Index (IMI) (net) is a free float-adjusted market capitalization weighted index that is designed to measure the equity market performance of developed and emerging markets, excluding the United States. This index approximates the minimum possible dividend reinvestment by deducting for the highest possible withholding tax rates of those markets.
This report identifies the Fund’s investments on June 30, 2022. These holdings are subject to change. Not all stocks in the Fund performed the same, nor is there any guarantee that these stocks will perform as well in the future. Market forecasts provided in this report may not necessarily come to pass.
Sector Diversification (Unaudited)
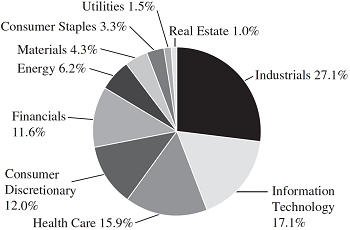
The sector diversification shown is based on the total long-term securities.
| June 30, 2022 | William Blair Funds | 39 |
International Leaders Fund
Portfolio of Investments, June 30, 2022 (all dollar amounts in thousands) (unaudited)
| | | | | | | | |
| | | | | | | | |
| | Issuer | | Shares | | | Value | |
| | | | | | | | |
| | Common Stocks | | | | | | | | |
| | | | | | | | | | |
| | Europe—49.9% | | | | | | | | |
| | Belgium—1.4% | | | | | | | | |
| | KBC Group N.V. (Banks) | | | 242,949 | | | $ | 13,631 | |
| | Denmark—7.3% | | | | | | | | |
| | Chr Hansen Holding A/S (Chemicals) | | | 188,637 | | | | 13,730 | |
| | Coloplast A/S Class “B” (Health care equipment & supplies) | | | 79,093 | | | | 9,008 | |
| | DSV A/S (Air freight & logistics) | | | 88,698 | | | | 12,387 | |
| | Novo Nordisk A/S Class “B” (Pharmaceuticals) | | | 199,382 | | | | 22,114 | |
| | Orsted A/S (Electric utilities) | | | 134,574 | | | | 14,067 | |
| | | | | | | | | 71,306 | |
| | Finland—1.4% | | | | | | | | |
| | Neste Oyj (Oil, gas & consumable fuels) | | | 309,929 | | | | 13,719 | |
| | France—14.7% | | | | | | | | |
| | Airbus SE (Aerospace & defense) | | | 343,671 | | | | 33,296 | |
| | Dassault Systemes SE (Software) | | | 196,643 | | | | 7,236 | |
| | L’Oreal S.A. (Personal products) | | | 37,202 | | | | 12,838 | |
| | LVMH Moet Hennessy Louis Vuitton SE (Textiles, apparel & luxury goods) | | | 40,853 | | | | 24,904 | |
| | Safran S.A. (Aerospace & defense) | | | 259,715 | | | | 25,641 | |
| | Sartorius Stedim Biotech (Life sciences tools & services) | | | 36,962 | | | | 11,593 | |
| | Teleperformance (Professional services) | | | 27,970 | | | | 8,597 | |
| | Vinci S.A. (Construction & engineering) | | | 222,348 | | | | 19,796 | |
| | | | | | | | | 143,901 | |
| | Germany—1.8% | | | | | | | | |
| | Infineon Technologies AG (Semiconductors & semiconductor equipment) | | | 529,519 | | | | 12,813 | |
| | Rational AG (Machinery) | | | 8,773 | | | | 5,098 | |
| | | | | | | | | 17,911 | |
| | Ireland—4.8% | | | | | | | | |
| * | ICON plc (Life sciences tools & services)† | | | 107,554 | | | | 23,307 | |
| | Kingspan Group plc (Building products) | | | 174,065 | | | | 10,470 | |
| * | Ryanair Holdings plc—ADR (Airlines) | | | 192,919 | | | | 12,974 | |
| | | | | | | | | 46,751 | |
| | Luxembourg—1.2% | | | | | | | | |
| | Tenaris S.A. (Energy equipment & services) | | | 918,034 | | | | 11,804 | |
| | Netherlands—3.4% | | | | | | | | |
| * | Adyen N.V. (IT services) | | | 10,464 | | | | 15,221 | |
| | ASML Holding N.V. (Semiconductors & semiconductor equipment) | | | 37,699 | | | | 18,009 | |
| | | | | | | | | 33,230 | |
| | Norway—0.5% | | | | | | | | |
| | TOMRA Systems ASA (Commercial services & supplies) | | | 284,549 | | | | 5,278 | |
| | Spain—2.7% | | | | | | | | |
| * | Amadeus IT Group S.A. (IT services) | | | 471,889 | | | | 26,289 | |
| | | | | | | | |
| | | | | | | | |
| | Issuer | | Shares | | | Value | |
| | | | | | | | |
| | Common Stocks—(continued) | | | | | | | | |
| | | | | | | | | | |
| | Europe—(continued) | | | | | | | | |
| | Sweden—4.5% | | | | | | | | |
| | Atlas Copco AB Class “A” (Machinery) | | | 1,180,537 | | | $ | 11,029 | |
| | EQT AB (Capital markets) | | | 243,294 | | | | 4,980 | |
| | Evolution AB (Hotels, restaurants & leisure) | | | 79,684 | | | | 7,245 | |
| | Hexagon AB Class “B” (Electronic equipment, instruments & components) | | | 1,590,645 | | | | 16,521 | |
| | Indutrade AB (Machinery) | | | 247,876 | | | | 4,520 | |
| | | | | | | | | 44,295 | |
| | Switzerland—6.2% | | | | | | | | |
| | Lonza Group AG (Life sciences tools & services) | | | 40,341 | | | | 21,509 | |
| | Partners Group Holding AG (Capital markets) | | | 12,694 | | | | 11,438 | |
| | Sika AG (Chemicals) | | | 47,079 | | | | 10,849 | |
| | Straumann Holding AG (Health care equipment & supplies) | | | 141,134 | | | | 16,950 | |
| | | | | | | | | 60,746 | |
| | | | | | | | | | |
| | United Kingdom—18.9% | | | | | | | | |
| | Ashtead Group plc (Trading companies & distributors) | | | 254,078 | | | | 10,636 | |
| | AstraZeneca plc (Pharmaceuticals) | | | 204,917 | | | | 26,940 | |
| | Bunzl plc (Trading companies & distributors) | | | 563,822 | | | | 18,662 | |
| | Compass Group plc (Hotels, restaurants & leisure) | | | 1,281,901 | | | | 26,216 | |
| | Diageo plc (Beverages) | | | 435,709 | | | | 18,725 | |
| | Experian plc (Professional services) | | | 463,419 | | | | 13,573 | |
| | Halma plc (Electronic equipment, instruments & components) | | | 212,450 | | | | 5,196 | |
| | Linde plc (Chemicals)† | | | 55,189 | | | | 15,868 | |
| | London Stock Exchange Group plc (Capital markets) | | | 193,164 | | | | 17,946 | |
| | Rentokil Initial plc (Commercial services & supplies) | | | 2,694,314 | | | | 15,566 | |
| | Segro plc (Equity REIT) | | | 775,903 | | | | 9,226 | |
| | Spirax-Sarco Engineering plc (Machinery) | | | 57,199 | | | | 6,878 | |
| | | | | | | | | 185,432 | |
| | | | | | | | | | |
| | Emerging Asia—8.4% | | | | | | | | |
| | India—6.4% | | | | | | | | |
| | Housing Development Finance Corporation, Ltd. (Thrifts & mortgage finance) | | | 534,819 | | | | 14,588 | |
| | Infosys, Ltd. (IT services) | | | 785,793 | | | | 14,522 | |
| * | Reliance Industries, Ltd. (Oil, gas & consumable fuels) | | | 1,034,874 | | | | 33,927 | |
| | | | | | | | | 63,037 | |
| | Taiwan—2.0% | | | | | | | | |
| | Taiwan Semiconductor Manufacturing Co., Ltd. (Semiconductors & semiconductor equipment) | | | 1,203,000 | | | | 19,259 | |
See accompanying Notes to Financial Statements.
| 40 | Semiannual Report | June 30, 2022 |
International Leaders Fund
Portfolio of Investments, June 30, 2022 (all dollar amounts in thousands) (unaudited)
| | | | | | | | |
| | | | | | | | |
| | Issuer | | Shares | | | Value | |
| | | | | | | | |
| | Common Stocks—(continued) | | | | | | | | |
| | | | | | | | | | |
| | Canada—8.0% | | | | | | | | |
| | Canadian National Railway Co. (Road & rail) | | | 249,485 | | | $ | 28,063 | |
| | Dollarama, Inc. (Multiline retail) | | | 157,455 | | | | 9,067 | |
| | Intact Financial Corporation (Insurance) | | | 53,303 | | | | 7,518 | |
| * | Lululemon Athletica, Inc. (Textiles, apparel & luxury goods) | | | 50,473 | | | | 13,760 | |
| | The Toronto-Dominion Bank (Banks) | | | 298,032 | | | | 19,544 | |
| | | | | | | | | 77,952 | |
| | | | | | | | | | |
| | Asia—5.7% | | | | | | | | |
| | Australia—3.7% | | | | | | | | |
| | Aristocrat Leisure, Ltd. (Hotels, restaurants & leisure) | | | 1,136,541 | | | | 26,971 | |
| * | Atlassian Corporation plc Class “A” (Software)† | | | 50,219 | | | | 9,411 | |
| | | | | | | | | 36,382 | |
| | Hong Kong—1.5% | | | | | | | | |
| | AIA Group, Ltd. (Insurance) | | | 1,324,800 | | | | 14,359 | |
| | New Zealand—0.5% | | | | | | | | |
| | Fisher & Paykel Healthcare Corp., Ltd. (Health care equipment & supplies) | | | 433,313 | | | | 5,407 | |
| | | | | | | | | | |
| | Japan—4.4% | | | | | | | | |
| | Asahi Intecc Co., Ltd. (Health care equipment & supplies) | | | 257,100 | | | | 3,881 | |
| | Daikin Industries, Ltd. (Building products) | | | 69,500 | | | | 11,141 | |
| | Hoya Corporation (Health care equipment & supplies) | | | 120,300 | | | | 10,272 | |
| | Keyence Corporation (Electronic equipment, instruments & components) | | | 38,900 | | | | 13,297 | |
| | Nihon M&A Center Holdings, Inc. (Professional services) | | | 426,900 | | | | 4,540 | |
| | | | | | | | | 43,131 | |
| | | | | | | | | | |
| | Emerging Latin America—1.8% | | | | | | | | |
| | Argentina—1.2% | | | | | | | | |
| * | Globant S.A. (IT services)† | | | 28,305 | | | | 4,925 | |
| * | MercadoLibre, Inc. (Internet & direct marketing retail) | | | 10,112 | | | | 6,440 | |
| | | | | | | | | 11,365 | |
| | Brazil—0.6% | | | | | | | | |
| | B3 S.A. - Brasil Bolsa Balcao (Capital markets) | | | 2,942,600 | | | | 6,163 | |
| | Total Common Stocks—97.1%
(cost $955,122) | | | | | | | 951,348 | |
| | | | | | | | |
| | Issuer | | Principal
Amount | | | Value | |
| | | | | | | | |
| | Repurchase Agreement | | | | | | | | |
| | Fixed Income Clearing Corporation, 0.240% dated 6/30/22, due 7/1/22, repurchase price $22,523, collateralized by U.S. Treasury Note, 1.250%, due 06/30/28, valued at $22,973 | | | $22,523 | | | $ | 22,523 | |
| | Total Repurchase Agreement—2.3%
(cost $22,523) | | | | | | | 22,523 | |
| | Total Investments—99.4%
(cost $977,645) | | | | | | | 973,871 | |
| | Cash and other assets, less liabilities—0.6% | | | | | | | 6,220 | |
| | Net assets—100.0% | | | | | | $ | 980,091 | |
ADR = American Depository Receipt
REIT = Real Estate Investment Trust
* = Non-income producing security
† = U.S. listed foreign security
At June 30, 2022, the Fund’s Portfolio of Investments includes the following industry categories (as a percentage of long-term investments):
| Industrials | | | 27.1 | % |
| Information Technology | | | 17.1 | % |
| Health Care | | | 15.9 | % |
| Consumer Discretionary | | | 12.0 | % |
| Financials | | | 11.6 | % |
| Energy | | | 6.2 | % |
| Materials | | | 4.3 | % |
| Consumer Staples | | | 3.3 | % |
| Utilities | | | 1.5 | % |
| Real Estate | | | 1.0 | % |
| Total | | | 100.0 | % |
At June 30, 2022, the Fund’s Portfolio of Investments includes the following currency categories (as a percentage of long-term investments):
| Euro | | | 28.5 | % |
| British Pound Sterling | | | 17.8 | % |
| U.S. Dollar | | | 9.1 | % |
| Danish Krone | | | 7.5 | % |
| Canadian Dollar | | | 6.8 | % |
| Indian Rupee | | | 6.6 | % |
| Swiss Franc | | | 6.4 | % |
| Swedish Krona | | | 4.7 | % |
| Japanese Yen | | | 4.5 | % |
| Australian Dollar | | | 2.8 | % |
| New Taiwan Dollar | | | 2.0 | % |
| Hong Kong Dollar | | | 1.5 | % |
| All Other Currencies | | | 1.8 | % |
| Total | | | 100.0 | % |
See accompanying Notes to Financial Statements.
| June 30, 2022 | William Blair Funds | 41 |
| | International Growth Fund |
| | |
| | The International Growth Fund seeks long-term capital appreciation. |
| | |
| | AN OVERVIEW FROM THE PORTFOLIO MANAGERS |
| | |

Simon Fennell 
Kenneth J. McAtamney 
Andrew Siepker, CFA | The William Blair International Growth Fund (Class N shares) (the “Fund”) posted a 30.69% decrease, net of fees, for the six months June 30, 2022. By comparison, the Fund’s benchmark index, the MSCI All Country World ex-U.S. IMI (net) (the “Index”), decreased 19.08%. Underperformance versus the Index was primarily driven by negative stock selection across most sectors. The Industrials and Health Care sectors were the largest sources of negative relative returns. Within the Industrials sector, Ashtead and Atlas Copco detracted from relative results. Ashtead, which operates under the Sunbelt brand, rents a broad range of construction and industrial equipment from general tools to specialty equipment. The rental business is simple, with the rental provider offering customers homogenous products. While simplistic, Ashtead has the key benefit of scale in a largely fragmented market. The benefits of scale are significant. Ashtead is able to buy equipment cheaper than the competition, it has a large and well-invested fleet to meet customer needs, and it has a wide-reaching and growing distribution network, ensuring that equipment is closer to the customer. These advantages have driven growth in cash flow, in turn driving further investment that has resulted in share gains and greater scale. The company’s recent results were above consensus with rental revenue up 22%. Despite these results, the stock is down year-to-date as valuations have compressed. Atlas Copco is a well-managed, consistently profitable provider of compressors, vacuum solutions, and air treatment systems within the Industrials sector. The company reported solid quarterly results even though supply chain constraints impacted growth. New orders were up 26%, but operating profit margins fell short of expectations as supply chain constraints and COVID-related labor challenges weighed on profits. We believe the company continues to offer a sustainable growth profile with an envied business model and strong competitive advantages. The near term will likely be choppy, but backlogs are swelling as deliveries significantly lag orders. As a result, near-term growth may be held back but we believe that the length of the upcycle will likely be extended. Within the Health Care sector, Straumann was the largest detractor to performance. Straumann is the global leader in esthetic dentistry. The categories that the company participates in–implants, clear aligners, and digital dentistry–are growing well above global dental market rates. Straumann is more than just a products company. As a total solution provider, it offers training, support, and a wide range of services to the dental industry all over the world. In addition, the company is investing in technology and expanding capacity to make clear aligners a second long-term growth pillar. Straumann was the best-performing stock in our portfolio last year, and we trimmed the position in the second quarter. Recent results have been strong, with revenue up 27% in the quarter. Despite those results, the stock declined as valuations have compressed. Lonza was an additional source of underperformance. Lonza is a leader in custom manufacturing of biopharmaceuticals and specialty ingredients. It is a premier contract development and manufacturing company with technical expertise in biologics, high-potency active pharma ingredients, and cell and gene therapies. As a preferred global partner to the biopharma industry, Lonza has enduring relationships that span the lifecycle of its partners’ portfolios of pharmaceuticals. It has a pipeline of more than 800 drugs and in our view is well |
| | |
| 42 | Semiannual Report | June 30, 2022 |
International Growth Fund
positioned to sustainably grow faster than the industry. Demand remains strong. The level of cash on hand at biotech companies is expected to be very robust for the next two to three years, and the company’s pipeline is tilted toward later stages of development. We trimmed the position earlier in the quarter at higher levels, and despite strong corporate performance, the stock declined as valuations have compressed.
Partially offsetting these effects was an overweight to Health Care, an underweight to Emerging Middle East and Africa, and positive stock selection within the Energy sector. Within Energy, Reliance Industries added to relative results. Reliance is an Indian conglomerate with diverse businesses in energy, telecom, and retail. It benefited from the COVID reopening in India, leading to positive operating leverage across its businesses and record earnings. Reliance’s ongoing transformation from an asset- and capex-heavy cyclical energy business to more diversified, end-consumer business with a large and expanding total addressable market, is underappreciated in our view. We believe that the market underestimates the monetization potential at Jio, its telecom and digital services business with strong ecosystem benefits as a dominant provider of connectivity, content, and commerce.
Please refer to the Global Markets Review and Outlook relating to the Fund beginning on page 32.
| June 30, 2022 | William Blair Funds | 43 |
International Growth Fund
Performance Highlights (Unaudited)
Average Annual Total Returns through 6/30/2022
| | | Year to
Date | | 1 Year | | 3 Year | | 5 Year | | 10 Year | | Since
Inception(a) |
| Class N | | | (30.69 | )% | | | (30.44 | )% | | | 2.69 | % | | | 3.64 | % | | | 5.73 | % | | | — | % |
| Class I | | | (30.58 | ) | | | (30.22 | ) | | | 3.00 | | | | 3.97 | | | | 6.05 | | | | — | |
| Class R6 | | | (30.58 | ) | | | (30.18 | ) | | | 3.07 | | | | — | | | | — | | | | 3.59 | |
| MSCI ACW ex-U.S. IMI (net) | | | (19.08 | ) | | | (19.86 | ) | | | 1.55 | | | | 2.50 | | | | 5.01 | | | | 1.47 | |
| | |
| (a) | Since inception is for the period from May 2, 2019 (Commencement of Operations) to June 30, 2022. |
Performance cited represents past performance. Past performance does not guarantee future results and current performance may be lower or higher than the data quoted. Results shown are average annual total returns, which assume reinvestment of dividends and capital gains. Investment returns and principal will fluctuate and you may have a gain or loss when you sell shares. For the most current month-end performance information, please call 1-800-742-7272, or visit our Web site at www.williamblairfunds.com. Investing in smaller and medium capitalization companies involves special risks, including higher volatility and lower liquidity. Smaller and medium capitalization stocks are also more sensitive to purchase/sale transactions and changes in the issuer’s financial condition. International investing involves special risk considerations, including currency fluctuations, lower liquidity, economic and political risk. From time to time, the investment adviser may waive fees or reimburse expenses for the Fund. Without these waivers/reimbursements, performance would be lower. Class N shares are not subject to a sales load. Class I shares are not subject to a sales load or distribution (Rule 12b-1) fees. Class R6 shares are not subject to a sales load, distribution (Rule 12b-1) fees, or sub-transfer agent fees.
The performance highlights and graph presented above do not reflect the deduction of taxes that a shareholder would pay on fund distributions or the redemption of fund shares.
The Morgan Stanley Capital International (MSCI) All Country World (ACW) ex-U.S. Investable Market Index (IMI) (net) is a free float-adjusted market capitalization weighted index that is designed to measure the equity market performance of developed and emerging markets, excluding the United States. This index approximates the minimum possible dividend reinvestment by deducting for the highest possible withholding tax rates of those markets.
This report identifies the Fund’s investments on June 30, 2022. These holdings are subject to change. Not all stocks in the Fund performed the same, nor is there any guarantee that these stocks will perform as well in the future. Market forecasts provided in this report may not necessarily come to pass.
Sector Diversification (Unaudited)

The sector diversification shown is based on the total long-term securities.
| 44 | Semiannual Report | June 30, 2022 |
International Growth Fund
Portfolio of Investments, June 30, 2022 (all dollar amounts in thousands) (unaudited)
| | | | | | | | |
| | | | | | | | |
| | Issuer | | Shares | | | Value | |
| | | | | | | | |
| | Common Stocks | | | | | | | | |
| | | | | | | | | | |
| | Europe, Mid-East—43.4% | | | | | | | | |
| | Belgium—1.3% | | | | | | | | |
| | KBC Group N.V. (Banks) | | | 299,153 | | | $ | 16,785 | |
| | Warehouses De Pauw CVA (Equity REIT) | | | 91,580 | | | | 2,879 | |
| | | | | | | | | 19,664 | |
| | Denmark—5.3% | | | | | | | | |
| | Chr Hansen Holding A/S (Chemicals) | | | 68,035 | | | | 4,952 | |
| | Coloplast A/S Class “B” (Health care equipment & supplies) | | | 52,069 | | | | 5,931 | |
| | DSV A/S (Air freight & logistics) | | | 115,834 | | | | 16,177 | |
| * | Genmab A/S (Biotechnology) | | | 32,880 | | | | 10,641 | |
| | Novo Nordisk A/S Class “B” (Pharmaceuticals) | | | 251,887 | | | | 27,937 | |
| | Orsted A/S (Electric utilities) | | | 75,178 | | | | 7,858 | |
| | Royal Unibrew A/S (Beverages) | | | 52,027 | | | | 4,606 | |
| | | | | | | | | 78,102 | |
| | Finland—1.0% | | | | | | | | |
| | Neste Oyj (Oil, gas & consumable fuels) | | | 314,003 | | | | 13,899 | |
| | France—11.4% | | | | | | | | |
| | Airbus SE (Aerospace & defense) | | | 262,497 | | | | 25,432 | |
| | Capgemini SE (IT services) | | | 48,127 | | | | 8,244 | |
| | Dassault Systemes SE (Software) | | | 343,771 | | | | 12,650 | |
| | Hermes International (Textiles, apparel & luxury goods) | | | 7,186 | | | | 8,035 | |
| | Kering S.A. (Textiles, apparel & luxury goods) | | | 11,412 | | | | 5,861 | |
| | L’Oreal S.A. (Personal products) | | | 48,093 | | | | 16,596 | |
| | LVMH Moet Hennessy Louis Vuitton SE (Textiles, apparel & luxury goods) | | | 28,228 | | | | 17,208 | |
| | Safran S.A. (Aerospace & defense) | | | 200,065 | | | | 19,752 | |
| | Sartorius Stedim Biotech (Life sciences tools & services) | | | 30,260 | | | | 9,491 | |
| | Teleperformance (Professional services) | | | 39,950 | | | | 12,279 | |
| | Thales S.A. (Aerospace & defense) | | | 111,724 | | | | 13,704 | |
| | Vinci S.A. (Construction & engineering) | | | 208,263 | | | | 18,543 | |
| | | | | | | | | 167,795 | |
| | Germany—3.7% | | | | | | | | |
| | Carl Zeiss Meditec AG (Health care equipment & supplies) | | | 36,547 | | | | 4,362 | |
| | CompuGroup Medical SE & Co. KgaA (Health care technology) | | | 47,871 | | | | 2,039 | |
| * | CTS Eventim AG & Co. KGaA (Entertainment) | | | 104,758 | | | | 5,489 | |
| | Infineon Technologies AG (Semiconductors & semiconductor equipment) | | | 484,836 | | | | 11,732 | |
| | MTU Aero Engines AG (Aerospace & defense) | | | 130,819 | | | | 23,813 | |
| | Nemetschek SE (Software) | | | 44,050 | | | | 2,666 | |
| | Puma SE (Textiles, apparel & luxury goods) | | | 64,019 | | | | 4,216 | |
| | | | | | | | | 54,317 | |
| | | | | | | | |
| | | | | | | | |
| | Issuer | | Shares | | | Value | |
| | | | | | | | |
| | Common Stocks—(continued) | | | | | | | | |
| | | | | | | | | | |
| | Europe, Mid-East—(continued) | | | | | | | | |
| | Ireland—2.7% | | | | | | | | |
| * | ICON plc (Life sciences tools & services)† | | | 108,374 | | | $ | 23,485 | |
| | Kingspan Group plc (Building products) | | | 157,783 | | | | 9,491 | |
| * | Ryanair Holdings plc—ADR (Airlines) | | | 107,455 | | | | 7,226 | |
| | | | | | | | | 40,202 | |
| | Israel—0.7% | | | | | | | | |
| * | Inmode, Ltd. (Health care equipment & supplies)† | | | 91,673 | | | | 2,054 | |
| | Mizrahi Tefahot Bank, Ltd. (Banks) | | | 98,649 | | | | 3,262 | |
| * | Nice, Ltd.—ADR (Software) | | | 23,485 | | | | 4,520 | |
| | | | | | | | | 9,836 | |
| | Italy—1.0% | | | | | | | | |
| | Amplifon SpA (Health care providers & services) | | | 112,002 | | | | 3,433 | |
| | Brunello Cucinelli SpA (Textiles, apparel & luxury goods) | | | 65,849 | | | | 2,966 | |
| | FinecoBank Banca Fineco SpA (Banks) | | | 430,505 | | | | 5,152 | |
| | Moncler SpA (Textiles, apparel & luxury goods) | | | 80,311 | | | | 3,445 | |
| | | | | | | | | 14,996 | |
| | Luxembourg—1.3% | | | | | | | | |
| | Eurofins Scientific SE (Life sciences tools & services) | | | 123,607 | | | | 9,725 | |
| | Tenaris S.A. (Energy equipment & services) | | | 706,680 | | | | 9,087 | |
| | | | | | | | | 18,812 | |
| | Netherlands—3.2% | | | | | | | | |
| * | Adyen N.V. (IT services) | | | 9,158 | | | | 13,321 | |
| | ASML Holding N.V. (Semiconductors & semiconductor equipment) | | | 43,779 | | | | 20,913 | |
| | BE Semiconductor Industries N.V. (Semiconductors & semiconductor equipment) | | | 39,939 | | | | 1,920 | |
| | Euronext N.V. (Capital markets) | | | 64,147 | | | | 5,237 | |
| | IMCD N.V. (Trading companies & distributors) | | | 35,064 | | | | 4,812 | |
| | | | | | | | | 46,203 | |
| | Norway—0.2% | | | | | | | | |
| * | AutoStore Holdings, Ltd. (Machinery) | | | 664,541 | | | | 944 | |
| | Gjensidige Forsikring ASA (Insurance) | | | 110,733 | | | | 2,243 | |
| | | | | | | | | 3,187 | |
| | Spain—2.1% | | | | | | | | |
| * | Amadeus IT Group S.A. (IT services) | | | 414,989 | | | | 23,119 | |
| | EDP Renovaveis S.A. (Independent power & renewable electricity producers) | | | 317,211 | | | | 7,486 | |
| | | | | | | | | 30,605 | |
See accompanying Notes to Financial Statements.
| June 30, 2022 | William Blair Funds | 45 |
International Growth Fund
Portfolio of Investments, June 30, 2022 (all dollar amounts in thousands) (unaudited)
| | | | | | | | |
| | | | | | | | |
| | Issuer | | Shares | | | Value | |
| | | | | | | | |
| | Common Stocks—(continued) | | | | | | | | |
| | | | | | | | | | |
| | Europe, Mid-East—(continued) | | | | | | | | |
| | Sweden—3.8% | | | | | | | | |
| | Atlas Copco AB Class “A” (Machinery) | | | 1,182,554 | | | $ | 11,048 | |
| | Beijer Ref AB (Trading companies & distributors) | | | 234,680 | | | | 3,209 | |
| | EQT AB (Capital markets) | | | 224,558 | | | | 4,597 | |
| | Evolution AB (Hotels, restaurants & leisure) | | | 75,329 | | | | 6,849 | |
| | Hemnet Group AB (Interactive Media & Services) | | | 154,767 | | | | 1,902 | |
| | Hexagon AB Class “B” (Electronic equipment, instruments & components) | | | 1,048,729 | | | | 10,892 | |
| | Indutrade AB (Machinery) | | | 224,325 | | | | 4,091 | |
| | Investment AB Latour Class “B” (Industrial conglomerates) | | | 149,431 | | | | 2,955 | |
| | Lifco AB Class “B” (Industrial conglomerates) | | | 257,425 | | | | 4,133 | |
| | Sweco AB Class “B” (Construction & engineering) | | | 196,431 | | | | 2,041 | |
| | Thule Group AB (Leisure products) | | | 87,471 | | | | 2,149 | |
| | Vitrolife AB (Biotechnology) | | | 76,180 | | | | 1,752 | |
| | | | | | | | | 55,618 | |
| | Switzerland—5.7% | | | | | | | | |
| | Bachem Holding AG Class “B” (Life sciences tools & services) | | | 25,425 | | | | 1,767 | |
| | Belimo Holding AG (Building products) | | | 8,457 | | | | 2,977 | |
| | Galenica AG (Health care providers & services) | | | 55,162 | | | | 4,235 | |
| | Lonza Group AG (Life sciences tools & services) | | | 40,175 | | | | 21,420 | |
| | Partners Group Holding AG (Capital markets) | | | 16,398 | | | | 14,776 | |
| * | Siegfried Holding AG (Life sciences tools & services) | | | 5,381 | | | | 3,438 | |
| * | SIG Group AG (Containers & packaging) | | | 305,681 | | | | 6,731 | |
| | Sika AG (Chemicals) | | | 53,713 | | | | 12,378 | |
| | Straumann Holding AG (Health care equipment & supplies) | | | 86,990 | | | | 10,447 | |
| * | Tecan Group AG (Life sciences tools & services) | | | 12,532 | | | | 3,639 | |
| * | VAT Group AG (Machinery) | | | 10,564 | | | | 2,519 | |
| | | | | | | | | 84,327 | |
| | | | | | | | | | |
| | United Kingdom—15.7% | | | | | | | | |
| | 3i Group plc (Capital markets) | | | 423,660 | | | | 5,717 | |
| | Ashtead Group plc (Trading companies & distributors) | | | 256,276 | | | | 10,728 | |
| | AstraZeneca plc (Pharmaceuticals) | | | 207,973 | | | | 27,342 | |
| | AVEVA Group plc (Software) | | | 67,582 | | | | 1,852 | |
| | Beazley plc (Insurance) | | | 462,832 | | | | 2,811 | |
| | Big Yellow Group plc (Equity REIT) | | | 227,651 | | | | 3,636 | |
| | Bunzl plc (Trading companies & distributors) | | | 209,547 | | | | 6,936 | |
| | Compass Group plc (Hotels, restaurants & leisure) | | | 1,295,633 | | | | 26,497 | |
| | | | | | | | |
| | | | | | | | |
| | Issuer | | Shares | | | Value | |
| | | | | | | | |
| | Common Stocks—(continued) | | | | | | | | |
| | | | | | | | | | |
| | United Kingdom—(continued) | | | | | | | | |
| | Croda International plc (Chemicals) | | | 159,417 | | | $ | 12,559 | |
| | CVS Group plc (Health care providers & services) | | | 129,741 | | | | 2,615 | |
| | Diageo plc (Beverages) | | | 283,828 | | | | 12,198 | |
| | Diploma plc (Trading companies & distributors) | | | 113,715 | | | | 3,084 | |
| | Experian plc (Professional services) | | | 425,779 | | | | 12,470 | |
| | Greggs plc (Hotels, restaurants & leisure) | | | 144,370 | | | | 3,177 | |
| | Halma plc (Electronic equipment, instruments & components) | | | 297,845 | | | | 7,284 | |
| | Intermediate Capital Group plc (Capital markets) | | | 327,840 | | | | 5,224 | |
| | Intertek Group plc (Professional services) | | | 98,615 | | | | 5,049 | |
| | Linde plc (Chemicals)† | | | 80,213 | | | | 23,064 | |
| | London Stock Exchange Group plc (Capital markets) | | | 247,830 | | | | 23,025 | |
| | Renishaw plc (Electronic equipment, instruments & components) | | | 48,590 | | | | 2,110 | |
| | Rentokil Initial plc (Commercial services & supplies) | | | 2,012,616 | | | | 11,628 | |
| | Rotork plc (Machinery) | | | 1,622,380 | | | | 4,752 | |
| | Segro plc (Equity REIT) | | | 695,200 | | | | 8,266 | |
| | Softcat plc (IT services) | | | 165,867 | | | | 2,659 | |
| | Spirax-Sarco Engineering plc (Machinery) | | | 53,564 | | | | 6,441 | |
| | | | | | | | | 231,124 | |
| | | | | | | | | | |
| | Emerging Asia—13.9% | | | | | | | | |
| | China—2.5% | | | | | | | | |
| | Chacha Food Co., Ltd. Class “A” (Food products) | | | 370,342 | | | | 3,150 | |
| | Foshan Haitian Flavouring & Food Co., Ltd. Class “A” (Food products) | | | 374,591 | | | | 5,056 | |
| | Li Ning Co., Ltd. (Textiles, apparel & luxury goods) | | | 1,723,500 | | | | 15,968 | |
| | Proya Cosmetics Co., Ltd. Class “A” (Personal products) | | | 196,678 | | | | 4,853 | |
| | Shenzhen Inovance Technology Co., Ltd. Class “A” (Machinery) | | | 602,592 | | | | 5,929 | |
| | Silergy Corporation (Semiconductors & semiconductor equipment) | | | 28,000 | | | | 2,256 | |
| | | | | | | | | 37,212 | |
| | India—6.8% | | | | | | | | |
| | Apollo Hospitals Enterprise, Ltd. (Health care providers & services) | | | 55,223 | | | | 2,566 | |
| | Crompton Greaves Consumer Electricals, Ltd. (Household durables) | | | 681,672 | | | | 2,943 | |
| | Havells India, Ltd. (Electrical equipment) | | | 261,449 | | | | 3,609 | |
| | HDFC Bank, Ltd. (Banks) | | | 1,010,739 | | | | 17,201 | |
| | Info Edge India, Ltd. (Interactive Media & Services) | | | 56,112 | | | | 2,693 | |
| | Infosys, Ltd. (IT services) | | | 985,725 | | | | 18,217 | |
| * | InterGlobe Aviation, Ltd. (Airlines) | | | 250,826 | | | | 5,112 | |
| | Petronet LNG, Ltd. (Oil, gas & consumable fuels) | | | 1,303,137 | | | | 3,549 | |
| | Pidilite Industries, Ltd. (Chemicals) | | | 126,964 | | | | 3,357 | |
See accompanying Notes to Financial Statements.
| 46 | Semiannual Report | June 30, 2022 |
International Growth Fund
Portfolio of Investments, June 30, 2022 (all dollar amounts in thousands) (unaudited)
| | | | | | | | |
| | | | | | | | |
| | Issuer | | Shares | | | Value | |
| | | | | | | | |
| | Common Stocks—(continued) | | | | | | | | |
| | | | | | | | | | |
| | Emerging Asia—(continued) | | | | | | | | |
| | India—(continued) | | | | | | | | |
| | Reliance Industries, Ltd. (Oil, gas & consumable fuels) | | | 1,066,444 | | | $ | 34,962 | |
| | UPL, Ltd. (Chemicals) | | | 365,141 | | | | 2,930 | |
| | Voltas, Ltd. (Construction & engineering) | | | 282,087 | | | | 3,466 | |
| | | | | | | | | 100,605 | |
| | Indonesia—1.7% | | | | | | | | |
| | Bank Central Asia Tbk PT (Banks) | | | 51,363,400 | | | | 24,996 | |
| | South Korea—0.4% | | | | | | | | |
| | Samsung SDI Co., Ltd. (Electronic equipment, instruments & components) | | | 13,818 | | | | 5,662 | |
| | Taiwan—2.5% | | | | | | | | |
| | Airtac International Group (Machinery) | | | 116,713 | | | | 3,890 | |
| | Globalwafers Co., Ltd. (Semiconductors & semiconductor equipment) | | | 125,000 | | | | 1,904 | |
| | MediaTek, Inc. (Semiconductors & semiconductor equipment) | | | 658,000 | | | | 14,407 | |
| | Taiwan Semiconductor Manufacturing Co., Ltd.—ADR (Semiconductors & semiconductor equipment) | | | 194,048 | | | | 15,863 | |
| | | | | | | | | 36,064 | |
| | | | | | | | | | |
| | Canada—7.7% | | | | | | | | |
| | Canadian National Railway Co. (Road & rail) | | | 233,119 | | | | 26,222 | |
| | Canadian Pacific Railway, Ltd. (Road & rail) | | | 258,682 | | | | 18,066 | |
| | CCL Industries, Inc. Class “B” (Containers & packaging) | | | 78,762 | | | | 3,723 | |
| | Dollarama, Inc. (Multiline retail) | | | 146,044 | | | | 8,410 | |
| | Intact Financial Corporation (Insurance) | | | 95,969 | | | | 13,537 | |
| * | Kinaxis, Inc. (Software) | | | 37,742 | | | | 4,074 | |
| * | Lululemon Athletica, Inc. (Textiles, apparel & luxury goods) | | | 44,427 | | | | 12,111 | |
| | Parkland Corporation (Oil, gas & consumable fuels) | | | 169,511 | | | | 4,604 | |
| | The Toronto-Dominion Bank (Banks) | | | 266,590 | | | | 17,482 | |
| | Toromont Industries, Ltd. (Trading companies & distributors) | | | 64,990 | | | | 5,255 | |
| | | | | | | | | 113,484 | |
| | | | | | | | | | |
| | Japan—6.8% | | | | | | | | |
| | Asahi Intecc Co., Ltd. (Health care equipment & supplies) | | | 226,400 | | | | 3,417 | |
| | Benefit One, Inc. (Professional services) | | | 153,700 | | | | 2,066 | |
| | Daikin Industries, Ltd. (Building products) | | | 75,900 | | | | 12,167 | |
| | Disco Corporation (Semiconductors & semiconductor equipment) | | | 9,700 | | | | 2,302 | |
| | Food & Life Cos., Ltd. (Hotels, restaurants & leisure) | | | 116,700 | | | | 2,491 | |
| | GMO Payment Gateway, Inc. (IT services) | | | 39,400 | | | | 2,773 | |
| | Harmonic Drive Systems, Inc. (Machinery) | | | 65,000 | | | | 1,895 | |
| | Hoya Corporation (Health care equipment & supplies) | | | 108,100 | | | | 9,230 | |
| | | | | | | | |
| | | | | | | | |
| | Issuer | | Shares | | | Value | |
| | | | | | | | |
| | Common Stocks—(continued) | | | | | | | | |
| | | | | | | | | | |
| | Japan—(continued) | | | | | | | | |
| | Keyence Corporation (Electronic equipment, instruments & components) | | | 33,600 | | | $ | 11,486 | |
| | M3, Inc. (Health care technology) | | | 163,600 | | | | 4,700 | |
| | MISUMI Group, Inc. (Machinery) | | | 166,600 | | | | 3,512 | |
| | MonotaRO Co., Ltd. (Trading companies & distributors) | | | 298,000 | | | | 4,428 | |
| | Nihon M&A Center Holdings, Inc. (Professional services) | | | 339,100 | | | | 3,606 | |
| | Olympus Corporation (Health care equipment & supplies) | | | 846,000 | | | | 17,000 | |
| | Rakus Co., Ltd. (Software) | | | 173,500 | | | | 2,045 | |
| * | SHIFT, Inc. (IT services) | | | 26,000 | | | | 3,384 | |
| | SMS Co., Ltd. (Professional services) | | | 79,500 | | | | 1,567 | |
| | TechnoPro Holdings, Inc. (Professional services) | | | 203,800 | | | | 4,081 | |
| | TIS, Inc. (IT services) | | | 278,100 | | | | 7,287 | |
| | | | | | | | | 99,437 | |
| | | | | | | | | | |
| | Asia—4.9% | | | | | | | | |
| | Australia—1.6% | | | | | | | | |
| | Aristocrat Leisure, Ltd. (Hotels, restaurants & leisure) | | | 360,656 | | | | 8,559 | |
| * | Atlassian Corporation plc Class “A” (Software)† | | | 51,379 | | | | 9,628 | |
| | Netwealth Group, Ltd. (Capital markets) | | | 264,572 | | | | 2,221 | |
| | Pro Medicus, Ltd. (Health care technology) | | | 87,262 | | | | 2,545 | |
| | | | | | | | | 22,953 | |
| | Hong Kong—2.6% | | | | | | | | |
| | AIA Group, Ltd. (Insurance) | | | 3,536,800 | | | | 38,335 | |
| | Singapore—0.7% | | | | | | | | |
| | DBS Group Holdings, Ltd. (Banks) | | | 510,900 | | | | 10,914 | |
| | | | | | | | | | |
| | Emerging Latin America—2.5% | | | | | | | | |
| | Argentina—0.6% | | | | | | | | |
| * | Globant S.A. (IT services)† | | | 24,833 | | | | 4,321 | |
| * | MercadoLibre, Inc. (Internet & direct marketing retail) | | | 7,983 | | | | 5,084 | |
| | | | | | | | | 9,405 | |
| | Brazil—0.4% | | | | | | | | |
| | B3 S.A. - Brasil Bolsa Balcao (Capital markets) | | | 2,070,600 | | | | 4,337 | |
| * | Locaweb Servicos de Internet S.A. (IT services) | | | 1,324,393 | | | | 1,422 | |
| | | | | | | | | 5,759 | |
| | Mexico—1.3% | | | | | | | | |
| | Grupo Aeroportuario del Sureste S.A.B. de C.V.—ADR (Transportation infrastructure) | | | 27,719 | | | | 5,444 | |
| | Wal-Mart de Mexico S.A.B. de C.V. (Food & staples retailing) | | | 4,014,700 | | | | 13,815 | |
| | | | | | | | | 19,259 | |
See accompanying Notes to Financial Statements.
| June 30, 2022 | William Blair Funds | 47 |
International Growth Fund
Portfolio of Investments, June 30, 2022 (all dollar amounts in thousands) (unaudited)
| | Issuer | | Shares or
Principal
Amount | | | Value | |
| | | | | | | | |
| | Common Stocks—(continued) | | | | | | | | |
| | | | | | | | | | |
| | Emerging Latin America—(continued) | | | | | | | | |
| | Uruguay—0.2% | | | | | | | | |
| * | Dlocal, Ltd. (IT services)† | | | 80,740 | | | $ | 2,119 | |
| | | | | | | | | | |
| | Emerging Mid-East—0.3% | | | | | | | | |
| | United Arab Emirates—0.3% | | | | | | | | |
| | First Abu Dhabi Bank PJSC (Banks) | | | 959,042 | | | | 4,903 | |
| | Total Common Stocks—95.2%
(cost $1,212,712) | | | | | | | 1,399,794 | |
| | | | | | | | | | |
| | Repurchase Agreement | | | | | | | | |
| | Fixed Income Clearing Corporation, 0.240% dated 6/30/22, due 7/1/22, repurchase price $64,810, collateralized by U.S. Treasury Bond 3.000%, due 02/15/49 and U.S. Treasury Note, 1.625%, due 05/15/31, valued at $66,106 | | | $64,810 | | | | 64,810 | |
| | Total Repurchase Agreement—4.4%
(cost $64,810) | | | | | | | 64,810 | |
| | Total Investments—99.6%
(cost $1,277,522) | | | | | | | 1,464,604 | |
| | Cash and other assets, less liabilities—0.4% | | | | | | | 5,889 | |
| | Net assets—100.0% | | | | | | $ | 1,470,493 | |
ADR = American Depository Receipt
REIT = Real Estate Investment Trust
* = Non-income producing security
† = U.S. listed foreign security
At June 30, 2022, the Fund’s Portfolio of Investments includes the following industry categories (as a percentage of long-term investments):
| Industrials | | | 25.5 | % |
| Information Technology | | | 16.6 | % |
| Financials | | | 15.9 | % |
| Health Care | | | 15.4 | % |
| Consumer Discretionary | | | 9.7 | % |
| Materials | | | 5.0 | % |
| Energy | | | 4.7 | % |
| Consumer Staples | | | 4.3 | % |
| Utilities | | | 1.1 | % |
| Real Estate | | | 1.1 | % |
| Communication Services | | | 0.7 | % |
| Total | | | 100.0 | % |
At June 30, 2022, the Fund’s Portfolio of Investments includes the following currency categories (as a percentage of long-term investments):
| Euro | | | 26.8 | % |
| British Pound Sterling | | | 14.9 | % |
| U.S. Dollar | | | 9.5 | % |
| Indian Rupee | | | 7.2 | % |
| Japanese Yen | | | 7.1 | % |
| Swiss Franc | | | 6.0 | % |
| Canadian Dollar | | | 5.9 | % |
| Danish Krone | | | 5.6 | % |
| Swedish Krona | | | 4.0 | % |
| Hong Kong Dollar | | | 3.9 | % |
| Indonesian Rupiah | | | 1.8 | % |
| New Taiwan Dollar | | | 1.6 | % |
| Chinese Yuan Renminbi | | | 1.4 | % |
| All Other Currencies | | | 4.3 | % |
| Total | | | 100.0 | % |
See accompanying Notes to Financial Statements.
| 48 | Semiannual Report | June 30, 2022 |
| | Institutional International Growth Fund |
| | |
| | The Institutional International Growth Fund seeks long-term capital appreciation. |
| | |
| | AN OVERVIEW FROM THE PORTFOLIO MANAGERS |
| | |

Simon Fennell 
Kenneth J. McAtamney 
Andrew Siepker, CFA | The William Blair Institutional International Growth Fund (the “Fund”) posted a 30.64% decrease, net of fees, for the six months ended June 30, 2022. By comparison, the Fund’s benchmark index, the MSCI All Country World ex-U.S. IMI (net) (the “Index”), decreased 19.08%. Underperformance versus the Index was primarily driven by negative stock selection across most sectors. The Industrials and Health Care sectors were the largest sources of negative relative returns. Within the Industrials sector, Ashtead and Atlas Copco detracted from relative results. Ashtead, which operates under the Sunbelt brand, rents a broad range of construction and industrial equipment from general tools to specialty equipment. The rental business is simple, with the rental provider offering customers homogenous products. While simplistic, Ashtead has the key benefit of scale in a largely fragmented market. The benefits of scale are significant. Ashtead is able to buy equipment cheaper than the competition, it has a large and well-invested fleet to meet customer needs, and it has a wide-reaching and growing distribution network, ensuring that equipment is closer to the customer. These advantages have driven growth in cash flow, in turn driving further investment that has resulted in share gains and greater scale. The company’s recent results were above consensus with rental revenue up 22%. Despite these results, the stock is down year-to-date as the P/E multiple has contracted from 25 times at the beginning of the year to 11 times at the end of the second quarter, one standard deviation below its 10-year average. Atlas Copco is a well-managed, consistently profitable provider of compressors, vacuum solutions, and air treatment systems within the industrials sector. The company reported solid quarterly results even though supply chain constraints impacted growth. New orders were up 26%, but operating profit margins fell short of expectations as supply chain constraints and COVID-related labor challenges weighed on profits. We believe the company continues to offer a sustainable growth profile with an envied business model and strong competitive advantages. The near term will likely be choppy, but backlogs are swelling as deliveries significantly lag orders. As a result, near-term growth will be held back but we believe that the length of the upcycle will likely be extended. Within the Health Care sector, Straumann was the largest detractor to performance. Straumann is the global leader in esthetic dentistry. The categories that the company participates in–implants, clear aligners, and digital dentistry–are growing well above global dental market rates. Straumann is more than just a products company. As a total solution provider, it offers training, support, and a wide range of services to the dental industry all over the world. In addition, the company is investing in technology and expanding capacity to make clear aligners a second long-term growth pillar. Straumann was the best-performing stock in our portfolio last year, and we trimmed the position in the second quarter. Recent results have been strong, with revenue up 27% in the quarter. Despite those results, P/E multiples have compressed significantly, from 58 times to 33 times this year. Lonza was an additional source of underperformance. Lonza is a leader in custom manufacturing of biopharmaceuticals and specialty ingredients. It is a premier contract development and manufacturing company with technical expertise in biologics, high-potency active pharma ingredients, and cell and gene therapies. As a preferred global partner to the biopharma industry, Lonza has enduring relationships that span the lifecycle of its partners’ portfolios of pharmaceuticals. It has a pipeline of more than 800 drugs and in our view is well positioned to sustainably grow faster than the industry. Demand remains strong. The level of |
| | | |
| June 30, 2022 | William Blair Funds | 49 |
Institutional International Growth Fund
cash on hand at biotech companies is expected to be very robust for the next two to three years, and the company’s pipeline is tilted toward later stages of development. We trimmed the position earlier in the quarter at higher levels, and despite strong corporate performance, the company’s P/E multiple has contracted from 57 times to 33 times this year.
Partially offsetting these effects was an overweight to Health Care, an underweight to Emerging Middle East and Africa, and positive stock selection within the Energy sector. Within Energy, Reliance Industries added to relative results. Reliance is an Indian conglomerate with diverse businesses in energy, telecom, and retail. It benefited from the COVID reopening in India, leading to positive operating leverage across its businesses and record earnings. Reliance’s ongoing transformation from an asset- and capital expenditure-heavy cyclical energy business to more diversified, end-consumer business with a large and expanding total addressable market, is underappreciated in our view. We believe that the market underestimates the monetization potential at Jio, its telecom and digital services business with strong ecosystem benefits as a dominant provider of connectivity, content, and commerce.
Please refer to the Global Markets Review and Outlook relating to the Fund beginning on page 32.
| 50 | Semiannual Report | June 30, 2022 |
Institutional International Growth Fund
Performance Highlights (Unaudited)
Average Annual Total Returns through 6/30/2022
| | | Year to
Date | | 1 Year | | 3 Year | | 5 Year | | 10 Year |
| Institutional International Growth Fund | | | (30.64 | )% | | | (30.06 | )% | | | 3.25 | % | | | 4.17 | % | | | 6.20 | % |
| MSCI ACW ex-U.S. IMI (net) | | | (19.08 | ) | | | (19.86 | ) | | | 1.55 | | | | 2.50 | | | | 5.01 | |
Performance cited represents past performance. Past performance does not guarantee future results and current performance may be lower or higher than the data quoted. Results shown are average annual total returns, which assume reinvestment of dividends and capital gains. Investment returns and principal will fluctuate and you may have a gain or loss when you sell shares. For the most current month-end performance information, please call 1-800-742-7272, or visit our Web site at www.williamblairfunds.com. From time to time, the investment adviser may waive fees or reimburse expenses for the Fund. Without these waivers/reimbursements, performance would be lower. Investing in smaller and medium capitalization companies involves special risks, including higher volatility and lower liquidity. Smaller and medium capitalization stocks are also more sensitive to purchase/sale transactions and changes in the issuer’s financial condition. International investing involves special risk considerations, including currency fluctuations, lower liquidity, economic and political risk. Shares of the Fund are not subject to a sales load, distribution (Rule 12b-1) fees, or sub-transfer agent fees.
The performance highlights and graph presented above do not reflect the deduction of taxes that a shareholder would pay on fund distributions or the redemption of fund shares.
The Morgan Stanley Capital International (MSCI) All Country World (ACW) ex-U.S. Investable Market Index (IMI) (net) is a free float-adjusted market capitalization weighted index that is designed to measure the equity market performance of developed and emerging markets, excluding the United States. This index approximates the minimum possible dividend reinvestment by deducting for the highest possible withholding tax rates of those markets.
This report identifies the Fund’s investments on June 30, 2022. These holdings are subject to change. Not all stocks in the Fund performed the same, nor is there any guarantee that these stocks will perform as well in the future. Market forecasts provided in this report may not necessarily come to pass.
Sector Diversification (Unaudited)

The sector diversification shown is based on the total long-term securities.
| | | |
| June 30, 2022 | William Blair Funds | 51 |
Institutional International Growth Fund
Portfolio of Investments, June 30, 2022 (all dollar amounts in thousands) (unaudited)
| | | | | | | | |
| | | | | | | | |
| | Issuer | | Shares | | | Value | |
| | | | | | | | | | |
| | Common Stocks | | | | | | | | |
| | | | | | | | | | |
| | Europe, Mid-East—44.2% | | | | | | | | |
| | Belgium—1.4% | | | | | | | | |
| | KBC Group N.V. (Banks) | | | 193,592 | | | $ | 10,862 | |
| | Warehouses De Pauw CVA (Equity REIT) | | | 59,265 | | | | 1,863 | |
| | | | | | | | | 12,725 | |
| | Denmark—5.4% | | | | | | | | |
| | Chr Hansen Holding A/S (Chemicals) | | | 44,028 | | | | 3,205 | |
| | Coloplast A/S Class “B” (Health care equipment & supplies) | | | 33,695 | | | | 3,838 | |
| | DSV A/S (Air freight & logistics) | | | 74,960 | | | | 10,469 | |
| * | Genmab A/S (Biotechnology) | | | 21,278 | | | | 6,886 | |
| | Novo Nordisk A/S Class “B” (Pharmaceuticals) | | | 163,005 | | | | 18,079 | |
| | Orsted A/S (Electric utilities) | | | 48,650 | | | | 5,085 | |
| | Royal Unibrew A/S (Beverages) | | | 33,668 | | | | 2,981 | |
| | | | | | | | | 50,543 | |
| | Finland—1.0% | | | | | | | | |
| | Neste Oyj (Oil, gas & consumable fuels) | | | 203,202 | | | | 8,995 | |
| | France—11.6% | | | | | | | | |
| | Airbus SE (Aerospace & defense) | | | 169,682 | | | | 16,439 | |
| | Capgemini SE (IT services) | | | 31,144 | | | | 5,335 | |
| | Dassault Systemes SE (Software) | | | 222,466 | | | | 8,187 | |
| | Hermes International (Textiles, apparel & luxury goods) | | | 4,650 | | | | 5,200 | |
| | Kering S.A. (Textiles, apparel & luxury goods) | | | 7,376 | | | | 3,788 | |
| | L’Oreal S.A. (Personal products) | | | 31,123 | | | | 10,740 | |
| | LVMH Moet Hennessy Louis Vuitton SE (Textiles, apparel & luxury goods) | | | 18,267 | | | | 11,135 | |
| | Safran S.A. (Aerospace & defense) | | | 129,469 | | | | 12,782 | |
| | Sartorius Stedim Biotech (Life sciences tools & services) | | | 19,582 | | | | 6,142 | |
| | Teleperformance (Professional services) | | | 25,824 | | | | 7,937 | |
| | Thales S.A. (Aerospace & defense) | | | 72,220 | | | | 8,859 | |
| | Vinci S.A. (Construction & engineering) | | | 134,774 | | | | 11,999 | |
| | | | | | | | | 108,543 | |
| | Germany—3.8% | | | | | | | | |
| | Carl Zeiss Meditec AG (Health care equipment & supplies) | | | 23,651 | | | | 2,823 | |
| | CompuGroup Medical SE & Co. KgaA (Health care technology) | | | 30,979 | | | | 1,319 | |
| * | CTS Eventim AG & Co. KGaA (Entertainment) | | | 67,792 | | | | 3,552 | |
| | Infineon Technologies AG (Semiconductors & semiconductor equipment) | | | 313,754 | | | | 7,592 | |
| | MTU Aero Engines AG (Aerospace & defense) | | | 84,657 | | | | 15,410 | |
| | Nemetschek SE (Software) | | | 28,506 | | | | 1,726 | |
| | Puma SE (Textiles, apparel & luxury goods) | | | 41,383 | | | | 2,725 | |
| | | | | | | | | 35,147 | |
| | | | | | | | |
| | | | | | | | |
| | Issuer | | Shares | | | Value | |
| | | | | | | | | | |
| | Common Stocks—(continued) | | | | | | | | |
| | | | | | | | | | |
| | Europe, Mid-East—(continued) | | | | | | | | |
| | Ireland—2.8% | | | | | | | | |
| * | ICON plc (Life sciences tools & services)† | | | 70,132 | | | $ | 15,198 | |
| | Kingspan Group plc (Building products) | | | 102,107 | | | | 6,142 | |
| * | Ryanair Holdings plc—ADR (Airlines) | | | 69,461 | | | | 4,671 | |
| | | | | | | | | 26,011 | |
| | Israel—0.7% | | | | | | | | |
| * | Inmode, Ltd. (Health care equipment & supplies)† | | | 59,325 | | | | 1,329 | |
| | Mizrahi Tefahot Bank, Ltd. (Banks) | | | 63,839 | | | | 2,111 | |
| * | Nice, Ltd.—ADR (Software) | | | 15,198 | | | | 2,925 | |
| | | | | | | | | 6,365 | |
| | Italy—1.0% | | | | | | | | |
| | Amplifon SpA (Health care providers & services) | | | 72,480 | | | | 2,222 | |
| | Brunello Cucinelli SpA (Textiles, apparel & luxury goods) | | | 42,613 | | | | 1,919 | |
| | FinecoBank Banca Fineco SpA (Banks) | | | 278,595 | | | | 3,334 | |
| | Moncler SpA (Textiles, apparel & luxury goods) | | | 51,972 | | | | 2,229 | |
| | | | | | | | | 9,704 | |
| | Luxembourg—1.3% | | | | | | | | |
| | Eurofins Scientific SE (Life sciences tools & services) | | | 79,990 | | | | 6,294 | |
| | Tenaris S.A. (Energy equipment & services) | | | 457,317 | | | | 5,880 | |
| | | | | | | | | 12,174 | |
| | Netherlands—3.2% | | | | | | | | |
| * | Adyen N.V. (IT services) | | | 5,927 | | | | 8,621 | |
| | ASML Holding N.V. (Semiconductors & semiconductor equipment) | | | 28,331 | | | | 13,534 | |
| | BE Semiconductor Industries N.V. (Semiconductors & semiconductor equipment) | | | 25,846 | | | | 1,242 | |
| | Euronext N.V. (Capital markets) | | | 41,512 | | | | 3,389 | |
| | IMCD N.V. (Trading companies & distributors) | | | 22,691 | | | | 3,114 | |
| | | | | | | | | 29,900 | |
| | Norway—0.2% | | | | | | | | |
| * | AutoStore Holdings, Ltd. (Machinery) | | | 430,047 | | | | 611 | |
| | Gjensidige Forsikring ASA (Insurance) | | | 71,659 | | | | 1,452 | |
| | | | | | | | | 2,063 | |
| | Spain—2.1% | | | | | | | | |
| * | Amadeus IT Group S.A. (IT services) | | | 268,554 | | | | 14,961 | |
| | EDP Renovaveis S.A. (Independent power & renewable electricity producers) | | | 205,278 | | | | 4,845 | |
| | | | | | | | | 19,806 | |
See accompanying Notes to Financial Statements.
| 52 | Semiannual Report | June 30, 2022 |
Institutional International Growth Fund
Portfolio of Investments, June 30, 2022 (all dollar amounts in thousands) (unaudited)
| | | | | | | | |
| | | | | | | | |
| | Issuer | | Shares | | | Value | |
| | | | | | | | | | |
| | Common Stocks—(continued) | | | | | | | | |
| | | | | | | | | | |
| | Europe, Mid-East—(continued) | | | | | | | | |
| | Sweden—3.9% | | | | | | | | |
| | Atlas Copco AB Class “A” (Machinery) | | | 765,272 | | | $ | 7,149 | |
| | Beijer Ref AB (Trading companies & distributors) | | | 151,870 | | | | 2,077 | |
| | EQT AB (Capital markets) | | | 145,319 | | | | 2,975 | |
| | Evolution AB (Hotels, restaurants & leisure) | | | 48,748 | | | | 4,432 | |
| | Hemnet Group AB (Interactive Media & Services) | | | 100,155 | | | | 1,231 | |
| | Hexagon AB Class “B” (Electronic equipment, instruments & components) | | | 678,670 | | | | 7,049 | |
| | Indutrade AB (Machinery) | | | 145,169 | | | | 2,647 | |
| | Investment AB Latour Class “B” (Industrial conglomerates) | | | 96,702 | | | | 1,912 | |
| | Lifco AB Class “B” (Industrial conglomerates) | | | 166,589 | | | | 2,675 | |
| | Sweco AB Class “B” (Construction & engineering) | | | 127,117 | | | | 1,321 | |
| | Thule Group AB (Leisure products) | | | 56,606 | | | | 1,391 | |
| | Vitrolife AB (Biotechnology) | | | 49,299 | | | | 1,133 | |
| | | | | | | | | 35,992 | |
| | Switzerland—5.8% | | | | | | | | |
| | Bachem Holding AG Class “B” (Life sciences tools & services) | | | 16,453 | | | | 1,143 | |
| | Belimo Holding AG (Building products) | | | 5,370 | | | | 1,890 | |
| | Galenica AG (Health care providers & services) | | | 35,697 | | | | 2,741 | |
| | Lonza Group AG (Life sciences tools & services) | | | 25,999 | | | | 13,862 | |
| | Partners Group Holding AG (Capital markets) | | | 10,612 | | | | 9,562 | |
| | Siegfried Holding AG (Life sciences tools & services) | | | 3,482 | | | | 2,225 | |
| * | SIG Group AG (Containers & packaging) | | | 197,817 | | | | 4,356 | |
| | Sika AG (Chemicals) | | | 34,759 | | | | 8,010 | |
| | Straumann Holding AG (Health care equipment & supplies) | | | 56,294 | | | | 6,761 | |
| | Tecan Group AG (Life sciences tools & services) | | | 8,110 | | | | 2,355 | |
| | VAT Group AG (Machinery) | | | 6,836 | | | | 1,630 | |
| | | | | | | | | 54,535 | |
| | | | | | | | | | |
| | United Kingdom—16.0% | | | | | | | | |
| | 3i Group plc (Capital markets) | | | 274,165 | | | | 3,699 | |
| | Ashtead Group plc (Trading companies & distributors) | | | 165,845 | | | | 6,943 | |
| | AstraZeneca plc (Pharmaceuticals) | | | 134,586 | | | | 17,694 | |
| | AVEVA Group plc (Software) | | | 43,735 | | | | 1,198 | |
| | Beazley plc (Insurance) | | | 299,515 | | | | 1,819 | |
| | Big Yellow Group plc (Equity REIT) | | | 147,321 | | | | 2,353 | |
| | Bunzl plc (Trading companies & distributors) | | | 135,605 | | | | 4,488 | |
| | Compass Group plc (Hotels, restaurants & leisure) | | | 838,449 | | | | 17,147 | |
| | Croda International plc (Chemicals) | | | 103,164 | | | | 8,128 | |
| | | | | | | | |
| | | | | | | | |
| | Issuer | | Shares | | | Value | |
| | | | | | | | | | |
| | Common Stocks—(continued) | | | | | | | | |
| | | | | | | | | | |
| | United Kingdom—(continued) | | | | | | | | |
| | CVS Group plc (Health care providers & services) | | | 83,960 | | | $ | 1,692 | |
| | Diageo plc (Beverages) | | | 183,675 | | | | 7,894 | |
| | Diploma plc (Trading companies & distributors) | | | 73,589 | | | | 1,996 | |
| | Experian plc (Professional services) | | | 275,537 | | | | 8,070 | |
| | Greggs plc (Hotels, restaurants & leisure) | | | 93,427 | | | | 2,056 | |
| | Halma plc (Electronic equipment, instruments & components) | | | 192,746 | | | | 4,714 | |
| | Intermediate Capital Group plc (Capital markets) | | | 212,157 | | | | 3,381 | |
| | Intertek Group plc (Professional services) | | | 63,817 | | | | 3,267 | |
| | Linde plc (Chemicals)† | | | 51,896 | | | | 14,922 | |
| | London Stock Exchange Group plc (Capital markets) | | | 160,379 | | | | 14,900 | |
| | Renishaw plc (Electronic equipment, instruments & components) | | | 31,444 | | | | 1,366 | |
| | Rentokil Initial plc (Commercial services & supplies) | | | 1,302,434 | | | | 7,525 | |
| | Rotork plc (Machinery) | | | 1,049,899 | | | | 3,075 | |
| | Segro plc (Equity REIT) | | | 449,888 | | | | 5,349 | |
| | Softcat plc (IT services) | | | 107,339 | | | | 1,721 | |
| | Spirax-Sarco Engineering plc (Machinery) | | | 34,663 | | | | 4,168 | |
| | | | | | | | | 149,565 | |
| | | | | | | | | | |
| | Emerging Asia—14.2% | | | | | | | | |
| | China—2.6% | | | | | | | | |
| | Chacha Food Co., Ltd. Class “A” (Food products) | | | 239,700 | | | | 2,038 | |
| | Foshan Haitian Flavouring & Food Co., Ltd. Class “A” (Food products) | | | 242,363 | | | | 3,271 | |
| | Li Ning Co., Ltd. (Textiles, apparel & luxury goods) | | | 1,115,500 | | | | 10,335 | |
| | Proya Cosmetics Co., Ltd. Class “A” (Personal products) | | | 127,240 | | | | 3,140 | |
| | Shenzhen Inovance Technology Co., Ltd. Class “A” (Machinery) | | | 389,500 | | | | 3,833 | |
| | Silergy Corporation (Semiconductors & semiconductor equipment) | | | 18,000 | | | | 1,450 | |
| | | | | | | | | 24,067 | |
| | India—7.0% | | | | | | | | |
| | Apollo Hospitals Enterprise, Ltd. (Health care providers & services) | | | 35,737 | | | | 1,660 | |
| | Crompton Greaves Consumer Electricals, Ltd. (Household durables) | | | 441,134 | | | | 1,905 | |
| | Havells India, Ltd. (Electrical equipment) | | | 169,193 | | | | 2,336 | |
| | HDFC Bank, Ltd. (Banks) | | | 654,085 | | | | 11,132 | |
| | Info Edge India, Ltd. (Interactive Media & Services) | | | 36,312 | | | | 1,743 | |
| | Infosys, Ltd. (IT services) | | | 637,897 | | | | 11,789 | |
| * | InterGlobe Aviation, Ltd. (Airlines) | | | 162,318 | | | | 3,308 | |
| | Petronet LNG, Ltd. (Oil, gas & consumable fuels) | | | 843,306 | | | | 2,296 | |
| | Pidilite Industries, Ltd. (Chemicals) | | | 82,163 | | | | 2,172 | |
See accompanying Notes to Financial Statements.
| June 30, 2022 | William Blair Funds | 53 |
Institutional International Growth Fund
Portfolio of Investments, June 30, 2022 (all dollar amounts in thousands) (unaudited)
| | | | | | | | |
| | | | | | | | |
| | Issuer | | Shares | | | Value | |
| | | | | | | | | | |
| | Common Stocks—(continued) | | | | | | | | |
| | | | | | | | | | |
| | Emerging Asia—(continued) | | | | | | | | |
| | India—(continued) | | | | | | | | |
| | Reliance Industries, Ltd. (Oil, gas & consumable fuels) | | | 690,133 | | | $ | 22,625 | |
| | UPL, Ltd. (Chemicals) | | | 236,296 | | | | 1,896 | |
| | Voltas, Ltd. (Construction & engineering) | | | 182,548 | | | | 2,243 | |
| | | | | | | | | 65,105 | |
| | Indonesia—1.7% | | | | | | | | |
| | Bank Central Asia Tbk PT (Banks) | | | 33,239,030 | | | | 16,176 | |
| | South Korea—0.4% | | | | | | | | |
| | Samsung SDI Co., Ltd. (Electronic equipment, instruments & components) | | | 8,942 | | | | 3,664 | |
| | Taiwan—2.5% | | | | | | | | |
| | Airtac International Group (Machinery) | | | 75,204 | | | | 2,506 | |
| | Globalwafers Co., Ltd. (Semiconductors & semiconductor equipment) | | | 81,000 | | | | 1,234 | |
| | MediaTek, Inc. (Semiconductors & semiconductor equipment) | | | 426,000 | | | | 9,327 | |
| | Taiwan Semiconductor Manufacturing Co., Ltd.—ADR (Semiconductors & semiconductor equipment) | | | 125,575 | | | | 10,266 | |
| | | | | | | | | 23,333 | |
| | | | | | | | | | |
| | Canada—7.9% | | | | | | | | |
| | Canadian National Railway Co. (Road & rail) | | | 150,691 | | | | 16,950 | |
| | Canadian Pacific Railway, Ltd. (Road & rail) | | | 167,402 | | | | 11,691 | |
| | CCL Industries, Inc. Class “B” (Containers & packaging) | | | 50,912 | | | | 2,406 | |
| | Dollarama, Inc. (Multiline retail) | | | 94,510 | | | | 5,442 | |
| | Intact Financial Corporation (Insurance) | | | 62,105 | | | | 8,760 | |
| * | Kinaxis, Inc. (Software) | | | 24,424 | | | | 2,637 | |
| * | Lululemon Athletica, Inc. (Textiles, apparel & luxury goods) | | | 28,750 | | | | 7,838 | |
| | Parkland Corporation (Oil, gas & consumable fuels) | | | 109,697 | | | | 2,979 | |
| | The Toronto-Dominion Bank (Banks) | | | 172,519 | | | | 11,313 | |
| | Toromont Industries, Ltd. (Trading companies & distributors) | | | 42,057 | | | | 3,401 | |
| | | | | | | | | 73,417 | |
| | | | | | | | | | |
| | Japan—6.9% | | | | | | | | |
| | Asahi Intecc Co., Ltd. (Health care equipment & supplies) | | | 146,500 | | | | 2,211 | |
| | Benefit One, Inc. (Professional services) | | | 99,400 | | | | 1,336 | |
| | Daikin Industries, Ltd. (Building products) | | | 49,100 | | | | 7,871 | |
| | Disco Corporation (Semiconductors & semiconductor equipment) | | | 6,300 | | | | 1,495 | |
| | Food & Life Cos., Ltd. (Hotels, restaurants & leisure) | | | 75,500 | | | | 1,612 | |
| | | | | | | | |
| | | | | | | | |
| | Issuer | | Shares | | | Value | |
| | | | | | | | | | |
| | Common Stocks—(continued) | | | | | | | | |
| | | | | | | | | | |
| | Japan—(continued) | | | | | | | | |
| | GMO Payment Gateway, Inc. (IT services) | | | 25,500 | | | $ | 1,795 | |
| | Harmonic Drive Systems, Inc. (Machinery) | | | 42,100 | | | | 1,227 | |
| | Hoya Corporation (Health care equipment & supplies) | | | 70,000 | | | | 5,977 | |
| | Keyence Corporation (Electronic equipment, instruments & components) | | | 21,700 | | | | 7,418 | |
| | M3, Inc. (Health care technology) | | | 105,900 | | | | 3,042 | |
| | MISUMI Group, Inc. (Machinery) | | | 107,800 | | | | 2,272 | |
| | MonotaRO Co., Ltd. (Trading companies & distributors) | | | 192,800 | | | | 2,865 | |
| | Nihon M&A Center Holdings, Inc. (Professional services) | | | 219,500 | | | | 2,334 | |
| | Olympus Corporation (Health care equipment & supplies) | | | 547,500 | | | | 11,002 | |
| | Rakus Co., Ltd. (Software) | | | 112,300 | | | | 1,324 | |
| * | SHIFT, Inc. (IT services) | | | 16,900 | | | | 2,200 | |
| | SMS Co., Ltd. (Professional services) | | | 51,500 | | | | 1,015 | |
| | TechnoPro Holdings, Inc. (Professional services) | | | 131,900 | | | | 2,641 | |
| | TIS, Inc. (IT services) | | | 180,000 | | | | 4,716 | |
| | | | | | | | | 64,353 | |
| | | | | | | | | | |
| | Asia—5.0% | | | | | | | | |
| | Australia—1.6% | | | | | | | | |
| | Aristocrat Leisure, Ltd. (Hotels, restaurants & leisure) | | | 233,393 | | | | 5,538 | |
| * | Atlassian Corporation plc Class “A” (Software)† | | | 33,249 | | | | 6,231 | |
| | Netwealth Group, Ltd. (Capital markets) | | | 171,214 | | | | 1,437 | |
| | Pro Medicus, Ltd. (Health care technology) | | | 56,470 | | | | 1,647 | |
| | | | | | | | | 14,853 | |
| | Hong Kong—2.7% | | | | | | | | |
| | AIA Group, Ltd. (Insurance) | | | 2,288,863 | | | | 24,809 | |
| | Singapore—0.7% | | | | | | | | |
| | DBS Group Holdings, Ltd. (Banks) | | | 330,600 | | | | 7,063 | |
| | | | | | | | | | |
| | Emerging Latin America—2.5% | | | | | | | | |
| | Argentina—0.7% | | | | | | | | |
| * | Globant S.A. (IT services)† | | | 16,070 | | | | 2,796 | |
| * | MercadoLibre, Inc. (Internet & direct marketing retail) | | | 5,166 | | | | 3,290 | |
| | | | | | | | | 6,086 | |
| | Brazil—0.4% | | | | | | | | |
| | B3 S.A. - Brasil Bolsa Balcao (Capital markets) | | | 1,339,900 | | | | 2,806 | |
| * | Locaweb Servicos de Internet S.A. (IT services) | | | 857,086 | | | | 921 | |
| | | | | | | | | 3,727 | |
See accompanying Notes to Financial Statements.
| 54 | Semiannual Report | June 30, 2022 |
Institutional International Growth Fund
Portfolio of Investments, June 30, 2022 (all dollar amounts in thousands) (unaudited)
| | Issuer | | Shares or
Principal
Amount | | | Value | |
| | | | | | | | | | |
| | Common Stocks—(continued) | | | | | | | | |
| | | | | | | | | | |
| | Emerging Latin America—(continued) | | | | | | | | |
| | Mexico—1.3% | | | | | | | | |
| | Grupo Aeroportuario del Sureste S.A.B. de C.V.—ADR (Transportation infrastructure) | | | 17,938 | | | $ | 3,523 | |
| | Wal-Mart de Mexico S.A.B. de C.V. (Food & staples retailing) | | | 2,598,100 | | | | 8,940 | |
| | | | | | | | | 12,463 | |
| | Uruguay—0.1% | | | | | | | | |
| * | Dlocal, Ltd. (IT services)† | | | 52,250 | | | | 1,372 | |
| | | | | | | | | | |
| | Emerging Mid-East—0.4% | | | | | | | | |
| | United Arab Emirates—0.4% | | | | | | | | |
| | First Abu Dhabi Bank PJSC (Banks) | | | 620,630 | | | | 3,173 | |
| | Total Common Stocks—97.1%
(cost $793,697) | | | | | | | 905,729 | |
| | | | | | | | | | |
| | Repurchase Agreement | | | | | | | | |
| | Fixed Income Clearing Corporation, 0.240% dated 6/30/22, due 7/1/22, repurchase price $24,449, collateralized by U.S. Treasury Note, 1.625%, due 05/15/31, valued at $24,938 | | | $24,449 | | | | 24,449 | |
| | Total Repurchase Agreement—2.6%
(cost $24,449) | | | | | | | 24,449 | |
| | Total Investments—99.7%
(cost $818,146) | | | | | | | 930,178 | |
| | Cash and other assets, less liabilities—0.3% | | | | | | | 2,763 | |
| | Net assets—100.0% | | | | | | $ | 932,941 | |
ADR = American Depository Receipt
REIT = Real Estate Investment Trust
* = Non-income producing security
† = U.S. listed foreign security
At June 30, 2022, the Fund’s Portfolio of Investments includes the following industry categories (as a percentage of long-term investments):
| Industrials | 25.5% |
| Information Technology | 16.6% |
| Financials | 15.9% |
| Health Care | 15.4% |
| Consumer Discretionary | 9.7% |
| Materials | 5.0% |
| Energy | 4.7% |
| Consumer Staples | 4.3% |
| Utilities | 1.1% |
| Real Estate | 1.1% |
| Communication Services | 0.7% |
| Total | 100.0% |
At June 30, 2022, the Fund’s Portfolio of Investments includes the following currency categories (as a percentage of long-term investments):
| Euro | 26.8% |
| British Pound Sterling | 14.9% |
| U.S. Dollar | 9.5% |
| Indian Rupee | 7.2% |
| Japanese Yen | 7.1% |
| Swiss Franc | 6.0% |
| Canadian Dollar | 5.9% |
| Danish Krone | 5.6% |
| Swedish Krona | 4.0% |
| Hong Kong Dollar | 3.9% |
| Indonesian Rupiah | 1.8% |
| New Taiwan Dollar | 1.6% |
| Chinese Yuan Renminbi | 1.4% |
| All Other Currencies | 4.3% |
| Total | 100.0% |
See accompanying Notes to Financial Statements.
| June 30, 2022 | William Blair Funds | 55 |
| | International Small Cap Growth Fund |
| | |
| | The International Small Cap Growth Fund seeks long-term capital appreciation. |
| | |
| | AN OVERVIEW FROM THE PORTFOLIO MANAGERS |
| | |

Simon Fennell 
Andrew G. Flynn, CFA 
D.J. Neiman, CFA | The William Blair International Small Cap Growth Fund (Class N shares) (the “Fund”) posted a 38.95% decrease, net of fees, for the six months June 30, 2022. By comparison, the Fund’s benchmark index, the MSCI All Country World ex-U.S. Small Cap Index (net) (the “Index”), decreased 22.92%. Six-month underperformance versus the Index was primarily driven by style headwinds amid strong outperformance of low-valuation stocks. From an attribution perspective, stock selection was weakest within Industrials and Health Care, which was partially offset by positive stock selection within Consumer Staples and Energy. Industrials stock selection was hampered, primarily driven by Benefit One. Benefit One is a provider of HR-related services, in the form of outsourced fringe benefits. A structural tightening of the Japanese labor market has increased the need for employers to attract hires using the types of services offered by Benefit One. We believe that future regulatory changes should also drive increased demand. As the business has a fixed cost base and low variable costs, operating leverage is high, supporting a rate of profit growth at the top end of the peer group. The share price declined on lower-than-consensus operating profit, primarily due to an increase in costs in the fringe benefits segment of the business. Health Care stock selection was also weaker due to InMode. InMode, the Israeli-based medical device company, has developed proprietary minimally invasive and non-invasive technologies for various aesthetic applications including fat reduction, skin tightening, and muscle toning. While the company is currently focusing on the large total-available-market for the medical aesthetics market, the products are applicable in a wide array of indications, such as women’s health, ENT (ear, nose & throat), and ophthalmology, which could significantly expand the targeted market going forward. Even after a strong run in 2021 and continued strength in earnings into 2022, the share price has been hampered by valuation compression and headwinds to growth such as supply chain disruptions and challenges from Ukraine/Russia/China. Despite the difficult backdrop for small-cap healthcare in particular, we remain constructive on InMode’s fundamental outlook. Partially offsetting these effects was positive stock selection within Consumer Staples and Energy, coupled with the positive effect of an underweight allocation to materials. Positive stock selection within Consumer Staples was bolstered by Proya Cosmetics. Proya is a leading domestic Chinese beauty company with differentiated positioning in channels, brands, products, and regions (lower-tier cities), as well as solid execution. We expect Proya to be one of the key beneficiaries of the domestic substitution trend within China’s cosmetics and beauty industry, which is currently dominated by overseas brands, and to continue gaining share in this highly fragmented market. The share price strengthened after the company reported strong fiscal 2021 gains primarily attributed to its continued new product launches and expansion into increased online purchases. Energy stock selection was also positive, driven by Parkland Corp. Parkland is a Canadian fuel retail company and benefits from a vertically integrated fuel downstream business model with large economies of scale. We expect the company should be able to achieve top-line organic growth in the low- to mid-single digits augmented by value-accretive mergers & acquisitions activity and steady margin improvement. The share price strengthened alongside rising commodity crude prices in the second quarter coupled with solid first quarter results with upbeat guidance for the second half of 2022. Please refer to the Global Markets Review and Outlook relating to the Fund beginning on page 32. |
| | | |
| 56 | Semiannual Report | June 30, 2022 |
International Small Cap Growth Fund
Performance Highlights (Unaudited)
Average Annual Total Returns through 6/30/2022
| | | Year to
Date | | 1 Year | | 3 Year | | 5 Year | | 10 Year |
| Class N | | | (38.95 | )% | | | (36.91 | )% | | | (0.62 | )% | | | (0.05 | )% | | | 4.78 | % |
| Class I | | | (38.87 | ) | | | (36.74 | ) | | | (0.35 | ) | | | 0.24 | | | | 5.08 | |
| Class R6 | | | (38.79 | ) | | | (36.64 | ) | | | (0.21 | ) | | | 0.34 | | | | 5.22 | |
| MSCI ACW ex-U.S. Small Cap Index (net) | | (22.92 | ) | | | (22.45 | ) | | | 2.94 | | | | 2.55 | | | | 6.22 | |
Performance cited represents past performance. Past performance does not guarantee future results and current performance may be lower or higher than the data quoted. Results shown are average annual total returns, which assume reinvestment of dividends and capital gains. Investment returns and principal will fluctuate and you may have a gain or loss when you sell shares. For the most current month-end performance information, please call 1-800-742-7272, or visit our Web site at www.williamblairfunds.com. From time to time, the investment adviser may waive fees or reimburse expenses for the Fund. Without these waivers/reimbursements, performance would be lower. Investing in smaller companies involves special risks, including higher volatility and lower liquidity. Smaller capitalization stocks are also more sensitive to purchase/sale transactions and changes in the issuer’s financial condition. International investing involves special risk considerations, including currency fluctuations, lower liquidity, economic and political risk. Class N shares are not subject to a sales load. Class I shares are not subject to a sales load or distribution (Rule 12b-1) fees. Class R6 shares are not subject to a sales load, distribution (Rule 12b-1) fees, or sub-transfer agent fees.
The performance highlights and graph presented above do not reflect the deduction of taxes that a shareholder would pay on fund distributions or the redemption of fund shares.
The Morgan Stanley Capital International (MSCI) All Country World (ACW) ex-U.S. Small Cap Index (net) is a free float-adjusted market capitalization weighted index that is designed to measure the equity market performance of small capitalization developed and emerging markets, excluding the United States. This index approximates the minimum possible dividend reinvestment by deducting for the highest possible withholding tax rates of those markets.
This report identifies the Fund’s investments on June 30, 2022. These holdings are subject to change. Not all stocks in the Fund performed the same, nor is there any guarantee that these stocks will perform as well in the future. Market forecasts provided in this report may not necessarily come to pass.
Sector Diversification (Unaudited)
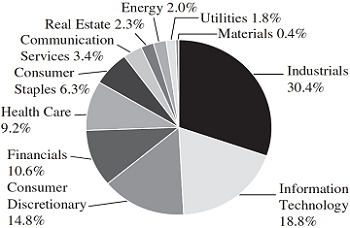
The sector diversification shown is based on the total long-term securities.
| June 30, 2022 | William Blair Funds | 57 |
International Small Cap Growth Fund
Portfolio of Investments, June 30, 2022 (all dollar amounts in thousands) (unaudited)
| | | | | | | | |
| | | | | | | | |
| | Issuer | | Shares | | | Value | |
| | | | | | | | | | |
| | Common Stocks | | | | | | | | |
| | | | | | | | | | |
| | Europe, Mid-East—33.2% | | | | | | | | |
| | Belgium—1.7% | | | | | | | | |
| | Melexis N.V. (Semiconductors & semiconductor equipment) | | | 40,483 | | | $ | 2,904 | |
| | Warehouses De Pauw CVA (Equity REIT) | | | 37,908 | | | | 1,192 | |
| | | | | | | | | 4,096 | |
| | Denmark—1.1% | | | | | | | | |
| | Royal Unibrew A/S (Beverages) | | | 30,306 | | | | 2,683 | |
| | Finland—1.5% | | | | | | | | |
| * | Musti Group Oyj (Specialty retail) | | | 105,321 | | | | 1,881 | |
| | Valmet Oyj (Machinery) | | | 70,402 | | | | 1,727 | |
| | | | | | | | | 3,608 | |
| | Germany—2.7% | | | | | | | | |
| | CompuGroup Medical SE & Co. KgaA (Health care technology) | | | 32,748 | | | | 1,395 | |
| * | CTS Eventim AG & Co. KGaA (Entertainment) | | | 67,759 | | | | 3,550 | |
| | Siltronic AG (Semiconductors & semiconductor equipment) | | | 19,416 | | | | 1,443 | |
| | | | | | | | | 6,388 | |
| | Israel—1.7% | | | | | | | | |
| * | Inmode, Ltd. (Health care equipment & supplies)† | | | 147,376 | | | | 3,303 | |
| | Maytronics, Ltd. (Household durables) | | | 43,021 | | | | 605 | |
| | | | | | | | | 3,908 | |
| | Italy—4.3% | | | | | | | | |
| | Amplifon SpA (Health care providers & services) | | | 33,164 | | | | 1,017 | |
| | Ariston Holding N.V. (Household durables) | | | 433,532 | | | | 3,550 | |
| | Azimut Holding SpA (Capital markets) | | | 45,775 | | | | 796 | |
| | Brembo SpA (Auto components) | | | 141,523 | | | | 1,375 | |
| | Brunello Cucinelli SpA (Textiles, apparel & luxury goods) | | | 38,465 | | | | 1,732 | |
| | Carel Industries SpA (Building products) | | | 85,750 | | | | 1,704 | |
| | | | | | | | | 10,174 | |
| | Netherlands—0.8% | | | | | | | | |
| | BE Semiconductor Industries N.V. (Semiconductors & semiconductor equipment) | | | 37,793 | | | | 1,817 | |
| | Norway—1.8% | | | | | | | | |
| * | AutoStore Holdings, Ltd. (Machinery) | | | 416,862 | | | | 592 | |
| | Gjensidige Forsikring ASA (Insurance) | | | 97,758 | | | | 1,980 | |
| | TOMRA Systems ASA (Commercial services & supplies) | | | 82,594 | | | | 1,532 | |
| | | | | | | | | 4,104 | |
| | Spain—1.7% | | | | | | | | |
| | EDP Renovaveis S.A. (Independent power & renewable electricity producers) | | | 117,212 | | | | 2,766 | |
| * | Solaria Energia y Medio Ambiente S.A. (Independent power & renewable electricity producers) | | | 61,067 | | | | 1,296 | |
| | | | | | | | | 4,062 | |
| | | | | | | | |
| | | | | | | | |
| | Issuer | | Shares | | | Value | |
| | | | | | | | | | |
| | Common Stocks—(continued) | | | | | | | | |
| | | | | | | | | | |
| | Europe, Mid-East—(continued) | | | | | | | | |
| | Sweden—11.7% | | | | | | | | |
| | AddTech AB Class “B” (Trading companies & distributors) | | | 134,192 | | | $ | 1,750 | |
| | Arjo AB Class “B” (Health care equipment & supplies) | | | 186,648 | | | | 1,180 | |
| | Beijer Ref AB (Trading companies & distributors) | | | 166,465 | | | | 2,276 | |
| | Biotage AB (Life sciences tools & services) | | | 145,871 | | | | 2,581 | |
| | Bravida Holding AB (Commercial services & supplies) | | | 16,455 | | | | 143 | |
| | Bufab AB (Trading companies & distributors) | | | 47,652 | | | | 1,234 | |
| | Fortnox AB (Software) | | | 445,470 | | | | 2,047 | |
| | Hemnet Group AB (Interactive Media & Services) | | | 114,889 | | | | 1,412 | |
| | Investment AB Latour Class “B” (Industrial conglomerates) | | | 98,549 | | | | 1,949 | |
| | Lagercrantz Group AB Class “B” (Electronic equipment, instruments & components) | | | 215,462 | | | | 1,745 | |
| | Lifco AB Class “B” (Industrial conglomerates) | | | 138,984 | | | | 2,232 | |
| | MIPS AB (Leisure products) | | | 60,615 | | | | 2,644 | |
| | Nolato AB Class “B” (Industrial conglomerates) | | | 213,467 | | | | 1,148 | |
| * | Sdiptech AB Class “B” (Commercial services & supplies) | | | 70,643 | | | | 1,634 | |
| | Sweco AB Class “B” (Construction & engineering) | | | 162,722 | | | | 1,691 | |
| | Vitrolife AB (Biotechnology) | | | 80,285 | | | | 1,846 | |
| | | | | | | | | 27,512 | |
| | Switzerland—4.2% | | | | | | | | |
| | Galenica AG (Health care providers & services) | | | 46,102 | | | | 3,540 | |
| | Kardex Holding AG (Machinery) | | | 19,905 | | | | 3,307 | |
| * | Siegfried Holding AG (Life sciences tools & services) | | | 4,538 | | | | 2,899 | |
| | | | | | | | | 9,746 | |
| | | | | | | | | | |
| | Emerging Asia—16.7% | | | | | | | | |
| | China—3.6% | | | | | | | | |
| | Chacha Food Co., Ltd. Class “A” (Food products) | | | 491,600 | | | | 4,181 | |
| | Proya Cosmetics Co., Ltd. Class “A” (Personal products) | | | 173,444 | | | | 4,279 | |
| | | | | | | | | 8,460 | |
| | India—7.4% | | | | | | | | |
| * | Aavas Financiers, Ltd. (Thrifts & mortgage finance) | | | 86,701 | | | | 2,231 | |
| * | Affle India, Ltd. (Media) | | | 60,557 | | | | 817 | |
| * | AU Small Finance Bank, Ltd. (Banks) | | | 731,686 | | | | 5,476 | |
| | Info Edge India, Ltd. (Interactive Media & Services) | | | 43,428 | | | | 2,084 | |
See accompanying Notes to Financial Statements.
| 58 | Semiannual Report | June 30, 2022 |
International Small Cap Growth Fund
Portfolio of Investments, June 30, 2022 (all dollar amounts in thousands) (unaudited)
| | | | | | | | |
| | | | | | | | |
| | Issuer | | Shares | | | Value | |
| | | | | | | | | | |
| | Common Stocks—(continued) | | | | | | | | |
| | | | | | | | | | |
| | Emerging Asia—(continued) | | | | | | | | |
| | India—(continued) | | | | | | | | |
| * | Motherson Sumi Wiring India, Ltd. (Auto components) | | | 2,222,488 | | | $ | 1,978 | |
| | Samvardhana Motherson International, Ltd. (Auto components) | | | 2,555,955 | | | | 3,813 | |
| | UPL, Ltd. (Chemicals) | | | 126,131 | | | | 1,012 | |
| | | | | | | | | 17,411 | |
| | Indonesia—1.2% | | | | | | | | |
| | Ace Hardware Indonesia Tbk PT (Specialty retail) | | | 22,834,900 | | | | 1,181 | |
| | Bank Negara Indonesia Persero Tbk PT (Banks) | | | 3,302,500 | | | | 1,740 | |
| | | | | | | | | 2,921 | |
| | Malaysia—0.6% | | | | | | | | |
| | MR DIY Group M Bhd (Specialty retail) | | | 3,155,900 | | | | 1,482 | |
| | South Korea—0.7% | | | | | | | | |
| | Koh Young Technology, Inc. (Semiconductors & semiconductor equipment) | | | 154,466 | | | | 1,677 | |
| | Taiwan—3.2% | | | | | | | | |
| | ASPEED Technology, Inc. (Semiconductors & semiconductor equipment) | | | 17,600 | | | | 1,125 | |
| | Tripod Technology Corporation (Electronic equipment, instruments & components) | | | 775,000 | | | | 2,906 | |
| | Voltronic Power Technology Corporation (Electrical equipment) | | | 69,451 | | | | 3,375 | |
| | | | | | | | | 7,406 | |
| | | | | | | | | | |
| | Japan—16.2% | | | | | | | | |
| | BayCurrent Consulting, Inc. (Professional services) | | | 14,400 | | | | 3,831 | |
| | Benefit One, Inc. (Professional services) | | | 193,500 | | | | 2,601 | |
| | Food & Life Cos., Ltd. (Hotels, restaurants & leisure) | | | 132,100 | | | | 2,820 | |
| | GMO Payment Gateway, Inc. (IT services) | | | 25,200 | | | | 1,774 | |
| | Harmonic Drive Systems, Inc. (Machinery) | | | 101,600 | | | | 2,962 | |
| | Japan Elevator Service Holdings Co., Ltd. (Commercial services & supplies) | | | 194,200 | | | | 2,021 | |
| | JINS Holdings, Inc. (Specialty retail) | | | 38,500 | | | | 1,209 | |
| | Meitec Corporation (Professional services) | | | 145,800 | | | | 2,350 | |
| | Rakus Co., Ltd. (Software) | | | 200,300 | | | | 2,360 | |
| | SCSK Corporation (IT services) | | | 156,300 | | | | 2,645 | |
| * | SHIFT, Inc. (IT services) | | | 26,100 | | | | 3,397 | |
| | SMS Co., Ltd. (Professional services) | | | 193,600 | | | | 3,815 | |
| | TechnoPro Holdings, Inc. (Professional services) | | | 224,900 | | | | 4,504 | |
| | TIS, Inc. (IT services) | | | 74,000 | | | | 1,939 | |
| | | | | | | | | 38,228 | |
| | | | | | | | |
| | | | | | | | |
| | Issuer | | Shares | | | Value | |
| | | | | | | | | | |
| | Common Stocks—(continued) | | | | | | | | |
| | | | | | | | | | |
| | United Kingdom—13.6% | | | | | | | | |
| | AVEVA Group plc (Software) | | | 30,198 | | | $ | 828 | |
| | Beazley plc (Insurance) | | | 806,842 | | | | 4,901 | |
| | Burford Capital, Ltd. (Diversified financial services) | | | 193,094 | | | | 1,892 | |
| | CVS Group plc (Health care providers & services) | | | 64,726 | | | | 1,305 | |
| | Diploma plc (Trading companies & distributors) | | | 121,837 | | | | 3,304 | |
| | Greggs plc (Hotels, restaurants & leisure) | | | 72,108 | | | | 1,587 | |
| | IntegraFin Holdings plc (Capital markets) | | | 415,246 | | | | 1,136 | |
| * | Kin & Carta plc (IT services) | | | 342,279 | | | | 731 | |
| | Pets at Home Group plc (Specialty retail) | | | 456,273 | | | | 1,706 | |
| | Renishaw plc (Electronic equipment, instruments & components) | | | 68,495 | | | | 2,975 | |
| | Rotork plc (Machinery) | | | 1,057,475 | | | | 3,097 | |
| | Safestore Holdings plc (Equity REIT) | | | 323,533 | | | | 4,179 | |
| | Softcat plc (IT services) | | | 269,437 | | | | 4,320 | |
| | | | | | | | | 31,961 | |
| | | | | | | | | | |
| | Emerging Latin America—7.3% | | | | | | | | |
| | Brazil—2.9% | | | | | | | | |
| | Arezzo Industria e Comercio S.A. (Textiles, apparel & luxury goods) | | | 244,200 | | | | 3,245 | |
| | Pet Center Comercio e Participacoes S.A. (Specialty retail) | | | 857,092 | | | | 1,626 | |
| | TOTVS S.A. (Software) | | | 438,400 | | | | 1,949 | |
| | | | | | | | | 6,820 | |
| | Mexico—4.4% | | | | | | | | |
| | Grupo Aeroportuario del Centro Norte S.A.B. de C.V. (Transportation infrastructure) | | | 912,800 | | | | 5,831 | |
| | Grupo Aeroportuario del Sureste S.A.B. de C.V. Class “B” (Transportation infrastructure) | | | 161,530 | | | | 3,184 | |
| | Regional S.A.B. de C.V. (Banks) | | | 307,800 | | | | 1,462 | |
| | | | | | | | | 10,477 | |
| | | | | | | | | | |
| | Canada—4.9% | | | | | | | | |
| | EQB, Inc. (Thrifts & mortgage finance) | | | 45,371 | | | | 1,874 | |
| * | Kinaxis, Inc. (Software) | | | 30,021 | | | | 3,241 | |
| | Parkland Corporation (Oil, gas & consumable fuels) | | | 166,990 | | | | 4,535 | |
| | Richelieu Hardware, Ltd. (Trading companies & distributors) | | | 72,453 | | | | 1,896 | |
| | | | | | | | | 11,546 | |
| | | | | | | | | | |
| | Emerging Europe, Mid-East, Africa—3.1% | | | | | | | | |
| | Greece—0.5% | | | | | | | | |
| | JUMBO S.A. (Specialty retail) | | | 85,584 | | | | 1,243 | |
| | South Africa—2.0% | | | | | | | | |
| | Clicks Group, Ltd. (Food & staples retailing) | | | 201,648 | | | | 3,388 | |
| | The Bidvest Group, Ltd. (Industrial conglomerates) | | | 99,980 | | | | 1,288 | |
| | | | | | | | | 4,676 | |
See accompanying Notes to Financial Statements.
| June 30, 2022 | William Blair Funds | 59 |
International Small Cap Growth Fund
Portfolio of Investments, June 30, 2022 (all dollar amounts in thousands) (unaudited)
| | Issuer | | Shares or
Principal
Amount | | | Value | |
| | | | | | | | | | |
| | Common Stocks—(continued) | | | | | | | | |
| | | | | | | | | | |
| | Emerging Europe, Mid-East, Africa—(continued) | | | | | | | | |
| | United Arab Emirates—0.6% | | | | | | | | |
| * | Network International Holdings plc (IT services) | | | 577,547 | | | $ | 1,327 | |
| | | | | | | | | | |
| | Asia—2.4% | | | | | | | | |
| | Australia—1.4% | | | | | | | | |
| | Domino’s Pizza Enterprises, Ltd. (Hotels, restaurants & leisure) | | | 7,416 | | | | 348 | |
| | Netwealth Group, Ltd. (Capital markets) | | | 94,475 | �� | | | 793 | |
| | Pro Medicus, Ltd. (Health care technology) | | | 69,779 | | | | 2,035 | |
| | | | | | | | | 3,176 | |
| | New Zealand—1.0% | | | | | | | | |
| | Mainfreight, Ltd. (Air freight & logistics) | | | 54,458 | | | | 2,377 | |
| | Total Common Stocks—97.4%
(cost $268,782) | | | | | | | 229,286 | |
| | | | | | | | | | |
| | Repurchase Agreement | | | | | | | | |
| | Fixed Income Clearing Corporation, 0.240% dated 6/30/22, due 7/1/22, repurchase price $6,440, collateralized by U.S. Treasury Note, 1.625%, due 05/15/31, valued at $6,568 | | | $6,439 | | | | 6,439 | |
| | Total Repurchase Agreement—2.7%
(cost $6,439) | | | | | | | 6,439 | |
| | Total Investments—100.1%
(cost $275,221) | | | | | | | 235,725 | |
| | Liabilities, plus cash and other assets—(0.1)% | | | | | | | (292 | ) |
| | Net assets—100.0% | | | | | | $ | 235,433 | |
REIT = Real Estate Investment Trust
* = Non-income producing security
† = U.S. listed foreign security
At June 30, 2022, the Fund’s Portfolio of Investments includes the following industry categories (as a percentage of long-term investments):
| Industrials | 30.4% |
| Information Technology | 18.8% |
| Consumer Discretionary | 14.8% |
| Financials | 10.6% |
| Health Care | 9.2% |
| Consumer Staples | 6.3% |
| Communication Services | 3.4% |
| Real Estate | 2.3% |
| Energy | 2.0% |
| Utilities | 1.8% |
| Materials | 0.4% |
| Total | 100.0% |
At June 30, 2022, the Fund’s Portfolio of Investments includes the following currency categories (as a percentage of long-term investments):
| Japanese Yen | 16.7% |
| British Pound Sterling | 14.5% |
| Euro | 13.7% |
| Swedish Krona | 12.0% |
| Indian Rupee | 7.6% |
| Canadian Dollar | 5.0% |
| Mexican Peso | 4.6% |
| Swiss Franc | 4.3% |
| Chinese Yuan Renminbi | 3.7% |
| New Taiwan Dollar | 3.2% |
| Brazilian Real | 3.0% |
| South African Rand | 2.0% |
| Norwegian Krone | 1.8% |
| U.S. Dollar | 1.4% |
| Australian Dollar | 1.4% |
| Indonesian Rupiah | 1.3% |
| Danish Krone | 1.2% |
| New Zealand Dollar | 1.0% |
| All Other Currencies | 1.6% |
| Total | 100.0% |
See accompanying Notes to Financial Statements.
| 60 | Semiannual Report | June 30, 2022 |
| | Emerging Markets Leaders Fund |
| | |
| | The Emerging Markets Leaders Fund seeks long-term capital appreciation. |
| | |
| | AN OVERVIEW FROM THE PORTFOLIO MANAGERS |
| | |

Todd M. McClone, CFA 
Kenneth J. McAtamney 
Hugo Scott-Gall | The William Blair Emerging Markets Leaders Fund (Class N shares) (the “Fund”) posted a 23.48% decrease, net of fees, for the six months ended June 30, 2022. By comparison, the Fund’s benchmark index, the MSCI Emerging Markets Index (net) (the “Index”), decreased 17.63%. Six-month underperformance versus the Index was driven by negative stock selection effect within Communication Services, Consumer Discretionary, and Information Technology. Within Communication Services, Yandex, a Russian internet platform, and SEA, a Southeast Asia gaming and e-commerce company, dragged down relative performance. Within Consumer Discretionary, e-commerce names were notable detractors; in particular, MercadoLibre and Coupang were dragged down by performance in the second quarter. Globant and Mediatek, within the IT services and semiconductor industries, respectively, weighed on the Information Technology sector’s relative performance. Yandex fell sharply along with Russian equities on the back of the country’s invasion of Ukraine. We exited the position in February 2022. SEA underperformed amid market rotation and weaker fundamental results, with slowing growth in the core gaming segment and continued investments into new markets, which added to investor concerns about Indian market restrictions and management’s capital-allocation discipline. Mediatek continued robust financial results; however, the share price declined as broader consumer weakness and slower incremental 5G adoption suggest rising risk to 2022-2023 expectations. Partially offsetting these effects was positive stock selection within the Energy sector, coupled with the overweight allocation to Consumer Staples and Industrials. Within Energy, Reliance Industries bolstered relative performance as the company delivered very strong results, benefiting from robust retail trends amid India reopening, rising gas prices, and wireless tariff increases. We believe that Reliance’s transformation from an asset-heavy, cyclical energy business to more diversified, end-consumer businesses with large and expanding total addressable markets is under-appreciated and will continue to drive strong growth and returns over the long term while the commodity business will continue to provide earnings support in the near term. Please refer to the Global Markets Review and Outlook relating to the Fund beginning on page 32. |
| | | |
| June 30, 2022 | William Blair Funds | 61 |
Emerging Markets Leaders Fund
Performance Highlights (Unaudited)
Average Annual Total Returns through 6/30/2022
| | | Year to
Date | | 1 Year | | 3 Year | | 5 Year | | 10 Year |
| Class N | | | (23.48 | )% | | | (31.88 | )% | | | (0.48 | )% | | | 2.22 | % | | | 2.87 | % |
| Class I | | | (23.30 | ) | | | (31.66 | ) | | | (0.22 | ) | | | 2.49 | | | | 3.16 | |
| Class R6 | | | (23.23 | ) | | | (31.56 | ) | | | (0.13 | ) | | | 2.55 | | | | 3.25 | |
| MSCI Emerging Markets Index (net) | | | (17.63 | ) | | | (25.28 | ) | | | 0.57 | | | | 2.18 | | | | 3.06 | |
Performance cited represents past performance. Past performance does not guarantee future results and current performance may be lower or higher than the data quoted. Results shown are average annual total returns, which assume reinvestment of dividends and capital gains. Investment returns and principal will fluctuate and you may have a gain or loss when you sell shares. For the most current month-end performance information, please call 1-800-742-7272, or visit our Web site at www.williamblairfunds.com. International investing involves special risk considerations, including currency fluctuations, lower liquidity, economic and political risk. These risks may be magnified when investing in emerging markets. From time to time, the investment adviser may waive fees or reimburse expenses for the Fund. Without these waivers/reimbursements, performance would be lower. Class N shares are not subject to a sales load. Class I shares are not subject to a sales load or distribution (Rule 12b-1) fees. Class R6 shares are not subject to a sales load, distribution (Rule 12b-1) fees, or sub-transfer agent fees.
The performance highlights and graph presented above do not reflect the deduction of taxes that a shareholder would pay on fund distributions or the redemption of fund shares.
The Morgan Stanley Capital International (MSCI) Emerging Markets Index (net) is a free float-adjusted market-capitalization-weighted index that is designed to measure equity market performance of emerging markets. This index approximates the minimum possible dividend reinvestment by deducting for the highest possible withholding tax rates of those markets.
This report identifies the Fund’s investments on June 30, 2022. These holdings are subject to change. Not all stocks in the Fund performed the same, nor is there any guarantee that these stocks will perform as well in the future. Market forecasts provided in this report may not necessarily come to pass.
Sector Diversification (Unaudited)
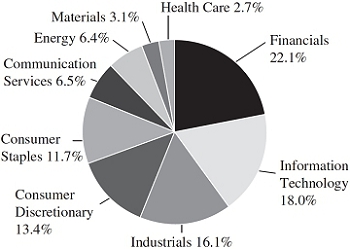
The sector diversification shown is based on the total long-term securities.
| 62 | Semiannual Report | June 30, 2022 |
Emerging Markets Leaders Fund
Portfolio of Investments, June 30, 2022 (all dollar amounts in thousands) (unaudited)
| | | | | | | | |
| | | | | | | | |
| | Issuer | | Shares | | | Value | |
| | | | | | | | | | |
| | Common Stocks | | | | | | | | |
| | | | | | | | | | |
| | Emerging Asia—73.3% | | | | | | | | |
| | China—33.2% | | | | | | | | |
| * | Alibaba Group Holding, Ltd. (Internet & direct marketing retail) | | | 1,123,628 | | | $ | 16,024 | |
| | China Merchants Bank Co., Ltd. Class “H” (Banks) | | | 2,017,000 | | | | 13,495 | |
| * | China Tourism Group Duty Free Corporation, Ltd. Class “A” (Specialty retail) | | | 352,056 | | | | 12,250 | |
| | Foshan Haitian Flavouring & Food Co., Ltd. Class “A” (Food products) | | | 570,701 | | | | 7,703 | |
| | JD.com, Inc. Class “A” (Internet & direct marketing retail) | | | 142,054 | | | | 4,577 | |
| | Kweichow Moutai Co., Ltd. Class “A” (Beverages) | | | 39,059 | | | | 11,932 | |
| | Midea Group Co., Ltd. Class “A” (Household durables) | | | 909,300 | | | | 8,203 | |
| | Shenzhen Inovance Technology Co., Ltd. Class “A” (Machinery) | | | 523,100 | | | | 5,147 | |
| | Shenzhou International Group Holdings, Ltd. (Textiles, apparel & luxury goods) | | | 211,200 | | | | 2,558 | |
| | Silergy Corporation (Semiconductors & semiconductor equipment) | | | 28,000 | | | | 2,255 | |
| | Suzhou Maxwell Technologies Co., Ltd. Class “A” (Electrical equipment) | | | 112,200 | | | | 8,228 | |
| | Tencent Holdings, Ltd. (Interactive Media & Services) | | | 451,400 | | | | 20,387 | |
| | TravelSky Technology, Ltd. Class “H” (IT services) | | | 2,971,000 | | | | 5,770 | |
| | Wuxi Lead Intelligent Equipment Co., Ltd. Class “A” (Machinery) | | | 786,169 | | | | 7,420 | |
| * | Zhangzhou Pientzehuang Pharmaceutical Co., Ltd. Class “A” (Pharmaceuticals) | | | 107,800 | | | | 5,745 | |
| | | | | | | | | 131,694 | |
| | India—22.1% | | | | | | | | |
| | Asian Paints, Ltd. (Chemicals) | | | 84,060 | | | | 2,854 | |
| | Bajaj Finance, Ltd. (Consumer finance) | | | 84,800 | | | | 5,790 | |
| | Britannia Industries, Ltd. (Food products) | | | 93,334 | | | | 4,067 | |
| | Havells India, Ltd. (Electrical equipment) | | | 211,314 | | | | 2,917 | |
| | HDFC Bank, Ltd. (Banks) | | | 667,188 | | | | 11,355 | |
| | Housing Development Finance Corporation, Ltd. (Thrifts & mortgage finance) | | | 233,247 | | | | 6,362 | |
| | Infosys, Ltd. (IT services) | | | 691,950 | | | | 12,788 | |
| * | InterGlobe Aviation, Ltd. (Airlines) | | | 303,074 | | | | 6,177 | |
| * | Motherson Sumi Wiring India, Ltd. (Auto components) | | | 931,670 | | | | 829 | |
| * | Reliance Industries, Ltd. (Oil, gas & consumable fuels) | | | 766,267 | | | | 25,121 | |
| * | UPL, Ltd. (Chemicals) | | | 1,145,512 | | | | 9,190 | |
| | | | | | | | | 87,450 | |
| | Indonesia—5.5% | | | | | | | | |
| | Bank Central Asia Tbk PT (Banks) | | | 28,834,500 | | | | 14,033 | |
| | Bank Rakyat Indonesia Persero Tbk PT (Banks) | | | 22,642,300 | | | | 6,307 | |
| * | Sea, Ltd.—ADR (Entertainment) | | | 24,903 | | | | 1,665 | |
| | | | | | | | | 22,005 | |
| | | | | | | | |
| | | | | | | | |
| | Issuer | | Shares | | | Value | |
| | | | | | | | | | |
| | Common Stocks—(continued) | | | | | | | | |
| | | | | | | | | | |
| | Emerging Asia—(continued) | | | | | | | | |
| | South Korea—0.8% | | | | | | | | |
| | Kakao Corporation (Interactive Media & Services) | | | 60,891 | | | $ | 3,278 | |
| | Taiwan—10.5% | | | | | | | | |
| * | Airtac International Group (Machinery) | | | 182,000 | | | | 6,066 | |
| * | E.Sun Financial Holding Co., Ltd. (Banks) | | | 5,003,267 | | | | 4,880 | |
| | eMemory Technology, Inc. (Semiconductors & semiconductor equipment) | | | 61,000 | | | | 2,123 | |
| | MediaTek, Inc. (Semiconductors & semiconductor equipment) | | | 247,000 | | | | 5,408 | |
| | Taiwan Semiconductor Manufacturing Co., Ltd.—ADR (Semiconductors & semiconductor equipment) | | | 283,060 | | | | 23,140 | |
| | | | | | | | | 41,617 | |
| | Thailand—1.2% | | | | | | | | |
| | Bangkok Dusit Medical Services PCL Class “F” (Health care providers & services) | | | 6,536,600 | | | | 4,622 | |
| | | | | | | | | | |
| | Emerging Latin America—20.6% | | | | | | | | |
| | Argentina—4.0% | | | | | | | | |
| * | Globant S.A. (IT services)† | | | 47,592 | | | | 8,281 | |
| * | MercadoLibre, Inc. (Internet & direct marketing retail) | | | 12,203 | | | | 7,772 | |
| | | | | | | | | 16,053 | |
| | Brazil—7.6% | | | | | | | | |
| | B3 S.A. - Brasil Bolsa Balcao (Capital markets) | | | 3,798,600 | | | | 7,955 | |
| * | Locaweb Servicos de Internet S.A. (IT services) | | | 1,511,000 | | | | 1,623 | |
| | Raia Drogasil S.A. (Food & staples retailing) | | | 783,900 | | | | 2,876 | |
| | Rumo S.A. (Road & rail) | | | 1,628,800 | | | | 4,970 | |
| | TOTVS S.A. (Software) | | | 1,265,200 | | | | 5,623 | |
| | WEG S.A. (Electrical equipment) | | | 1,376,400 | | | | 6,957 | |
| | | | | | | | | 30,004 | |
| | Mexico—7.0% | | | | | | | | |
| | Grupo Aeroportuario del Pacifico S.A.B. de C.V. Class “B” (Transportation infrastructure) | | | 1,058,700 | | | | 14,801 | |
| | Wal-Mart de Mexico S.A.B. de C.V. (Food & staples retailing) | | | 3,742,800 | | | | 12,879 | |
| | | | | | | | | 27,680 | |
| | Peru—1.4% | | | | | | | | |
| | Credicorp, Ltd. (Banks)† | | | 46,180 | | | | 5,537 | |
| | Uruguay—0.6% | | | | | | | | |
| * | Dlocal, Ltd. (IT services)† | | | 92,009 | | | | 2,415 | |
| | | | | | | | | | |
| | Emerging Mid-East, Africa—4.3% | | | | | | | | |
| | South Africa—4.1% | | | | | | | | |
| | Capitec Bank Holdings, Ltd. (Banks) | | | 85,222 | | | | 10,383 | |
| | Clicks Group, Ltd. (Food & staples retailing) | | | 363,819 | | | | 6,112 | |
| | | | | | | | | 16,495 | |
See accompanying Notes to Financial Statements.
| June 30, 2022 | William Blair Funds | 63 |
Emerging Markets Leaders Fund
Portfolio of Investments, June 30, 2022 (all dollar amounts in thousands) (unaudited)
| | Issuer | | Shares or
Principal
Amount | | | Value | |
| | | | | | | | | | |
| | Common Stocks—(continued) | | | | | | | | |
| | | | | | | | | | |
| | Emerging Mid-East, Africa—(continued) | | | | | | | | |
| | United Arab Emirates—0.2% | | | | | | | | |
| * | Network International Holdings plc (IT services) | | | 309,044 | | | $ | 710 | |
| | Total Common Stocks—98.2%
(cost $431,390) | | | | | | | 389,560 | |
| | | | | | | | | | |
| | Repurchase Agreement | | | | | | | | |
| | Fixed Income Clearing Corporation, 0.240% dated 6/30/22, due 7/1/22, repurchase price $3,263, collateralized by U.S. Treasury Note, 1.625%, due 05/15/31, valued at $3,328 | | | $3,263 | | | | 3,263 | |
| | Total Repurchase Agreement—0.8%
(cost $3,263) | | | | | | | 3,263 | |
| | Total Investments—99.0%
(cost $434,653) | | | | | | | 392,823 | |
| | Cash and other assets, less liabilities—1.0% | | | | | | | 3,793 | |
| | Net assets—100.0% | | | | | | $ | 396,616 | |
ADR = American Depository Receipt
* = Non-income producing security
† = U.S. listed foreign security
At June 30, 2022, the Fund’s Portfolio of Investments includes the following industry categories (as a percentage of long-term investments):
| Financials | 22.1% |
| Information Technology | 18.0% |
| Industrials | 16.1% |
| Consumer Discretionary | 13.4% |
| Consumer Staples | 11.7% |
| Communication Services | 6.5% |
| Energy | 6.4% |
| Materials | 3.1% |
| Health Care | 2.7% |
| Total | 100.0% |
At June 30, 2022, the Fund’s Portfolio of Investments includes the following currency categories (as a percentage of long-term investments):
| Indian Rupee | 22.5% |
| Chinese Yuan Renminbi | 17.1% |
| Hong Kong Dollar | 16.1% |
| U.S. Dollar | 12.5% |
| Brazilian Real | 7.7% |
| Mexican Peso | 7.1% |
| New Taiwan Dollar | 5.3% |
| Indonesian Rupiah | 5.2% |
| South African Rand | 4.3% |
| Thai Baht | 1.2% |
| All Other Currencies | 1.0% |
| Total | 100.0% |
See accompanying Notes to Financial Statements.
| 64 | Semiannual Report | June 30, 2022 |
| | Emerging Markets Growth Fund |
| | |
| | The Emerging Markets Growth Fund seeks long-term capital appreciation. |
| | |
| | AN OVERVIEW FROM THE PORTFOLIO MANAGERS |
| | |

Todd M. McClone, CFA 
Casey K. Preyss, CFA 
Vivian Lin Thurston, CFA | The William Blair Emerging Markets Growth Fund (Class N shares) (the “Fund”) posted a 28.04% decrease, net of fees, for the six months ended June 30, 2022. By comparison, the Fund’s benchmark index, the MSCI Emerging Markets IMI (net) (the “Index”), decreased 17.94%. Six-month underperformance versus the Index was driven by negative stock selection effect within Information Technology, Financials, Consumer Discretionary, and Communication Services. Information Technology was dragged down by semiconductor names, in particular- Silergy and Mediatek. Silergy is the market leader in China for analog semiconductors and in our view remains a beneficiary of structural growth in demand from automobile, cloud, and 5G end-markets, as well as a localization trend. The stock price weakened amid a deteriorated demand backdrop. Mediatek, a Taiwanese semiconductor design company, continued to deliver strong results on the back of stable 5G pricing and continued market share gain; however, unit growth expectations are decelerating amid broader consumer weakness and slower incremental 5G adoption. Within the Financials sector, TCS Group and OTP Bank hindered relative results. TCS Group, the leading Russian digital financial services company, and OTP Bank, the largest bank in Hungary with exposure to Eastern Europe, fell sharply due to the Russia–Ukraine conflict. We exited both positions in the wake of Russia’s invasion of Ukraine. MercadoLibre was the main detractor within the Consumer Discretionary sector, dragged down by the share underperformance in the second quarter. Within Communication Services, internet platforms Yandex of Russia and Kakao of Korea detracted the most. We sold Yandex to eliminate Russia exposure. Kakao’s share price declined amid market concerns related to increasing labor cost and management’s focus on content investments. Partially offsetting these effects was positive stock selection within the energy sector bolstered by strong relative performance from Reliance Industries. The company delivered very strong results in the first quarter, benefiting from robust retail trends amid India reopening, rising gas prices, and wireless tariff increases. We believe that the company’s transformation from an asset-heavy, cyclical energy business to more diversified, end-consumer businesses with large and expanding total addressable markets is under-appreciated and will continue to drive strong growth and returns over the long term while commodity business will continue to provide earnings support in the near term. Please refer to the Global Markets Review and Outlook relating to the Fund beginning on page 32. |
| June 30, 2022 | William Blair Funds | 65 |
Emerging Markets Growth Fund
Performance Highlights (Unaudited)
| Average Annual Total Returns through 6/30/2022 |
| | | Year to
Date | | 1 Year | | 3 Year | | 5 Year | | 10 Year |
| Class N | | | (28.04 | )% | | | (32.86 | )% | | | 4.75 | % | | | 4.55 | % | | | 4.64 | % |
| Class I | | | (27.95 | ) | | | (32.68 | ) | | | 5.03 | | | | 4.82 | | | | 4.90 | |
| Class R6 | | | (27.93 | ) | | | (32.62 | ) | | | 5.11 | | | | 4.91 | | | | 5.03 | |
| MSCI Emerging Markets IMI (net) | | | (17.94 | ) | | | (24.75 | ) | | | 1.15 | | | | 2.33 | | | | 3.20 | |
Performance cited represents past performance. Past performance does not guarantee future results and current performance may be lower or higher than the data quoted. Results shown are average annual total returns, which assume reinvestment of dividends and capital gains. Investment returns and principal will fluctuate and you may have a gain or loss when you sell shares. For the most current month-end performance information, please call 1-800-742-7272, or visit our Web site at www.williamblairfunds.com. From time to time, the investment adviser may waive fees or reimburse expenses for the Fund. Without these waivers/reimbursements, performance would be lower. International investing involves special risk considerations, including currency fluctuations, lower liquidity, economic and political risk. These risks may be magnified when investing in emerging markets. Class N shares are not subject to a sales load. Class I shares are not subject to a sales load or distribution (Rule 12b-1) fees. Class R6 shares are not subject to a sales load, distribution (Rule 12b-1) fees, or sub-transfer agent fees.
The performance highlights and graph presented above do not reflect the deduction of taxes that a shareholder would pay on fund distributions or the redemption of fund shares.
The Morgan Stanley Capital International (MSCI) Emerging Markets Investable Market Index (IMI) (net) is a free float-adjusted market capitalization weighted index that is designed to measure the equity market performance of emerging markets. This index approximates the minimum possible dividend reinvestment by deducting for the highest possible withholding tax rates of those markets.
This report identifies the Fund’s investments on June 30, 2022. These holdings are subject to change. Not all stocks in the Fund performed the same, nor is there any guarantee that these stocks will perform as well in the future. Market forecasts provided in this report may not necessarily come to pass.
Sector Diversification (Unaudited)
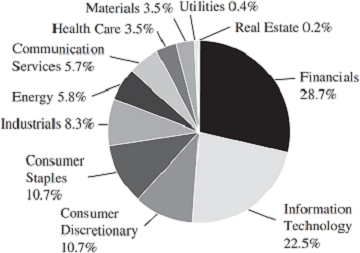
The sector diversification shown is based on the total long-term securities.
| 66 | Semiannual Report | June 30, 2022 |
Emerging Markets Growth Fund
Portfolio of Investments, June 30, 2022 (all dollar amounts in thousands) (unaudited)
| | | | | | | | |
| | | | | | | | |
| | Issuer | | Shares | | | Value | |
| | | | | | | | | | |
| | Common Stocks | | | | | | | | |
| | | | | | | | | | |
| | Emerging Asia—75.4% | | | | | | | | |
| | China—25.0% | | | | | | | | |
| | ANTA Sports Products, Ltd. (Textiles, apparel & luxury goods) | | | 361,000 | | | $ | 4,435 | |
| | Bank of Chengdu Co., Ltd. Class “A” (Banks) | | | 2,188,835 | | | | 5,421 | |
| | Bank of Ningbo Co., Ltd. Class “A” (Banks) | | | 1,788,700 | | | | 9,568 | |
| | Chacha Food Co., Ltd. Class “A” (Food products) | | | 330,472 | | | | 2,811 | |
| | China Meidong Auto Holdings, Ltd. (Specialty retail) | | | 1,036,000 | | | | 3,261 | |
| | China Merchants Bank Co., Ltd. Class “H” (Banks) | | | 1,715,000 | | | | 11,475 | |
| | China Tourism Group Duty Free Corporation, Ltd. Class “A” (Specialty retail) | | | 228,000 | | | | 7,933 | |
| | East Money Information Co., Ltd. Class “A” (Capital markets) | | | 1,452,740 | | | | 5,512 | |
| | Huaneng Lancang River Hydropower, Inc. Class “A” (Independent power & renewable electricity producers) | | | 2,447,900 | | | | 2,556 | |
| | Inner Mongolia Yili Industrial Group Co., Ltd. Class “A” (Food products) | | | 684,700 | | | | 3,984 | |
| | JD.com, Inc. Class “A” (Internet & direct marketing retail) | | | 510,921 | | | | 16,460 | |
| | Jiumaojiu International Holdings, Ltd. (Hotels, restaurants & leisure) | | | 1,730,000 | | | | 4,597 | |
| | Kweichow Moutai Co., Ltd. Class “A” (Beverages) | | | 37,774 | | | | 11,539 | |
| | Li Ning Co., Ltd. (Textiles, apparel & luxury goods) | | | 1,097,000 | | | | 10,164 | |
| | Longshine Technology Group Co., Ltd. Class “A” (Software) | | | 473,500 | | | | 1,782 | |
| | NARI Technology Co., Ltd. Class “A” (Electrical equipment) | | | 627,120 | | | | 2,529 | |
| | NAURA Technology Group Co., Ltd. Class “A” (Semiconductors & semiconductor equipment) | | | 56,800 | | | | 2,351 | |
| | NetEase, Inc. (Entertainment) | | | 899,900 | | | | 16,526 | |
| | Proya Cosmetics Co., Ltd. Class “A” (Personal products) | | | 228,820 | | | | 5,646 | |
| | Shenzhen Inovance Technology Co., Ltd. Class “A” (Machinery) | | | 721,464 | | | | 7,099 | |
| | Silergy Corporation (Semiconductors & semiconductor equipment) | | | 31,000 | | | | 2,497 | |
| | Suzhou Maxwell Technologies Co., Ltd. Class “A” (Electrical equipment) | | | 69,307 | | | | 5,083 | |
| | Tencent Holdings, Ltd. (Interactive Media & Services) | | | 288,960 | | | | 13,051 | |
| | Wuxi Lead Intelligent Equipment Co., Ltd. Class “A” (Machinery) | | | 542,800 | | | | 5,123 | |
| | Yunnan Botanee Bio-Technology Group Co., Ltd. Class “A” (Personal products) | | | 175,820 | | | | 5,713 | |
| | Yunnan Energy New Material Co., Ltd. Class “A” (Chemicals) | | | 64,100 | | | | 2,398 | |
| | Zhangzhou Pientzehuang Pharmaceutical Co., Ltd. Class “A” (Pharmaceuticals) | | | 71,500 | | | | 3,810 | |
| | | | | | | | |
| | | | | | | | |
| | Issuer | | Shares | | | Value | |
| | | | | | | | | | |
| | Common Stocks—(continued) | | | | | | | | |
| | | | | | | | | | |
| | Emerging Asia—(continued) | | | | | | | | |
| | China—(continued) | | | | | | | | |
| | Zhejiang Jingsheng Mechanical & Electrical Co., Ltd. Class “A” (Semiconductors & semiconductor equipment) | | | 420,890 | | | $ | 4,250 | |
| | Zhongsheng Group Holdings, Ltd. (Specialty retail) | | | 526,000 | | | | 3,710 | |
| | | | | | | | | 181,284 | |
| | India—19.3% | | | | | | | | |
| | Aarti Industries, Ltd. (Chemicals) | | | 122,737 | | | | 1,083 | |
| * | Affle India, Ltd. (Media) | | | 88,205 | | | | 1,190 | |
| * | Amber Enterprises India, Ltd. (Household durables) | | | 34,521 | | | | 978 | |
| * | APL Apollo Tubes, Ltd. (Metals & mining) | | | 204,389 | | | | 2,192 | |
| | Apollo Hospitals Enterprise, Ltd. (Health care providers & services) | | | 83,015 | | | | 3,857 | |
| | Asian Paints, Ltd. (Chemicals) | | | 54,959 | | | | 1,866 | |
| | Astral, Ltd. (Building products) | | | 51,426 | | | | 1,076 | |
| | Atul, Ltd. (Chemicals) | | | 8,098 | | | | 820 | |
| | Bajaj Finance, Ltd. (Consumer finance) | | | 77,451 | | | | 5,288 | |
| | Bata India, Ltd. (Textiles, apparel & luxury goods) | | | 84,498 | | | | 1,779 | |
| * | Clean Science & Technology, Ltd. (Chemicals) | | | 28,157 | | | | 533 | |
| | Computer Age Management Services, Ltd. (IT services) | | | 62,374 | | | | 1,784 | |
| | Crompton Greaves Consumer Electricals, Ltd. (Household durables) | | | 246,091 | | | | 1,063 | |
| | Dabur India, Ltd. (Personal products) | | | 289,397 | | | | 1,817 | |
| | Dixon Technologies India, Ltd. (Household durables) | | | 23,178 | | | | 1,046 | |
| | Escorts Kubota, Ltd. (Machinery) | | | 69,597 | | | | 1,273 | |
| * | Godrej Properties, Ltd. (Real estate management & development) | | | 71,119 | | | | 1,063 | |
| | Havells India, Ltd. (Electrical equipment) | | | 133,164 | | | | 1,838 | |
| | HDFC Bank, Ltd. (Banks) | | | 664,063 | | | | 11,301 | |
| | Hindustan Unilever, Ltd. (Personal products) | | | 75,075 | | | | 2,110 | |
| | Housing Development Finance Corporation, Ltd. (Thrifts & mortgage finance) | | | 275,829 | | | | 7,524 | |
| | Indian Energy Exchange Ltd. (Capital markets) | | | 321,861 | | | | 646 | |
| | Info Edge India, Ltd. (Interactive Media & Services) | | | 16,298 | | | | 782 | |
| | Infosys, Ltd. (IT services) | | | 304,489 | | | | 5,627 | |
| | JK Cement, Ltd. (Construction materials) | | | 25,850 | | | | 688 | |
| | Jubilant Foodworks, Ltd. (Hotels, restaurants & leisure) | | | 124,927 | | | | 811 | |
| | Kajaria Ceramics, Ltd. (Building products) | | | 89,677 | | | | 1,074 | |
| | KEI Industries, Ltd. (Electrical equipment) | | | 155,753 | | | | 2,269 | |
See accompanying Notes to Financial Statements.
| June 30, 2022 | William Blair Funds | 67 |
Emerging Markets Growth Fund
Portfolio of Investments, June 30, 2022 (all dollar amounts in thousands) (unaudited)
| | | | | | | | |
| | | | | | | | |
| | Issuer | | Shares | | | Value | |
| | | | | | | | | | |
| | Common Stocks—(continued) | | | | | | | | |
| | | | | | | | | | |
| | Emerging Asia—(continued) | | | | | | | | |
| | India—(continued) | | | | | | | | |
| | Minda Industries, Ltd. (Auto components) | | | 191,524 | | | $ | 2,241 | |
| | Nestle India, Ltd. (Food products) | | | 9,008 | | | | 1,974 | |
| | Pidilite Industries, Ltd. (Chemicals) | | | 60,503 | | | | 1,600 | |
| | Polycab India, Ltd. (Electrical equipment) | | | 38,619 | | | | 1,079 | |
| | Reliance Industries, Ltd. (Oil, gas & consumable fuels) | | | 1,112,663 | | | | 36,477 | |
| | SRF, Ltd. (Chemicals) | | | 194,032 | | | | 5,523 | |
| | Sun Pharmaceutical Industries, Ltd. (Pharmaceuticals) | | | 244,639 | | | | 2,574 | |
| | Tata Consultancy Services, Ltd. (IT services) | | | 174,515 | | | | 7,214 | |
| | Tata Consumer Products, Ltd. (Food products) | | | 243,645 | | | | 2,174 | |
| | Tata Elxsi, Ltd. (Software) | | | 35,489 | | | | 3,640 | |
| | Trent, Ltd. (Multiline retail) | | | 166,863 | | | | 2,296 | |
| | UPL, Ltd. (Chemicals) | | | 531,989 | | | | 4,268 | |
| | Varun Beverages, Ltd. (Beverages) | | | 390,203 | | | | 3,903 | |
| | Voltas, Ltd. (Construction & engineering) | | | 151,903 | | | | 1,867 | |
| | | | | | | | | 140,208 | |
| | Indonesia—5.7% | | | | | | | | |
| | Bank Central Asia Tbk PT (Banks) | | | 40,520,095 | | | | 19,720 | |
| | Bank Rakyat Indonesia Persero Tbk PT (Banks) | | | 50,617,051 | | | | 14,100 | |
| | PT Astra International Tbk (Automobiles) | | | 9,781,600 | | | | 4,350 | |
| | PT United Tractors Tbk (Oil, gas & consumable fuels) | | | 1,711,100 | | | | 3,262 | |
| | | | | | | | | 41,432 | |
| | Philippines—0.9% | | | | | | | | |
| | BDO Unibank, Inc. (Banks) | | | 1,717,780 | | | | 3,452 | |
| | International Container Terminal Services, Inc. (Transportation infrastructure) | | | 1,045,980 | | | | 3,500 | |
| | | | | | | | | 6,952 | |
| | South Korea—5.0% | | | | | | | | |
| | Chunbo Co., Ltd. (Chemicals) | | | 1,882 | | | | 302 | |
| | JYP Entertainment Corporation (Entertainment) | | | 72,836 | | | | 2,707 | |
| | Kakao Corporation (Interactive Media & Services) | | | 34,840 | | | | 1,876 | |
| | LEENO Industrial, Inc. (Semiconductors & semiconductor equipment) | | | 16,247 | | | | 1,627 | |
| | NAVER Corporation (Interactive Media & Services) | | | 9,990 | | | | 1,846 | |
| * | Samsung Biologics Co., Ltd. (Life sciences tools & services) | | | 6,929 | | | | 4,216 | |
| | Samsung Electronics Co., Ltd. (Technology hardware, storage & peripherals) | | | 488,705 | | | | 21,454 | |
| | Samsung SDI Co., Ltd. (Electronic equipment, instruments & components) | | | 5,097 | | | | 2,088 | |
| | | | | | | | | 36,116 | |
| | | | | | | | |
| | | | | | | | |
| | Issuer | | Shares | | | Value | |
| | | | | | | | | | |
| | Common Stocks—(continued) | | | | | | | | |
| | | | | | | | | | |
| | Emerging Asia—(continued) | | | | | | | | |
| | Taiwan—17.0% | | | | | | | | |
| | Accton Technology Corporation (Communications equipment) | | | 122,000 | | | $ | 979 | |
| | Advantech Co., Ltd. (Technology hardware, storage & peripherals) | | | 330,766 | | | | 3,849 | |
| | Airtac International Group (Machinery) | | | 157,852 | | | | 5,261 | |
| | ASMedia Technology, Inc. (Semiconductors & semiconductor equipment) | | | 41,000 | | | | 1,537 | |
| | ASPEED Technology, Inc. (Semiconductors & semiconductor equipment) | | | 36,300 | | | | 2,320 | |
| | Chailease Holding Co., Ltd. (Diversified financial services) | | | 1,567,190 | | | | 10,990 | |
| | Chroma ATE, Inc. (Electronic equipment, instruments & components) | | | 371,000 | | | | 1,909 | |
| | E Ink Holdings, Inc. (Electronic equipment, instruments & components) | | | 321,000 | | | | 2,035 | |
| | E.Sun Financial Holding Co., Ltd. (Banks) | | | 12,342,646 | | | | 12,038 | |
| | Elite Material Co., Ltd. (Electronic equipment, instruments & components) | | | 271,000 | | | | 1,627 | |
| | eMemory Technology, Inc. (Semiconductors & semiconductor equipment) | | | 46,000 | | | | 1,601 | |
| | Feng TAY Enterprise Co., Ltd. (Textiles, apparel & luxury goods) | | | 409,000 | | | | 2,414 | |
| | Lotes Co., Ltd. (Electronic equipment, instruments & components) | | | 112,459 | | | | 2,527 | |
| | MediaTek, Inc. (Semiconductors & semiconductor equipment) | | | 233,000 | | | | 5,101 | |
| | Parade Technologies, Ltd. (Semiconductors & semiconductor equipment) | | | 62,000 | | | | 2,398 | |
| | Realtek Semiconductor Corporation (Semiconductors & semiconductor equipment) | | | 88,000 | | | | 1,074 | |
| | Sinbon Electronics Co., Ltd. (Electronic equipment, instruments & components) | | | 370,000 | | | | 3,161 | |
| | Taiwan Semiconductor Manufacturing Co., Ltd.—ADR (Semiconductors & semiconductor equipment) | | | 509,241 | | | | 41,630 | |
| | Taiwan Semiconductor Manufacturing Co., Ltd. (Semiconductors & semiconductor equipment) | | | 884,000 | | | | 14,152 | |
| | Voltronic Power Technology Corporation (Electrical equipment) | | | 100,586 | | | | 4,888 | |
| | Wiwynn Corporation (Technology hardware, storage & peripherals) | | | 68,000 | | | | 1,594 | |
| | | | | | | | | 123,085 | |
| | Thailand—2.3% | | | | | | | | |
| | Bangkok Dusit Medical Services PCL Class “F” (Health care providers & services) | | | 6,409,400 | | | | 4,532 | |
| | Bumrungrad Hospital PCL (Health care providers & services) | | | 534,100 | | | | 2,704 | |
| | Com7 PCL Class “F” (Specialty retail) | | | 1,568,900 | | | | 1,331 | |
| | Kasikornbank PCL (Banks) | | | 1,851,600 | | | | 7,882 | |
| | | | | | | | | 16,449 | |
See accompanying Notes to Financial Statements.
| 68 | Semiannual Report | June 30, 2022 |
Emerging Markets Growth Fund
Portfolio of Investments, June 30, 2022 (all dollar amounts in thousands) (unaudited)
| | | | | | | | |
| | | | | | | | |
| | Issuer | | Shares | | | Value | |
| | | | | | | | | | |
| | Common Stocks—(continued) | | | | | | | | |
| | | | | | | | | | |
| | Emerging Asia—(continued) | | | | | | | | |
| | Vietnam—0.2% | | | | | | | | |
| | Hoa Phat Group JSC (Metals & mining) | | | 1,372,541 | | | $ | 1,316 | |
| | | | | | | | | | |
| | Emerging Latin America—10.2% | | | | | | | | |
| | Argentina—1.4% | | | | | | | | |
| * | Globant S.A. (IT services)† | | | 31,662 | | | | 5,509 | |
| * | MercadoLibre, Inc. (Internet & direct marketing retail) | | | 7,114 | | | | 4,531 | |
| | | | | | | | | 10,040 | |
| | Brazil—4.7% | | | | | | | | |
| | B3 S.A. - Brasil Bolsa Balcao (Capital markets) | | | 1,332,200 | | | | 2,790 | |
| | Itau Unibanco Holding S.A.—ADR (Banks) | | | 3,070,003 | | | | 13,140 | |
| | Localiza Rent a Car S.A. (Road & rail) | | | 370,000 | | | | 3,705 | |
| | Patria Investments, Ltd. Class “A” (Capital markets)† | | | 172,473 | | | | 2,280 | |
| | Raia Drogasil S.A. (Food & staples retailing) | | | 871,400 | | | | 3,197 | |
| | TOTVS S.A. (Software) | | | 770,900 | | | | 3,426 | |
| | Vinci Partners Investments, Ltd. Class “A” (Capital markets)† | | | 195,411 | | | | 2,091 | |
| | WEG S.A. (Electrical equipment) | | | 717,741 | | | | 3,627 | |
| | | | | | | | | 34,256 | |
| | Chile—0.2% | | | | | | | | |
| | Sociedad Quimica y Minera de Chile S.A.—ADR (Chemicals) | | | 18,802 | | | | 1,571 | |
| | Mexico—2.2% | | | | | | | | |
| | Wal-Mart de Mexico S.A.B. de C.V. (Food & staples retailing) | | | 4,500,400 | | | | 15,487 | |
| | Peru—1.3% | | | | | | | | |
| | Credicorp, Ltd. (Banks)† | | | 79,980 | | | | 9,590 | |
| | Uruguay—0.4% | | | | | | | | |
| * | Dlocal, Ltd. (IT services)† | | | 116,452 | | | | 3,057 | |
| | | | | | | | | | |
| | Emerging Europe, Mid-East, Africa—8.6% | | | |
| | Kenya—0.1% | | | | | | | | |
| | Safaricom plc (Wireless telecommunication services) | | | 3,332,094 | | | | 704 | |
| | Poland—0.4% | | | | | | | | |
| * | Dino Polska S.A. (Food & staples retailing) | | | 41,523 | | | | 2,956 | |
| | Qatar—1.9% | | | | | | | | |
| | Qatar Islamic Bank S.A.Q. (Banks) | | | 690,485 | | | | 4,218 | |
| | Qatar National Bank QPSC (Banks) | | | 1,722,418 | | | | 9,450 | |
| | | | | | | | | 13,668 | |
| | Saudi Arabia—0.4% | | | | | | | | |
| | Dr Sulaiman Al Habib Medical Services Group Co. (Health care providers & services) | | | 46,927 | | | | 2,424 | |
| | Issuer | | Shares or
Principal
Amount | | | Value | |
| | | | | | | | | | |
| | Common Stocks—(continued) | | | | | | | | |
| | | | | | | | | | |
| | Emerging Europe, Mid-East, Africa—(continued) | |
| | South Africa—4.4% | | | | | | | | |
| | Capitec Bank Holdings, Ltd. (Banks) | | | 138,709 | | | $ | 16,900 | |
| | Clicks Group, Ltd. (Food & staples retailing) | | | 301,246 | | | | 5,061 | |
| | Shoprite Holdings, Ltd. (Food & staples retailing) | | | 407,968 | | | | 4,962 | |
| | The Bidvest Group, Ltd. (Industrial conglomerates) | | | 404,155 | | | | 5,206 | |
| | | | | | | | | 32,129 | |
| | United Arab Emirates—1.4% | | | | | | | | |
| | First Abu Dhabi Bank PJSC (Banks) | | | 1,988,775 | | | | 10,168 | |
| | Total Common Stocks—94.2%
(cost $671,409) | | | | | | | 682,892 | |
| | | | | | | | | | |
| | Repurchase Agreement | | | | | | | | |
| | Fixed Income Clearing Corporation, 0.240% dated 6/30/22, due 7/1/22, repurchase price $14,469, collateralized by U.S. Treasury Note, 1.625%, due 05/15/31, valued at $14,758 | | $ | 14,469 | | | | 14,469 | |
| | Total Repurchase Agreement—2.0%
(cost $14,469) | | | | | | | 14,469 | |
| | Total Investments—96.2%
(cost $685,878) | | | | | | | 697,361 | |
| | Cash and other assets, less liabilities—3.8% | | | | | | | 27,896 | |
| | Net assets—100.0% | | | | | | $ | 725,257 | |
ADR = American Depository Receipt
* = Non-income producing security
† = U.S. listed foreign security
See accompanying Notes to Financial Statements.
| June 30, 2022 | William Blair Funds | 69 |
Emerging Markets Growth Fund
Portfolio of Investments, June 30, 2022 (unaudited)
At June 30, 2022, the Fund’s Portfolio of Investments includes the following industry categories (as a percentage of long-term investments):
| Financials | | | 28.7 | % |
| Information Technology | | | 22.5 | % |
| Consumer Discretionary | | | 10.7 | % |
| Consumer Staples | | | 10.7 | % |
| Industrials | | | 8.3 | % |
| Energy | | | 5.8 | % |
| Communication Services | | | 5.7 | % |
| Health Care | | | 3.5 | % |
| Materials | | | 3.5 | % |
| Utilities | | | 0.4 | % |
| Real Estate | | | 0.2 | % |
| Total | | | 100.0 | % |
At June 30, 2022, the Fund’s Portfolio of Investments includes the following currency categories (as a percentage of long-term investments):
| Indian Rupee | | | 20.5 | % |
| Chinese Yuan Renminbi | | | 13.9 | % |
| New Taiwan Dollar | | | 12.3 | % |
| Hong Kong Dollar | | | 12.3 | % |
| U.S. Dollar | | | 12.2 | % |
| Indonesian Rupiah | | | 6.1 | % |
| South Korean Won | | | 5.3 | % |
| South African Rand | | | 5.1 | % |
| Brazilian Real | | | 2.4 | % |
| Thai Baht | | | 2.4 | % |
| Mexican Peso | | | 2.3 | % |
| Qatari Rial | | | 2.0 | % |
| UAE Dirham | | | 1.5 | % |
| Philippine Peso | | | 1.0 | % |
| All Other Currencies | | | 0.7 | % |
| Total | | | 100.0 | % |
See accompanying Notes to Financial Statements.
| 70 | Semiannual Report | June 30, 2022 |
| | Emerging Markets Small Cap Growth Fund |
| | |
| | The Emerging Markets Small Cap Growth Fund seeks long-term capital appreciation. |
| | |
| | AN OVERVIEW FROM THE PORTFOLIO MANAGERS |
| | |

Todd M. McClone, CFA 
Casey K. Preyss, CFA 
D.J. Neiman, CFA | The William Blair Emerging Markets Small Cap Growth Fund (Class N shares) (the “Fund”) posted a 27.08% decrease, net of fees, for the six months ended June 30, 2022. By comparison, the Fund’s benchmark index, the MSCI Emerging Markets Small Cap Index (net) (the “Index”), decreased 20.03%. Six-month underperformance versus the Index was driven by a negative stock selection effect within Consumer Discretionary, Materials, Industrials, and Information Technology. Within Consumer Discretionary, F&F New and Momo.com were the most notable detractors. F&F New is a Korean fashion brand with a strong and diverse brand portfolio including Major League Baseball and Discovery and a strong presence in China. Weaker sales amid COVID lockdowns and deteriorated consumer sentiment drove the share price underperformance. Momo.com is a Taiwanese e-commerce services company offering TV shopping and internet shopping services. A key beneficiary of COVID lockdowns, e-commerce growth in Taiwan has decelerated from 35% year-over-year to 17% year-over-year amid the country’s post-lockdown reopening. We believe that increased spending will be needed to secure growth, negatively impacting margins. Hansol Chemical hampered relative results in the Materials sector. The company supplies a mix of components and consumables to large tech hardware customers. The company delivered weaker-than-expected results against cost pressure from higher oil and liquid natural gas prices, the fall in NB-latex price, and overall weaker end-market demand. Within Industrials, HeadHunter, a Russian online job recruitment platform, fell along with Russian equities on the back of the country’s invasion of Ukraine. Information Technology was dragged down by ASPEED Technology and Parade Technologies. Both semiconductor companies’ stock declines were primarily driven by the decelerating semiconductor cycle and softer demand outlook. Partially offsetting these negative effects was the positive stock selection effect within Consumer Staples coupled with the overweighting allocation to Consumer Staples and underweighting allocation to Health Care. Within the Consumer Staples sector, Varun Beverages, Proya Cosmetics, and Yunnan Botanee Bio-tech were the most notable contributors to relative performance amid the strong stock performance in the second quarter. Please refer to the Global Markets Review and Outlook relating to the Fund beginning on page 32. |
| June 30, 2022 | William Blair Funds | 71 |
Emerging Markets Small Cap Growth Fund
Performance Highlights (Unaudited)
| Average Annual Total Returns through 6/30/2022 |
| | | Year to
Date | | 1 Year | | 3 Year | | 5 Year | | 10 Year | | Since
Inception(a) |
| Class N | | | (27.08 | )% | | | (26.00 | )% | | | 7.10 | % | | | 3.71 | % | | | 7.10 | % | | | — | % |
| Class I | | | (26.99 | ) | | | (25.83 | ) | | | 7.36 | | | | 3.97 | | | | 7.39 | | | | — | |
| Class R6 | | | (26.97 | ) | | | (25.78 | ) | | | 7.42 | | | | 4.04 | | | | — | | | | 6.21 | |
| MSCI Emerging Markets Small Cap Index (net) | | | (20.03 | ) | | | (20.72 | ) | | | 5.78 | | | | 3.48 | | | | 4.31 | | | | 3.26 | |
| (a) | Since inception is for the period from December 20, 2012 (Commencement of Operations) to June 30, 2022. |
Performance cited represents past performance. Past performance does not guarantee future results and current performance may be lower or higher than the data quoted. Results shown are average annual total returns, which assume reinvestment of dividends and capital gains. Investment returns and principal will fluctuate and you may have a gain or loss when you sell shares. For the most current month-end performance information, please call 1-800-742-7272, or visit our Web site at www.williamblairfunds.com. From time to time, the investment adviser may waive fees or reimburse expenses for the Fund. Without these waivers/reimbursements, performance would be lower. International investing involves special risk considerations, including currency fluctuations, lower liquidity, economic and political risk. These risks may be magnified when investing in emerging markets. Smaller capitalization stocks are also more sensitive to purchase/sale transactions and changes in the issuer’s financial condition. Class N shares are not subject to a sales load. Class I shares are not subject to a sales load or distribution (Rule 12b-1) fees. Class R6 shares are not subject to a sales load, distribution (Rule 12b-1) fees, or sub-transfer agent fees.
The performance highlights and graph presented above do not reflect the deduction of taxes that a shareholder would pay on fund distributions or the redemption of fund shares.
The Morgan Stanley Capital International (MSCI) Emerging Markets Small Cap Index (net) is a free float-adjusted market capitalization index that is designed to measure the equity market performance of emerging markets. This index approximates the minimum possible dividend reinvestment by deducting for the highest possible withholding tax rates of those markets.
This report identifies the Fund’s investments on June 30, 2022. These holdings are subject to change. Not all stocks in the Fund performed the same, nor is there any guarantee that these stocks will perform as well in the future. Market forecasts provided in this report may not necessarily come to pass.
Sector Diversification (Unaudited)
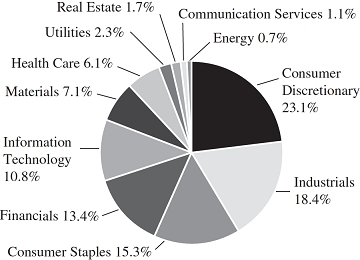
The sector diversification shown is based on the total long-term securities.
| 72 | Semiannual Report | June 30, 2022 |
Emerging Markets Small Cap Growth Fund
Portfolio of Investments, June 30, 2022 (all dollar amounts in thousands) (unaudited)
| | | | | | | | |
| | | | | | | | |
| | Issuer | | Shares | | | Value | |
| | | | | | | | | | |
| | Common Stocks | | | | | | | | |
| | | | | | | | | | |
| | Emerging Asia—70.6% | | | | | | | | |
| | Cambodia—0.5% | | | | | | | | |
| * | NagaCorp, Ltd. (Hotels, restaurants & leisure) | | | 2,068,000 | | | $ | 1,692 | |
| | China—20.3% | | | | | | | | |
| | By-health Co., Ltd. Class “A” (Personal products) | | | 840,776 | | | | 2,719 | |
| | Centre Testing International Group Co., Ltd. Class “A” (Professional services) | | | 1,125,305 | | | | 3,902 | |
| | Chacha Food Co., Ltd. Class “A” (Food products) | | | 709,871 | | | | 6,037 | |
| | China Meidong Auto Holdings, Ltd. (Specialty retail) | | | 1,150,000 | | | | 3,620 | |
| | CIFI Ever Sunshine Services Group, Ltd. (Real estate management & development) | | | 2,238,000 | | | | 2,852 | |
| | Ecovacs Robotics Co., Ltd. Class “A” (Household durables) | | | 162,000 | | | | 2,950 | |
| | Estun Automation Co., Ltd. Class “A” (Machinery) | | | 405,000 | | | | 1,482 | |
| | Huaneng Lancang River Hydropower, Inc. Class “A” (Independent power & renewable electricity producers) | | | 2,816,700 | | | | 2,941 | |
| | Jiumaojiu International Holdings, Ltd. (Hotels, restaurants & leisure) | | | 2,679,000 | | | | 7,118 | |
| | Longshine Technology Group Co., Ltd. Class “A” (Software) | | | 725,400 | | | | 2,730 | |
| | Proya Cosmetics Co., Ltd. Class “A” (Personal products) | | | 494,349 | | | | 12,198 | |
| | Suzhou Maxwell Technologies Co., Ltd. Class “A” (Electrical equipment) | | | 119,923 | | | | 8,794 | |
| | Yunnan Botanee Bio-Technology Group Co., Ltd. Class “A” (Personal products) | | | 236,700 | | | | 7,691 | |
| | Zhongsheng Group Holdings, Ltd. (Specialty retail) | | | 468,500 | | | | 3,305 | |
| | | | | | | | | 68,339 | |
| | India—28.0% | | | | | | | | |
| | Aarti Industries, Ltd. (Chemicals) | | | 60,428 | | | | 533 | |
| * | Aavas Financiers, Ltd. (Thrifts & mortgage finance) | | | 101,578 | | | | 2,614 | |
| * | Affle India, Ltd. (Media) | | | 193,791 | | | | 2,613 | |
| * | Amber Enterprises India, Ltd. (Household durables) | | | 44,384 | | | | 1,258 | |
| * | APL Apollo Tubes, Ltd. (Metals & mining) | | | 237,719 | | | | 2,550 | |
| | Apollo Hospitals Enterprise, Ltd. (Health care providers & services) | | | 28,305 | | | | 1,315 | |
| | Astral Poly Technik, Ltd. (Building products) | | | 119,535 | | | | 2,500 | |
| | Atul, Ltd. (Chemicals) | | | 14,213 | | | | 1,440 | |
| * | AU Small Finance Bank Ltd. (Banks) | | | 814,914 | | | | 6,099 | |
| | Balkrishna Industries, Ltd. (Auto components) | | | 22,071 | | | | 603 | |
| | Bata India, Ltd. (Textiles, apparel & luxury goods) | | | 58,546 | | | | 1,233 | |
| | | | | | | | |
| | | | | | | | |
| | Issuer | | Shares | | | Value | |
| | | | | | | | | | |
| | Common Stocks—(continued) | | | | | | | | |
| | | | | | | | | | |
| | Emerging Asia—(continued) | | | | | | | | |
| | India—(continued) | | | | | | | | |
| | Carborundum Universal, Ltd. (Chemicals) | | | 218,443 | | | $ | 1,977 | |
| | Central Depository Services India, Ltd. (Capital markets) | | | 124,234 | | | | 1,751 | |
| | Century Plyboards India, Ltd. (Paper & forest products) | | | 264,281 | | | | 1,758 | |
| | Cholamandalam Investment and Finance Co., Ltd. (Consumer finance) | | | 534,858 | | | | 4,203 | |
| * | Clean Science & Technology, Ltd. (Chemicals) | | | 70,747 | | | | 1,339 | |
| | Computer Age Management Services, Ltd. (IT services) | | | 44,510 | | | | 1,273 | |
| | Dixon Technologies India, Ltd. (Household durables) | | | 45,239 | | | | 2,041 | |
| | Fine Organic Industries, Ltd. (Chemicals) | | | 39,174 | | | | 2,374 | |
| * | Godrej Properties, Ltd. (Real estate management & development) | | | 50,921 | | | | 761 | |
| | Havells India, Ltd. (Electrical equipment) | | | 24,740 | | | | 342 | |
| | KEI Industries, Ltd. (Electrical equipment) | | | 353,447 | | | | 5,148 | |
| | Laurus Labs, Ltd. (Pharmaceuticals) | | | 129,484 | | | | 762 | |
| * | Max Healthcare Institute, Ltd. (Health care providers & services) | | | 376,571 | | | | 1,748 | |
| | Minda Industries, Ltd. (Auto components) | | | 131,184 | | | | 1,535 | |
| | Navin Fluorine International, Ltd. (Chemicals) | | | 24,544 | | | | 1,138 | |
| * | Oberoi Realty, Ltd. (Real estate management & development) | | | 228,910 | | | | 2,116 | |
| | PI Industries, Ltd. (Chemicals) | | | 13,256 | | | | 427 | |
| | Pidilite Industries, Ltd. (Chemicals) | | | 23,138 | | | | 612 | |
| | Polycab India, Ltd. (Electrical equipment) | | | 112,009 | | | | 3,130 | |
| | Radico Khaitan, Ltd. (Beverages) | | | 142,402 | | | | 1,572 | |
| | Relaxo Footwears, Ltd. (Textiles, apparel & luxury goods) | | | 70,682 | | | | 866 | |
| | SRF, Ltd. (Chemicals) | | | 180,811 | | | | 5,147 | |
| | Sundram Fasteners, Ltd. (Auto components) | | | 74,156 | | | | 675 | |
| | Trent, Ltd. (Multiline retail) | | | 471,387 | | | | 6,486 | |
| | Tube Investments of India, Ltd. (Auto components) | | | 165,697 | | | | 3,881 | |
| * | V-Mart Retail, Ltd. (Multiline retail) | | | 30,357 | | | | 957 | |
| | Varun Beverages, Ltd. (Beverages) | | | 1,198,275 | | | | 11,987 | |
| | Vinati Organics, Ltd. (Chemicals) | | | 91,621 | | | | 2,291 | |
| | VIP Industries, Ltd. (Textiles, apparel & luxury goods) | | | 397,672 | | | | 3,144 | |
| | | | | | | | | 94,199 | |
| | Indonesia—4.0% | | | | | | | | |
| | PT Bank Negara Indonesia Persero Tbk (Banks) | | | 11,031,900 | | | | 5,813 | |
| | PT Bank Tabungan Pensiunan Nasional Syariah Tbk (Banks) | | | 27,331,100 | | | | 5,174 | |
| | PT United Tractors Tbk (Oil, gas & consumable fuels) | | | 1,251,100 | | | | 2,385 | |
| | | | | | | | | 13,372 | |
See accompanying Notes to Financial Statements.
| June 30, 2022 | William Blair Funds | 73 |
Emerging Markets Small Cap Growth Fund
Portfolio of Investments, June 30, 2022 (all dollar amounts in thousands) (unaudited)
| | | | | | | | |
| | | | | | | | |
| | Issuer | | Shares | | | Value | |
| | | | | | | | | | |
| | Common Stocks—(continued) | | | | | | | | |
| | | | | | | | | | |
| | Emerging Asia—(continued) | | | | | | | | |
| | Malaysia—0.9% | | | | | | | | |
| | MR DIY Group M Bhd (Specialty retail) | | | 4,973,400 | | | $ | 2,336 | |
| | UWC BHD (Machinery) | | | 1,150,200 | | | | 858 | |
| | | | | | | | | 3,194 | |
| | Philippines—3.6% | | | | | | | | |
| | International Container Terminal Services, Inc. (Transportation infrastructure) | | | 1,979,350 | | | | 6,624 | |
| * | TDCX, Inc.—ADR (IT services) | | | 123,354 | | | | 1,141 | |
| | Wilcon Depot, Inc. (Specialty retail) | | | 9,752,700 | | | | 4,221 | |
| | | | | | | | | 11,986 | |
| | South Korea—2.3% | | | | | | | | |
| | Chunbo Co., Ltd. (Chemicals) | | | 11,646 | | | | 1,866 | |
| | F&F Co., Ltd. (Textiles, apparel & luxury goods) | | | 37,649 | | | | 3,900 | |
| | LEENO Industrial, Inc. (Semiconductors & semiconductor equipment) | | | 19,723 | | | | 1,975 | |
| | NICE Information Service Co., Ltd. (Professional services) | | | 11,787 | | | | 131 | |
| | | | | | | | | 7,872 | |
| | Taiwan—7.2% | | | | | | | | |
| | Airtac International Group (Machinery) | | | 131,158 | | | | 4,371 | |
| | ASMedia Technology, Inc. (Semiconductors & semiconductor equipment) | | | 12,000 | | | | 450 | |
| | ASPEED Technology, Inc. (Semiconductors & semiconductor equipment) | | | 20,900 | | | | 1,336 | |
| | Elite Material Co., Ltd. (Electronic equipment, instruments & components) | | | 96,000 | | | | 576 | |
| | eMemory Technology, Inc. (Semiconductors & semiconductor equipment) | | | 8,000 | | | | 279 | |
| | Lotes Co., Ltd. (Electronic equipment, instruments & components) | | | 265,831 | | | | 5,972 | |
| | Parade Technologies, Ltd. (Semiconductors & semiconductor equipment) | | | 34,000 | | | | 1,315 | |
| | Sinbon Electronics Co., Ltd. (Electronic equipment, instruments & components) | | | 680,000 | | | | 5,809 | |
| | Voltronic Power Technology Corporation (Electrical equipment) | | | 88,507 | | | | 4,301 | |
| | | | | | | | | 24,409 | |
| | Thailand—3.8% | | | | | | | | |
| | Bumrungrad Hospital PCL (Health care providers & services) | | | 1,479,900 | | | | 7,493 | |
| | Carabao Group PCL Class “F” (Beverages) | | | 108,500 | | | | 327 | |
| | Com7 PCL Class “F” (Specialty retail) | | | 5,671,100 | | | | 4,812 | |
| | Muangthai Capital PCL (Consumer finance) | | | 269,200 | | | | 325 | |
| | | | | | | | | 12,957 | |
| | Vietnam—0.0% | | | | | | | | |
| | Hoa Phat Group JSC (Metals & mining) | | | 26 | | | | — | (a) |
| | | | | | | | |
| | | | | | | | |
| | Issuer | | Shares | | | Value | |
| | | | | | | | | | |
| | Common Stocks—(continued) | | | | | | | | |
| | | | | | | | | | |
| | Emerging Latin America—15.2% | | | | | | | | |
| | Brazil—8.4% | | | | | | | | |
| | Arezzo Industria e Comercio S.A. (Textiles, apparel & luxury goods) | | | 440,100 | | | $ | 5,849 | |
| * | Azul S.A.—ADR (Airlines) | | | 75,858 | | | | 539 | |
| * | CI&T, Inc. Class “A” (IT services)† | | | 61,250 | | | | 618 | |
| | Cyrela Brazil Realty S.A. Empreendimentos e Participacoes (Household durables) | | | 1,090,300 | | | | 2,463 | |
| | Grupo SBF S.A. (Specialty retail) | | | 1,070,600 | | | | 3,872 | |
| * | Infracommerce CXAAS S.A. (IT services) | | | 811,200 | | | | 694 | |
| * | Locaweb Servicos de Internet S.A. (IT services) | | | 1,549,578 | | | | 1,664 | |
| | Lojas Quero Quero S (Specialty retail) | | | 1,092,100 | | | | 1,189 | |
| | Pet Center Comercio e Participacoes S.A. (Specialty retail) | | | 1,858,406 | | | | 3,526 | |
| * | Sequoia Logistica e Transportes S.A. (Air freight & logistics) | | | 1,114,500 | | | | 1,165 | |
| | TOTVS S.A. (Software) | | | 1,478,200 | | | | 6,570 | |
| | | | | | | | | 28,149 | |
| | Mexico—5.9% | | | | | | | | |
| | Banco del Bajio S.A. (Banks) | | | 2,225,800 | | | | 4,479 | |
| | Grupo Aeroportuario del Centro Norte S.A.B. de C.V. (Transportation infrastructure) | | | 820,199 | | | | 5,240 | |
| | Grupo Aeroportuario del Sureste S.A.B. de C.V. Class “B” (Transportation infrastructure) | | | 437,355 | | | | 8,621 | |
| | Regional S.A.B. de C.V. (Banks) | | | 324,100 | | | | 1,539 | |
| | | | | | | | | 19,879 | |
| | Uruguay—0.9% | | | | | | | | |
| * | Dlocal, Ltd. (IT services)† | | | 116,849 | | | | 3,067 | |
| | | | | | | | | | |
| | Emerging Europe, Mid-East, Africa—12.1% | |
| | Greece—1.4% | |
| | Terna Energy S.A. (Independent power & renewable electricity producers) | | | 264,752 | | | | 4,761 | |
| | Kazakhstan—0.6% | | | | | | | | |
| | Kaspi.KZ JSC—GDR (Consumer finance) | | | 40,954 | | | | 1,864 | |
| | Lithuania—0.3% | | | | | | | | |
| * | Baltic Classifieds Group plc (Interactive Media & Services) | | | 699,798 | | | | 1,111 | |
| | Poland—2.5% | | | | | | | | |
| * | Dino Polska S.A. (Food & staples retailing) | | | 98,256 | | | | 6,994 | |
| | ING Bank Slaski S.A. (Banks) | | | 33,921 | | | | 1,290 | |
| | | | | | | | | 8,284 | |
| | Romania—0.9% | | | | | | | | |
| | Banca Transilvania S.A. (Banks) | | | 6,542,961 | | | | 3,092 | |
See accompanying Notes to Financial Statements.
| 74 | Semiannual Report | June 30, 2022 |
Emerging Markets Small Cap Growth Fund
Portfolio of Investments, June 30, 2022 (all dollar amounts in thousands) (unaudited)
| | Issuer | | Shares or
Principal
Amount | | | Value | |
| | | | | | | | | | |
| | Common Stocks—(continued) | | | | | | | | |
| | | | | | | | | | |
| | Emerging Europe, Mid-East, Africa—(continued) | |
| | Saudi Arabia—2.6% | | | | | | | | |
| | Dr Sulaiman Al Habib Medical Services Group Co. (Health care providers & services) | | | 105,509 | | | $ | 5,450 | |
| | Mouwasat Medical Services Co. (Health care providers & services) | | | 58,706 | | | | 3,332 | |
| | | | | | | | | 8,782 | |
| | South Africa—3.1% | | | | | | | | |
| | Clicks Group, Ltd. (Food & staples retailing) | | | 62,820 | | | | 1,055 | |
| | The Bidvest Group, Ltd. (Industrial conglomerates) | | | 271,585 | | | | 3,499 | |
| | Transaction Capital, Ltd. (Consumer finance) | | | 2,616,412 | | | | 5,904 | |
| | | | | | | | | 10,458 | |
| | United Arab Emirates—0.7% | | | | | | | | |
| | Abu Dhabi National Oil Co. for Distribution PJSC (Specialty retail) | | | 2,089,223 | | | | 2,400 | |
| | Total Common Stocks—97.9%
(cost $362,227) | | | | | | | 329,867 | |
| | | | | | | | | | |
| | Repurchase Agreement | | | | | | | | |
| | Fixed Income Clearing Corporation, 0.240% dated 6/30/22, due 7/1/22, repurchase price $2,701, collateralized by U.S. Treasury Note, 1.625%, due 05/15/31, valued at $2,755 | | $ | 2,701 | | | | 2,701 | |
| | Total Repurchase Agreement—0.8%
(cost $2,701) | | | | | | | 2,701 | |
| | Total Investments—98.7%
(cost $364,928) | | | | | | | 332,568 | |
| | Cash and other assets, less liabilities—1.3% | | 4,399 | |
| | Net assets—100.0% | | | | | | $ | 336,967 | |
ADR = American Depository Receipt
GDR = Global Depository Receipt
* = Non-income producing security
(a) Amount is less than the minimum amount disclosed.
† = U.S. listed foreign security
At June 30, 2022, the Fund’s Portfolio of Investments includes the following industry categories (as a percentage of long-term investments):
| Consumer Discretionary | | | 23.1 | % |
| Industrials | | | 18.4 | % |
| Consumer Staples | | | 15.3 | % |
| Financials | | | 13.4 | % |
| Information Technology | | | 10.8 | % |
| Materials | | | 7.1 | % |
| Health Care | | | 6.1 | % |
| Utilities | | | 2.3 | % |
| Real Estate | | | 1.7 | % |
| Communication Services | | | 1.1 | % |
| Energy | | | 0.7 | % |
| Total | | | 100.0 | % |
At June 30, 2022, the Fund’s Portfolio of Investments includes the following currency categories (as a percentage of long-term investments):
| Indian Rupee | | | 28.6 | % |
| Chinese Yuan Renminbi | | | 15.6 | % |
| Brazilian Real | | | 8.2 | % |
| New Taiwan Dollar | | | 7.4 | % |
| Mexican Peso | | | 6.0 | % |
| South African Rand | | | 5.8 | % |
| Hong Kong Dollar | | | 5.6 | % |
| Indonesian Rupiah | | | 4.1 | % |
| Thai Baht | | | 3.9 | % |
| Philippine Peso | | | 3.3 | % |
| Polish Zloty | | | 2.5 | % |
| South Korean Won | | | 2.4 | % |
| U.S. Dollar | | | 2.2 | % |
| Euro | | | 1.4 | % |
| All Other Currencies | | | 3.0 | % |
| Total | | | 100.0 | % |
See accompanying Notes to Financial Statements
| June 30, 2022 | William Blair Funds | 75 |
| | China Growth Fund |
| | |
| | The China Growth Fund seeks long-term capital appreciation. |
| | |
| | AN OVERVIEW FROM THE PORTFOLIO MANAGERS |
| | |

Vivian Lin Thurston, CFA 
Casey K. Preyss, CFA | The William Blair China Growth Fund (Class I shares) (the “Fund”) posted a 18.72% decrease, net of fees, for the six months ended June 30, 2022. By comparison, the Fund’s benchmark index, the MSCI China All Shares Index (net) (the “Index”), decreased 11.77%. Six-month underperformance versus the Index was primarily driven by style headwinds amid strong outperformance of low-valuation stocks. From a sector perspective, the portfolio’s lack of exposure to Energy and overweight to Information Technology were particularly detrimental. Style headwinds also drove negative stock selection across sectors, which was particularly acute in the Information Technology and Industrials sectors. Underperformance within Information Technology was driven by the portfolio’s exposure to technology hardware, particularly semiconductor manufacturers Silergy and Will Semiconductor. Silergy is the market leader in China for analog semiconductors and remains a beneficiary of structural growth in demand from automobile, cloud, and 5G end-markets as well as a localization trend. Will Semiconductor produces image sensors for smartphones, automotive, and other uses. Will Semiconductor is taking market share at the lower end of the technology spectrum as competitors on the leading edge reduce capacity. The stock price for the industry weakened against a deteriorated demand backdrop and rising costs. Underperformance in Industrials was primarily driven by exposure to Contemporary Amperex Technology Ltd. (CATL). CATL manufactures batteries primarily for use in electric vehicles (“EV”), with a small amount used by utility companies and other large power users for stationary power storage. There are significant tailwinds for EV adoption in China and we believe CATL is well positioned to exploit the opportunity given its status as a domestic champion. Performance year-to-date has been pressured by increased costs for the raw materials used in battery production and headwinds for long-duration growth companies trading at high near-term valuations. Partially offsetting those effects was an overweight in Consumer Staples anchored by Kweichow Moutai. Kweichow Moutai is the leader in the Baijiu industry, with the highest brand equity and strongest heritage. In 2022, Kweichow Moutai introduced new products, established the iMoutai e-commerce platform, expanded the distribution channel, and adopted a more proactive marketing strategy. This, combined with recovery in restocking and price increases, drove the share price higher. Please refer to the Global Markets Review and Outlook relating to the Fund beginning on page 32. |
| 76 | Semiannual Report | June 30, 2022 |
China Growth Fund
Performance Highlights (Unaudited)
Average Annual Total Returns through 6/30/2022
| | | Year to
Date | | Since
Inception(a) |
| Class I | | | (18.72 | )% | | | (22.30 | )% |
| Class R6 | | | (18.72 | ) | | | (22.30 | ) |
| MSCI China All Shares Index (net) | | | (11.77 | ) | | | (14.60 | ) |
| | |
| (a) | Since inception is for the period from August 27, 2021 (Commencement of Operations) to June 30, 2022. |
Performance cited represents past performance. Past performance does not guarantee future results and current performance may be lower or higher than the data quoted. Results shown are average annual total returns, which assume reinvestment of dividends and capital gains. Investment returns and principal will fluctuate and you may have a gain or loss when you sell shares. For the most current month-end performance information, please call 1-800-742-7272, or visit our Web site at www.williamblairfunds.com. From time to time, the investment adviser may waive fees or reimburse expenses for the Fund. Without these waivers/reimbursements, performance would be lower. International investing involves special risk considerations, including currency fluctuations, lower liquidity, economic and political risk. These risks may be magnified when investing in emerging markets. Smaller capitalization stocks are also more sensitive to purchase/sale transactions and changes in the issuer’s financial condition. Class I shares are not subject to a sales load or distribution (Rule 12b-1) fees. Class R6 shares are not subject to a sales load, distribution (Rule 12b-1) fees, or sub-transfer agent fees.
The performance highlights and graph presented above do not reflect the deduction of taxes that a shareholder would pay on fund distributions or the redemption of fund shares.
The MSCI China All Shares Index (net) captures large and mid-cap representation across China A-shares, B-shares, H-shares, Red-chips, P-chips, and foreign listings. The index aims to reflect the opportunity set of China share classes listed in Hong Kong, Shanghai, Shenzhen, and outside of China. The Index is unmanaged, does not incur fees or expenses, and cannot be invested in directly.
This report identifies the Fund’s investments on June 30, 2022. These holdings are subject to change. Not all stocks in the Fund performed the same, nor is there any guarantee that these stocks will perform as well in the future. Market forecasts provided in this report may not necessarily come to pass.
Sector Diversification (Unaudited)

The sector diversification shown is based on the total long-term securities.
| June 30, 2022 | William Blair Funds | 77 |
China Growth Fund
Portfolio of Investments, June 30, 2022 (all dollar amounts in thousands) (unaudited)
| | | | | | | | |
| | | | | | | | |
| | Issuer | | Shares | | | Value | |
| | | | | | | | | | |
| | Common Stocks | | | | | | | | |
| | | | | | | | | | |
| | Emerging Asia—95.8% | | | | | | | | |
| | China—94.9% | | | | | | | | |
| | Aier Eye Hospital Group Co., Ltd. Class “A” (Health care providers & services) | | | 13,268 | | | $ | 89 | |
| * | Alibaba Group Holding, Ltd. (Internet & direct marketing retail) | | | 13,600 | | | | 194 | |
| | Bank of Chengdu Co., Ltd. Class “A” (Banks) | | | 13,300 | | | | 33 | |
| | Bank of Ningbo Co., Ltd. Class “A�� (Banks) | | | 18,190 | | | | 97 | |
| | Beijing Kingsoft Office Software, Inc. Class “A” (Software) | | | 1,522 | | | | 45 | |
| | China Meidong Auto Holdings, Ltd. (Specialty retail) | | | 8,000 | | | | 25 | |
| | China Merchants Bank Co., Ltd. Class “H” (Banks) | | | 21,500 | | | | 144 | |
| | China Tourism Group Duty Free Corporation, Ltd. Class “A” (Specialty retail) | | | 5,400 | | | | 188 | |
| | Chongqing Zhifei Biological Products Co., Ltd. Class “A” (Biotechnology) | | | 1,200 | | | | 20 | |
| | Contemporary Amperex Technology Co., Ltd. Class “A” (Electrical equipment) | | | 1,400 | | | | 112 | |
| | East Money Information Co., Ltd. Class “A” (Capital markets) | | | 25,320 | | | | 96 | |
| | Ecovacs Robotics Co., Ltd. Class “A” (Household durables) | | | 2,300 | | | | 42 | |
| | Foshan Haitian Flavouring & Food Co., Ltd. Class “A” (Food products) | | | 11,210 | | | | 151 | |
| | Hangzhou Tigermed Consulting Co., Ltd. Class “A” (Life sciences tools & services) | | | 2,217 | | | | 38 | |
| | Inner Mongolia Yili Industrial Group Co., Ltd. Class “A” (Food products) | | | 10,300 | | | | 60 | |
| | JD.com, Inc. Class “A” (Internet & direct marketing retail) | | | 4,252 | | | | 137 | |
| | Jiangsu Hengli Hydraulic Co., Ltd. Class “A” (Machinery) | | | 4,900 | | | | 45 | |
| | Jiumaojiu International Holdings, Ltd. (Hotels, restaurants & leisure) | | | 14,000 | | | | 37 | |
| | Juewei Food Co., Ltd. Class “A” (Food products) | | | 3,600 | | | | 31 | |
| | Kweichow Moutai Co., Ltd. Class “A” (Beverages) | | | 700 | | | | 214 | |
| | Li Ning Co., Ltd. (Textiles, apparel & luxury goods) | | | 7,000 | | | | 65 | |
| | Maxscend Microelectronics Co., Ltd. Class “A” (Electronic equipment, instruments & components) | | | 1,600 | | | | 32 | |
| * | Meituan Class “B” (Internet & direct marketing retail) | | | 4,100 | | | | 101 | |
| | NAURA Technology Group Co., Ltd. Class “A” (Semiconductors & semiconductor equipment) | | | 1,400 | | | | 58 | |
| | NetEase, Inc. (Entertainment) | | | 5,600 | | | | 103 | |
| | Ovctek China, Inc. Class “A” (Health care equipment & supplies) | | | 5,200 | | | | 44 | |
| | | | | | | | |
| | | | | | | | |
| | Issuer | | Shares | | | Value | |
| | | | | | | | | | |
| | Common Stocks—(continued) | | | | | | | | |
| | | | | | | | | | |
| | Emerging Asia—(continued) | | | | | | | | |
| | China—(continued) | | | | | | | | |
| | Proya Cosmetics Co., Ltd. Class “A” (Personal products) | | | 2,420 | | | $ | 60 | |
| | SG Micro Corporation Class “A” (Semiconductors & semiconductor equipment) | | | 1,950 | | | | 53 | |
| | Shanghai M&G Stationery, Inc. Class “A” (Commercial services & supplies) | | | 3,600 | | | | 30 | |
| | Shenzhen Inovance Technology Co., Ltd. Class “A” (Machinery) | | | 7,100 | | | | 70 | |
| | Shenzhen Mindray Bio-Medical Electronics Co., Ltd. Class “A” (Health care equipment & supplies) | | | 600 | | | | 28 | |
| | Shenzhou International Group Holdings, Ltd. (Textiles, apparel & luxury goods) | | | 2,000 | | | | 24 | |
| | Silergy Corporation (Semiconductors & semiconductor equipment) | | | 1,000 | | | | 81 | |
| | Suzhou Maxwell Technologies Co., Ltd. Class “A” (Electrical equipment) | | | 820 | | | | 60 | |
| | Tencent Holdings, Ltd. (Interactive Media & Services) | | | 6,500 | | | | 294 | |
| * | Topchoice Medical Corporation Class “A” (Health care providers & services) | | | 1,500 | | | | 39 | |
| | Will Semiconductor Co., Ltd. Shanghai Class “A” (Semiconductors & semiconductor equipment) | | | 1,600 | | | | 41 | |
| | Wuliangye Yibin Co., Ltd. Class “A” (Beverages) | | | 3,000 | | | | 91 | |
| | WuXi AppTec Co., Ltd. Class “H” (Life sciences tools & services) | | | 4,100 | | | | 55 | |
| * | Wuxi Biologics Cayman, Inc. (Life sciences tools & services) | | | 5,500 | | | | 50 | |
| | Wuxi Lead Intelligent Equipment Co., Ltd. Class “A” (Machinery) | | | 4,300 | | | | 41 | |
| | Yonyou Network Technology Co., Ltd. Class “A” (Software) | | | 9,800 | | | | 32 | |
| | Yunnan Botanee Bio-Technology Group Co., Ltd. Class “A” (Personal products) | | | 1,400 | | | | 45 | |
| | Yunnan Energy New Material Co., Ltd. Class “A” (Chemicals) | | | 1,600 | | | | 60 | |
| | Zhangzhou Pientzehuang Pharmaceutical Co., Ltd. Class “A” (Pharmaceuticals) | | | 1,500 | | | | 80 | |
| | Zhejiang Jingsheng Mechanical & Electrical Co., Ltd. Class “A” (Semiconductors & semiconductor equipment) | | | 3,800 | | | | 38 | |
| | Zhongsheng Group Holdings, Ltd. (Specialty retail) | | | 6,500 | | | | 46 | |
| | | | | | | | | 3,519 | |
| | Taiwan—0.9% | | | | | | | | |
| * | Airtac International Group (Machinery) | | | 1,000 | | | | 33 | |
See accompanying Notes to Financial Statements.
| 78 | Semiannual Report | June 30, 2022 |
China Growth Fund
Portfolio of Investments, June 30, 2022 (all dollar amounts in thousands) (unaudited)
| | | | | | | |
| | | | | | | |
| Issuer | | Shares | | | Value | |
| | | | | | | | | |
| Common Stocks—(continued) | | | | | | | | |
| | | | | | | | | |
| Asia—3.3% | | | | | | | | |
| Hong Kong—3.3% | | | | | | | | |
| AIA Group, Ltd. (Insurance) | | | 7,800 | | | $ | 85 | |
| Hong Kong Exchanges and Clearing, Ltd. (Capital markets) | | | 800 | | | | 39 | |
| | | | | | | | 124 | |
Total Common Stocks—99.1%
(cost $4,353) | | | | | | | 3,676 | |
Total Investments—99.1%
(cost $4,353) | | | | | | | 3,676 | |
| Cash and other assets, less liabilities—0.9% | | | | | | | 34 | |
| Net assets—100.0% | | | | | | $ | 3,710 | |
* = Non-income producing security
At June 30, 2022, the Fund’s Portfolio of Investments includes the following industry categories (as a percentage of long-term investments):
| Consumer Discretionary | | 23.5% |
| Consumer Staples | | 17.7% |
| Financials | | 13.4% |
| Health Care | | 12.1% |
| Communication Services | | 10.8% |
| Industrials | | 10.6% |
| Information Technology | | 10.3% |
| Materials | | 1.6% |
| Total | | 100.0% |
At June 30, 2022, the Fund’s Portfolio of Investments includes the following currency categories (as a percentage of long-term investments):
| Chinese Yuan Renminbi | | 58.8% |
| Hong Kong Dollar | | 38.1% |
| New Taiwan Dollar | | 3.1% |
| Total | | 100.0% |
See accompanying Notes to Financial Statements.
| June 30, 2022 | William Blair Funds | 79 |
Emerging Markets Debt Market Review and Outlook
Emerging Markets (EM) Debt faced strong headwinds during the first half of the year as the Russia-Ukraine conflict created significant uncertainties for global investors. Moreover, a negative combination of factors—including rising inflationary pressures, the continuation of global supply-chain disruptions, ongoing monetary policy normalization, higher global rates, and rising economic growth risks—all weighed on investor sentiment. This led to outflows from EM Debt portfolios, widening EM Debt credit spreads, higher EM local bond yields, and to a lesser extent, weaker EM currencies—all amid high levels of market volatility.
In this environment, the credit spread of the J.P. Morgan Emerging Markets Bond Index Global Diversified (EMBIGD) widened by 175 basis points (bps) to 542 bps, producing a negative total return of 20.31% during the first half of 2022. There was broad weakness in credits across the investable universe with less than 140 bps of performance separating the returns of the high yield and investment grade segments. Regionally, the most negative, and direct, impact of the war in Ukraine was felt in the performance of the CEE-region, and later, high-yield, high-beta countries took the lead in the sell-off during the second quarter. Countries in the Middle East led returns in the first half by losing the least, followed by those in Asia and Latin America.
While the near-term outlook for global economic growth remains clouded by a combination of recession fears, still-strong inflationary pressures, and prospects of faster monetary policy tightening globally, we now expect an improvement in investor sentiment during the summer and have recently upgraded our medium-term views of EM Debt.
We expect inflationary pressures to start to dissipate soon, particularly in the United States, where a combination of stabilizing energy and food prices, improving global supply chain dynamics, a strong U.S. dollar, and softening economic conditions should drive inflation lower in the coming months. Declining inflation should allow for a less aggressive Federal Reserve hiking cycle, in turn leading to lower U.S. Treasury yields and reduced risks of an economic recession.
In EMs, we believe the fundamental backdrop remains constructive despite less favorable near-term fiscal and debt dynamics driven by softer economic conditions. External accounts should remain well supported by high commodity prices in most countries. While there are pockets of fundamental weaknesses, especially among some energy- and food- importing countries, overall, we believe the asset class is well positioned to withstand a period of weaker global growth. It is important to note that central banks in emerging markets have been preemptively hiking interest rates, and real interest-rate levels are significantly higher than they are in advanced economies, supporting local currencies and adding to the positive fundamental landscape.
We believe EM Debt valuations remain compelling on both an absolute and relative basis, with spreads remaining wider than their historical levels. EM sovereign high-yield spreads appear compelling, particularly relative to U.S. high-yield levels. In the distressed credit space, which now represents approximately 14% of the EMBIGD, we believe current prices are overestimating probabilities of credit events and underestimating potential restructuring and recovery values. Overall, we believe current valuations overcompensate investors for credit risks and volatility, and EM debt currently offers value to investors with a medium-to long-term horizon and a willingness to tolerate a period of higher volatility.
Notwithstanding the foregoing, we believe volatility should remain elevated in the near term because of still-challenging technical market conditions. While the supply of new debt remains constrained because of declining net refinancing needs, which occurred due to improved fiscal accounts and prefinancing activities last year, the recent pickup in outflows from dedicated EM Debt portfolios should continue to pressure bond prices, especially in the context of reduced liquidity during the summer months. However, we expect outflows to stabilize in the next few months, which—together with lower net debt issuance, reduced long investor positioning, and high investor cash levels—should add to a more positive technical condition picture in the coming months.
| 80 | Semiannual Report | June 30, 2022 |
| | Emerging Markets Debt Fund |
| | |
| | The Emerging Markets Debt Fund seeks to provide attractive risk-adjusted returns relative to the Fund’s benchmark through investments in hard currency denominated debt issued in emerging market countries. |
| | |
| | AN OVERVIEW FROM THE PORTFOLIO MANAGERS |
| | |

Marcelo Assalin, CFA 
Marco Ruijer, CFA | The William Blair Emerging Markets Debt Fund (Class I shares) (the “Fund”) posted a 20.65% decrease, net of fees, for the six months ended June 30, 2022. By comparison, the Fund’s benchmark index, the JPMorgan EMBI Global Diversified (the “Index”), decreased 20.31%. The Fund modestly underperformed the Index during the period. Positioning in higher-risk countries detracted the most from alpha in the period. Specifically, overweight positions in Ukraine, Sri Lanka, and Egypt detracted the most. Partially mitigating the negative attribution impact was an overweight position in Argentina and underweight positions in Russia and Belarus, which contributed the most to performance during the period. In Russia, our underweight position generated positive alpha following the military attack on Ukraine that began in February 2022. Bonds were marked down sharply as widescale financial and economic sanctions were placed on Russia, which we believe are likely to severely weaken its domestic economy and ultimately lead to a sovereign default. J.P. Morgan decided to remove all Russian bonds from the Index at the end of March 2022, and the Fund also sold the last of its U.S.-dollar-denominated Russian sovereign bonds during that same month. In Belarus, security selection (i.e., only holding the lower-priced bonds in the Index) and our underweight position in the country contributed to outperformance versus the Index as the country’s performance lagged the broader market. Belarus’s decision to allow Russia to host nuclear weapons and its support of Russia’s invasion of Ukraine weakened sentiment toward the country, prompting our decision to sell our Belarus holdings during March 2022. J.P. Morgan also decided to remove all Belarusian bonds from the Index at the end of March 2022. In Argentina, performance was driven primarily by our underweight of sovereign bonds and overweight of higher-quality provincial bonds. In addition, our basis positions and sovereign credit default swap hedges performed well in an environment in which Argentine bonds slid. Although higher-risk countries underperformed generally, Argentina was also plagued by domestic concerns as confidence in the government eroded. Rollover rates of domestic debt were low, raising concerns about near-term financing and the possibility that a funding mistake could occur sooner than many had thought. In Ukraine, our overweight exposure detracted from performance as the country came under military attack from Russia. Ukrainian officials have confirmed that they remain committed to servicing their external debt obligations for as long as possible, evidenced by a coupon payment paid to international investors following the attack. Moreover, Ukraine has received sizable financial support from both multilateral and bilateral organizations, which we believe should enable debt servicing to continue in the near term. However, given the extent of the uncertainty around the military invasion and its deep impact on Ukraine’s economy, the size of our overweight relative to the Index has been significantly eroded. In Sri Lanka, underperformance was driven by our overweight position as the country suspended servicing of its external debt and defaulted in April 2022. Sri Lanka is in discussions with the International Monetary Fund (IMF) for assistance and is in the early stages of debt restructuring. In Egypt, external bonds remained under pressure against a very unsupportive global macroeconomic backdrop and signs that the country’s external buffers are thinning. Fundamentally, there were signs of improvement, with Gulf Cooperation Council (GCC) countries making substantial financial commitments and Egypt having discussions with the IMF about a funded arrangement progressing. |
| June 30, 2022 | William Blair Funds | 81 |
Emerging Markets Debt Fund
In medium-risk countries, positioning drove slightly negative attribution impacts. In particular overweight positions in Trinidad and Tobago (now in the lower-risk countries group), Mongolia, and Guatemala contributed the most to relative performance. Conversely, underweight positions in Mexico, South Africa, and Brazil detracted the most from relative performance.
In Trinidad & Tobago, performance was primarily driven by our position in a state-owned entity called Heritage Petroleum. The entity performed an asset liability management optimization, paying approximately seven points above market price to retire outstanding holding company bonds and issue bonds from the operating company. The new bonds performed well in contrast to most bonds in the Index, which were down in the first half of the year.
In Mongolia, we reduced our positioning in the country’s sovereign debt after a slowdown of export activity into China due to COVID-related lockdowns. Our focus on shorter-duration debt also helped performance through security selection.
In Guatemala, the primary driver of outperformance was the use of corporate debt, which outperformed the sovereign in the first half of the year.
In Mexico, underperformance was driven primarily by an idiosyncratic issue with one of our corporate positions. Without this issue, the country was a relative outperformer in the first half of the year as it stood to benefit from higher oil prices and continued capital investment as companies continued to re-shore to North America.
In South Africa, we increased our positioning through the primary and secondary markets over the period. However, South African bonds failed to perform amid challenging global conditions. Labor and political tensions domestically also weighed on sentiment. Nevertheless, South Africa continued to experience fiscal tailwinds, which allowed us to remain comfortable with our exposure.
In Brazil, underperformance was driven by our underweight position in the country’s sovereign debt and the use of corporate debt, which was also impacted by idiosyncratic security selection issues.
Positioning in lower-risk countries contributed the most to alpha. Specifically overweight positions in Indonesia, Malaysia, and Georgia contributed the most. Conversely, underweight positions in China, Saudi Arabia, and United Arab Emirates (UAE) detracted the most from performance.
In Indonesia, outperformance was driven by our overweight positions in both sovereign bonds and quasi-sovereign bonds, given that spreads in those bonds were more insulated from the challenges of the environment than the rest of the Index. Indonesian assets have been better supported due to the country’s relatively strong economic growth and better terms of trade.
In Malaysia, our overweight position in a short-duration quasi-sovereign bond and underweight position in the rest of the curve contributed to performance as the longer-duration Malaysian quasi sovereign bonds sold off during the first half of the year.
We have an overweight in Georgia expressed through the national rail company which is a quasi-sovereign entity. This positioning benefitted our performance in the first half of the year. In spite of the conflict in Ukraine, forecasts for Georgia economic growth have increased due to upward revisions to external inflow. The country is using the re-routing of business, trade and labour flows in a beneficial way.
In China, performance was hurt by overweight positions in corporate credit. Because Chinese corporate credit risk appeared oversold, we increased our exposure to the segment—admittedly prematurely. Further hampering returns was the relative lack of typical support measures from the government. The overly drawn-out default process for some of the companies in the Chinese property sector also drove underperformance. We expect volatility to remain elevated but believe that these positions could ultimately be good entry points as the sector resets.
In Saudi Arabia and UAE, our underweight exposure detracted from performance. In a period of extreme market volatility as seen in the first half of the year, spreads only widened marginally due to strong fundamentals in the GCC countries and elevated oil prices. Our position in long-dated bonds also hurt performance due to their sensitivity to the upward move in U.S. Treasury yields during the first half of the year.
Please refer to the Emerging Markets Debt Review and Outlook relating to the Fund on page 80.
| 82 | Semiannual Report | June 30, 2022 |
Emerging Markets Debt Fund
Performance Highlights (Unaudited)
Average Annual Total Returns through 6/30/2022
| | | Year to
Date | | 1 Year | | Since
Inception(a) |
| Class I | | | (20.65 | )% | | | (22.04 | )% | | | (19.96 | )% |
| Class R6 | | | (20.62 | ) | | | (21.96 | ) | | | (19.89 | ) |
| JPMorgan EMBI Global Diversified | | | (20.31 | ) | | | (21.22 | ) | | | (18.83 | ) |
| | |
| (a) | Since inception is for the period from May 25, 2021 (Commencement of Operations) to June 30, 2022. |
Performance cited represents past performance. Past performance does not guarantee future results and current performance may be lower or higher than the data quoted. Results shown are average annual total returns, which assume reinvestment of dividends and capital gains. Investment returns and principal will fluctuate and you may have a gain or loss when you sell shares. For the most current month-end performance information, please call 1-800-742-7272, or visit our Web site at www.williamblairfunds.com. From time to time, the investment adviser may waive fees or reimburse expenses for the Fund. Without these waivers/reimbursements, performance would be lower. Class I shares are not subject to a sales load or distribution (Rule 12b-1) fees. Class R6 shares are not subject to a sales load, distribution (Rule 12b-1) fees, or sub-transfer agent fees.
The performance highlights and graph presented above do not reflect the deduction of taxes that a shareholder would pay on fund distributions or the redemption of fund shares.
The JP Morgan Emerging Markets Bond Index (EMBI) Global Diversified tracks the total return of U.S.-dollar denominated debt instruments issued by sovereign and quasi-sovereign entities.
This report identifies the Fund’s investments on June 30, 2022. These holdings are subject to change. Not all investments in the Fund performed the same, nor is there any guarantee that these investments will perform as well in the future. Market forecasts provided in this report may not necessarily come to pass.
Sector Diversification (Unaudited)
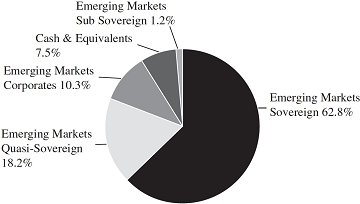
The sector diversification shown is based on the total investments.
| June 30, 2022 | William Blair Funds | 83 |
Emerging Markets Debt Fund
Portfolio of Investments, June 30, 2022 (all dollar amounts in thousands) (unaudited)
| | | | | | | | |
| | Issuer | | Principal
Amount | | | Value | |
| | | | | | | | | | |
| | Foreign Government Bonds—59.7% | | | | | | | | |
| | Angola—2.7% | | | | | | | | |
| | Angolan Government International Bond, 8.000%, due 11/26/29 | | $ | 500 | | | $ | 397 | |
| | Angolan Government International Bond, 9.125%, due 11/26/49 | | | 825 | | | | 583 | |
| | Angolan Government International Bond—144A, 8.750%, due 4/14/32 | | | 250 | | | | 200 | |
| | | | | | | | | 1,180 | |
| | Argentina—1.4% | | | | | | | | |
| | Argentine Republic Government International Bond, 0.500%, due 7/9/30, VRN(a) | | | 575 | | | | 126 | |
| | Argentine Republic Government International Bond, 1.125%, due 7/9/35, VRN(a) | | | 340 | | | | 71 | |
| | Argentine Republic Government International Bond, 1.500%, due 1/9/38, VRN(a) | | EUR | 320 | | | | 77 | |
| | Argentine Republic Government International Bond, 2.000%, due 1/9/38, VRN(a) | | $ | 710 | | | | 205 | |
| | Argentine Republic Government International Bond, 2.500%, due 7/9/41, VRN(a) | | | 475 | | | | 122 | |
| | | | | | | | | 601 | |
| | Armenia—0.3% | | | | | | | | |
| | Republic of Armenia International Bond, 3.600%, due 2/2/31 | | | 200 | | | | 139 | |
| | Bahrain—0.9% | | | | | | | | |
| | Bahrain Government International Bond, 5.250%, due 1/25/33 | | | 200 | | | | 162 | |
| | Bahrain Government International Bond, 6.250%, due 1/25/51 | | | 300 | | | | 222 | |
| | | | | | | | | 384 | |
| | Brazil—1.1% | | | | | | | | |
| | Brazilian Government International Bond, 4.750%, due 1/14/50 | | | 280 | | | | 190 | |
| | Brazilian Government International Bond, 5.625%, due 2/21/47 | | | 400 | | | | 309 | |
| | | | | | | | | 499 | |
| | Cameroon—0.4% | | | | | | | | |
| | Republic of Cameroon—144A, 5.950%, due 7/7/32 | | EUR | 250 | | | | 194 | |
| | Chile—1.4% | | | | | | | | |
| | Chile Government International Bond, 2.550%, due 7/27/33 | | $ | 275 | | | | 224 | |
| | Chile Government International Bond, 4.340%, due 3/7/42 | | | 450 | | | | 402 | |
| | | | | | | | | 626 | |
| | | | | | | | |
| | Issuer | | Principal
Amount | | | Value | |
| | | | | | | | | | |
| | Foreign Government Bonds—(continued) | | | | | | | | |
| | Colombia—1.7% | | | | | | | | |
| | Colombia Government International Bond, 4.125%, due 2/22/42 | | $ | 300 | | | $ | 188 | |
| | Colombia Government International Bond, 5.000%, due 6/15/45 | | | 830 | | | | 554 | |
| | | | | | | | | 742 | |
| | Costa Rica—0.4% | | | | | | | | |
| | Costa Rica Government International Bond, 7.000%, due 4/4/44 | | | 200 | | | | 171 | |
| | Dominican Republic—3.4% | | | | | | | | |
| | Dominican Republic International Bond, 4.500%, due 1/30/30 | | | 320 | | | | 255 | |
| | Dominican Republic International Bond, 4.875%, due 9/23/32 | | | 1,030 | | | | 790 | |
| | Dominican Republic International Bond, 5.875%, due 1/30/60 | | | 400 | | | | 273 | |
| | Dominican Republic International Bond—144A, 6.000%, due 2/22/33 | | | 200 | | | | 166 | |
| | | | | | | | | 1,484 | |
| | Ecuador—2.3% | | | | | | | | |
| | Ecuador Government International Bond, 0.000%, due 7/31/30 | | | 410 | | | | 176 | |
| | Ecuador Government International Bond, 0.500%, due 7/31/40, VRN(a) | | | 160 | | | | 67 | |
| | Ecuador Government International Bond, 1.000%, due 7/31/35, VRN(a) | | | 1,390 | | | | 679 | |
| | Ecuador Government International Bond, 5.000%, due 7/31/30, VRN(a) | | | 120 | | | | 78 | |
| | | | | | | | | 1,000 | |
| | Egypt—2.9% | | | | | | | | |
| | Egypt Government International Bond, 4.750%, due 4/16/26 | | EUR | 200 | | | | 157 | |
| | Egypt Government International Bond, 6.375%, due 4/11/31 | | | 250 | | | | 164 | |
| | Egypt Government International Bond, 7.500%, due 2/16/61 | | $ | 250 | | | | 138 | |
| | Egypt Government International Bond, 7.625%, due 5/29/32 | | | 250 | | | | 162 | |
| | Egypt Government International Bond, 8.875%, due 5/29/50 | | | 550 | | | | 330 | |
| | Egypt Government International Bond—144A, 7.300%, due 9/30/33 | | | 250 | | | | 159 | |
| | Egypt Government International Bond—144A, 8.750%, due 9/30/51 | | | 250 | | | | 149 | |
| | | | | | | | | 1,259 | |
| | El Salvador—0.6% | | | | | | | | |
| | El Salvador Government International Bond, 7.125%, due 1/20/50 | | | 150 | | | | 45 | |
| | El Salvador Government International Bond, 7.625%, due 2/1/41 | | | 650 | | | | 201 | |
| | El Salvador Government International Bond, 8.250%, due 4/10/32 | | | 110 | | | | 37 | |
| | | | | | | | | 283 | |
See accompanying Notes to Financial Statements.
| 84 | Semiannual Report | June 30, 2022 |
Emerging Markets Debt Fund
Portfolio of Investments, June 30, 2022 (all dollar amounts in thousands) (unaudited)
| | | | | | | | |
| | Issuer | | Principal
Amount | | | Value | |
| | | | | | | | | | |
| | Foreign Government Bonds—(continued) | | | | | | | | |
| | Gabon—0.7% | | | | | | | | |
| | Gabon Government International Bond, 7.000%, due 11/24/31 | | $ | 450 | | | $ | 325 | |
| | Ghana—1.9% | | | | | | | | |
| | Ghana Government International Bond, 7.750%, due 4/7/29 | | | 300 | | | | 147 | |
| | Ghana Government International Bond, 8.625%, due 4/7/34 | | | 400 | | | | 191 | |
| | Ghana Government International Bond, 8.750%, due 3/11/61 | | | 550 | | | | 256 | |
| | Ghana Government International Bond, 8.950%, due 3/26/51 | | | 500 | | | | 234 | |
| | | | | | | | | 828 | |
| | Hungary—0.3% | | | | | | | | |
| | Hungary Government International Bond, 3.125%, due 9/21/51 | | | 200 | | | | 132 | |
| | Indonesia—3.4% | | | | | | | | |
| | Indonesia Government International Bond, 3.400%, due 9/18/29 | | | 550 | | | | 509 | |
| | Indonesia Government International Bond, 4.450%, due 4/15/70 | | | 250 | | | | 213 | |
| | Indonesia Government International Bond, 4.750%, due 2/11/29 | | | 300 | | | | 303 | |
| | Indonesia Government International Bond, 5.125%, due 1/15/45 | | | 500 | | | | 478 | |
| | | | | | | | | 1,503 | |
| | Iraq—1.3% | | | | | | | | |
| | Iraq International Bond, 6.752%, due 3/9/23 | | | 600 | | | | 584 | |
| | Ivory Coast—0.3% | | | | | | | | |
| | Ivory Coast Government International Bond, 6.625%, due 3/22/48 | | EUR | 200 | | | | 140 | |
| | Jamaica—0.5% | | | | | | | | |
| | Jamaica Government International Bond, 7.875%, due 7/28/45 | | $ | 200 | | | | 211 | |
| | Kenya—1.0% | | | | | | | | |
| | Republic of Kenya Government International Bond, 8.250%, due 2/28/48 | | | 700 | | | | 427 | |
| | Lebanon—0.5% | | | | | | | | |
| | Lebanon Government International Bond, 5.800%, due 4/14/20(b) | | | 1,400 | | | | 92 | |
| | Lebanon Government International Bond, 6.850%, due 3/23/27(b) | | | 600 | | | | 35 | |
| | Lebanon Government International Bond, 7.150%, due 11/20/31(b) | | | 1,200 | | | | 81 | |
| | | | | | | | | 208 | |
| | Mexico—0.9% | | | | | | | | |
| | Mexico Government International Bond, 3.750%, due 4/19/71 | | | 600 | | | | 379 | |
| | Mongolia—0.4% | | | | | | | | |
| | Mongolia Government International Bond, 5.625%, due 5/1/23 | | | 200 | | | | 196 | |
| | | | | | | | |
| | Issuer | | Principal
Amount | | | Value | |
| | | | | | | | | | |
| | Foreign Government Bonds—(continued) | | | | | | | | |
| | Morocco—0.3% | | | | | | | | |
| | Morocco Government International Bond, 4.000%, due 12/15/50 | | $ | 200 | | | $ | 121 | |
| | Mozambique—0.3% | | | | | | | | |
| | Mozambique International Bond, 5.000%, due 9/15/31, VRN(a) | | | 200 | | | | 145 | |
| | Nigeria—2.3% | | | | | | | | |
| | Nigeria Government International Bond, 7.625%, due 11/28/47 | | | 750 | | | | 448 | |
| | Nigeria Government International Bond, 7.696%, due 2/23/38 | | | 400 | | | | 248 | |
| | Nigeria Government International Bond—144A, 7.375%, due 9/28/33 | | | 250 | | | | 162 | |
| | Nigeria Government International Bond—144A, 8.250%, due 9/28/51 | | | 225 | | | | 139 | |
| | | | | | | | | 997 | |
| | Oman—2.0% | | | | | | | | |
| | Oman Government International Bond, 6.750%, due 1/17/48 | | | 1,000 | | | | 860 | |
| | Pakistan—1.7% | | | | | | | | |
| | Pakistan Government International Bond, 6.875%, due 12/5/27 | | | 200 | | | | 134 | |
| | Pakistan Government International Bond, 8.875%, due 4/8/51 | | | 800 | | | | 476 | |
| | Pakistan Government International Bond—144A, 6.000%, due 4/8/26 | | | 200 | | | | 134 | |
| | | | | | | | | 744 | |
| | Panama—1.4% | | | | | | | | |
| | Panama Government International Bond, 4.500%, due 4/1/56 | | | 400 | | | | 318 | |
| | Panama Government International Bond, 4.500%, due 1/19/63 | | | 400 | | | | 310 | |
| | | | | | | | | 628 | |
| | Paraguay—1.1% | | | | | | | | |
| | Paraguay Government International Bond, 5.400%, due 3/30/50 | | | 600 | | | | 463 | |
| | Peru—1.1% | | | | | | | | |
| | Peruvian Government International Bond, 3.000%, due 1/15/34 | | | 200 | | | | 164 | |
| | Peruvian Government International Bond, 3.230%, due 7/28/21 | | | 400 | | | | 246 | |
| | Peruvian Government International Bond, 3.600%, due 1/15/72 | | | 100 | | | | 67 | |
| | | | | | | | | 477 | |
| | Philippines—1.4% | | | | | | | | |
| | Philippine Government International Bond, 3.700%, due 2/2/42 | | | 500 | | | | 413 | |
| | Philippine Government International Bond, 5.000%, due 1/13/37 | | | 200 | | | | 199 | |
| | | | | | | | | 612 | |
| | Qatar—2.2% | | | | | | | | |
| | Qatar Government International Bond, 4.400%, due 4/16/50 | | | 1,000 | | | | 959 | |
See accompanying Notes to Financial Statements.
| June 30, 2022 | William Blair Funds | 85 |
Emerging Markets Debt Fund
Portfolio of Investments, June 30, 2022 (all dollar amounts in thousands) (unaudited)
| | | | | | | | |
| | Issuer | | Principal
Amount | | | Value | |
| | | | | | | | | | |
| | Foreign Government Bonds—(continued) | | | | | | | | |
| | Romania—1.4% | | | | | | | | |
| | Romanian Government International Bond, 2.875%, due 4/13/42 | | EUR | 200 | | | $ | 122 | |
| | Romanian Government International Bond, 3.375%, due 1/28/50 | | | 780 | | | | 483 | |
| | | | | | | | | 605 | |
| | Saudi Arabia—2.3% | | | | | | | | |
| | Saudi Government International Bond, 2.250%, due 2/2/33 | | $ | 400 | | | | 332 | |
| | Saudi Government International Bond, 3.250%, due 11/17/51 | | | 200 | | | | 150 | |
| | Saudi Government International Bond, 3.450%, due 2/2/61 | | | 500 | | | | 376 | |
| | Saudi Government International Bond, 3.750%, due 1/21/55 | | | 200 | | | | 164 | |
| | | | | | | | | 1,022 | |
| | Senegal—0.6% | | | | | | | | |
| | Senegal Government International Bond, 6.750%, due 3/13/48 | | | 400 | | | | 253 | |
| | Serbia—0.6% | | | | | | | | |
| | Serbia International Bond, 1.500%, due 6/26/29 | | EUR | 200 | | | | 151 | |
| | Serbia International Bond, 2.050%, due 9/23/36 | | | 200 | | | | 122 | |
| | | | | | | | | 273 | |
| | South Africa—2.2% | | | | | | | | |
| | Republic of South Africa Government International Bond, 5.000%, due 10/12/46 | | $ | 200 | | | | 130 | |
| | Republic of South Africa Government International Bond, 5.650%, due 9/27/47 | | | 200 | | | | 136 | |
| | Republic of South Africa Government International Bond, 5.750%, due 9/30/49 | | | 800 | | | | 548 | |
| | Republic of South Africa Government International Bond, 7.300%, due 4/20/52 | | | 200 | | | | 160 | |
| | | | | | | | | 974 | |
| | Sri Lanka—1.2% | | | | | | | | |
| | Sri Lanka Government International Bond, 5.750%, due 4/18/23 | | | 400 | | | | 124 | |
| | Sri Lanka Government International Bond, 6.850%, due 11/3/25 | | | 400 | | | | 120 | |
| | Sri Lanka Government International Bond, 7.850%, due 3/14/29 | | | 1,000 | | | | 280 | |
| | | | | | | | | 524 | |
| | Tunisia—0.6% | | | | | | | | |
| | Banque Centrale de Tunisie International Bond, 5.625%, due 2/17/24 | | EUR | 400 | | | | 243 | |
| | Turkey—1.9% | | | | | | | | |
| | Turkey Government International Bond, 4.375%, due 7/8/27 | | | 100 | | | | 87 | |
| | Turkey Government International Bond, 4.875%, due 4/16/43 | | $ | 450 | | | | 265 | |
| | Turkey Government International Bond, 5.750%, due 5/11/47 | | | 200 | | | | 123 | |
| | | | | | | | |
| | Issuer | | Principal
Amount | | | Value | |
| | | | | | | | | | |
| | Foreign Government Bonds—(continued) | | | | | | | | |
| | Turkey (continued) | | | | | | | | |
| | Turkey Government International Bond, 5.950%, due 1/15/31 | | $ | 200 | | | $ | 145 | |
| | Turkey Government International Bond, 8.600%, due 9/24/27 | | | 250 | | | | 226 | |
| | | | | | | | | 846 | |
| | Ukraine—1.0% | | | | | | | | |
| | Ukraine Government International Bond, 0.000%, due 5/31/40, VRN(a) | | | 280 | | | | 69 | |
| | Ukraine Government International Bond, 6.876%, due 5/21/29 | | | 200 | | | | 48 | |
| | Ukraine Government International Bond, 7.253%, due 3/15/33 | | | 1,400 | | | | 343 | |
| | | | | | | | | 460 | |
| | United Arab Emirates—1.2% | | | | | | | | |
| | Abu Dhabi Government International Bond, 2.700%, due 9/2/70 | | | 450 | | | | 301 | |
| | United Arab Emirates Government International Bond, 4.951%, due 7/7/52 | | | 200 | | | | 203 | |
| | | | | | | | | 504 | |
| | Uruguay—0.8% | | | | | | | | |
| | Uruguay Government International Bond, 4.975%, due 4/20/55 | | | 350 | | | | 344 | |
| | Uzbekistan—0.6% | | | | | | | | |
| | Republic of Uzbekistan International Bond, 3.900%, due 10/19/31 | | | 400 | | | | 283 | |
| | Zambia—0.8% | | | | | | | | |
| | Zambia Government International Bond, 8.500%, due 4/14/24 | | | 400 | | | | 240 | |
| | Zambia Government International Bond, 8.970%, due 7/30/27 | | | 200 | | | | 116 | |
| | | | | | | | | 356 | |
| | Total Foreign Government Bonds—59.7%
(cost $33,881) | | | | | | | 26,188 | |
| | | | | | | | | | |
| | Foreign Corporate Bonds—29.2% | | | | | | | | |
| | Azerbaijan—0.4% | | | | | | | | |
| | State Oil Co. of the Azerbaijan Republic, 6.950%, due 3/18/30 | | | 200 | | | | 189 | |
| | Brazil—1.0% | | | | | | | | |
| | Atento Luxco 1 S.A., 8.000%, due 2/10/26 | | | 150 | | | | 106 | |
| | MV24 Capital BV, 6.748%, due 6/1/34 | | | 178 | | | | 159 | |
| | Petrorio Luxembourg S.a.r.l., 6.125%, due 6/9/26 | | | 200 | | | | 184 | |
| | | | | | | | | 449 | |
| | Chile—2.5% | | | | | | | | |
| | CAP S.A., 3.900%, due 4/27/31 | | | 250 | | | | 196 | |
| | Celulosa Arauco y Constitucion S.A., 4.250%, due 4/30/29 | | | 200 | | | | 180 | |
See accompanying Notes to Financial Statements.
| 86 | Semiannual Report | June 30, 2022 |
Emerging Markets Debt Fund
Portfolio of Investments, June 30, 2022 (all dollar amounts in thousands) (unaudited)
| | | | | | | | |
| | Issuer | | Principal
Amount | | | Value | |
| | | | | | | | | | |
| | Foreign Corporate Bonds—(continued) | | | | | | | | |
| | Chile (continued) | | | | | | | | |
| | Empresa Nacional del Petroleo, 5.250%, due 11/6/29 | | $ | 450 | | | $ | 425 | |
| | Kenbourne Invest S.A., 4.700%, due 1/22/28 | | | 200 | | | | 154 | |
| | VTR Finance N.V., 6.375%, due 7/15/28 | | | 200 | | | | 145 | |
| | | | | | | | | 1,100 | |
| | China—2.4% | | | | | | | | |
| | China Evergrande Group, 9.500%, due 3/29/24(b) | | | 300 | | | | 25 | |
| | CNAC HK Finbridge Co., Ltd., 3.000%, due 9/22/30 | | | 200 | | | | 174 | |
| | CNAC HK Finbridge Co., Ltd., 4.875%, due 3/14/25 | | | 200 | | | | 203 | |
| | Enn Energy holdings, Ltd.—144A, 4.625%, due 5/17/27 | | | 200 | | | | 201 | |
| | Huarong Finance 2017 Co., Ltd., 4.250%, due 11/7/27 | | | 200 | | | | 179 | |
| | Sinochem Offshore Capital Co., Ltd., 2.375%, due 9/23/31 | | | 300 | | | | 243 | |
| | Yuzhou Group Holdings Co., Ltd., 7.850%, due 8/12/26(b) | | | 200 | | | | 13 | |
| | | | | | | | | 1,038 | |
| | Colombia—0.8% | | | | | | | | |
| | Canacol Energy Ltd.—144A, 5.750%, due 11/24/28 | | | 200 | | | | 162 | |
| | Gran Tierra Energy International Holdings, Ltd., 6.250%, due 2/15/25 | | | 200 | | | | 171 | |
| | | | | | | | | 333 | |
| | Dominican Republic—0.9% | | | | | | | | |
| | Aeropuertos Dominicanos Siglo XXI S.A., 6.750%, due 3/30/29 | | | 200 | | | | 181 | |
| | Empresa Generadora de Electricidad Haina S.A.—144A, 5.625%, due 11/8/28 | | | 250 | | | | 213 | |
| | | | | | | | | 394 | |
| | Georgia—0.4% | | | | | | | | |
| | Georgian Railway JSC, 4.000%, due 6/17/28 | | | 200 | | | | 154 | |
| | Ghana—0.4% | | | | | | | | |
| | Tullow Oil plc, 7.000%, due 3/1/25 | | | 200 | | | | 165 | |
| | Guatemala—0.8% | | | | | | | | |
| | Energuate Trust, 5.875%, due 5/3/27 | | | 200 | | | | 187 | |
| | Investment Energy Resources Ltd.—144A, 6.250%, due 4/26/29 | | | 200 | | | | 170 | |
| | | | | | | | | 357 | |
| | India—1.1% | | | | | | | | |
| | Continuum Energy Levante, 4.500%, due 2/9/27 | | | 197 | | | | 154 | |
| | Export-Import Bank of India, 2.250%, due 1/13/31 | | | 200 | | | | 158 | |
| | Periama Holdings LLC, 5.950%, due 4/19/26 | | | 200 | | | | 178 | |
| | | | | | | | | 490 | |
| | | | | | | | |
| | Issuer | | Principal
Amount | | | Value | |
| | | | | | | | | | |
| | Foreign Corporate Bonds—(continued) | | | | | | | | |
| | Indonesia—2.9% | | | | | | | | |
| | Medco Laurel Tree Pte, Ltd., 6.950%, due 11/12/28 | | $ | 200 | | | $ | 166 | |
| | Nickel Mines Ltd.—144A, 6.500%, due 4/1/24 | | | 200 | | | | 187 | |
| | Perusahaan Penerbit SBSN Indonesia III—144A, 4.700%, due 6/6/32 | | | 200 | | | | 196 | |
| | PT Pertamina Persero, 2.300%, due 2/9/31 | | | 200 | | | | 162 | |
| | PT Pertamina Persero, 3.100%, due 8/27/30 | | | 400 | | | | 347 | |
| | PT Pertamina Persero, 6.000%, due 5/3/42 | | | 200 | | | | 193 | |
| | | | | | | | | 1,251 | |
| | Kazakhstan—2.6% | | | | | | | | |
| | KazMunayGas National Co. JSC, 3.500%, due 4/14/33 | | | 1,600 | | | | 1,146 | |
| | Malaysia—3.6% | | | | | | | | |
| | 1MDB Global Investments, Ltd., 4.400%, due 3/9/23 | | | 1,200 | | | | 1,162 | |
| | Dua Capital, Ltd., 2.780%, due 5/11/31 | | | 300 | | | | 246 | |
| | Petronas Capital, Ltd., 4.550%, due 4/21/50 | | | 200 | | | | 191 | |
| | | | | | | | | 1,599 | |
| | Mexico—3.6% | | | | | | | | |
| | BBVA Bancomer S.A., 5 year CMT + 2.650%, 5.125%, due 1/18/33, VRN | | | 200 | | | | 170 | |
| | Credito Real S.A.B. de C.V. SOFOM ER, 5.000%, due 2/1/27 | | EUR | 200 | | | | 12 | |
| | Petroleos Mexicanos, 6.700%, due 2/16/32 | | $ | 330 | | | | 250 | |
| | Petroleos Mexicanos, 6.750%, due 9/21/47 | | | 538 | | | | 329 | |
| | Petroleos Mexicanos, 6.950%, due 1/28/60 | | | 500 | | | | 308 | |
| | Petroleos Mexicanos, 7.690%, due 1/23/50 | | | 500 | | | | 334 | |
| | Petroleos Mexicanos—144A, 8.750%, due 6/2/29 | | | 200 | | | | 178 | |
| | | | | | | | | 1,581 | |
| | Mongolia—0.4% | | | | | | | | |
| | Development Bank of Mongolia, 7.250%, due 10/23/23 | | | 200 | | | | 193 | |
| | Nigeria—0.5% | | | | | | | | |
| | SEPLAT Energy plc, 7.750%, due 4/1/26 | | | 250 | | | | 222 | |
| | Panama—0.4% | | | | | | | | |
| | Aeropuerto Internacional de Tocumen S.A., 5.125%, due 8/11/61 | | | 250 | | | | 196 | |
See accompanying Notes to Financial Statements.
| June 30, 2022 | William Blair Funds | 87 |
Emerging Markets Debt Fund
Portfolio of Investments, June 30, 2022 (all dollar amounts in thousands) (unaudited)
| | | | | | | | |
| | Issuer | | Principal
Amount | | | Value | |
| | | | | | | | | | |
| | Foreign Corporate Bonds—(continued) | | | | | | | | |
| | Peru—0.9% | | | | | | | | |
| | Corporation Financiera de Desarrollo S.A., 2.400%, due 9/28/27 | | $ | 200 | | | $ | 169 | |
| | Fondo MIVIVIENDA S.A.—144A, 4.625%, due 4/12/27 | | | 250 | | | | 241 | |
| | | | | | | | | 410 | |
| | Trinidad And Tobago—0.5% | | | | | | | | |
| | Heritage Petrol Co., Ltd.—144A, 9.000%, due 8/12/29 | | | 200 | | | | 207 | |
| | Turkey—0.6% | | | | | | | | |
| | Turkiye Ihracat Kredi Bankasi A.S.—144A, 5.750%, due 7/6/26 | | | 300 | | | | 251 | |
| | United Arab Emirates—2.1% | | | | | | | | |
| | DP World, Ltd., 4.700%, due 9/30/49 | | | 200 | | | | 163 | |
| | Emirate of Dubai Government International Bonds, 3.900%, due 9/9/50 | | | 200 | | | | 143 | |
| | Finance Department Government of Sharjah, 3.625%, due 3/10/33 | | | 300 | | | | 255 | |
| | MAF Global Securities, Ltd., 5 year CMT + 3.539%, 6.375%, due 3/20/26, VRN(c) | | | 200 | | | | 192 | |
| | Shelf Drilling Holdings, Ltd., 8.250%, due 2/15/25 | | | 200 | | | | 157 | |
| | | | | | | | | 910 | |
| | Uzbekistan—0.4% | | | | | | | | |
| | Ipoteka-Bank ATIB, 5.500%, due 11/19/25 | | | 200 | | | | 176 | |
| | Total Foreign Corporate Bonds—29.2%
(cost $15,100) | | | | | | | 12,811 | |
| | | | | | | | | | |
| | Foreign Municipal Bonds—1.2% | | | | | | | | |
| | Argentina—1.2% | | | | | | | | |
| | Provincia de Buenos Aires, 3.900%, due 9/1/37, VRN(a) | | | 400 | | | | 121 | |
| | Provincia de Buenos Aires—144A, 3.500%, due 9/1/37, VRN(a) | | | 200 | | | | 56 | |
| | Provincia de Buenos Aires—144A, 3.900%, due 9/1/37, VRN(a) | | | 50 | | | | 15 | |
| | Provincia de Cordoba, 6.875%, due 12/10/25, VRN(a) | | | 200 | | | | 152 | |
| | Provincia del Chubut Argentina, 7.750%, due 7/26/30, VRN(a) | | | 227 | | | | 179 | |
| | | | | | | | | 523 | |
| | Total Foreign Municipal Bonds—1.2%
(cost $647) | | | | | | | 523 | |
| | | | | | | | | | |
| | Repurchase Agreement | | | | | | | | |
| | Fixed Income Clearing Corporation, 0.240% dated 6/30/22, due 7/1/22, repurchase price $3,343, collateralized by U.S. Treasury Note, 1.250%, due 06/30/28, valued at $3,410 | | | 3,343 | | | | 3,343 | |
| | | | | | | | | |
| | | | | | | | | |
| | Issuer | | | | | | Value | |
| | | | | | | | | | |
| | Repurchase Agreement—(continued) | | | | | | | | |
| | Total Repurchase Agreement—7.7%
(cost $3,343) | | | | | | $ | 3,343 | |
| | Total Investments in Securities—97.8%
(cost $52,971) | | | | | | | 42,865 | |
| | Total Investments—97.8%
(cost $52,971) | | | | | | | 42,865 | |
| | Cash and other assets, less liabilities—2.2% | | | | | | | 983 | |
| | Net assets—100.0% | | | | | | $ | 43,848 | |
(a) Variable/Floating interest rate security. Certain variable/floating interest rate securities are not based on a published reference rate and spread but are determined by the issuer or agent and are based on current market conditions. These securities do not indicate a reference rate and spread in their description above. Rate presented is as of June 30, 2022.
(b) = Defaulted securities.
(c) Security is perpetual in nature and has no stated maturity.
144A = Security exempt from registration under Rule 144A of the Securities Act of 1933. These securities may be resold in transactions exempt from registration, normally to qualified institutional buyers.
SOFR = Secured Overnight Financing Rate
VRN = Variable Rate Note
At June 30, 2022, the Fund’s Portfolio of Investments includes the following industry categories (as a percentage of long-term investments):
| Sovereign | | 67.8% |
| Quasi-Sovereign | | 19.8% |
| Corporate | | |
| Energy | | 4.3% |
| Financials | | 1.9% |
| Materials | | 1.9% |
| Utilities | | 1.5% |
| Communication Services | | 0.8% |
| Industrials | | 0.4% |
| Consumer Discretionary | | 0.3% |
| Sub Sovereign | | 1.3% |
| Total | | 100.0% |
At June 30, 2022, the Fund’s Portfolio of Investments includes the following currency categories (as a percentage of long-term investments):
| U.S. Dollar | | 95.1% |
| Euro | | 4.9% |
| Total | | 100.0% |
See accompanying Notes to Financial Statements.
| 88 | Semiannual Report | June 30, 2022 |
Emerging Markets Debt Fund
Portfolio of Investments, June 30, 2022 (all dollar amounts in thousands) (unaudited)
Forward Foreign Currency Contracts
Settlement
Date | | Deliver/Receive | | Counterparty | | Local Currency
(in thousands) | | USD (Base)
Purchased
or Sold | | | Current
Value | | Net
Unrealized
Appreciation
(Depreciation) | |
| Bought | | | | | | | | | | | | | | | | | | | |
| 9/21/22 | | Euro | | Citibank N.A. London | | 176 | | | $ 187 | | | | $ 185 | | | | $ | (2 | ) |
| Sold | | | | | | | | | | | | | | | | | | | |
| 9/21/22 | | Euro | | Citibank N.A. London | | 2,171 | | | 2,335 | | | | 2,288 | | | | | 47 | |
| Total net unrealized appreciation (depreciation) on forward foreign currency contracts | | | | $ | 45 | |
Centrally Cleared Interest Rate Swaps
Floating Rate
Reference | | Pay/Receive
Floating Rate | | Fixed
Rate | | Payment
Frequency | | Maturity
Date | | Cleared
Exchange | | Notional
Amount
(in thousands) | | | Upfront
Payment
Paid
(Received) | | | Value | | Unrealized
Appreciation
(Depreciation) | |
| 6 Month EURIBOR | | Receive | | (0.250)% | | 1Y | | June 2026 | | LCH | | | EUR 157 | | | | $(2) | | | | $ 12 | | | $ | 14 | |
| 6 Month EURIBOR | | Receive | | (0.250)% | | 1Y | | June 2028 | | LCH | | | EUR 722 | | | | 43 | | | | 91 | | | | 48 | |
| 6 Month EURIBOR | | Receive | | 0.000% | | 1Y | | June 2031 | | LCH | | | EUR 166 | | | | (2) | | | | 30 | | | | 32 | |
| 6 Month EURIBOR | | Receive | | 0.000% | | 1Y | | June 2036 | | LCH | | | EUR 347 | | | | 48 | | | | 104 | | | | 56 | |
| 6 Month EURIBOR | | Receive | | 0.250% | | 1Y | | June 2041 | | LCH | | | EUR 620 | | | | 16 | | | | 208 | | | | 192 | |
| 12 Month USD SOFR | | Receive | | 1.500% | | 1Y | | December 2031 | | LCH | | | $1,910 | | | | 113 | | | | 184 | | | | 71 | |
| 12 Month USD SOFR | | Receive | | 1.650% | | 1Y | | December 2041 | | LCH | | | 442 | | | | 62 | | | | 75 | | | | 13 | |
| 12 Month USD SOFR | | Receive | | 1.600% | | 1Y | | December 2051 | | LCH | | | 569 | | | | 37 | | | | 113 | | | | 76 | |
| 12 Month USD SOFR | | Pay | | 1.250% | | 1Y | | December 2026 | | LCH | | | 2,753 | | | | (56) | | | | (158) | | | | (102 | ) |
| 12 Month USD SOFR | | Pay | | 1.100% | | 1Y | | December 2024 | | LCH | | | 2,660 | | | | (35) | | | | (102) | | | | (67 | ) |
| 12 Month USD SOFR | | Pay | | 1.600% | | 1Y | | December 2036 | | LCH | | | 1,097 | | | | (146) | | | | (154) | | | | (8 | ) |
| 12 Month USD SOFR | | Pay | | 1.400% | | 1Y | | December 2028 | | LCH | | | 2,641 | | | | (81) | | | | (195) | | | | (114 | ) |
| | | | | | | | | | | | | | | | | | | | | | | | | $ | 211 | |
| | | | | | | | | | | | | | | | | |
Centrally Cleared Credit Default Swaps | | | | | | | | | | | | | | | | |
| | | | | | | | | | | | | | | | | | | | | | | | | | | |
Reference
Entity | | Buy/Sell
Protection | | Fixed Rate | | Payment
Frequency | | Maturity
Date | | Cleared
Exchange | | Notional
Amount
(in thousands) | | | Upfront
Payment
Paid
(Received) | | | Value | | Unrealized
Appreciation
(Depreciation) | |
| Kingdom of Saudi Arabia | | Buy | | 1.000% | | 3M | | June 2026 | | ICE | | | $400 | | | | $(8) | | | | $(5) | | | $ | 3 | |
| Republic of Argentina | | Buy | | 5.000% | | 3M | | December 2023 | | ICE | | | 200 | | | | 32 | | | | 59 | | | | 27 | |
| Republic of Argentina | | Buy | | 1.000% | | 3M | | December 2025 | | ICE | | | 500 | | | | 306 | | | | 371 | | | | 65 | |
| Republic of Argentina | | Buy | | 5.000% | | 3M | | June 2026 | | ICE | | | 250 | | | | 143 | | | | 172 | | | | 29 | |
| Republic of Argentina | | Sell | | 5.000% | | 3M | | December 2031 | | ICE | | | 500 | | | | (293) | | | | (358) | | | | (65 | ) |
| Republic of Argentina | | Sell | | 5.000% | | 3M | | June 2032 | | ICE | | | 100 | | | | (63) | | | | (72) | | | | (9 | ) |
| Republic of Argentina | | Sell | | 5.000% | | 3M | | December 2024 | | ICE | | | 250 | | | | (103) | | | | (146) | | | | (43 | ) |
| Republic of Turkey | | Sell | | 1.000% | | 3M | | June 2024 | | ICE | | | 250 | | | �� | (31) | | | | (35) | | | | (4 | ) |
| | | | | | | | | | | | | | | | | | | | | | | | | $ | 3 | |
| Total net unrealized appreciation (depreciation) on swaps | | | | | | | | | | | | | | | | $ | 214 | |
See accompanying Notes to Financial Statements.
| June 30, 2022 | William Blair Funds | 89 |
Macro Allocation Fund (In Liquidation)
Portfolio of Investments, June 30, 2022 (all dollar amounts in thousands) (unaudited)
| | | | | | | | |
| | Issuer | | Principal
Amount | | | Value | |
| | | | | | | | | | |
| | Repurchase Agreement | | | | | | | | |
| | Fixed Income Clearing Corporation, 0.240% dated 6/30/22, due 7/1/22, repurchase price $22,881, collateralized by U.S. Treasury Note, 0.875% - 1.625%, due 11/15/30 - 05/15/31, valued at $23,338 | | $ | 22,881 | | | $ | 22,881 | |
| | Total Repurchase Agreement—101.2%
(cost $22,881) | | | | | | | 22,881 | |
| | Liabilities, plus cash and other assets—(1.2)% | | | | | | | (280 | ) |
| | Net assets—100.0% | | | | | | $ | 22,601 | |
Upon recommendation of William Blair Investment Management, LLC (the “Adviser”), the Board of Trustees determined that it was in the best interest of Macro Allocation Fund to redeem all shares of Macro Allocation Fund outstanding on or before July 29, 2022, and then to terminate Macro Allocation Fund. All outstanding shares of Macro Allocation Fund were redeemed on July 29, 2022.
See accompanying Notes to Financial Statements.
| 90 | Semiannual Report | June 30, 2022 |
Statements of Assets and Liabilities
As of June 30, 2022 (dollar amounts in thousands) (unaudited)
| | | Growth
Fund | | | Large Cap
Growth
Fund | | | Mid Cap
Growth
Fund | | | Mid Cap
Value
Fund | |
| Assets | | | | | | | | | | | | |
| Investments in securities, at cost | | $ | 163,437 | | | $ | 1,103,726 | | | $ | 38,744 | | | $ | 1,563 | |
| Investments in securities, at value | | $ | 224,765 | | | $ | 1,074,678 | | | $ | 35,390 | | | $ | 1,352 | |
| Cash | | | — | | | | — | | | | — | | | | 34 | |
| Receivable for securities sold | | | — | | | | 6,482 | | | | — | | | | 21 | |
| Receivable for fund shares sold | | | 110 | | | | 2,608 | | | | 33 | | | | — | |
| Receivable from Adviser | | | 2 | | | | 117 | | | | 15 | | | | 9 | |
| Dividend and interest receivable | | | 67 | | | | 242 | | | | — | | | | 2 | |
| Total assets | | | 224,944 | | | | 1,084,127 | | | | 35,438 | | | | 1,418 | |
| Liabilities | | | | | | | | | | | | | | | | |
| Payable for securities purchased | | | 591 | | | | 5,420 | | | | — | | | | 24 | |
| Payable for fund shares redeemed | | | 62 | | | | 342 | | | | — | | | | — | |
| Management fee payable | | | 145 | | | | 549 | | | | 27 | | | | 1 | |
| Distribution fee payable | | | 5 | | | | 28 | | | | 1 | | | | — | |
| Other payables and accrued expenses | | | 85 | | | | 146 | | | | 70 | | | | 21 | |
| Total liabilities | | | 888 | | | | 6,485 | | | | 98 | | | | 46 | |
| Net assets | | $ | 224,056 | | | $ | 1,077,642 | | | $ | 35,340 | | | $ | 1,372 | |
| Capital | | | | | | | | | | | | | | | | |
| Composition of net assets | | | | | | | | | | | | | | | | |
| Paid in capital | | $ | 144,232 | | | $ | 1,117,150 | | | $ | 25,494 | | | $ | 1,584 | |
| Total distributable earnings (loss) | | | 79,824 | | | | (39,508 | ) | | | 9,846 | | | | (212 | ) |
| Net assets | | $ | 224,056 | | | $ | 1,077,642 | | | $ | 35,340 | | | $ | 1,372 | |
| | | | | | | | | | | | | | | | | |
| Class N shares | | | | | | | | | | | | | | | | |
| Net assets | | $ | 25,185 | | | $ | 128,452 | | | $ | 3,384 | | | | — | |
| Shares outstanding | | | 2,982,937 | | | | 7,692,880 | | | | 374,643 | | | | — | |
| Net asset value per share | | $ | 8.44 | | | $ | 16.70 | | | $ | 9.03 | | | | — | |
| Class I shares | | | | | | | | | | | | | | | | |
| Net assets | | $ | 187,817 | | | $ | 739,937 | | | $ | 31,494 | | | $ | 48 | |
| Shares outstanding | | | 17,606,014 | | | | 41,400,865 | | | | 3,155,328 | | | | 5,424 | |
| Net asset value per share | | $ | 10.67 | | | $ | 17.87 | | | $ | 9.98 | | | $ | 8.74 | |
| Class R6 shares | | | | | | | | | | | | | | | | |
| Net assets | | $ | 11,054 | | | $ | 209,253 | | | $ | 462 | | | $ | 1,324 | |
| Shares outstanding | | | 1,032,533 | | | | 11,714,073 | | | | 46,219 | | | | 151,490 | |
| Net asset value per share | | $ | 10.71 | | | $ | 17.86 | | | $ | 10.00 | | | $ | 8.74 | |
See accompanying Notes to Financial Statements.
| June 30, 2022 | William Blair Funds | 91 |
Statements of Operations
For the Period Ended June 30, 2022 (all amounts in thousands) (unaudited)
| | | Growth
Fund | | | Large Cap
Growth
Fund | | | Mid Cap
Growth
Fund | | | Mid Cap
Value
Fund (a) | |
| Investment income | | | | | | | | | | | | | | | | | |
| Dividends | | $ | 807 | | | $ | 3,518 | | | $ | 71 | | | | $ | 9 | |
| Interest | | | 1 | | | | 2 | | | | — | | | | | — | |
| Total income | | | 808 | | | | 3,520 | | | | 71 | | | | | 9 | |
| Expenses | | | | | | | | | | | | | | | | | |
| Investment advisory fees | | | 1,032 | | | | 3,321 | | | | 187 | | | | | 3 | |
| Distribution fees | | | 38 | | | | 208 | | | | 5 | | | | | — | |
| Custodian fees | | | 32 | | | | 30 | | | | 29 | | | | | 17 | |
| Transfer agent fees | | | 38 | | | | 59 | | | | 4 | | | | | 1 | |
| Sub-transfer agent fees | | | | | | | | | | | | | | | | | |
| Class N | | | 21 | | | | 124 | | | | 3 | | | | | — | |
| Class I | | | 76 | | | | 376 | | | | 42 | | | | | — | |
| Professional fees | | | 21 | | | | 38 | | | | 14 | | | | | 11 | |
| Registration fees | | | 32 | | | | 64 | | | | 29 | | | | | 2 | |
| Shareholder reporting fees | | | 7 | | | | 18 | | | | 1 | | | | | — | |
| Trustee fees | | | 11 | | | | 30 | | | | 3 | | | | | — | |
| Other expenses | | | 9 | | | | 20 | | | | 5 | | | | | — | |
| Total expenses before expense limitation | | | 1,317 | | | | 4,288 | | | | 322 | | | | | 34 | |
| Expenses waived or reimbursed by the Adviser | | | | | | | | | | | | | | | | | |
| Class N | | | (7 | ) | | | (121 | ) | | | (10 | ) | | | | — | |
| Class I | | | — | | | | (365 | ) | | | (108 | ) | | | | (1 | ) |
| Class R6 | | | — | | | | (50 | ) | | | (1 | ) | | | | (31 | ) |
| Total expenses waived or reimbursed by the Adviser | | | (7 | ) | | | (536 | ) | | | (119 | ) | | | | (32 | ) |
| Net expenses | | | 1,310 | | | | 3,752 | | | | 203 | | | | | 2 | |
| Net investment income (loss) | | | (502 | ) | | | (232 | ) | | | (132 | ) | | | | 7 | |
| Realized and unrealized gain (loss) | | | | | | | | | | | | | | | | | |
| Net realized gain (loss) on transactions from: | | | | | | | | | | | | | | | | | |
| Investments in securities | | | 12,601 | | | | (15,728 | ) | | | 1,091 | | | | | (8 | ) |
| Total net realized gain (loss) | | | 12,601 | | | | (15,728 | ) | | | 1,091 | | | | | (8 | ) |
| Change in net unrealized appreciation (depreciation) of: | | | | | | | | | | | | | | | | | |
| Investments in securities | | | (106,248 | ) | | | (415,285 | ) | | | (17,572 | ) | | | | (211 | ) |
| Change in net unrealized appreciation (depreciation) | | | (106,248 | ) | | | (415,285 | ) | | | (17,572 | ) | | | | (211 | ) |
| Net increase (decrease) in net assets resulting from operations | | $ | (94,149 | ) | | $ | (431,245 | ) | | $ | (16,613 | ) | | | $ | (212 | ) |
| (a) | For the period from March 16, 2022 (Commencement of Operations) to June 30, 2022. |
See accompanying Notes to Financial Statements.
| 92 | Semiannual Report | June 30, 2022 |
Statements of Changes in Net Assets
For the Period Ended June 30, 2022 (unaudited) and the Year Ended December 31, 2021 (all amounts in thousands)
| | | Growth Fund | | | Large Cap
Growth Fund | | | Mid Cap
Growth Fund | | | Mid Cap
Value
Fund | |
| | | 2022 | | | 2021 | | | 2022 | | | 2021 | | | 2022 | | | 2021 | | | 2022 (a) | |
| Operations | | | | | | | | | | | | | | | | | | | | | | | | | | | | |
| Net investment income (loss) | | $ | (502 | ) | | $ | (1,243 | ) | | $ | (232 | ) | | $ | (863 | ) | | $ | (132 | ) | | $ | (523 | ) | | $ | 7 | |
| Net realized gain (loss) on investments, and other assets and liabilities | | | 12,601 | | | | 38,774 | | | | (15,728 | ) | | | 54,657 | | | | 1,091 | | | | 22,029 | | | | (8 | ) |
| Change in net unrealized appreciation (depreciation) on investments, and other assets and liabilities | | | (106,248 | ) | | | 27,119 | | | | (415,285 | ) | | | 154,591 | | | | (17,572 | ) | | | (13,963 | ) | | | (211 | ) |
| Net increase (decrease) in net assets resulting from operations | | | (94,149 | ) | | | 64,650 | | | | (431,245 | ) | | | 208,385 | | | | (16,613 | ) | | | 7,543 | | | | (212 | ) |
| Distributions to shareholders | | | | | | | | | | | | | | | | | | | | | | | | | | | | |
| Class N | | | — | | | | (4,767 | ) | | | — | | | | (8,639 | ) | | | — | | | | (243 | ) | | | — | |
| Class I | | | — | | | | (31,377 | ) | | | — | | | | (27,171 | ) | | | — | | | | (1,877 | ) | | | — | |
| Class R6 | | | — | | | | (1,576 | ) | | | — | | | | (9,649 | ) | | | — | | | | (27 | ) | | | — | |
| Total distributions | | | — | | | | (37,720 | ) | | | — | | | | (45,459 | ) | | | — | | | | (2,147 | ) | | | — | |
| Capital stock transactions | | | | | | | | | | | | | | | | | | | | | | | | | | | | |
| Proceeds from sale of shares | | | 11,719 | | | | 24,728 | | | | 604,815 | | | | 419,690 | | | | 2,815 | | | | 8,991 | | | | 1,584 | |
| Shares issued in reinvestment of income dividends and capital gain distributions | | | — | | | | 36,511 | | | | — | | | | 43,442 | | | | — | | | | 2,127 | | | | — | |
| Less cost of shares redeemed | | | (39,214 | ) | | | (39,720 | ) | | | (201,948 | ) | | | (232,907 | ) | | | (3,712 | ) | | | (47,634 | ) | | | — | |
| Net increase (decrease) in net assets resulting from capital share transactions | | | (27,495 | ) | | | 21,519 | | | | 402,867 | | | | 230,225 | | | | (897 | ) | | | (36,516 | ) | | | 1,584 | |
| Increase (decrease) in net assets | | | (121,644 | ) | | | 48,449 | | | | (28,378 | ) | | | 393,151 | | | | (17,510 | ) | | | (31,120 | ) | | | 1,372 | |
| Net assets | | | | | | | | | | | | | | | | | | | | | | | | | | | | |
| Beginning of period | | | 345,700 | | | | 297,251 | | | | 1,106,020 | | | | 712,869 | | | | 52,850 | | | | 83,970 | | | | — | |
| End of period | | $ | 224,056 | | | $ | 345,700 | | | $ | 1,077,642 | | | $ | 1,106,020 | | | $ | 35,340 | | | $ | 52,850 | | | $ | 1,372 | |
| (a) | For the period from March 16, 2022 (Commencement of Operations) to June 30, 2022. |
See accompanying Notes to Financial Statements.
| June 30, 2022 | William Blair Funds | 93 |
Statements of Assets and Liabilities
As of June 30, 2022 (dollar amounts in thousands) (unaudited)
| | | Small-Mid
Cap Core
Fund | | | Small-Mid
Cap Growth
Fund | | | Small Cap
Growth
Fund | | | Small Cap
Value
Fund | |
| Assets | | | | | | | | | | | | | | | | |
| Investments in securities, at cost | | $ | 136,427 | | | $ | 2,188,032 | | | $ | 511,734 | | | $ | 1,309,814 | |
| Investments in securities, at value | | $ | 117,955 | | | $ | 2,119,868 | | | $ | 492,420 | | | $ | 1,264,683 | |
| Receivable for securities sold | | | 1,363 | | | | 4,666 | | | | 7,967 | | | | 5,820 | |
| Receivable for fund shares sold | | | 2 | | | | 4,402 | | | | 432 | | | | 294 | |
| Receivable from Adviser | | | 30 | | | | 111 | | | | 20 | | | | 56 | |
| Dividend and interest receivable | | | 38 | | | | 209 | | | | 118 | | | | 1,167 | |
| Total assets | | | 119,388 | | | | 2,129,256 | | | | 500,957 | | | | 1,272,020 | |
| Liabilities | | | | | | | | | | | | | | | | |
| Payable for securities purchased | | | 1,150 | | | | 10,714 | | | | 7,926 | | | | 1,962 | |
| Payable for fund shares redeemed | | | 7 | | | | 24,342 | | | | 461 | | | | 355 | |
| Management fee payable | | | 91 | | | | 1,812 | | | | 467 | | | | 820 | |
| Distribution fee payable | | | — | | | | 31 | | | | 24 | | | | 1 | |
| Other payables and accrued expenses | | | 61 | | | | 688 | | | | 187 | | | | 182 | |
| Total liabilities | | | 1,309 | | | | 37,587 | | | | 9,065 | | | | 3,320 | |
| Net assets | | $ | 118,079 | | | $ | 2,091,669 | | | $ | 491,892 | | | $ | 1,268,700 | |
| Capital | | | | | | | | | | | | | | | | |
| Composition of net assets | | | | | | | | | | | | | | | | |
| Paid in capital | | $ | 141,798 | | | $ | 2,091,928 | | | $ | 508,544 | | | $ | 998,530 | |
| Total distributable earnings (loss) | | | (23,719 | ) | | | (259 | ) | | | (16,652 | ) | | | 270,170 | |
| Net assets | | $ | 118,079 | | | $ | 2,091,669 | | | $ | 491,892 | | | $ | 1,268,700 | |
| Class N shares | | | | | | | | | | | | | | | | |
| Net assets | | | — | | | $ | 142,341 | | | $ | 109,837 | | | $ | 2,592 | |
| Shares outstanding | | | — | | | | 6,177,971 | | | | 4,779,705 | | | | 91,047 | |
| Net asset value per share | | | — | | | $ | 23.04 | | | $ | 22.98 | | | $ | 28.46 | |
| Class I shares | | | | | | | | | | | | | | | | |
| Net assets | | $ | 89,264 | | | $ | 1,624,862 | | | $ | 285,790 | | | $ | 872,616 | |
| Shares outstanding | | | 6,995,018 | | | | 65,463,168 | | | | 10,562,505 | | | | 30,658,422 | |
| Net asset value per share | | $ | 12.76 | | | $ | 24.82 | | | $ | 27.06 | | | $ | 28.46 | |
| Class R6 shares | | | | | | | | | | | | | | | | |
| Net assets | | $ | 28,815 | | | $ | 324,466 | | | $ | 96,265 | | | $ | 393,492 | |
| Shares outstanding | | | 2,256,215 | | | | 13,040,665 | | | | 3,548,354 | | | | 13,818,824 | |
| Net asset value per share | | $ | 12.77 | | | $ | 24.88 | | | $ | 27.13 | | | $ | 28.48 | |
See accompanying Notes to Financial Statements.
| 94 | Semiannual Report | June 30, 2022 |
Statements of Operations
For the Period Ended June 30, 2022 (all amounts in thousands) (unaudited)
| | | Small-Mid
Cap Core
Fund | | | Small-Mid
Cap Growth
Fund | | | Small Cap
Growth
Fund | | | Small Cap
Value
Fund | |
| Investment income | | | | | | | | | | | | | | | | |
| Dividends | | $ | 521 | | | $ | 5,326 | | | $ | 1,253 | | | $ | 10,103 | |
| Less foreign tax withheld | | | (7 | ) | | | (53 | ) | | | (54 | ) | | | (20 | ) |
| Interest | | | 1 | | | | 8 | | | | 3 | | | | 2 | |
| Total income | | | 515 | | | | 5,281 | | | | 1,202 | | | | 10,085 | |
| Expenses | | | | | | | | | | | | | | | | |
| Investment advisory fees | | | 573 | | | | 12,393 | | | | 3,251 | | | | 5,304 | |
| Distribution fees | | | — | | | | 223 | | | | 174 | | | | 4 | |
| Custodian fees | | | 34 | | | | 49 | | | | 37 | | | | 34 | |
| Transfer agent fees | | | 2 | | | | 120 | | | | 46 | | | | 28 | |
| Sub-transfer agent fees | | | | | | | | | | | | | | | | |
| Class N | | | — | | | | 141 | | | | 104 | | | | 2 | |
| Class I | | | 50 | | | | 1,429 | | | | 191 | | | | 656 | |
| Professional fees | | | 15 | | | | 83 | | | | 34 | | | | 64 | |
| Registration fees | | | 15 | | | | 45 | | | | 37 | | | | 15 | |
| Shareholder reporting fees | | | — | | | | 59 | | | | 21 | | | | 31 | |
| Trustee fees | | | 2 | | | | 113 | | | | 24 | | | | 64 | |
| Other expenses | | | 16 | | | | 49 | | | | 15 | | | | 54 | |
| Total expenses before expense limitation | | | 707 | | | | 14,704 | | | | 3,934 | | | | 6,256 | |
| Expenses waived or reimbursed by the Adviser | | | | | | | | | | | | | | | | |
| Class N | | | — | | | | (89 | ) | | | (50 | ) | | | (1 | ) |
| Class I | | | (91 | ) | | | (848 | ) | | | (58 | ) | | | (171 | ) |
| Class R6 | | | (20 | ) | | | — | | | | — | | | | — | |
| Total expenses waived or reimbursed by the Adviser | | | (111 | ) | | | (937 | ) | | | (108 | ) | | | (172 | ) |
| Net expenses | | | 596 | | | | 13,767 | | | | 3,826 | | | | 6,084 | |
| Net investment income (loss) | | | (81 | ) | | | (8,486 | ) | | | (2,624 | ) | | | 4,001 | |
| Realized and unrealized gain (loss) | | | | | | | | | | | | | | | | |
| Net realized gain (loss) on transactions from: | | | | | | | | | | | | | | | | |
| Investments in securities | | | 1,742 | | | | 5,133 | | | | (1,213 | ) | | | 48,723 | |
| Redemptions in-kind | | | — | | | | 3,930 | | | | — | | | | 201,191 | |
| Total net realized gain (loss) | | | 1,742 | | | | 9,063 | | | | (1,213 | ) | | | 249,914 | |
| Change in net unrealized appreciation (depreciation) of: | | | | | | | | | | | | | | | | |
| Investments in securities | | | (32,286 | ) | | | (847,132 | ) | | | (194,692 | ) | | | (476,879 | ) |
| Change in net unrealized appreciation (depreciation) | | | (32,286 | ) | | | (847,132 | ) | | | (194,692 | ) | | | (476,879 | ) |
| Net increase (decrease) in net assets resulting from operations | | $ | (30,625 | ) | | $ | (846,555 | ) | | $ | (198,529 | ) | | $ | (222,964 | ) |
See accompanying Notes to Financial Statements.
| June 30, 2022 | William Blair Funds | 95 |
Statements of Changes in Net Assets
For the Period Ended June 30, 2022 (unaudited) and the Year Ended December 31, 2021 (all amounts in thousands)
| | | | | | | | | | | | | | | | | | | | | Small Cap Value Fund | |
| | | Small-Mid
Cap Core Fund | | | Small-Mid
Cap Growth Fund | | | Small Cap
Growth Fund | | | Period
Ended
June 30, | | | Period
Ended
December 31, | | | Year Ended
October 31, | |
| | | 2022 | | | 2021 | | | 2022 | | | 2021 | | | 2022 | | | 2021 | | | 2022 | | | 2021 (a) | | | 2021 | |
| Operations | | | | | | | | | | | | | | | | | | | | | | | | | | | | | | | | | | | | |
| Net investment income (loss) | | $ | (81 | ) | | $ | (88 | ) | | $ | (8,486 | ) | | $ | (26,790 | ) | | $ | (2,624 | ) | | $ | (7,225 | ) | | $ | 4,001 | | | $ | 1,951 | | | $ | 9,948 | |
| Net realized gain (loss) on investments, and other assets and liabilities | | | 1,742 | | | | 6,597 | | | | 9,063 | | | | 732,573 | | | | (1,213 | ) | | | 132,217 | | | | 249,914 | | | | 61,233 | | | | 239,708 | |
| Change in net unrealized appreciation (depreciation) on investments, and other assets and liabilities | | | (32,286 | ) | | | 6,181 | | | | (847,132 | ) | | | (416,628 | ) | | | (194,692 | ) | | | (38,580 | ) | | | (476,879 | ) | | | 23,828 | | | | 449,268 | |
| Net increase (decrease) in net assets resulting from operations | | | (30,625 | ) | | | 12,690 | | | | (846,555 | ) | | | 289,155 | | | | (198,529 | ) | | | 86,412 | | | | (222,964 | ) | | | 87,012 | | | | 698,924 | |
| Distributions to shareholders | | | | | | | | | | | | | | | | | | | | | | | | | | | | | | | | | | | | |
| Class N | | | — | | | | — | | | | — | | | | (21,416 | ) | | | — | | | | (32,137 | ) | | | — | | | | (117 | ) | | | — | (b) |
| Class I | | | — | | | | — | | | | — | | | | (214,965 | ) | | | — | | | | (64,470 | ) | | | — | | | | (40,018 | ) | | | (184,473 | ) |
| Class R6 | | | — | | | | — | | | | — | | | | (27,879 | ) | | | — | | | | (18,771 | ) | | | — | | | | (38,470 | ) | | | — | (b) |
| Total distributions | | | — | | | | — | | | | — | | | | (264,260 | ) | | | — | | | | (115,378 | ) | | | — | | | | (78,605 | ) | | | (184,473 | ) |
| Capital stock transactions | | | | | | | | | | | | | | | | | | | | | | | | | | | | | | | | | | | | |
| Proceeds from sale of shares | | | 71,501 | | | | 56,055 | | | | 319,373 | | | | 760,395 | | | | 83,407 | | | | 138,428 | | | | 104,754 | | | | 156,798 | | | | 1,256,445 | |
| Shares issued in connection with reorganization - See Note 1(b) | | | — | | | | — | | | | — | | | | — | | | | — | | | | — | | | | — | | | | — | | | | 45,734 | |
| Shares issued in reinvestment of income dividends and capital gain distributions | | | — | | | | — | | | | — | | | | 258,615 | | | | — | | | | 113,063 | | | | — | | | | 77,431 | | | | 181,788 | |
| Less cost of shares redeemed | | | (15,577 | ) | | | (6,010 | ) | | | (429,211 | ) | | | (1,572,925 | ) | | | (103,064 | ) | | | (187,055 | ) | | | (682,488 | ) | | | (193,465 | ) | | | (1,159,600 | ) |
| Net increase (decrease) in net assets resulting from capital share transactions | | | 55,924 | | | | 50,045 | | | | (109,838 | ) | | | (553,915 | ) | | | (19,657 | ) | | | 64,436 | | | | (577,734 | ) | | | 40,764 | | | | 324,367 | |
| Increase (decrease) in net assets | | | 25,299 | | | | 62,735 | | | | (956,393 | ) | | | (529,020 | ) | | | (218,186 | ) | | | 35,470 | | | | (800,698 | ) | | | 49,171 | | | | 838,818 | |
| Net assets | | | | | | | | | | | | | | | | | | | | | | | | | | | | | | | | | | | | |
| Beginning of period | | | 92,780 | | | | 30,045 | | | | 3,048,062 | | | | 3,577,082 | | | | 710,078 | | | | 674,608 | | | | 2,069,398 | | | | 2,020,227 | | | | 1,181,409 | |
| End of period | | $ | 118,079 | | | $ | 92,780 | | | $ | 2,091,669 | | | $ | 3,048,062 | | | $ | 491,892 | | | $ | 710,078 | | | $ | 1,268,700 | | | $ | 2,069,398 | | | $ | 2,020,227 | |
| (a) | For the period from November 1, 2021 to December 31, 2021. |
| (b) | For the period from July 17, 2021 (Commencement of Operations) to October 31, 2021. |
See accompanying Notes to Financial Statements.
| 96 | Semiannual Report | June 30, 2022 |
Statements of Assets and Liabilities
As of June 30, 2022 (dollar amounts in thousands) (unaudited)
| | | Global
Leaders
Fund | | | International
Leaders
Fund | | | International
Growth
Fund | | | Institutional
International
Growth
Fund | |
| Assets | | | | | | | | | | | | |
| Investments in securities, at cost | | $ | 71,104 | | | $ | 977,645 | | | $ | 1,277,522 | | | $ | 818,146 | |
| Investments in securities, at value | | $ | 94,304 | | | $ | 973,871 | | | $ | 1,464,604 | | | $ | 930,178 | |
| Foreign currency, at value (cost $9; $227; $579; $293) | | | 9 | | | | 227 | | | | 579 | | | | 294 | |
| Receivable for securities sold | | | 1,076 | | | | — | | | | 169 | | | | 110 | |
| Receivable for fund shares sold | | | 14 | | | | 5,717 | | | | 2,036 | | | | 107 | |
| Receivable from Adviser | | | 20 | | | | 87 | | | | 149 | | | | — | |
| Dividend and interest receivable | | | 184 | | | | 2,459 | | | | 5,978 | | | | 3,404 | |
| Total assets | | | 95,607 | | | | 982,361 | | | | 1,473,515 | | | | 934,093 | |
| Liabilities | | | | | | | | | | | | | | | | |
| Payable for fund shares redeemed | | | 21 | | | | 792 | | | | 761 | | | | 20 | |
| Management fee payable | | | 70 | | | | 704 | | | | 1,165 | | | | 709 | |
| Distribution fee payable | | | 2 | | | | 7 | | | | 42 | | | | — | |
| Foreign capital gains tax liability | | | 2 | | | | 540 | | | | 109 | | | | 8 | |
| Other payables and accrued expenses | | | 79 | | | | 227 | | | | 945 | | | | 415 | |
| Total liabilities | | | 174 | | | | 2,270 | | | | 3,022 | | | | 1,152 | |
| Net assets | | $ | 95,433 | | | $ | 980,091 | | | $ | 1,470,493 | | | $ | 932,941 | |
| Capital | | | | | | | | | | | | | | | | |
| Composition of net assets | | | | | | | | | | | | | | | | |
| Paid in capital | | $ | 69,578 | | | $ | 1,000,350 | | | $ | 1,119,902 | | | $ | 780,597 | |
| Total distributable earnings (loss) | | | 25,855 | | | | (20,259 | ) | | | 350,591 | | | | 152,344 | |
| Net assets | | $ | 95,433 | | | $ | 980,091 | | | $ | 1,470,493 | | | $ | 932,941 | |
| | | | | | | | | | | | | | | | | |
| Class N shares | | | | | | | | | | | | | | | | |
| Net assets | | $ | 8,673 | | | $ | 34,735 | | | $ | 195,767 | | | | — | |
| Shares outstanding | | | 655,329 | | | | 2,078,992 | | | | 7,516,637 | | | | — | |
| Net asset value per share | | $ | 13.23 | | | $ | 16.71 | | | $ | 26.04 | | | | — | |
| Class I shares | | | | | | | | | | | | | | | | |
| Net assets | | $ | 83,133 | | | $ | 386,886 | | | $ | 1,193,559 | | | | — | |
| Shares outstanding | | | 6,236,195 | | | | 23,004,090 | | | | 44,459,016 | | | | — | |
| Net asset value per share | | $ | 13.33 | | | $ | 16.82 | | | $ | 26.85 | | | | — | |
| Institutional/Class R6 shares | | | | | | | | | | | | | | | | |
| Net assets | | $ | 3,627 | | | $ | 558,470 | | | $ | 81,167 | | | $ | 932,941 | |
| Shares outstanding | | | 271,772 | | | | 33,193,200 | | | | 3,019,407 | | | | 70,683,628 | |
| Net asset value per share | | $ | 13.34 | | | $ | 16.82 | | | $ | 26.88 | | | $ | 13.20 | |
See accompanying Notes to Financial Statements.
| June 30, 2022 | William Blair Funds | 97 |
Statements of Operations
For the Period Ended June 30, 2022 (all amounts in thousands) (unaudited)
| | | Global
Leaders
Fund | | | International
Leaders
Fund | | | International
Growth
Fund | | | Institutional
International
Growth
Fund | |
| Investment income | | | | | | | | | | | | | | | | | | | |
| Dividends | | $ | 688 | | | | $ | 11,670 | | | | $ | 18,461 | | | | $ | 11,215 | |
| Less foreign tax withheld | | | (49 | ) | | | | (1,290 | ) | | | | (2,119 | ) | | | | (1,345 | ) |
| Other income | | | — | | | | | 4 | | | | | 6,390 | | | | | 2,812 | |
| Total income | | | 639 | | | | | 10,384 | | | | | 22,732 | | | | | 12,682 | |
| Expenses | | | | | | | | | | | | | | | | | | | |
| Investment advisory fees | | | 491 | | | | | 4,860 | | | | | 8,384 | | | | | 4,942 | |
| Distribution fees | | | 14 | | | | | 50 | | | | | 290 | | | | | — | |
| Custodian fees | | | 40 | | | | | 106 | | | | | 228 | | | | | 113 | |
| Transfer agent fees | | | 5 | | | | | 30 | | | | | 53 | | | | | 17 | |
| Sub-transfer agent fees | | | | | | | | | | | | | | | | | | | |
| Class N | | | 8 | | | | | 28 | | | | | 157 | | | | | — | |
| Class I | | | 38 | | | | | 271 | | | | | 706 | | | | | — | |
| Professional fees | | | 23 | | | | | 61 | | | | | 92 | | | | | 66 | |
| Registration fees | | | 23 | | | | | 47 | | | | | 34 | | | | | 12 | |
| Shareholder reporting fees | | | 2 | | | | | 14 | | | | | 37 | | | | | 4 | |
| Trustee fees | | | 4 | | | | | 41 | | | | | 77 | | | | | 44 | |
| Other expenses | | | 7 | | | | | 24 | | | | | 33 | | | | | 18 | |
| Total expenses before expense limitation | | | 655 | | | | | 5,532 | | | | | 10,091 | | | | | 5,216 | |
| Expenses waived or reimbursed by the Adviser | | | | | | | | | | | | | | | | | | | |
| Class N | | | (15 | ) | | | | (29 | ) | | | | (73 | ) | | | | — | |
| Class I | | | (103 | ) | | | | (285 | ) | | | | (192 | ) | | | | — | |
| Institutional/Class R6 | | | (4 | ) | | | | (183 | ) | | | | — | | | | | — | |
| Total expenses waived or reimbursed by the Adviser | | | (122 | ) | | | | (497 | ) | | | | (265 | ) | | | | — | |
| Net expenses | | | 533 | | | | | 5,035 | | | | | 9,826 | | | | | 5,216 | |
| Net investment income (loss) | | | 106 | | | | | 5,349 | | | | | 12,906 | | | | | 7,466 | |
| Realized and unrealized gain (loss) | | | | | | | | | | | | | | | | | | | |
| Net realized gain (loss) on transactions from: | | | | | | | | | | | | | | | | | | | |
| Investments in securities (net of foreign capital gains tax paid $— ; $140; $— ; $—) | | | 1,398 | | | | | (12,332 | ) | | | | 65,689 | | | | | 42,418 | |
| Foreign currency transactions | | | (3 | ) | | | | (512 | ) | | | | (347 | ) | | | | (248 | ) |
| Total net realized gain (loss) | | | 1,395 | | | | | (12,844 | ) | | | | 65,342 | | | | | 42,170 | |
| Change in net unrealized appreciation (depreciation) of: | | | | | | | | | | | | | | | | | | | |
| Investments in securities (net of foreign capital gains tax accrual $2; $(869); $(1,802); $(1,155)) | | | (45,438 | ) | | | | (429,446 | ) | | | | (725,106 | ) | | | | (438,912 | ) |
| Foreign currency translations | | | (8 | ) | | | | (84 | ) | | | | (198 | ) | | | | (102 | ) |
| Change in net unrealized appreciation (depreciation) | | | (45,446 | ) | | | | (429,530 | ) | | | | (725,304 | ) | | | | (439,014 | ) |
| Net increase (decrease) in net assets resulting from operations | | $ | (43,945 | ) | | | $ | (437,025 | ) | | | $ | (647,056 | ) | | | $ | (389,378 | ) |
See accompanying Notes to Financial Statements.
| 98 | Semiannual Report | June 30, 2022 |
Statements of Changes in Net Assets
For the Period Ended June 30, 2022 (unaudited) and the Year Ended December 31, 2021 (all amounts in thousands)
| | | Global
Leaders Fund | | | International
Leaders Fund | | | International
Growth Fund | | | Institutional
International
Growth Fund | |
| | | 2022 | | | 2021 | | | 2022 | | | 2021 | | | 2022 | | | 2021 | | | 2022 | | | 2021 | |
| Operations | | | | | | | | | | | | | | | | | | | | | | | | | | | | | | | | |
| Net investment income (loss) | | $ | 106 | | | $ | (460 | ) | | $ | 5,349 | | | $ | (2,629 | ) | | $ | 12,906 | | | $ | (9,181 | ) | | $ | 7,466 | | | $ | (2,879 | ) |
| Net realized gain (loss) on investments, and other assets and liabilities | | | 1,395 | | | | 9,127 | | | | (12,844 | ) | | | 39,090 | | | | 65,342 | | | | 332,710 | | | | 42,170 | | | | 172,547 | |
| Change in net unrealized appreciation (depreciation) on investments, and other assets and liabilities | | | (45,446 | ) | | | 12,186 | | | | (429,530 | ) | | | 79,811 | | | | (725,304 | ) | | | (124,200 | ) | | | (439,014 | ) | | | (51,592 | ) |
| Net increase (decrease) in net assets resulting from operations | | | (43,945 | ) | | | 20,853 | | | | (437,025 | ) | | | 116,272 | | | | (647,056 | ) | | | 199,329 | | | | (389,378 | ) | | | 118,076 | |
| Distributions to shareholders | | | | | | | | | | | | | | | | | | | | | | | | | | | | | |
| Class N | | | — | | | | (737 | ) | | | — | | | | (1,210 | ) | | | — | | | | (31,606 | ) | | | — | | | | — | |
| Class I | | | — | | | | (6,705 | ) | | | — | | | | (16,237 | ) | | | — | | | | (181,589 | ) | | | — | | | | — | |
| Institutional/Class R6 | | | — | | | | (299 | ) | | | — | | | | (18,646 | ) | | | — | | | | (13,865 | ) | | | — | | | | (181,394 | ) |
| Total distributions | | | — | | | | (7,741 | ) | | | — | | | | (36,093 | ) | | | — | | | | (227,060 | ) | | | — | | | | (181,394 | ) |
| Capital stock transactions | | | | | | | | | | | | | | | | | | | | | | | | | | | | |
| Proceeds from sale of shares | | | 3,523 | | | | 13,948 | | | | 279,562 | | | | 383,722 | | | | 153,639 | | | | 199,696 | | | | 119,961 | | | | 48,760 | |
| Shares issued in reinvestment of income dividends and capital gain distributions | | | — | | | | 7,707 | | | | — | | | | 35,670 | | | | — | | | | 211,018 | | | | — | | | | 181,112 | |
| Less cost of shares redeemed | | | (7,927 | ) | | | (13,167 | ) | | | (169,176 | ) | | | (293,194 | ) | | | (158,987 | ) | | | (572,736 | ) | | | (79,485 | ) | | | (211,193 | ) |
| Net increase (decrease) in net assets resulting from capital share transactions | | | (4,404 | ) | | | 8,488 | | | | 110,386 | | | | 126,198 | | | | (5,348 | ) | | | (162,022 | ) | | | 40,476 | | | | 18,679 | |
| Increase (decrease) in net assets | | | (48,349 | ) | | | 21,600 | | | | (326,639 | ) | | | 206,377 | | | | (652,404 | ) | | | (189,753 | ) | | | (348,902 | ) | | | (44,639 | ) |
| Net assets | | | | | | | | | | | | | | | | | | | | | | | | | | | | | | | | |
| Beginning of period | | | 143,782 | | | | 122,182 | | | | 1,306,730 | | | | 1,100,353 | | | | 2,122,897 | | | | 2,312,650 | | | | 1,281,843 | | | | 1,326,482 | |
| End of period | | $ | 95,433 | | | $ | 143,782 | | | $ | 980,091 | | | $ | 1,306,730 | | | $ | 1,470,493 | | | $ | 2,122,897 | | | $ | 932,941 | | | $ | 1,281,843 | |
See accompanying Notes to Financial Statements.
| June 30, 2022 | William Blair Funds | 99 |
Statements of Assets and Liabilities
As of June 30, 2022 (dollar amounts in thousands) (unaudited)
| | | International
Small Cap
Growth
Fund | | | Emerging
Markets
Leaders
Fund | | | Emerging
Markets
Growth
Fund | | | Emerging
Markets
Small Cap
Growth Fund | |
| Assets | | | | | | | | | | | | | | | | |
| Investments in securities, at cost | | $ | 275,221 | | | $ | 434,653 | | | $ | 685,878 | | | $ | 364,928 | |
| Investments in securities, at value | | $ | 235,725 | | | $ | 392,823 | | | $ | 697,361 | | | $ | 332,568 | |
| Foreign currency, at value (cost $27; $2,121; $3,360; $2,473) | | | 27 | | | | 2,121 | | | | 3,350 | | | | 2,452 | |
| Receivable for securities sold | | | 2,232 | | | | 1,389 | | | | 20,163 | | | | 2,653 | |
| Receivable for fund shares sold | | | 96 | | | | 128 | | | | 3,544 | | | | 351 | |
| Receivable from Adviser | | | — | | | | 40 | | | | 34 | | | | 32 | |
| Dividend and interest receivable | | | 678 | | | | 1,499 | | | | 2,474 | | | | 329 | |
| Total assets | | | 238,758 | | | | 398,000 | | | | 726,926 | | | | 338,385 | |
| Liabilities | | | | | | | | | | | | | | | | |
| Payable for securities purchased | | | 2,865 | | | | — | | | | — | | | | 455 | |
| Payable for fund shares redeemed | | | 108 | | | | 25 | | | | 45 | | | | 325 | |
| Management fee payable | | | 202 | | | | 312 | | | | 567 | | | | 318 | |
| Distribution fee payable | | | — | | | | — | | | | 4 | | | | 1 | |
| Foreign capital gains tax liability | | | — | | | | 714 | | | | 449 | | | | — | |
| Other payables and accrued expenses | | | 150 | | | | 333 | | | | 604 | | | | 319 | |
| Total liabilities | | | 3,325 | | | | 1,384 | | | | 1,669 | | | | 1,418 | |
| Net assets | | $ | 235,433 | | | $ | 396,616 | | | $ | 725,257 | | | $ | 336,967 | |
| Capital | | | | | | | | | | | | | | | | |
| Composition of net assets | | | | | | | | | | | | | | | | |
| Paid in capital | | $ | 299,841 | | | $ | 477,796 | | | $ | 725,803 | | | $ | 370,973 | |
| Total distributable earnings (loss) | | | (64,408 | ) | | | (81,180 | ) | | | (546 | ) | | | (34,006 | ) |
| Net assets | | $ | 235,433 | | | $ | 396,616 | | | $ | 725,257 | | | $ | 336,967 | |
| | | | | | | | | | | | | | | | | |
| Class N shares | | | | | | | | | | | | | | | | |
| Net assets | | $ | 1,874 | | | $ | 937 | | | $ | 18,168 | | | $ | 3,237 | |
| Shares outstanding | | | 185,319 | | | | 107,992 | | | | 1,623,683 | | | | 188,810 | |
| Net asset value per share | | $ | 10.11 | | | $ | 8.67 | | | $ | 11.19 | | | $ | 17.15 | |
| Class I shares | | | | | | | | | | | | | | | | |
| Net assets | | $ | 91,547 | | | $ | 43,103 | | | $ | 194,090 | | | $ | 124,190 | |
| Shares outstanding | | | 8,910,476 | | | | 4,957,495 | | | | 16,994,477 | | | | 7,150,079 | |
| Net asset value per share | | $ | 10.27 | | | $ | 8.69 | | | $ | 11.42 | | | $ | 17.37 | |
| Class R6 shares | | | | | | | | | | | | | | | | |
| Net assets | | $ | 142,012 | | | $ | 352,576 | | | $ | 512,999 | | | $ | 209,540 | |
| Shares outstanding | | | 13,726,511 | | | | 40,593,291 | | | | 44,386,709 | | | | 12,036,532 | |
| Net asset value per share | | $ | 10.35 | | | $ | 8.69 | | | $ | 11.56 | | | $ | 17.41 | |
See accompanying Notes to Financial Statements.
| 100 | Semiannual Report | June 30, 2022 |
Statements of Operations
For the Period Ended June 30, 2022 (all amounts in thousands) (unaudited)
| | International
Small Cap
Growth
Fund | | | Emerging
Markets
Leaders
Fund | | | Emerging
Markets
Growth
Fund | | | Emerging
Markets
Small Cap
Growth Fund | |
| Investment income | | | | | | | | | | | | | | | | | | | |
| Dividends | | $ | 3,164 | | | | $ | 4,757 | | | | $ | 8,358 | | | | $ | 4,094 | |
| Less foreign tax withheld | | | (358 | ) | | | | (520 | ) | | | | (964 | ) | | | | (463 | ) |
| Other income | | | 5 | | | | | 1 | | | | | 2 | | | | | — | |
| Total income | | | 2,811 | | | | | 4,238 | | | | | 7,396 | | | | | 3,631 | |
| Expenses | | | | | | | | | | | | | | | | | | | |
| Investment advisory fees | | | 1,448 | | | | | 2,226 | | | | | 4,497 | | | | | 2,299 | |
| Distribution fees | | | 3 | | | | | 2 | | | | | 28 | | | | | 5 | |
| Custodian fees | | | 73 | | | | | 98 | | | | | 252 | | | | | 206 | |
| Transfer agent fees | | | 11 | | | | | 10 | | | | | 30 | | | | | 19 | |
| Sub-transfer agent fees | | | | | | | | | | | | | | | | | | | |
| Class N | | | 1 | | | | | 1 | | | | | 15 | | | | | 3 | |
| Class I | | | 58 | | | | | 17 | | | | | 97 | | | | | 67 | |
| Professional fees | | | 37 | | | | | 44 | | | | | 90 | | | | | 85 | |
| Registration fees | | | 26 | | | | | 33 | | | | | 46 | | | | | 25 | |
| Shareholder reporting fees | | | 9 | | | | | 4 | | | | | 7 | | | | | 9 | |
| Trustee fees | | | 12 | | | | | 12 | | | | | 39 | | | | | 14 | |
| Other expenses | | | 10 | | | | | 10 | | | | | 20 | | | | | 13 | |
| Total expenses before expense limitation | | | 1,688 | | | | | 2,457 | | | | | 5,121 | | | | | 2,745 | |
| Expenses waived or reimbursed by the Adviser | | | | | | | | | | | | | | | | | | | |
| Class N | | | — | | | | | (1 | ) | | | | (8 | ) | | | | (2 | ) |
| Class I | | | — | | | | | (28 | ) | | | | (30 | ) | | | | (51 | ) |
| Class R6 | | | — | | | | | (189 | ) | | | | — | | | | | (38 | ) |
| Total expenses waived or reimbursed by the Adviser | | | — | | | | | (218 | ) | | | | (38 | ) | | | | (91 | ) |
| Net expenses | | | 1,688 | | | | | 2,239 | | | | | 5,083 | | | | | 2,654 | |
| Net investment income (loss) | | | 1,123 | | | | | 1,999 | | | | | 2,313 | | | | | 977 | |
| Realized and unrealized gain (loss) | | | | | | | | | | | | | | | | | | | |
| Net realized gain (loss) on transactions from: | | | | | | | | | | | | | | | | | | | |
| Investments in securities (net of foreign capital gains tax paid $— ; $389; $698; $1,603) | | | (21,894 | ) | | | | (34,752 | ) | | | | (4,168 | ) | | | | (12,527 | ) |
| Foreign currency transactions | | | (139 | ) | | | | (165 | ) | | | | (852 | ) | | | | (325 | ) |
| Total net realized gain (loss) | | | (22,033 | ) | | | | (34,917 | ) | | | | (5,020 | ) | | | | (12,852 | ) |
| Change in net unrealized appreciation (depreciation) of: | | | | | | | | | | | | | | | | | | | |
| Investments in securities (net of foreign capital gains tax accrual $—; $(2,025); $(7,221); $(5,681)) | | | (128,360 | ) | | | | (79,953 | ) | | | | (284,354 | ) | | | | (120,649 | ) |
| Foreign currency translations | | | (33 | ) | | | | (14 | ) | | | | (63 | ) | | | | (36 | ) |
| Change in net unrealized appreciation (depreciation) | | | (128,393 | ) | | | | (79,967 | ) | | | | (284,417 | ) | | | | (120,685 | ) |
| Net increase (decrease) in net assets resulting from operations | | $ | (149,303 | ) | | | $ | (112,885 | ) | | | $ | (287,124 | ) | | | $ | (132,560 | ) |
See accompanying Notes to Financial Statements.
| June 30, 2022 | William Blair Funds | 101 |
Statements of Changes in Net Assets
For the Period Ended June 30, 2022 (unaudited) and the Year Ended December 31, 2021 (all amounts in thousands)
| | | International Small
Cap Growth Fund | | | Emerging Markets
Leaders Fund | | | Emerging Markets
Growth Fund | | | Emerging Markets
Small Cap Growth Fund | |
| | | | 2022 | | | | 2021 | | | | 2022 | | | | 2021 | | | | 2022 | | | | 2021 | | | | 2022 | | | | 2021 | |
| Operations | | | | | | | | | | | | | | | | | | | | | | | | | | | | | | | | |
| Net investment income (loss) | | $ | 1,123 | | | $ | (1,285 | ) | | $ | 1,999 | | | $ | (611 | ) | | $ | 2,313 | | | $ | (3,469 | ) | | $ | 977 | | | $ | (2,297 | ) |
| Net realized gain (loss) on investments, and other assets and liabilities | | | (22,033 | ) | | | 50,965 | | | | (34,917 | ) | | | 30,340 | | | | (5,020 | ) | | | 192,407 | | | | (12,852 | ) | | | 57,364 | |
| Change in net unrealized appreciation (depreciation) on investments, and other assets and liabilities | | | (128,393 | ) | | | (13,255 | ) | | | (79,967 | ) | | | (58,106 | ) | | | (284,417 | ) | | | (147,125 | ) | | �� | (120,685 | ) | | | (1,751 | ) |
| Net increase (decrease) in net assets resulting from operations | | | (149,303 | ) | | | 36,425 | | | | (112,885 | ) | | | (28,377 | ) | | | (287,124 | ) | | | 41,813 | | | | (132,560 | ) | | | 53,316 | |
| Distributions to shareholders | | | | | | | | | | | | | | | | | | | | | | | | | | | |
| Class N | | | — | | | | (504 | ) | | | — | | | | (114 | ) | | | — | | | | (5,480 | ) | | | — | | | | (333 | ) |
| Class I | | | — | | | | (20,759 | ) | | | — | | | | (3,247 | ) | | | — | | | | (30,440 | ) | | | — | | | | (13,825 | ) |
| Class R6 | | | — | | | | (34,265 | ) | | | — | | | | (32,392 | ) | | | — | | | | (144,353 | ) | | | — | | | | (26,855 | ) |
| Total distributions | | | — | | | | (55,528 | ) | | | — | | | | (35,753 | ) | | | — | | | | (180,273 | ) | | | — | | | | (41,013 | ) |
| Capital stock transactions | | | | | | | | | | | | | | | | | | | | | | | | | | | | | | | | |
| Proceeds from sale of shares | | | 24,344 | | | | 65,065 | | | | 65,827 | | | | 407,452 | | | | 178,572 | | | | 303,585 | | | | 66,110 | | | | 242,540 | |
| Shares issued in reinvestment of income dividends and capital gain distributions | | | — | | | | 49,466 | | | | — | | | | 35,512 | | | | — | | | | 167,335 | | | | — | | | | 40,338 | |
| Less cost of shares redeemed | | | (23,119 | ) | | | (48,798 | ) | | | (30,011 | ) | | | (167,286 | ) | | | (208,029 | ) | | | (486,358 | ) | | | (96,991 | ) | | | (102,182 | ) |
| Net increase (decrease) in net assets resulting from capital share transactions | | | 1,225 | | | | 65,733 | | | | 35,816 | | | | 275,678 | | | | (29,457 | ) | | | (15,438 | ) | | | (30,881 | ) | | | 180,696 | |
| Increase (decrease) in net assets | | | (148,078 | ) | | | 46,630 | | | | (77,069 | ) | | | 211,548 | | | | (316,581 | ) | | | (153,898 | ) | | | (163,441 | ) | | | 192,999 | |
| Net assets | | | | | | | | | | | | | | | | | | | | | | | | | | | | | | | | |
| Beginning of period | | | 383,511 | | | | 336,881 | | | | 473,685 | | | | 262,137 | | | | 1,041,838 | | | | 1,195,736 | | | | 500,408 | | | | 307,409 | |
| End of period | | $ | 235,433 | | | $ | 383,511 | | | $ | 396,616 | | | $ | 473,685 | | | $ | 725,257 | | | $ | 1,041,838 | | | $ | 336,967 | | | $ | 500,408 | |
See accompanying Notes to Financial Statements.
| 102 | Semiannual Report | June 30, 2022 |
Statements of Assets and Liabilities
As of June 30, 2022 (dollar amounts in thousands) (unaudited)
| | | China
Growth
Fund | | | Emerging
Markets
Debt
Fund | | | Macro
Allocation
Fund (In
Liquidation) | |
| Assets | | | | | | | | | | | | | |
| Investments in securities, at cost | | $ | 4,353 | | | $ | 49,628 | | | | $ | — | |
| Repurchase agreement, at cost | | | — | | | | 3,343 | | | | | 22,881 | |
| Investments in securities, at value | | $ | 3,676 | | | $ | 39,522 | | | | $ | — | |
| Repurchase agreement, at value | | | — | | | | 3,343 | | | | | 22,881 | |
| Cash | | | 32 | | | | — | | | | | — | |
| Foreign currency, at value (cost $6; $—; $—) | | | 6 | | | | — | | | | | — | |
| Segregated cash at broker | | | — | | | | 337 | | | | | — | |
| Receivable for securities sold | | | — | | | | 162 | | | | | — | |
| Receivable for fund shares sold | | | — | | | | 25 | | | | | 1 | |
| Receivable for variation margin on centrally cleared swaps | | | — | | | | 2 | | | | | — | |
| Receivable from Adviser | | | 13 | | | | 22 | | | | | 29 | |
| Dividend and interest receivable | | | 1 | | | | 882 | | | | | — | |
| Unrealized appreciation on forward foreign currency contracts | | | — | | | | 47 | | | | | — | |
| Total assets | | | 3,728 | | | | 44,342 | | | | | 22,911 | |
| Liabilities | | | | | | | | | | | | | |
| Payable for securities purchased | | | — | | | | 415 | | | | | — | |
| Payable for fund shares redeemed | | | — | | | | 20 | | | | | 165 | |
| Unrealized depreciation on forward foreign currency contracts | | | — | | | | 2 | | | | | — | |
| Management fee payable | | | 3 | | | | 24 | | | | | 20 | |
| Distribution fee payable | | | — | | | | — | | | | | 1 | |
| Other payables and accrued expenses | | | 15 | | | | 33 | | | | | 124 | |
| Total liabilities | | | 18 | | | | 494 | | | | | 310 | |
| Net assets | | $ | 3,710 | | | $ | 43,848 | | | | $ | 22,601 | |
| Capital | | | | | | | | | | | | | |
| Composition of net assets | | | | | | | | | | | | | |
| Paid in capital | | $ | 5,752 | | | $ | 58,553 | | | | $ | 202,859 | |
| Total distributable earnings (loss) | | | (2,042 | ) | | | (14,705 | ) | | | | (180,258 | ) |
| Net assets | | $ | 3,710 | | | $ | 43,848 | | | | $ | 22,601 | |
| | | | | | | | | | | | | | |
| Class N shares | | | | | | | | | | | | | |
| Net assets | | | — | | | | — | | | | $ | 3,826 | |
| Shares outstanding | | | — | | | | — | | | | | 357,799 | |
| Net asset value per share | | | — | | | | — | | | | $ | 10.69 | |
| Class I shares | | | | | | | | | | | | | |
| Net assets | | $ | 2,350 | | | $ | 883 | | | | $ | 18,647 | |
| Shares outstanding | | | 302,404 | | | | 119,712 | | | | | 1,755,082 | |
| Net asset value per share | | $ | 7.77 | | | $ | 7.38 | | | | $ | 10.62 | |
| Class R6 shares | | | | | | | | | | | | | |
| Net assets | | $ | 1,360 | | | $ | 42,965 | | | | $ | 128 | |
| Shares outstanding | | | 175,048 | | | | 5,825,953 | | | | | 12,063 | |
| Net asset value per share | | $ | 7.77 | | | $ | 7.37 | | | | $ | 10.62 | |
See accompanying Notes to Financial Statements.
| June 30, 2022 | William Blair Funds | 103 |
Statements of Operations
For the Period Ended June 30, 2022 (all amounts in thousands) (unaudited)
| | | | | | Emerging | | | Macro | |
| | | China | | | Markets | | | Allocation | |
| | | Growth | | | Debt | | | Fund (In | |
| | | Fund | | | Fund | | | Liquidation) | |
| Investment income | | | | | | | | | | | | |
| Dividends | | $ | 41 | | | $ | — | | | $ | 475 | |
| Less foreign tax withheld | | | (1 | ) | | | — | | | | (16 | ) |
| Interest | | | — | | | | 1,570 | | | | 62 | |
| Total income | | | 40 | | | | 1,570 | | | | 521 | |
| | | | | | | | | | | | | |
| Expenses | | | | | | | | | | | | |
| Investment advisory fees | | | 26 | | | | 154 | | | | 531 | |
| Distribution fees | | | — | | | | — | | | | 6 | |
| Custodian fees | | | 40 | | | | 60 | | | | 105 | |
| Transfer agent fees | | | 1 | | | | 1 | | | | 12 | |
| Sub-transfer agent fees | | | | | | | | | | | | |
| Class N | | | — | | | | — | | | | 3 | |
| Class I | | | 1 | | | | — | | | | 24 | |
| Professional fees | | | 18 | | | | 21 | | | | 15 | |
| Registration fees | | | 8 | | | | 17 | | | | 7 | |
| Shareholder reporting fees | | | — | | | | 1 | | | | 2 | |
| Trustee fees | | | — | | | | 2 | | | | 12 | |
| Other expenses | | | 1 | | | | 3 | | | | 18 | |
| Interest expense | | | — | | | | — | | | | 28 | |
| Total expenses before expense limitation | | | 95 | | | | 259 | | | | 763 | |
| Expenses waived or reimbursed by the Adviser | | | | | | | | | | | | |
| Class N | | | — | | | | — | | | | (7 | ) |
| Class I | | | (49 | ) | | | (3 | ) | | | (49 | ) |
| Class R6 | | | (18 | ) | | | (101 | ) | | | (30 | ) |
| Total expenses waived or reimbursed by the Adviser | | | (67 | ) | | | (104 | ) | | | (86 | ) |
| Net expenses | | | 28 | | | | 155 | | | | 677 | |
| Net investment income (loss) | | | 12 | | | | 1,415 | | | | (156 | ) |
| Realized and unrealized gain (loss) | | | | | | | | | | | | |
| Net realized gain (loss) on transactions from: | | | | | | | | | | | | |
| Investments in securities | | | (1,332 | ) | | | (5,169 | ) | | | 7,983 | |
| Options | | | — | | | | — | | | | (2,753 | ) |
| Futures contracts | | | — | | | | — | | | | 14,239 | |
| Swaps | | | — | | | | 471 | | | | (2,085 | ) |
| Forward foreign currency contracts | | | — | | | | 150 | | | | (496 | ) |
| Foreign currency transactions | | | (5 | ) | | | 3 | | | | (100 | ) |
| Total net realized gain (loss) | | | (1,337 | ) | | | (4,545 | ) | | | 16,788 | |
| Change in net unrealized appreciation (depreciation) of: | | | | | | | | | | | | |
| Investments in securities | | | (246 | ) | | | (8,102 | ) | | | (21,195 | ) |
| Futures contracts | | | — | | | | — | | | | 1,592 | |
| Swaps | | | — | | | | 136 | | | | (126 | ) |
| Forward foreign currency contracts | | | — | | | | 71 | | | | 1,857 | |
| Foreign currency translations | | | — | | | | 14 | | | | 47 | |
| Change in net unrealized appreciation (depreciation) | | | (246 | ) | | | (7,881 | ) | | | (17,825 | ) |
| Net increase (decrease) in net assets resulting from operations | | $ | (1,571 | ) | | $ | (11,011 | ) | | $ | (1,193 | ) |
See accompanying Notes to Financial Statements.
| 104 | Semiannual Report | June 30, 2022 |
Statements of Changes in Net Assets
For the Period Ended June 30, 2022 (unaudited) and the Year Ended December 31, 2021 (all amounts in thousands)
| | | China Growth Fund | | | Emerging Markets
Debt Fund | | | Macro Allocation Fund
(In Liquidation) | |
| | | 2022 | | | 2021(a) | | | 2022 | | | 2021(b) | | | 2022 | | | 2021 | |
| Operations | | | | | | | | | | | | | | | | | | | | | | | | |
| Net investment income (loss) | | $ | 12 | | | $ | (14 | ) | | $ | 1,415 | | | $ | 1,200 | | | $ | (156 | ) | | $ | 2,133 | |
| Net realized gain (loss) on investments, and other assets and liabilities | | | (1,337 | ) | | | (39 | ) | | | (4,545 | ) | | | (227 | ) | | | 16,788 | | | | 40,148 | |
| Change in net unrealized appreciation (depreciation) on investments, and other assets and liabilities | | | (246 | ) | | | (431 | ) | | | (7,881 | ) | | | (1,954 | ) | | | (17,825 | ) | | | (35,584 | ) |
| Net increase (decrease) in net assets resulting from operations | | | (1,571 | ) | | | (484 | ) | | | (11,011 | ) | | | (981 | ) | | | (1,193 | ) | | | 6,697 | |
| Distributions to shareholders | | | | | | | | | | | | | | | | | | | | | | | | |
| Class N | | | — | | | | — | | | | — | | | | — | | | | — | | | | (149 | ) |
| Class I | | | — | | | | — | | | | (41 | ) | | | (35 | ) | | | — | | | | (1,803 | ) |
| Class R6 | | | — | | | | — | | | | (1,409 | ) | | | (1,228 | ) | | | — | | | | (2,923 | ) |
| Total distributions | | | — | | | | — | | | | (1,450 | ) | | | (1,263 | ) | | | — | | | | (4,875 | ) |
| Capital stock transactions | | | | | | | | | | | | | | | | | | | | | | | | |
| Proceeds from sale of shares | | | 134 | | | | 7,722 | | | | 4,218 | | | | 52,600 | | | | 4,407 | | | | 17,989 | |
| Shares issued in reinvestment of income dividends and capital gain distributions | | | — | | | | — | | | | 1,435 | | | | 1,275 | | | | — | | | | 4,799 | |
| Less cost of shares redeemed | | | (2,078 | ) | | | (13 | ) | | | (838 | ) | | | (137 | ) | | | (169,409 | ) | | | (189,529 | ) |
| Net increase (decrease) in net assets resulting from capital share transactions | | | (1,944 | ) | | | 7,709 | | | | 4,815 | | | | 53,738 | | | | (165,002 | ) | | | (166,741 | ) |
| Increase (decrease) in net assets | | | (3,515 | ) | | | 7,225 | | | | (7,646 | ) | | | 51,494 | | | | (166,195 | ) | | | (164,919 | ) |
| Net assets | | | | | | | | | | | | | | | | | | | | | | | | |
| Beginning of period | | | 7,225 | | | | — | | | | 51,494 | | | | — | | | | 188,796 | | | | 353,715 | |
| End of period | | $ | 3,710 | | | $ | 7,225 | | | $ | 43,848 | | | $ | 51,494 | | | $ | 22,601 | | | $ | 188,796 | |
| (a) | For the period from August 27, 2021 (Commencement of Operations) to December 31, 2021. |
| (b) | For the period from May 25, 2021 (Commencement of Operations) to December 31, 2021. |
See accompanying Notes to Financial Statements.
| June 30, 2022 | William Blair Funds | 105 |
Notes to Financial Statements (information as of June 30, 2022 is unaudited)
(1) Organization
(a) Description of the Trust
William Blair Funds (the “Trust”) is a Delaware statutory trust registered under the Investment Company Act of 1940, as amended (the “1940 Act”), as an open-end management investment company. As of the date of this report, the Trust has the following nineteen funds (the “Funds”) available for sale, each with its own investment objective and policies. For each Fund, the number of shares authorized is unlimited.
U.S. Equity Funds Growth Large Cap Growth Mid Cap Growth Mid Cap Value Small-Mid Cap Core Small-Mid Cap Growth Small Cap Growth Small Cap Value | | Global Equity Fund Global Leaders International Equity Funds International Leaders International Growth Institutional International Growth International Small Cap Growth Emerging Markets Leaders Emerging Markets Growth Emerging Markets Small Cap Growth China Growth | | Emerging Markets Debt Fund Emerging Markets Debt Multi-Asset and Alternative Fund Macro Allocation |
William Blair Investment Management, LLC (the “Adviser”) serves as the Trust’s investment adviser. William Blair & Company, L.L.C. (“WBC” or the “Distributor”), an affiliate of the Adviser, serves as the Trust’s principal underwriter and distributor.
(b) Reorganization of Small Cap Value Fund
In connection with the Adviser’s acquisition of Investment Counselors of Maryland, LLC (“ICM”), the Board of Trustees of the Trust and the Board of Trustees of The Advisors’ Inner Circle Fund (“AIC”) approved a reorganization of the ICM Small Company Portfolio (“Predecessor Fund”), a series of AIC advised by ICM, into the Small Cap Value Fund (“SCV Fund”) (the “Reorganization”), pursuant to which the SCV Fund acquired all assets and assumed all liabilities of the Predecessor Fund in exchange for Class I shares of the SCV Fund. The tax-free reorganization occurred on July 16, 2021. The SCV Fund is the surviving entity for legal and tax purposes and has maintained a tax year end of December 31. The Predecessor Fund is the accounting survivor for financial reporting purposes. As a result, the statement of changes in net assets and Class I financial highlights for the periods prior to the merger date reflect the operations of the Predecessor Fund. The performance and accounting history for Class N and Class R6 shares of the reorganized SCV Fund began effective July 17, 2021.
The following is a summary of shares outstanding, net assets, net asset value per share and unrealized appreciation (depreciation) immediately before and after the tax-free reorganization (dollar amounts are in thousands):
| | | Before
Reorganization | | After
Reorganization |
| | | Small Cap
Value Fund | | ICM Small
Company Portfolio | | Small Cap
Value Fund |
| Class N | | | | | | | | | | | | |
| Shares outstanding | | | 317,775 | (a) | | | N/A | | | | 317,775 | |
| Net assets | | $ | 10,216 | | | | N/A | | | $ | 10,216 | |
| Net asset value | | $ | 32.15 | (a) | | | N/A | | | $ | 32.15 | |
| Class I / Institutional Class | | | | | | | | | | | | |
| Shares outstanding | | | 760,891 | (b) | | | 59,609,442 | | | | 60,370,333 | |
| Net assets | | $ | 24,461 | | | $ | 1,916,342 | | | $ | 1,940,803 | |
| Net asset value | | $ | 32.15 | (b) | | $ | 32.15 | | | $ | 32.15 | |
| 106 | Semiannual Report | June 30, 2022 |
Notes to Financial Statements (information as of June 30, 2022 is unaudited)
| | | Before
Reorganization | | After
Reorganization |
| | | Small Cap
Value Fund | | ICM Small
Company Portfolio | | Small Cap
Value Fund |
| Class R6 | | | | | | | | | | | | |
| Shares outstanding | | | 343,951 | (c) | | | N/A | | | | 343,951 | |
| Net assets | | $ | 11,057 | | | | N/A | | | $ | 11,057 | |
| Net asset value | | $ | 32.15 | (c) | | | N/A | | | $ | 32.15 | |
| Total | | | | | | | | | | | | |
| Net assets | | $ | 45,734 | | | $ | 1,916,342 | | | $ | 1,962,076 | |
| Cost of long-term investments | | $ | 46,200 | | | $ | 1,499,746 | | | $ | 1,545,946 | |
| Unrealized appreciation (depreciation) | | $ | (834 | ) | | $ | 398,015 | | | $ | 397,181 | |
| (a) | Reflects a 0.454985-for-1 stock split which occurred immediately prior to the reorganization on July 16, 2021. |
| (b) | Reflects a 0.474218-for-1 stock split which occurred immediately prior to the reorganization on July 16, 2021. |
| (c) | Reflects a 0.473845-for-1 stock split which occurred immediately prior to the reorganization on July 16, 2021. |
Assuming the reorganization had been completed on November 1, 2020, the SCV Fund’s results of operations for the year ended October 31, 2021 would have been as follows (in thousands):
| Net investment income | | $ | 10,239 | |
| Net realized and unrealized gain (loss) on investments | | | 706,989 | |
| Net increase in net assets resulting from operations | | $ | 717,228 | |
Because the combined investment portfolios have been managed as a single portfolio since the reorganization was completed, it is not practical to separate the amounts of revenue and earnings to the SCV Fund that have been included in its Statement of Operations since the reorganization.
For financial reporting purposes, assets received and shares issued by the SCV Fund were recorded at fair value; however, the cost basis of the investments from the Predecessor Fund was carried forward to align ongoing reporting of the SCV Fund’s realized and unrealized gains and losses with amounts distributable to shareholders for tax purposes.
(c) Share Classes
Each Fund is comprised of Class N, Class I and Class R6 shares, except the Mid Cap Value, Small-Mid Cap Core, China Growth and Emerging Markets Debt Funds, which are comprised of Class I and Class R6 shares, and Institutional International Growth Fund, which does not offer multiple classes of shares.
Class N shares are available to the general public, either directly through the Trust’s distributor or through a select number of financial intermediaries. Class N shares are sold without any sales load and carry an annual 12b-1 distribution fee at a fixed rate (0.25% for all Funds as discussed in Note 4(b) – Transactions with Affiliates – Underwriting and Distribution Services Agreements) and a sub-transfer agent fee that is not a fixed rate and varies by Fund and class, as discussed below.
Class I shares are available to certain retirement and deferred compensation plans, clients of certain financial intermediaries, and asset-based fee advisory clients of William Blair. The minimum initial investment for a Class I account is $500,000, subject to certain exceptions. Class I shares do not carry any sales load or distribution fees and generally have lower ongoing expenses than Class N shares. Class I shares have a sub-transfer agent fee that is not a fixed rate and varies by Fund and class, as discussed below.
Class R6 shares are available to certain retirement and deferred compensation plans, clients of certain financial intermediaries, asset-based fee advisory clients of William Blair, and additional types of investors, provided that neither the investor nor the financial intermediary requires the Funds to make any type of servicing or administrative payment. The minimum initial investment for a Class R6 account is $1 million, subject to certain exceptions.
| June 30, 2022 | William Blair Funds | 107 |
Notes to Financial Statements (information as of June 30, 2022 is unaudited)
Shares of the Institutional International Growth Fund require a minimum initial investment of $5 million, subject to certain exceptions.
Class R6 shares and the Institutional International Growth Fund do not carry any sales load, distribution fees or sub-transfer agent fees. Class R6 shares of a Fund generally have lower ongoing expenses than the Fund’s Class N and Class I shares.
Sub-transfer agent fees: For Class N and Class I shares, the Funds may reimburse WBC for fees paid to intermediaries such as banks, broker-dealers, financial advisers or other financial institutions for sub-administration, sub-transfer agency and other services provided to investors whose shares of record are held in omnibus, other group accounts, retirement plans or accounts traded through registered securities clearing agents. These fees may vary based on, for example, the nature of services provided, but generally range up to 0.15% of the assets of the class serviced or maintained by the intermediary or up to $15 per sub-account maintained by the intermediary, depending on the method by which the intermediary charges for the services.
(d) Fund Objectives
The investment objectives of the Funds are as follows:
| U.S. Equity Funds | | Long-term capital appreciation. |
| Global Equity Fund | | Long-term capital appreciation. |
| International Equity Funds | | Long-term capital appreciation. |
| Emerging Markets Debt Fund | | Provide attractive risk-adjusted returns relative to the Fund’s benchmark through investments in hard currency denominated debt issued in emerging market countries. |
| Macro Allocation Fund | | Maximize long-term risk-adjusted total return. |
(2) Significant Accounting Policies
The following is a summary of the Trust’s significant accounting policies in effect during the periods covered by the financial statements, which are in accordance with U.S. generally accepted accounting principles (“US GAAP”), which includes the accounting and reporting guidelines under Accounting Standards Topic 946, Financial Services—Investment Companies.
(a) Investment income and transactions
Investment income, realized and unrealized gains and losses, and certain Fund level expenses and expense reductions, if any, are allocated based on the relative net assets of each class, except for certain class-specific expenses, which are charged directly to the appropriate class. Differences in class expenses may result in the payment of different per share dividends by class. All share classes of the Funds have equal rights with respect to voting, subject to class specific arrangements.
Dividend income and expenses are recorded on the ex-dividend date, except for those dividends from certain foreign securities that are recorded when the information is available.
Interest income is recorded on an accrual basis, adjusted for amortization of premium or accretion of discount. Variable rate bonds and floating rate notes earn interest at coupon rates that fluctuate at specific time intervals. The interest rates shown in the Portfolio of Investments for the Emerging Markets Debt Fund were the rates in effect on June 30, 2022. Put bonds may be redeemed at the discretion of the holder on specified dates prior to maturity.
Premiums and discounts are amortized and accreted, respectively, on a straight-line basis for short-term investments and on an effective interest method for long-term investments.
For the period ended June 30, 2022, the International Growth and Institutional International Growth Funds received European Union tax reclaim payments, including interest, of $6,383 and $2,800, respectively (in thousands), relating to amounts withheld on dividends received by the Funds during the fiscal years ended December 31, 2009 through 2014. The amounts withheld on dividends were not previously passed through to the Funds’ shareholders in the years the dividends were received by the Funds. The payments received are included within other income in the Statement of Operations.
The Funds do not isolate the portion of operations resulting from fluctuations in foreign currency exchange rates on investments from the fluctuations arising from changes in the value of securities held. Such currency fluctuations are included with the net realized and unrealized gain or loss from investments.
| 108 | Semiannual Report | June 30, 2022 |
Notes to Financial Statements (information as of June 30, 2022 is unaudited)
Reported net realized foreign currency gains or losses arise from disposition of foreign currency, the difference in the foreign exchange rates between the trade and settlement dates on securities transactions, and the difference between the amounts of dividends, interest and foreign withholding taxes recorded on the ex-date or accrual date and the U.S. dollar equivalent of the amounts actually received or paid. Net unrealized foreign exchange gains and losses arise from changes (due to the changes in the exchange rate) in the value of foreign currency and other assets and liabilities denominated in foreign currencies held at period end.
For financial reporting purposes, security and shareholder transactions are recorded on trade date in accordance with US GAAP. Realized gains and losses from securities transactions are recognized on a specifically identified cost basis.
Awards from class action litigation may be recorded as a reduction of cost. If the Funds no longer own the applicable securities, the proceeds are recorded as realized gains.
(b) Share Valuation and Distributions to Shareholders
Shares are sold and redeemed on a continuous basis at net asset value. The net asset value per share is determined separately for each class by dividing the Fund’s net assets attributable to that class by the number of shares of the class outstanding as of the close of regular trading on the New York Stock Exchange (the “NYSE”), which is generally 4:00 p.m. Eastern time, on each day the NYSE is open.
Distributions from net investment income, if any, for all Equity and Multi-Asset and Alternative Funds are declared and paid at least annually. Distributions from net investment income for Emerging Markets Debt Fund are declared daily and paid monthly. Capital gain distributions, if any, for all Funds, are declared and paid at least annually in December and/or January. Distributions payable to shareholders are recorded on the ex-dividend date.
For the period from November 1, 2020 to July 16, 2021, the Predecessor Fund distributed its net investment income quarterly, and distributed its net realized gains at least annually. In connection with the Reorganization, the Predecessor Fund also distributed all of its net realized gains on July 13, 2021. Effective July 17, 2021, the Small Cap Value Fund pays distributions in accordance with the aforementioned policy.
(c) Foreign Currency Translation
The Funds may invest in securities denominated in foreign currencies. As such, assets and liabilities denominated in foreign currencies are translated into U.S. dollar amounts at the current exchange rate on the date of valuation. The values of foreign investments, open forward foreign currency contracts, and cash denominated in foreign currencies are translated into U.S. dollars using a spot market rate of exchange as of the time of the determination of each Fund’s net asset value, typically 4:00 p.m. Eastern time on days when there is regular trading on the NYSE. Payables and receivables for securities transactions, dividends, interest income and tax reclaims are translated into U.S. dollars using a spot market rate of exchange as of 4:00 p.m. Eastern time. Settlement of purchases and sales and dividend and interest receipts are translated into U.S. dollars using a spot market rate of exchange as of 11:00 a.m. Eastern time.
(d) Investment in REITs
With respect to the Funds, dividend income is recorded based on the income included in distributions received from the REIT investments using published REIT reclassifications including some management estimates when actual amounts are not available. Distributions received in excess of this estimated amount are recorded as a reduction of the cost of investments or reclassified to capital gains. The actual amounts of income, return of capital, and capital gains are only determined by each REIT after its fiscal year-end, and may differ from the estimated amounts.
(e) Master Limited Partnerships
The Funds may invest in master limited partnerships (“MLP”). MLPs are limited partnerships or limited liability companies, whose partnership units or limited liability interests are listed and traded on a U.S. securities exchange, and are treated as publicly traded partnerships for federal income tax purposes. To qualify to be treated as a partnership for tax purposes, an MLP must receive at least 90% of its income from qualifying sources as set forth in Section 7704(d) of the Internal Revenue Code of 1986,
| June 30, 2022 | William Blair Funds | 109 |
Notes to Financial Statements (information as of June 30, 2022 is unaudited)
as amended (the “Code”). These qualifying sources include activities such as the exploration, development, mining, production, processing, refining, transportation, storage and marketing of mineral or natural resources. MLPs generally have two classes of owners, the general partner and limited partners. MLPs that are formed as limited liability companies generally have two analogous classes of owners, the managing member and the members. For purposes of this section, references to general partners also apply to managing members and references to limited partners also apply to members. The general partner is typically owned by a major energy company, an investment fund, the direct management of the MLP or is an entity owned by one or more of such parties. The general partner may be structured as a private or publicly traded corporation or other entity. The general partner typically controls the operations and management of the MLP through an equity interest of as much as 2% in the MLP plus, in many cases, ownership of common units and subordinated units. Limited partners own the remainder of the MLP through ownership of common units and have a limited role in the MLP’s operations and management.
(f) Income Taxes
Each Fund intends to comply with the provisions of Subchapter M of the Code, in order to qualify as regulated investment companies. Each Fund intends to make the requisite distributions of income and capital gains to its shareholders sufficient to relieve it from all, or substantially all, federal income and excise taxes. No provision for federal income and excise taxes has been made.
Certain Funds may be subject to foreign income taxes imposed on realized gains on securities of issuers from certain foreign countries. Such taxes, if applicable, are included within net realized gain (loss) on transactions from investments in securities in the Statement of Operations.
Management evaluates tax positions taken or expected to be taken in the course of preparing the Funds’ tax returns to determine whether it is “more likely than not” that each tax position would be sustained upon examination by a taxing authority based on the technical merits of the positions. Tax positions not deemed to meet the “more likely than not” threshold would be recorded as a tax benefit or expense in the current year. Management has evaluated all of the uncertain tax positions of the Funds and has determined that no liability is required to be recorded in the financial statements.
The statute of limitations on the Funds’ tax returns for the prior three years remains open and the returns are subject to examination.
Adjustments to the cost of investments for tax purposes may be due to the deferred loss associated with current and prior year wash sales, income recognition from investments in real estate investment trusts, and the Funds’ election to mark-to-market their investments in Passive Foreign Investment Companies (“PFICs”). The cost of investments, including derivatives, for federal income tax purposes and related gross unrealized appreciation (depreciation) and net unrealized appreciation/(depreciation) at June 30, 2022, were as follows (in thousands):
| Fund | | Cost of
Investments | | | Gross
Unrealized
Appreciation | | | Gross
Unrealized
Depreciation | | | Net
Unrealized
Appreciation/
(Depreciation) |
| Growth | | $ | 164,027 | | | $ | 87,176 | | | $ | 26,438 | | | $ | 60,738 | |
| Large Cap Growth | | | 1,112,998 | | | | 82,609 | | | | 120,929 | | | | (38,320 | ) |
| Mid Cap Growth | | | 39,078 | | | | 5,373 | | | | 9,061 | | | | (3,688 | ) |
| Mid Cap Value | | | 1,563 | | | | 6 | | | | 217 | | | | (211 | ) |
| Small-Mid Cap Core | | | 138,009 | | | | 3,105 | | | | 23,159 | | | | (20,054 | ) |
| Small-Mid Cap Growth | | | 2,201,557 | | | | 286,245 | | | | 367,934 | | | | (81,689 | ) |
| Small Cap Growth | | | 524,030 | | | | 74,990 | | | | 106,600 | | | | (31,610 | ) |
| Small Cap Value | | | 1,308,670 | | | | 125,368 | | | | 169,355 | | | | (43,987 | ) |
| Global Leaders | | | 71,745 | | | | 27,507 | | | | 4,948 | | | | 22,559 | |
| International Leaders | | | 987,878 | | | | 91,402 | | | | 105,409 | | | | (14,007 | ) |
| International Growth | | | 1,293,408 | | | | 276,773 | | | | 105,577 | | | | 171,196 | |
| Institutional International Growth | | | 832,463 | | | | 159,012 | | | | 61,297 | | | | 97,715 | |
| 110 | Semiannual Report | June 30, 2022 |
Notes to Financial Statements (information as of June 30, 2022 is unaudited)
| Fund | | Cost of
Investments | | | Gross
Unrealized
Appreciation | | | Gross
Unrealized
Depreciation | | | Net
Unrealized
Appreciation/
(Depreciation) |
| International Small Cap Growth | | | 277,484 | | | | 13,667 | | | | 55,426 | | | | (41,759 | ) |
| Emerging Markets Leaders | | | 445,494 | | | | 15,646 | | | | 68,317 | | | | (52,671 | ) |
| Emerging Markets Growth | | | 701,023 | | | | 55,753 | | | | 59,415 | | | | (3,662 | ) |
| Emerging Markets Small Cap Growth | | | 374,442 | | | | 20,522 | | | | 62,396 | | | | (41,874 | ) |
| China Growth | | | 4,399 | | | | 62 | | | | 785 | | | | (723 | ) |
| Emerging Markets Debt | | | 53,458 | | | | 269 | | | | 10,615 | | | | (10,344 | ) |
| Macro Allocation | | | 22,881 | | | | — | | | | — | | | | — | |
As of December 31, 2021, the Funds may have unused capital loss carryforwards available for federal income tax purposes to be applied against future capital gains, if any. Under current law, the Funds may carry forward net capital losses indefinitely to use to offset capital gains realized in future years. The following table details the Funds’ available capital loss carryforwards as of December 31, 2021, and the capital loss carryforwards utilized by the Funds in 2021 (in thousands):
| | | | | | | | | | | | Capital Loss |
| | | Available Capital Loss Carryforwards | | | Carryforwards |
| Fund | | Short Term | | | Long Term | | | Total | | | Utilized in 2021 |
| Small-Mid Cap Core | | $ | 6,340 | | | $ | — | | | $ | 6,340 | | | $ | 6,466 | |
| China Growth | | | 28 | | | | — | | | | 28 | | | | — | |
| Emerging Markets Debt | | | 248 | | | | — | | | | 248 | | | | — | |
| Macro Allocation | | | 196,808 | | | | — | | | | 196,808 | | | | 39,838 | |
In order to meet certain excise tax distribution requirements, the Funds are required to measure and distribute annually, net capital gains realized during a twelve month period ending October 31 and net investment income earned during a twelve month period ending December 31. In connection with this, the Funds are permitted for tax purposes to defer into their next fiscal year qualified late year losses. Qualified late year capital losses are any short term or long term capital losses incurred between November 1 and the end of their fiscal year, December 31, 2021. Qualified late year ordinary losses are comprised of losses related to swaps, foreign currency and PFICs incurred between November 1 and the end of their fiscal year, December 31, 2021.
As of December 31, 2021, the following Funds deferred, on a tax basis, qualified late year losses of (in thousands):
| | | Qualified Late Year Losses | |
| Fund | | Ordinary
Income | | | Net
Capital | |
| Growth | | $ | — | | | $ | 715 | |
| Large Cap Growth | | | — | | | | 1,904 | |
| Small-Mid Cap Growth | | | — | | | | 1,783 | |
| Small Cap Growth | | | — | | | | 3,077 | |
| International Leaders | | | 1,890 | | | | — | |
| International Growth | | | — | | | | 6,800 | |
| Institutional International Growth | | | — | | | | 3,248 | |
| International Small Cap Growth | | | 47 | | | | 2,083 | |
| Emerging Markets Leaders | | | 703 | | | | — | |
| Emerging Markets Growth | | | 1,382 | | | | — | |
| Emerging Markets Small Cap Growth | | | 967 | | | | — | |
| China Growth | | | 5 | | | | — | |
| Macro Allocation | | | 2,498 | | | | — | |
| June 30, 2022 | William Blair Funds | 111 |
Notes to Financial Statements (information as of June 30, 2022 is unaudited)
(g) Repurchase Agreements
In a repurchase agreement, a Fund buys a security at one price and at the time of sale, the seller agrees to repurchase the security at a mutually agreed upon time and price (usually within seven days). The repurchase agreement thereby determines the yield during the purchaser’s holding period, while the seller’s obligation to repurchase is secured by the value of the underlying collateral. The Adviser monitors, on an ongoing basis, the value of the underlying collateral to ensure that the value always equals or exceeds the repurchase price plus accrued interest. Repurchase agreements may involve certain risks in the event of a default or insolvency of the other party to the agreement, including possible delays or restrictions upon a Fund’s ability to dispose of the underlying collateral. The risk to a Fund is limited to the ability of the seller to pay the agreed upon sum on the delivery date. In the event of default, a repurchase agreement provides that a Fund is entitled to sell the underlying collateral. The loss, if any, to a Fund will be the difference between the proceeds from the sale and the repurchase price. However, if bankruptcy proceedings are commenced with respect to the seller of the security, disposition of the collateral by the Fund may be delayed or limited. The Funds have master repurchase agreements which allow the Funds to offset amounts owed to a counterparty with amounts owed from the same counterparty, including any collateral, in the event the counterparty defaults. Each Fund’s outstanding repurchase agreements, if any, and related collateral, are shown on the Fund’s Portfolio of Investments. Although no definitive creditworthiness criteria are used, the Adviser reviews the creditworthiness of the banks and non-bank dealers with which a Fund enters into repurchase agreements to evaluate those risks. A Fund may, for tax purposes, deem repurchase agreements collateralized by U.S. Government securities to be investments in U.S. Government securities.
(h) Securities Sold, Not Yet Purchased
A Fund may sell a security it does not own (known as selling a security short) in anticipation of a decline in the fair value of that security. When a Fund sells a security short, it must borrow the security sold short and deliver it to the broker through which it made the short sale. A gain, limited to the price at which the fund sold the security short, or a loss, unlimited in size, will be recognized upon the termination of the short sale. A Fund is also subject to the risk that it may be unable to acquire a security to terminate a short position except at a price substantially in excess of the price at which it sold the security short.
(i) Use of Estimates
The preparation of financial statements in conformity with US GAAP requires management to make estimates and assumptions that affect the amounts reported in the financial statements. Actual results may differ from those estimates.
(j) Indemnification
In the normal course of business, the Funds have entered into contracts in which the Funds agree to indemnify the other party or parties against various potential costs or liabilities. The Funds’ maximum exposure under these arrangements is unknown. No claim has been made for indemnification pursuant to any such agreement of the Funds.
(k) Redemption In-Kind
In accordance with the Trust’s prospectus, the Funds may distribute portfolio securities rather than cash as payment for a redemption of Fund shares (in-kind redemption). For financial reporting purposes, the Fund recognizes a gain or loss on the transfer of securities depending on the value of those securities on the date of redemption. Gains and losses realized on in-kind redemptions may not be recognized for tax purposes and are reclassified from accumulated net realized gain (loss) to capital paid in excess of par value. During the period ended June 30, 2022, the Small-Mid Cap Growth and Small Cap Value Funds redeemed $19,912 and $579,643 (in thousands), respectively, of fund shares in-kind rather than with cash and recognized net realized gains of $3,930 and $201,191 (in thousands), respectively, on the securities distributed to shareholders.
(3) Valuation
(a) Investment Valuation
The value of U.S. equity securities, including exchange-traded funds, is determined by valuing securities traded on national securities markets or in the over-the-counter markets at the last sale price or, if applicable, the official closing price or, in the absence of a recent sale on the date of determination, at the mean between the last reported bid and ask prices.
| 112 | Semiannual Report | June 30, 2022 |
Notes to Financial Statements (information as of June 30, 2022 is unaudited)
The value of foreign equity securities is generally determined based upon the last sale price on the foreign exchange or market on which it is primarily traded and in the currency of that market as of the close of the appropriate exchange or, if there have been no sales during that day, at the mean between the last reported bid and ask prices. The Board of Trustees has determined that the passage of time between when the foreign exchanges or markets close and when the Funds compute their net asset values could cause the value of foreign equity securities to no longer be representative or accurate and, as a result, may necessitate that such securities be fair valued. Accordingly, for foreign equity securities, the Funds may use an independent pricing service to fair value price the security as of the close of regular trading on the NYSE. As a result, a Fund’s value for a foreign security may be different from the last sale price (or the mean between the last reported bid and ask prices). As of June 30, 2022, fair valuation estimates for foreign equity securities were not obtained.
Fixed income securities are generally valued using evaluated prices provided by an independent pricing service. The evaluated prices are formed using various market inputs that the pricing service believes accurately represent the market value of a security at a particular point in time. The pricing service determines evaluated prices for fixed income securities using inputs including, but not limited to, recent transaction prices for such securities, dealer quotes, transaction prices for other securities with similar characteristics, collateral characteristics, credit quality, payment history, liquidity and market conditions.
Repurchase agreements are valued at cost, which approximates fair value.
Option contracts on securities, currencies and other financial instruments traded on one or more exchanges are valued at their most recent sale price on the exchange on which they are traded most extensively. Option contracts on foreign indices are valued at the settlement price. If there were no sales that day or if no settlement price is available, such option contracts are valued at the mean between the last reported bid and ask prices. Option contracts traded in the Over-the-Counter (“OTC”) market shall be valued by an independent pricing service. Futures contracts are valued at the most recent settlement price on the exchange on which they are traded most extensively, or if no settlement price is available, at the last sale price as of the close of the exchange. Forward foreign currency contracts are valued on the basis of the value of the underlying currencies at the prevailing currency exchange rate as supplied by an independent pricing service.
Swaps that are centrally cleared through an exchange are valued at the most recent settlement price provided by the exchange on which they are cleared. Total return swaps on equities, equity baskets, indices and other financial instruments are valued by an independent pricing service, or if unavailable, based on the security’s or instrument’s underlying reference asset. All other swap contracts are valued by an independent pricing service. Depending on the product and the terms of the transaction, the independent pricing service may use a series of techniques, including simulation pricing models. The pricing models use inputs that are observed from actively quoted markets such as issuer details, indices, spreads, interest rates, yield curves, dividends and exchange rates.
Securities, and other assets, for which a market price is not available or is deemed unreliable (e.g., securities affected by unusual or extraordinary events, such as natural disasters or securities affected by market or economic events, such as bankruptcy filings), or the value of which is affected by a significant valuation event, are valued at a fair value as determined in good faith by, or under the direction of, the Board of Trustees and in accordance with the Valuation Procedures approved by the Board of Trustees. The value of these fair valued securities may be different from the last sale price (or the mean between the last reported bid and ask prices), and there is no guarantee that a fair valued security will be sold at the price at which a Fund is carrying the security.
(b) Fair Value Measurements
Fair value is defined as the price that a Fund would receive upon selling a security in an orderly transaction to an independent buyer in the principal or most advantageous market for the investment. Various inputs are used in determining the value of a Fund’s investments. A three-tier hierarchy of inputs is used to classify fair value measurements for disclosure purposes. The three-tier hierarchy of inputs is summarized in the three broad levels listed below:
| | • | Level 1—Quoted prices (unadjusted) in active markets for an identical security. |
| | | |
| | • | Level 2—Prices determined using other significant observable inputs. Observable inputs are inputs that other market participants would use in pricing a security. These may include quoted prices for similar securities, interest rates, prepayment speeds, credit risk, and others. In addition, other observable inputs such as foreign exchange rates, benchmark securities indices and foreign futures contracts may be utilized in the valuation of certain foreign securities when significant events occur between the last sale on the foreign securities exchange and the time at which the net asset value of the Fund is calculated. |
| June 30, 2022 | William Blair Funds | 113 |
Notes to Financial Statements (information as of June 30, 2022 is unaudited)
| | • | Level 3—Prices determined using significant unobservable inputs. In situations where quoted prices or observable inputs are unavailable (for example, when there is little or no market activity for an investment), unobservable inputs may be used. Unobservable inputs reflect the Fund’s own assumptions about the factors market participants would use in pricing an investment, and are based on the best information available. |
The inputs or methodology used for valuing an investment are not necessarily an indication of the risk associated with investing in those securities.
A description of the valuation methodologies applied to the Funds’ major categories of assets and liabilities measured at fair value on a recurring basis is as follows:
Exchange-Traded Securities
Securities traded on a national securities exchange (or reported on the NASDAQ national market), including exchange-traded funds, are stated at the last reported sales price on the day of valuation. Other securities traded in the over-the-counter market and listed securities for which no sale was reported on that date are stated at the mean between the last reported bid and ask prices. To the extent these securities are actively traded and valuation adjustments are not applied, they are categorized as Level 1 of the fair value hierarchy. Securities traded on inactive markets or valued by reference to similar instruments are generally categorized as Level 2 of the fair value hierarchy.
Fixed Income Securities
Fixed income securities including corporate, convertible and municipal bonds and notes, U.S. government agency obligations, U.S. treasury obligations, sovereign issues, bank loans, convertible preferred securities, asset-backed securities, non-U.S. bonds and commercial paper are generally valued using evaluated prices provided by an independent pricing service. The evaluated prices are formed using various market inputs that the pricing service believes accurately represent the fair value of a security at a particular point in time. The pricing service determines evaluated prices for fixed income securities using inputs including, but not limited to, recent transaction prices for such securities, dealer quotes, transaction prices for other securities with similar characteristics, collateral characteristics, credit quality, payment history, liquidity and market conditions. Securities that use similar valuation techniques and observable inputs as described above are categorized as Level 2 of the fair value hierarchy.
Repurchase Agreements
Repurchase agreements are valued at cost, which approximates fair value. Repurchase agreements are categorized as Level 2 of the fair value hierarchy.
Derivative Instruments
Listed derivatives, such as certain options and futures contracts, that are actively traded are valued based on quoted prices from the exchange on which they are traded most extensively and are categorized as Level 1 of the fair value hierarchy. OTC derivative contracts include forward foreign currency contracts, swap and certain option contracts related to interest rates, foreign currencies, the credit standing of reference entities, equity prices, or commodity prices. Depending on the product and the terms of the transaction, the fair value of OTC derivative products can be modeled by independent pricing services taking into account the counterparties’ creditworthiness and using a series of techniques, including simulation models. Many pricing models do not entail material subjectivity because the methodologies employed do not necessitate significant judgments and the pricing inputs are observed from actively quoted markets, as is the case of forward foreign currency contracts and interest rate swaps. A substantial majority of OTC derivative products valued by a Fund using pricing models fall into this category and are categorized as Level 2 of the fair value hierarchy.
| 114 | Semiannual Report | June 30, 2022 |
Notes to Financial Statements (information as of June 30, 2022 is unaudited)
As of June 30, 2022, the value of investments in securities and other financial instruments, segregated by their hierarchical input levels used in determining fair value and by security class or other financial instruments, are shown below (in thousands).
| Investments in securities | | | Growth | | | | Large Cap
Growth | | | | Mid Cap
Growth | | | | Mid Cap
Value | |
| Level 1—Quoted prices | | | | | | | | | | | | | | | | | | | | |
| Common Stocks | | | $ | 219,802 | | | | $ | 1,061,641 | | | | $ | 34,698 | | | | $ | 1,352 | |
| Level 2—Other significant observable inputs | | | | | | | | | | | | | | | | | | | | |
| Repurchase Agreements | | | | 4,963 | | | | | 13,037 | | | | | 692 | | | | | — | |
| Level 3—Significant unobservable inputs | | | | | | | | | | | | | | | | | | | | |
| None | | | | — | | | | | — | | | | | — | | | | | — | |
| Total investments in securities | | | $ | 224,765 | | | | $ | 1,074,678 | | | | $ | 35,390 | | | | $ | 1,352 | |
| | | | | | | | | | | | | | | | | |
| Investments in securities | | | Small-Mid
Cap Core | | | | Small-Mid
Cap Growth | | | | Small Cap
Growth | | | | Small Cap
Value | |
| Level 1—Quoted prices | | | | | | | | | | | | | | | | | | | | |
| Common Stocks | | | $ | 114,830 | | | | $ | 2,068,376 | | | | $ | 479,691 | | | | $ | 1,255,009 | |
| Level 2—Other significant observable inputs | | | | | | | | | | | | | | | | | | | | |
| Repurchase Agreements | | | | 3,125 | | | | | 51,492 | | | | | 12,729 | | | | | 9,674 | |
| Level 3—Significant unobservable inputs | | | | | | | | | | | | | | | | | | | | |
| None | | | | — | | | | | — | | | | | — | | | | | — | |
| Total investments in securities | | | $ | 117,955 | | | | $ | 2,119,868 | | | | $ | 492,420 | | | | $ | 1,264,683 | |
| | | | | | | | | | | | | | | | | | | | |
| Investments in securities | | | Global
Leaders | | | | International
Leaders | | | | International
Growth | | | |
Institutional
International Growth | |
| Level 1—Quoted prices | | | | | | | | | | | | | | | | | | | | |
| Common Stocks | | | $ | 93,674 | | | | $ | 951,348 | | | | $ | 1,399,794 | | | | $ | 905,729 | |
| Level 2—Other significant observable inputs | | | | | | | | | | | | | | | | | | | | |
| Repurchase Agreements | | | | 630 | | | | | 22,523 | | | | | 64,810 | | | | | 24,449 | |
| Level 3—Significant unobservable inputs | | | | | | | | | | | | | | | | | | | | |
| None | | | | — | | | | | — | | | | | — | | | | | — | |
| Total investments in securities | | | $ | 94,304 | | | | $ | 973,871 | | | | $ | 1,464,604 | | | | $ | 930,178 | |
| | | | | | | | | | | | | | | | | |
| Investments in securities | | | International
Small Cap
Growth | | | | Emerging
Markets
Leaders | | | | Emerging
Markets
Growth | | | | Emerging
Markets
Small Cap
Growth | |
| Level 1—Quoted prices | | | | | | | | | | | | | | | | | | | | |
| Common Stocks | | | $ | 229,286 | | | | $ | 384,938 | | | | $ | 666,443 | | | | $ | 316,910 | |
| Level 2—Other significant observable inputs | | | | | | | | | | | | | | | | | | | | |
| Common Stocks | | | | — | | | | | 4,622 | | | | | 16,449 | | | | | 12,957 | |
| Repurchase Agreements | | | | 6,439 | | | | | 3,263 | | | | | 14,469 | | | | | 2,701 | |
| Level 3—Significant unobservable inputs | | | | | | | | | | | | | | | | | | | | |
| None | | | | — | | | | | — | | | | | — | | | | | — | |
| Total investments in securities | | | $ | 235,725 | | | | $ | 392,823 | | | | $ | 697,361 | | | | $ | 332,568 | |
| June 30, 2022 | William Blair Funds | 115 |
Notes to Financial Statements (information as of June 30, 2022 is unaudited)
| Investments in securities | | China
Growth | | | Emerging
Markets
Debt | | | Macro
Allocation | |
| Assets | | | | | | | | | | | | |
| Level 1—Quoted prices | | | | | | | | | | | | |
| Common Stocks | | $ | 3,676 | | | $ | — | | | $ | — | |
| Level 2—Other significant observable inputs | | | | | | | | | | | | |
| Foreign Corporate Obligations | | | — | | | | 12,811 | | | | — | |
| Foreign Government Bonds | | | — | | | | 26,188 | | | | — | |
| Foreign Municipal Bonds | | | — | | | | 523 | | | | — | |
| Repurchase Agreements | | | — | | | | 3,343 | | | | 22,881 | |
| Level 3—Significant unobservable inputs | | | | | | | | | | | | |
| None | | | — | | | | — | | | | — | |
| Liabilities | | | | | | | | | | | | |
| Level 1—Quoted prices | | | | | | | | | | | | |
| None | | | — | | | | — | | | | — | |
| Level 2—Other significant observable inputs | | | | | | | | | | | | |
| None | | | — | | | | — | | | | — | |
| Level 3—Significant unobservable inputs | | | | | | | | | | | | |
| None | | | — | | | | — | | | | — | |
| Total investments in securities | | $ | 3,676 | | | $ | 42,865 | | | $ | 22,881 | |
| Other financial instruments | | | | | | | | | | | | |
| Assets | | | | | | | | | | | | |
| Level 1—Quoted prices | | | | | | | | | | | | |
| None | | $ | — | | | $ | — | | | $ | — | |
| Level 2—Other significant observable inputs | | | | | | | | | | | | |
| Forward Foreign Currency Contracts | | | — | | | | 47 | | | | — | |
| Swaps | | | — | | | | 626 | | | | — | |
| Level 3—Significant unobservable inputs | | | | | | | | | | | | |
| None | | | — | | | | — | | | | — | |
| Liabilities | | | | | | | | | | | | |
| Level 1—Quoted prices | | | | | | | | | | | | |
| None | | | — | | | | — | | | | — | |
| Level 2—Other significant observable inputs | | | | | | | | | | | | |
| Forward Foreign Currency Contracts | | | — | | | | (2 | ) | | | — | |
| Swaps | | | — | | | | (412 | ) | | | — | |
| Level 3—Significant unobservable inputs | | | | | | | | | | | | |
| None | | | — | | | | — | | | | — | |
| Total other financial instruments | | $ | — | | | $ | 259 | | | $ | — | |
See Portfolio of Investments for Sector Classification.
| 116 | Semiannual Report | June 30, 2022 |
Notes to Financial Statements (information as of June 30, 2022 is unaudited)
(4) Transactions with Affiliates
(a) Management and Expense Limitation Agreements
Each Fund has a management agreement with the Adviser for investment management, clerical, bookkeeping and administrative services. Each Fund pays the Adviser an annual management fee, which is accrued daily and paid monthly, based on a specified percentage of the Fund’s average daily net assets. Each Fund’s annual management fee rate is as follows:
| U.S. Equity Funds | | | |
| Growth | | | 0.75 | % |
| Large Cap Growth | | | 0.60 | % |
| Mid Cap Growth | | | 0.90 | % |
| Mid Cap Value | | | 0.70 | % |
| Small-Mid Cap Core | | | 0.90 | % |
| Small-Mid Cap Growth | | | 1.00 | % |
| Small Cap Growth | | | 1.10 | % |
| Small Cap Value | | | 0.75 | % |
| | | | | |
| Emerging Markets Debt Fund | | | | |
| Emerging Markets Debt | | | 0.65 | % |
| | | | | |
| Multi-Asset and Alternative Fund | | | | |
| Macro Allocation | | | 0.80 | % |
| | | | | |
| Global Equity Fund | | | | |
| Global Leaders | | | 0.85 | % |
| International Equity Funds | | | |
| International Leaders | | | 0.85 | % |
| International Growth Fund1: | | | | |
| First $3 billion | | | 0.94 | % |
| Next $2 billion | | | 0.90 | % |
| Next $5 billion | | | 0.85 | % |
| Next $5 billion | | | 0.825 | % |
| In excess of $15 billion | | | 0.80 | % |
| Institutional International Growth Fund2: | | | |
| First $1.875 billion | | | 0.94 | % |
| Next $625 million | | | 0.90 | % |
| Next $2.5 billion | | | 0.875 | % |
| Next $5 billion | | | 0.85 | % |
| Next $5 billion | | | 0.825 | % |
| In excess of $15 billion | | | 0.80 | % |
| International Small Cap Growth | | | 1.00 | % |
| Emerging Markets Leaders3 | | | 0.94 | % |
| Emerging Markets Growth4 | | | 0.94 | % |
| Emerging Markets Small Cap Growth | | | 1.10 | % |
| China Growth5 | | | 0.94 | % |
| 1 | Prior to May 1, 2022, the International Growth Fund paid a management fee at a rate of 1.10% of the first $250 million of the Fund’s average daily net assets; plus 1.00% of the next $2.25 billion of the Fund’s average daily net assets; plus 0.975% of the next $2.5 billion of the Fund’s average daily net assets; plus 0.95% of the next $5 billion of the Fund’s average daily net assets; plus 0.925% of the next $5 billion of the Fund’s average daily net assets; plus 0.90% of the Fund’s average daily net assets over $15 billion. Effective May 1, 2022, the management fee paid to the Adviser was reduced to 0.94% of the first $3 billion of the Fund’s average daily net assets; plus 0.90% of the next $2 billion of the Fund’s average daily net assets; plus 0.85% of the next $5 billion of the Fund’s average daily net assets; plus 0.825% of the next $5 billion of the Fund’s average daily net assets; plus 0.80% of the Fund’s average daily net assets over $15 billion. |
| 2 | Prior to May 1, 2022, the Institutional International Growth Fund paid a management fee at a rate of 1.00% of the first $500 million of the Fund’s average daily net assets; plus 0.95% of the next $500 million of the Fund’s average daily net assets; plus 0.90% of the next $1.5 billion of the Fund’s average daily net assets; plus 0.875% of the next $2.5 billion of the Fund’s average daily net assets; plus 0.85% of the next $5 billion of the Fund’s average daily net assets; plus 0.825% of the next $5 billion of the Fund’s average daily net assets; plus 0.80% of the Fund’s average daily net assets over $15 billion. Effective May 1, 2022, the management fee paid to the Adviser was reduced to 0.94% of the first $1.875 billion of the Fund’s average daily net assets; plus 0.90% of the next $625 million of the Fund’s average daily net assets; plus 0.875% of the next $2.5 billion of the Fund’s average daily net assets; plus 0.85% of the next $5 billion of the Fund’s average daily net assets; plus 0.825% of the next $5 billion of the Fund’s average daily net assets; plus 0.80% of the Fund’s average daily net assets over $15 billion. |
| 3 | Prior to May 1, 2022, the Emerging Markets Leaders Fund paid a management fee at a rate of 1.10% of the Fund’s average daily net assets. Effective May 1, 2022, the management fee paid to the Adviser was reduced to 0.94%. |
| 4 | Prior to May 1, 2022, the Emerging Markets Growth Fund paid a management fee at a rate of 1.10% of the Fund’s average daily net assets. Effective May 1, 2022, the management fee paid to the Adviser was reduced to 0.94%. |
| 5 | Prior to May 1, 2022, the China Growth Fund paid a management fee at a rate of 1.00% of the Fund’s average daily net assets. Effective May 1, 2022, the management fee paid to the Adviser was reduced to 0.94%. |
| June 30, 2022 | William Blair Funds | 117 |
Notes to Financial Statements (information as of June 30, 2022 is unaudited)
The Funds have also entered into an Amended and Restated Expense Limitation Agreement with the Adviser. Under the terms of the agreement, the Adviser will waive its management fee and/or reimburse a Fund for certain operating expenses, subject to certain excluded expenses, in excess of the agreed upon rate through April 30, 2023. Excluded expenses include interest expenses, taxes, brokerage commissions, acquired fund fees and expenses, dividend and interest expenses on short sales, other investment-related costs and extraordinary expenses, such as litigation and other expenses not incurred in the ordinary course of a Fund’s business. The amount the Adviser owes a Fund as of the reporting date is recorded as Receivable from Adviser in the Statements of Assets and Liabilities. The Adviser reimburses the Funds on a monthly basis. The Adviser will waive fees and/or reimburse expenses to the extent that the total operating expenses for the stated class of the Funds, subject to certain excluded expenses, exceed the following rates (as a percentage of average daily net assets):
| | | Class N | | Class I | | Institutional/Class R6 |
| Fund | | Effective
May 1, 2022
through
April 30,
2023 | | Effective
May 1, 2021
through
April 30,
2022 | | Effective
May 1, 2022
through
April 30,
2023 | | Effective
May 1, 2021
through
April 30,
2022 | | Effective
May 1, 2022
through
April 30,
2023 | | Effective
May 1, 2021
through
April 30,
2022 |
| Growth | | | 1.20 | % | | | 1.20 | % | | | 0.95 | % | | | 0.95 | % | | | 0.90 | % | | | 0.90 | % |
| Large Cap Growth | | | 0.90 | % | | | 0.90 | % | | | 0.65 | % | | | 0.65 | % | | | 0.60 | % | | | 0.60 | % |
| Mid Cap Growth | | | 1.20 | % | | | 1.20 | % | | | 0.95 | % | | | 0.95 | % | | | 0.90 | % | | | 0.90 | % |
| Mid Cap Value | | | N/A | | | | N/A | | | | 0.75 | %2 | | | 0.75 | %1 | | | 0.70 | %2 | | | 0.70 | %1 |
| Small-Mid Cap Core | | | N/A | | | | N/A | | | | 0.95 | % | | | 0.95 | % | | | 0.90 | % | | | 0.90 | % |
| Small-Mid Cap Growth | | | 1.35 | % | | | 1.35 | % | | | 1.10 | % | | | 1.10 | % | | | 1.05 | % | | | 1.05 | % |
| Small Cap Growth | | | 1.50 | % | | | 1.50 | % | | | 1.25 | % | | | 1.25 | % | | | 1.20 | % | | | 1.20 | % |
| Small Cap Value | | | 1.15 | % | | | 1.15 | %3 | | | 0.89 | % | | | 0.89 | % | | | 0.85 | % | | | 0.85 | %3 |
| Global Leaders | | | 1.15 | % | | | 1.15 | % | | | 0.90 | % | | | 0.90 | % | | | 0.85 | % | | | 0.85 | % |
| International Leaders | | | 1.15 | % | | | 1.15 | % | | | 0.90 | % | | | 0.90 | % | | | 0.85 | % | | | 0.85 | % |
| International Growth | | | 1.24 | % | | | 1.45 | % | | | 0.99 | % | | | 1.20 | % | | | 0.94 | % | | | 1.15 | % |
| Institutional International Growth | | | N/A | | | | N/A | | | | N/A | | | | N/A | | | | 0.94 | % | | | 1.05 | % |
| International Small Cap Growth | | | 1.55 | % | | | 1.55 | % | | | 1.30 | % | | | 1.30 | % | | | 1.25 | % | | | 1.25 | % |
| Emerging Markets Leaders | | | 1.24 | % | | | 1.40 | % | | | 0.99 | % | | | 1.15 | % | | | 0.94 | % | | | 1.10 | % |
| Emerging Markets Growth | | | 1.24 | % | | | 1.60 | % | | | 0.99 | % | | | 1.35 | % | | | 0.94 | % | | | 1.30 | % |
| Emerging Markets Small Cap Growth | | | 1.55 | % | | | 1.55 | % | | | 1.30 | % | | | 1.30 | % | | | 1.25 | % | | | 1.25 | % |
| China Growth | | | N/A | | | | N/A | | | | 0.99 | % | | | 1.05 | %4 | | | 0.94 | % | | | 1.00 | %4 |
| Emerging Markets Debt | | | N/A | | | | N/A | | | | 0.70 | % | | | 0.70 | %5 | | | 0.65 | % | | | 0.65 | %5 |
| Macro Allocation | | | 1.25 | % | | | 1.25 | % | | | 1.00 | % | | | 1.00 | % | | | 0.95 | % | | | 0.95 | % |
| 1 | Effective March 16, 2022 (Commencement of Operations). |
| 2 | Effective through April 30, 2024. |
| 3 | Effective July 17, 2021 (Commencement of Operations). |
| 4 | Effective August 27, 2021 (Commencement of Operations). |
| 5 | Effective May 25, 2021 (Commencement of Operations). |
The fee waivers and/or expense reimbursements received by each class are reported in the Statements of Operations.
The Adviser is entitled to recoupment of previously waived fees and reimbursed expenses for a period of three years subsequent to a fund’s commencement of operations to the extent that such recoupment does not cause the fund’s annual operating expenses (after the recoupment is taken into account) to exceed both (1) the expense limit in place when such amounts were waived or reimbursed and (2) the fund’s current expense limitation. The total amounts available for recoupment as of June 30, 2022 were as follows (in thousands):
| Fund | | Available for
Recoupment | | | Expiration of
Recoupment |
| Mid Cap Value | | | $ 32 | | | March 16, 2025 |
| Small-Mid Cap Core | | | 684 | | | October 1, 2022 |
| China Growth | | | 123 | | | August 27, 2024 |
| Emerging Markets Debt | | | 238 | | | May 25, 2024 |
| 118 | Semiannual Report | June 30, 2022 |
Notes to Financial Statements (information as of June 30, 2022 is unaudited)
(b) Underwriting and Distribution Services Agreements
Pursuant to separate Underwriting and Distribution Agreements, WBC is the principal underwriter and distributor for the continuous offering of shares of the Trust and acts as agent of the Trust in the sale of its shares. The Underwriting Agreement provides that the Distributor will use its best efforts to distribute the Trust’s shares. The Distributor is not compensated under the Underwriting Agreement.
Each Fund, except the Mid Cap Value, Small-Mid Cap Core, China Growth, Emerging Markets Debt and Institutional International Growth Funds, has a Distribution Agreement with WBC for distribution services to the Funds’ Class N shares. Each Fund pays WBC an annual fee, payable monthly, based on a specified percentage of its average daily net assets of Class N shares. The annual rate expressed as a percentage of average daily net assets for Class N is 0.25% for all Funds. Pursuant to the Distribution Agreement, WBC enters into related selling group agreements with various firms at various rates for sales of the Funds’ Class N shares.
(c) Administration Agreement
For the period from November 1, 2020 to July 16, 2021, the Predecessor Fund and the SEI Investments Distribution Co. were parties to a Distribution Agreement. SEI Investments Distribution Co. received no fees under the agreement. Effective July 17, 2021, the Small Cap Value Fund was subject to the aforementioned Underwriting and Distribution Agreements.
(5) Investment Transactions
Investment transactions, excluding short-term securities, for the period ended June 30, 2022, were as follows (in thousands):
| Fund | | Purchases | | | Sales | |
| Growth | | $ | 37,645 | | | $ | 63,660 | |
| Large Cap Growth | | | 526,821 | | | | 133,833 | |
| Mid Cap Growth | | | 7,931 | | | | 8,389 | |
| Mid Cap Value (a) | | | 1,633 | | | | 63 | |
| Small-Mid Cap Core | | | 88,777 | | | | 34,230 | |
| Small-Mid Cap Growth | | | 584,087 | | | | 645,521 | |
| Small Cap Growth | | | 141,225 | | | | 161,202 | |
| Small Cap Value | | | 225,149 | | | | 780,404 | |
| Global Leaders | | | 5,885 | | | | 8,316 | |
| International Leaders | | | 447,124 | | | | 339,712 | |
| International Growth | | | 421,612 | | | | 434,759 | |
| Institutional International Growth | | | 333,421 | | | | 283,882 | |
| International Small Cap Growth | | | 90,182 | | | | 87,873 | |
| Emerging Markets Leaders | | | 122,453 | | | | 84,787 | |
| Emerging Markets Growth | | | 399,982 | | | | 454,980 | |
| Emerging Markets Small Cap Growth | | | 207,775 | | | | 241,632 | |
| China Growth | | | 1,276 | | | | 3,165 | |
| Emerging Markets Debt | | | 36,083 | | | | 31,127 | |
| Macro Allocation | | | 7,292 | | | | 161,220 | |
| (a) | For the period from March 16, 2022 (Commencement of Operations) to June 30, 2022. |
(6) Financial Derivative Instruments
Each Fund may use derivative instruments to maintain liquidity, to provide hedging, or in anticipation of changes in the composition of its portfolio holdings or as otherwise provided in each Fund’s prospectus. The Macro Allocation Fund may also use derivative instruments to implement its investment strategy and obtain desired investment exposures, including by taking long or short positions indirectly through derivative instruments such as, but not limited to, futures, swaps, options and forward foreign currency contracts. Such long and short positions may be intended to enhance expected return, reduce expected risk, or both. For additional information regarding the asset class exposures the Macro Allocation Fund typically seeks through futures, swaps, options and forward foreign currency contracts, see the Fund’s principal investment strategy disclosure in its prospectus. The derivative instruments held as of June 30, 2022, as disclosed in each Fund’s Portfolios of Investments, are representative of each Fund’s derivative instrument trading activity during the period ended June 30, 2022.
| June 30, 2022 | William Blair Funds | 119 |
Notes to Financial Statements (information as of June 30, 2022 is unaudited)
Derivative transactions carry counterparty risk as they are based on contracts between a Fund and the applicable counterparty. For exchange-traded or cleared derivative contracts, such counterparty risk is limited due to the role of the exchange or clearinghouse. OTC derivative contracts, however, are exposed to counterparty risk in the amount of unrealized gains, net of collateral held, for the duration of the contract.
The Macro Allocation Fund is subject to certain netting arrangements through International Swaps and Derivatives Association, Inc. Master Agreements and Credit Support Annexes (“ISDAs”). The ISDAs maintain provisions for general obligations, representations, agreements, collateral and events of default or termination. The ISDAs cover certain OTC derivative securities entered into by the Macro Allocation Fund with various counterparties and allow the Macro Allocation Fund to close out and net its total exposure to a counterparty in the event of a default.
Futures Contracts
A futures contract provides for the future sale by one party and purchase by another party of a specified amount of a specific financial instrument for a specified price at a designated date, time and place. An index futures contract is an agreement pursuant to which the parties agree to take or make delivery of an amount of cash equal to the difference between the value of the index at the close of the last trading day of the contract and the price at which the index futures contract was originally written. A futures contract can be closed out prior to delivery by entering into an offsetting transaction in a matching futures contract. Although the value of an index might be a function of the value of certain specified securities, no physical delivery of those securities is made. If the offsetting purchase price is less than the original sale price, a Fund realizes a gain; if it is more, a Fund realizes a loss. Conversely, if the offsetting sale price is more than the original purchase price, a Fund realizes a gain; if it is less, a Fund realizes a loss. The transaction costs must also be included in these calculations. There can be no assurance, however, that a Fund will be able to enter into an offsetting transaction with respect to a particular futures contract at a particular time. If a Fund is not able to enter into an offsetting transaction, a Fund will continue to be required to maintain the margin deposits on the futures contract.
Upon entering into a futures contract, a Fund is required to pledge to the broker an amount of cash, U.S. government securities, or other liquid assets equal to a certain percentage of the contract amount (“initial margin deposit”). Futures contracts are marked to market daily and an appropriate payable or receivable for the change in value (“variation margin”) is recorded by a Fund and a cash payment is either made to or received from the broker each day. Gains or losses on futures contracts are recognized but not considered realized until the contracts expire or are closed and are included in the Statement of Operations.
Options
The purchase or sale of an option by a Fund involves the payment or receipt of a premium by the investor and the corresponding right or obligation, as the case may be, either to purchase or sell the underlying security, commodity, or other instrument for a specific price at a certain time or during a certain period. Purchasing options involves the risk that the underlying instrument will not change price in the manner expected, so the investor loses its premium. Writing options involves potentially greater risk because the investor is exposed to the extent of the actual price movement in the underlying security rather than only the amount of the premium paid (which could result in a potentially unlimited loss). OTC options also involve counterparty credit risk. Purchased options are shown as an asset in the Statement of Assets and Liabilities and are included in Investments in securities. Premiums received for written options are shown as a liability in the Statement of Assets and Liabilities. Realized gains and losses on the sale, expiration or assignment of an option are disclosed in the Statement of Operations.
Forward Foreign Currency Contracts
The Global Equity, International Equity, Emerging Markets Debt and Multi-Asset and Alternative Funds may enter into forward foreign currency contracts. When entering into a forward foreign currency contract, a Fund agrees to receive or deliver a fixed quantity of foreign currency for an agreed-upon price on an agreed future date. A Fund’s net equity therein, representing unrealized gain or loss on the contracts as measured by the difference between the forward foreign exchange rates at the dates of entry into the contracts and the forward rates at the reporting date, is included in the Statement of Assets and Liabilities as unrealized appreciation/depreciation on forward foreign currency contracts. Realized and unrealized gains and losses are included in the Statement of Operations. These instruments may involve market risk, credit risk, or both kinds of risks in excess of the amount recognized in the Statement of Assets and Liabilities. Risks arise from the possible inability of counterparties to meet the terms of their contracts and from the price movements in currencies.
| 120 | Semiannual Report | June 30, 2022 |
Notes to Financial Statements (information as of June 30, 2022 is unaudited)
Swap Contracts
Swap agreements may include total return, interest rate, securities index, commodity, security, currency exchange rate, credit default index, volatility and variance swaps. Cleared swaps are transacted through futures commission merchants that are members of central clearing houses with the clearing house serving as a central counterparty similar to transactions in futures contracts. In a standard “swap” transaction, two parties agree to exchange the returns (or differentials in rates of return) earned or realized on particular predetermined investments or instruments. The gross returns to be exchanged or “swapped” between the parties are calculated with respect to a “notional amount” (i.e., the change in the value of a particular dollar amount invested, for example, at a particular interest rate, in a particular foreign currency, or in a “basket” of securities representing a particular index). Swap agreements are subject to the risk that the counterparty to the swap will default on its obligation to pay a Fund and the risk that a Fund will not be able to meet its obligations to pay the counterparty to the swap. Swap agreements may also involve fees, commissions or other costs that may reduce a Fund’s gains from a swap agreement or may cause a Fund to lose money. To the extent permitted by its investment policies and restrictions, a Fund may invest in the following types of swaps:
Credit Default Swaps—A Fund may invest in credit default swaps as a means of “buying” credit protection (i.e., attempting to mitigate the risk of default or credit quality deterioration in some portion of a Fund’s holdings) or “selling” credit protection (i.e., attempting to gain exposure to an underlying issuer’s credit quality characteristics without directly investing in that issuer). A credit default swap is a contract between a buyer and a seller of protection against a pre-defined credit event (e.g., a ratings downgrade or default) on an underlying reference obligation, which may be a single debt instrument or baskets or indices of securities. Under current regulatory requirements, a Fund may be a buyer or seller of a credit default swap. As a seller of protection on credit default swap agreements, a Fund will generally receive from the buyer of protection a fixed rate of income throughout the term of the swap provided that there is no credit event. A Fund adds leverage to its portfolio because the Fund is subject to investment exposure on the notional amount of the swap. The maximum potential amount of future payments that a Fund as a seller of protection could be required to make under a credit default swap agreement equals the notional amount of the agreement. Notional amounts of each individual credit default swap agreement outstanding as of the period end for which a Fund is the seller of protection are disclosed in the Fund’s Portfolio of Investments. These potential amounts would be partially offset by any recovery values of the respective referenced obligations, upfront payments received upon entering into the agreement, or net amounts received from the settlement of buy protection credit default swap agreements entered into by the same Fund for the same referenced entity or entities. For credit default swap contracts on credit indices, the quoted market prices and resulting values serve as an indicator of the payment performance risk. Increasing market values, in absolute terms when compared to the notional amount of the swap, typically represent deterioration of the referenced entities’ credit soundness and a greater likelihood or risk of default or other credit event occurring as defined under the terms of the swap.
Interest Rate Swap—A Fund may invest in interest rate swaps to gain or mitigate exposure to changes in interest rates. Interest rate swap agreements involve a commitment between parties to pay either a fixed interest rate or a floating interest rate based on a notional amount of principal. The parties make payments at predetermined intervals throughout the life of the swap. As a payer, a Fund would make the fixed payment and receive the floating payment. As a receiver, a Fund would make the floating payment and receive the fixed payment.
Total Return Swap—A Fund may invest in total return swaps to gain or mitigate exposure to an underlying security, or securities. Total return swap agreements may involve commitments to pay interest in exchange for the return on the underlying security, or securities. At maturity, a net cash flow is exchanged between the parties based on the total return of the underlying security, or securities, less a financing rate. As a receiver in the transaction, a Fund would receive a payment for a positive return and would make a payment for a negative return. As a payer in the transaction, a Fund would make a payment for a positive return and would receive a payment for a negative return.
Variance Swap—A Fund may invest in variance swaps in order to gain or mitigate its exposure to an underlying reference entity such as a broad based index. A variance swap is an agreement between two parties to exchange cash flows based on the measured variance of a reference entity. The payer agrees to exchange the fixed rate, which is the variance strike price of the reference entity, to the receiver for the floating rate, which is the realized variance price of the reference entity. At the time the trade is originated, the agreed upon variance strike price is generally set so that the fair value of the swap is near zero. At maturity, a net cash flow is exchanged between the parties based on the difference between the final realized variance price of the swap and the variance strike price multiplied by the notional, or vega amount. As a receiver of the floating rate, a Fund would receive a payment if the final realized variance price is greater than the variance strike price and would make a payment if the final realized variance price is less than the variance strike price. As a payer of the floating rate, a Fund would receive a payment if the final realized variance price is less than the variance strike price and would make a payment if the final realized variance price is greater than the variance strike price.
| June 30, 2022 | William Blair Funds | 121 |
Notes to Financial Statements (information as of June 30, 2022 is unaudited)
The following table presents the value of financial derivative instruments, by Fund and primary risk exposure, as of June 30, 2022, and their respective location in the Statements of Assets and Liabilities (in thousands):
| | | Assets | | | Liabilities | |
Fund and
Primary Risk Exposure | | Statements of Assets
and Liabilities | | Value | | | Statements of Assets
and Liabilities | | Value | |
| Emerging Markets Debt | | | | | | | | | | | | |
| Credit | | Receivable for variation margin on centrally cleared swaps(1) | | | $124 | | | Payable for variation margin on centrally cleared swaps(1) | | | $121 | |
| Currency | | Unrealized appreciation on forward foreign currency contracts | | | 47 | | | Unrealized depreciation on forward foreign currency contracts) | | | 2 | |
| Interest rate | | Receivable for variation margin on centrally cleared swaps(1) | | | 502 | | | Payable for variation margin on centrally cleared swaps(1) | | | 291 | |
| (1) | The table above includes cumulative appreciation/(depreciation) on futures contracts and centrally cleared swaps as reported in the applicable Fund’s Portfolio of Investments. Receivable/payable for variation margin on futures contracts and centrally cleared swaps as reported in the applicable Fund’s Statement of Assets and Liabilities represents the current day’s variation margin. |
The following table indicates the effect of derivatives, by Fund and primary risk exposure, in the Statements of Operations for the period ended June 30, 2022 (in thousands):
| | | Net Realized Gain (Loss) | | | Change in Net Unrealized
Appreciation (Depreciation) | |
Fund and
Primary Risk Exposure | | Statements of Operations | | Value | | | Statements of Operations | | Value | |
| Emerging Markets Debt | | | | | | | | | | | | |
| Credit | | Swaps | | | $ 251 | | | Swaps | | | $ (8 | ) |
| Currency | | Forward foreign currency contracts | | | 150 | | | Forward foreign currency contracts | | | 71 | |
| Interest rate | | Swaps | | | 220 | | | Swaps | | | 144 | |
| Macro Allocation | | | | | | | | | | | | |
| Credit | | Swaps | | | (56 | ) | | Swaps | | | — | |
| Currency | | Forward foreign currency contracts | | | (496 | ) | | Forward foreign currency contracts | | | 1,857 | |
| Equity | | Futures contracts | | | 13,351 | | | Futures contracts | | | 1,891 | |
| Equity | | Options | | | (2,753 | ) | | Options | | | — | |
| Equity | | Swaps | | | (1,641 | ) | | Swaps | | | (177 | ) |
| Interest rate | | Futures contracts | | | 888 | | | Futures contracts | | | (299 | ) |
| Interest rate | | Swaps | | | (388 | ) | | Swaps | | | 51 | |
The following table is a summary by counterparty of the derivative instruments and collateral pledged/(received) included in the Fund’s Statement of Assets and Liabilities at June 30, 2022 (in thousands):
| | | Financial Derivative Assets | | Financial Derivative Liabilities | | | | | | | | | |
| Counterparty | | Forward
Foreign
Currency
Contracts | | Total | | Forward
Foreign
Currency
Contracts | | Total | | Net
Market
Value | | Collateral
Pledged
(Received) | | Net
Exposure |
| Emerging Markets Debt | | | | | | | | | | | | | | | | | | | | | | | | | | | | |
| Citibank N.A. | | | $47 | | | | $47 | | | | $(2) | | | | $(2) | | | | $45 | | | | $— | | | | $45 | |
| | | | $47 | | | | $47 | | | | $(2) | | | | $(2) | | | | | | | | | | | | | |
The net exposure represents the amount due from/(due to) the counterparty in the event of default. Any net exposure is generally due to changes in market value of the underlying derivative instruments on the last day of the period as timing of collateral movement occurs the following day.
| 122 | Semiannual Report | June 30, 2022 |
Notes to Financial Statements (information as of June 30, 2022 is unaudited)
(7) Fund Share Transactions
The following tables summarize the activity in capital shares of each Fund for the period ended June 30, 2022 (in thousands):
| | | Class N |
| | | Dollars | | | Shares |
| Fund | | Sales | | | Reinvest | | | Redemptions | | | Total | | | Sales | | | Reinvest | | | Redemptions | | | Total |
| Growth | | $ | 2,920 | | | $ | — | | | $ | 4,130 | | | $ | (1,210 | ) | | | 262 | | | | — | | | | 395 | | | | (133 | ) |
| Large Cap Growth | | | 38,158 | | | | — | | | | 46,936 | | | | (8,778 | ) | | | 1,826 | | | | — | | | | 2,424 | | | | (598 | ) |
| Mid Cap Growth | | | 88 | | | | — | | | | 521 | | | | (433 | ) | | | 9 | | | | — | | | | 46 | | | | (37 | ) |
| Small-Mid Cap Growth | | | 10,287 | | | | — | | | | 37,670 | | | | (27,383 | ) | | | 370 | | | | — | | | | 1,387 | | | | (1,017 | ) |
| Small Cap Growth | | | 23,504 | | | | — | | | | 45,275 | | | | (21,771 | ) | | | 832 | | | | — | | | | 1,686 | | | | (854 | ) |
| Small Cap Value | | | 157 | | | | — | | | | 400 | | | | (243 | ) | | | 5 | | | | — | | | | 13 | | | | (8 | ) |
| Global Leaders | | | 214 | | | | — | | | | 1,117 | | | | (903 | ) | | | 12 | | | | — | | | | 72 | | | | (60 | ) |
| International Leaders | | | 12,019 | | | | — | | | | 9,086 | | | | 2,933 | | | | 587 | | | | — | | | | 453 | | | | 134 | |
| International Growth | | | 4,338 | | | | — | | | | 13,039 | | | | (8,701 | ) | | | 142 | | | | — | | | | 436 | | | | (294 | ) |
| International Small Cap Growth | | | 12 | | | | — | | | | 402 | | | | (390 | ) | | | — | | | | — | | | | 29 | | | | (29 | ) |
| Emerging Markets Leaders | | | 2,844 | | | | — | | | | 3,616 | | | | (772 | ) | | | 288 | | | | — | | | | 365 | | | | (77 | ) |
| Emerging Markets Growth | | | 6,391 | | | | — | | | | 9,365 | | | | (2,974 | ) | | | 474 | | | | — | | | | 687 | | | | (213 | ) |
| Emerging Markets Small Cap Growth | | | 517 | | | | — | | | | 333 | | | | 184 | | | | 24 | | | | — | | | | 16 | | | | 8 | |
| Macro Allocation | | | 471 | | | | — | | | | 3,290 | | | | (2,819 | ) | | | 43 | | | | — | | | | 302 | | | | (259 | ) |
| | | | | | | | | | | | | | | | | | | | | | | | | | | | | | | | | |
| | | Class I |
| | | Dollars | | | Shares |
| Fund | | Sales | | | Reinvest | | | Redemptions | | | Total | | | Sales | | | Reinvest | | | Redemptions | | | Total |
| Growth | | $ | 7,832 | | | $ | — | | | $ | 34,501 | | | $ | (26,669 | ) | | | 605 | | | | — | | | | 2,716 | | | | (2,111 | ) |
| Large Cap Growth | | | 487,615 | | | | — | | | | 133,456 | | | | 354,159 | | | | 22,449 | | | | — | | | | 6,608 | | | | 15,841 | |
| Mid Cap Growth | | | 2,717 | | | | — | | | | 3,184 | | | | (467 | ) | | | 238 | | | | — | | | | 265 | | | | (27 | ) |
| Mid Cap Value (a) | | | 54 | | | | — | | | | — | | | | 54 | | | | 5 | | | | — | | | | — | | | | 5 | |
| Small-Mid Cap Core | | | 66,064 | | | | — | | | | 15,096 | | | | 50,968 | | | | 4,257 | | | | — | | | | 1,029 | | | | 3,228 | |
| Small-Mid Cap Growth | | | 198,807 | | | | — | | | | 376,148 | | | | (177,341 | ) | | | 6,760 | | | | — | | | | 12,951 | | | | (6,191 | ) |
| Small Cap Growth | | | 43,030 | | | | — | | | | 46,187 | | | | (3,157 | ) | | | 1,329 | | | | — | | | | 1,498 | | | | (169 | ) |
| Small Cap Value | | | 59,657 | | | | — | | | | 86,783 | | | | (27,126 | ) | | | 1,895 | | | | — | | | | 2,777 | | | | (882 | ) |
| Global Leaders | | | 3,297 | | | | — | | | | 6,526 | | | | (3,229 | ) | | | 209 | | | | — | | | | 429 | | | | (220 | ) |
| International Leaders | | | 103,814 | | | | — | | | | 131,984 | | | | (28,170 | ) | | | 5,278 | | | �� | — | | | | 6,506 | | | | (1,228 | ) |
| International Growth | | | 146,031 | | | | — | | | | 135,139 | | | | 10,892 | | | | 4,803 | | | | — | | | | 4,361 | | | | 442 | |
| International Small Cap Growth | | | 22,249 | | | | — | | | | 12,625 | | | | 9,624 | | | | 1,819 | | | | — | | | | 1,037 | | | | 782 | |
| Emerging Markets Leaders | | | 21,874 | | | | — | | | | 10,630 | | | | 11,244 | | | | 2,307 | | | | — | | | | 1,122 | | | | 1,185 | |
| Emerging Markets Growth | | | 136,387 | | | | — | | | | 70,389 | | | | 65,998 | | | | 10,366 | | | | — | | | | 5,419 | | | | 4,947 | |
| Emerging Markets Small Cap Growth | | | 22,600 | | | | — | | | | 23,734 | | | | (1,134 | ) | | | 1,096 | | | | — | | | | 1,176 | | | | (80 | ) |
| China Growth | | | 6 | | | | — | | | | 1,956 | | | | (1,950 | ) | | | 1 | | | | — | | | | 279 | | | | (278 | ) |
| Emerging Markets Debt | | | 354 | | | | 40 | | | | 648 | | | | (254 | ) | | | 41 | | | | 5 | | | | 81 | | | | (35 | ) |
| Macro Allocation | | | 3,936 | | | | — | | | | 51,784 | | | | (47,848 | ) | | | 362 | | | | — | | | | 4,859 | | | | (4,497 | ) |
| (a) | For the period from March 16, 2022 (Commencement of Operations) to June 30, 2022. |
| | | |
| June 30, 2022 | William Blair Funds | 123 |
Notes to Financial Statements (information as of June 30, 2022 is unaudited)
| | | Institutional/Class R6 |
| | | Dollars | | | Shares |
| Fund | | Sales | | | Reinvest | | | Redemptions | | | Total | | | Sales | | | Reinvest | | | Redemptions | | | Total |
| Growth | | $ | 967 | | | $ | — | | | $ | 583 | | | $ | 384 | | | | 76 | | | | — | | | | 46 | | | | 30 | |
| Large Cap Growth | | | 79,042 | | | | — | | | | 21,556 | | | | 57,486 | | | | 3,800 | | | | — | | | | 1,031 | | | | 2,769 | |
| Mid Cap Growth | | | 10 | | | | — | | | | 7 | | | | 3 | | | | 1 | | | | — | | | | 1 | | | | — | |
| Mid Cap Value (a) | | | 1,530 | | | | — | | | | — | | | | 1,530 | | | | 151 | | | | — | | | | — | | | | 151 | |
| Small-Mid Cap Core | | | 5,437 | | | | — | | | | 481 | | | | 4,956 | | | | 367 | | | | — | | | | 32 | | | | 335 | |
| Small-Mid Cap Growth | | | 110,279 | | | | — | | | | 15,393 | | | | 94,886 | | | | 4,133 | | | | — | | | | 520 | | | | 3,613 | |
| Small Cap Growth | | | 16,873 | | | | — | | | | 11,602 | | | | 5,271 | | | | 517 | | | | — | | | | 365 | | | | 152 | |
| Small Cap Value | | | 44,940 | | | | — | | | | 595,305 | | | | (550,365 | ) | | | 1,439 | | | | — | | | | 17,608 | | | | (16,169 | ) |
| Global Leaders | | | 12 | | | | — | | | | 284 | | | | (272 | ) | | | 1 | | | | — | | | | 18 | | | | (17 | ) |
| International Leaders | | | 163,729 | | | | — | | | | 28,106 | | | | 135,623 | | | | 7,338 | | | | — | | | | 1,508 | | | | 5,830 | |
| International Growth | | | 3,270 | | | | — | | | | 10,809 | | | | (7,539 | ) | | | 99 | | | | — | | | | 351 | | | | (252 | ) |
| Institutional International Growth | | | 119,961 | | | | — | | | | 79,485 | | | | 40,476 | | | | 8,566 | | | | — | | | | 5,228 | | | | 3,338 | |
| International Small Cap Growth | | | 2,083 | | | | — | | | | 10,092 | | | | (8,009 | ) | | | 160 | | | | — | | | | 826 | | | | (666 | ) |
| Emerging Markets Leaders | | | 41,109 | | | | — | | | | 15,765 | | | | 25,344 | | | | 4,286 | | | | — | | | | 1,577 | | | | 2,709 | |
| Emerging Markets Growth | | | 35,794 | | | | — | | | | 128,275 | | | | (92,481 | ) | | | 2,633 | | | | — | | | | 9,519 | | | | (6,886 | ) |
| Emerging Markets Small Cap Growth | | | 42,993 | | | | — | | | | 72,924 | | | | (29,931 | ) | | | 2,100 | | | | — | | | | 3,660 | | | | (1,560 | ) |
| China Growth | | | 128 | | | | — | | | | 122 | | | | 6 | | | | 15 | | | | — | | | | 17 | | | | (2 | ) |
| Emerging Markets Debt | | | 3,864 | | | | 1,395 | | | | 190 | | | | 5,069 | | | | 464 | | | | 168 | | | | 23 | | | | 609 | |
| Macro Allocation | | | — | | | | — | | | | 114,335 | | | | (114,335 | ) | | | — | | | | — | | | | 10,696 | | | | (10,696 | ) |
| | | | | | | | | | | | | | | | | | | | | | | | | | | | | | | | | |
| | | Net Change in Net Assets Relating to Fund Share Activity |
| | | Dollars | | | Shares |
| Fund | | Sales | | | Reinvest | | | Redemptions | | | Total | | | Sales | | | Reinvest | | | Redemptions | | | Total |
| Growth | | $ | 11,719 | | | $ | — | | | $ | 39,214 | | | $ | (27,495 | ) | | | 943 | | | | — | | | | 3,157 | | | | (2,214 | ) |
| Large Cap Growth | | | 604,815 | | | | — | | | | 201,948 | | | | 402,867 | | | | 28,075 | | | | — | | | | 10,063 | | | | 18,012 | |
| Mid Cap Growth | | | 2,815 | | | | — | | | | 3,712 | | | | (897 | ) | | | 248 | | | | — | | | | 312 | | | | (64 | ) |
| Mid Cap Value (a) | | | 1,584 | | | | — | | | | — | | | | 1,584 | | | | 156 | | | | — | | | | — | | | | 156 | |
| Small-Mid Cap Core | | | 71,501 | | | | — | | | | 15,577 | | | | 55,924 | | | | 4,624 | | | | — | | | | 1,061 | | | | 3,563 | |
| Small-Mid Cap Growth | | | 319,373 | | | | — | | | | 429,211 | | | | (109,838 | ) | | | 11,263 | | | | — | | | | 14,858 | | | | (3,595 | ) |
| Small Cap Growth | | | 83,407 | | | | — | | | | 103,064 | | | | (19,657 | ) | | | 2,678 | | | | — | | | | 3,549 | | | | (871 | ) |
| Small Cap Value | | | 104,754 | | | | — | | | | 682,488 | | | | (577,734 | ) | | | 3,339 | | | | — | | | | 20,398 | | | | (17,059 | ) |
| Global Leaders | | | 3,523 | | | | — | | | | 7,927 | | | | (4,404 | ) | | | 222 | | | | — | | | | 519 | | | | (297 | ) |
| International Leaders | | | 279,562 | | | | — | | | | 169,176 | | | | 110,386 | | | | 13,203 | | | | — | | | | 8,467 | | | | 4,736 | |
| International Growth | | | 153,639 | | | | — | | | | 158,987 | | | | (5,348 | ) | | | 5,044 | | | | — | | | | 5,148 | | | | (104 | ) |
| Institutional International Growth | | | 119,961 | | | | — | | | | 79,485 | | | | 40,476 | | | | 8,566 | | | | — | | | | 5,228 | | | | 3,338 | |
| International Small Cap Growth | | | 24,344 | | | | — | | | | 23,119 | | | | 1,225 | | | | 1,979 | | | | — | | | | 1,892 | | | | 87 | |
| Emerging Markets Leaders | | | 65,827 | | | | — | | | | 30,011 | | | | 35,816 | | | | 6,881 | | | | — | | | | 3,064 | | | | 3,817 | |
| Emerging Markets Growth | | | 178,572 | | | | — | | | | 208,029 | | | | (29,457 | ) | | | 13,473 | | | | — | | | | 15,625 | | | | (2,152 | ) |
| Emerging Markets Small Cap Growth | | | 66,110 | | | | — | | | | 96,991 | | | | (30,881 | ) | | | 3,220 | | | | — | | | | 4,852 | | | | (1,632 | ) |
| China Growth | | | 134 | | | | — | | | | 2,078 | | | | (1,944 | ) | | | 16 | | | | — | | | | 296 | | | | (280 | ) |
| Emerging Markets Debt | | | 4,218 | | | | 1,435 | | | | 838 | | | | 4,815 | | | | 505 | | | | 173 | | | | 104 | | | | 574 | |
| Macro Allocation | | | 4,407 | | | | — | | | | 169,409 | | | | (165,002 | ) | | | 405 | | | | — | | | | 15,857 | | | | (15,452 | ) |
| (a) | For the period from March 16, 2022 (Commencement of Operations) to June 30, 2022. |
| | | |
| 124 | Semiannual Report | June 30, 2022 |
Notes to Financial Statements (information as of June 30, 2022 is unaudited)
The following tables summarize the activity in capital shares of each Fund for the year ended December 31, 2021 (in thousands):
| | | Class N |
| | | Dollars | | | Shares |
| Fund | | Sales | | | Reinvest | | | Redemptions | | | Total | | | Sales | | | Reinvest | | | Redemptions | | | Total |
| Growth | | $ | 3,638 | | | $ | 4,724 | | | $ | 9,192 | | | $ | (830 | ) | | | 280 | | | | 412 | | | | 758 | | | | (66 | ) |
| Large Cap Growth | | | 65,433 | | | | 8,488 | | | | 41,026 | | | | 32,895 | | | | 2,867 | | | | 356 | | | | 1,830 | | | | 1,393 | |
| Mid Cap Growth | | | 267 | | | | 225 | | | | 1,283 | | | | (791 | ) | | | 20 | | | | 18 | | | | 97 | | | | (59 | ) |
| Small-Mid Cap Growth | | | 36,098 | | | | 21,174 | | | | 142,815 | | | | (85,543 | ) | | | 1,030 | | | | 694 | | | | 4,074 | | | | (2,350 | ) |
| Small Cap Growth | | | 31,616 | | | | 31,635 | | | | 54,012 | | | | 9,239 | | | | 821 | | | | 1,043 | | | | 1,468 | | | | 396 | |
| Small Cap Value (a) | | | 198 | | | | 114 | | | | 6,875 | | | | (6,563 | ) | | | 5 | | | | 4 | | | | 203 | | | | (194 | ) |
| Global Leaders | | | 815 | | | | 709 | | | | 870 | | | | 654 | | | | 41 | | | | 38 | | | | 45 | | | | 34 | |
| International Leaders | | | 36,810 | | | | 1,209 | | | | 11,899 | | | | 26,120 | | | | 1,526 | | | | 51 | | | | 495 | | | | 1,082 | |
| International Growth | | | 18,167 | | | | 30,895 | | | | 37,544 | | | | 11,518 | | | | 440 | | | | 847 | | | | 933 | | | | 354 | |
| International Small Cap Growth | | | 502 | | | | 443 | | | | 332 | | | | 613 | | | | 27 | | | | 28 | | | | 19 | | | | 36 | |
| Emerging Markets Leaders | | | 6,412 | | | | 95 | | | | 5,943 | | | | 564 | | | | 494 | | | | 9 | | | | 454 | | | | 49 | |
| Emerging Markets Growth | | | 33,625 | | | | 4,793 | | | | 22,748 | | | | 15,670 | | | | 1,723 | | | | 313 | | | | 1,209 | | | | 827 | |
| Emerging Markets Small Cap Growth | | | 247 | | | | 333 | | | | 516 | | | | 64 | | | | 10 | | | | 15 | | | | 22 | | | | 3 | |
| Macro Allocation | | | 893 | | | | 145 | | | | 1,983 | | | | (945 | ) | | | 81 | | | | 13 | | | | 179 | | | | (85 | ) |
| | | | | | | | | | | | | | | | | | | | | | | | | | | | | | | | | |
| | | Class I |
| | | Dollars | | | Shares |
| Fund | | Sales | | | Reinvest | | | Redemptions | | | Total | | | Sales | | | Reinvest | | | Redemptions | | | Total |
| Growth | | $ | 19,229 | | | $ | 30,211 | | | $ | 28,892 | | | $ | 20,548 | | | | 1,245 | | | | 2,088 | | | | 1,918 | | | | 1,415 | |
| Large Cap Growth | | | 277,571 | | | | 25,384 | | | | 122,960 | | | | 179,995 | | | | 11,137 | | | | 996 | | | | 5,236 | | | | 6,897 | |
| Mid Cap Growth | | | 8,724 | | | | 1,875 | | | | 46,351 | | | | (35,752 | ) | | | 592 | | | | 134 | | | | 3,013 | | | | (2,287 | ) |
| Small-Mid Cap Core | | | 34,907 | | | | — | | | | 5,431 | | | | 29,476 | | | | 2,343 | | | | — | | | | 359 | | | | 1,984 | |
| Small-Mid Cap Growth | | | 487,031 | | | | 209,644 | | | | 1,385,928 | | | | (689,253 | ) | | | 13,062 | | | | 6,384 | | | | 37,145 | | | | (17,699 | ) |
| Small Cap Growth | | | 84,017 | | | | 63,719 | | | | 121,526 | | | | 26,210 | | | | 1,948 | | | | 1,786 | | | | 2,923 | | | | 811 | |
| Small Cap Value (a) | | | 23,757 | | | | 39,018 | | | | 155,752 | | | | (92,977 | ) | | | 709 | | | | 1,209 | | | | 4,486 | | | | (2,568 | ) |
| Global Leaders | | | 11,174 | | | | 6,699 | | | | 12,223 | | | | 5,650 | | | | 580 | | | | 358 | | | | 629 | | | | 309 | |
| International Leaders | | | 277,059 | | | | 16,022 | | | | 125,675 | | | | 167,406 | | | | 11,454 | | | | 677 | | | | 5,165 | | | | 6,966 | |
| International Growth | | | 114,128 | | | | 173,395 | | | | 481,271 | | | | (193,748 | ) | | | 2,731 | | | | 4,615 | | | | 11,607 | | | | (4,261 | ) |
| International Small Cap Growth | | | 20,954 | | | | 18,099 | | | | 42,075 | | | | (3,022 | ) | | | 1,120 | | | | 1,121 | | | | 2,340 | | | | (99 | ) |
| Emerging Markets Leaders | | | 73,454 | | | | 3,030 | | | | 90,773 | | | | (14,289 | ) | | | 5,753 | | | | 274 | | | | 6,949 | | | | (922 | ) |
| Emerging Markets Growth | | | 167,716 | | | | 29,260 | | | | 91,992 | | | | 104,984 | | | | 8,926 | | | | 1,876 | | | | 4,848 | | | | 5,954 | |
| Emerging Markets Small Cap Growth | | | 38,960 | | | | 13,160 | | | | 39,950 | | | | 12,170 | | | | 1,569 | | | | 569 | | | | 1,663 | | | | 475 | |
| China Growth (b) | | | 5,955 | | | | — | | | | 13 | | | | 5,942 | | | | 581 | | | | — | | | | 1 | | | | 580 | |
| Emerging Markets Debt (c) | | | 1,531 | | | | 35 | | | | 26 | | | | 1,540 | | | | 154 | | | | 4 | | | | 3 | | | | 155 | |
| Macro Allocation | | | 16,639 | | | | 1,737 | | | | 123,374 | | | | (104,998 | ) | | | 1,501 | | | | 162 | | | | 11,191 | | | | (9,528 | ) |
| (a) | The Small Cap Value Fund figures reflect the fiscal period from November 1, 2021 to December 31, 2021. |
| (b) | For the period from August 27, 2021 (Commencement of Operations) to December 31, 2021. |
| (c) | For the period from May 25, 2021 (Commencement of Operations) to December 31, 2021. |
| | | |
| June 30, 2022 | William Blair Funds | 125 |
Notes to Financial Statements (information as of June 30, 2022 is unaudited)
| | | Institutional/Class R6 |
| | | Dollars | | | Shares |
| Fund | | Sales | | | Reinvest | | | Redemptions | | | Total | | | Sales | | | Reinvest | | | Redemptions | | | Total |
| Growth | | $ | 1,861 | | | $ | 1,576 | | | $ | 1,636 | | | $ | 1,801 | | | | 122 | | | | 109 | | | | 109 | | | | 122 | |
| Large Cap Growth | | | 76,686 | | | | 9,570 | | | | 68,921 | | | | 17,335 | | | | 3,270 | | | | 376 | | | | 3,039 | | | | 607 | |
| Mid Cap Growth | | | — | | | | 27 | | | | — | | | | 27 | | | | — | | | | 2 | | | | — | | | | 2 | |
| Small-Mid Cap Core | | | 21,148 | | | | — | | | | 579 | | | | 20,569 | | | | 1,409 | | | | — | | | | 38 | | | | 1,371 | |
| Small-Mid Cap Growth | | | 237,266 | | | | 27,797 | | | | 44,182 | | | | 220,881 | | | | 6,258 | | | | 845 | | | | 1,178 | | | | 5,925 | |
| Small Cap Growth | | | 22,795 | | | | 17,709 | | | | 11,517 | | | | 28,987 | | | | 538 | | | | 495 | | | | 263 | | | | 770 | |
| Small Cap Value (a) | | | 132,843 | | | | 38,299 | | | | 30,838 | | | | 140,304 | | | | 3,809 | | | | 1,187 | | | | 877 | | | | 4,119 | |
| Global Leaders | | | 1,959 | | | | 299 | | | | 74 | | | | 2,184 | | | | 108 | | | | 16 | | | | 4 | | | | 120 | |
| International Leaders | | | 69,853 | | | | 18,439 | | | | 155,620 | | | | (67,328 | ) | | | 2,934 | | | | 779 | | | | 6,494 | | | | (2,781 | ) |
| International Growth | | | 67,401 | | | | 6,728 | | | | 53,921 | | | | 20,208 | | | | 1,592 | | | | 179 | | | | 1,254 | | | | 517 | |
| Institutional International Growth | | | 48,760 | | | | 181,112 | | | | 211,193 | | | | 18,679 | | | | 2,286 | | | | 9,812 | | | | 9,861 | | | | 2,237 | |
| International Small Cap Growth | | | 43,609 | | | | 30,924 | | | | 6,391 | | | | 68,142 | | | | 2,217 | | | | 1,903 | | | | 343 | | | | 3,777 | |
| Emerging Markets Leaders | | | 327,586 | | | | 32,387 | | | | 70,570 | | | | 289,403 | | | | 25,256 | | | | 2,931 | | | | 5,236 | | | | 22,951 | |
| Emerging Markets Growth | | | 102,244 | | | | 133,282 | | | | 371,618 | | | | (136,092 | ) | | | 5,116 | | | | 8,447 | | | | 18,743 | | | | (5,180 | ) |
| Emerging Markets Small Cap Growth | | | 203,333 | | | | 26,845 | | | | 61,716 | | | | 168,462 | | | | 8,175 | | | | 1,159 | | | | 2,519 | | | | 6,815 | |
| China Growth (b) | | | 1,767 | | | | — | | | | — | | | | 1,767 | | | | 177 | | | | — | | | | — | | | | 177 | |
| Emerging Markets Debt (c) | | | 51,069 | | | | 1,240 | | | | 111 | | | | 52,198 | | | | 5,101 | | | | 127 | | | | 11 | | | | 5,217 | |
| Macro Allocation | | | 457 | | | | 2,917 | | | | 64,172 | | | | (60,798 | ) | | | 41 | | | | 273 | | | | 5,724 | | | | (5,410 | ) |
| | | | | | | | | | | | | | | | | | | | | | | | | | | | | | | | | |
| | | Net Change in Net Assets Relating to Fund Share Activity |
| | | Dollars | | | Shares |
| Fund | | Sales | | | Reinvest | | | Redemptions | | | Total | | | Sales | | | Reinvest | | | Redemptions | | | Total |
| Growth | | $ | 24,728 | | | $ | 36,511 | | | $ | 39,720 | | | $ | 21,519 | | | | 1,647 | | | | 2,609 | | | | 2,785 | | | | 1,471 | |
| Large Cap Growth | | | 419,690 | | | | 43,442 | | | | 232,907 | | | | 230,225 | | | | 17,274 | | | | 1,728 | | | | 10,105 | | | | 8,897 | |
| Mid Cap Growth | | | 8,991 | | | | 2,127 | | | | 47,634 | | | | (36,516 | ) | | | 612 | | | | 154 | | | | 3,110 | | | | (2,344 | ) |
| Small-Mid Cap Core | | | 56,055 | | | | — | | | | 6,010 | | | | 50,045 | | | | 3,752 | | | | — | | | | 397 | | | | 3,355 | |
| Small-Mid Cap Growth | | | 760,395 | | | | 258,615 | | | | 1,572,925 | | | | (553,915 | ) | | | 20,350 | | | | 7,923 | | | | 42,397 | | | | (14,124 | ) |
| Small Cap Growth | | | 138,428 | | | | 113,063 | | | | 187,055 | | | | 64,436 | | | | 3,307 | | | | 3,324 | | | | 4,654 | | | | 1,977 | |
| Small Cap Value (a) | | | 156,798 | | | | 77,431 | | | | 193,465 | | | | 40,764 | | | | 4,523 | | | | 2,400 | | | | 5,566 | | | | 1,357 | |
| Global Leaders | | | 13,948 | | | | 7,707 | | | | 13,167 | | | | 8,488 | | | | 729 | | | | 412 | | | | 678 | | | | 463 | |
| International Leaders | | | 383,722 | | | | 35,670 | | | | 293,194 | | | | 126,198 | | | | 15,914 | | | | 1,507 | | | | 12,154 | | | | 5,267 | |
| International Growth | | | 199,696 | | | | 211,018 | | | | 572,736 | | | | (162,022 | ) | | | 4,763 | | | | 5,641 | | | | 13,794 | | | | (3,390 | ) |
| Institutional International Growth | | | 48,760 | | | | 181,112 | | | | 211,193 | | | | 18,679 | | | | 2,286 | | | | 9,812 | | | | 9,861 | | | | 2,237 | |
| International Small Cap Growth | | | 65,065 | | | | 49,466 | | | | 48,798 | | | | 65,733 | | | | 3,364 | | | | 3,052 | | | | 2,702 | | | | 3,714 | |
| Emerging Markets Leaders | | | 407,452 | | | | 35,512 | | | | 167,286 | | | | 275,678 | | | | 31,503 | | | | 3,214 | | | | 12,639 | | | | 22,078 | |
| Emerging Markets Growth | | | 303,585 | | | | 167,335 | | | | 486,358 | | | | (15,438 | ) | | | 15,765 | | | | 10,636 | | | | 24,800 | | | | 1,601 | |
| Emerging Markets Small Cap Growth | | | 242,540 | | | | 40,338 | | | | 102,182 | | | | 180,696 | | | | 9,754 | | | | 1,743 | | | | 4,204 | | | | 7,293 | |
| China Growth (b) | | | 7,722 | | | | — | | | | 13 | | | | 7,709 | | | | 758 | | | | — | | | | 1 | | | | 757 | |
| Emerging Markets Debt (c) | | | 52,600 | | | | 1,275 | | | | 137 | | | | 53,738 | | | | 5,255 | | | | 131 | | | | 14 | | | | 5,372 | |
| Macro Allocation | | | 17,989 | | | | 4,799 | | | | 189,529 | | | | (166,741 | ) | | | 1,623 | | | | 448 | | | | 17,094 | | | | (15,023 | ) |
| (a) | The Small Cap Value Fund figures reflect the fiscal period from November 1, 2021 to December 31, 2021. |
| (b) | For the period from August 27, 2021 (Commencement of Operations) to December 31, 2021. |
| (c) | For the period from May 25, 2021 (Commencement of Operations) to December 31, 2021. |
| | | |
| 126 | Semiannual Report | June 30, 2022 |
Notes to Financial Statements (information as of June 30, 2022 is unaudited)
The following tables summarize the activity in capital shares of the Small Cap Value Fund for the year ended October 31, 2021 (dollar amounts in thousands):
| | | 2021 | |
| | | Dollars | | | Shares | |
| | | Sales | | Issued in
Reorga-
nization | | | Reinvest | | Redemptions | | | Total | | | Sales | | | Issued in
Reorga-
nization | | | Reinvest | | | Redemptions | | | Total | |
| Class N (a) | | $ | 715 | | | $ | 10,216 | | | $ | — | | | $ | 1,521 | | | $ | 9,410 | | | | 21,895 | | | | 317,775 | | | | — | | | | 46,864 | | | | 292,806 | |
| Class I | | | 398,983 | | | | 24,461 | | | | 181,788 | | | | 1,146,946 | | | | (541,714 | ) | | | 12,568,399 | | | | 760,891 | | | | 5,519,000 | | | | 34,394,651 | | | | (15,546,361 | ) |
| Class R6 (a) | | | 856,747 | | | | 11,057 | | | | — | | | | 11,133 | | | | 856,671 | | | | 25,855,620 | | | | 343,951 | | | | — | | | | 330,341 | | | | 25,869,230 | |
| | | $ | 1,256,445 | | | $ | 45,734 | | | $ | 181,788 | | | $ | 1,159,600 | | | $ | 324,367 | | | | | | | | | | | | | | | | | | | | | |
| (a) | For the period from July 17, 2021 (Commencement of Operations) to October 31, 2021. |
(8) Subsequent Events
Upon recommendation of the Adviser, the Board of Trustees determined that it was in the best interest of Macro Allocation Fund to redeem all shares of Macro Allocation Fund outstanding on or before July 29, 2022, and then to terminate Macro Allocation Fund. All outstanding shares of Macro Allocation Fund were redeemed on July 29, 2022.
The Board of Trustees approved a change to the investment objective of Emerging Markets Debt Fund. Effective October 3, 2022, the investment objective of Emerging Markets Debt Fund will change to “The Emerging Markets Debt Fund seeks to provide attractive risk-adjusted returns relative to the Fund’s benchmark.”
The Funds have evaluated subsequent events through the date of issuance of the Funds’ financial statements and have determined there are no other impacts to the Funds’ financial statements.
| June 30, 2022 | William Blair Funds | 127 |
Financial Highlights — For a share outstanding throughout each period
Growth Fund
| | | Class N | |
| | | (unaudited)
Period Ended
June 30, | | | Years Ended December 31, | |
| | | 2022 | | | 2021 | | | 2020 | | | 2019 | | | 2018 | | | 2017 | |
| Net asset value, beginning of year | | | $ | 11.81 | | | $ | 11.15 | | | $ | 9.45 | | | $ | 7.91 | | | $ | 10.27 | | | $ | 11.41 | |
| Income (loss) from investment operations: | | | | | | | | | | | | | | | | | | | | | | | | | |
| Net investment income (loss) | | | | (0.03 | ) | | | (0.08 | ) | | | (0.05 | ) | | | (0.03 | ) | | | (0.04 | ) | | | (0.02 | ) |
| Net realized and unrealized gain (loss) on investments | | | | (3.34 | ) | | | 2.49 | | | | 3.43 | | | | 2.54 | | | | 0.75 | | | | 2.78 | |
| Total from investment operations | | | | (3.37 | ) | | | 2.41 | | | | 3.38 | | | | 2.51 | | | | 0.71 | | | | 2.76 | |
| Less distributions from: | | | | | | | | | | | | | | | | | | | | | | | | | |
| Net investment income | | | | — | | | | — | | | | — | | | | — | | | | — | | | | — | |
| Net realized gain | | | | — | | | | 1.75 | | | | 1.68 | | | | 0.97 | | | | 3.07 | | | | 3.90 | |
| Total distributions | | | | — | | | | 1.75 | | | | 1.68 | | | | 0.97 | | | | 3.07 | | | | 3.90 | |
| Net asset value, end of year | | | $ | 8.44 | | | $ | 11.81 | | | $ | 11.15 | | | $ | 9.45 | | | $ | 7.91 | | | $ | 10.27 | |
| Total return (%)* | | | | (28.54 | ) | | | 22.09 | | | | 35.97 | | | | 31.97 | | | | 5.10 | | | | 24.35 | |
| Ratios to average daily net assets (%)**: | | | | | | | | | | | | | | | | | | | | | | | | | |
| Expenses, before waivers and reimbursements | | | | 1.24 | | | | 1.21 | | | | 1.26 | | | | 1.24 | | | | 1.22 | | | | 1.20 | |
| Expenses, net of waivers and reimbursements | | | | 1.20 | | | | 1.20 | | | | 1.20 | | | | 1.20 | | | | 1.20 | | | | 1.20 | |
| Net investment income (loss), before waivers and reimbursements | | | | (0.65 | ) | | | (0.67 | ) | | | (0.55 | ) | | | (0.35 | ) | | | (0.36 | ) | | | (0.14 | ) |
| Net investment income (loss), net of waivers and reimbursements | | | | (0.61 | ) | | | (0.66 | ) | | | (0.49 | ) | | | (0.31 | ) | | | (0.34 | ) | | | (0.14 | ) |
| Class N net assets at the end of the year (in thousands) | | | $ | 25,185 | | | $ | 36,807 | | | $ | 35,494 | | | $ | 32,710 | | | $ | 38,370 | | | $ | 34,886 | |
| Portfolio turnover rate (%)* | | | | 15 | | | | 30 | | | | 46 | | | | 39 | | | | 46 | | | | 38 | |
| | | | | | | | | | | | | | | | | | | | | | | | | | |
| | | Class I | |
| | | (unaudited)
Period Ended
June 30, | | | Years Ended December 31, | |
| | | 2022 | | | 2021 | | | 2020 | | | 2019 | | | 2018 | | | 2017 | |
| Net asset value, beginning of year | | | $ | 14.91 | | | $ | 13.64 | | | $ | 11.25 | | | $ | 9.25 | | | $ | 11.51 | | | $ | 12.39 | |
| Income (loss) from investment operations: | | | | | | | | | | | | | | | | | | | | | | | | | |
| Net investment income (loss) | | | | (0.02 | ) | | | (0.05 | ) | | | (0.03 | ) | | | (0.00 | )^ | | | (0.01 | ) | | | 0.02 | |
| Net realized and unrealized gain (loss) on investments | | | | (4.22 | ) | | | 3.07 | | | | 4.10 | | | | 2.97 | | | | 0.82 | | | | 3.02 | |
| Total from investment operations | | | | (4.24 | ) | | | 3.02 | | | | 4.07 | | | | 2.97 | | | | 0.81 | | | | 3.04 | |
| Less distributions from: | | | | | | | | | | | | | | | | | | | | | | | | | |
| Net investment income | | | | — | | | | — | | | | — | | | | — | | | | 0.00 | ^ | | | 0.02 | |
| Net realized gain | | | | — | | | | 1.75 | | | | 1.68 | | | | 0.97 | | | | 3.07 | | | | 3.90 | |
| Total distributions | | | | — | | | | 1.75 | | | | 1.68 | | | | 0.97 | | | | 3.07 | | | | 3.92 | |
| Net asset value, end of year | | | $ | 10.67 | | | $ | 14.91 | | | $ | 13.64 | | | $ | 11.25 | | | $ | 9.25 | | | $ | 11.51 | |
| Total return (%)* | | | | (28.44 | ) | | | 22.54 | | | | 36.35 | | | | 32.32 | | | | 5.42 | | | | 24.64 | |
| Ratios to average daily net assets (%)**: | | | | | | | | | | | | | | | | | | | | | | | | | |
| Expenses | | | | 0.92 | | | | 0.89 | | | | 0.93 | | | | 0.92 | | | | 0.91 | | | | 0.92 | |
| Net investment income (loss) | | | | (0.34 | ) | | | (0.35 | ) | | | (0.23 | ) | | | (0.03 | ) | | | (0.06 | ) | | | 0.12 | |
| Class I net assets at the end of the year (in thousands) | | | $ | 187,817 | | | $ | 293,900 | | | $ | 249,716 | | | $ | 220,660 | | | $ | 187,306 | | | $ | 318,848 | |
| Portfolio turnover rate (%)* | | | | 15 | | | | 30 | | | | 46 | | | | 39 | | | | 46 | | | | 38 | |
| * | Rates are not annualized for periods less than a year. |
| ** | Rates are annualized for periods less than a year. |
| ^ | Amount is less than $0.005 per share. |
Note: Net investment income (loss) per share is based on the average shares outstanding during the year.
Performance cited represents past performance. Past performance does not guarantee future results and current performance may be lower or higher than the data quoted. Results shown are annual returns, which assume reinvestment of dividends and capital gains. Investment returns and principal will fluctuate and you may have a gain or loss when you sell shares. For the most current month-end performance information, please call 1-800-742-7272 or visit our Web site at www.williamblairfunds.com.
| | | |
| 128 | Semiannual Report | June 30, 2022 |
Financial Highlights — For a share outstanding throughout each period
Growth Fund
| | | Class R6 | |
| | | (unaudited)
Period Ended
June 30, | | | Years Ended December 31, | |
| | | 2022 | | | 2021 | | | 2020 | | | 2019(a) | |
| Net asset value, beginning of year | | | $ | 14.95 | | | $ | 13.67 | | | $ | 11.26 | | | $ | 11.06 | |
| Income (loss) from investment operations: | | | | | | | | | | | | | | | | | |
| Net investment income (loss) | | | | (0.02 | ) | | | (0.04 | ) | | | (0.03 | ) | | | (0.00 | )^ |
| Net realized and unrealized gain (loss) on investments | | | | (4.22 | ) | | | 3.07 | | | | 4.12 | | | | 1.17 | |
| Total from investment operations | | | | (4.24 | ) | | | 3.03 | | | | 4.09 | | | | 1.17 | |
| Less distributions from: | | | | | | | | | | | | | | | | | |
| Net investment income | | | | — | | | | — | | | | — | | | | — | |
| Net realized gain | | | | — | | | | 1.75 | | | | 1.68 | | | | 0.97 | |
| Total distributions | | | | — | | | | 1.75 | | | | 1.68 | | | | 0.97 | |
| Net asset value, end of year | | | $ | 10.71 | | | $ | 14.95 | | | $ | 13.67 | | | $ | 11.26 | |
| Total return (%)* | | | | (28.36 | ) | | | 22.55 | | | | 36.50 | | | | 10.75 | |
| Ratios to average daily net assets (%)**: | | | | | | | | | | | | | | | | | |
| Expenses | | | | 0.86 | | | | 0.84 | | | | 0.87 | | | | 0.88 | |
| Net investment income (loss) | | | | (0.27 | ) | | | (0.29 | ) | | | (0.23 | ) | | | (0.06 | ) |
| Class R6 net assets at the end of the year (in thousands) | | | $ | 11,054 | | | $ | 14,993 | | | $ | 12,041 | | | $ | 217 | |
| Portfolio turnover rate (%)* | | | | 15 | | | | 30 | | | | 46 | | | | 39 | |
| (a) | For the period from May 2, 2019 (Commencement of Operations) to December 31, 2019. |
| * | Rates are not annualized for periods less than a year. |
| ** | Rates are annualized for periods less than a year. |
| ^ | Amount is less than $0.005 per share. |
Note: Net investment income (loss) per share is based on the average shares outstanding during the year.
Performance cited represents past performance. Past performance does not guarantee future results and current performance may be lower or higher than the data quoted. Results shown are annual returns, which assume reinvestment of dividends and capital gains. Investment returns and principal will fluctuate and you may have a gain or loss when you sell shares. For the most current month-end performance information, please call 1-800-742-7272 or visit our Web site at www.williamblairfunds.com.
| | | |
| June 30, 2022 | William Blair Funds | 129 |
Financial Highlights — For a share outstanding throughout each period
Large Cap Growth Fund
| | | Class N | |
| | | (unaudited)
Period Ended
June 30, | | | Years Ended December 31, | |
| | | 2022 | | | 2021 | | | 2020 | | | 2019 | | | 2018 | | | 2017 | |
| Net asset value, beginning of year | | | $ | 24.49 | | | $ | 20.03 | | | $ | 15.27 | | | $ | 11.99 | | | $ | 13.35 | | | $ | 10.26 | |
| Income (loss) from investment operations: | | | | | | | | | | | | | | | | | | | | | | | | | |
| Net investment income (loss) | | | | (0.03 | ) | | | (0.07 | ) | | | 0.01 | | | | 0.00 | ^ | | | (0.02 | ) | | | (0.02 | ) |
| Net realized and unrealized gain (loss) on investments | | | | (7.76 | ) | | | 5.65 | | | | 5.52 | | | | 4.29 | | | | 0.81 | | | | 3.19 | |
| Total from investment operations | | | | (7.79 | ) | | | 5.58 | | | | 5.53 | | | | 4.29 | | | | 0.79 | | | | 3.17 | |
| Less distributions from: | | | | | | | | | | | | | | | | | | | | | | | | | |
| Net investment income | | | | — | | | | — | | | | 0.00 | ^ | | | 0.01 | | | | — | | | | — | |
| Net realized gain | | | | — | | | | 1.12 | | | | 0.77 | | | | 1.00 | | | | 2.15 | | | | 0.08 | |
| Total distributions | | | | — | | | | 1.12 | | | | 0.77 | | | | 1.01 | | | | 2.15 | | | | 0.08 | |
| Net asset value, end of year | | | $ | 16.70 | | | $ | 24.49 | | | $ | 20.03 | | | $ | 15.27 | | | $ | 11.99 | | | $ | 13.35 | |
| Total return (%)* | | | | (31.81 | ) | | | 28.03 | | | | 36.30 | | | | 36.00 | | | | 4.96 | | | | 30.88 | |
| Ratios to average daily net assets (%)**: | | | | | | | | | | | | | | | | | | | | | | | | | |
| Expenses, before waivers and reimbursements | | | | 1.05 | | | | 1.05 | | | | 1.09 | | | | 1.12 | | | | 1.21 | | | | 1.19 | |
| Expenses, net of waivers and reimbursements | | | | 0.90 | | | | 0.90 | | | | 0.90 | | | | 0.95 | | | | 1.05 | | | | 1.05 | |
| Net investment income (loss), before waivers and reimbursements | | | | (0.42 | ) | | | (0.46 | ) | | | (0.15 | ) | | | (0.14 | ) | | | (0.33 | ) | | | (0.27 | ) |
| Net investment income (loss), net of waivers and reimbursements | | | | (0.27 | ) | | | (0.31 | ) | | | 0.04 | | | | 0.03 | | | | (0.17 | ) | | | (0.13 | ) |
| Class N net assets at the end of the year (in thousands) | | | $ | 128,452 | | | $ | 203,014 | | | $ | 138,152 | | | $ | 65,314 | | | $ | 41,361 | | | $ | 25,604 | |
| Portfolio turnover rate (%)* | | | | 13 | | | | 26 | | | | 35 | | | | 37 | | | | 47 | | | | 29 | |
| | | | | | | | | | | | | | | | | | | | | | | | | | |
| | | Class I | |
| | | (unaudited)
Period Ended
June 30, | | | Years Ended December 31, | |
| | | 2022 | | | 2021 | | | 2020 | | | 2019 | | | 2018 | | | 2017 | |
| Net asset value, beginning of year | | | $ | 26.18 | | | $ | 21.29 | | | $ | 16.19 | | | $ | 12.66 | | | $ | 13.97 | | | $ | 10.70 | |
| Income (loss) from investment operations: | | | | | | | | | | | | | | | | | | | | | | | | | |
| Net investment income (loss) | | | | (0.00 | )^ | | | (0.02 | ) | | | 0.06 | | | | 0.04 | | | | 0.01 | | | | 0.02 | |
| Net realized and unrealized gain (loss) on investments | | | | (8.31 | ) | | | 6.03 | | | | 5.85 | | | | 4.54 | | | | 0.85 | | | | 3.33 | |
| Total from investment operations | | | | (8.31 | ) | | | 6.01 | | | | 5.91 | | | | 4.58 | | | | 0.86 | | | | 3.35 | |
| Less distributions from: | | | | | | | | | | | | | | | | | | | | | | | | | |
| Net investment income | | | | — | | | | — | | | | 0.04 | | | | 0.05 | | | | 0.02 | | | | — | |
| Net realized gain | | | | — | | | | 1.12 | | | | 0.77 | | | | 1.00 | | | | 2.15 | | | | 0.08 | |
| Total distributions | | | | — | | | | 1.12 | | | | 0.81 | | | | 1.05 | | | | 2.17 | | | | 0.08 | |
| Net asset value, end of year | | | $ | 17.87 | | | $ | 26.18 | | | $ | 21.29 | | | $ | 16.19 | | | $ | 12.66 | | | $ | 13.97 | |
| Total return (%)* | | | | (31.74 | ) | | | 28.39 | | | | 36.59 | | | | 36.35 | | | | 5.21 | | | | 31.29 | |
| Ratios to average daily net assets (%)**: | | | | | | | | | | | | | | | | | | | | | | | | | |
| Expenses, before waivers and reimbursements | | | | 0.75 | | | | 0.75 | | | | 0.80 | | | | 0.81 | | | | 0.90 | | | | 0.90 | |
| Expenses, net of waivers and reimbursements | | | | 0.65 | | | | 0.65 | | | | 0.65 | | | | 0.70 | | | | 0.80 | | | | 0.80 | |
| Net investment income (loss), before waivers and reimbursements | | | | (0.11 | ) | | | (0.17 | ) | | | 0.16 | | | | 0.16 | | | | (0.01 | ) | | | 0.03 | |
| Net investment income (loss), net of waivers and reimbursements | | | | (0.01 | ) | | | (0.07 | ) | | | 0.31 | | | | 0.27 | | | | 0.09 | | | | 0.13 | |
| Class I net assets at the end of the year (in thousands) | | | $ | 739,937 | | | $ | 669,060 | | | $ | 397,370 | | | $ | 236,930 | | | $ | 137,599 | | | $ | 177,959 | |
| Portfolio turnover rate (%)* | | | | 13 | | | | 26 | | | | 35 | | | | 37 | | | | 47 | | | | 29 | |
| * | Rates are not annualized for periods less than a year. |
| ** | Rates are annualized for periods less than a year. |
| ^ | Amount is less than $0.005 per share. |
Note: Net investment income (loss) per share is based on the average shares outstanding during the year.
Performance cited represents past performance. Past performance does not guarantee future results and current performance may be lower or higher than the data quoted. Results shown are annual returns, which assume reinvestment of dividends and capital gains. Investment returns and principal will fluctuate and you may have a gain or loss when you sell shares. For the most current month-end performance information, please call 1-800-742-7272 or visit our Web site at www.williamblairfunds.com.
| | | |
| 130 | Semiannual Report | June 30, 2022 |
Financial Highlights — For a share outstanding throughout each period
Large Cap Growth Fund
| | | Class R6 | |
| | | (unaudited)
Period Ended
June 30, | | | Years Ended December 31, | |
| | | 2022 | | | 2021 | | | 2020 | | | 2019(a) | |
| Net asset value, beginning of year | | | $ | 26.16 | | | $ | 21.27 | | | $ | 16.17 | | | $ | 15.12 | |
| Income (loss) from investment operations: | | | | | | | | | | | | | | | | | |
| Net investment income (loss) | | | | (0.00 | )^ | | | (0.00 | )^ | | | 0.01 | | | | 0.04 | |
| Net realized and unrealized gain (loss) on investments | | | | (8.30 | ) | | | 6.01 | | | | 5.91 | | | | 2.07 | |
| Total from investment operations | | | | (8.30 | ) | | | 6.01 | | | | 5.92 | | | | 2.11 | |
| Less distributions from: | | | | | | | | | | | | | | | | | |
| Net investment income | | | | — | | | | 0.00 | ^ | | | 0.05 | | | | 0.06 | |
| Net realized gain | | | | — | | | | 1.12 | | | | 0.77 | | | | 1.00 | |
| Total distributions | | | | — | | | | 1.12 | | | | 0.82 | | | | 1.06 | |
| Net asset value, end of year | | | $ | 17.86 | | | $ | 26.16 | | | $ | 21.27 | | | $ | 16.17 | |
| Total return (%)* | | | | (31.73 | ) | | | 28.42 | | | | 36.70 | | | | 14.13 | |
| Ratios to average daily net assets (%)**: | | | | | | | | | | | | | | | | | |
| Expenses, before waivers and reimbursements | | | | 0.65 | | | | 0.67 | | | | 0.70 | | | | 0.71 | |
| Expenses, net of waivers and reimbursements | | | | 0.60 | | | | 0.60 | | | | 0.60 | | | | 0.60 | |
| Net investment income (loss), before waivers and reimbursements | | | | (0.02 | ) | | | (0.08 | ) | | | (0.03 | ) | | | 0.22 | |
| Net investment income (loss), net of waivers and reimbursements | | | | 0.03 | | | | (0.01 | ) | | | 0.07 | | | | 0.33 | |
| Class R6 net assets at the end of the year (in thousands) | | | $ | 209,253 | | | $ | 233,946 | | | $ | 177,347 | | | $ | 1,590 | |
| Portfolio turnover rate (%)* | | | | 13 | | | | 26 | | | | 35 | | | | 37 | |
| (a) | For the period from May 2, 2019 (Commencement of Operations) to December 31, 2019. |
| * | Rates are not annualized for periods less than a year. |
| ** | Rates are annualized for periods less than a year. |
| ^ | Amount is less than $0.005 per share. |
Note: Net investment income (loss) per share is based on the average shares outstanding during the year.
Performance cited represents past performance. Past performance does not guarantee future results and current performance may be lower or higher than the data quoted. Results shown are annual returns, which assume reinvestment of dividends and capital gains. Investment returns and principal will fluctuate and you may have a gain or loss when you sell shares. For the most current month-end performance information, please call 1-800-742-7272 or visit our Web site at www.williamblairfunds.com.
| | | |
| June 30, 2022 | William Blair Funds | 131 |
Financial Highlights — For a share outstanding throughout each period
Mid Cap Growth Fund
| | | Class N | |
| | | (unaudited)
Period Ended
June 30, | | | Years Ended December 31, | |
| | | 2022 | | | 2021 | | | 2020 | | | 2019 | | | 2018 | | | 2017 | |
| Net asset value, beginning of year | | | $ | 13.29 | | | $ | 12.89 | | | $ | 10.99 | | | $ | 8.87 | | | $ | 10.92 | | | $ | 10.69 | |
| Income (loss) from investment operations: | | | | | | | | | | | | | | | | | | | | | | | | | |
| Net investment income (loss) | | | | (0.05 | ) | | | (0.12 | ) | | | (0.08 | ) | | | (0.05 | ) | | | (0.06 | ) | | | (0.08 | ) |
| Net realized and unrealized gain (loss) on investments | | | | (4.21 | ) | | | 1.13 | | | | 3.01 | | | | 3.22 | | | | 0.03 | | | | 2.29 | |
| Total from investment operations | | | | (4.26 | ) | | | 1.01 | | | | 2.93 | | | | 3.17 | | | | (0.03 | ) | | | 2.21 | |
| Less distributions from: | | | | | | | | | | | | | | | | | | | | | | | | | |
| Net investment income | | | | — | | | | — | | | | — | | | | — | | | | — | | | | — | |
| Net realized gain | | | | — | | | | 0.61 | | | | 1.03 | | | | 1.05 | | | | 2.02 | | | | 1.98 | |
| Total distributions | | | | — | | | | 0.61 | | | | 1.03 | | | | 1.05 | | | | 2.02 | | | | 1.98 | |
| Net asset value, end of year | | | $ | 9.03 | | | $ | 13.29 | | | $ | 12.89 | | | $ | 10.99 | | | $ | 8.87 | | | $ | 10.92 | |
| Total return (%)* | | | | (32.05 | ) | | | 8.10 | | | | 26.80 | | | | 36.02 | | | | (1.20 | ) | | | 20.88 | |
| Ratios to average daily net assets (%)**: | | | | | | | | | | | | | | | | | | | | | | | | | |
| Expenses, before waivers and reimbursements | | | | 1.69 | | | | 1.48 | | | | 1.54 | | | | 1.51 | | | | 1.57 | | | | 1.49 | |
| Expenses, net of waivers and reimbursements | | | | 1.20 | | | | 1.20 | | | | 1.20 | | | | 1.20 | | | | 1.23 | | | | 1.30 | |
| Net investment income (loss), before waivers and reimbursements | | | | (1.35 | ) | | | (1.14 | ) | | | (1.06 | ) | | | (0.79 | ) | | | (0.85 | ) | | | (0.84 | ) |
| Net investment income (loss), net of waivers and reimbursements | | | | (0.86 | ) | | | (0.86 | ) | | | (0.72 | ) | | | (0.48 | ) | | | (0.51 | ) | | | (0.65 | ) |
| Class N net assets at the end of the year (in thousands) | | | $ | 3,384 | | | $ | 5,480 | | | $ | 6,074 | | | $ | 5,465 | | | $ | 4,944 | | | $ | 6,166 | |
| Portfolio turnover rate (%)* | | | | 20 | | | | 47 | | | | 45 | | | | 43 | | | | 58 | | | | 59 | |
| | | | | | | | | | | | | | | | | | | | | | | | | | |
| | | Class I | |
| | | (unaudited)
Period Ended
June 30, | | | Years Ended December 31, | |
| | | 2022 | | | 2021 | | | 2020 | | | 2019 | | | 2018 | | | 2017 | |
| Net asset value, beginning of year | | | $ | 14.67 | | | $ | 14.13 | | | $ | 11.93 | | | $ | 9.55 | | | $ | 11.57 | | | $ | 11.20 | |
| Income (loss) from investment operations: | | | | | | | | | | | | | | | | | | | | | | | | | |
| Net investment income (loss) | | | | (0.04 | ) | | | (0.09 | ) | | | (0.06 | ) | | | (0.03 | ) | | | (0.03 | ) | | | (0.05 | ) |
| Net realized and unrealized gain (loss) on investments | | | | (4.65 | ) | | | 1.24 | | | | 3.29 | | | | 3.46 | | | | 0.03 | | | | 2.40 | |
| Total from investment operations | | | | (4.69 | ) | | | 1.15 | | | | 3.23 | | | | 3.43 | | | | — | | | | 2.35 | |
| Less distributions from: | | | | | | | | | | | | | | | | | | | | | | | | | |
| Net investment income | | | | — | | | | — | | | | — | | | | — | | | | — | | | | — | |
| Net realized gain | | | | — | | | | 0.61 | | | | 1.03 | | | | 1.05 | | | | 2.02 | | | | 1.98 | |
| Total distributions | | | | — | | | | 0.61 | | | | 1.03 | | | | 1.05 | | | | 2.02 | | | | 1.98 | |
| Net asset value, end of year | | | $ | 9.98 | | | $ | 14.67 | | | $ | 14.13 | | | $ | 11.93 | | | $ | 9.55 | | | $ | 11.57 | |
| Total return (%)* | | | | (31.97 | ) | | | 8.38 | | | | 27.21 | | | | 36.17 | | | | (0.86 | ) | | | 21.18 | |
| Ratios to average daily net assets (%)**: | | | | | | | | | | | | | | | | | | | | | | | | | |
| Expenses, before waivers and reimbursements | | | | 1.53 | | | | 1.24 | | | | 1.29 | | | | 1.28 | | | | 1.31 | | | | 1.23 | |
| Expenses, net of waivers and reimbursements | | | | 0.95 | | | | 0.95 | | | | 0.95 | | | | 0.95 | | | | 0.98 | | | | 1.05 | |
| Net investment income (loss), before waivers and reimbursements | | | | (1.19 | ) | | | (0.91 | ) | | | (0.80 | ) | | | (0.56 | ) | | | (0.58 | ) | | | (0.58 | ) |
| Net investment income (loss), net of waivers and reimbursements | | | | (0.61 | ) | | | (0.62 | ) | | | (0.46 | ) | | | (0.23 | ) | | | (0.25 | ) | | | (0.40 | ) |
| Class I net assets at the end of the year (in thousands) | | | $ | 31,494 | | | $ | 46,694 | | | $ | 77,273 | | | $ | 67,936 | | | $ | 51,173 | | | $ | 71,369 | |
| Portfolio turnover rate (%)* | | | | 20 | | | | 47 | | | | 45 | | | | 43 | | | | 58 | | | | 59 | |
| * | Rates are not annualized for periods less than a year. |
| ** | Rates are annualized for periods less than a year. |
Note: Net investment income (loss) per share is based on the average shares outstanding during the year.
Performance cited represents past performance. Past performance does not guarantee future results and current performance may be lower or higher than the data quoted. Results shown are annual returns, which assume reinvestment of dividends and capital gains. Investment returns and principal will fluctuate and you may have a gain or loss when you sell shares. For the most current month-end performance information, please call 1-800-742-7272 or visit our Web site at www.williamblairfunds.com.
| | | |
| 132 | Semiannual Report | June 30, 2022 |
Financial Highlights — For a share outstanding throughout each period
Mid Cap Growth Fund
| | | Class R6 | |
| | | (unaudited)
Period Ended
June 30, | | | Years Ended December 31, | |
| | | 2022 | | | 2021 | | | 2020 | | | 2019(a) | |
| Net asset value, beginning of year | | | $ | 14.69 | | | $ | 14.14 | | | $ | 11.94 | | | $ | 11.93 | |
| Income (loss) from investment operations: | | | | | | | | | | | | | | | | | |
| Net investment income (loss) | | | | (0.03 | ) | | | (0.08 | ) | | | (0.06 | ) | | | (0.01 | ) |
| Net realized and unrealized gain (loss) on investments | | | | (4.66 | ) | | | 1.24 | | | | 3.29 | | | | 1.07 | |
| Total from investment operations | | | | (4.69 | ) | | | 1.16 | | | | 3.23 | | | | 1.06 | |
| Less distributions from: | | | | | | | | | | | | | | | | | |
| Net investment income | | | | — | | | | — | | | | — | | | | — | |
| Net realized gain | | | | — | | | | 0.61 | | | | 1.03 | | | | 1.05 | |
| Total distributions | | | | — | | | | 0.61 | | | | 1.03 | | | | 1.05 | |
| Net asset value, end of year | | | $ | 10.00 | | | $ | 14.69 | | | $ | 14.14 | | | $ | 11.94 | |
| Total return (%)* | | | | (31.93 | ) | | | 8.44 | | | | 27.18 | | | | 9.10 | |
| Ratios to average daily net assets (%)**: | | | | | | | | | | | | | | | | | |
| Expenses, before waivers and reimbursements | | | | 1.31 | | | | 1.11 | | | | 1.16 | | | | 1.14 | |
| Expenses, net of waivers and reimbursements | | | | 0.90 | | | | 0.90 | | | | 0.90 | | | | 0.90 | |
| Net investment income (loss), before waivers and reimbursements | | | | (0.96 | ) | | | (0.78 | ) | | | (0.70 | ) | | | (0.41 | ) |
| Net investment income (loss), net of waivers and reimbursements | | | | (0.55 | ) | | | (0.57 | ) | | | (0.44 | ) | | | (0.17 | ) |
| Class R6 net assets at the end of the year (in thousands) | | | $ | 462 | | | $ | 676 | | | $ | 623 | | | $ | 145 | |
| Portfolio turnover rate (%)* | | | | 20 | | | | 47 | | | | 45 | | | | 43 | |
| (a) | For the period from May 2, 2019 (Commencement of Operations) to December 31, 2019. |
| * | Rates are not annualized for periods less than a year. |
| ** | Rates are annualized for periods less than a year. |
Note: Net investment income (loss) per share is based on the average shares outstanding during the year.
Performance cited represents past performance. Past performance does not guarantee future results and current performance may be lower or higher than the data quoted. Results shown are annual returns, which assume reinvestment of dividends and capital gains. Investment returns and principal will fluctuate and you may have a gain or loss when you sell shares. For the most current month-end performance information, please call 1-800-742-7272 or visit our Web site at www.williamblairfunds.com.
| | | |
| June 30, 2022 | William Blair Funds | 133 |
Financial Highlights — For a share outstanding throughout each period
Mid Cap Value Fund
| | | Class I | |
| | | (unaudited)
Period Ended
June 30, | |
| | | 2022(a) | |
| Net asset value, beginning of year | | | $ | 10.00 | |
| Income (loss) from investment operations: | | | | | |
| Net investment income (loss) | | | | 0.04 | |
| Net realized and unrealized gain (loss) on investments | | | | (1.30 | ) |
| Total from investment operations | | | | (1.26 | ) |
| Less distributions from: | | | | | |
| Net investment income | | | | — | |
| Net realized gain | | | | — | |
| Total distributions | | | | — | |
| Net asset value, end of year | | | $ | 8.74 | |
| Total return (%)* | | | | (12.60 | ) |
| Ratios to average daily net assets (%)**: | | | | | |
| Expenses, before waivers and reimbursements | | | | 7.90 | |
| Expenses, net of waivers and reimbursements | | | | 0.75 | |
| Net investment income (loss), before waivers and reimbursements | | | | (5.77 | ) |
| Net investment income (loss), net of waivers and reimbursements | | | | 1.38 | |
| Class I net assets at the end of the year (in thousands) | | | $ | 48 | |
| Portfolio turnover rate (%)* | | | | 4 | |
| | | | | | |
| | | Class R6 | |
| | | (unaudited)
Period Ended
June 30, | |
| | | 2022(a) | |
| Net asset value, beginning of year | | | $ | 10.00 | |
| Income (loss) from investment operations: | | | | | |
| Net investment income (loss) | | | | 0.04 | |
| Net realized and unrealized gain (loss) on investments | | | | (1.30 | ) |
| Total from investment operations | | | | (1.26 | ) |
| Less distributions from: | | | | | |
| Net investment income | | | | — | |
| Net realized gain | | | | — | |
| Total distributions | | | | — | |
| Net asset value, end of year | | | $ | 8.74 | |
| Total return (%)* | | | | (12.60 | ) |
| Ratios to average daily net assets (%)**: | | | | | |
| Expenses, before waivers and reimbursements | | | | 7.91 | |
| Expenses, net of waivers and reimbursements | | | | 0.70 | |
| Net investment income (loss), before waivers and reimbursements | | | | (5.78 | ) |
| Net investment income (loss), net of waivers and reimbursements | | | | 1.43 | |
| Class R6 net assets at the end of the year (in thousands) | | | $ | 1,324 | |
| Portfolio turnover rate (%)* | | | | 4 | |
| (a) | For the period from March 16, 2022 (Commencement of Operations) to June 30, 2022. |
| * | Rates are not annualized for periods less than a year. |
| ** | Rates are annualized for periods less than a year. |
Note: Net investment income (loss) per share is based on the average shares outstanding during the year.
Performance cited represents past performance. Past performance does not guarantee future results and current performance may be lower or higher than the data quoted. Results shown are annual returns, which assume reinvestment of dividends and capital gains. Investment returns and principal will fluctuate and you may have a gain or loss when you sell shares. For the most current month-end performance information, please call 1-800-742-7272 or visit our Web site at www.williamblairfunds.com.
| | | |
| 134 | Semiannual Report | June 30, 2022 |
Financial Highlights — For a share outstanding throughout each period
Small-Mid Cap Core Fund
| | | Class I | |
| | | (unaudited)
Period Ended
June 30, | | | Years Ended December 31, | |
| | | 2022 | | | 2021 | | | 2020 | | | 2019(a) | |
| Net asset value, beginning of year | | | $ | 16.31 | | | $ | 12.88 | | | $ | 10.68 | | | $ | 10.00 | |
| Income (loss) from investment operations: | | | | | | | | | | | | | | | | | |
| Net investment income (loss) | | | | (0.01 | ) | | | (0.03 | ) | | | 0.00 | ^ | | | 0.02 | |
| Net realized and unrealized gain (loss) on investments | | | | (3.54 | ) | | | 3.46 | | | | 2.20 | | | | 0.67 | |
| Total from investment operations | | | | (3.55 | ) | | | 3.43 | | | | 2.20 | | | | 0.69 | |
| Less distributions from: | | | | | | | | | | | | | | | | | |
| Net investment income | | | | — | | | | — | | | | — | | | | 0.01 | |
| Net realized gain | | | | — | | | | — | | | | — | | | | — | |
| Total distributions | | | | — | | | | — | | | | — | | | | 0.01 | |
| Net asset value, end of year | | | $ | 12.76 | | | $ | 16.31 | | | $ | 12.88 | | | $ | 10.68 | |
| Total return (%)* | | | | (21.77 | ) | | | 26.63 | | | | 20.60 | | | | 6.87 | |
| Ratios to average daily net assets (%)**: | | | | | | | | | | | | | | | | | |
| Expenses, before waivers and reimbursements | | | | 1.14 | | | | 1.25 | | | | 1.22 | | | | 3.92 | |
| Expenses, net of waivers and reimbursements | | | | 0.95 | | | | 0.95 | | | | 0.95 | | | | 0.95 | |
| Net investment income (loss), before waivers and reimbursements | | | | (0.33 | ) | | | (0.47 | ) | | | (0.27 | ) | | | (2.23 | ) |
| Net investment income (loss), net of waivers and reimbursements | | | | (0.14 | ) | | | (0.17 | ) | | | 0.00 | | | | 0.74 | |
| Class I net assets at the end of the year (in thousands) | | | $ | 89,264 | | | $ | 61,433 | | | $ | 22,958 | | | $ | 1,655 | |
| Portfolio turnover rate (%)* | | | | 29 | | | | 45 | | | | 244 | | | | 12 | |
| | | | | | | | | | | | | | | | | | |
| | | Class R6 | |
| | | (unaudited)
Period Ended
June 30, | | | Years Ended December 31, | |
| | | 2022 | | | 2021 | | | 2020 | | | 2019(a) | |
| Net asset value, beginning of year | | | $ | 16.32 | | | $ | 12.88 | | | $ | 10.68 | | | $ | 10.00 | |
| Income (loss) from investment operations: | | | | | | | | | | | | | | | | | |
| Net investment income (loss) | | | | (0.01 | ) | | | (0.02 | ) | | | 0.01 | | | | 0.01 | |
| Net realized and unrealized gain (loss) on investments | | | | (3.54 | ) | | | 3.46 | | | | 2.19 | | | | 0.68 | |
| Total from investment operations | | | | (3.55 | ) | | | 3.44 | | | | 2.20 | | | | 0.69 | |
| Less distributions from: | | | | | | | | | | | | | | | | | |
| Net investment income | | | | — | | | | — | | | | 0.00 | ^ | | | 0.01 | |
| Net realized gain | | | | — | | | | — | | | | — | | | | — | |
| Total distributions | | | | — | | | | — | | | | 0.00 | ^ | | | 0.01 | |
| Net asset value, end of year | | | $ | 12.77 | | | $ | 16.32 | | | $ | 12.88 | | | $ | 10.68 | |
| Total return (%)* | | | | (21.75 | ) | | | 26.71 | | | | 20.60 | | | | 6.88 | |
| Ratios to average daily net assets (%)**: | | | | | | | | | | | | | | | | | |
| Expenses, before waivers and reimbursements | | | | 1.03 | | | | 1.16 | | | | 1.07 | | | | 3.92 | |
| Expenses, net of waivers and reimbursements | | | | 0.90 | | | | 0.90 | | | | 0.90 | | | | 0.90 | |
| Net investment income (loss), before waivers and reimbursements | | | | (0.23 | ) | | | (0.37 | ) | | | (0.11 | ) | | | (2.71 | ) |
| Net investment income (loss), net of waivers and reimbursements | | | | (0.10 | ) | | | (0.11 | ) | | | 0.06 | | | | 0.31 | |
| Class R6 net assets at the end of the year (in thousands) | | | $ | 28,815 | | | $ | 31,347 | | | $ | 7,087 | | | $ | 4,933 | |
| Portfolio turnover rate (%)* | | | | 29 | | | | 45 | | | | 244 | | | | 12 | |
| (a) | For the period from October 1, 2019 (Commencement of Operations) to December 31, 2019. |
| * | Rates are not annualized for periods less than a year. |
| ** | Rates are annualized for periods less than a year. |
| ^ | Amount is less than $0.005 per share. |
Note: Net investment income (loss) per share is based on the average shares outstanding during the year.
Performance cited represents past performance. Past performance does not guarantee future results and current performance may be lower or higher than the data quoted. Results shown are annual returns, which assume reinvestment of dividends and capital gains. Investment returns and principal will fluctuate and you may have a gain or loss when you sell shares. For the most current month-end performance information, please call 1-800-742-7272 or visit our Web site at www.williamblairfunds.com.
| | | |
| June 30, 2022 | William Blair Funds | 135 |
Financial Highlights — For a share outstanding throughout each period
Small-Mid Cap Growth Fund
| | | Class N | |
| | | (unaudited)
Period Ended
June 30, | | | Years Ended December 31, | |
| | | 2022 | | | 2021 | | | 2020 | | | 2019 | | | 2018 | | | 2017 | |
| Net asset value, beginning of year | | | $ | 32.27 | | | $ | 32.96 | | | $ | 25.41 | | | $ | 20.97 | | | $ | 23.36 | | | $ | 19.20 | |
| Income (loss) from investment operations: | | | | | | | | | | | | | | | | | | | | | | | | | |
| Net investment income (loss) | | | | (0.13 | ) | | | (0.36 | ) | | | (0.24 | ) | | | (0.20 | ) | | | (0.18 | ) | | | (0.16 | ) |
| Net realized and unrealized gain (loss) on investments | | | | (9.10 | ) | | | 2.90 | | | | 8.37 | | | | 6.56 | | | | (0.25 | ) | | | 5.62 | |
| Total from investment operations | | | | (9.23 | ) | | | 2.54 | | | | 8.13 | | | | 6.36 | | | | (0.43 | ) | | | 5.46 | |
| Less distributions from: | | | | | | | | | | | | | | | | | | | | | | | | | |
| Net investment income | | | | — | | | | — | | | | — | | | | — | | | | — | | | | — | |
| Net realized gain | | | | — | | | | 3.23 | | | | 0.58 | | | | 1.92 | | | | 1.96 | | | | 1.30 | |
| Total distributions | | | | — | | | | 3.23 | | | | 0.58 | | | | 1.92 | | | | 1.96 | | | | 1.30 | |
| Net asset value, end of year | | | $ | 23.04 | | | $ | 32.27 | | | $ | 32.96 | | | $ | 25.41 | | | $ | 20.97 | | | $ | 23.36 | |
| Total return (%)* | | | | (28.60 | ) | | | 8.27 | | | | 32.04 | | | | 30.41 | | | | (2.29 | ) | | | 28.57 | |
| Ratios to average daily net assets (%)**: | | | | | | | | | | | | | | | | | | | | | | | | | |
| Expenses, before waivers and reimbursements | | | | 1.45 | | | | 1.43 | | | | 1.45 | | | | 1.43 | | | | 1.44 | | | | 1.43 | |
| Expenses, net of waivers and reimbursements | | | | 1.35 | | | | 1.35 | | | | 1.35 | | | | 1.35 | | | | 1.35 | | | | 1.35 | |
| Net investment income (loss), before waivers and reimbursements | | | | (1.03 | ) | | | (1.10 | ) | | | (1.01 | ) | | | (0.88 | ) | | | (0.81 | ) | | | (0.82 | ) |
| Net investment income (loss), net of waivers and reimbursements | | | | (0.93 | ) | | | (1.02 | ) | | | (0.91 | ) | | | (0.80 | ) | | | (0.72 | ) | | | (0.74 | ) |
| Class N net assets at the end of the year (in thousands) | | | $ | 142,341 | | | $ | 232,166 | | | $ | 314,572 | | | $ | 334,017 | | | $ | 424,865 | | | $ | 228,828 | |
| Portfolio turnover rate (%)* | | | | 26 | | | | 38 | | | | 55 | | | | 56 | | | | 46 | | | | 64 | |
| | | | | | | | | | | | | | | | | | | | | | | | | | |
| | | Class I | |
| | | (unaudited)
Period Ended
June 30, | | | Years Ended December 31, | |
| | | 2022 | | | 2021 | | | 2020 | | | 2019 | | | 2018 | | | 2017 | |
| Net asset value, beginning of year | | | $ | 34.72 | | | $ | 35.13 | | | $ | 26.99 | | | $ | 22.12 | | | $ | 24.48 | | | $ | 20.02 | |
| Income (loss) from investment operations: | | | | | | | | | | | | | | | | | | | | | | | | | |
| Net investment income (loss) | | | | (0.10 | ) | | | (0.29 | ) | | | (0.19 | ) | | | (0.14 | ) | | | (0.12 | ) | | | (0.11 | ) |
| Net realized and unrealized gain (loss) on investments | | | | (9.80 | ) | | | 3.11 | | | | 8.91 | | | | 6.93 | | | | (0.28 | ) | | | 5.87 | |
| Total from investment operations | | | | (9.90 | ) | | | 2.82 | | | | 8.72 | | | | 6.79 | | | | (0.40 | ) | | | 5.76 | |
| Less distributions from: | | | | | | | | | | | | | | | | | | | | | | | | | |
| Net investment income | | | | — | | | | — | | | | — | | | | — | | | | — | | | | — | |
| Net realized gain | | | | — | | | | 3.23 | | | | 0.58 | | | | 1.92 | | | | 1.96 | | | | 1.30 | |
| Total distributions | | | | — | | | | 3.23 | | | | 0.58 | | | | 1.92 | | | | 1.96 | | | | 1.30 | |
| Net asset value, end of year | | | $ | 24.82 | | | $ | 34.72 | | | $ | 35.13 | | | $ | 26.99 | | | $ | 22.12 | | | $ | 24.48 | |
| Total return (%)* | | | | (28.51 | ) | | | 8.56 | | | | 32.35 | | | | 30.77 | | | | (2.06 | ) | | | 28.90 | |
| Ratios to average daily net assets (%)**: | | | | | | | | | | | | | | | | | | | | | | | | | |
| Expenses, before waivers and reimbursements | | | | 1.18 | | | | 1.16 | | | | 1.17 | | | | 1.16 | | | | 1.16 | | | | 1.16 | |
| Expenses, net of waivers and reimbursements | | | | 1.10 | | | | 1.10 | | | | 1.10 | | | | 1.10 | | | | 1.10 | | | | 1.10 | |
| Net investment income (loss), before waivers and reimbursements | | | | (0.76 | ) | | | (0.83 | ) | | | (0.73 | ) | | | (0.59 | ) | | | (0.53 | ) | | | (0.55 | ) |
| Net investment income (loss), net of waivers and reimbursements | | | | (0.68 | ) | | | (0.77 | ) | | | (0.66 | ) | | | (0.53 | ) | | | (0.47 | ) | | | (0.49 | ) |
| Class I net assets at the end of the year (in thousands) | | | $ | 1,624,862 | | | $ | 2,487,862 | | | $ | 3,139,290 | | | $ | 2,531,823 | | | $ | 1,979,105 | | | $ | 1,576,180 | |
| Portfolio turnover rate (%)* | | | | 26 | | | | 38 | | | | 55 | | | | 56 | | | | 46 | | | | 64 | |
| * | Rates are not annualized for periods less than a year. |
| ** | Rates are annualized for periods less than a year. |
Note: Net investment income (loss) per share is based on the average shares outstanding during the year.
Performance cited represents past performance. Past performance does not guarantee future results and current performance may be lower or higher than the data quoted. Results shown are annual returns, which assume reinvestment of dividends and capital gains. Investment returns and principal will fluctuate and you may have a gain or loss when you sell shares. For the most current month-end performance information, please call 1-800-742-7272 or visit our Web site at www.williamblairfunds.com.
| | | |
| 136 | Semiannual Report | June 30, 2022 |
Financial Highlights — For a share outstanding throughout each period
Small-Mid Cap Growth Fund
| | | Class R6 | |
| | | (unaudited)
Period Ended
June 30, | | | Years Ended December 31, | |
| | | 2022 | | | 2021 | | | 2020 | | | 2019(a) | |
| Net asset value, beginning of year | | | $ | 34.79 | | | $ | 35.18 | | | $ | 27.01 | | | $ | 26.76 | |
| Income (loss) from investment operations: | | | | | | | | | | | | | | | | | |
| Net investment income (loss) | | | | (0.09 | ) | | | (0.26 | ) | | | (0.17 | ) | | | (0.09 | ) |
| Net realized and unrealized gain (loss) on investments | | | | (9.82 | ) | | | 3.10 | | | | 8.92 | | | | 2.26 | |
| Total from investment operations | | | | (9.91 | ) | | | 2.84 | | | | 8.75 | | | | 2.17 | |
| Less distributions from: | | | | | | | | | | | | | | | | | |
| Net investment income | | | | — | | | | — | | | | — | | | | — | |
| Net realized gain | | | | — | | | | 3.23 | | | | 0.58 | | | | 1.92 | |
| Total distributions | | | | — | | | | 3.23 | | | | 0.58 | | | | 1.92 | |
| Net asset value, end of year | | | $ | 24.88 | | | $ | 34.79 | | | $ | 35.18 | | | $ | 27.01 | |
| Total return (%)* | | | | (28.49 | ) | | | 8.60 | | | | 32.44 | | | | 8.17 | |
| Ratios to average daily net assets (%)**: | | | | | | | | | | | | | | | | | |
| Expenses | | | | 1.04 | | | | 1.03 | | | | 1.05 | | | | 1.05 | |
| Net investment income (loss) | | | | (0.60 | ) | | | (0.69 | ) | | | (0.61 | ) | | | (0.46 | ) |
| Class R6 net assets at the end of the year (in thousands) | | | $ | 324,466 | | | $ | 328,034 | | | $ | 123,220 | | | $ | 39,974 | |
| Portfolio turnover rate (%)* | | | | 26 | | | | 38 | | | | 55 | | | | 56 | |
| (a) | For the period from May 2, 2019 (Commencement of Operations) to December 31, 2019. |
| * | Rates are not annualized for periods less than a year. |
| ** | Rates are annualized for periods less than a year. |
Note: Net investment income (loss) per share is based on the average shares outstanding during the year.
Performance cited represents past performance. Past performance does not guarantee future results and current performance may be lower or higher than the data quoted. Results shown are annual returns, which assume reinvestment of dividends and capital gains. Investment returns and principal will fluctuate and you may have a gain or loss when you sell shares. For the most current month-end performance information, please call 1-800-742-7272 or visit our Web site at www.williamblairfunds.com.
| | | |
| June 30, 2022 | William Blair Funds | 137 |
Financial Highlights — For a share outstanding throughout each period
Small Cap Growth Fund
| | Class N | |
| | (unaudited)
Period Ended
June 30, | | | Years Ended December 31, | |
| | | 2022 | | | 2021 | | | 2020 | | | 2019 | | | 2018 | | | 2017 | |
| Net asset value, beginning of year | | $ | 31.90 | | | $ | 34.49 | | | $ | 27.75 | | | $ | 23.23 | | | $ | 26.87 | | | $ | 25.24 | |
| Income (loss) from investment operations: | | | | | | | | | | | | | | | | | | | | | | | | |
| Net investment income (loss) | | | (0.15 | ) | | | (0.45 | ) | | | (0.29 | ) | | | (0.24 | ) | | | (0.27 | ) | | | (0.25 | ) |
| Net realized and unrealized gain (loss) on investments | | | (8.77 | ) | | | 4.56 | | | | 10.86 | | | | 5.40 | | | | (0.10 | ) | | | 6.88 | |
| Total from investment operations | | | (8.92 | ) | | | 4.11 | | | | 10.57 | | | | 5.16 | | | | (0.37 | ) | | | 6.63 | |
| Less distributions from: | | | | | | | | | | | | | | | | | | | | | | | | |
| Net investment income | | | — | | | | — | | | | — | | | | — | | | | — | | | | — | |
| Net realized gain | | | — | | | | 6.70 | | | | 3.83 | | | | 0.64 | | | | 3.27 | | | | 5.00 | |
| Total distributions | | | — | | | | 6.70 | | | | 3.83 | | | | 0.64 | | | | 3.27 | | | | 5.00 | |
| Net asset value, end of year | | $ | 22.98 | | | $ | 31.90 | | | $ | 34.49 | | | $ | 27.75 | | | $ | 23.23 | | | $ | 26.87 | |
| Total return (%)* | | | (27.96 | ) | | | 12.91 | | | | 38.32 | | | | 22.26 | | | | (2.14 | ) | | | 26.70 | |
| Ratios to average daily net assets (%)**: | | | | | | | | | | | | | | | | | | | | | | | | |
| Expenses, before waivers and reimbursements | | | 1.57 | | | | 1.56 | | | | 1.58 | | | | 1.54 | | | | 1.55 | | | | 1.54 | |
| Expenses, net of waivers and reimbursements | | | 1.50 | | | | 1.50 | | | | 1.50 | | | | 1.50 | | | | 1.50 | | | | 1.50 | |
| Net investment income (loss), before waivers and reimbursements | | | (1.17 | ) | | | (1.24 | ) | | | (1.10 | ) | | | (0.92 | ) | | | (0.94 | ) | | | (0.93 | ) |
| Net investment income (loss), net of waivers and reimbursements | | | (1.10 | ) | | | (1.18 | ) | | | (1.02 | ) | | | (0.88 | ) | | | (0.89 | ) | | | (0.89 | ) |
| Class N net assets at the end of the year (in thousands) | | $ | 109,837 | | | $ | 179,739 | | | $ | 180,635 | | | $ | 180,706 | | | $ | 169,074 | | | $ | 146,291 | |
| Portfolio turnover rate (%)* | | | 27 | | | | 49 | | | | 71 | | | | 51 | | | | 74 | | | | 81 | |
| | | | | | | | | | | | | | | | | | | | | | | | | |
| | Class I | |
| | (unaudited)
Period Ended
June 30, | | | Years Ended December 31, | |
| | | 2022 | | | 2021 | | | 2020 | | | 2019 | | | 2018 | | | 2017 | |
| Net asset value, beginning of year | | $ | 37.52 | | | $ | 39.36 | | | $ | 31.19 | | | $ | 25.99 | | | $ | 29.61 | | | $ | 27.34 | |
| Income (loss) from investment operations: | | | | | | | | | | | | | | | | | | | | | | | | |
| Net investment income (loss) | | | (0.13 | ) | | | (0.41 | ) | | | (0.24 | ) | | | (0.19 | ) | | | (0.21 | ) | | | (0.20 | ) |
| Net realized and unrealized gain (loss) on investments | | | (10.33 | ) | | | 5.27 | | | | 12.24 | | | | 6.03 | | | | (0.14 | ) | | | 7.47 | |
| Total from investment operations | | | (10.46 | ) | | | 4.86 | | | | 12.00 | | | | 5.84 | | | | (0.35 | ) | | | 7.27 | |
| Less distributions from: | | | | | | | | | | | | | | | | | | | | | | | | |
| Net investment income | | | — | | | | — | | | | — | | | | — | | | | — | | | | — | |
| Net realized gain | | | — | | | | 6.70 | | | | 3.83 | | | | 0.64 | | | | 3.27 | | | | 5.00 | |
| Total distributions | | | — | | | | 6.70 | | | | 3.83 | | | | 0.64 | | | | 3.27 | | | | 5.00 | |
| Net asset value, end of year | | $ | 27.06 | | | $ | 37.52 | | | $ | 39.36 | | | $ | 31.19 | | | $ | 25.99 | | | $ | 29.61 | |
| Total return (%)* | | | (27.88 | ) | | | 13.22 | | | | 38.68 | | | | 22.51 | | | | (1.88 | ) | | | 26.99 | |
| Ratios to average daily net assets (%)**: | | | | | | | | | | | | | | | | | | | | | | | | |
| Expenses, before waivers and reimbursements | | | 1.28 | | | | 1.25 | | | | 1.30 | | | | 1.27 | | | | 1.25 | | | | 1.25 | |
| Expenses, net of waivers and reimbursements | | | 1.25 | | | | 1.25 | | | | 1.25 | | | | 1.25 | | | | 1.25 | | | | 1.25 | |
| Net investment income (loss), before waivers and reimbursements | | | (0.87 | ) | | | (0.93 | ) | | | (0.82 | ) | | | (0.65 | ) | | | (0.65 | ) | | | (0.64 | ) |
| Net investment income (loss), net of waivers and reimbursements | | | (0.84 | ) | | | (0.93 | ) | | | (0.77 | ) | | | (0.63 | ) | | | (0.65 | ) | | | (0.64 | ) |
| Class I net assets at the end of the year (in thousands) | | $ | 285,790 | | | $ | 402,629 | | | $ | 390,511 | | | $ | 423,881 | | | $ | 410,233 | | | $ | 343,119 | |
| Portfolio turnover rate (%)* | | | 27 | | | | 49 | | | | 71 | | | | 51 | | | | 74 | | | | 81 | |
| * | Rates are not annualized for periods less than a year. |
| ** | Rates are annualized for periods less than a year. |
Note: Net investment income (loss) per share is based on the average shares outstanding during the year.
Performance cited represents past performance. Past performance does not guarantee future results and current performance may be lower or higher than the data quoted. Results shown are annual returns, which assume reinvestment of dividends and capital gains. Investment returns and principal will fluctuate and you may have a gain or loss when you sell shares. For the most current month-end performance information, please call 1-800-742-7272 or visit our Web site at www.williamblairfunds.com.
| 138 | Semiannual Report | June 30, 2022 |
Financial Highlights — For a share outstanding throughout each period
Small Cap Growth Fund
| | Class R6 | |
| | (unaudited)
Period Ended
June 30, | | | Years Ended December 31, | |
| | | 2022 | | | 2021 | | | 2020 | | | 2019(a) | |
| Net asset value, beginning of year | | $ | 37.60 | | | $ | 39.40 | | | $ | 31.20 | | | $ | 31.00 | |
| Income (loss) from investment operations: | | | | | | | | | | | | | | | | |
| Net investment income (loss) | | | (0.12 | ) | | | (0.37 | ) | | | (0.23 | ) | | | (0.11 | ) |
| Net realized and unrealized gain (loss) on investments | | | (10.35 | ) | | | 5.27 | | | | 12.26 | | | | 0.95 | |
| Total from investment operations | | | (10.47 | ) | | | 4.90 | | | | 12.03 | | | | 0.84 | |
| Less distributions from: | | | | | | | | | | | | | | | | |
| Net investment income | | | — | | | | — | | | | — | | | | — | |
| Net realized gain | | | — | | | | 6.70 | | | | 3.83 | | | | 0.64 | |
| Total distributions | | | — | | | | 6.70 | | | | 3.83 | | | | 0.64 | |
| Net asset value, end of year | | $ | 27.13 | | | $ | 37.60 | | | $ | 39.40 | | | $ | 31.20 | |
| Total return (%)* | | | (27.85 | ) | | | 13.31 | | | | 38.76 | | | | 2.75 | |
| Ratios to average daily net assets (%)**: | | | | | | | | | | | | | | | | |
| Expenses | | | 1.17 | | | | 1.16 | | | | 1.19 | | | | 1.18 | |
| Net investment income (loss) | | | (0.76 | ) | | | (0.84 | ) | | | (0.71 | ) | | | (0.51 | ) |
| Class R6 net assets at the end of the year (in thousands) | | $ | 96,265 | | | $ | 127,710 | | | $ | 103,462 | | | $ | 65,950 | |
| Portfolio turnover rate (%)* | | | 27 | | | | 49 | | | | 71 | | | | 51 | |
| (a) | For the period from May 2, 2019 (Commencement of Operations) to December 31, 2019. |
| * | Rates are not annualized for periods less than a year. |
| ** | Rates are annualized for periods less than a year. |
Note: Net investment income (loss) per share is based on the average shares outstanding during the year.
Performance cited represents past performance. Past performance does not guarantee future results and current performance may be lower or higher than the data quoted. Results shown are annual returns, which assume reinvestment of dividends and capital gains. Investment returns and principal will fluctuate and you may have a gain or loss when you sell shares. For the most current month-end performance information, please call 1-800-742-7272 or visit our Web site at www.williamblairfunds.com.
| June 30, 2022 | William Blair Funds | 139 |
Financial Highlights — For a share outstanding throughout each period
Small Cap Value Fund
| | Class N | |
| | (unaudited) | | | | | | | | |
| | Period Ended | | | Period Ended | | | Period Ended | |
| | June 30, | | | December 31, | | | October 31, | |
| | | | 2022 | | | | | 2021(b) | | | | | 2021(a) | |
| Net asset value, beginning of year | | $ | 33.63 | | | | $ | 33.49 | | | | $ | 32.15 | |
| Income (loss) from investment operations: | | | | | | | | | | | | | | |
| Net investment income (loss) | | | 0.04 | | | | | 0.00 | ^ | | | | 0.05 | |
| Net realized and unrealized gain (loss) on investments | | | (5.21 | ) | | | | 1.37 | | | | | 1.29 | |
| Total from investment operations | | | (5.17 | ) | | | | 1.37 | | | | | 1.34 | |
| Less distributions from: | | | | | | | | | | | | | | |
| Net investment income | | | — | | | | | — | | | | | — | |
| Net realized gain | | | — | | | | | 1.23 | | | | | — | |
| Total distributions | | | — | | | | | 1.23 | | | | | — | |
| Net asset value, end of year | | $ | 28.46 | | | | $ | 33.63 | | | | $ | 33.49 | |
| Total return (%)* | | | (15.37 | ) | | | | 4.24 | | | | | 4.17 | |
| Ratios to average daily net assets (%)**: | | | | | | | | | | | | | | |
| Expenses, before waivers and reimbursements | | | 1.22 | | | | | 1.26 | | | | | 1.17 | |
| Expenses, net of waivers and reimbursements | | | 1.15 | | | | | 1.15 | | | | | 1.15 | |
| Net investment income (loss), before waivers and reimbursements | | | 0.19 | | | | | (0.05 | ) | | | | 0.51 | |
| Net investment income (loss), net of waivers and reimbursements | | | 0.26 | | | | | 0.06 | | | | | 0.53 | |
| Class N net assets at the end of the year (in thousands) | | $ | 2,592 | | | | $ | 3,313 | | | | $ | 9,805 | |
| Portfolio turnover rate (%)* | | | 17 | | | | | 7 | | | | | 35 | |
| | | | | | | | | | | | | | | |
| | Class I | |
| | (unaudited)
Period Ended
June 30, | | Period Ended
December 31, | | | | | | | | | | | | Year Ended
October 31, | |
| | | 2022 | | | 2021(b) | | | 2021 | | | 2020 | | | 2019 | | | 2018 | | | 2017 | |
| Net asset value, beginning of year | | $ | 33.58 | | | $ | 33.52 | | | $ | 23.79 | | | $ | 28.84 | | | $ | 31.53 | | | $ | 35.04 | | | $ | 27.27 | |
| Income (loss) from investment operations: | | | | | | | | | | | | | | | | | | | | | | | | | | | | |
| Net investment income (loss) | | | 0.08 | | | | 0.03 | | | | 0.18 | | | | 0.09 | | | | 0.18 | | | | 0.06 | | | | 0.06 | |
| Net realized and unrealized gain (loss) on investments | | | (5.20 | ) | | | 1.35 | | | | 12.91 | | | | (3.89 | ) | | | 1.59 | | | | (1.00 | ) | | | 8.61 | |
| Total from investment operations | | | (5.12 | ) | | | 1.38 | | | | 13.09 | | | | (3.80 | ) | | | 1.77 | | | | (0.94 | ) | | | 8.67 | |
| Less distributions from: | | | | | | | | | | | | | | | | | | | | | | | | | | | | |
| Net investment income | | | — | | | | 0.09 | | | | 0.11 | | | | 0.07 | | | | 0.15 | | | | 0.09 | | | | 0.03 | |
| Net realized gain | | | — | | | | 1.23 | | | | 3.25 | | | | 1.18 | | | | 4.31 | | | | 2.48 | | | | 0.87 | |
| Total distributions | | | — | | | | 1.32 | | | | 3.36 | | | | 1.25 | | | | 4.46 | | | | 2.57 | | | | 0.90 | |
| Net asset value, end of year | | $ | 28.46 | | | $ | 33.58 | | | $ | 33.52 | | | $ | 23.79 | | | $ | 28.84 | | | $ | 31.53 | | | $ | 35.04 | |
| Total return (%)* | | | (15.25 | ) | | | 4.31 | | | | 55.32 | | | | (13.91 | ) | | | 8.60 | | | | (3.06 | ) | | | 32.07 | |
| Ratios to average daily net assets (%)**: | | | | | | | | | | | | | | | | | | | | | | | | | | | | |
| Expenses, before waivers and reimbursements | | | 0.92 | | | | 0.82 | | | | 0.86 | | | | 0.89 | | | | 0.93 | | | | 0.93 | | | | 0.95 | |
| Expenses, net of waivers and reimbursements | | | 0.89 | | | | 0.82 | | | | 0.86 | | | | 0.89 | | | | 0.93 | | | | 0.93 | | | | 0.95 | |
| Net investment income (loss), before waivers and reimbursements | | | 0.50 | | | | 0.55 | | | | 0.52 | | | | 0.37 | | | | 0.63 | | | | 0.16 | | | | 0.17 | |
| Net investment income (loss), net of waivers and reimbursements | | | 0.53 | | | | 0.55 | | | | 0.52 | | | | 0.37 | | | | 0.63 | | | | 0.16 | | | | 0.17 | |
| Class I net assets at the end of the year (in thousands) | | $ | 872,616 | | | $ | 1,059,157 | | | $ | 1,143,150 | | | $ | 1,181,409 | | | $ | 908,831 | | | $ | 738,558 | | | $ | 768,329 | |
| Portfolio turnover rate (%)* | | | 17 | | | | 7 | | | | 35 | | | | 27 | | | | 31 | | | | 31 | | | | 30 | |
| (a) | For the period from July 17, 2021 (Commencement of Operations) to October 31, 2021. |
| (b) | For the period from November 1, 2021 to December 31, 2021. |
| * | Rates are not annualized for periods less than a year. |
| ** | Rates are annualized for periods less than a year. |
| ^ | Amount is less than $0.005 per share. |
Note: Net investment income (loss) per share is based on the average shares outstanding during the year.
Performance cited represents past performance. Past performance does not guarantee future results and current performance may be lower or higher than the data quoted. Results shown are annual returns, which assume reinvestment of dividends and capital gains. Investment returns and principal will fluctuate and you may have a gain or loss when you sell shares. For the most current month-end performance information, please call 1-800-742-7272 or visit our Web site at www.williamblairfunds.com.
| 140 | Semiannual Report | June 30, 2022 |
Financial Highlights — For a share outstanding throughout each period
Small Cap Value Fund
| | Class R6 | |
| | (unaudited) | | | | | | | | | |
| | Period Ended | | | Period Ended | | | Period Ended | |
| | June 30, | | | December 31, | | | October 31, | |
| | | 2022 | | | | 2021(b) | | | | 2021(a) | |
| Net asset value, beginning of year | | $ | 33.58 | | | | $ | 33.53 | | | | $ | 32.15 | |
| Income (loss) from investment operations: | | | | | | | | | | | | | | |
| Net investment income (loss) | | | 0.10 | | | | | 0.03 | | | | | 0.06 | |
| Net realized and unrealized gain (loss) on investments | | | (5.20 | ) | | | | 1.35 | | | | | 1.32 | |
| Total from investment operations | | | (5.10 | ) | | | | 1.38 | | | | | 1.38 | |
| Less distributions from: | | | | | | | | | | | | | | |
| Net investment income | | | — | | | | | 0.10 | | | | | — | |
| Net realized gain | | | — | | | | | 1.23 | | | | | — | |
| Total distributions | | | — | | | | | 1.33 | | | | | — | |
| Net asset value, end of year | | $ | 28.48 | | | | $ | 33.58 | | | | $ | 33.53 | |
| Total return (%)* | | | (15.19 | ) | | | | 4.33 | | | | | 4.26 | |
| Ratios to average daily net assets (%)**: | | | | | | | | | | | | | | |
| Expenses | | | 0.79 | | | | | 0.78 | | | | | 0.78 | |
| Net investment income (loss) | | | 0.65 | | | | | 0.59 | | | | | 0.64 | |
| Class R6 net assets at the end of the year (in thousands) | | $ | 393,492 | | | | $ | 1,006,928 | | | | $ | 867,272 | |
| Portfolio turnover rate (%)* | | | 17 | | | | | 7 | | | | | 35 | |
| (a) | For the period from July 17, 2021 (Commencement of Operations) to October 31, 2021. |
| (b) | For the period from November 1, 2021 to December 31, 2021. |
| * | Rates are not annualized for periods less than a year. |
| ** | Rates are annualized for periods less than a year. |
Note: Net investment income (loss) per share is based on the average shares outstanding during the year.
Performance cited represents past performance. Past performance does not guarantee future results and current performance may be lower or higher than the data quoted. Results shown are annual returns, which assume reinvestment of dividends and capital gains. Investment returns and principal will fluctuate and you may have a gain or loss when you sell shares. For the most current month-end performance information, please call 1-800-742-7272 or visit our Web site at www.williamblairfunds.com.
| June 30, 2022 | William Blair Funds | 141 |
Financial Highlights — For a share outstanding throughout each period
Global Leaders Fund
| | Class N | |
| | (unaudited)
Period Ended
June 30, | | | Years Ended December 31, | |
| | | 2022 | | | 2021 | | | 2020 | | | 2019 | | | 2018 | | | 2017 | |
| Net asset value, beginning of year | | $ | 19.17 | | | $ | 17.41 | | | $ | 14.92 | | | $ | 11.47 | | | $ | 14.53 | | | $ | 11.60 | |
| Income (loss) from investment operations: | | | | | | | | | | | | | | | | | | | | | | | | |
| Net investment income (loss) | | | (0.00 | )^ | | | (0.11 | ) | | | (0.06 | ) | | | 0.01 | | | | 0.02 | | | | 0.05 | |
| Net realized and unrealized gain (loss) on investments | | | (5.94 | ) | | | 2.96 | | | | 4.74 | | | | 3.61 | | | | (1.12 | ) | | | 3.46 | |
| Total from investment operations | | | (5.94 | ) | | | 2.85 | | | | 4.68 | | | | 3.62 | | | | (1.10 | ) | | | 3.51 | |
| Less distributions from: | | | | | | | | | | | | | | | | | | | | | | | | |
| Net investment income | | | — | | | | — | | | | — | | | | 0.03 | | | | — | | | | 0.10 | |
| Net realized gain | | | — | | | | 1.09 | | | | 2.19 | | | | 0.14 | | | | 1.96 | | | | 0.48 | |
| Total distributions | | | — | | | | 1.09 | | | | 2.19 | | | | 0.17 | | | | 1.96 | | | | 0.58 | |
| Net asset value, end of year | | $ | 13.23 | | | $ | 19.17 | | | $ | 17.41 | | | $ | 14.92 | | | $ | 11.47 | | | $ | 14.53 | |
| Total return (%)* | | | (30.99 | ) | | | 16.55 | | | | 31.50 | | | | 31.57 | | | | (8.23 | ) | | | 30.31 | |
| Ratios to average daily net assets (%)**: | | | | | | | | | | | | | | | | | | | | | | | | |
| Expenses, before waivers and reimbursements | | | 1.44 | | | | 1.38 | | | | 1.45 | | | | 1.39 | | | | 1.47 | | | | 1.63 | |
| Expenses, net of waivers and reimbursements | | | 1.15 | | | | 1.15 | | | | 1.15 | | | | 1.20 | | | | 1.33 | | | | 1.37 | |
| Net investment income (loss), before waivers and reimbursements | | | (0.35 | ) | | | (0.79 | ) | | | (0.67 | ) | | | (0.10 | ) | | | (0.01 | ) | | | 0.09 | |
| Net investment income (loss), net of waivers and reimbursements | | | (0.06 | ) | | | (0.56 | ) | | | (0.37 | ) | | | 0.09 | | | | 0.13 | | | | 0.35 | |
| Class N net assets at the end of the year (in thousands) | | $ | 8,673 | | | $ | 13,709 | | | $ | 11,861 | | | $ | 8,910 | | | $ | 7,225 | | | $ | 7,761 | |
| Portfolio turnover rate (%)* | | | 6 | | | | 18 | | | | 27 | | | | 27 | | | | 49 | | | | 41 | |
| | | | | | | | | | | | | | | | | | | | | | | | | |
| | Class I | |
| | (unaudited)
Period Ended
June 30, | | | Years Ended December 31, | |
| | | 2022 | | | 2021 | | | 2020 | | | 2019 | | | 2018 | | | 2017 | |
| Net asset value, beginning of year | | $ | 19.28 | | | $ | 17.47 | | | $ | 14.93 | | | $ | 11.47 | | | $ | 14.56 | | | $ | 11.62 | |
| Income (loss) from investment operations: | | | | | | | | | | | | | | | | | | | | | | | | |
| Net investment income (loss) | | | 0.02 | | | | (0.06 | ) | | | (0.01 | ) | | | 0.05 | | | | 0.06 | | | | 0.09 | |
| Net realized and unrealized gain (loss) on investments | | | (5.97 | ) | | | 2.96 | | | | 4.74 | | | | 3.61 | | | | (1.13 | ) | | | 3.47 | |
| Total from investment operations | | | (5.95 | ) | | | 2.90 | | | | 4.73 | | | | 3.66 | | | | (1.07 | ) | | | 3.56 | |
| Less distributions from: | | | | | | | | | | | | | | | | | | | | | | | | |
| Net investment income | | | — | | | | — | | | | 0.00 | ^ | | | 0.06 | | | | 0.06 | | | | 0.14 | |
| Net realized gain | | | — | | | | 1.09 | | | | 2.19 | | | | 0.14 | | | | 1.96 | | | | 0.48 | |
| Total distributions | | | — | | | | 1.09 | | | | 2.19 | | | | 0.20 | | | | 2.02 | | | | 0.62 | |
| Net asset value, end of year | | $ | 13.33 | | | $ | 19.28 | | | $ | 17.47 | | | $ | 14.93 | | | $ | 11.47 | | | $ | 14.56 | |
| Total return (%)* | | | (30.86 | ) | | | 16.78 | | | | 31.86 | | | | 31.96 | | | | (8.06 | ) | | | 30.69 | |
| Ratios to average daily net assets (%)**: | | | | | | | | | | | | | | | | | | | | | | | | |
| Expenses, before waivers and reimbursements | | | 1.11 | | | | 1.07 | | | | 1.12 | | | | 1.07 | | | | 1.15 | | | | 1.33 | |
| Expenses, net of waivers and reimbursements | | | 0.90 | | | | 0.90 | | | | 0.90 | | | | 0.95 | | | | 1.07 | | | | 1.07 | |
| Net investment income (loss), before waivers and reimbursements | | | 0.00 | | | | (0.49 | ) | | | (0.31 | ) | | | 0.22 | | | | 0.31 | | | | 0.39 | |
| Net investment income (loss), net of waivers and reimbursements | | | 0.21 | | | | (0.32 | ) | | | (0.09 | ) | | | 0.34 | | | | 0.39 | | | | 0.65 | |
| Class I net assets at the end of the year (in thousands) | | $ | 83,133 | | | $ | 124,488 | | | $ | 107,375 | | | $ | 114,666 | | | $ | 83,790 | | | $ | 60,067 | |
| Portfolio turnover rate (%)* | | | 6 | | | | 18 | | | | 27 | | | | 27 | | | | 49 | | | | 41 | |
| * | Rates are not annualized for periods less than a year. |
| ** | Rates are annualized for periods less than a year. |
| ^ | Amount is less than $0.005 per share. |
Note: Net investment income (loss) per share is based on the average shares outstanding during the year.
Performance cited represents past performance. Past performance does not guarantee future results and current performance may be lower or higher than the data quoted. Results shown are annual returns, which assume reinvestment of dividends and capital gains. Investment returns and principal will fluctuate and you may have a gain or loss when you sell shares. For the most current month-end performance information, please call 1-800-742-7272 or visit our Web site at www.williamblairfunds.com.
| 142 | Semiannual Report | June 30, 2022 |
Financial Highlights — For a share outstanding throughout each period
Global Leaders Fund
| | Class R6 | |
| | (unaudited)
Period Ended
June 30, | | | Years Ended December 31, | |
| | | 2022 | | | 2021 | | | 2020 | | | 2019 | | | 2018 | | | 2017 | |
| Net asset value, beginning of year | | $ | 19.30 | | | $ | 17.47 | | | $ | 14.93 | | | $ | 11.47 | | | $ | 14.56 | | | $ | 11.62 | |
| Income (loss) from investment operations: | | | | | | | | | | | | | | | | | | | | | | | | |
| Net investment income (loss) | | | 0.02 | | | | (0.05 | ) | | | 0.02 | | | | 0.06 | | | | 0.07 | | | | 0.10 | |
| Net realized and unrealized gain (loss) on investments | | | (5.98 | ) | | | 2.97 | | | | 4.72 | | | | 3.61 | | | | (1.13 | ) | | | 3.47 | |
| Total from investment operations | | | (5.96 | ) | | | 2.92 | | | | 4.74 | | | | 3.67 | | | | (1.06 | ) | | | 3.57 | |
| Less distributions from: | | | | | | | | | | | | | | | | | | | | | | | | |
| Net investment income | | | — | | | | — | | | | 0.01 | | | | 0.07 | | | | 0.07 | | | | 0.15 | |
| Net realized gain | | | — | | | | 1.09 | | | | 2.19 | | | | 0.14 | | | | 1.96 | | | | 0.48 | |
| Total distributions | | | — | | | | 1.09 | | | | 2.20 | | | | 0.21 | | | | 2.03 | | | | 0.63 | |
| Net asset value, end of year | | $ | 13.34 | | | $ | 19.30 | | | $ | 17.47 | | | $ | 14.93 | | | $ | 11.47 | | | $ | 14.56 | |
| Total return (%)* | | | (30.83 | ) | | | 16.90 | | | | 31.91 | | | | 32.02 | | | | (7.99 | ) | | | 30.78 | |
| Ratios to average daily net assets (%)**: | | | | | | | | | | | | | | | | | | | | | | | | |
| Expenses, before waivers and reimbursements | | | 1.03 | | | | 0.99 | | | | 1.06 | | | | 1.01 | | | | 1.08 | | | | 1.10 | |
| Expenses, net of waivers and reimbursements | | | 0.85 | | | | 0.85 | | | | 0.85 | | | | 0.90 | | | | 1.00 | | | | 1.00 | |
| Net investment income (loss), before waivers and reimbursements | | | 0.07 | | | | (0.40 | ) | | | (0.10 | ) | | | 0.32 | | | | 0.39 | | | | 0.65 | |
| Net investment income (loss), net of waivers and reimbursements | | | 0.25 | | | | (0.26 | ) | | | 0.11 | | | | 0.43 | | | | 0.47 | | | | 0.75 | |
| Class R6 net assets at the end of the year (in thousands) | | $ | 3,627 | | | $ | 5,585 | | | $ | 2,946 | | | $ | 48,133 | | | $ | 79,685 | | | $ | 143,521 | |
| Portfolio turnover rate (%)* | | | 6 | | | | 18 | | | | 27 | | | | 27 | | | | 49 | | | | 41 | |
| * | Rates are not annualized for periods less than a year. |
| ** | Rates are annualized for periods less than a year. |
Note: Net investment income (loss) per share is based on the average shares outstanding during the year.
Performance cited represents past performance. Past performance does not guarantee future results and current performance may be lower or higher than the data quoted. Results shown are annual returns, which assume reinvestment of dividends and capital gains. Investment returns and principal will fluctuate and you may have a gain or loss when you sell shares. For the most current month-end performance information, please call 1-800-742-7272 or visit our Web site at www.williamblairfunds.com.
| June 30, 2022 | William Blair Funds | 143 |
Financial Highlights — For a share outstanding throughout each period
International Leaders Fund
| | Class N | |
| | (unaudited)
Period Ended
June 30, | | | Years Ended December 31, | |
| | | 2022 | | | 2021 | | | 2020 | | | 2019 | | | 2018 | | | 2017 | |
| Net asset value, beginning of year | | $ | 24.28 | | | $ | 22.69 | | | $ | 18.08 | | | $ | 13.80 | | | $ | 16.37 | | | $ | 12.88 | |
| Income (loss) from investment operations: | | | | | | | | | | | | | | | | | | | | | | | | |
| Net investment income (loss) | | | 0.07 | | | | (0.12 | ) | | | (0.04 | ) | | | 0.09 | | | | 0.13 | | | | 0.11 | |
| Net realized and unrealized gain (loss) on investments | | | (7.64 | ) | | | 2.35 | | | | 4.82 | | | | 4.25 | | | | (2.19 | ) | | | 3.70 | |
| Total from investment operations | | | (7.57 | ) | | | 2.23 | | | | 4.78 | | | | 4.34 | | | | (2.06 | ) | | | 3.81 | |
| Less distributions from: | | | | | | | | | | | | | | | | | | | | | | | | |
| Net investment income | | | — | | | | 0.00^ | | | | — | | | | 0.06 | | | | 0.06 | | | | 0.20 | |
| Net realized gain | | | — | | | | 0.64 | | | | 0.17 | | | | — | | | | 0.45 | | | | 0.12 | |
| Total distributions | | | — | | | | 0.64 | | | | 0.17 | | | | 0.06 | | | | 0.51 | | | | 0.32 | |
| Net asset value, end of year | | $ | 16.71 | | | $ | 24.28 | | | $ | 22.69 | | | $ | 18.08 | | | $ | 13.80 | | | $ | 16.37 | |
| Total return (%)* | | | (31.18 | ) | | | 9.93 | | | | 26.45 | | | | 31.46 | | | | (12.70 | ) | | | 29.65 | |
| Ratios to average daily net assets (%)**: | | | | | | | | | | | | | | | | | | | | | | | | |
| Expenses, before waivers and reimbursements | | | 1.29 | | | | 1.30 | | | | 1.31 | | | | 1.32 | | | | 1.39 | | | | 1.59 | |
| Expenses, net of waivers and reimbursements | | | 1.15 | | | | 1.15 | | | | 1.15 | | | | 1.18 | | | | 1.28 | | | | 1.35 | |
| Net investment income (loss), before waivers and reimbursements | | | 0.54 | | | | (0.65 | ) | | | (0.39 | ) | | | 0.44 | | | | 0.70 | | | | 0.48 | |
| Net investment income (loss), net of waivers and reimbursements | | | 0.68 | | | | (0.50 | ) | | | (0.23 | ) | | | 0.58 | | | | 0.81 | | | | 0.72 | |
| Class N net assets at the end of the year (in thousands) | | $ | 34,735 | | | $ | 47,234 | | | $ | 19,586 | | | $ | 11,163 | | | $ | 8,715 | | | $ | 9,651 | |
| Portfolio turnover rate (%)* | | | 33 | | | | 18 | | | | 34 | | | | 20 | | | | 33 | | | | 41 | |
| | | | | | | | | | | | | | | | | | | | | | | | | |
| | Class I | |
| | (unaudited)
Period Ended
June 30, | | | Years Ended December 31, | |
| | | 2022 | | | 2021 | | | 2020 | | | 2019 | | | 2018 | | | 2017 | |
| Net asset value, beginning of year | | $ | 24.41 | | | $ | 22.80 | | | $ | 18.13 | | | $ | 13.84 | | | $ | 16.44 | | | $ | 12.92 | |
| Income (loss) from investment operations: | | | | | | | | | | | | | | | | | | | | | | | | |
| Net investment income (loss) | | | 0.09 | | | | (0.06 | ) | | | (0.00 | )^ | | | 0.12 | | | | 0.17 | | | | 0.16 | |
| Net realized and unrealized gain (loss) on investments | | | (7.68 | ) | | | 2.36 | | | | 4.85 | | | | 4.27 | | | | (2.19 | ) | | | 3.71 | |
| Total from investment operations | | | (7.59 | ) | | | 2.30 | | | | 4.85 | | | | 4.39 | | | | (2.02 | ) | | | 3.87 | |
| Less distributions from: | | | | | | | | | | | | | | | | | | | | | | | | |
| Net investment income | | | — | | | | 0.05 | | | | 0.01 | | | | 0.10 | | | | 0.13 | | | | 0.23 | |
| Net realized gain | | | — | | | | 0.64 | | | | 0.17 | | | | — | | | | 0.45 | | | | 0.12 | |
| Total distributions | | | — | | | | 0.69 | | | | 0.18 | | | | 0.10 | | | | 0.58 | | | | 0.35 | |
| Net asset value, end of year | | $ | 16.82 | | | $ | 24.41 | | | $ | 22.80 | | | $ | 18.13 | | | $ | 13.84 | | | $ | 16.44 | |
| Total return (%)* | | | (31.09 | ) | | | 10.17 | | | | 26.77 | | | | 31.76 | | | | (12.45 | ) | | | 30.05 | |
| Ratios to average daily net assets (%)**: | | | | | | | | | | | | | | | | | | | | | | | | |
| Expenses, before waivers and reimbursements | | | 1.02 | | | | 0.99 | | | | 1.01 | | | | 1.01 | | | | 1.07 | | | | 1.28 | |
| Expenses, net of waivers and reimbursements | | | 0.90 | | | | 0.90 | | | | 0.90 | | | | 0.93 | | | | 1.03 | | | | 1.05 | |
| Net investment income (loss), before waivers and reimbursements | | | 0.74 | | | | (0.33 | ) | | | (0.11 | ) | | | 0.64 | | | | 1.02 | | | | 0.86 | |
| Net investment income (loss), net of waivers and reimbursements | | | 0.86 | | | | (0.24 | ) | | | (0.00 | ) | | | 0.72 | | | | 1.06 | | | | 1.09 | |
| Class I net assets at the end of the year (in thousands) | | $ | 386,886 | | | $ | 591,500 | | | $ | 393,596 | | | $ | 181,617 | | | $ | 76,382 | | | $ | 60,279 | |
| Portfolio turnover rate (%)* | | | 33 | | | | 18 | | | | 34 | | | | 20 | | | | 33 | | | | 41 | |
| * | Rates are not annualized for periods less than a year. |
| ** | Rates are annualized for periods less than a year. |
| ^ | Amount is less than $0.005 per share. |
Note: Net investment income (loss) per share is based on the average shares outstanding during the year.
Performance cited represents past performance. Past performance does not guarantee future results and current performance may be lower or higher than the data quoted. Results shown are annual returns, which assume reinvestment of dividends and capital gains. Investment returns and principal will fluctuate and you may have a gain or loss when you sell shares. For the most current month-end performance information, please call 1-800-742-7272 or visit our Web site at www.williamblairfunds.com.
| 144 | Semiannual Report | June 30, 2022 |
Financial Highlights — For a share outstanding throughout each period
International Leaders Fund
| | Class R6 | |
| | (unaudited)
Period Ended
June 30, | | | Years Ended December 31, | |
| | | 2022 | | | 2021 | | | 2020 | | | 2019 | | | 2018 | | | 2017 | |
| Net asset value, beginning of year | | $ | 24.41 | | | $ | 22.80 | | | $ | 18.12 | | | $ | 13.83 | | | $ | 16.43 | | | $ | 12.92 | |
| Income (loss) from investment operations: | | | | | | | | | | | | | | | | | | | | | | | | |
| Net investment income (loss) | | | 0.10 | | | | (0.04 | ) | | | 0.02 | | | | 0.14 | | | | 0.18 | | | | 0.18 | |
| Net realized and unrealized gain (loss) on investments | | | (7.69 | ) | | | 2.35 | | | | 4.85 | | | | 4.26 | | | | (2.19 | ) | | | 3.70 | |
| Total from investment operations | | | (7.59 | ) | | | 2.31 | | | | 4.87 | | | | 4.40 | | | | (2.01 | ) | | | 3.88 | |
| Less distributions from: | | | | | | | | | | | | | | | | | | | | | | | | |
| Net investment income | | | — | | | | 0.06 | | | | 0.02 | | | | 0.11 | | | | 0.14 | | | | 0.25 | |
| Net realized gain | | | — | | | | 0.64 | | | | 0.17 | | | | — | | | | 0.45 | | | | 0.12 | |
| Total distributions | | | — | | | | 0.70 | | | | 0.19 | | | | 0.11 | | | | 0.59 | | | | 0.37 | |
| Net asset value, end of year | | $ | 16.82 | | | $ | 24.41 | | | $ | 22.80 | | | $ | 18.12 | | | $ | 13.83 | | | $ | 16.43 | |
| Total return (%)* | | | (31.09 | ) | | | 10.22 | | | | 26.88 | | | | 31.83 | | | | (12.38 | ) | | | 30.08 | |
| Ratios to average daily net assets (%)**: | | | | | | | | | | | | | | | | | | | | | | | | |
| Expenses, before waivers and reimbursements | | | 0.91 | | | | 0.91 | | | | 0.92 | | | | 0.93 | | | | 0.99 | | | | 1.03 | |
| Expenses, net of waivers and reimbursements | | | 0.85 | | | | 0.85 | | | | 0.85 | | | | 0.88 | | | | 0.95 | | | | 0.95 | |
| Net investment income (loss), before waivers and reimbursements | | | 0.94 | | | | (0.24 | ) | | | 0.03 | | | | 0.80 | | | | 1.07 | | | | 1.10 | |
| Net investment income (loss), net of waivers and reimbursements | | | 1.00 | | | | (0.18 | ) | | | 0.10 | | | | 0.85 | | | | 1.11 | | | | 1.18 | |
| Class R6 net assets at the end of the year (in thousands) | | $ | 558,470 | | | $ | 667,996 | | | $ | 687,171 | | | $ | 461,124 | | | $ | 324,902 | | | $ | 308,898 | |
| Portfolio turnover rate (%)* | | | 33 | | | | 18 | | | | 34 | | | | 20 | | | | 33 | | | | 41 | |
| * | Rates are not annualized for periods less than a year. |
| ** | Rates are annualized for periods less than a year. |
Note: Net investment income (loss) per share is based on the average shares outstanding during the year.
Performance cited represents past performance. Past performance does not guarantee future results and current performance may be lower or higher than the data quoted. Results shown are annual returns, which assume reinvestment of dividends and capital gains. Investment returns and principal will fluctuate and you may have a gain or loss when you sell shares. For the most current month-end performance information, please call 1-800-742-7272 or visit our Web site at www.williamblairfunds.com.
| June 30, 2022 | William Blair Funds | 145 |
Financial Highlights — For a share outstanding throughout each period
International Growth Fund
| | Class N | |
| | (unaudited)
Period Ended
June 30, | | | Years Ended December 31, | |
| | | 2022 | | | 2021 | | | 2020 | | | 2019 | | | 2018 | | | 2017 | |
| Net asset value, beginning of year | | $ | 37.57 | | | $ | 38.75 | | | $ | 29.68 | | | $ | 23.04 | | | $ | 30.41 | | | $ | 23.86 | |
| Income (loss) from investment operations: | | | | | | | | | | | | | | | | | | | | | | | | |
| Net investment income (loss) | | | 0.19 | | | | (0.28 | ) | | | (0.16 | ) | | | 0.09 | | | | 0.16 | | | | 0.21 | |
| Net realized and unrealized gain (loss) on investments | | | (11.72 | ) | | | 3.51 | | | | 9.55 | | | | 6.87 | | | | (5.56 | ) | | | 6.73 | |
| Total from investment operations | | | (11.53 | ) | | | 3.23 | | | | 9.39 | | | | 6.96 | | | | (5.40 | ) | | | 6.94 | |
| Less distributions from: | | | | | | | | | | | | | | | | | | | | | | | | |
| Net investment income | | | — | | | | — | | | | 0.06 | | | | 0.32 | | | | 0.12 | | | | 0.39 | |
| Net realized gain | | | — | | | | 4.41 | | | | 0.26 | | | | — | | | | 1.85 | | | | — | |
| Total distributions | | | — | | | | 4.41 | | | | 0.32 | | | | 0.32 | | | | 1.97 | | | | 0.39 | |
| Net asset value, end of year | | $ | 26.04 | | | $ | 37.57 | | | $ | 38.75 | | | $ | 29.68 | | | $ | 23.04 | | | $ | 30.41 | |
| Total return (%)* | | | (30.69 | ) | | | 8.68 | | | | 31.64 | | | | 30.24 | | | | (18.00 | ) | | | 29.11 | |
| Ratios to average daily net assets (%)**: | | | | | | | | | | | | | | | | | | | | | | | | |
| Expenses, before waivers and reimbursements | | | 1.44 | | | | 1.46 | | | | 1.47 | | | | 1.45 | | | | 1.46 | | | | 1.47 | |
| Expenses, net of waivers and reimbursements | | | 1.38 | | | | 1.45 | | | | 1.45 | | | | 1.45 | | | | 1.45 | | | | 1.45 | |
| Net investment income (loss), before waivers and reimbursements | | | 1.22 | | | | (0.68 | ) | | | (0.56 | ) | | | 0.34 | | | | 0.54 | | | | 0.76 | |
| Net investment income (loss), net of waivers and reimbursements | | | 1.28 | | | | (0.67 | ) | | | (0.54 | ) | | | 0.34 | | | | 0.55 | | | | 0.78 | |
| Class N net assets at the end of the year (in thousands) | | $ | 195,767 | | | $ | 293,481 | | | $ | 288,976 | | | $ | 494,788 | | | $ | 456,533 | | | $ | 763,740 | |
| Portfolio turnover rate (%)* | | | 28 | | | | 19 | | | | 27 | | | | 34 | | | | 78 | | | | 82 | |
| | | | | | | | | | | | | | | | | | | | | | | | | |
| | Class I | |
| | (unaudited)
Period Ended
June 30, | | | Years Ended December 31, | |
| | | 2022 | | | 2021 | | | 2020 | | | 2019 | | | 2018 | | | 2017 | |
| Net asset value, beginning of year | | $ | 38.68 | | | $ | 39.65 | | | $ | 30.38 | | | $ | 23.56 | | | $ | 31.13 | | | $ | 24.42 | |
| Income (loss) from investment operations: | | | | | | | | | | | | | | | | | | | | | | | | |
| Net investment income (loss) | | | 0.24 | | | | (0.15 | ) | | | (0.08 | ) | | | 0.18 | | | | 0.26 | | | | 0.30 | |
| Net realized and unrealized gain (loss) on investments | | | (12.07 | ) | | | 3.59 | | | | 9.79 | | | | 7.03 | | | | (5.70 | ) | | | 6.89 | |
| Total from investment operations | | | (11.83 | ) | | | 3.44 | | | | 9.71 | | | | 7.21 | | | | (5.44 | ) | | | 7.19 | |
| Less distributions from: | | | | | | | | | | | | | | | | | | | | | | | | |
| Net investment income | | | — | | | | — | | | | 0.18 | | | | 0.39 | | | | 0.28 | | | | 0.48 | |
| Net realized gain | | | — | | | | 4.41 | | | | 0.26 | | | | — | | | | 1.85 | | | | — | |
| Total distributions | | | — | | | | 4.41 | | | | 0.44 | | | | 0.39 | | | | 2.13 | | | | 0.48 | |
| Net asset value, end of year | | $ | 26.85 | | | $ | 38.68 | | | $ | 39.65 | | | $ | 30.38 | | | $ | 23.56 | | | $ | 31.13 | |
| Total return (%)* | | | (30.58 | ) | | | 9.01 | | | | 31.99 | | | | 30.66 | | | | (17.73 | ) | | | 29.49 | |
| Ratios to average daily net assets (%)**: | | | | | | | | | | | | | | | | | | | | | | | | |
| Expenses, before waivers and reimbursements | | | 1.16 | | | | 1.14 | | | | 1.16 | | | | 1.14 | | | | 1.13 | | | | 1.14 | |
| Expenses, net of waivers and reimbursements | | | 1.13 | | | | 1.14 | | | | 1.16 | | | | 1.14 | | | | 1.13 | | | | 1.14 | |
| Net investment income (loss), before waivers and reimbursements | | | 1.54 | | | | (0.36 | ) | | | (0.24 | ) | | | 0.65 | | | | 0.86 | | | | 1.08 | |
| Net investment income (loss), net of waivers and reimbursements | | | 1.57 | | | | (0.36 | ) | | | (0.24 | ) | | | 0.65 | | | | 0.86 | | | | 1.08 | |
| Class I net assets at the end of the year (in thousands) | | $ | 1,193,559 | | | $ | 1,702,775 | | | $ | 1,914,460 | | | $ | 1,552,355 | | | $ | 1,646,811 | | | $ | 2,375,326 | |
| Portfolio turnover rate (%)* | | | 28 | | | | 19 | | | | 27 | | | | 34 | | | | 78 | | | | 82 | |
| * | Rates are not annualized for periods less than a year. |
| ** | Rates are annualized for periods less than a year. |
Note: Net investment income (loss) per share is based on the average shares outstanding during the year.
Performance cited represents past performance. Past performance does not guarantee future results and current performance may be lower or higher than the data quoted. Results shown are annual returns, which assume reinvestment of dividends and capital gains. Investment returns and principal will fluctuate and you may have a gain or loss when you sell shares. For the most current month-end performance information, please call 1-800-742-7272 or visit our Web site at www.williamblairfunds.com.
| 146 | Semiannual Report | June 30, 2022 |
Financial Highlights — For a share outstanding throughout each period
International Growth Fund
| | Class R6 | |
| | (unaudited) | | | | | | | | | | | |
| | Period Ended | | | | | | | | | | | |
| | June 30, | | | Years Ended December 31, | |
| | | 2022 | | | | 2021 | | | 2020 | | | 2019(a) | |
| Net asset value, beginning of year | | $ | 38.72 | | | | $ | 39.66 | | | $ | 30.37 | | | $ | 27.56 | |
| Income (loss) from investment operations: | | | | | | | | | | | | | | | | | |
| Net investment income (loss) | | | 0.24 | | | | | (0.11 | ) | | | (0.07 | ) | | | (0.05 | ) |
| Net realized and unrealized gain (loss) on investments | | | (12.08 | ) | | | | 3.58 | | | | 9.83 | | | | 3.27 | |
| Total from investment operations | | | (11.84 | ) | | | | 3.47 | | | | 9.76 | | | | 3.22 | |
| Less distributions from: | | | | | | | | | | | | | | | | | |
| Net investment income | | | — | | | | | — | | | | 0.21 | | | | 0.41 | |
| Net realized gain | | | — | | | | | 4.41 | | | | 0.26 | | | | — | |
| Total distributions | | | — | | | | | 4.41 | | | | 0.47 | | | | 0.41 | |
| Net asset value, end of year | | $ | 26.88 | | | | $ | 38.72 | | | $ | 39.66 | | | $ | 30.37 | |
| Total return (%)* | | | (30.58 | ) | | | | 9.09 | | | | 32.16 | | | | 11.71 | |
| Ratios to average daily net assets (%)**: | | | | | | | | | | | | | | | | | |
| Expenses | | | 1.06 | | | | | 1.06 | | | | 1.07 | | | | 1.06 | |
| Net investment income (loss) | | | 1.56 | | | | | (0.25 | ) | | | (0.23 | ) | | | (0.26 | ) |
| Class R6 net assets at the end of the year (in thousands) | | $ | 81,167 | | | | $ | 126,641 | | | $ | 109,214 | | | $ | 61,916 | |
| Portfolio turnover rate (%)* | | | 28 | | | | | 19 | | | | 27 | | | | 34 | |
| (a) | For the period from May 2, 2019 (Commencement of Operations) to December 31, 2019. |
| * | Rates are not annualized for periods less than a year. |
| ** | are annualized for periods less than a year. |
Note: Net investment income (loss) per share is based on the average shares outstanding during the year.
Performance cited represents past performance. Past performance does not guarantee future results and current performance may be lower or higher than the data quoted. Results shown are annual returns, which assume reinvestment of dividends and capital gains. Investment returns and principal will fluctuate and you may have a gain or loss when you sell shares. For the most current month-end performance information, please call 1-800-742-7272 or visit our Web site at www.williamblairfunds.com.
| June 30, 2022 | William Blair Funds | 147 |
Financial Highlights — For a share outstanding throughout each period
Institutional International Growth Fund
| | Institutional | |
| | (unaudited)
Period Ended
June 30, | | | Years Ended December 31, | |
| | | 2022 | | | 2021 | | | 2020 | | | 2019 | | | 2018 | | | 2017 | |
| Net asset value, beginning of year | | $ | 19.03 | | | $ | 20.37 | | | $ | 17.35 | | | $ | 13.40 | | | $ | 18.08 | | | $ | 14.55 | |
| Income (loss) from investment operations: | | | | | | | | | | | | | | | | | | | | | | | | |
| Net investment income (loss) | | | 0.11 | | | | (0.05 | ) | | | (0.01 | ) | | | 0.12 | | | | 0.18 | | | | 0.21 | |
| Net realized and unrealized gain (loss) on investments | | | (5.94 | ) | | | 1.86 | | | | 5.60 | | | | 4.00 | | | | (3.29 | ) | | | 4.07 | |
| Total from investment operations | | | (5.83 | ) | | | 1.81 | | | | 5.59 | | | | 4.12 | | | | (3.11 | ) | | | 4.28 | |
| Less distributions from: | | | | | | | | | | | | | | | | | | | | | | | | |
| Net investment income | | | — | | | | — | | | | 0.02 | | | | 0.17 | | | | 0.17 | | | | 0.44 | |
| Net realized gain | | | — | | | | 3.15 | | | | 2.55 | | | | — | | | | 1.40 | | | | 0.31 | |
| Total distributions | | | — | | | | 3.15 | | | | 2.57 | | | | 0.17 | | | | 1.57 | | | | 0.75 | |
| Net asset value, end of year | | $ | 13.20 | | | $ | 19.03 | | | $ | 20.37 | | | $ | 17.35 | | | $ | 13.40 | | | $ | 18.08 | |
| Total return (%)* | | | (30.64 | ) | | | 9.39 | | | | 32.47 | | | | 30.75 | | | | (17.50 | ) | | | 29.53 | |
| Ratios to average daily net assets (%)**: | | | | | | | | | | | | | | | | | | | | | | | | |
| Expenses | | | 1.01 | | | | 1.01 | | | | 1.00 | | | | 0.99 | | | | 0.97 | | | | 0.97 | |
| Net investment income (loss) | | | 1.45 | | | | (0.22 | ) | | | (0.04 | ) | | | 0.77 | | | | 1.01 | | | | 1.22 | |
| Net assets at the end of the year (in thousands) | | $ | 932,941 | | | $ | 1,281,843 | | | $ | 1,326,482 | | | $ | 1,892,911 | | | $ | 1,784,435 | | | $ | 2,330,299 | |
| Portfolio turnover rate (%)* | | | 31 | | | | 19 | | | | 31 | | | | 35 | | | | 82 | | | | 84 | |
| * | Rates are not annualized for periods less than a year. |
| ** | Rates are annualized for periods less than a year. |
Note: Net investment income (loss) per share is based on the average shares outstanding during the year.
Performance cited represents past performance. Past performance does not guarantee future results and current performance may be lower or higher than the data quoted. Results shown are annual returns, which assume reinvestment of dividends and capital gains. Investment returns and principal will fluctuate and you may have a gain or loss when you sell shares. For the most current month-end performance information, please call 1-800-742-7272 or visit our Web site at www.williamblairfunds.com.
| 148 | Semiannual Report | June 30, 2022 |
Financial Highlights — For a share outstanding throughout each period
International Small Cap Growth Fund
| | Class N | |
| | (unaudited)
Period Ended
June 30, | | | Years Ended December 31, | |
| | | 2022 | | | 2021 | | | 2020 | | | 2019 | | | 2018 | | | 2017 | |
| Net asset value, beginning of year | | $ | 16.56 | | | $ | 17.45 | | | $ | 13.85 | | | $ | 10.36 | | | $ | 15.49 | | | $ | 12.87 | |
| Income (loss) from investment operations: | | | | | | | | | | | | | | | | | | | | | | | | |
| Net investment income (loss) | | | 0.03 | | | | (0.12 | ) | | | (0.05 | ) | | | 0.05 | | | | 0.04 | | | | 0.12 | |
| Net realized and unrealized gain (loss) on investments | | | (6.48 | ) | | | 1.91 | | | | 4.01 | | | | 3.45 | | | | (3.78 | ) | | | 3.98 | |
| Total from investment operations | | | (6.45 | ) | | | 1.79 | | | | 3.96 | | | | 3.50 | | | | (3.74 | ) | | | 4.10 | |
| Less distributions from: | | | | | | | | | | | | | | | | | | | | | | | | |
| Net investment income | | | — | | | | — | | | | — | | | | 0.01 | | | | 0.08 | | | | 0.32 | |
| Net realized gain | | | — | | | | 2.68 | | | | 0.36 | | | | — | | | | 1.31 | | | | 1.16 | |
| Total distributions | | | — | | | | 2.68 | | | | 0.36 | | | | 0.01 | | | | 1.39 | | | | 1.48 | |
| Net asset value, end of year | | $ | 10.11 | | | $ | 16.56 | | | $ | 17.45 | | | $ | 13.85 | | | $ | 10.36 | | | $ | 15.49 | |
| Total return (%)* | | | (38.95 | ) | | | 10.87 | | | | 28.68 | | | | 33.81 | | | | (24.48 | ) | | | 32.17 | |
| Ratios to average daily net assets (%)**: | | | | | | | | | | | | | | | | | | | | | | | | |
| Expenses, before waivers and reimbursements | | | 1.49 | | | | 1.46 | | | | 1.52 | | | | 1.48 | | | | 1.48 | | | | 1.62 | |
| Expenses, net of waivers and reimbursements | | | 1.49 | | | | 1.46 | | | | 1.52 | | | | 1.48 | | | | 1.48 | | | | 1.47 | |
| Net investment income (loss), before waivers and reimbursements | | | 0.43 | | | | (0.67 | ) | | | (0.36 | ) | | | 0.45 | | | | 0.29 | | | | 0.70 | |
| Net investment income (loss), net of waivers and reimbursements | | | 0.43 | | | | (0.67 | ) | | | (0.36 | ) | | | 0.45 | | | | 0.29 | | | | 0.85 | |
| Class N net assets at the end of the year (in thousands) | | $ | 1,874 | | | $ | 3,540 | | | $ | 3,101 | | | $ | 3,650 | | | $ | 3,440 | | | $ | 6,275 | |
| Portfolio turnover rate (%)* | | | 33 | | | | 52 | | | | 63 | | | | 38 | | | | 88 | | | | 64 | |
| | | | | | | | | | | | | | | | | | | | | | | | | |
| | Class I | |
| | (unaudited)
Period Ended
June 30, | | | Years Ended December 31, | |
| | | 2022 | | | 2021 | | | 2020 | | | 2019 | | | 2018 | | | 2017 | |
| Net asset value, beginning of year | | $ | 16.80 | | | $ | 17.66 | | | $ | 13.98 | | | $ | 10.45 | | | $ | 15.65 | | | $ | 13.00 | |
| Income (loss) from investment operations: | | | | | | | | | | | | | | | | | | | | | | | | |
| Net investment income (loss) | | | 0.05 | | | | (0.07 | ) | | | (0.01 | ) | | | 0.09 | | | | 0.09 | | | | 0.14 | |
| Net realized and unrealized gain (loss) on investments | | | (6.58 | ) | | | 1.93 | | | | 4.06 | | | | 3.48 | | | | (3.84 | ) | | | 4.07 | |
| Total from investment operations | | | (6.53 | ) | | | 1.86 | | | | 4.05 | | | | 3.57 | | | | (3.75 | ) | | | 4.21 | |
| Less distributions from: | | | | | | | | | | | | | | | | | | | | | | | | |
| Net investment income | | | — | | | | 0.04 | | | | 0.01 | | | | 0.04 | | | | 0.14 | | | | 0.40 | |
| Net realized gain | | | — | | | | 2.68 | | | | 0.36 | | | | — | | | | 1.31 | | | | 1.16 | |
| Total distributions | | | — | | | | 2.72 | | | | 0.37 | | | | 0.04 | | | | 1.45 | | | | 1.56 | |
| Net asset value, end of year | | $ | 10.27 | | | $ | 16.80 | | | $ | 17.66 | | | $ | 13.98 | | | $ | 10.45 | | | $ | 15.65 | |
| Total return (%)* | | | (38.87 | ) | | | 11.17 | | | | 29.04 | | | | 34.22 | | | | (24.29 | ) | | | 32.70 | |
| Ratios to average daily net assets (%)**: | | | | | | | | | | | | | | | | | | | | | | | | |
| Expenses, before waivers and reimbursements | | | 1.23 | | | | 1.19 | | | | 1.25 | | | | 1.21 | | | | 1.18 | | | | 1.31 | |
| Expenses, net of waivers and reimbursements | | | 1.23 | | | | 1.19 | | | | 1.25 | | | | 1.21 | | | | 1.18 | | | | 1.16 | |
| Net investment income (loss), before waivers and reimbursements | | | 0.73 | | | | (0.40 | ) | | | (0.05 | ) | | | 0.75 | | | | 0.60 | | | | 0.77 | |
| Net investment income (loss), net of waivers and reimbursements | | | 0.73 | | | | (0.40 | ) | | | (0.05 | ) | | | 0.75 | | | | 0.60 | | | | 0.92 | |
| Class I net assets at the end of the year (in thousands) | | $ | 91,547 | | | $ | 136,573 | | | $ | 145,283 | | | $ | 142,951 | | | $ | 165,451 | | | $ | 338,920 | |
| Portfolio turnover rate (%)* | | | 33 | | | | 52 | | | | 63 | | | | 38 | | | | 88 | | | | 64 | |
| * | Rates are not annualized for periods less than a year. |
| ** | Rates are annualized for periods less than a year. |
Note: Net investment income (loss) per share is based on the average shares outstanding during the year.
Performance cited represents past performance. Past performance does not guarantee future results and current performance may be lower or higher than the data quoted. Results shown are annual returns, which assume reinvestment of dividends and capital gains. Investment returns and principal will fluctuate and you may have a gain or loss when you sell shares. For the most current month-end performance information, please call 1-800-742-7272 or visit our Web site at www.williamblairfunds.com.
| June 30, 2022 | William Blair Funds | 149 |
Financial Highlights — For a share outstanding throughout each period
International Small Cap Growth Fund
| | Class R6 | |
| | (unaudited)
Period Ended
June 30, | | Years Ended December 31, | |
| | | 2022 | | | 2021 | | | 2020 | | | 2019 | | | 2018 | | | 2017 | |
| Net asset value, beginning of year | | $ | 16.91 | | | $ | 17.76 | | | $ | 14.05 | | | $ | 10.50 | | | $ | 15.73 | | | $ | 13.07 | |
| Income (loss) from investment operations: | | | | | | | | | | | | | | | | | | | | | | | | |
| Net investment income (loss) | | | 0.05 | | | | (0.06 | ) | | | 0.00 | ^ | | | 0.11 | | | | 0.10 | | | | 0.15 | |
| Net realized and unrealized gain (loss) on investments | | | (6.61 | ) | | | 1.95 | | | | 4.09 | | | | 3.49 | | | | (3.85 | ) | | | 4.08 | |
| Total from investment operations | | | (6.56 | ) | | | 1.89 | | | | 4.09 | | | | 3.60 | | | | (3.75 | ) | | | 4.23 | |
| Less distributions from: | | | | | | | | | | | | | | | | | | | | | | | | |
| Net investment income | | | — | | | | 0.06 | | | | 0.02 | | | | 0.05 | | | | 0.17 | | | | 0.41 | |
| Net realized gain | | | — | | | | 2.68 | | | | 0.36 | | | | — | | | | 1.31 | | | | 1.16 | |
| Total distributions | | | — | | | | 2.74 | | | | 0.38 | | | | 0.05 | | | | 1.48 | | | | 1.57 | |
| Net asset value, end of year | | $ | 10.35 | | | $ | 16.91 | | | $ | 17.76 | | | $ | 14.05 | | | $ | 10.50 | | | $ | 15.73 | |
| Total return (%)* | | | (38.79 | ) | | | 11.27 | | | | 29.23 | | | | 34.32 | | | | (24.19 | ) | | | 32.70 | |
| Ratios to average daily net assets (%)**: | | | | | | | | | | | | | | | | | | | | | | | | |
| Expenses | | | 1.12 | | | | 1.10 | | | | 1.14 | | | | 1.12 | | | | 1.08 | | | | 1.08 | |
| Net investment income (loss) | | | 0.81 | | | | (0.31 | ) | | | 0.02 | | | | 0.86 | | | | 0.67 | | | | 0.99 | |
| Class R6 net assets at the end of the year (in thousands) | | $ | 142,012 | | | $ | 243,398 | | | $ | 188,497 | | | $ | 162,465 | | | $ | 171,833 | | | $ | 256,558 | |
| Portfolio turnover rate (%)* | | | 33 | | | | 52 | | | | 63 | | | | 38 | | | | 88 | | | | 64 | |
| * | Rates are not annualized for periods less than a year. |
| ** | Rates are annualized for periods less than a year. |
| ^ | Amount is less than $0.005 per share. |
Note: Net investment income (loss) per share is based on the average shares outstanding during the year.
Performance cited represents past performance. Past performance does not guarantee future results and current performance may be lower or higher than the data quoted. Results shown are annual returns, which assume reinvestment of dividends and capital gains. Investment returns and principal will fluctuate and you may have a gain or loss when you sell shares. For the most current month-end performance information, please call 1-800-742-7272 or visit our Web site at www.williamblairfunds.com.
| 150 | Semiannual Report | June 30, 2022 |
Financial Highlights — For a share outstanding throughout each period
Emerging Markets Leaders Fund
| | Class N | |
| | (unaudited)
Period Ended
June 30, | | | Years Ended December 31, | |
| | | 2022 | | | 2021 | | | 2020 | | | 2019 | | | 2018 | | | 2017 | |
| Net asset value, beginning of year | | $ | 11.33 | | | $ | 13.26 | | | $ | 10.51 | | | $ | 8.26 | | | $ | 11.06 | | | $ | 7.84 | |
| Income (loss) from investment operations: | | | | | | | | | | | | | | | | | | | | | | | | |
| Net investment income (loss) | | | 0.02 | | | | (0.06 | ) | | | (0.02 | ) | | | 0.03 | | | | 0.03 | | | | 0.01 | |
| Net realized and unrealized gain (loss) on investments | | | (2.68 | ) | | | (0.98 | ) | | | 2.88 | | | | 2.28 | | | | (1.97 | ) | | | 3.26 | |
| Total from investment operations | | | (2.66 | ) | | | (1.04 | ) | | | 2.86 | | | | 2.31 | | | | (1.94 | ) | | | 3.27 | |
| Less distributions from: | | | | | | | | | | | | | | | | | | | | | | | | |
| Net investment income | | | — | | | | 0.01 | | | | — | | | | 0.04 | | | | 0.07 | | | | 0.05 | |
| Net realized gain | | | — | | | | 0.88 | | | | 0.11 | | | | 0.02 | | | | 0.79 | | | | — | |
| Total distributions | | | — | | | | 0.89 | | | | 0.11 | | | | 0.06 | | | | 0.86 | | | | 0.05 | |
| Net asset value, end of year | | $ | 8.67 | | | $ | 11.33 | | | $ | 13.26 | | | $ | 10.51 | | | $ | 8.26 | | | $ | 11.06 | |
| Total return (%)* | | | (23.48 | ) | | | (7.69 | ) | | | 27.23 | | | | 27.98 | | | | (17.73 | ) | | | 41.68 | |
| Ratios to average daily net assets (%)**: | | | | | | | | | | | | | | | | | | | | | | | | |
| Expenses, before waivers and reimbursements | | | 1.56 | | | | 1.56 | | | | 1.63 | | | | 1.62 | | | | 1.60 | | | | 1.62 | |
| Expenses, net of waivers and reimbursements | | | 1.35 | | | | 1.40 | | | | 1.40 | | | | 1.45 | | | | 1.58 | | | | 1.47 | |
| Net investment income (loss), before waivers and reimbursements | | | 0.20 | | | | (0.64 | ) | | | (0.45 | ) | | | 0.17 | | | | 0.27 | | | | (0.01 | ) |
| Net investment income (loss), net of waivers and reimbursements | | | 0.41 | | | | (0.48 | ) | | | (0.22 | ) | | | 0.34 | | | | 0.29 | | | | 0.14 | |
| Class N net assets at the end of the year (in thousands) | | $ | 937 | | | $ | 2,096 | | | $ | 1,803 | | | $ | 1,856 | | | $ | 2,239 | | | $ | 2,766 | |
| Portfolio turnover rate (%)* | | | 21 | | | | 40 | | | | 47 | | | | 33 | | | | 52 | | | | 59 | |
| | | | | | | | | | | | | | | | | | | | | | | | | |
| | Class I | |
| | (unaudited)
Period Ended
June 30, | | | Years Ended December 31, | |
| | | 2022 | | | 2021 | | | 2020 | | | 2019 | | | 2018 | | | 2017 | |
| Net asset value, beginning of year | | $ | 11.33 | | | $ | 13.28 | | | $ | 10.52 | | | $ | 8.27 | | | $ | 11.09 | | | $ | 7.87 | |
| Income (loss) from investment operations: | | | | | | | | | | | | | | | | | | | | | | | | |
| Net investment income (loss) | | | 0.05 | | | | (0.04 | ) | | | (0.00 | )^ | | | 0.06 | | | | 0.06 | | | | 0.02 | |
| Net realized and unrealized gain (loss) on investments | | | (2.69 | ) | | | (0.98 | ) | | | 2.89 | | | | 2.29 | | | | (1.97 | ) | | | 3.27 | |
| Total from investment operations | | | (2.64 | ) | | | (1.02 | ) | | | 2.89 | | | | 2.35 | | | | (1.91 | ) | | | 3.29 | |
| Less distributions from: | | | | | | | | | | | | | | | | | | | | | | | | |
| Net investment income | | | — | | | | 0.05 | | | | 0.02 | | | | 0.08 | | | | 0.12 | | | | 0.07 | |
| Net realized gain | | | — | | | | 0.88 | | | | 0.11 | | | | 0.02 | | | | 0.79 | | | | — | |
| Total distributions | | | — | | | | 0.93 | | | | 0.13 | | | | 0.10 | | | | 0.91 | | | | 0.07 | |
| Net asset value, end of year | | $ | 8.69 | | | $ | 11.33 | | | $ | 13.28 | | | $ | 10.52 | | | $ | 8.27 | | | $ | 11.09 | |
| Total return (%)* | | | (23.30 | ) | | | (7.48 | ) | | | 27.52 | | | | 28.36 | | | | (17.45 | ) | | | 41.89 | |
| Ratios to average daily net assets (%)**: | | | | | | | | | | | | | | | | | | | | | | | | |
| Expenses, before waivers and reimbursements | | | 1.23 | | | | 1.28 | | | | 1.33 | | | | 1.29 | | | | 1.27 | | | | 1.40 | |
| Expenses, net of waivers and reimbursements | | | 1.10 | | | | 1.15 | | | | 1.15 | | | | 1.20 | | | | 1.27 | | | | 1.25 | |
| Net investment income (loss), before waivers and reimbursements | | | 0.84 | | | | (0.40 | ) | | | (0.21 | ) | | | 0.53 | | | | 0.58 | | | | 0.09 | |
| Net investment income (loss), net of waivers and reimbursements | | | 0.97 | | | | (0.27 | ) | | | (0.03 | ) | | | 0.62 | | | | 0.58 | | | | 0.24 | |
| Class I net assets at the end of the year (in thousands) | | $ | 43,103 | | | $ | 42,750 | | | $ | 62,319 | | | $ | 45,090 | | | $ | 34,786 | | | $ | 47,666 | |
| Portfolio turnover rate (%)* | | | 21 | | | | 40 | | | | 47 | | | | 33 | | | | 52 | | | | 59 | |
| * | Rates are not annualized for periods less than a year. |
| ** | Rates are annualized for periods less than a year. |
| ^ | Amount is less than $0.005 per share. |
Note: Net investment income (loss) per share is based on the average shares outstanding during the year.
Performance cited represents past performance. Past performance does not guarantee future results and current performance may be lower or higher than the data quoted. Results shown are annual returns, which assume reinvestment of dividends and capital gains. Investment returns and principal will fluctuate and you may have a gain or loss when you sell shares. For the most current month-end performance information, please call 1-800-742-7272 or visit our Web site at www.williamblairfunds.com.
| June 30, 2022 | William Blair Funds | 151 |
Financial Highlights — For a share outstanding throughout each period
Emerging Markets Leaders Fund
| | Class R6 | |
| | (unaudited)
Period Ended
June 30, | | | Years Ended December 31, | |
| | | 2022 | | | 2021 | | | 2020 | | | 2019 | | | 2018 | | | 2017 | |
| Net asset value, beginning of year | | $ | 11.32 | | | $ | 13.26 | | | $ | 10.51 | | | $ | 8.26 | | | $ | 11.09 | | | $ | 7.86 | |
| Income (loss) from investment operations: | | | | | | | | | | | | | | | | | | | | | | | | |
| Net investment income (loss) | | | 0.05 | | | | (0.02 | ) | | | 0.00 | ^ | | | 0.06 | | | | 0.07 | | | | 0.03 | |
| Net realized and unrealized gain (loss) on investments | | | (2.68 | ) | | | (0.98 | ) | | | 2.89 | | | | 2.29 | | | | (1.98 | ) | | | 3.28 | |
| Total from investment operations | | | (2.63 | ) | | | (1.00 | ) | | | 2.89 | | | | 2.35 | | | | (1.91 | ) | | | 3.31 | |
| Less distributions from: | | | | | | | | | | | | | | | | | | | | | | | | |
| Net investment income | | | — | | | | 0.06 | | | | 0.03 | | | | 0.08 | | | | 0.13 | | | | 0.08 | |
| Net realized gain | | | — | | | | 0.88 | | | | 0.11 | | | | 0.02 | | | | 0.79 | | | | — | |
| Total distributions | | | — | | | | 0.94 | | | | 0.14 | | | | 0.10 | | | | 0.92 | | | | 0.08 | |
| Net asset value, end of year | | $ | 8.69 | | | $ | 11.32 | | | $ | 13.26 | | | $ | 10.51 | | | $ | 8.26 | | | $ | 11.09 | |
| Total return (%)* | | | (23.23 | ) | | | (7.35 | ) | | | 27.50 | | | | 28.45 | | | | (17.46 | ) | | | 42.15 | |
| Ratios to average daily net assets (%)**: | | | | | | | | | | | | | | | | | | | | | | | | |
| Expenses, before waivers and reimbursements | | | 1.15 | | | | 1.20 | | | | 1.26 | | | | 1.23 | | | | 1.20 | | | | 1.19 | |
| Expenses, net of waivers and reimbursements | | | 1.05 | | | | 1.10 | | | | 1.10 | | | | 1.15 | | | | 1.20 | | | | 1.19 | |
| Net investment income (loss), before waivers and reimbursements | | | 0.84 | | | | (0.26 | ) | | | (0.11 | ) | | | 0.57 | | | | 0.71 | | | | 0.33 | |
| Net investment income (loss), net of waivers and reimbursements | | | 0.94 | | | | (0.16 | ) | | | 0.05 | | | | 0.65 | | | | 0.71 | | | | 0.33 | |
| Class R6 net assets at the end of the year (in thousands) | | $ | 352,576 | | | $ | 428,839 | | | $ | 198,015 | | | $ | 191,337 | | | $ | 161,889 | | | $ | 427,480 | |
| Portfolio turnover rate (%)* | | | 21 | | | | 40 | | | | 47 | | | | 33 | | | | 52 | | | | 59 | |
| * | Rates are not annualized for periods less than a year. |
| ** | Rates are annualized for periods less than a year. |
| ^ | Amount is less than $0.005 per share. |
Note: Net investment income (loss) per share is based on the average shares outstanding during the year.
Performance cited represents past performance. Past performance does not guarantee future results and current performance may be lower or higher than the data quoted. Results shown are annual returns, which assume reinvestment of dividends and capital gains. Investment returns and principal will fluctuate and you may have a gain or loss when you sell shares. For the most current month-end performance information, please call 1-800-742-7272 or visit our Web site at www.williamblairfunds.com.
| 152 | Semiannual Report | June 30, 2022 |
Financial Highlights — For a share outstanding throughout each period
Emerging Markets Growth Fund
| | Class N | |
| | (unaudited)
Period Ended
June 30, | | | Years Ended December 31, | |
| | | 2022 | | | 2021 | | | 2020 | | | 2019 | | | 2018 | | | 2017 | |
| Net asset value, beginning of year | | $ | 15.55 | | | $ | 18.42 | | | $ | 13.67 | | | $ | 11.14 | | | $ | 16.20 | | | $ | 10.99 | |
| Income (loss) from investment operations: | | | | | | | | | | | | | | | | | | | | | | | | |
| Net investment income (loss) | | | 0.02 | | | | (0.13 | ) | | | (0.09 | ) | | | 0.11 | | | | 0.01 | | | | (0.02 | ) |
| Net realized and unrealized gain (loss) on investments | | | (4.38 | ) | | | 0.62 | | | | 5.60 | | | | 2.98 | | | | (3.49 | ) | | | 5.35 | |
| Total from investment operations | | | (4.36 | ) | | | 0.49 | | | | 5.51 | | | | 3.09 | | | | (3.48 | ) | | | 5.33 | |
| Less distributions from: | | | | | | | | | | | | | | | | | | | | | | | | |
| Net investment income | | | — | | | | — | | | | — | | | | 0.16 | | | | 0.11 | | | | 0.12 | |
| Net realized gain | | | — | | | | 3.36 | | | | 0.76 | | | | 0.40 | | | | 1.47 | | | | — | |
| Total distributions | | | — | | | | 3.36 | | | | 0.76 | | | | 0.56 | | | | 1.58 | | | | 0.12 | |
| Net asset value, end of year | | $ | 11.19 | | | $ | 15.55 | | | $ | 18.42 | | | $ | 13.67 | | | $ | 11.14 | | | $ | 16.20 | |
| Total return (%)* | | | (28.04 | ) | | | 2.97 | | | | 40.43 | | | | 27.89 | | | | (21.61 | ) | | | 48.53 | |
| Ratios to average daily net assets (%)**: | | | | | | | | | | | | | | | | | | | | | | | | |
| Expenses, before waivers and reimbursements | | | 1.55 | | | | 1.55 | | | | 1.55 | | | | 1.51 | | | | 1.52 | | | | 1.65 | |
| Expenses, net of waivers and reimbursements | | | 1.48 | | | | 1.55 | | | | 1.55 | | | | 1.51 | | | | 1.52 | | | | 1.50 | |
| Net investment income (loss), before waivers and reimbursements | | | 0.19 | | | | (0.65 | ) | | | (0.60 | ) | | | 0.84 | | | | 0.09 | | | | (0.29 | ) |
| Net investment income (loss), net of waivers and reimbursements | | | 0.26 | | | | (0.65 | ) | | | (0.60 | ) | | | 0.84 | | | | 0.09 | | | | (0.14 | ) |
| Class N net assets at the end of the year (in thousands) | | $ | 18,168 | | | $ | 28,565 | | | $ | 18,606 | | | $ | 7,804 | | | $ | 7,103 | | | $ | 10,479 | |
| Portfolio turnover rate (%)* | | | 51 | | | | 52 | | | | 77 | | | | 79 | | | | 113 | | | | 91 | |
| | | | | | | | | | | | | | | | | | | | | | | | | |
| | Class I | |
| | (unaudited)
Period Ended
June 30, | | | Years Ended December 31, | |
| | | 2022 | | | 2021 | | | 2020 | | | 2019 | | | 2018 | | | 2017 | |
| Net asset value, beginning of year | | $ | 15.85 | | | $ | 18.66 | | | $ | 13.82 | | | $ | 11.25 | | | $ | 16.36 | | | $ | 11.10 | |
| Income (loss) from investment operations: | | | | | | | | | | | | | | | | | | | | | | | | |
| Net investment income (loss) | | | 0.04 | | | | (0.07 | ) | | | (0.05 | ) | | | 0.14 | | | | 0.05 | | | | 0.01 | |
| Net realized and unrealized gain (loss) on investments | | | (4.47 | ) | | | 0.62 | | | | 5.66 | | | | 3.02 | | | | (3.52 | ) | | | 5.40 | |
| Total from investment operations | | | (4.43 | ) | | | 0.55 | | | | 5.61 | | | | 3.16 | | | | (3.47 | ) | | | 5.41 | |
| Less distributions from: | | | | | | | | | | | | | | | | | | | | | | | | |
| Net investment income | | | — | | | | — | | | | 0.01 | | | | 0.19 | | | | 0.17 | | | | 0.15 | |
| Net realized gain | | | — | | | | 3.36 | | | | 0.76 | | | | 0.40 | | | | 1.47 | | | | — | |
| Total distributions | | | — | | | | 3.36 | | | | 0.77 | | | | 0.59 | | | | 1.64 | | | | 0.15 | |
| Net asset value, end of year | | $ | 11.42 | | | $ | 15.85 | | | $ | 18.66 | | | $ | 13.82 | | | $ | 11.25 | | | $ | 16.36 | |
| Total return (%)* | | | (27.95 | ) | | | 3.25 | | | | 40.72 | | | | 28.29 | | | | (21.37 | ) | | | 48.83 | |
| Ratios to average daily net assets (%)**: | | | | | | | | | | | | | | | | | | | | | | | | |
| Expenses, before waivers and reimbursements | | | 1.26 | | | | 1.27 | | | | 1.30 | | | | 1.26 | | | | 1.27 | | | | 1.42 | |
| Expenses, net of waivers and reimbursements | | | 1.23 | | | | 1.27 | | | | 1.30 | | | | 1.26 | | | | 1.27 | | | | 1.27 | |
| Net investment income (loss), before waivers and reimbursements | | | 0.54 | | | | (0.37 | ) | | | (0.33 | ) | | | 1.06 | | | | 0.34 | | | | (0.07 | ) |
| Net investment income (loss), net of waivers and reimbursements | | | 0.57 | | | | (0.37 | ) | | | (0.33 | ) | | | 1.06 | | | | 0.34 | | | | 0.08 | |
| Class I net assets at the end of the year (in thousands) | | $ | 194,090 | | | $ | 190,985 | | | $ | 113,697 | | | $ | 73,496 | | | $ | 79,427 | | | $ | 129,481 | |
| Portfolio turnover rate (%)* | | | 51 | | | | 52 | | | | 77 | | | | 79 | | | | 113 | | | | 91 | |
| * | Rates are not annualized for periods less than a year. |
| ** | Rates are annualized for periods less than a year. |
Note: Net investment income (loss) per share is based on the average shares outstanding during the year.
Performance cited represents past performance. Past performance does not guarantee future results and current performance may be lower or higher than the data quoted. Results shown are annual returns, which assume reinvestment of dividends and capital gains. Investment returns and principal will fluctuate and you may have a gain or loss when you sell shares. For the most current month-end performance information, please call 1-800-742-7272 or visit our Web site at www.williamblairfunds.com.
| June 30, 2022 | William Blair Funds | 153 |
Financial Highlights — For a share outstanding throughout each period
Emerging Markets Growth Fund
| | Class R6 | |
| | (unaudited)
Period Ended
June 30, | | | Years Ended December 31, | |
| | | 2022 | | | 2021 | | | 2020 | | | 2019 | | | 2018 | | | 2017 | |
| Net asset value, beginning of year | | $ | 16.04 | | | $ | 18.84 | | | $ | 13.94 | | | $ | 11.35 | | | $ | 16.49 | | | $ | 11.18 | |
| Income (loss) from investment operations: | | | | | | | | | | | | | | | | | | | | | | | | |
| Net investment income (loss) | | | 0.04 | | | | (0.05 | ) | | | (0.03 | ) | | | 0.15 | | | | 0.07 | | | | 0.02 | |
| Net realized and unrealized gain (loss) on investments | | | (4.52 | ) | | | 0.63 | | | | 5.71 | | | | 3.04 | | | | (3.56 | ) | | | 5.46 | |
| Total from investment operations | | | (4.48 | ) | | | 0.58 | | | | 5.68 | | | | 3.19 | | | | (3.49 | ) | | | 5.48 | |
| Less distributions from: | | | | | | | | | | | | | | | | | | | | | | | | |
| Net investment income | | | — | | | | 0.02 | | | | 0.02 | | | | 0.20 | | | | 0.18 | | | | 0.17 | |
| Net realized gain | | | — | | | | 3.36 | | | | 0.76 | | | | 0.40 | | | | 1.47 | | | | — | |
| Total distributions | | | — | | | | 3.38 | | | | 0.78 | | | | 0.60 | | | | 1.65 | | | | 0.17 | |
| Net asset value, end of year | | $ | 11.56 | | | $ | 16.04 | | | $ | 18.84 | | | $ | 13.94 | | | $ | 11.35 | | | $ | 16.49 | |
| Total return (%)* | | | (27.93 | ) | | | 3.37 | | | | 40.90 | | | | 28.28 | | | | (21.29 | ) | | | 49.06 | |
| Ratios to average daily net assets (%)**: | | | | | | | | | | | | | | | | | | | | | | | | |
| Expenses | | | 1.17 | | | | 1.17 | | | | 1.20 | | | | 1.19 | | | | 1.19 | | | | 1.17 | |
| Net investment income (loss) | | | 0.54 | | | | (0.27 | ) | | | (0.22 | ) | | | 1.17 | | | | 0.46 | | | | 0.17 | |
| Class R6 net assets at the end of the year (in thousands) | | $ | 512,999 | | | $ | 822,288 | | | $ | 1,063,433 | | | $ | 708,892 | | | $ | 654,441 | | | $ | 1,178,853 | |
| Portfolio turnover rate (%)* | | | 51 | | | | 52 | | | | 77 | | | | 79 | | | | 113 | | | | 91 | |
| * | Rates are not annualized for periods less than a year. |
| ** | Rates are annualized for periods less than a year. |
Note: Net investment income (loss) per share is based on the average shares outstanding during the year.
Performance cited represents past performance. Past performance does not guarantee future results and current performance may be lower or higher than the data quoted. Results shown are annual returns, which assume reinvestment of dividends and capital gains. Investment returns and principal will fluctuate and you may have a gain or loss when you sell shares. For the most current month-end performance information, please call 1-800-742-7272 or visit our Web site at www.williamblairfunds.com.
| 154 | Semiannual Report | June 30, 2022 |
Financial Highlights — For a share outstanding throughout each period
Emerging Markets Small Cap Growth Fund
| | Class N | |
| | (unaudited)
Period Ended
June 30, | | | Years Ended December 31, | |
| | | 2022 | | | 2021 | | | 2020 | | | 2019 | | | 2018 | | | 2017 | |
| Net asset value, beginning of year | | $ | 23.52 | | | $ | 22.22 | | | $ | 16.80 | | | $ | 13.96 | | | $ | 18.66 | | | $ | 13.73 | |
| Income (loss) from investment operations: | | | | | | | | | | | | | | | | | | | | | | | | |
| Net investment income (loss) | | | 0.02 | | | | (0.20 | ) | | | (0.06 | ) | | | 0.00 | ^ | | | (0.02 | ) | | | 0.01 | |
| Net realized and unrealized gain (loss) on investments | | | (6.39 | ) | | | 3.53 | | | | 5.48 | | | | 2.84 | | | | (4.38 | ) | | | 5.46 | |
| Total from investment operations | | | (6.37 | ) | | | 3.33 | | | | 5.42 | | | | 2.84 | | | | (4.40 | ) | | | 5.47 | |
| Less distributions from: | | | | | | | | | | | | | | | | | | | | | | | | |
| Net investment income | | | — | | | | — | | | | — | | | | — | | | | — | | | | 0.50 | |
| Net realized gain | | | — | | | | 2.03 | | | | — | | | | — | | | | 0.30 | | | | 0.04 | |
| Total distributions | | | — | | | | 2.03 | | | | — | | | | — | | | | 0.30 | | | | 0.54 | |
| Net asset value, end of year | | $ | 17.15 | | | $ | 23.52 | | | $ | 22.22 | | | $ | 16.80 | | | $ | 13.96 | | | $ | 18.66 | |
| Total return (%)* | | | (27.08 | ) | | | 15.23 | | | | 32.26 | | | | 20.34 | | | | (23.57 | ) | | | 40.09 | |
| Ratios to average daily net assets (%)**: | | | | | | | | | | | | | | | | | | | | | | | | |
| Expenses, before waivers and reimbursements | | | 1.66 | | | | 1.60 | | | | 1.77 | | | | 1.71 | | | | 1.70 | | | | 1.83 | |
| Expenses, net of waivers and reimbursements | | | 1.55 | | | | 1.55 | | | | 1.55 | | | | 1.55 | | | | 1.58 | | | | 1.64 | |
| Net investment income (loss), before waivers and reimbursements | | | 0.10 | | | | (0.88 | ) | | | (0.58 | ) | | | (0.14 | ) | | | (0.22 | ) | | | (0.11 | ) |
| Net investment income (loss), net of waivers and reimbursements | | | 0.21 | | | | (0.83 | ) | | | (0.36 | ) | | | 0.02 | | | | (0.10 | ) | | | 0.08 | |
| Class N net assets at the end of the year (in thousands) | | $ | 3,237 | | | $ | 4,262 | | | $ | 3,947 | | | $ | 4,025 | | | $ | 8,977 | | | $ | 15,082 | |
| Portfolio turnover rate (%)* | | | 51 | | | | 76 | | | | 119 | | | | 142 | | | | 187 | | | | 183 | |
| | | | | | | | | | | | | | | | | | | | | | | | | |
| | Class I | |
| | (unaudited)
Period Ended
June 30, | | | Years Ended December 31, | |
| | | 2022 | | | 2021 | | | 2020 | | | 2019 | | | 2018 | | | 2017 | |
| Net asset value, beginning of year | | $ | 23.79 | | | $ | 22.40 | | | $ | 16.90 | | | $ | 14.03 | | | $ | 18.73 | | | $ | 13.77 | |
| Income (loss) from investment operations: | | | | | | | | | | | | | | | | | | | | | | | | |
| Net investment income (loss) | | | 0.04 | | | | (0.14 | ) | | | (0.02 | ) | | | 0.04 | | | | 0.03 | | | | 0.08 | |
| Net realized and unrealized gain (loss) on investments | | | (6.46 | ) | | | 3.56 | | | | 5.53 | | | | 2.86 | | | | (4.41 | ) | | | 5.47 | |
| Total from investment operations | | | (6.42 | ) | | | 3.42 | | | | 5.51 | | | | 2.90 | | | | (4.38 | ) | | | 5.55 | |
| Less distributions from: | | | | | | | | | | | | | | | | | | | | | | | | |
| Net investment income | | | — | | | | — | | | | 0.01 | | | | 0.03 | | | | 0.02 | | | | 0.55 | |
| Net realized gain | | | — | | | | 2.03 | | | | — | | | | — | | | | 0.30 | | | | 0.04 | |
| Total distributions | | | — | | | | 2.03 | | | | 0.01 | | | | 0.03 | | | | 0.32 | | | | 0.59 | |
| Net asset value, end of year | | $ | 17.37 | | | $ | 23.79 | | | $ | 22.40 | | | $ | 16.90 | | | $ | 14.03 | | | $ | 18.73 | |
| Total return (%)* | | | (26.99 | ) | | | 15.51 | | | | 32.60 | | | | 20.58 | | | | (23.31 | ) | | | 40.53 | |
| Ratios to average daily net assets (%)**: | | | | | | | | | | | | | | | | | | | | | | | | |
| Expenses, before waivers and reimbursements | | | 1.37 | | | | 1.31 | | | | 1.45 | | | | 1.40 | | | | 1.38 | | | | 1.50 | |
| Expenses, net of waivers and reimbursements | | | 1.30 | | | | 1.30 | | | | 1.30 | | | | 1.30 | | | | 1.33 | | | | 1.31 | |
| Net investment income (loss), before waivers and reimbursements | | | 0.37 | | | | (0.59 | ) | | | (0.25 | ) | | | 0.18 | | | | 0.13 | | | | 0.30 | |
| Net investment income (loss), net of waivers and reimbursements | | | 0.44 | | | | (0.58 | ) | | | (0.10 | ) | | | 0.28 | | | | 0.18 | | | | 0.49 | |
| Class I net assets at the end of the year (in thousands) | | $ | 124,190 | | | $ | 171,994 | | | $ | 151,302 | | | $ | 142,885 | | | $ | 169,770 | | | $ | 282,620 | |
| Portfolio turnover rate (%)* | | | 51 | | | | 76 | | | | 119 | | | | 142 | | | | 187 | | | | 183 | |
| * | Rates are not annualized for periods less than a year. |
| ** | Rates are annualized for periods less than a year. |
| ^ | Amount is less than $0.005 per share. |
Note: Net investment income (loss) per share is based on the average shares outstanding during the year.
Performance cited represents past performance. Past performance does not guarantee future results and current performance may be lower or higher than the data quoted. Results shown are annual returns, which assume reinvestment of dividends and capital gains. Investment returns and principal will fluctuate and you may have a gain or loss when you sell shares. For the most current month-end performance information, please call 1-800-742-7272 or visit our Web site at www.williamblairfunds.com.
| June 30, 2022 | William Blair Funds | 155 |
Financial Highlights — For a share outstanding throughout each period
Emerging Markets Small Cap Growth Fund
| | Class R6 | |
| | (unaudited)
Period Ended
June 30, | | | Years Ended December 31, | |
| | | 2022 | | | 2021 | | | 2020 | | | 2019 | | | 2018 | | | 2017 | |
| Net asset value, beginning of year | | $ | 23.84 | | | $ | 22.44 | | | $ | 16.93 | | | $ | 14.06 | | | $ | 18.76 | | | $ | 13.79 | |
| Income (loss) from investment operations: | | | | | | | | | | | | | | | | | | | | | | | | |
| Net investment income (loss) | | | 0.05 | | | | (0.12 | ) | | | (0.00 | )^ | | | 0.05 | | | | 0.05 | | | | 0.10 | |
| Net realized and unrealized gain (loss) on investments | | | (6.48 | ) | | | 3.56 | | | | 5.53 | | | | 2.86 | | | | (4.41 | ) | | | 5.47 | |
| Total from investment operations | | | (6.43 | ) | | | 3.44 | | | | 5.53 | | | | 2.91 | | | | (4.36 | ) | | | 5.57 | |
| Less distributions from: | | | | | | | | | | | | | | | | | | | | | | | | |
| Net investment income | | | — | | | | 0.01 | | | | 0.02 | | | | 0.04 | | | | 0.04 | | | | 0.56 | |
| Net realized gain | | | — | | | | 2.03 | | | | — | | | | — | | | | 0.30 | | | | 0.04 | |
| Total distributions | | | — | | | | 2.04 | | | | 0.02 | | | | 0.04 | | | | 0.34 | | | | 0.60 | |
| Net asset value, end of year | | $ | 17.41 | | | $ | 23.84 | | | $ | 22.44 | | | $ | 16.93 | | | $ | 14.06 | | | $ | 18.76 | |
| Total return (%)* | | | (26.97 | ) | | | 15.58 | | | | 32.66 | | | | 20.69 | | | | (23.24 | ) | | | 40.62 | |
| Ratios to average daily net assets (%)**: | | | | | | | | | | | | | | | | | | | | | | | | |
| Expenses, before waivers and reimbursements | | | 1.28 | | | | 1.23 | | | | 1.36 | | | | 1.33 | | | | 1.30 | | | | 1.29 | |
| Expenses, net of waivers and reimbursements | | | 1.25 | | | | 1.23 | | | | 1.25 | | | | 1.25 | | | | 1.25 | | | | 1.25 | |
| Net investment income (loss), before waivers and reimbursements | | | 0.46 | | | | (0.49 | ) | | | (0.14 | ) | | | 0.27 | | | | 0.22 | | | | 0.53 | |
| Net investment income (loss), net of waivers and reimbursements | | | 0.49 | | | | (0.49 | ) | | | (0.03 | ) | | | 0.35 | | | | 0.27 | | | | 0.57 | |
| Class R6 net assets at the end of the year (in thousands) | | $ | 209,540 | | | $ | 324,152 | | | $ | 152,160 | | | $ | 130,711 | | | $ | 98,188 | | | $ | 166,927 | |
| Portfolio turnover rate (%)* | | | 51 | | | | 76 | | | | 119 | | | | 142 | | | | 187 | | | | 183 | |
| * | Rates are not annualized for periods less than a year. |
| ** | Rates are annualized for periods less than a year. |
| ^ | Amount is less than $0.005 per share. |
Note: Net investment income (loss) per share is based on the average shares outstanding during the year.
Performance cited represents past performance. Past performance does not guarantee future results and current performance may be lower or higher than the data quoted. Results shown are annual returns, which assume reinvestment of dividends and capital gains. Investment returns and principal will fluctuate and you may have a gain or loss when you sell shares. For the most current month-end performance information, please call 1-800-742-7272 or visit our Web site at www.williamblairfunds.com.
| 156 | Semiannual Report | June 30, 2022 |
Financial Highlights — For a share outstanding throughout each period
China Growth Fund
| | | Class I | |
| | | (unaudited) | | | | |
| | | Period Ended | | | Period Ended | |
| | | June 30, | | | December 31, | |
| | | | 2022 | | | | 2021(a) | |
| Net asset value, beginning of year | | | $ | 9.54 | | | | $ | 10.00 | |
| Income (loss) from investment operations: | | | | | | | | | | |
| Net investment income (loss) | | | | 0.02 | | | | | (0.04 | ) |
| Net realized and unrealized gain (loss) on investments | | | | (1.79 | ) | | | | (0.42 | ) |
| Total from investment operations | | | | (1.77 | ) | | | | (0.46 | ) |
| Less distributions from: | | | | | | | | | | |
| Net investment income | | | | — | | | | | — | |
| Net realized gain | | | | — | | | | | — | |
| Total distributions | | | | — | | | | | — | |
| Net asset value, end of year | | | $ | 7.77 | | | | $ | 9.54 | |
| Total return (%)* | | | | (18.72 | ) | | | | (4.40 | ) |
| Ratios to average daily net assets (%)**: | | | | | | | | | | |
| Expenses, before waivers and reimbursements | | | | 3.58 | | | | | 4.74 | |
| Expenses, net of waivers and reimbursements | | | | 1.03 | | | | | 1.05 | |
| Net investment income (loss), before waivers and reimbursements | | | | (2.12 | ) | | | | (4.69 | ) |
| Net investment income (loss), net of waivers and reimbursements | | | | 0.43 | | | | | (1.00 | ) |
| Class I net assets at the end of the year (in thousands) | | | $ | 2,350 | | | | $ | 5,538 | |
| Portfolio turnover rate (%)* | | | | 24 | | | | | 4 | |
| | | | | | | | | | | |
| | | Class R6 | |
| | | (unaudited) | | | | | |
| | | Period Ended | | | Period Ended | |
| | | June 30, | | | December 31, | |
| | | | 2022 | | | | 2021(a) | |
| Net asset value, beginning of year | | | $ | 9.54 | | | | $ | 10.00 | |
| Income (loss) from investment operations: | | | | | | | | | | |
| Net investment income (loss) | | | | 0.03 | | | | | (0.03 | ) |
| Net realized and unrealized gain (loss) on investments | | | | (1.80 | ) | | | | (0.43 | ) |
| Total from investment operations | | | | (1.77 | ) | | | | (0.46 | ) |
| Less distributions from: | | | | | | | | | | |
| Net investment income | | | | — | | | | | — | |
| Net realized gain | | | | — | | | | | — | |
| Total distributions | | | | — | | | | | — | |
| Net asset value, end of year | | | $ | 7.77 | | | | $ | 9.54 | |
| Total return (%)* | | | | (18.72 | ) | | | | (4.40 | ) |
| Ratios to average daily net assets (%)**: | | | | | | | | | | |
| Expenses, before waivers and reimbursements | | | | 3.55 | | | | | 4.72 | |
| Expenses, net of waivers and reimbursements | | | | 0.98 | | | | | 1.00 | |
| Net investment income (loss), before waivers and reimbursements | | | | (1.89 | ) | | | | (4.61 | ) |
| Net investment income (loss), net of waivers and reimbursements | | | | 0.68 | | | | | (0.89 | ) |
| Class R6 net assets at the end of the year (in thousands) | | | $ | 1,360 | | | | $ | 1,687 | |
| Portfolio turnover rate (%)* | | | | 24 | | | | | 4 | |
| (a) | For the period from August 27, 2021 (Commencement of Operations) to December 31, 2021. |
| * | Rates are not annualized for periods less than a year. |
| ** | Rates are annualized for periods less than a year. |
Note: Net investment income (loss) per share is based on the average shares outstanding during the year.
Performance cited represents past performance. Past performance does not guarantee future results and current performance may be lower or higher than the data quoted. Results shown are annual returns, which assume reinvestment of dividends and capital gains. Investment returns and principal will fluctuate and you may have a gain or loss when you sell shares. For the most current month-end performance information, please call 1-800-742-7272 or visit our Web site at www.williamblairfunds.com.
| June 30, 2022 | William Blair Funds | 157 |
Financial Highlights — For a share outstanding throughout each period
Emerging Markets Debt Fund
| | | Class I | |
| | | (unaudited) | | | | | |
| | | Period Ended | | | Period Ended | |
| | | June 30, | | | December 31, | |
| | | | 2022 | | | | 2021(a) | |
| Net asset value, beginning of year | | | $ | 9.59 | | | | $ | 10.00 | |
| Income (loss) from investment operations: | | | | | | | | | | |
| Net investment income (loss) | | | | 0.25 | | | | | 0.27 | |
| Net realized and unrealized gain (loss) on investments | | | | (2.21 | ) | | | | (0.40 | ) |
| Total from investment operations | | | | (1.96 | ) | | | | (0.13 | ) |
| Less distributions from: | | | | | | | | | | |
| Net investment income | | | | 0.25 | | | | | 0.28 | |
| Net realized gain | | | | — | | | | �� | — | |
| Total distributions | | | | 0.25 | | | | | 0.28 | |
| Net asset value, end of year | | | $ | 7.38 | | | | $ | 9.59 | |
| Total return (%)* | | | | (20.65 | ) | | | | (1.39 | ) |
| Ratios to average daily net assets (%)**: | | | | | | | | | | |
| Expenses, before waivers and reimbursements | | | | 1.16 | | | | | 1.24 | |
| Expenses, net of waivers and reimbursements | | | | 0.70 | | | | | 0.70 | |
| Net investment income (loss), before waivers and reimbursements | | | | 5.43 | | | | | 4.02 | |
| Net investment income (loss), net of waivers and reimbursements | | | | 5.89 | | | | | 4.56 | |
| Class I net assets at the end of the year (in thousands) | | | $ | 883 | | | | $ | 1,484 | |
| Portfolio turnover rate (%)* | | | | 70 | | | | | 72 | |
| | | | | | | | | | | |
| | | Class R6 | |
| | | (unaudited) | | | | | |
| | | Period Ended | | | Period Ended | |
| | | June 30, | | | December 31, | |
| | | | 2022 | | | | 2021(a) | |
| Net asset value, beginning of year | | | $ | 9.59 | | | | $ | 10.00 | |
| Income (loss) from investment operations: | | | | | | | | | | |
| Net investment income (loss) | | | | 0.25 | | | | | 0.28 | |
| Net realized and unrealized gain (loss) on investments | | | | (2.21 | ) | | | | (0.41 | ) |
| Total from investment operations | | | | (1.96 | ) | | | | (0.13 | ) |
| Less distributions from: | | | | | | | | | | |
| Net investment income | | | | 0.26 | | | | | 0.28 | |
| Net realized gain | | | | — | | | | | — | |
| Total distributions | | | | 0.26 | | | | | 0.28 | |
| Net asset value, end of year | | | $ | 7.37 | | | | $ | 9.59 | |
| Total return (%)* | | | | (20.62 | ) | | | | (1.32 | ) |
| Ratios to average daily net assets (%)**: | | | | | | | | | | |
| Expenses, before waivers and reimbursements | | | | 1.09 | | | | | 1.17 | |
| Expenses, net of waivers and reimbursements | | | | 0.65 | | | | | 0.65 | |
| Net investment income (loss), before waivers and reimbursements | | | | 5.52 | | | | | 4.10 | |
| Net investment income (loss), net of waivers and reimbursements | | | | 5.96 | | | | | 4.62 | |
| Class R6 net assets at the end of the year (in thousands) | | | $ | 42,965 | | | | $ | 50,010 | |
| Portfolio turnover rate (%)* | | | | 70 | | | | | 72 | |
| (a) | For the period from May 25, 2021 (Commencement of Operations) to December 31, 2021. |
| * | Rates are not annualized for periods less than a year. |
| ** | Rates are annualized for periods less than a year. |
Note: Net investment income (loss) per share is based on the average shares outstanding during the year.
Performance cited represents past performance. Past performance does not guarantee future results and current performance may be lower or higher than the data quoted. Results shown are annual returns, which assume reinvestment of dividends and capital gains. Investment returns and principal will fluctuate and you may have a gain or loss when you sell shares. For the most current month-end performance information, please call 1-800-742-7272 or visit our Web site at www.williamblairfunds.com.
| 158 | Semiannual Report | June 30, 2022 |
Financial Highlights — For a share outstanding throughout each period
Macro Allocation Fund (In Liquidation)
| | Class N | |
| | (unaudited)
Period Ended
June 30, | | | Years Ended December 31, | |
| | | 2022 | | | 2021 | | | 2020 | | | 2019 | | | 2018 | | | 2017 | |
| Net asset value, beginning of year | | $ | 10.82 | | | $ | 10.93 | | | $ | 11.44 | | | $ | 11.41 | | | $ | 11.84 | | | $ | 11.34 | |
| Income (loss) from investment operations: | | | | | | | | | | | | | | | | | | | | | | | | |
| Net investment income (loss) | | | (0.04 | ) | | | 0.07 | | | | 0.04 | | | | 0.08 | | | | 0.08 | | | | 0.06 | |
| Net realized and unrealized gain (loss) on investments | | | (0.09 | ) | | | 0.06 | | | | (0.44 | ) | | | 0.37 | | | | (0.24 | ) | | | 0.51 | |
| Total from investment operations | | | (0.13 | ) | | | 0.13 | | | | (0.40 | ) | | | 0.45 | | | | (0.16 | ) | | | 0.57 | |
| Less distributions from: | | | | | | | | | | | | | | | | | | | | | | | | |
| Net investment income | | | — | | | | 0.24 | | | | 0.11 | | | | 0.42 | | | | 0.27 | | | | 0.07 | |
| Net realized gain | | | — | | | | — | | | | — | | | | — | | | | — | | | | — | |
| Total distributions | | | — | | | | 0.24 | | | | 0.11 | | | | 0.42 | | | | 0.27 | | | | 0.07 | |
| Net asset value, end of year | | $ | 10.69 | | | $ | 10.82 | | | $ | 10.93 | | | $ | 11.44 | | | $ | 11.41 | | | $ | 11.84 | |
| Total return (%)* | | | (1.11 | ) | | | 1.15 | | | | (3.49 | ) | | | 3.97 | | | | (1.30 | ) | | | 5.06 | |
| Ratios to average daily net assets (%)**: | | | | | | | | | | | | | | | | | | | | | | | | |
| Expenses, before waivers and reimbursements | | | 1.60 | | | | 1.39 | | | | 1.36 | | | | 1.22 | | | | 1.30 | | | | 1.52 | |
| Expenses, net of waivers and reimbursements | | | 1.27 | | | | 1.28 | | | | 1.26 | | | | 1.22 | | | | 1.30 | | | | 1.37 | |
| Expenses, (excluding div/int expense), net of waivers and reimbursements | | | 1.25 | | | | 1.25 | | | | 1.25 | | | | 1.21 | | | | 1.28 | | | | 1.31 | |
| Net investment income (loss), before waivers and reimbursements | | | (1.10 | ) | | | 0.54 | | | | 0.26 | | | | 0.70 | | | | 0.66 | | | | 0.35 | |
| Net investment income (loss), net of waivers and reimbursements | | | (0.77 | ) | | | 0.65 | | | | 0.36 | | | | 0.70 | | | | 0.66 | | | | 0.50 | |
| Class N net assets at the end of the year (in thousands) | | $ | 3,826 | | | $ | 6,673 | | | $ | 7,674 | | | $ | 13,717 | | | $ | 43,463 | | | $ | 41,483 | |
| Portfolio turnover rate (%)* | | | 8 | | | | 70 | | | | 29 | | | | 31 | | | | 36 | | | | 43 | |
| | | |
| | Class I | |
| | (unaudited)
Period Ended
June 30, | | | Years Ended December 31, | |
| | | 2022 | | | 2021 | | | 2020 | | | 2019 | | | 2018 | | | 2017 | |
| Net asset value, beginning of year | | $ | 10.74 | | | $ | 10.85 | | | $ | 11.35 | | | $ | 11.38 | | | $ | 11.88 | | | $ | 11.38 | |
| Income (loss) from investment operations: | | | | | | | | | | | | | | | | | | | | | | | | |
| Net investment income (loss) | | | (0.02 | ) | | | 0.08 | | | | 0.06 | | | | 0.13 | | | | 0.11 | | | | 0.11 | |
| Net realized and unrealized gain (loss) on investments | | | (0.10 | ) | | | 0.08 | | | | (0.42 | ) | | | 0.34 | | | | (0.24 | ) | | | 0.51 | |
| Total from investment operations | | | (0.12 | ) | | | 0.16 | | | | (0.36 | ) | | | 0.47 | | | | (0.13 | ) | | | 0.62 | |
| Less distributions from: | | | | | | | | | | | | | | | | | | | | | | | | |
| Net investment income | | | — | | | | 0.27 | | | | 0.14 | | | | 0.50 | | | | 0.37 | | | | 0.12 | |
| Net realized gain | | | — | | | | — | | | | — | | | | — | | | | — | | | | — | |
| Total distributions | | | — | | | | 0.27 | | | | 0.14 | | | | 0.50 | | | | 0.37 | | | | 0.12 | |
| Net asset value, end of year | | $ | 10.62 | | | $ | 10.74 | | | $ | 10.85 | | | $ | 11.35 | | | $ | 11.38 | | | $ | 11.88 | |
| Total return (%)* | | | (1.03 | ) | | | 1.41 | | | | (3.15 | ) | | | 4.14 | | | | (1.08 | ) | | | 5.50 | |
| Ratios to average daily net assets (%)**: | | | | | | | | | | | | | | | | | | | | | | | | |
| Expenses, before waivers and reimbursements | | | 1.23 | | | | 1.12 | | | | 1.04 | | | | 0.97 | | | | 0.99 | | | | 1.17 | |
| Expenses, net of waivers and reimbursements | | | 1.02 | | | | 1.03 | | | | 1.01 | | | | 0.97 | | | | 0.99 | | | | 1.02 | |
| Expenses, (excluding div/int expense), net of waivers and reimbursements | | | 1.00 | | | | 1.00 | | | | 1.00 | | | | 0.96 | | | | 0.97 | | | | 0.96 | |
| Net investment income (loss), before waivers and reimbursements | | | (0.60 | ) | | | 0.66 | | | | 0.56 | | | | 1.09 | | | | 0.95 | | | | 0.75 | |
| Net investment income (loss), net of waivers and reimbursements | | | (0.39 | ) | | | 0.75 | | | | 0.59 | | | | 1.09 | | | | 0.95 | | | | 0.90 | |
| Class I net assets at the end of the year (in thousands) | | $ | 18,647 | | | $ | 67,139 | | | $ | 171,153 | | | $ | 358,935 | | | $ | 486,543 | | | $ | 780,075 | |
| Portfolio turnover rate (%)* | | | 8 | | | | 70 | | | | 29 | | | | 31 | | | | 36 | | | | 43 | |
| * | Rates are not annualized for periods less than a year. |
| ** | Rates are annualized for periods less than a year. |
Note: Net investment income (loss) per share is based on the average shares outstanding during the year.
Performance cited represents past performance. Past performance does not guarantee future results and current performance may be lower or higher than the data quoted. Results shown are annual returns, which assume reinvestment of dividends and capital gains. Investment returns and principal will fluctuate and you may have a gain or loss when you sell shares. For the most current month-end performance information, please call 1-800-742-7272 or visit our Web site at www.williamblairfunds.com.
| June 30, 2022 | William Blair Funds | 159 |
Financial Highlights — For a share outstanding throughout each period
Macro Allocation Fund (In Liquidation)
| | Class R6 | |
| | (unaudited)
Period Ended
June 30, | | | Years Ended December 31, | |
| | | 2022 | | | 2021 | | | 2020 | | | 2019 | | | 2018 | | | 2017 | |
| Net asset value, beginning of year | | $ | 10.74 | | | $ | 10.85 | | | $ | 11.36 | | | $ | 11.38 | | | $ | 11.89 | | | $ | 11.40 | |
| Income (loss) from investment operations: | | | | | | | | | | | | | | | | | | | | | | | | |
| Net investment income (loss) | | | (0.00 | )^ | | | 0.10 | | | | 0.08 | | | | 0.14 | | | | 0.13 | | | | 0.12 | |
| Net realized and unrealized gain (loss) on investments | | | (0.12 | ) | | | 0.07 | | | | (0.44 | ) | | | 0.34 | | | | (0.24 | ) | | | 0.51 | |
| Total from investment operations | | | (0.12 | ) | | | 0.17 | | | | (0.36 | ) | | | 0.48 | | | | (0.11 | ) | | | 0.63 | |
| Less distributions from: | | | | | | | | | | | | | | | | | | | | | | | | |
| Net investment income | | | — | | | | 0.28 | | | | 0.15 | | | | 0.50 | | | | 0.40 | | | | 0.14 | |
| Net realized gain | | | — | | | | — | | | | — | | | | — | | | | — | | | | — | |
| Total distributions | | | — | | | | 0.28 | | | | 0.15 | | | | 0.50 | | | | 0.40 | | | | 0.14 | |
| Net asset value, end of year | | $ | 10.62 | | | $ | 10.74 | | | $ | 10.85 | | | $ | 11.36 | | | $ | 11.38 | | | $ | 11.89 | |
| Total return (%)* | | | (1.03 | ) | | | 1.48 | | | | (3.13 | ) | | | 4.29 | | | | (0.94 | ) | | | 5.51 | |
| Ratios to average daily net assets (%)**: | | | | | | | | | | | | | | | | | | | | | | | | |
| Expenses, before waivers and reimbursements | | | 1.06 | | | | 1.01 | | | | 0.93 | | | | 0.89 | | | | 0.91 | | | | 0.92 | |
| Expenses, net of waivers and reimbursements | | | 0.97 | | | | 0.98 | | | | 0.93 | | | | 0.89 | | | | 0.91 | | | | 0.92 | |
| Expenses, (excluding div/int expense), net of waivers and reimbursements | | | 0.95 | | | | 0.95 | | | | 0.92 | | | | 0.88 | | | | 0.89 | | | | 0.86 | |
| Net investment income (loss), before waivers and reimbursements | | | (0.17 | ) | | | 0.91 | | | | 0.70 | | | | 1.23 | | | | 1.10 | | | | 1.04 | |
| Net investment income (loss), net of waivers and reimbursements | | | (0.08 | ) | | | 0.94 | | | | 0.70 | | | | 1.23 | | | | 1.10 | | | | 1.04 | |
| Class R6 net assets at the end of the year (in thousands) | | $ | 128 | | | $ | 114,984 | | | $ | 174,888 | | | $ | 378,148 | | | $ | 391,812 | | | $ | 487,082 | |
| Portfolio turnover rate (%)* | | | 8 | | | | 70 | | | | 29 | | | | 31 | | | | 36 | | | | 43 | |
| * | Rates are not annualized for periods less than a year. |
| ** | Rates are annualized for periods less than a year. |
| ^ | Amount is less than $0.005 per share. |
Note: Net investment income (loss) per share is based on the average shares outstanding during the year.
Performance cited represents past performance. Past performance does not guarantee future results and current performance may be lower or higher than the data quoted. Results shown are annual returns, which assume reinvestment of dividends and capital gains. Investment returns and principal will fluctuate and you may have a gain or loss when you sell shares. For the most current month-end performance information, please call 1-800-742-7272 or visit our Web site at www.williamblairfunds.com.
| 160 | Semiannual Report | June 30, 2022 |
RENEWAL OF THE MANAGEMENT AGREEMENT
On April 27, 2022, the Board of Trustees (the “Board”) of the William Blair Funds (the “Trust”), including the Trustees who are not “interested persons” of the Trust as defined by the Investment Company Act of 1940, as amended (the “Independent Trustees”), approved the renewal for an additional one-year term of the Trust’s Management Agreement with William Blair Investment Management, LLC (the “Adviser”) on behalf of each of the William Blair Funds (each, a “Fund” and collectively, the “Funds”) (with the exception of the China Growth Fund, for which the Management Agreement was approved for an initial two-year term by the Board on April 28, 2021, and the Mid Cap Value Fund and the Emerging Markets ex China Growth Fund, for which the Management Agreement was approved for an initial two-year term by the Board on November 30, 2021). In deciding to approve the renewal of the Management Agreement, the Board did not identify any single factor or group of factors as all important or controlling and considered all factors together. The Board did not allot a particular weight to any one factor or group of factors.
The information in this summary outlines the Board’s considerations associated with its renewal of the Management Agreement. In connection with its deliberations regarding the continuation of the Management Agreement, the Board considered such information and factors as it believed to be necessary to evaluate the terms of the Management Agreement. As described below, the Board considered the nature, quality and extent of the services performed by the Adviser under the Management Agreement; the investment performance of each Fund and the Adviser; comparative management fees and expense ratios as prepared by an independent provider (Broadridge); the estimated profitability realized by the Adviser; the extent to which the Adviser realizes economies of scale as a Fund grows; and whether fall-out benefits are being realized by the Adviser. In addition, the Independent Trustees discussed the renewal of the Management Agreement with Trust management and in private sessions with independent legal counsel at which no representatives of the Adviser were present.
The Board, including the Independent Trustees, considered the renewal of the Management Agreement pursuant to a process that concluded at the Board’s April 27, 2022 meeting. In preparation for the review process, the Independent Trustees considered the type and nature of information to be requested, and independent legal counsel sent a formal request for information to the Adviser. The Adviser provided extensive information in response to the request. After reviewing the information received, the Independent Trustees requested supplemental information, which the Adviser provided. The Independent Trustees also received a memorandum from legal counsel advising them of their duties and responsibilities in connection with the consideration of the Management Agreement. The Independent Trustees reviewed comparative performance for a performance peer universe and peer group of funds and comparative management fees and expense ratios for an expense peer group and an expense peer universe of funds provided by Broadridge for each Fund. In addition, the Independent Trustees considered: (1) the nature, quality and extent of the services provided by the Adviser; (2) information comparing the performance of each Fund to one or more relevant securities indexes; (3) information comparing management fees of each Fund to fees charged by the Adviser to other funds and client accounts with similar investment strategies; (4) the estimated allocated direct or indirect costs of services provided and estimated profits realized by the Adviser for both the Trust as a whole and each Fund individually; and (5) information describing other benefits to the Adviser and its affiliate, William Blair & Company, L.L.C. (the “Distributor,” and collectively with the Adviser, “William Blair”), resulting from their relationship with the Funds. The Independent Trustees also noted that they receive information from the Adviser regarding the Funds throughout the year in connection with regular Board meetings, including presentations from portfolio managers. In addition, the Adviser made a presentation to the Board regarding the contract review information, including addressing the supplemental information requests, and answered questions from the Independent Trustees. The Board, including the Independent Trustees, determined that, given the totality of the information provided with respect to the Management Agreement, the Board had received sufficient information to renew the Management Agreement. The Independent Trustees noted that in evaluating the Management Agreement, they were taking into account their accumulated experience as Board members in working with the Adviser on matters relating to the Funds. Based on their review, the Independent Trustees concluded that it was in the best interest of each Fund to renew the Management Agreement and, accordingly, recommended to the Board of the Trust the renewal of the Management Agreement for each Fund. The Board considered the recommendation of the Independent Trustees along with other factors that the Board deemed relevant.
Nature, Quality and Extent of Services. In evaluating the nature, quality and extent of the services provided by the Adviser to the Funds, the Board noted that the Adviser is a quality firm with a reputation for integrity and honesty that employs high-quality people and has a long association with the Funds. The Board believes that a long-term relationship with a capable, conscientious adviser is in the best interests of shareholders and that shareholders have invested in the Funds knowing that the Adviser manages the Funds and knowing the management fees. The Board considered the Adviser’s fundamental research approach in actively managed, process oriented investing. The Board considered biographical information about the Trust’s officers, other Adviser personnel and the Funds’ portfolio managers, including information on the portfolio managers’ personal investments in the Fund(s) they manage. The Board also considered the administrative services performed by the Adviser, financial information regarding the Adviser, the Adviser’s execution quality and use of soft dollars, risk management oversight, compliance program and the expense limitations proposed for each of the Funds’ share classes. The Board also considered the nature, quality and extent of
| June 30, 2022 | William Blair Funds | 161 |
services that the Adviser provides to the Funds compared to the services that the Adviser provides to other clients. The Board noted that the Adviser pays the compensation of all of the officers of the Trust. Based upon all relevant factors, the Board concluded that the nature, quality and extent of the services provided by the Adviser to each Fund were appropriate.
Performance. The Board reviewed information on the annualized net total returns of Class I shares of the Funds (except for the Institutional International Growth Fund, which does not have share classes) for the one-, three-, five- and ten-year periods ended December 31, 2021, as applicable, along with annualized total return information for a Morningstar performance peer universe of funds and one or more benchmark securities indexes. The Morningstar performance peer universe for each Fund included all funds in the same Morningstar category as the Fund. For purposes of this report, Class I shares were used for comparison purposes for all Funds (except for the Institutional International Growth Fund, which does not have share classes) as the Board noted that Class I shares represent the largest percentage of assets in the Trust. In evaluating performance, the Board recognized that the performance data reflects a snapshot of a period as of a particular date and that selecting a different performance period could produce different results.
The Board considered that the Adviser seeks to provide superior performance over the long term and was committed to managing each Fund consistently with the Fund’s stated investment strategies and that at times relative performance will be affected by whether the market environment favors or disfavors particular investments, styles and/or market capitalizations. The Board considered that the Adviser had managed the Funds consistent with their respective investment strategies. Based on the information provided, the Board considered the following with respect to the total returns of each Fund.
Growth Fund. The Board considered that the Fund’s total return was above the average of its Morningstar performance peer universe for the one-, three- and five-year periods ended December 31, 2021. The Board also considered that the Fund underperformed the benchmark (Russell 3000® Growth Index) for the one-, three- and five-year periods ended December 31, 2021.
Large Cap Growth Fund. The Board considered that the Fund’s total return was above the average of its Morningstar performance peer universe for the one-, three- and five-year periods ended December 31, 2021. The Board also considered that the Fund outperformed the benchmark (Russell 1000® Growth Index) for the one- and five-year periods and underperformed the benchmark for the three-year period ended December 31, 2021.
Mid Cap Growth Fund. The Board considered that the Fund’s total return was below the average of its Morningstar performance peer universe and the benchmark (Russell Midcap® Growth Index) for the one-, three- and five-year periods ended December 31, 2021. The Board considered the Adviser’s view that the Fund’s relative underperformance for the three- and five-year periods was the result of stock specific issues and style headwinds.
Small-Mid Cap Core Fund. The Board considered that the Fund’s total return was above the average of its Morningstar performance peer universe and the benchmark (Russell 2500™ Index) for the one-year period ended December 31, 2021.
Small-Mid Cap Growth Fund. The Board considered that the Fund’s total return was below the average of its Morningstar performance peer universe for the one-, three- and five-year periods ended December 31, 2021. The Board also considered that the Fund outperformed the benchmark (Russell 2500™ Growth Index) for the one- and five-year periods and underperformed the benchmark for the three-year period ended December 31, 2021. The Board also considered that the Fund’s underperformance was largely attributable to calendar year 2020, when the Fund lagged the return of the benchmark.
Small Cap Growth Fund. The Board considered that the Fund’s total return was above the average of its Morningstar performance peer universe for the one- and five-year periods and below the average of its Morningstar performance peer universe for the three-year period ended December 31, 2021. The Board also considered that the Fund outperformed the benchmark (Russell 2000® Growth Index) for the one-, three- and five-year periods ended December 31, 2021.
Small Cap Value Fund. The Board considered that the Fund’s total return was below the average of its Morningstar performance peer universe for the one-year period and above the average of its Morningstar performance peer universe for the three- and five-year periods ended December 31, 2021. The Board also considered that the Fund outperformed the benchmark (Russell 2000® Value Index) for the one-, three- and five-year periods ended December 31, 2021. The Board also considered that the Fund is the performance and accounting survivor of the reorganization of the ICM Small Company Portfolio with the Fund, which was completed on July 16, 2021.
Global Leaders Fund. The Board considered that the Fund’s total return was above the average of its Morningstar performance peer universe for the one-, three- and five-year periods ended December 31, 2021. The Board also considered that the Fund underperformed the benchmark (MSCI All Country World IMI (net) Index) for the one-year period and outperformed the benchmark for the three- and five-year periods ended December 31, 2021.
| 162 | Semiannual Report | June 30, 2022 |
International Leaders Fund. The Board considered that the Fund’s total return was above the average of its Morningstar performance peer universe and the benchmark (MSCI All Country World Ex-U.S. IMI (net) Index) for the one-, three- and five-year periods ended December 31, 2021.
International Growth Fund. The Board considered that the Fund’s total return was above the average of its Morningstar performance peer universe and the benchmark (MSCI All Country World Ex-U.S. IMI (net) Index) for the one-, three- and five-year periods ended December 31, 2021.
Institutional International Growth Fund. The Board considered that the Fund’s total return was above the average of its Morningstar performance peer universe and the benchmark (MSCI All Country World Ex-U.S. IMI (net) Index) for the one-, three- and five-year periods ended December 31, 2021.
International Small Cap Growth Fund. The Board considered that the Fund’s total return was above the average of its Morningstar performance peer universe for the one- and three-year periods and below the average of its Morningstar performance peer universe for the five-year period ended December 31, 2021. The Board also considered that the Fund underperformed the benchmark (MSCI All Country World Ex-U.S. Small Cap (net) Index) for the one-year period and outperformed the benchmark for the three- and five-year periods ended December 31, 2021.
Emerging Markets Leaders Fund. The Board considered that the Fund’s total return was below the average of its Morningstar performance peer universe and the benchmark (MSCI Emerging Markets (net) Index) for the one-year period and above the average of its Morningstar performance peer universe and the benchmark for the three- and five-year periods ended December 31, 2021.
Emerging Markets Growth Fund. The Board considered that the Fund’s total return was above the average of its Morningstar performance peer universe and the benchmark (MSCI Emerging Markets IMI (net) Index) for the one-, three- and five-year periods ended December 31, 2021.
Emerging Markets Small Cap Growth Fund. The Board considered that the Fund’s total return was above the average of its Morningstar performance peer universe for the one-, three- and five-year periods ended December 31, 2021. The Board also considered that the Fund underperformed the benchmark (MSCI Emerging Markets Small Cap (net) Index) for the one-year period and outperformed the benchmark for the three- and five-year periods ended December 31, 2021.
Emerging Markets Debt Fund. The Board considered that the Fund commenced operations on May 25, 2021, which provided a limited period of time to evaluate investment performance.
Macro Allocation Fund. The Board considered that the Fund’s total return was below the average of its Morningstar performance peer universe for the one-, three- and five-year periods ended December 31, 2021. The Board also considered that the Fund outperformed the benchmark (ICE BofAML 3-Month US Treasury Bill Index) for the one- and five-year periods and underperformed the benchmark for the three-year period ended December 31, 2021. The Board considered that it had approved the liquidation and termination of the Fund and that the renewal of the Management Agreement with respect to the Fund would allow the Fund to operate until completion of the liquidation and termination.
Management Fees. The Board reviewed each Fund’s management fee and reviewed information comparing the management fee to those of an expense peer group and an expense peer universe of funds provided by Broadridge for Class I shares of the Funds (except for the Institutional International Growth Fund, which does not have share classes). The Broadridge expense peer group for Class I (the “Broadridge Expense Group”) of each Fund other than the Institutional International Growth Fund, and the expense peer group for the Institutional International Growth Fund, consisted of a group of institutional funds with a similar investment strategy and asset size, as classified by Broadridge. The Broadridge expense peer universe for each Fund consisted of the Fund’s Broadridge expense peer group and all other no-load funds with an investment strategy as classified by Broadridge similar to the Fund’s. In considering the Broadridge information and giving effect to the contractual management fee reductions proposed by the Adviser for the International Growth Fund, the Emerging Markets Leaders Fund and the Emerging Markets Growth Fund, the Board noted that the contractual management fees for the Growth Fund, the Large Cap Growth Fund, the Small Cap Value Fund, the Emerging Markets Leaders Fund, the Emerging Markets Growth Fund, the Emerging Markets Small Cap Growth Fund, the Emerging Markets Debt Fund and the Macro Allocation Fund were below the average contractual management fees of their respective Broadridge Expense Groups. The Board also noted that the contractual management fees for the Mid Cap Growth Fund, the Small-Mid Cap Core Fund, the Small-Mid Cap Growth Fund, the Small Cap Growth Fund, the Global Leaders Fund, the International Leaders Fund, the International Growth Fund, the Institutional International Growth Fund and the International Small Cap Growth Fund were above the average contractual management fees of their respective Broadridge Expense Groups.
| June 30, 2022 | William Blair Funds | 163 |
In considering the management fee for the Institutional International Growth Fund, which does not have share classes, the Board noted that the contractual management fee for the Fund giving effect to the proposed contractual management fee reduction proposed by the Adviser was above the average contractual management fee of its Broadridge expense peer group.
The Board noted the current and proposed contractual expense limitations for the share classes of the Funds. The Board considered that the Adviser proposed to contractually limit operating expenses until April 30, 2023 for each share class of the Funds. The Board considered the amount of management fees waived and other expenses reimbursed by the Adviser on behalf of the Funds in 2021.
For each Fund, the Board also reviewed amounts charged by the Adviser to other pooled investment vehicles, including other registered funds for which the Adviser acts as a sub-adviser, and the Adviser’s fee schedule for institutional accounts. With respect to other pooled investment vehicles and institutional accounts, the Board considered the Adviser’s statements to the effect that the level of services provided to the Funds and the regulatory responsibilities associated with sponsoring registered investment companies were greater as compared to the work involved for other pooled investment vehicles, including other registered funds for which the Adviser acts as a sub-adviser, and institutional accounts. In addition, the Board considered the Adviser’s statements to the effect that institutional accounts are distributed differently, operate under different investment and regulatory structures and have different business risks as compared to the Funds and that there are responsibilities and duties involved in sponsoring a registered fund that are not present in sub-advising a registered fund.
On the basis of all the information provided, the Board concluded that each Fund’s management fee, coupled with the applicable expense limitations, was reasonable.
Profitability. With respect to the profitability of the Management Agreement to the Adviser, the Board considered the overall fees paid under the Management Agreement, including the estimated allocated costs of the services provided, management fees waived and other expenses reimbursed, if any, and profits realized by the Adviser from its relationship with the Trust as a whole and each Fund individually. The Board concluded that the estimated profits realized by the Adviser were not unreasonable.
Economies of Scale. The Board considered the extent to which economies of scale would be realized as the Funds grow and whether fee levels reflect these economies of scale for the benefit of investors. The Board noted the Adviser’s statements to the effect that the resources required for the Adviser’s fundamental investment process typically increase as a Fund increases in size. The Board also considered that certain of the Funds were part of investment strategies that were capacity constrained by the Adviser so that opportunities for economies of scale were limited. The Board further considered that of the Funds that are subject to capacity constraints, the International Growth Fund, Institutional International Growth Fund, International Small Cap Growth Fund and Emerging Markets Small Cap Growth Fund are closed to investors, except as noted in each Fund’s prospectus.
In considering whether fee levels reflect economies of scale for the benefit of Fund investors, the Board considered each Fund’s asset size, management fee breakpoints for applicable Funds, the expense limitations in place for each Fund and the proposed reduction in management fees and/or expense limits for certain Funds and each Fund’s expense ratios. The Board concluded that in the aggregate the Funds’ fee levels reasonably reflect appropriate recognition of economies of scale.
Other Benefits. The Board considered benefits derived by the Adviser and its affiliates from their relationship with the Funds, including (1) receipt of research from brokerage firms; (2) soft dollars, which pertain primarily to the Funds investing in equity securities; (3) reimbursement of some intermediary fees in the nature of sub-transfer agency fees; (4) fees from Class N shares of the Funds to the Distributor pursuant to the Rule 12b-1 Plan, nearly all of which are paid to third parties; and (5) favorable media coverage. The Board determined that management fees were reasonable in light of these benefits.
Conclusion. Based upon all of the information considered and the conclusions reached, the Board determined that the terms of the Management Agreement continue to be fair and reasonable and that the continuation of the Management Agreement is in the best interests of each Fund.
| 164 | Semiannual Report | June 30, 2022 |
APPROVAL OF THE MANAGEMENT AGREEMENT FOR THE WILLIAM BLAIR MID CAP VALUE FUND
On November 30, 2021, the Board of Trustees (the “Board”) of William Blair Funds (the “Trust”), including the Trustees who are not interested persons of the Trust as defined by the Investment Company Act of 1940, as amended (the “Independent Trustees”), approved the management agreement between the Trust, on behalf of the William Blair Mid Cap Value Fund (the “Fund”), and William Blair Investment Management, LLC (the “Adviser”). The Independent Trustees reviewed materials provided by the Adviser and Broadridge for the approval of the management agreement and were assisted by independent legal counsel in making their determination. The Board determined that, given the totality of the information provided with respect to the management agreement, the Board had received sufficient information to consider the approval of the management agreement. The Board considered the following factors in making its determination, but did not identify any single factor or group of factors as all important or controlling and considered all factors together.
Nature, Quality and Extent of Services. In evaluating the nature, quality and extent of the services expected to be provided by the Adviser to the Fund, the Board noted that the Adviser is a quality firm with a reputation for integrity and honesty that employs high quality people. The Board considered that the Adviser also manages other series of the Trust and that the Board is familiar with the background and experience of the Fund’s portfolio managers. The Board considered the extensive information it receives from the Adviser in connection with the annual contract renewal process including financial information regarding the Adviser. The Board considered the previous experience of the Fund’s portfolio management team members with value-style investments in mid-cap companies. The Board also considered the Adviser’s experience in managing new funds and investing in the proposed Fund’s asset class and that the Adviser serves as investment adviser to the other series of the Trust. Based upon all relevant factors, the Board concluded that the nature, quality and extent of the services to be provided by the Adviser to the Fund were expected to be satisfactory.
Fees and Expenses. The Board reviewed the proposed advisory fee for the Fund and reviewed information comparing the Fund’s advisory fee to a peer group and a peer universe of institutional funds provided by Broadridge. The Broadridge peer group for the Fund consisted of the Fund and 11 other (no-load) institutional multi-cap value funds with no Rule 12b-1 fees, as classified by Broadridge. The Broadridge peer universe for the Fund consisted of the Fund, the Fund’s Broadridge peer group and all other institutional multi-cap value funds, excluding outliers.
In considering the information, the Board noted that the proposed advisory fee for the Fund was equal to the median and above the average contractual management fee of the peer group. The Board also considered that the Adviser had proposed to limit total operating expenses, including waiving advisory fees for each share class of the Fund, until April 30, 2024. On the basis of the information provided, the Board concluded that the proposed advisory fee for the Fund was reasonable in light of the nature, quality and extent of services expected to be provided by the Adviser.
Profitability. With respect to the estimated profitability of the Management Agreement to the Adviser with respect to the Fund, the Board considered the Fund’s proposed advisory fee, that the Fund was newly organized, the Adviser’s agreement to limit total expenses until April 30, 2024 for Class I and Class R6 shares. The Board also considered that the Adviser will be incurring all expenses related to the organization of the Fund.
Economies of Scale. The Board considered the extent to which economies of scale would be realized as the Fund grows and whether fee levels reflect these economies of scale for the benefit of investors. In considering whether fee levels reflect economies of scale for the benefit of Fund investors, the Board reviewed the Fund’s advisory fee compared to peer funds and the Fund’s estimated expense ratios giving effect to the Adviser’s agreement to limit total expenses until April 30, 2024, and concluded that the advisory fee for the Fund was reasonable.
Other Benefits to the Adviser. The Board considered benefits to be derived by the Adviser from its relationship with the Trust based on information provided during the annual contract renewal process, including receipt of research from brokerage firms, for Class I shares, reimbursement of some intermediary fees in the nature of sub-transfer agency fees and favorable media coverage. The Board concluded that, after taking into account these benefits, the proposed advisory fee for the Fund was reasonable.
Conclusion. Based upon the information considered and the conclusions reached, the Board determined that the terms of the Management Agreement are fair and reasonable and that the approval of the Management Agreement is in the best interests of the Fund.
| June 30, 2022 | William Blair Funds | 165 |
REVIEW OF LIQUIDITY RISK MANAGEMENT PROGRAM
The Board of Trustees (the “Board”) of William Blair Funds previously approved the William Blair Funds Liquidity Risk Management Program Policy (the “Policy”) under Rule 22e-4 under the 1940 Act (the “Liquidity Rule”), which sets forth the terms of the William Blair Liquidity Risk Management Program (the “Program”). The Program (through the Policy) seeks to assess, manage and review each Fund’s liquidity risk. For purposes of the Program, the Policy and the Liquidity Rule, “liquidity risk” is defined as the risk that a Fund could not meet requests to redeem shares issued by a Fund without significant dilution of remaining investors’ interest in the Funds. Among other things, the Liquidity Rule requires that a written report be provided to the Board on an annual basis that addresses the operation of the Program and assesses the adequacy and effectiveness of its implementation, including, if applicable, the operation of any highly liquid investment minimum (“HLIM”) established for a Fund and any material changes to the Program.
The Board designated the Liquidity Risk Management Committee of William Blair Investment Management, LLC, the Funds’ investment adviser, to be the administrator for the Program (the “Program Administrator”). On February 23, 2022, the Board of Trustees reviewed the Program Administrator’s written report (the “Report”) concerning the operation of the Program and the Policy as well as the adequacy and effectiveness of the Program’s and Policy’s implementation for the period from January 1, 2021 through December 31, 2021 (the “Program Reporting Period”). There were no material changes to the Program or to the Policy during the Program Reporting Period.
The Report summarized the operation of the Program and the Policy and the information and factors considered by the Program Administrator in assessing whether the Program and the Policy have been adequately and effectively implemented with respect to each Fund. Such information and factors included, among other things: (1) the liquidity risk framework used to assess, manage, and periodically review each Fund’s liquidity risk and the results of this assessment; (2) the classification of each of the Funds’ respective investments into one of four liquidity categories that reflect an estimate of their liquidity under normal and reasonably foreseeable stressed conditions; (3) whether a Fund invested primarily in “Highly Liquid Investments” (as defined under the Liquidity Rule) and whether an HLIM should be established for any Fund; (4) whether a Fund invested more than 15% of its assets in “Illiquid Investments” (as defined under the Liquidity Rule); (5) specific liquidity events arising during the Program Reporting Period, including the impact on Fund liquidity caused by extended non-U.S. market closures; and (6) the nature and quality of the services provided by the service provider engaged to assist with determining liquidity classifications for the Funds. Based on this review, the Report concluded that the Program and the Policy meet the requirements of the Liquidity Rule and are operating effectively.
| 166 | Semiannual Report | June 30, 2022 |
Trustees and Officers (Unaudited).† The trustees and officers of the William Blair Funds, their year of birth, their principal occupations during the last five years, their affiliations, if any, with William Blair, and other significant affiliations are set forth below. The address of each officer and trustee is 150 North Riverside Plaza, Chicago, Illinois 60606.
| Name and Year of Birth | | Position(s)
Held with
Trust | | Term of
Office(1) and
Length of
Time
Served | | Principal
Occupation(s)
During Past 5 Years | | Number of
Portfolios
in Trust
Complex
Overseen
by Trustee* | | Other Directorships
Held by Trustee
During Past 5 Years** |
| | | | | | | | | | | |
| Interested Trustees | | | | | | |
Stephanie G. Braming, CFA,
1970(2) | | Chairman of the Board and President, previously Senior Vice President | | Chairman of the Board and President since 2018, and Senior Vice President 2014 to 2018 | | Global Head of Investment Management since 2017, portfolio manager (2014 to 2017) and Partner, William Blair | | 19 | | Chairman, William Blair SICAV |
| | | | | | | | | | | |
Cissie Citardi,
1975(2) | | Trustee | | Since 2021 | | General Counsel (since 2021), Deputy General Counsel (May 2020 to December 2020) and Partner, William Blair; formerly, General Counsel, PineBridge Investments (2016-2020) | | 19 | | Director, William Blair SICAV |
| | | | | | | | | | | |
| Non-Interested Trustees | | | |
Vann A. Avedisian,
1964 | | Trustee | | Since 2012 | | Co-founder and Partner, Newbond Holdings (real estate operations) (since 2021); formerly, Principal, Highgate Holdings (hotel investments) (2009-2021); co-founder and Managing Director, Oxford Capital Partners Inc. (1994 to 2006) | | 19 | | Potbelly Sandwich Works (2001 to 2015 and since 2021)(3) |
| | | | | | | | | | | |
Kathleen T. Barr,
1955 | | Trustee | | Since 2013 | | Retired; Chairman of the Governing Council, Independent Directors Council (since 2020); formerly, President, Productive Capital Management, Inc. (registered investment adviser to public entities) and Owner, KT Barr Consulting, LLC (mutual fund and investment management consulting) (2010 to 2013); prior thereto, Chief Administrative Officer, Senior Vice President and Senior Managing Director of Allegiant Asset Management Company (merged with PNC Capital Advisors, LLC in 2009) (2004 to 2010) | | 19 | | Muzinich BDC, Inc. (since 2019); Board of Governors, Investment Company Institute (since 2019); Professionally Managed Portfolios (since 2018) |
| † | William Blair Investment Management, LLC and William Blair & Company, L.L.C. are collectively referred to in this section as “William Blair”, each of which is a wholly owned subsidiary of WBC Holdings, L.P., which is wholly owned by certain William Blair employees (employee owners are referred to as ‘partners’). |
| | |
| * | The number shown does not include two additional series of the Trust that are in existence, but not currently offered to the public. |
| | |
| ** | Includes directorships of public companies and other registered investment companies held during the past five years. |
| June 30, 2022 | William Blair Funds | 167 |
| Name and Year of Birth | | Position(s)
Held with
Trust | | Term of
Office(1) and
Length of
Time
Served | | Principal
Occupation(s)
During Past 5 Years | | Number of
Portfolios
in Trust
Complex
Overseen
by Trustee* | | Other Directorships
Held by Trustee
During Past 5 Years** |
Daniel N. Leib,
1966(4) | | Trustee | | Since 2016 | | Chief Executive Officer, Donnelley Financial Solutions, Inc. (since 2016); formerly, Executive Vice President and Chief Financial Officer (2011 to 2016) and Group Chief Financial Officer (2009 to 2011), R.R. Donnelley & Sons Company | | 19 | | Donnelley Financial Solutions, Inc. (since 2016) |
| | | | | | | | | | | |
Dorri C. McWhorter,
1973 | | Trustee | | Since 2019 | | President and Chief Executive Officer, YMCA of Metropolitan Chicago (since 2021); formerly, Chief Executive Officer, YWCA Metropolitan Chicago (2013 to 2021); Partner, Crowe LLP (2008 to 2013)(5) | | 19 | | Highland Funds (since 2022); Skyway Concession Company, LLC (since 2018); Illinois CPA Society (since 2017); Lifeway Foods, Inc. (since 2020); Green Thumb Industries (since 2022) |
| | | | | | | | | | | |
Thomas J. Skelly,
1951 | | Trustee | | Since 2007 | | Advisory Board Member for various U.S. companies (since 2005); formerly, Managing Partner of various divisions at Accenture (1994 to 2004) | | 19 | | Mutual Trust Financial Group (provider of insurance and investment products) |
| | | | | | | | | | | |
Steven R. Zenz,
1954 | | Trustee | | Since 2018 | | Consultant, Steven R. Zenz Consulting LLC (merger and acquisition transactions and SEC reporting and filings) (since 2011); formerly, Partner, KPMG LLP (1987 to 2010)(6) | | 19 | | Engine Media Holdings, Inc. (media group supporting esports, news streaming and gaming) (2020 to 2021); Frankly Inc. (technology products/ services for media industry) (2016 to 2020); Insignia Systems, Inc. (in-store advertising services for consumer packaged goods manufacturers) (2013 to 2019) |
| (1) | Each Trustee serves until the election and qualification of a successor, or until death, resignation or retirement, or removal as provided in the Trust’s Declaration of Trust. Retirement for Independent Trustees occurs no later than at the conclusion of the calendar year that occurs after the earlier of (a) the Independent Trustee’s 75th birthday or (b) the 17th anniversary of the date that the Independent Trustee became a member of the Board of Trustees. |
| (2) | Ms. Braming and Ms. Citardi are interested persons of the Trust because they are partners of William Blair, and with respect to Ms. Braming also due to her position as an officer of the Trust. |
| (3) | On February 9, 2021, Potbelly Corporation (“Potbelly”) entered into a securities purchase agreement with accredited purchasers, pursuant to which Potbelly agreed to issue and sell to the purchasers in a private placement an aggregate of (i) 3,249,668 shares of Potbelly’s common stock, par value $0.01 per share and (ii) warrants to purchase an aggregate of 1,299,861 shares of common stock, for an aggregate purchase price of $15.9 million (the “Offering”). The Offering closed on February 12, 2021. WBC acted as the sole placement agent for the Offering and received fees from Potbelly of approximately $1,025,000. |
| (4) | The Trust and William Blair use Donnelley Financial Solutions, Inc. (“DFS’’) for financial printing and other services. DFS is a public company. The Trust and William Blair in the aggregate paid DFS approximately $214,000 and $252,000 in 2020 and 2021, respectively, for the services provided. DFS’s revenue was approximately $895 million in 2020 and $993 million in 2021. Mr. Leib, as the Chief Executive Officer of DFS, is not directly involved in any of the services provided to the Trust or William Blair and his compensation is not materially affected by the fees DFS receives from the Trust and William Blair. |
| (5) | As a former partner of the audit firm Crowe LLP (formerly, Crowe Horwath LLP), Ms. McWhorter received distributions of her capital in the firm over time and those distributions were completed in March 2021. The Trust and William Blair made no payments to Crowe LLP over the past three years. |
| (6) | The Trust engages KPMG to provide foreign tax services in Taiwan. KPMG does not provide audit or audit-related services to the Trust. Mr. Zenz is a former partner of KPMG and receives pension/retirement funds from KPMG. |
| 168 | Semiannual Report | June 30, 2022 |
| Name and Year of Birth | | Position(s) Held
with Trust | | Term of Office
and Length of
Time Served(1) | | Principal Occupation(s)
During Past 5 Years |
| | | | | | | |
| Officers | | | | | | |
| | | | | | | |
Alaina Anderson, CFA,
1975 | | Senior Vice President | | Since 2021 | | Partner, William Blair |
| | | | | | | |
Marcelo Assalin, CFA,
1973 | | Senior Vice President | | Since 2020 | | Partner, William Blair (since 2022); formerly, Associate, William Blair (2020-2021); NN Investment Partners (formerly, ING Investment Management) (2013-2020) |
| | | | | | | |
Daniel Crowe, CFA,
1972 | | Senior Vice President | | Since 2016 | | Partner, William Blair |
| | | | | | | |
Robert J. Duwa, CFA,
1967 | | Senior Vice President | | Since 2019 | | Partner, William Blair |
| | | | | | | |
Simon Fennell,
1969 | | Senior Vice President | | Since 2013 | | Partner, William Blair |
| | | | | | | |
Andrew G. Flynn, CFA,
1961 | | Senior Vice President | | Since 2013 | | Partner, William Blair |
| | | | | | | |
David C. Fording, CFA,
1967 | | Senior Vice President | | Since 2006 | | Partner, William Blair |
| | | | | | | |
James S. Golan, CFA,
1961 | | Senior Vice President | | Since 2005 | | Partner, William Blair |
| | | | | | | |
William V. Heaphy, CFA,
1967 | | Senior Vice President | | Since 2021 | | Associate, William Blair (since 2021); formerly, Principal, Investment Counselors of Maryland, LLC (1994-2021) |
| | | | | | | |
James E. Jones, CFA,
1977 | | Senior Vice President | | Since 2019 | | Partner, William Blair |
| | | | | | | |
Kenneth J. McAtamney,
1966 | | Senior Vice President | | Since 2008 | | Partner, William Blair |
| | | | | | | |
Todd M. McClone, CFA,
1968 | | Senior Vice President | | Since 2005 | | Partner, William Blair |
| | | | | | | |
D.J. Neiman, CFA,
1975 | | Senior Vice President | | Since 2021 | | Partner, William Blair |
| | | | | | | |
Casey K. Preyss, CFA,
1976 | | Senior Vice President | | Since 2015 | | Partner, William Blair |
| | | | | | | |
David P. Ricci, CFA,
1958 | | Senior Vice President | | Since 2006 | | Partner, William Blair |
| | | | | | | |
Lisa D. Rusch,
1970 | | Senior Vice President
Vice President | | Since 2020
2018-2020 | | Partner, William Blair (since 2020); formerly, Associate, William Blair |
| | | | | | | |
Hugo Scott-Gall,
1971 | | Senior Vice President | | Since 2021 | | Partner, William Blair (since 2018); formerly, Managing Director, Goldman Sachs International (1998-2018) |
| | | | | | | |
Ward D. Sexton, CFA,
1974 | | Senior Vice President | | Since 2016 | | Partner, William Blair |
| June 30, 2022 | William Blair Funds | 169 |
| Name and Year of Birth | | Position(s) Held
with Trust | | Term of Office
and Length of
Time Served(1) | | Principal Occupation(s)
During Past 5 Years |
| | | | | | | |
Andrew Siepker, CFA,
1981 | | Senior Vice President | | Since 2022 | | Partner, William Blair (since 2019); formerly, Associate, William Blair |
| | | | | | | |
Mark C. Thompson, CFA,
1976 | | Senior Vice President | | Since 2020 | | Partner, William Blair |
| | | | | | | |
Vivian Lin Thurston, CFA,
1972 | | Senior Vice President | | Since 2021 | | Partner, William Blair |
| | | | | | | |
Dan Zelazny,
1971 | | Senior Vice President | | Since 2019 | | Associate, William Blair (since 2019); formerly, Managing Director, AQR Capital Management (2011-2019) |
| | | | | | | |
Matthew Fleming, CFA,
1973 | | Vice President | | Since 2022 | | Associate, William Blair (since 2021); formerly, Investment Counselors of Maryland, LLC (2008-2021) |
| | | | | | | |
Gary J. Merwitz,
1970 | | Vice President | | Since 2021 | | Associate, William Blair (since 2021); formerly, Principal, Investment Counselors of Maryland, LLC (2004-2021) |
| | | | | | | |
Marco Ruijer, CFA,
1975 | | Vice President | | Since 2020 | | Associate, William Blair (since 2020); formerly, NN Investment Partners (formerly, ING Investment Management) (2013-2020) |
| | | | | | | |
John M. Raczek,
1970 | | Treasurer
Assistant Treasurer | | Since 2019
2010-2019 | | Associate, William Blair |
| | | | | | | |
Andrew T. Pfau,
1970 | | Secretary | | Since 2009 | | Associate, William Blair |
| | | | | | | |
David M. Cihak,
1982 | | Assistant Treasurer | | Since 2019 | | Associate, William Blair |
| | | | | | | |
Walter R. Randall, Jr.,
1960 | | Chief Compliance Officer and Assistant Secretary | | Since 2009 | | Associate, William Blair |
| (1) | The Trust’s Officers, except the Chief Compliance Officer, are elected annually by the Board of Trustees. The Trust’s Chief Compliance Officer is designated by the Board of Trustees and may only be removed by action of the Board of Trustees, including a majority of Independent Trustees. Length of Time Served for all Officers indicates the year the individual became an Officer of the Trust. |
The Statement of Additional Information for the William Blair Funds includes additional information about the trustees and is available without charge by calling 1-800-635-2886 (in Massachusetts 1-800-635-2840) or by writing the Fund.
| 170 | Semiannual Report | June 30, 2022 |
(Unaudited)
Proxy Voting
A description of the policies and procedures that the Funds use to determine how to vote proxies relating to portfolio securities and information regarding how the Funds voted proxies relating to portfolio securities for the most recent 12-month period ended December 31 are available without charge, upon request, by calling 1-800-635-2886 (in Massachusetts 1-800-635-2840), at www.williamblairfunds.com and on the SEC’s website at http://www.sec.gov.
Quarterly Portfolio Schedules
Each Fund files its complete schedule of portfolio holdings with the SEC for the first and third fiscal quarters of each fiscal year (quarters ended March 31 and September 30) on Form N-PORT. The Funds’ Forms N-PORT are available on the SEC’s website at http://www.sec.gov.
Additional Federal Income Tax Information: (unaudited)
Under Section 852(b)(3)(C) of the Code, the Funds hereby designate the following amounts as capital gain dividends for the fiscal year ended December 31, 2021 (in thousands):
| Fund | | Capital Gain Dividend |
| Growth | | $ | 33,127 | |
| Large Cap Growth | | | 50,399 | |
| Mid Cap Growth | | | 9,883 | |
| Small-Mid Cap Growth | | | 494,676 | |
| Small Cap Growth | | | 96,453 | |
| Small Cap Value | | | 66,686 | |
| Global Leaders | | | 8,080 | |
| International Leaders | | | 39,526 | |
| International Growth | | | 243,841 | |
| Institutional International Growth | | | 180,725 | |
| International Small Cap Growth | | | 53,095 | |
| Emerging Markets Leaders | | | 38,180 | |
| Emerging Markets Growth | | | 222,451 | |
| Emerging Markets Small Cap Growth | | | 43,773 | |
| June 30, 2022 | William Blair Funds | 171 |
Useful Information About Your Report (Unaudited)
Please refer to this information when reviewing the Expense Example for each Fund.
Expense Example
As a shareholder of a Fund, you incur two types of costs: (1) transaction costs and (2) ongoing costs, including management fees, distribution (12b-1) fees (for Class N shares, as applicable), and other Fund expenses. The example is intended to help you understand your ongoing costs (in dollars) of investing in the Fund and to compare these costs with the ongoing costs of investing in other mutual funds. To do so, compare the Fund’s 5% hypothetical example with the 5% hypothetical examples that appear in the shareholder reports of other funds. The example is based on an investment of $1,000 invested at the beginning of the period and held for the entire six-month period from January 1, 2022 to June 30, 2022.
Actual Expenses
In each example, the first line for each share class in the table provides information about the actual account values and actual expenses. These expenses reflect the effect of any expense cap applicable to the share class during the period. Without this expense cap, the costs shown in the table would have been higher. You may use the information in this line, together with the amount you invested, to estimate the expenses that you paid over the period. Simply divide your account value by $1,000 (example, an $8,600 account value divided by $1,000 = 8.6), then multiply the result by the number in the first line under the heading entitled “Expenses Paid During the Period” to estimate the expenses you paid on your account during the period.
Hypothetical Example for Comparison Purposes
In each example, the second line for each share class in the table provides information about hypothetical account values and hypothetical expenses based on the Fund’s actual expense ratio and an assumed rate of return of 5% per year before expenses. This is not the Fund’s actual return. The hypothetical account values and expenses may not be used to estimate your actual ending account balance or the expenses you paid for the period. You may use this information to compare the ongoing costs of investing in the Fund to the costs of investing in other funds. To do so, compare this 5% hypothetical example with the 5% hypothetical examples that appear in the shareholder reports of other funds.
Please note that the expenses shown in both examples are meant to highlight your ongoing costs only and do not reflect any transactional costs or account type fees, such as IRA administration fees. These fees are discussed in the prospectus. Therefore, the second line of each share class in the table is useful in comparing ongoing costs only and will not help you determine the relative costs of owning different funds. In addition, if these transactional costs or account fees were included, your costs would have been higher.
| 172 | Semiannual Report | June 30, 2022 |
Fund Expenses (Unaudited)
| Expense Example | | Beginning
Account Value
1/1/2022 | | Ending
Account Value
6/30/2022 | | Expenses Paid
During
the Period (a) | | Annualized
Expense Ratio |
| Growth Fund | | | | | | | | | | |
| Class N-actual return | | $1,000.00 | | $714.65 | | | $5.10 | | 1.20 | % |
| Class N-hypothetical 5% return | | $1,000.00 | | $1,044.05 | | | $6.08 | | 1.20 | |
| Class I-actual return | | $1,000.00 | | $715.63 | | | $3.91 | | 0.92 | |
| Class I-hypothetical 5% return | | $1,000.00 | | $1,045.44 | | | $4.67 | | 0.92 | |
| Class R6-actual return | | $1,000.00 | | $716.39 | | | $3.66 | | 0.86 | |
| Class R6-hypothetical 5% return | | $1,000.00 | | $1,045.74 | | | $4.36 | | 0.86 | |
| Large Cap Growth Fund | | | | | | | | | | |
| Class N-actual return | | $1,000.00 | | $681.91 | | | $3.75 | | 0.90 | |
| Class N-hypothetical 5% return | | $1,000.00 | | $1,045.54 | | | $4.56 | | 0.90 | |
| Class I-actual return | | $1,000.00 | | $682.58 | | | $2.71 | | 0.65 | |
| Class I-hypothetical 5% return | | $1,000.00 | | $1,046.78 | | | $3.30 | | 0.65 | |
| Class R6-actual return | | $1,000.00 | | $682.72 | | | $2.50 | | 0.60 | |
| Class R6-hypothetical 5% return | | $1,000.00 | | $1,047.02 | | | $3.05 | | 0.60 | |
| Mid Cap Growth Fund | | | | | | | | | | |
| Class N-actual return | | $1,000.00 | | $679.46 | | | $5.00 | | 1.20 | |
| Class N-hypothetical 5% return | | $1,000.00 | | $1,044.05 | | | $6.08 | | 1.20 | |
| Class I-actual return | | $1,000.00 | | $680.30 | | | $3.96 | | 0.95 | |
| Class I-hypothetical 5% return | | $1,000.00 | | $1,045.29 | | | $4.82 | | 0.95 | |
| Class R6-actual return | | $1,000.00 | | $680.74 | | | $3.75 | | 0.90 | |
| Class R6-hypothetical 5% return | | $1,000.00 | | $1,045.54 | | | $4.56 | | 0.90 | |
| Mid Cap Value Fund | | | | | | | | | | |
| Class I-actual return (b) | | $1,000.00 | | $874.00 | | | $2.06 | | 0.75 | |
| Class I-hypothetical 5% return (6 month period) | | $1,000.00 | | $1,046.28 | | | $3.81 | | 0.75 | |
| Class R6-actual return (b) | | $1,000.00 | | $874.00 | | | $1.92 | | 0.70 | |
| Class R6-hypothetical 5% return (6 month period) | | $1,000.00 | | $1,046.53 | | | $3.55 | | 0.70 | |
| Small-Mid Cap Core Fund | | | | | | | | | | |
| Class I-actual return | | $1,000.00 | | $782.34 | | | $4.20 | | 0.95 | |
| Class I-hypothetical 5% return | | $1,000.00 | | $1,045.29 | | | $4.82 | | 0.95 | |
| Class R6-actual return | | $1,000.00 | | $782.48 | | | $3.98 | | 0.90 | |
| Class R6-hypothetical 5% return | | $1,000.00 | | $1,045.54 | | | $4.56 | | 0.90 | |
| Small-Mid Cap Growth Fund | | | | | | | | | | |
| Class N-actual return | | $1,000.00 | | $713.98 | | | $5.74 | | 1.35 | |
| Class N-hypothetical 5% return | | $1,000.00 | | $1,043.31 | | | $6.84 | | 1.35 | |
| Class I-actual return | | $1,000.00 | | $714.86 | | | $4.68 | | 1.10 | |
| Class I-hypothetical 5% return | | $1,000.00 | | $1,044.55 | | | $5.58 | | 1.10 | |
| Class R6-actual return | | $1,000.00 | | $715.15 | | | $4.42 | | 1.04 | |
| Class R6-hypothetical 5% return | | $1,000.00 | | $1,044.84 | | | $5.27 | | 1.04 | |
| Small Cap Growth Fund | | | | | | | | | | |
| Class N-actual return | | $1,000.00 | | $720.38 | | | $6.40 | | 1.50 | |
| Class N-hypothetical 5% return | | $1,000.00 | | $1,042.56 | | | $7.60 | | 1.50 | |
| Class I-actual return | | $1,000.00 | | $721.22 | | | $5.33 | | 1.25 | |
| Class I-hypothetical 5% return | | $1,000.00 | | $1,043.80 | | | $6.33 | | 1.25 | |
| Class R6-actual return | | $1,000.00 | | $721.54 | | | $4.99 | | 1.17 | |
| Class R6-hypothetical 5% return | | $1,000.00 | | $1,044.20 | | | $5.93 | | 1.17 | |
| Small Cap Value Fund | | | | | | | | | | |
| Class N-actual return | | $1,000.00 | | $846.27 | | | $5.26 | | 1.15 | |
| Class N-hypothetical 5% return | | $1,000.00 | | $1,044.30 | | | $5.83 | | 1.15 | |
| Class I-actual return | | $1,000.00 | | $847.53 | | | $4.08 | | 0.89 | |
| Class I-hypothetical 5% return | | $1,000.00 | | $1,045.59 | | | $4.51 | | 0.89 | |
| Class R6-actual return | | $1,000.00 | | $848.12 | | | $3.62 | | 0.79 | |
| Class R6-hypothetical 5% return | | $1,000.00 | | $1,046.08 | | | $4.01 | | 0.79 | |
| Global Leaders Fund | | | | | | | | | | |
| Class N-actual return | | $1,000.00 | | $690.14 | | | $4.82 | | 1.15 | |
| Class N-hypothetical 5% return | | $1,000.00 | | $1,044.30 | | | $5.83 | | 1.15 | |
| Class I-actual return | | $1,000.00 | | $691.39 | | | $3.77 | | 0.90 | |
| Class I-hypothetical 5% return | | $1,000.00 | | $1,045.54 | | | $4.56 | | 0.90 | |
| Class R6-actual return | | $1,000.00 | | $691.71 | | | $3.57 | | 0.85 | |
| Class R6-hypothetical 5% return | | $1,000.00 | | $1,045.78 | | | $4.31 | | 0.85 | |
| June 30, 2022 | William Blair Funds | 173 |
Fund Expenses (Unaudited)
| Expense Example | | Beginning
Account Value
1/1/2022 | | Ending
Account Value
6/30/2022 | | Expenses Paid
During
the Period (a) | | Annualized
Expense Ratio |
| International Leaders Fund | | | | | | | | | | |
| Class N-actual return | | $1,000.00 | | $688.22 | | | $4.81 | | 1.15 | % |
| Class N-hypothetical 5% return | | $1,000.00 | | $1,044.30 | | | $5.83 | | 1.15 | |
| Class I-actual return | | $1,000.00 | | $689.06 | | | $3.77 | | 0.90 | |
| Class I-hypothetical 5% return | | $1,000.00 | | $1,045.54 | | | $4.56 | | 0.90 | |
| Class R6-actual return | | $1,000.00 | | $689.06 | | | $3.56 | | 0.85 | |
| Class R6-hypothetical 5% return | | $1,000.00 | | $1,045.78 | | | $4.31 | | 0.85 | |
| International Growth Fund | | | | | | | | | | |
| Class N-actual return | | $1,000.00 | | $693.11 | | | $5.79 | | 1.38 | |
| Class N-hypothetical 5% return | | $1,000.00 | | $1,043.16 | | | $6.99 | | 1.38 | |
| Class I-actual return | | $1,000.00 | | $694.16 | | | $4.75 | | 1.13 | |
| Class I-hypothetical 5% return | | $1,000.00 | | $1,044.40 | | | $5.73 | | 1.13 | |
| Class R6-actual return | | $1,000.00 | | $694.21 | | | $4.45 | | 1.06 | |
| Class R6-hypothetical 5% return | | $1,000.00 | | $1,044.74 | | | $5.37 | | 1.06 | |
| Institutional International Growth Fund | | | | | | | | | | |
| Institutional Class-actual return | | $1,000.00 | | $693.64 | | | $4.24 | | 1.01 | |
| Institutional Class-hypothetical 5% return | | $1,000.00 | | $1,044.99 | | | $5.12 | | 1.01 | |
| International Small Cap Growth Fund | | | | | | | | | | |
| Class N-actual return | | $1,000.00 | | $610.51 | | | $5.95 | | 1.49 | |
| Class N-hypothetical 5% return | | $1,000.00 | | $1,042.61 | | | $7.55 | | 1.49 | |
| Class I-actual return | | $1,000.00 | | $611.31 | | | $4.91 | | 1.23 | |
| Class I-hypothetical 5% return | | $1,000.00 | | $1,043.90 | | | $6.23 | | 1.23 | |
| Class R6-actual return | | $1,000.00 | | $612.06 | | | $4.48 | | 1.12 | |
| Class R6-hypothetical 5% return | | $1,000.00 | | $1,044.45 | | | $5.68 | | 1.12 | |
| Emerging Markets Leaders Fund | | | | | | | | | | |
| Class N-actual return | | $1,000.00 | | $765.23 | | | $5.91 | | 1.35 | |
| Class N-hypothetical 5% return | | $1,000.00 | | $1,043.31 | | | $6.84 | | 1.35 | |
| Class I-actual return | | $1,000.00 | | $766.99 | | | $4.82 | | 1.10 | |
| Class I-hypothetical 5% return | | $1,000.00 | | $1,044.55 | | | $5.58 | | 1.10 | |
| Class R6-actual return | | $1,000.00 | | $767.67 | | | $4.60 | | 1.05 | |
| Class R6-hypothetical 5% return | | $1,000.00 | | $1,044.79 | | | $5.32 | | 1.05 | |
| Emerging Markets Growth Fund | | | | | | | | | | |
| Class N-actual return | | $1,000.00 | | $719.61 | | | $6.31 | | 1.48 | |
| Class N-hypothetical 5% return | | $1,000.00 | | $1,042.66 | | | $7.50 | | 1.48 | |
| Class I-actual return | | $1,000.00 | | $720.50 | | | $5.25 | | 1.23 | |
| Class I-hypothetical 5% return | | $1,000.00 | | $1,043.90 | | | $6.23 | | 1.23 | |
| Class R6-actual return | | $1,000.00 | | $720.70 | | | $4.99 | | 1.17 | |
| Class R6-hypothetical 5% return | | $1,000.00 | | $1,044.20 | | | $5.93 | | 1.17 | |
| Emerging Markets Small Cap Growth Fund | | | | | | | | | | |
| Class N-actual return | | $1,000.00 | | $729.17 | | | $6.65 | | 1.55 | |
| Class N-hypothetical 5% return | | $1,000.00 | | $1,042.31 | | | $7.85 | | 1.55 | |
| Class I-actual return | | $1,000.00 | | $730.14 | | | $5.58 | | 1.30 | |
| Class I-hypothetical 5% return | | $1,000.00 | | $1,043.55 | | | $6.59 | | 1.30 | |
| Class R6-actual return | | $1,000.00 | | $730.29 | | | $5.36 | | 1.25 | |
| Class R6-hypothetical 5% return | | $1,000.00 | | $1,043.80 | | | $6.33 | | 1.25 | |
| China Growth Fund | | | | | | | | | | |
| Class I-actual return | | $1,000.00 | | $812.76 | | | $4.63 | | 1.03 | |
| Class I-hypothetical 5% return | | $1,000.00 | | $1,044.89 | | | $5.22 | | 1.03 | |
| Class R6-actual return | | $1,000.00 | | $812.76 | | | $4.40 | | 0.98 | |
| Class R6-hypothetical 5% return | | $1,000.00 | | $1,045.14 | | | $4.97 | | 0.98 | |
| Emerging Markets Debt Fund | | | | | | | | | | |
| Class I-actual return | | $1,000.00 | | $793.54 | | | $3.11 | | 0.70 | |
| Class I-hypothetical 5% return | | $1,000.00 | | $1,046.53 | | | $3.55 | | 0.70 | |
| Class R6-actual return | | $1,000.00 | | $793.76 | | | $2.89 | | 0.65 | |
| Class R6-hypothetical 5% return | | $1,000.00 | | $1,046.78 | | | $3.30 | | 0.65 | |
| 174 | Semiannual Report | June 30, 2022 |
Fund Expenses (Unaudited)
| Expense Example | | Beginning
Account Value
1/1/2022 | | Ending
Account Value
6/30/2022 | | Expenses Paid
During
the Period (a) | | Annualized
Expense Ratio |
| Macro Allocation Fund (In Liquidation) | | | | | | | | | | |
| Class N-actual return | | $1,000.00 | | $988.90 | | | $6.26 | | 1.27 | % |
| Class N-hypothetical 5% return | | $1,000.00 | | $1,043.70 | | | $6.44 | | 1.27 | |
| Class I-actual return | | $1,000.00 | | $989.75 | | | $5.03 | | 1.02 | |
| Class I-hypothetical 5% return | | $1,000.00 | | $1,044.94 | | | $5.17 | | 1.02 | |
| Class R6-actual return | | $1,000.00 | | $989.75 | | | $4.79 | | 0.97 | |
| Class R6-hypothetical 5% return | | $1,000.00 | | $1,045.19 | | | $4.92 | | 0.97 | |
| (a) | Expenses are equal to the annualized expense ratio, multiplied by the average account value over the period, multiplied by the number of days in the period, 181 and divided by 365 (to reflect the one-half year period). |
| (b) | For the period March 16, 2022 (Commencement of Operations) to June 30, 2022. |
| June 30, 2022 | William Blair Funds | 175 |
BOARD OF TRUSTEES (as of August 25, 2022)
Vann A. Avedisian
Co-founder and Partner, Newbond Holdings
Kathleen T. Barr
Retired Senior Managing Director, PNC Capital Advisors, LLC
Stephanie G. Braming, CFA, Chairman and President
Partner, William Blair
Cissie Citardi
Partner, William Blair
Daniel N. Leib
Chief Executive Officer, Donnelley Financial Solutions, Inc.
Dorri C. McWhorter
President and Chief Executive Officer, YMCA of Metropolitan Chicago
Thomas J. Skelly
Retired Managing Partner, Accenture
Steven R. Zenz
Retired Partner, KPMG LLP
Officers
Alaina Anderson, CFA, Senior Vice President
Marcelo Assalin, CFA, Senior Vice President
Daniel Crowe, CFA, Senior Vice President
Robert J. Duwa, CFA, Senior Vice President
Simon Fennell, Senior Vice President
Andrew G. Flynn, CFA, Senior Vice President
David C. Fording, CFA, Senior Vice President
James S. Golan, CFA, Senior Vice President
William V. Heaphy, CFA, Senior Vice President
James E. Jones, CFA, Senior Vice President
Kenneth J. McAtamney, Senior Vice President
Todd M. McClone, CFA, Senior Vice President
D.J. Neiman, CFA, Senior Vice President
Casey K. Preyss, CFA, Senior Vice President
David P. Ricci, CFA, Senior Vice President
Lisa D. Rusch, Senior Vice President
Hugo Scott-Gall, Senior Vice President
Ward D. Sexton, CFA, Senior Vice President
Andrew Siepker, CFA, Senior Vice President
Mark C. Thompson, CFA, Senior Vice President
Vivian Lin Thurston, CFA, Senior Vice President
Dan Zelazny, Senior Vice President
Matthew Fleming, CFA, Vice President
Gary J. Merwitz, Vice President
Marco Ruijer, CFA, Vice President
John M. Raczek, Treasurer
Andrew T. Pfau, Secretary
David M. Cihak, Assistant Treasurer
Walter R. Randall, Jr., Chief Compliance Officer and Assistant Secretary
Investment Adviser
William Blair Investment Management, LLC
Distributor
William Blair & Company, L.L.C.
Independent Registered Public Accounting Firm
Ernst & Young LLP
Transfer Agent
DST Asset Manager Solutions, Inc.
For customer assistance, call 1-800-635-2886
P.O. Box 219137
Kansas City, Missouri 64121-913
| 176 | Semiannual Report | June 30, 2022 |
| | | | |
| | William Blair Funds | | |
| | | | |
| | U.S. EQUITY | | GLOBAL EQUITY | | EMERGING MARKETS
DEBT |
| | Growth Fund | | Global Leaders Fund | |
| | Large Cap Growth Fund | | INTERNATIONAL EQUITY | | Emerging Markets Debt Fund |
| | Mid Cap Growth Fund | | | |
| | Mid Cap Value Fund | | International Leaders Fund | | MULTI-ASSET AND
ALTERNATIVE |
| | Small-Mid Cap Core Fund | | International Growth Fund | |
| | Small-Mid Cap Growth Fund | | Institutional International Growth Fund | | Macro Allocation Fund |
| | Small Cap Growth Fund | | International Small Cap Growth Fund | | |
| | Small Cap Value Fund | | Emerging Markets Leaders Fund | | |
| | | | Emerging Markets Growth Fund | |
|
| | | | Emerging Markets Small Cap Growth Fund | |
| | | | China Growth Fund | | |
 | | © | William Blair & Company, L.L.C., distributor | |
| +1 800 742 7272 | | 150 North Riverside Plaza | |
| williamblairfunds.com | | Chicago, Illinois 60606 | 00103188 |
Not applicable to this filing.
| Item 3. | Audit Committee Financial Expert |
Not applicable to this filing.
| Item 4. | Principal Accountant Fees and Services |
Not applicable to this filing.
| Item 5. | Audit Committee of Listed Registrants |
Not applicable to this Registrant, insofar as the Registrant is not a listed company.
| Item 6. | Schedule of Investments |
See Schedule of Investments in Item 1.
| Item 7. | Disclosure of Proxy Voting Policies and Procedures for Closed-End Management Investment Companies |
Not applicable to this Registrant, insofar as the Registrant is not a closed-end management investment company.
| Item 8. | Portfolio Managers of Closed-End Management Investment Companies |
Not applicable to this Registrant, insofar as the Registrant is not a closed-end management investment company.
| Item 9. | Purchase of Equity Securities by Closed-End Management Investment Companies and Affiliated Purchasers |
Not applicable to this Registrant, insofar as the Registrant is not a closed-end management investment company.
| Item 10. | Submission of Matters to a Vote of Security Holders |
There have been no material changes to the procedures by which shareholders may recommend nominees to the Registrant’s Board of Trustees since the Registrant last provided disclosure in response to this item.
Controls and Procedures
(a) The Registrant’s principal executive and principal financial officers, or persons performing similar functions, have concluded that the Registrant’s Disclosure Controls and Procedures (as defined in Rule 30a-3(c) under the Investment Company Act of 1940, as amended (the “1940 Act”) (17 CFR 270.30a-3(c)) are effective, as of a date within 90 days of the filing date of this report that includes the disclosure required by this paragraph, based on their evaluation of these controls and procedures required by Rule 30a-3 (b) under the 1940 Act (17 CFR 270.30a-3(b) and Rules 13a-15(b) or 15d-15(b) under the Securities Exchange Act of 1934, as amended to date (17 CFR 240.13a-15(b) or 240.15d-15(b)).
(b) There were no changes in the Registrant’s internal control over financial reporting (as defined in Rule 30a-3(d) under the 1940 Act (17 CFR 270.30a-3(d)) that occurred during the period covered by this report that has materially affected, or is reasonably likely to materially affect, the Registrant’s internal control over financial reporting.
| Item 12. | Disclosure of Securities Lending Activities for Closed-End Management Investment Companies |
Not applicable to this Registrant, insofar as the Registrant is not a closed-end management investment company.
13. (a) (1) Code of Ethics
Not applicable to this filing.
13. (a) (2) (1)
Certification of Principal Executive Officer Required by Rule 30a-2(a) of the Investment Company Act of 1940 is filed as an exhibit hereto.
13. (a) (2) (2)
Certification of Principal Financial Officer Required by Rule 30a-2(a) of the Investment Company Act of 1940 is filed as an exhibit hereto.
13. (a) (3)
Not applicable to this Registrant.
13. (a) (4)
Not applicable to this filing.
13. (b)
Certifications of the Principal Executive Officer and Principal Financial Officer of the issuer as required by Rule 30a-2(b) of the Investment Company Act of 1940 are filed as exhibits hereto.
SIGNATURES
Pursuant to the requirements of the Securities Exchange Act of 1934 and the Investment Company Act of 1940, the Registrant has duly caused this report to be signed on its behalf by the undersigned, thereunto duly authorized.
| | | William Blair Funds |
| | |
| | | /s/ Stephanie G. Braming |
| By: | | Stephanie G. Braming |
| | | President (Principal Executive Officer) |
Date: August 25, 2022
Pursuant to the requirements of the Securities Exchange Act of 1934 and the Investment Company Act of 1940, this report has been signed below by the following persons on behalf of the Registrant and in the capacities and on the dates indicated.
| | | /s/ Stephanie G. Braming |
| By: | | Stephanie G. Braming |
| | | President (Principal Executive Officer) |
Date: August 25, 2022
| | | /s/ John M. Raczek |
| By: | | John M. Raczek |
| | | Treasurer (Principal Financial Officer) |
Date: August 25, 2022