UNITED STATES
SECURITIES AND EXCHANGE COMMISSION
Washington, D.C. 20549
Form N-CSR
CERTIFIED SHAREHOLDER REPORT OF REGISTERED
MANAGEMENT INVESTMENT COMPANIES
Investment Company Act File Number 811-5344
William Blair Funds
(Exact name of registrant as specified in charter)
| 150 North Riverside Plaza, Chicago, IL | | 60606 |
| (Address of principal executive offices) | | (Zip Code) |
Stephanie G. Braming, Principal Executive Officer
William Blair Funds
150 North Riverside Plaza, Chicago, IL 60606
(Name and address of agent for service)
Registrant’s telephone number, including area code: 312-236-1600
Date of fiscal year end: December 31
Date of reporting period: June 30, 2020
Item 1. June 30, 2020 Semiannual Reports transmitted to shareholders.

| | | | | June 30, 2020 |
| | | | | |
| | | | | |
| | | | | |
| | | | | |
| | | | | |
| | | | | |
| | | | | |
| | | | | |
| | | | | |
| | | | | |
| | | | | |
| | | | | |
| | | | | |
| | William Blair Funds | | |
| | Semiannual Report | | |
| | | | | |
| | | | | |
| | | | | |
| | | | | |
| | | IMPORTANT NOTE: Beginning on January 1, 2021, as permitted by regulations adopted by the Securities and Exchange Commission, paper copies of the William Blair Funds’ (the “Funds”) annual and semi-annual shareholder reports will no longer be sent by mail, unless you specifically request paper copies of the shareholder reports from the Funds or from your financial intermediary, such as a broker-dealer or bank. Instead, shareholder reports will be available on the Funds’ website (https://www.williamblairfunds.com/investor_services/prospectus_reports_forms.fs), and you will be notified by mail each time a report is posted and provided with a website link to access the report. | | |
| | | If you already elected to receive shareholder reports electronically, you will not be affected by this change and you need not take any action. You may elect to receive shareholder reports and other communications from the Funds electronically by notifying your financial intermediary or, if you are a direct investor, by calling 1-800-635-2886. | | |
| | | You may elect to receive all future shareholder reports in paper free of charge. You can inform your financial intermediary that you wish to continue receiving paper copies of your shareholder reports, or if you are a direct investor, by calling 1-800-635-2886. Your election to receive reports in paper will apply to all Funds you hold directly or through your financial intermediary, as applicable. | | |
| | | | | |
| | | | | |
| | | | | |
| June 30, 2020 | William Blair Funds | 1 |
The views expressed in the commentary for each Fund reflect those of the portfolio management team only through the end of the period of the report as stated on the cover. The portfolio management team’s views are subject to change at any time based on market and other conditions and should not be construed as a recommendation. Statements involving predictions, assessments, analyses, or outlook for individual securities, industries, market sectors, and/or markets involve risks and uncertainties, and there is no guarantee they will come to pass.
This report is submitted for the general information of the shareholders of William Blair Funds. It is not authorized for distribution to prospective Fund investors unless accompanied or preceded by the Fund’s prospectus. Please carefully consider a Fund’s investment objectives, risks, charges, and expenses before investing. This and other information is contained in the Fund’s prospectus, which you may obtain by calling 1-800-742-7272. Read it carefully before you invest or send money.
| 2 | Semiannual Report | June 30, 2020 |
U.S. Growth Market Review and Outlook
While COVID-19 was the dominant force affecting the economy and equities year-to-date, the tenor of the market was dramatically different in the first and second quarters of the year.
During the first quarter, equities declined rapidly as market participants digested the magnitude of the economic impact of COVID-19. Stay-at-home directives effectively shut down many segments of the economy. First quarter GDP declined 5% and the unemployment rate spiked to almost 15%. This was the most dramatic decline in GDP and the sharpest rise in unemployment in the post-World War II period.
After bottoming in mid-March, equity returns were robust during the second quarter. This was predominately the result of massive amounts of fiscal and monetary stimulus, coupled with improving COVID-19 trends, optimism regarding vaccine development and progress toward re-opening the economy. The Federal Reserve (Fed) responded quickly and dramatically in an attempt to limit economic damage. With the federal funds rate near zero and purchases of both government and corporate bonds, the Fed balance sheet has expanded by over $3 trillion since the pandemic began. The Fed’s actions, paired with unprecedented levels of fiscal stimulus, supported strong demand for equities and a decline in fixed income spreads.
The strength of the recovery brought several market indices into positive territory for the first half of the year. The S&P 500 was down close to 20% in the first quarter and regained nearly all of the lost ground, returning over 20% during the second quarter - its highest quarterly gain since 1998.
Despite the recovery of the equity market, significant uncertainty remains as we emerge from an economic shutdown amidst an ongoing global health pandemic. The economic trajectory of the U.S. is unclear as some states begin to re-open while others retrench in response to rising COVID-19 infections. Early signs of economic improvement could prove fleeting as unemployment benefits expire and potential structural changes could leave some workers permanently out of work. Possible offsets to these challenges include the development of a vaccine and the lagged impact of monetary and fiscal stimulus. These factors, together with social unrest and a contentious forthcoming U.S. presidential election, leave corporate management teams with limited certainty.
As long-term investors, we are reminded more than ever that companies with superior management, high barriers to entry, differentiated products or services, and the financial flexibility to invest through uncertainty should ultimately prevail. We continually seek to identify companies that we believe will come out the other side of this unprecedented period stronger, with increased market share and profitability, regardless of the shape and duration of the broader recovery. While non-fundamental factors can create short-term volatility, the foundational belief upon which our portfolio is built is that earnings and cash flows are the determinants of long-term value creation and stock performance.
| June 30, 2020 | William Blair Funds | 3 |
U.S. Value Market Review and Outlook
While COVID-19 was the dominant force impacting the economy and equities during the first half of 2020, market sentiment was dramatically different between the first and second quarters of the year.
During the first quarter, equities declined dramatically as economic activity was brought to an abrupt halt due to the implementation of shelter-in-place directives in an effort to curb the spread of the virus. With a large percentage of the U.S. economy essentially closed due to this health care related shock, first quarter GDP declined 5% and the unemployment rate spiked to almost 15%. This was the most dramatic decline in GDP and the sharpest rise in unemployment in the post-World War II period.
After the market bottomed in mid-March, equity returns rebounded swiftly in the second quarter. The dramatic reversal in the equity market was a function of massive amounts fiscal and monetary stimulus, improving virus trends, positive health care news on potential vaccines, and optimism regarding economic re-opening, and the hope that the recession would be short-lived.
Policymaker response to this pandemic has been unprecedented in many respects. The Federal Reserve (Fed) has been particularly aggressive in escalating the degree of support broadly across asset classes. These moves seem to have provided more economic support and market liquidity than initially anticipated. While the re-opening of the U.S. economy has provided some positive economic data-points, the Fed appears fully committed to employing any means necessary to provide market liquidity and mitigate the economic fallout from the COVID-19 pandemic.
Despite the swift recovery in the equity market, it is impossible to predict how this COVID-driven recession will play out. Investor confidence will likely hinge on additional fiscal and monetary stimulus efforts and the availability of forward guidance from company management regarding how the shutdown will impact future earnings. We believe that there are numerous risks that are likely to impact the pace and duration of the domestic economy recovery, including the upcoming U.S. presidential election, further increase in virus cases, mass unemployment, corporate bankruptcies, re-emergence of U.S.-China tensions, civil unrest, and vaccine delays.
The pandemic-related lockdowns are starving many businesses of revenue and, where corporate debt levels are high, inability to service debt may likely result in an escalation in the number of corporate bankruptcies. Although all fifty states have taken measures to ease lockdowns, some have retrenched in response to rising COVID-19 infections. This causes us to question the strength of any subsequent economic rebound and the potential longer-term impacts due to fundamental changes in social behavior.
We continue to focus on companies with increasingly stronger balance sheets given our concern about corporate debt levels and expectations for increased market volatility. We believe these companies will be able to endure this unprecedented period and emerge from this crisis stronger and with increased market share, regardless of the trajectory of the broader economic recovery. While non-fundamental factors can create short-term volatility, the foundational belief upon which our Fund is built is that superior capital stewardship, as characterized by strong cash flows and improving or sustainable return on invested capital, are the determinants of long-term value creation and stock performance.
| 4 | Semiannual Report | June 30, 2020 |
| | Growth Fund |
| | |
| | The Growth Fund seeks long-term capital appreciation. |
| | |
| | AN OVERVIEW FROM THE PORTFOLIO MANAGER |
| | |

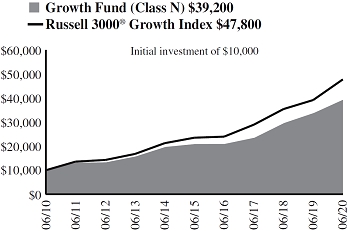
David C. Fording | The William Blair Growth Fund (Class N shares) posted a 7.72% increase, net of fees, for the six months ended June 30, 2020. By comparison, the Fund’s benchmark index, the Russell 3000® Growth Index (the “Index”), increased 8.98%. Despite adding value during the first quarter market sell off, the Fund trailed its benchmark on a year-to-date basis due to a combination of style dynamics and stock-specific factors. From a style perspective, our typical underweight to larger market capitalization stocks, specifically mega caps, relative to the Index was a headwind during the quarter as mega cap stocks outperformed. This headwind was partially offset by our higher growth bias as stocks with higher growth profiles generally outperformed during the period. From a stock-specific perspective, our top detractors included Brink’s Company (Industrials), Coca-Cola (Consumer Staples), Laureate Education (Consumer Discretionary) and Raytheon (Industrials). COVID-19 related closures weighed on Brink’s Company, a global cash management services company, most notably as it related to revenues derived from retail locations that were either temporarily closed or operating on a limited basis. Beverage company Coca-Cola lagged as it continued to face revenue headwinds resulting from COVID-19 driven store and restaurant closures. Stock selection in Information Technology, including our position in Sabre Corp and not owning Apple, one of the largest positions in the benchmark, created a significant headwind to relative performance. We believe the high-end smart phone, tablet and PC markets, which are significant sources of revenue for the company, have largely matured, limiting Apple’s ability to materially grow revenues and operating profits over the longer term, notwithstanding its near-term opportunity for a 5G driven upgrade cycle, also detracted from the Fund’s relative returns. Conversely, our top individual contributor during the period was Amazon (Consumer Discretionary). E-commerce website Amazon continued to benefit from COVID-19 related tailwinds, including increased consumer demand and the rapid shift to e-commerce and online shopping. Other top contributors included Horizon Therapeutics (Health Care), which benefitted from robust growth of the company’s newly launched drug Tepezza (as well as broad based strength across the rest of the business), BJ’s Wholesale Club (Consumer Staples), Etsy (Consumer Discretionary) and Virtu Financial (Financials). Please refer to the U.S. Growth Market Review and Outlook relating to the Fund on page 3. |
| June 30, 2020 | William Blair Funds | 5 |
Growth Fund
Performance Highlights (Unaudited)
| Average Annual Total Return through 6/30/2020 |
| | | Year
to Date | | 1 Year | | 3 Year | | 5 Year | | 10 Year | | Since
Inception(a) |
| Class N | | | 7.72 | % | | | 16.17 | % | | | 18.66 | % | | | 13.46 | % | | | 14.65 | % | | | — | |
| Class I | | | 7.91 | | | | 16.47 | | | | 18.98 | | | | 13.80 | | | | 15.01 | | | | — | |
| Class R6 | | | 7.99 | | | | 16.65 | | | | — | | | | — | | | | — | | | | 16.61 | % |
| Russell 3000® Growth Index | | | 8.98 | | | | 21.94 | | | | 18.21 | | | | 15.23 | | | | 16.92 | | | | 19.35 | |
| S&P 500® Index | | | (3.08 | ) | | | 7.51 | | | | 10.73 | | | | 10.73 | | | | 13.99 | | | | 7.31 | |
| | | | | | | | | | | | | | | | | | | | | | | | | |
| (a) | Since inception is for the period from May 2, 2019 (Commencement of Operations) to June 30, 2020. |
Performance cited represents past performance. Past performance does not guarantee future results and current performance may be lower or higher than the data quoted. Results shown are average annual returns, which assume reinvestment of dividends and capital gains. Investment returns and principal will fluctuate and you may have a gain or loss when you sell shares. For the most current month-end performance information, please call 1-800-742-7272, or visit our Web site at www.williamblairfunds.com. From time to time, the investment adviser may waive fees or reimburse expenses for the Fund. Without these waivers/reimbursements, performance would be lower. Class N shares are not subject to a sales load. Class I shares are not subject to a sales load or distribution (Rule 12b-1) fees. Class R6 shares are not subject to a sales load, distribution (Rule 12b-1) fees, or sub-transfer agent fees.
The performance highlights and graph presented above do not reflect the deduction of taxes that a shareholder would pay on fund distributions or the redemption of fund shares.
The Russell 3000® Growth Index consists of large, medium, and small capitalization companies with above average price-to-book ratios and forecasted growth rates. The index is weighted by market capitalization and large/medium/small companies make up approximately 80%/15%/5% of the index.
The S&P 500® Index indicates broad larger capitalization equity market performance.
This report identifies the Fund’s investments on June 30, 2020. These holdings are subject to change. Not all stocks in the Fund performed the same, nor is there any guarantee that these stocks will perform as well in the future. Market forecasts provided in this report may not necessarily come to pass.
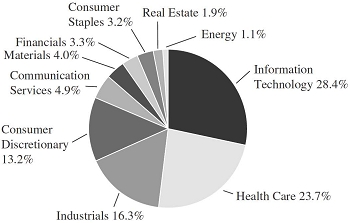
Sector Diversification (Unaudited)

The sector diversification shown is based on the total long-term securities.
| 6 | Semiannual Report | June 30, 2020 |
Growth Fund
Portfolio of Investments, June 30, 2020 (all dollar amounts in thousands) (unaudited)
| | | | | | | | |
| | | | | | | | |
| | Issuer | | Shares | | | Value | |
| | | | | | | | |
| | Common Stocks | | | | | | | | |
| | Information Technology—37.5% | | | | | | | | |
| * | Adobe, Inc. | | | 17,532 | | | $ | 7,632 | |
| * | Advanced Micro Devices, Inc. | | | 65,822 | | | | 3,463 | |
| * | Alarm.com Holdings, Inc. | | | 31,712 | | | | 2,055 | |
| * | Arista Networks, Inc. | | | 20,623 | | | | 4,331 | |
| | Dolby Laboratories, Inc. | | | 34,533 | | | | 2,275 | |
| | Fidelity National Information Services, Inc. | | | 40,947 | | | | 5,491 | |
| * | Inphi Corporation | | | 14,404 | | | | 1,692 | |
| | Mastercard, Inc. Class “A” | | | 35,743 | | | | 10,569 | |
| | Microsoft Corporation | | | 122,155 | | | | 24,860 | |
| * | MongoDB, Inc. | | | 8,437 | | | | 1,910 | |
| | National Instruments Corporation | | | 81,576 | | | | 3,158 | |
| * | Nice, Ltd. - ADR | | | 13,668 | | | | 2,586 | |
| * | PayPal Holdings, Inc. | | | 36,405 | | | | 6,343 | |
| | Perspecta, Inc. | | | 99,820 | | | | 2,319 | |
| * | Pure Storage, Inc. | | | 249,468 | | | | 4,323 | |
| | Texas Instruments, Inc. | | | 44,270 | | | | 5,621 | |
| * | Verra Mobility Corporation | | | 117,183 | | | | 1,205 | |
| * | Workday, Inc. | | | 19,604 | | | | 3,673 | |
| | | | | | | | | 93,506 | |
| | Health Care—14.9% | | | | | | | | |
| | Abbott Laboratories | | | 44,724 | | | | 4,089 | |
| | Agilent Technologies, Inc. | | | 45,389 | | | | 4,011 | |
| * | Codexis, Inc. | | | 61,640 | | | | 703 | |
| * | Horizon Therapeutics plc† | | | 84,259 | | | | 4,683 | |
| * | Illumina, Inc. | | | 7,106 | | | | 2,632 | |
| * | Penumbra, Inc. | | | 8,981 | | | | 1,606 | |
| * | Quidel Corporation | | | 7,197 | | | | 1,610 | |
| | STERIS plc† | | | 12,217 | | | | 1,875 | |
| | Stryker Corporation | | | 16,269 | | | | 2,931 | |
| | Teleflex, Inc. | | | 5,141 | | | | 1,871 | |
| | UnitedHealth Group, Inc. | | | 27,608 | | | | 8,143 | |
| | Zoetis, Inc. | | | 22,226 | | | | 3,046 | |
| | | | | | | | | 37,200 | |
| | Consumer Discretionary—13.9% | | | | | | | | |
| | Advance Auto Parts, Inc. | | | 20,170 | | | | 2,873 | |
| * | Amazon.com, Inc. | | | 7,912 | | | | 21,828 | |
| * | Burlington Stores, Inc. | | | 11,370 | | | | 2,239 | |
| * | Etsy, Inc. | | | 23,284 | | | | 2,474 | |
| * | Grand Canyon Education, Inc. | | | 19,656 | | | | 1,779 | |
| * | Laureate Education, Inc. | | | 142,194 | | | | 1,417 | |
| * | Ulta Beauty, Inc. | | | 10,281 | | | | 2,091 | |
| | | | | | | | | 34,701 | |
| | Communication Services—9.4% | | | | | | | | |
| | Activision Blizzard, Inc. | | | 62,172 | | | | 4,719 | |
| * | Alphabet, Inc. Class “A” | | | 10,727 | | | | 15,211 | |
| * | Live Nation Entertainment, Inc. | | | 33,052 | | | | 1,465 | |
| * | Take-Two Interactive Software, Inc. | | | 15,059 | | | | 2,102 | |
| | | | | | | | | 23,497 | |
| | Industrials—8.5% | | | | | | | | |
| | BWX Technologies, Inc. | | | 69,905 | | | | 3,959 | |
| | | | Shares or | | | | |
| | | | Principal | | | | |
| | Issuer | | Amount | | | Value | |
| | | | | | | | |
| | Common Stocks—(continued) | | | | | | | | |
| | Industrials—(continued) | | | | | | | | |
| * | Copart, Inc. | | | 48,534 | | | $ | 4,041 | |
| * | CoStar Group, Inc. | | | 5,770 | | | | 4,101 | |
| | Fortive Corporation | | | 46,750 | | | | 3,163 | |
| | Luxfer Holdings plc† | | | 101,664 | | | | 1,439 | |
| | The Brink’s Co. | | | 45,087 | | | | 2,052 | |
| * | Trex Co., Inc. | | | 19,172 | | | | 2,494 | |
| | | | | | | | | 21,249 | |
| | Consumer Staples—6.0% | | | | | | | | |
| * | BJ’s Wholesale Club Holdings, Inc. | | | 89,221 | | | | 3,325 | |
| | Costco Wholesale Corporation | | | 12,156 | | | | 3,686 | |
| | The Coca-Cola Co. | | | 105,001 | | | | 4,692 | |
| | The Estee Lauder Cos., Inc. Class “A” | | | 16,511 | | | | 3,115 | |
| | | | | | | | | 14,818 | |
| | Financials—3.5% | | | | | | | | |
| | Aon plc† | | | 16,269 | | | | 3,133 | |
| | Ares Management Corporation | | | 69,157 | | | | 2,746 | |
| | Virtu Financial, Inc. | | | 118,190 | | | | 2,789 | |
| | | | | | | | | 8,668 | |
| | Materials—3.1% | | | | | | | | |
| | Ball Corporation | | | 66,073 | | | | 4,591 | |
| | Linde plc† | | | 14,696 | | | | 3,117 | |
| | | | | | | | | 7,708 | |
| | Real Estate—1.4% | | | | | | | | |
| | SBA Communications Corporation | | | 11,975 | | | | 3,568 | |
| | Energy—1.1% | | | | | | | | |
| | Cameco Corporation† | | | 273,623 | | | | 2,805 | |
| | Total Common Stocks—99.3%
(cost $148,062) | | | | | | | 247,720 | |
| | | | | | | | | | |
| | Repurchase Agreement | | | | | | | | |
| | Fixed Income Clearing Corporation, 0.000% dated 6/30/20, due 7/1/20, repurchase price $1,884, collateralized by U.S. Treasury Note, 1.625%, due 2/15/26, valued at $1,922 | | | $1,884 | | | | 1,884 | |
| | Total Repurchase Agreement—0.8%
(cost $1,884) | | | | | | | 1,884 | |
| | Total Investments—100.1%
(cost $149,946) | | | | | | | 249,604 | |
| | Liabilities, plus cash and other assets—(0.1)% | | | | | | | (271 | ) |
| | Net assets—100.0% | | | | | | $ | 249,333 | |
ADR = American Depository Receipt
* = Non-income producing security
† = U.S. listed foreign security
See accompanying Notes to Financial Statements.
| June 30, 2020 | William Blair Funds | 7 |
| | Large Cap Growth Fund |
| | |
| | The Large Cap Growth Fund seeks long-term capital appreciation. |
| | |
| | AN OVERVIEW FROM THE PORTFOLIO MANAGERS |
| | |

James S. Golan 
David P. Ricci | The William Blair Large Cap Growth Fund (Class N shares) posted a 9.63% increase, net of fees, for the six months ended June 30, 2020. By comparison, the Fund’s benchmark index, the Russell 1000® Growth Index (the “Index”), increased 9.81%. As a result of adding value during the first quarter market sell off, the Fund modestly outperformed its benchmark during the year-to-date period due to a combination of style dynamics and stock specific factors. From a style perspective, our higher valuation exposure, driven by the Fund’s secular growth bias, was a tailwind as stocks with higher valuations generally outperformed during the period. From a stock-specific perspective, our top two contributors were PayPal Holdings (Information Technology), which reported strong revenue acceleration and record levels of new client additions and transactions as it continued to benefit from the rapid transition to e-commerce and digital payments, and Amazon (Consumer Discretionary). E-commerce website Amazon continued to benefit from COVID-19 related tailwinds including increased consumer demand and the rapid shift to e-commerce and online shopping. Other notable contributors included Activision Blizzard (Communication Services), Veeva Systems (Health Care) and Adobe (Information Technology). Additionally, not owning Apple was the largest detractor from relative returns during the period. We believe the high-end smart phone, tablet and PC markets, which are significant sources of revenue for the company, have largely matured, limiting Apple’s ability to materially grow revenues and operating profits over the longer term. Conversely, our top detractors included Live Nation Entertainment (Communication Services), Starbucks Corporation (Consumer Discretionary), Coca-Cola (Consumer Staples), Stryker (Health Care) and Fortive Corp. (Industrials). Live Nation, a global leader in live entertainment, lagged as social distancing measures negatively impacted the company’s ability to conduct live events. COVID-19 related store closures weighed on Starbucks, impacting the company’s revenues during the period. Please refer to the U.S. Growth Market Review and Outlook relating to the Fund on page 3. |
| 8 | Semiannual Report | June 30, 2020 |
Large Cap Growth Fund
Performance Highlights (Unaudited)
| Average Annual Total Return through 6/30/2020 |
| | | Year
to Date | | 1 Year | | 3 Year | | 5 Year | | 10 Year | | Since
Inception(a) |
| Class N | | | 9.63 | % | | | 20.14 | % | | | 22.15 | % | | | 16.15 | % | | | 17.24 | % | | | — | |
| Class I | | | 9.76 | | | | 20.45 | | | | 22.44 | | | | 16.44 | | | | 17.54 | | | | — | |
| Class R6 | | | 9.83 | | | | 20.50 | | | | — | | | | — | | | | — | | | | 21.42 | % |
| Russell 1000® Growth Index | | | 9.81 | | | | 23.28 | | | | 18.99 | | | | 15.89 | | | | 17.23 | | | | 20.47 | |
| (a) | Since inception is for the period from May 2, 2019 (Commencement of Operations) to June 30, 2020. |
Performance cited represents past performance. Past performance does not guarantee future results and current performance may be lower or higher than the data quoted. Results shown are average annual total returns, which assume reinvestment of dividends and capital gains. Investment returns and principal will fluctuate and you may have a gain or loss when you sell shares. For the most current month-end performance information, please call 1-800-742-7272, or visit our Web site at www.williamblairfunds.com. From time to time, the investment adviser may waive fees or reimburse expenses for the Fund. Without these waivers/reimbursements, performance would be lower. Class N shares are not subject to a sales load. Class I shares are not subject to a sales load or distribution (Rule 12b-1) fees. Class R6 shares are not subject to a sales load, distribution (Rule 12b-1) fees, or sub-transfer agent fees.
The performance highlights and graph presented above do not reflect the deduction of taxes that a shareholder would pay on fund distributions or the redemption of fund shares.
The Russell 1000® Growth Index consists of large capitalization companies with above average price-to-book ratios and forecasted growth rates.
This report identifies the Fund’s investments on June 30, 2020. These holdings are subject to change. Not all stocks in the Fund performed the same, nor is there any guarantee that these stocks will perform as well in the future. Market forecasts provided in this report may not necessarily come to pass.
| Sector Diversification (Unaudited) |
The sector diversification shown is based on the total long-term securities.
| June 30, 2020 | William Blair Funds | 9 |
Portfolio of Investments, June 30, 2020 (all dollar amounts in thousands) (unaudited)
| | | | | | | | |
| | | | | | | | |
| | Issuer | | Shares | | | Value | |
| | | | | | | | |
| | Common Stocks | | | | | | | | |
| | Information Technology—41.9% | | | | | | | | |
| | Accenture plc† | | | 84,890 | | | $ | 18,228 | |
| * | Adobe, Inc. | | | 44,380 | | | | 19,319 | |
| * | Advanced Micro Devices, Inc. | | | 263,228 | | | | 13,848 | |
| | Fidelity National Information Services, Inc. | | | 84,700 | | | | 11,357 | |
| * | Guidewire Software, Inc. | | | 77,230 | | | | 8,561 | |
| | Intuit, Inc. | | | 44,760 | | | | 13,258 | |
| | Lam Research Corporation | | | 39,000 | | | | 12,615 | |
| | Mastercard, Inc. Class “A” | | | 82,700 | | | | 24,454 | |
| | Microsoft Corporation | | | 266,900 | | | | 54,317 | |
| * | PayPal Holdings, Inc. | | | 144,230 | | | | 25,129 | |
| | Texas Instruments, Inc. | | | 131,540 | | | | 16,702 | |
| | | | | | | | | 217,788 | |
| | Consumer Discretionary—15.9% | | | | | | | | |
| * | Amazon.com, Inc. | | | 16,490 | | | | 45,493 | |
| | Marriott International, Inc. | | | 63,480 | | | | 5,442 | |
| | NIKE, Inc. Class “B” | | | 169,830 | | | | 16,652 | |
| | Starbucks Corporation | | | 203,860 | | | | 15,002 | |
| | | | | | | | | 82,589 | |
| | Health Care—13.7% | | | | | | | | |
| | Abbott Laboratories | | | 135,850 | | | | 12,421 | |
| * | Illumina, Inc. | | | 29,870 | | | | 11,062 | |
| | Stryker Corporation | | | 84,180 | | | | 15,168 | |
| | UnitedHealth Group, Inc. | | | 70,330 | | | | 20,744 | |
| | Zoetis, Inc. | | | 87,590 | | | | 12,003 | |
| | | | | | | | | 71,398 | |
| | Communication Services—9.9% | | | | | | | | |
| | Activision Blizzard, Inc. | | | 182,310 | | | | 13,837 | |
| * | Alphabet, Inc. Class “A” | | | 19,260 | | | | 27,312 | |
| * | Alphabet, Inc. Class “C” | | | 816 | | | | 1,154 | |
| * | Live Nation Entertainment, Inc. | | | 213,270 | | | | 9,454 | |
| | | | | | | | | 51,757 | |
| | Industrials—7.4% | | | | | | | | |
| * | Copart, Inc. | | | 175,830 | | | | 14,641 | |
| | Equifax, Inc. | | | 73,970 | | | | 12,714 | |
| | Fortive Corporation | | | 162,220 | | | | 10,976 | |
| | | | | | | | | 38,331 | |
| | Consumer Staples—5.4% | | | | | | | | |
| | Costco Wholesale Corporation | | | 24,480 | | | | 7,423 | |
| | The Coca-Cola Co. | | | 278,210 | | | | 12,430 | |
| | The Estee Lauder Cos., Inc. Class “A” | | | 42,590 | | | | 8,036 | |
| | | | | | | | | 27,889 | |
| | Financials—3.7% | | | | | | | | |
| | Aon plc† | | | 45,230 | | | | 8,711 | |
| | Apollo Global Management, Inc. | | | 212,890 | | | | 10,628 | |
| | | | | | | | | 19,339 | |
| | Materials—1.7% | | | | | | | | |
| | Linde plc† | | | 40,980 | | | | 8,692 | |
| | Total Common Stocks—99.6%
(cost $402,992) | | | | | | | 517,783 | |
| | | | | | | | | | |
| | | | Principal | | | | |
| | Issuer | | Amount | | | Value | |
| | | | | | | | |
| | Repurchase Agreement | | | | | | | | |
| | Fixed Income Clearing Corporation, 0.000% dated 6/30/20, due 7/1/20, repurchase price $4,290, collateralized by U.S. Treasury Note, 1.625%, due 2/15/26, valued at $4,376 | | | $4,290 | | | $ | 4,290 | |
| | Total Repurchase Agreement—0.8%
(cost $4,290) | | | | | | | 4,290 | |
| | Total Investments—100.4%
(cost $407,282) | | | | | | | 522,073 | |
| | Liabilities, plus cash and other assets—(0.4)% | | | | | | | (1,838 | ) |
| | Net assets—100.0% | | | | | | $ | 520,235 | |
† = U.S. listed foreign security
* = Non-income producing security
See accompanying Notes to Financial Statements.
| 10 | Semiannual Report | June 30, 2020 |
| | Mid Cap Growth Fund |
| | |
| | The Mid Cap Growth Fund seeks long-term capital appreciation. |
| | |
| | AN OVERVIEW FROM THE PORTFOLIO MANAGERS |
| | |

Daniel Crowe 
James E. Jones 
Robert C. Lanphier, IV | The William Blair Mid Cap Growth Fund (Class N shares) posted a 1.36% decrease, net of fees, for the six months ended June 30, 2020. By comparison, the Fund’s benchmark index, the Russell Midcap® Growth Index (the “Index”), increased 4.16%. Despite holding up better than its benchmark during the first quarter market sell off, the Fund trailed the Index on a year-to-date basis due to a combination of style headwinds and stock specific factors. From a style perspective, our bias toward more consistent business models did not provide its typical, down market benefit during the first quarter. The unique nature of the sell-off caused by COVID-19 impacted performance in some unexpected ways as stocks of companies with low fundamental volatility and low cyclicality were not necessarily rewarded. From a stock specific standpoint, selection in Information Technology, including our positions in Euronet Worldwide and WEX, and our underweight to the most expensive stocks in the sector (e.g., Software), which materially outperformed, detracted from relative returns. Electronic payment and transaction processor Euronet Worldwide lagged as COVID-19 related social distancing measures caused a decline in global travel volumes, negatively affecting the company’s ATM business. Stock selection in Consumer Discretionary, including our positions in Wayfair and Ross Stores, also was a detractor during the period. Home furnishings retailer Wayfair experienced headwinds as the COVID-19 pandemic resulted in a decline in consumer spending and supply chain disruptions. Communication Services holding Live Nation Entertainment also underperformed during the period. Conversely, our top contributors included Horizon Therapeutics (Health Care), which benefitted from robust growth of the company’s newly launched drug Tepezza as well as broad based strength across the rest of the business, BJ’s Wholesale Club (Consumer Staples), SBA Communications (Real Estate) and Autodesk (Information Technology). BJ’s, the third largest wholesale club retailer, benefitted from an unexpected increase in new memberships during the period. Stock selection in Industrials, including our position in CoStar Group, contributed positively to relative returns. Please refer to the U.S. Growth Market Review and Outlook relating to the Fund on page 3. |
| June 30, 2020 | William Blair Funds | 11 |
Mid Cap Growth Fund
Performance Highlights (Unaudited)
Average Annual Total Return through 6/30/2020
| | | Year
to Date | | 1 Year | | 3 Year | | 5 Year | | 10 Year | | Since
Inception(a) |
| Class N | | | (1.36 | )% | | | 5.31 | % | | | 13.29 | % | | | 8.90 | % | | | 12.28 | % | | | — | |
| Class I | | | (1.17 | ) | | | 5.60 | | | | 13.57 | | | | 9.18 | | | | 12.57 | | | | — | |
| Class R6 | | | (1.17 | ) | | | 5.69 | | | | — | | | | — | | | | — | | | | 6.68 | % |
| Russell Midcap® Growth Index | | | 4.16 | | | | 11.91 | | | | 14.76 | | | | 11.60 | | | | 15.09 | | | | 12.00 | |
| (a) | Since inception is for the period from May 2, 2019 (Commencement of Operations) to June 30, 2020. |
Performance cited represents past performance. Past performance does not guarantee future results and current performance may be lower or higher than the data quoted. Results shown are average annual total returns, which assume reinvestment of dividends and capital gains. Investment returns and principal will fluctuate and you may have a gain or loss when you sell shares. For the most current month-end performance information, please call 1-800-742-7272, or visit our Web site at www.williamblairfunds.com. Investing in medium capitalization companies involves special risks, including higher volatility and lower liquidity. Medium capitalization stocks are also more sensitive to purchase/sale transactions and changes in the issuer’s financial condition. From time to time, the investment adviser may waive fees or reimburse expenses for the Fund. Without these waivers/reimbursements, performance would be lower. Class N shares are not subject to a sales load. Class I shares are not subject to a sales load or distribution (Rule 12b-1) fees. Class R6 shares are not subject to a sales load, distribution (Rule 12b-1) fees, or sub-transfer agent fees.
The performance highlights and graph presented above do not reflect the deduction of taxes that a shareholder would pay on fund distributions or the redemption of fund shares.
The Russell Midcap® Growth Index is an index that is constructed to provide a comprehensive and unbiased barometer of the mid-cap growth market.
This report identifies the Fund’s investments on June 30, 2020. These holdings are subject to change. Not all stocks in the Fund performed the same, nor is there any guarantee that these stocks will perform as well in the future. Market forecasts provided in this report may not necessarily come to pass.
Sector Diversification (Unaudited)

The sector diversification shown is based on the total long-term securities.
| 12 | Semiannual Report | June 30, 2020 |
Mid Cap Growth Fund
Portfolio of Investments, June 30, 2020 (all dollar amounts in thousands) (unaudited)
| | | | | | | | |
| | | | | | | | |
| | Issuer | | Shares | | | Value | |
| | | | | | | | | | |
| | Common Stocks | | | | | | | | |
| | Information Technology—31.9% | | | | | | | | |
| * | Arista Networks, Inc. | | | 7,190 | | | $ | 1,510 | |
| * | Aspen Technology, Inc. | | | 7,180 | | | | 744 | |
| | Booz Allen Hamilton Holding Corporation | | | 18,359 | | | | 1,428 | |
| * | Cadence Design Systems, Inc. | | | 20,730 | | | | 1,989 | |
| * | Coupa Software, Inc. | | | 3,920 | | | | 1,086 | |
| | Dolby Laboratories, Inc. | | | 19,230 | | | | 1,267 | |
| * | EPAM Systems, Inc. | | | 5,675 | | | | 1,430 | |
| * | Euronet Worldwide, Inc. | | | 12,375 | | | | 1,186 | |
| | Global Payments, Inc. | | | 5,915 | | | | 1,003 | |
| * | GoDaddy, Inc. | | | 19,600 | | | | 1,437 | |
| | j2 Global, Inc. | | | 9,803 | | | | 620 | |
| | MAXIMUS, Inc. | | | 11,310 | | | | 797 | |
| | Microchip Technology, Inc. | | | 15,790 | | | | 1,663 | |
| * | MongoDB, Inc. | | | 5,420 | | | | 1,227 | |
| * | Nice, Ltd.—ADR | | | 5,365 | | | | 1,015 | |
| * | Pure Storage, Inc. | | | 77,980 | | | | 1,352 | |
| * | WEX, Inc. | | | 6,625 | | | | 1,093 | |
| * | Workday, Inc. | | | 5,480 | | | | 1,027 | |
| * | Zendesk, Inc. | | | 8,710 | | | | 771 | |
| | | | | | | | | 22,645 | |
| | Health Care—19.3% | | | | | | | | |
| * | ABIOMED, Inc. | | | 4,718 | | | | 1,140 | |
| | Agilent Technologies, Inc. | | | 24,660 | | | | 2,179 | |
| * | Align Technology, Inc. | | | 4,015 | | | | 1,102 | |
| * | Centene Corporation | | | 19,235 | | | | 1,222 | |
| | Encompass Health Corporation | | | 20,913 | | | | 1,295 | |
| * | Exact Sciences Corporation | | | 10,660 | | | | 927 | |
| * | Horizon Therapeutics plc† | | | 31,195 | | | | 1,734 | |
| * | Insulet Corporation | | | 3,620 | | | | 703 | |
| * | Mettler-Toledo International, Inc. | | | 1,040 | | | | 838 | |
| | STERIS plc† | | | 4,815 | | | | 739 | |
| | Teleflex, Inc. | | | 4,935 | | | | 1,796 | |
| | | | | | | | | 13,675 | |
| | Industrials—14.5% | | | | | | | | |
| | BWX Technologies, Inc. | | | 39,349 | | | | 2,229 | |
| * | Copart, Inc. | | | 27,722 | | | | 2,308 | |
| * | CoStar Group, Inc. | | | 3,609 | | | | 2,565 | |
| | Equifax, Inc. | | | 5,000 | | | | 859 | |
| | Fortive Corporation | | | 11,515 | | | | 779 | |
| * | Teledyne Technologies, Inc. | | | 2,095 | | | | 652 | |
| | Waste Connections, Inc.† | | | 9,975 | | | | 936 | |
| | | | | | | | | 10,328 | |
| | Consumer Discretionary—10.2% | | | | | | | | |
| | Advance Auto Parts, Inc. | | | 10,113 | | | | 1,441 | |
| | Aptiv plc† | | | 10,375 | | | | 809 | |
| * | Bright Horizons Family Solutions, Inc. | | | 5,625 | | | | 659 | |
| * | Burlington Stores, Inc. | | | 6,145 | | | | 1,210 | |
| | Domino’s Pizza, Inc. | | | 1,698 | | | | 627 | |
| | Ross Stores, Inc. | | | 10,960 | | | | 934 | |
| | Service Corporation International | | | 19,525 | | | | 759 | |
| * | Ulta Beauty, Inc. | | | 3,800 | | | | 773 | |
| | | | | | | | | 7,212 | |
| | | | Shares or | | | | |
| | | | Principal | | | | |
| | Issuer | | Amount | | | Value | |
| | | | | | | | | | |
| | Common Stocks—(continued) | | | | | | | | |
| | Materials—5.9% | | | | | | | | |
| | Ball Corporation | | | 31,065 | | | $ | 2,158 | |
| | Celanese Corporation | | | 3,820 | | | | 330 | |
| | Vulcan Materials Co. | | | 14,715 | | | | 1,705 | |
| | | | | | | | | 4,193 | |
| | Communication Services—5.8% | | | | | | | | |
| | Cable One, Inc. | | | 335 | | | | 594 | |
| * | Live Nation Entertainment, Inc. | | | 18,069 | | | | 801 | |
| * | Take-Two Interactive Software, Inc. | | | 11,020 | | | | 1,538 | |
| * | Zynga, Inc. | | | 123,960 | | | | 1,183 | |
| | | | | | | | | 4,116 | |
| | Consumer Staples—4.2% | | | | | | | | |
| * | BJ’s Wholesale Club Holdings, Inc. | | | 26,864 | | | | 1,001 | |
| | Conagra Brands, Inc. | | | 30,625 | | | | 1,077 | |
| | Lamb Weston Holdings, Inc. | | | 13,622 | | | | 871 | |
| | | | | | | | | 2,949 | |
| | Financials—3.1% | | | | | | | | |
| | Arthur J Gallagher & Co. | | | 16,570 | | | | 1,615 | |
| * | SVB Financial Group | | | 2,760 | | | | 595 | |
| | | | | | | | | 2,210 | |
| | Real Estate—1.9% | | | | | | | | |
| | SBA Communications Corporation | | | 4,530 | | | | 1,350 | |
| | Total Common Stocks—96.8%
(cost $55,389) | | | | | | | 68,678 | |
| | |
| | Repurchase Agreement | | | | | | | | |
| | Fixed Income Clearing Corporation, 0.000% dated 6/30/20, due 7/1/20, repurchase price $1,769, collateralized by U.S. Treasury Note, 1.625% due 2/15/26, valued at $1,805 | | | $1,769 | | | | 1,769 | |
| | Total Repurchase Agreement—2.5%
(cost $1,769) | | | | | | | 1,769 | |
| | Total Investments—99.3%
(cost $57,158) | | | | | | | 70,447 | |
| | Cash and other assets, less liabilities—0.7% | | | | | | | 501 | |
| | Net assets—100.0% | | | | | | $ | 70,948 | |
ADR = American Depository Receipt
* = Non-income producing security
† = U.S. listed foreign security
See accompanying Notes to Financial Statements.
| June 30, 2020 | William Blair Funds | 13 |
| | Small-Mid Cap Core Fund The Small-Mid Cap Core Fund seeks long-term capital appreciation. AN OVERVIEW FROM THE PORTFOLIO MANAGERS |

Daniel Crowe 
Robert C. Lanphier, IV 
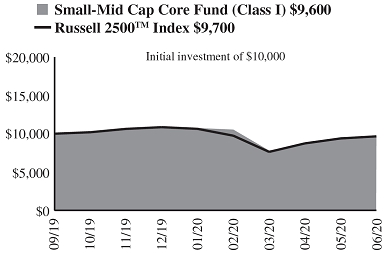
Ward D. Sexton | The William Blair Small-Mid Cap Core Fund (Class I shares) posted a 10.49% decrease, net of fees, for the six months ended June 30, 2020. By comparison, the Fund’s benchmark index, the Russell 2500TM Index (the “Index”), decreased 11.05%. As a result of adding value during the first quarter market sell off, the Fund outperformed its benchmark on a year-to-date basis primarily driven by stock specific factors. Top individual contributors for the period were Horizon Therapeutics (Health Care), which benefitted from robust growth of the company’s newly launched drug Tepezza, as well as broad based strength across the rest of the business, and BJ’s Wholesale Clubs (Consumer Staples), which benefitted from higher consumer demand amid the pandemic. Stock selection was positive in several sectors, most notably Financials, including our position in Virtu Financial. Other notable performers included Merit Medical Systems (Health Care) and Nice Ltd (Information Technology). Conversely, selection in Information Technology, including our underweight to the most expensive stocks in the sector (e.g., Software) which outperformed, dampened relative returns. Top detractors during the period were Brink’s Company (Industrials), whose COVID-19 related closures weighed on cash management services, most notably as it relates to revenues derived from retail locations that were either temporarily closed or operating on a limited basis, and Western Alliance Bancorp (Financials), due to the potential impact of COVID-19 on the company’s hotel loan book combined with a lower interest rate environment. Our positions in Boot Barn (Consumer Discretionary), Hanger (Health Care) and Orion Engineered Carbons (Materials) also underperformed. From a style perspective, year-to-date dynamics were similar to those of the second quarter wherein the most volatile and lowest return on invested capital quintiles of the benchmark were the best performers. While these dynamics persisted across our benchmark, they are exemplified by Biotechnology, which, in the small/mid space, consists mostly of speculative companies without approved products and outperformed year-to-date. Our underweight to these types of companies was a relative headwind. Please refer to the U.S. Growth Market Review and Outlook relating to the Fund on page 3. |
| 14 | Semiannual Report | June 30, 2020 |
Small-Mid Cap Core Fund
Performance Highlights (Unaudited)
| Average Annual Total Return through 6/30/2020 |
| | | Year | | Since |
| | | to Date | | Inception(a) |
| Class I | | | (10.49 | )% | | | (4.34 | )% |
| Class R6 | | | (10.39 | ) | | | (4.23 | ) |
| Russell 2500TM Index | | | (11.05 | ) | | | (3.46 | ) |
| (a) | Since inception is for the period from October 1, 2019 (Commencement of Operations) to June 30, 2020. |
Performance cited represents past performance. Past performance does not guarantee future results and current performance may be lower or higher than the data quoted. Results shown are average annual total returns, which assume reinvestment of dividends and capital gains. Investment returns and principal will fluctuate and you may have a gain or loss when you sell shares. For the most current month-end performance information, please call 1-800-742-7272, or visit our Web site at www.williamblairfunds.com. Investing in smaller and medium capitalization companies involves special risks, including higher volatility and lower liquidity. Smaller and medium capitalization stocks are also more sensitive to purchase/sale transactions and changes in the issuer’s financial condition. From time to time, the investment adviser may waive fees or reimburse expenses for the Fund. Without these waivers/reimbursements, performance would be lower. Class I shares are not subject to a sales load or distribution (Rule 12b-1) fees. Class R6 shares are not subject to a sales load, distribution (Rule 12b-1) fees, or sub-transfer agent fees.
The performance highlights and graph presented above do not reflect the deduction of taxes that a shareholder would pay on fund distributions or the redemption of fund shares.
The Russell 2500TM Index measures the performance of those Russell 2500 companies with above average price-to-book ratios and forecasted growth rates.
This report identifies the Fund’s investments on June 30, 2020. These holdings are subject to change. Not all stocks in the Fund performed the same, nor is there any guarantee that these stocks will perform as well in the future. Market forecasts provided in this report may not necessarily come to pass.
Sector Diversification (Unaudited)

The sector diversification shown is based on the total long-term securities.
| June 30, 2020 | William Blair Funds | 15 |
Small-Mid Cap Core Fund
Portfolio of Investments, June 30, 2020 (all dollar amounts in thousands) (unaudited)
| | | | | | | | |
| | | | | | | | |
| | Issuer | | Shares | | | Value | |
| | Common Stocks | | | | | | | | |
| | Health Care—17.8% | | | | | | | | |
| * | Codexis, Inc. | | | 171,142 | | | $ | 1,951 | |
| | Encompass Health Corporation | | | 43,479 | | | | 2,693 | |
| * | Hanger, Inc. | | | 155,704 | | | | 2,578 | |
| * | HealthEquity, Inc. | | | 25,784 | | | | 1,513 | |
| * | Horizon Therapeutics plc† | | | 82,903 | | | | 4,608 | |
| * | LHC Group, Inc. | | | 20,144 | | | | 3,512 | |
| * | Mednax, Inc. | | | 153,973 | | | | 2,633 | |
| * | Merit Medical Systems, Inc. | | | 114,425 | | | | 5,223 | |
| * | Quidel Corporation | | | 7,961 | | | | 1,781 | |
| | STERIS plc† | | | 17,936 | | | | 2,752 | |
| * | Tabula Rasa HealthCare, Inc. | | | 46,327 | | | | 2,535 | |
| | Teleflex, Inc. | | | 5,796 | | | | 2,110 | |
| * | Veracyte, Inc. | | | 59,332 | | | | 1,537 | |
| | | | | | | | | 35,426 | |
| | Information Technology—17.6% | | | | | | | | |
| | Booz Allen Hamilton Holding Corporation | | | 22,076 | | | | 1,717 | |
| | Brooks Automation, Inc. | | | 49,248 | | | | 2,179 | |
| * | Cree, Inc. | | | 26,513 | | | | 1,569 | |
| | Dolby Laboratories, Inc. | | | 41,170 | | | | 2,712 | |
| | Entegris, Inc. | | | 27,965 | | | | 1,651 | |
| * | Euronet Worldwide, Inc. | | | 26,130 | | | | 2,504 | |
| | j2 Global, Inc. | | | 33,957 | | | | 2,146 | |
| * | Knowles Corporation | | | 117,231 | | | | 1,789 | |
| | MAXIMUS, Inc. | | | 21,870 | | | | 1,541 | |
| * | Nice, Ltd.—ADR | | | 23,348 | | | | 4,418 | |
| | Perspecta, Inc. | | | 111,793 | | | | 2,597 | |
| * | Pure Storage, Inc. | | | 146,510 | | | | 2,539 | |
| * | Rogers Corporation | | | 12,806 | | | | 1,596 | |
| * | SolarEdge Technologies, Inc. | | | 16,499 | | | | 2,290 | |
| * | Verra Mobility Corporation | | | 214,086 | | | | 2,201 | |
| * | WEX, Inc. | | | 9,620 | | | | 1,587 | |
| | | | | | | | | 35,036 | |
| | Industrials—12.6% | | | | | | | | |
| | Armstrong World Industries, Inc. | | | 14,436 | | | | 1,126 | |
| * | Blue Bird Corporation | | | 96,108 | | | | 1,441 | |
| | BWX Technologies, Inc. | | | 89,250 | | | | 5,055 | |
| | Douglas Dynamics, Inc. | | | 49,976 | | | | 1,755 | |
| * | Generac Holdings, Inc. | | | 16,298 | | | | 1,987 | |
| * | IAA, Inc. | | | 34,848 | | | | 1,344 | |
| | John Bean Technologies Corporation | | | 14,124 | | | | 1,215 | |
| | Lincoln Electric Holdings, Inc. | | | 18,103 | | | | 1,525 | |
| | Luxfer Holdings plc† | | | 99,356 | | | | 1,406 | |
| * | Teledyne Technologies, Inc. | | | 3,879 | | | | 1,206 | |
| | The Brink’s Co. | | | 50,504 | | | | 2,299 | |
| | The Toro Co. | | | 20,683 | | | | 1,372 | |
| * | Trex Co., Inc. | | | 25,965 | | | | 3,377 | |
| | | | | | | | | 25,108 | |
| | Financials—12.3% | | | | | | | | |
| | Ares Management Corporation | | | 70,963 | | | | 2,817 | |
| | Arthur J Gallagher & Co. | | | 15,931 | | | | 1,553 | |
| | Cboe Global Markets, Inc. | | | 19,185 | | | | 1,790 | |
| * | Encore Capital Group, Inc. | | | 59,921 | | | | 2,048 | |
| | FirstCash, Inc. | | | 22,858 | | | | 1,542 | |
| | LPL Financial Holdings, Inc. | | | 38,938 | | | | 3,053 | |
| * | SVB Financial Group | | | 18,192 | | | | 3,921 | |
| | Virtu Financial, Inc. | | | 74,059 | | | | 1,748 | |
| | Western Alliance Bancorp | | | 105,753 | | | | 4,005 | |
| | Wintrust Financial Corporation | | | 48,209 | | | | 2,103 | |
| | | | | | | | | 24,580 | |
| | Consumer Discretionary—9.7% | | | | | | | | |
| | Advance Auto Parts, Inc. | | | 29,937 | | | | 4,264 | |
| * | Boot Barn Holdings, Inc. | | | 137,711 | | | | 2,969 | |
| * | Burlington Stores, Inc. | | | 11,936 | | | | 2,351 | |
| | | | Shares or | | | | |
| | | | Principal | | | | |
| | Issuer | | Amount | | | Value | |
| | Common Stocks—(continued) | | | | | | | | |
| | Consumer Discretionary—(continued) | | | | | | | | |
| * | Grand Canyon Education, Inc. | | | 51,904 | | | $ | 4,699 | |
| * | National Vision Holdings, Inc. | | | 87,849 | | | | 2,681 | |
| | Service Corporation International | | | 60,415 | | | | 2,350 | |
| | | | | | | | | 19,314 | |
| | Real Estate—8.1% | | | | | | | | |
| | Americold Realty Trust | | | 92,393 | | | | 3,354 | |
| | CoreSite Realty Corporation | | | 18,135 | | | | 2,195 | |
| | Douglas Emmett, Inc. | | | 87,146 | | | | 2,672 | |
| | Equity LifeStyle Properties, Inc. | | | 39,540 | | | | 2,470 | |
| | Healthcare Realty Trust, Inc. | | | 82,686 | | | | 2,422 | |
| | Jones Lang LaSalle, Inc. | | | 17,405 | | | | 1,801 | |
| | Sunstone Hotel Investors, Inc. | | | 151,385 | | | | 1,234 | |
| | | | | | | | | 16,148 | |
| | Materials—7.0% | | | | | | | | |
| | Avery Dennison Corporation | | | 18,029 | | | | 2,057 | |
| * | Crown Holdings, Inc. | | | 56,044 | | | | 3,650 | |
| | Eagle Materials, Inc. | | | 29,792 | | | | 2,092 | |
| | FMC Corporation | | | 15,797 | | | | 1,574 | |
| | Martin Marietta Materials, Inc. | | | 10,300 | | | | 2,127 | |
| | Orion Engineered Carbons S.A.† | | | 222,757 | | | | 2,359 | |
| | | | | | | | | 13,859 | |
| | Consumer Staples—5.5% | | | | | | | | |
| * | BJ’s Wholesale Club Holdings, Inc. | | | 108,339 | | | | 4,038 | |
| | Lamb Weston Holdings, Inc. | | | 46,008 | | | | 2,941 | |
| | Primo Water Corporation† | | | 144,297 | | | | 1,984 | |
| | Spectrum Brands Holdings, Inc. | | | 42,616 | | | | 1,956 | |
| | | | | | | | | 10,919 | |
| | Communication Services—4.3% | | | | | | | | |
| | Cable One, Inc. | | | 1,270 | | | | 2,254 | |
| * | Live Nation Entertainment, Inc. | | | 41,248 | | | | 1,828 | |
| * | Take-Two Interactive Software, Inc. | | | 13,901 | | | | 1,940 | |
| * | Zynga, Inc. | | | 271,238 | | | | 2,588 | |
| | | | | | | | | 8,610 | |
| | Energy—2.9% | | | | | | | | |
| | Cameco Corporation† | | | 272,737 | | | | 2,796 | |
| * | Oceaneering International, Inc. | | | 129,684 | | | | 829 | |
| | Parsley Energy, Inc. | | | 122,477 | | | | 1,308 | |
| * | Talos Energy, Inc. | | | 88,414 | | | | 813 | |
| | | | | | | | | 5,746 | |
| | Utilities—1.3% | | | | | | | | |
| | IDACORP, Inc. | | | 28,867 | | | | 2,521 | |
| | Total Common Stocks—99.1%
(cost $210,215) | | | | | | | 197,267 | |
| | Repurchase Agreement | | | | | | | | |
| | Fixed Income Clearing Corporation, 0.000% dated 6/30/20, due 7/1/20, repurchase price $2,170, collateralized by U.S. Treasury Note, 1.625%, due 2/15/26, valued at $2,213 | | | $2,170 | | | | 2,170 | |
| | Total Repurchase Agreement—1.1%
(cost $2,170) | | | | | | | 2,170 | |
| | Total Investments—100.2%
(cost $212,385) | | | | | | | 199,437 | |
| | Liabilities, plus cash and other assets—(0.2)% | | | | | | | (339 | ) |
| | Net assets—100.0% | | | | | | $ | 199,098 | |
ADR = American Depository Receipt
* = Non-income producing security
† = U.S. listed foreign security
See accompanying Notes to Financial Statements.
| 16 | Semiannual Report | June 30, 2020 |
| | Small-Mid Cap Growth Fund |
| | |
| | The Small-Mid Cap Growth Fund seeks long-term capital appreciation. |
| | |
| | AN OVERVIEW FROM THE PORTFOLIO MANAGERS |
| | |

Daniel Crowe 
James E. Jones 
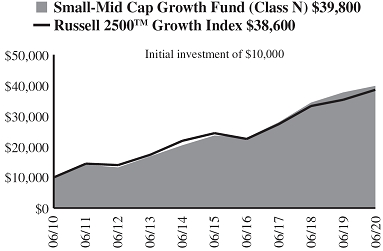
Robert C. Lanphier, IV | The William Blair Small-Mid Cap Growth Fund (Class N shares) posted a 0.67% increase, net of fees, for the six months ended June 30, 2020. By comparison, the Fund’s benchmark index, the Russell 2500TM Growth Index (the “Index”), increased 2.02%. Despite adding value during the first quarter market sell off, the portfolio trailed its benchmark on a year-to-date basis due to a combination of style headwinds and stock specific factors. From a style perspective, year-to-date dynamics were similar to those of the second quarter wherein the most volatile, highest beta and lowest Return on Invested Capital quintiles of the benchmark were the best performers. While these dynamics persisted across our benchmark, we believe that they are exemplified by Biotechnology, which, in the small/mid space, consists mostly of speculative companies without approved products and outperformed year-to-date. Our underweight to these types of companies was a relative headwind. Partly offsetting this headwind was our typical larger market cap profile relative to the Index as the largest stocks in our universe outperformed year-to-date. From a stock specific standpoint, selection in Information Technology, including our position in Euronet Worldwide, and our underweight to the most expensive stocks in the sector (e.g., Software) detracted from relative returns. Top individual stock detractors were Brink’s Company (Industrials), whose COVID-19 related closures weighed on this cash management services provider, most notably as it relates to revenues derived from retail locations that were either temporarily closed or operating on a limited basis, and Live Nation Entertainment (Communication Services), due to the negative impact social-distancing measures had on the company’s ability to conduct live events. Other notable underperforming holdings were Martin Marietta (Materials) and Jones Lang LaSalle (Real Estate). Conversely, top contributors included Horizon Therapeutics (Health Care) and Etsy (Consumer Discretionary), which added new buyers to its platform amid COVID-19 retail disruption, which we believe could sustainably increase longer-term sales potential for the company, as well as BJ’s Wholesale Club (Consumer Staples) and Zynga (Communication Services). Stock selection in Industrials, including our position in Trex Company, also added value. Please refer to the U.S. Growth Market Review and Outlook relating to the Fund on page 3. |
| June 30, 2020 | William Blair Funds | 17 |
Small-Mid Cap Growth Fund
Performance Highlights (Unaudited)
| Average Annual Total Return through 6/30/2020 |
| | | Year
to Date | | 1 Year | | 3 Year | | 5 Year | | 10 Year | | Since
Inception(a) |
| Class N | | | 0.67 | % | | | 5.64 | % | | | 12.47 | % | | | 10.98 | % | | | 14.82 | % | | | — | |
| Class I | | | 0.78 | | | | 5.89 | | | | 12.73 | | | | 11.27 | | | | 15.11 | | | | — | |
| Class R6 | | | 0.81 | | | | 5.96 | | | | — | | | | — | | | | — | | | | 7.73 | % |
| Russell 2500TM Growth Index | | | 2.02 | | | | 9.21 | | | | 12.10 | | | | 9.57 | | | | 14.45 | | | | 9.51 | |
| | |
| (a) | Since inception is for the period from May 2, 2019 (Commencement of Operations) to June 30, 2020. |
Performance cited represents past performance. Past performance does not guarantee future results and current performance may be lower or higher than the data quoted. Results shown are average annual total returns, which assume reinvestment of dividends and capital gains. Investment returns and principal will fluctuate and you may have a gain or loss when you sell shares. For the most current month-end performance information, please call 1-800-742-7272, or visit our Web site at www.williamblairfunds.com. Investing in smaller and medium capitalization companies involves special risks, including higher volatility and lower liquidity. Smaller and medium capitalization stocks are also more sensitive to purchase/sale transactions and changes in the issuer’s financial condition. From time to time, the investment adviser may waive fees or reimburse expenses for the Fund. Without these waivers/reimbursements, performance would be lower. Class N shares are not subject to a sales load. Class I shares are not subject to a sales load or distribution (Rule 12b-1) fees. Class R6 shares are not subject to a sales load, distribution (Rule 12b-1) fees, or sub-transfer agent fees.
The performance highlights and graph presented above do not reflect the deduction of taxes that a shareholder would pay on fund distributions or the redemption of fund shares.
The Russell 2500TM Growth Index measures the performance of those Russell 2500 companies with above average price-to-book ratios and forecasted growth rates.
This report identifies the Fund’s investments on June 30, 2020. These holdings are subject to change. Not all stocks in the Fund performed the same, nor is there any guarantee that these stocks will perform as well in the future. Market forecasts provided in this report may not necessarily come to pass.
Sector Diversification (Unaudited)
The sector diversification shown is based on the total long-term securities.
| 18 | Semiannual Report | June 30, 2020 |
Small-Mid Cap Growth Fund
Portfolio of Investments, June 30, 2020 (all dollar amounts in thousands) (unaudited)
| | | | | | | | |
| | | | | | | | |
| | Issuer | | Shares | | | Value | |
| | | | | | | | |
| | Common Stocks | | | | | | | | |
| | Information Technology—28.1% | | | | | | | | |
| * | Alarm.com Holdings, Inc. | | | 455,200 | | | $ | 29,501 | |
| * | Aspen Technology, Inc. | | | 387,267 | | | | 40,125 | |
| * | Avalara, Inc. | | | 343,615 | | | | 45,732 | |
| | Booz Allen Hamilton Holding Corporation | | | 504,207 | | | | 39,222 | |
| | Brooks Automation, Inc. | | | 773,342 | | | | 34,213 | |
| * | Coupa Software, Inc. | | | 107,222 | | | | 29,705 | |
| * | Cree, Inc. | | | 503,938 | | | | 29,828 | |
| | Entegris, Inc. | | | 384,583 | | | | 22,710 | |
| * | Euronet Worldwide, Inc. | | | 490,562 | | | | 47,006 | |
| * | GoDaddy, Inc. | | | 584,560 | | | | 42,866 | |
| * | j2 Global, Inc. | | | 404,491 | | | | 25,568 | |
| | MAXIMUS, Inc. | | | 283,184 | | | | 19,950 | |
| * | MongoDB, Inc. | | | 130,769 | | | | 29,598 | |
| | National Instruments Corporation | | | 903,275 | | | | 34,966 | |
| * | Nice, Ltd.—ADR | | | 331,492 | | | | 62,731 | |
| * | Novanta, Inc.† | | | 236,981 | | | | 25,302 | |
| | Perspecta, Inc. | | | 997,557 | | | | 23,173 | |
| * | Proofpoint, Inc. | | | 250,218 | | | | 27,804 | |
| * | Pure Storage, Inc. | | | 3,178,226 | | | | 55,079 | |
| * | Rogers Corporation | | | 185,631 | | | | 23,130 | |
| * | SolarEdge Technologies, Inc. | | | 320,680 | | | | 44,504 | |
| * | Varonis Systems, Inc. | | | 287,056 | | | | 25,399 | |
| * | WEX, Inc. | | | 189,785 | | | | 31,316 | |
| | | | | | | | | 789,428 | |
| | Health Care—23.5% | | | | | | | | |
| * | ABIOMED, Inc. | | | 130,971 | | | | 31,637 | |
| * | Amedisys, Inc. | | | 233,952 | | | | 46,449 | |
| | Encompass Health Corporation | | | 927,606 | | | | 57,447 | |
| * | Exact Sciences Corporation | | | 419,811 | | | | 36,499 | |
| * | Halozyme Therapeutics, Inc. | | | 1,466,206 | | | | 39,309 | |
| * | HealthEquity, Inc. | | | 578,815 | | | | 33,959 | |
| * | Horizon Therapeutics plc† | | | 1,596,174 | | | | 88,715 | |
| * | Insulet Corporation | | | 218,635 | | | | 42,472 | |
| * | iRhythm Technologies, Inc. | | | 319,525 | | | | 37,030 | |
| * | Ligand Pharmaceuticals, Inc. | | | 324,998 | | | | 36,351 | |
| * | Masimo Corporation | | | 117,464 | | | | 26,781 | |
| * | Penumbra, Inc. | | | 292,841 | | | | 52,366 | |
| * | Quidel Corporation | | | 113,121 | | | | 25,310 | |
| | STERIS plc† | | | 270,968 | | | | 41,577 | |
| | Teleflex, Inc. | | | 116,521 | | | | 42,411 | |
| * | Veracyte, Inc. | | | 865,726 | | | | 22,422 | |
| | | | | | | | | 660,735 | |
| | Industrials—16.2% | | | | | | | | |
| | BWX Technologies, Inc. | | | 1,540,431 | | | | 87,250 | |
| * | Copart, Inc. | | | 328,757 | | | | 27,376 | |
| * | Generac Holdings, Inc. | | | 225,097 | | | | 27,446 | |
| | HEICO Corporation | | | 355,105 | | | | 28,849 | |
| | Lincoln Electric Holdings, Inc. | | | 246,796 | | | | 20,790 | |
| * | Mercury Systems, Inc. | | | 485,707 | | | | 38,206 | |
| | Ritchie Bros Auctioneers, Inc.† | | | 999,891 | | | | 40,845 | |
| * | Teledyne Technologies, Inc. | | | 147,428 | | | | 45,843 | |
| | The Brink’s Co. | | | 778,699 | | | | 35,439 | |
| | TransUnion | | | 521,267 | | | | 45,371 | |
| * | Trex Co., Inc. | | | 447,224 | | | | 58,170 | |
| | | | | | | | | 455,585 | |
| | Consumer Discretionary—13.1% | | | | | | | | |
| | Advance Auto Parts, Inc. | | | 281,088 | | | | 40,041 | |
| * | Bright Horizons Family Solutions, Inc. | | | 369,018 | | | | 43,249 | |
| | | | Shares or | | | | |
| | | | Principal | | | | |
| | Issuer | | Amount | | | Value | |
| | | | | | | | |
| | Common Stocks—(continued) | | | | | | | | |
| | Consumer Discretionary—(continued) | | | | | | | | |
| * | Burlington Stores, Inc. | | | 209,395 | | | $ | 41,236 | |
| * | Etsy, Inc. | | | 523,572 | | | | 55,619 | |
| * | Grand Canyon Education, Inc. | | | 915,184 | | | | 82,852 | |
| * | Helen of Troy, Ltd.† | | | 157,280 | | | | 29,657 | |
| * | National Vision Holdings, Inc. | | | 904,559 | | | | 27,607 | |
| * | Planet Fitness, Inc. | | | 488,161 | | | | 29,568 | |
| * | Ulta Beauty, Inc. | | | 89,463 | | | | 18,198 | |
| | | | | | | | | 368,027 | |
| | Communication Services—4.9% | | | | | | | | |
| | Cable One, Inc. | | | 26,955 | | | | 47,841 | |
| * | Live Nation Entertainment, Inc. | | | 767,164 | | | | 34,009 | |
| * | Zynga, Inc. | | | 5,775,077 | | | | 55,094 | |
| | | | | | | | | 136,944 | |
| | Materials—4.0% | | | | | | | | |
| * | Crown Holdings, Inc. | | | 774,764 | | | | 50,460 | |
| | Martin Marietta Materials, Inc. | | | 298,916 | | | | 61,747 | |
| | | | | | | | | 112,207 | |
| | Financials—3.2% | | | | | | | | |
| | Ares Management Corporation | | | 647,771 | | | | 25,716 | |
| | FirstCash, Inc. | | | 446,051 | | | | 30,100 | |
| | Virtu Financial, Inc. | | | 1,483,507 | | | | 35,011 | |
| | | | | | | | | 90,827 | |
| | Consumer Staples—3.2% | | | | | | | | |
| * | BJ’s Wholesale Club Holdings, Inc. | | | 1,358,938 | | | | 50,648 | |
| | Lamb Weston Holdings, Inc. | | | 617,165 | | | | 39,455 | |
| | | | | | | | | 90,103 | |
| | Real Estate—1.8% | | | | | | | | |
| | FirstService Corporation† | | | 300,222 | | | | 30,247 | |
| | Jones Lang LaSalle, Inc. | | | 212,565 | | | | 21,992 | |
| | | | | | | | | 52,239 | |
| | Energy—1.1% | | | | | | | | |
| | Cameco Corporation† | | | 3,037,700 | | | | 31,136 | |
| | Total Common Stocks—99.1%
(cost $2,239,412) | | | | | | | 2,787,231 | |
| | | | | | | | | | |
| | Repurchase Agreement | | | | | | | | |
| | Fixed Income Clearing Corporation, 0.000% dated 6/30/20, due 7/1/20, repurchase price $24,418, collateralized by U.S. Treasury Note, 1.625%, due 2/15/26, valued at $24,906 | | $ | 24,418 | | | | 24,418 | |
| | Total Repurchase Agreement—0.9%
(cost $24,418) | | | | | | | 24,418 | |
| | Total Investments—100.0%
(cost $2,263,830) | | | | | | | 2,811,649 | |
| | Liabilities, plus cash and other assets—(0.0)% | | | | | | | (849 | ) |
| | Net assets—100.0% | | | | | | $ | 2,810,800 | |
ADR = American Depository Receipt
* = Non-income producing security
† = U.S. listed foreign security
See accompanying Notes to Financial Statements.
| June 30, 2020 | William Blair Funds | 19 |
| | Small-Mid Cap Value Fund |
| | |
| | The Small-Mid Cap Value Fund seeks long-term capital appreciation. |
| | |
| | AN OVERVIEW FROM THE PORTFOLIO MANAGERS |
| | |

Chad M. Kilmer 
Mark T. Leslie 
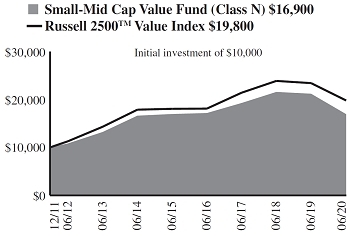
David S. Mitchell | The William Blair Small-Mid Cap Value Fund (Class N shares) posted a 23.89% decrease, net of fees, for the six months ended June 30, 2020. By comparison, the Fund’s benchmark index, the Russell 2500TM Value Index (the “Index”), decreased 21.18%. The relative underperformance of the Fund during the period was the result of stock selection. At the sector level, Energy was the most significant detractor from relative performance due to stock selection within Oil, Gas & Consumable Fuels. More specifically, stock selection within Exploration & Production was the main driver of the relative underperformance within the sector as all Energy sectors were faced with lower commodity prices during the period. The relative underperformance within Health Care, the best performing sector of the market, was driven by the lack of exposure to Biotechnology and Pharmaceutical stocks. The relative outperformance within Technology was the result of strong stock selection within IT Services and Communications Equipment. Looking specifically at stock selection, the Fund’s largest detractors during the period were EPR Properties (Real Estate), Patterson-UTI (Energy) and WPX Energy (Energy). Somewhat offsetting these detractors were our investments in Booz Allen Hamilton (Information Technology), FTI Consulting (Industrials) and Cadence Design Systems (Information Technology). Please refer to the U.S. Value Market Review and Outlook relating to the Fund on page 4. |
| | | |
| 20 | Semiannual Report | June 30, 2020 |
Small-Mid Cap Value Fund
Performance Highlights (Unaudited)
Average Annual Total Return through 6/30/2020
| | | Year | | | | | | | | Since |
| | | to Date | | 1 Year | | 3 Year | | 5 Year | | Inception |
| Class N(a) | | | (23.89 | )% | | | (19.90 | )% | | | (4.73 | )% | | | (0.10 | )% | | | 6.35 | % |
| Class I(a) | | | (23.63 | ) | | | (19.57 | ) | | | (4.43 | ) | | | 0.19 | | | | 6.65 | |
| Russell 2500TM Value Index(a) | | | (21.18 | ) | | | (15.50 | ) | | | (2.60 | ) | | | 1.85 | | | | 8.30 | |
| Class R6(b) | | | (23.81 | ) | | | (19.82 | ) | | | — | | | | — | | | | (18.19 | ) |
| Russell 2500TM Value Index(b) | | | (21.18 | ) | | | (15.50 | ) | | | — | | | | — | | | | (13.98 | ) |
| | |
| (a) | Since inception is for the period from December 15, 2011 (Commencement of Operations) to June 30, 2020. |
| (b) | Since inception is for the period from May 2, 2019 (Commencement of Operations) to June 30, 2020. |
Performance cited represents past performance. Past performance does not guarantee future results and current performance may be lower or higher than the data quoted. Results shown are average annual total returns, which assume reinvestment of dividends and capital gains. Investment returns and principal will fluctuate and you may have a gain or loss when you sell shares. For the most current month-end performance information, please call 1-800-742-7272, or visit our Web site at www.williamblairfunds.com. Investing in smaller and medium capitalization companies involves special risks, including higher volatility and lower liquidity. Smaller and medium capitalization stocks are also more sensitive to purchase/sale transactions and changes in the issuer’s financial condition. From time to time, the investment adviser may waive fees or reimburse expenses for the Fund. Without these waivers/reimbursements, performance would be lower. Class N shares are not subject to a sales load. Class I shares are not subject to a sales load or distribution (Rule 12b-1) fees. Class R6 shares are not subject to a sales load, distribution (Rule 12b-1) fees, or sub-transfer agent fees.
The performance highlights and graph presented above do not reflect the deduction of taxes that a shareholder would pay on fund distributions or the redemption of fund shares.
The Russell 2500TM Value Index consists of small to mid-capitalization companies with below average price-to-book ratios and forecasted growth rates.
This report identifies the Fund’s investments on June 30, 2020. These holdings are subject to change. Not all stocks in the Fund performed the same, nor is there any guarantee that these stocks will perform as well in the future. Market forecasts provided in this report may not necessarily come to pass.
Sector Diversification (Unaudited)

The sector diversification shown is based on the total long-term securities.
| June 30, 2020 | William Blair Funds | 21 |
Small-Mid Cap Value Fund
Portfolio of Investments, June 30, 2020 (all dollar amounts in thousands) (unaudited)
| | | | | | |
| | | | | | |
| | Issuer | | Shares | | | Value | |
| | | | | | | | | | |
| | Common Stocks | | | | | | | | |
| | Financials—18.8% | | | | | | | | |
| | American Financial Group, Inc. | | | 159 | | | $ | 10 | |
| | CNO Financial Group, Inc. | | | 736 | | | | 11 | |
| | East West Bancorp, Inc. | | | 394 | | | | 14 | |
| | First American Financial Corporation | | | 288 | | | | 14 | |
| | FNB Corporation | | | 1,525 | | | | 11 | |
| | Hancock Whitney Corporation | | | 497 | | | | 11 | |
| | Home BancShares, Inc. | | | 849 | | | | 13 | |
| | National Bank Holdings Corporation | | | 426 | | | | 12 | |
| | PacWest Bancorp | | | 769 | | | | 15 | |
| | Radian Group, Inc. | | | 806 | | | | 13 | |
| | Selective Insurance Group, Inc. | | | 331 | | | | 17 | |
| * | SVB Financial Group | | | 69 | | | | 15 | |
| | The Hanover Insurance Group, Inc. | | | 178 | | | | 18 | |
| | Umpqua Holdings Corporation | | | 1,379 | | | | 15 | |
| | Voya Financial, Inc. | | | 419 | | | | 20 | |
| | Western Alliance Bancorp | | | 450 | | | | 17 | |
| | | | | | | | | 226 | |
| | Industrials—17.0% | | | | | | | | |
| | Brady Corporation | | | 510 | | | | 24 | |
| | Curtiss-Wright Corporation | | | 210 | | | | 19 | |
| * | FTI Consulting, Inc. | | | 171 | | | | 20 | |
| | IDEX Corporation | | | 195 | | | | 31 | |
| | Kansas City Southern | | | 163 | | | | 24 | |
| | Simpson Manufacturing Co., Inc. | | | 255 | | | | 21 | |
| | The Toro Co. | | | 364 | | | | 24 | |
| | Watts Water Technologies, Inc. | | | 186 | | | | 15 | |
| | Westinghouse Air Brake Technologies Corporation | | | 448 | | | | 26 | |
| | | | | | | | | 204 | |
| | Real Estate—12.8% | | | | | | | | |
| | American Assets Trust, Inc. | | | 619 | | | | 17 | |
| | American Campus Communities, Inc. | | | 372 | | | | 13 | |
| | Americold Realty Trust | | | 424 | | | | 15 | |
| | CoreSite Realty Corporation | | | 47 | | | | 6 | |
| | Douglas Emmett, Inc. | | | 581 | | | | 18 | |
| | Equity LifeStyle Properties, Inc. | | | 359 | | | | 22 | |
| | Healthcare Realty Trust, Inc. | | | 783 | | | | 23 | |
| | Life Storage, Inc. | | | 222 | | | | 21 | |
| | Terreno Realty Corporation | | | 358 | | | | 19 | |
| | | | | | | | | 154 | |
| | Consumer Discretionary—12.0% | | | | | | | | |
| * | Deckers Outdoor Corporation | | | 89 | | | | 18 | |
| | Dunkin’ Brands Group, Inc. | | | 319 | | | | 21 | |
| * | Helen of Troy, Ltd.† | | | 112 | | | | 21 | |
| * | Murphy USA, Inc. | | | 149 | | | | 17 | |
| | PulteGroup, Inc. | | | 600 | | | | 20 | |
| | Service Corporation International | | | 445 | | | | 17 | |
| | Strategic Education, Inc. | | | 73 | | | | 11 | |
| * | TopBuild Corporation | | | 167 | | | | 19 | |
| | | | | | | | | 144 | |
| | | | | | |
| | | | | | |
| | Issuer | | Shares | | | Value | |
| | | | | | | | | | |
| | Common Stocks—(continued) | | | | | | | | |
| | Information Technology—8.5% | | | | | | | | |
| * | Arista Networks, Inc. | | | 75 | | | $ | 16 | |
| | Booz Allen Hamilton Holding Corporation | | | 212 | | | | 16 | |
| * | Cadence Design Systems, Inc. | | | 177 | | | | 17 | |
| * | Ciena Corporation | | | 380 | | | | 21 | |
| * | Inphi Corporation | | | 104 | | | | 12 | |
| | MAXIMUS, Inc. | | | 291 | | | | 21 | |
| | | | | | | | | 103 | |
| | Health Care—6.8% | | | | | | | | |
| * | Bio-Rad Laboratories, Inc. | | | 29 | | | | 13 | |
| | CONMED Corporation | | | 147 | | | | 11 | |
| | Encompass Health Corporation | | | 295 | | | | 18 | |
| * | Hologic, Inc. | | | 332 | | | | 19 | |
| | PerkinElmer, Inc. | | | 214 | | | | 21 | |
| | | | | | | | | 82 | |
| | Materials—6.3% | | | | | | | | |
| | FMC Corporation | | | 264 | | | | 26 | |
| | PolyOne Corporation | | | 509 | | | | 13 | |
| | Sensient Technologies Corporation | | | 208 | | | | 11 | |
| | Silgan Holdings, Inc. | | | 351 | | | | 11 | |
| | Steel Dynamics, Inc. | | | 556 | | | | 15 | |
| | | | | | | | | 76 | |
| | Utilities—4.4% | | | | | | | | |
| | Alliant Energy Corporation | | | 334 | | | | 16 | |
| | Atmos Energy Corporation | | | 192 | | | | 19 | |
| | IDACORP, Inc. | | | 208 | | | | 18 | |
| | | | | | | | | 53 | |
| | Consumer Staples—3.8% | | | | | | | | |
| * | BJ’s Wholesale Club Holdings, Inc. | | | 326 | | | | 12 | |
| | Casey’s General Stores, Inc. | | | 40 | | | | 6 | |
| | J&J Snack Foods Corporation | | | 98 | | | | 12 | |
| | Lamb Weston Holdings, Inc. | | | 248 | | | | 16 | |
| | | | | | | | | 46 | |
| | Energy—3.8% | | | | | | | | |
| * | CNX Resources Corporation | | | 897 | | | | 8 | |
| | Diamondback Energy, Inc. | | | 269 | | | | 11 | |
| | Helmerich & Payne, Inc. | | | 308 | | | | 6 | |
| | Parsley Energy, Inc. | | | 849 | | | | 9 | |
| | Valero Energy Corporation | | | 196 | | | | 12 | |
| | | | | | | | | 46 | |
| | Communication Services—3.1% | | | | | | | | |
| | The Interpublic Group of Cos., Inc. | | | 1,310 | | | | 23 | |
| * | Zynga, Inc. | | | 1,499 | | | | 14 | |
| | | | | | | | | 37 | |
| | Total Common Stocks—97.3%
(cost $996) | | | | | | | 1,171 | |
| | Total Investments—97.3%
(cost $996) | | | | | | | 1,171 | |
| | Cash and other assets, less liabilities—2.7% | | | | | | | 33 | |
| | Net assets—100.0% | | | | | | $ | 1,204 | |
* = Non-income producing security
† = U.S. listed foreign security
See accompanying Notes to Financial Statements.
| 22 | Semiannual Report | June 30, 2020 |
| | Small Cap Growth Fund |
| | |
| | The Small Cap Growth Fund seeks long-term capital appreciation. |
| | |
| | AN OVERVIEW FROM THE PORTFOLIO MANAGERS |
| | |

Michael P. Balkin 
Ward D. Sexton | The William Blair Small Cap Growth Fund (Class N shares) posted a 2.88% decrease, net of fees, for the six months ended June 30, 2020. By comparison, the Fund’s benchmark index, the Russell 2000® Growth Index (the “Index”), decreased 3.06%. As a result of adding value during the first quarter market sell off, the Fund outperformed its benchmark on a year-to-date basis primarily driven by stock specific factors. Top individual contributors for the period were Etsy (Consumer Discretionary) and Horizon Therapeutics (Health Care). E-commerce marketplace Etsy added new buyers to its platform amid COVID-19 retail disruption, which we believe could sustainably increase longer-term sales potential for the company. Horizon Therapeutics benefitted from robust growth of the company’s newly launched drug Tepezza, as well as broad based strength across the rest of the business. Other top performers included Simulations Plus (Health Care), Virtu Financial (Financials) and Avalara (Information Technology). Conversely, top detractors were Hanger (Health Care), as demand for orthotic and prosthetic services paused amid the COVID-19 outbreak, and Brink’s Company (Industrials). COVID-19 related closures weighed on Brink’s Company, most notably as it relates to revenues derived from retail locations that were either temporarily closed or operating on a limited basis. Other laggards included Laureate Education (Consumer Discretionary), Boot Barn (Consumer Discretionary) and Euronet Worldwide (Information Technology). From a style perspective, year-to-date dynamics were similar to those of the second quarter wherein our typical underweights to Biotechnology and the most expensive stocks in the benchmark were headwinds. Please refer to the U.S. Growth Market Review and Outlook relating to the Fund on page 3. |
| | |
| June 30, 2020 | William Blair Funds | 23 |
Small Cap Growth Fund
Performance Highlights (Unaudited)
| Average Annual Total Return through 6/30/2020 |
| | | Year
to Date | | 1 Year | | 3 Year | | 5 Year | | 10 Year | | Since
Inception(a) |
| Class N | | | (2.88 | )% | | | (0.21 | )% | | | 8.44 | % | | | 10.12 | % | | | 12.47 | % | | | — | |
| Class I | | | (2.73 | ) | | | 0.04 | | | | 8.72 | | | | 10.40 | | | | 12.75 | | | | — | |
| Class R6 | | | (2.72 | ) | | | 0.08 | | | | — | | | | — | | | | — | | | | (0.05 | )% |
| Russell 2000® Growth Index | | | (3.06 | ) | | | 3.48 | | | | 7.86 | | | | 6.86 | | | | 12.92 | | | | 3.65 | |
| | | | | | | | | | | | | | | | | | | | | | | | | |
| (a) | Since inception is for the period from May 2, 2019 (Commencement of Operations) to June 30, 2020. |
Performance cited represents past performance. Past performance does not guarantee future results and current performance may be lower or higher than the data quoted. Results shown are average annual total returns, which assume reinvestment of dividends and capital gains. Investment returns and principal will fluctuate and you may have a gain or loss when you sell shares. For the most current month-end performance information, please call 1-800-742-7272, or visit our Web site at www.williamblairfunds.com. Investing in smaller companies involves special risks, including higher volatility and lower liquidity. Smaller capitalization stocks are also more sensitive to purchase/sale transactions and changes in the issuer’s financial condition. From time to time, the investment adviser may waive fees or reimburse expenses for the Fund. Without these waivers/reimbursements, performance would be lower. Class N shares are not subject to a sales load. Class I shares are not subject to a sales load or distribution (Rule 12b-1) fees. Class R6 shares are not subject to a sales load, distribution (Rule 12b-1) fees, or sub-transfer agent fees.
The performance highlights and graph presented above do not reflect the deduction of taxes that a shareholder would pay on fund distributions or the redemption of fund shares.
The Russell 2000® Growth Index is an unmanaged composite of the smallest 2000 stocks of the Russell 3000® Growth Index.
This report identifies the Fund’s investments on June 30, 2020. These holdings are subject to change. Not all stocks in the Fund performed the same, nor is there any guarantee that these stocks will perform as well in the future. Market forecasts provided in this report may not necessarily come to pass.
Sector Diversification (Unaudited)
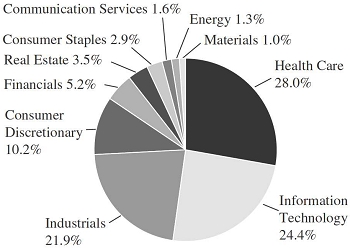
The sector diversification shown is based on the total long-term securities.
| 24 | Semiannual Report | June 30, 2020 |
Small Cap Growth Fund
Portfolio of Investments, June 30, 2020 (all dollar amounts in thousands) (unaudited)
| | | | | | | | |
| | | | | | | | |
| | Issuer | | Shares | | | Value | |
| | | | | | | | |
| | Common Stocks | | | | | | | | |
| | Health Care—27.2% | | | | | | | | |
| * | Aerie Pharmaceuticals, Inc. | | | 432,011 | | | $ | 6,376 | |
| * | Amedisys, Inc. | | | 26,965 | | | | 5,354 | |
| * | AxoGen, Inc. | | | 313,450 | | | | 2,896 | |
| * | CareDx, Inc. | | | 76,478 | | | | 2,710 | |
| * | Codexis, Inc. | | | 426,428 | | | | 4,861 | |
| * | CryoLife, Inc. | | | 241,042 | | | | 4,621 | |
| | Encompass Health Corporation | | | 104,631 | | | | 6,480 | |
| * | GenMark Diagnostics, Inc. | | | 198,750 | | | | 2,923 | |
| * | Halozyme Therapeutics, Inc. | | | 292,920 | | | | 7,853 | |
| * | Hanger, Inc. | | | 384,270 | | | | 6,363 | |
| * | Health Catalyst, Inc. | | | 206,878 | | | | 6,035 | |
| * | HealthEquity, Inc. | | | 64,495 | | | | 3,784 | |
| * | Horizon Therapeutics plc† | | | 139,152 | | | | 7,734 | |
| * | Insmed, Inc. | | | 257,880 | | | | 7,102 | |
| * | iRhythm Technologies, Inc. | | | 61,895 | | | | 7,173 | |
| * | LHC Group, Inc. | | | 41,533 | | | | 7,240 | |
| * | Ligand Pharmaceuticals, Inc. | | | 73,918 | | | | 8,268 | |
| * | Merit Medical Systems, Inc. | | | 155,490 | | | | 7,098 | |
| * | Penumbra, Inc. | | | 38,243 | | | | 6,839 | |
| * | Quidel Corporation | | | 19,025 | | | | 4,257 | |
| | Simulations Plus, Inc. | | | 110,270 | | | | 6,596 | |
| * | Tabula Rasa HealthCare, Inc. | | | 98,084 | | | | 5,368 | |
| * | Twist Bioscience Corporation | | | 175,586 | | | | 7,954 | |
| * | Veracyte, Inc. | | | 205,860 | | | | 5,332 | |
| | | | | | | | | 141,217 | |
| | Information Technology—23.6% | | | | | | | | |
| * | Agilysys, Inc. | | | 244,605 | | | | 4,388 | |
| * | Alarm.com Holdings, Inc. | | | 128,390 | | | | 8,321 | |
| | American Software, Inc. | | | 239,650 | | | | 3,777 | |
| * | Avalara, Inc. | | | 40,898 | | | | 5,443 | |
| | Brooks Automation, Inc. | | | 142,815 | | | | 6,318 | |
| | Computer Services, Inc. | | | 98,029 | | | | 5,245 | |
| * | Euronet Worldwide, Inc. | | | 52,830 | | | | 5,062 | |
| * | Grid Dynamics Holdings, Inc. | | | 706,991 | | | | 4,878 | |
| * | Inphi Corporation | | | 38,870 | | | | 4,567 | |
| * | j2 Global, Inc. | | | 88,912 | | | | 5,620 | |
| * | Knowles Corporation | | | 268,830 | | | | 4,102 | |
| | Littelfuse, Inc. | | | 35,313 | | | | 6,026 | |
| * | LivePerson, Inc. | | | 95,347 | | | | 3,950 | |
| * | Novanta, Inc.† | | | 34,220 | | | | 3,654 | |
| * | PDF Solutions, Inc. | | | 150,872 | | | | 2,951 | |
| | Perspecta, Inc. | | | 261,440 | | | | 6,073 | |
| * | Pure Storage, Inc. | | | 467,276 | | | | 8,098 | |
| * | Qualys, Inc. | | | 34,220 | | | | 3,560 | |
| * | Rogers Corporation | | | 29,897 | | | | 3,725 | |
| * | SiTime Corporation | | | 125,468 | | | | 5,948 | |
| * | SolarEdge Technologies, Inc. | | | 31,760 | | | | 4,408 | |
| * | Varonis Systems, Inc. | | | 50,890 | | | | 4,503 | |
| * | Verra Mobility Corporation | | | 502,749 | | | | 5,168 | |
| * | WNS Holdings, Ltd.—ADR | | | 122,092 | | | | 6,713 | |
| | | | | | | | | 122,498 | |
| | | | | | | | |
| | | | | | | | |
| | Issuer | | Shares | | | Value | |
| | | | | | | | |
| | Common Stocks—(continued) | | | | | | | | |
| | Industrials—21.3% | | | | | | | | |
| | Albany International Corporation | | | 91,435 | | | $ | 5,368 | |
| | Armstrong World Industries, Inc. | | | 27,653 | | | | 2,156 | |
| * | Blue Bird Corporation | | | 260,441 | | | | 3,904 | |
| | BWX Technologies, Inc. | | | 213,529 | | | | 12,094 | |
| * | Casella Waste Systems, Inc. | | | 166,720 | | | | 8,689 | |
| | Douglas Dynamics, Inc. | | | 151,413 | | | | 5,318 | |
| * | Ducommun, Inc. | | | 234,279 | | | | 8,169 | |
| | ESCO Technologies, Inc. | | | 47,906 | | | | 4,050 | |
| * | Forrester Research, Inc. | | | 132,993 | | | | 4,261 | |
| * | IAA, Inc. | | | 90,070 | | | | 3,474 | |
| | John Bean Technologies Corporation | | | 52,830 | | | | 4,544 | |
| | Lincoln Electric Holdings, Inc. | | | 45,170 | | | | 3,805 | |
| | Luxfer Holdings plc† | | | 391,695 | | | | 5,543 | |
| * | Mercury Systems, Inc. | | | 83,936 | | | | 6,602 | |
| * | PAE, Inc. | | | 886,258 | | | | 8,473 | |
| | Ritchie Bros Auctioneers, Inc.† | | | 149,475 | | | | 6,106 | |
| | The Brink’s Co. | | | 193,406 | | | | 8,802 | |
| * | Trex Co., Inc. | | | 44,350 | | | | 5,769 | |
| * | Willdan Group, Inc. | | | 123,108 | | | | 3,079 | |
| | | | | | | | | 110,206 | |
| | Consumer Discretionary—9.9% | | | | | | | | |
| | Aaron’s, Inc. | | | 161,297 | | | | 7,323 | |
| * | Boot Barn Holdings, Inc. | | | 371,924 | | | | 8,019 | |
| * | Etsy, Inc. | | | 48,512 | | | | 5,153 | |
| * | Grand Canyon Education, Inc. | | | 99,812 | | | | 9,036 | |
| * | Laureate Education, Inc. | | | 610,423 | | | | 6,083 | |
| | Lithia Motors, Inc. | | | 34,749 | | | | 5,258 | |
| * | National Vision Holdings, Inc. | | | 244,468 | | | | 7,461 | |
| * | Revolve Group, Inc. | | | 187,800 | | | | 2,791 | |
| | | | | | | | | 51,124 | |
| | Financials—5.1% | | | | | | | | |
| * | Encore Capital Group, Inc. | | | 127,105 | | | | 4,344 | |
| | FirstCash, Inc. | | | 105,118 | | | | 7,093 | |
| | Home BancShares, Inc. | | | 233,931 | | | | 3,598 | |
| | LPL Financial Holdings, Inc. | | | 55,850 | | | | 4,379 | |
| * | Open Lending Corporation | | | 246,467 | | | | 3,722 | |
| | Virtu Financial, Inc. | | | 132,666 | | | | 3,131 | |
| | | | | | | | | 26,267 | |
| | Real Estate—3.3% | | | | | | | | |
| | Colliers International Group, Inc.† | | | 110,408 | | | | 6,327 | |
| | CoreSite Realty Corporation | | | 26,004 | | | | 3,148 | |
| | FirstService Corporation† | | | 78,427 | | | | 7,902 | |
| | | | | | | | | 17,377 | |
| | Consumer Staples— 2.8% | | | | | | | | |
| * | BJ’s Wholesale Club Holdings, Inc. | | | 196,830 | | | | 7,336 | |
| * | Darling Ingredients, Inc. | | | 288,180 | | | | 7,095 | |
| | | | | | | | | 14,431 | |
| | Communication Services—1.6% | | | | | | | | |
| * | QuinStreet, Inc. | | | 784,860 | | | | 8,209 | |
See accompanying Notes to Financial Statements.
| June 30, 2020 | William Blair Funds | 25 |
Small Cap Growth Fund
Portfolio of Investments, June 30, 2020 (all dollar amounts in thousands) (unaudited)
| | | | Shares or | | | | |
| | | | Principal | | | | |
| | Issuer | | Amount | | | Value | |
| | | | | | | | |
| | Common Stocks—(continued) | | | | | | | | |
| | Energy—1.3% | | | | | | | | |
| | Cameco Corporation† | | | 497,960 | | | $ | 5,104 | |
| | Parsley Energy, Inc. | | | 140,160 | | | | 1,497 | |
| | | | | | | | | 6,601 | |
| | Materials—1.0% | | | | | | | | |
| | Orion Engineered Carbons S.A.† | | | 482,417 | | | | 5,109 | |
| | Total Common Stocks—97.1%
(cost $419,618) | | | | | | | 503,039 | |
| | | | | | | | | | |
| | Repurchase Agreement | | | | | | | | |
| | Fixed Income Clearing Corporation, 0.000% dated 6/30/20, due 7/1/20, repurchase price $10,600, collateralized by U.S. Treasury Note, 1.625%, due 2/15/26, valued at $10,812 | | | $10,600 | | | | 10,600 | |
| | Total Repurchase Agreement—2.0%
(cost $10,600) | | | | | | | 10,600 | |
| | Total Investments—99.1%
(cost $430,218) | | | | | | | 513,639 | |
| | Cash and other assets, less liabilities—0.9% | | | | | | | 4,549 | |
| | Net assets—100.0% | | | | | | $ | 518,188 | |
ADR = American Depository Receipt
* = Non-income producing security
† = U.S. listed foreign security
See accompanying Notes to Financial Statements.
| 26 | Semiannual Report | June 30, 2020 |
| | Small Cap Value Fund |
| | |
| | The Small Cap Value Fund seeks long-term capital appreciation. |
| | |
| | AN OVERVIEW FROM THE PORTFOLIO MANAGERS |
| | |

Chad M. Kilmer 
Mark T. Leslie 
David S. Mitchell | The William Blair Small Cap Value Fund (Class N shares) posted a 26.37% decrease, net of fees, for the six months ended June 30, 2020. By comparison, the Fund’s benchmark index, the Russell 2000® Value Index (the “Index”), decreased 23.50%. The relative underperformance of the Fund during the period was the result of stock selection. At the sector level, Health Care was the most significant detractor from relative performance due to the Fund’s lack of exposure to Biotechnology. This lack of exposure more than offset positive stock selection within Health Care Providers & Services. The relative underperformance within Energy, the worst performing sector of the market, was primarily due to stock selection within Oil, Gas & Consumable Fuels; more specifically, stock selection within Exploration & Production. Within Consumer Discretionary, stock selection within Hotels, Restaurants & Leisure and the lack of exposure to Internet & Direct Marketing Retail contributed to the relative underperformance within the sector. The relative outperformance within Industrials was due to broad-based stock selection throughout most industries. Within the sector, stock selection within Professional Services and Commercial Services & Supplies were the main contributors to relative returns. Within Communication Services, our lack of exposure to Media stocks was the main contributor to relative performance within the sector. Looking specifically at stock selection, the Fund’s largest detractors during the period were EPR Properties (Real Estate), Pebblebrook Hotel Trust (Real Estate) and Helix Energy Solutions (Energy). More than offsetting these detractors were our investments in Inphi (Information Technology), FTI Consulting (Industrials) and Americold Realty Trust (Real Estate). Please refer to the U.S. Value Market Review and Outlook relating to the Fund on page 4. |
| June 30, 2020 | William Blair Funds | 27 |
Small Cap Value Fund
Performance Highlights (Unaudited)
| Average Annual Total Return through 6/30/2020 |
| | | Year
to Date | | 1 Year | | 3 Year | | 5 Year | | 10 Year | | Since
Inception(a) |
| Class N | | | (26.37 | )% | | | (23.93 | )% | | | (7.00 | )% | | | (1.15 | )% | | | 6.54 | % | | | — | |
| Class I | | | (26.34 | ) | | | (23.77 | ) | | | (6.78 | ) | | | (0.91 | ) | | | 6.80 | | | | — | |
| Class R6 | | | (26.27 | ) | | | (23.70 | ) | | | — | | | | — | | | | — | | | | (21.26 | )% |
| Russell 2000® Value Index | | | (23.50 | ) | | | (17.48 | ) | | | (4.35 | ) | | | 1.26 | | | | 7.82 | | | | (16.29 | ) |
| (a) | Since inception is for the period from May 2, 2019 (Commencement of Operations) to June 30, 2020. |
Performance cited represents past performance. Past performance does not guarantee future results and current performance may be lower or higher than the data quoted. Results shown are average annual total returns, which assume reinvestment of dividends and capital gains. Investment returns and principal will fluctuate and you may have a gain or loss when you sell shares. For the most current month-end performance information, please call 1-800-742-7272, or visit our Web site at www.williamblairfunds.com. Investing in smaller companies involves special risks, including higher volatility and lower liquidity. Smaller capitalization stocks are also more sensitive to purchase/sale transactions and changes in the issuer’s financial condition. From time to time, the investment adviser may waive fees or reimburse expenses for the Fund. Without these waivers/reimbursements, performance would be lower. Class N shares are not subject to a sales load. Class I shares are not subject to a sales load or distribution (Rule 12b-1) fees. Class R6 shares are not subject to a sales load, distribution (Rule 12b-1) fees, or sub-transfer agent fees.
The performance highlights and graph presented above do not reflect the deduction of taxes that a shareholder would pay on fund distributions or the redemption of fund shares.
The Russell 2000® Value Index consists of small-capitalization companies with below average price-to-book ratios and forecasted growth rates.
This report identifies the Fund’s investments on June 30, 2020. These holdings are subject to change. Not all stocks in the Fund performed the same, nor is there any guarantee that these stocks will perform as well in the future. Market forecasts provided in this report may not necessarily come to pass.
| Sector Diversification (Unaudited) |

The sector diversification shown is based on the total long-term securities.
| 28 | Semiannual Report | June 30, 2020 |
Small Cap Value Fund
Portfolio of Investments, June 30, 2020 (all dollar amounts in thousands) (unaudited)
| | | | | | | | |
| | | | | | | | |
| | Issuer | | Shares | | | Value | |
| | | | | | | | |
| | Common Stocks | | | | | | | | |
| | Financials—25.7% | | | | | | | | |
| | Banc of California, Inc. | | | 72,707 | | | $ | 787 | |
| | Banner Corporation | | | 27,015 | | | | 1,027 | |
| | Boston Private Financial Holdings, Inc. | | | 165,828 | | | | 1,141 | |
| | CNO Financial Group, Inc. | | | 80,449 | | | | 1,253 | |
| | First American Financial Corporation | | | 15,030 | | | | 722 | |
| | FNB Corporation | | | 143,203 | | | | 1,074 | |
| | Glacier Bancorp, Inc. | | | 37,339 | | | | 1,318 | |
| | Hancock Whitney Corporation | | | 63,422 | | | | 1,345 | |
| | Home BancShares, Inc. | | | 97,368 | | | | 1,497 | |
| | Horace Mann Educators Corporation | | | 34,835 | | | | 1,279 | |
| | National Bank Holdings Corporation | | | 41,179 | | | | 1,112 | |
| | OceanFirst Financial Corporation | | | 59,417 | | | | 1,048 | |
| | PacWest Bancorp | | | 52,074 | | | | 1,026 | |
| | Radian Group, Inc. | | | 99,958 | | | | 1,550 | |
| | Renasant Corporation | | | 40,152 | | | | 1,000 | |
| | Sandy Spring Bancorp, Inc. | | | 41,682 | | | | 1,033 | |
| * | Seacoast Banking Corporation of Florida | | | 59,525 | | | | 1,214 | |
| | Selective Insurance Group, Inc. | | | 32,715 | | | | 1,725 | |
| | The Hanover Insurance Group, Inc. | | | 14,371 | | | | 1,456 | |
| | Umpqua Holdings Corporation | | | 100,507 | | | | 1,069 | |
| | Western Alliance Bancorp | | | 40,400 | | | | 1,530 | |
| | | | | | | | | 25,206 | |
| | Industrials—16.2% | | | | | | | | |
| | Brady Corporation | | | 53,892 | | | | 2,523 | |
| | Curtiss-Wright Corporation | | | 17,259 | | | | 1,541 | |
| | ESCO Technologies, Inc. | | | 18,227 | | | | 1,541 | |
| | Federal Signal Corporation | | | 33,151 | | | | 986 | |
| * | FTI Consulting, Inc. | | | 14,049 | | | | 1,609 | |
| * | Gibraltar Industries, Inc. | | | 31,650 | | | | 1,519 | |
| * | Saia, Inc. | | | 13,526 | | | | 1,504 | |
| | Simpson Manufacturing Co., Inc. | | | 17,985 | | | | 1,517 | |
| | UniFirst Corporation | | | 8,417 | | | | 1,506 | |
| | Watts Water Technologies, Inc. | | | 20,863 | | | | 1,690 | |
| | | | | | | | | 15,936 | |
| | Real Estate—10.6% | | | | | | | | |
| | Agree Realty Corporation | | | 20,415 | | | | 1,342 | |
| | American Assets Trust, Inc. | | | 40,306 | | | | 1,122 | |
| | Americold Realty Trust | | | 33,785 | | | | 1,226 | |
| | CoreSite Realty Corporation | | | 7,185 | | | | 870 | |
| | Healthcare Realty Trust, Inc. | | | 62,401 | | | | 1,828 | |
| | Highwoods Properties, Inc. | | | 29,549 | | | | 1,103 | |
| | Life Storage, Inc. | | | 16,050 | | | | 1,524 | |
| | Terreno Realty Corporation | | | 26,889 | | | | 1,415 | |
| | | | | | | | | 10,430 | |
| | Consumer Discretionary—10.5% | | | | | | | | |
| * | Adtalem Global Education, Inc. | | | 31,930 | | | | 995 | |
| | Carter’s, Inc. | | | 10,181 | | | | 822 | |
| * | Cavco Industries, Inc. | | | 7,162 | | | | 1,381 | |
| * | Deckers Outdoor Corporation | | | 6,525 | | | | 1,281 | |
| | Dunkin’ Brands Group, Inc. | | | 16,100 | | | | 1,050 | |
| * | Helen of Troy, Ltd.† | | | 6,750 | | | | 1,273 | |
| * | Monarch Casino & Resort, Inc. | | | 16,886 | | | | 576 | |
| * | Murphy USA, Inc. | | | 6,510 | | | | 733 | |
| | Strategic Education, Inc. | | | 5,585 | | | | 858 | |
| * | TopBuild Corporation | | | 11,860 | | | | 1,349 | |
| | | | | | | | | 10,318 | |
| | | | | | | | |
| | | | | | | | |
| | Issuer | | Shares | | | Value | |
| | | | | | | | |
| | Common Stocks—(continued) | | | | | | | | |
| | Information Technology—6.5% | | | | | | | | |
| * | Inphi Corporation | | | 6,148 | | | $ | 722 | |
| * | j2 Global, Inc. | | | 13,482 | | | | 852 | |
| * | LiveRamp Holdings, Inc. | | | 21,924 | | | | 931 | |
| | MAXIMUS, Inc. | | | 18,177 | | | | 1,281 | |
| | Perspecta, Inc. | | | 38,610 | | | | 897 | |
| * | Semtech Corporation | | | 14,141 | | | | 739 | |
| * | Viavi Solutions, Inc. | | | 77,817 | | | | 991 | |
| | | | | | | | | 6,413 | |
| | Health Care—6.5% | | | | | | | | |
| | CONMED Corporation | | | 24,021 | | | | 1,729 | |
| | Encompass Health Corporation | | | 30,309 | | | | 1,877 | |
| * | Integer Holdings Corporation | | | 23,029 | | | | 1,682 | |
| * | Magellan Health, Inc. | | | 14,876 | | | | 1,086 | |
| | | | | | | | | 6,374 | |
| | Utilities—6.1% | | | | | | | | |
| | Black Hills Corporation | | | 24,582 | | | | 1,393 | |
| | Chesapeake Utilities Corporation | | | 913 | | | | 77 | |
| | IDACORP, Inc. | | | 14,463 | | | | 1,264 | |
| | ONE Gas, Inc. | | | 22,805 | | | | 1,757 | |
| | PNM Resources, Inc. | | | 38,565 | | | | 1,482 | |
| | | | | | | | | 5,973 | |
| | Materials—5.5% | | | | | | | | |
| | Carpenter Technology Corporation | | | 36,769 | | | | 893 | |
| | Minerals Technologies, Inc. | | | 24,069 | | | | 1,130 | |
| | PolyOne Corporation | | | 38,674 | | | | 1,014 | |
| | Sensient Technologies Corporation | | | 19,022 | | | | 992 | |
| | Silgan Holdings, Inc. | | | 42,332 | | | | 1,371 | |
| | | | | | | | | 5,400 | |
| | Energy—4.5% | | | | | | | | |
| | Archrock, Inc. | | | 127,747 | | | | 829 | |
| | Brigham Minerals, Inc. Class “A” | | | 75,155 | | | | 928 | |
| | Cactus, Inc. Class “A” | | | 26,305 | | | | 543 | |
| * | CNX Resources Corporation | | | 57,995 | | | | 502 | |
| * | Dril-Quip, Inc. | | | 11,480 | | | | 342 | |
| | HollyFrontier Corporation | | | 24,565 | | | | 717 | |
| * | PDC Energy, Inc. | | | 45,200 | | | | 562 | |
| | | | | | | | | 4,423 | |
| | Consumer Staples—4.3% | | | | | | | | |
| * | BJ’s Wholesale Club Holdings, Inc. | | | 27,765 | | | | 1,035 | |
| | Casey’s General Stores, Inc. | | | 4,695 | | | | 702 | |
| * | Darling Ingredients, Inc. | | | 59,876 | | | | 1,474 | |
| | J&J Snack Foods Corporation | | | 7,670 | | | | 975 | |
| | | | | | | | | 4,186 | |
| | Communication Services—1.1% | | | | | | | | |
| | The Interpublic Group of Cos., Inc. | | | 26,795 | | | | 460 | |
| * | Zynga, Inc. | | | 60,995 | | | | 582 | |
| | | | | | | | | 1,042 | |
| | Total Common Stocks—97.5%
(cost $83,626) | | | | | | | 95,701 | |
See accompanying Notes to Financial Statements.
| June 30, 2020 | William Blair Funds | 29 |
Small Cap Value Fund
Portfolio of Investments, June 30, 2020 (all dollar amounts in thousands) (unaudited)
| | | | | | | | |
| | | | Principal | | | | |
| | Issuer | | Amount | | | Value | |
| | | | | | | | |
| | Repurchase Agreement | | | | | | |
| | Fixed Income Clearing Corporation, 0.000% dated 6/30/20, due 7/1/20, repurchase price $2,128, collateralized by U.S. Treasury Note, 1.625%, due 2/15/26, valued at $2,170 | | | $2,128 | | | $ | 2,128 | |
| | Total Repurchase Agreement—2.2%
(cost $2,128) | | | | | | | 2,128 | |
| | Total Investments—99.7%
(cost $85,754) | | | | | | | 97,829 | |
| | Cash and other assets, less liabilities—0.3% | | | | | | | 285 | |
| | Net assets—100.0% | | | | | | $ | 98,114 | |
* = Non-income producing security
† = U.S. listed foreign security
See accompanying Notes to Financial Statements.
| 30 | Semiannual Report | June 30, 2020 |
Global Markets Review and Outlook
Global equities rebounded strongly and market volatility moderated in the second quarter as the MSCI ACWI IMI advanced 19.83% - recovering a significant portion of the pandemic-induced selloff during March. While concerns over the economic impact of the coronavirus remain, investors were encouraged by the massive stimulus measures from governments and central banks. Significant monetary and fiscal responses coupled with the gradual resumption of business activity led to a broad equity rally across both developed and emerging markets.
U.S. equities strengthened during the second quarter (MSCI USA IMI +22.10%) despite the precipitous decline in economic activity, which included a significant rise in unemployment claims. The U.S. unemployment rate reached a record high in April of 14.7% before falling back to 11.1% as of June 30 amid the gradual reopening of businesses across the country. Despite the extraordinary amount of tools used by the Federal Reserve (Fed), Chairman Powell maintained his commitment not to follow the path of other central banks and introduce negative policy rates.
European equities advanced during the quarter (MSCI Europe ex-UK IMI +18.45%) with major countries indicating progress towards lowering the rate of new coronavirus infections. German equities surged (+26.75%) on the announcement from Chancellor Angela Merkel that efforts were being made to inject a second stimulus package into the economy. Autos and other manufacturers rallied on the news. Across other primary developed markets, the UK (+8.77%) and Japan (+11.82%) were notable laggards during the quarter.
Emerging markets rebounded in the second quarter (MSCI EM IMI +18.93%), driven by strength in South Africa (+26.78%), Brazil (+23.83%) and Taiwan (+23.38%). After depreciating significantly in the first quarter, emerging market currencies such as the South African Rand and the Mexican Peso stabilized in the second quarter. China underperformed on a relative basis (+15.22%) amid a reescalation of political tensions with the U.S., as the Senate passed legislation that would potentially ban Chinese companies from listing on American exchanges.
Following the peak of the pandemic and related lock-down, economic activity accelerated strongly in June in China, Europe and the U.S., including both manufacturing and services. Our preferred supply side indicator - orders in excess of inventories-registered double-digit improvement in the Euro Area and is already back to positive territory in the U.S. Crucially, a rebound in new orders drove the improvement. Unprecedented fiscal support efforts, combined with healthy corporate and household balance sheets at the start of the pandemic-induced recession, point to a continued strong sequential recovery, although we do not expect either GDP or corporate profits to recover to pre-pandemic levels this year.
China, Europe and the U.S. followed somewhat different approaches to containing the spread of the virus. These differences may impact the recovery trajectory and speed in each of these major global demand centers, with the U.S. lagging and likely to continue to fall behind given the resurgence of cases.
The market recovery we have seen has been driven by liquidity. Major central banks acted early and decisively, such that periods of funding stress typical in acute and sudden recession were fleeting. Domestic financial conditions are normalizing rapidly and both the U.S. Fed and Europe’s ECB have assured the markets that they will remain committed to eliminating pockets of funding stress wherever necessary. In China, the People’s Bank of China has aggressively increased liquidity provisions, such that the total credit impulse in the economy is now among the strongest we have seen in a decade. Importantly, funding conditions remain adequate for the vast majority of Emerging Market economies, supported by ample dollar liquidity and lower oil prices.
From a corporate performance perspective, new economy digital business models proved more defensive and more resilient amid the pandemic-induced collapse in economic activity. While the majority of S&P 500 companies saw year-on-year revenue declines in excess of 10%, the fastest growers clocked in double digit gains. This widening performance differential is particularly interesting to us as investors in industry leading growth companies.
While valuation multiples appear inflated due to depressed earnings, this is largely consistent with historical recovery environments. Looking forward, however, successful containment of the virus, combined with improving prospects for an effective vaccine, are likely to pave the way for a broadening of market leadership to include more traditional cyclical companies as their earnings begin to stabilize and reaccelerate. This will be the ultimate catalyst to see a style reversal in the market, where the valuation differentials of high growth companies relative to all others will likely compress. We are monitoring this closely.
| June 30, 2020 | William Blair Funds | 31 |
Global Markets Review and Outlook (continued)
Given that backdrop and this period of high uncertainty, we are focused on understanding the durability of the competitive advantage of those “digital winners”, trying to understand the nature of the acceleration of their growth; and how much of that future success is priced into the stocks. Electronic payments are a key focus area in that context.
On the other hand, we are also interested in some of the more compelling structural growth companies in cyclical industries who have been particularly impacted by the economic slowdown. While there may be limited visibility in sight, many of these stocks remain quite depressed and may represent a significant valuation as well as growth opportunity when activity normalizes. We believe that air travel and aerospace manufacturing companies are good examples.
| 32 | Semiannual Report | June 30, 2020 |
| | Global Leaders Fund |
| | |
| | The Global Leaders Fund seeks long-term capital appreciation. |
| | |
| | AN OVERVIEW FROM THE PORTFOLIO MANAGERS |
| | |

Andrew G. Flynn 
Kenneth J. McAtamney | The William Blair Global Leaders Fund (Class N shares) posted a 2.21% increase, net of fees, for the six months ended June 30, 2020. By comparison, the Fund’s benchmark index, the MSCI All Country World IMI Index (net) (the “Index”), decreased 7.06%. Six-month outperformance versus the Index was primarily driven by positive stock selection across most sectors. The Industrials, Financials and Health Care sectors were the most significant contributors to relative return. Within Industrials, Nihon M&A Center propelled relative performance as the company’s pipeline of deals and capacity to manage them has continued to expand. Nihon M&A Center is a high-quality Japanese growth company that provides advisory services to small and medium sized businesses facing succession-oriented challenges, which is common given Japan’s aging demographics. It is led by an entrepreneurial management team that has built an attractive network of national relationships aimed at identifying buyers and sellers and sourcing transactions, and the growth outlook remains robust. BlackRock, the asset management industry leader within the Financials sector, was an additional source of outperformance. Its first quarter results were resilient, reflecting the company’s diverse business model, scale, tech-enabled platform and broad product offering. These factors underpin its ability to generate strong net flows, a key value driver. The business has low capital intensity with high cash generation that is returned to shareholders via dividends and share buybacks. Within the Health Care, Lonza Group helped relative performance. Lonza is a leader in custom manufacturing of biopharmaceuticals and specialty ingredients. Business trends remain strong, particularly in its pharma biotech segment amid the COVID-19 pandemic. Lonza offers highly visible growth, and given the strong market demand for outsourced biopharma production and related services, we remain confident they can deliver on growth in the future. Partially offsetting these effects was an overweight to Industrials, coupled with below average stock selection within the Consumer Discretionary sector. Within Consumer Discretionary, Compass Group and Fevertree Drinks weighed on relative returns. Compass is the global leader in outsourced foodservice and other support services to private businesses, schools and colleges, hospitals, and in remote environments. It is benefiting from the ongoing trend toward outsourcing foodservice and hospitality services globally. Given the COVID-19 pandemic, the narrative around contract caterers is fairly negative due to work from home dynamics, social distancing, and a challenging macro backdrop. However, as volumes recover and people gain comfort that the business model remains intact, we expect the stock will reflect the long-term earnings power of the business. We believe that current estimates do not account for an acceleration of market share gains as business may shift away from competitors with weaker offerings, the demand for outsourcing likely increasing due to health and safety concerns, or any upside from M&A, which we anticipate the company will take an active role in. Fevertree Drinks produced in-line results in the first quarter but suffered a decline in its stock price due to the COVID-19 pandemic. Fevertree produces premium mixers, including tonic water, ginger beer, cola and lemonade. We believe that the company should experience rapid growth due its expanding geographic presence, increased product mix, and the trend towards premium spirits. Please refer to the Global Markets Review and Outlook relating to the Fund beginning on page 31. |
| June 30, 2020 | William Blair Funds | 33 |
Global Leaders Fund
Performance Highlights (Unaudited)
| Average Annual Total Return through 6/30/2020 |
| | | Year
to Date | | 1 Year | | 3 Year | | 5 Year | | 10 Year | | Since
Inception |
| Class N | | | 2.21 | % | | | 11.45 | % | | | 12.16 | % | | | 9.61 | % | | | 11.65 | % | | | — | |
| Class I | | | 2.34 | | | | 11.68 | | | | 12.46 | | | | 9.93 | | | | 11.94 | | | | — | |
| MSCI ACW IMI (net) | | | (7.06 | ) | | | 1.17 | | | | 5.55 | | | | 6.11 | | | | 9.10 | | | | — | |
| Class R6(a) | | | 2.41 | | | | 11.81 | | | | 12.55 | | | | 10.00 | | | | — | | | | 10.56 | % |
| MSCI ACW IMI (net)(a) | | (7.06 | ) | | | 1.17 | | | | 5.55 | | | | 6.11 | | | | — | | | | 7.90 | |
| (a) | Since inception is for the period from December 19, 2012 (Commencement of Operations) to June 30, 2020. |
Performance cited represents past performance. Past performance does not guarantee future results and current performance may be lower or higher than the data quoted. Results shown are average annual total returns, which assume reinvestment of dividends and capital gains. Investment returns and principal will fluctuate and you may have a gain or loss when you sell shares. For the most current month-end performance information, please call 1-800-742-7272, or visit our Web site at www.williamblairfunds.com. Investing in smaller and medium capitalization companies involves special risks, including higher volatility and lower liquidity. Smaller and medium capitalization stocks are also more sensitive to purchase/sale transactions and changes in the issuer’s financial condition. International investing involves special risk considerations, including currency fluctuations, lower liquidity, economic and political risk. From time to time, the investment adviser may waive fees or reimburse expenses for the Fund. Without these waivers/reimbursements, performance would be lower. Class N shares are not subject to a sales load. Class I shares are not subject to a sales load or distribution (Rule 12b-1) fees. Class R6 shares are not subject to a sales load, distribution (Rule 12b-1) fees, or sub-transfer agent fees.
The performance highlights and graph presented above do not reflect the deduction of taxes that a shareholder would pay on fund distributions or the redemption of fund shares.
The Morgan Stanley Capital International (MSCI) All Country World (ACW) Investable Market Index (IMI) (net) is a free float-adjusted market capitalization weighted index that is designed to measure the equity market of developed and emerging markets. This index approximates the minimum possible dividend reinvestment by deducting for the highest possible withholding tax rates of those markets.
This report identifies the Fund’s investments on June 30, 2020. These holdings are subject to change. Not all stocks in the Fund performed the same, nor is there any guarantee that these stocks will perform as well in the future. Market forecasts provided in this report may not necessarily come to pass.
Sector Diversification (Unaudited)

The sector diversification shown is based on the total long-term securities.
| 34 | Semiannual Report | June 30, 2020 |
Global Leaders Fund
Portfolio of Investments, June 30, 2020 (all dollar amounts in thousands) (unaudited)
| | | | | | | | |
| | | | | | | | |
| | Issuer | | Shares | | | Value | |
| | |
| | Common Stocks | | | | | | | | |
| | |
| | Western Hemisphere—51.4% | | | | | | | | |
| | Canada—2.8% | | | | | | | | |
| | Brookfield Asset Management, Inc. Class “A” (Capital markets)† | | | 34,147 | | | $ | 1,123 | |
| * | Lululemon Athletica, Inc. (Textiles, apparel & luxury goods) | | | 5,040 | | | | 1,573 | |
| | | | | | | | | 2,696 | |
| | United States—48.6% | | | | | | | | |
| * | Adobe, Inc. (Software) | | | 4,875 | | | | 2,122 | |
| * | Alphabet, Inc. Class “A” (Interactive Media & Services) | | | 2,265 | | | | 3,212 | |
| * | Amazon.com, Inc. (Internet & direct marketing retail) | | | 1,571 | | | | 4,334 | |
| | BlackRock, Inc. (Capital markets) | | | 2,656 | | | | 1,445 | |
| * | CoStar Group, Inc. (Professional services) . | | | 1,510 | | | | 1,073 | |
| * | Edwards Lifesciences Corporation (Health care equipment & supplies) | | | 15,452 | | | | 1,068 | |
| * | Facebook, Inc. Class “A” (Interactive Media & Services) | | | 11,608 | | | | 2,636 | |
| | Fidelity National Information Services, Inc. (IT services) | | | 12,211 | | | | 1,637 | |
| * | IDEXX Laboratories, Inc. (Health care equipment & supplies) | | | 3,741 | | | | 1,235 | |
| * | Illumina, Inc. (Life sciences tools & services) | | | 1,777 | | | | 658 | |
| | Intercontinental Exchange, Inc. (Capital markets) | | | 14,998 | | | | 1,374 | |
| * | Intuitive Surgical, Inc. (Health care equipment & supplies) | | | 1,663 | | | | 948 | |
| | JPMorgan Chase & Co. (Banks) | | | 13,558 | | | | 1,275 | |
| | Lockheed Martin Corporation (Aerospace & defense) | | | 3,399 | | | | 1,240 | |
| | Mastercard, Inc. Class “A” (IT services) | | | 8,763 | | | | 2,591 | |
| | NextEra Energy, Inc. (Electric utilities) | | | 3,705 | | | | 890 | |
| | NIKE, Inc. Class “B” (Textiles, apparel & luxury goods) | | | 14,365 | | | | 1,408 | |
| * | PayPal Holdings, Inc. (IT services) | | | 11,742 | | | | 2,046 | |
| | Prologis, Inc. (Equity REIT) | | | 11,205 | | | | 1,046 | |
| | Roper Technologies, Inc. (Industrial conglomerates) | | | 4,002 | | | | 1,554 | |
| * | salesforce.com, Inc. (Software) | | | 12,624 | | | | 2,365 | |
| | The Estee Lauder Cos., Inc. Class “A” (Personal products) | | | 7,146 | | | | 1,348 | |
| | Thermo Fisher Scientific, Inc. (Life sciences tools & services) | | | 3,914 | | | | 1,418 | |
| * | Ulta Beauty, Inc. (Specialty retail) | | | 5,673 | | | | 1,154 | |
| | Union Pacific Corporation (Road & rail) | | | 8,622 | | | | 1,458 | |
| | UnitedHealth Group, Inc. (Health care providers & services) | | | 6,430 | | | | 1,897 | |
| * | Veeva Systems, Inc. Class “A” (Health care technology) | | | 3,046 | | | | 714 | |
| * | Workday, Inc. (Software) | | | 8,628 | | | | 1,617 | |
| | Zoetis, Inc. (Pharmaceuticals) | | | 10,000 | | | | 1,370 | |
| | | | | | | | | 47,133 | |
| | | | | | | | |
| | | | | | | | |
| | Issuer | | Shares | | | Value | |
| | |
| | Common Stocks—(continued) | | | | | | | | |
| | | | | | | | | | |
| | Europe—21.5% | | | | | | | | |
| | Denmark—4.0% | | | | | | | | |
| | Chr Hansen Holding A/S (Chemicals) | | | 10,421 | | | $ | 1,075 | |
| | DSV PANALPINA A/S (Air freight & logistics) | | | 11,497 | | | | 1,404 | |
| | Novo Nordisk A/S Class “B” (Pharmaceuticals) | | | 21,388 | | | | 1,384 | |
| | | | | | | | | 3,863 | |
| | France—3.2% | | | | | | | | |
| * | Airbus SE (Aerospace & defense) | | | 21,092 | | | | 1,505 | |
| | LVMH Moet Hennessy Louis Vuitton SE (Textiles, apparel & luxury goods) | | | 3,734 | | | | 1,638 | |
| | | | | | | | | 3,143 | |
| | Germany—3.8% | | | | | | | | |
| | Infineon Technologies AG (Semiconductors & semiconductor equipment) | | | 83,090 | | | | 1,949 | |
| * | MTU Aero Engines AG (Aerospace & defense) | | | 6,855 | | | | 1,187 | |
| | Rational AG (Machinery) | | | 897 | | | | 502 | |
| | | | | | | | | 3,638 | |
| | Ireland—2.3% | | | | | | | | |
| | Allegion plc (Building products)† | | | 7,737 | | | | 791 | |
| | Aptiv plc (Auto components)† | | | 18,491 | | | | 1,441 | |
| | | | | | | | | 2,232 | |
| | Netherlands—1.0% | | | | | | | | |
| * | Adyen N.V. (IT services) | | | 670 | | | | 975 | |
| | | | | | | | | | |
| | Sweden—4.1% | | | | | | | | |
| | Atlas Copco AB Class “A” (Machinery) | | | 40,691 | | | | 1,723 | |
| * | Hexagon AB Class “B” (Electronic equipment, instruments & components) | | | 29,517 | | | | 1,723 | |
| * | Indutrade AB (Trading companies & distributors) | | | 14,042 | | | | 555 | |
| | | | | | | | | 4,001 | |
| | Switzerland—3.1% | | | | | | | | |
| | Lonza Group AG (Life sciences tools & services) | | | 2,820 | | | | 1,489 | |
| | Partners Group Holding AG (Capital markets) | | | 1,722 | | | | 1,562 | |
| | | | | | | | | 3,051 | |
| | | | | | | | | | |
| | Emerging Asia—9.5% | | | | | | | | |
| | China—6.1% | | | | | | | | |
| * | Alibaba Group Holding, Ltd. (Internet & direct marketing retail) | | | 98,344 | | | | 2,659 | |
| | Shenzhou International Group Holdings, Ltd. (Textiles, apparel & luxury goods) | | | 49,300 | | | | 594 | |
| | Tencent Holdings, Ltd. (Interactive Media & Services) | | | 41,000 | | | | 2,638 | |
| | | | | | | | | 5,891 | |
See accompanying Notes to Financial Statements.
| June 30, 2020 | William Blair Funds | 35 |
Global Leaders Fund
Portfolio of Investments, June 30, 2020 (all dollar amounts in thousands) (unaudited)
| | | | | | | | |
| | | | | | | | |
| | Issuer | | Shares | | | Value | |
| | |
| | Common Stocks—(continued) | | | | | | | | |
| | |
| | Emerging Asia—(continued) | | | | | | | | |
| | India—1.0% | | | | | | | | |
| | HDFC Bank, Ltd.—ADR (Banks) | | | 21,493 | | | $ | 977 | |
| | | | | | | | | | |
| | Taiwan—2.4% | | | | | | | | |
| | Taiwan Semiconductor Manufacturing Co., Ltd.—ADR (Semiconductors & semiconductor equipment) | | | 41,252 | | | | 2,342 | |
| | |
| | Japan—6.4% | | | | | | | | |
| | Daikin Industries, Ltd. (Building products) | | | 9,700 | | | | 1,558 | |
| | Keyence Corporation (Electronic equipment, instruments & components) | | | 4,300 | | | | 1,793 | |
| | Nihon M&A Center, Inc. (Professional services) | | | 35,900 | | | | 1,619 | |
| | SMC Corporation (Machinery) | | | 2,500 | | | | 1,278 | |
| | | | | | | | | 6,248 | |
| | |
| | Asia—5.4% | | | | | | | | |
| | Australia—3.2% | | | | | | | | |
| | Aristocrat Leisure, Ltd. (Hotels, restaurants & leisure) | | | 54,343 | | | | 956 | |
| * | Atlassian Corporation plc Class “A” (Software)† | | | 5,001 | | | | 902 | |
| | CSL, Ltd. (Biotechnology) | | | 6,450 | | | | 1,277 | |
| | | | | | | | | 3,135 | |
| | Hong Kong—1.6% | | | | | | | | |
| | AIA Group, Ltd. (Insurance) | | | 170,200 | | | | 1,588 | |
| | | | | | | | | | |
| | New Zealand—0.6% | | | | | | | | |
| | Fisher & Paykel Healthcare Corp., Ltd. (Health care equipment & supplies) | | | 24,254 | | | | 557 | |
| | |
| | United Kingdom—3.4% | | | | | | | | |
| | Compass Group plc (Hotels, restaurants & leisure) | | | 81,449 | | | | 1,122 | |
| | Experian plc (Professional services) | | | 27,603 | | | | 964 | |
| | Halma plc (Electronic equipment, instruments & components) | | | 15,731 | | | | 449 | |
| | Rentokil Initial plc (Commercial services & supplies) | | | 116,783 | | | | 738 | |
| | | | | | | | | 3,273 | |
| | |
| | Emerging Latin America—1.7% | | | | | | | | |
| | Argentina—1.7% | | | | | | | | |
| * | Globant S.A. (Software)† | | | 5,785 | | | | 867 | |
| * | MercadoLibre, Inc. (Internet & direct marketing retail) | | | 753 | | | | 742 | |
| | | | | | | | | 1,609 | |
| | Total Common Stocks—99.3%
(cost $63,702) | | | | | | | 96,352 | |
| | | | | | | | |
| | Issuer | | Principal
Amount | | | Value | |
| | |
| | Repurchase Agreement | | | | | | | | |
| | Fixed Income Clearing Corporation, 0.000% dated 6/30/20, due 7/1/20, repurchase price $658, collateralized by U.S. Treasury Note, 1.625%, due 2/15/26, valued at $671 | | $ | 658 | | | $ | 658 | |
| | Total Repurchase Agreement—0.7%
(cost $658) | | | | | | | 658 | |
| | Total Investments—100.0%
(cost $64,360) | | | | | | | 97,010 | |
| | Cash and other assets, less liabilities—0.0% | | | | | | | 25 | |
| | Net assets—100.0% | | | | | | $ | 97,035 | |
ADR = American Depository Receipt
REIT = Real Estate Investment Trust
† = U.S. listed foreign security
* = Non-income producing security
For securities primarily traded on exchanges or markets that close before the close of regular trading on the New York Stock Exchange, the Fund may use an independent pricing service to fair value price the securities pursuant to Valuation Procedures approved by the Board of Trustees.
At June 30, 2020, the Fund’s Portfolio of Investments includes the following industry categories (as a percentage of long-term investments):
| Information Technology | | 24.3 | % |
| Industrials | | 19.9 | % |
| Consumer Discretionary | | 18.3 | % |
| Health Care | | 14.5 | % |
| Financials | | 9.7 | % |
| Communication Services | | 8.8 | % |
| Consumer Staples | | 1.4 | % |
| Materials | | 1.1 | % |
| Real Estate | | 1.1 | % |
| Utilities | | 0.9 | % |
| Total | | 100.0 | % |
At June 30, 2020, the Fund’s Portfolio of Investments includes the following currency categories (as a percentage of long-term investments):
| U.S. Dollar | | 60.1 | % |
| Euro | | 8.0 | % |
| Hong Kong Dollar | | 7.8 | % |
| Japanese Yen | | 6.5 | % |
| Swedish Krona | | 4.1 | % |
| Danish Krone | | 4.0 | % |
| British Pound Sterling | | 3.4 | % |
| Swiss Franc | | 3.2 | % |
| Australian Dollar | | 2.3 | % |
| All Other Currencies | | 0.6 | % |
| Total | | 100.0 | % |
See accompanying Notes to Financial Statements.
| 36 | Semiannual Report | June 30, 2020 |
| | International Leaders Fund |
| | |
| | The International Leaders Fund seeks long-term capital appreciation. |
| | |
| | AN OVERVIEW FROM THE PORTFOLIO MANAGERS |
| | |

Simon Fennell 
Kenneth J. McAtamney | The William Blair International Leaders Fund (Class N shares) posted a 1.27% decrease, net of fees, for the six months ended June 30, 2020. By comparison, the Fund’s benchmark index, the MSCI All Country World ex-U.S. IMI (net) (the “Index”), decreased 11.24%. Six-month outperformance versus the Index was primarily driven by positive stock selection across most sectors. The Financials, Consumer Discretionary and Communication Services sectors were the most notable sources of relative return. Within Financials, London Stock Exchange Group (LSE) aided relative returns as the company’s share price appreciated on the back of strong operating results. LSE stands out with approximately 65% of revenue from more durable non-transaction driven businesses with exposure to secular growth trends including passive investing and OTC clearing. Integration planning for the Refinitiv transaction is progressing well and LSE has committed to achieving completion in 2020. We believe the company should deliver mid-teens earnings growth over the next few years driven by high single-digit revenue growth and margin expansion. Within Consumer Discretionary, TAL Education Group, a leading tutoring services provider in China with a strong brand and significant growth opportunities, was an additional source of outperformance. With brands known for improving student performance, TAL should continue to be a consolidator in the highly fragmented industry due to strong execution and scalable technology. Within the Communication Services sector, Chinese online companies NetEase and Tencent were additional sources of outperformance. Both companies reported better-than-expected results and have benefited from positive investor sentiment related to the slowing of the pandemic within China as well as the resilient nature of their business models. Partially offsetting these effects was an overweight allocation to the U.K. and below average stock selection within the Consumer Staples sector. Within Consumer Staples, Nestle and Diageo hurt relative performance. The relative underperformance from Nestle was a result of it not being owned in the Fund during the COVID-19 pandemic. The defensive nature of the business often leads it to perform well during periods of significant economic disruption, as was the case in the first half of 2020. Diageo, a global leader in spirits, has seen significant disruption in Greater China due to the pandemic. The share price decline rebounded since bottoming in the first quarter, but did not keep up with broad market. Please refer to the Global Markets Review and Outlook relating to the Fund beginning on page 31. |
| June 30, 2020 | William Blair Funds | 37 |
International Leaders Fund
Performance Highlights (Unaudited)
| Average Annual Total Return through 6/30/2020 |
| | | Year
to Date | | 1 Year | | 3 Year | | 5 Year | | Since
Inception |
| Class N(a) | | | (1.27 | )% | | | 7.64 | % | | | 8.43 | % | | | 7.85 | % | | | 8.95 | % |
| Class I(a) | | | (1.16 | ) | | | 7.93 | | | | 8.72 | | | | 8.12 | | | | 9.22 | |
| MSCI ACW Ex-U.S. IMI (net)(a) | | | (11.24 | ) | | | (4.74 | ) | | | 0.96 | | | | 2.30 | | | | 4.54 | |
| Class R6(b) | | | (1.10 | ) | | | 7.97 | | | | 8.79 | | | | 8.21 | | | | 9.26 | |
| MSCI ACW Ex-U.S. IMI (net)(b) | | | (11.24 | ) | | | (4.74 | ) | | | 0.96 | | | | 2.30 | | | | 4.15 | |
| (a) | Since inception is for the period from August 16, 2012 (Commencement of Operations) to June 30, 2020. |
| (b) | Since inception is for the period from November 2, 2012 (Commencement of Operations) to June 30, 2020. |
Performance cited represents past performance. Past performance does not guarantee future results and current performance may be lower or higher than the data quoted. Results shown are average annual returns, which assume reinvestment of dividends and capital gains. Investment returns and principal will fluctuate and you may have a gain or loss when you sell shares. For the most current month-end performance information, please call 1-800-742-7272, or visit our Web site at www.williamblairfunds.com. Investing in smaller and medium capitalization companies involves special risks, including higher volatility and lower liquidity. Smaller and medium capitalization stocks are also more sensitive to purchase/sale transactions and changes in the issuer’s financial condition. International investing involves special risk considerations, including currency fluctuations, lower liquidity, economic and political risk. From time to time the investment adviser may waive fees or reimburse expenses for the Fund. Without these waivers/reimbursements, performance would be lower. Class N shares are not subject to a sales load. Class I shares are not subject to a sales load or distribution (Rule 12b-1) fees. Class R6 shares are not subject to a sales load, distribution (Rule 12b-1) fees, or sub-transfer agent fees.
The performance highlights presented above do not reflect the deduction of taxes that a shareholder would pay on fund distributions or the redemption of fund shares.
The Morgan Stanley Capital International (MSCI) All Country World (ACW) Ex-U.S. Investable Market Index (IMI) (net) is a free float-adjusted market capitalization weighted index that is designed to measure the equity market performance of developed and emerging markets, excluding the United States. This index approximates the minimum possible dividend reinvestment by deducting for the highest possible withholding tax rates of those markets.
This report identifies the Fund’s investments on June 30, 2020. These holdings are subject to change. Not all stocks in the Fund performed the same, nor is there any guarantee that these stocks will perform as well in the future. Market forecasts provided in this report may not necessarily come to pass.
Sector Diversification (Unaudited)
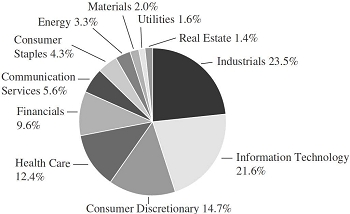
The sector diversification shown is based on the total long-term securities.
| 38 | Semiannual Report | June 30, 2020 |
International Leaders Fund
Portfolio of Investments, June 30, 2020 (all dollar amounts in thousands) (unaudited)
| | | | | | | | |
| | | | | | | | |
| | Issuer | | Shares | | | Value | |
| | | | | | | | |
| | Common Stocks | | | | | | | | |
| | | | | | | | | | |
| | Europe—43.4% | | | | | | | | |
| | Denmark—6.9% | | | | | | | | |
| | Chr Hansen Holding A/S (Chemicals) | | | 32,359 | | | $ | 3,337 | |
| | Coloplast A/S Class “B” (Health care equipment & supplies) | | | 80,191 | | | | 12,429 | |
| | DSV PANALPINA A/S (Air freight & logistics) | | | 57,433 | | | | 7,012 | |
| | Novo Nordisk A/S Class “B” (Pharmaceuticals) | | | 192,526 | | | | 12,465 | |
| | Orsted A/S (Electric utilities) | | | 92,038 | | | | 10,621 | |
| | | | | | | | | 45,864 | |
| | Finland—1.1% | | | | | | | | |
| | Neste Oyj (Oil, gas & consumable fuels) | | | 191,662 | | | | 7,496 | |
| | France—9.7% | | | | | | | | |
| * | Airbus SE (Aerospace & defense) | | | 105,603 | | | | 7,536 | |
| | Capgemini SE (IT services) | | | 92,447 | | | | 10,589 | |
| * | L’Oreal S.A. (Personal products) | | | 33,438 | | | | 10,733 | |
| | LVMH Moet Hennessy Louis Vuitton SE (Textiles, apparel & luxury goods) | | | 44,000 | | | | 19,304 | |
| * | Safran S.A. (Aerospace & defense) | | | 99,997 | | | | 10,024 | |
| | Teleperformance (Professional services) | | | 24,692 | | | | 6,267 | |
| | | | | | | | | 64,453 | |
| | Germany—5.9% | | | | | | | | |
| | Infineon Technologies AG (Semiconductors & semiconductor equipment) | | | 597,745 | | | | 14,019 | |
| | Rational AG (Machinery) | | | 12,617 | | | | 7,065 | |
| | SAP SE (Software) | | | 102,595 | | | | 14,330 | |
| * | TeamViewer AG (Software) | | | 64,325 | | | | 3,512 | |
| | | | | | | | | 38,926 | |
| | Ireland—2.0% | | | | | | | | |
| | Kingspan Group plc (Building products) | | | 200,288 | | | | 12,905 | |
| | Luxembourg—0.4% | | | | | | | | |
| | Tenaris S.A. (Energy equipment & services) | | | 353,977 | | | | 2,286 | |
| | Netherlands—2.9% | | | | | | | | |
| * | Adyen N.V. (IT services) | | | 9,655 | | | | 14,053 | |
| | ASML Holding N.V. (Semiconductors & semiconductor equipment) | | | 14,637 | | | | 5,375 | |
| | | | | | | | | 19,428 | |
| | Spain—1.2% | | | | | | | | |
| | Amadeus IT Group S.A. (IT services) | | | 150,093 | | | | 7,821 | |
| | Sweden—4.4% | | | | | | | | |
| | Atlas Copco AB Class “A” (Machinery) | | | 352,008 | | | | 14,906 | |
| * | Hexagon AB Class “B” (Electronic equipment, instruments & components) | | | 246,367 | | | | 14,383 | |
| | | | | | | | | 29,289 | |
| | | | | | | | |
| | | | | | | | |
| | Issuer | | Shares | | | Value | |
| | | | | | | | |
| | Common Stocks—(continued) | | | | | | | | |
| | | | | | | | | | |
| | Europe—(continued) | | | | | | | | |
| | Switzerland—8.9% | | | | | | | | |
| | Lonza Group AG (Life sciences tools & services) | | | 29,482 | | | $ | 15,565 | |
| | Partners Group Holding AG (Capital markets) | | | 12,161 | | | | 11,031 | |
| | Sika AG (Chemicals) | | | 52,856 | | | | 10,173 | |
| | Straumann Holding AG (Health care equipment & supplies) | | | 12,999 | | | | 11,168 | |
| | Temenos AG (Software) | | | 71,540 | | | | 11,111 | |
| | | | | | | | | 59,048 | |
| | | | | | | | | | |
| | Emerging Asia—18.3% | | | | | | | | |
| | China—12.9% | | | | | | | | |
| * | Alibaba Group Holding, Ltd. (Internet & direct marketing retail) | | | 871,256 | | | | 23,562 | |
| | China Merchants Bank Co., Ltd. Class “H” (Banks) | | | 2,169,000 | | | | 9,977 | |
| | NetEase, Inc.—ADR (Entertainment) | | | 29,744 | | | | 12,771 | |
| * | TAL Education Group—ADR (Diversified consumer services) | | | 219,637 | | | | 15,019 | |
| | Tencent Holdings, Ltd. (Interactive Media & Services) | | | 375,800 | | | | 24,176 | |
| | | | | | | | | 85,505 | |
| | India—2.9% | | | | | | | | |
| | Housing Development Finance Corporation, Ltd. (Thrifts & mortgage finance) | | | 309,844 | | | | 7,227 | |
| | Reliance Industries, Ltd. (Oil, gas & consumable fuels) | | | 511,664 | | | | 11,571 | |
| * | Reliance Industries, Ltd. (Oil, gas & consumable fuels) | | | 36,741 | | | | 389 | |
| | | | | | | | | 19,187 | |
| | Taiwan—2.5% | | | | | | | | |
| | Taiwan Semiconductor Manufacturing Co., Ltd. (Semiconductors & semiconductor equipment) | | | 1,576,000 | | | | 16,719 | |
| | | | | | | | | | |
| | United Kingdom—14.7% | | | | | | | | |
| | Abcam plc (Biotechnology) | | | 171,279 | | | | 2,829 | |
| | Ashtead Group plc (Trading companies & distributors) | | | 254,292 | | | | 8,567 | |
| | Compass Group plc (Hotels, restaurants & leisure) | | | 516,663 | | | | 7,119 | |
| | Diageo plc (Beverages) | | | 255,283 | | | | 8,482 | |
| | Experian plc (Professional services) | | | 429,331 | | | | 14,997 | |
| | Halma plc (Electronic equipment, instruments & components) | | | 240,237 | | | | 6,855 | |
| | London Stock Exchange Group plc (Capital markets) | | | 119,799 | | | | 12,407 | |
| | RELX plc (Professional services) | | | 498,796 | | | | 11,558 | |
| | Rentokil Initial plc (Commercial services & supplies) | | | 1,273,841 | | | | 8,044 | |
| | Segro plc (Equity REIT) | | | 858,547 | | | | 9,521 | |
| | Spirax-Sarco Engineering plc (Machinery) | | | 57,872 | | | | 7,154 | |
| | | | | | | | | 97,533 | |
See accompanying Notes to Financial Statements.
| June 30, 2020 | William Blair Funds | 39 |
International Leaders Fund
Portfolio of Investments, June 30, 2020 (all dollar amounts in thousands) (unaudited)
| | | | Shares or | | | | |
| | | | Principal | | | | |
| | Issuer | | Amount | | | Value | |
| | | | | | | | |
| | Common Stocks—(continued) | | | | | | | | |
| | | | | | | | | | |
| | Japan—10.3% | | | | | | | | |
| | Asahi Intecc Co., Ltd. (Health care equipment & supplies) | | | 175,900 | | | $ | 4,993 | |
| | Daikin Industries, Ltd. (Building products) | | | 76,400 | | | | 12,266 | |
| | Hoya Corporation (Health care equipment & supplies) | | | 113,300 | | | | 10,766 | |
| | Keyence Corporation (Electronic equipment, instruments & components) | | | 43,400 | | | | 18,100 | |
| | Shiseido Co., Ltd. (Personal products) | | | 146,600 | | | | 9,280 | |
| | SMC Corporation (Machinery) | | | 24,400 | | | | 12,469 | |
| | | | | | | | | 67,874 | |
| | Canada—5.8% | | | | | | | | |
| | Brookfield Asset Management, Inc. Class “A” (Capital markets)† | | | 296,716 | | | | 9,762 | |
| | Canadian National Railway Co. (Road & rail) | | | 146,479 | | | | 12,959 | |
| | Dollarama, Inc. (Multiline retail) | | | 204,757 | | | | 6,811 | |
| * | Lululemon Athletica, Inc. (Textiles, apparel & luxury goods) | | | 29,402 | | | | 9,174 | |
| | | | | | | | | 38,706 | |
| | Asia—5.5% | | | | | | | | |
| | Australia—3.6% | | | | | | | | |
| | Aristocrat Leisure, Ltd. (Hotels, restaurants & leisure) | | | 350,186 | | | | 6,162 | |
| * | Atlassian Corporation plc Class “A” (Software)† | | | 32,006 | | | | 5,770 | |
| | CSL, Ltd. (Biotechnology) | | | 58,717 | | | | 11,629 | |
| | | | | | | | | 23,561 | |
| | Hong Kong—1.9% | | | | | | | | |
| | AIA Group, Ltd. (Insurance) | | | 1,345,200 | | | | 12,549 | |
| | Emerging Latin America—1.5% | | | | | | | | |
| | Argentina—1.5% | | | | | | | | |
| * | MercadoLibre, Inc. (Internet & direct marketing retail) | | | 10,122 | | | | 9,978 | |
| | Total Common Stocks—99.5%
(cost $512,419) | | | | | | | 659,128 | |
| | Repurchase Agreement | | | | | | | | |
| | Fixed Income Clearing Corporation, 0.000% dated 6/30/20, due 7/1/20, repurchase price $2,863, collateralized by U.S. Treasury Note, 1.625%, due 2/15/26, valued at $2,920 | | $ | 2,863 | | | | 2,863 | |
| | Total Repurchase Agreement—0.4%
(cost $2,863) | | | | | | | 2,863 | |
| | Total Investments—99.9%
(cost $515,282) | | | | | | | 661,991 | |
| | Cash and other assets, less liabilities—0.1% | | | | | | | 470 | |
| | Net assets—100.0% | | | | | | $ | 662,461 | |
ADR = American Depository Receipt
REIT = Real Estate Investment Trust
* = Non-income producing security
† = U.S. listed foreign security
For securities primarily traded on exchanges or markets that close before the close of regular trading on the New York Stock Exchange, the Fund may use an independent pricing service to fair value price the securities pursuant to Valuation Procedures approved by the Board of Trustees.
At June 30, 2020, the Fund’s Portfolio of Investments includes the following industry categories (as a percentage of long-term investments):
| Industrials | | | 23.5 | % |
| Information Technology | | | 21.6 | % |
| Consumer Discretionary | | | 14.7 | % |
| Health Care | | | 12.4 | % |
| Financials | | | 9.6 | % |
| Communication Services | | | 5.6 | % |
| Consumer Staples | | | 4.3 | % |
| Energy | | | 3.3 | % |
| Materials | | | 2.0 | % |
| Utilities | | | 1.6 | % |
| Real Estate | | | 1.4 | % |
| Total | | | 100.0 | % |
At June 30, 2020, the Fund’s Portfolio of Investments includes the following currency categories (as a percentage of long-term investments):
| Euro | | | 23.3 | % |
| British Pound Sterling | | | 14.8 | % |
| Hong Kong Dollar | | | 10.7 | % |
| Japanese Yen | | | 10.3 | % |
| U.S. Dollar | | | 9.5 | % |
| Swiss Franc | | | 9.0 | % |
| Danish Krone | | | 6.9 | % |
| Swedish Krona | | | 4.4 | % |
| Canadian Dollar | | | 3.0 | % |
| Indian Rupee | | | 2.9 | % |
| Australian Dollar | | | 2.7 | % |
| New Taiwan Dollar | | | 2.5 | % |
| Total | | | 100.0 | % |
See accompanying Notes to Financial Statements.
| 40 | Semiannual Report | June 30, 2020 |
| | International Growth Fund The International Growth Fund seeks long-term capital appreciation. AN OVERVIEW FROM THE PORTFOLIO MANAGERS |

Simon Fennell 
Kenneth J. McAtamney | The William Blair International Growth Fund (Class N shares) posted a 0.27% increase, net of fees, for the six months ended June 30, 2020. By comparison, the Fund’s benchmark index, the MSCI All Country World ex-U.S. IMI (net) (the “Index”), decreased 11.24%. Six-month outperformance versus the Index was primarily driven by positive stock selection across most sectors. The Information Technology, Communication Services and Industrials sectors were the most notable sources of relative return. Within Information Technology, Adyen enhanced relative returns as the company posted second quarter results that reassured investors during a time of high uncertainty given the global COVID-19 pandemic. An innovative global payment service provider with a focus on large merchant online payments, we believe that Adyen is well positioned to benefit from an accelerated shift to online payments due to its best-in-class technology and product differentiation. Sea Ltd, a South East Asian mobile gaming and e-commerce company within Communication Services, was an additional source of outperformance. SEA primarily operates in seven South East Asian markets, including Indonesia, Malaysia, the Philippines, Singapore, Thailand, Taiwan and Vietnam. More recently, it has expanded its gaming operations to include India, Russia and Latin America. The company is the market leader in both gaming revenues and e-commerce, and current game success and a robust pipeline are driving higher revenue growth and profitability expectations, while e-commerce operating metrics continue to be strong. Within the Industrials sector, SMC Corp and Atlas Copco aided relative performance as the rebound in investor sentiment help propel high quality companies in cyclical sectors higher. Partially offsetting these effects was an overweight allocation to the U.K., an underweight allocation to Communication Services and an overweight to the Industrials sector. Additionally, companies with exposure to travel-related activities underperformed as activity remained depressed, including Airbus, Safran, MTU Aero and Amadeus. Please refer to the Global Markets Review and Outlook relating to the Fund beginning on page 31. |
| June 30, 2020 | William Blair Funds | 41 |
International Growth Fund
Performance Highlights (Unaudited)
| Average Annual Total Return through 6/30/2020 |
| | | Year | | | | | | | | | | Since |
| | | to Date | | 1 Year | | 3 Year | | 5 Year | | 10 Year | | Inception(a) |
| Class N | | | 0.27 | % | | | 9.49 | % | | | 6.54 | % | | | 4.78 | % | | | 7.38 | % | | | — | |
| Class I | | | 0.40 | | | | 9.82 | | | | 6.88 | | | | 5.10 | | | | 7.70 | | | | — | |
| Class R6 | | | 0.46 | | | | 9.92 | | | | — | | | | — | | | | — | | | | 10.42 | % |
| MSCI ACW Ex-U.S. IMI (net) | | | (11.24 | ) | | | (4.74 | ) | | | 0.96 | | | | 2.30 | | | | 5.11 | | | | (4.08 | ) |
| (a) | Since inception is for the period from May 2, 2019 (Commencement of Operations) to June 30, 2020. |
Performance cited represents past performance. Past performance does not guarantee future results and current performance may be lower or higher than the data quoted. Results shown are average annual total returns, which assume reinvestment of dividends and capital gains. Investment returns and principal will fluctuate and you may have a gain or loss when you sell shares. For the most current month-end performance information, please call 1-800-742-7272, or visit our Web site at www.williamblairfunds.com. Investing in smaller and medium capitalization companies involves special risks, including higher volatility and lower liquidity. Smaller and medium capitalization stocks are also more sensitive to purchase/sale transactions and changes in the issuer’s financial condition. International investing involves special risk considerations, including currency fluctuations, lower liquidity, economic and political risk. From time to time, the investment adviser may waive fees or reimburse expenses for the Fund. Without these waivers/reimbursements, performance would be lower. Class N shares are not subject to a sales load. Class I shares are not subject to a sales load or distribution (Rule 12b-1) fees. Class R6 shares are not subject to a sales load, distribution (Rule 12b-1) fees, or sub-transfer agent fees.
The performance highlights and graph presented above do not reflect the deduction of taxes that a shareholder would pay on fund distributions or the redemption of fund shares.
The Morgan Stanley Capital International (MSCI) All Country World (ACW) Ex-U.S. Investable Market Index (IMI) (net) is a free float-adjusted market capitalization weighted index that is designed to measure the equity market performance of developed and emerging markets, excluding the United States. This index approximates the minimum possible dividend reinvestment by deducting for the highest possible withholding tax rates of those markets.
This report identifies the Fund’s investments on June 30, 2020. These holdings are subject to change. Not all stocks in the Fund performed the same, nor is there any guarantee that these stocks will perform as well in the future. Market forecasts provided in this report may not necessarily come to pass.
Sector Diversification (Unaudited)
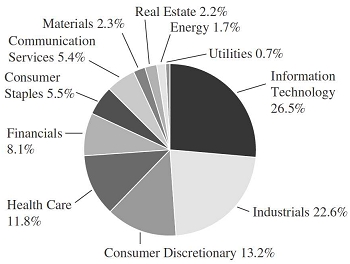
The sector diversification shown is based on the total long-term securities.
| 42 | Semiannual Report | June 30, 2020 |
International Growth Fund
Portfolio of Investments, June 30, 2020 (all dollar amounts in thousands) (unaudited)
| | | | | | | | |
| | | | | | | | |
| | Issuer | | Shares | | | Value | |
| | |
| | Common Stocks | | | | | | |
| | |
| | Europe, Mid-East—42.7% | | | | | | | | |
| | Belgium—0.3% | | | | | | | | |
| | Melexis N.V. (Semiconductors & semiconductor equipment) | | | 31,256 | | | $ | 2,370 | |
| | Warehouses De Pauw CVA (Equity REIT) | | | 137,691 | | | | 3,759 | |
| | | | | | | | | 6,129 | |
| | Denmark—5.3% | | | | | | | | |
| | Chr Hansen Holding A/S (Chemicals) | | | 77,429 | | | | 7,985 | |
| | Coloplast A/S Class “B” (Health care equipment & supplies) | | | 67,454 | | | | 10,455 | |
| | DSV PANALPINA A/S (Air freight & logistics) | | | 226,302 | | | | 27,631 | |
| * | Genmab A/S (Biotechnology) | | | 42,596 | | | | 14,258 | |
| * | Netcompany Group A/S (Software) | | | 59,114 | | | | 3,877 | |
| | Novo Nordisk A/S Class “B” (Pharmaceuticals) | | | 289,613 | | | | 18,750 | |
| | Orsted A/S (Electric utilities) | | | 97,391 | | | | 11,239 | |
| * | Royal Unibrew A/S (Beverages) | | | 44,799 | | | | 3,727 | |
| | Tryg A/S (Insurance) | | | 84,989 | | | | 2,460 | |
| | | | | | | | | 100,382 | |
| | Faroe Islands—0.1% | | | | | | | | |
| * | Bakkafrost P/F (Food products) | | | 41,151 | | | | 2,589 | |
| | Finland—0.9% | | | | | | | | |
| | Neste Oyj (Oil, gas & consumable fuels) | | | 406,763 | | | | 15,908 | |
| | France—9.8% | | | | | | | | |
| * | Airbus SE (Aerospace & defense) | | | 301,988 | | | | 21,551 | |
| | Capgemini SE (IT services) | | | 143,715 | | | | 16,461 | |
| | Dassault Systemes SE (Software) | | | 89,066 | | | | 15,370 | |
| | Hermes International (Textiles, apparel & luxury goods) | | | 9,306 | | | | 7,777 | |
| | Kering S.A. (Textiles, apparel & luxury goods) | | | 27,782 | | | | 15,115 | |
| * | L’Oreal S.A. (Personal products) | | | 62,299 | | | | 19,997 | |
| | LVMH Moet Hennessy Louis Vuitton SE (Textiles, apparel & luxury goods) | | | 57,336 | | | | 25,155 | |
| | Orpea (Health care providers & services) | | | 40,297 | | | | 4,659 | |
| | Rubis SCA (Gas utilities) | | | 55,609 | | | | 2,673 | |
| * | Safran S.A. (Aerospace & defense) | | | 218,258 | | | | 21,878 | |
| | Sartorius Stedim Biotech (Life sciences tools & services) | | | 26,095 | | | | 6,596 | |
| | Teleperformance (Professional services) | | | 54,748 | | | | 13,895 | |
| * | Worldline S.A. (IT services) | | | 157,698 | | | | 13,656 | |
| | | | | | | | | 184,783 | |
| | Germany—5.8% | | | | | | | | |
| * | Carl Zeiss Meditec AG (Health care equipment & supplies) | | | 42,958 | | | | 4,189 | |
| * | HelloFresh SE (Internet & direct marketing retail) | | | 56,632 | | | | 3,016 | |
| | Infineon Technologies AG (Semiconductors & semiconductor equipment) | | | 936,734 | | | | 21,969 | |
| | KION Group AG (Machinery) | | | 88,293 | | | | 5,436 | |
| * | MTU Aero Engines AG (Aerospace & defense) | | | 119,832 | | | | 20,753 | |
| | | | | | | | |
| | |
| | Issuer | | Shares | | | Value | |
| | |
| | Common Stocks—(continued) | | | | | | |
| | |
| | Europe, Mid-East—(continued) | | | | | | | | |
| | Germany—(continued) | | | | | | | | |
| * | Puma SE (Textiles, apparel & luxury goods) | | | 131,041 | | | $ | 10,132 | |
| | SAP SE (Software) | | | 139,779 | | | | 19,524 | |
| * | TeamViewer AG (Software) | | | 184,818 | | | | 10,092 | |
| | Vonovia SE (Real estate management & development) | | | 214,641 | | | | 13,162 | |
| | | | | | | | | 108,273 | |
| | Ireland—2.0% | | | | | | | | |
| * | ICON plc (Life sciences tools & services)† | | | 75,184 | | | | 12,666 | |
| | Kerry Group plc Class “A” (Food products) | | | 86,138 | | | | 10,674 | |
| | Kingspan Group plc (Building products) | | | 204,396 | | | | 13,170 | |
| | | | | | | | | 36,510 | |
| | Israel—0.7% | | | | | | | | |
| * | CyberArk Software, Ltd. (Software)† | | | 39,970 | | | | 3,968 | |
| * | Wix.com, Ltd. (IT services)† | | | 37,499 | | | | 9,608 | |
| | | | | | | | | 13,576 | |
| | Italy—0.5% | | | | | | | | |
| * | Amplifon SpA (Health care providers & services) | | | 145,089 | | | | 3,865 | |
| * | Brunello Cucinelli SpA (Textiles, apparel & luxury goods) | | | 85,305 | | | | 2,534 | |
| * | Moncler SpA (Textiles, apparel & luxury goods) | | | 77,745 | | | | 2,973 | |
| | | | | | | | | 9,372 | |
| | Luxembourg—0.4% | | | | | | | | |
| * | Eurofins Scientific SE (Life sciences tools & services) | | | 11,289 | | | | 7,085 | |
| | Netherlands—3.7% | | | | | | | | |
| * | Adyen N.V. (IT services) | | | 14,517 | | | | 21,129 | |
| | ASML Holding N.V. (Semiconductors & semiconductor equipment) | | | 100,505 | | | | 36,913 | |
| | BE Semiconductor Industries N.V. (Semiconductors & semiconductor equipment) | | | 87,856 | | | | 3,914 | |
| | Euronext N.V. (Capital markets) | | | 45,353 | | | | 4,548 | |
| | IMCD N.V. (Trading companies & distributors) | | | 39,128 | | | | 3,678 | |
| | | | | | | | | 70,182 | |
| | Norway—0.4% | | | | | | | | |
| | TOMRA Systems ASA (Commercial services & supplies) | | | 205,020 | | | | 7,521 | |
| | Spain—1.0% | | | | | | | | |
| | Amadeus IT Group S.A. (IT services) | | | 352,495 | | | | 18,368 | |
| | Sweden—4.8% | | | | | | | | |
| * | AAK AB (Food products) | | | 129,414 | | | | 2,224 | |
| | Atlas Copco AB Class “A” (Machinery) | | | 752,486 | | | | 31,866 | |
| | Evolution Gaming Group AB (Hotels, restaurants & leisure) | | | 180,998 | | | | 10,792 | |
| | Fabege AB (Real estate management & development) | | | 232,864 | | | | 2,721 | |
See accompanying Notes to Financial Statements.
| June 30, 2020 | | William Blair Funds | 43 |
International Growth Fund
Portfolio of Investments, June 30, 2020 (all dollar amounts in thousands) (unaudited)
| | | | | | | | |
| | |
| | Issuer | | Shares | | | Value | |
| | |
| | Common Stocks—(continued) | | | | | | |
| | |
| | Europe, Mid-East—(continued) | | | | | | | | |
| | Sweden—(continued) | | | | | | | | |
| * | Hexagon AB Class “B” (Electronic equipment, instruments & components) | | | 367,043 | | | $ | 21,428 | |
| * | Indutrade AB (Trading companies & distributors) | | | 136,280 | | | | 5,382 | |
| | Lifco AB Class “B” (Industrial conglomerates) | | | 63,727 | | | | 4,035 | |
| * | Nibe Industrier AB Class “B” (Building products) | | | 251,458 | | | | 5,556 | |
| * | Nolato AB Class “B” (Industrial conglomerates) | | | 56,363 | | | | 3,799 | |
| * | Vitrolife AB (Biotechnology) | | | 104,462 | | | | 2,336 | |
| | | | | | | | | 90,139 | |
| | Switzerland—7.0% | | | | | | | | |
| | Belimo Holding AG (Building products) | | | 536 | | | | 3,943 | |
| | Logitech International S.A. (Technology hardware, storage & peripherals) | | | 136,783 | | | | 8,931 | |
| | Lonza Group AG (Life sciences tools & services) | | | 47,060 | | | | 24,845 | |
| | Partners Group Holding AG (Capital markets) | | | 17,929 | | | | 16,263 | |
| * | SIG Combibloc Group AG (Containers & packaging) | | | 186,919 | | | | 3,024 | |
| | Sika AG (Chemicals) | | | 116,788 | | | | 22,478 | |
| * | Softwareone Holding AG (Electronic equipment, instruments & components) | | | 157,921 | | | | 3,900 | |
| | STMicroelectronics N.V. (Semiconductors & semiconductor equipment) | | | 550,146 | | | | 14,970 | |
| | Straumann Holding AG (Health care equipment & supplies) | | | 14,637 | | | | 12,575 | |
| | Tecan Group AG (Life sciences tools & services) | | | 14,674 | | | | 5,198 | |
| | Temenos AG (Software) | | | 70,158 | | | | 10,896 | |
| | VAT Group AG (Machinery) | | | 27,047 | | | | 4,939 | |
| | | | | | | | | 131,962 | |
| | |
| | Emerging Asia—21.9% | | | | | | | | |
| | China—14.4% | | | | | | | | |
| | A-Living Services Co., Ltd. Class “H” (Commercial services & supplies) | | | 739,750 | | | | 3,727 | |
| | Aier Eye Hospital Group Co., Ltd. Class “A” (Health care providers & services) | | | 1,038,916 | | | | 6,381 | |
| | AK Medical Holdings, Ltd. (Health care equipment & supplies) | | | 860,000 | | | | 2,735 | |
| * | Alibaba Group Holding, Ltd. (Internet & direct marketing retail) | | | 1,473,384 | | | | 39,845 | |
| | Centre Testing International Group Co., Ltd. Class “A” (Professional services) | | | 2,318,700 | | | | 6,477 | |
| | Country Garden Services Holdings Co., Ltd. (Commercial services & supplies) | | | 1,732,000 | | | | 8,045 | |
| | Foshan Haitian Flavouring & Food Co., Ltd. Class “A” (Food products) | | | 339,459 | | | | 5,970 | |
| | Hangzhou Tigermed Consulting Co., Ltd. Class “A” (Life sciences tools & services) | | | 505,870 | | | | 7,285 | |
| | | | | | | | |
| | |
| | Issuer | | Shares | | | Value | |
| | |
| | Common Stocks—(continued) | | | | | | |
| | |
| | Emerging Asia—(continued) | | | | | | | | |
| | China—(continued) | | | | | | | | |
| | Kweichow Moutai Co., Ltd. Class “A” (Beverages) | | | 54,053 | | | $ | 11,178 | |
| | Li Ning Co., Ltd. (Textiles, apparel & luxury goods) | | | 3,015,500 | | | | 9,571 | |
| * | Meituan Dianping Class “B” (Internet & direct marketing retail) | | | 497,900 | | | | 11,043 | |
| | NAURA Technology Group Co., Ltd. Class “A” (Electronic equipment, instruments & components) | | | 182,913 | | | | 4,419 | |
| | NetEase, Inc.—ADR (Entertainment) | | | 39,608 | | | | 17,007 | |
| | Offcn Education Technology Co., Ltd. Class “A” (Diversified consumer services) | | | 974,421 | | | | 3,822 | |
| | Ping An Insurance Group Co. of China, Ltd. Class “H” (Insurance) | | | 2,075,000 | | | | 20,749 | |
| | Shenzhen Mindray Bio-Medical Electronics Co., Ltd. Class “A” (Health care equipment & supplies) | | | 102,350 | | | | 4,423 | |
| | Shenzhou International Group Holdings, Ltd. (Textiles, apparel & luxury goods) | | | 468,000 | | | | 5,640 | |
| | Silergy Corporation (Semiconductors & semiconductor equipment) | | | 156,000 | | | | 10,152 | |
| * | TAL Education Group—ADR (Diversified consumer services) | | | 311,308 | | | | 21,287 | |
| | Tencent Holdings, Ltd. (Interactive Media & Services) | | | 738,900 | | | | 47,534 | |
| * | Tencent Music Entertainment Group—ADR (Entertainment) | | | 210,681 | | | | 2,836 | |
| * | Topchoice Medical Corporation Class “A” (Health care providers & services) | | | 210,339 | | | | 4,959 | |
| | Vitasoy International Holdings, Ltd. (Food products) | | | 480,000 | | | | 1,836 | |
| | Will Semiconductor, Ltd. Class “A” (Semiconductors & semiconductor equipment) | | | 85,077 | | | | 2,429 | |
| | WuXi AppTec Co., Ltd. Class “A” (Life sciences tools & services) | | | 299,414 | | | | 4,089 | |
| * | Wuxi Biologics Cayman, Inc. (Life sciences tools & services) | | | 423,500 | | | | 7,748 | |
| | | | | | | | | 271,187 | |
| | India—1.5% | | | | | | | | |
| | HDFC Bank, Ltd. (Banks) | | | 497,394 | | | | 7,025 | |
| | Ipca Laboratories, Ltd. (Pharmaceuticals) | | | 123,136 | | | | 2,727 | |
| | Pidilite Industries, Ltd. (Chemicals) | | | 164,478 | | | | 2,991 | |
| | Reliance Industries, Ltd. (Oil, gas & consumable fuels) | | | 669,916 | | | | 15,150 | |
| * | Reliance Industries, Ltd. (Oil, gas & consumable fuels) | | | 51,309 | | | | 544 | |
| | | | | | | | | 28,437 | |
| | Indonesia—1.0% | | | | | | | | |
| | PT Bank Central Asia Tbk (Banks) | | | 9,066,500 | | | | 18,073 | |
| | South Korea—0.9% | | | | | | | | |
| | Kakao Corporation (Interactive Media & Services) | | | 37,761 | | | | 8,398 | |
See accompanying Notes to Financial Statements.
| 44 | Semiannual Report | June 30, 2020 |
International Growth Fund
Portfolio of Investments, June 30, 2020 (all dollar amounts in thousands) (unaudited)
| | | | | | | | |
| | | | | | | | |
| | Issuer | | Shares | | | Value | |
| | |
| | Common Stocks—(continued) | | | | | | |
| | |
| | Emerging Asia—(continued) | | | | | | | | |
| | South Korea—(continued) | | | | | | | | |
| | Samsung SDI Co., Ltd. (Electronic equipment, instruments & components) | | | 31,119 | | | $ | 9,404 | |
| | | | | | | | | 17,802 | |
| | Taiwan—3.1% | | | | | | | | |
| | Globalwafers Co., Ltd. (Semiconductors & semiconductor equipment) | | | 267,000 | | | | 3,647 | |
| | MediaTek, Inc. (Semiconductors & semiconductor equipment) | | | 1,206,000 | | | | 23,667 | |
| | Taiwan Semiconductor Manufacturing Co., Ltd.—ADR (Semiconductors & semiconductor equipment) | | | 534,335 | | | | 30,334 | |
| | | | | | | | | 57,648 | |
| | Thailand—1.0% | | | | | | | | |
| | Airports of Thailand PCL (Transportation infrastructure) | | | 1,456,200 | | | | 2,850 | |
| * | Sea, Ltd.—ADR (Entertainment) | | | 145,050 | | | | 15,555 | |
| | | | | | | | | 18,405 | |
| | |
| | Japan—12.5% | | | | | | | | |
| | Asahi Intecc Co., Ltd. (Health care equipment & supplies) | | | 293,500 | | | | 8,331 | |
| | Daikin Industries, Ltd. (Building products) | | | 127,400 | | | | 20,454 | |
| | Disco Corporation (Semiconductors & semiconductor equipment) | | | 45,200 | | | | 10,922 | |
| | GMO Payment Gateway, Inc. (IT services) | | | 50,800 | | | | 5,288 | |
| | Harmonic Drive Systems, Inc. (Machinery) | | | 84,200 | | | | 4,609 | |
| | Hoya Corporation (Health care equipment & supplies) | | | 140,400 | | | | 13,341 | |
| | Keyence Corporation (Electronic equipment, instruments & components) | | | 85,900 | | | | 35,824 | |
| | Meitec Corporation (Professional services) | | | 44,800 | | | | 2,153 | |
| | MISUMI Group, Inc. (Machinery) | | | 216,000 | | | | 5,389 | |
| | MonotaRO Co., Ltd. (Trading companies & distributors) | | | 193,000 | | | | 7,722 | |
| | Nihon M&A Center, Inc. (Professional services) | | | 219,800 | | | | 9,914 | |
| | Nomura Research Institute, Ltd. (IT services) | | | 381,300 | | | | 10,336 | |
| | NS Solutions Corporation (IT services) | | | 77,700 | | | | 2,119 | |
| | Omron Corporation (Electronic equipment, instruments & components) | | | 299,300 | | | | 20,013 | |
| | Persol Holdings Co., Ltd. (Professional services) | | | 320,900 | | | | 4,399 | |
| | Shimadzu Corporation (Electronic equipment, instruments & components) | | | 211,500 | | | | 5,618 | |
| | Shiseido Co., Ltd. (Personal products) | | | 230,400 | | | | 14,585 | |
| | SMC Corporation (Machinery) | | | 52,600 | | | | 26,881 | |
| | Sushiro Global Holdings, Ltd. (Hotels, restaurants & leisure) | | | 151,400 | | | | 3,327 | |
| | TechnoPro Holdings, Inc. (Professional services) | | | 73,800 | | | | 4,203 | |
| | Terumo Corporation (Health care equipment & supplies) | | | 308,900 | | | | 11,675 | |
| | TIS, Inc. (IT services) | | | 360,200 | | | | 7,586 | |
| | | | | | | | | 234,689 | |
| | | | | | | | |
| | |
| | Issuer | | Shares | | | Value | |
| | |
| | Common Stocks—(continued) | | | | | | |
| | |
| | United Kingdom—11.7% | | | | | | | | |
| | 3i Group plc (Capital markets) | | | 548,813 | | | $ | 5,662 | |
| | Abcam plc (Biotechnology) | | | 139,772 | | | | 2,309 | |
| | Ashtead Group plc (Trading companies & distributors) | | | 337,716 | | | | 11,378 | |
| | Avast plc (Software) | | | 939,144 | | | | 6,150 | |
| | AVEVA Group plc (Software) | | | 107,435 | | | | 5,447 | |
| | Big Yellow Group plc (Equity REIT) | | | 294,907 | | | | 3,669 | |
| * | boohoo Group plc (Internet & direct marketing retail) | | | 995,778 | | | | 5,084 | |
| | Compass Group plc (Hotels, restaurants & leisure) | | | 1,115,229 | | | | 15,367 | |
| | Croda International plc (Chemicals) | | | 111,816 | | | | 7,282 | |
| | Diageo plc (Beverages) | | | 503,297 | | | | 16,723 | |
| | Experian plc (Professional services) | | | 647,178 | | | | 22,606 | |
| | Greggs plc (Hotels, restaurants & leisure) | | | 248,553 | | | | 4,989 | |
| | Halma plc (Electronic equipment, instruments & components) | | | 532,723 | | | | 15,202 | |
| | Intermediate Capital Group plc (Capital markets) | | | 424,689 | | | | 6,783 | |
| | Intertek Group plc (Professional services) | | | 127,746 | | | | 8,611 | |
| | London Stock Exchange Group plc (Capital markets) | | | 182,519 | | | | 18,902 | |
| | RELX plc (Professional services) | | | 574,967 | | | | 13,323 | |
| | Renishaw plc (Electronic equipment, instruments & components) | | | 62,947 | | | | 3,139 | |
| | Rentokil Initial plc (Commercial services & supplies) | | | 2,116,883 | | | | 13,367 | |
| | Rotork plc (Machinery) | | | 1,494,541 | | | | 5,185 | |
| | Segro plc (Equity REIT) | | | 1,075,169 | | | | 11,924 | |
| | Softcat plc (IT services) | | | 214,869 | | | | 2,902 | |
| | Spirax-Sarco Engineering plc (Machinery) | | | 96,237 | | | | 11,896 | |
| * | Trainline plc (Internet & direct marketing retail) | | | 456,720 | | | | 2,458 | |
| | | | | | | | | 220,358 | |
| | |
| | Western Hemisphere—4.5% | | | | | | | | |
| | Canada—4.3% | | | | | | | | |
| | Alimentation Couche-Tard, Inc. Class “B” (Food & staples retailing) | | | 423,831 | | | | 13,290 | |
| | Brookfield Asset Management, Inc. Class “A” (Capital markets)† | | | 406,457 | | | | 13,372 | |
| | Canadian National Railway Co. (Road & rail) | | | 285,524 | | | | 25,261 | |
| | Enghouse Systems, Ltd. (Software) | | | 68,632 | | | | 3,665 | |
| * | Kinaxis, Inc. (Software) | | | 35,719 | | | | 5,106 | |
| * | Lululemon Athletica, Inc. (Textiles, apparel & luxury goods) | | | 57,549 | | | | 17,956 | |
| | Toromont Industries, Ltd. (Trading companies & distributors) | | | 51,968 | | | | 2,579 | |
| | | | | | | | | 81,229 | |
| | United States—0.2% | | | | | | | | |
| | Benefit One, Inc. (Professional services) | | | 198,600 | | | | 3,982 | |
See accompanying Notes to Financial Statements.
| June 30, 2020 | William Blair Funds | 45 |
International Growth Fund
Portfolio of Investments, June 30, 2020 (all dollar amounts in thousands) (unaudited)
| | | | | | | | |
| | |
| | Issuer | | Shares | | | Value | |
| | |
| | Common Stocks—(continued) | | | | | | |
| | |
| | Asia—3.8% | | | | | | | | |
| | Australia—2.2% | | | | | | | | |
| | Aristocrat Leisure, Ltd. (Hotels, restaurants & leisure) | | | 570,336 | | | $ | 10,036 | |
| * | Atlassian Corporation plc Class “A” (Software)† | | | 66,556 | | | | 11,998 | |
| | CSL, Ltd. (Biotechnology) | | | 65,439 | | | | 12,961 | |
| | Goodman Group (Equity REIT) | | | 675,829 | | | | 6,926 | |
| | | | | | | | | 41,921 | |
| | Hong Kong—1.6% | | | | | | | | |
| | AIA Group, Ltd. (Insurance) | | | 3,095,800 | | | | 28,879 | |
| | |
| | Emerging Latin America—2.1% | | | | | | | | |
| | Argentina—0.8% | | | | | | | | |
| * | Globant S.A. (Software)† | | | 32,168 | | | | 4,820 | |
| * | MercadoLibre, Inc. (Internet & direct marketing retail) | | | 10,336 | | | | 10,189 | |
| | | | | | | | | 15,009 | |
| | Brazil—1.2% | | | | | | | | |
| | B3 S.A.—Brasil Bolsa Balcao (Capital markets) | | | 894,100 | | | | 9,058 | |
| | Lojas Renner S.A. (Multiline retail) | | | 289,000 | | | | 2,221 | |
| | Magazine Luiza S.A. (Multiline retail) | | | 497,500 | | | | 6,555 | |
| | Notre Dame Intermedica Participacoes S.A. (Health care providers & services) | | | 380,300 | | | | 4,756 | |
| | | | | | | | | 22,590 | |
| | Mexico—0.1% | | | | | | | | |
| * | Grupo Aeroportuario del Sureste S.A.B. de C.V.—ADR (Transportation infrastructure) | | | 26,655 | | | | 2,993 | |
| | |
| | Emerging Europe—0.5% | | | | | | | | |
| | Russia—0.5% | | | | | | | | |
| * | Yandex N.V. Class “A” (Interactive Media & Services)† | | | 189,126 | | | | 9,460 | |
| | Total Common Stocks—99.7%
(cost $1,357,985) | | | | | | | 1,875,441 | |
| | | | | | | | |
| | | | Principal | | | | |
| | Issuer | | Amount | | | Value | |
| | |
| | Repurchase Agreement | | | | | | | | |
| | Fixed Income Clearing Corporation, 0.000% dated 6/30/20, due 7/1/20, repurchase price $7,359, collateralized by U.S. Treasury Note, 1.625%, due 2/15/26, valued at $7,507 | | $ | 7,359 | | | $ | 7,359 | |
| | Total Repurchase Agreement—0.4%
(cost $7,359) | | | | | | | 7,359 | |
| | Total Investments—100.1%
(cost $1,365,344) | | | | | | | 1,882,800 | |
| | Liabilities, plus cash and other assets—(0.1)% | | | | | | | (1,592 | ) |
| | Net assets—100.0% | | | | | | $ | 1,881,208 | |
ADR = American Depository Receipt
REIT = Real Estate Investment Trust
* = Non-income producing security
† = U.S. listed foreign security
For securities primarily traded on exchanges or markets that close before the close of regular trading on the New York Stock Exchange, the Fund may use an independent pricing service to fair value price the securities pursuant to Valuation Procedures approved by the Board of Trustees.
At June 30, 2020, the Fund’s Portfolio of Investments includes the following industry categories (as a percentage of long-term investments):
| Information Technology | | | 26.5 | % |
| Industrials | | | 22.6 | % |
| Consumer Discretionary | | | 13.2 | % |
| Health Care | | | 11.8 | % |
| Financials | | | 8.1 | % |
| Consumer Staples | | | 5.5 | % |
| Communication Services | | | 5.4 | % |
| Materials | | | 2.3 | % |
| Real Estate | | | 2.2 | % |
| Energy | | | 1.7 | % |
| Utilities | | | 0.7 | % |
| Total | | | 100.0 | % |
At June 30, 2020, the Fund’s Portfolio of Investments includes the following currency categories (as a percentage of long-term investments):
| Euro | | | 24.5 | % |
| Japanese Yen | | | 12.7 | % |
| British Pound Sterling | | | 11.7 | % |
| Hong Kong Dollar | | | 10.0 | % |
| U.S. Dollar | | | 9.8 | % |
| Swiss Franc | | | 6.2 | % |
| Danish Krone | | | 5.4 | % |
| Swedish Krona | | | 4.8 | % |
| Chinese Yuan Renminbi | | | 3.3 | % |
| Canadian Dollar | | | 2.7 | % |
| New Taiwan Dollar | | | 2.0 | % |
| Australian Dollar | | | 1.6 | % |
| Indian Rupee | | | 1.5 | % |
| Brazilian Real | | | 1.2 | % |
| All Other Currencies | | | 2.6 | % |
| Total | | | 100.0 | % |
See accompanying Notes to Financial Statements.
| 46 | Semiannual Report | June 30, 2020 |
| | Institutional International Growth Fund |
| | |
| | The Institutional International Growth Fund seeks long-term capital appreciation. |
| | |
| | AN OVERVIEW FROM THE PORTFOLIO MANAGERS |
| | |
 Simon Fennell 
Kenneth J. McAtamney | The William Blair Institutional International Growth Fund posted a 0.69% increase, net of fees, for the six months ended June 30, 2020. By comparison, the Fund’s benchmark index, the MSCI All Country World ex-U.S. IMI (net) (the “Index”), decreased 11.24%. Six-month outperformance versus the Index was primarily driven by positive stock selection across most sectors. The Information Technology, Communication Services and Industrials sectors were the most notable sources of relative return. Within Information Technology, Adyen enhanced relative returns as the company posted second quarter results that reassured investors during a time of high uncertainty given the global COVID-19 pandemic. An innovative global payment service provider with a focus on large merchant online payments, we believe that Adyen is well positioned to benefit from an accelerated shift to online payments due to its best-in-class technology and product differentiation. Sea Ltd, a South East Asian mobile gaming and e-commerce company within Communication Services, was an additional source of outperformance. SEA primarily operates in seven South East Asian markets, including Indonesia, Malaysia, the Philippines, Singapore, Thailand, Taiwan and Vietnam. More recently, it has expanded its gaming operations to include India, Russia and Latin America. The company is the market leader in both gaming revenues and e-commerce, and current game success and a robust pipeline are driving higher revenue growth and profitability expectations, while e-commerce operating metrics continue to be strong. Within the Industrials sector, SMC Corp and Atlas Copco aided relative performance as the rebound in investor sentiment help propel high quality companies in cyclical sectors higher. Partially offsetting these effects was an overweight allocation to the U.K., an underweight allocation to Communication Services, and an overweight to the Industrials sector. Additionally, companies with exposure to travel-related activities underperformed as activity remained depressed, including Airbus, Safran, MTU Aero, and Amadeus. Please refer to the Global Markets Review and Outlook relating to the Fund beginning on page 31. |
| June 30, 2020 | William Blair Funds | 47 |
Institutional International Growth Fund
Performance Highlights (Unaudited)
| Average Annual Total Return through 6/30/2020 |
| | | Year
to Date | | 1 Year | | 3 Year | | 5 Year | | 10 Year |
| Institutional International Growth Fund | | | 0.69 | % | | | 10.26 | % | | | 7.11 | % | | | 5.30 | % | | | 7.90 | % |
| MSCI ACW Ex-U.S. IMI (net) | | | (11.24 | ) | | | (4.74 | ) | | | 0.96 | | | | 2.30 | | | | 5.11 | |
Performance cited represents past performance. Past performance does not guarantee future results and current performance may be lower or higher than the data quoted. Results shown are average annual returns, which assume reinvestment of dividends and capital gains. Investment returns and principal will fluctuate and you may have a gain or loss when you sell shares. For the most current month-end performance information, please call 1-800-742-7272, or visit our Web site at www.williamblairfunds.com. From time to time, the investment adviser may waive fees or reimburse expenses for the Fund. Without these waivers/reimbursements, performance would be lower. Investing in smaller and medium capitalization companies involves special risks, including higher volatility and lower liquidity. Smaller and medium capitalization stocks are also more sensitive to purchase/sale transactions and changes in the issuer’s financial condition. International investing involves special risk considerations, including currency fluctuations, lower liquidity, economic and political risk. Shares of the Fund are not subject to a sales load, distribution (Rule 12b-1) fees, or sub-transfer agent fees.
The performance highlights and graph presented above do not reflect the deduction of taxes that a shareholder would pay on fund distributions or the redemption of fund shares.
The Morgan Stanley Capital International (MSCI) All Country World (ACW) Ex-U.S. Investable Market Index (IMI) (net) is a free float-adjusted market capitalization weighted index that is designed to measure the equity market performance of developed and emerging markets, excluding the United States. This index approximates the minimum possible dividend reinvestment by deducting for the highest possible withholding tax rates of those markets.
This report identifies the Fund’s investments on June 30, 2020. These holdings are subject to change. Not all stocks in the Fund performed the same, nor is there any guarantee that these stocks will perform as well in the future. Market forecasts provided in this report may not necessarily come to pass.
Sector Diversification (Unaudited)

The sector diversification shown is based on the total long-term securities.
| 48 | Semiannual Report | June 30, 2020 |
Institutional International Growth Fund
Portfolio of Investments, June 30, 2020 (all dollar amounts in thousands) (unaudited)
| | | | | | | | |
| | | | | | | | |
| | Issuer | | Shares | | | Value | |
| | | | | | | | | | |
| | Common Stocks | | | | | | | | |
| | | | | | | | | | |
| | Europe, Mid-East—42.7% | | | | | | | | |
| | Belgium—0.3% | | | | | | | | |
| | Melexis N.V. (Semiconductors & semiconductor equipment) | | | 25,680 | | | $ | 1,947 | |
| | Warehouses De Pauw CVA (Equity REIT) | | | 113,128 | | | | 3,089 | |
| | | | | | | | | 5,036 | |
| | Denmark—5.3% | | | | | | | | |
| | Chr Hansen Holding A/S (Chemicals) | | | 63,616 | | | | 6,561 | |
| | Coloplast A/S Class “B” (Health care equipment & supplies) | | | 55,421 | | | | 8,590 | |
| | DSV PANALPINA A/S (Air freight & logistics) | | | 185,931 | | | | 22,701 | |
| * | Genmab A/S (Biotechnology) | | | 34,997 | | | | 11,714 | |
| * | Netcompany Group A/S (Software) | | | 48,568 | | | | 3,186 | |
| | Novo Nordisk A/S Class “B” (Pharmaceuticals) | | | 237,947 | | | | 15,405 | |
| | Orsted A/S (Electric utilities) | | | 80,017 | | | | 9,234 | |
| * | Royal Unibrew A/S (Beverages) | | | 36,807 | | | | 3,062 | |
| | Tryg A/S (Insurance) | | | 69,827 | | | | 2,021 | |
| | | | | | | | | 82,474 | |
| | Faroe Islands—0.1% | | | | | | | | |
| * | Bakkafrost P/F (Food products) | | | 33,810 | | | | 2,127 | |
| | Finland—0.9% | | | | | | | | |
| | Neste Oyj (Oil, gas & consumable fuels) | | | 334,199 | | | | 13,070 | |
| | France—9.8% | | | | | | | | |
| * | Airbus SE (Aerospace & defense) | | | 248,115 | | | | 17,707 | |
| | Capgemini SE (IT services) | | | 118,077 | | | | 13,525 | |
| | Dassault Systemes SE (Software) | | | 73,177 | | | | 12,628 | |
| | Hermes International (Textiles, apparel & luxury goods) | | | 7,646 | | | | 6,389 | |
| | Kering S.A. (Textiles, apparel & luxury goods) | | | 22,825 | | | | 12,418 | |
| * | L’Oreal S.A. (Personal products) | | | 51,186 | | | | 16,430 | |
| | LVMH Moet Hennessy Louis Vuitton SE (Textiles, apparel & luxury goods) | | | 47,107 | | | | 20,667 | |
| | Orpea (Health care providers & services) | | | 33,108 | | | | 3,828 | |
| | Rubis SCA (Gas utilities) | | | 45,688 | | | | 2,196 | |
| * | Safran S.A. (Aerospace & defense) | | | 179,322 | | | | 17,975 | |
| | Sartorius Stedim Biotech (Life sciences tools & services) | | | 21,440 | | | | 5,420 | |
| | Teleperformance (Professional services) | | | 44,981 | | | | 11,416 | |
| * | Worldline S.A. (IT services) | | | 129,565 | | | | 11,220 | |
| | | | | | | | | 151,819 | |
| | Germany—5.8% | | | | | | | | |
| * | Carl Zeiss Meditec AG (Health care equipment & supplies) | | | 35,294 | | | | 3,442 | |
| * | HelloFresh SE (Internet & direct marketing retail) | | | 46,529 | | | | 2,478 | |
| | Infineon Technologies AG (Semiconductors & semiconductor equipment) | | | 769,624 | | | | 18,050 | |
| | KION Group AG (Machinery) | | | 72,542 | | | | 4,466 | |
| * | MTU Aero Engines AG (Aerospace & defense) | | | 98,454 | | | | 17,051 | |
| * | Puma SE (Textiles, apparel & luxury goods) | | | 107,664 | | | | 8,324 | |
| | | | | | | | |
| | | | | | | | |
| | Issuer | | Shares | | | Value | |
| | | | | | | | | | |
| | Common Stocks—(continued) | | | | | | | | |
| | | | | | | | | | |
| | Europe, Mid-East—(continued) | | | | | | | | |
| | Germany—(continued) | | | | | | | | |
| | SAP SE (Software) | | | 114,843 | | | $ | 16,041 | |
| * | TeamViewer AG (Software) | | | 151,847 | | | | 8,291 | |
| | Vonovia SE (Real estate management & development) | | | 176,350 | | | | 10,814 | |
| | | | | | | | | 88,957 | |
| | Ireland—2.0% | | | | | | | | |
| * | ICON plc (Life sciences tools & services)† | | | 61,771 | | | | 10,406 | |
| | Kerry Group plc Class “A” (Food products) | | | 70,771 | | | | 8,770 | |
| | Kingspan Group plc (Building products) | | | 167,933 | | | | 10,820 | |
| | | | | | | | | 29,996 | |
| | Israel—0.7% | | | | | | | | |
| * | CyberArk Software, Ltd. (Software)† | | | 32,840 | | | | 3,260 | |
| * | Wix.com, Ltd. (IT services)† | | | 30,809 | | | | 7,894 | |
| | | | | | | | | 11,154 | |
| | Italy—0.5% | | | | | | | | |
| * | Amplifon SpA (Health care providers & services) | | | 119,206 | | | | 3,175 | |
| * | Brunello Cucinelli SpA (Textiles, apparel & luxury goods) | | | 70,087 | | | | 2,082 | |
| * | Moncler SpA (Textiles, apparel & luxury goods) | | | 63,876 | | | | 2,443 | |
| | | | | | | | | 7,700 | |
| | Luxembourg—0.4% | | | | | | | | |
| * | Eurofins Scientific SE (Life sciences tools & services) | | | 9,275 | | | | 5,821 | |
| | Netherlands—3.7% | | | | | | | | |
| * | Adyen N.V. (IT services) | | | 11,927 | | | | 17,360 | |
| | ASML Holding N.V. (Semiconductors & semiconductor equipment) | | | 82,576 | | | | 30,328 | |
| | BE Semiconductor Industries N.V. (Semiconductors & semiconductor equipment) | | | 72,183 | | | | 3,216 | |
| | Euronext N.V. (Capital markets) | | | 37,263 | | | | 3,736 | |
| | IMCD N.V. (Trading companies & distributors) | | | 32,148 | | | | 3,022 | |
| | | | | | | | | 57,662 | |
| | Norway—0.4% | | | | | | | | |
| | TOMRA Systems ASA (Commercial services & supplies) | | | 168,445 | | | | 6,179 | |
| | Spain—1.0% | | | | | | | | |
| | Amadeus IT Group S.A. (IT services) | | | 289,611 | | | | 15,091 | |
| | Sweden—4.8% | | | | | | | | |
| * | AAK AB (Food products) | | | 106,327 | | | | 1,827 | |
| | Atlas Copco AB Class “A” (Machinery) | | | 618,246 | | | | 26,181 | |
| | Evolution Gaming Group AB (Hotels, restaurants & leisure) | | | 148,708 | | | | 8,867 | |
| | Fabege AB (Real estate management & development) | | | 191,322 | | | | 2,236 | |
| * | Hexagon AB Class “B” (Electronic equipment, instruments & components) | | | 301,564 | | | | 17,605 | |
See accompanying Notes to Financial Statements.
| June 30, 2020 | William Blair Funds | 49 |
Institutional International Growth Fund
Portfolio of Investments, June 30, 2020 (all dollar amounts in thousands) (unaudited)
| | | | | | | | |
| | | | | | | | |
| | Issuer | | Shares | | | Value | |
| | | | | | | | | | |
| | Common Stocks—(continued) | | | | | | | | |
| | | | | | | | | | |
| | Europe, Mid-East—(continued) | | | | | | | | |
| | Sweden—(continued) | | | | | | | | |
| * | Indutrade AB (Trading companies & distributors) | | | 111,968 | | | $ | 4,422 | |
| | Lifco AB Class “B” (Industrial conglomerates) | | | 52,359 | | | | 3,315 | |
| * | Nibe Industrier AB Class “B” (Building products) | | | 206,599 | | | | 4,565 | |
| * | Nolato AB Class “B” (Industrial conglomerates) | | | 46,308 | | | | 3,121 | |
| * | Vitrolife AB (Biotechnology) | | | 85,827 | | | | 1,920 | |
| | | | | | | | | 74,059 | |
| | Switzerland—7.0% | | | | | | | | |
| | Belimo Holding AG (Building products) | | | 441 | | | | 3,244 | |
| | Logitech International S.A. (Technology hardware, storage & peripherals) | | | 112,381 | | | | 7,337 | |
| | Lonza Group AG (Life sciences tools & services) | | | 38,665 | | | | 20,413 | |
| | Partners Group Holding AG (Capital markets) | | | 14,730 | | | | 13,361 | |
| * | SIG Combibloc Group AG (Containers & packaging) | | | 153,573 | | | | 2,485 | |
| | Sika AG (Chemicals) | | | 95,954 | | | | 18,468 | |
| * | Softwareone Holding AG (Electronic equipment, instruments & components) | | | 129,748 | | | | 3,205 | |
| | STMicroelectronics N.V. (Semiconductors & semiconductor equipment) | | | 452,002 | | | | 12,300 | |
| | Straumann Holding AG (Health care equipment & supplies) | | | 12,026 | | | | 10,332 | |
| | Tecan Group AG (Life sciences tools & services) | | | 12,056 | | | | 4,270 | |
| | Temenos AG (Software) | | | 57,642 | | | | 8,952 | |
| | VAT Group AG (Machinery) | | | 22,222 | | | | 4,058 | |
| | | | | | | | | 108,425 | |
| | | | | | | | | | |
| | Emerging Asia—22.4% | | | | | | | | |
| | China—14.9% | | | | | | | | |
| | A-Living Services Co., Ltd. Class “H” (Commercial services & supplies) | | | 607,750 | | | | 3,062 | |
| | Aier Eye Hospital Group Co., Ltd. Class “A” (Health care providers & services) | | | 985,230 | | | | 6,051 | |
| | AK Medical Holdings, Ltd. (Health care equipment & supplies) | | | 706,000 | | | | 2,245 | |
| * | Alibaba Group Holding, Ltd. (Internet & direct marketing retail) | | | 1,202,500 | | | | 32,520 | |
| | Centre Testing International Group Co., Ltd. Class “A” (Professional services) | | | 2,198,900 | | | | 6,142 | |
| | Country Garden Services Holdings Co., Ltd. (Commercial services & supplies) | | | 1,423,000 | | | | 6,610 | |
| | Foshan Haitian Flavouring & Food Co., Ltd. Class “A” (Food products) | | | 321,940 | | | | 5,661 | |
| | Hangzhou Tigermed Consulting Co., Ltd. Class “A” (Life sciences tools & services) | | | 479,700 | | | | 6,909 | |
| | Kweichow Moutai Co., Ltd. Class “A” (Beverages) | | | 51,217 | | | | 10,591 | |
| | | | | | | | |
| | | | | | | | |
| | Issuer | | Shares | | | Value | |
| | | | | | | | | | |
| | Common Stocks—(continued) | | | | | | | | |
| | | | | | | | | | |
| | Emerging Asia—(continued) | | | | | | | | |
| | China—(continued) | | | | | | | | |
| | Li Ning Co., Ltd. (Textiles, apparel & luxury goods) | | | 2,477,500 | | | $ | 7,864 | |
| * | Meituan Dianping Class “B” (Internet & direct marketing retail) | | | 409,100 | | | | 9,073 | |
| | NAURA Technology Group Co., Ltd. Class “A” (Electronic equipment, instruments & components) | | | 173,400 | | | | 4,189 | |
| | NetEase, Inc.—ADR (Entertainment) | | | 32,542 | | | | 13,973 | |
| | Offcn Education Technology Co., Ltd. Class “A” (Diversified consumer services) | | | 924,100 | | | | 3,625 | |
| | Ping An Insurance Group Co. of China, Ltd. Class “H” (Insurance) | | | 1,704,500 | | | | 17,044 | |
| | Shenzhen Mindray Bio-Medical Electronics Co., Ltd. Class “A” (Health care equipment & supplies) | | | 97,100 | | | | 4,196 | |
| | Shenzhou International Group Holdings, Ltd. (Textiles, apparel & luxury goods) | | | 384,400 | | | | 4,632 | |
| | Silergy Corporation (Semiconductors & semiconductor equipment) | | | 128,000 | | | | 8,330 | |
| * | TAL Education Group—ADR (Diversified consumer services) | | | 255,772 | | | | 17,490 | |
| | Tencent Holdings, Ltd. (Interactive Media & Services) | | | 607,100 | | | | 39,056 | |
| * | Tencent Music Entertainment Group—ADR (Entertainment) | | | 173,096 | | | | 2,330 | |
| * | Topchoice Medical Corporation Class “A” (Health care providers & services) | | | 199,400 | | | | 4,701 | |
| | Vitasoy International Holdings, Ltd. (Food products) | | | 392,000 | | | | 1,500 | |
| | Will Semiconductor, Ltd. Class “A” (Semiconductors & semiconductor equipment) | | | 80,670 | | | | 2,303 | |
| | WuXi AppTec Co., Ltd. Class “A” (Life sciences tools & services) | | | 283,864 | | | | 3,876 | |
| * | Wuxi Biologics Cayman, Inc. (Life sciences tools & services) | | | 348,000 | | | | 6,367 | |
| | | | | | | | | 230,340 | |
| | India—1.5% | | | | | | | | |
| | HDFC Bank, Ltd. (Banks) | | | 408,661 | | | | 5,772 | |
| | Ipca Laboratories, Ltd. (Pharmaceuticals) | | | 101,169 | | | | 2,241 | |
| | Pidilite Industries, Ltd. (Chemicals) | | | 135,136 | | | | 2,457 | |
| * | Reliance Industries, Ltd. (Oil, gas & consumable fuels) | | | 39,923 | | | | 423 | |
| | Reliance Industries, Ltd. (Oil, gas & consumable fuels) | | | 550,406 | | | | 12,447 | |
| | | | | | | | | 23,340 | |
| | Indonesia—1.0% | | | | | | | | |
| | PT Bank Central Asia Tbk (Banks) | | | 7,449,006 | | | | 14,849 | |
| | South Korea—0.9% | | | | | | | | |
| | Kakao Corporation (Interactive Media & Services) | | | 31,025 | | | | 6,899 | |
| | Samsung SDI Co., Ltd. (Electronic equipment, instruments & components) | | | 25,568 | | | | 7,727 | |
| | | | | | | | | 14,626 | |
See accompanying Notes to Financial Statements.
| 50 | Semiannual Report | June 30, 2020 |
Institutional International Growth Fund
Portfolio of Investments, June 30, 2020 (all dollar amounts in thousands) (unaudited)
| | | | | | | | |
| | | | | | | | |
| | Issuer | | Shares | | | Value | |
| | | | | | | | | | |
| | Common Stocks—(continued) | | | | | | | | |
| | | | | | | | | | |
| | Emerging Asia—(continued) | | | | | | | | |
| | Taiwan—3.1% | | | | | | | | |
| | Globalwafers Co., Ltd. (Semiconductors & semiconductor equipment) | | | 220,000 | | | $ | 3,005 | |
| | MediaTek, Inc. (Semiconductors & semiconductor equipment) | | | 991,000 | | | | 19,447 | |
| | Taiwan Semiconductor Manufacturing Co., Ltd.—ADR (Semiconductors & semiconductor equipment) | | | 439,012 | | | | 24,923 | |
| | | | | | | | | 47,375 | |
| | Thailand—1.0% | | | | | | | | |
| | Airports of Thailand PCL (Transportation infrastructure) | | | 1,196,500 | | | | 2,342 | |
| * | Sea, Ltd.—ADR (Entertainment) | | | 119,174 | | | | 12,780 | |
| | | | | | | | | 15,122 | |
| | | | | | | | | | |
| | Japan—12.5% | | | | | | | | |
| | Asahi Intecc Co., Ltd. (Health care equipment & supplies) | | | 241,200 | | | | 6,847 | |
| | Daikin Industries, Ltd. (Building products) | | | 104,700 | | | | 16,809 | |
| | Disco Corporation (Semiconductors & semiconductor equipment) | | | 37,100 | | | | 8,964 | |
| | GMO Payment Gateway, Inc. (IT services) | | | 41,700 | | | | 4,341 | |
| | Harmonic Drive Systems, Inc. (Machinery) | | | 69,200 | | | | 3,788 | |
| | Hoya Corporation (Health care equipment & supplies) | | | 115,400 | | | | 10,965 | |
| | Keyence Corporation (Electronic equipment, instruments & components) | | | 70,600 | | | | 29,443 | |
| | Meitec Corporation (Professional services) | | | 36,800 | | | | 1,769 | |
| | MISUMI Group, Inc. (Machinery) | | | 177,500 | | | | 4,429 | |
| | MonotaRO Co., Ltd. (Trading companies & distributors) | | | 158,600 | | | | 6,345 | |
| | Nihon M&A Center, Inc. (Professional services) | | | 180,600 | | | | 8,146 | |
| | Nomura Research Institute, Ltd. (IT services) | | | 313,300 | | | | 8,493 | |
| | NS Solutions Corporation (IT services) | | | 63,800 | | | | 1,740 | |
| | Omron Corporation (Electronic equipment, instruments & components) | | | 245,900 | | | | 16,443 | |
| | Persol Holdings Co., Ltd. (Professional services) | | | 263,700 | | | | 3,614 | |
| | Shimadzu Corporation (Electronic equipment, instruments & components) | | | 173,700 | | | | 4,614 | |
| | Shiseido Co., Ltd. (Personal products) | | | 189,300 | | | | 11,983 | |
| | SMC Corporation (Machinery) | | | 43,200 | | | | 22,077 | |
| | Sushiro Global Holdings, Ltd. (Hotels, restaurants & leisure) | | | 124,400 | | | | 2,734 | |
| | TechnoPro Holdings, Inc. (Professional services) | | | 60,600 | | | | 3,452 | |
| | Terumo Corporation (Health care equipment & supplies) | | | 253,800 | | | | 9,592 | |
| | TIS, Inc. (IT services) | | | 295,900 | | | | 6,232 | |
| | | | | | | | | 192,820 | |
| | | | | | | | |
| | | | | | | | |
| | Issuer | | Shares | | | Value | |
| | | | | | | | | | |
| | Common Stocks—(continued) | | | | | | | | |
| | | | | | | | | | |
| | United Kingdom—11.7% | | | | | | | | |
| | 3i Group plc (Capital markets) | | | 450,907 | | | $ | 4,652 | |
| | Abcam plc (Biotechnology) | | | 114,837 | | | | 1,897 | |
| | Ashtead Group plc (Trading companies & distributors) | | | 277,469 | | | | 9,348 | |
| | Avast plc (Software) | | | 771,605 | | | | 5,053 | |
| | AVEVA Group plc (Software) | | | 88,269 | | | | 4,476 | |
| | Big Yellow Group plc (Equity REIT) | | | 242,297 | | | | 3,014 | |
| * | boohoo Group plc (Internet & direct marketing retail) | | | 818,136 | | | | 4,177 | |
| | Compass Group plc (Hotels, restaurants & leisure) | | | 916,277 | | | | 12,625 | |
| | Croda International plc (Chemicals) | | | 91,869 | | | | 5,983 | |
| | Diageo plc (Beverages) | | | 413,511 | | | | 13,740 | |
| | Experian plc (Professional services) | | | 531,724 | | | | 18,573 | |
| | Greggs plc (Hotels, restaurants & leisure) | | | 204,212 | | | | 4,099 | |
| | Halma plc (Electronic equipment, instruments & components) | | | 437,687 | | | | 12,490 | |
| | Intermediate Capital Group plc (Capital markets) | | | 348,926 | | | | 5,573 | |
| | Intertek Group plc (Professional services) | | | 104,956 | | | | 7,075 | |
| | London Stock Exchange Group plc (Capital markets) | | | 149,958 | | | | 15,530 | |
| | RELX plc (Professional services) | | | 472,395 | | | | 10,946 | |
| | Renishaw plc (Electronic equipment, instruments & components) | | | 51,718 | | | | 2,579 | |
| | Rentokil Initial plc (Commercial services & supplies) | | | 1,739,240 | | | | 10,982 | |
| | Rotork plc (Machinery) | | | 1,227,921 | | | | 4,260 | |
| | Segro plc (Equity REIT) | | | 883,364 | | | | 9,797 | |
| | Softcat plc (IT services) | | | 176,538 | | | | 2,384 | |
| | Spirax-Sarco Engineering plc (Machinery) | | | 79,069 | | | | 9,774 | |
| * | Trainline plc (Internet & direct marketing retail) | | | 375,243 | | | | 2,020 | |
| | | | | | | | | 181,047 | |
| | | | | | | | | | |
| | Western Hemisphere—4.5% | | | | | | | | |
| | Canada—4.3% | | | | | | | | |
| | Alimentation Couche-Tard, Inc. Class “B” (Food & staples retailing) | | | 348,222 | | | | 10,919 | |
| | Brookfield Asset Management, Inc. Class “A” (Capital markets)† | | | 333,947 | | | | 10,987 | |
| | Canadian National Railway Co. (Road & rail) | | | 234,588 | | | | 20,755 | |
| | Enghouse Systems, Ltd. (Software) | | | 56,388 | | | | 3,011 | |
| * | Kinaxis, Inc. (Software) | | | 29,347 | | | | 4,195 | |
| * | Lululemon Athletica, Inc. (Textiles, apparel & luxury goods) | | | 47,283 | | | | 14,753 | |
| | Toromont Industries, Ltd. (Trading companies & distributors) | | | 42,697 | | | | 2,119 | |
| | | | | | | | | 66,739 | |
| | United States—0.2% | | | | | | | | |
| | Benefit One, Inc. (Professional services) | | | 163,200 | | | | 3,272 | |
See accompanying Notes to Financial Statements.
| June 30, 2020 | William Blair Funds | 51 |
Institutional International Growth Fund
Portfolio of Investments, June 30, 2020 (all dollar amounts in thousands) (unaudited)
| | | | | | | | |
| | | | | | | | |
| | Issuer | | Shares | | | Value | |
| | | | | | | | | | |
| | Common Stocks—(continued) | | | | | | | | |
| | | | | | | | | | |
| | Asia—3.8% | | | | | | | | |
| | Australia—2.2% | | | | | | | | |
| | Aristocrat Leisure, Ltd. (Hotels, restaurants & leisure) | | | 468,591 | | | $ | 8,246 | |
| * | Atlassian Corporation plc Class “A” (Software)† | | | 54,683 | | | | 9,858 | |
| | CSL, Ltd. (Biotechnology) | | | 53,765 | | | | 10,649 | |
| | Goodman Group (Equity REIT) | | | 555,264 | | | | 5,690 | |
| | | | | | | | | 34,443 | |
| | Hong Kong—1.6% | | | | | | | | |
| | AIA Group, Ltd. (Insurance) | | | 2,543,663 | | | | 23,728 | |
| | | | | | | | | | |
| | Emerging Latin America—2.1% | | | | | | | | |
| | Argentina—0.8% | | | | | | | | |
| * | Globant S.A. (Software)† | | | 26,429 | | | | 3,961 | |
| * | MercadoLibre, Inc. (Internet & direct marketing retail) | | | 8,492 | | | | 8,371 | |
| | | | | | | | | 12,332 | |
| | Brazil—1.2% | | | | | | | | |
| | B3 S.A.—Brasil Bolsa Balcao (Capital markets) | | | 734,600 | | | | 7,442 | |
| | Lojas Renner S.A. (Multiline retail) | | | 237,460 | | | | 1,825 | |
| | Magazine Luiza S.A. (Multiline retail) | | | 408,800 | | | | 5,386 | |
| | Notre Dame Intermedica Participacoes S.A. (Health care providers & services) | | | 312,500 | | | | 3,908 | |
| | | | | | | | | 18,561 | |
| | Mexico—0.1% | | | | | | | | |
| | Grupo Aeroportuario del Sureste S.A.B. de C.V.—ADR (Transportation infrastructure) | | | 21,900 | | | | 2,459 | |
| | | | | | | | | | |
| | Emerging Europe—0.5% | | | | | | | | |
| | Russia—0.5% | | | | | | | | |
| * | Yandex N.V. Class “A” (Interactive Media & Services)† | | | 155,387 | | | | 7,772 | |
| | Total Common Stocks—100.2%
(cost $1,128,494) | | | | | | | 1,548,395 | |
| | | | | | | | |
| | | | Principal | | | | |
| | Issuer | | Amount | | | Value | |
| | | | | | | | |
| | Repurchase Agreement | | | | | | |
| | Fixed Income Clearing Corporation, 0.000% dated 6/30/20, due 7/1/20, repurchase price $4,201, collateralized by U.S. Treasury Note, 1.625%, due 2/15/26, valued at $4,285 | | $ | 4,201 | | | $ | 4,201 | |
| | Total Repurchase Agreement—0.3%
(cost $4,201) | | | | | | | 4,201 | |
| | Total Investments—100.5%
(cost $1,132,695) | | | | | | | 1,552,596 | |
| | Liabilities, plus cash and other assets—(0.5)% | | | | | | | (7,214 | ) |
| | Net assets—100.0% | | | | | | $ | 1,545,382 | |
ADR = American Depository Receipt
REIT = Real Estate Investment Trust
* = Non-income producing security
† = U.S. listed foreign security
For securities primarily traded on exchanges or markets that close before the close of regular trading on the New York Stock Exchange, the Fund may use an independent pricing service to fair value price the securities pursuant to Valuation Procedures approved by the Board of Trustees.
At June 30, 2020, the Fund’s Portfolio of Investments includes the following industry categories (as a percentage of long-term investments):
| Information Technology | | | 26.5 | % |
| Industrials | | | 22.5 | % |
| Consumer Discretionary | | | 13.1 | % |
| Health Care | | | 12.0 | % |
| Financials | | | 8.1 | % |
| Consumer Staples | | | 5.6 | % |
| Communication Services | | | 5.3 | % |
| Materials | | | 2.3 | % |
| Real Estate | | | 2.2 | % |
| Energy | | | 1.7 | % |
| Utilities | | | 0.7 | % |
| Total | | | 100.0 | % |
At June 30, 2020, the Fund’s Portfolio of Investments includes the following currency categories (as a percentage of long-term investments):
| Euro | | | 24.3 | % |
| Japanese Yen | | | 12.7 | % |
| British Pound Sterling | | | 11.7 | % |
| Hong Kong Dollar | | | 9.9 | % |
| U.S. Dollar | | | 9.8 | % |
| Swiss Franc | | | 6.2 | % |
| Danish Krone | | | 5.3 | % |
| Swedish Krona | | | 4.8 | % |
| Chinese Yuan Renminbi | | | 3.8 | % |
| Canadian Dollar | | | 2.6 | % |
| New Taiwan Dollar | | | 2.0 | % |
| Australian Dollar | | | 1.6 | % |
| Indian Rupee | | | 1.5 | % |
| Brazilian Real | | | 1.2 | % |
| All Other Currencies | | | 2.6 | % |
| Total | | | 100.0 | % |
See accompanying Notes to Financial Statements.
| 52 | Semiannual Report | June 30, 2020 |
| | International Small Cap Growth Fund |
| | |
| | The International Small Cap Growth Fund seeks long-term capital appreciation. |
| | |
| | AN OVERVIEW FROM THE PORTFOLIO MANAGERS |
| | |

Simon Fennell 
Andrew G. Flynn | The William Blair International Small Cap Growth Fund (Class N shares) posted a 3.10% decrease, net of fees, for the six months ended June 30, 2020. By comparison, the Fund’s benchmark index, the MSCI All Country World ex-U.S. Small Cap Index (net) (the “Index”), decreased 12.80%. Six month outperformance was driven by positive stock selection effects across most sectors, led by Industrials. Notable contributors within Industrials were Japanese holdings Nihon M&A Center and MonotaRO. Nihon M&A Center is a high-quality Japanese growth company that provides advisory services to small and medium-sized enterprises facing succession-oriented challenges. It is led by an entrepreneurial management team that has built an attractive network of national relationships aimed at identifying buyers and sellers and sourcing transactions. Maintenance, repair and operations company MonotaRO offers over 10 million products across 7 industrial categories using a single transparent price for each product and overnight delivery. The company leverages its extensive customer data base to predict client order trends, apply targeted promotions and manage inventory. Partially offsetting these positive effects were negative stock selection in the Consumer Staples and Healthcare sectors. Within Consumer Staples, South African holding Clicks Group underperformed. Clicks is a drugstore retailer with a leading market position and high returns business model, and a management team with a long track record of valuation creation. The stock weakened during the second quarter amid investor concerns over management’s cautious outlook and a challenging economic backdrop in South Africa. Within Healthcare, Germany-based Carl Zeiss Meditec underperformed. The company is one of the leading suppliers of surgical tools and equipment for the diagnosis and treatment of ophthalmic conditions. Its share price was negatively impacted by COVID-19 lockdowns and weak patient volumes during the period. Please refer to the Global Markets Review and Outlook relating to the Fund beginning on page 31. |
| June 30, 2020 | William Blair Funds | 53 |
International Small Cap Growth Fund
Performance Highlights (Unaudited)
Average Annual Total Return through 6/30/2020
| | | Year
to Date | | 1 Year | | 3 Year | | 5 Year | | 10 Year |
| Class N | | | (3.10 | )% | | | 9.21 | % | | | 3.53 | % | | | 4.83 | % | | | 7.86 | % |
| Class I | | | (2.93 | ) | | | 9.53 | | | | 3.85 | | | | 5.16 | | | | 8.19 | |
| Class R6 | | | (2.85 | ) | | | 9.70 | | | | 3.94 | | | | 5.25 | | | | 8.35 | |
| MSCI ACW Ex-U.S. Small Cap Index (net) | | | (12.80 | ) | | | (4.34 | ) | | | (0.17 | ) | | | 2.50 | | | | 6.05 | |
Performance cited represents past performance. Past performance does not guarantee future results and current performance may be lower or higher than the data quoted. Results shown are average annual returns, which assume reinvestment of dividends and capital gains. Investment returns and principal will fluctuate and you may have a gain or loss when you sell shares. For the most current month-end performance information, please call 1-800-742-7272, or visit our Web site at www.williamblairfunds.com. From time to time, the investment adviser may waive fees or reimburse expenses for the Fund. Without these waivers/reimbursements, performance would be lower. Investing in smaller companies involves special risks, including higher volatility and lower liquidity. Smaller capitalization stocks are also more sensitive to purchase/sale transactions and changes in the issuer’s financial condition. International investing involves special risk considerations, including currency fluctuations, lower liquidity, economic and political risk. Class N shares are not subject to a sales load. Class I shares are not subject to a sales load or distribution (Rule 12b-1) fees. Class R6 shares are not subject to a sales load, distribution (Rule 12b-1) fees, or sub-transfer agent fees.
The performance highlights and graph presented above do not reflect the deduction of taxes that a shareholder would pay on fund distributions or the redemption of fund shares.
The Morgan Stanley Capital International (MSCI) All Country World (ACW) Ex-U.S. Small Cap Index (net) is a free float-adjusted market capitalization weighted index that is designed to measure the equity market performance of small capitalization developed and emerging markets, excluding the United States. This index approximates the minimum possible dividend reinvestment by deducting for the highest possible withholding tax rates of those markets.
This report identifies the Fund’s investments on June 30, 2020. These holdings are subject to change. Not all stocks in the Fund performed the same, nor is there any guarantee that these stocks will perform as well in the future. Market forecasts provided in this report may not necessarily come to pass.
Sector Diversification (Unaudited)
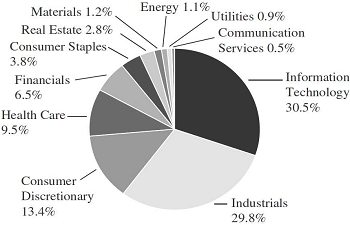
The sector diversification shown is based on the total long-term securities.
| 54 | Semiannual Report | June 30, 2020 |
International Small Cap Growth Fund
Portfolio of Investments, June 30, 2020 (all dollar amounts in thousands) (unaudited)
| | | | | | | | |
| | | | | | | | |
| | Issuer | | Shares | | | Value | |
| | | | | | | | | | |
| | Common Stocks | | | | | | | | |
| | | | | | | | | | |
| | Europe, Mid-East—43.4% | | | | | | | | |
| | Belgium—1.8% | | | | | | | | |
| | Melexis N.V. (Semiconductors & semiconductor equipment) | | | 34,349 | | | $ | 2,605 | |
| | Warehouses De Pauw CVA (Equity REIT) | | | 79,098 | | | | 2,159 | |
| | | | | | | | | 4,764 | |
| | Denmark—4.3% | | | | | | | | |
| * | Netcompany Group A/S (Software) | | | 69,562 | | | | 4,562 | |
| * | Royal Unibrew A/S (Beverages) | | | 36,509 | | | | 3,037 | |
| | SimCorp A/S (Software) | | | 19,087 | | | | 2,058 | |
| | Tryg A/S (Insurance) | | | 52,708 | | | | 1,526 | |
| | | | | | | | | 11,183 | |
| | Faroe Islands—1.2% | | | | | | | | |
| * | Bakkafrost P/F (Food products) | | | 48,118 | | | | 3,027 | |
| | Germany—6.4% | | | | | | | | |
| * | Carl Zeiss Meditec AG (Health care equipment & supplies) | | | 37,962 | | | | 3,702 | |
| * | HelloFresh SE (Internet & direct marketing retail) | | | 71,694 | | | | 3,818 | |
| | Siltronic AG (Semiconductors & semiconductor equipment) | | | 41,451 | | | | 4,228 | |
| * | TeamViewer AG (Software) | | | 93,522 | | | | 5,106 | |
| | | | | | | | | 16,854 | |
| | Israel—2.4% | | | | | | | | |
| * | CyberArk Software, Ltd. (Software)† | | | 28,652 | | | | 2,844 | |
| | Elbit Systems, Ltd. (Aerospace & defense) | | | 12,070 | | | | 1,652 | |
| | Strauss Group, Ltd. (Food products) | | | 61,483 | | | | 1,703 | |
| | | | | | | | | 6,199 | |
| | Italy—2.2% | | | | | | | | |
| * | Amplifon SpA (Health care providers & services) | | | 99,851 | | | | 2,660 | |
| * | Brunello Cucinelli SpA (Textiles, apparel & luxury goods) | | | 38,986 | | | | 1,158 | |
| * | Nexi SpA (IT services) | | | 117,320 | | | | 2,030 | |
| | | | | | | | | 5,848 | |
| | Jersey—0.7% | | | | | | | | |
| | Sanne Group plc (Capital markets) | | | 230,559 | | | | 1,800 | |
| | Netherlands—2.7% | | | | | | | | |
| | BE Semiconductor Industries N.V. (Semiconductors & semiconductor equipment) | | | 45,672 | | | | 2,035 | |
| | Euronext N.V. (Capital markets) | | | 28,012 | | | | 2,809 | |
| | IMCD N.V. (Trading companies & distributors) | | | 23,413 | | | | 2,201 | |
| | | | | | | | | 7,045 | |
| | Norway—1.3% | | | | | | | | |
| | TOMRA Systems ASA (Commercial services & supplies) | | | 91,378 | | | | 3,352 | |
| | Spain—0.9% | | | | | | | | |
| | EDP Renovaveis S.A. (Independent power & renewable electricity producers) | | | 173,479 | | | | 2,397 | |
| | | | | | | | |
| | | | | | | | |
| | Issuer | | Shares | | | Value | |
| | | | | | | | | | |
| | Common Stocks—(continued) | | | | | | | | |
| | | | | | | | | | |
| | Europe, Mid-East—(continued) | | | | | | | | |
| | Sweden—12.5% | | | | | | | | |
| | AddTech AB Class “B” (Trading companies & distributors) | | | 61,642 | | | $ | 2,477 | |
| | Arjo AB Class “B” (Health care equipment & supplies) | | | 302,432 | | | | 1,681 | |
| | Beijer Ref AB (Trading companies & distributors) | | | 107,740 | | | | 3,254 | |
| * | Biotage AB (Life sciences tools & services) | | | 53,433 | | | | 799 | |
| | Evolution Gaming Group AB (Hotels, restaurants & leisure) | | | 62,784 | | | | 3,743 | |
| * | Indutrade AB (Trading companies & distributors) | | | 148,784 | | | | 5,876 | |
| | Investment AB Latour Class “B” (Industrial conglomerates) | | | 81,577 | | | | 1,479 | |
| | Lifco AB Class “B” (Industrial conglomerates) | | | 59,746 | | | | 3,783 | |
| | MIPS AB (Leisure products) | | | 84,376 | | | | 2,910 | |
| * | Nolato AB Class “B” (Industrial conglomerates) | | | 41,436 | | | | 2,793 | |
| | Sweco AB Class “B” (Construction & engineering) | | | 49,345 | | | | 2,216 | |
| * | Vitrolife AB (Biotechnology) | | | 81,153 | | | | 1,815 | |
| | | | | | | | | 32,826 | |
| | Switzerland—7.0% | | | | | | | | |
| | Belimo Holding AG (Building products) | | | 235 | | | | 1,729 | |
| | Galenica AG (Health care providers & services) | | | 23,093 | | | | 1,653 | |
| | Kardex AG (Machinery) | | | 15,748 | | | | 2,872 | |
| * | Siegfried Holding AG (Life sciences tools & services) | | | 2,468 | | | | 1,120 | |
| * | SIG Combibloc Group AG (Containers & packaging) | | | 97,823 | | | | 1,583 | |
| * | Softwareone Holding AG (Electronic equipment, instruments & components) | | | 149,670 | | | | 3,696 | |
| | Tecan Group AG (Life sciences tools & services) | | | 6,851 | | | | 2,427 | |
| | VAT Group AG (Machinery) | | | 18,634 | | | | 3,402 | |
| | | | | | | | | 18,482 | |
| | | | | | | | | | |
| | United Kingdom—16.4% | | | | | | | | |
| | Abcam plc (Biotechnology) | | | 113,334 | | | | 1,872 | |
| | Avast plc (Software) | | | 447,937 | | | | 2,933 | |
| | AVEVA Group plc (Software) | | | 89,882 | | | | 4,557 | |
| | Beazley plc (Insurance) | | | 545,490 | | | | 2,771 | |
| | Big Yellow Group plc (Equity REIT) | | | 143,386 | | | | 1,784 | |
| * | boohoo Group plc (Internet & direct marketing retail) | | | 881,742 | | | | 4,501 | |
| | Burford Capital, Ltd. (Capital markets) | | | 78,411 | | | | 452 | |
| | Diploma plc (Trading companies & distributors) | | | 173,078 | | | | 3,850 | |
| | Hill & Smith Holdings plc (Metals & mining) | | | 88,960 | | | | 1,371 | |
| | Intermediate Capital Group plc (Capital markets) | | | 267,978 | | | | 4,280 | |
See accompanying Notes to Financial Statements.
| June 30, 2020 | William Blair Funds | 55 |
International Small Cap Growth Fund
Portfolio of Investments, June 30, 2020 (all dollar amounts in thousands) (unaudited)
| | | | | | | | |
| | | | | | | | |
| | Issuer | | Shares | | | Value | |
| | | | | | | | | | |
| | Common Stocks—(continued) | | | | | | | | |
| | | | | | | | | | |
| | United Kingdom—(continued) | | | | | | | | |
| | Renishaw plc (Electronic equipment, instruments & components) | | | 92,351 | | | $ | 4,605 | |
| | Rotork plc (Machinery) | | | 700,677 | | | | 2,431 | |
| | Safestore Holdings plc (Equity REIT) | | | 250,099 | | | | 2,250 | |
| | Softcat plc (IT services) | | | 151,908 | | | | 2,052 | |
| * | Trainline plc (Internet & direct marketing retail) | | | 417,580 | | | | 2,248 | |
| | Workspace Group plc (Equity REIT) | | | 124,535 | | | | 1,008 | |
| | | | | | | | | 42,965 | |
| | | | | | | | | | |
| | Emerging Asia—12.9% | | | | | | | | |
| | Cambodia—0.7% | | | | | | | | |
| | NagaCorp, Ltd. (Hotels, restaurants & leisure) | | | 1,748,000 | | | | 2,023 | |
| | China—5.0% | | | | | | | | |
| | A-Living Services Co., Ltd. Class “H” (Commercial services & supplies) | | | 480,750 | | | | 2,422 | |
| | AK Medical Holdings, Ltd. (Health care equipment & supplies) | | | 542,000 | | | | 1,724 | |
| | Country Garden Services Holdings Co., Ltd. (Commercial services & supplies) | | | 513,000 | | | | 2,383 | |
| * | GSX Techedu, Inc.—ADR (Diversified consumer services) | | | 34,826 | | | | 2,089 | |
| | Silergy Corporation (Semiconductors & semiconductor equipment) | | | 48,000 | | | | 3,123 | |
| | Travelsky Technology, Ltd. Class “H” (IT services) | | | 746,000 | | | | 1,313 | |
| | | | | | | | | 13,054 | |
| | India—1.1% | | | | | | | | |
| | AU Small Finance Bank, Ltd. (Banks) | | | 66,984 | | | | 480 | |
| | Ipca Laboratories, Ltd. (Pharmaceuticals) | | | 56,600 | | | | 1,253 | |
| | Motherson Sumi Systems, Ltd. (Auto components) | | | 956,732 | | | | 1,198 | |
| | | | | | | | | 2,931 | |
| | South Korea—0.5% | | | | | | | | |
| | Koh Young Technology, Inc. (Semiconductors & semiconductor equipment) | | | 15,275 | | | | 1,270 | |
| | Taiwan—5.6% | | | | | | | | |
| | ASPEED Technology, Inc. (Semiconductors & semiconductor equipment) | | | 36,000 | | | | 1,513 | |
| | Chailease Holding Co., Ltd. (Diversified financial services) | | | 633,085 | | | | 2,682 | |
| | Feng TAY Enterprise Co., Ltd. (Textiles, apparel & luxury goods) | | | 605,400 | | | | 3,416 | |
| | Globalwafers Co., Ltd. (Semiconductors & semiconductor equipment) | | | 270,000 | | | | 3,688 | |
| | Tripod Technology Corporation (Electronic equipment, instruments & components) | | | 322,000 | | | | 1,430 | |
| | Voltronic Power Technology Corporation (Electrical equipment) | | | 68,000 | | | | 1,950 | |
| | | | | | | | | 14,679 | |
| | | | | | | | |
| | | | | | | | |
| | Issuer | | Shares | | | Value | |
| | | | | | | | | | |
| | Common Stocks—(continued) | | | | | | | | |
| | | | | | | | | | |
| | Japan—12.6% | | | | | | | | |
| | Asahi Intecc Co., Ltd. (Health care equipment & supplies) | | | 47,400 | | | $ | 1,345 | |
| | GMO Payment Gateway, Inc. (IT services) | | | 21,300 | | | | 2,217 | |
| | Harmonic Drive Systems, Inc. (Machinery) | | | 70,100 | | | | 3,837 | |
| | JINS Holdings, Inc. (Specialty retail) | | | 24,000 | | | | 1,456 | |
| | MonotaRO Co., Ltd. (Trading companies & distributors) | | | 60,900 | | | | 2,436 | |
| | Nihon M&A Center, Inc. (Professional services) | | | 158,300 | | | | 7,140 | |
| | Nihon Unisys, Ltd. (IT services) | | | 126,800 | | | | 3,952 | |
| | SMS Co., Ltd. (Professional services) | | | 50,200 | | | | 1,124 | |
| | Sushiro Global Holdings, Ltd. (Hotels, restaurants & leisure) | | | 109,500 | | | | 2,406 | |
| | TechnoPro Holdings, Inc. (Professional services) | | | 52,700 | | | | 3,002 | |
| | TIS, Inc. (IT services) | | | 190,400 | | | | 4,010 | |
| | | | | | | | | 32,925 | |
| | | | | | | | | | |
| | Western Hemisphere—5.5% | | | | | | | | |
| | Canada—4.4% | | | | | | | | |
| | Enghouse Systems, Ltd. (Software) | | | 41,892 | | | | 2,237 | |
| * | Kinaxis, Inc. (Software) | | | 21,345 | | | | 3,051 | |
| | Parkland Corporation (Oil, gas & consumable fuels) | | | 113,168 | | | | 2,810 | |
| | Toromont Industries, Ltd. (Trading companies & distributors) | | | 68,517 | | | | 3,400 | |
| | | | | | | | | 11,498 | |
| | United States—1.1% | | | | | | | | |
| | Benefit One, Inc. (Professional services) | | | 151,500 | | | | 3,038 | |
| | | | | | | | | | |
| | Emerging Latin America—2.8% | | | | | | | | |
| | Argentina—1.6% | | | | | | | | |
| * | Globant S.A. (Software)† | | | 27,999 | | | | 4,196 | |
| | Brazil—0.4% | | | | | | | | |
| | Arezzo Industria e Comercio S.A. (Textiles, apparel & luxury goods) | | | 113,000 | | | | 995 | |
| | Mexico—0.8% | | | | | | | | |
| * | Grupo Aeroportuario del Centro Norte S.A.B. de C.V. (Transportation infrastructure) | | | 479,900 | | | | 2,231 | |
| | | | | | | | | | |
| | Emerging Europe, Mid-East, Africa—2.8% | | | |
| | Greece—0.9% | | | | | | | | |
| | OPAP S.A. (Hotels, restaurants & leisure) | | | 258,029 | | | | 2,448 | |
| | South Africa—0.7% | | | | | | | | |
| | Clicks Group, Ltd. (Food & staples retailing) | | | 154,526 | | | | 1,874 | |
| | United Arab Emirates—1.2% | | | | | | | | |
| * | Network International Holdings plc (IT services) | | | 552,514 | | | | 3,019 | |
See accompanying Notes to Financial Statements.
| 56 | Semiannual Report | June 30, 2020 |
International Small Cap Growth Fund
Portfolio of Investments, June 30, 2020 (all dollar amounts in thousands) (unaudited)
| | | | Shares or | | | | |
| | | | Principal | | | | |
| | Issuer | | Amount | | | Value | |
| | | | | | | | | | |
| | Common Stocks—(continued) | | | | | | | | |
| | | | | | | | | | |
| | Asia—1.4% | | | | | | | | |
| | New Zealand—1.4% | | | | | | | | |
| | Ryman Healthcare, Ltd. (Health care providers & services) | | | 267,319 | | | $ | 2,256 | |
| | Spark New Zealand, Ltd. (Diversified telecommunication services) | | | 447,074 | | | | 1,316 | |
| | | | | | | | | 3,572 | |
| | Total Common Stocks—97.8%
(cost $208,186) | | | | | | | 256,495 | |
| | | | | | | | | | |
| | Repurchase Agreement | | | | | | | | |
| | Fixed Income Clearing Corporation, 0.000% dated 6/30/20, due 7/1/20, repurchase price $4,786, collateralized by U.S. Treasury Note, 1.625%, due 2/15/26, valued at $4,882 | | | $4,786 | | | | 4,786 | |
| | Total Repurchase Agreement—1.8%
(cost $4,786) | | | | | | | 4,786 | |
| | Total Investments—99.6%
(cost $212,972) | | | | | | | 261,281 | |
| | Cash and other assets, less liabilities—0.4% | | | | | | | 1,060 | |
| | Net assets—100.0% | | | | | | $ | 262,341 | |
ADR = American Depository Receipt
REIT = Real Estate Investment Trust
* = Non-income producing security
† = U.S. listed foreign security
For securities primarily traded on exchanges or markets that close before the close of regular trading on the New York Stock Exchange, the Fund may use an independent pricing service to fair value price the securities pursuant to Valuation Procedures approved by the Board of Trustees.
At June 30, 2020, the Fund’s Portfolio of Investments includes the following industry categories (as a percentage of long-term investments):
| Information Technology | | | 30.5 | % |
| Industrials | | | 29.8 | % |
| Consumer Discretionary | | | 13.4 | % |
| Health Care | | | 9.5 | % |
| Financials | | | 6.5 | % |
| Consumer Staples | | | 3.8 | % |
| Real Estate | | | 2.8 | % |
| Materials | | | 1.2 | % |
| Energy | | | 1.1 | % |
| Utilities | | | 0.9 | % |
| Communication Services | | | 0.5 | % |
| Total | | | 100.0 | % |
At June 30, 2020, the Fund’s Portfolio of Investments includes the following currency categories (as a percentage of long-term investments):
| British Pound Sterling | | | 18.6 | % |
| Euro | | | 15.3 | % |
| Japanese Yen | | | 14.0 | % |
| Swedish Krona | | | 12.8 | % |
| Swiss Franc | | | 7.2 | % |
| New Taiwan Dollar | | | 6.9 | % |
| Canadian Dollar | | | 4.5 | % |
| Danish Krone | | | 4.4 | % |
| Hong Kong Dollar | | | 3.9 | % |
| U.S. Dollar | | | 3.6 | % |
| Norwegian Krone | | | 2.5 | % |
| New Zealand Dollar | | | 1.4 | % |
| Israeli Shekel | | | 1.3 | % |
| Indian Rupee | | | 1.1 | % |
| All Other Currencies | | | 2.5 | % |
| Total | | | 100.0 | % |
See accompanying Notes to Financial Statements.
| June 30, 2020 | William Blair Funds | 57 |
| | Emerging Markets Leaders Fund |
| | |
| | The Emerging Markets Leaders Fund seeks long-term capital appreciation. |
| | |
| | AN OVERVIEW FROM THE PORTFOLIO MANAGERS |
| | |

Todd M. McClone 
John C. Murphy | The William Blair Emerging Markets Leaders Fund (Class N shares) posted a 4.47% decrease, net of fees, for the six months ended June 30, 2020. By comparison, the Fund’s benchmark index, the MSCI Emerging Markets Index (net) (the “Index”) decreased 9.78%. Six-month outperformance versus the Index was primarily driven by strong relative results during the second quarter. Positive stock selection effects within Communication Services, Consumer Discretionary and Information Technology were the main drivers of relative performance. Within Communication Services, NetEase, a leading developer of self-developed PC and mobile games in China, helped relative returns. The company’s operating performance remained solid amid increased online customer engagement in gaming and rapid growth in its online education business. China Tourism Group Duty Free drove the outperformance within Consumer Discretionary. The strong rally in the second quarter more than offset weakness in the first quarter, which was mainly driven by the impact of travel restrictions on duty free sales. Stock selection in Information Technology was bolstered by strong performance by Taiwan-based semiconductor company MediaTek in the second quarter. Partially offsetting these positive effects was negative stock selection within the Financials and Industrials sectors. IRB Brasil Resseguros, the dominant reinsurance company in Brazil, weighed on performance as the stock fell amid a short seller report and corporate governance issues. We decided to sell the position due to ongoing governance concerns coupled with a challenging operating backdrop and growth outlook. Capitec is a high quality South African financial company with a strong brand and expanding product offering. The stock underperformed amid concerns about the bank’s unsecure credit business and weak macroeconomic conditions. Industrials performance was hampered by COVID-19 concerns impacting travel-related holdings—Airports of Thailand and Grupo Aeroportuario del Pacifico. Bidvest, the South African diversified services company, weakened on the deteriorating macro backdrop and investor sentiment amid South Africa’s credit rating downgrade. Please refer to the Global Markets Review and Outlook relating to the Fund beginning on page 31. |
| 58 | Semiannual Report | June 30, 2020 |
Emerging Markets Leaders Fund
Performance Highlights (Unaudited)
| Average Annual Total Return through 6/30/2020 |
| | | Year
to Date | | 1 Year | | 3 Year | | 5 Year | | 10 Year |
| Class N | | | (4.47 | )% | | | 4.76 | % | | | 5.85 | % | | | 4.10 | % | | | 4.34 | % |
| Class I | | | (4.28 | ) | | | 5.08 | | | | 6.15 | | | | 4.41 | | | | 4.63 | |
| Class R6 | | | (4.28 | ) | | | 5.13 | | | | 6.19 | | | | 4.48 | | | | 4.73 | |
| MSCI Emerging Markets Index (net) | | | (9.78 | ) | | | (3.39 | ) | | | 1.90 | | | | 2.86 | | | | 3.27 | |
Performance cited represents past performance. Past performance does not guarantee future results and current performance may be lower or higher than the data quoted. Results shown are average annual total returns, which assume reinvestment of dividends and capital gains. Investment returns and principal will fluctuate and you may have a gain or loss when you sell shares. For the most current month-end performance information, please call 1-800-742-7272, or visit our Web site at www.williamblairfunds.com. International investing involves special risk considerations, including currency fluctuations, lower liquidity, economic and political risk. These risks may be magnified when investing in emerging markets. From time to time, the investment adviser may waive fees or reimburse expenses for the Fund. Without these waivers/reimbursements, performance would be lower. Class N shares are not subject to a sales load. Class I shares are not subject to a sales load or distribution (Rule 12b-1) fees. Class R6 shares are not subject to a sales load, distribution (Rule 12b-1) fees, or sub-transfer agent fees.
The performance highlights and graph presented above do not reflect the deduction of taxes that a shareholder would pay on fund distributions or the redemption of fund shares.
The Morgan Stanley Capital International (MSCI) Emerging Markets Index (net) is a free float-adjusted market-capitalization-weighted index that is designed to measure equity market performance of emerging markets. This index approximates the minimum possible dividend reinvestment by deducting for the highest possible withholding tax rates of those markets.
This report identifies the Fund’s investments on June 30, 2020. These holdings are subject to change. Not all stocks in the Fund performed the same, nor is there any guarantee that these stocks will perform as well in the future. Market forecasts provided in this report may not necessarily come to pass.
Sector Diversification (Unaudited)

The sector diversification shown is based on the total long-term securities.
| June 30, 2020 | William Blair Funds | 59 |
Emerging Markets Leaders Fund
Portfolio of Investments, June 30, 2020 (all dollar amounts in thousands) (unaudited)
| | | | | | | | |
| | | | | | | | |
| | Issuer | | Shares | | | Value | |
| | | | | | | | |
| | Common Stocks | | | | | | | | |
| | | | | | | | | | |
| | Emerging Asia—76.3% | | | | | | | | |
| | China—37.3% | | | | | | | | |
| * | Alibaba Group Holding, Ltd. (Internet & direct marketing retail) | | | 542,428 | | | $ | 14,669 | |
| | China International Travel Service Corporation, Ltd. Class “A” (Specialty retail) | | | 356,656 | | | | 7,766 | |
| | Jiangsu Hengrui Medicine Co., Ltd. Class “A” (Pharmaceuticals) | | | 158,270 | | | | 2,065 | |
| | Kweichow Moutai Co., Ltd. Class “A” (Beverages) | | | 18,059 | | | | 3,734 | |
| | Midea Group Co., Ltd. Class “A” (Household durables) | | | 519,000 | | | | 4,387 | |
| | NetEase, Inc.—ADR (Entertainment) | | | 18,831 | | | | 8,086 | |
| | Ping An Insurance Group Co. of China, Ltd. Class “H” (Insurance) | | | 785,000 | | | | 7,849 | |
| | Shenzhou International Group Holdings, Ltd. (Textiles, apparel & luxury goods) | | | 341,200 | | | | 4,112 | |
| * | TAL Education Group—ADR (Diversified consumer services) | | | 53,341 | | | | 3,647 | |
| | Tencent Holdings, Ltd. (Interactive Media & Services) | | | 258,900 | | | | 16,655 | |
| * | Tencent Music Entertainment Group—ADR (Entertainment) | | | 361,189 | | | | 4,862 | |
| | Travelsky Technology, Ltd. Class “H” (IT services) | | | 1,393,000 | | | | 2,451 | |
| | Zhangzhou Pientzehuang Pharmaceutical Co., Ltd. Class “A” (Pharmaceuticals) | | | 125,100 | | | | 3,011 | |
| | | | | | | | | 83,294 | |
| | India—14.9% | | | | | | | | |
| | Asian Paints, Ltd. (Chemicals) | | | 117,098 | | | | 2,616 | |
| | Bajaj Finance, Ltd. (Consumer finance) | | | 39,055 | | | | 1,463 | |
| | Britannia Industries, Ltd. (Food products) | | | 39,256 | | | | 1,874 | |
| | HDFC Bank, Ltd.—ADR (Banks) | | | 3,809 | | | | 173 | |
| | HDFC Bank, Ltd. (Banks) | | | 313,166 | | | | 4,423 | |
| | Housing Development Finance Corporation, Ltd. (Thrifts & mortgage finance) | | | 128,735 | | | | 3,003 | |
| | Infosys, Ltd. (IT services) | | | 381,900 | | | | 3,711 | |
| | Maruti Suzuki India, Ltd. (Automobiles) | | | 23,390 | | | | 1,806 | |
| | Motherson Sumi Systems, Ltd. (Auto components) | | | 2,411,154 | | | | 3,018 | |
| | Reliance Industries, Ltd. (Oil, gas & consumable fuels) | | | 319,030 | | | | 7,215 | |
| * | Reliance Industries, Ltd. (Oil, gas & consumable fuels) | | | 23,562 | | | | 250 | |
| | UPL, Ltd. (Chemicals) | | | 661,156 | | | | 3,737 | |
| | | | | | | | | 33,289 | |
| | Indonesia—2.8% | | | | | | | | |
| | PT Bank Rakyat Indonesia Persero Tbk (Banks) | | | 11,839,800 | | | | 2,511 | |
| | PT Telekomunikasi Indonesia Persero Tbk (Diversified telecommunication services) | | | 17,284,800 | | | | 3,691 | |
| | | | | | | | | 6,202 | |
| | South Korea—6.5% | | | | | | | | |
| | Douzone Bizon Co., Ltd. (Software) | | | 28,937 | | | | 2,454 | |
| | Kakao Corporation (Interactive Media & Services) | | | 8,345 | | | | 1,856 | |
| | | | | | | | |
| | | | | | | | |
| | Issuer | | Shares | | | Value | |
| | | | | | | |
| | Common Stocks—(continued) | | | | | | | | |
| | | | | | | | | | |
| | Emerging Asia—(continued) | | | | | | | | |
| | South Korea—(continued) | | | | | | | | |
| | LG Household & Health Care, Ltd. (Personal products) | | | 4,603 | | | $ | 5,151 | |
| | NAVER Corporation (Interactive Media & Services) | | | 22,420 | | | | 4,976 | |
| | | | | | | | | 14,437 | |
| | Taiwan—13.3% | | | | | | | | |
| | E.Sun Financial Holding Co., Ltd. (Banks) | | | 2,860,648 | | | | 2,696 | |
| | MediaTek, Inc. (Semiconductors & semiconductor equipment) | | | 329,000 | | | | 6,456 | |
| | Taiwan Semiconductor Manufacturing Co., Ltd.—ADR (Semiconductors & semiconductor equipment) | | | 274,603 | | | | 15,589 | |
| | Uni-President Enterprises Corporation (Food products) | | | 2,091,000 | | | | 5,053 | |
| | | | | | | | | 29,794 | |
| | Thailand—1.5% | | | | | | | | |
| | Airports of Thailand PCL (Transportation infrastructure) | | | 1,764,000 | | | | 3,453 | |
| | | | | | | | | | |
| | Emerging Latin America—14.1% | | | | | | | | |
| | Argentina—3.4% | | | | | | | | |
| * | Globant S.A. (Software)† | | | 19,825 | | | | 2,971 | |
| * | MercadoLibre, Inc. (Internet & direct marketing retail) | | | 4,627 | | | | 4,561 | |
| | | | | | | | | 7,532 | |
| | Brazil—7.0% | | | | | | | | |
| | B3 S.A.—Brasil Bolsa Balcao (Capital markets) | | | 476,700 | | | | 4,829 | |
| | Odontoprev S.A. (Health care providers & services) | | | 652,653 | | | | 1,708 | |
| | Raia Drogasil S.A. (Food & staples retailing) | | | 86,500 | | | | 1,759 | |
| * | Rumo S.A. (Road & rail) | | | 831,500 | | | | 3,439 | |
| | TOTVS S.A. (Software) | | | 507,600 | | | | 2,161 | |
| | WEG S.A. (Electrical equipment) | | | 191,900 | | | | 1,786 | |
| | | | | | | | | 15,682 | |
| | Mexico—2.5% | | | | | | | | |
| | Grupo Aeroportuario del Pacifico S.A.B. de C.V. Class “B” (Transportation infrastructure) | | | 420,200 | | | | 3,033 | |
| | Wal-Mart de Mexico S.A.B. de C.V. (Food & staples retailing) | | | 1,066,700 | | | | 2,551 | |
| | | | | | | | | 5,584 | |
| | Peru—1.2% | | | | | | | | |
| | Credicorp, Ltd. (Banks)† | | | 19,642 | | | | 2,626 | |
| | | | | | | | | | |
| | Emerging Europe, Africa—6.0% | | | | | | | | |
| | Russia—2.5% | | | | | | | | |
| * | Yandex N.V. Class “A” (Interactive Media & Services)† | | | 112,072 | | | | 5,606 | |
See accompanying Notes to Financial Statements.
| 60 | Semiannual Report | June 30, 2020 |
Emerging Markets Leaders Fund
Portfolio of Investments, June 30, 2020 (all dollar amounts in thousands) (unaudited)
| | | | Shares or | | | | |
| | | | Principal | | | | |
| | Issuer | | Amount | | | Value | |
| | | | | | | | |
| | Common Stocks—(continued) | | | | | | | | |
| | | | | | | | | | |
| | Emerging Europe, Africa—(continued) | | |
| | South Africa—3.5% | | | | | | | | |
| | Bid Corporation, Ltd. (Food & staples retailing) | | | 116,571 | | | $ | 1,904 | |
| | Bidvest Group, Ltd. (Industrial conglomerates) | | | 234,426 | | | | 1,919 | |
| | Capitec Bank Holdings, Ltd. (Banks) | | | 44,196 | | | | 2,187 | |
| | Clicks Group, Ltd. (Food & staples retailing) | | | 154,827 | | | | 1,877 | |
| | | | | | | | | 7,887 | |
| | Total Common Stocks—96.4%
(cost $171,200) | | | | | | | 215,386 | |
| | | | | | | | | | |
| | Repurchase Agreement | | | | | | | | |
| | Fixed Income Clearing Corporation, 0.000% dated 6/30/20, due 7/1/20, repurchase price $6,920, collateralized by U.S. Treasury Note, 1.625%, due 2/15/26, valued at $7,058 | | $ | 6,920 | | | | 6,920 | |
| | Total Repurchase Agreement—3.1%
(cost $6,920) | | | | | | | 6,920 | |
| | Total Investments—99.5%
(cost $178,120) | | | | | | | 222,306 | |
| | Cash and other assets, less liabilities—0.5% | | | | | | | 1,161 | |
| | Net assets—100.0% | | | | | | $ | 223,467 | |
ADR = American Depository Receipt
* = Non-income producing security
† = U.S. listed foreign security
For securities primarily traded on exchanges or markets that close before the close of regular trading on the New York Stock Exchange, the Fund may use an independent pricing service to fair value price the securities pursuant to Valuation Procedures approved by the Board of Trustees.
At June 30, 2020, the Fund’s Portfolio of Investments includes the following industry categories (as a percentage of long-term investments):
| Communication Services | | | 21.2 | % |
| Consumer Discretionary | | | 20.6 | % |
| Information Technology | | | 16.6 | % |
| Financials | | | 14.7 | % |
| Consumer Staples | | | 11.1 | % |
| Industrials | | | 6.3 | % |
| Energy | | | 3.5 | % |
| Health Care | | | 3.1 | % |
| Materials | | | 2.9 | % |
| Total | | | 100.0 | % |
At June 30, 2020, the Fund’s Portfolio of Investments includes the following currency categories (as a percentage of long-term investments):
| U.S. Dollar | | | 22.3 | % |
| Hong Kong Dollar | | | 21.2 | % |
| Indian Rupee | | | 15.4 | % |
| Chinese Yuan Renminbi | | | 9.7 | % |
| Brazilian Real | | | 7.3 | % |
| South Korean Won | | | 6.7 | % |
| New Taiwan Dollar | | | 6.6 | % |
| South African Rand | | | 3.7 | % |
| Indonesian Rupiah | | | 2.9 | % |
| Mexican Peso | | | 2.6 | % |
| Thai Baht | | | 1.6 | % |
| Total | | | 100.0 | % |
See accompanying Notes to Financial Statements.
| June 30, 2020 | William Blair Funds | 61 |
| | Emerging Markets Growth Fund |
| | |
| | The Emerging Markets Growth Fund seeks long-term capital appreciation. |
| | |
| | AN OVERVIEW FROM THE PORTFOLIO MANAGERS |
| | |

Todd M. McClone 
Casey K. Preyss | The William Blair Emerging Markets Growth Fund (Class N shares) posted a 3.22% increase, net of fees, for the six months ended June 30, 2020. By comparison, the Fund’s benchmark index, the MSCI Emerging Markets IMI (net) (the “Index”), decreased 10.09%. Six-month outperformance versus the Index was primarily driven by positive stock selection across most sectors. The Communication Services, Information Technology and Consumer Staples sectors were the largest sources of relative return. Within Communication Services, Sea Ltd contributed to relative returns amid significant growth in gaming and acceleration of e-commerce penetration and market share gains. MediaTek Inc, within Information Technology, was an additional source of outperformance on the back of strong operating momentum and a positive growth outlook supported by a strong product cycle and favorable competitive dynamics. Within the Consumer Staples sector, Wuliangye Yibin Co Ltd, the second-largest premium baijiu player in China, helped relative results. The company continues to deliver on our investment thesis, predicated on management’s reform efforts to increase the focus on high-end products, improve brand support and strengthen sales and channel management infrastructure. Partially offsetting these effects were the overweight allocation to Brazil and an underweight allocation to the Communication Services sector, coupled with below average stock selection within the Financials sector. Indian financials, especially non-bank financial companies, came under pressure amid increased stress in the financial system. In this context, Bajaj Finance weighed on relative results on the back of investor concerns over increased funding costs and deteriorating asset quality amid economic disruption in India. Brazilian financials also detracted from relative performance. Banco BTG Pactual, a leading investment bank and wealth/asset manager in Brazil and Latin America, weakened due to deteriorated business sentiment amid COVID-19’s disruption of the economic recovery. Please refer to the Global Markets Review and Outlook relating to the Fund beginning on page 31. |
| 62 | Semiannual Report | June 30, 2020 |
Emerging Markets Growth Fund
Performance Highlights (Unaudited)
| Average Annual Total Return through 6/30/2020 |
| | | Year
to Date | | 1 Year | | 3 Year | | 5 Year | | 10 Year |
| Class N | | | 3.22 | % | | | 14.00 | % | | | 7.41 | % | | | 5.30 | % | | | 5.95 | % |
| Class I | | | 3.33 | | | | 14.36 | | | | 7.69 | | | | 5.58 | | | | 6.23 | |
| Class R6 | | | 3.37 | | | | 14.37 | | | | 7.76 | | | | 5.65 | | | | 6.37 | |
| MSCI Emerging Markets IMI (net) | | | (10.09 | ) | | | (3.97 | ) | | | 1.35 | | | | 2.35 | | | | 3.11 | |
Performance cited represents past performance. Past performance does not guarantee future results and current performance may be lower or higher than the data quoted. Results shown are average annual returns, which assume reinvestment of dividends and capital gains. Investment returns and principal will fluctuate and you may have a gain or loss when you sell shares. For the most current month-end performance information, please call 1-800-742-7272, or visit our Web site at www.williamblairfunds.com. From time to time, the investment adviser may waive fees or reimburse expenses for the Fund. Without these waivers/reimbursements, performance would be lower. International investing involves special risk considerations, including currency fluctuations, lower liquidity, economic and political risk. These risks may be magnified when investing in emerging markets. Class N shares are not subject to a sales load. Class I shares are not subject to a sales load or distribution (Rule 12b-1) fees. Class R6 shares are not subject to a sales load, distribution (Rule 12b-1) fees, or sub-transfer agent fees.
The performance highlights and graph presented above do not reflect the deduction of taxes that a shareholder would pay on fund distributions or the redemption of fund shares.
The Morgan Stanley Capital International (MSCI) Emerging Markets Investable Market Index (IMI) (net) is a free float-adjusted market capitalization weighted index that is designed to measure the equity market performance of emerging markets. This index approximates the minimum possible dividend reinvestment by deducting for the highest possible withholding tax rates of those markets.
This report identifies the Fund’s investments on June 30, 2020. These holdings are subject to change. Not all stocks in the Fund performed the same, nor is there any guarantee that these stocks will perform as well in the future. Market forecasts provided in this report may not necessarily come to pass.
Sector Diversification (Unaudited)

The sector diversification shown is based on the total long-term securities.
| June 30, 2020 | William Blair Funds | 63 |
Emerging Markets Growth Fund
Portfolio of Investments, June 30, 2020 (all dollar amounts in thousands) (unaudited)
| | | | | | | | |
| | | | | | | | |
| | Issuer | | Shares | | | Value | |
| | | | | | | | |
| | Common Stocks | | | | | | | | |
| | | | | | | | | | |
| | Emerging Asia—87.1% | | | | | | | | |
| | China—45.5% | | | | | | | | |
| | A-Living Services Co., Ltd. Class “H” (Commercial services & supplies) | | | 989,500 | | | $ | 4,986 | |
| | Aier Eye Hospital Group Co., Ltd. Class “A” (Health care providers & services) | | | 633,114 | | | | 3,889 | |
| * | Alibaba Group Holding, Ltd. (Internet & direct marketing retail) | | | 2,112,032 | | | | 57,117 | |
| * | Alibaba Health Information Technology, Ltd. (Health care technology) | | | 2,044,000 | | | | 5,960 | |
| | Beijing Oriental Yuhong Waterproof Technology Co., Ltd. Class “A” (Construction materials) | | | 428,800 | | | | 2,463 | |
| | Centre Testing International Group Co., Ltd. Class “A” (Professional services) | | | 1,495,000 | | | | 4,176 | |
| | Chacha Food Co., Ltd. Class “A” (Food products) | | | 371,068 | | | | 2,843 | |
| | Chengdu Hongqi Chain Co., Ltd. Class “A” (Food & staples retailing) | | | 1,509,000 | | | | 2,329 | |
| | China Education Group Holdings, Ltd. (Diversified consumer services) | | | 1,026,000 | | | | 1,649 | |
| | China Meidong Auto Holdings, Ltd. (Specialty retail) | | | 850,000 | | | | 2,084 | |
| | China Merchants Bank Co., Ltd. Class “H” (Banks) | | | 859,500 | | | | 3,953 | |
| | Chongqing Zhifei Biological Products Co., Ltd. Class “A” (Biotechnology) | | | 222,400 | | | | 3,149 | |
| | Country Garden Services Holdings Co., Ltd. (Commercial services & supplies) | | | 1,292,000 | | | | 6,001 | |
| | Double Medical Technology, Inc. Class “A” (Health care equipment & supplies) | | | 137,400 | | | | 2,317 | |
| | Foshan Haitian Flavouring & Food Co., Ltd. Class “A” (Food products) | | | 363,844 | | | | 6,398 | |
| | Gigadevice Semiconductor Beijing, Inc. Class “A” (Semiconductors & semiconductor equipment) | | | 88,800 | | | | 2,961 | |
| | Guangdong Haid Group Co., Ltd. Class “A” (Food products) | | | 393,200 | | | | 2,645 | |
| | Hangzhou Tigermed Consulting Co., Ltd. Class “A” (Life sciences tools & services) | | | 290,466 | | | | 4,183 | |
| | Hefei Meiya Optoelectronic Technology, Inc. Class “A” (Machinery) | | | 295,200 | | | | 2,195 | |
| | Hualan Biological Engineering, Inc. Class “A” (Biotechnology) | | | 372,500 | | | | 2,639 | |
| | Hundsun Technologies, Inc. Class “A” (Software) | | | 294,604 | | | | 4,485 | |
| | Jiajiayue Group Co., Ltd. Class “A” (Food & staples retailing) | | | 429,204 | | | | 2,989 | |
| | Jiangsu Hengli Hydraulic Co., Ltd. Class “A” (Machinery) | | | 597,146 | | | | 6,770 | |
| | Jiangsu Hengrui Medicine Co., Ltd. Class “A” (Pharmaceuticals) | | | 416,806 | | | | 5,438 | |
| * | Kingdee International Software Group Co., Ltd. (Software) | | | 1,696,000 | | | | 3,943 | |
| | Kweichow Moutai Co., Ltd. Class “A” (Beverages) | | | 39,242 | | | | 8,115 | |
| | Li Ning Co., Ltd. (Textiles, apparel & luxury goods) | | | 1,220,500 | | | | 3,874 | |
| | | | | | | | |
| | | | | | | | |
| | Issuer | | Shares | | | Value | |
| | | | | | | | |
| | Common Stocks—(continued) | | | | | | | | |
| | | | | | | | | | |
| | Emerging Asia—(continued) | | | | | | | | |
| | China—(continued) | | | | | | | | |
| | Luxshare Precision Industry Co., Ltd. Class “A” (Electronic equipment, instruments & components) | | | 1,379,529 | | | $ | 10,014 | |
| * | Meituan Dianping Class “B” (Internet & direct marketing retail) | | | 766,800 | | | | 17,007 | |
| | NAURA Technology Group Co., Ltd. Class “A” (Electronic equipment, instruments & components) | | | 112,600 | | | | 2,720 | |
| | NetEase, Inc.—ADR (Entertainment) | | | 36,286 | | | | 15,581 | |
| | Offcn Education Technology Co., Ltd. Class “A” (Diversified consumer services) | | | 1,326,800 | | | | 5,205 | |
| * | Ping An Healthcare and Technology Co., Ltd. (Health care technology) | | | 390,100 | | | | 5,934 | |
| | Ping An Insurance Group Co. of China, Ltd. Class “H” (Insurance) | | | 393,300 | | | | 3,933 | |
| | Proya Cosmetics Co., Ltd. Class “A” (Personal products) | | | 133,000 | | | | 3,385 | |
| | Sangfor Technologies, Inc. Class “A” (Software) | | | 82,400 | | | | 2,399 | |
| | SG Micro Corporation Class “A” (Semiconductors & semiconductor equipment) | | | 87,800 | | | | 3,786 | |
| | Shandong Weigao Group Medical Polymer Co., Ltd. Class “H” (Health care equipment & supplies) | | | 1,616,000 | | | | 3,595 | |
| | Shanghai M&G Stationery, Inc. Class “A” (Commercial services & supplies) | | | 266,800 | | | | 2,059 | |
| | Shennan Circuits Co., Ltd. Class “A” (Electronic equipment, instruments & components) | | | 109,084 | | | | 2,583 | |
| | Shenzhen Mindray Bio-Medical Electronics Co., Ltd. Class “A” (Health care equipment & supplies) | | | 153,500 | | | | 6,633 | |
| | Silergy Corporation (Semiconductors & semiconductor equipment) | | | 156,000 | | | | 10,152 | |
| | Skshu Paint Co., Ltd. Class “A” (Chemicals) | | | 181,300 | | | | 2,363 | |
| | Sunny Optical Technology Group Co., Ltd. (Electronic equipment, instruments & components) | | | 210,200 | | | | 3,363 | |
| | Tencent Holdings, Ltd. (Interactive Media & Services) | | | 914,260 | | | | 58,816 | |
| * | Topchoice Medical Corporation Class “A” (Health care providers & services) | | | 128,200 | | | | 3,022 | |
| | Topsports International Holdings Ltd. (Specialty retail) | | | 1,908,000 | | | | 2,437 | |
| | Will Semiconductor, Ltd. Class “A” (Semiconductors & semiconductor equipment) | | | 95,600 | | | | 2,729 | |
| | Wuliangye Yibin Co., Ltd. Class “A” (Beverages) | | | 359,994 | | | | 8,708 | |
| | WuXi AppTec Co., Ltd. Class “H” (Life sciences tools & services) | | | 528,600 | | | | 6,868 | |
| * | Wuxi Biologics Cayman, Inc. (Life sciences tools & services) | | | 514,500 | | | | 9,413 | |
See accompanying Notes to Financial Statements.
| 64 | Semiannual Report | June 30, 2020 |
Emerging Markets Growth Fund
Portfolio of Investments, June 30, 2020 (all dollar amounts in thousands) (unaudited)
| | | | | | | | |
| | | | | | | | |
| | Issuer | | Shares | | | Value | |
| | | | | | | | |
| | Common Stocks—(continued) | | | | | | | | |
| | | | | | | | | | |
| | Emerging Asia—(continued) | | | | | | | | |
| | China—(continued) | | | | | | | | |
| | Yifeng Pharmacy Chain Co., Ltd. Class “A” (Food & staples retailing) | | | 257,060 | | | $ | 3,307 | |
| * | Yihai International Holding, Ltd. (Food products) | | | 577,000 | | | | 5,915 | |
| | Zhangzhou Pientzehuang Pharmaceutical Co., Ltd. Class “A” (Pharmaceuticals) | | | 260,900 | | | | 6,279 | |
| | Zhejiang Dingli Machinery Co., Ltd. Class “A” (Machinery) | | | 397,860 | | | | 4,261 | |
| | Zhongsheng Group Holdings, Ltd. (Specialty retail) | | | 772,500 | | | | 4,276 | |
| | | | | | | | | 376,294 | |
| | India—7.8% | | | | | | | | |
| | Asian Paints, Ltd. (Chemicals) | | | 122,283 | | | | 2,732 | |
| | Dabur India, Ltd. (Personal products) | | | 335,010 | | | | 2,072 | |
| | HDFC Asset Management Co., Ltd. (Capital markets) | | | 51,536 | | | | 1,695 | |
| | HDFC Bank, Ltd. (Banks) | | | 863,409 | | | | 12,195 | |
| * | HDFC Life Insurance Co. Ltd. (Insurance) | | | 279,005 | | | | 2,033 | |
| | Hindustan Unilever, Ltd. (Household products) | | | 149,275 | | | | 4,304 | |
| | Housing Development Finance Corporation, Ltd. (Thrifts & mortgage finance) | | | 307,182 | | | | 7,165 | |
| * | Indraprastha Gas, Ltd. (Gas utilities) | | | 372,449 | | | | 2,186 | |
| | Nestle India, Ltd. (Food products) | | | 20,967 | | | | 4,762 | |
| | Pidilite Industries, Ltd. (Chemicals) | | | 118,278 | | | | 2,151 | |
| | Reliance Industries, Ltd. (Oil, gas & consumable fuels) | | | 705,948 | | | | 15,965 | |
| * | Reliance Industries, Ltd. (Oil, gas & consumable fuels) | | | 45,229 | | | | 479 | |
| | SRF, Ltd. (Chemicals) | | | 33,590 | | | | 1,605 | |
| | Tata Consultancy Services, Ltd. (IT services) | | | 133,548 | | | | 3,688 | |
| | Varun Beverages, Ltd. (Beverages) | | | 182,654 | | | | 1,645 | |
| | | | | | | | | 64,677 | |
| | Indonesia—1.0% | | | | | | | | |
| | PT Bank Central Asia Tbk (Banks) | | | 4,296,900 | | | | 8,565 | |
| | Malaysia—1.1% | | | | | | | | |
| | Hartalega Holdings Bhd (Health care equipment & supplies) | | | 1,023,600 | | | | 3,105 | |
| | Top Glove Corporation Bhd (Health care equipment & supplies) | | | 1,674,900 | | | | 6,293 | |
| | | | | | | | | 9,398 | |
| | South Korea—11.1% | | | | | | | | |
| | Kakao Corporation (Interactive Media & Services) | | | 73,410 | | | | 16,325 | |
| | LEENO Industrial, Inc. (Semiconductors & semiconductor equipment) | | | 23,334 | | | | 2,192 | |
| | LG Household & Health Care, Ltd. (Personal products) | | | 6,102 | | | | 6,828 | |
| | Macquarie Korea Infrastructure Fund (Capital markets) | | | 194,940 | | | | 1,847 | |
| | NAVER Corporation (Interactive Media & Services) | | | 66,127 | | | | 14,678 | |
| | | | | | | | |
| | | | | | | | |
| | Issuer | | Shares | | | Value | |
| | | | | | | | |
| | Common Stocks—(continued) | | | | | | | | |
| | | | | | | | | | |
| | Emerging Asia—(continued) | | | | | | | | |
| | South Korea—(continued) | | | | | | | | |
| | NCSoft Corporation (Entertainment) | | | 12,201 | | | $ | 9,038 | |
| | NHN KCP Corporation (IT services) | | | 45,261 | | | | 1,857 | |
| | NICE Information Service Co., Ltd. (Professional services) | | | 100,559 | | | | 1,526 | |
| | RFHIC Corporation (Semiconductors & semiconductor equipment) | | | 39,928 | | | | 1,205 | |
| | Samsung Electronics Co., Ltd. (Technology hardware, storage & peripherals) | | | 774,393 | | | | 33,993 | |
| | Seegene, Inc. (Biotechnology) | | | 21,004 | | | | 1,970 | |
| | | | | | | | | 91,459 | |
| | Taiwan—19.1% | | | | | | | | |
| | Accton Technology Corporation (Communications equipment) | | | 470,000 | | | | 3,632 | |
| | Advantech Co., Ltd. (Technology hardware, storage & peripherals) | | | 266,000 | | | | 2,664 | |
| | Airtac International Group (Machinery) | | | 372,000 | | | | 6,506 | |
| | Alchip Technologies, Ltd. (Semiconductors & semiconductor equipment) | | | 119,000 | | | | 2,017 | |
| | ASMedia Technology, Inc. (Semiconductors & semiconductor equipment) | | | 156,000 | | | | 7,587 | |
| | ASPEED Technology, Inc. (Semiconductors & semiconductor equipment) | | | 141,000 | | | | 5,926 | |
| | E.Sun Financial Holding Co., Ltd. (Banks) | | | 7,884,007 | | | | 7,428 | |
| | Elite Material Co., Ltd. (Electronic equipment, instruments & components) | | | 643,000 | | | | 3,476 | |
| | ITEQ Corporation (Electronic equipment, instruments & components) | | | 462,000 | | | | 2,310 | |
| | King Yuan Electronics Co., Ltd. (Semiconductors & semiconductor equipment) | | | 2,051,000 | | | | 2,388 | |
| | Lotes Co., Ltd. (Electronic equipment, instruments & components) | | | 212,000 | | | | 2,720 | |
| | MediaTek, Inc. (Semiconductors & semiconductor equipment) | | | 1,064,000 | | | | 20,880 | |
| | momo.com, Inc. (Internet & direct marketing retail) | | | 81,000 | | | | 1,966 | |
| | Parade Technologies, Ltd. (Semiconductors & semiconductor equipment) | | | 144,000 | | | | 4,793 | |
| | Powertech Technology, Inc. (Semiconductors & semiconductor equipment) | | | 1,131,000 | | | | 4,102 | |
| | Poya International Co., Ltd. (Multiline retail) | | | 100,000 | | | | 1,973 | |
| | Realtek Semiconductor Corporation (Semiconductors & semiconductor equipment) | | | 303,000 | | | | 3,071 | |
| | Sinbon Electronics Co., Ltd. (Electronic equipment, instruments & components) | | | 550,000 | | | | 2,777 | |
| | Taiwan Semiconductor Manufacturing Co., Ltd.—ADR (Semiconductors & semiconductor equipment) | | | 674,637 | | | | 38,299 | |
| | Taiwan Semiconductor Manufacturing Co., Ltd. (Semiconductors & semiconductor equipment) | | | 1,644,000 | | | | 17,440 | |
See accompanying Notes to Financial Statements.
| June 30, 2020 | William Blair Funds | 65 |
Emerging Markets Growth Fund
Portfolio of Investments, June 30, 2020 (all dollar amounts in thousands) (unaudited)
| | | | | | | | |
| | | | | | | | |
| | Issuer | | Shares | | | Value | |
| | | | | | | | |
| | Common Stocks—(continued) | | | | | | | | |
| | | | | | | | | | |
| | Emerging Asia—(continued) | | | | | | | | |
| | Taiwan—(continued) | | | | | | | | |
| | Taiwan Union Technology Corporation (Electronic equipment, instruments & components) | | | 592,000 | | | $ | 2,879 | |
| | Tripod Technology Corporation (Electronic equipment, instruments & components) | | | 510,000 | | | | 2,264 | |
| | Voltronic Power Technology Corporation (Electrical equipment) | | | 114,700 | | | | 3,289 | |
| | Win Semiconductors Corporation (Semiconductors & semiconductor equipment) | | | 402,000 | | | | 4,074 | |
| | Wiwynn Corporation (Technology hardware, storage & peripherals) | | | 129,000 | | | | 3,506 | |
| | | | | | | | | 157,967 | |
| | Thailand—1.5% | | | | | | | | |
| * | Sea, Ltd.—ADR (Entertainment) | | | 115,606 | | | | 12,398 | |
| | | | | | | | | | |
| | Emerging Latin America—6.4% | | | | | | | | |
| | Argentina—2.2% | | | | | | | | |
| * | Globant S.A. (Software)† | | | 29,482 | | | | 4,418 | |
| * | MercadoLibre, Inc. (Internet & direct marketing retail) | | | 13,805 | | | | 13,608 | |
| | | | | | | | | 18,026 | |
| | Brazil—3.8% | | | | | | | | |
| * | Arco Platform, Ltd. Class “A” (Diversified consumer services)† | | 37,898 | | | | 1,648 | |
| * | B2W Cia Digital (Internet & direct marketing retail) | | | 142,600 | | | | 2,807 | |
| | B3 S.A.—Brasil Bolsa Balcao (Capital markets) | | | 759,300 | | | | 7,692 | |
| * | Locaweb Servicos de Internet S.A. (IT services) | | | 167,600 | | | | 1,331 | |
| | Magazine Luiza S.A. (Multiline retail) | | | 606,800 | | | | 7,995 | |
| * | StoneCo, Ltd. Class “A” (IT services)† | | | 80,067 | | | | 3,103 | |
| | TOTVS S.A. (Software) | | | 561,100 | | | | 2,389 | |
| | WEG S.A. (Electrical equipment) | | | 508,020 | | | | 4,728 | |
| | | | | | | | | 31,693 | |
| | Mexico—0.4% | | | | | | | | |
| | Wal-Mart de Mexico S.A.B. de C.V. (Food & staples retailing) | | | 1,483,800 | | | | 3,549 | |
| | | | | | | | | | |
| | Emerging Europe, Africa—6.1% | | | | | | | | |
| | Greece—0.3% | | | | | | | | |
| | JUMBO S.A. (Specialty retail) | | | 151,171 | | | | 2,718 | |
| | Kenya—0.3% | | | | | | | | |
| | Safaricom plc (Wireless telecommunication services) | | | 8,934,854 | | | | 2,415 | |
| | Poland—1.4% | | | | | | | | |
| | CD Projekt S.A. (Entertainment) | | | 54,808 | | | | 5,471 | |
| * | Dino Polska S.A. (Food & staples retailing) | | | 118,147 | | | | 5,990 | |
| | | | | | | | | 11,461 | |
| | | | Shares or | | | | |
| | | | Principal | | | | |
| | Issuer | | Amount | | | Value | |
| | | | | | | | |
| | Common Stocks—(continued) | | | | | | | | |
| | | | | | | | | | |
| | Emerging Europe, Africa—(continued) | | | | | | | | |
| | Russia—1.6% | | | | | | | | |
| * | Yandex N.V. Class “A” (Interactive Media & Services)† | | | 258,536 | | | $ | 12,932 | |
| | South Africa—2.5% | | | | | | | | |
| | Clicks Group, Ltd. (Food & staples retailing) | | | 230,813 | | | | 2,798 | |
| | Naspers, Ltd. (Internet & direct marketing retail) | | | 97,359 | | | | 17,747 | |
| | | | | | | | | 20,545 | |
| | Total Common Stocks—99.6%
(cost $594,088) | | | | | | | 824,097 | |
| | | | | | | | | | |
| | Repurchase Agreement | | | | | | | | |
| | Fixed Income Clearing Corporation, 0.000% dated 6/30/20, due 7/1/20, repurchase price $5,980, collateralized by U.S. Treasury Note, 1.625%, due 2/15/26, valued at $6,099 | | | $5,980 | | | | 5,980 | |
| | Total Repurchase Agreement—0.7%
(cost $5,980) | | | | | | | 5,980 | |
| | Total Investments—100.3%
(cost $600,068) | | | | | | | 830,077 | |
| | Liabilities, plus cash and other assets—(0.3)% | | | | | | | (2,122 | ) |
| | Net assets—100.0% | | | | | | $ | 827,955 | |
ADR = American Depository Receipt
* = Non-income producing security
† = U.S. listed foreign security
For securities primarily traded on exchanges or markets that close before the close of regular trading on the New York Stock Exchange, the Fund may use an independent pricing service to fair value price the securities pursuant to Valuation Procedures approved by the Board of Trustees.
See accompanying Notes to Financial Statements.
| 66 | Semiannual Report | June 30, 2020 |
Emerging Markets Growth Fund
Portfolio of Investments, June 30, 2020 (unaudited)
At June 30, 2020, the Fund’s Portfolio of Investments includes the following industry categories (as a percentage of long-term investments):
| Information Technology | | | 29.1 | % |
| Communication Services | | | 17.9 | % |
| Consumer Discretionary | | | 17.5 | % |
| Health Care | | | 9.8 | % |
| Consumer Staples | | | 9.5 | % |
| Financials | | | 6.9 | % |
| Industrials | | | 5.6 | % |
| Energy | | | 2.0 | % |
| Materials | | | 1.4 | % |
| Utilities | | | 0.3 | % |
| Total | | | 100.0 | % |
At June 30, 2020, the Fund’s Portfolio of Investments includes the following currency categories (as a percentage of long-term investments):
| Hong Kong Dollar | | | 25.6 | % |
| Chinese Yuan Renminbi | | | 16.9 | % |
| New Taiwan Dollar | | | 15.8 | % |
| U.S. Dollar | | | 12.4 | % |
| South Korean Won | | | 11.1 | % |
| Indian Rupee | | | 7.8 | % |
| Brazilian Real | | | 3.3 | % |
| South African Rand | | | 2.5 | % |
| Polish Zloty | | | 1.4 | % |
| Malaysian Ringgit | | | 1.1 | % |
| Indonesian Rupiah | | | 1.0 | % |
| All Other Currencies | | | 1.1 | % |
| Total | | | 100.0 | % |
See accompanying Notes to Financial Statements.
| June 30, 2020 | William Blair Funds | 67 |
| | Emerging Markets Small Cap Growth Fund |
| | |
| | The Emerging Markets Small Cap Growth Fund seeks long-term capital appreciation. |
| | |
| | AN OVERVIEW FROM THE PORTFOLIO MANAGERS |
| | |

Todd M. McClone 
Casey K. Preyss | The William Blair Emerging Markets Small Cap Growth Fund (Class N shares) posted a 1.01% increase, net of fees, for the six months ended June 30, 2020. By comparison, the Fund’s benchmark index, the MSCI Emerging Markets Small Cap Index (net) (the “Index”), decreased 12.74%. Six-month outperformance versus the Index was primarily driven by positive stock selection across most sectors. The Industrials and Information Technology sectors were the most notable sources of relative return. Within Industrials, A-Living Services Co Ltd and Country Garden Services Holdings helped relative returns over the period due to strong results in the first quarter. The property management companies’ share price acceleration in the first quarter was underpinned by robust growth in the gross floor area under management and increased revenue from value added services. Both companies benefited from heightened demand for extra services and local governments subsidies on the back of the COVID-19 outbreak. Within Information Technology, Parade Technologies Ltd, the Taiwanese fabless semiconductor company focused on high-speed video interfacing and processing, was an additional source of outperformance. The company continues to benefit from market share and content gains amid improving display technology across devices and increasing demand for faster data transmission capabilities within datacenters. Partially offsetting these effects were the overweight allocation to Brazil and an underweight allocation to South Korea, coupled with below average stock selection within the Financials sector. Within Financials, Capitec Bank Holdings Ltd and Bank BTPN Syariah Tbk (BTPS) hurt relative results. Capitec is a high quality South African financial company with strong brand, execution and expanding product offering. BTPS is a highly-profitable Shariah bank in Indonesia with a leading position in the ultra-micro segment. Both stocks were hit by investor concerns over the banks’ unsecure credit business coupled with weaker outlooks for growth and credit quality. Please refer to the Global Markets Review and Outlook relating to the Fund beginning on page 31. |
| 68 | Semiannual Report | June 30, 2020 |
Emerging Markets Small Cap Growth Fund
Performance Highlights (Unaudited)
| Average Annual Total Return through 6/30/2020 |
| | | Year
to Date | | 1 Year | | 3 Year | | 5 Year | | Since
Inception |
| Class N(a) | | | 1.01 | % | | | 11.64 | % | | | 2.93 | % | | | 1.78 | % | | | 8.35 | % |
| Class I(a) | | | 1.12 | | | | 11.89 | | | | 3.19 | | | | 2.07 | | | | 8.65 | |
| MSCI Emerging Markets Small Cap Index (net)(a) | | | (12.74 | ) | | | (8.82 | ) | | | (2.95 | ) | | | (1.38 | ) | | | 1.93 | |
| Class R6(b) | | | 1.12 | | | | 11.93 | | | | 3.26 | | | | 2.15 | | | | 6.47 | |
| MSCI Emerging Markets Small Cap Index (net)(b) | | | (12.74 | ) | | | (8.82 | ) | | | (2.95 | ) | | | (1.38 | ) | | | 0.59 | |
| (a) | Since inception is for the period from October 24, 2011 (Commencement of Operations) to June 30, 2020. |
| (b) | Since inception is for the period from December 20, 2012 (Commencement of Operations) to June 30, 2020. |
Performance cited represents past performance. Past performance does not guarantee future results and current performance may be lower or higher than the data quoted. Results shown are average annual returns, which assume reinvestment of dividends and capital gains. Investment returns and principal will fluctuate and you may have a gain or loss when you sell shares. For the most current month-end performance information, please call 1-800-742-7272, or visit our Web site at www.williamblairfunds.com. From time to time, the investment adviser may waive fees or reimburse expenses for the Fund. Without these waivers/reimbursements, performance would be lower. International investing involves special risk considerations, including currency fluctuations, lower liquidity, economic and political risk. These risks may be magnified when investing in emerging markets. Smaller capitalization stocks are also more sensitive to purchase/sale transactions and changes in the issuer’s financial condition. Class N shares are not subject to a sales load. Class I shares are not subject to a sales load or distribution (Rule 12b-1) fees. Class R6 shares are not subject to a sales load, distribution (Rule 12b-1) fees, or sub-transfer agent fees.
The performance highlights and graph presented above do not reflect the deduction of taxes that a shareholder would pay on fund distributions or the redemption of fund shares.
The Morgan Stanley Capital International (MSCI) Emerging Markets Small Cap Index (net) is a free float-adjusted market capitalization index that is designed to measure the equity market performance of emerging markets. This index approximates the minimum possible dividend reinvestment by deducting for the highest possible withholding tax rates of those markets.
This report identifies the Fund’s investments on June 30, 2020. These holdings are subject to change. Not all stocks in the Fund performed the same, nor is there any guarantee that these stocks will perform as well in the future. Market forecasts provided in this report may not necessarily come to pass.
Sector Diversification (Unaudited)

The sector diversification shown is based on the total long-term securities.
| June 30, 2020 | William Blair Funds | 69 |
Emerging Markets Small Cap Growth Fund
Portfolio of Investments, June 30, 2020 (all dollar amounts in thousands) (unaudited)
| | | | | | | | |
| | | | | | | | |
| | Issuer | | Shares | | | Value | |
| | |
| | Common Stocks | | | | | | | | |
| | |
| | Emerging Asia—79.8% | | | | | | | | |
| | Cambodia—0.8% | | | | | | | | |
| | NagaCorp, Ltd. (Hotels, restaurants & leisure) | | | 1,922,000 | | | $ | 2,224 | |
| | China—31.8% | | | | | | | | |
| | A-Living Services Co., Ltd. Class “H” (Commercial services & supplies) | | | 685,000 | | | | 3,451 | |
| | Airtac International Group (Machinery) | | | 337,000 | | | | 5,894 | |
| | AK Medical Holdings, Ltd. (Health care equipment & supplies) | | | 342,000 | | | | 1,088 | |
| * | Aoyuan Healthy Life Group Co., Ltd. (Real estate management & development) | | | 1,200,000 | | | | 1,228 | |
| | Centre Testing International Group Co., Ltd.Class “A” (Professional services) | | | 1,473,305 | | | | 4,115 | |
| | Chacha Food Co., Ltd. Class “A” (Food products) | | | 129,573 | | | | 993 | |
| | Changzhou Xingyu Automotive Lighting Systems Co., Ltd. Class “A” (Auto components) | | | 99,147 | | | | 1,780 | |
| | Chengdu Hongqi Chain Co., Ltd. Class “A” (Food & staples retailing) | | | 716,380 | | | | 1,106 | |
| | China Feihe, Ltd. (Food products) | | | 366,000 | | | | 733 | |
| | China Lesso Group Holdings, Ltd. (Building products) | | | 1,188,000 | | | | 1,545 | |
| | China Meidong Auto Holdings, Ltd. (Specialty retail) | | | 768,000 | | | | 1,883 | |
| | China Overseas Property Holdings, Ltd. (Real estate management & development) | | | 595,000 | | | | 629 | |
| | Country Garden Services Holdings Co., Ltd. (Commercial services & supplies) | | | 748,000 | | | | 3,474 | |
| | Double Medical Technology, Inc. Class “A” (Health care equipment & supplies) | | | 88,700 | | | | 1,496 | |
| | Ever Sunshine Lifestyle Services Group, Ltd. (Commercial services & supplies) | | | 2,056,000 | | | | 3,178 | |
| | Hangzhou Tigermed Consulting Co., Ltd. Class “A” (Life sciences tools & services) | | | 219,317 | | | | 3,159 | |
| | Hefei Meiya Optoelectronic Technology, Inc. Class “A” (Machinery) | | | 193,295 | | | | 1,437 | |
| | Jiajiayue Group Co., Ltd. Class “A” (Food & staples retailing) | | | 360,352 | | | | 2,509 | |
| | Jiangsu Hengli Hydraulic Co., Ltd. Class “A” (Machinery) | | | 365,009 | | | | 4,138 | |
| | Jonjee Hi-Tech Industrial and Commercial Holding Co., Ltd. Class “A” (Food products) | | | 349,591 | | | | 2,892 | |
| * | Kingdee International Software Group Co., Ltd. (Software) | | | 1,364,000 | | | | 3,171 | |
| * | Kingsoft Cloud Holdings, Ltd.—ADR (IT services) | | | 49,398 | | | | 1,557 | |
| * | KWG Group Holdings, Ltd. (Real estate management & development) | | | 1,667,500 | | | | 2,801 | |
| | Offcn Education Technology Co., Ltd. Class “A” (Diversified consumer services) | | | 384,000 | | | | 1,506 | |
| | Ovctek China, Inc. Class “A” (Health care equipment & supplies) | | | 156,977 | | | | 1,539 | |
| * | Ping An Healthcare and Technology Co., Ltd. (Health care technology) | | | 182,300 | | | | 2,773 | |
| | | | | | | | |
| | | | | | | | |
| | Issuer | | Shares | | | Value | |
| | |
| | Common Stocks—(continued) | | | | | | | | |
| | |
| | Emerging Asia—(continued) | | | | | | | | |
| | China—(continued) | | | | | | | | |
| | Poly Property Development Co., Ltd. Class “H” (Real estate management & development) | | | 112,200 | | | $ | 1,129 | |
| | Proya Cosmetics Co., Ltd. Class “A” (Personal products) | | | 129,124 | | | | 3,286 | |
| | Shandong Weigao Group Medical Polymer Co., Ltd. Class “H” (Health care equipment & supplies) | | | 900,000 | | | | 2,002 | |
| | Shanghai M&G Stationery, Inc. Class “A” (Commercial services & supplies) | | | 64,219 | | | | 496 | |
| | Silergy Corporation (Semiconductors & semiconductor equipment) | | | 81,000 | | | | 5,271 | |
| * | Topchoice Medical Corporation Class “A” (Health care providers & services) | | | 97,000 | | | | 2,287 | |
| | Topsports International Holdings, Ltd. (Specialty retail) | | | 551,000 | | | | 704 | |
| | Yifeng Pharmacy Chain Co., Ltd. Class “A” (Food & staples retailing) | | | 61,000 | | | | 785 | |
| * | Yihai International Holding, Ltd. (Food products) | | | 224,000 | | | | 2,296 | |
| | Zhejiang Dingli Machinery Co., Ltd. Class “A” (Machinery) | | | 281,471 | | | | 3,015 | |
| | Zhongsheng Group Holdings, Ltd. (Specialty retail) | | | 277,500 | | | | 1,536 | |
| | | | | | | | | 82,882 | |
| | India—13.3% | | | | | | | | |
| | Aarti Industries, Ltd. (Chemicals) | | | 151,187 | | | | 1,874 | |
| | Apollo Hospitals Enterprise, Ltd. (Health care providers & services) | | | 33,462 | | | | 600 | |
| * | Arti Surfactants, Ltd. (Chemicals)** | | | 13,896 | | | | 2 | |
| | Astral Poly Technik, Ltd. (Building products) | | | 166,404 | | | | 2,116 | |
| | Balkrishna Industries, Ltd. (Auto components) | | | 88,412 | | | | 1,485 | |
| | Bandhan Bank, Ltd. (Banks) | | | 632,154 | | | | 2,685 | |
| | Bata India, Ltd. (Textiles, apparel & luxury goods) | | | 30,783 | | | | 532 | |
| | Berger Paints India, Ltd. (Chemicals) | | | 308,007 | | | | 2,015 | |
| | Divi’s Laboratories, Ltd. (Life sciences tools & services) | | | 35,960 | | | | 1,084 | |
| | Dr. Lal PathLabs, Ltd. (Health care providers & services) | | | 30,406 | | | | 630 | |
| * | Godrej Properties, Ltd. (Real estate management & development) | | | 99,018 | | | | 1,131 | |
| | HDFC Asset Management Co., Ltd. (Capital markets) | | | 32,601 | | | | 1,072 | |
| * | Indraprastha Gas, Ltd. (Gas utilities) | | | 302,991 | | | | 1,779 | |
| | Info Edge India, Ltd. (Interactive Media & Services) | | | 29,824 | | | | 1,090 | |
| | Ipca Laboratories, Ltd. (Pharmaceuticals) | | | 86,394 | | | | 1,913 | |
| | PI Industries, Ltd. (Chemicals) | | | 125,023 | | | | 2,492 | |
| | Pidilite Industries, Ltd. (Chemicals) | | | 34,632 | | | | 630 | |
| | Relaxo Footwears, Ltd. (Textiles, apparel & luxury goods) | | | 134,039 | | | | 1,122 | |
See accompanying Notes to Financial Statements.
| 70 | Semiannual Report | June 30, 2020 |
Emerging Markets Small Cap Growth Fund
Portfolio of Investments, June 30, 2020 (all dollar amounts in thousands) (unaudited)
| | | | | | | | |
| | | | | | | | |
| | Issuer | | Shares | | | Value | |
| | |
| | Common Stocks—(continued) | | | | | | | | |
| | |
| | Emerging Asia—(continued) | | | | | | | | |
| | India—(continued) | | | | | | | | |
| | SRF, Ltd. (Chemicals) | | | 62,721 | | | $ | 2,996 | |
| | Tata Consumer Products, Ltd. (Food products) | | | 313,530 | | | | 1,611 | |
| | The Phoenix Mills, Ltd. (Real estate management & development) | | | 108,942 | | | | 839 | |
| | Titan Co., Ltd. (Textiles, apparel & luxury goods) | | | 21,050 | | | | 265 | |
| | Torrent Pharmaceuticals, Ltd. (Pharmaceuticals) | | | 24,874 | | | | 781 | |
| | Trent, Ltd. (Multiline retail) | | | 143,853 | | | | 1,185 | |
| | Varun Beverages, Ltd. (Beverages) | | | 289,565 | | | | 2,608 | |
| | | | | | | | | 34,537 | |
| | Indonesia—1.9% | | | | | | | | |
| | PT Bank Tabungan Pensiunan Nasional Syariah Tbk (Banks) | | | 8,848,800 | | | | 1,970 | |
| | PT Jasa Marga Persero Tbk (Transportation infrastructure) | | | 4,684,700 | | | | 1,443 | |
| | PT Pakuwon Jati Tbk (Real estate management & development) | | | 55,403,000 | | | | 1,613 | |
| | | | | | | | | 5,026 | |
| | Malaysia—0.9% | | | | | | | | |
| | Hartalega Holdings Bhd (Health care equipment & supplies) | | | 238,500 | | | | 724 | |
| | Top Glove Corporation Bhd (Health care equipment & supplies) | | | 437,400 | | | | 1,643 | |
| | | | | | | | | 2,367 | |
| | Philippines—1.2% | | | | | | | | |
| | Bloomberry Resorts Corporation (Hotels, restaurants & leisure) | | | 8,344,600 | | | | 1,244 | |
| | Wilcon Depot, Inc. (Specialty retail) | | | 6,127,300 | | | | 1,904 | |
| | | | | | | | | 3,148 | |
| | South Korea—8.6% | | | | | | | | |
| | Douzone Bizon Co., Ltd. (Software) | | | 67,330 | | | | 5,710 | |
| | Hite Jinro Co., Ltd. (Beverages) | | | 51,064 | | | | 1,859 | |
| | JYP Entertainment Corporation (Entertainment) | | | 39,867 | | | | 703 | |
| | Koh Young Technology, Inc. (Semiconductors & semiconductor equipment) | | | 49,448 | | | | 4,111 | |
| | LEENO Industrial, Inc. (Semiconductors & semiconductor equipment) | | | 20,305 | | | | 1,908 | |
| | NHN KCP Corporation (IT services) | | | 40,902 | | | | 1,678 | |
| | NICE Information Service Co., Ltd. (Professional services) | | | 109,595 | | | | 1,663 | |
| | RFHIC Corporation (Semiconductors & semiconductor equipment) | | | 35,035 | | | | 1,057 | |
| | Seegene, Inc. (Biotechnology) | | | 14,666 | | | | 1,375 | |
| * | WONIK IPS Co., Ltd. (Semiconductors & semiconductor equipment) | | | 80,941 | | | | 2,399 | |
| | | | | | | | | 22,463 | |
| | | | | | | | |
| | | | | | | | |
| | Issuer | | Shares | | | Value | |
| | |
| | Common Stocks—(continued) | | | | | | | | |
| | |
| | Emerging Asia—(continued) | | | | | | | | |
| | Taiwan—19.2% | | | | | | | | |
| | Accton Technology Corporation (Communications equipment) | | | 251,000 | | | $ | 1,940 | |
| | Alchip Technologies, Ltd. (Semiconductors & semiconductor equipment) | | | 80,000 | | | | 1,356 | |
| | ASMedia Technology, Inc. (Semiconductors & semiconductor equipment) | | | 43,000 | | | | 2,091 | |
| | ASPEED Technology, Inc. (Semiconductors & semiconductor equipment) | | | 69,000 | | | | 2,900 | |
| | Elite Material Co., Ltd. (Electronic equipment, instruments & components) | | | 413,000 | | | | 2,233 | |
| | Globalwafers Co., Ltd. (Semiconductors & semiconductor equipment) | | | 30,000 | | | | 410 | |
| | Hiwin Technologies Corporation (Machinery) | | | 355,000 | | | | 3,531 | |
| | ITEQ Corporation (Electronic equipment, instruments & components) | | | 515,000 | | | | 2,575 | |
| | Lotes Co., Ltd. (Electronic equipment, instruments & components) | | | 219,000 | | | | 2,809 | |
| | momo.com, Inc. (Internet & direct marketing retail) | | | 38,000 | | | | 922 | |
| | Parade Technologies, Ltd. (Semiconductors & semiconductor equipment) | | | 129,000 | | | | 4,294 | |
| | Powertech Technology, Inc. (Semiconductors & semiconductor equipment) | | | 783,000 | | | | 2,840 | |
| | Poya International Co., Ltd. (Multiline retail) | | | 111,000 | | | | 2,190 | |
| | Realtek Semiconductor Corporation (Semiconductors & semiconductor equipment) | | | 242,000 | | | | 2,452 | |
| | RichWave Technology Corporation (Semiconductors & semiconductor equipment) | | | 168,000 | | | | 1,073 | |
| | Sinbon Electronics Co., Ltd. (Electronic equipment, instruments & components) | | | 886,000 | | | | 4,474 | |
| | Sporton International, Inc. (Professional services) | | | 318,000 | | | | 2,587 | |
| | Taiwan Union Technology Corporation (Electronic equipment, instruments & components) | | | 635,000 | | | | 3,088 | |
| | Tripod Technology Corporation (Electronic equipment, instruments & components) | | | 67,000 | | | | 297 | |
| | Voltronic Power Technology Corporation (Electrical equipment) | | | 116,100 | | | | 3,329 | |
| | Wiwynn Corporation (Technology hardware, storage & peripherals) | | | 96,000 | | | | 2,610 | |
| | | | | | | | | 50,001 | |
| | Thailand—1.3% | | | | | | | | |
| | Carabao Group PCL Class “F” (Beverages) | | | 542,000 | | | | 1,824 | |
| | Com7 PCL Class “F” (Specialty retail) | | | 1,609,000 | | | | 1,470 | |
| | | | | | | | | 3,294 | |
| | Vietnam—0.8% | | | | | | | | |
| * | Hoa Phat Group JSC (Metals & mining) | | | 1,805,930 | | | | 2,086 | |
See accompanying Notes to Financial Statements.
| June 30, 2020 | William Blair Funds | 71 |
Emerging Markets Small Cap Growth Fund
Portfolio of Investments, June 30, 2020 (all dollar amounts in thousands) (unaudited)
| | | | | | | | |
| | | | | | | | |
| | Issuer | | Shares | | | Value | |
| | |
| | Common Stocks—(continued) | | | | | | | | |
| | |
| | Emerging Latin America—12.3% | | | | | | | | |
| | Argentina—1.2% | | | | | | | | |
| * | Globant S.A. (Software)† | | | 21,393 | | | $ | 3,206 | |
| | Brazil—10.4% | | | | | | | | |
| * | Arco Platform, Ltd. Class “A” (Diversified consumer services)† | | 44,076 | | | | 1,916 | |
| * | B2W Cia Digital (Internet & direct marketing retail) | | | 175,200 | | | | 3,449 | |
| | Banco BTG Pactual S.A. (Capital markets) | | | 218,300 | | | | 3,071 | |
| | Construtora Tenda S.A. (Household durables) | | | 388,900 | | | | 2,218 | |
| | Cyrela Brazil Realty S.A. Empreendimentos e Participacoes (Household durables) | | | 544,700 | | | | 2,289 | |
| | Ez Tec Empreendimentos e Participacoes S.A. (Household durables) | | | 115,200 | | | | 845 | |
| * | Grupo SBF S.A. (Specialty retail) | | | 512,092 | | | | 3,080 | |
| | Hapvida Participacoes e Investimentos S.A. (Health care providers & services) | | | 92,700 | | | | 1,060 | |
| * | Locaweb Servicos de Internet S.A. (IT services) | | | 330,900 | | | | 2,629 | |
| | Tegma Gestao Logistica S.A. (Road & rail) | | | 512,700 | | | | 2,195 | |
| | TOTVS S.A. (Software) | | | 1,057,900 | | | | 4,503 | |
| | | | | | | | | 27,255 | |
| | Mexico—0.7% | | | | | | | | |
| * | Grupo Aeroportuario del Centro Norte S.A.B. de C.V. (Transportation infrastructure) | | | 372,500 | | | | 1,731 | |
| | |
| | Emerging Europe, Africa—6.2% | | | | | | | | |
| | Greece—1.9% | | | | | | | | |
| | JUMBO S.A. (Specialty retail) | | | 99,031 | | | | 1,780 | |
| | OPAP S.A. (Hotels, restaurants & leisure) | | | 195,530 | | | | 1,855 | |
| | Terna Energy S.A. (Independent power & renewable electricity producers) | | | 114,274 | | | | 1,234 | |
| | | | | | | | | 4,869 | |
| | Kenya—0.6% | | | | | | | | |
| | Safaricom plc (Wireless telecommunication services) | | | 5,828,700 | | | | 1,575 | |
| | Poland—2.5% | | | | | | | | |
| | CD Projekt S.A. (Entertainment) | | | 12,344 | | | | 1,232 | |
| * | Dino Polska S.A. (Food & staples retailing) | | | 103,373 | | | | 5,242 | |
| | | | | | | | | 6,474 | |
| | Russia—0.4% | | | | | | | | |
| | HeadHunter Group plc—ADR (Professional services) | | | 41,301 | | | | 966 | |
| | South Africa—0.8% | | | | | | | | |
| | Clicks Group, Ltd. (Food & staples retailing) | | | 86,957 | | | | 1,054 | |
| | Transaction Capital, Ltd. (Consumer finance) | | | 1,010,447 | | | | 1,083 | |
| | | | | | | | | 2,137 | |
| | | | Shares or | | | | |
| | | | Principal | | | | |
| | Issuer | | Amount | | | Value | |
| | |
| | Common Stocks—(continued) | | | | | | | | |
| | Total Common Stocks—98.3%
(cost $200,924) | | | | | | $ | 256,241 | |
| | |
| | Preferred Stock | | | | | | | | |
| | Brazil—0.7% | | | | | | | | |
| | Randon S.A. Implementos e Participacoes (Machinery) | | | 943,250 | | | | 1,667 | |
| | Total Preferred Stock—0.7%
(cost $1,942) | | | | | | | 1,667 | |
| | |
| | Repurchase Agreement | | | | | | | | |
| | Fixed Income Clearing Corporation, 0.000% dated 6/30/20, due 7/1/20, repurchase price $1,789, collateralized by U.S. Treasury Note, 1.625%, due 2/15/26, valued at $1,825 | | $ | 1,789 | | | | 1,789 | |
| | Total Repurchase Agreement—0.7%
(cost $1,789) | | | | | | | 1,789 | |
| | Total Investments—99.7%
(cost $204,655) | | | | | | | 259,697 | |
| | Cash and other assets, less liabilities—0.3% | | | | | | | 871 | |
| | Net assets—100.0% | | | | | | $ | 260,568 | |
ADR = American Depository Receipt
* = Non-income producing security
** = Fair valued pursuant to Valuation Procedures approved by the Board of Trustees. This holding represents 0.00% of the Fund’s net assets at June 30, 2020.
† = U.S. listed foreign security
For securities primarily traded on exchanges or markets that close before the close of regular trading on the New York Stock Exchange, the Fund may use an independent pricing service to fair value price the securities pursuant to Valuation Procedures approved by the Board of Trustees.
See accompanying Notes to Financial Statements.
| 72 | Semiannual Report | June 30, 2020 |
Emerging Markets Small Cap Growth Fund
Portfolio of Investments, June 30, 2020 (unaudited)
At June 30, 2020, the Fund’s Portfolio of Investments includes the following industry categories (as a percentage of long-term investments):
| Information Technology | | | 28.8 | % |
| Industrials | | | 20.2 | % |
| Consumer Discretionary | | | 15.3 | % |
| Consumer Staples | | | 11.2 | % |
| Health Care | | | 9.4 | % |
| Materials | | | 4.7 | % |
| Financials | | | 3.8 | % |
| Real Estate | | | 3.6 | % |
| Communication Services | | | 1.8 | % |
| Utilities | | | 1.2 | % |
| Total | | | 100.0 | % |
At June 30, 2020, the Fund’s Portfolio of Investments includes the following currency categories (as a percentage of long-term investments):
| New Taiwan Dollar | | | 23.7 | % |
| Chinese Yuan Renminbi | | | 14.2 | % |
| Hong Kong Dollar | | | 13.9 | % |
| Indian Rupee | | | 13.4 | % |
| Brazilian Real | | | 10.5 | % |
| South Korean Won | | | 8.7 | % |
| U.S. Dollar | | | 3.0 | % |
| Polish Zloty | | | 2.5 | % |
| Indonesian Rupiah | | | 1.9 | % |
| Euro | | | 1.9 | % |
| Thai Baht | | | 1.3 | % |
| Philippine Peso | | | 1.2 | % |
| All Other Currencies | | | 3.8 | % |
| Total | | | 100.0 | % |
See accompanying Notes to Financial Statements.
| June 30, 2020 | William Blair Funds | 73 |
Fixed Income Market Review and Outlook
The Bloomberg Barclays U.S. Aggregate Index returned +2.90% during the second quarter of 2020 and +6.14% for the year-to-date period ending June 30, 2020. It has been a favorable environment for treasuries and higher quality credit, especially longer duration profiles. Interest rates declined, with the majority of the move happening in the first quarter of 2020 as the Federal Reserve (Fed) responded to the COVID-19 pandemic and subsequent lockdowns. Year-to-date, the 10 Year U.S. Treasury note and 30 Year U.S. Treasury bond’s yields declined by roughly 1.26% and 0.98%, respectively. Corporate credit spreads widened 1.79% in first quarter 2020 as economic activity slowed due to the COVID-19 pandemic. As fiscal and monetary stimulus was injected into the economy in late March/early April of 2020, corporate credit spreads tightened 1.22%, ending the second quarter of 2020 at +1.50%, wider for the year by 0.57%.
Due to COVID-19 pandemic, the Federal Open Market Committee (FOMC) made an emergency cut of 0.50% to the Fed Funds rate on March 3, 2020. This was followed by another cut on Sunday March 15, 2020. The target rate is now 0-0.25%. The curve experienced a parallel shift downward as the Fed hit the ZLB (Zero Lower Bound). The 3-month T-bill was briefly negative intra-month in March. In addition to rate cuts, in March 2020, the Fed also boosted funding markets by creating the Commercial Paper Funding Facility (CPFF), which was designed to support the flow of liquidity within commercial paper market, and the Money Market Liquidity Facility (MMLF), which was re-launched to assist in meeting the demands for possible redemptions. Finally, the Fed also focused on stabilizing credit markets, and in late March 2020, announced the Primary & Secondary Market Corporate Credit Facility (PMCFF & SMCCF), which were new facilities created to support highly rated US corporate bonds, and the Term Asset-Backed Loan Facility (TALF), which was created to support flow of credit to US consumers.
The Fed also expanded their balance sheet ~63% year-to-date through open market purchases, targeting U.S. Treasury bills & notes as well as Agency Mortgage-Backed Securities. All told, we believe that these actions coupled with rate cuts and targeted lending programs by the Fed helped stabilize markets, which led to the significant tightening of spread sectors in the second quarter of 2020.
U.S. Treasury Inflation-Protected Securities (TIPS) performed in-line with the overall Aggregate index year-to-date (+6.01%) and outperformed in the second quarter (+4.24%). Market-implied break-even inflation rates dropped materially year-to-date, moving from 1.78% to 1.34%, using the U.S. 10 year break-even levels. That being said, in March of 2020 break-evens reached 0.55%, their lowest levels in the last five years.
Agency mortgage-backed securities (+3.50%) underperformed the Aggregate Index year-to-date. Per the index, the best-performing segments of the market for the quarter were higher-coupon 30-year pools (coupons of 5.5% and higher) and the lowest coupon pools (coupons of 3.0%) that were supported as part of the Fed’s MBS purchasing program. Many lower-coupon pools (3.5–4.5%) experienced higher prepayment activity in light of the decline in interest rates during the year.
Corporate bonds of all tenors, credit qualities, and sectors underperformed similar-maturity Treasury instruments during the year. Higher quality Investment Grade bonds (AAA-A) outperformed lower rated corporate bonds (BBB’s). Longer maturity corporate bonds outperformed shorter maturity corporate bonds. BB- and B-rated high yield corporate bonds underperformed investment-grade corporate bonds as the Bloomberg Barclays US Corporate High Yield Bond Index returned -3.8% year-to-date.
U.S. economic growth projections at the end of June 2020 were negative, but have rebounded from dire projections seen at the end of first quarter 2020. We believe that inflationary pressures are benign, and inflation projections are below the FOMC’s longer-term objective of 2.0%-2.5%.
We believe that the FOMC will be very patient in moving away from the ZLB, with Chair Powell stating at the end of June 2020, “We are committed to using our full range of tools to support the economy and to help assure that the recovery from this difficult period will be as robust as possible.”
TIPS have market-implied breakeven inflation rates that are below the FOMC’s stated target range of 2.0%-2.5%. We believe TIPS are an attractive alternative to fixed-rate Treasuries to mitigate the effects of rising rates driven by accelerating inflationary pressures.
We believe that spread sectors remain relatively attractive to Treasuries over the intermediate-to-long term. Corporate risk premiums are near their longer-term averages, and we believe the tailwinds exist as their remains explicit support from the Fed for pockets of the credit markets. That being said, we believe security selection will be key as certain business models may not be sustainable in the post-pandemic environment.
| 74 | Semiannual Report | June 30, 2020 |
Fixed Income Market Review and Outlook (continued)
We believe that higher-coupon segments (30-year mortgage-backed securities (MBS) coupon rates of 5.0% and above) of the agency MBS market offer compelling value. These segments of the agency MBS market offer attractive spreads and a defensive duration profile. Prepayment protection is critical in this lower interest rate environment. We continue to mitigate this risk by focusing on specified pools comprised of borrowers that do not have the economic incentive to refinance their loans: seasoned low-loan balance pools.
| June 30, 2020 | William Blair Funds | 75 |
| | Bond Fund The Bond Fund seeks to outperform the Bloomberg Barclays U.S. Aggregate Index by maximizing total return through a combination of income and capital appreciation. AN OVERVIEW FROM THE PORTFOLIO MANAGERS |

Paul J. Sularz 
Ruta Ziverte | The William Blair Bond Fund (Class N shares) returned 4.29%, net of fees, for the six month period ended June 30, 2020. By comparison, the Fund’s benchmark, the Bloomberg Barclays U.S. Aggregate Index (the “Index”), returned 6.14%. A couple of factors detracted from the Fund’s performance relative to the Index year-to-date. The Fund’s significant underweight and shorter duration positioning in Treasuries detracted from performance as Treasuries continue to be the best performing sector year-to-date. In addition, modest allocations to higher beta sectors such as high yield corporates and emerging markets detracted from attribution, however security selection offset the majority of the detraction. Positive attribution came from the Fund’s overweight and security selection of higher coupon segments within the mortgage-backed securities (MBS) space, hedging credit exposure in first quarter 2020 with credit default swap positions, and security selection within Investment Grade corporate securities, offset only slightly by the Fund’s overweight. Please refer to the Fixed Income Market Review and Outlook relating to the Fund beginning on page 74. |
| 76 | Semiannual Report | June 30, 2020 |
Bond Fund
Performance Highlights (Unaudited)
| Average Annual Total Return through 6/30/2020 |
| | | Year | | | | | | | | |
| | | to Date | | 1 Year | | 3 Year | | 5 Year | | 10 Year |
| Class N | | | 4.29 | % | | | 7.23 | % | | | 4.76 | % | | | 4.03 | % | | | 4.22 | % |
| Class I | | | 4.30 | | | | 7.32 | | | | 4.91 | | | | 4.21 | | | | 4.39 | |
| Class R6 | | | 4.32 | | | | 7.48 | | | | 5.01 | | | | 4.29 | | | | 4.50 | |
| Bloomberg Barclays U.S. Aggregate Index | | | 6.14 | | | | 8.74 | | | | 5.32 | | | | 4.30 | | | | 3.82 | |
Performance cited represents past performance. Past performance does not guarantee future results and current performance may be lower or higher than the data quoted. Results shown are average annual total returns, which assume reinvestment of dividends and capital gains. Investment returns and principal will fluctuate and you may have a gain or loss when you sell shares. For the most current month-end performance information, please call 1-800-742-7272, or visit our Web site at www.williamblairfunds.com. From time to time, the investment adviser may waive fees or reimburse expenses for the Fund. Without these waivers/reimbursements, performance would be lower. Class N shares are not subject to a sales load. Class I shares are not subject to a sales load or distribution (Rule 12b-1) fees. Class R6 shares are not subject to a sales load, distribution (Rule 12b-1) fees, or sub-transfer agent fees.
The performance highlights and graph presented above do not reflect the deduction of taxes that a shareholder would pay on fund distributions or the redemption of fund shares.
The Bloomberg Barclays U.S. Aggregate Index indicates broad intermediate government/corporate bond market performance.
This report identifies the Fund’s investments on June 30, 2020. These holdings are subject to change. Not all investments in the Fund performed the same, nor is there any guarantee that these investments will perform as well in the future. Market forecasts provided in this report may not necessarily come to pass.
Sector Diversification (Unaudited)

The sector diversification shown is based on the total investments.
| June 30, 2020 | William Blair Funds | 77 |
Bond Fund
Portfolio of Investments, June 30, 2020 (all dollar amounts in thousands) (unaudited)
| | | | | | | | | | |
| | | | Principal | | |
| | Issuer | | Amount | | | Value | |
| | |
| | U.S. Government and U.S. Government Agency—56.1% |
| | U.S. Treasury Inflation Indexed Notes/Bonds—3.4% | | | | | | | | |
| | U.S. Treasury Inflation Indexed Bond, 3.875%, due 4/15/29 | | $ | 6,708 | | | $ | 9,484 | |
| | U.S. Treasury—2.1% | | | | | | | | |
| | U.S. Treasury Strip Principal, 0.000%, due 8/15/27 | | | 4,000 | | | | 3,877 | |
| | U.S. Treasury Bond, 2.375%, due 11/15/49 | | | 1,530 | | | | 1,890 | |
| | Total U.S. Treasury Obligations | | | | | | | 5,767 | |
| | Federal Home Loan Mortgage Corp. (FHLMC)—13.4% | | | | | | | | |
| | #J02986, 6.500%, due 7/1/21 | | | 1 | | | | 1 | |
| | #G02210, 7.000%, due 12/1/28 | | | 34 | | | | 39 | |
| | #G02183, 6.500%, due 3/1/30 | | | 3 | | | | 4 | |
| | #G01400, 7.000%, due 4/1/32 | | | 361 | | | | 423 | |
| | #G01728, 7.500%, due 7/1/32 | | | 62 | | | | 75 | |
| | #C01385, 6.500%, due 8/1/32 | | | 47 | | | | 54 | |
| | #C01623, 5.500%, due 9/1/33 | | | 54 | | | | 62 | |
| | #A15039, 5.500%, due 10/1/33 | | | 2 | | | | 2 | |
| | #A17603, 5.500%, due 1/1/34 | | | 1,317 | | | | 1,525 | |
| | #G01843, 6.000%, due 6/1/35 | | | 11 | | | | 13 | |
| | #A62858, 6.500%, due 7/1/37 | | | 63 | | | | 73 | |
| | #G03170, 6.500%, due 8/1/37 | | | 115 | | | | 134 | |
| | #A78138, 5.500%, due 6/1/38 | | | 161 | | | | 185 | |
| | #G04466, 5.500%, due 7/1/38 | | | 9,713 | | | | 11,370 | |
| | #G60366, 6.000%, due 10/1/39 | | | 9,471 | | | | 11,081 | |
| | #G61450, 6.000%, due 4/1/40 | | | 9,782 | | | | 11,615 | |
| | #C03665, 9.000%, due 4/1/41 | | | 227 | | | | 277 | |
| | Total FHLMC Mortgage Obligations | | | | | | | 36,933 | |
| | Federal National Mortgage Association (FNMA)—37.2% | | | | | | | | |
| | #900725, 6.000%, due 8/1/21 | | | 3 | | | | 3 | |
| | #893325, 7.000%, due 9/1/21 | | | 2 | | | | 2 | |
| | #255956, 5.500%, due 10/1/25 | | | 6 | | | | 7 | |
| | #AL2853, 4.500%, due 6/1/26 | | | 2,615 | | | | 2,787 | |
| | #AL9857, 4.000%, due 2/1/29 | | | 1,351 | | | | 1,434 | |
| | #252925, 7.500%, due 12/1/29 | | | 1 | | | | 1 | |
| | #AD0729, 7.500%, due 12/1/30 | | | 2,560 | | | | 3,009 | |
| | #535977, 6.500%, due 4/1/31 | | | 4 | | | | 5 | |
| | #253907, 7.000%, due 7/1/31 | | | 1 | | | | 1 | |
| | #587849, 6.500%, due 11/1/31 | | | 4 | | | | 5 | |
| | #545437, 7.000%, due 2/1/32 | | | 28 | | | | 33 | |
| | #545759, 6.500%, due 7/1/32 | | | 236 | | | | 278 | |
| | #545869, 6.500%, due 7/1/32 | | | 780 | | | | 911 | |
| | #670385, 6.500%, due 9/1/32 | | | 356 | | | | 421 | |
| | #254548, 5.500%, due 12/1/32 | | | 23 | | | | 26 | |
| | #AD0725, 7.000%, due 12/1/32 | | | 1,183 | | | | 1,406 | |
| | #555340, 5.500%, due 4/1/33 | | | 179 | | | | 208 | |
| | #741850, 5.500%, due 9/1/33 | | | 274 | | | | 315 | |
| | #555800, 5.500%, due 10/1/33 | | | 26 | | | | 30 | |
| | #CA2754, 4.500%, due 11/1/33 | | | 701 | | | | 756 | |
| | #756153, 5.500%, due 11/1/33 | | | 279 | | | | 320 | |
| | #AL3455, 5.500%, due 11/1/33 | | | 3,820 | | | | 4,428 | |
| | #AL3401, 5.500%, due 2/1/34 | | | 768 | | | | 891 | |
| | #763798, 5.500%, due 3/1/34 | | | 49 | | | | 57 | |
| | | | NRSRO | | | | | | |
| | | | Rating | | Principal | | |
| | Issuer | | (unaudited) | | Amount | | | Value | |
| | |
| | U.S. Government and U.S. Government Agency—(continued) |
| | Federal National Mortgage Association (FNMA)—(continued) |
| | #725611, 5.500%, due 6/1/34 | | | | $ | 59 | | | $ | 68 | |
| | #745563, 5.500%, due 8/1/34 | | | | | 336 | | | | 386 | |
| | #AL6413, 8.000%, due 8/1/34 | | | | | 346 | | | | 398 | |
| | #794474, 6.000%, due 10/1/34 | | | | | 29 | | | | 34 | |
| | #745092, 6.500%, due 7/1/35 | | | | | 187 | | | | 219 | |
| | #357944, 6.000%, due 9/1/35 | | | | | 7 | | | | 8 | |
| | #AL6412, 7.500%, due 9/1/35 | | | | | 556 | | | | 641 | |
| | #AD0979, 7.500%, due 10/1/35 | | | | | 37 | | | | 44 | |
| | #888305, 7.000%, due 3/1/36 | | | | | 6 | | | | 7 | |
| | #895637, 6.500%, due 5/1/36 | | | | | 33 | | | | 39 | |
| | #831540, 6.000%, due 6/1/36 | | | | | 15 | | | | 17 | |
| | #893318, 6.500%, due 8/1/36 | | | | | 7 | | | | 9 | |
| | #831926, 6.000%, due 12/1/36 | | | | | 395 | | | | 460 | |
| | #902974, 6.000%, due 12/1/36 | | | | | 98 | | | | 114 | |
| | #AB0265, 6.000%, due 2/1/37 | | | | | 7,595 | | | | 8,886 | |
| | #938440, 6.000%, due 7/1/37 | | | | | 59 | | | | 69 | |
| | #948689, 6.000%, due 8/1/37 | | | | | 88 | | | | 101 | |
| | #AL6411, 7.000%, due 12/1/37 | | | | | 1,321 | | | | 1,517 | |
| | #AL0904, 5.500%, due 1/1/38 | | | | | 69 | | | | 79 | |
| | #986856, 6.500%, due 9/1/38 | | | | | 75 | | | | 89 | |
| | #FM1735, 6.500%, due 10/1/38 | | | | | 4,425 | | | | 5,387 | |
| | #991911, 7.000%, due 11/1/38 | | | | | 73 | | | | 84 | |
| | #FM2467, 6.000%, due 1/1/39 | | | | | 4,273 | | | | 5,076 | |
| | #AD0752, 7.000%, due 1/1/39 | | | | | 372 | | | | 469 | |
| | #AC1619, 5.500%, due 8/1/39 | | | | | 229 | | | | 262 | |
| | #FM1736, 6.500%, due 10/1/39 | | | | | 7,210 | | | | 8,683 | |
| | #AD7137, 5.500%, due 7/1/40 | | | | | 2,743 | | | | 3,223 | |
| | #BM1689, 5.500%, due 8/1/40 | | | | | 2,224 | | | | 2,557 | |
| | #AL5815, 5.500%, due 4/1/41 | | | | | 2,651 | | | | 3,112 | |
| | #BM3525, 6.000%, due 4/1/41 | | | | | 9,327 | | | | 10,934 | |
| | #AL9226, 5.500%, due 12/1/41 | | | | | 11,099 | | | | 12,979 | |
| | #AL9225, 6.000%, due 1/1/42 | | | | | 4,983 | | | | 5,848 | |
| | #BM5121, 5.500%, due 12/1/48 | | | | | 11,649 | | | | 13,678 | |
| | Total FNMA Mortgage Obligations | | | | | | | | | 102,811 | |
| | |
| | U.S. Government Agency—1.8% |
| | TBA—1.8% | | | | | | | | | | |
| | FNCL 2 7/20, 2.000%, due 7/1/50 | | | | | 5,000 | | | | 5,117 | |
| | |
| | Asset-Backed Securities—1.5% |
| | Centre Point Funding LLC—144A, 2012-2A, Tranche 1, 2.610%, 8/20/21 | | A1 | | | 24 | | | | 24 | |
| | Tesla Auto Lease Trust—144A, 2019-A, Tranche E, 5.480%, 5/22/23 | | Ba3 | | | 1,000 | | | | 1,024 | |
| | GM Financial Automobile Leasing Trust, 2020-1, Tranche D, 2.280%, 6/20/24 | | A | | | 3,050 | | | | 3,018 | |
| | Total Asset-Backed Securities | | | | | | | | | 4,066 | |
See accompanying Notes to Financial Statements.
| 78 | Semiannual Report | June 30, 2020 |
Bond Fund
Portfolio of Investments, June 30, 2020 (all dollar amounts in thousands) (unaudited)
| | | | NRSRO | | | | | | |
| | | | Rating | | Principal | | |
| | Issuer | | (unaudited) | | Amount | | | Value | |
| | |
| | Corporate Obligations—41.4% |
| | Fresenius Medical Care US Finance II, Inc.—144A, 5.875%, due 1/31/22 | | BBB | | $ | 2,000 | | | $ | 2,110 | |
| | Toyota Motor Credit Corporation, 1.150%, due 5/26/22 | | A+ | | | 1,000 | | | | 1,012 | |
| | Jones Lang LaSalle, Inc., 4.400%, due 11/15/22 | | BBB+ | | | 2,500 | | | | 2,623 | |
| | Toll Brothers Finance Corporation, 4.375%, due 4/15/23 | | BBB- | | | 2,750 | | | | 2,863 | |
| | CNH Industrial Capital LLC, 1.950%, due 7/2/23 | | BBB | | | 1,600 | | | | 1,611 | |
| | Wells Fargo & Co., 4.480%, due 1/16/24 | | A3 | | | 1,500 | | | | 1,666 | |
| | Lennar Corporation, 4.500%, due 4/30/24 | | BBB- | | | 2,450 | | | | 2,554 | |
| | Banco Inbursa S.A. Institucion de Banca Multiple—144A, 4.125%, due 6/6/24 | | BBB | | | 2,000 | | | | 2,057 | |
| | Grupo Bimbo S.A.B. de C.V.—144A, 3.875%, due 6/27/24 | | BBB | | | 2,000 | | | | 2,143 | |
| | JPMorgan Chase & Co., SOFRRATE + 3.125%, 4.600%, due 2/1/25, VRN | | BBB+ | | | 3,000 | | | | 2,681 | |
| | Ford Motor Co., 9.000%, due 4/22/25 | | BB+ | | | 700 | | | | 759 | |
| | Booz Allen Hamilton, Inc.—144A, 5.125%, due 5/1/25 | | Ba2 | | | 1,400 | | | | 1,426 | |
| | DaVita, Inc., 5.000%, due 5/1/25 | | Ba3 | | | 1,400 | | | | 1,433 | |
| | Simon Property Group L.P., 3.300%, due 1/15/26 | | A | | | 2,750 | | | | 2,953 | |
| | Xylem, Inc., 3.250%, due 11/1/26 | | BBB | | | 2,225 | | | | 2,459 | |
| | Netflix, Inc., 4.375%, due 11/15/26 | | BB- | | | 1,400 | | | | 1,460 | |
| | Fibria Overseas Finance, Ltd., 5.500%, due 1/17/27 | | BBB- | | | 2,000 | | | | 2,155 | |
| | Sirius XM Radio, Inc.—144A, 5.000%, due 8/1/27 | | BB | | | 1,400 | | | | 1,433 | |
| | Motorola Solutions, Inc., 4.600%, due 2/23/28 | | BBB- | | | 2,750 | | | | 3,130 | |
| | Winnebago Industries, Inc.—144A, 6.250%, due 7/15/28 | | BB | | | 250 | | | | 250 | |
| | Roper Technologies, Inc., 4.200%, due 9/15/28 | | BBB+ | | | 2,500 | | | | 2,934 | |
| | The Kroger Co., 8.000%, due 9/15/29 | | Baa1 | | | 2,250 | | | | 3,249 | |
| | United Rentals North America, Inc., 5.250%, due 1/15/30 | | BB- | | | 1,250 | | | | 1,294 | |
| | Sysco Corporation, 2.400%, due 2/15/30 | | Baa1 | | | 3,200 | | | | 3,170 | |
| | Omnicom Group, Inc., 2.450%, due 4/30/30 | | BBB+ | | | 2,800 | | | | 2,863 | |
| | Abbott Laboratories, 1.400%, due 6/30/30 | | A- | | | 1,350 | | | | 1,345 | |
| | Intuit, Inc., 1.650%, due 7/15/30 | | A- | | | 1,200 | | | | 1,199 | |
| | | | NRSRO | | | | | | |
| | | | Rating | | Principal | | |
| | Issuer | | (unaudited) | | Amount | | | Value | |
| | |
| | Corporate Obligations—(continued) | | |
| | Costco Wholesale Corporation, 1.750%, due 4/20/32 | | Aa3 | | $ | 2,500 | | | $ | 2,542 | |
| | Owens Corning, 7.000%, due 12/1/36 | | BBB | | | 2,250 | | | | 2,881 | |
| | Yum! Brands, Inc., 6.875%, due 11/15/37 | | B+ | | | 1,250 | | | | 1,349 | |
| | ConocoPhillips, 6.500%, due 2/1/39 | | A | | | 2,000 | | | | 2,916 | |
| | Citigroup, Inc., 5.875%, due 1/30/42 | | A | | | 2,000 | | | | 2,917 | |
| | Bank of America Corporation, 5.875%, due 2/7/42 | | A+ | | | 2,000 | | | | 2,988 | |
| | Cox Communications, Inc.—144A, 4.700%, due 12/15/42 | | BBB+ | | | 2,500 | | | | 3,096 | |
| | Orbia Advance Corp S.A.B. de C.V.—144A, 5.875%, due 9/17/44 | | BBB | | | 2,250 | | | | 2,474 | |
| | AbbVie, Inc., 4.700%, due 5/14/45 | | BBB+ | | | 2,500 | | | | 3,147 | |
| | ERP Operating L.P., 4.500%, due 6/1/45 | | A | | | 2,500 | | | | 3,293 | |
| | Apple, Inc., 4.650%, due 2/23/46 | | AA+ | | | 2,250 | | | | 3,104 | |
| | PepsiCo, Inc., 4.450%, due 4/14/46 | | A+ | | | 2,250 | | | | 3,016 | |
| | Brookfield Finance, Inc., 4.700%, due 9/20/47 | | A- | | | 2,750 | | | | 3,127 | |
| | Union Pacific Corporation, 4.300%, due 3/1/49 | | A- | | | 2,500 | | | | 3,202 | |
| | Microsoft Corporation, 4.750%, due 11/3/55 | | AAA | | | 2,250 | | | | 3,277 | |
| | AT&T, Inc., 5.700%, due 3/1/57 | | A- | | | 2,250 | | | | 3,089 | |
| | Comcast Corporation, 4.950%, due 10/15/58 | | A- | | | 2,000 | | | | 2,853 | |
| | Altria Group, Inc., 6.200%, due 2/14/59 | | A3 | | | 2,250 | | | | 3,011 | |
| | The Boeing Co., 5.930%, due 5/1/60 | | Baa2 | | | 1,400 | | | | 1,667 | |
| | Amazon.com, Inc., 2.700%, due 6/3/60 | | AA- | | | 1,250 | | | | 1,279 | |
| | Corning, Inc., 5.850%, due 11/15/68 | | BBB+ | | | 2,400 | | | | 3,052 | |
| | Petrobras Global Finance BV, 6.850%, due 6/5/15 | | Ba2 | | | 1,250 | | | | 1,236 | |
| | Total Corporate Obligations | | | | | | | | | 114,348 | |
| | Total Long-Term Investments—100.8%
(cost $259,476) | | | | | | | | | 278,526 | |
See accompanying Notes to Financial Statements.
| June 30, 2020 | William Blair Funds | 79 |
Bond Fund
Portfolio of Investments, June 30, 2020 (all dollar amounts in thousands) (unaudited)
| | | | | | | | | | |
| | | | Principal | | |
| | Issuer | | Amount | | | Value | |
| | |
| | Repurchase Agreement | | | | | | | | |
| | Fixed Income Clearing Corporation, 0.000% dated 6/30/20, due 7/1/20, repurchase price $2,159, collateralized by U.S. Treasury Note, 1.625%, due 2/15/26, valued at $2,202 | | $ | 2,159 | | | $ | 2,159 | |
| | Total Repurchase Agreement—0.8%
(cost $2,159) | | | | | | | 2,159 | |
| | Total Investments—101.6%
(cost $261,635) | | | | | | | 280,685 | |
| | Liabilities, plus cash and other assets—(1.6)% | | | | | | | (4,530 | ) |
| | Net assets—100.0% | | | | | | $ | 276,155 | |
The obligations of certain U.S. Government-sponsored securities are neither issued nor guaranteed by the U.S. Treasury.
144A = Security exempt from registration under Rule 144A of the Securities Act of 1933. These securities may be resold in transactions exempt from registration, normally to qualified institutional buyers.
NRSRO = Nationally Recognized Statistical Rating Organization—The credit quality ratings of the securities in the Fund reflect the highest category rating by any of Fitch Ratings, Moody’s Investors Service Inc., or Standard & Poor’s, a division of the McGraw-Hill Companies, Inc.
TBA = To Be Announced—TBAs are mortgage-backed securities traded under delayed delivery commitments, settling after June 30, 2020. The term TBA comes from the fact that the specific mortgage-backed security that will be delivered to fulfill a TBA trade is not designated at the time the trade is made.
VRN = Variable Rate Note
See accompanying Notes to Financial Statements.
| 80 | Semiannual Report | June 30, 2020 |
| | Income Fund |
| | |
| | The Income Fund seeks a high level of current income with relative stability of principal. |
| | |
| | AN OVERVIEW FROM THE PORTFOLIO MANAGER |
| | |

Ruta Ziverte | The William Blair Income Fund (Class N shares) returned 3.14%, net of fees, for the six month period ended June 30, 2020. By comparison, the Fund’s benchmark, the Bloomberg Barclays Intermediate Government/Credit Bond Index (the “Index”), returned 5.28%. A couple of factors detracted from the Fund’s performance relative to the Index year-to-date. The Fund’s significant underweight and shorter duration positioning in Treasuries detracted from performance as Treasuries continue to be the best performing sector year-to-date. Additionally, security selection within treasuries detracted from performance as U.S. Treasury Inflation-Protected Securities (TIPS) underperformed nominal treasuries. Security selection in Investment Grade Credit detracted from attribution, primarily from owning shorter duration exposure as 7-10 year credit outperformed 3-5 year credit. Finally, the Fund has a shorter duration profile versus the benchmark, which detracted from performance. Positive attribution came from the Fund’s security selection of higher coupon segments within the mortgage-backed securities (MBS) space, which contributed to performance as these securities outperformed current coupon MBS. In addition, the Fund’s overweight to select asset-backed securities (ABS) was a contributor to performance as spreads continued to tighten. Finally, the structural bias to up-in quality Investment Grade Credit contributed to attribution as the Fund limits its BBB exposure to 10% of the portfolio. Please refer to the Fixed Income Market Review and Outlook relating to the Fund beginning on page 74. |
| June 30, 2020 | William Blair Funds | 81 |
Income Fund
Performance Highlights (Unaudited)
| Average Annual Total Return through 6/30/2020 |
| | | Year
to Date | | 1 Year | | 3 Year | | 5 Year | | 10 Year | | Since
Inception(a) |
| Class N | | | 3.14 | % | | | 4.70 | % | | | 2.87 | % | | | 2.34 | % | | | 2.69 | % | | | — | |
| Class I | | | 3.22 | | | | 4.87 | | | | 3.10 | | | | 2.60 | | | | 2.93 | | | | — | |
| Class R6 | | | 3.25 | | | | 4.92 | | | | — | | | | — | | | | — | | | | 5.58 | % |
| Bloomberg Barclays Intermediate Government/ Credit Bond Index | | | 5.28 | | | | 7.12 | | | | 4.43 | | | | 3.46 | | | | 3.13 | | | | 8.29 | |
| (a) | Since inception is for the period from May 2, 2019 (Commencement of Operations) to June 30, 2020. |
Performance cited represents past performance. Past performance does not guarantee future results and current performance may be lower or higher than the data quoted. Results shown are average annual total returns, which assume reinvestment of dividends and capital gains. Investment returns and principal will fluctuate and you may have a gain or loss when you sell shares. For the most current month-end performance information, please call 1-800-742-7272, or visit our Web site at www.williamblairfunds.com. From time to time, the investment adviser may waive fees or reimburse expenses for the Fund. Without these waivers/reimbursements, performance would be lower. Class N shares are not subject to a sales load. Class I shares are not subject to a sales load or distribution (Rule 12b-1) fees. Class R6 shares are not subject to a sales load, distribution (Rule 12b-1) fees, or sub-transfer agent fees.
The performance highlights and graph presented above do not reflect the deduction of taxes that a shareholder would pay on fund distributions or the redemption of fund shares.
The Bloomberg Barclays Intermediate Government/Credit Bond Index indicates broad intermediate government/corporate bond market performance.
This report identifies the Fund’s investments on June 30, 2020. These holdings are subject to change. Not all investments in the Fund performed the same, nor is there any guarantee that these investments will perform as well in the future. Market forecasts provided in this report may not necessarily come to pass.
Sector Diversification (Unaudited)

The sector diversification shown is based on the total investments.
| 82 | Semiannual Report | June 30, 2020 |
Income Fund
Portfolio of Investments, June 30, 2020 (all dollar amounts in thousands) (unaudited)
| | | | | | | | |
| | | | Principal | | | | |
| | Issuer | | Amount | | | Value | |
| | | | | | | | |
| | U.S. Government and U.S. Government Agency—65.8% |
| | U.S. Treasury Inflation Indexed Notes/Bonds—3.1% |
| | U.S. Treasury Inflation Indexed Bond, 3.875%, due 4/15/29 | | $ | 1,170 | | | $ | 1,654 | |
| | U.S. Treasury—3.8% | | | | | | | | |
| | U.S. Treasury Strip Principal, 0.000%, due 5/15/22 | | | 1,000 | | | | 997 | |
| | U.S. Treasury Strip Principal, 0.000%, due 8/15/27 | | | 775 | | | | 751 | |
| | U.S. Treasury Bill, 0.175%, due 09/17/2020 | | | 240 | | | | 240 | |
| | Total U.S. Treasury Obligations | | | | | | | 1,988 | |
| | Federal Home Loan Mortgage Corp. (FHLMC)—8.8% |
| | #E02490, 6.000%, due 4/1/23 | | | 20 | | | | 21 | |
| | #J13022, 4.000%, due 9/1/25 | | | 195 | | | | 206 | |
| | #G14150, 4.500%, due 4/1/26 | | | 59 | | | | 63 | |
| | #J16051, 4.500%, due 7/1/26 | | | 440 | | | | 472 | |
| | #G15030, 4.000%, due 3/1/29 | | | 143 | | | | 154 | |
| | #A17603, 5.500%, due 1/1/34 | | | 381 | | | | 442 | |
| | #G01705, 5.500%, due 6/1/34 | | | 693 | | | | 804 | |
| | #A45790, 7.500%, due 5/1/35 | | | 65 | | | | 75 | |
| | #G04126, 6.000%, due 6/1/37 | | | 166 | | | | 195 | |
| | #G04564, 6.000%, due 12/1/37 | | | 133 | | | | 155 | |
| | #G05566, 5.500%, due 12/1/38 | | | 94 | | | | 108 | |
| | #G05875, 5.500%, due 2/1/40 | | | 69 | | | | 81 | |
| | #G61450, 6.000%, due 4/1/40 | | | 1,466 | | | | 1,741 | |
| | #C03665, 9.000%, due 4/1/41 | | | 110 | | | | 134 | |
| | Total FHLMC Mortgage Obligations | | | | | | | 4,651 | |
| | Federal National Mortgage Association (FNMA)—50.1% |
| | #735574, 8.000%, due 3/1/22 | | | 10 | | | | 11 | |
| | FNR G93-19 SH, 1M USD LIBOR + 56.169%, 11.234%, due 4/25/23, VRN | | | 10 | | | | 10 | |
| | #982885, 5.000%, due 5/1/23 | | | 103 | | | | 109 | |
| | #933985, 5.500%, due 8/1/23 | | | 51 | | | | 53 | |
| | #255956, 5.500%, due 10/1/25 | | | 19 | | | | 21 | |
| | #AH0971, 4.000%, due 12/1/25 | | | 219 | | | | 232 | |
| | #AL2853, 4.500%, due 6/1/26 | | | 338 | | | | 360 | |
| | #AJ6954, 4.000%, due 11/1/26 | | | 98 | | | | 104 | |
| | #256639, 5.000%, due 2/1/27 | | | 4 | | | | 5 | |
| | #AL9730, 4.500%, due 2/1/27 | | | 675 | | | | 721 | |
| | #806458, 8.000%, due 6/1/28 | | | 62 | | | | 71 | |
| | #AL9857, 4.000%, due 2/1/29 | | | 4,100 | | | | 4,351 | |
| | #880155, 8.500%, due 7/1/29 | | | 93 | | | | 107 | |
| | #797846, 7.000%, due 3/1/32 | | | 23 | | | | 23 | |
| | #745519, 8.500%, due 5/1/32 | | | 44 | | | | 50 | |
| | #654674, 6.500%, due 9/1/32 | | | 32 | | | | 36 | |
| | #AD0725, 7.000%, due 12/1/32 | | | 505 | | | | 600 | |
| | #254693, 5.500%, due 4/1/33 | | | 4 | | | | 5 | |
| | #555531, 5.500%, due 6/1/33 | | | 38 | | | | 43 | |
| | #711736, 5.500%, due 6/1/33 | | | 58 | | | | 66 | |
| | #555591, 5.500%, due 7/1/33 | | | 6 | | | | 7 | |
| | #AL3455, 5.500%, due 11/1/33 | | | 1,122 | | | | 1,301 | |
| | #CA2754, 4.500%, due 11/1/33 | | | 384 | | | | 413 | |
| | #725424, 5.500%, due 4/1/34 | | | 40 | | | | 46 | |
| | | | NRSRO | | | | | | |
| | | | Rating | | Principal | | | | |
| | Issuer | | (unaudited) | | Amount | | | Value | |
| | | | | | | | | | |
| | U.S. Government and U.S. Government Agency—(continued) |
| | Federal National Mortgage Association (FNMA)—(continued) |
| | #AL6413, 8.000%, due 8/1/34 | | | | $ | 169 | | | $ | 194 | |
| | #AL6412, 7.500%, due 9/1/35 | | | | | 417 | | | | 481 | |
| | #888884, 5.500%, due 12/1/35 | | | | | 93 | | | | 106 | |
| | #991911, 7.000%, due 11/1/38 | | | | | 47 | | | | 54 | |
| | #928658, 6.500%, due 9/1/37 | | | | | 15 | | | | 17 | |
| | #889371, 6.000%, due 1/1/38 | | | | | 1,723 | | | | 2,025 | |
| | #FM1735, 6.500%, due 10/1/38 | | | | | 1,252 | | | | 1,524 | |
| | #FM2467, 6.000%, due 1/1/39 | | | | | 475 | | | | 564 | |
| | #FM1736, 6.500%, due 10/1/39 | | | | | 1,193 | | | | 1,436 | |
| | #BM1689, 5.500%, due 8/1/40 | | | | | 301 | | | | 346 | |
| | #BM3525, 6.000%, due 4/1/41 | | | | | 828 | | | | 970 | |
| | #AL5815, 5.500%, due 4/1/41 | | | | | 379 | | | | 445 | |
| | #AL9226, 5.500%, due 12/1/41 | | | | | 3,508 | | | | 4,102 | |
| | #AL9225, 6.000%, due 1/1/42 | | | | | 1,370 | | | | 1,608 | |
| | #BM1328, 6.000%, due 1/1/42 | | | | | 1,426 | | | | 1,671 | |
| | #BM5121, 5.500%, due 12/1/48 | | | | | 1,915 | | | | 2,249 | |
| | Total FNMA Mortgage Obligations | | | | | | | | | 26,537 | |
| | | | | | | | | | | | |
| | Asset-Backed Securities—2.6% | | | |
| | GM Financial Automobile Leasing Trust, 2020-1, Tranche C, 2.040%, 12/20/23 | | A+ | | | 950 | | | | 944 | |
| | Verizon Owner Trust, 2020-A, Tranche C, 2.060%, 7/22/24 | | Aa3 | | | 425 | | | | 426 | |
| | Total Asset-Backed Securities | | | | | | | | | 1,370 | |
| | | | | | | | | | | | |
| | Corporate Obligations—30.9% | | | |
| | HSBC Holdings plc, 3M USD LIBOR + 2.240%, 2.558%, due 3/8/21, VRN | | A+ | | | 500 | | | | 506 | |
| | Toyota Motor Credit Corporation, 1.150%, due 5/26/22 | | A+ | | | 500 | | | | 506 | |
| | Jones Lang LaSalle, Inc., 4.400%, due 11/15/22 | | BBB+ | | | 500 | | | | 525 | |
| | Toll Brothers Finance Corporation, 4.375%, due 4/15/23 | | BBB- | | | 500 | | | | 521 | |
| | CNH Industrial Capital LLC, 1.950%, due 7/2/23 | | BBB | | | 350 | | | | 352 | |
| | Wells Fargo & Co., 4.480%, due 1/16/24 | | A3 | | | 550 | | | | 611 | |
| | The Goldman Sachs Group, Inc., 4.000%, due 3/3/24 | | A | | | 550 | | | | 608 | |
| | Bank of America Corporation, 3M USD LIBOR + 0.780%, 3.550%, due 3/5/24, VRN | | A+ | | | 650 | | | | 695 | |
| | Mitsubishi UFJ Financial Group, Inc., 3.407%, due 3/7/24 | | A1 | | | 550 | | | | 594 | |
| | Citigroup, Inc., SOFR + 1.667%, 1.678%, due 5/15/24, VRN | | A | | | 500 | | | | 510 | |
| | Grupo Bimbo S.A.B. de C.V.—144A, 3.875%, due 6/27/24 | | BBB | | | 500 | | | | 536 | |
| | ERP Operating L.P., 3.375%, due 6/1/25 | | A | | | 550 | | | | 605 | |
See accompanying Notes to Financial Statements.
| June 30, 2020 | William Blair Funds | 83 |
Income Fund
Portfolio of Investments, June 30, 2020 (all dollar amounts in thousands) (unaudited)
| | | | NRSRO | | | | | | |
| | | | Rating | | Principal | | | | |
| | Issuer | | (unaudited) | | Amount | | | Value | |
| | | | | | | | | | |
| | Corporate Obligations—(continued) | | |
| | Intuit, Inc., 0.950%, due 7/15/25 | | A- | | $ | 450 | | | $ | 452 | |
| | The Hershey Co., 0.900%, due 6/1/25 | | A1 | | | 525 | | | | 528 | |
| | Comcast Corporation, 3.950%, due 10/15/25 | | A- | | | 500 | | | | 573 | |
| | Capital One Financial Corporation, 4.200%, due 10/29/25 | | Baa1 | | | 500 | | | | 556 | |
| | Intercontinental Exchange, Inc., 3.750%, due 12/1/25 | | A | | | 550 | | | | 627 | |
| | Simon Property Group L.P., 3.300%, due 1/15/26 | | A | | | 550 | | | | 591 | |
| | AT&T, Inc., 4.125%, due 2/17/26 | | A- | | | 550 | | | | 627 | |
| | Merck & Co., Inc., 0.750%, due 2/24/26 | | AA- | | | 700 | | | | 699 | |
| | ConocoPhillips Co., 4.950%, due 3/15/26 | | A | | | 500 | | | | 600 | |
| | Brookfield Finance, Inc., 4.250%, due 6/2/26 | | A- | | | 550 | | | | 622 | |
| | Costco Wholesale Corporation, 1.375%, due 6/20/27 | | Aa3 | | | 500 | | | | 512 | |
| | Abbott Laboratories, 1.150%, due 1/30/28 | | A- | | | 450 | | | | 452 | |
| | Motorola Solutions, Inc., 4.600%, due 2/23/28 | | BBB- | | | 450 | | | | 512 | |
| | Roper Technologies, Inc., 4.200%, due 9/15/28 | | BBB+ | | | 375 | | | | 440 | |
| | The Kroger Co., 8.000%, due 9/15/29 | | Baa1 | | | 350 | | | | 505 | |
| | Sysco Corporation, 2.400%, due 2/15/30 | | Baa1 | | | 525 | | | | 520 | |
| | Omnicom Group, Inc., 2.450%, due 4/30/30 | | BBB+ | | | 500 | | | | 511 | |
| | Amazon.com, Inc., 1.500%, due 6/3/30 | | AA- | | | 450 | | | | 456 | |
| | Total Corporate Obligations | | | | | | | | | 16,352 | |
| | Total Long-Term Investments—99.3%
(cost $50,975) | | | | | | | | | 52,552 | |
| | | | | | | | |
| | | | Principal | | | | |
| | Issuer | | Amount | | | Value | |
| | | | | | | | |
| | Repurchase Agreement | | | | | | | | |
| | Fixed Income Clearing Corporation, 0.000% dated 6/30/20, due 7/1/20, repurchase price $119, collateralized by U.S. Treasury Note, 1.625%, due 2/15/26, valued at $122 | | $ | 119 | | | $ | 119 | |
| | Total Repurchase Agreement—0.2%
(cost $119) | | | | | | | 119 | |
| | | | | | | | | | |
| | Commercial Paper | | | | | | | | |
| | Societe Generale, 0.101%, due 7/1/20 | | | 350 | | | | 350 | |
| | Total Commercial Paper—0.7%
(cost $350) | | | | | | | 350 | |
| | Total Investments—100.2%
(cost $51,444) | | | | | | | 53,021 | |
| | Liabilities, plus cash and other assets—(0.2)% | | | | | | | (88 | ) |
| | Net assets—100.0% | | | | | | $ | 52,933 | |
The obligations of certain U.S. Government-sponsored securities are neither issued nor guaranteed by the U.S. Treasury.
144A = Security exempt from registration under Rule 144A of the Securities Act of 1933. These securities may be resold in transactions exempt from registration, normally to qualified institutional buyers.
NRSRO = Nationally Recognized Statistical Rating Organization—The credit quality ratings of the securities in the Fund reflect the highest category rating by any of Fitch Ratings, Moody’s Investors Service Inc., or Standard & Poor’s, a division of the McGraw-Hill Companies, Inc.
VRN = Variable Rate Note
See accompanying Notes to Financial Statements.
| 84 | Semiannual Report | June 30, 2020 |
| | Low Duration Fund |
| | |
| | The Low Duration Fund seeks to maximize total return. Total return includes both income and capital appreciation. |
| | |
| | AN OVERVIEW FROM THE PORTFOLIO MANAGERS |
| | |

Kathleen M. Lynch 
Paul J. Sularz | The William Blair Low Duration Fund (Class N shares) returned 1.85%, net of fees, for the six month period ended June 30, 2020. By comparison, the Fund’s benchmark index, the ICE BofAML 1-Year US Treasury Note Index (the “Index”), returned 1.69%. A couple of factors contributed to the Fund’s performance relative to the Index year-to-date. The Fund’s allocation to and security selection within higher coupon segments within the mortgage-backed securities (MBS) space contributed the most to performance. In addition, allocation to and security selection within Investment Grade Credit also contributed to performance as credit spreads continued to tighten. Finally, exposure to asset-backed securities (ABS) also contributed to performance as spreads tightened. While all sectors contributed positive returns to the Fund over the period, Investment Grade Credit and ABS exposure contributed the least to the Fund’s performance. Please refer to the Fixed Income Market Review and Outlook relating to the Fund beginning on page 74. |
| June 30, 2020 | William Blair Funds | 85 |
Low Duration Fund
Performance Highlights (Unaudited)
| Average Annual Total Return through 6/30/2020 |
| | | Year
to Date | | 1 Year | | 3 Year | | 5 Year | | 10 Year |
| Class N | | | 1.85 | % | | | 2.87 | % | | | 2.23 | % | | | 1.61 | % | | | 1.36 | % |
| Class I | | | 1.93 | | | | 2.91 | | | | 2.39 | | | | 1.78 | | | | 1.52 | |
| Class R6 | | | 1.84 | | | | 2.96 | | | | 2.40 | | | | 1.82 | | | | 1.61 | |
| ICE BofAML 1-Year US Treasury Note Index | | | 1.69 | | | | 2.86 | | | | 2.25 | | | | 1.54 | | | | 0.93 | |
Performance cited represents past performance. Past performance does not guarantee future results and current performance may be lower or higher than the data quoted. Results shown are average annual total returns, which assume reinvestment of dividends and capital gains. Investment returns and principal will fluctuate and you may have a gain or loss when you sell shares. For the most current month-end performance information, please call 1-800-742-7272, or visit our Web site at www.williamblairfunds.com. From time to time, the investment adviser may waive fees or reimburse expenses for the Fund. Without these waivers/reimbursements, performance would be lower. Class N shares are not subject to a sales load. Class I shares are not subject to a sales load or distribution (Rule 12b-1) fees. Class R6 shares are not subject to a sales load, distribution (Rule 12b-1) fees, or sub-transfer agent fees.
The performance highlights and graph presented above do not reflect the deduction of taxes that a shareholder would pay on fund distributions or the redemption of fund shares.
The ICE BofAML 1-Year US Treasury Note Index is comprised of a single U.S. Treasury Note issue purchased at the beginning of the month and held for a full month. Each month the index is rebalanced and the issue selected is the outstanding U.S. Treasury Note that matures closest to, but not beyond one year from the rebalancing date.
This report identifies the Fund’s investments on June 30, 2020. These holdings are subject to change. Not all investments in the Fund performed the same, nor is there any guarantee that these investments will perform as well in the future. Market forecasts provided in this report may not necessarily come to pass.
Sector Diversification (Unaudited)

The sector diversification shown is based on the total investments.
| 86 | Semiannual Report | June 30, 2020 |
Low Duration Fund
Portfolio of Investments, June 30, 2020 (all dollar amounts in thousands) (unaudited)
| | | | | | | | |
| | | | Principal | | | | |
| | Issuer | | Amount | | | Value | |
| | | | | | | | |
| | U.S. Government and U.S. Government Agency—65.6% | | | | | |
| | U.S. Treasury—13.5% | | | | | | | | |
| | U.S. Treasury Bill, 0.094%,
due 7/14/20 | | | $1,220 | | | $ | 1,220 | |
| | U.S. Treasury Bill, 0.194%,
due 7/16/20 | | | 1,625 | | | | 1,625 | |
| | U.S. Treasury Bill, 0.122%,
due 8/13/20 | | | 1,650 | | | | 1,650 | |
| | U.S. Treasury Bill, 0.125%,
due 8/25/20 | | | 1,650 | | | | 1,649 | |
| | U.S. Treasury Bill, 0.175%,
due 9/17/20 | | | 1,000 | | | | 999 | |
| | U.S. Treasury Bill, 0.150%,
due 9/24/20 | | | 3,900 | | | | 3,899 | |
| | U.S. Treasury Strip Principal, 0.000%,
due 8/15/21 | | | 3,990 | | | | 3,985 | |
| | Total U.S. Treasury Obligations | | | | | | | 15,027 | |
| | Federal Home Loan Mortgage Corp. (FHLMC)—14.2% | | | | | | | | |
| | #E02322, 5.500%, due 5/1/22 | | | 5 | | | | 5 | |
| | #G12725, 6.000%, due 6/1/22 | | | 26 | | | | 27 | |
| | #J08450, 5.500%, due 7/1/23 | | | 9 | | | | 9 | |
| | #J08703, 5.500%, due 9/1/23 | | | 13 | | | | 14 | |
| | #C00351, 8.000%, due 7/1/24 | | | 20 | | | | 22 | |
| | #J11208, 5.000%, due 11/1/24 | | | 24 | | | | 26 | |
| | #G00363, 8.000%, due 6/1/25 | | | 32 | | | | 35 | |
| | #C80329, 8.000%, due 8/1/25 | | | 7 | | | | 7 | |
| | #G14550, 4.500%, due 9/1/26 | | | 606 | | | | 647 | |
| | #G15360, 4.500%, due 11/1/26 | | | 205 | | | | 218 | |
| | #G14402, 4.000%, due 2/1/27 | | | 146 | | | | 155 | |
| | #G04821, 8.500%, due 7/1/31 | | | 1,269 | | | | 1,543 | |
| | #A81372, 6.000%, due 8/1/38 | | | 140 | | | | 159 | |
| | #G04687, 6.000%, due 9/1/38 | | | 43 | | | | 50 | |
| | #G04745, 6.000%, due 9/1/38 | | | 169 | | | | 193 | |
| | #G06085, 6.500%, due 9/1/38 | | | 39 | | | | 45 | |
| | #G60681, 7.000%, due 2/1/39 | | | 5,268 | | | | 6,635 | |
| | #G60680, 6.500%, due 9/1/39 | | | 652 | | | | 781 | |
| | #G61450, 6.000%, due 4/1/40 | | | 4,399 | | | | 5,223 | |
| | Total FHLMC Mortgage Obligations | | | | | | | 15,794 | |
| | Federal National Mortgage Association (FNMA)—37.9% | | | | | | | | |
| | #831497, 6.000%, due 4/1/21 | | | 13 | | | | 14 | |
| | #879607, 5.500%, due 4/1/21 | | | 2 | | | | 2 | |
| | #831525, 5.500%, due 6/1/21 | | | 4 | | | | 4 | |
| | #880993, 6.000%, due 1/1/22 | | | 1 | | | | 1 | |
| | #888982, 6.000%, due 12/1/22 | | | 33 | | | | 34 | |
| | #972934, 5.500%, due 2/1/23 | | | 41 | | | | 42 | |
| | #889670, 5.500%, due 6/1/23 | | | 8 | | | | 8 | |
| | #AE0011, 5.500%, due 9/1/23 | | | 6 | | | | 7 | |
| | #995253, 5.500%, due 12/1/23 | | | 391 | | | | 403 | |
| | #995395, 6.000%, due 12/1/23 | | | 20 | | | | 20 | |
| | #190988, 9.000%, due 6/1/24 | | | 3 | | | | 3 | |
| | #AL8529, 6.000%, due 11/1/24 | | | 3,415 | | | | 3,580 | |
| | #AL2853, 4.500%, due 6/1/26 | | | 1,072 | | | | 1,143 | |
| | #AL9730, 4.500%, due 2/1/27 | | | 1,688 | | | | 1,803 | |
| | #AL3388, 4.000%, due 9/1/27 | | | 353 | | | | 379 | |
| | | | NRSRO | | | | | | |
| | | | Rating | | Principal | | | | |
| | Issuer | | (unaudited) | | Amount | | | Value | |
| | | | | | | | | | |
| | U.S. Government Agency—(continued) | | | | | | | | | | |
| | Federal National Mortgage Association (FNMA)—(continued) | | | | | | | | | | |
| | #AL9870, 6.500%, due 2/1/28 | | | | | $ 987 | | | $ | 1,099 | |
| | #AL4502, 4.000%, due 11/1/28 | | | | | 420 | | | | 453 | |
| | #AL9857, 4.000%, due 2/1/29 | | | | | 3,475 | | | | 3,687 | |
| | #323933, 7.000%, due 9/1/29 | | | | | 239 | | | | 275 | |
| | #555933, 7.000%, due 6/1/32 | | | | | 331 | | | | 385 | |
| | #555866, 7.500%, due 3/1/33 | | | | | 204 | | | | 239 | |
| | #CA2754, 4.500%, due 11/1/33 | | | | | 115 | | | | 124 | |
| | #AL6413, 8.000%, due 8/1/34 | | | | | 196 | | | | 226 | |
| | #AD0720, 5.500%, due 12/1/34 | | | | | 228 | | | | 262 | |
| | #AL6412, 7.500%, due 9/1/35 | | | | | 694 | | | | 802 | |
| | #886762, 7.000%, due 9/1/36 | | | | | 186 | | | | 226 | |
| | #888530, 7.500%, due 8/1/37 | | | | | 1,446 | | | | 1,832 | |
| | #AL6411, 7.000%, due 12/1/37 | | | | | 1,321 | | | | 1,517 | |
| | #FM1735, 6.500%, due 10/1/38 | | | | | 2,235 | | | | 2,721 | |
| | #AD0100, 7.000%, due 12/1/38 | | | | | 459 | | | | 552 | |
| | #FM2467, 6.000%, due 1/1/39 | | | | | 1,899 | | | | 2,256 | |
| | #FM1736, 6.500%, due 10/1/39 | | | | | 2,880 | | | | 3,469 | |
| | #AL0515, 6.000%, due 7/1/40 | | | | | 561 | | | | 664 | |
| | #BM3525, 6.000%, due 4/1/41 | | | | | 2,649 | | | | 3,105 | |
| | #AL9226, 5.500%, due 12/1/41 | | | | | 2,461 | | | | 2,877 | |
| | #AL9225, 6.000%, due 1/1/42 | | | | | 2,242 | | | | 2,632 | |
| | #BM1328, 6.000%, due 1/1/42 | | | | | 1,371 | | | | 1,607 | |
| | #AL6276, 5.500%, due 10/1/43 | | | | | 181 | | | | 211 | |
| | #BM5121, 5.500%, due 12/1/48 | | | | | 1,264 | | | | 1,484 | |
| | #CA5837, 6.000%, due 7/1/49 | | | | | 1,723 | | | | 2,049 | |
| | Total FNMA Mortgage Obligations | | | | | | | | | 42,197 | |
| | | | | | | | | | | | |
| | Asset-Backed Securities—8.9% | | | | | | | | | | |
| | Tesla Auto Lease Trust 2018-B—144A, 2018-B, Tranche A, 3.710%, 8/20/21 | | Aaa | | | 597 | | | | 606 | |
| | Honda Auto Receivables Owner Trust, 2019-3, Tranche A2, 1.900%, 4/15/22 | | AAA | | | 904 | | | | 910 | |
| | CNH Equipment Trust 2019-A, 2019-A, Tranche A2, 2.960%, 5/16/22 | | AAA | | | 392 | | | | 394 | |
| | Toyota Auto Receivables 2020-B Owner Trust, 2020-B, Tranche A2, 1.380%, 12/15/22 | | AAA | | | 1,250 | | | | 1,261 | |
| | Tesla Auto Lease Trust—144A, 2019-A, Tranche C, 2.680%, 1/20/23 | | A2 | | | 675 | | | | 679 | |
| | American Express Credit Account Master Trust, 2017-6, Tranche A, 2.040%, 5/15/23 | | AAA | | | 1,000 | | | | 1,005 | |
| | BA Credit Card Trust, 2018-A2, Tranche A2, 3.000%, 9/15/23 | | AAA | | | 1,000 | | | | 1,020 | |
| | GM Financial Automobile Leasing Trust, 2020-1, Tranche C, 2.040%, 12/20/23 | | A+ | | | 1,400 | | | | 1,391 | |
| | Verizon Owner Trust, 2020-A, Tranche C, 2.060%, 7/22/24 | | Aa3 | | | 1,250 | | | | 1,253 | |
See accompanying Notes to Financial Statements.
| June 30, 2020 | William Blair Funds | 87 |
Low Duration Fund
Portfolio of Investments, June 30, 2020 (all dollar amounts in thousands) (unaudited)
| | | | NRSRO | | | | | | |
| | | | Rating | | Principal | | | | |
| | Issuer | | (unaudited) | | Amount | | | Value | |
| | | | | | | | | | |
| | Asset-Backed Securities—(continued) | | | | | | | | | | |
| | CNH Equipment Trust 2020-A, 2020-A,
Tranche A3,
1.160%, 6/16/25 | | AAA | | | $ 300 | | | $ | 303 | |
| | Canadian Pacer Auto Receivables
Trust—144A, 2020-1A,
Tranche B, 2.000%, 7/21/25 | | AA+ | | | 500 | | | | 503 | |
| | CarMax Auto Owner Trust,
2020-1, Tranche C,
2.340%, 11/17/25 | | A | | | 600 | | | | 597 | |
| | Total Asset-Backed Securities | | | | | | | | | 9,922 | |
| | | | | | | | | | | | |
| | Corporate Obligations—22.3% | | | | | | | | | | |
| | The Bank of Nova Scotia,
2.150%, due 7/14/20 | | Aa2 | | | 2,097 | | | | 2,098 | |
| | Apple, Inc.,
3M USD LIBOR + 1.130%,
1.490%, due 2/23/21, VRN | | AA+ | | | 550 | | | | 554 | |
| | JPMorgan Chase & Co.,
3M USD LIBOR + 1.480%,
1.830%, due 3/1/21, VRN | | AA- | | | 1,500 | | | | 1,511 | |
| | Wells Fargo & Co.,
3M USD LIBOR + 1.340%,
1.671%, due 3/4/21, VRN | | A+ | | | 1,500 | | | | 1,511 | |
| | HSBC Holdings plc,
3M USD LIBOR + 2.240%,
2.558%, due 3/8/21, VRN | | A+ | | | 1,500 | | | | 1,519 | |
| | Bank of America Corporation,
3M USD LIBOR + 1.420%,
2.555%, due 4/19/21, VRN | | A+ | | | 1,000 | | | | 1,011 | |
| | The Goldman Sachs Group, Inc.,
3M USD LIBOR + 1.360%,
2.351%, due 4/23/21, VRN | | A | | | 1,000 | | | | 1,008 | |
| | Bristol-Myers Squibb Co.—144A,
2.600%, due 5/16/22 | | A+ | | | 1,000 | | | | 1,040 | |
| | Toyota Motor Credit Corporation,
1.150%, due 5/26/22 | | A+ | | | 1,600 | | | | 1,619 | |
| | AT&T, Inc.,
3.000%, due 6/30/22 | | A- | | | 1,500 | | | | 1,567 | |
| | John Deere Capital Corporation,
0.550%, due 7/5/22 | | A | | | 1,200 | | | | 1,204 | |
| | Mitsubishi UFJ Financial Group, Inc.,
2.623%, due 7/18/22 | | A1 | | | 2,000 | | | | 2,074 | |
| | Philip Morris International, Inc.,
2.375%, due 8/17/22 | | A | | | 1,500 | | | | 1,558 | |
| | Capital One Bank USA NA,
SOFRRATE + 0.616%, 2.014%,
due 1/27/23, VRN | | A- | | | 1,400 | | | | 1,420 | |
| | Morgan Stanley,
3.750%, due 2/25/23 | | A | | | 2,003 | | | | 2,162 | |
| | Caterpillar Financial Services Corporation,
2.625%, due 3/1/23 | | A | | | 1,579 | | | | 1,669 | |
| | Intuit, Inc.,
0.650%, due 7/15/23 | | A- | | | 1,300 | | | | 1,303 | |
| | Total Corporate Obligations | | | | | | | | | 24,828 | |
| | Total Long-Term Investments—96.8%
(cost $106,870) | | | | | | | | | 107,768 | |
| | | | | | | | |
| | | | Principal | | | | |
| | Issuer | | Amount | | | Value | |
| | | | | | | | |
| | Repurchase Agreement | | | | | | | | |
| | Fixed Income Clearing Corporation, 0.000% dated 6/30/20, due 7/1/20, repurchase price $1,111, collateralized by U.S. Treasury Note, 1.625%, due 2/15/26, valued at $1,134 | | | $ 1,111 | | | $ | 1,111 | |
| | Total Repurchase Agreement—1.0%
(cost $1,111) | | | | | | | 1,111 | |
| | | | | | | | | | |
| | Commercial Paper | | | | | | | | |
| | American Transmission,
0.132%, due 7/1/20 | | | 1,600 | | | | 1,600 | |
| | Cargill GBL Funding,
0.101%, due 7/1/20 | | | 1,600 | | | | 1,600 | |
| | Societe Generale,
0.101%, due 7/1/20 | | | 1,600 | | | | 1,600 | |
| | Total Commercial Paper—4.3%
(cost $4,800) | | | | | | | 4,800 | |
| | Total Investments—102.1%
(cost $112,781) | | | | | | | 113,679 | |
| | Liabilities, plus cash and other assets—(2.1)% | | | | | | | (2,317 | ) |
| | Net assets—100.0% | | | | | | $ | 111,362 | |
The obligations of certain U.S. Government-sponsored securities are neither issued nor guaranteed by the U.S. Treasury.
144A = Security exempt from registration under Rule 144A of the Securities Act of 1933. These securities may be resold in transactions exempt from registration, normally to qualified institutional buyers.
NRSRO = Nationally Recognized Statistical Rating Organization—The credit quality ratings of the securities in the Fund reflect the highest category rating by any of Fitch Ratings, Moody’s Investors Service Inc., or Standard & Poor’s, a division of the McGraw-Hill Companies, Inc.
VRN = Variable Rate Note
See accompanying Notes to Financial Statements.
| 88 | Semiannual Report | June 30, 2020 |
| | Macro Allocation Fund |
| | |
| | AN OVERVIEW FROM THE PORTFOLIO MANAGERS |
| | |

Thomas Clarke 
Brian D. Singer | The William Blair Macro Allocation Fund (Class N shares) posted a 7.08% decrease, net of fees, for the six month period ended June 30, 2020. By comparison, the Fund’s benchmark index, the ICE BofAML US 3-Month Treasury Bill Index (the “Index”), increased 0.60%. The first six months of 2020 had significant volatility across assets and currencies, triggered by the onset of the COVID-19 pandemic and subsequent “lockdowns” and restrictions on people’s freedoms and movements. These lockdowns have put the global economy into its first recession in over a decade, with GDP forecasts collapsing and unemployment ballooning. This led to a material decline in global equities in the first quarter. But since then, equity markets have rebounded as governments eased their restrictions and optimism about economic prospects have emerged. However, the rebound in equity markets has not been uniform across countries and sectors, such that, on a year-to-date basis, there is significant dispersion. The S&P 500 finished the first six months of the year down 3.0%, while MSCI UK (hedged) was down 17.5% and MSCI EMU (hedged) was down 11.4%. Broad emerging market equities were down 5.0%, but again with wide dispersion: MSCI China (hedged) was up 3.3% while MSCI Brazil (hedged) was down 17.4%, for example. The significant volatility and economic slowdown brought response from central banks, including rate cuts and liquidity injections. This brought bond yields down and bond prices up. Within currencies, the “risk-off” nature of the first quarter caused a sell-off in emerging currencies and a rally in safe haven currencies. This trend was only mildly reversed in the second quarter. The Fund’s market and currency strategies were both negative during the period. Within markets, the negative performance was driven by long exposure to equities, most notably UK, Spain, Greece and Brazil. Partially offsetting this was short exposure to Mexico, Netherlands and South Africa equities. The Fund maintained long exposure to U.S. government bonds, which contributed positively to performance. Within currencies, the largest detractors were long exposure to the Mexican peso, Colombian peso, Norwegian krone and Russian ruble. Contributing positively to performance were short exposure to the Indonesian rupiah, New Zealand dollar and Thai baht. We significantly de-risked our equity and currency exposures through the first quarter of the year. Our long equity exposure entering 2020 was already somewhat scaled back and we scaled back further through the quarter as well as fully neutralizing many of our long emerging currency exposures. Our interpretation and analysis of developments since then is such that we have only modestly re-established long equity market exposure that we had de-risked in the first quarter. We remain slightly long of government bonds, despite their long-standing and significant over-valuation based on our fundamental analysis, which taken alone would warrant short exposure. We have made a more significant re-engagement with respect to currency risk exposures (compared to our activity in equities). In short, we believe there are significant long-term valuation opportunities in all three domains (equities attractive, bonds very unattractive, most emerging currencies attractive relative to safe havens), but we are most inclined to seek to exploit the currency opportunity at this point, remaining cautious with respect to the equity opportunity, and, as mentioned previously, we are going slightly against the expensive sovereign bond signal. The primary impact of the pandemic on financial markets comes through curtailment of economic activity, which was a policy enacted worldwide as countries went into varying degrees of “lockdown.” With no vaccine nor effective treatment for the virus, which is fatal in some cases, the effort to limit its spread focused on keeping people distant from each other and shuttering most forms of non-essential economic activity. This focus exerted a powerfully depressive influence on spending and earnings. While one or two quarters of lost revenue to a business might not reduce the fundamental value to a very large extent, we believe that many firms are likely to be operating well below former capacity for a considerable time, and some will not survive in their present form. Almost all central banks have ramped up their provision of ultra-easy monetary conditions (low, zero or negative policy interest rates; accelerated asset purchases; and significant increases to provisions of guaranteed liquidity and credit). Governments, too, have aggressively responded through relaxed fiscal policies with increased investment and spending, including outright cash transfers to businesses and individuals, unemployment insurance payments, and, in some countries, direct wage support to employees |
| June 30, 2020 | William Blair Funds | 89 |
and self-employed people who have been prevented from working by government-imposed lockdowns. A side effect of these policy responses has been to preserve a large number of firms under the premise that they can eventually restart their prior trading patterns. But since this will not be universally the case, these “zombies” (businesses that will scarcely be viable in a post-pandemic world) will unwittingly have been financed to a greater extent than before, which we believe represents an enormous misallocation of resources. We believe this will have an enduring contractionary side effect on fundamental values in relevant areas. In addition, ballooning government debt as a result of this may ultimately require tax increases that impair future corporate earnings flowing to investors. Equity price rises have been surprisingly robust since late March given that the spread of the virus has only been slowed down by the deliberate squashing of growth, but we believe market rallies are significantly influenced by the aggressive central bank action, which is not a long-term substitute for valuation support. For these reasons, we are disinclined to materially chase equities upward from generally prevailing levels.
With respect to bonds, in some contrast, the effect of ever-more-powerful quantitative easing on sovereign fixed income yields, along with communicated interest rate expectations of “even-lower-for-even-longer,” can have a much more enduring impact on the suppression of yields well below what equilibrium conditions would indicate was fair value. In short, if ultra-easy policy is maintained through to the maturity date of government bonds, such debt can effectively be held above fundamental value for the remainder of its life. Monetary authorities thus have more ability to persistently counter the prospect of negative returns that bond markets would otherwise generate in many cases. We believe fundamental valuation accordingly exerts its weakest pull on fixed income in the present environment (compared to other assets) and we are not following valuation signals.
Conversely, exchange rates have not generally been a direct policy objective of central banks. Therefore, we believe that the widening of currency opportunities that was caused by the pandemic impact has not been “artificially” suppressed/countered in the same way it has with equities and (even more so) government bonds. Indeed, deeper currency under-valuations across oil-producing economies were rather reinforced and exacerbated by ill-timed oil production increase announcements from Saudi Arabia and Russia in early March. This “price war” was later defused, but not before it had disproportionately affected oil-sensitive currencies that continued to weaken in April even after stock markets had regained some stability. As currencies moved far below value through April and beyond in some cases, we saw fit to significantly reverse the large amount of de-risking that we had undertaken in the first quarter.
Markets and currencies remain somewhat abnormally correlated and lacking in diversification in the short term but, for the reasons previously referenced, we anticipate that the fundamental investment opportunities will converge differentially, with the currency opportunities being somewhat more robust looking ahead, followed by equities, and with little likelihood of bond yields experiencing any noticeable near-term “pull” from value.
We do not think there is a high chance of a repeat of the panic conditions that manifested due to the pandemic in the first quarter. This may be the case even as secondary waves of COVID-19 transmission are likely in some places, and even as infection rates continue to climb in several emerging countries where lockdowns were not as effective as in the developed world and merely slowed accelerating infection rates rather than decelerating the spread. Importantly, market participants now know that even liberal democracies can lock down activity if they need to, and it is also known that this is effective in slowing down the disease transmission (though less effective in emerging economies than developed ones, as noted). Extra capacity in health services that was hurriedly built in many places successfully averted extreme stress on care capacity in health systems in the developed world. Unless secondary waves of infection stress this capacity, which largely did not happen the first time, we believe that stringent economic lockdowns are not likely to be repeated. Future adverse shocks to market sentiment should therefore not carry the same fear-inducing, nonlinear aspect that was dominant in the first quarter.
Although, as previously noted, several emerging countries have not been able to achieve declining virus spread rates at this point, they too have loosened their social and economic restrictions (that likely did prevent a worse outcome). While the human cost of the pandemic remains large, and in parts of the world is getting larger, populations will and have already been able to adapt and accommodate risks and adversity over time. From a dispassionate investing perspective, resuming economic activity amid an ongoing health catastrophe that is being controlled, but not yet defeated, argues for fundamental valuations in equities and currencies to ultimately re-exert their prevailing pull on prices. Our goal as investors is to position portfolios to best capture the risks and returns as they relate to price, value, and navigation influences. Previously we observed that our portfolios were well placed to step into what we believe will eventually prove to be large opportunities to take active risk, and for an eventual environment in which fundamental value is not prevented from being an effective force exerted onto prices. We believe that the pull of valuation will endure and ultimately prevail over today’s large, tragic, but temporary influences.
| 90 | Semiannual Report | June 30, 2020 |
Macro Allocation Fund
Performance Highlights (Unaudited)
| Average Annual Total Return through 6/30/2020 |
| | | Year
to Date | | 1 Year | | 3 Year | | 5 Year | | Since
Inception |
| Class N(a) | | | (7.08 | )% | | | (5.71 | )% | | | (0.84 | )% | | | (1.63 | )% | | | 3.13 | % |
| Class I(a) | | | (6.96 | ) | | | (5.60 | ) | | | (0.58 | ) | | | (1.38 | ) | | | 3.39 | |
| ICE BofAML US 3-Month Treasury Bill Index(a) | | | 0.60 | | | | 1.63 | | | | 1.77 | | | | 1.19 | | | | 0.72 | |
| Class R6(b) | | | (6.87 | ) | | | (5.37 | ) | | | (0.45 | ) | | | (1.26 | ) | | | 0.39 | |
| ICE BofAML US 3-Month Treasury Bill Index(b) | | | 0.60 | | | | 1.63 | | | | 1.77 | | | | 1.19 | | | | 0.90 | |
| (a) | Since inception is for the period from November 29, 2011 (Commencement of Operations) to June 30, 2020. |
| (b) | Since inception is for the period from October 21, 2013 (Commencement of Operations) to June 30, 2020. |
Performance cited represents past performance. Past performance does not guarantee future results and current performance may be lower or higher than the data quoted. Results shown are average annual total returns, which assume reinvestment of dividends and capital gains. Investment returns and principal will fluctuate and you may have a gain or loss when you sell shares. For the most current month-end performance information, please call 1-800-742-7272, or visit our Web site at www.williamblairfunds.com. The Fund involves a high level of risk and may not be appropriate for everyone. You could lose money by investing in the Fund. There can be no assurance that the Fund’s investment objective will be achieved or that the Fund’s investment strategies will be successful. The Fund is not a complete investment program. From time to time, the investment adviser may waive fees or reimburse expenses for the Fund. Without these waivers/reimbursements, performance would be lower. Class N shares are not subject to a sales load. Class I shares are not subject to a sales load or distribution (Rule 12b-1) fees. Class R6 shares are not subject to a sales load, distribution (Rule 12b-1) fees, or sub-transfer agent fees.
The performance highlights and graph presented above do not reflect the deduction of taxes that a shareholder would pay on fund distributions or the redemption of fund shares.
The ICE BofAML US 3-Month Treasury Bill Index measures total return on cash, including price and interest income, based on short-term government Treasury Bills of about 90-day maturity. The Index is unmanaged, does not incur fees or expenses, and cannot be invested in directly.
This report identifies the Fund’s investments on June 30, 2020. These holdings are subject to change. Not all investments in the Fund performed the same, nor is there any guarantee that these investments will perform as well in the future. Market forecasts provided in this report may not necessarily come to pass.
Portfolio Allocation (Unaudited)
The table below provides the allocation of the Fund’s holdings as a percent of net assets as of June 30, 2020.
| Category | | % of net
assets |
| Equity Exchange-Traded Funds | | | 55.8 | % |
| Fixed Income Exchange-Traded Funds | | | 9.1 | |
| Foreign Government Bond | | | 3.3 | |
| Repurchase Agreement | | | 2.8 | |
| U.S. Government. | | | 28.4 | |
| Cash and Other Assets, Less Liabilities | | | 0.6 | |
| Net Assets | | | 100.0 | % |
| June 30, 2020 | William Blair Funds | 91 |
Macro Allocation Fund
Portfolio of Investments, June 30, 2020 (all dollar amounts in thousands) (unaudited)
| | Issuer | | Shares or
Principal
Amount | | | Value | |
| | | | | | | | |
| | Exchange-Traded Funds—64.9% | | | | | | |
| | Equity Exchange-Traded Funds—55.8% | | | | | | | | |
| | iShares Core MSCI Emerging Markets ETF | | | 461,600 | | | $ | 21,972 | |
| | iShares MSCI Brazil ETF | | | 36,800 | | | | 1,058 | |
| | iShares MSCI Chile ETF | | | 210,700 | | | | 5,310 | |
| | SPDR S&P 500 ETF Trust | | | 857,400 | | | | 264,388 | |
| | Utilities Select Sector SPDR Fund | | | 23,900 | | | | 1,349 | |
| | Vietnam Enterprise Investments, Ltd. Class “C” | | | 2,109,100 | | | | 10,859 | |
| | Total Equity Exchange-Traded Funds | | | | | | | 304,936 | |
| | Fixed Income Exchange-Traded Funds—9.1% | | | | | | | | |
| | iShares iBoxx $ Investment Grade Corporate Bond ETF | | | 123,800 | | | | 16,651 | |
| | iShares MBS ETF | | | 250,000 | | | | 27,675 | |
| | SPDR Bloomberg Barclays High Yield Bond ETF | | | 55,300 | | | | 5,594 | |
| | Total Fixed Income Exchange-Traded Funds | | | | | | | 49,920 | |
| | Total Exchange-Traded Funds—64.9%
(cost $328,109) | | | | | | | 354,856 | |
| | | | | | | | | | |
| | Foreign Government Bond—3.3% | | | | | | | | |
| | Malaysia—3.3% | | | | | | | | |
| | Malaysia Government Bond, 4.160%, due 7/15/21 | | MYR 76,000 | | | | 18,104 | |
| | Total Foreign Government Bonds—3.3%
(cost $18,525) | | | | | | | 18,104 | |
| | | | | | | | | | |
| | Repurchase Agreement—2.8% | | | | | | | | |
| | Fixed Income Clearing Corporation, 0.000% dated 6/30/20, due 7/1/20, repurchase price $15,297, collateralized by U.S. Treasury Note, 1.625%, due 2/15/26, valued at $15,604 | | | 15,297 | | | | 15,297 | |
| | Total Repurchase Agreement—2.8%
(cost $15,297) | | | | | | | 15,297 | |
| | | | | | | | |
| | Issuer | | Principal
Amount | | | Value | |
| | | | | | | | |
| | U.S. Government—28.4% | | | | | | | | |
| | U.S. Treasury Bill, 1.776%, due 7/16/20(a) | | | 17,500 | | | $ | 17,499 | |
| | U.S. Treasury Bill, 1.723%, due 8/13/20 | | | 17,500 | | | | 17,497 | |
| | U.S. Treasury Bill, 1.742%, due 9/10/20(a) | | | 17,500 | | | | 17,496 | |
| | U.S. Treasury Bill, 1.542%, due 10/8/20(a)(b) | | | 17,500 | | | | 17,493 | |
| | U.S. Treasury Bill, 1.558%, due 11/5/20(a) | | | 17,500 | | | | 17,491 | |
| | U.S. Treasury Bill, 1.544%, due 12/3/20(a) | | | 15,000 | | | | 14,991 | |
| | U.S. Treasury Bill, 0.165%, due 12/31/20 | | | 7,500 | | | | 7,494 | |
| | U.S. Treasury Bill, 1.424%, due 1/28/21 | | | 7,500 | | | | 7,493 | |
| | U.S. Treasury Bill, 1.280%, due 2/25/21(b) | | | 7,500 | | | | 7,493 | |
| | U.S. Treasury Bill, 0.213%, due 3/25/21 | | | 7,500 | | | | 7,491 | |
| | U.S. Treasury Bill, 0.162%, due 4/22/21(a) | | | 7,500 | | | | 7,491 | |
| | U.S. Treasury Bill, 0.157%, due 5/20/21 | | | 7,500 | | | | 7,489 | |
| | U.S. Treasury Bill, 0.192%, due 6/17/21 | | | 7,500 | | | | 7,487 | |
| | Total U.S. Government—28.4%
(cost $154,398) | | | | | | | 154,905 | |
| | Total Investments in Securities—99.4%
(cost $516,329) | | | | | | | 543,162 | |
| | Cash and other assets, less liabilities—0.6% | | | | | | | 3,302 | |
| | Net assets—100.0% | | | | | | $ | 546,464 | |
a) Security, or portion of security, is segregated as collateral for centrally cleared swaps and to cover initial margin requirements on open futures contracts aggregating a total value of $48,907 (in thousands).
(b) Security, or portion of security, is pledged as collateral for forward foreign currency contracts and for OTC swap contracts aggregating a total value of $7,431 (in thousands).
See accompanying Notes to Financial Statements.
| 92 | Semiannual Report | June 30, 2020 |
Macro Allocation Fund
Portfolio of Investments, June 30, 2020 (all dollar amounts in thousands) (unaudited)
| Forward Foreign Currency Contracts | | | | | | | | | | | | | | |
Settlement
Date | | Deliver/Receive | | Counterparty | | Local Currency
(in thousands) | | USD (Base)
Purchased
or Sold | | Current
Value | | Net Unrealized
Appreciation
(Depreciation) |
| Purchased | | | | | | | | | | | | | | | | | | | | | | | |
| 7/15/20 | | Australian Dollar | | Citibank N.A. London | | | 4,891 | | | | $ | 3,370 | | | | $ | 3,376 | | | | $ | 6 | |
| 7/15/20 | | Brazilian Real | | Citibank N.A. London | | | 138,291 | | | | | 27,068 | | | | | 25,415 | | | | | (1,653 | ) |
| 7/15/20 | | British Pound Sterling | | Citibank N.A. London | | | 25,010 | | | | | 31,668 | | | | | 30,992 | | | | | (676 | ) |
| 7/15/20 | | Chilean Peso | | Citibank N.A. London | | | 4,090,635 | | | | | 5,212 | | | | | 4,982 | | | | | (230 | ) |
| 7/15/20 | | Chinese Yuan Renminbi | | Citibank N.A. London | | | 22,564 | | | | | 3,191 | | | | | 3,189 | | | | | (2 | ) |
| 7/15/20 | | Colombian Peso | | Citibank N.A. London | | | 62,775,654 | | | | | 16,714 | | | | | 16,686 | | | | | (28 | ) |
| 7/15/20 | | Euro | | Citibank N.A. London | | | 897 | | | | | 1,008 | | | | | 1,008 | | | | | — | |
| 7/15/20 | | Hong Kong Dollar | | Citibank N.A. London | | | 14,505 | | | | | 1,871 | | | | | 1,871 | | | | | — | |
| 7/15/20 | | Indian Rupee | | Citibank N.A. London | | | 722,966 | | | | | 9,502 | | | | | 9,555 | | | | | 53 | |
| 7/15/20 | | Indonesian Rupiah | | Citibank N.A. London | | | 11,511,384 | | | | | 794 | | | | | 792 | | | | | (2 | ) |
| 7/15/20 | | Israeli Shekel | | Citibank N.A. London | | | 11,743 | | | | | 3,396 | | | | | 3,391 | | | | | (5 | ) |
| 7/15/20 | | Japanese Yen | | Citibank N.A. London | | | 2,431,316 | | | | | 22,754 | | | | | 22,521 | | | | | (233 | ) |
| 7/15/20 | | Mexican Peso | | Citibank N.A. London | | | 756,850 | | | | | 33,640 | | | | | 32,873 | | | | | (767 | ) |
| 7/15/20 | | New Zealand Dollar | | Citibank N.A. London | | | 5,565 | | | | | 3,585 | | | | | 3,591 | | | | | 6 | |
| 7/15/20 | | Norwegian Krone | | Citibank N.A. London | | | 392,407 | | | | | 41,524 | | | | | 40,770 | | | | | (754 | ) |
| 7/15/20 | | Philippine Peso | | Citibank N.A. London | | | 1,207,218 | | | | | 24,036 | | | | | 24,260 | | | | | 224 | |
| 7/15/20 | | Russian Ruble | | Citibank N.A. London | | | 1,454,811 | | | | | 20,889 | | | | | 20,408 | | | | | (481 | ) |
| 7/15/20 | | Singapore Dollar | | Citibank N.A. London | | | 44,767 | | | | | 32,284 | | | | | 32,124 | | | | | (160 | ) |
| 7/15/20 | | South African Rand | | Citibank N.A. London | | | 388,756 | | | | | 22,839 | | | | | 22,371 | | | | | (468 | ) |
| 7/15/20 | | South Korean Won | | Citibank N.A. London | | | 4,800,793 | | | | | 4,004 | | | | | 4,002 | | | | | (2 | ) |
| 7/15/20 | | Swedish Krona | | Citibank N.A. London | | | 321,056 | | | | | 34,881 | | | | | 34,460 | | | | | (421 | ) |
| 7/15/20 | | Swiss Franc | | Citibank N.A. London | | | 707 | | | | | 746 | | | | | 746 | | | | | — | |
| 7/15/20 | | Taiwan Dollar | | Citibank N.A. London | | | 59,659 | | | | | 2,034 | | | | | 2,034 | | | | | — | |
| 7/15/20 | | Thai Baht | | Citibank N.A. London | | | 38,047 | | | | | 1,234 | | | | | 1,231 | | | | | (3 | ) |
| 7/16/20 | | New Turkish Lira | | Citibank N.A. London | | | 192,874 | | | | | 27,981 | | | | | 28,054 | | | | | 73 | |
| | | | | | | | | | | | | | | | | | | | | | $ | (5,523 | ) |
| Sold | | | | | | | | | | | | | | | | | | | | | | | |
| 7/15/20 | | Australian Dollar | | Citibank N.A. London | | | 53,030 | | | | $ | 36,631 | | | | $ | 36,599 | | | | $ | 32 | |
| 7/15/20 | | British Pound Sterling | | Citibank N.A. London | | | 537 | | | | | 664 | | | | | 665 | | | | | (1 | ) |
| 7/15/20 | | Canadian Dollar | | Citibank N.A. London | | | 11,099 | | | | | 8,193 | | | | | 8,175 | | | | | 18 | |
| 7/15/20 | | Chinese Yuan Renminbi | | Citibank N.A. London | | | 338,057 | | | | | 47,741 | | | | | 47,779 | | | | | (38 | ) |
| 7/15/20 | | Colombian Peso | | Citibank N.A. London | | | 2,536,308 | | | | | 677 | | | | | 674 | | | | | 3 | |
| 7/15/20 | | Czech Koruna | | Citibank N.A. London | | | 213,006 | | | | | 9,099 | | | | | 8,979 | | | | | 120 | |
| 7/15/20 | | Euro | | Citibank N.A. London | | | 18,847 | | | | | 21,447 | | | | | 21,180 | | | | | 267 | |
| 7/15/20 | | Hong Kong Dollar | | Citibank N.A. London | | | 144,003 | | | | | 18,576 | | | | | 18,579 | | | | | (3 | ) |
| 7/15/20 | | Indonesian Rupiah | | Citibank N.A. London | | | 172,529,287 | | | | | 11,907 | | | | | 11,863 | | | | | 44 | |
| 7/15/20 | | Israeli Shekel | | Citibank N.A. London | | | 144,079 | | | | | 41,721 | | | | | 41,606 | | | | | 115 | |
| 7/15/20 | | Japanese Yen | | Citibank N.A. London | | | 95,336 | | | | | 884 | | | | | 883 | | | | | 1 | |
| 7/15/20 | | Mexican Peso | | Citibank N.A. London | | | 14,743 | | | | | 637 | | | | | 640 | | | | | (3 | ) |
| 7/15/20 | | New Zealand Dollar | | Citibank N.A. London | | | 69,555 | | | | | 45,031 | | | | | 44,886 | | | | | 145 | |
| 7/15/20 | | Norwegian Krone | | Citibank N.A. London | | | 22,706 | | | | | 2,353 | | | | | 2,359 | | | | | (6 | ) |
| 7/15/20 | | Philippine Peso | | Citibank N.A. London | | | 122,168 | | | | | 2,451 | | | | | 2,455 | | | | | (4 | ) |
| 7/15/20 | | Russian Ruble | | Citibank N.A. London | | | 57,073 | | | | | 800 | | | | | 801 | | | | | (1 | ) |
| 7/15/20 | | Singapore Dollar | | Citibank N.A. London | | | 1,146 | | | | | 821 | | | | | 822 | | | | | (1 | ) |
| 7/15/20 | | South African Rand | | Citibank N.A. London | | | 16,953 | | | | | 974 | | | | | 976 | | | | | (2 | ) |
| 7/15/20 | | South Korean Won | | Citibank N.A. London | | | 33,427,381 | | | | | 27,877 | | | | | 27,864 | | | | | 13 | |
| 7/15/20 | | Swedish Krona | | Citibank N.A. London | | | 6,848 | | | | | 735 | | | | | 735 | | | | | — | |
| 7/15/20 | | Swiss Franc | | Citibank N.A. London | | | 32,728 | | | | | 34,849 | | | | | 34,556 | | | | | 293 | |
| 7/15/20 | | Taiwan Dollar | | Citibank N.A. London | | | 854,783 | | | | | 28,973 | | | | | 29,146 | | | | | (173 | ) |
| 7/15/20 | | Thai Baht | | Citibank N.A. London | | | 926,519 | | | | | 29,977 | | | | | 29,977 | | | | | — | |
| 7/16/20 | | New Turkish Lira | | Citibank N.A. London | | | 7,776 | | | | | 1,131 | | | | | 1,131 | | | | | — | |
| | | | | | | | | | | | | | | | | | | | | | $ | 819 | |
| Total net unrealized appreciation (depreciation) on forward foreign currency contracts | | | | | | | | $ | (4,704 | ) |
See accompanying Notes to Financial Statements.
| June 30, 2020 | William Blair Funds | 93 |
Macro Allocation Fund
Portfolio of Investments, June 30, 2020 (all dollar amounts in thousands) (unaudited)
Futures Contracts
Number of
Contracts | | Description | | Expiration Date | | Local Currency | | Notional Value
(Local,
in Thousands) | | Notional
Amount
(USD) | | Notional
Value
(USD) | | Net Unrealized
Appreciation
(Depreciation) |
| Long | | | | | | | | | | | | | | | | | | | | | | | | | |
| 125 | | CAC 40 Index | | July 2020 | | Euro | | | 6,142 | | | | $ | 6,886 | | | | $ | 6,900 | | | | $ | 14 | |
| 130 | | IBEX 35 Index | | July 2020 | | Euro | | | 9,373 | | | | | 10,899 | | | | | 10,530 | | | | | (369 | ) |
| 806 | | MSCI Singapore ETS Index | | July 2020 | | Singapore Dollar | | | 23,846 | | | | | 17,434 | | | | | 17,111 | | | | | (323 | ) |
| 2 | | HSCEI Index | | July 2020 | | Hong Kong Dollar | | | 965 | | | | | 127 | | | | | 124 | | | | | (3 | ) |
| 49 | | KOSPI 200 Index | | September 2020 | | South Korean Won | | | 3,439,800 | | | | | 2,952 | | | | | 2,860 | | | | | (92 | ) |
| 10 | | NIKKEI 225 Index | | September 2020 | | Japanese Yen | | | 111,300 | | | | | 1,069 | | | | | 1,031 | | | | | (38 | ) |
| 120 | | SPI 200 Index | | September 2020 | | Australian Dollar | | | 17,676 | | | | | 11,964 | | | | | 12,198 | | | | | 234 | |
| 22 | | DAX Index | | September 2020 | | Euro | | | 6,779 | | | | | 7,624 | | | | | 7,616 | | | | | (8 | ) |
| 475 | | FTSE 100 Index | | September 2020 | | British Pound Sterling | | | 29,201 | | | | | 35,387 | | | | | 36,183 | | | | | 796 | |
| 48 | | FTSE MIB Index | | September 2020 | | Euro | | | 4,629 | | | | | 5,185 | | | | | 5,201 | | | | | 16 | |
| | | | | | | | | | | | | | | | | | | | | | | | $ | 227 | |
| Short | | | | | | | | | | | | | | | | | | | | | | | | | |
| 12 | | Amsterdam Index | | July 2020 | | Euro | | | 1,343 | | | | $ | 1,519 | | | | $ | 1,509 | | | | $ | 10 | |
| 53 | | OMXS 30 Index | | July 2020 | | Swedish Krona | | | 8,831 | | | | | 912 | | | | | 948 | | | | | (36 | ) |
| 78 | | HANG SENG Index | | July 2020 | | Hong Kong Dollar | | | 94,563 | | | | | 12,449 | | | | | 12,201 | | | | | 248 | |
| 61 | | MSCI Taiwan Index | | July 2020 | | U.S. Dollar | | | 2,640 | | | | | 2,663 | | | | | 2,640 | | | | | 23 | |
| 171 | | EURO-BTP | | September 2020 | | Euro | | | 24,603 | | | | | 27,160 | | | | | 27,642 | | | | | (482 | ) |
| 106 | | FTSE 40 Index | | September 2020 | | South African Rand | | | 53,310 | | | | | 2,989 | | | | | 3,072 | | | | | (83 | ) |
| 2 | | S&P TSX 60 Index | | September 2020 | | Canadian Dollar | | | 371 | | | | | 266 | | | | | 274 | | | | | (8 | ) |
| 994 | | EURO STOXX 50 Index | | September 2020 | | Euro | | | 32,037 | | | | | 34,622 | | | | | 35,993 | | | | | (1,371 | ) |
| 664 | | MSCI Emerging Markets Index | | September 2020 | | U.S. Dollar | | | 32,725 | | | | | 31,803 | | | | | 32,725 | | | | | (922 | ) |
| 334 | | MSCI Mexico Index | | September 2020 | | U.S. Dollar | | | 5,731 | | | | | 5,994 | | | | | 5,731 | | | | | 263 | |
| 1,595 | | S&P 500 E Mini Index | | September 2020 | | U.S. Dollar | | | 246,444 | | | | | 243,266 | | | | | 246,444 | | | | | (3,178 | ) |
| 39 | | S&P E Mini Com Ser Index | | September 2020 | | U.S. Dollar | | | 2,758 | | | | | 2,822 | | | | | 2,758 | | | | | 64 | |
| 27 | | XAK Technology | | September 2020 | | U.S. Dollar | | | 2,840 | | | | | 2,716 | | | | | 2,840 | | | | | (124 | ) |
| 43 | | XAY Cons Discret | | September 2020 | | U.S. Dollar | | | 5,546 | | | | | 5,588 | | | | | 5,546 | | | | | 42 | |
| 77 | | 10YR Can Bond | | September 2020 | | Canadian Dollar | | | 11,844 | | | | | 8,698 | | | | | 8,724 | | | | | (26 | ) |
| | | | | | | | | | | | | | | | | | | | | | | | $ | (5,580 | ) |
| Total net unrealized appreciation (depreciation) on futures contracts | | | | | | | | | | | | | $ | (5,353 | ) |
| Centrally Cleared Interest Rate Swap | | | | | | | | | | | | | |
Floating
Rate
Reference | | Pay/Receive
Floating
Rate | | Fixed Rate | | Pay/Receive
Payment
Frequency | | Maturity
Date | | Cleared
Exchange | | Notional
Amount
(in thousands) | | Upfront
Payment
Paid
(Received) | | Value | | | Unrealized
Appreciation
(Depreciation) | |
| China 1-Week Repo Rate | | Pay | | 1.960% | | 3M | | June 2025 | | LCH | | CNY 311,580 | | $(320) | | $(773) | | | | $(453) | |
See accompanying Notes to Financial Statements.
| 94 | Semiannual Report | June 30, 2020 |
Macro Allocation Fund
Portfolio of Investments, June 30, 2020 (all dollar amounts in thousands) (unaudited)
Total Return Swaps
Reference
Entity | | Pay/Receive
Floating Rate | | Floating Rate | | Maturity
Date | | Counterparty | | Notional
Amount (in
thousands | ) | Market
Value | | Unrealized
Appreciation
(Depreciation) |
| Swiss Market Index (Total Return) | | Receive | | 3 Month LIBOR minus 0 bp | | Sep 2020 | | Credit Suisse International | | CHF | 7,465 | | $ | 168 | | | $ | 168 | |
| MSCI World Energy Sector Net Index | | Pay | | 3 Month LIBOR minus 70 bp | | Sep 2020 | | Credit Suisse International | | $ | 16,826 | | | (545 | ) | | | (545 | ) |
| MSCI Emerging Markets Indonesia Net Total Return USD | | Pay | | 3 Month LIBOR minus 110 bp | | Sep 2020 | | Citibank N.A. | | $ | 5,152 | | | (83 | ) | | | (83 | ) |
| RTS Index Future | | Receive | | 0 bp | | Sep 2020 | | Credit Suisse International | | $ | 4,333 | | | 99 | | | | 99 | |
| Euro-Bund Future | | Receive | | 0 bp | | Sep 2020 | | Credit Suisse International | | EUR | 2,975 | | | (29 | ) | | | (29 | ) |
| 10YR T-Note Future | | Pay | | 0 bp | | Sep 2020 | | Credit Suisse International | | $ | 52,841 | | | 184 | | | | 184 | |
| 5YR T-Note Future | | Pay | | 0 bp | | Sep 2020 | | Credit Suisse International | | $ | 22,461 | | | 47 | | | | 47 | |
| | | | | | | | | | | | | | | | | | $ | (159 | ) |
Centrally Cleared Credit Default Swap
Reference
Entity | | Buy/Sell
Protection | | Fixed Deal
Pay Rate | | Payment
Frequency | | Maturity
Date | | Cleared
Exchange | | Notional
Amount
(in thousands | ) | Upfront
Payment
Paid
(Received | ) | Value | | Unrealized
Appreciation
(Depreciation) | |
| iTRAXX Europe 33 | | Sell | | 1.000% | | 3M | | June 2025 | | ICE | | $10,095 | | $52 | | $194 | | | $ | 142 | |
| Total net unrealized appreciation (depreciation) on swaps | | | | | | | | $ | (470) | |
See accompanying Notes to Financial Statements.
| June 30, 2020 | William Blair Funds | 95 |
Statements of Assets and Liabilities
As of June 30, 2020 (dollar amounts in thousands) (unaudited)
| | | | | | Large Cap | | | Mid Cap | | | Small-Mid | |
| | | Growth | | | Growth | | | Growth | | | Cap Core | |
| | | Fund | | | Fund | | | Fund | | | Fund | |
| Assets | | | | | | | | | | | | |
| Investments in securities, at cost | | $ | 149,946 | | | $ | 407,282 | | | $ | 57,158 | | | $ | 212,385 | |
| Investments in securities, at value | | $ | 249,604 | | | $ | 522,073 | | | $ | 70,447 | | | $ | 199,437 | |
| Receivable for securities sold | | | 1,834 | | | | 2,596 | | | | 1,359 | | | | 1,991 | |
| Receivable for fund shares sold | | | 47 | | | | 2,467 | | | | 13 | | | | 2 | |
| Receivable from Adviser | | | 1 | | | | 52 | | | | 21 | | | | 39 | |
| Dividend and interest receivable | | | 88 | | | | 238 | | | | 13 | | | | 130 | |
| Total assets | | | 251,574 | | | | 527,426 | | | | 71,853 | | | | 201,599 | |
| Liabilities | | | | | | | | | | | | | | | | |
| Payable for securities purchased | | | 1,835 | | | | 5,836 | | | | 766 | | | | 1,128 | |
| Payable for fund shares redeemed | | | 171 | | | | 1,066 | | | | 28 | | | | 1,115 | |
| Management fee payable | | | 151 | | | | 248 | | | | 53 | | | | 153 | |
| Distribution fee payable | | | 6 | | | | 26 | | | | 1 | | | | — | |
| Other payables and accrued expenses | | | 78 | | | | 15 | | | | 57 | | | | 105 | |
| Total liabilities | | | 2,241 | | | | 7,191 | | | | 905 | | | | 2,501 | |
| Net assets | | $ | 249,333 | | | $ | 520,235 | | | $ | 70,948 | | | $ | 199,098 | |
| Capital | | | | | | | | | | | | | | | | |
| Composition of net assets | | | | | | | | | | | | | | | | |
| Paid in capital | | $ | 125,147 | | | $ | 387,041 | | | $ | 53,747 | | | $ | 224,050 | |
| Total distributable earnings (loss) | | | 124,186 | | | | 133,194 | | | | 17,201 | | | | (24,952 | ) |
| Net assets | | $ | 249,333 | | | $ | 520,235 | | | $ | 70,948 | | | $ | 199,098 | |
| | | | | | | | | | | | | | | | | |
| Class N shares | | | | | | | | | | | | | | | | |
| Net assets | | $ | 31,139 | | | $ | 131,166 | | | $ | 5,003 | | | | — | |
| Shares outstanding | | | 3,058,143 | | | | 7,834,131 | | | | 461,507 | | | | — | |
| Net asset value per share | | $ | 10.18 | | | $ | 16.74 | | | $ | 10.84 | | | | — | |
| Class I shares | | | | | | | | | | | | | | | | |
| Net assets | | $ | 217,361 | | | $ | 386,509 | | | $ | 65,781 | | | $ | 194,012 | |
| Shares outstanding | | | 17,905,884 | | | | 21,750,702 | | | | 5,579,850 | | | | 20,284,560 | |
| Net asset value per share | | $ | 12.14 | | | $ | 17.77 | | | $ | 11.79 | | | $ | 9.56 | |
| Class R6 shares | | | | | | | | | | | | | | | | |
| Net assets | | $ | 833 | | | $ | 2,560 | | | $ | 164 | | | $ | 5,086 | |
| Shares outstanding | | | 68,542 | | | | 144,181 | | | | 13,911 | | | | 531,649 | |
| Net asset value per share | | $ | 12.16 | | | $ | 17.76 | | | $ | 11.80 | | | $ | 9.57 | |
See accompanying Notes to Financial Statements.
| 96 | Semiannual Report | June 30, 2020 |
Statements of Operations
For the Period Ended June 30, 2020 (all amounts in thousands) (unaudited)
| | | | | | Large Cap | | | Mid Cap | | | Small-Mid | |
| | | Growth | | | Growth | | | Growth | | | Cap Core | |
| | | Fund | | | Fund | | | Fund | | | Fund | |
| Investment income | | | | | | | | | | | | |
| Dividends | | $ | 955 | | | $ | 2,018 | | | $ | 192 | | | $ | 1,053 | |
| Less foreign tax withheld | | | — | | | | — | | | | (1 | ) | | | (8 | ) |
| Interest | | | 1 | | | | 1 | | | | — | | | | 1 | |
| Total income | | | 956 | | | | 2,019 | | | | 191 | | | | 1,046 | |
| Expenses | | | | | | | | | | | | | | | | |
| Investment advisory fees | | | 878 | | | | 1,180 | | | | 304 | | | | 910 | |
| Distribution fees | | | 37 | | | | 110 | | | | 6 | | | | — | |
| Custodian fees | | | 32 | | | | 33 | | | | 31 | | | | 40 | |
| Transfer agent fees | | | 33 | | | | 31 | | | | 7 | | | | 10 | |
| Sub-transfer agent fees | | | | | | | | | | | | | | | | |
| Class N | | | 22 | | | | 49 | | | | 3 | | | | — | |
| Class I | | | 63 | | | | 108 | | | | 41 | | | | 130 | |
| Professional fees | | | 24 | | | | 25 | | | | 20 | | | | 23 | |
| Registration fees | | | 38 | | | | 32 | | | | 28 | | | | 19 | |
| Shareholder reporting fees | | | 9 | | | | 12 | | | | 2 | | | | 2 | |
| Trustee fees | | | 10 | | | | 10 | | | | 3 | | | | 5 | |
| Other expenses | | | 7 | | | | 9 | | | | 5 | | | | 6 | |
| Total expenses before expense limitation | | | 1,153 | | | | 1,599 | | | | 450 | | | | 1,145 | |
| Expenses waived or reimbursed by the Adviser | | | | | | | | | | | | | | | | |
| Class N | | | (12 | ) | | | (61 | ) | | | (9 | ) | | | — | |
| Class I | | | — | | | | (149 | ) | | | (113 | ) | | | (183 | ) |
| Class R6 | | | — | | | | (1 | ) | | | — | | | | (2 | ) |
| Total expenses waived or reimbursed by the Adviser | | | (12 | ) | | | (211 | ) | | | (122 | ) | | | (185 | ) |
| Net expenses | | | 1,141 | | | | 1,388 | | | | 328 | | | | 960 | |
| Net investment income (loss) | | | (185 | ) | | | 631 | | | | (137 | ) | | | 86 | |
| Realized and unrealized gain (loss) | | | | | | | | | | | | | | | | |
| Net realized gain (loss) on transactions from: | | | | | | | | | | | | | | | | |
| Investments in securities | | | 18,568 | | | | 16,041 | | | | 2,017 | | | | (12,119 | ) |
| Futures contracts | | | — | | | | — | | | | — | | | | 45 | |
| Total net realized gain (loss) | | | 18,568 | | | | 16,041 | | | | 2,017 | | | | (12,074 | ) |
| Change in net unrealized appreciation (depreciation) of: | | | | | | | | | | | | | | | | |
| Investments in securities | | | (191 | ) | | | 27,947 | | | | (2,832 | ) | | | (13,334 | ) |
| Change in net unrealized appreciation (depreciation) | | | (191 | ) | | | 27,947 | | | | (2,832 | ) | | | (13,334 | ) |
| Net increase (decrease) in net assets resulting from operations | | $ | 18,192 | | | $ | 44,619 | | | $ | (952 | ) | | $ | (25,322 | ) |
See accompanying Notes to Financial Statements.
| June 30, 2020 | William Blair Funds | 97 |
Statements of Changes in Net Assets
For the Period Ended June 30, 2020 (unaudited) and the Year Ended December 31, 2019 (all amounts in thousands)
| | | Growth Fund | | | Large Cap
Growth Fund | | | Mid Cap
Growth Fund | | | Small-Mid Cap
Core Fund | |
| | | 2020 | | | 2019 | | | 2020 | | | 2019 | | | 2020 | | | 2019 | | | 2020 | | | 2019 (a) | |
| Operations | | | | | | | | | | | | | | | | | | | | | | | | | | | | | | | | |
| Net investment income (loss) | | $ | (185 | ) | | $ | (175 | ) | | $ | 631 | | | $ | 475 | | | $ | (137 | ) | | $ | (171 | ) | | $ | 86 | | | $ | 4 | |
| Net realized gain (loss) on investments, and other assets and liabilities | | | 18,568 | | | | 24,088 | | | | 16,041 | | | | 17,324 | | | | 2,017 | | | | 7,108 | | | | (12,074 | ) | | | (16 | ) |
| Change in net unrealized appreciation (depreciation) on investments, and other assets and liabilities | | | (191 | ) | | | 45,368 | | | | 27,947 | | | | 49,902 | | | | (2,832 | ) | | | 13,055 | | | | (13,334 | ) | | | 386 | |
| Net increase (decrease) in net assets resulting from operations | | | 18,192 | | | | 69,281 | | | | 44,619 | | | | 67,701 | | | | (952 | ) | | | 19,992 | | | | (25,322 | ) | | | 374 | |
| Distributions to shareholders from | | | | | | | | | | | | | | | | | | | | | | | | | | | | | | | | |
| Class N | | | — | | | | (3,190 | ) | | | — | | | | (3,981 | ) | | | — | | | | (480 | ) | | | — | | | | — | |
| Class I | | | — | | | | (17,880 | ) | | | — | | | | (12,030 | ) | | | — | | | | (5,507 | ) | | | — | | | | (1 | ) |
| Class R6 | | | — | | | | (17 | ) | | | — | | | | (97 | ) | | | — | | | | (12 | ) | | | — | | | | (3 | ) |
| Total distributions | | | — | | | | (21,087 | ) | | | — | | | | (16,108 | ) | | | — | | | | (5,999 | ) | | | — | | | | (4 | ) |
| Capital stock transactions | | | | | | | | | | | | | | | | | | | | | | | | | | | | | | | | |
| Proceeds from sale of shares | | | 9,204 | | | | 21,672 | | | | 228,157 | | | | 122,974 | | | | 6,515 | | | | 10,314 | | | | 264,119 | | | | 6,238 | |
| Shares issued in reinvestment of income dividends and capital gain distributions | | | — | | | | 20,274 | | | | — | | | | 13,134 | | | | — | | | | 5,817 | | | | — | | | | 4 | |
| Less cost of shares redeemed | | | (31,650 | ) | | | (62,229 | ) | | | (56,375 | ) | | | (62,827 | ) | | | (8,161 | ) | | | (12,695 | ) | | | (46,287 | ) | | | (24 | ) |
| Net increase (decrease) in net assets resulting from capital share transactions | | | (22,446 | ) | | | (20,283 | ) | | | 171,782 | | | | 73,281 | | | | (1,646 | ) | | | 3,436 | | | | 217,832 | | | | 6,218 | |
| Increase (decrease) in net assets | | | (4,254 | ) | | | 27,911 | | | | 216,401 | | | | 124,874 | | | | (2,598 | ) | | | 17,429 | | | | 192,510 | | | | 6,588 | |
| Net assets | | | | | | | | | | | | | | | | | | | | | | | | | | | | | | | | |
| Beginning of period | | | 253,587 | | | | 225,676 | | | | 303,834 | | | | 178,960 | | | | 73,546 | | | | 56,117 | | | | 6,588 | | | | — | |
| End of period | | $ | 249,333 | | | $ | 253,587 | | | $ | 520,235 | | | $ | 303,834 | | | $ | 70,948 | | | $ | 73,546 | | | $ | 199,098 | | | $ | 6,588 | |
(a) For the period from October 1, 2019 (Commencement of Operations) to December 31, 2019.
See accompanying Notes to Financial Statements.
| 98 | Semiannual Report | June 30, 2020 |
Statements of Assets and Liabilities
As of June 30, 2020 (dollar amounts in thousands) (unaudited)
| | | | Small-Mid
Cap Growth
Fund | | | Small-Mid
Cap Value
Fund | | | | Small Cap
Growth
Fund | | | | Small Cap
Value
Fund | |
| Assets | | | | | | | | | | | | | | | | | | |
| Investments in securities, at cost | | | $ | 2,263,830 | | | | $ | 996 | | | $ | 430,218 | | | $ | 85,754 | |
| Investments in securities, at value | | | $ | 2,811,649 | | | | $ | 1,171 | | | $ | 513,639 | | | $ | 97,829 | |
| Cash | | | | — | | | | | 47 | | | | — | | | | — | |
| Receivable for securities sold | | | | 2,233 | | | | | 24 | | | | 6,254 | | | | 1,266 | |
| Receivable for fund shares sold | | | | 2,099 | | | | | 3 | | | | 440 | | | | 29 | |
| Receivable from Adviser | | | | 122 | | | | | 17 | | | | 25 | | | | 41 | |
| Dividend and interest receivable | | | | 622 | | | | | 1 | | | | 146 | | | | 79 | |
| Total assets | | | | 2,816,725 | | | | | 1,263 | | | | 520,504 | | | | 99,244 | |
| Liabilities | | | | | | | | | | | | | | | | | | |
| Payable for securities purchased | | | | — | | | | | 15 | | | | 797 | | | | 945 | |
| Payable for fund shares redeemed | | | | 3,032 | | | | | — | | | | 892 | | | | 50 | |
| Management fee payable | | | | 2,333 | | | | | 1 | | | | 469 | | | | 80 | |
| Distribution fee payable | | | | 57 | | | | | — | | | | 30 | | | | 1 | |
| Other payables and accrued expenses | | | | 503 | | | | | 43 | | | | 128 | | | | 54 | |
| Total liabilities | | | | 5,925 | | | | | 59 | | | | 2,316 | | | | 1,130 | |
| Net assets | | | $ | 2,810,800 | | | | $ | 1,204 | | | $ | 518,188 | | | $ | 98,114 | |
| Capital | | | | | | | | | | | | | | | | | | |
| Composition of net assets | | | | | | | | | | | | | | | | | | |
| Paid in capital | | | $ | 2,306,971 | | | | $ | 4,210 | | | $ | 434,478 | | | $ | 105,036 | |
| Total distributable earnings (loss) | | | | 503,829 | | | | | (3,006 | ) | | | 83,710 | | | | (6,922 | ) |
| Net assets | | | $ | 2,810,800 | | | | $ | 1,204 | | | $ | 518,188 | | | $ | 98,114 | |
| | | | | | | | | | | | | | | | | | | |
| Class N shares | | | | | | | | | | | | | | | | | | |
| Net assets | | | $ | 273,268 | | | | $ | 161 | | | $ | 141,873 | | | $ | 7,027 | |
| Shares outstanding | | | | 10,683,610 | | | | | 18,792 | | | | 5,264,016 | | | | 684,696 | |
| Net asset value per share | | | $ | 25.58 | | | | $ | 8.54 | | | $ | 26.95 | | | $ | 10.26 | |
| Class I shares | | | | | | | | | | | | | | | | | | |
| Net assets | | | $ | 2,464,057 | | | | $ | 814 | | | $ | 312,187 | | | $ | 90,613 | |
| Shares outstanding | | | | 90,577,963 | | | | | 95,642 | | | | 10,291,217 | | | | 8,482,660 | |
| Net asset value per share | | | $ | 27.20 | | | | $ | 8.51 | | | $ | 30.34 | | | $ | 10.68 | |
| Class R6 shares | | | | | | | | | | | | | | | | | | |
| Net assets | | | $ | 73,475 | | | | $ | 229 | | | $ | 64,128 | | | $ | 474 | |
| Shares outstanding | | | | 2,698,296 | | | | | 27,019 | | | | 2,112,763 | | | | 44,374 | |
| Net asset value per share | | | $ | 27.23 | | | | $ | 8.49 | | | $ | 30.35 | | | $ | 10.69 | |
See accompanying Notes to Financial Statements.
| June 30, 2020 | William Blair Funds | 99 |
Statements of Operations
For the Period June 30, 2020 (all amounts in thousands) (unaudited)
| | | Small-Mid
Cap Growth
Fund | | | Small-Mid
Cap Value
Fund | | | Small Cap
Growth
Fund | | | Small Cap
Value
Fund | |
| Investment income | | | | | | | | | | | | | | | | | | | | |
| Dividends | | | $ | 6,865 | | | | $ | 50 | | | | $ | 1,482 | | | | $ | 1,239 | |
| Less foreign tax withheld | | | | (65 | ) | | | | — | | | | | (30 | ) | | | | — | |
| Interest | | | | 18 | | | | | 9 | | | | | 3 | | | | | 1 | |
| Total income | | | | 6,818 | | | | | 59 | | | | | 1,455 | | | | | 1,240 | |
| Expenses | | | | | | | | | | | | | | | | | | | | |
| Investment advisory fees | | | | 13,686 | | | | | 22 | | | | | 2,986 | | | | | 652 | |
| Distribution fees | | | | 361 | | | | | — | | | | | 187 | | | | | 12 | |
| Custodian fees | | | | 40 | | | | | 47 | | | | | 39 | | | | | 39 | |
| Transfer agent fees | | | | 183 | | | | | 1 | | | | | 57 | | | | | 24 | |
| Sub-transfer agent fees | | | | | | | | | | | | | | | | | | | | |
| Class N | | | | 229 | | | | | — | | | | | 115 | | | | | 9 | |
| Class I | | | | 1,409 | | | | | 2 | | | | | 196 | | | | | 95 | |
| Professional fees | | | | 104 | | | | | 19 | | | | | 39 | | | | | 33 | |
| Registration fees | | | | 82 | | | | | 28 | | | | | 52 | | | | | 26 | |
| Shareholder reporting fees | | | | 126 | | | | | 1 | | | | | 39 | | | | | 10 | |
| Trustee fees | | | | 105 | | | | | — | | | | | 25 | | | | | 16 | |
| Other expenses | | | | 51 | | | | | 3 | | | | | 8 | | | | | 7 | |
| Total expenses before expense limitation | | | | 16,376 | | | | | 123 | | | | | 3,743 | | | | | 923 | |
| Expenses waived or reimbursed by the Adviser | | | | | | | | | | | | | | | | | | | | |
| Class N | | | | (158 | ) | | | | (5 | ) | | | | (74 | ) | | | | (15 | ) |
| Class I | | | | (817 | ) | | | | (91 | ) | | | | (105 | ) | | | | (173 | ) |
| Class R6 | | | | (1 | ) | | | | (4 | ) | | | | — | | | | | (1 | ) |
| Total expenses waived or reimbursed by the Adviser | | | | (976 | ) | | | | (100 | ) | | | | (179 | ) | | | | (189 | ) |
| Net expenses | | | | 15,400 | | | | | 23 | | | | | 3,564 | | | | | 734 | |
| Net investment income (loss) | | | | (8,582 | ) | | | | 36 | | | | | (2,109 | ) | | | | 506 | |
| Realized and unrealized gain (loss) | | | | | | | | | | | | | | | | | | | | |
| Net realized gain (loss) on transactions from: | | | | | | | | | | | | | | | | | | | | |
| Investments in securities | | | | (59,181 | ) | | | | (3,166 | ) | | | | 7,655 | | | | | (16,350 | ) |
| Redemptions in-kind | | | | 6,220 | | | | | — | | | | | — | | | | | — | |
| Total net realized gain (loss) | | | | (52,961 | ) | | | | (3,166 | ) | | | | 7,655 | | | | | (16,350 | ) |
| Change in net unrealized appreciation (depreciation) of: | | | | | | | | | | | | | | | | | | | | |
| Investments in securities | | | | 55,293 | | | | | (253 | ) | | | | (42,004 | ) | | | | (30,436 | ) |
| Change in net unrealized appreciation (depreciation) | | | | 55,293 | | | | | (253 | ) | | | | (42,004 | ) | | | | (30,436 | ) |
| Net increase (decrease) in net assets resulting from operations | | | $ | (6,250 | ) | | | $ | (3,383 | ) | | | $ | (36,458 | ) | | | $ | (46,280 | ) |
See accompanying Notes to Financial Statements.
| 100 | Semiannual Report | June 30, 2020 |
Statements of Changes in Net Assets
For the Period Ended June 30, 2020 (unaudited) and the Year Ended December 31, 2019 (all amounts in thousands)
| | | | Small-Mid
Cap Growth Fund | | | Small-Mid
Cap Value Fund | | | Small Cap
Growth Fund | | | Small Cap
Value Fund | |
| | | | 2020 | | | | 2019 | | | 2020 | | | 2019 | | | 2020 | | | 2019 | | | 2020 | | | 2019 | |
| Operations | | | | | | | | | | | | | | | | | | | | | | | | | | |
| Net investment income (loss) | | $ | (8,582 | ) | | $ | (15,808 | ) | | | $ | 36 | | | | $ | 40 | | | $ | (2,109 | ) | | $ | (4,727 | ) | | $ | 506 | | | $ | 3,710 | |
| Net realized gain (loss) on investments, and other assets and liabilities | | | (52,961 | ) | | | 293,543 | | | | | (3,166 | ) | | | | 109 | | | | 7,655 | | | | 10,576 | | | | (16,350 | ) | | | 73,420 | |
| Change in net unrealized appreciation (depreciation) on investments, and other assets and liabilities | | | 55,293 | | | | 439,745 | | | | | (253 | ) | | | | 446 | | | | (42,004 | ) | | | 125,876 | | | | (30,436 | ) | | | 15,381 | |
| Net increase (decrease) in net assets resulting from operations | | | (6,250 | ) | | | 717,480 | | | | | (3,383 | ) | | | | 595 | | | | (36,458 | ) | | | 131,725 | | | | (46,280 | ) | | | 92,511 | |
| Distributions to shareholders from | | | | | | | | | | | | | | | | | | | | | | | | | | | | | | | | | | |
| Class N | | | — | | | | (24,075 | ) | | | | — | | | | | (6 | ) | | | — | | | | (4,188 | ) | | | (2,077 | ) | | | (498 | ) |
| Class I | | | — | | | | (172,835 | ) | | | | — | | | | | (131 | ) | | | — | | | | (8,605 | ) | | | (26,233 | ) | | | (14,700 | ) |
| Class R6 | | | — | | | | (2,668 | ) | | | | — | | | | | (3 | ) | | | — | | | | (1,345 | ) | | | (101 | ) | | | (16 | ) |
| Total distributions | | | — | | | | (199,578 | ) | | | | — | | | | | (140 | ) | | | — | | | | (14,138 | ) | | | (28,411 | ) | | | (15,214 | ) |
| Capital stock transactions | | | | | | | | | | | | | | | | | | | | | | | | | | | | | | | | | | |
| Proceeds from sale of shares | | | 420,380 | | | | 835,740 | | | | | 3,164 | | | | | 7,068 | | | | 56,548 | | | | 265,349 | | | | 10,771 | | | | 49,983 | |
| Shares issued in reinvestment of income dividends and capital gain distributions | | | — | | | | 193,454 | | | | | — | | | | | 139 | | | | — | | | | 14,035 | | | | 27,328 | | | | 14,998 | |
| Less cost of shares redeemed | | | (509,144 | ) | | | (1,045,252 | ) | | | | (6,105 | ) | | | | (1,813 | ) | | | (172,439 | ) | | | (305,741 | ) | | | (40,572 | ) | | | (458,515 | ) |
| Net increase (decrease) in net assets resulting from capital share transactions | | | (88,764 | ) | | | (16,058 | ) | | | | (2,941 | ) | | | | 5,394 | | | | (115,891 | ) | | | (26,357 | ) | | | (2,473 | ) | | | (393,534 | ) |
| Increase (decrease) in net assets | | | (95,014 | ) | | | 501,844 | | | | | (6,324 | ) | | | | 5,849 | | | | (152,349 | ) | | | 91,230 | | | | (77,164 | ) | | | (316,237 | ) |
| Net assets | | | | | | | | | | | | | | | | | | | | | | | | | | | | | | | | | | |
| Beginning of period | | | 2,905,814 | | | | 2,403,970 | | | | | 7,528 | | | | | 1,679 | | | | 670,537 | | | | 579,307 | | | | 175,278 | | | | 491,515 | |
| End of period | | $ | 2,810,800 | | | $ | 2,905,814 | | | | $ | 1,204 | | | | $ | 7,528 | | | $ | 518,188 | | | $ | 670,537 | | | $ | 98,114 | | | $ | 175,278 | |
See accompanying Notes to Financial Statements.
| June 30, 2020 | William Blair Funds | 101 |
Statements of Assets and Liabilities
As of June 30, 2020 (dollar amounts in thousands) (unaudited)
| | | Global
Leaders
Fund | | | International
Leaders
Fund | | | International
Growth
Fund | | | Institutional
International
Growth
Fund | |
| Assets | | | | | | | | | | | | | | | | |
| Investments in securities, at cost | | | $ | 64,360 | | | | $ | 515,282 | | | | $ | 1,365,344 | | | | $ | 1,132,695 | |
| Investments in securities, at value | | | $ | 97,010 | | | | $ | 661,991 | | | | $ | 1,882,800 | | | | $ | 1,552,596 | |
| Cash | | | | 9 | | | | | 84 | | | | | 122 | | | | | 117 | |
| Foreign currency, at value (cost $— ; $— ; $66; $63) | | | | — | | | | | — | | | | | 66 | | | | | 63 | |
| Receivable for securities sold | | | | 34 | | | | | — | | | | | — | | | | | 228,801 | |
| Receivable for fund shares sold | | | | 1 | | | | | 682 | | | | | 588 | | | | | 186 | |
| Receivable from Adviser | | | | 26 | | | | | 46 | | | | | 1 | | | | | — | |
| Dividend and interest receivable | | | | 125 | | | | | 821 | | | | | 4,878 | | | | | 3,339 | |
| Total assets | | | | 97,205 | | | | | 663,624 | | | | | 1,888,455 | | | | | 1,785,102 | |
| Liabilities | | | | | | | | | | | | | | | | | | | | |
| Payable for securities purchased | | | | — | | | | | 311 | | | | | 3,162 | | | | | 2,026 | |
| Payable for fund shares redeemed | | | | — | | | | | 102 | | | | | 1,865 | | | | | 236,001 | |
| Management fee payable | | | | 86 | | | | | 456 | | | | | 1,550 | | | | | 1,367 | |
| Distribution fee payable | | | | 2 | | | | | 2 | | | | | 47 | | | | | — | |
| Foreign capital gains tax liability | | | | — | | | | | 197 | | | | | — | | | | | 17 | |
| Other payables and accrued expenses | | | | 82 | | | | | 95 | | | | | 623 | | | | | 309 | |
| Total liabilities | | | | 170 | | | | | 1,163 | | | | | 7,247 | | | | | 239,720 | |
| Net assets | | | $ | 97,035 | | | | $ | 662,461 | | | | $ | 1,881,208 | | | | $ | 1,545,382 | |
| | | | | | | | | | | | | | | | | | | | | |
| Capital | | | | | | | | | | | | | | | | | | | | |
| Composition of net assets | | | | | | | | | | | | | | | | | | | | |
| Paid in capital | | | $ | 44,585 | | | | $ | 520,933 | | | | $ | 1,366,029 | | | | $ | 1,122,363 | |
| Total distributable earnings (loss) | | | | 52,450 | | | | | 141,528 | | | | | 515,179 | | | | | 423,019 | |
| Net assets | | | $ | 97,035 | | | | $ | 662,461 | | | | $ | 1,881,208 | | | | $ | 1,545,382 | |
| Class N shares | | | | | | | | | | | | | | | | | | | | |
| Net assets | | | $ | 8,862 | | | | $ | 8,102 | | | | $ | 232,632 | | | | | — | |
| Shares outstanding | | | | 581,013 | | | | | 453,917 | | | | | 7,816,757 | | | | | — | |
| Net asset value per share | | | $ | 15.25 | | | | $ | 17.85 | | | | $ | 29.76 | | | | | — | |
| Class I shares | | | | | | | | | | | | | | | | | | | | |
| Net assets | | | $ | 86,976 | | | | $ | 187,634 | | | | $ | 1,591,582 | | | | | — | |
| Shares outstanding | | | | 5,691,626 | | | | | 10,472,996 | | | | | 52,185,622 | | | | | — | |
| Net asset value per share | | | $ | 15.28 | | | | $ | 17.92 | | | | $ | 30.50 | | | | | — | |
| Institutional/Class R6 shares | | | | | | | | | | | | | | | | | | | | |
| Net assets | | | $ | 1,197 | | | | $ | 466,725 | | | | $ | 56,994 | | | | $ | 1,545,382 | |
| Shares outstanding | | | | 78,297 | | | | | 26,047,546 | | | | | 1,868,239 | | | | | 88,481,200 | |
| Net asset value per share | | | $ | 15.29 | | | | $ | 17.92 | | | | $ | 30.51 | | | | $ | 17.47 | |
See accompanying Notes to Financial Statements.
| 102 | Semiannual Report | June 30, 2020 |
Statements of Operations
For the Period Ended June 30, 2020 (all amounts in thousands) (unaudited)
| | | Global
Leaders
Fund | | | International
Leaders
Fund | | | International
Growth
Fund | | | Institutional
International
Growth
Fund | |
| Investment income | | | | | | | | | | | | | | | | | | | | |
| Dividends | | | $ | 799 | | | | $ | 4,429 | | | | $ | 12,135 | | | | $ | 11,360 | |
| Less foreign tax withheld | | | | (50 | ) | | | | (482 | ) | | | | (1,200 | ) | | | | (1,128 | ) |
| Interest | | | | 1 | | | | | 4 | | | | | 4 | | | | | 5 | |
| Total income | | | | 750 | | | | | 3,951 | | | | | 10,939 | | | | | 10,237 | |
| Expenses | | | | | | | | | | | | | | | | | | | | |
| Investment advisory fees | | | | 616 | | | | | 2,621 | | | | | 9,301 | | | | | 8,069 | |
| Distribution fees | | | | 10 | | | | | 12 | | | | | 423 | | | | | — | |
| Custodian fees | | | | 39 | | | | | 61 | | | | | 165 | | | | | 132 | |
| Transfer agent fees | | | | 5 | | | | | 25 | | | | | 85 | | | | | 34 | |
| Sub-transfer agent fees | | | | | | | | | | | | | | | | | | | | |
| Class N | | | | 6 | | | | | 7 | | | | | 300 | | | | | — | |
| Class I | | | | 38 | | | | | 65 | | | | | 601 | | | | | — | |
| Professional fees | | | | 27 | | | | | 46 | | | | | 95 | | | | | 90 | |
| Registration fees | | | | 31 | | | | | 30 | | | | | 44 | | | | | 15 | |
| Shareholder reporting fees | | | | 2 | | | | | 9 | | | | | 60 | | | | | 8 | |
| Trustee fees | | | | 7 | | | | | 21 | | | | | 85 | | | | | 72 | |
| Other expenses | | | | 7 | | | | | 16 | | | | | 29 | | | | | 27 | |
| Total expenses before expense limitation | | | | 788 | | | | | 2,913 | | | | | 11,188 | | | | | 8,447 | |
| Expenses waived or reimbursed by the Adviser | | | | | | | | | | | | | | | | | | | | |
| Class N | | | | (11 | ) | | | | (8 | ) | | | | (88 | ) | | | | — | |
| Class I | | | | (97 | ) | | | | (79 | ) | | | | — | | | | | — | |
| Institutional/Class R6 | | | | (27 | ) | | | | (146 | ) | | | | — | | | | | — | |
| Total expenses waived or reimbursed by the Adviser | | | | (135 | ) | | | | (233 | ) | | | | (88 | ) | | | | — | |
| Net expenses | | | | 653 | | | | | 2,680 | | | | | 11,100 | | | | | 8,447 | |
| Net investment income (loss) | | | | 97 | | | | | 1,271 | | | | | (161 | ) | | | | 1,790 | |
| Realized and unrealized gain (loss) | | | | | | | | | | | | | | | | | | | | |
| Net realized gain (loss) on transactions from: | | | | | | | | | | | | | | | | | | | | |
| Investments in securities, net of foreign taxes, if applicable | | | | 12,076 | | | | | (2,957 | ) | | | | 15,464 | | | | | 41,231 | |
| Redemptions in-kind | | | | 7,974 | | | | | — | | | | | — | | | | | 7,699 | |
| Foreign currency transactions | | | | (16 | ) | | | | (86 | ) | | | | (290 | ) | | | | (156 | ) |
| Total net realized gain (loss) | | | | 20,034 | | | | | (3,043 | ) | | | | 15,174 | | | | | 48,774 | |
| Change in net unrealized appreciation (depreciation) of: | | | | | | | | | | | | | | | | | | | | |
| Investments in securities | | | | (16,195 | ) | | | | (7,610 | ) | | | | (27,500 | ) | | | | (52,107 | ) |
| Foreign currency translations | | | | — | | | | | 46 | | | | | (65 | ) | | | | (95 | ) |
| Change in net unrealized appreciation (depreciation) | | | | (16,195 | ) | | | | (7,564 | ) | | | | (27,565 | ) | | | | (52,202 | ) |
| Net increase (decrease) in net assets resulting from operations | | | $ | 3,936 | | | | $ | (9,336 | ) | | | $ | (12,552 | ) | | | $ | (1,638 | ) |
See accompanying Notes to Financial Statements.
| June 30, 2020 | William Blair Funds | 103 |
Statements of Changes in Net Assets
For the Period Ended June 30, 2020 (unaudited) and the Year Ended December 31, 2019 (all amounts in thousands)
| | | Global
Leaders Fund | | | International
Leaders Fund | | | International
Growth Fund | | |
Institutional
International
Growth Fund | |
| | | 2020 | | | 2019 | | | 2020 | | | 2019 | | | 2020 | | | 2019 | | | 2020 | | | 2019 | |
| Operations | | | | | | | | | | | | | | | | | | | | | | | | | | | | | | | | |
| Net investment income (loss) | | $ | 97 | | | $ | 690 | | | $ | 1,271 | | | $ | 4,360 | | | $ | (161 | ) | | $ | 12,129 | | | $ | 1,790 | | | $ | 14,030 | |
| Net realized gain (loss) on investments, and other assets and liabilities | | | 20,034 | | | | 21,561 | | | | (3,043 | ) | | | 138 | | | | 15,174 | | | | 31,125 | | | | 48,774 | | | | 4,333 | |
| Change in net unrealized appreciation (depreciation) on investments, and other assets and liabilities | | | (16,195 | ) | | | 27,856 | | | | (7,564 | ) | | | 139,075 | | | | (27,565 | ) | | | 530,581 | | | | (52,202 | ) | | | 472,155 | |
| Net increase (decrease) in net assets resulting from operations | | | 3,936 | | | | 50,107 | | | | (9,336 | ) | | | 143,573 | | | | (12,552 | ) | | | 573,835 | | | | (1,638 | ) | | | 490,518 | |
| Distributions to shareholders from | | | | | | | | | | | | | | | | | | | | | | | | | | | | | | | | |
| Class N | | | — | | | | (99 | ) | | | — | | | | (37 | ) | | | — | | | | (5,328 | ) | | | — | | | | — | |
| Class I | | | — | | | | (1,500 | ) | | | — | | | | (981 | ) | | | — | | | | (19,998 | ) | | | — | | | | — | |
| Institutional/Class R6 | | | — | | | | (656 | ) | | | — | | | | (2,772 | ) | | | — | | | | (819 | ) | | | — | | | | (17,917 | ) |
| Total distributions | | | — | | | | (2,255 | ) | | | — | | | | (3,790 | ) | | | — | | | | (26,145 | ) | | | — | | | | (17,917 | ) |
| Capital stock transactions | | | | | | | | | | | | | | | | | | | | | | | | | | | | | | | | |
| Proceeds from sale of shares | | | 10,540 | | | | 16,564 | | | | 90,159 | | | | 150,318 | | | | 268,419 | | | | 290,402 | | | | 101,823 | | | | 192,878 | |
| Shares issued in reinvestment of income dividends and capital gain distributions | | | — | | | | 2,241 | | | | — | | | | 3,249 | | | | — | | | | 24,177 | | | | — | | | | 17,852 | |
| Less cost of shares redeemed | | | (89,150 | ) | | | (65,648 | ) | | | (72,266 | ) | | | (49,445 | ) | | | (483,718 | ) | | | (856,554 | ) | | | (447,714 | ) | | | (574,855 | ) |
| Net increase (decrease) in net assets resulting from capital share transactions | | | (78,610 | ) | | | (46,843 | ) | | | 17,893 | | | | 104,122 | | | | (215,299 | ) | | | (541,975 | ) | | | (345,891 | ) | | | (364,125 | ) |
| Increase (decrease) in net assets | | | (74,674 | ) | | | 1,009 | | | | 8,557 | | | | 243,905 | | | | (227,851 | ) | | | 5,715 | | | | (347,529 | ) | | | 108,476 | |
| Net assets | | | | | | | | | | | | | | | | | | | | | | | | | | | | | | | | |
| Beginning of period | | | 171,709 | | | | 170,700 | | | | 653,904 | | | | 409,999 | | | | 2,109,059 | | | | 2,103,344 | | | | 1,892,911 | | | | 1,784,435 | |
| End of period | | $ | 97,035 | | | $ | 171,709 | | | $ | 662,461 | | | $ | 653,904 | | | $ | 1,881,208 | | | $ | 2,109,059 | | | $ | 1,545,382 | | | $ | 1,892,911 | |
See accompanying Notes to Financial Statements.
| 104 | Semiannual Report | June 30, 2020 |
Statements of Assets and Liabilities
As of June 30, 2020 (dollar amounts in thousands) (unaudited)
| | | International | | | Emerging | | | Emerging | | | Emerging | |
| | | Small Cap | | | Markets | | | Markets | | | Markets | |
| | | Growth | | | Leaders | | | Growth | | | Small Cap | |
| | Fund | | | Fund | | | Fund | | | Growth Fund | |
| Assets | | | | | | | | | | | | |
| Investments in securities, at cost | | | $ | 212,972 | | | $ | 178,120 | | | $ | 600,068 | | | | $ | 204,655 | |
| Investments in securities, at value | | | $ | 261,281 | | | $ | 222,306 | | | $ | 830,077 | | | | $ | 259,697 | |
| Foreign currency, at value (cost $195; $— ; $643; $816) | | | | 196 | | | | — | | | | 643 | | | | | 817 | |
| Receivable for securities sold | | | | — | | | | 954 | | | | 1,701 | | | | | 1,555 | |
| Receivable for fund shares sold | | | | 179 | | | | 101 | | | | 3,032 | | | | | 66 | |
| Receivable from Adviser | | | | — | | | | 35 | | | | — | | | | | 43 | |
| Dividend and interest receivable | | | | 1,137 | | | | 458 | | | | 1,213 | | | | | 396 | |
| Total assets | | | | 262,793 | | | | 223,854 | | | | 836,666 | | | | | 262,574 | |
| Liabilities | | | | | | | | | | | | | | | | | | |
| Payable for securities purchased | | | | — | | | | — | | | | 628 | | | | | 1,311 | |
| Payable for fund shares redeemed | | | | 37 | | | | 3 | | | | 6,499 | | | | | 36 | |
| Management fee payable | | | | 214 | | | | 198 | | | | 730 | | | | | 232 | |
| Distribution fee payable | | | | 1 | | | | — | | | | 2 | | | | | 1 | |
| Foreign capital gains tax liability | | | | — | | | | — | | | | 457 | | | | | — | |
| Other payables and accrued expenses | | | | 200 | | | | 186 | | | | 395 | | | | | 426 | |
| Total liabilities | | | | 452 | | | | 387 | | | | 8,711 | | | | | 2,006 | |
| Net assets | | | $ | 262,341 | | | $ | 223,467 | | | $ | 827,955 | | | | $ | 260,568 | |
| Capital | | | | | | | | | | | | | | | | | | |
| Composition of net assets | | | | | | | | | | | | | | | | | | |
| Paid in capital | | | $ | 232,357 | | | $ | 188,195 | | | $ | 614,106 | | | | $ | 249,031 | |
| Total distributable earnings (loss) | | | | 29,984 | | | | 35,272 | | | | 213,849 | | | | | 11,537 | |
| Net assets | | | $ | 262,341 | | | $ | 223,467 | | | $ | 827,955 | | | | $ | 260,568 | |
| | | | | | | | | | | | | | | | | | | |
| Class N shares | | | | | | | | | | | | | | | | | | |
| Net assets | | | $ | 2,530 | | | $ | 1,391 | | | $ | 7,934 | | | | $ | 3,314 | |
| Shares outstanding | | | | 188,464 | | | | 138,543 | | | | 562,190 | | | | | 195,292 | |
| Net asset value per share | | | $ | 13.42 | | | $ | 10.04 | | | $ | 14.11 | | | | $ | 16.97 | |
| Class I shares | | | | | | | | | | | | | | | | | | |
| Net assets | | | $ | 126,889 | | | $ | 43,268 | | | $ | 75,381 | | | | $ | 122,722 | |
| Shares outstanding | | | | 9,350,127 | | | | 4,298,432 | | | | 5,278,540 | | | | | 7,179,432 | |
| Net asset value per share | | | $ | 13.57 | | | $ | 10.07 | | | $ | 14.28 | | | | $ | 17.09 | |
| Class R6 shares | | | | | | | | | | | | | | | | | | |
| Net assets | | | $ | 132,922 | | | $ | 178,808 | | | $ | 744,640 | | | | $ | 134,532 | |
| Shares outstanding | | | | 9,737,564 | | | | 17,779,815 | | | | 51,663,560 | | | | | 7,856,017 | |
| Net asset value per share | | | $ | 13.65 | | | $ | 10.06 | | | $ | 14.41 | | | | $ | 17.12 | |
See accompanying Notes to Financial Statements.
| June 30, 2020 | William Blair Funds | 105 |
Statements of Operations
For the Period Ended June 30, 2020 (all amounts in thousands) (unaudited)
| | | | | | | | | | | | | | | Emerging | |
| | | International | | | Emerging | | | Emerging | | | Markets | |
| | | Small Cap | | | Markets | | | Markets | | | Small Cap | |
| | | Growth | | | Leaders | | | Growth | | | Growth | |
| | Fund | | | Fund | | | Fund | | | Fund | |
| Investment income | | | | | | | | | | | | |
| Dividends | | | $ | 2,045 | | | | $ | 1,836 | | | | $ | 4,753 | | | | $ | 1,377 | |
| Less foreign tax withheld | | | | (183 | ) | | | | (209 | ) | | | | (562 | ) | | | | (117 | ) |
| Interest | | | | 1 | | | | | 2 | | | | | 56 | | | | | 1 | |
| Total income | | | | 1,863 | | | | | 1,629 | | | | | 4,247 | | | | | 1,261 | |
| Expenses | | | | | | | | | | | | | | | | | | | | |
| Investment advisory fees | | | | 1,253 | | | | | 1,166 | | | | | 4,151 | | | | | 1,403 | |
| Distribution fees | | | | 4 | | | | | 2 | | | | | 9 | | | | | 4 | |
| Custodian fees | | | | 73 | | | | | 72 | | | | | 200 | | | | | 167 | |
| Transfer agent fees | | | | 12 | | | | | 6 | | | | | 17 | | | | | 29 | |
| Sub-transfer agent fees | | | | | | | | | | | | | | | | | | | | |
| Class N | | | | 2 | | | | | 1 | | | | | 3 | | | | | 3 | |
| Class I | | | | 70 | | | | | 14 | | | | | 35 | | | | | 59 | |
| Professional fees | | | | 40 | | | | | 39 | | | | | 82 | | | | | 97 | |
| Registration fees | | | | 29 | | | | | 31 | | | | | 31 | | | | | 29 | |
| Shareholder reporting fees | | | | 18 | | | | | 6 | | | | | 3 | | | | | 15 | |
| Trustee fees | | | | 14 | | | | | 10 | | | | | 32 | | | | | 12 | |
| Other expenses | | | | 7 | | | | | 7 | | | | | 16 | | | | | 8 | |
| Total expenses before expense limitation | | | | 1,522 | | | | | 1,354 | | | | | 4,579 | | | | | 1,826 | |
| Expenses waived or reimbursed by the Adviser | | | | | | | | | | | | | | | | | | | | |
| Class N | | | | — | | | | | (2 | ) | | | | — | | | | | (5 | ) |
| Class I | | | | — | | | | | (37 | ) | | | | — | | | | | (106 | ) |
| Class R6 | | | | — | | | | | (136 | ) | | | | — | | | | | (83 | ) |
| Total expenses waived or reimbursed by the Adviser | | | | — | | | | | (175 | ) | | | | — | | | | | (194 | ) |
| Net expenses | | | | 1,522 | | | | | 1,179 | | | | | 4,579 | | | | | 1,632 | |
| Net investment income (loss) | | | | 341 | | | | | 450 | | | | | (332 | ) | | | | (371 | ) |
| Realized and unrealized gain (loss) | | | | | | | | | | | | | | | | | | | | |
| Net realized gain (loss) on transactions from: | | | | | | | | | | | | | | | | | | | | |
| Investments in securities, net of foreign taxes, if applicable | | | | 1,331 | | | | | (9,096 | ) | | | | (14,889 | ) | | | | 5,871 | |
| Foreign currency transactions | | | | (30 | ) | | | | (123 | ) | | | | (951 | ) | | | | (238 | ) |
| Total net realized gain (loss) | | | | 1,301 | | | | | (9,219 | ) | | | | (15,840 | ) | | | | 5,633 | |
| Change in net unrealized appreciation (depreciation) of: | | | | | | | | | | | | | | | | | | | | |
| Investments in securities | | | | (12,216 | ) | | | | (3,322 | ) | | | | 51,053 | | | | | (5,436 | ) |
| Foreign currency translations | | | | (13 | ) | | | | 875 | | | | | 1,530 | | | | | (19 | ) |
| Change in net unrealized appreciation (depreciation) | | | | (12,229 | ) | | | | (2,447 | ) | | | | 52,583 | | | | | (5,455 | ) |
| Net increase (decrease) in net assets resulting from operations | | | $ | (10,587 | ) | | | $ | (11,216 | ) | | | $ | 36,411 | | | | $ | (193 | ) |
See accompanying Notes to Financial Statements.
| 106 | Semiannual Report | June 30, 2020 |
Statements of Changes in Net Assets
For the Period Ended June 30, 2020 (unaudited) and the Year Ended December 31, 2019 (all amounts in thousands)
| | | International | | | | | | | | | | | | | | | Emerging Markets | |
| | | Small Cap | | | Emerging Markets | | | Emerging Markets | | | Small Cap | |
| | | Growth Fund | | | Leaders Fund | | | Growth Fund | | | Growth Fund | |
| | 2020 | | | 2019 | | | 2020 | | | 2019 | | | 2020 | | | 2019 | | | 2020 | | | 2019 | |
| Operations | | | | | | | | | | | | | | | | | | | | | | | | |
| Net investment income (loss) | | $ | 341 | | | $ | 2,537 | | | $ | 450 | | | $ | 1,416 | | | $ | (332 | ) | | $ | 9,209 | | | $ | (371 | ) | | $ | 848 | |
| Net realized gain (loss) on investments, and other assets and liabilities | | | 1,301 | | | | (185 | ) | | | (9,219 | ) | | | 5,825 | | | | (15,840 | ) | | | 42,250 | | | | 5,633 | | | | (596 | ) |
| Change in net unrealized appreciation (depreciation) on investments, and other assets and liabilities | | | (12,229 | ) | | | 92,376 | | | | (2,447 | ) | | | 48,207 | | | | 52,583 | | | | 143,459 | | | | (5,455 | ) | | | 51,198 | |
| Net increase (decrease) in net assets resulting from operations | | | (10,587 | ) | | | 94,728 | | | | (11,216 | ) | | | 55,448 | | | | 36,411 | | | | 194,918 | | | | (193 | ) | | | 51,450 | |
| Distributions to shareholders from | | | | | | | | | | | | | | | | | | | | | | | | | | | | | | | | |
| Class N | | | — | | | | (3 | ) | | | — | | | | (11 | ) | | | — | | | | (311 | ) | | | — | | | | — | |
| Class I | | | — | | | | (460 | ) | | | — | | | | (393 | ) | | | — | | | | (3,046 | ) | | | — | | | | (236 | ) |
| Class R6 | | | — | | | | (597 | ) | | | — | | | | (1,820 | ) | | | — | | | | (28,573 | ) | | | — | | | | (286 | ) |
| Total distributions | | | — | | | | (1,060 | ) | | | — | | | | (2,224 | ) | | | — | | | | (31,930 | ) | | | — | | | | (522 | ) |
| Capital stock transactions | | | | | | | | | | | | | | | | | | | | | | | | | | | | | | | | |
| Proceeds from sale of shares | | | 12,079 | | | | 45,917 | | | | 23,357 | | | | 38,679 | | | | 84,384 | | | | 171,633 | | | | 52,171 | | | | 60,868 | |
| Shares issued in reinvestment of income dividends and capital gain distributions | | | — | | | | 969 | | | | — | | | | 2,206 | | | | — | | | | 26,669 | | | | — | | | | 465 | |
| Less cost of shares redeemed | | | (48,217 | ) | | | (172,212 | ) | | | (26,957 | ) | | | (54,740 | ) | | | (83,032 | ) | | | (312,069 | ) | | | (69,031 | ) | | | (111,575 | ) |
| Net increase (decrease) in net assets resulting from capital share transactions | | | (36,138 | ) | | | (125,326 | ) | | | (3,600 | ) | | | (13,855 | ) | | | 1,352 | | | | (113,767 | ) | | | (16,860 | ) | | | (50,242 | ) |
| Increase (decrease) in net assets | | | (46,725 | ) | | | (31,658 | ) | | | (14,816 | ) | | | 39,369 | | | | 37,763 | | | | 49,221 | | | | (17,053 | ) | | | 686 | |
| Net assets | | | | | | | | | | | | | | | | | | | | | | | | | | | | | | | | |
| Beginning of period | | | 309,066 | | | | 340,724 | | | | 238,283 | | | | 198,914 | | | | 790,192 | | | | 740,971 | | | | 277,621 | | | | 276,935 | |
| End of period | | $ | 262,341 | | | $ | 309,066 | | | $ | 223,467 | | | $ | 238,283 | | | $ | 827,955 | | | $ | 790,192 | | | $ | 260,568 | | | $ | 277,621 | |
See accompanying Notes to Financial Statements.
| June 30, 2020 | William Blair Funds | 107 |
Statements of Assets and Liabilities
As of June 30, 2020 (dollar amounts in thousands) (unaudited)
| | | | | | | | | Low | | | Macro | |
| | | Bond | | | Income | | | Duration | | | Allocation | |
| | | Fund | | | Fund | | | Fund | | | Fund | |
| Assets | | | | | | | | | | | | | | | | | |
| Investments in securities, at cost | | $ | 261,635 | | | $ | 51,444 | | | $ | 112,781 | | | | $ | 516,329 | |
| Investments in securities, at value | | $ | 280,685 | | | $ | 53,021 | | | $ | 113,679 | | | | $ | 543,162 | |
| Receivable for securities sold | | | — | | | | — | | | | — | | | | | 15,512 | |
| Receivable for fund shares sold | | | 1,222 | | | | 166 | | | | 3,290 | | | | | 276 | |
| Receivable from Adviser | | | 19 | | | | 7 | | | | 12 | | | | | 10 | |
| Dividend and interest receivable | | | 1,798 | | | | 246 | | | | 391 | | | | | 1,576 | |
| Unrealized appreciation on swap contracts | | | — | | | | — | | | | — | | | | | 498 | |
| Unrealized appreciation on forward foreign currency contracts | | | — | | | | — | | | | — | | | | | 1,413 | |
| Total assets | | | 283,724 | | | | 53,440 | | | | 117,372 | | | | | 562,447 | |
| Liabilities | | | | | | | | | | | | | | | | | |
| Payable for futures variation margin | | | — | | | | — | | | | — | | | | | 3,752 | |
| Payable for securities purchased | | | 6,888 | | | | 348 | | | | 5,813 | | | | | 4,436 | |
| Payable for fund shares redeemed | | | 416 | | | | 88 | | | | 67 | | | | | 494 | |
| Unrealized depreciation on swap contracts | | | — | | | | — | | | | — | | | | | 657 | |
| Unrealized depreciation on forward foreign currency contracts | | | — | | | | — | | | | — | | | | | 6,117 | |
| Management fee payable | | | 67 | | | | 16 | | | | 23 | | | | | 370 | |
| Distribution fee payable | | | 4 | | | | 3 | | | | 1 | | | | | 2 | |
| Distributions payable to shareholders | | | 134 | | | | 9 | | | | 51 | | | | | — | |
| Other payables and accrued expenses | | | 60 | | | | 43 | | | | 55 | | | | | 155 | |
| Total liabilities | | | 7,569 | | | | 507 | | | | 6,010 | | | | | 15,983 | |
| Net assets | | $ | 276,155 | | | $ | 52,933 | | | $ | 111,362 | | | | $ | 546,464 | |
| Capital | | | | | | | | | | | | | | | | | |
| Composition of net assets | | | | | | | | | | | | | | | | | |
| Paid in capital | | $ | 278,430 | | | $ | 58,088 | | | $ | 139,014 | | | | $ | 744,653 | |
| Total distributable earnings (loss) | | | (2,275 | ) | | | (5,155 | ) | | | (27,652 | ) | | | | (198,189 | ) |
| Net assets | | $ | 276,155 | | | $ | 52,933 | | | $ | 111,362 | | | | $ | 546,464 | |
| | | | | | | | | | | | | | | | | | |
| Class N shares | | | | | | | | | | | | | | | | | |
| Net assets | | $ | 30,598 | | | $ | 21,204 | | | $ | 7,192 | | | | $ | 8,519 | |
| Shares outstanding | | | 2,871,527 | | | | 2,436,104 | | | | 826,898 | | | | | 801,351 | |
| Net asset value per share | | $ | 10.66 | | | $ | 8.70 | | | $ | 8.70 | | | | $ | 10.63 | |
| Class I shares | | | | | | | | | | | | | | | | | |
| Net assets | | $ | 199,616 | | | $ | 31,659 | | | $ | 63,588 | | | | $ | 248,277 | |
| Shares outstanding | | | 18,932,705 | | | | 3,661,908 | | | | 7,316,160 | | | | | 23,500,815 | |
| Net asset value per share | | $ | 10.54 | | | $ | 8.65 | | | $ | 8.69 | | | | $ | 10.56 | |
| Class R6 shares | | | | | | | | | | | | | | | | | |
| Net assets | | $ | 45,941 | | | $ | 70 | | | $ | 40,582 | | | | $ | 289,668 | |
| Shares outstanding | | | 4,359,352 | | | | 8,073 | | | | 4,667,469 | | | | | 27,385,803 | |
| Net asset value per share | | $ | 10.54 | | | $ | 8.65 | | | $ | 8.69 | | | | $ | 10.58 | |
See accompanying Notes to Financial Statements.
| 108 | Semiannual Report | June 30, 2020 |
Statements of Operations
For the Period Ended June 30, 2020 (all amounts in thousands) (unaudited)
| | | | | | | | | | Low | | | Macro | |
| | | Bond | | | Income | | | Duration | | | Allocation | |
| | | Fund | | | Fund | | | Fund | | | Fund | |
| Investment income | | | | | | | | | | | | | | | | | | | |
| Dividends | | $ | — | | | | $ | — | | | | $ | — | | | | $ | 3,603 | |
| Interest | | | 4,397 | | | | | 659 | | | | | 887 | | | | | 1,742 | |
| Total income | | | 4,397 | | | | | 659 | | | | | 887 | | | | | 5,345 | |
| Expenses | | | | | | | | | | | | | | | | | | | |
| Investment advisory fees | | | 415 | | | | | 98 | | | | | 119 | | | | | 2,529 | |
| Distribution fees | | | 23 | | | | | 15 | | | | | 2 | | | | | 13 | |
| Custodian fees | | | 55 | | | | | 38 | | | | | 38 | | | | | 66 | |
| Transfer agent fees | | | 36 | | | | | 5 | | | | | 3 | | | | | 127 | |
| Sub-transfer agent fees | | | | | | | | | | | | | | | | | | | |
| Class N | | | 21 | | | | | 14 | | | | | 1 | | | | | 8 | |
| Class I | | | 86 | | | | | 7 | | | | | 7 | | | | | 142 | |
| Professional fees | | | 27 | | | | | 20 | | | | | 18 | | | | | 51 | |
| Registration fees | | | 32 | | | | | 28 | | | | | 29 | | | | | 26 | |
| Shareholder reporting fees | | | 13 | | | | | 3 | | | | | 1 | | | | | 20 | |
| Trustee fees | | | 14 | | | | | 2 | | | | | 4 | | | | | 41 | |
| Other expenses | | | 7 | | | | | 5 | | | | | 5 | | | | | 70 | |
| Total expenses before expense limitation | | | 729 | | | | | 235 | | | | | 227 | | | | | 3,093 | |
| Expenses waived or reimbursed by the Adviser | | | | | | | | | | | | | | | | | | | |
| Class N | | | (17 | ) | | | | (22 | ) | | | | (3 | ) | | | | (3 | ) |
| Class I | | | (66 | ) | | | | (19 | ) | | | | (35 | ) | | | | (10 | ) |
| Class R6 | | | (7 | ) | | | | — | | | | | (37 | ) | | | | — | |
| Total expenses waived or reimbursed by the Adviser | | | (90 | ) | | | | (41 | ) | | | | (75 | ) | | | | (13 | ) |
| Net expenses | | | 639 | | | | | 194 | | | | | 152 | | | | | 3,080 | |
| Net investment income (loss) | | | 3,758 | | | | | 465 | | | | | 735 | | | | | 2,265 | |
| Realized and unrealized gain (loss) | | | | | | | | | | | | | | | | | | | |
| Net realized gain (loss) on transactions from: | | | | | | | | | | | | | | | | | | | |
| Investments in securities | | | 170 | | | | | 21 | | | | | (364 | ) | | | | (4,464 | ) |
| Options | | | — | | | | | — | | | | | — | | | | | (6,041 | ) |
| Futures contracts | | | — | | | | | — | | | | | — | | | | | 9,318 | |
| Swaps | | | 405 | | | | | (34 | ) | | | | (56 | ) | | | | 5,111 | |
| Forward foreign currency contracts | | | — | | | | | — | | | | | — | | | | | (9,183 | ) |
| Foreign currency transactions | | | — | | | | | — | | | | | — | | | | | (1,272 | ) |
| Total net realized gain (loss) | | | 575 | | | | | (13 | ) | | | | (420 | ) | | | | (6,531 | ) |
| Change in net unrealized appreciation (depreciation) of: | | | | | | | | | | | | | | | | | | | |
| Investments in securities | | | 6,351 | | | | | 1,168 | | | | | 1,163 | | | | | (40,593 | ) |
| Futures contracts | | | — | | | | | — | | | | | — | | | | | (373 | ) |
| Swaps | | | 626 | | | | | — | | | | | — | | | | | (1,481 | ) |
| Forward foreign currency contracts | | | — | | | | | — | | | | | — | | | | | (1,892 | ) |
| Foreign currency translations | | | — | | | | | — | | | | | — | | | | | 43 | |
| Change in net unrealized appreciation (depreciation) | | | 6,977 | | | | | 1,168 | | | | | 1,163 | | | | | (44,296 | ) |
| Net increase (decrease) in net assets resulting from operations | | $ | 11,310 | | | | $ | 1,620 | | | | $ | 1,478 | | | | $ | (48,562 | ) |
See accompanying Notes to Financial Statements.
| June 30, 2020 | William Blair Funds | 109 |
Statements of Changes in Net Assets
For the Period Ended June 30, 2020 (unaudited) and the Year Ended December 31, 2019 (all amounts in thousands)
| | | | | | | | | | | | | | | | | Low Duration | | | Macro Allocation | |
| | | Bond Fund | | | Income Fund | | | Fund | | | Fund | |
| | | 2020 | | | 2019 | | | 2020 | | | 2019 | | | 2020 | | | 2019 | | | 2020 | | | 2019 | |
| Operations | | | | | | | | | | | | | | | | | | | | | | | | | | | | | | | | | | |
| Net investment income (loss) | | | $ | 3,758 | | | $ | 11,304 | | | | $ | 465 | | | $ | 1,286 | | | $ | 735 | | | $ | 2,273 | | | $ | 2,265 | | | $ | 10,006 | |
| Net realized gain (loss) on investments, and other assets and liabilities | | | | 575 | | | | 5,641 | | | | | (13 | ) | | | 98 | | | | (420 | ) | | | (575 | ) | | | (6,531 | ) | | | (33,187 | ) |
| Change in net unrealized appreciation (depreciation) on investments, and other assets and liabilities | | | | 6,977 | | | | 25,603 | | | | | 1,168 | | | | 2,291 | | | | 1,163 | | | | 1,875 | | | | (44,296 | ) | | | 58,793 | |
| Net increase (decrease) in net assets resulting from operations | | | | 11,310 | | | | 42,548 | | | | | 1,620 | | | | 3,675 | | | | 1,478 | | | | 3,573 | | | | (48,562 | ) | | | 35,612 | |
| Distributions to shareholders from | | | | | | | | | | | | | | | | | | | | | | | | | | | | | | | | | | |
| Class N | | | | (572 | ) | | | (2,191 | ) | | | | (313 | ) | | | (699 | ) | | | (39 | ) | | | (60 | ) | | | — | | | | (503 | ) |
| Class I | | | | (3,880 | ) | | | (10,482 | ) | | | | (524 | ) | | | (1,385 | ) | | | (664 | ) | | | (1,999 | ) | | | — | | | | (15,861 | ) |
| Class R6 | | | | (857 | ) | | | (2,442 | ) | | | | (1 | ) | | | (1 | ) | | | (641 | ) | | | (1,674 | ) | | | — | | | | (16,522 | ) |
| Total distributions | | | | (5,309 | ) | | | (15,115 | ) | | | | (838 | ) | | | (2,085 | ) | | | (1,344 | ) | | | (3,733 | ) | | | — | | | | (32,886 | ) |
| Capital stock transactions | | | | | | | | | | | | | | | | | | | | | | | | | | | | | | | | | | |
| Proceeds from sale of shares | | | | 34,241 | | | | 80,419 | | | | | 8,429 | | | | 17,977 | | | | 40,452 | | | | 14,009 | | | | 58,225 | | | | 222,795 | |
| Shares issued in reinvestment of income dividends and capital gain distributions | | | | 4,477 | | | | 13,243 | | | | | 781 | | | | 1,968 | | | | 1,015 | | | | 2,946 | | | | — | | | | 27,731 | |
| Less cost of shares redeemed | | | | (50,699 | ) | | | (261,506 | ) | | | | (8,402 | ) | | | (27,407 | ) | | | (6,754 | ) | | | (45,646 | ) | | | (213,999 | ) | | | (424,270 | ) |
| Net increase (decrease) in net assets resulting from capital share transactions | | | | (11,981 | ) | | | (167,844 | ) | | | | 808 | | | | (7,462 | ) | | | 34,713 | | | | (28,691 | ) | | | (155,774 | ) | | | (173,744 | ) |
| Increase (decrease) in net assets | | | | (5,980 | ) | | | (140,411 | ) | | | | 1,590 | | | | (5,872 | ) | | | 34,847 | | | | (28,851 | ) | | | (204,336 | ) | | | (171,018 | ) |
| Net assets | | | | | | | | | | | | | | | | | | | | | | | | | | | | | | | | | | |
| Beginning of period | | | | 282,135 | | | | 422,546 | | | | | 51,343 | | | | 57,215 | | | | 76,515 | | | | 105,366 | | | | 750,800 | | | | 921,818 | |
| End of period | | | $ | 276,155 | | | $ | 282,135 | | | | $ | 52,933 | | | $ | 51,343 | | | $ | 111,362 | | | $ | 76,515 | | | $ | 546,464 | | | $ | 750,800 | |
See accompanying Notes to Financial Statements.
| 110 | Semiannual Report | June 30, 2020 |
Notes to Financial Statements (information as of June 30, 2020 is unaudited)
(1) Organization
(a) Description of the Trust
William Blair Funds (the “Trust”) is a Delaware statutory trust registered under the Investment Company Act of 1940, as amended (the “1940 Act”), as an open-end management investment company. As of the date of this report, the Trust has the following twenty funds (the “Funds”) available for sale, each with its own investment objective and policies. For each Fund, the number of shares authorized is unlimited.
| U.S. Equity Funds | Global Equity Fund | Fixed Income Funds |
| Growth | Global Leaders | Bond |
| Large Cap Growth | | Income |
| Mid Cap Growth | International Equity Funds | Low Duration |
| Small-Mid Cap Core | International Leaders | |
| Small-Mid Cap Growth | International Growth | Multi-Asset and Alternative Fund |
| Small-Mid Cap Value | Institutional International Growth | Macro Allocation |
| Small Cap Growth | International Small Cap Growth | |
| Small Cap Value | Emerging Markets Leaders | |
| | Emerging Markets Growth | |
| | Emerging Markets Small Cap Growth | |
William Blair Investment Management, LLC (the “Adviser”) serves as the Trust’s investment adviser. William Blair & Company, L.L.C. (“WBC” or the “Distributor”), an affiliate of the Adviser, serves as the Trust’s principal underwriter and distributor.
(b) Share Classes
Each Fund is comprised of Class N, Class I and Class R6 shares, except Small-Mid Cap Core Fund, which is comprised of Class I and Class R6 shares, and Institutional International Growth Fund, which does not offer multiple classes of shares.
Class N shares are available to the general public, either directly through the Trust’s distributor or through a select number of financial intermediaries. Class N shares are sold without any sales load and carry an annual 12b-1 distribution fee at a fixed rate (0.25% for the U.S. Equity, Global Equity, International Equity and Multi-Asset and Alternative Funds and 0.15% for the Fixed Income Funds as discussed in Note 4(b) – Transactions with Affiliates – Underwriting Distribution Services and Shareholder Administration Agreements) and a sub-transfer agent fee that is not a fixed rate and varies by Fund and class, as discussed below.
Class I shares are available to certain retirement and deferred compensation plans, clients of certain financial intermediaries, and asset-based fee advisory clients of William Blair. The minimum initial investment for a Class I account is $500,000, subject to certain exceptions. Class I shares do not carry any sales load or distribution fees and generally have lower ongoing expenses than Class N shares. Class I shares have a sub-transfer agent fee that is not a fixed rate and varies by Fund and class, as discussed below.
Class R6 shares are available to certain retirement and deferred compensation plans, clients of certain financial intermediaries, asset-based fee advisory clients of William Blair, and additional types of investors, provided that neither the investor nor the financial intermediary requires the Funds to make any type of servicing or administrative payment. The minimum initial investment for a Class R6 account is $1 million, subject to certain exceptions.
Shares of the Institutional International Growth Fund require a minimum initial investment of $5 million, subject to certain exceptions.
Class R6 shares and the Institutional International Growth Fund do not carry any sales load, distribution fees or sub-transfer agents fees. Class R6 shares of a Fund generally have lower ongoing expenses than the Fund’s Class N and Class I shares.
Sub-transfer agent fees: For Class N and Class I shares, the Funds may reimburse WBC for fees paid to intermediaries such as banks, broker-dealers, financial advisers or other financial institutions for sub-administration, sub-transfer agency and other services provided to investors whose shares of record are held in omnibus, other group accounts, retirement plans or accounts
| June 30, 2020 | William Blair Funds | 111 |
Notes to Financial Statements (information as of June 30, 2020 is unaudited)
traded through registered securities clearing agents. These fees may vary based on, for example, the nature of services provided, but generally range up to 0.15% of the assets of the class serviced or maintained by the intermediary or up to $15 per sub-account maintained by the intermediary, depending on the method by which the intermediary charges for the services.
(c) Fund Objectives
The investment objectives of the Funds are as follows:
| U.S. Equity Funds | Long-term capital appreciation. |
| Global Equity Fund | Long-term capital appreciation. |
| International Equity Funds | Long-term capital appreciation. |
| Bond Fund | Outperform the Bloomberg Barclays U.S. Aggregate Index by maximizing total return through a combination of income and capital appreciation. |
| Income Fund | High level of current income with relative stability of principal. |
| Low Duration Fund | Maximize total return. Total return includes both income and capital appreciation. |
| Macro Allocation Fund | Maximize long-term risk-adjusted total return. |
(2) Significant Accounting Policies
The following is a summary of the Trust’s significant accounting policies in effect during the periods covered by the financial statements, which are in accordance with U.S. generally accepted accounting principles (“US GAAP”), which includes the accounting and reporting guidelines under Accounting Standards Topic 946, Financial Services—Investment Companies.
(a) Investment income and transactions
Investment income, realized and unrealized gains and losses, and certain Fund level expenses and expense reductions, if any, are allocated based on the relative net assets of each class, except for certain class-specific expenses, which are charged directly to the appropriate class. Differences in class expenses may result in the payment of different per share dividends by class. All share classes of the Funds have equal rights with respect to voting, subject to class specific arrangements.
Dividend income and expenses are recorded on the ex-dividend date, except for those dividends from certain foreign securities that are recorded when the information is available.
Interest income is recorded on an accrual basis, adjusted for amortization of premium or accretion of discount. Variable rate bonds and floating rate notes earn interest at coupon rates that fluctuate at specific time intervals. The interest rates shown in the Portfolio of Investments for the Bond, Income, Low Duration and Macro Allocation Funds were the rates in effect on June 30, 2020. Put bonds may be redeemed at the discretion of the holder on specified dates prior to maturity.
Premiums and discounts are amortized and accreted, respectively, on a straight-line basis for short-term investments and on an effective interest method for long-term investments.
Paydown gains and losses on mortgage-backed and asset-backed securities are treated as an adjustment to interest income. For the period ended June 30, 2020, the Bond, Income and Low Duration Funds recognized a reduction of interest income and a corresponding increase in net realized gain of $1,684, $373 and $610, respectively (in thousands). This reclassification had no effect on the net increase (decrease) in net assets resulting from operations, net asset value or the net assets of the Funds.
The Funds do not isolate the portion of operations resulting from fluctuations in foreign currency exchange rates on investments from the fluctuations arising from changes in the value of securities held. Such currency fluctuations are included with the net realized and unrealized gain or loss from investments.
Reported net realized foreign currency gains or losses arise from disposition of foreign currency, the difference in the foreign exchange rates between the trade and settlement dates on securities transactions, and the difference between the amounts of dividends, interest and foreign withholding taxes recorded on the ex-date or accrual date and the U.S. dollar equivalent of the amounts actually received or paid. Net unrealized foreign exchange gains and losses arise from changes (due to the changes in the exchange rate) in the value of foreign currency and other assets and liabilities denominated in foreign currencies held at period end.
| 112 | Semiannual Report | June 30, 2020 |
Notes to Financial Statements (information as of June 30, 2020 is unaudited)
For financial reporting purposes, security and shareholder transactions are recorded on trade date in accordance with US GAAP. Realized gains and losses from securities transactions are recognized on a specifically identified cost basis.
Awards from class action litigation may be recorded as a reduction of cost. If the Funds no longer own the applicable securities, the proceeds are recorded as realized gains.
(b) Share Valuation and Distributions to Shareholders
Shares are sold and redeemed on a continuous basis at net asset value. The net asset value per share is determined separately for each class by dividing the Fund’s net assets attributable to that class by the number of shares of the class outstanding as of the close of regular trading on the New York Stock Exchange (the “NYSE”), which is generally 4:00 p.m. Eastern time, on each day the NYSE is open.
Distributions from net investment income, if any, for all Equity and Multi-Asset and Alternative Funds are declared and paid at least annually. Distributions from net investment income for the Fixed Income Funds are declared daily and paid monthly. Capital gain distributions, if any, for all Funds, are declared and paid at least annually in December and/or January. The Small Cap Value Fund paid a distribution from capitals gains in March 2020. Distributions payable to shareholders are recorded on the ex-dividend date.
(c) Foreign Currency Translation
The Funds may invest in securities denominated in foreign currencies. As such, assets and liabilities denominated in foreign currencies are translated into U.S. dollar amounts at the current exchange rate on the date of valuation. The values of foreign investments, open forward foreign currency contracts, and cash denominated in foreign currencies are translated into U.S. dollars using a spot market rate of exchange as of the time of the determination of each Fund’s net asset value, typically 4:00 p.m. Eastern time on days when there is regular trading on the NYSE. Payables and receivables for securities transactions, dividends, interest income and tax reclaims are translated into U.S. dollars using a spot market rate of exchange as of 4:00 p.m. Eastern time. Settlement of purchases and sales and dividend and interest receipts are translated into U.S. dollars using a spot market rate of exchange as of 11:00 a.m. Eastern time.
(d) Income Taxes
Each Fund intends to comply with the provisions of Subchapter M of the Internal Revenue Code of 1986, as amended (the “Code”), in order to qualify as regulated investment companies. Each Fund intends to make the requisite distributions of income and capital gains to its shareholders sufficient to relieve it from all, or substantially all, federal income and excise taxes. No provision for federal income and excise taxes has been made.
Certain Funds may be subject to foreign income taxes imposed on realized gains on securities of issuers from certain foreign countries. Such taxes, if applicable, are included within net realized gain (loss) on transactions from investments in securities in the Statement of Operations.
Management evaluates tax positions taken or expected to be taken in the course of preparing the Funds’ tax returns to determine whether it is “more likely than not” that each tax position would be sustained upon examination by a taxing authority based on the technical merits of the positions. Tax positions not deemed to meet the “more likely than not” threshold would be recorded as a tax benefit or expense in the current year. Management has evaluated all of the uncertain tax positions of the Funds and has determined that no liability is required to be recorded in the financial statements.
The statute of limitations on the Funds’ tax returns for the prior three years remains open and the returns are subject to examination.
| June 30, 2020 | William Blair Funds | 113 |
Notes to Financial Statements (information as of June 30, 2020 is unaudited)
Adjustments to the cost of investments for tax purposes may be due to the deferred loss associated with current and prior year wash sales, income recognition from investments in real estate investment trusts and partnerships, and the Funds’ election to mark-to-market their investments in Passive Foreign Investment Companies (“PFICs”). The cost of investments, including derivatives, for federal income tax purposes and related gross unrealized appreciation (depreciation) and net unrealized appreciation/(depreciation) at June 30, 2020, were as follows (in thousands):
| | | | | | | | | | | | Net |
| | | | | | Gross | | Gross | | Unrealized |
| | | Cost of | | | Unrealized | | Unrealized | | Appreciation/ |
| Fund | | Investments | | | Appreciation | | Depreciation | | (Depreciation) |
| Growth | | $ | 150,788 | | | $ | 102,027 | | | $ | 3,211 | | | $ | 98,816 | |
| Large Cap Growth | | | 409,230 | | | | 116,638 | | | | 3,795 | | | | 112,843 | |
| Mid Cap Growth | | | 57,409 | | | | 14,708 | | | | 1,670 | | | | 13,038 | |
| Small-Mid Cap Core | | | 213,211 | | | | 15,644 | | | | 29,418 | | | | (13,774 | ) |
| Small-Mid Cap Growth | | | 2,279,923 | | | | 594,822 | | | | 63,096 | | | | 531,726 | |
| Small-Mid Cap Value | | | 1,297 | | | | (122 | ) | | | 4 | | | | (126 | ) |
| Small Cap Growth | | | 444,152 | | | | 97,875 | | | | 28,388 | | | | 69,487 | |
| Small Cap Value | | | 87,994 | | | | 16,746 | | | | 6,911 | | | | 9,835 | |
| Global Leaders | | | 65,145 | | | | 32,800 | | | | 935 | | | | 31,865 | |
| International Leaders | | | 519,860 | | | | 160,926 | | | | 18,795 | | | | 142,131 | |
| International Growth | | | 1,383,291 | | | | 527,960 | | | | 28,451 | | | | 499,509 | |
| Institutional International Growth | | | 1,152,408 | | | | 422,652 | | | | 22,464 | | | | 400,188 | |
| International Small Cap Growth | | | 216,688 | | | | 54,244 | | | | 9,651 | | | | 44,593 | |
| Emerging Markets Leaders | | | 181,107 | | | | 51,651 | | | | 10,452 | | | | 41,199 | |
| Emerging Markets Growth | | | 608,520 | | | | 224,418 | | | | 2,861 | | | | 221,557 | |
| Emerging Markets Small Cap Growth | | | 208,353 | | | | 55,451 | | | | 4,107 | | | | 51,344 | |
| Bond | | | 261,703 | | | | 19,505 | | | | 523 | | | | 18,982 | |
| Income | | | 51,453 | | | | 1,614 | | | | 46 | | | | 1,568 | |
| Low Duration | | | 112,781 | | | | 1,254 | | | | 356 | | | | 898 | |
| Macro Allocation | | | 512,815 | | | | 33,305 | | | | 3,700 | | | | 29,605 | |
As of December 31, 2019, the Funds may have unused capital loss carryforwards available for federal income tax purposes to be applied against future capital gains, if any. Under current law, the Funds may carry forward net capital losses indefinitely to use to offset capital gains realized in future years. The following table details the Funds’ available capital loss carryforwards as of December 31, 2019, and the capital loss carryforwards utilized by the Funds in 2019:
| | | Available Capital Loss Carryforwards | | Capital Loss
Carryforwards |
| Fund | | Short Term | | Long Term | | Total | | Utilized in 2019 |
| Small-Mid Cap Core | | $ | 14 | | | $ | — | | | $ | 14 | | | $ | — | |
| International Growth | | | 8,604 | | | | — | | | | 8,604 | | | | — | |
| Institutional International Growth | | | 33,252 | | | | — | | | | 33,252 | | | | — | |
| International Small Cap Growth | | | 15,355 | | | | — | | | | 15,355 | | | | — | |
| Emerging Markets Small Cap Growth | | | 46,476 | | | | — | | | | 46,476 | | | | — | |
| Bond | | | 10,477 | | | | 9,850 | | | | 20,327 | | | | 1,720 | |
| Income | | | 2,323 | | | | 4,026 | | | | 6,349 | | | | — | |
| Low Duration | | | 12,502 | | | | 15,028 | | | | 27,530 | | | | — | |
| Macro Allocation | | | 195,996 | | | | 25,044 | | | | 221,040 | | | | — | |
In order to meet certain excise tax distribution requirements, the Funds are required to measure and distribute annually, net capital gains realized during a twelve month period ending October 31 and net investment income earned during a twelve month period ending December 31. In connection with this, the Funds are permitted for tax purposes to defer into their next fiscal year qualified late year losses. Qualified late year capital losses are any short term or long term capital losses incurred between November 1 and the end of their fiscal year, December 31, 2019. Qualified late year ordinary losses are comprised of losses related to swaps, foreign currency and PFICs incurred between November 1 and the end of their fiscal year, December 31, 2019.
| 114 | Semiannual Report | June 30, 2020 |
Notes to Financial Statements (information as of June 30, 2020 is unaudited)
As of December 31, 2019, the following Funds deferred, on a tax basis, qualified late year losses of (in thousands):
| | | Qualified Late Year Losses | |
| | | Ordinary | | | Net | |
| Fund | | Income | | | Capital | |
| Small Cap Growth | | $ | — | | | $ | 600 | |
| Bond | | | 432 | | | | — | |
(e) Repurchase Agreements
In a repurchase agreement, a Fund buys a security at one price and at the time of sale, the seller agrees to repurchase the security at a mutually agreed upon time and price (usually within seven days). The repurchase agreement thereby determines the yield during the purchaser’s holding period, while the seller’s obligation to repurchase is secured by the value of the underlying collateral. The Adviser monitors, on an ongoing basis, the value of the underlying collateral to ensure that the value always equals or exceeds the repurchase price plus accrued interest. Repurchase agreements may involve certain risks in the event of a default or insolvency of the other party to the agreement, including possible delays or restrictions upon a Fund’s ability to dispose of the underlying collateral. The risk to a Fund is limited to the ability of the seller to pay the agreed upon sum on the delivery date. In the event of default, a repurchase agreement provides that a Fund is entitled to sell the underlying collateral. The loss, if any, to a Fund will be the difference between the proceeds from the sale and the repurchase price. However, if bankruptcy proceedings are commenced with respect to the seller of the security, disposition of the collateral by the Fund may be delayed or limited. The Funds have master repurchase agreements which allow the Funds to offset amounts owed to a counterparty with amounts owed from the same counterparty, including any collateral, in the event the counterparty defaults. Each Fund’s outstanding repurchase agreements, if any, and related collateral, are shown on the Fund’s Portfolio of Investments. Although no definitive creditworthiness criteria are used, the Adviser reviews the creditworthiness of the banks and non-bank dealers with which a Fund enters into repurchase agreements to evaluate those risks. A Fund may, for tax purposes, deem repurchase agreements collateralized by U.S. Government securities to be investments in U.S. Government securities.
(f) TBA Securities
The Fixed Income Funds may invest in mortgage pass-through securities eligible to be sold in the “to-be announced” market (“TBAs”). TBAs provide for the forward or delayed delivery of the underlying instrument with settlement in up to 180 days. The term TBA comes from the fact that the specific mortgage-backed security that will be delivered to fulfill a TBA trade is not designated at the time the trade is made, but rather is generally announced 48 hours before the settlement date. A Fund generally has the ability to close out a TBA obligation on or before the settlement date, rather than take delivery of the security. When a Fund sells TBAs, it incurs risks similar to those incurred in short sales. For example, when a Fund sells TBAs without owning or having the right to obtain the deliverable securities it incurs a risk of loss because it could have to purchase the securities at a price that is higher than the price at which it sold the securities.
(g) Securities Sold, Not Yet Purchased
A Fund may sell a security it does not own (known as selling a security short) in anticipation of a decline in the fair value of that security. When a Fund sells a security short, it must borrow the security sold short and deliver it to the broker through which it made the short sale. A gain, limited to the price at which the fund sold the security short, or a loss, unlimited in size, will be recognized upon the termination of the short sale. A Fund is also subject to the risk that it may be unable to acquire a security to terminate a short position except at a price substantially in excess of the price at which it sold the security short.
(h) Use of Estimates
The preparation of financial statements in conformity with US GAAP requires management to make estimates and assumptions that affect the amounts reported in the financial statements. Actual results may differ from those estimates.
(i) Indemnification
In the normal course of business, the Funds have entered into contracts in which the Funds agree to indemnify the other party or parties against various potential costs or liabilities. The Funds’ maximum exposure under these arrangements is unknown. No claim has been made for indemnification pursuant to any such agreement of the Funds.
| June 30, 2020 | William Blair Funds | 115 |
Notes to Financial Statements (information as of June 30, 2020 is unaudited)
(j) Redemption In-Kind
In accordance with the Trust’s prospectus, the Funds may distribute portfolio securities rather than cash as payment for a redemption of Fund shares (in-kind redemption). For financial reporting purposes, the Fund recognizes a gain or loss on the transfer of securities depending on the value of those securities on the date of redemption. Gains and losses realized on in-kind redemptions may not be recognized for tax purposes and are reclassified from accumulated net realized gain (loss) to capital paid in excess of par value. During the period ended June 30, 2020, the Small-Mid Cap Growth, Global Leaders and Institutional International Growth Funds redeemed $20,321, $19,073 and $37,257 (in thousands), respectively, of Fund shares in-kind rather than with cash and recognized net realized gains of $6,220, $7,974 and $7,699 (in thousands), respectively, on the securities distributed to shareholders.
(3) Valuation
(a) Investment Valuation
The value of U.S. equity securities, including exchange-traded funds, is determined by valuing securities traded on national securities markets or in the over-the-counter markets at the last sale price or, if applicable, the official closing price or, in the absence of a recent sale on the date of determination, at the mean between the last reported bid and ask prices.
The value of foreign equity securities is generally determined based upon the last sale price on the foreign exchange or market on which it is primarily traded and in the currency of that market as of the close of the appropriate exchange or, if there have been no sales during that day, at the mean between the last reported bid and ask prices. The Board of Trustees has determined that the passage of time between when the foreign exchanges or markets close and when the Funds compute their net asset values could cause the value of foreign equity securities to no longer be representative or accurate and, as a result, may necessitate that such securities be fair valued. Accordingly, for foreign equity securities, the Funds may use an independent pricing service to fair value price the security as of the close of regular trading on the NYSE. As a result, a Fund’s value for a foreign security may be different from the last sale price (or the mean between the last reported bid and ask prices). As of June 30, 2020, fair valuation estimates for foreign equity securities were not obtained.
Fixed income securities are generally valued using evaluated prices provided by an independent pricing service. The evaluated prices are formed using various market inputs that the pricing service believes accurately represent the market value of a security at a particular point in time. The pricing service determines evaluated prices for fixed income securities using inputs including, but not limited to, recent transaction prices for such securities, dealer quotes, transaction prices for other securities with similar characteristics, collateral characteristics, credit quality, payment history, liquidity and market conditions.
Repurchase agreements are valued at cost, which approximates fair value.
Option contracts on securities, currencies and other financial instruments traded on one or more exchanges are valued at their most recent sale price on the exchange on which they are traded most extensively. Option contracts on foreign indices are valued at the settlement price. If there were no sales that day or if no settlement price is available, such option contracts are valued at the mean between the last reported bid and ask prices. Option contracts traded in the Over-the-Counter (“OTC”) market shall be valued by an independent pricing service. Futures contracts are valued at the most recent settlement price on the exchange on which they are traded most extensively, or if no settlement price is available, at the last sale price as of the close of the exchange. Forward foreign currency contracts are valued on the basis of the value of the underlying currencies at the prevailing currency exchange rate as supplied by an independent pricing service.
Swaps that are centrally cleared through an exchange are valued at the most recent settlement price provided by the exchange on which they are cleared. Total return swaps on equities, equity baskets, indices and other financial instruments are valued by an independent pricing service, or if unavailable, based on the security’s or instrument’s underlying reference asset. All other swap contracts are valued by an independent pricing service. Depending on the product and the terms of the transaction, the independent pricing service may use a series of techniques, including simulation pricing models. The pricing models use inputs that are observed from actively quoted markets such as issuer details, indices, spreads, interest rates, yield curves, dividends and exchange rates.
Securities, and other assets, for which a market price is not available or is deemed unreliable (e.g., securities affected by unusual or extraordinary events, such as natural disasters or securities affected by market or economic events, such as bankruptcy filings), or the value of which is affected by a significant valuation event, are valued at a fair value as determined in good faith by, or under the direction of, the Board of Trustees and in accordance with the Valuation Procedures approved by the Board of Trustees. The value of these fair valued securities may be different from the last sale price (or the mean between the last reported bid and ask prices), and there is no guarantee that a fair valued security will be sold at the price at which a Fund is carrying the security.
| 116 | Semiannual Report | June 30, 2020 |
Notes to Financial Statements (information as of June 30, 2020 is unaudited)
(b) Fair Value Measurements
Fair value is defined as the price that a Fund would receive upon selling a security in an orderly transaction to an independent buyer in the principal or most advantageous market for the investment. Various inputs are used in determining the value of a Fund’s investments. A three-tier hierarchy of inputs is used to classify fair value measurements for disclosure purposes. The three-tier hierarchy of inputs is summarized in the three broad levels listed below:
| | • | Level 1—Quoted prices (unadjusted) in active markets for an identical security. |
| | | |
| | • | Level 2—Prices determined using other significant observable inputs. Observable inputs are inputs that other market participants would use in pricing a security. These may include quoted prices for similar securities, interest rates, prepayment speeds, credit risk, and others. In addition, other observable inputs such as foreign exchange rates, benchmark securities indices and foreign futures contracts may be utilized in the valuation of certain foreign securities when significant events occur between the last sale on the foreign securities exchange and the time at which the net asset value of the Fund is calculated. |
| | | |
| | • | Level 3—Prices determined using significant unobservable inputs. In situations where quoted prices or observable inputs are unavailable (for example, when there is little or no market activity for an investment), unobservable inputs may be used. Unobservable inputs reflect the Fund’s own assumptions about the factors market participants would use in pricing an investment, and are based on the best information available. |
The inputs or methodology used for valuing an investment are not necessarily an indication of the risk associated with investing in those securities.
A description of the valuation methodologies applied to the Funds’ major categories of assets and liabilities measured at fair value on a recurring basis is as follows:
Exchange-Traded Securities
Securities traded on a national securities exchange (or reported on the NASDAQ national market), including exchange-traded funds, are stated at the last reported sales price on the day of valuation. Other securities traded in the over-the-counter market and listed securities for which no sale was reported on that date are stated at the mean between the last reported bid and ask prices. To the extent these securities are actively traded and valuation adjustments are not applied, they are categorized as Level 1 of the fair value hierarchy. Securities traded on inactive markets or valued by reference to similar instruments are generally categorized as Level 2 of the fair value hierarchy.
Fixed Income Securities
Fixed income securities including corporate, convertible and municipal bonds and notes, U.S. government agency obligations, U.S. treasury obligations, sovereign issues, bank loans, convertible preferred securities, asset-backed securities, non-U.S. bonds and commercial paper are generally valued using evaluated prices provided by an independent pricing service. The evaluated prices are formed using various market inputs that the pricing service believes accurately represent the fair value of a security at a particular point in time. The pricing service determines evaluated prices for fixed income securities using inputs including, but not limited to, recent transaction prices for such securities, dealer quotes, transaction prices for other securities with similar characteristics, collateral characteristics, credit quality, payment history, liquidity and market conditions. Securities that use similar valuation techniques and observable inputs as described above are categorized as Level 2 of the fair value hierarchy.
Repurchase Agreements
Repurchase agreements are valued at cost, which approximates fair value. Repurchase agreements are categorized as Level 2 of the fair value hierarchy.
Derivative Instruments
Listed derivatives, such as certain options and futures contracts, that are actively traded are valued based on quoted prices from the exchange on which they are traded most extensively and are categorized as Level 1 of the fair value hierarchy. OTC derivative contracts include forward foreign currency contracts, swap and certain option contracts related to interest rates, foreign currencies, the credit standing of reference entities, equity prices, or commodity prices. Depending on the product and the terms of the transaction, the fair value of OTC derivative products can be modeled by independent pricing services taking into account the counterparties’ creditworthiness and using a series of techniques, including simulation models. Many pricing models do not entail material subjectivity because the methodologies employed do not necessitate significant judgments and the pricing inputs are
| June 30, 2020 | William Blair Funds | 117 |
Notes to Financial Statements (information as of June 30, 2020 is unaudited)
observed from actively quoted markets, as is the case of forward foreign currency contracts and interest rate swaps. A substantial majority of OTC derivative products valued by a Fund using pricing models fall into this category and are categorized as Level 2 of the fair value hierarchy.
As of June 30, 2020, the value of investments in securities and other financial instruments, segregated by their hierarchical input levels used in determining fair value and by security class or other financial instruments, are shown below (in thousands).
| | | | | | Large Cap | | | Mid Cap | | | Small-Mid | |
| Investments in securities | | Growth | | | Growth | | | Growth | | | Cap Core | |
| Level 1—Quoted prices | | | | | | | | | | | | | | | | |
| Common Stocks | | $ | 247,720 | | | $ | 517,783 | | | $ | 68,678 | | | $ | 197,267 | |
| Level 2—Other significant observable inputs | | | | | | | | | | | | | | | | |
| Repurchase Agreements | | | 1,884 | | | | 4,290 | | | | 1,769 | | | | 2,170 | |
| Level 3—Significant unobservable inputs | | | | | | | | | | | | | | | | |
| None | | | — | | | | — | | | | — | | | | — | |
| Total investments in securities | | $ | 249,604 | | | $ | 522,073 | | | $ | 70,447 | | | $ | 199,437 | |
| | | | | | | | | | | | | |
| | | Small-Mid | | | Small-Mid | | | Small Cap | | | Small Cap | |
| Investments in securities | | Cap Growth | | | Cap Value | | | Growth | | | Value | |
| Level 1—Quoted prices | | | | | | | | | | | | | | | | |
| Common Stocks | | $ | 2,787,231 | | | $ | 1,171 | | | $ | 503,039 | | | $ | 95,701 | |
| Level 2—Other significant observable inputs | | | | | | | | | | | | | | | | |
| Repurchase Agreements | | | 24,418 | | | | — | | | | 10,600 | | | | 2,128 | |
| Level 3—Significant unobservable inputs | | | | | | | | | | | | | | | | |
| None | | | — | | | | — | | | | — | | | | — | |
| Total investments in securities | | $ | 2,811,649 | | | $ | 1,171 | | | $ | 513,639 | | | $ | 97,829 | |
| | | | | | | | | | | | | | | | | |
| | | Global | | | International | | | International | | | Institutional
International | |
| Investments in securities | | Leaders | | | Leaders | | | Growth | | | Growth | |
| Level 1—Quoted prices | | | | | | | | | | | | | | | | |
| Common Stocks | | $ | 96,352 | | | $ | 659,128 | | | $ | 1,872,591 | | | $ | 1,546,053 | |
| Level 2—Other significant observable inputs | | | | | | | | | | | | | | | | |
| Common Stocks | | | — | | | | — | | | | 2,850 | | | | 2,342 | |
| Repurchase Agreements | | | 658 | | | | 2,863 | | | | 7,359 | | | | 4,201 | |
| Level 3—Significant unobservable inputs | | | | | | | | | | | | | | | | |
| None | | | — | | | | — | | | | — | | | | — | |
| Total investments in securities | | $ | 97,010 | | | $ | 661,991 | | | $ | 1,882,800 | | | $ | 1,552,596 | |
| | | | | | | | | | | | | | | | | |
| | | | | | | | | | | | | | | Emerging | |
| | | International | | | Emerging | | | Emerging | | | Markets | |
| | | Small Cap | | | Markets | | | Markets | | | Small Cap | |
| Investments in securities | | Growth | | | Leaders | | | Growth | | | Growth | |
| Level 1—Quoted prices | | | | | | | | | | | | | | | | |
| Common Stocks | | $ | 256,495 | | | $ | 211,933 | | | $ | 824,097 | | | $ | 252,945 | |
| Preferred Stocks | | | — | | | | — | | | | — | | | | 1,667 | |
| Level 2—Other significant observable inputs | | | | | | | | | | | | | | | | |
| Common Stocks | | | — | | | | 3,453 | | | | — | | | | 3,294 | |
| Repurchase Agreements | | | 4,786 | | | | 6,920 | | | | 5,980 | | | | 1,789 | |
| Level 3—Significant unobservable inputs | | | | | | | | | | | | | | | | |
| Common Stocks | | | — | | | | — | | | | — | | | | 2 | |
| Total investments in securities | | $ | 261,281 | | | $ | 222,306 | | | $ | 830,077 | | | $ | 259,697 | |
| 118 | Semiannual Report | June 30, 2020 |
Notes to Financial Statements (information as of June 30, 2020 is unaudited)
| | | | | | | | | Low | | | Macro | |
| Investments in securities | | Bond | | | Income | | | Duration | | | Allocation | |
| Assets | | | | | | | | | | | | | | | | |
| Level 1—Quoted prices | | | | | | | | | | | | | | | | |
| Exchange-Traded Funds | | $ | — | | | $ | — | | | $ | — | | | $ | 354,856 | |
| Level 2—Other significant observable inputs | | | | | | | | | | | | | | | | |
| Asset-Backed Securities | | | 4,066 | | | | 1,370 | | | | 9,922 | | | | — | |
| Commercial Paper | | | — | | | | 350 | | | | 4,800 | | | | — | |
| Corporate Obligations | | | 114,348 | | | | 16,352 | | | | 24,828 | | | | — | |
| Foreign Government Bonds | | | — | | | | — | | | | — | | | | 18,104 | |
| Repurchase Agreements | | | 2,159 | | | | 119 | | | | 1,111 | | | | 15,297 | |
| U.S. Government and U.S. Government Agency | | | 160,112 | | | | 34,830 | | | | 73,018 | | | | 154,905 | |
| Level 3—Significant unobservable inputs | | | | | | | | | | | | | | | | |
| None | | | — | | | | — | | | | — | | | | — | |
| Liabilities | | | | | | | | | | | | | | | | |
| Level 1—Quoted prices | | | | | | | | | | | | | | | | |
| None | | | — | | | | — | | | | — | | | | — | |
| Level 2—Other significant observable inputs | | | | | | | | | | | | | | | | |
| None | | | — | | | | — | | | | — | | | | — | |
| Level 3—Significant unobservable inputs | | | | | | | | | | | | | | | | |
| None | | | — | | | | — | | | | — | | | | — | |
| Total investments in securities | | $ | 280,685 | | | $ | 53,021 | | | $ | 113,679 | | | $ | 543,162 | |
| | | | | | | | | | | | | | | | | |
| Other financial instruments | | | | | | | | | | | | | | | | |
| | | | | | | | | | | | | | | | | |
| Assets | | | | | | | | | | | | | | | | |
| Level 1—Quoted prices | | | | | | | | | | | | | | | | |
| Futures Contracts | | $ | — | | | $ | — | | | $ | — | | | $ | 1,710 | |
| Level 2—Other significant observable inputs | | | | | | | | | | | | | | | | |
| Forward Foreign Currency Contracts | | | — | | | | — | | | | — | | | | 1,413 | |
| Swaps | | | — | | | | — | | | | — | | | | 640 | |
| Level 3—Significant unobservable inputs | | | | | | | | | | | | | | | | |
| None | | | — | | | | — | | | | — | | | | — | |
| Liabilities | | | | | | | | | | | | | | | | |
| Level 1—Quoted prices | | | | | | | | | | | | | | | | |
| Futures Contracts | | | — | | | | — | | | | — | | | | (7,063 | ) |
| Level 2—Other significant observable inputs | | | | | | | | | | | | | | | | |
| Forward Foreign Currency Contracts | | | — | | | | — | | | | — | | | | (6,117 | ) |
| Swaps | | | — | | | | — | | | | — | | | | (1,110 | ) |
| Level 3—Significant unobservable inputs | | | | | | | | | | | | | | | | |
| None | | | — | | | | — | | | | — | | | | — | |
| Total other financial instruments | | $ | — | | | $ | — | | | $ | — | | | $ | (10,527 | ) |
Level 1 Common Stocks are exchange-traded securities with a quoted price. See Portfolio of Investments for Sector Classification.
The fair value estimate for the Level 3 security in the Emerging Markets Small Cap Growth Fund was determined in good faith by the Pricing Committee, pursuant to the Valuation Procedures approved by the Board of Trustees. There were various factors considered in reaching the fair value determination, including, but not limited to, the following: the type of security, the extent of public trading of the security, information obtained for the security, and analysis of the company’s performance and market trends that influence its performance. The Level 3 security represented 0.00% as a percentage of net assets in the Emerging Markets Small Cap Growth Fund. The change in net unrealized gain (loss) related to this security held at June 30, 2020 is included within change in net unrealized appreciation (depreciation) of investments in securities in the Statement of Operations.
| June 30, 2020 | William Blair Funds | 119 |
Notes to Financial Statements (information as of June 30, 2020 is unaudited)
(4) Transactions with Affiliates
(a) Management and Expense Limitation Agreements
Each Fund has a management agreement with the Adviser for investment management, clerical, bookkeeping and administrative services. Each Fund pays the Adviser an annual management fee, which is accrued daily and paid monthly, based on a specified percentage of the Fund’s average daily net assets. Each Fund’s annual management fee rate is as follows:
| U.S. Equity Funds | | | | |
| Growth | | | 0.75 | % |
| Large Cap Growth | | | 0.60 | % |
| Mid Cap Growth | | | 0.90 | % |
| Small-Mid Cap Core | | | 0.90 | % |
| Small-Mid Cap Growth | | | 1.00 | % |
| Small-Mid Cap Value2 | | | 0.85 | % |
| Small Cap Growth | | | 1.10 | % |
| Small Cap Value3 | | | 0.95 | % |
| | | | | |
| Fixed Income Funds | | | | |
| Bond | | | 0.30 | % |
| Income1: | | | | |
| First $250 million | | | 0.25 | % |
| In excess of $250 million | | | 0.20 | % |
| Low Duration | | | 0.30 | % |
| | | | | |
| Multi-Asset and Alternative Fund | | | | |
| Macro Allocation | | | 0.80 | % |
| | | | | |
| Global Equity Fund | | | | |
| Global Leaders | | | 0.85 | % |
| International Equity Funds | | | |
| International Leaders | | | 0.85 | % |
| International Growth: | | | | |
| First $250 million | | | 1.10 | % |
| Next $2.25 billion | | | 1.00 | % |
| Next $2.5 billion | | | 0.975 | % |
| Next $5 billion | | | 0.95 | % |
| Next $5 billion | | | 0.925 | % |
| In excess of $15 billion | | | 0.90 | % |
| Institutional International Growth: | | | | |
| First $500 million | | | 1.00 | % |
| Next $500 million | | | 0.95 | % |
| Next $1.5 billion | | | 0.90 | % |
| Next $2.5 billion | | | 0.875 | % |
| Next $5 billion | | | 0.85 | % |
| Next $5 billion | | | 0.825 | % |
| In excess of $15 billion | | | 0.80 | % |
| International Small Cap Growth | | | 1.00 | % |
| Emerging Markets Leaders | | | 1.10 | % |
| Emerging Markets Growth | | | 1.10 | % |
| Emerging Markets Small Cap Growth | | | 1.10 | % |
| 1 | Management fee also includes a charge of 5% of gross income. |
| 2 | Prior to May 1, 2020, the Small-Mid Cap Value Fund paid a management fee at a rate of 0.95% of the Fund’s average daily net assets. Effective May 1, 2020, the management fee paid to the Adviser was reduced to 0.85%. |
| 3 | Prior to May 1, 2020, the Small Cap Value Fund paid a management fee at a rate of 1.10% of the Fund’s average daily net assets. Effective May 1, 2020, the management fee paid to the Adviser was reduced to 0.95%. |
| 120 | Semiannual Report | June 30, 2020 |
Notes to Financial Statements (information as of June 30, 2020 is unaudited)
The Funds have also entered into an Amended and Restated Expense Limitation Agreement with the Adviser. Under the terms of the agreement, the Adviser will waive its management fee and/or reimburse a Fund for certain operating expenses, subject to certain excluded expenses, in excess of the agreed upon rate through April 30, 2021. The amount the Adviser owes a Fund as of the reporting date is recorded as Receivable from Adviser in the Statements of Assets and Liabilities. The Adviser reimburses the Funds on a monthly basis. The Adviser will waive fees and/or reimburse expenses to the extent that the total operating expenses for the stated class of the Funds, subject to certain excluded expenses, exceed the following rates (as a percentage of average daily net assets):
| | | Class N | | Class I | | Institutional/Class R6 |
| | | Effective | | Effective | | Effective | | Effective | | Effective | | Effective |
| | | May 1, 2020 | | May 1, 2019 | | May 1, 2020 | | May 1, 2019 | | May 1, 2020 | | May 1, 2019 |
| | | through | | through | | through | | through | | through | | through |
| | | April 30, | | April 30, | | April 30, | | April 30, | | April 30, | | April 30, |
| Fund | | 2021 | | 2020 | | 2021 | | 2020 | | 2021 | | 2020 |
| Growth | | | 1.20 | % | | | 1.20 | % | | | 0.95 | % | | | 0.95 | % | | | 0.90 | % | | | 0.90 | % |
| Large Cap Growth | | | 0.90 | % | | | 0.90 | % | | | 0.65 | % | | | 0.65 | % | | | 0.60 | % | | | 0.60 | % |
| Mid Cap Growth | | | 1.20 | % | | | 1.20 | % | | | 0.95 | % | | | 0.95 | % | | | 0.90 | % | | | 0.90 | % |
| Small-Mid Cap Core | | | N/A | | | | N/A | | | | 0.95 | % | | | 0.95 | %1 | | | 0.90 | % | | | 0.90 | %1 |
| Small-Mid Cap Growth | | | 1.35 | % | | | 1.35 | % | | | 1.10 | % | | | 1.10 | % | | | 1.05 | % | | | 1.05 | % |
| Small-Mid Cap Value | | | 1.15 | % | | | 1.25 | % | | | 0.90 | % | | | 1.00 | % | | | 0.85 | % | | | 0.95 | % |
| Small Cap Growth | | | 1.50 | % | | | 1.50 | % | | | 1.25 | % | | | 1.25 | % | | | 1.20 | % | | | 1.20 | % |
| Small Cap Value | | | 1.25 | % | | | 1.50 | % | | | 1.00 | % | | | 1.25 | % | | | 0.95 | % | | | 1.20 | % |
| Global Leaders | | | 1.15 | % | | | 1.15 | % | | | 0.90 | % | | | 0.90 | % | | | 0.85 | % | | | 0.85 | % |
| International Leaders | | | 1.15 | % | | | 1.15 | % | | | 0.90 | % | | | 0.90 | % | | | 0.85 | % | | | 0.85 | % |
| International Growth | | | 1.45 | % | | | 1.45 | % | | | 1.20 | % | | | 1.20 | % | | | 1.15 | % | | | 1.15 | % |
| Institutional International Growth | | | N/A | | | | N/A | | | | N/A | | | | N/A | | | | 1.05 | % | | | 1.05 | % |
| International Small Cap Growth | | | 1.55 | % | | | 1.55 | % | | | 1.30 | % | | | 1.30 | % | | | 1.25 | % | | | 1.25 | % |
| Emerging Markets Leaders | | | 1.40 | % | | | 1.40 | % | | | 1.15 | % | | | 1.15 | % | | | 1.10 | % | | | 1.10 | % |
| Emerging Markets Growth | | | 1.60 | % | | | 1.60 | % | | | 1.35 | % | | | 1.35 | % | | | 1.30 | % | | | 1.30 | % |
| Emerging Markets Small Cap Growth | | | 1.55 | % | | | 1.55 | % | | | 1.30 | % | | | 1.30 | % | | | 1.25 | % | | | 1.25 | % |
| Bond | | | 0.60 | % | | | 0.60 | % | | | 0.45 | % | | | 0.45 | % | | | 0.40 | % | | | 0.40 | % |
| Income | | | 0.85 | % | | | 0.85 | % | | | 0.70 | % | | | 0.70 | % | | | 0.65 | % | | | 0.65 | % |
| Low Duration | | | 0.55 | % | | | 0.55 | % | | | 0.40 | % | | | 0.40 | % | | | 0.35 | % | | | 0.35 | % |
| Macro Allocation | | | 1.25 | % | | | 1.25 | % | | | 1.00 | % | | | 1.00 | % | | | 0.95 | % | | | 0.95 | % |
1 Effective October 1, 2019 (Commencement of Operations).
| June 30, 2020 | William Blair Funds | 121 |
Notes to Financial Statements (information as of June 30, 2020 is unaudited)
The fee waivers and/or expense reimbursements received by each class are reported in the Statements of Operations.
With respect to the Small-Mid Cap Core Fund, the Adviser is entitled to recoupment of previously waived fees and reimbursed expenses for a period of three years subsequent to October 1, 2019 (Commencement of Operations) to the extent that such recoupment does not cause the fund’s annual operating expenses (after the recoupment is taken into account) to exceed both (1) the expense limit in place when such amounts were waived or reimbursed and (2) the fund’s current expense limitation.
(b) Underwriting and Distribution Services Agreements
Pursuant to separate Underwriting and Distribution Agreements, WBC is the principal underwriter and distributor for the continuous offering of shares of the Trust and acts as agent of the Trust in the sale of its shares. The Underwriting Agreement provides that the Distributor will use its best efforts to distribute the Trust’s shares. The Distributor is not compensated under the Underwriting Agreement.
Each Fund, except the Small-Mid Cap Core and Institutional International Growth Funds, has a Distribution Agreement with WBC for distribution services to the Funds’ Class N shares. Each Fund pays WBC an annual fee, payable monthly, based on a specified percentage of its average daily net assets of Class N shares. The annual rate expressed as a percentage of average daily net assets for Class N is 0.25% for all Funds except the Bond, Income and Low Duration Funds, which is 0.15%. Pursuant to the Distribution Agreement, WBC enters into related selling group agreements with various firms at various rates for sales of the Funds’ Class N shares.
(5) Investment Transactions
Investment transactions, excluding U.S. government securities and short-term securities, for the period ended June 30, 2020, were as follows (in thousands):
| Fund | | Purchases | | | Sales | |
| Growth | | $ | 60,965 | | | $ | 84,213 | |
| Large Cap Growth | | | 253,800 | | | | 81,944 | |
| Mid Cap Growth | | | 17,779 | | | | 20,068 | |
| Small-Mid Cap Core | | | 299,866 | | | | 83,633 | |
| Small-Mid Cap Growth | | | 847,718 | | | | 911,534 | |
| Small-Mid Cap Value | | | 6,846 | | | | 9,663 | |
| Small Cap Growth | | | 201,878 | | | | 321,735 | |
| Small Cap Value | | | 52,891 | | | | 77,946 | |
| Global Leaders | | | 27,737 | | | | 85,686 | |
| International Leaders | | | 157,328 | | | | 119,958 | |
| International Growth | | | 375,739 | | | | 571,347 | |
| Institutional International Growth | | | 376,648 | | | | 652,062 | |
| International Small Cap Growth | | | 89,660 | | | | 127,185 | |
| Emerging Markets Leaders | | | 49,149 | | | | 55,036 | |
| Emerging Markets Growth | | | 349,450 | | | | 340,919 | |
| Emerging Markets Small Cap Growth | | | 176,416 | | | | 193,372 | |
| Bond | | | 131,044 | | | | 126,324 | |
| Income | | | 19,690 | | | | 22,724 | |
| Low Duration | | | 71,412 | | | | 64,020 | |
| Macro Allocation | | | 72,110 | | | | 189,249 | |
Investment transactions in U.S. government securities, excluding short-term securities, for the period ended June 30, 2020, were as follows (in thousands):
| Fund | | Purchases | | | Sales | |
| Bond | | $ | 5,834 | | | $ | 5,424 | |
| Income | | | 1,719 | | | | — | |
| Low Duration | | | 3,900 | | | | — | |
| Macro Allocation | | | — | | | | — | |
| 122 | Semiannual Report | June 30, 2020 |
Notes to Financial Statements (information as of June 30, 2020 is unaudited)
(6) Financial Derivative Instruments
Each Fund may use derivative instruments to maintain liquidity, to provide hedging, or in anticipation of changes in the composition of its portfolio holdings or as otherwise provided in each Fund’s prospectus. Macro Allocation Fund may also use derivative instruments to obtain investment exposures. The derivative instruments held as of June 30, 2020, as disclosed in each Fund’s Portfolios of Investments, are representative of each Fund’s derivative instrument trading activity during the period ended June 30, 2020.
Derivative transactions carry counterparty risk as they are based on contracts between a Fund and the applicable counterparty. For exchange-traded or cleared derivative contracts, such counterparty risk is limited due to the role of the exchange or clearinghouse. OTC derivative contracts, however, are exposed to counterparty risk in the amount of unrealized gains, net of collateral held, for the duration of the contract.
Macro Allocation Fund is subject to certain netting arrangements through International Swaps and Derivatives Association, Inc. Master Agreements and Credit Support Annexes (“ISDAs”). The ISDAs maintain provisions for general obligations, representations, agreements, collateral and events of default or termination. The ISDAs cover certain OTC derivative securities entered into by Macro Allocation Fund with various counterparties and allow Macro Allocation Fund to close out and net its total exposure to a counterparty in the event of a default.
Futures Contracts
A futures contract provides for the future sale by one party and purchase by another party of a specified amount of a specific financial instrument for a specified price at a designated date, time and place. An index futures contract is an agreement pursuant to which the parties agree to take or make delivery of an amount of cash equal to the difference between the value of the index at the close of the last trading day of the contract and the price at which the index futures contract was originally written. A futures contract can be closed out prior to delivery by entering into an offsetting transaction in a matching futures contract. Although the value of an index might be a function of the value of certain specified securities, no physical delivery of those securities is made. If the offsetting purchase price is less than the original sale price, a Fund realizes a gain; if it is more, a Fund realizes a loss. Conversely, if the offsetting sale price is more than the original purchase price, a Fund realizes a gain; if it is less, a Fund realizes a loss. The transaction costs must also be included in these calculations. There can be no assurance, however, that a Fund will be able to enter into an offsetting transaction with respect to a particular futures contract at a particular time. If a Fund is not able to enter into an offsetting transaction, a Fund will continue to be required to maintain the margin deposits on the futures contract.
Upon entering into a futures contract, a Fund is required to pledge to the broker an amount of cash, U.S. government securities, or other liquid assets equal to a certain percentage of the contract amount (“initial margin deposit”). Futures contracts are marked to market daily and an appropriate payable or receivable for the change in value (“variation margin”) is recorded by a Fund and a cash payment is either made to or received from the broker each day. Gains or losses on futures contracts are recognized but not considered realized until the contracts expire or are closed and are included in the Statement of Operations.
Options
The purchase or sale of an option by a Fund involves the payment or receipt of a premium by the investor and the corresponding right or obligation, as the case may be, either to purchase or sell the underlying security, commodity, or other instrument for a specific price at a certain time or during a certain period. Purchasing options involves the risk that the underlying instrument will not change price in the manner expected, so the investor loses its premium. Writing options involves potentially greater risk because the investor is exposed to the extent of the actual price movement in the underlying security rather than only the amount of the premium paid (which could result in a potentially unlimited loss). OTC options also involve counterparty credit risk. Purchased options are shown as an asset in the Statement of Assets and Liabilities and are included in Investments in securities. Premiums received for written options are shown as a liability in the Statement of Assets and Liabilities. Realized gains and losses on the sale, expiration or assignment of an option are disclosed in the Statement of Operations.
Forward Foreign Currency Contracts
The Global Equity, International Equity and Multi-Asset and Alternative Funds may enter into forward foreign currency contracts. When entering into a forward foreign currency contract, a Fund agrees to receive or deliver a fixed quantity of foreign currency for an agreed-upon price on an agreed future date. A Fund’s net equity therein, representing unrealized gain or loss on the
| June 30, 2020 | William Blair Funds | 123 |
Notes to Financial Statements (information as of June 30, 2020 is unaudited)
contracts as measured by the difference between the forward foreign exchange rates at the dates of entry into the contracts and the forward rates at the reporting date, is included in the Statement of Assets and Liabilities as unrealized appreciation/depreciation on forward foreign currency contracts. Realized and unrealized gains and losses are included in the Statement of Operations. These instruments may involve market risk, credit risk, or both kinds of risks in excess of the amount recognized in the Statement of Assets and Liabilities. Risks arise from the possible inability of counterparties to meet the terms of their contracts and from the price movements in currencies.
Swap Contracts
Swap agreements may include total return, interest rate, securities index, commodity, security, currency exchange rate, credit default index, volatility and variance swaps. Cleared swaps are transacted through futures commission merchants that are members of central clearing houses with the clearing house serving as a central counterparty similar to transactions in futures contracts. In a standard “swap” transaction, two parties agree to exchange the returns (or differentials in rates of return) earned or realized on particular predetermined investments or instruments. The gross returns to be exchanged or “swapped” between the parties are calculated with respect to a “notional amount” (i.e., the change in the value of a particular dollar amount invested, for example, at a particular interest rate, in a particular foreign currency, or in a “basket” of securities representing a particular index). Swap agreements are subject to the risk that the counterparty to the swap will default on its obligation to pay a Fund and the risk that a Fund will not be able to meet its obligations to pay the counterparty to the swap. Swap agreements may also involve fees, commissions or other costs that may reduce a Fund’s gains from a swap agreement or may cause a Fund to lose money. To the extent permitted by its investment policies and restrictions, a Fund may invest in the following types of swaps:
Credit Default Swaps—A Fund may invest in credit default swaps as a means of “buying” credit protection (i.e., attempting to mitigate the risk of default or credit quality deterioration in some portion of a Fund’s holdings) or “selling” credit protection (i.e., attempting to gain exposure to an underlying issuer’s credit quality characteristics without directly investing in that issuer). A credit default swap is a contract between a buyer and a seller of protection against a pre-defined credit event (e.g., a ratings downgrade or default) on an underlying reference obligation, which may be a single debt instrument or baskets or indices of securities. A Fund may be a buyer or seller of a credit default swap. As a seller of protection on credit default swap agreements, a Fund will generally receive from the buyer of protection a fixed rate of income throughout the term of the swap provided that there is no credit event. A Fund adds leverage to its portfolio because the Fund is subject to investment exposure on the notional amount of the swap. The maximum potential amount of future payments that a Fund as a seller of protection could be required to make under a credit default swap agreement equals the notional amount of the agreement. Notional amounts of each individual credit default swap agreement outstanding as of the period end for which a Fund is the seller of protection are disclosed in the Fund’s Portfolio of Investments. These potential amounts would be partially offset by any recovery values of the respective referenced obligations, upfront payments received upon entering into the agreement, or net amounts received from the settlement of buy protection credit default swap agreements entered into by the same Fund for the same referenced entity or entities. For credit default swap contracts on credit indices, the quoted market prices and resulting values serve as an indicator of the payment performance risk. Increasing market values, in absolute terms when compared to the notional amount of the swap, typically represent deterioration of the referenced entities’ credit soundness and a greater likelihood or risk of default or other credit event occurring as defined under the terms of the swap.
Interest Rate Swap—A Fund may invest in interest rate swaps to gain or mitigate exposure to changes in interest rates. Interest rate swap agreements involve a commitment between parties to pay either a fixed interest rate or a floating interest rate based on a notional amount of principal. The parties make payments at predetermined intervals throughout the life of the swap. As a payer, a Fund would make the fixed payment and receive the floating payment. As a receiver, a Fund would make the floating payment and receive the fixed payment.
Total Return Swap—A Fund may invest in total return swaps to gain or mitigate exposure to an underlying security, or securities. Total return swap agreements may involve commitments to pay interest in exchange for the return on the underlying security, or securities. At maturity, a net cash flow is exchanged between the parties based on the total return of the underlying security, or securities, less a financing rate. As a receiver in the transaction, a Fund would receive a payment for a positive return and would make a payment for a negative return. As a payer in the transaction, a Fund would make a payment for a positive return and would receive a payment for a negative return.
Variance Swap—A Fund may invest in variance swaps in order to gain or mitigate its exposure to an underlying reference entity such as a broad based index. A variance swap is an agreement between two parties to exchange cash flows based on the measured
| 124 | Semiannual Report | June 30, 2020 |
Notes to Financial Statements (information as of June 30, 2020 is unaudited)
variance of a reference entity. The payer agrees to exchange the fixed rate, which is the variance strike price of the reference entity, to the receiver for the floating rate, which is the realized variance price of the reference entity. At the time the trade is originated, the agreed upon variance strike price is generally set so that the fair value of the swap is near zero. At maturity, a net cash flow is exchanged between the parties based on the difference between the final realized variance price of the swap and the variance strike price multiplied by the notional, or vega amount. As a receiver of the floating rate, a Fund would receive a payment if the final realized variance price is greater than the variance strike price and would make a payment if the final realized variance price is less than the variance strike price. As a payer of the floating rate, a Fund would receive a payment if the final realized variance price is less than the variance strike price and would make a payment if the final realized variance price is greater than the variance strike price.
The following table presents the value of financial derivative instruments, by Fund and primary risk exposure, as of June 30, 2020, and their respective location in the Statements of Assets and Liabilities (in thousands):
| | | Assets | | | Liabilities | |
Fund and
Primary Risk Exposure | | Statements of Assets
and Liabilities | | Value | | | Statements of Assets
and Liabilities | | Value | |
| Macro Allocation | | | | | | | | | | | | |
| Credit | | Receivable for variation margin on centrally cleared swaps(1) | | | 142 | | | Payable for variation margin on centrally cleared swaps(1) | | | — | |
| Currency | | Unrealized appreciation on forward currency contracts | | | 1,413 | | | Unrealized depreciation on forward currency contracts | | | 6,117 | |
| Equity | | Receivable for variation margin on futures(1) | | | 1,710 | | | Payable for variation margin on futures(1) | | | 6,555 | |
| Equity | | Unrealized appreciation on swap contracts | | | 267 | | | Unrealized depreciation on swap contracts | | | 628 | |
| Interest rate | | Unrealized appreciation on swap contracts | | | 231 | | | Unrealized depreciation on swap contracts | | | 29 | |
| Interest rate | | Receivable for variation margin on futures(1) | | | — | | | Payable for variation margin on futures(1) | | | 508 | |
| Interest rate | | Receivable for variation margin on centrally cleared swaps(1) | | | — | | | Payable for variation margin on centrally cleared swaps(1) | | | 453 | |
| (1) | The table above includes cumulative appreciation/(depreciation) on futures contracts and centrally cleared swaps as reported in the applicable Fund’s Portfolio of Investments. Receivable/payable for variation margin on futures contracts and centrally cleared swaps as reported in the applicable Fund’s Statement of Assets and Liabilities represents the current day’s variation margin. |
| June 30, 2020 | William Blair Funds | 125 |
Notes to Financial Statements (information as of June 30, 2020 is unaudited)
The following table indicates the effect of derivatives, by Fund and primary risk exposure, in the Statements of Operations for the period ended June 30, 2020 (in thousands):
| | | Realized Gain (Loss) | | | Change in Net Unrealized
Appreciation (Depreciation) | |
Fund and
Primary Risk Exposure | | Statements of Operations | | Value | | | Statements of Operations | | Value | |
| Small-Mid Cap Core | | | | | | | | | | | | |
| Equity | | Futures contracts | | $ | 45 | | | Futures contracts | | $ | — | |
| Bond | | | | | | | | | | | | |
| Credit | | Swaps | | | 405 | | | Swaps | | | 626 | |
| Income | | | | | | | | | | | | |
| Credit | | Swaps | | | (34 | ) | | Swaps | | | — | |
| Low Duration | | | | | | | | | | | | |
| Credit | | Swaps | | | (56 | ) | | Swaps | | | — | |
| Macro Allocation | | | �� | | | | | | | | | |
| Credit | | Swaps | | | (175 | ) | | Swaps | | | 32 | |
| Currency | | Forward foreign currency contracts | | | (9,183 | ) | | Forward foreign currency contracts | | | (1,892 | ) |
| Equity | | Futures contracts | | | 5,648 | | | Futures contracts | | | (657 | ) |
| Equity | | Options | | | (6,041 | ) | | Options | | | — | |
| Equity | | Swaps | | | 1,246 | | | Swaps | | | (1,409 | ) |
| Interest rate | | Futures contracts | | | 3,670 | | | Futures contracts | | | 284 | |
| Interest rate | | Swaps | | | 4,040 | | | Swaps | | | (104 | ) |
The following table is a summary by counterparty of the derivative instruments and collateral pledged/(received) included in the Macro Allocation Fund’s Statement of Assets and Liabilities at June 30, 2020 (in thousands):
| | | Financial Derivative Assets | | Financial Derivative Liabilities | | | | | | |
| Counterparty | | Forward
Foreign
Currency
Contracts | | Swaps | | Total | | Forward
Foreign
Currency
Contracts | | Swaps | | Total | | Net
Market
Value | | Collateral
Pledged
(Received) | | Net
Exposure |
| Citibank N.A. | | $ | 1,413 | | | $ | — | | | $ | 1,413 | | | $ | (6,117 | ) | | $ | (83 | ) | | $ | (6,200 | ) | | $ | (4,787 | ) | | $ | 4,765 | | | $ | (22 | ) |
| Credit Suisse | | | — | | | | 498 | | | | 498 | | | | — | | | | (574 | ) | | | (574 | ) | | | (76 | ) | | | 76 | | | | — | |
| | | $ | 1,413 | | | $ | 498 | | | $ | 1,911 | | | $ | (6,117 | ) | | $ | (657 | ) | | $ | (6,774 | ) | | | | | | | | | | | | |
The net exposure represents the amount due from/(due to) the counterparty in the event of default. Any net exposure is generally due to changes in market value of the underlying derivative instruments on the last day of the period as timing of collateral movement occurs the following day. For Credit Suisse, the table does not include collateral pledged in the amount of $2,590 (in thousands) that is necessary to cover initial margin requirements on OTC swap contracts.
| 126 | Semiannual Report | June 30, 2020 |
Notes to Financial Statements (information as of June 30, 2020 is unaudited)
(7) Fund Share Transactions
The following tables summarize the activity in capital shares of each Fund for the period ended June 30, 2020 (in thousands):
| | | | | | | | | | | | | | | | | | | | | | | | Class N |
| | | | | | | | | | | | Dollars | | | | | | | | | | | | Shares |
| Fund | | Sales | | | Reinvest | | | Redemptions | | | Total | | | Sales | | | Reinvest | | | Redemptions | | | Total |
| Growth | | $ | 872 | | | $ | — | | | $ | 4,529 | | | $ | (3,657 | ) | | | 95 | | | | — | | | | 499 | | | | (404 | ) |
| Large Cap Growth | | | 80,476 | | | | — | | | | 26,094 | | | | 54,382 | | | | 5,309 | | | | — | | | | 1,751 | | | | 3,558 | |
| Mid Cap Growth | | | 332 | | | | — | | | | 733 | | | | (401 | ) | | | 38 | | | | — | | | | 73 | | | | (35 | ) |
| Small-Mid Cap Growth | | | 33,030 | | | | — | | | | 89,626 | | | | (56,596 | ) | | | 1,433 | | | | — | | | | 3,894 | | | | (2,461 | ) |
| Small-Mid Cap Value | | | 34 | | | | — | | | | 120 | | | | (86 | ) | | | 5 | | | | — | | | | 14 | | | | (9 | ) |
| Small Cap Growth | | | 20,100 | | | | — | | | | 49,558 | | | | (29,458 | ) | | | 840 | | | | — | | | | 2,088 | | | | (1,248 | ) |
| Small Cap Value | | | 788 | | | | 2,060 | | | | 3,241 | | | | (393 | ) | | | 75 | | | | 172 | | | | 287 | | | | (40 | ) |
| Global Leaders | | | 384 | | | | — | | | | 586 | | | | (202 | ) | | | 27 | | | | — | | | | 43 | | | | (16 | ) |
| International Leaders | | | 2,513 | | | | — | | | | 5,224 | | | | (2,711 | ) | | | 142 | | | | — | | | | 305 | | | | (163 | ) |
| International Growth | | | 29,264 | | | | — | | | | 250,059 | | | | (220,795 | ) | | | 1,248 | | | | — | | | | 10,100 | | | | (8,852 | ) |
| International Small Cap Growth | | | 139 | | | | — | | | | 923 | | | | (784 | ) | | | 9 | | | | — | | | | 85 | | | | (76 | ) |
| Emerging Markets Leaders | | | 2,603 | | | | — | | | | 2,955 | | | | (352 | ) | | | 273 | | | | — | | | | 311 | | | | (38 | ) |
| Emerging Markets Growth | | | 1,348 | | | | — | | | | 1,395 | | | | (47 | ) | | | 113 | | | | — | | | | 122 | | | | (9 | ) |
| Emerging Markets Small Cap Growth | | | 45 | | | | — | | | | 654 | | | | (609 | ) | | | 2 | | | | — | | | | 47 | | | | (45 | ) |
| Bond | | | 6,106 | | | | 566 | | | | 8,777 | | | | (2,105 | ) | | | 586 | | | | 54 | | | | 859 | | | | (219 | ) |
| Income | | | 4,347 | | | | 307 | | | | 3,427 | | | | 1,227 | | | | 505 | | | | 36 | | | | 398 | | | | 143 | |
| Low Duration | | | 6,270 | | | | 36 | | | | 631 | | | | 5,675 | | | | 721 | | | | 4 | | | | 72 | | | | 653 | |
| Macro Allocation | | | 452 | | | | — | | | | 4,815 | | | | (4,363 | ) | | | 40 | | | | — | | | | 439 | | | | (399 | ) |
| | | | | | | | | | | | | | | | | | | | | | | | |
| | | | | | | | | | | | | | | | | | | | | | | | Class I |
| | | | | | | | | | | | Dollars | | | | | | | | | | | | Shares |
| Fund | | Sales | | | Reinvest | | | Redemptions | | | Total | | | Sales | | | Reinvest | | | Redemptions | | | Total |
| Growth | | $ | 7,796 | | | $ | — | | | $ | 27,121 | | | $ | (19,325 | ) | | | 716 | | | | — | | | | 2,427 | | | | (1,711 | ) |
| Large Cap Growth | | | 146,890 | | | | — | | | | 30,251 | | | | 116,639 | | | | 9,030 | | | | — | | | | 1,913 | | | | 7,117 | |
| Mid Cap Growth | | | 6,160 | | | | — | | | | 7,428 | | | | (1,268 | ) | | | 555 | | | | — | | | | 668 | | | | (113 | ) |
| Small-Mid Cap Core | | | 263,449 | | | | — | | | | 46,248 | | | | 217,201 | | | | 24,720 | | | | — | | | | 4,590 | | | | 20,130 | |
| Small-Mid Cap Growth | | | 353,299 | | | | — | | | | 417,873 | | | | (64,574 | ) | | | 13,865 | | | | — | | | | 17,088 | | | | (3,223 | ) |
| Small-Mid Cap Value | | | 3,013 | | | | — | | | | 5,985 | | | | (2,972 | ) | | | 291 | | | | — | | | | 828 | | | | (537 | ) |
| Small Cap Growth | | | 30,327 | | | | — | | | | 117,026 | | | | (86,699 | ) | | | 1,112 | | | | — | | | | 4,409 | | | | (3,297 | ) |
| Small Cap Value | | | 9,850 | | | | 25,167 | | | | 37,316 | | | | (2,299 | ) | | | 851 | | | | 2,013 | | | | 3,375 | | | | (511 | ) |
| Global Leaders | | | 7,698 | | | | — | | | | 37,865 | | | | (30,167 | ) | | | 606 | | | | — | | | | 2,595 | | | | (1,989 | ) |
| International Leaders | | | 44,397 | | | | — | | | | 36,738 | | | | 7,659 | | | | 2,699 | | | | — | | | | 2,246 | | | | 453 | |
| International Growth | | | 237,171 | | | | — | | | | 227,590 | | | | 9,581 | | | | 9,408 | | | | — | | | | 8,322 | | | | 1,086 | |
| International Small Cap Growth | | | 11,033 | | | | — | | | | 20,625 | | | | (9,592 | ) | | | 899 | | | | — | | | | 1,775 | | | | (876 | ) |
| Emerging Markets Leaders | | | 7,977 | | | | — | | | | 7,217 | | | | 760 | | | | 815 | | | | — | | | | 801 | | | | 14 | |
| Emerging Markets Growth | | | 6,439 | | | | — | | | | 6,810 | | | | (371 | ) | | | 521 | | | | — | | | | 561 | | | | (40 | ) |
| Emerging Markets Small Cap Growth | | | 11,520 | | | | — | | | | 30,534 | | | | (19,014 | ) | | | 751 | | | | — | | | | 2,026 | | | | (1,275 | ) |
| Bond | | | 26,138 | | | | 3,054 | | | | 40,308 | | | | (11,116 | ) | | | 2,522 | | | | 294 | | | | 3,910 | | | | (1,094 | ) |
| Income | | | 4,066 | | | | 473 | | | | 4,975 | | | | (436 | ) | | | 475 | | | | 55 | | | | 582 | | | | (52 | ) |
| Low Duration | | | 27,603 | | | | 650 | | | | 2,877 | | | | 25,376 | | | | 3,175 | | | | 75 | | | | 332 | | | | 2,918 | |
| Macro Allocation | | | 32,429 | | | | — | | | | 120,741 | | | | (88,312 | ) | | | 2,953 | | | | — | | | | 11,075 | | | | (8,122 | ) |
| June 30, 2020 | William Blair Funds | 127 |
Notes to Financial Statements (information as of June 30, 2020 is unaudited)
| | Institutional/Class R6 |
| | | | | | | | | | | | Dollars | | | | | | | | | | | | Shares |
| Fund | | Sales | | | Reinvest | | | Redemptions | | | Total | | | Sales | | | Reinvest | | | Redemptions | | | Total |
| Growth | | $ | 536 | | | $ | — | | | $ | — | | | $ | 536 | | | | 50 | | | | — | | | | — | | | | 50 | |
| Large Cap Growth | | | 791 | | | | — | | | | 30 | | | | 761 | | | | 48 | | | | — | | | | 2 | | | | 46 | |
| Mid Cap Growth | | | 23 | | | | — | | | | — | | | | 23 | | | | 2 | | | | — | | | | — | | | | 2 | |
| Small-Mid Cap Core | | | 670 | | | | — | | | | 39 | | | | 631 | | | | 75 | | | | — | | | | 5 | | | | 70 | |
| Small-Mid Cap Growth | | | 34,051 | | | | — | | | | 1,645 | | | | 32,406 | | | | 1,285 | | | | — | | | | 67 | | | | 1,218 | |
| Small-Mid Cap Value | | | 117 | | | | — | | | | — | | | | 117 | | | | 12 | | | | — | | | | — | | | | 12 | |
| Small Cap Growth | | | 6,121 | | | | — | | | | 5,855 | | | | 266 | | | | 209 | | | | — | | | | 210 | | | | (1 | ) |
| Small Cap Value | | | 133 | | | | 101 | | | | 15 | | | | 219 | | | | 10 | | | | 8 | | | | 2 | | | | 16 | |
| Global Leaders | | | 2,458 | | | | — | | | | 50,699 | | | | (48,241 | ) | | | 190 | | | | — | | | | 3,335 | | | | (3,145 | ) |
| International Leaders | | | 43,249 | | | | — | | | | 30,304 | | | | 12,945 | | | | 2,554 | | | | — | | | | 1,949 | | | | 605 | |
| International Growth | | | 1,984 | | | | — | | | | 6,069 | | | | (4,085 | ) | | | 69 | | | | — | | | | 239 | | | | (170 | ) |
| Institutional International Growth | | | 101,823 | | | | — | | | | 447,714 | | | | (345,891 | ) | | | 6,520 | | | | — | | | | 27,169 | | | | (20,649 | ) |
| International Small Cap Growth | | | 907 | | | | — | | | | 26,669 | | | | (25,762 | ) | | | 76 | | | | — | | | | 1,900 | | | | (1,824 | ) |
| Emerging Markets Leaders | | | 12,777 | | | | — | | | | 16,785 | | | | (4,008 | ) | | | 1,337 | | | | — | | | | 1,758 | | | | (421 | ) |
| Emerging Markets Growth | | | 76,597 | | | | — | | | | 74,827 | | | | 1,770 | | | | 6,461 | | | | — | | | | 5,659 | | | | 802 | |
| Emerging Markets Small Cap Growth | | | 40,606 | | | | — | | | | 37,843 | | | | 2,763 | | | | 2,562 | | | | — | | | | 2,428 | | | | 134 | |
| Bond | | | 1,997 | | | | 857 | | | | 1,614 | | | | 1,240 | | | | 193 | | | | 82 | | | | 156 | | | | 119 | |
| Income | | | 16 | | | | 1 | | | | — | | | | 17 | | | | 2 | | | | — | | | | — | | | | 2 | |
| Low Duration | | | 6,579 | | | | 329 | | | | 3,246 | | | | 3,662 | | | | 757 | | | | 38 | | | | 373 | | | | 422 | |
| Macro Allocation | | | 25,344 | | | | — | | | | 88,443 | | | | (63,099 | ) | | | 2,259 | | | | — | | | | 8,165 | | | | (5,906 | ) |
| | | | | |
| | | | | Net Change in Net Assets Relating to Fund Share Activity |
| | | | | | | | | | | | Dollars | | | | | | | | | | | | Shares |
| Fund | | Sales | | | Reinvest | | | Redemptions | | | Total | | | Sales | | | Reinvest | | | Redemptions | | | Total |
| Growth | | $ | 9,204 | | | $ | — | | | $ | 31,650 | | | $ | (22,446 | ) | | | 861 | | | | — | | | | 2,926 | | | | (2,065 | ) |
| Large Cap Growth | | | 228,157 | | | | — | | | | 56,375 | | | | 171,782 | | | | 14,387 | | | | — | | | | 3,666 | | | | 10,721 | |
| Mid Cap Growth | | | 6,515 | | | | — | | | | 8,161 | | | | (1,646 | ) | | | 595 | | | | — | | | | 741 | | | | (146 | ) |
| Small-Mid Cap Core | | | 264,119 | | | | — | | | | 46,287 | | | | 217,832 | | | | 24,795 | | | | — | | | | 4,595 | | | | 20,200 | |
| Small-Mid Cap Growth | | | 420,380 | | | | — | | | | 509,144 | | | | (88,764 | ) | | | 16,583 | | | | — | | | | 21,049 | | | | (4,466 | ) |
| Small-Mid Cap Value | | | 3,164 | | | | — | | | | 6,105 | | | | (2,941 | ) | | | 308 | | | | — | | | | 842 | | | | (534 | ) |
| Small Cap Growth | | | 56,548 | | | | — | | | | 172,439 | | | | (115,891 | ) | | | 2,161 | | | | — | | | | 6,707 | | | | (4,546 | ) |
| Small Cap Value | | | 10,771 | | | | 27,328 | | | | 40,572 | | | | (2,473 | ) | | | 936 | | | | 2,193 | | | | 3,664 | | | | (535 | ) |
| Global Leaders | | | 10,540 | | | | — | | | | 89,150 | | | | (78,610 | ) | | | 823 | | | | — | | | | 5,973 | | | | (5,150 | ) |
| International Leaders | | | 90,159 | | | | — | | | | 72,266 | | | | 17,893 | | | | 5,395 | | | | — | | | | 4,500 | | | | 895 | |
| International Growth | | | 268,419 | | | | — | | | | 483,718 | | | | (215,299 | ) | | | 10,725 | | | | — | | | | 18,661 | | | | (7,936 | ) |
| Institutional International Growth | | | 101,823 | | | | — | | | | 447,714 | | | | (345,891 | ) | | | 6,520 | | | | — | | | | 27,169 | | | | (20,649 | ) |
| International Small Cap Growth | | | 12,079 | | | | — | | | | 48,217 | | | | (36,138 | ) | | | 984 | | | | — | | | | 3,760 | | | | (2,776 | ) |
| Emerging Markets Leaders | | | 23,357 | | | | — | | | | 26,957 | | | | (3,600 | ) | | | 2,425 | | | | — | | | | 2,870 | | | | (445 | ) |
| Emerging Markets Growth | | | 84,384 | | | | — | | | | 83,032 | | | | 1,352 | | | | 7,095 | | | | — | | | | 6,342 | | | | 753 | |
| Emerging Markets Small Cap Growth | | | 52,171 | | | | — | | | | 69,031 | | | | (16,860 | ) | | | 3,315 | | | | — | | | | 4,501 | | | | (1,186 | ) |
| Bond | | | 34,241 | | | | 4,477 | | | | 50,699 | | | | (11,981 | ) | | | 3,301 | | | | 430 | | | | 4,925 | | | | (1,194 | ) |
| Income | | | 8,429 | | | | 781 | | | | 8,402 | | | | 808 | | | | 982 | | | | 91 | | | | 980 | | | | 93 | |
| Low Duration | | | 40,452 | | | | 1,015 | | | | 6,754 | | | | 34,713 | | | | 4,653 | | | | 117 | | | | 777 | | | | 3,993 | |
| Macro Allocation | | | 58,225 | | | | — | | | | 213,999 | | | | (155,774 | ) | | | 5,252 | | | | — | | | | 19,679 | | | | (14,427 | ) |
| 128 | Semiannual Report | June 30, 2020 |
Notes to Financial Statements (information as of June 30, 2020 is unaudited)
The following tables summarize the activity in capital shares of each Fund for the year ended December 31, 2019 (in thousands):
| | | | | | | | | | | | | | | | | | | | | | | | Class N |
| | | | | | | | | | | | Dollars | | | | | | | | | | | | Shares |
| Fund | | Sales | | | Reinvest | | | Redemptions | | | Total | | | Sales | | | Reinvest | | | Redemptions | | | Total |
| Growth | | $ | 4,699 | | | $ | 3,142 | | | $ | 21,051 | | | $ | (13,210 | ) | | | 512 | | | | 339 | | | | 2,242 | | | | (1,391 | ) |
| Large Cap Growth | | | 33,843 | | | | 3,913 | | | | 25,920 | | | | 11,836 | | | | 2,320 | | | | 263 | | | | 1,756 | | | | 827 | |
| Mid Cap Growth | | | 476 | | | | 431 | | | | 1,578 | | | | (671 | ) | | | 43 | | | | 40 | | | | 143 | | | | (60 | ) |
| Small-Mid Cap Growth | | | 74,019 | | | | 23,898 | | | | 268,742 | | | | (170,825 | ) | | | 2,970 | | | | 946 | | | | 11,034 | | | | (7,118 | ) |
| Small-Mid Cap Value | | | 102 | | | | 6 | | | | 76 | | | | 32 | | | | 10 | | | | — | | | | 7 | | | | 3 | |
| Small Cap Growth | | | 57,125 | | | | 4,113 | | | | 83,288 | | | | (22,050 | ) | | | 2,151 | | | | 150 | | | | 3,066 | | | | (765 | ) |
| Small Cap Value | | | 2,377 | | | | 495 | | | | 9,131 | | | | (6,259 | ) | | | 138 | | | | 29 | | | | 531 | | | | (364 | ) |
| Global Leaders | | | 953 | | | | 98 | | | | 1,463 | | | | (412 | ) | | | 72 | | | | 7 | | | | 112 | | | | (33 | ) |
| International Leaders | | | 2,342 | | | | 37 | | | | 2,610 | | | | (231 | ) | | | 145 | | | | 2 | | | | 161 | | | | (14 | ) |
| International Growth | | | 44,662 | | | | 5,263 | | | | 133,868 | | | | (83,943 | ) | | | 1,723 | | | | 183 | | | | 5,050 | | | | (3,144 | ) |
| International Small Cap Growth | | | 76 | | | | 3 | | | | 908 | | | | (829 | ) | | | 7 | | | | — | | | | 75 | | | | (68 | ) |
| Emerging Markets Leaders | | | 3,645 | | | | 11 | | | | 4,555 | | | | (899 | ) | | | 388 | | | | 1 | | | | 483 | | | | (94 | ) |
| Emerging Markets Growth | | | 1,739 | | | | 300 | | | | 2,909 | | | | (870 | ) | | | 142 | | | | 23 | | | | 231 | | | | (66 | ) |
| Emerging Markets Small Cap Growth | | | 561 | | | | — | | | | 6,536 | | | | (5,975 | ) | | | 37 | | | | — | | | | 440 | | | | (403 | ) |
| Bond | | | 13,853 | | | | 2,166 | | | | 58,587 | | | | (42,568 | ) | | | 1,355 | | | | 212 | | | | 5,682 | | | | (4,115 | ) |
| Income | | | 2,090 | | | | 686 | | | | 6,085 | | | | (3,309 | ) | | | 245 | | | | 80 | | | | 714 | | | | (389 | ) |
| Low Duration | | | 613 | | | | 53 | | | | 809 | | | | (143 | ) | | | 70 | | | | 6 | | | | 93 | | | | (17 | ) |
| Macro Allocation | | | 6,932 | | | | 489 | | | | 37,706 | | | | (30,285 | ) | | | 607 | | | | 43 | | | | 3,261 | | | | (2,611 | ) |
| | | | | | | | | | | | | | | | | | | | | | | | |
| | | | | | | | | | | | | | | | | | | | | | | | Class I |
| | | | | | | | | | | | Dollars | | | | | | | | | | | | Shares |
| Fund | | Sales | | | Reinvest | | | Redemptions | | | Total | | | Sales | | | Reinvest | | | Redemptions | | | Total |
| Growth | | $ | 16,720 | | | $ | 17,115 | | | $ | 41,128 | | | $ | (7,293 | ) | | | 1,519 | | | | 1,552 | | | | 3,712 | | | | (641 | ) |
| Large Cap Growth | | | 87,517 | | | | 9,125 | | | | 36,804 | | | | 59,838 | | | | 5,611 | | | | 578 | | | | 2,424 | | | | 3,765 | |
| Mid Cap Growth | | | 9,653 | | | | 5,374 | | | | 11,067 | | | | 3,960 | | | | 818 | | | | 460 | | | | 945 | | | | 333 | |
| Small-Mid Cap Core (a) | | | 1,600 | | | | 1 | | | | 1 | | | | 1,600 | | | | 155 | | | | — | | | | — | | | | 155 | |
| Small-Mid Cap Growth | | | 722,356 | | | | 166,901 | | | | 775,495 | | | | 113,762 | | | | 27,182 | | | | 6,225 | | | | 29,057 | | | | 4,350 | |
| Small-Mid Cap Value | | | 6,397 | | | | 130 | | | | 1,342 | | | | 5,185 | | | | 589 | | | | 12 | | | | 125 | | | | 476 | |
| Small Cap Growth | | | 137,860 | | | | 8,577 | | | | 216,223 | | | | (69,786 | ) | | | 4,617 | | | | 278 | | | | 7,091 | | | | (2,196 | ) |
| Small Cap Value | | | 47,012 | | | | 14,487 | | | | 449,289 | | | | (387,790 | ) | | | 2,655 | | | | 811 | | | | 25,120 | | | | (21,654 | ) |
| Global Leaders | | | 13,378 | | | | 1,486 | | | | 9,732 | | | | 5,132 | | | | 983 | | | | 102 | | | | 710 | | | | 375 | |
| International Leaders | | | 93,939 | | | | 938 | | | | 21,157 | | | | 73,720 | | | | 5,758 | | | | 53 | | | | 1,312 | | | | 4,499 | |
| International Growth | | | 187,914 | | | | 18,095 | | | | 720,429 | | | | (514,420 | ) | | | 7,104 | | | | 614 | | | | 26,516 | | | | (18,798 | ) |
| International Small Cap Growth | | | 37,548 | | | | 370 | | | | 104,497 | | | | (66,579 | ) | | | 3,181 | | | | 27 | | | | 8,815 | | | | (5,607 | ) |
| Emerging Markets Leaders | | | 11,138 | | | | 376 | | | | 10,689 | | | | 825 | | | | 1,144 | | | | 37 | | | | 1,102 | | | | 79 | |
| Emerging Markets Growth | | | 6,749 | | | | 2,839 | | | | 31,465 | | | | (21,877 | ) | | | 529 | | | | 211 | | | | 2,480 | | | | (1,740 | ) |
| Emerging Markets Small Cap Growth | | | 34,235 | | | | 217 | | | | 89,550 | | | | (55,098 | ) | | | 2,330 | | | | 13 | | | | 5,987 | | | | (3,644 | ) |
| Bond | | | 63,530 | | | | 8,645 | | | | 165,844 | | | | (93,669 | ) | | | 6,285 | | | | 855 | | | | 16,289 | | | | (9,149 | ) |
| Income | | | 15,837 | | | | 1,281 | | | | 21,322 | | | | (4,204 | ) | | | 1,889 | | | | 151 | | | | 2,517 | | | | (477 | ) |
| Low Duration | | | 5,864 | | | | 1,972 | | | | 25,726 | | | | (17,890 | ) | | | 673 | | | | 226 | | | | 2,953 | | | | (2,054 | ) |
| Macro Allocation | | | 95,661 | | | | 13,901 | | | | 238,819 | | | | (129,257 | ) | | | 8,287 | | | | 1,233 | | | | 20,648 | | | | (11,128 | ) |
| June 30, 2020 | William Blair Funds | 129 |
Notes to Financial Statements (information as of June 30, 2020 is unaudited)
| | | | | | | | | | | | | | | | | Institutional/Class R6 |
| | | | | | | | | | | | Dollars | | | | | | | | | | | | Shares |
| Fund | | Sales | | | Reinvest | | | Redemptions | | | Total | | | Sales | | | Reinvest | | | Redemptions | | | Total |
| Growth (b) | | $ | 253 | | | $ | 17 | | | $ | 50 | | | $ | 220 | | | | 21 | | | | 2 | | | | 4 | | | | 19 | |
| Large Cap Growth (b) | | | 1,614 | | | | 96 | | | | 103 | | | | 1,607 | | | | 98 | | | | 6 | | | | 6 | | | | 98 | |
| Mid Cap Growth | | | 185 | | | | 12 | | | | 50 | | | | 147 | | | | 15 | | | | 1 | | | | 4 | | | | 12 | |
| Small-Mid Cap Core (a) | | | 4,638 | | | | 3 | | | | 23 | | | | 4,618 | | | | 464 | | | | — | | | | 2 | | | | 462 | |
| Small-Mid Cap Growth (b) | | | 39,365 | | | | 2,655 | | | | 1,015 | | | | 41,005 | | | | 1,417 | | | | 99 | | | | 36 | | | | 1,480 | |
| Small-Mid Cap Value (b) | | | 569 | | | | 3 | | | | 395 | | | | 177 | | | | 52 | | | | — | | | | 37 | | | | 15 | |
| Small Cap Growth (b) | | | 70,364 | | | | 1,345 | | | | 6,230 | | | | 65,479 | | | | 2,272 | | | | 44 | | | | 202 | | | | 2,114 | |
| Small Cap Value (b) | | | 594 | | | | 16 | | | | 95 | | | | 515 | | | | 32 | | | | 1 | | | | 5 | | | | 28 | |
| Global Leaders | | | 2,233 | | | | 657 | | | | 54,453 | | | | (51,563 | ) | | | 167 | | | | 45 | | | | 3,935 | | | | (3,723 | ) |
| International Leaders | | | 54,037 | | | | 2,274 | | | | 25,678 | | | | 30,633 | | | | 3,363 | | | | 129 | | | | 1,540 | | | | 1,952 | |
| International Growth (b) | | | 57,826 | | | | 819 | | | | 2,257 | | | | 56,388 | | | | 2,087 | | | | 28 | | | | 77 | | | | 2,038 | |
| Institutional International Growth | | | 192,878 | | | | 17,852 | | | | 574,855 | | | | (364,125 | ) | | | 12,482 | | | | 1,060 | | | | 37,590 | | | | (24,048 | ) |
| International Small Cap Growth | | | 8,293 | | | | 596 | | | | 66,807 | | | | (57,918 | ) | | | 690 | | | | 44 | | | | 5,534 | | | | (4,800 | ) |
| Emerging Markets Leaders | | | 23,896 | | | | 1,819 | | | | 39,496 | | | | (13,781 | ) | | | 2,519 | | | | 179 | | | | 4,094 | | | | (1,396 | ) |
| Emerging Markets Growth | | | 163,145 | | | | 23,530 | | | | 277,695 | | | | (91,020 | ) | | | 12,739 | | | | 1,737 | | | | 21,289 | | | | (6,813 | ) |
| Emerging Markets Small Cap Growth | | | 26,072 | | | | 248 | | | | 15,489 | | | | 10,831 | | | | 1,756 | | | | 15 | | | | 1,035 | | | | 736 | |
| Bond | | | 3,036 | | | | 2,432 | | | | 37,075 | | | | (31,607 | ) | | | 304 | | | | 241 | | | | 3,654 | | | | (3,109 | ) |
| Income (b) | | | 50 | | | | 1 | | | | — | | | | 51 | | | | 6 | | | | — | | | | — | | | | 6 | |
| Low Duration | | | 7,532 | | | | 921 | | | | 19,111 | | | | (10,658 | ) | | | 863 | | | | 106 | | | | 2,191 | | | | (1,222 | ) |
| Macro Allocation | | | 120,202 | | | | 13,341 | | | | 147,745 | | | | (14,202 | ) | | | 10,415 | | | | 1,183 | | | | 12,734 | | | | (1,136 | ) |
| | | | | |
| | | | | Net Change in Net Assets Relating to Fund Share Activity |
| | | | | | | | | | | | Dollars | | | | | | | | | | | | Shares |
| Fund | | Sales | | | Reinvest | | | Redemptions | | | Total | | | Sales | | | Reinvest | | | Redemptions | | | Total |
| Growth | | $ | 21,672 | | | $ | 20,274 | | | $ | 62,229 | | | $ | (20,283 | ) | | | 2,052 | | | | 1,893 | | | | 5,958 | | | | (2,013 | ) |
| Large Cap Growth | | | 122,974 | | | | 13,134 | | | | 62,827 | | | | 73,281 | | | | 8,029 | | | | 847 | | | | 4,186 | | | | 4,690 | |
| Mid Cap Growth | | | 10,314 | | | | 5,817 | | | | 12,695 | | | | 3,436 | | | | 876 | | | | 501 | | | | 1,092 | | | | 285 | |
| Small-Mid Cap Core (a) | | | 6,238 | | | | 4 | | | | 24 | | | | 6,218 | | | | 619 | | | | — | | | | 2 | | | | 617 | |
| Small-Mid Cap Growth | | | 835,740 | | | | 193,454 | | | | 1,045,252 | | | | (16,058 | ) | | | 31,569 | | | | 7,270 | | | | 40,127 | | | | (1,288 | ) |
| Small-Mid Cap Value | | | 7,068 | | | | 139 | | | | 1,813 | | | | 5,394 | | | | 651 | | | | 12 | | | | 169 | | | | 494 | |
| Small Cap Growth | | | 265,349 | | | | 14,035 | | | | 305,741 | | | | (26,357 | ) | | | 9,040 | | | | 472 | | | | 10,359 | | | | (847 | ) |
| Small Cap Value | | | 49,983 | | | | 14,998 | | | | 458,515 | | | | (393,534 | ) | | | 2,825 | | | | 841 | | | | 25,656 | | | | (21,990 | ) |
| Global Leaders | | | 16,564 | | | | 2,241 | | | | 65,648 | | | | (46,843 | ) | | | 1,222 | | | | 154 | | | | 4,757 | | | | (3,381 | ) |
| International Leaders | | | 150,318 | | | | 3,249 | | | | 49,445 | | | | 104,122 | | | | 9,266 | | | | 184 | | | | 3,013 | | | | 6,437 | |
| International Growth | | | 290,402 | | | | 24,177 | | | | 856,554 | | | | (541,975 | ) | | | 10,914 | | | | 825 | | | | 31,643 | | | | (19,904 | ) |
| Institutional International Growth | | | 192,878 | | | | 17,852 | | | | 574,855 | | | | (364,125 | ) | | | 12,482 | | | | 1,060 | | | | 37,590 | | | | (24,048 | ) |
| International Small Cap Growth | | | 45,917 | | | | 969 | | | | 172,212 | | | | (125,326 | ) | | | 3,878 | | | | 71 | | | | 14,424 | | | | (10,475 | ) |
| Emerging Markets Leaders | | | 38,679 | | | | 2,206 | | | | 54,740 | | | | (13,855 | ) | | | 4,051 | | | | 217 | | | | 5,679 | | | | (1,411 | ) |
| Emerging Markets Growth | | | 171,633 | | | | 26,669 | | | | 312,069 | | | | (113,767 | ) | | | 13,410 | | | | 1,971 | | | | 24,000 | | | | (8,619 | ) |
| Emerging Markets Small Cap Growth | | | 60,868 | | | | 465 | | | | 111,575 | | | | (50,242 | ) | | | 4,123 | | | | 28 | | | | 7,462 | | | | (3,311 | ) |
| Bond | | | 80,419 | | | | 13,243 | | | | 261,506 | | | | (167,844 | ) | | | 7,944 | | | | 1,308 | | | | 25,625 | | | | (16,373 | ) |
| Income | | | 17,977 | | | | 1,968 | | | | 27,407 | | | | (7,462 | ) | | | 2,140 | | | | 231 | | | | 3,231 | | | | (860 | ) |
| Low Duration | | | 14,009 | | | | 2,946 | | | | 45,646 | | | | (28,691 | ) | | | 1,606 | | | | 338 | | | | 5,237 | | | | (3,293 | ) |
| Macro Allocation | | | 222,795 | | | | 27,731 | | | | 424,270 | | | | (173,744 | ) | | | 19,309 | | | | 2,459 | | | | 36,643 | | | | (14,875 | ) |
| (a) | For the period from October 1, 2019 (Commencement of Operations) to December 31, 2019. |
| (b) | For the period from May 2, 2019 (Commencement of Operations) to December 31, 2019. |
(8) Subsequent Events
The Funds have evaluated subsequent events through the date of issuance of the Funds’ financial statements and have determined there is no impact to the Funds’ financial statements.
| 130 | Semiannual Report | June 30, 2020 |
Financial Highlights — For a share outstanding throughout each period
Growth Fund
| | | Class N | |
| | | (unaudited)
Period Ended
June 30, | | | Years Ended December 31, | |
| | | | 2020 | | | 2019 | | | 2018 | | | 2017 | | | 2016 | | | 2015 | |
| Net asset value, beginning of year | | | $ | 9.45 | | | $ | 7.91 | | | $ | 10.27 | | | $ | 11.41 | | | $ | 12.52 | | | $ | 13.55 | |
| Income (loss) from investment operations: | | | | | | | | | | | | | | | | | | | | | | | | | |
| Net investment income (loss) | | | | (0.02 | ) | | | (0.03 | ) | | | (0.04 | ) | | | (0.02 | ) | | | (0.02 | ) | | | (0.04 | ) |
| Net realized and unrealized gain (loss) on investments | | | | 0.75 | | | | 2.54 | | | | 0.75 | | | | 2.78 | | | | (0.08 | ) | | | 0.75 | |
| Total from investment operations | | | | 0.73 | | | | 2.51 | | | | 0.71 | | | | 2.76 | | | | (0.10 | ) | | | 0.71 | |
| Less distributions from: | | | | | | | | | | | | | | | | | | | | | | | | | |
| Net investment income | | | | — | | | | — | | | | — | | | | — | | | | — | | | | — | |
| Net realized gain | | | | — | | | | 0.97 | | | | 3.07 | | | | 3.90 | | | | 1.01 | | | | 1.74 | |
| Total distributions | | | | — | | | | 0.97 | | | | 3.07 | | | | 3.90 | | | | 1.01 | | | | 1.74 | |
| Net asset value, end of year | | | $ | 10.18 | | | $ | 9.45 | | | $ | 7.91 | | | $ | 10.27 | | | $ | 11.41 | | | $ | 12.52 | |
| Total return (%)* | | | | 7.72 | | | | 31.97 | | | | 5.10 | | | | 24.35 | | | | (0.98 | ) | | | 5.31 | |
| Ratios to average daily net assets (%)**: | | | | | | | | | | | | | | | | | | | | | | | | | |
| Expenses, before waivers and reimbursements | | | | 1.28 | | | | 1.24 | | | | 1.22 | | | | 1.20 | | | | 1.21 | | | | 1.19 | |
| Expenses, net of waivers and reimbursements | | | | 1.20 | | | | 1.20 | | | | 1.20 | | | | 1.20 | | | | 1.21 | | | | 1.19 | |
| Net investment income (loss), before waivers and reimbursements | | | | (0.46 | ) | | | (0.35 | ) | | | (0.36 | ) | | | (0.14 | ) | | | (0.15 | ) | | | (0.29 | ) |
| Net investment income (loss), net of waivers and reimbursements | | | | (0.38 | ) | | | (0.31 | ) | | | (0.34 | ) | | | (0.14 | ) | | | (0.15 | ) | | | (0.29 | ) |
| Class N net assets at the end of the year (in thousands) | | | $ | 31,139 | | | $ | 32,710 | | | $ | 38,370 | | | $ | 34,886 | | | $ | 62,936 | | | $ | 149,754 | |
| Portfolio turnover rate (%)* | | | | 26 | | | | 39 | | | | 46 | | | | 38 | | | | 79 | | | | 78 | |
| | | | | | | | | | | | | | | | | | | | | | | | | | |
| | | Class I | |
| | | (unaudited)
Period Ended
June 30, | | | Years Ended December 31, | |
| | | | 2020 | | | 2019 | | | 2018 | | | 2017 | | | 2016 | | | 2015 | |
| Net asset value, beginning of year | | | $ | 11.25 | | | $ | 9.25 | | | $ | 11.51 | | | $ | 12.39 | | | $ | 13.50 | | | $ | 14.43 | |
| Income (loss) from investment operations: | | | | | | | | | | | | | | | | | | | | | | | | | |
| Net investment income (loss) | | | | (0.01 | ) | | | (0.00 | )^ | | | (0.01 | ) | | | 0.02 | | | | 0.03 | | | | 0.01 | |
| Net realized and unrealized gain (loss) on investments | | | | 0.90 | | | | 2.97 | | | | 0.82 | | | | 3.02 | | | | (0.10 | ) | | | 0.80 | |
| Total from investment operations | | | | 0.89 | | | | 2.97 | | | | 0.81 | | | | 3.04 | | | | (0.07 | ) | | | 0.81 | |
| Less distributions from: | | | | | | | | | | | | | | | | | | | | | | | | | |
| Net investment income | | | | — | | | | — | | | | 0.00 | ^ | | | 0.02 | | | | 0.03 | | | | — | |
| Net realized gain | | | | — | | | | 0.97 | | | | 3.07 | | | | 3.90 | | | | 1.01 | | | | 1.74 | |
| Total distributions | | | | — | | | | 0.97 | | | | 3.07 | | | | 3.92 | | | | 1.04 | | | | 1.74 | |
| Net asset value, end of year | | | | 12.14 | | | $ | 11.25 | | | $ | 9.25 | | | $ | 11.51 | | | $ | 12.39 | | | $ | 13.50 | |
| Total return (%)* | | | | 7.91 | | | | 32.32 | | | | 5.42 | | | | 24.64 | | | | (0.69 | ) | | | 5.69 | |
| Ratios to average daily net assets (%)**: | | | | | | | | | | | | | | | | | | | | | | | | | |
| Expenses | | | | 0.94 | | | | 0.92 | | | | 0.91 | | | | 0.92 | | | | 0.90 | | | | 0.89 | |
| Net investment income (loss) | | | | (0.13 | ) | | | (0.03 | ) | | | (0.06 | ) | | | 0.12 | | | | 0.20 | | | | 0.06 | |
| Class I net assets at the end of the year (in thousands) | | | $ | 217,361 | | | $ | 220,660 | | | $ | 187,306 | | | $ | 318,848 | | | $ | 514,870 | | | $ | 696,744 | |
| Portfolio turnover rate (%)* | | | | 26 | | | | 39 | | | | 46 | | | | 38 | | | | 79 | | | | 78 | |
| * | Rates are not annualized for periods less than a year. |
| ** | Rates are annualized for periods less than a year. |
| ^ | Amount is less than $0.005 per share. |
Note: Net investment income (loss) per share is based on the average shares outstanding during the year.
Performance cited represents past performance. Past performance does not guarantee future results and current performance may be lower or higher than the data quoted. Results shown are annual returns, which assume reinvestment of dividends and capital gains. Investment returns and principal will fluctuate and you may have a gain or loss when you sell shares. For the most current month-end performance information, please call 1-800-742-7272 or visit our Web site at www.williamblairfunds.com.
| June 30, 2020 | William Blair Funds | 131 |
Financial Highlights — For a share outstanding throughout each period
Growth Fund
| | | Class R6 | |
| | | Period Ended
June 30, | | | Period Ended
December 31, | |
| | | 2020 | | | 2019(a) | |
| Net asset value, beginning of year | | | $ | 11.26 | | | | $ | 11.06 | |
| Income (loss) from investment operations: | | | | | | | | | | |
| Net investment income (loss) | | | | (0.00 | )^ | | | | (0.00 | )^ |
| Net realized and unrealized gain (loss) on investments | | | | 0.90 | | | | | 1.17 | |
| Total from investment operations | | | | 0.90 | | | | | 1.17 | |
| Less distributions from: | | | | | | | | | | |
| Net investment income | | | | — | | | | | — | |
| Net realized gain | | | | — | | | | | 0.97 | |
| Total distributions | | | | — | | | | | 0.97 | |
| Net asset value, end of year | | | $ | 12.16 | | | | $ | 11.26 | |
| Total return (%)* | | | | 7.99 | | | | | 10.75 | |
| Ratios to average daily net assets (%)**: | | | | | | | | | | |
| Expenses | | | | 0.88 | | | | | 0.88 | |
| Net investment income (loss) | | | | (0.06 | ) | | | | (0.06 | ) |
| Class R6 net assets at the end of the year (in thousands) | | | $ | 833 | | | | $ | 217 | |
| Portfolio turnover rate (%)* | | | | 26 | | | | | 39 | |
| (a) | For the period from May 2, 2019 (Commencement of Operations) to December 31, 2019. |
| * | Rates are not annualized for periods less than a year. |
| ** | Rates are annualized for periods less than a year. |
| ^ | Amount is less than $0.005 per share. |
Note: Net investment income (loss) per share is based on the average shares outstanding during the year.
Performance cited represents past performance. Past performance does not guarantee future results and current performance may be lower or higher than the data quoted. Results shown are annual returns, which assume reinvestment of dividends and capital gains. Investment returns and principal will fluctuate and you may have a gain or loss when you sell shares. For the most current month-end performance information, please call 1-800-742-7272 or visit our Web site at www.williamblairfunds.com.
| 132 | Semiannual Report | June 30, 2020 |
Financial Highlights — For a share outstanding throughout each period
Large Cap Growth Fund
| | | Class N | |
| | | (unaudited)
Period Ended
June 30, | | | Years Ended December 31, | |
| | | | 2020 | | | 2019 | | | 2018 | | | 2017 | | | 2016 | | | 2015 | |
| Net asset value, beginning of year | | | $ | 15.27 | | | $ | 11.99 | | | $ | 13.35 | | | $ | 10.26 | | | $ | 10.15 | | | $ | 10.46 | |
| Income (loss) from investment operations: | | | | | | | | | | | | | | | | | | | | | | | | | |
| Net investment income (loss) | | | | 0.01 | | | | 0.00 | ^ | | | (0.02 | ) | | | (0.02 | ) | | | 0.02 | | | | (0.02 | ) |
| Net realized and unrealized gain (loss) on investments | | | | 1.46 | | | | 4.29 | | | | 0.81 | | | | 3.19 | | | | 0.18 | | | | 0.75 | |
| Total from investment operations | | | | 1.47 | | | | 4.29 | | | | 0.79 | | | | 3.17 | | | | 0.20 | | | | 0.73 | |
| Less distributions from: | | | | | | | | | | | | | | | | | | | | | | | | | |
| Net investment income | | | | — | | | | 0.01 | | | | — | | | | — | | | | 0.01 | | | | — | |
| Net realized gain | | | | — | | | | 1.00 | | | | 2.15 | | | | 0.08 | | | | 0.08 | | | | 1.04 | |
| Total distributions | | | | — | | | | 1.01 | | | | 2.15 | | | | 0.08 | | | | 0.09 | | | | 1.04 | |
| Net asset value, end of year | | | $ | 16.74 | | | $ | 15.27 | | | $ | 11.99 | | | $ | 13.35 | | | $ | 10.26 | | | $ | 10.15 | |
| Total return (%)* | | | | 9.63 | | | | 36.00 | | | | 4.96 | | | | 30.88 | | | | 1.97 | | | | 7.04 | |
| Ratios to average daily net assets (%)**: | | | | | | | | | | | | | | | | | | | | | | | | | |
| Expenses, before waivers and reimbursements | | | | 1.04 | | | | 1.12 | | | | 1.21 | | | | 1.19 | | | | 1.23 | | | | 1.28 | |
| Expenses, net of waivers and reimbursements | | | | 0.90 | | | | 0.95 | | | | 1.05 | | | | 1.05 | | | | 1.05 | | | | 1.07 | |
| Net investment income (loss), before waivers and reimbursements | | | | (0.02 | ) | | | (0.14 | ) | | | (0.33 | ) | | | (0.27 | ) | | | (0.01 | ) | | | (0.43 | ) |
| Net investment income (loss), net of waivers and reimbursements | | | | 0.12 | | | | 0.03 | | | | (0.17 | ) | | | (0.13 | ) | | | 0.17 | | | | (0.22 | ) |
| Class N net assets at the end of the year (in thousands) | | | $ | 131,166 | | | $ | 65,314 | | | $ | 41,361 | | | $ | 25,604 | | | $ | 11,860 | | | $ | 10,443 | |
| Portfolio turnover rate (%)* | | | | 21 | | | | 37 | | | | 47 | | | | 29 | | | | 44 | | | | 38 | |
| | | | | | | | | | | | | | | | | | | | | | | | | | |
| | | Class I | |
| | | (unaudited)
Period Ended
June 30, | | | Years Ended December 31, | |
| | | | 2020 | | | 2019 | | | 2018 | | | 2017 | | | 2016 | | | 2015 | |
| Net asset value, beginning of year | | | $ | 16.19 | | | $ | 12.66 | | | $ | 13.97 | | | $ | 10.70 | | | $ | 10.58 | | | $ | 10.84 | |
| Income (loss) from investment operations: | | | | | | | | | | | | | | | | | | | | | | | | | |
| Net investment income (loss) | | | | 0.03 | | | | 0.04 | | | | 0.01 | | | | 0.02 | | | | 0.04 | | | | (0.00 | )^ |
| Net realized and unrealized gain (loss) on investments | | | | 1.55 | | | | 4.54 | | | | 0.85 | | | | 3.33 | | | | 0.19 | | | | 0.78 | |
| Total from investment operations | | | | 1.58 | | | | 4.58 | | | | 0.86 | | | | 3.35 | | | | 0.23 | | | | 0.78 | |
| Less distributions from: | | | | | | | | | | | | | | | | | | | | | | | | | |
| Net investment income | | | | — | | | | 0.05 | | | | 0.02 | | | | — | | | | 0.03 | | | | — | |
| Net realized gain | | | | — | | | | 1.00 | | | | 2.15 | | | | 0.08 | | | | 0.08 | | | | 1.04 | |
| Total distributions | | | | — | | | | 1.05 | | | | 2.17 | | | | 0.08 | | | | 0.11 | | | | 1.04 | |
| Net asset value, end of year | | | $ | 17.77 | | | $ | 16.19 | | | $ | 12.66 | | | $ | 13.97 | | | $ | 10.70 | | | $ | 10.58 | |
| Total return (%)* | | | | 9.76 | | | | 36.35 | | | | 5.21 | | | | 31.29 | | | | 2.22 | | | | 7.26 | |
| Ratios to average daily net assets (%)**: | | | | | | | | | | | | | | | | | | | | | | | | | |
| Expenses, before waivers and reimbursements | | | | 0.75 | | | | 0.81 | | | | 0.90 | | | | 0.90 | | | | 0.91 | | | | 0.95 | |
| Expenses, net of waivers and reimbursements | | | | 0.65 | | | | 0.70 | | | | 0.80 | | | | 0.80 | | | | 0.80 | | | | 0.82 | |
| Net investment income (loss), before waivers and reimbursements | | | | 0.28 | | | | 0.16 | | | | (0.01 | ) | | | 0.03 | | | | 0.30 | | | | (0.10 | ) |
| Net investment income (loss), net of waivers and reimbursements | | | | 0.38 | | | | 0.27 | | | | 0.09 | | | | 0.13 | | | | 0.41 | | | | 0.03 | |
| Class I net assets at the end of the year (in thousands) | | | $ | 386,509 | | | $ | 236,930 | | | $ | 137,599 | | | $ | 177,959 | | | $ | 110,475 | | | $ | 59,038 | |
| Portfolio turnover rate (%)* | | | | 21 | | | | 37 | | | | 47 | | | | 29 | | | | 44 | | | | 38 | |
| * | Rates are not annualized for periods less than a year. |
| ** | Rates are annualized for periods less than a year. |
| ^ | Amount is less than $0.005 per share. |
Note: Net investment income (loss) per share is based on the average shares outstanding during the year.
Performance cited represents past performance. Past performance does not guarantee future results and current performance may be lower or higher than the data quoted. Results shown are annual returns, which assume reinvestment of dividends and capital gains. Investment returns and principal will fluctuate and you may have a gain or loss when you sell shares. For the most current month-end performance information, please call 1-800-742-7272 or visit our Web site at www.williamblairfunds.com.
| June 30, 2020 | William Blair Funds | 133 |
Financial Highlights — For a share outstanding throughout each period
Large Cap Growth Fund
| | | Class R6 | |
| | | (unaudited)
Period Ended
June 30, | | | Period Ended
December 31, | |
| | | 2020 | | | 2019(a) | |
| Net asset value, beginning of year | | | $ | 16.17 | | | | $ | 15.12 | |
| Income (loss) from investment operations: | | | | | | | | | | |
| Net investment income (loss) | | | | 0.03 | | | | | 0.04 | |
| Net realized and unrealized gain (loss) on investments | | | | 1.56 | | | | | 2.07 | |
| Total from investment operations | | | | 1.59 | | | | | 2.11 | |
| Less distributions from: | | | | | | | | | | |
| Net investment income | | | | — | | | | | 0.06 | |
| Net realized gain | | | | — | | | | | 1.00 | |
| Total distributions | | | | — | | | | | 1.06 | |
| Net asset value, end of year | | | $ | 17.76 | | | | $ | 16.17 | |
| Total return (%)* | | | | 9.83 | | | | | 14.13 | |
| Ratios to average daily net assets (%)**: | | | | | | | | | | |
| Expenses, before waivers and reimbursements | | | | 0.68 | | | | | 0.71 | |
| Expenses, net of waivers and reimbursements | | | | 0.60 | | | | | 0.60 | |
| Net investment income (loss), before waivers and reimbursements | | | | 0.34 | | | | | 0.22 | |
| Net investment income (loss), net of waivers and reimbursements | | | | 0.42 | | | | | 0.33 | |
| Class R6 net assets at the end of the year (in thousands) | | | $ | 2,560 | | | | $ | 1,590 | |
| Portfolio turnover rate (%)* | | | | 21 | | | | | 37 | |
| (a) | For the period from May 2, 2019 (Commencement of Operations) to December 31, 2019. |
| * | Rates are not annualized for periods less than a year. |
| ** | Rates are annualized for periods less than a year. |
Note: Net investment income (loss) per share is based on the average shares outstanding during the year.
Performance cited represents past performance. Past performance does not guarantee future results and current performance may be lower or higher than the data quoted. Results shown are annual returns, which assume reinvestment of dividends and capital gains. Investment returns and principal will fluctuate and you may have a gain or loss when you sell shares. For the most current month-end performance information, please call 1-800-742-7272 or visit our Web site at www.williamblairfunds.com.
| 134 | Semiannual Report | June 30, 2020 |
Financial Highlights — For a share outstanding throughout each period
Mid Cap Growth Fund
| | Class N | |
| | (unaudited)
Period Ended
June 30, | | | Years Ended December 31, | |
| | | 2020 | | | 2019 | | | 2018 | | | 2017 | | | 2016 | | | 2015 | |
| Net asset value, beginning of year | | $ | 10.99 | | | $ | 8.87 | | | $ | 10.92 | | | $ | 10.69 | | | $ | 11.28 | | | $ | 14.20 | |
| Income (loss) from investment operations: | | | | | | | | | | | | | | | | | | | | | | | | |
| Net investment income (loss) | | | (0.03 | ) | | | (0.05 | ) | | | (0.06 | ) | | | (0.08 | ) | | | (0.06 | ) | | | (0.09 | ) |
| Net realized and unrealized gain (loss) on investments | | | (0.12 | ) | | | 3.22 | | | | 0.03 | | | | 2.29 | | | | 0.09 | | | | 0.04 | |
| Total from investment operations | | | (0.15 | ) | | | 3.17 | | | | (0.03 | ) | | | 2.21 | | | | 0.03 | | | | (0.05 | ) |
| Less distributions from: | | | | | | | | | | | | | | | | | | | | | | | | |
| Net investment income | | | — | | | | — | | | | — | | | | — | | | | — | | | | — | |
| Net realized gain | | | — | | | | 1.05 | | | | 2.02 | | | | 1.98 | | | | 0.62 | | | | 2.87 | |
| Total distributions | | | — | | | | 1.05 | | | | 2.02 | | | | 1.98 | | | | 0.62 | | | | 2.87 | |
| Net asset value, end of year | | $ | 10.84 | | | $ | 10.99 | | | $ | 8.87 | | | $ | 10.92 | | | $ | 10.69 | | | $ | 11.28 | |
| Total return (%)* | | | (1.36 | ) | | | 36.02 | | | | (1.20 | ) | | | 20.88 | | | | 0.23 | | | | (0.20 | ) |
| Ratios to average daily net assets (%)**: | | | | | | | | | | | | | | | | | | | | | | | | |
| Expenses, before waivers and reimbursements | | | 1.55 | | | | 1.51 | | | | 1.57 | | | | 1.49 | | | | 1.45 | | | | 1.43 | |
| Expenses, net of waivers and reimbursements | | | 1.20 | | | | 1.20 | | | | 1.23 | | | | 1.30 | | | | 1.30 | | | | 1.32 | |
| Net investment income (loss), before waivers and reimbursements | | | (0.99 | ) | | | (0.79 | ) | | | (0.85 | ) | | | (0.84 | ) | | | (0.68 | ) | | | (0.76 | ) |
| Net investment income (loss), net of waivers and reimbursements | | | (0.64 | ) | | | (0.48 | ) | | | (0.51 | ) | | | (0.65 | ) | | | (0.53 | ) | | | (0.65 | ) |
| Class N net assets at the end of the year (in thousands) | | $ | 5,003 | | | $ | 5,465 | | | $ | 4,944 | | | $ | 6,166 | | | $ | 16,234 | | | $ | 25,105 | |
| Portfolio turnover rate (%)* | | | 27 | | | | 43 | | | | 58 | | | | 59 | | | | 60 | | | | 65 | |
| |
| | Class I | |
| | (unaudited)
Period Ended
June 30, | | | Years Ended December 31, | |
| | | | 2020 | | | | 2019 | | | | 2018 | | | | 2017 | | | | 2016 | | | | 2015 | |
| Net asset value, beginning of year | | $ | 11.93 | | | $ | 9.55 | | | $ | 11.57 | | | $ | 11.20 | | | $ | 11.76 | | | $ | 14.65 | |
| Income (loss) from investment operations: | | | | | | | | | | | | | | | | | | | | | | | | |
| Net investment income (loss) | | | (0.02 | ) | | | (0.03 | ) | | | (0.03 | ) | | | (0.05 | ) | | | (0.03 | ) | | | (0.06 | ) |
| Net realized and unrealized gain (loss) on investments | | | (0.12 | ) | | | 3.46 | | | | 0.03 | | | | 2.40 | | | | 0.09 | | | | 0.04 | |
| Total from investment operations | | | (0.14 | ) | | | 3.43 | | | | — | | | | 2.35 | | | | 0.06 | | | | (0.02 | ) |
| Less distributions from: | | | | | | | | | | | | | | | | | | | | | | | | |
| Net investment income | | | — | | | | — | | | | — | | | | — | | | | — | | | | — | |
| Net realized gain | | | — | | | | 1.05 | | | | 2.02 | | | | 1.98 | | | | 0.62 | | | | 2.87 | |
| Total distributions | | | — | | | | 1.05 | | | | 2.02 | | | | 1.98 | | | | 0.62 | | | | 2.87 | |
| Net asset value, end of year | | $ | 11.79 | | | $ | 11.93 | | | $ | 9.55 | | | $ | 11.57 | | | $ | 11.20 | | | $ | 11.76 | |
| Total return (%)* | | | (1.17 | ) | | | 36.17 | | | | (0.86 | ) | | | 21.18 | | | | 0.48 | | | | 0.00 | |
| Ratios to average daily net assets (%)**: | | | | | | | | | | | | | | | | | | | | | | | | |
| Expenses, before waivers and reimbursements | | | 1.31 | | | | 1.28 | | | | 1.31 | | | | 1.23 | | | | 1.18 | | | | 1.14 | |
| Expenses, net of waivers and reimbursements | | | 0.95 | | | | 0.95 | | | | 0.98 | | | | 1.05 | | | | 1.05 | | | | 1.07 | |
| Net investment income (loss), before waivers and reimbursements | | | (0.74 | ) | | | (0.56 | ) | | | (0.58 | ) | | | (0.58 | ) | | | (0.39 | ) | | | (0.48 | ) |
| Net investment income (loss), net of waivers and reimbursements | | | (0.38 | ) | | | (0.23 | ) | | | (0.25 | ) | | | (0.40 | ) | | | (0.26 | ) | | | (0.41 | ) |
| Class I net assets at the end of the year (in thousands) | | $ | 65,781 | | | $ | 67,936 | | | $ | 51,173 | | | $ | 71,369 | | | $ | 119,424 | | | $ | 174,617 | |
| Portfolio turnover rate (%)* | | | 27 | | | | 43 | | | | 58 | | | | 59 | | | | 60 | | | | 65 | |
| * | Rates are not annualized for periods less than a year. |
| ** | Rates are annualized for periods less than a year. |
Note: Net investment income (loss) per share is based on the average shares outstanding during the year.
Performance cited represents past performance. Past performance does not guarantee future results and current performance may be lower or higher than the data quoted. Results shown are annual returns, which assume reinvestment of dividends and capital gains. Investment returns and principal will fluctuate and you may have a gain or loss when you sell shares. For the most current month-end performance information, please call 1-800-742-7272 or visit our Web site at www.williamblairfunds.com.
| June 30, 2020 | William Blair Funds | 135 |
Financial Highlights — For a share outstanding throughout each period
Mid Cap Growth Fund
| | | Class R6 | |
| | | (unaudited) | | | | | |
| | | Period Ended | | | Period Ended | |
| | | June 30, | | | December 31, | |
| | | 2020 | | | 2019(a) | |
| Net asset value, beginning of year | | | $ | 11.94 | | | | $ | 11.93 | |
| Income (loss) from investment operations: | | | | | | | | | | |
| Net investment income (loss) | | | | (0.02 | ) | | | | (0.01 | ) |
| Net realized and unrealized gain (loss) on investments | | | | (0.12 | ) | | | | 1.07 | |
| Total from investment operations | | | | (0.14 | ) | | | | 1.06 | |
| Less distributions from: | | | | | | | | | | |
| Net investment income | | | | — | | | | | — | |
| Net realized gain | | | | — | | | | | 1.05 | |
| Total distributions | | | | — | | | | | 1.05 | |
| Net asset value, end of year | | | $ | 11.80 | | | | $ | 11.94 | |
| Total return (%)* | | | | (1.17 | ) | | | | 9.10 | |
| Ratios to average daily net assets (%)**: | | | | | | | | | | |
| Expenses, before waivers and reimbursements | | | | 1.18 | | | | | 1.14 | |
| Expenses, net of waivers and reimbursements | | | | 0.90 | | | | | 0.90 | |
| Net investment income (loss), before waivers and reimbursements | | | | (0.60 | ) | | | | (0.41 | ) |
| Net investment income (loss), net of waivers and reimbursements | | | | (0.32 | ) | | | | (0.17 | ) |
| Class R6 net assets at the end of the year (in thousands) | | | $ | 164 | | | | $ | 145 | |
| Portfolio turnover rate (%)* | | | | 27 | | | | | 43 | |
| (a) | For the period from May 2, 2019 (Commencement of Operations) to December 31, 2019. |
| * | Rates are not annualized for periods less than a year. |
| ** | Rates are annualized for periods less than a year. |
Note: Net investment income (loss) per share is based on the average shares outstanding during the year.
Performance cited represents past performance. Past performance does not guarantee future results and current performance may be lower or higher than the data quoted. Results shown are annual returns, which assume reinvestment of dividends and capital gains. Investment returns and principal will fluctuate and you may have a gain or loss when you sell shares. For the most current month-end performance information, please call 1-800-742-7272 or visit our Web site at www.williamblairfunds.com.
| 136 | Semiannual Report | June 30, 2020 |
Financial Highlights — For a share outstanding throughout each period
Small-Mid Cap Core Fund
| | | Class I | |
| | | (unaudited) | | | | | |
| | | Period Ended | | | Period Ended | |
| | | June 30, | | | December 31, | |
| | | 2020 | | | 2019(a) | |
| Net asset value, beginning of year | | | $ | 10.68 | | | | $ | 10.00 | |
| Income (loss) from investment operations: | | | | | | | | | | |
| Net investment income (loss) | | | | 0.00 | ^ | | | | 0.02 | |
| Net realized and unrealized gain (loss) on investments | | | | (1.12 | ) | | | | 0.67 | |
| Total from investment operations | | | | (1.12 | ) | | | | 0.69 | |
| Less distributions from: | | | | | | | | | | |
| Net investment income | | | | — | | | | | 0.01 | |
| Net realized gain | | | | — | | | | | — | |
| Total distributions | | | | — | | | | | 0.01 | |
| Net asset value, end of year | | | $ | 9.56 | | | | $ | 10.68 | |
| Total return (%)* | | | | (10.49 | ) | | | | 6.87 | |
| Ratios to average daily net assets (%)**: | | | | | | | | | | |
| Expenses, before waivers and reimbursements | | | | 1.14 | | | | | 3.92 | |
| Expenses, net of waivers and reimbursements | | | | 0.95 | | | | | 0.95 | |
| Net investment income (loss), before waivers and reimbursements | | | | (0.11 | ) | | | | (2.23 | ) |
| Net investment income (loss), net of waivers and reimbursements | | | | 0.08 | | | | | 0.74 | |
| Class N net assets at the end of the year (in thousands) | | | $ | 194,012 | | | | $ | 1,655 | |
| Portfolio turnover rate (%)* | | | | 48 | | | | | 12 | |
| |
| | | Class R6 | |
| | | (unaudited) | | | | | | |
| | | Period Ended | | | Period Ended | |
| | | June 30, | | | December 31, | |
| | | 2020 | | | 2019(a) | |
| Net asset value, beginning of year | | | $ | 10.68 | | | | $ | 10.00 | |
| Income (loss) from investment operations: | | | | | | | | | | |
| Net investment income (loss) | | | | 0.01 | | | | | 0.01 | |
| Net realized and unrealized gain (loss) on investments | | | | (1.12 | ) | | | | 0.68 | |
| Total from investment operations | | | | (1.11 | ) | | | | 0.69 | |
| Less distributions from: | | | | | | | | | | |
| Net investment income | | | | — | | | | | 0.01 | |
| Net realized gain | | | | — | | | | | — | |
| Total distributions | | | | — | | | | | 0.01 | |
| Net asset value, end of year | | | $ | 9.57 | | | | $ | 10.68 | |
| Total return (%)* | | | | (10.39 | ) | | | | 6.88 | |
| Ratios to average daily net assets (%)**: | | | | | | | | | | |
| Expenses, before waivers and reimbursements | | | | 1.01 | | | | | 3.92 | |
| Expenses, net of waivers and reimbursements | | | | 0.90 | | | | | 0.90 | |
| Net investment income (loss), before waivers and reimbursements | | | | 0.04 | | | | | (2.71 | ) |
| Net investment income (loss), net of waivers and reimbursements | | | | 0.15 | | | | | 0.31 | |
| Class I net assets at the end of the year (in thousands) | | | $ | 5,086 | | | | $ | 4,933 | |
| Portfolio turnover rate (%)* | | | | 48 | | | | | 12 | |
| (a) | For the period from October 1, 2019 (commencement of operations) to December 31, 2019. |
| * | Rates are not annualized for periods less than a year. |
| ** | Rates are annualized for periods less than a year. |
| ^ | Amount is less than $0.005 per share. |
Note: Net investment income (loss) per share is based on the average shares outstanding during the year.
Performance cited represents past performance. Past performance does not guarantee future results and current performance may be lower or higher than the data quoted. Results shown are annual returns, which assume reinvestment of dividends and capital gains. Investment returns and principal will fluctuate and you may have a gain or loss when you sell shares. For the most current month-end performance information, please call 1-800-742-7272 or visit our Web site at www.williamblairfunds.com.
| June 30, 2020 | William Blair Funds | 137 |
Financial Highlights — For a share outstanding throughout each period
Small-Mid Cap Growth Fund
| | | Class N | |
| | (unaudited)
Period Ended
June 30, | | | Years Ended December 31, | |
| | | 2020 | | | 2019 | | | 2018 | | | 2017 | | | 2016 | | | 2015 | |
| Net asset value, beginning of year | | $ | 25.41 | | | $ | 20.97 | | | $ | 23.36 | | | $ | 19.20 | | | $ | 18.53 | | | $ | 18.72 | |
| Income (loss) from investment operations: | | | | | | | | | | | | | | | | | | | | | | | | |
| Net investment income (loss) | | | (0.10 | ) | | | (0.20 | ) | | | (0.18 | ) | | | (0.16 | ) | | | (0.09 | ) | | | (0.10 | ) |
| Net realized and unrealized gain (loss) on investments | | | 0.27 | | | | 6.56 | | | | (0.25 | ) | | | 5.62 | | | | 1.29 | | | | 0.93 | |
| Total from investment operations | | | 0.17 | | | | 6.36 | | | | (0.43 | ) | | | 5.46 | | | | 1.20 | | | | 0.83 | |
| Less distributions from: | | | | | | | | | | | | | | | | | | | | | | | | |
| Net investment income | | | — | | | | — | | | | — | | | | — | | | | — | | | | — | |
| Net realized gain | | | — | | | | 1.92 | | | | 1.96 | | | | 1.30 | | | | 0.53 | | | | 1.02 | |
| Total distributions | | | — | | | | 1.92 | | | | 1.96 | | | | 1.30 | | | | 0.53 | | | | 1.02 | |
| Net asset value, end of year | | $ | 25.58 | | | $ | 25.41 | | | $ | 20.97 | | | $ | 23.36 | | | $ | 19.20 | | | $ | 18.53 | |
| Total return (%)* | | | 0.67 | | | | 30.41 | | | | (2.29 | ) | | | 28.57 | | | | 6.45 | | | | 4.47 | |
| Ratios to average daily net assets (%)**: | | | | | | | | | | | | | | | | | | | | | | | | |
| Expenses, before waivers and reimbursements | | | 1.46 | | | | 1.43 | | | | 1.44 | | | | 1.43 | | | | 1.43 | | | | 1.42 | |
| Expenses, net of waivers and reimbursements | | | 1.35 | | | | 1.35 | | | | 1.35 | | | | 1.35 | | | | 1.35 | | | | 1.35 | |
| Net investment income (loss), before waivers and reimbursements | | | (0.97 | ) | | | (0.88 | ) | | | (0.81 | ) | | | (0.82 | ) | | | (0.59 | ) | | | (0.58 | ) |
| Net investment income (loss), net of waivers and reimbursements | | | (0.86 | ) | | | (0.80 | ) | | | (0.72 | ) | | | (0.74 | ) | | | (0.51 | ) | | | (0.51 | ) |
| Class N net assets at the end of the year (in thousands) | | $ | 273,268 | | | $ | 334,017 | | | $ | 424,865 | | | $ | 228,828 | | | $ | 171,638 | | | $ | 169,595 | |
| Portfolio turnover rate (%)* | | | 31 | | | | 56 | | | | 46 | | | | 64 | | | | 66 | | | | 44 | |
| |
| | | Class I | |
| | (unaudited)
Period Ended
June 30, | | | Years Ended December 31, | |
| | | | 2020 | | | | 2019 | | | | 2018 | | | | 2017 | | | | 2016 | | | | 2015 | |
| Net asset value, beginning of year | | $ | 26.99 | | | $ | 22.12 | | | $ | 24.48 | | | $ | 20.02 | | | $ | 19.25 | | | $ | 19.36 | |
| Income (loss) from investment operations: | | | | | | | | | | | | | | | | | | | | | | | | |
| Net investment income (loss) | | | (0.08 | ) | | | (0.14 | ) | | | (0.12 | ) | | | (0.11 | ) | | | (0.05 | ) | | | (0.06 | ) |
| Net realized and unrealized gain (loss) on investments | | | 0.29 | | | | 6.93 | | | | (0.28 | ) | | | 5.87 | | | | 1.35 | | | | 0.97 | |
| Total from investment operations | | | 0.21 | | | | 6.79 | | | | (0.40 | ) | | | 5.76 | | | | 1.30 | | | | 0.91 | |
| Less distributions from: | | | | | | | | | | | | | | | | | | | | | | | | |
| Net investment income | | | — | | | | — | | | | — | | | | — | | | | — | | | | — | |
| Net realized gain | | | — | | | | 1.92 | | | | 1.96 | | | | 1.30 | | | | 0.53 | | | | 1.02 | |
| Total distributions | | | — | | | | 1.92 | | | | 1.96 | | | | 1.30 | | | | 0.53 | | | | 1.02 | |
| Net asset value, end of year | | $ | 27.20 | | | $ | 26.99 | | | $ | 22.12 | | | $ | 24.48 | | | $ | 20.02 | | | $ | 19.25 | |
| Total return (%)* | | | 0.78 | | | | 30.77 | | | | (2.06 | ) | | | 28.90 | | | | 6.72 | | | | 4.74 | |
| Ratios to average daily net assets (%)**: | | | | | | | | | | | | | | | | | | | | | | | | |
| Expenses, before waivers and reimbursements | | | 1.17 | | | | 1.16 | | | | 1.16 | | | | 1.16 | | | | 1.16 | | | | 1.15 | |
| Expenses, net of waivers and reimbursements | | | 1.10 | | | | 1.10 | | | | 1.10 | | | | 1.10 | | | | 1.10 | | | | 1.10 | |
| Net investment income (loss), before waivers and reimbursements | | | (0.67 | ) | | | (0.59 | ) | | | (0.53 | ) | | | (0.55 | ) | | | (0.34 | ) | | | (0.33 | ) |
| Net investment income (loss), net of waivers and reimbursements | | | (0.60 | ) | | | (0.53 | ) | | | (0.47 | ) | | | (0.49 | ) | | | (0.28 | ) | | | (0.28 | ) |
| Class I net assets at the end of the year (in thousands) | | $ | 2,464,057 | | | $ | 2,531,823 | | | $ | 1,979,105 | | | $ | 1,576,180 | | | $ | 1,090,939 | | | $ | 1,019,544 | |
| Portfolio turnover rate (%)* | | | 31 | | | | 56 | | | | 46 | | | | 64 | | | | 66 | | | | 44 | |
| * | Rates are not annualized for periods less than a year. |
| ** | Rates are annualized for periods less than a year. |
Note: Net investment income (loss) per share is based on the average shares outstanding during the year.
Performance cited represents past performance. Past performance does not guarantee future results and current performance may be lower or higher than the data quoted. Results shown are annual returns, which assume reinvestment of dividends and capital gains. Investment returns and principal will fluctuate and you may have a gain or loss when you sell shares. For the most current month-end performance information, please call 1-800-742-7272 or visit our Web site at www.williamblairfunds.com.
| 138 | Semiannual Report | June 30, 2020 |
Financial Highlights — For a share outstanding throughout each period
Small-Mid Cap Growth Fund
| | | Class R6 | |
| | | (unaudited) | | | | | |
| | | Period Ended | | | Period Ended | |
| | | June 30, | | | December 31, | |
| | | 2020 | | | 2019(a) | |
| Net asset value, beginning of year | | | $ | 27.01 | | | | $ | 26.76 | |
| Income (loss) from investment operations: | | | | | | | | | | |
| Net investment income (loss) | | | | (0.07 | ) | | | | (0.09 | ) |
| Net realized and unrealized gain (loss) on investments | | | | 0.29 | | | | | 2.26 | |
| Total from investment operations | | | | 0.22 | | | | | 2.17 | |
| Less distributions from: | | | | | | | | | | |
| Net investment income | | | | — | | | | | — | |
| Net realized gain | | | | — | | | | | 1.92 | |
| Total distributions | | | | — | | | | | 1.92 | |
| Net asset value, end of year | | | $ | 27.23 | | | | $ | 27.01 | |
| Total return (%)* | | | | 0.81 | | | | | 8.17 | |
| Ratios to average daily net assets (%)**: | | | | | | | | | | |
| Expenses | | | | 1.05 | | | | | 1.05 | |
| Net investment income (loss) | | | | (0.53 | ) | | | | (0.46 | ) |
| Class R6 net assets at the end of the year (in thousands) | | | $ | 73,475 | | | | $ | 39,974 | |
| Portfolio turnover rate (%)* | | | | 31 | | | | | 56 | |
| (a) | For the period from May 2, 2019 (Commencement of Operations) to December 31, 2019. |
| * | Rates are not annualized for periods less than a year. |
| ** | Rates are annualized for periods less than a year. |
Note: Net investment income (loss) per share is based on the average shares outstanding during the year.
Performance cited represents past performance. Past performance does not guarantee future results and current performance may be lower or higher than the data quoted. Results shown are annual returns, which assume reinvestment of dividends and capital gains. Investment returns and principal will fluctuate and you may have a gain or loss when you sell shares. For the most current month-end performance information, please call 1-800-742-7272 or visit our Web site at www.williamblairfunds.com.
| June 30, 2020 | William Blair Funds | 139 |
Financial Highlights — For a share outstanding throughout each period
Small-Mid Cap Value Fund
| | | | | | | | | | | | | | | | | Class N | |
| | (unaudited)
Period Ended
June 30, | | | | | | | | | Years Ended December 31, | |
| | | 2020 | | | 2019 | | | 2018 | | | 2017 | | | 2016 | | | 2015 | |
| Net asset value, beginning of year | | $ | 11.22 | | | $ | 9.31 | | | $ | 14.31 | | | $ | 14.53 | | | $ | 12.54 | | | $ | 13.63 | |
| Income (loss) from investment operations: | | | | | | | | | | | | | | | | | | | | | | | | |
| Net investment income (loss) | | | 0.06 | | | | 0.10 | | | | 0.09 | | | | 0.04 | | | | 0.04 | | | | 0.04 | |
| Net realized and unrealized gain (loss) on investments | | | (2.74 | ) | | | 2.00 | | | | (2.08 | ) | | | 1.33 | | | | 2.55 | | | | (0.47 | ) |
| Total from investment operations | | | (2.68 | ) | | | 2.10 | | | | (1.99 | ) | | | 1.37 | | | | 2.59 | | | | (0.43 | ) |
| Less distributions from: | | | | | | | | | | | | | | | | | | | | | | | | |
| Net investment income | | | — | | | | 0.03 | | | | 0.03 | | | | 0.02 | | | | 0.01 | | | | 0.01 | |
| Net realized gain | | | — | | | | 0.16 | | | | 2.98 | | | | 1.57 | | | | 0.59 | | | | 0.65 | |
| Total distributions | | | — | | | | 0.19 | | | | 3.01 | | | | 1.59 | | | | 0.60 | | | | 0.66 | |
| Net asset value, end of year | | $ | 8.54 | | | $ | 11.22 | | | $ | 9.31 | | | $ | 14.31 | | | $ | 14.53 | | | $ | 12.54 | |
| Total return (%)* | | | (23.89 | ) | | | 22.77 | | | | (15.32 | ) | | | 9.59 | | | | 20.69 | | | | (3.13 | ) |
| Ratios to average daily net assets (%)**: | | | | | | | | | | | | | | | | | | | | | | | | |
| Expenses, before waivers and reimbursements | | | 5.52 | | | | 6.76 | | | | 6.88 | | | | 4.83 | | | | 4.15 | | | | 3.93 | |
| Expenses, net of waivers and reimbursements | | | 1.22 | | | | 1.25 | | | | 1.28 | | | | 1.35 | | | | 1.35 | | | | 1.37 | |
| Net investment income (loss), before waivers and reimbursements | | | (2.89 | ) | | | (4.59 | ) | | | (4.97 | ) | | | (3.21 | ) | | | (2.51 | ) | | | (2.29 | ) |
| Net investment income (loss), net of waivers and reimbursements | | | 1.41 | | | | 0.92 | | | | 0.63 | | | | 0.27 | | | | 0.29 | | | | 0.27 | |
| Class N net assets at the end of the year (in thousands) | | $ | 161 | | | $ | 315 | | | $ | 234 | | | $ | 284 | | | $ | 267 | | | $ | 855 | |
| Portfolio turnover rate (%)* | | | 142 | | | | 107 | | | | 104 | | | | 70 | | | | 45 | | | | 35 | |
| | | | | | | | | | | | | | | | | | | | | | | | | |
| | | | | | | | | | | | | | | | | | | | | Class I | |
| | (unaudited)
Period Ended
June 30, | | | Years Ended December 31, | |
| | | 2020 | | | | 2019 | | | | 2018 | | | | 2017 | | | | 2016 | | | | 2015 | |
| Net asset value, beginning of year | | $ | 11.13 | | | $ | 9.23 | | | $ | 14.24 | | | $ | 14.47 | | | $ | 12.54 | | | $ | 13.63 | |
| Income (loss) from investment operations: | | | | | | | | | | | | | | | | | | | | | | | | |
| Net investment income (loss) | | | 0.07 | | | | 0.14 | | | | 0.11 | | | | 0.07 | | | | 0.08 | | | | 0.07 | |
| Net realized and unrealized gain (loss) on investments | | | (2.69 | ) | | | 1.98 | | | | (2.06 | ) | | | 1.33 | | | | 2.55 | | | | (0.47 | ) |
| Total from investment operations | | | (2.62 | ) | | | 2.12 | | | | (1.95 | ) | | | 1.40 | | | | 2.63 | | | | (0.40 | ) |
| Less distributions from: | | | | | | | | | | | | | | | | | | | | | | | | |
| Net investment income | | | — | | | | 0.06 | | | | 0.08 | | | | 0.06 | | | | 0.11 | | | | 0.04 | |
| Net realized gain | | | — | | | | 0.16 | | | | 2.98 | | | | 1.57 | | | | 0.59 | | | | 0.65 | |
| Total distributions | | | — | | | | 0.22 | | | | 3.06 | | | | 1.63 | | | | 0.70 | | | | 0.69 | |
| Net asset value, end of year | | $ | 8.51 | | | $ | 11.13 | | | $ | 9.23 | | | $ | 14.24 | | | $ | 14.47 | | | $ | 12.54 | |
| Total return (%)* | | | (23.63 | ) | | | 23.00 | | | | (15.03 | ) | | | 9.84 | | | | 21.00 | | | | (2.86 | ) |
| Ratios to average daily net assets (%)**: | | | | | | | | | | | | | | | | | | | | | | | | |
| Expenses, before waivers and reimbursements | | | 5.21 | | | | 6.45 | | | | 6.54 | | | | 4.55 | | | | 3.92 | | | | 3.72 | |
| Expenses, net of waivers and reimbursements | | | 0.97 | | | | 1.00 | | | | 1.03 | | | | 1.10 | | | | 1.10 | | | | 1.12 | |
| Net investment income (loss), before waivers and reimbursements | | | (2.74 | ) | | | (4.13 | ) | | | (4.69 | ) | | | (2.94 | ) | | | (2.20 | ) | | | (2.08 | ) |
| Net investment income (loss), net of waivers and reimbursements | | | 1.50 | | | | 1.32 | | | | 0.82 | | | | 0.51 | | | | 0.62 | | | | 0.52 | |
| Class I net assets at the end of the year (in thousands) | | $ | 814 | | | $ | 7,042 | | | $ | 1,445 | | | $ | 3,359 | | | $ | 3,186 | | | $ | 3,220 | |
| Portfolio turnover rate (%)* | | | 142 | | | | 107 | | | | 104 | | | | 70 | | | | 45 | | | | 35 | |
| * | Rates are not annualized for periods less than a year. |
| ** | Rates are annualized for periods less than a year. |
Note: Net investment income (loss) per share is based on the average shares outstanding during the year.
Performance cited represents past performance. Past performance does not guarantee future results and current performance may be lower or higher than the data quoted. Results shown are annual returns, which assume reinvestment of dividends and capital gains. Investment returns and principal will fluctuate and you may have a gain or loss when you sell shares. For the most current month-end performance information, please call 1-800-742-7272 or visit our Web site at www.williamblairfunds.com.
| 140 | Semiannual Report | June 30, 2020 |
Financial Highlights — For a share outstanding throughout each period
Small-Mid Cap Value Fund
| | | Class R6 | |
| | | (unaudited)
Period Ended
June 30, | | | Period Ended
December 31, | |
| | 2020 | | | 2019(a) | |
| Net asset value, beginning of year | | | $ | 11.13 | | | | $ | 10.93 | |
| Income (loss) from investment operations: | | | | | | | | | | |
| Net investment income (loss) | | | | 0.08 | | | | | 0.11 | |
| Net realized and unrealized gain (loss) on investments | | | | (2.72 | ) | | | | 0.31 | |
| Total from investment operations | | | | (2.64 | ) | | | | 0.42 | |
| Less distributions from: | | | | | | | | | | |
| Net investment income | | | | — | | | | | 0.06 | |
| Net realized gain | | | | — | | | | | 0.16 | |
| Total distributions | | | | — | | | | | 0.22 | |
| Net asset value, end of year | | | $ | 8.49 | | | | $ | 11.13 | |
| Total Return (%)* | | | | (23.81 | ) | | | | 3.89 | |
| Ratios to average daily net assets (%)**: | | | | | | | | | | |
| Expenses, before waivers and reimbursements | | | | 5.11 | | | | | 4.85 | |
| Expenses, net of waivers and reimbursements | | | | 0.92 | | | | | 0.95 | |
| Net investment income (loss), before waivers and reimbursements | | | | (2.34 | ) | | | | (2.41 | ) |
| Net investment income (loss), net of waivers and reimbursements | | | | 1.85 | | | | | 1.49 | |
| Class R6 net assets at the end of the year (in thousands) | | | $ | 229 | | | | $ | 171 | |
| Portfolio turnover rate (%)* | | | | 142 | | | | | 107 | |
| (a) | For the period from May 2, 2019 (Commencement of Operations) to December 31, 2019. |
| * | Rates are not annualized for periods less than a year. |
| ** | Rates are annualized for periods less than a year. |
Note: Net investment income (loss) per share is based on the average shares outstanding during the year.
Performance cited represents past performance. Past performance does not guarantee future results and current performance may be lower or higher than the data quoted. Results shown are annual returns, which assume reinvestment of dividends and capital gains. Investment returns and principal will fluctuate and you may have a gain or loss when you sell shares. For the most current month-end performance information, please call 1-800-742-7272 or visit our Web site at www.williamblairfunds.com.
| June 30, 2020 | William Blair Funds | 141 |
Financial Highlights — For a share outstanding throughout each period
Small Cap Growth Fund
| | | | | | | | | | | | | | | | | | Class N | |
| | (unaudited)
Period Ended
June 30, | | | Years Ended December 31, | |
| | | 2020 | | | 2019 | | | 2018 | | | 2017 | | | 2016 | | | 2015 | |
| Net asset value, beginning of year | | $ | 27.75 | | | $ | 23.23 | | | $ | 26.87 | | | $ | 25.24 | | | $ | 22.47 | | | $ | 25.61 | |
| Income (loss) from investment operations: | | | | | | | | | | | | | | | | | | | | | | | | |
| Net investment income (loss) | | | (0.12 | ) | | | (0.24 | ) | | | (0.27 | ) | | | (0.25 | ) | | | (0.18 | ) | | | (0.22 | ) |
| Net realized and unrealized gain (loss) on investments | | | (0.68 | ) | | | 5.40 | | | | (0.10 | ) | | | 6.88 | | | | 4.43 | | | | (0.93 | ) |
| Total from investment operations | | | (0.80 | ) | | | 5.16 | | | | (0.37 | ) | | | 6.63 | | | | 4.25 | | | | (1.15 | ) |
| Less distributions from: | | | | | | | | | | | | | | | | | | | | | | | | |
| Net investment income | | | — | | | | — | | | | — | | | | — | | | | — | | | | — | |
| Net realized gain | | | — | | | | 0.64 | | | | 3.27 | | | | 5.00 | | | | 1.48 | | | | 1.99 | |
| Total distributions | | | — | | | | 0.64 | | | | 3.27 | | | | 5.00 | | | | 1.48 | | | | 1.99 | |
| Net asset value, end of year | | $ | 26.95 | | | $ | 27.75 | | | $ | 23.23 | | | $ | 26.87 | | | $ | 25.24 | | | $ | 22.47 | |
| Total return (%)* | | | (2.88 | ) | | | 22.26 | | | | (2.14 | ) | | | 26.70 | | | | 18.89 | | | | (4.44 | ) |
| Ratios to average daily net assets (%)**: | | | | | | | | | | | | | | | | | | | | | | | | |
| Expenses, before waivers and reimbursements | | | 1.60 | | | | 1.54 | | | | 1.55 | | | | 1.54 | | | | 1.55 | | | | 1.59 | |
| Expenses, net of waivers and reimbursements | | | 1.50 | | | | 1.50 | | | | 1.50 | | | | 1.50 | | | | 1.50 | | | | 1.50 | |
| Net investment income (loss), before waivers and reimbursements | | | (1.06 | ) | | | (0.92 | ) | | | (0.94 | ) | | | (0.93 | ) | | | (0.84 | ) | | | (0.94 | ) |
| Net investment income (loss), net of waivers and reimbursements | | | (0.96 | ) | | | (0.88 | ) | | | (0.89 | ) | | | (0.89 | ) | | | (0.79 | ) | | | (0.85 | ) |
| Class N net assets at the end of the year (in thousands) | | $ | 141,873 | | | $ | 180,706 | | | $ | 169,074 | | | $ | 146,291 | | | $ | 117,068 | | | $ | 111,944 | |
| Portfolio turnover rate (%)* | | | 37 | | | | 51 | | | | 74 | | | | 81 | | | | 90 | | | | 91 | |
| | | | | | | | | | | | | | | | | | | | | | | | | |
| | | | | | | | | | | | | | | | | | | | | | | | Class I | |
| | (unaudited)
Period Ended
June 30, | | | Years Ended December 31, | |
| | | | 2020 | | | | 2019 | | | | 2018 | | | | 2017 | | | | 2016 | | | | 2015 | |
| Net asset value, beginning of year | | $ | 31.19 | | | $ | 25.99 | | | $ | 29.61 | | | $ | 27.34 | | | $ | 24.17 | | | $ | 27.32 | |
| Income (loss) from investment operations: | | | | | | | | | | | | | | | | | | | | | | | | |
| Net investment income (loss) | | | (0.10 | ) | | | (0.19 | ) | | | (0.21 | ) | | | (0.20 | ) | | | (0.13 | ) | | | (0.17 | ) |
| Net realized and unrealized gain (loss) on investments | | | (0.75 | ) | | | 6.03 | | | | (0.14 | ) | | | 7.47 | | | | 4.78 | | | | (0.99 | ) |
| Total from investment operations | | | (0.85 | ) | | | 5.84 | | | | (0.35 | ) | | | 7.27 | | | | 4.65 | | | | (1.16 | ) |
| Less distributions from: | | | | | | | | | | | | | | | | | | | | | | | | |
| Net investment income | | | — | | | | — | | | | — | | | | — | | | | — | | | | — | |
| Net realized gain | | | — | | | | 0.64 | | | | 3.27 | | | | 5.00 | | | | 1.48 | | | | 1.99 | |
| Total distributions | | | — | | | | 0.64 | | | | 3.27 | | | | 5.00 | | | | 1.48 | | | | 1.99 | |
| Net asset value, end of year | | $ | 30.34 | | | $ | 31.19 | | | $ | 25.99 | | | $ | 29.61 | | | $ | 27.34 | | | $ | 24.17 | |
| Total return (%)* | | | (2.73 | ) | | | 22.51 | | | | (1.88 | ) | | | 26.99 | | | | 19.22 | | | | (4.20 | ) |
| Ratios to average daily net assets (%)**: | | | | | | | | | | | | | | | | | | | | | | | | |
| Expenses, before waivers and reimbursements | | | 1.31 | | | | 1.27 | | | | 1.25 | | | | 1.25 | | | | 1.27 | | | | 1.30 | |
| Expenses, net of waivers and reimbursements | | | 1.25 | | | | 1.25 | | | | 1.25 | | | | 1.25 | | | | 1.25 | | | | 1.25 | |
| Net investment income (loss), before waivers and reimbursements | | | (0.78 | ) | | | (0.65 | ) | | | (0.65 | ) | | | (0.64 | ) | | | (0.56 | ) | | | (0.66 | ) |
| Net investment income (loss), net of waivers and reimbursements | | | (0.72 | ) | | | (0.63 | ) | | | (0.65 | ) | | | (0.64 | ) | | | (0.54 | ) | | | (0.61 | ) |
| Class I net assets at the end of the year (in thousands) | | $ | 312,187 | | | $ | 423,881 | | | $ | 410,233 | | | $ | 343,119 | | | $ | 271,830 | | | $ | 261,269 | |
| Portfolio turnover rate (%)* | | | 37 | | | | 51 | | | | 74 | | | | 81 | | | | 90 | | | | 91 | |
| * | Rates are not annualized for periods less than a year. |
| ** | Rates are annualized for periods less than a year. |
Note: Net investment income (loss) per share is based on the average shares outstanding during the year.
Performance cited represents past performance. Past performance does not guarantee future results and current performance may be lower or higher than the data quoted. Results shown are annual returns, which assume reinvestment of dividends and capital gains. Investment returns and principal will fluctuate and you may have a gain or loss when you sell shares. For the most current month-end performance information, please call 1-800-742-7272 or visit our Web site at www.williamblairfunds.com.
| 142 | Semiannual Report | June 30, 2020 |
Financial Highlights — For a share outstanding throughout each period
Small Cap Growth Fund
| | | Class R6 | |
| | | (unaudited)
Period Ended
June 30, | | |
Period Ended
December 31, | |
| | 2020 | | | 2019(a) | |
| Net asset value, beginning of year | | | $ | 31.20 | | | | $ | 31.00 | |
| Income (loss) from investment operations: | | | | | | | | | | |
| Net investment income (loss) | | | | (0.09 | ) | | | | (0.11 | ) |
| Net realized and unrealized gain (loss) on investments | | | | (0.76 | ) | | | | 0.95 | |
| Total from investment operations | | | | (0.85 | ) | | | | 0.84 | |
| Less distributions from: | | | | | | | | | | |
| Net investment income | | | | — | | | | | — | |
| Net realized gain | | | | — | | | | | 0.64 | |
| Total distributions | | | | — | | | | | 0.64 | |
| Net asset value, end of year | | | $ | 30.35 | | | | $ | 31.20 | |
| Total Return (%)* | | | | (2.72 | ) | | | | 2.75 | |
| Ratios to average daily net assets (%)**: | | | | | | | | | | |
| Expenses | | | | 1.20 | | | | | 1.18 | |
| Net investment income (loss) | | | | (0.65 | ) | | | | (0.51 | ) |
| Class R6 net assets at the end of the year (in thousands) | | | $ | 64,128 | | | | $ | 65,950 | |
| Portfolio turnover rate (%)* | | | | 37 | | | | | 51 | |
| (a) | For the period from May 2, 2019 (Commencement of Operations) to December 31, 2019. |
| * | Rates are not annualized for periods less than a year. |
| ** | Rates are annualized for periods less than a year. |
Note: Net investment income (loss) per share is based on the average shares outstanding during the year.
Performance cited represents past performance. Past performance does not guarantee future results and current performance may be lower or higher than the data quoted. Results shown are annual returns, which assume reinvestment of dividends and capital gains. Investment returns and principal will fluctuate and you may have a gain or loss when you sell shares. For the most current month-end performance information, please call 1-800-742-7272 or visit our Web site at www.williamblairfunds.com.
| June 30, 2020 | William Blair Funds | 143 |
Financial Highlights — For a share outstanding throughout each period
Small Cap Value Fund
| | | | Class N | |
| | | (unaudited) | | | | | | | | | | | | | | | | |
| | | Period Ended | | | | | | | | | | | | | | | | |
| | | June 30, | | | Years Ended December 31, | |
| | | | 2020 | | | 2019 | | | 2018 | | | 2017 | | | 2016 | | | 2015 | |
| Net asset value, beginning of year | | | $ | 17.47 | | | $ | 15.04 | | | $ | 20.15 | | | $ | 20.18 | | | $ | 16.68 | | | $ | 17.76 | |
| Income (loss) from investment operations: | | | | | | | | | | | | | | | | | | | | | | | | | |
| Net investment income (loss) | | | | 0.04 | | | | 0.09 | | | | 0.03 | | | | 0.01 | | | | 0.04 | | | | 0.02 | |
| Net realized and unrealized gain (loss) on investments | | | | (4.21 | ) | | | 2.92 | | | | (3.12 | ) | | | 1.50 | | | | 4.34 | | | | (1.05 | ) |
| Total from investment operations | | | | (4.17 | ) | | | 3.01 | | | | (3.09 | ) | | | 1.51 | | | | 4.38 | | | | (1.03 | ) |
| Less distributions from: | | | | | | | | | | | | | | | | | | | | | | | | | |
| Net investment income | | | | — | | | | 0.09 | | | | — | | | | — | | | | 0.04 | | | | — | |
| Net realized gain | | | | 3.04 | | | | 0.49 | | | | 2.02 | | | | 1.54 | | | | 0.84 | | | | 0.05 | |
| Total distributions | | | | 3.04 | | | | 0.58 | | | | 2.02 | | | | 1.54 | | | | 0.88 | | | | 0.05 | |
| Net asset value, end of year | | | $ | 10.26 | | | $ | 17.47 | | | $ | 15.04 | | | $ | 20.15 | | | $ | 20.18 | | | $ | 16.68 | |
| Total return (%)* | | | | (26.37 | ) | | | 20.09 | | | | (15.93 | ) | | | 7.57 | | | | 26.19 | | | | (5.77 | ) |
| Ratios to average daily net assets (%)**: | | | | | | | | | | | | | | | | | | | | | | | | | |
| Expenses, before waivers and reimbursements | | | | 1.75 | | | | 1.55 | | | | 1.56 | | | | 1.55 | | | | 1.53 | | | | 1.54 | |
| Expenses, net of waivers and reimbursements | | | | 1.42 | | | | 1.50 | | | | 1.50 | | | | 1.50 | | | | 1.50 | | | | 1.50 | |
| Net investment income (loss), before waivers and reimbursements | | | | 0.27 | | | | 0.49 | | | | 0.08 | | | | (0.01 | ) | | | 0.19 | | | | 0.10 | |
| Net investment income (loss), net of waivers and reimbursements | | | | 0.60 | | | | 0.54 | | | | 0.14 | | | | 0.04 | | | | 0.22 | | | | 0.14 | |
| Class N net assets at the end of the year (in thousands) | | | $ | 7,027 | | | $ | 12,672 | | | $ | 16,381 | | | $ | 29,271 | | | $ | 33,359 | | | $ | 33,351 | |
| Portfolio turnover rate (%)* | | | | 43 | | | | 116 | | | | 56 | | | | 38 | | | | 33 | | | | 30 | |
| | | | | | | | | | | | | | | | | | | | | | | | | | |
| | | | Class I | |
| | (unaudited) | | | | |
| | | Period Ended | | | |
| | | June 30, | | | Years Ended December 31, | |
| | | | 2020 | | | 2019 | | | 2018 | | | 2017 | | | 2016 | | | 2015 | |
| Net asset value, beginning of year | | | $ | 18.02 | | | $ | 15.50 | | | $ | 20.70 | | | $ | 20.68 | | | $ | 17.08 | | | $ | 18.17 | |
| Income (loss) from investment operations: | | | | | | | | | | | | | | | | | | | | | | | | | |
| Net investment income (loss) | | | | 0.05 | | | | 0.14 | | | | 0.08 | | | | 0.06 | | | | 0.09 | | | | 0.08 | |
| Net realized and unrealized gain (loss) on investments | | | | (4.35 | ) | | | 3.01 | | | | (3.21 | ) | | | 1.54 | | | | 4.44 | | | | (1.08 | ) |
| Total from investment operations | | | | (4.30 | ) | | | 3.15 | | | | (3.13 | ) | | | 1.60 | | | | 4.53 | | | | (1.00 | ) |
| Less distributions from: | | | | | | | | | | | | | | | | | | | | | | | | | |
| Net investment income | | | | — | | | | 0.14 | | | | 0.05 | | | | 0.04 | | | | 0.09 | | | | 0.04 | |
| Net realized gain | | | | 3.04 | | | | 0.49 | | | | 2.02 | | | | 1.54 | | | | 0.84 | | | | 0.05 | |
| Total distributions | | | | 3.04 | | | | 0.63 | | | | 2.07 | | | | 1.58 | | | | 0.93 | | | | 0.09 | |
| Net asset value, end of year | | | $ | 10.68 | | | $ | 18.02 | | | $ | 15.50 | | | $ | 20.70 | | | $ | 20.68 | | | $ | 17.08 | |
| Total return (%)* | | | | (26.34 | ) | | | 20.45 | | | | (15.74 | ) | | | 7.85 | | | | 26.46 | | | | (5.47 | ) |
| Ratios to average daily net assets (%)**: | | | | | | | | | | | | | | | | | | | | | | | | | |
| Expenses, before waivers and reimbursements | | | | 1.47 | | | | 1.31 | | | | 1.30 | | | | 1.29 | | | | 1.29 | | | | 1.24 | |
| Expenses, net of waivers and reimbursements | | | | 1.17 | | | | 1.25 | | | | 1.25 | | | | 1.25 | | | | 1.25 | | | | 1.24 | |
| Net investment income (loss), before waivers and reimbursements | | | | 0.54 | | | | 0.74 | | | | 0.36 | | | | 0.25 | | | | 0.43 | | | | 0.43 | |
| Net investment income (loss), net of waivers and reimbursements | | | | 0.84 | | | | 0.80 | | | | 0.41 | | | | 0.29 | | | | 0.47 | | | | 0.43 | |
| Class I net assets at the end of the year (in thousands) | | | $ | 90,613 | | | $ | 162,093 | | | $ | 475,134 | | | $ | 644,749 | | | $ | 675,272 | | | $ | 579,010 | |
| Portfolio turnover rate (%)* | | | | 43 | | | | 116 | | | | 56 | | | | 38 | | | | 33 | | | | 30 | |
| * | Rates are not annualized for periods less than a year. |
| ** | Rates are annualized for periods less than a year. |
Note: Net investment income (loss) per share is based on the average shares outstanding during the year.
Performance cited represents past performance. Past performance does not guarantee future results and current performance may be lower or higher than the data quoted. Results shown are annual returns, which assume reinvestment of dividends and capital gains. Investment returns and principal will fluctuate and you may have a gain or loss when you sell shares. For the most current month-end performance information, please call 1-800-742-7272 or visit our Web site at www.williamblairfunds.com.
| 144 | Semiannual Report | June 30, 2020 |
Financial Highlights — For a share outstanding throughout each period
Small Cap Value Fund
| | | | | | | Class R6 | |
| | | (unaudited) | | | | | |
| | | Period Ended | | | Period Ended | |
| | | June 30, | | | December 31, | |
| | | 2020 | | | 2019(a) | |
| Net asset value, beginning of year | | | $ | 18.03 | | | | $ | 18.19 | |
| Income (loss) from investment operations: | | | | | | | | | | |
| Net investment income (loss) | | | | 0.06 | | | | | 0.16 | |
| Net realized and unrealized gain (loss) on investments | | | | (4.36 | ) | | | | 0.32 | |
| Total from investment operations | | | | (4.30 | ) | | | | 0.48 | |
| Less distributions from: | | | | | | | | | | |
| Net investment income | | | | — | | | | | 0.15 | |
| Net realized gain | | | | 3.04 | | | | | 0.49 | |
| Total distributions | | | | 3.04 | | | | | 0.64 | |
| Net asset value, end of year | | | $ | 10.69 | | | | $ | 18.03 | |
| Total Return (%)* | | | | (26.27 | ) | | | | 2.69 | |
| Ratios to average daily net assets (%)**: | | | | | | | | | | |
| Expenses, before waivers and reimbursements | | | | 1.30 | | | | | 1.17 | |
| Expenses, net of waivers and reimbursements | | | | 1.12 | | | | | 1.17 | |
| Net investment income (loss), before waivers and reimbursements | | | | 0.76 | | | | | 1.28 | |
| Net investment income (loss), net of waivers and reimbursements | | | | 0.94 | | | | | 1.28 | |
| Class R6 net assets at the end of the year (in thousands) | | | $ | 474 | | | | $ | 513 | |
| Portfolio turnover rate (%)* | | | | 43 | | | | | 116 | |
| (a) | For the period from May 2, 2019 (Commencement of Operations) to December 31, 2019. |
| * | Rates are not annualized for periods less than a year. |
| ** | Rates are annualized for periods less than a year. |
Note: Net investment income (loss) per share is based on the average shares outstanding during the year.
Performance cited represents past performance. Past performance does not guarantee future results and current performance may be lower or higher than the data quoted. Results shown are annual returns, which assume reinvestment of dividends and capital gains. Investment returns and principal will fluctuate and you may have a gain or loss when you sell shares. For the most current month-end performance information, please call 1-800-742-7272 or visit our Web site at www.williamblairfunds.com.
| June 30, 2020 | William Blair Funds | 145 |
Financial Highlights — For a share outstanding throughout each period
Global Leaders Fund
| | | | Class N | |
| | (unaudited) | | | | | | | | | | | | | | | | |
| | | Period Ended | | | | | | | | | | | | | | | | |
| | | June 30, | | | Years Ended December 31, | |
| | | | 2020 | | | 2019 | | | 2018 | | | 2017 | | | 2016 | | | 2015 | |
| Net asset value, beginning of year | | | $ | 14.92 | | | $ | 11.47 | | | $ | 14.53 | | | $ | 11.60 | | | $ | 11.58 | | | $ | 11.84 | |
| Income (loss) from investment operations: | | | | | | | | | | | | | | | | | | | | | | | | | |
| Net investment income (loss) | | | | (0.01 | ) | | | 0.01 | | | | 0.02 | | | | 0.05 | | | | 0.03 | | | | 0.02 | |
| Net realized and unrealized gain (loss) on investments | | | | 0.34 | | | | 3.61 | | | | (1.12 | ) | | | 3.46 | | | | 0.04 | | | | 0.27 | |
| Total from investment operations | | | | 0.33 | | | | 3.62 | | | | (1.10 | ) | | | 3.51 | | | | 0.07 | | | | 0.29 | |
| Less distributions from: | | | | | | | | | | | | | | | | | | | | | | | | | |
| Net investment income | | | | — | | | | 0.03 | | | | — | | | | 0.10 | | | | — | | | | 0.01 | |
| Net realized gain | | | | — | | | | 0.14 | | | | 1.96 | | | | 0.48 | | | | 0.05 | | | | 0.54 | |
| Total distributions | | | | — | | | | 0.17 | | | | 1.96 | | | | 0.58 | | | | 0.05 | | | | 0.55 | |
| Net asset value, end of year | | | $ | 15.25 | | | $ | 14.92 | | | $ | 11.47 | | | $ | 14.53 | | | $ | 11.60 | | | $ | 11.58 | |
| Total return (%)* | | | | 2.21 | | | | 31.57 | | | | (8.23 | ) | | | 30.31 | | | | 0.62 | | | | 2.49 | |
| Ratios to average daily net assets (%)**: | | | | | | | | | | | | | | | | | | | | | | | | | |
| Expenses, before waivers and reimbursements | | | | 1.40 | | | | 1.39 | | | | 1.47 | | | | 1.63 | | | | 1.62 | | | | 1.61 | |
| Expenses, net of waivers and reimbursements | | | | 1.15 | | | | 1.20 | | | | 1.33 | | | | 1.37 | | | | 1.36 | | | | 1.39 | |
| Net investment income (loss), before waivers and reimbursements | | | | (0.35 | ) | | | (0.10 | ) | | | (0.01 | ) | | | 0.09 | | | | (0.03 | ) | | | (0.10 | ) |
| Net investment income (loss), net of waivers and reimbursements | | | | (0.10 | ) | | | 0.09 | | | | 0.13 | | | | 0.35 | | | | 0.23 | | | | 0.12 | |
| Class N net assets at the end of the year (in thousands) | | | $ | 8,862 | | | $ | 8,910 | | | $ | 7,225 | | | $ | 7,761 | | | $ | 5,760 | | | $ | 5,588 | |
| Portfolio turnover rate (%)* | | | | 20 | | | | 27 | | | | 49 | | | | 41 | | | | 75 | | | | 55 | |
| | | | | | | | | | | | | | | | | | | | | | | | | | |
| | | | Class I | |
| | (unaudited) | | | | | | | | | | | | | | | | |
| | | Period Ended | | | | | | | | | | | | | | | | |
| | | June 30, | | | Years Ended December 31, | |
| | | | 2020 | | | 2019 | | | 2018 | | | 2017 | | | 2016 | | | 2015 | |
| Net asset value, beginning of year | | | $ | 14.93 | | | $ | 11.47 | | | $ | 14.56 | | | $ | 11.62 | | | $ | 11.59 | | | $ | 11.85 | |
| Income (loss) from investment operations: | | | | | | | | | | | | | | | | | | | | | | | | | |
| Net investment income (loss) | | | | 0.01 | | | | 0.05 | | | | 0.06 | | | | 0.09 | | | | 0.06 | | | | 0.06 | |
| Net realized and unrealized gain (loss) on investments | | | | 0.34 | | | | 3.61 | | | | (1.13 | ) | | | 3.47 | | | | 0.05 | | | | 0.26 | |
| Total from investment operations | | | | 0.35 | | | | 3.66 | | | | (1.07 | ) | | | 3.56 | | | | 0.11 | | | | 0.32 | |
| Less distributions from: | | | | | | | | | | | | | | | | | | | | | | | | | |
| Net investment income | | | | — | | | | 0.06 | | | | 0.06 | | | | 0.14 | | | | 0.03 | | | | 0.04 | |
| Net realized gain | | | | — | | | | 0.14 | | | | 1.96 | | | | 0.48 | | | | 0.05 | | | | 0.54 | |
| Total distributions | | | | — | | | | 0.20 | | | | 2.02 | | | | 0.62 | | | | 0.08 | | | | 0.58 | |
| Net asset value, end of year | | | $ | 15.28 | | | $ | 14.93 | | | $ | 11.47 | | | $ | 14.56 | | | $ | 11.62 | | | $ | 11.59 | |
| Total return (%)* | | | | 2.34 | | | | 31.96 | | | | (8.06 | ) | | | 30.69 | | | | 0.98 | | | | 2.77 | |
| Ratios to average daily net assets (%)**: | | | | | | | | | | | | | | | | | | | | | | | | | |
| Expenses, before waivers and reimbursements | | | | 1.09 | | | | 1.07 | | | | 1.15 | | | | 1.33 | | | | 1.31 | | | | 1.32 | |
| Expenses, net of waivers and reimbursements | | | | 0.90 | | | | 0.95 | | | | 1.07 | | | | 1.07 | | | | 1.05 | | | | 1.10 | |
| Net investment income (loss), before waivers and reimbursements | | | | (0.04 | ) | | | 0.22 | | | | 0.31 | | | | 0.39 | | | | 0.28 | | | | 0.23 | |
| Net investment income (loss), net of waivers and reimbursements | | | | 0.15 | | | | 0.34 | | | | 0.39 | | | | 0.65 | | | | 0.54 | | | | 0.45 | |
| Class I net assets at the end of the year (in thousands) | | | $ | 86,976 | | | $ | 114,666 | | | $ | 83,790 | | | $ | 60,067 | | | $ | 45,772 | | | $ | 45,853 | |
| Portfolio turnover rate (%)* | | | | 20 | | | | 27 | | | | 49 | | | | 41 | | | | 75 | | | | 55 | |
| * | Rates are not annualized for periods less than a year. |
| ** | Rates are annualized for periods less than a year. |
Note: Net investment income (loss) per share is based on the average shares outstanding during the year.
Performance cited represents past performance. Past performance does not guarantee future results and current performance may be lower or higher than the data quoted. Results shown are annual returns, which assume reinvestment of dividends and capital gains. Investment returns and principal will fluctuate and you may have a gain or loss when you sell shares. For the most current month-end performance information, please call 1-800-742-7272 or visit our Web site at www.williamblairfunds.com.
| 146 | Semiannual Report | June 30, 2020 |
Financial Highlights — For a share outstanding throughout each period
Global Leaders Fund
| | | | Class R6 | |
| | (unaudited) | | | | | | | | | | | | | | | | |
| | | Period Ended | | | | | | | | | | | | | | | | |
| | | June 30, | | | Years Ended December 31, | |
| | | | 2020 | | | 2019 | | | 2018 | | | 2017 | | | 2016 | | | 2015 | |
| Net asset value, beginning of year | | | $ | 14.93 | | | $ | 11.47 | | | $ | 14.56 | | | $ | 11.62 | | | $ | 11.59 | | | $ | 11.85 | |
| Income (loss) from investment operations: | | | | | | | | | | | | | | | | | | | | | | | | | |
| Net investment income (loss) | | | | 0.01 | | | | 0.06 | | | | 0.07 | | | | 0.10 | | | | 0.07 | | | | 0.06 | |
| Net realized and unrealized gain (loss) on investments | | | | 0.35 | | | | 3.61 | | | | (1.13 | ) | | | 3.47 | | | | 0.05 | | | | 0.27 | |
| Total from investment operations | | | | 0.36 | | | | 3.67 | | | | (1.06 | ) | | | 3.57 | | | | 0.12 | | | | 0.33 | |
| Less distributions from: | | | | | | | | | | | | | | | | | | | | | | | | | |
| Net investment income | | | | — | | | | 0.07 | | | | 0.07 | | | | 0.15 | | | | 0.04 | | | | 0.05 | |
| Net realized gain | | | | — | | | | 0.14 | | | | 1.96 | | | | 0.48 | | | | 0.05 | | | | 0.54 | |
| Total distributions | | | | — | | | | 0.21 | | | | 2.03 | | | | 0.63 | | | | 0.09 | | | | 0.59 | |
| Net asset value, end of year | | | $ | 15.29 | | | $ | 14.93 | | | $ | 11.47 | | | $ | 14.56 | | | $ | 11.62 | | | $ | 11.59 | |
| Total return (%)* | | | | 2.41 | | | | 32.02 | | | | (7.99 | ) | | | 30.78 | | | | 1.03 | | | | 2.85 | |
| Ratios to average daily net assets (%)**: | | | | | | | | | | | | | | | | | | | | | | | | | |
| Expenses, before waivers and reimbursements | | | | 1.01 | | | | 1.01 | | | | 1.08 | | | | 1.10 | | | | 1.11 | | | | 1.11 | |
| Expenses, net of waivers and reimbursements | | | | 0.85 | | | | 0.90 | | | | 1.00 | | | | 1.00 | | | | 1.00 | | | | 1.03 | |
| Net investment income (loss), before waivers and reimbursements | | | | (0.03 | ) | | | 0.32 | | | | 0.39 | | | | 0.65 | | | | 0.48 | | | | 0.39 | |
| Net investment income (loss), net of waivers and reimbursements | | | | 0.13 | | | | 0.43 | | | | 0.47 | | | | 0.75 | | | | 0.59 | | | | 0.47 | |
| Class R6 net assets at the end of the year (in thousands) | | | $ | 1,197 | | | $ | 48,133 | | | $ | 79,685 | | | $ | 143,521 | | | $ | 125,199 | | | $ | 137,527 | |
| Portfolio turnover rate (%)* | | | | 20 | | | | 27 | | | | 49 | | | | 41 | | | | 75 | | | | 55 | |
| * | Rates are not annualized for periods less than a year. |
| ** | Rates are annualized for periods less than a year. |
Note: Net investment income (loss) per share is based on the average shares outstanding during the year.
Performance cited represents past performance. Past performance does not guarantee future results and current performance may be lower or higher than the data quoted. Results shown are annual returns, which assume reinvestment of dividends and capital gains. Investment returns and principal will fluctuate and you may have a gain or loss when you sell shares. For the most current month-end performance information, please call 1-800-742-7272 or visit our Web site at www.williamblairfunds.com.
| June 30, 2020 | William Blair Funds | 147 |
Financial Highlights — For a share outstanding throughout each period
International Leaders Fund
| | | Class N | |
| | | (unaudited)
Period Ended
June 30, | | | Years Ended December 31, | |
| | | 2020 | | | 2019 | | | 2018 | | | 2017 | | | 2016 | | | 2015 | |
| Net asset value, beginning of year | | $ | 18.08 | | | $ | 13.80 | | | $ | 16.37 | | | $ | 12.88 | | | $ | 12.89 | | | $ | 12.25 | |
| Income (loss) from investment operations: | | | | | | | | | | | | | | | | | | | | | | | | |
| Net investment income (loss) | | | 0.01 | | | | 0.09 | | | | 0.13 | | | | 0.11 | | | | 0.03 | | | | 0.07 | |
| Net realized and unrealized gain (loss) on investments | | | (0.24 | ) | | | 4.25 | | | | (2.19 | ) | | | 3.70 | | | | 0.08 | | | | 0.66 | |
| Total from investment operations | | | (0.23 | ) | | | 4.34 | | | | (2.06 | ) | | | 3.81 | | | | 0.11 | | | | 0.73 | |
| Less distributions from: | | | | | | | | | | | | | | | | | | | | | | | | |
| Net investment income | | | — | | | | 0.06 | | | | 0.06 | | | | 0.20 | | | | 0.12 | | | | 0.02 | |
| Net realized gain | | | — | | | | — | | | | 0.45 | | | | 0.12 | | | | — | | | | 0.07 | |
| Total distributions | | | — | | | | 0.06 | | | | 0.51 | | | | 0.32 | | | | 0.12 | | | | 0.09 | |
| Net asset value, end of year | | $ | 17.85 | | | $ | 18.08 | | | $ | 13.80 | | | $ | 16.37 | | | $ | 12.88 | | | $ | 12.89 | |
| Total return (%)* | | | (1.27 | ) | | | 31.46 | | | | (12.70 | ) | | | 29.65 | | | | 0.88 | | | | 6.01 | |
| Ratios to average daily net assets (%)**: | | | | | | | | | | | | | | | | | | | | | | | | |
| Expenses, before waivers and reimbursements | | | 1.31 | | | | 1.32 | | | | 1.39 | | | | 1.59 | | | | 1.56 | | | | 1.56 | |
| Expenses, net of waivers and reimbursements | | | 1.15 | | | | 1.18 | | | | 1.28 | | | | 1.35 | | | | 1.30 | | | | 1.24 | |
| Net investment income (loss), before waivers and reimbursements | | | (0.03 | ) | | | 0.44 | | | | 0.70 | | | | 0.48 | | | | (0.02 | ) | | | 0.19 | |
| Net investment income (loss), net of waivers and reimbursements | | | 0.13 | | | | 0.58 | | | | 0.81 | | | | 0.72 | | | | 0.24 | | | | 0.51 | |
| Class N net assets at the end of the year (in thousands) | | $ | 8,102 | | | $ | 11,163 | | | $ | 8,715 | | | $ | 9,651 | | | $ | 2,922 | | | $ | 377 | |
| Portfolio turnover rate (%)* | | | 20 | | | | 20 | | | | 33 | | | | 41 | | | | 59 | | | | 29 | |
| | | | | | | | | | | | | | | | | | | | | | | | | |
| | | Class I | |
| | | | (unaudited)
Period Ended
June 30, | | | Years Ended December 31, | |
| | | | 2020 | | | | 2019 | | | | 2018 | | | | 2017 | | | | 2016 | | | | 2015 | |
| Net asset value, beginning of year | | $ | 18.13 | | | $ | 13.84 | | | $ | 16.44 | | | $ | 12.92 | | | $ | 12.91 | | | $ | 12.25 | |
| Income (loss) from investment operations: | | | | | | | | | | | | | | | | | | | | | | | | |
| Net investment income (loss) | | | 0.03 | | | | 0.12 | | | | 0.17 | | | | 0.16 | | | | 0.10 | | | | 0.10 | |
| Net realized and unrealized gain (loss) on investments | | | (0.24 | ) | | | 4.27 | | | | (2.19 | ) | | | 3.71 | | | | 0.04 | | | | 0.65 | |
| Total from investment operations | | | (0.21 | ) | | | 4.39 | | | | (2.02 | ) | | | 3.87 | | | | 0.14 | | | | 0.75 | |
| Less distributions from: | | | | | | | | | | | | | | | | | | | | | | | | |
| Net investment income | | | — | | | | 0.10 | | | | 0.13 | | | | 0.23 | | | | 0.13 | | | | 0.02 | |
| Net realized gain | | | — | | | | — | | | | 0.45 | | | | 0.12 | | | | — | | | | 0.07 | |
| Total distributions | | | — | | | | 0.10 | | | | 0.58 | | | | 0.35 | | | | 0.13 | | | | 0.09 | |
| Net asset value, end of year | | $ | 17.92 | | | $ | 18.13 | | | $ | 13.84 | | | $ | 16.44 | | | $ | 12.92 | | | $ | 12.91 | |
| Total return (%)* | | | (1.16 | ) | | | 31.76 | | | | (12.45 | ) | | | 30.05 | | | | 1.10 | | | | 6.18 | |
| Ratios to average daily net assets (%)**: | | | | | | | | | | | | | | | | | | | | | | | | |
| Expenses, before waivers and reimbursements. | | | 0.99 | | | | 1.01 | | | | 1.07 | | | | 1.28 | | | | 1.30 | | | | 1.46 | |
| Expenses, net of waivers and reimbursements | | | 0.90 | | | | 0.93 | | | | 1.03 | | | | 1.05 | | | | 1.04 | | | | 1.13 | |
| Net investment income (loss), before waivers and reimbursements | | | 0.29 | | | | 0.64 | | | | 1.02 | | | | 0.86 | | | | 0.48 | | | | 0.42 | |
| Net investment income (loss), net of waivers and reimbursements | | | 0.38 | | | | 0.72 | | | | 1.06 | | | | 1.09 | | | | 0.74 | | | | 0.75 | |
| Class I net assets at the end of the year (in thousands) | | $ | 187,634 | | | $ | 181,617 | | | $ | 76,382 | | | $ | 60,279 | | | $ | 30,944 | | | $ | 13,474 | |
| Portfolio turnover rate (%)* | | | 20 | | | | 20 | | | | 33 | | | | 41 | | | | 59 | | | | 29 | |
| * | Rates are not annualized for periods less than a year. |
| ** | Rates are annualized for periods less than a year. |
Note: Net investment income (loss) per share is based on the average shares outstanding during the year.
Performance cited represents past performance. Past performance does not guarantee future results and current performance may be lower or higher than the data quoted. Results shown are annual returns, which assume reinvestment of dividends and capital gains. Investment returns and principal will fluctuate and you may have a gain or loss when you sell shares. For the most current month-end performance information, please call 1-800-742-7272 or visit our Web site at www.williamblairfunds.com.
| 148 | Semiannual Report | June 30, 2020 |
Financial Highlights — For a share outstanding throughout each period
International Leaders Fund
| | | Class R6 | |
| | | (unaudited)
Period Ended
June 30, | | | Years Ended December 31, | |
| | | 2020 | | | 2019 | | | 2018 | | | 2017 | | | 2016 | | | 2015 | |
| Net asset value, beginning of year | | $ | 18.12 | | | $ | 13.83 | | | $ | 16.43 | | | $ | 12.92 | | | $ | 12.90 | | | $ | 12.24 | |
| Income (loss) from investment operations: | | | | | | | | | | | | | | | | | | | | | | | | |
| Net investment income (loss) | | | 0.04 | | | | 0.14 | | | | 0.18 | | | | 0.18 | | | | 0.12 | | | | 0.11 | |
| Net realized and unrealized gain (loss) on investments | | | (0.24 | ) | | | 4.26 | | | | (2.19 | ) | | | 3.70 | | | | 0.04 | | | | 0.66 | |
| Total from investment operations | | | (0.20 | ) | | | 4.40 | | | | (2.01 | ) | | | 3.88 | | | | 0.16 | �� | | | 0.77 | |
| Less distributions from: | | | | | | | | | | | | | | | | | | | | | | | | |
| Net investment income | | | — | | | | 0.11 | | | | 0.14 | | | | 0.25 | | | | 0.14 | | | | 0.04 | |
| Net realized gain | | | — | | | | — | | | | 0.45 | | | | 0.12 | | | | — | | | | 0.07 | |
| Total distributions | | | — | | | | 0.11 | | | | 0.59 | | | | 0.37 | | | | 0.14 | | | | 0.11 | |
| Net asset value, end of year | | $ | 17.92 | | | $ | 18.12 | | | $ | 13.83 | | | $ | 16.43 | | | $ | 12.92 | | | $ | 12.90 | |
| Total return (%)* | | | (1.10 | ) | | | 31.83 | | | | (12.38 | ) | | | 30.08 | | | | 1.25 | | | | 6.33 | |
| Ratios to average daily net assets (%)**: | | | | | | | | | | | | | | | | | | | | | | | | |
| Expenses, before waivers and reimbursements | | | 0.92 | | | | 0.93 | | | | 0.99 | | | | 1.03 | | | | 1.06 | | | | 1.15 | |
| Expenses, net of waivers and reimbursements | | | 0.85 | | | | 0.88 | | | | 0.95 | | | | 0.95 | | | | 0.95 | | | | 0.98 | |
| Net investment income (loss), before waivers and reimbursements | | | 0.36 | | | | 0.80 | | | | 1.07 | | | | 1.10 | | | | 0.81 | | | | 0.71 | |
| Net investment income (loss), net of waivers and reimbursements | | | 0.43 | | | | 0.85 | | | | 1.11 | | | | 1.18 | | | | 0.92 | | | | 0.88 | |
| Class R6 net assets at the end of the year (in thousands) | | $ | 466,725 | | | $ | 461,124 | | | $ | 324,902 | | | $ | 308,898 | | | $ | 221,356 | | | $ | 102,227 | |
| Portfolio turnover rate (%)* | | | 20 | | | | 20 | | | | 33 | | | | 41 | | | | 59 | | | | 29 | |
| * | Rates are not annualized for periods less than a year. |
| ** | Rates are annualized for periods less than a year. |
Note: Net investment income (loss) per share is based on the average shares outstanding during the year.
Performance cited represents past performance. Past performance does not guarantee future results and current performance may be lower or higher than the data quoted. Results shown are annual returns, which assume reinvestment of dividends and capital gains. Investment returns and principal will fluctuate and you may have a gain or loss when you sell shares. For the most current month-end performance information, please call 1-800-742-7272 or visit our Web site at www.williamblairfunds.com.
| June 30, 2020 | William Blair Funds | 149 |
Financial Highlights — For a share outstanding throughout each period
International Growth Fund
| | | Class N | |
| | | (unaudited)
Period Ended
June 30, | | | Years Ended December 31, | |
| | | 2020 | | | 2019 | | | 2018 | | | 2017 | | | 2016 | | | 2015 | |
| Net asset value, beginning of year | | $ | 29.68 | | | $ | 23.04 | | | $ | 30.41 | | | $ | 23.86 | | | $ | 24.94 | | | $ | 25.24 | |
| Income (loss) from investment operations: | | | | | | | | | | | | | | | | | | | | | | | | |
| Net investment income (loss) | | | (0.05 | ) | | | 0.09 | | | | 0.16 | | | | 0.21 | | | | 0.20 | | | | 0.18 | |
| Net realized and unrealized gain (loss) on investments | | | 0.13 | | | | 6.87 | | | | (5.56 | ) | | | 6.73 | | | | (0.92 | ) | | | (0.25 | ) |
| Total from investment operations | | | 0.08 | | | | 6.96 | | | | (5.40 | ) | | | 6.94 | | | | (0.72 | ) | | | (0.07 | ) |
| Less distributions from: | | | | | | | | | | | | | | | | | | | | | | | | |
| Net investment income | | | — | | | | 0.32 | | | | 0.12 | | | | 0.39 | | | | 0.36 | | | | 0.23 | |
| Net realized gain | | | — | | | | — | | | | 1.85 | | | | — | | | | — | | | | — | |
| Total distributions | | | — | | | | 0.32 | | | | 1.97 | | | | 0.39 | | | | 0.36 | | | | 0.23 | |
| Net asset value, end of year | | $ | 29.76 | | | $ | 29.68 | | | $ | 23.04 | | | $ | 30.41 | | | $ | 23.86 | | | $ | 24.94 | |
| Total return (%)* | | | 0.27 | | | | 30.24 | | | | (18.00 | ) | | | 29.11 | | | | (2.88 | ) | | | (0.27 | ) |
| Ratios to average daily net assets (%)**: | | | | | | | | | | | | | | | | | | | | | | | | |
| Expenses, before waivers and reimbursements | | | 1.50 | | | | 1.45 | | | | 1.46 | | | | 1.47 | | | | 1.43 | | | | 1.42 | |
| Expenses, net of waivers and reimbursements | | | 1.45 | | | | 1.45 | | | | 1.45 | | | | 1.45 | | | | 1.43 | | | | 1.42 | |
| Net investment income (loss), before waivers and reimbursements | | | (0.41 | ) | | | 0.34 | | | | 0.54 | | | | 0.76 | | | | 0.84 | | | | 0.71 | |
| Net investment income (loss), net of waivers and reimbursements | | | (0.36 | ) | | | 0.34 | | | | 0.55 | | | | 0.78 | | | | 0.84 | | | | 0.71 | |
| Class N net assets at the end of the year (in thousands) | | $ | 232,632 | | | $ | 494,788 | | | $ | 456,533 | | | $ | 763,740 | | | $ | 729,544 | | | $ | 1,023,588 | |
| Portfolio turnover rate (%)* | | | 20 | | | | 34 | | | | 78 | | | | 82 | | | | 101 | | | | 70 | |
| | | | | | | | | | | | | | | | | | | | | | | | | |
| | | Class I | |
| | | (unaudited)
Period Ended
June 30, | | | Years Ended December 31, | |
| | | | 2020 | | | | 2019 | | | | 2018 | | | | 2017 | | | | 2016 | | | | 2015 | |
| Net asset value, beginning of year | | $ | 30.38 | | | $ | 23.56 | | | $ | 31.13 | | | $ | 24.42 | | | $ | 25.51 | | | $ | 25.82 | |
| Income (loss) from investment operations: | | | | | | | | | | | | | | | | | | | | | | | | |
| Net investment income (loss) | | | 0.01 | | | | 0.18 | | | | 0.26 | | | | 0.30 | | | | 0.29 | | | | 0.27 | |
| Net realized and unrealized gain (loss) on investments | | | 0.11 | | | | 7.03 | | | | (5.70 | ) | | | 6.89 | | | | (0.94 | ) | | | (0.28 | ) |
| Total from investment operations | | | 0.12 | | | | 7.21 | | | | (5.44 | ) | | | 7.19 | | | | (0.65 | ) | | | (0.01 | ) |
| Less distributions from: | | | | | | | | | | | | | | | | | | | | | | | | |
| Net investment income | | | — | | | | 0.39 | | | | 0.28 | | | | 0.48 | | | | 0.44 | | | | 0.30 | |
| Net realized gain | | | — | | | | — | | | | 1.85 | | | | — | | | | — | | | | — | |
| Total distributions | | | — | | | | 0.39 | | | | 2.13 | | | | 0.48 | | | | 0.44 | | | | 0.30 | |
| Net asset value, end of year | | $ | 30.50 | | | $ | 30.38 | | | $ | 23.56 | | | $ | 31.13 | | | $ | 24.42 | | | $ | 25.51 | |
| Total return (%)* | | | 0.40 | | | | 30.66 | | | | (17.73 | ) | | | 29.49 | | | | (2.54 | ) | | | (0.03 | ) |
| Ratios to average daily net assets (%)**: | | | | | | | | | | | | | | | | | | | | | | | | |
| Expenses | | | 1.16 | | | | 1.14 | | | | 1.13 | | | | 1.14 | | | | 1.13 | | | | 1.14 | |
| Net investment income (loss) | | | 0.06 | | | | 0.65 | | | | 0.86 | | | | 1.08 | | | | 1.16 | | | | 1.02 | |
| Class I net assets at the end of the year (in thousands) | | $ | 1,591,582 | | | $ | 1,552,355 | | | $ | 1,646,811 | | | $ | 2,375,326 | | | $ | 2,251,701 | | | $ | 2,655,156 | |
| Portfolio turnover rate (%)* | | | 20 | | | | 34 | | | | 78 | | | | 82 | | | | 101 | | | | 70 | |
| * | Rates are not annualized for periods less than a year. |
| ** | Rates are annualized for periods less than a year. |
Note: Net investment income (loss) per share is based on the average shares outstanding during the year.
Performance cited represents past performance. Past performance does not guarantee future results and current performance may be lower or higher than the data quoted. Results shown are annual returns, which assume reinvestment of dividends and capital gains. Investment returns and principal will fluctuate and you may have a gain or loss when you sell shares. For the most current month-end performance information, please call 1-800-742-7272 or visit our Web site at www.williamblairfunds.com.
| 150 | Semiannual Report | June 30, 2020 |
Financial Highlights — For a share outstanding throughout each period
International Growth Fund
| | | | Class R6 | |
| | | (unaudited)
Period Ended
June 30, | | | Period Ended
December 31, | |
| | | | 2020 | | | | 2019(a) | |
| Net asset value, beginning of year | | | $ | 30.37 | | | | $ | 27.56 | |
| Income (loss) from investment operations: | | | | | | | | | | |
| Net investment income (loss) | | | | 0.02 | | | | | (0.05 | ) |
| Net realized and unrealized gain (loss) on investments | | | | 0.12 | | | | | 3.27 | |
| Total from investment operations | | | | 0.14 | | | | | 3.22 | |
| Less distributions from: | | | | | | | | | | |
| Net investment income | | | | — | | | | | 0.41 | |
| Net realized gain | | | | — | | | | | — | |
| Total distributions | | | | — | | | | | 0.41 | |
| Net asset value, end of year | | | $ | 30.51 | | | | $ | 30.37 | |
| Total Return (%)* | | | | 0.46 | | | | | 11.71 | |
| Ratios to average daily net assets (%)**: | | | | | | | | | | |
| Expenses | | | | 1.07 | | | | | 1.06 | |
| Net investment income (loss) | | | | 0.11 | | | | | (0.26 | ) |
| Class R6 net assets at end of year (in thousands) | | | $ | 56,994 | | | | $ | 61,916 | |
| Portfolio turnover rate (%)* | | | | 20 | | | | | 34 | |
| (a) | For the period from May 2, 2019 (Commencement of Operations) to December 31, 2019. |
| * | Rates are not annualized for periods less than a year. |
| ** | Rates are annualized for periods less than a year. |
Note: Net investment income (loss) per share is based on the average shares outstanding during the year.
Performance cited represents past performance. Past performance does not guarantee future results and current performance may be lower or higher than the data quoted. Results shown are annual returns, which assume reinvestment of dividends and capital gains. Investment returns and principal will fluctuate and you may have a gain or loss when you sell shares. For the most current month-end performance information, please call 1-800-742-7272 or visit our Web site at www.williamblairfunds.com.
| June 30, 2020 | William Blair Funds | 151 |
Financial Highlights — For a share outstanding throughout each period
Institutional International Growth Fund
| | | Institutional | |
| | | (unaudited)
Period Ended
June 30, | | | Years Ended December 31, | |
| | | | 2020 | | | 2019 | | | 2018 | | | 2017 | | | 2016 | | | 2015 | |
| Net asset value, beginning of year | | | $ | 17.35 | | | $ | 13.40 | | | $ | 18.08 | | | $ | 14.55 | | | $ | 15.08 | | | $ | 15.26 | |
| Income (loss) from investment operations: | | | | | | | | | | | | | | | | | | | | | | | | | |
| Net investment income (loss) | | | | 0.02 | | | | 0.12 | | | | 0.18 | | | | 0.21 | | | | 0.18 | | | | 0.19 | |
| Net realized and unrealized gain (loss) on investments | | | | 0.10 | | | | 4.00 | | | | (3.29 | ) | | | 4.07 | | | | (0.54 | ) | | | (0.18 | ) |
| Total from investment operations | | | | 0.12 | | | | 4.12 | | | | (3.11 | ) | | | 4.28 | | | | (0.36 | ) | | | 0.01 | |
| Less distributions from: | | | | | | | | | | | | | | | | | | | | | | | | | |
| Net investment income | | | | — | | | | 0.17 | | | | 0.17 | | | | 0.44 | | | | 0.17 | | | | 0.09 | |
| Net realized gain | | | | — | | | | — | | | | 1.40 | | | | 0.31 | | | | — | | | | 0.10 | |
| Total distributions | | | | — | | | | 0.17 | | | | 1.57 | | | | 0.75 | | | | 0.17 | | | | 0.19 | |
| Net asset value, end of year | | | $ | 17.47 | | | $ | 17.35 | | | $ | 13.40 | | | $ | 18.08 | | | $ | 14.55 | | | $ | 15.08 | |
| Total return (%)* | | | | 0.69 | | | | 30.75 | | | | (17.50 | ) | | | 29.53 | | | | (2.40 | ) | | | 0.09 | |
| Ratios to average daily net assets (%)**: | | | | | | | | | | | | | | | | | | | | | | | | | |
| Expenses | | | | 0.99 | | | | 0.99 | | | | 0.97 | | | | 0.97 | | | | 0.98 | | | | 0.96 | |
| Net investment income (loss), | | | | 0.21 | | | | 0.77 | | | | 1.01 | | | | 1.22 | | | | 1.25 | | | | 1.18 | |
| Net assets at the end of the year (in thousands) | | | $ | 1,545,382 | | | $ | 1,892,911 | | | $ | 1,784,435 | | | $ | 2,330,299 | | | $ | 2,093,971 | | | $ | 2,335,632 | |
| Portfolio turnover rate (%)* | | | | 22 | | | | 35 | | | | 82 | | | | 84 | | | | 105 | | | | 70 | |
| * | Rates are not annualized for periods less than a year. |
| ** | Rates are annualized for periods less than a year. |
Note: Net investment income (loss) per share is based on the average shares outstanding during the year.
Performance cited represents past performance. Past performance does not guarantee future results and current performance may be lower or higher than the data quoted. Results shown are annual returns, which assume reinvestment of dividends and capital gains. Investment returns and principal will fluctuate and you may have a gain or loss when you sell shares. For the most current month-end performance information, please call 1-800-742-7272 or visit our Web site at www.williamblairfunds.com.
| 152 | Semiannual Report | June 30, 2020 |
Financial Highlights — For a share outstanding throughout each period
International Small Cap Growth Fund
| | | Class N | |
| | | (unaudited)
Period Ended
June 30, | | | Years Ended December 31, | |
| | | | 2020 | | | 2019 | | | 2018 | | | 2017 | | | 2016 | | | 2015 | |
| Net asset value, beginning of year | | | $ | 13.85 | | | $ | 10.36 | | | $ | 15.49 | | | $ | 12.87 | | | $ | 13.50 | | | $ | 12.56 | |
| Income (loss) from investment operations: | | | | | | | | | | | | | | | | | | | | | | | | | |
| Net investment income (loss) | | | | (0.01 | ) | | | 0.05 | | | | 0.04 | | | | 0.12 | | | | 0.10 | | | | 0.05 | |
| Net realized and unrealized gain (loss) on investments | | | | (0.42 | ) | | | 3.45 | | | | (3.78 | ) | | | 3.98 | | | | (0.72 | ) | | | 1.16 | |
| Total from investment operations | | | | (0.43 | ) | | | 3.50 | | | | (3.74 | ) | | | 4.10 | | | | (0.62 | ) | | | 1.21 | |
| Less distributions from: | | | | | | | | | | | | | | | | | | | | | | | | | |
| Net investment income | | | | — | | | | 0.01 | | | | 0.08 | | | | 0.32 | | | | 0.01 | | | | 0.24 | |
| Net realized gain | | | | — | | | | — | | | | 1.31 | | | | 1.16 | | | | 0.00^ | | | | 0.03 | |
| Total distributions | | | | — | | | | 0.01 | | | | 1.39 | | | | 1.48 | | | | 0.01 | | | | 0.27 | |
| Net asset value, end of year | | | $ | 13.42 | | | $ | 13.85 | | | $ | 10.36 | | | $ | 15.49 | | | $ | 12.87 | | | $ | 13.50 | |
| Total return (%)* | | | | (3.10 | ) | | | 33.81 | | | | (24.48 | ) | | | 32.17 | | | | (4.60 | ) | | | 9.67 | |
| Ratios to average daily net assets (%)**: | | | | | | | | | | | | | | | | | | | | | | | | | |
| Expenses, before waivers and reimbursements | | | | 1.54 | | | | 1.48 | | | | 1.48 | | | | 1.62 | | | | 1.59 | | | | 1.62 | |
| Expenses, net of waivers and reimbursements | | | | 1.54 | | | | 1.48 | | | | 1.48 | | | | 1.47 | | | | 1.44 | | | | 1.47 | |
| Net investment income (loss), before waivers and reimbursements | | | | (0.15 | ) | | | 0.45 | | | | 0.29 | | | | 0.70 | | | | 0.62 | | | | 0.19 | |
| Net investment income (loss), net of waivers and reimbursements | | | | (0.15 | ) | | | 0.45 | | | | 0.29 | | | | 0.85 | | | | 0.77 | | | | 0.34 | |
| Class N net assets at the end of the year (in thousands) | | | $ | 2,530 | | | $ | 3,650 | | | $ | 3,440 | | | $ | 6,275 | | | $ | 10,361 | | | $ | 11,350 | |
| Portfolio turnover rate (%)* | | | | 35 | | | | 38 | | | | 88 | | | | 64 | | | | 73 | | | | 90 | |
| | | | | | | | | | | | | | | | | | | | | | | | | | |
| | | Class I | |
| | | (unaudited)
Period Ended
June 30, | | | Years Ended December 31, | |
| | | | 2020 | | | 2019 | | | 2018 | | | 2017 | | | 2016 | | | 2015 | |
| Net asset value, beginning of year | | | $ | 13.98 | | | $ | 10.45 | | | $ | 15.65 | | | $ | 13.00 | | | $ | 13.65 | | | $ | 12.70 | |
| Income (loss) from investment operations: | | | | | | | | | | | | | | | | | | | | | | | | | |
| Net investment income (loss) | | | | 0.01 | | | | 0.09 | | | | 0.09 | | | | 0.14 | | | | 0.14 | | | | 0.09 | |
| Net realized and unrealized gain (loss) on investments | | | | (0.42 | ) | | | 3.48 | | | | (3.84 | ) | | | 4.07 | | | | (0.75 | ) | | | 1.18 | |
| Total from investment operations | | | | (0.41 | ) | | | 3.57 | | | | (3.75 | ) | | | 4.21 | | | | (0.61 | ) | | | 1.27 | |
| Less distributions from: | | | | | | | | | | | | | | | | | | | | | | | | | |
| Net investment income | | | | — | | | | 0.04 | | | | 0.14 | | | | 0.40 | | | | 0.04 | | | | 0.29 | |
| Net realized gain | | | | — | | | | — | | | | 1.31 | | | | 1.16 | | | | 0.00^ | | | | 0.03 | |
| Total distributions | | | | — | | | | 0.04 | | | | 1.45 | | | | 1.56 | | | | 0.04 | | | | 0.32 | |
| Net asset value, end of year | | | $ | 13.57 | | | $ | 13.98 | | | $ | 10.45 | | | $ | 15.65 | | | $ | 13.00 | | | $ | 13.65 | |
| Total return (%)* | | | | (2.93 | ) | | | 34.22 | | | | (24.29 | ) | | | 32.70 | | | | (4.41 | ) | | | 10.00 | |
| Ratios to average daily net assets (%)**: | | | | | | | | | | | | | | | | | | | | | | | | | |
| Expenses, before waivers and reimbursements | | | | 1.27 | | | | 1.21 | | | | 1.18 | | | | 1.31 | | | | 1.30 | | | | 1.31 | |
| Expenses, net of waivers and reimbursements | | | | 1.27 | | | | 1.21 | | | | 1.18 | | | | 1.16 | | | | 1.15 | | | | 1.16 | |
| Net investment income (loss), before waivers and reimbursements | | | | 0.21 | | | | 0.75 | | | | 0.60 | | | | 0.77 | | | | 0.91 | | | | 0.51 | |
| Net investment income (loss), net of waivers and reimbursements | | | | 0.21 | | | | 0.75 | | | | 0.60 | | | | 0.92 | | | | 1.06 | | | | 0.66 | |
| Class I net assets at the end of the year (in thousands) | | | $ | 126,889 | | | $ | 142,951 | | | $ | 165,451 | | | $ | 338,920 | | | $ | 306,526 | | | $ | 342,232 | |
| Portfolio turnover rate (%)* | | | | 35 | | | | 38 | | | | 88 | | | | 64 | | | | 73 | | | | 90 | |
| * | Rates are not annualized for periods less than a year. |
| ** | Rates are annualized for periods less than a year. |
| ^ | Amount is less than $0.005 per share. |
Note: Net investment income (loss) per share is based on the average shares outstanding during the year.
Performance cited represents past performance. Past performance does not guarantee future results and current performance may be lower or higher than the data quoted. Results shown are annual returns, which assume reinvestment of dividends and capital gains. Investment returns and principal will fluctuate and you may have a gain or loss when you sell shares. For the most current month-end performance information, please call 1-800-742-7272 or visit our Web site at www.williamblairfunds.com.
| June 30, 2020 | William Blair Funds | 153 |
Financial Highlights — For a share outstanding throughout each period
International Small Cap Growth Fund
| | | Class R6 | |
| | | (unaudited)
Period Ended
June 30, | | | Years Ended December 31, | |
| | | | 2020 | | | 2019 | | | 2018 | | | 2017 | | | 2016 | | | 2015 | |
| Net asset value, beginning of year | | | $ | 14.05 | | | $ | 10.50 | | | $ | 15.73 | | | $ | 13.07 | | | $ | 13.72 | | | $ | 12.77 | |
| Income (loss) from investment operations: | | | | | | | | | | | | | | | | | | | | | | | | | |
| Net investment income (loss) | | | | 0.02 | | | | 0.11 | | | | 0.10 | | | | 0.15 | | | | 0.15 | | | | 0.10 | |
| Net realized and unrealized gain (loss) on investments | | | | (0.42 | ) | | | 3.49 | | | | (3.85 | ) | | | 4.08 | | | | (0.74 | ) | | | 1.18 | |
| Total from investment operations | | | | (0.40 | ) | | | 3.60 | | | | (3.75 | ) | | | 4.23 | | | | (0.59 | ) | | | 1.28 | |
| Less distributions from: | | | | | | | | | | | | | | | | | | | | | | | | | |
| Net investment income | | | | — | | | | 0.05 | | | | 0.17 | | | | 0.41 | | | | 0.06 | | | | 0.30 | |
| Net realized gain | | | | — | | | | — | | | | 1.31 | | | | 1.16 | | | | 0.00^ | | | | 0.03 | |
| Total distributions | | | | — | | | | 0.05 | | | | 1.48 | | | | 1.57 | | | | 0.06 | | | | 0.33 | |
| Net asset value, end of year | | | $ | 13.65 | | | $ | 14.05 | | | $ | 10.50 | | | $ | 15.73 | | | $ | 13.07 | | | $ | 13.72 | |
| Total return (%)* | | | | (2.85 | ) | | | 34.32 | | | | (24.19 | ) | | | 32.70 | | | | (4.31 | ) | | | 10.03 | |
| Ratios to average daily net assets (%)**: | | | | | | | | | | | | | | | | | | | | | | | | | |
| Expenses | | | | 1.15 | | | | 1.12 | | | | 1.08 | | | | 1.08 | | | | 1.07 | | | | 1.08 | |
| Net investment income (loss) | | | | 0.34 | | | | 0.86 | | | | 0.67 | | | | 0.99 | | | | 1.13 | | | | 0.76 | |
| Class R6 net assets at the end of the year (in thousands) | | | $ | 132,922 | | | $ | 162,465 | | | $ | 171,833 | | | $ | 256,558 | | | $ | 199,746 | | | $ | 221,018 | |
| Portfolio turnover rate (%)* | | | | 35 | | | | 38 | | | | 88 | | | | 64 | | | | 73 | | | | 90 | |
| * | Rates are not annualized for periods less than a year. |
| ** | Rates are annualized for periods less than a year. |
| ^ | Amount is less than $0.005 per share. |
Note: Net investment income (loss) per share is based on the average shares outstanding during the year.
Performance cited represents past performance. Past performance does not guarantee future results and current performance may be lower or higher than the data quoted. Results shown are annual returns, which assume reinvestment of dividends and capital gains. Investment returns and principal will fluctuate and you may have a gain or loss when you sell shares. For the most current month-end performance information, please call 1-800-742-7272 or visit our Web site at www.williamblairfunds.com.
| 154 | Semiannual Report | June 30, 2020 |
Financial Highlights — For a share outstanding throughout each period
Emerging Markets Leaders Fund
| | | Class N | |
| | | (unaudited)
Period Ended
June 30, | | | Years Ended December 31, | |
| | | | 2020 | | | 2019 | | | 2018 | | | 2017 | | | 2016 | | | 2015 | |
| Net asset value, beginning of year | | | $ | 10.51 | | | $ | 8.26 | | | $ | 11.06 | | | $ | 7.84 | | | $ | 7.73 | | | $ | 9.06 | |
| Income (loss) from investment operations: | | | | | | | | | | | | | | | | | | | | | | | | | |
| Net investment income (loss) | | | | 0.01 | | | | 0.03 | | | | 0.03 | | | | 0.01 | | | | 0.02 | | | | 0.02 | |
| Net realized and unrealized gain (loss) on investments | | | | (0.48 | ) | | | 2.28 | | | | (1.97 | ) | | | 3.26 | | | | 0.09 | | | | (1.34 | ) |
| Total from investment operations | | | | (0.47 | ) | | | 2.31 | | | | (1.94 | ) | | | 3.27 | | | | 0.11 | | | | (1.32 | ) |
| Less distributions from: | | | | | | | | | | | | | | | | | | | | | | | | | |
| Net investment income | | | | — | | | | 0.04 | | | | 0.07 | | | | 0.05 | | | | — | | | | — | |
| Net realized gain | | | | — | | | | 0.02 | | | | 0.79 | | | | — | | | | — | | | | 0.01 | |
| Total distributions | | | | — | | | | 0.06 | | | | 0.86 | | | | 0.05 | | | | — | | | | 0.01 | |
| Net asset value, end of year | | | $ | 10.04 | | | $ | 10.51 | | | $ | 8.26 | | | $ | 11.06 | | | $ | 7.84 | | | $ | 7.73 | |
| Total return (%)* | | | | (4.47 | ) | | | 27.98 | | | | (17.73 | ) | | | 41.68 | | | | 1.42 | | | | (14.56 | ) |
| Ratios to average daily net assets (%)**: | | | | | | | | | | | | | | | | | | | | | | | | | |
| Expenses, before waivers and reimbursements | | | | 1.66 | | | | 1.62 | | | | 1.60 | | | | 1.62 | | | | 1.81 | | | | 1.89 | |
| Expenses, net of waivers and reimbursements | | | | 1.40 | | | | 1.45 | | | | 1.58 | | | | 1.47 | | | | 1.57 | | | | 1.64 | |
| Net investment income (loss), before waivers and reimbursements | | | | (0.13 | ) | | | 0.17 | | | | 0.27 | | | | (0.01 | ) | | | 0.05 | | | | (0.07 | ) |
| Net investment income (loss), net of waivers and reimbursements | | | | 0.13 | | | | 0.34 | | | | 0.29 | | | | 0.14 | | | | 0.29 | | | | 0.18 | |
| Class N net assets at the end of the year (in thousands) | | | $ | 1,391 | | | $ | 1,856 | | | $ | 2,239 | | | $ | 2,766 | | | $ | 2,479 | | | $ | 1,599 | |
| Portfolio turnover rate (%)* | | | | 24 | | | | 33 | | | | 52 | | | | 59 | | | | 135 | | | | 110 | |
| | | | | | | | | | | | | | | | | | | | | | | | | | |
| | | Class I | |
| | | (unaudited)
Period Ended
June 30, | | | Years Ended December 31, | |
| | | | | 2020 | | | | 2019 | | | | 2018 | | | | 2017 | | | | 2016 | | | | 2015 | |
| Net asset value, beginning of year | | | $ | 10.52 | | | $ | 8.27 | | | $ | 11.09 | | | $ | 7.87 | | | $ | 7.74 | | | $ | 9.08 | |
| Income (loss) from investment operations: | | | | | | | | | | | | | | | | | | | | | | | | | |
| Net investment income (loss) | | | | 0.02 | | | | 0.06 | | | | 0.06 | | | | 0.02 | | | | 0.04 | | | | 0.05 | |
| Net realized and unrealized gain (loss) on investments | | | | (0.47 | ) | | | 2.29 | | | | (1.97 | ) | | | 3.27 | | | | 0.10 | | | | (1.36 | ) |
| Total from investment operations | | | | (0.45 | ) | | | 2.35 | | | | (1.91 | ) | | | 3.29 | | | | 0.14 | | | | (1.31 | ) |
| Less distributions from: | | | | | | | | | | | | | | | | | | | | | | | | | |
| Net investment income | | | | — | | | | 0.08 | | | | 0.12 | | | | 0.07 | | | | 0.01 | | | | 0.02 | |
| Net realized gain | | | | — | | | | 0.02 | | | | 0.79 | | | | — | | | | — | | | | 0.01 | |
| Total distributions | | | | — | | | | 0.10 | | | | 0.91 | | | | 0.07 | | | | 0.01 | | | | 0.03 | |
| Net asset value, end of year | | | $ | 10.07 | | | $ | 10.52 | | | $ | 8.27 | | | $ | 11.09 | | | $ | 7.87 | | | $ | 7.74 | |
| Total return (%)* | | | | (4.28 | ) | | | 28.36 | | | | (17.45 | ) | | | 41.89 | | | | 1.82 | | | | (14.37 | ) |
| Ratios to average daily net assets (%)**: | | | | | | | | | | | | | | | | | | | | | | | | | |
| Expenses, before waivers and reimbursements | | | | 1.33 | | | | 1.29 | | | | 1.27 | | | | 1.40 | | | | 1.54 | | | | 1.54 | |
| Expenses, net of waivers and reimbursements | | | | 1.15 | | | | 1.20 | | | | 1.27 | | | | 1.25 | | | | 1.30 | | | | 1.29 | |
| Net investment income (loss), before waivers and reimbursements | | | | 0.20 | | | | 0.53 | | | | 0.58 | | | | 0.09 | | | | 0.28 | | | | 0.28 | |
| Net investment income (loss), net of waivers and reimbursements | | | | 0.38 | | | | 0.62 | | | | 0.58 | | | | 0.24 | | | | 0.52 | | | | 0.53 | |
| Class I net assets at the end of the year (in thousands) | | | $ | 43,268 | | | $ | 45,090 | | | $ | 34,786 | | | $ | 47,666 | | | $ | 30,346 | | | $ | 32,862 | |
| Portfolio turnover rate (%)* | | | | 24 | | | | 33 | | | | 52 | | | | 59 | | | | 135 | | | | 110 | |
| * | Rates are not annualized for periods less than a year. |
| ** | Rates are annualized for periods less than a year. |
Note: Net investment income (loss) per share is based on the average shares outstanding during the year.
Performance cited represents past performance. Past performance does not guarantee future results and current performance may be lower or higher than the data quoted. Results shown are annual returns, which assume reinvestment of dividends and capital gains. Investment returns and principal will fluctuate and you may have a gain or loss when you sell shares. For the most current month-end performance information, please call 1-800-742-7272 or visit our Web site at www.williamblairfunds.com.
| June 30, 2020 | William Blair Funds | 155 |
Financial Highlights — For a share outstanding throughout each period
Emerging Markets Leaders Fund
| | | Class R6 | |
| | | (unaudited)
Period Ended
June 30, | | | Years Ended December 31, | |
| | | | 2020 | | | 2019 | | | 2018 | | | 2017 | | | 2016 | | | 2015 | |
| Net asset value, beginning of year | | | $ | 10.51 | | | $ | 8.26 | | | $ | 11.09 | | | $ | 7.86 | | | $ | 7.74 | | | $ | 9.07 | |
| Income (loss) from investment operations: | | | | | | | | | | | | | | | | | | | | | | | | | |
| Net investment income (loss) | | | | 0.02 | | | | 0.06 | | | | 0.07 | | | | 0.03 | | | | 0.03 | | | | 0.04 | |
| Net realized and unrealized gain (loss) on investments | | | | (0.47 | ) | | | 2.29 | | | | (1.98 | ) | | | 3.28 | | | | 0.10 | | | | (1.33 | ) |
| Total from investment operations | | | | (0.45 | ) | | | 2.35 | | | | (1.91 | ) | | | 3.31 | | | | 0.13 | | | | (1.29 | ) |
| Less distributions from: | | | | | | | | | | | | | | | | | | | | | | | | | |
| Net investment income | | | | — | | | | 0.08 | | | | 0.13 | | | | 0.08 | | | | 0.01 | | | | 0.03 | |
| Net realized gain | | | | — | | | | 0.02 | | | | 0.79 | | | | — | | | | — | | | | 0.01 | |
| Total distributions | | | | — | | | | 0.10 | | | | 0.92 | | | | 0.08 | | | | 0.01 | | | | 0.04 | |
| Net asset value, end of year | | | $ | 10.06 | | | $ | 10.51 | | | $ | 8.26 | | | $ | 11.09 | | | $ | 7.86 | | | $ | 7.74 | |
| Total return (%)* | | | | (4.28 | ) | | | 28.45 | | | | (17.46 | ) | | | 42.15 | | | | 1.74 | | | | (14.24 | ) |
| Ratios to average daily net assets (%)**: | | | | | | | | | | | | | | | | | | | | | | | | | |
| Expenses, before waivers and reimbursements | | | | 1.26 | | | | 1.23 | | | | 1.20 | | | | 1.19 | | | | 1.34 | | | | 1.35 | |
| Expenses, net of waivers and reimbursements | | | | 1.10 | | | | 1.15 | | | | 1.20 | | | | 1.19 | | | | 1.25 | | | | 1.25 | |
| Net investment income (loss), before waivers and reimbursements | | | | 0.28 | | | | 0.57 | | | | 0.71 | | | | 0.33 | | | | 0.30 | | | | 0.39 | |
| Net investment income (loss), net of waivers and reimbursements | | | | 0.44 | | | | 0.65 | | | | 0.71 | | | | 0.33 | | | | 0.39 | | | | 0.49 | |
| Class R6 net assets at the end of the year (in thousands) | | | $ | 178,808 | | | $ | 191,337 | | | $ | 161,889 | | | $ | 427,480 | | | $ | 272,678 | | | $ | 93,217 | |
| Portfolio turnover rate (%)* | | | | 24 | | | | 33 | | | | 52 | | | | 59 | | | | 135 | | | | 110 | |
| * | Rates are not annualized for periods less than a year. |
| ** | Rates are annualized for periods less than a year. |
Note: Net investment income (loss) per share is based on the average shares outstanding during the year.
Performance cited represents past performance. Past performance does not guarantee future results and current performance may be lower or higher than the data quoted. Results shown are annual returns, which assume reinvestment of dividends and capital gains. Investment returns and principal will fluctuate and you may have a gain or loss when you sell shares. For the most current month-end performance information, please call 1-800-742-7272 or visit our Web site at www.williamblairfunds.com.
| 156 | Semiannual Report | June 30, 2020 |
Financial Highlights — For a share outstanding throughout each period
Emerging Markets Growth Fund
| | | Class N | |
| | (unaudited)
Period Ended
June 30, | | | Years Ended December 31, | |
| | | | 2020 | | | | 2019 | | | | 2018 | | | | 2017 | | | | 2016 | | | | 2015 | |
| Net asset value, beginning of year | | $ | 13.67 | | | $ | 11.14 | | | $ | 16.20 | | | $ | 10.99 | | | $ | 10.85 | | | $ | 12.91 | |
| Income (loss) from investment operations: | | | | | | | | | | | | | | | | | | | | | | | | |
| Net investment income (loss) | | | (0.03 | ) | | | 0.11 | | | | 0.01 | | | | (0.02 | ) | | | 0.03 | | | | 0.04 | |
| Net realized and unrealized gain (loss) on investments | | | 0.47 | | | | 2.98 | | | | (3.49 | ) | | | 5.35 | | | | 0.13 | | | | (1.98 | ) |
| Total from investment operations | | | 0.44 | | | | 3.09 | | | | (3.48 | ) | | | 5.33 | | | | 0.16 | | | | (1.94 | ) |
| Less distributions from: | | | | | | | | | | | | | | | | | | | | | | | | |
| Net investment income | | | — | | | | 0.16 | | | | 0.11 | | | | 0.12 | | | | 0.02 | | | | — | |
| Net realized gain | | | — | | | | 0.40 | | | | 1.47 | | | | — | | | | — | | | | 0.12 | |
| Total distributions | | | — | | | | 0.56 | | | | 1.58 | | | | 0.12 | | | | 0.02 | | | | 0.12 | |
| Net asset value, end of year | | $ | 14.11 | | | $ | 13.67 | | | $ | 11.14 | | | $ | 16.20 | | | $ | 10.99 | | | $ | 10.85 | |
| Total return (%)* | | | 3.22 | | | | 27.89 | | | | (21.61 | ) | | | 48.53 | | | | 1.49 | | | | (15.03 | ) |
| Ratios to average daily net assets (%)**: | | | | | | | | | | | | | | | | | | | | | | | | |
| Expenses, before waivers and reimbursements | | | 1.54 | | | | 1.51 | | | | 1.52 | | | | 1.65 | | | | 1.65 | | | | 1.65 | |
| Expenses, net of waivers and reimbursements | | | 1.54 | | | | 1.51 | | | | 1.52 | | | | 1.50 | | | | 1.50 | | | | 1.50 | |
| Net investment income (loss), before waivers and reimbursements | | | (0.43 | ) | | | 0.84 | | | | 0.09 | | | | (0.29 | ) | | | 0.13 | | | | 0.18 | |
| Net investment income (loss), net of waivers and reimbursements | | | (0.43 | ) | | | 0.84 | | | | 0.09 | | | | (0.14 | ) | | | 0.28 | | | | 0.33 | |
| Class N net assets at the end of the year (in thousands) | | $ | 7,934 | | | $ | 7,804 | | | $ | 7,103 | | | $ | 10,479 | | | $ | 8,488 | | | $ | 9,367 | |
| Portfolio turnover rate (%)* | | | 46 | | | | 79 | | | | 113 | | | | 91 | | | | 105 | | | | 121 | |
| | | | | | | | | | | | | | | | | | | | | | | | | |
| | | Class I | |
| | (unaudited)
Period Ended
June 30, | | | Years Ended December 31, | |
| | | | 2020 | | | | 2019 | | | | 2018 | | | | 2017 | | | | 2016 | | | | 2015 | |
| Net asset value, beginning of year | | $ | 13.82 | | | $ | 11.25 | | | $ | 16.36 | | | $ | 11.10 | | | $ | 10.96 | | | $ | 13.01 | |
| Income (loss) from investment operations: | | | | | | | | | | | | | | | | | | | | | | | | |
| Net investment income (loss) | | | (0.01 | ) | | | 0.14 | | | | 0.05 | | | | 0.01 | | | | 0.06 | | | | 0.07 | |
| Net realized and unrealized gain (loss) on investments | | | 0.47 | | | | 3.02 | | | | (3.52 | ) | | | 5.40 | | | | 0.13 | | | | (2.00 | ) |
| Total from investment operations | | | 0.46 | | | | 3.16 | | | | (3.47 | ) | | | 5.41 | | | | 0.19 | | | | (1.93 | ) |
| Less distributions from: | | | | | | | | | | | | | | | | | | | | | | | | |
| Net investment income | | | — | | | | 0.19 | | | | 0.17 | | | | 0.15 | | | | 0.05 | | | | — | |
| Net realized gain | | | — | | | | 0.40 | | | | 1.47 | | | | — | | | | — | | | | 0.12 | |
| Total distributions | | | — | | | | 0.59 | | | | 1.64 | | | | 0.15 | | | | 0.05 | | | | 0.12 | |
| Net asset value, end of year | | $ | 14.28 | | | $ | 13.82 | | | $ | 11.25 | | | $ | 16.36 | | | $ | 11.10 | | | $ | 10.96 | |
| Total return (%)* | | | 3.33 | | | | 28.29 | | | | (21.37 | ) | | | 48.83 | | | | 1.73 | | | | (14.83 | ) |
| Ratios to average daily net assets (%)**: | | | | | | | | | | | | | | | | | | | | | | | | |
| Expenses, before waivers and reimbursements. | | | 1.30 | | | | 1.26 | | | | 1.27 | | | | 1.42 | | | | 1.41 | | | | 1.40 | |
| Expenses, net of waivers and reimbursements | | | 1.30 | | | | 1.26 | | | | 1.27 | | | | 1.27 | | | | 1.26 | | | | 1.25 | |
| Net investment income (loss), before waivers and reimbursements | | | (0.19 | ) | | | 1.06 | | | | 0.34 | | | | (0.07 | ) | | | 0.38 | | | | 0.43 | |
| Net investment income (loss), net of waivers and reimbursements | | | (0.19 | ) | | | 1.06 | | | | 0.34 | | | | 0.08 | | | | 0.53 | | | | 0.58 | |
| Class I net assets at the end of the year (in thousands) | | $ | 75,381 | | | $ | 73,496 | | | $ | 79,427 | | | $ | 129,481 | | | $ | 93,668 | | | $ | 130,491 | |
| Portfolio turnover rate (%)* | | | 46 | | | | 79 | | | | 113 | | | | 91 | | | | 105 | | | | 121 | |
| * | Rates are not annualized for periods less than a year. |
| ** | Rates are annualized for periods less than a year. |
Note: Net investment income (loss) per share is based on the average shares outstanding during the year.
Performance cited represents past performance. Past performance does not guarantee future results and current performance may be lower or higher than the data quoted. Results shown are annual returns, which assume reinvestment of dividends and capital gains. Investment returns and principal will fluctuate and you may have a gain or loss when you sell shares. For the most current month-end performance information, please call 1-800-742-7272 or visit our Web site at www.williamblairfunds.com.
| June 30, 2020 | William Blair Funds | 157 |
Financial Highlights — For a share outstanding throughout each period
Emerging Markets Growth Fund
| | | Class R6 | |
| | (unaudited)
Period Ended
June 30, | | | Years Ended December 31, | |
| | | | 2020 | | | | 2019 | | | | 2018 | | | | 2017 | | | | 2016 | | | | 2015 | |
| Net asset value, beginning of year | | $ | 13.94 | | | $ | 11.35 | | | $ | 16.49 | | | $ | 11.18 | | | $ | 11.05 | | | $ | 13.09 | |
| Income (loss) from investment operations: | | | | | | | | | | | | | | | | | | | | | | | | |
| Net investment income (loss) | | | (0.00 | )^ | | | 0.15 | | | | 0.07 | | | | 0.02 | | | | 0.07 | | | | 0.08 | |
| Net realized and unrealized gain (loss) on investments | | | 0.47 | | | | 3.04 | | | | (3.56 | ) | | | 5.46 | | | | 0.12 | | | | (2.00 | ) |
| Total from investment operations | | | 0.47 | | | | 3.19 | | | | (3.49 | ) | | | 5.48 | | | | 0.19 | | | | (1.92 | ) |
| Less distributions from: | | | | | | | | | | | | | | | | | | | | | | | | |
| Net investment income | | | — | | | | 0.20 | | | | 0.18 | | | | 0.17 | | | | 0.06 | | | | — | |
| Net realized gain | | | — | | | | 0.40 | | | | 1.47 | | | | — | | | | — | | | | 0.12 | |
| Total distributions | | | — | | | | 0.60 | | | | 1.65 | | | | 0.17 | | | | 0.06 | | | | 0.12 | |
| Net asset value, end of year | | $ | 14.41 | | | $ | 13.94 | | | $ | 11.35 | | | $ | 16.49 | | | $ | 11.18 | | | $ | 11.05 | |
| Total return (%)* | | | 3.37 | | | | 28.28 | | | | (21.29 | ) | | | 49.06 | | | | 1.71 | | | | (14.67 | ) |
| Ratios to average daily net assets (%)**: | | | | | | | | | | | | | | | | | | | | | | | | |
| Expenses | | | 1.20 | | | | 1.19 | | | | 1.19 | | | | 1.17 | | | | 1.19 | | | | 1.17 | |
| Net investment income (loss) | | | (0.07 | ) | | | 1.17 | | | | 0.46 | | | | 0.17 | | | | 0.60 | | | | 0.61 | |
| Class R6 net assets at the end of the year (in thousands) | | $ | 744,640 | | | $ | 708,892 | | | $ | 654,441 | | | $ | 1,178,853 | | | $ | 831,587 | | | $ | 739,253 | |
| Portfolio turnover rate (%)* | | | 46 | | | | 79 | | | | 113 | | | | 91 | | | | 105 | | | | 121 | |
| * | Rates are not annualized for periods less than a year. |
| ** | Rates are annualized for periods less than a year. |
| ^ | Amount is less than $0.005 per share. |
Note: Net investment income (loss) per share is based on the average shares outstanding during the year.
Performance cited represents past performance. Past performance does not guarantee future results and current performance may be lower or higher than the data quoted. Results shown are annual returns, which assume reinvestment of dividends and capital gains. Investment returns and principal will fluctuate and you may have a gain or loss when you sell shares. For the most current month-end performance information, please call 1-800-742-7272 or visit our Web site at www.williamblairfunds.com.
| 158 | Semiannual Report | June 30, 2020 |
Financial Highlights — For a share outstanding throughout each period
Emerging Markets Small Cap Growth Fund
| | | Class N | |
| | (unaudited)
Period Ended
June 30, | | | Years Ended December 31, | |
| | | | 2020 | | | | 2019 | | | | 2018 | | | | 2017 | | | | 2016 | | | | 2015 | |
| Net asset value, beginning of year | | $ | 16.80 | | | $ | 13.96 | | | $ | 18.66 | | | $ | 13.73 | | | $ | 14.84 | | | $ | 16.52 | |
| Income (loss) from investment operations: | | | | | | | | | | | | | | | | | | | | | | | | |
| Net investment income (loss) | | | (0.05 | ) | | | 0.00 | ^ | | | (0.02 | ) | | | 0.01 | | | | 0.09 | | | | (0.01 | ) |
| Net realized and unrealized gain (loss) on investments | | | 0.22 | | | | 2.84 | | | | (4.38 | ) | | | 5.46 | | | | (0.88 | ) | | | (1.05 | ) |
| Total from investment operations | | | 0.17 | | | | 2.84 | | | | (4.40 | ) | | | 5.47 | | | | (0.79 | ) | | | (1.06 | ) |
| Less distributions from: | | | | | | | | | | | | | | | | | | | | | | | | |
| Net investment income | | | — | | | | — | | | | — | | | | 0.50 | | | | 0.32 | | | | — | |
| Net realized gain | | | — | | | | — | | | | 0.30 | | | | 0.04 | | | | — | | | | 0.62 | |
| Total distributions | | | — | | | | — | | | | 0.30 | | | | 0.54 | | | | 0.32 | | | | 0.62 | |
| Net asset value, end of year | | $ | 16.97 | | | $ | 16.80 | | | $ | 13.96 | | | $ | 18.66 | | | $ | 13.73 | | | $ | 14.84 | |
| Total return (%)* | | | 1.01 | | | | 20.34 | | | | (23.57 | ) | | | 40.09 | | | | (5.33 | ) | | | (6.40 | ) |
| Ratios to average daily net assets (%)**: | | | | | | | | | | | | | | | | | | | | | | | | |
| Expenses, before waivers and reimbursements | | | 1.80 | | | | 1.71 | | | | 1.70 | | | | 1.83 | | | | 1.82 | | | | 1.94 | |
| Expenses, net of waivers and reimbursements | | | 1.55 | | | | 1.55 | | | | 1.58 | | | | 1.64 | | | | 1.61 | | | | 1.65 | |
| Net investment income (loss), before waivers and reimbursements | | | (0.83 | ) | | | (0.14 | ) | | | (0.22 | ) | | | (0.11 | ) | | | 0.41 | | | | (0.35 | ) |
| Net investment income (loss), net of waivers and reimbursements | | | (0.58 | ) | | | 0.02 | �� | | | (0.10 | ) | | | 0.08 | | | | 0.62 | | | | (0.06 | ) |
| Class N net assets at the end of the year (in thousands) | | $ | 3,314 | | | $ | 4,025 | | | $ | 8,977 | | | $ | 15,082 | | | $ | 9,263 | | | $ | 11,306 | |
| Portfolio turnover rate (%)* | | | 69 | | | | 142 | | | | 187 | | | | 183 | | | | 157 | | | | 167 | |
| | | | | | | | | | | | | | | | | | | | | | | | | |
| | | Class I | |
| | (unaudited)
Period Ended
June 30, | | | Years Ended December 31, | |
| | | | 2020 | | | | 2019 | | | | 2018 | | | | 2017 | | | | 2016 | | | | 2015 | |
| Net asset value, beginning of year | | $ | 16.90 | | | $ | 14.03 | | | $ | 18.73 | | | $ | 13.77 | | | $ | 14.90 | | | $ | 16.52 | |
| Income (loss) from investment operations: | | | | | | | | | | | | | | | | | | | | | | | | |
| Net investment income (loss) | | | (0.03 | ) | | | 0.04 | | | | 0.03 | | | | 0.08 | | | | 0.13 | | | | 0.05 | |
| Net realized and unrealized gain (loss) on investments | | | 0.22 | | | | 2.86 | | | | (4.41 | ) | | | 5.47 | | | | (0.89 | ) | | | (1.05 | ) |
| Total from investment operations | | | 0.19 | | | | 2.90 | | | | (4.38 | ) | | | 5.55 | | | | (0.76 | ) | | | (1.00 | ) |
| Less distributions from: | | | | | | | | | | | | | | | | | | | | | | | | |
| Net investment income | | | — | | | | 0.03 | | | | 0.02 | | | | 0.55 | | | | 0.37 | | | | — | |
| Net realized gain | | | — | | | | — | | | | 0.30 | | | | 0.04 | | | | — | | | | 0.62 | |
| Total distributions | | | — | | | | 0.03 | | | | 0.32 | | | | 0.59 | | | | 0.37 | | | | 0.62 | |
| Net asset value, end of year | | $ | 17.09 | | | $ | 16.90 | | | $ | 14.03 | | | $ | 18.73 | | | $ | 13.77 | | | $ | 14.90 | |
| Total return (%)* | | | 1.12 | | | | 20.58 | | | | (23.31 | ) | | | 40.53 | | | | (5.11 | ) | | | (6.03 | ) |
| Ratios to average daily net assets (%)**: | | | | | | | | | | | | | | | | | | | | | | | | |
| Expenses, before waivers and reimbursements | | | 1.47 | | | | 1.40 | | | | 1.38 | | | | 1.50 | | | | 1.51 | | | | 1.52 | |
| Expenses, net of waivers and reimbursements | | | 1.30 | | | | 1.30 | | | | 1.33 | | | | 1.31 | | | | 1.30 | | | | 1.31 | |
| Net investment income (loss), before waivers and reimbursements | | | (0.49 | ) | | | 0.18 | | | | 0.13 | | | | 0.30 | | | | 0.66 | | | | 0.09 | |
| Net investment income (loss), net of waivers and reimbursements | | | (0.32 | ) | | | 0.28 | | | | 0.18 | | | | 0.49 | | | | 0.87 | | | | 0.30 | |
| Class I net assets at the end of the year (in thousands) | | $ | 122,722 | | | $ | 142,885 | | | $ | 169,770 | | | $ | 282,620 | | | $ | 147,949 | | | $ | 162,375 | |
| Portfolio turnover rate (%)* | | | 69 | | | | 142 | | | | 187 | | | | 183 | | | | 157 | | | | 167 | |
| * | Rates are not annualized for periods less than a year. |
| ** | Rates are annualized for periods less than a year. |
| ^ | Amount is less than $0.005 per share. |
Note: Net investment income (loss) per share is based on the average shares outstanding during the year.
Performance cited represents past performance. Past performance does not guarantee future results and current performance may be lower or higher than the data quoted. Results shown are annual returns, which assume reinvestment of dividends and capital gains. Investment returns and principal will fluctuate and you may have a gain or loss when you sell shares. For the most current month-end performance information, please call 1-800-742-7272 or visit our Web site at www.williamblairfunds.com.
| June 30, 2020 | William Blair Funds | 159 |
Financial Highlights — For a share outstanding throughout each period
Emerging Markets Small Cap Growth Fund
| | | Class R6 | |
| | (unaudited)
Period Ended
June 30, | | | Years Ended December 31, | |
| | | | 2020 | | | | 2019 | | | | 2018 | | | | 2017 | | | | 2016 | | | | 2015 | |
| Net asset value, beginning of year | | $ | 16.93 | | | $ | 14.06 | | | $ | 18.76 | | | $ | 13.79 | | | $ | 14.92 | | | $ | 16.53 | |
| Income (loss) from investment operations: | | | | | | | | | | | | | | | | | | | | | | | | |
| Net investment income (loss) | | | (0.02 | ) | | | 0.05 | | | | 0.05 | | | | 0.10 | | | | 0.14 | | | | 0.06 | |
| Net realized and unrealized gain (loss) on investments | | | 0.21 | | | | 2.86 | | | | (4.41 | ) | | | 5.47 | | | | (0.89 | ) | | | (1.05 | ) |
| Total from investment operations | | | 0.19 | | | | 2.91 | | | | (4.36 | ) | | | 5.57 | | | | (0.75 | ) | | | (0.99 | ) |
| Less distributions from: | | | | | | | | | | | | | | | | | | | | | | | | |
| Net investment income | | | — | | | | 0.04 | | | | 0.04 | | | | 0.56 | | | | 0.38 | | | | 0.00^ | |
| Net realized gain | | | — | | | | — | | | | 0.30 | | | | 0.04 | | | | — | | | | 0.62 | |
| Total distributions | | | — | | | | 0.04 | | | | 0.34 | | | | 0.60 | | | | 0.38 | | | | 0.62 | |
| Net asset value, end of year | | $ | 17.12 | | | $ | 16.93 | | | $ | 14.06 | | | $ | 18.76 | | | $ | 13.79 | | | $ | 14.92 | |
| Total return (%)* | | | 1.12 | | | | 20.69 | | | | (23.24 | ) | | | 40.62 | | | | (5.05 | ) | | | (5.97 | ) |
| Ratios to average daily net assets (%)**: | | | | | | | | | | | | | | | | | | | | | | | | |
| Expenses, before waivers and reimbursements | | | 1.38 | | | | 1.33 | | | | 1.30 | | | | 1.29 | | | | 1.31 | | | | 1.31 | |
| Expenses, net of waivers and reimbursements | | | 1.25 | | | | 1.25 | | | | 1.25 | | | | 1.25 | | | | 1.25 | | | | 1.25 | |
| Net investment income (loss), before waivers and reimbursements | | | (0.39 | ) | | | 0.27 | | | | 0.22 | | | | 0.53 | | | | 0.88 | | | | 0.28 | |
| Net investment income (loss), net of waivers and reimbursements | | | (0.26 | ) | | | 0.35 | | | | 0.27 | | | | 0.57 | | | | 0.94 | | | | 0.34 | |
| Class R6 net assets at the end of the year (in thousands) | | $ | 134,532 | | | $ | 130,711 | | | $ | 98,188 | | | $ | 166,927 | | | $ | 125,650 | | | $ | 123,160 | |
| Portfolio turnover rate (%)* | | | 69 | | | | 142 | | | | 187 | | | | 183 | | | | 157 | | | | 167 | |
| * | Rates are not annualized for periods less than a year. |
| ** | Rates are annualized for periods less than a year. |
| ^ | Amount is less than $0.005 per share. |
Note: Net investment income (loss) per share is based on the average shares outstanding during the year.
Performance cited represents past performance. Past performance does not guarantee future results and current performance may be lower or higher than the data quoted. Results shown are annual returns, which assume reinvestment of dividends and capital gains. Investment returns and principal will fluctuate and you may have a gain or loss when you sell shares. For the most current month-end performance information, please call 1-800-742-7272 or visit our Web site at www.williamblairfunds.com.
| 160 | Semiannual Report | June 30, 2020 |
Financial Highlights — For a share outstanding throughout each period
Bond Fund
| | | Class N | |
| | | (unaudited)
Period Ended
June 30, | | | Years Ended December 31, | |
| | | 2020 | | | 2019 | | | 2018 | | | 2017 | | | 2016 | | | 2015 | |
| Net asset value, beginning of year | | | $ | 10.41 | | | $ | 9.75 | | | $ | 10.41 | | | $ | 10.41 | | | $ | 10.34 | | | $ | 10.74 | |
| Income (loss) from investment operations: | | | | | | | | | | | | | | | | | | | | | | | | | |
| Net investment income (loss) | | | | 0.13 | | | | 0.30 | | | | 0.31 | | | | 0.27 | | | | 0.27 | | | | 0.27 | |
| Net realized and unrealized gain (loss) on investments | | | | 0.31 | | | | 0.77 | | | | (0.56 | ) | | | 0.12 | | | | 0.18 | | | | (0.29 | ) |
| Total from investment operations | | | | 0.44 | | | | 1.07 | | | | (0.25 | ) | | | 0.39 | | | | 0.45 | | | | (0.02 | ) |
| Less distributions from: | | | | | | | | | | | | | | | | | | | | | | | | | |
| Net investment income | | | | 0.19 | | | | 0.41 | | | | 0.41 | | | | 0.39 | | | | 0.38 | | | | 0.38 | |
| Net realized gain | | | | — | | | | — | | | | — | | | | — | | | | — | | | | — | |
| Total distributions | | | | 0.19 | | | | 0.41 | | | | 0.41 | | | | 0.39 | | | | 0.38 | | | | 0.38 | |
| Net asset value, end of year | | | $ | 10.66 | | | $ | 10.41 | | | $ | 9.75 | | | $ | 10.41 | | | $ | 10.41 | | | $ | 10.34 | |
| Total return (%)* | | | | 4.29 | | | | 11.09 | | | | (2.42 | ) | | | 3.83 | | | | 4.40 | | | | (0.23 | ) |
| Ratios to average daily net assets (%)**: | | | | | | | | | | | | | | | | | | | | | | | | | |
| Expenses, before waivers and reimbursements | | | | 0.71 | | | | 0.69 | | | | 0.69 | | | | 0.82 | | | | 0.82 | | | | 0.79 | |
| Expenses, net of waivers and reimbursements | | | | 0.60 | | | | 0.60 | | | | 0.62 | | | | 0.65 | | | | 0.65 | | | | 0.61 | |
| Net investment income (loss), before waivers and reimbursements | | | | 2.44 | | | | 2.90 | | | | 3.01 | | | | 2.40 | | | | 2.43 | | | | 2.42 | |
| Net investment income (loss), net of waivers and reimbursements | | | | 2.55 | | | | 2.99 | | | | 3.08 | | | | 2.57 | | | | 2.60 | | | | 2.60 | |
| Class N net assets at the end of the year (in thousands) | | | $ | 30,598 | | | $ | 32,176 | | | $ | 70,253 | | | $ | 83,662 | | | $ | 125,866 | | | $ | 139,303 | |
| Portfolio turnover rate (%)* | | | | 47 | | | | 58 | | | | 40 | | | | 17 | | | | 17 | | | | 32 | |
| | | | | | | | | | | | | | | | | | | | | | | | | | |
| | | Class I | |
| | | (unaudited)
Period Ended
June 30, | | | Years Ended December 31, | |
| | | 2020 | | | 2019 | | | 2018 | | | 2017 | | | 2016 | | | 2015 | |
| Net asset value, beginning of year | | | $ | 10.30 | | | $ | 9.65 | | | $ | 10.31 | | | $ | 10.30 | | | $ | 10.24 | | | $ | 10.64 | |
| Income (loss) from investment operations: | | | | | | | | | | | | | | | | | | | | | | | | | |
| Net investment income (loss) | | | | 0.14 | | | | 0.31 | | | | 0.32 | | | | 0.29 | | | | 0.30 | | | | 0.31 | |
| Net realized and unrealized gain (loss) on investments | | | | 0.30 | | | | 0.76 | | | | (0.56 | ) | | | 0.13 | | | | 0.16 | | | | (0.31 | ) |
| Total from investment operations | | | | 0.44 | | | | 1.07 | | | | (0.24 | ) | | | 0.42 | | | | 0.46 | | | | — | |
| Less distributions from: | | | | | | | | | | | | | | | | | | | | | | | | | |
| Net investment income | | | | 0.20 | | | | 0.42 | | | | 0.42 | | | | 0.41 | | | | 0.40 | | | | 0.40 | |
| Net realized gain | | | | — | | | | — | | | | — | | | | — | | | | — | | | | — | |
| Total distributions | | | | 0.20 | | | | 0.42 | | | | 0.42 | | | | 0.41 | | | | 0.40 | | | | 0.40 | |
| Net asset value, end of year | | | $ | 10.54 | | | $ | 10.30 | | | $ | 9.65 | | | $ | 10.31 | | | $ | 10.30 | | | $ | 10.24 | |
| Total return (%)* | | | | 4.30 | | | | 11.22 | | | | (2.31 | ) | | | 4.16 | | | | 4.55 | | | | (0.05 | ) |
| Ratios to average daily net assets (%)**: | | | | | | | | | | | | | | | | | | | | | | | | | |
| Expenses, before waivers and reimbursements | | | | 0.51 | | | | 0.47 | | | | 0.46 | | | | 0.60 | | | | 0.58 | | | | 0.59 | |
| Expenses, net of waivers and reimbursements | | | | 0.45 | | | | 0.45 | | | | 0.46 | | | | 0.43 | | | | 0.41 | | | | 0.41 | |
| Net investment income (loss), before waivers and reimbursements | | | | 2.65 | | | | 3.10 | | | | 3.24 | | | | 2.62 | | | | 2.66 | | | | 2.75 | |
| Net investment income (loss), net of waivers and reimbursements | | | | 2.71 | | | | 3.12 | | | | 3.24 | | | | 2.79 | | | | 2.83 | | | | 2.93 | |
| Class I net assets at the end of the year (in thousands) | | | $ | 199,616 | | | $ | 206,304 | | | $ | 281,442 | | | $ | 384,464 | | | $ | 322,174 | | | $ | 237,587 | |
| Portfolio turnover rate (%)* | | | | 47 | | | | 58 | | | | 40 | | | | 17 | | | | 17 | | | | 32 | |
| * | Rates are not annualized for periods less than a year. |
| ** | Rates are annualized for periods less than a year. |
Note: Net investment income (loss) per share is based on the average shares outstanding during the year.
Performance cited represents past performance. Past performance does not guarantee future results and current performance may be lower or higher than the data quoted. Results shown are annual returns, which assume reinvestment of dividends and capital gains. Investment returns and principal will fluctuate and you may have a gain or loss when you sell shares. For the most current month-end performance information, please call 1-800-742-7272 or visit our Web site at www.williamblairfunds.com.
| June 30, 2020 | William Blair Funds | 161 |
Financial Highlights — For a share outstanding throughout each period
Bond Fund
| | | Class R6 | |
| | | (unaudited)
Period Ended
June 30, | | | Years Ended December 31, | |
| | | 2020 | | | 2019 | | | 2018 | | | 2017 | | | 2016 | | | 2015 | |
| Net asset value, beginning of year | | | $ | 10.30 | | | $ | 9.64 | | | $ | 10.30 | | | $ | 10.29 | | | $ | 10.23 | | | $ | 10.63 | |
| Income (loss) from investment operations: | | | | | | | | | | | | | | | | | | | | | | | | | |
| Net investment income (loss) | | | | 0.14 | | | | 0.32 | | | | 0.33 | | | | 0.30 | | | | 0.30 | | | | 0.32 | |
| Net realized and unrealized gain (loss) on investments | | | | 0.30 | | | | 0.76 | | | | (0.56 | ) | | | 0.13 | | | | 0.17 | | | | (0.31 | ) |
| Total from investment operations | | | | 0.44 | | | | 1.08 | | | | (0.23 | ) | | | 0.43 | | | | 0.47 | | | | 0.01 | |
| Less distributions from: | | | | | | | | | | | | | | | | | | | | | | | | | |
| Net investment income | | | | 0.20 | | | | 0.42 | | | | 0.43 | | | | 0.42 | | | | 0.41 | | | | 0.41 | |
| Net realized gain | | | | — | | | | — | | | | — | | | | — | | | | — | | | | — | |
| Total distributions | | | | 0.20 | | | | 0.42 | | | | 0.43 | | | | 0.42 | | | | 0.41 | | | | 0.41 | |
| Net asset value, end of year | | | $ | 10.54 | | | $ | 10.30 | | | $ | 9.64 | | | $ | 10.30 | | | $ | 10.29 | | | $ | 10.23 | |
| Total return (%)* | | | | 4.32 | | | | 11.39 | | | | (2.26 | ) | | | 4.24 | | | | 4.61 | | | | 0.01 | |
| Ratios to average daily net assets (%)**: | | | | | | | | | | | | | | | | | | | | | | | | | |
| Expenses, before waivers and reimbursements | | | | 0.43 | | | | 0.41 | | | | 0.38 | | | | 0.37 | | | | 0.37 | | | | 0.38 | |
| Expenses, net of waivers and reimbursements | | | | 0.40 | | | | 0.40 | | | | 0.38 | | | | 0.35 | | | | 0.35 | | | | 0.35 | |
| Net investment income (loss), before waivers and reimbursements | | | | 2.73 | | | | 3.17 | | | | 3.32 | | | | 2.85 | | | | 2.88 | | | | 2.98 | |
| Net investment income (loss), net of waivers and reimbursements | | | | 2.76 | | | | 3.18 | | | | 3.32 | | | | 2.87 | | | | 2.90 | | | | 3.01 | |
| Class R6 net assets at the end of the year (in thousands) | | | $ | 45,941 | | | $ | 43,655 | | | $ | 70,851 | | | $ | 91,629 | | | $ | 95,216 | | | $ | 103,904 | |
| Portfolio turnover rate (%)* | | | | 47 | | | | 58 | | | | 40 | | | | 17 | | | | 17 | | | | 32 | |
| * | Rates are not annualized for periods less than a year. |
| ** | Rates are annualized for periods less than a year. |
Note: Net investment income (loss) per share is based on the average shares outstanding during the year.
Performance cited represents past performance. Past performance does not guarantee future results and current performance may be lower or higher than the data quoted. Results shown are annual returns, which assume reinvestment of dividends and capital gains. Investment returns and principal will fluctuate and you may have a gain or loss when you sell shares. For the most current month-end performance information, please call 1-800-742-7272 or visit our Web site at www.williamblairfunds.com.
| 162 | Semiannual Report | June 30, 2020 |
Financial Highlights — For a share outstanding throughout each period
Income Fund
| | | Class N | |
| | | (unaudited)
Period Ended
June 30, | | | Years Ended December 31, | |
| | | 2020 | | | 2019 | | | 2018 | | | 2017 | | | 2016 | | | 2015 | |
| Net asset value, beginning of year | | | $ | 8.57 | | | $ | 8.36 | | | $ | 8.72 | | | $ | 8.86 | | | $ | 8.90 | | | $ | 9.12 | |
| Income (loss) from investment operations: | | | | | | | | | | | | | | | | | | | | | | | | | |
| Net investment income (loss) | | | | 0.07 | | | | 0.17 | | | | 0.17 | | | | 0.16 | | | | 0.16 | | | | 0.15 | |
| Net realized and unrealized gain (loss) on investments | | | | 0.20 | | | | 0.32 | | | | (0.25 | ) | | | (0.03 | ) | | | 0.06 | | | | (0.11 | ) |
| Total from investment operations | | | | 0.27 | | | | 0.49 | | | | (0.08 | ) | | | 0.13 | | | | 0.22 | | | | 0.04 | |
| Less distributions from: | | | | | | | | | | | | | | | | | | | | | | | | | |
| Net investment income | | | | 0.14 | | | | 0.28 | | | | 0.28 | | | | 0.27 | | | | 0.26 | | | | 0.26 | |
| Net realized gain | | | | — | | | | — | | | | — | | | | — | | | | — | | | | — | |
| Total distributions | | | | 0.14 | | | | 0.28 | | | | 0.28 | | | | 0.27 | | | | 0.26 | | | | 0.26 | |
| Net asset value, end of year | | | $ | 8.70 | | | $ | 8.57 | | | $ | 8.36 | | | $ | 8.72 | | | $ | 8.86 | | | $ | 8.90 | |
| Total return (%)* | | | | 3.14 | | | | 5.92 | | | | (0.86 | ) | | | 1.46 | | | | 2.44 | | | | 0.39 | |
| Ratios to average daily net assets (%)**: | | | | | | | | | | | | | | | | | | | | | | | | | |
| Expenses, before waivers and reimbursements | | | | 1.07 | | | | 0.98 | | | | 0.91 | | | | 0.88 | | | | 0.79 | | | | 0.81 | |
| Expenses, net of waivers and reimbursements | | | | 0.85 | | | | 0.85 | | | | 0.85 | | | | 0.85 | | | | 0.79 | | | | 0.81 | |
| Net investment income (loss), before waivers and reimbursements | | | | 1.49 | | | | 1.85 | | | | 1.96 | | | | 1.77 | | | | 1.80 | | | | 1.71 | |
| Net investment income (loss), net of waivers and reimbursements | | | | 1.71 | | | | 1.98 | | | | 2.02 | | | | 1.80 | | | | 1.80 | | | | 1.71 | |
| Class N net assets at the end of the year (in thousands) | | | $ | 21,204 | | | $ | 19,662 | | | $ | 22,422 | | | $ | 39,625 | | | $ | 52,710 | | | $ | 32,942 | |
| Portfolio turnover rate (%)* | | | | 40 | | | | 114 | | | | 97 | | | | 37 | | | | 22 | | | | 21 | |
| | | | | | | | | | | | | | | | | | | | | | | | | | |
| | | Class I | |
| | | (unaudited)
Period Ended
June 30, | | | Years Ended December 31, | |
| | | 2020 | | | 2019 | | | 2018 | | | 2017 | | | 2016 | | | 2015 | |
| Net asset value, beginning of year | | | $ | 8.52 | | | $ | 8.30 | | | $ | 8.66 | | | $ | 8.80 | | | $ | 8.83 | | | $ | 9.05 | |
| Income (loss) from investment operations: | | | | | | | | | | | | | | | | | | | | | | | | | |
| Net investment income (loss) | | | | 0.08 | | | | 0.18 | | | | 0.19 | | | | 0.18 | | | | 0.18 | | | | 0.18 | |
| Net realized and unrealized gain (loss) on investments | | | | 0.19 | | | | 0.33 | | | | (0.25 | ) | | | (0.03 | ) | | | 0.06 | | | | (0.12 | ) |
| Total from investment operations | | | | 0.27 | | | | 0.51 | | | | (0.06 | ) | | | 0.15 | | | | 0.24 | | | | 0.06 | |
| Less distributions from: | | | | | | | | | | | | | | | | | | | | | | | | | |
| Net investment income | | | | 0.14 | | | | 0.29 | | | | 0.30 | | | | 0.29 | | | | 0.27 | | | | 0.28 | |
| Net realized gain | | | | — | | | | — | | | | — | | | | — | | | | — | | | | — | |
| Total distributions | | | | 0.14 | | | | 0.29 | | | | 0.30 | | | | 0.29 | | | | 0.27 | | | | 0.28 | |
| Net asset value, end of year | | | $ | 8.65 | | | $ | 8.52 | | | $ | 8.30 | | | $ | 8.66 | | | $ | 8.80 | | | $ | 8.83 | |
| Total return (%)* | | | | 3.22 | | | | 6.24 | | | | (0.69 | ) | | | 1.68 | | | | 2.78 | | | | 0.63 | |
| Ratios to average daily net assets (%)**: | | | | | | | | | | | | | | | | | | | | | | | | | |
| Expenses, before waivers and reimbursements | | | | 0.82 | | | | 0.74 | | | | 0.65 | | | | 0.62 | | | | 0.57 | | | | 0.55 | |
| Expenses, net of waivers and reimbursements | | | | 0.70 | | | | 0.70 | | | | 0.65 | | | | 0.62 | | | | 0.57 | | | | 0.55 | |
| Net investment income (loss), before waivers and reimbursements | | | | 1.75 | | | | 2.10 | | | | 2.22 | | | | 2.03 | | | | 2.05 | | | | 1.97 | |
| Net investment income (loss), net of waivers and reimbursements | | | | 1.87 | | | | 2.14 | | | | 2.22 | | | | 2.03 | | | | 2.05 | | | | 1.97 | |
| Class I net assets at the end of the year (in thousands) | | | $ | 31,659 | | | $ | 31,629 | | | $ | 34,793 | | | $ | 51,153 | | | $ | 58,160 | | | $ | 62,722 | |
| Portfolio turnover rate (%)* | | | | 40 | | | | 114 | | | | 97 | | | | 37 | | | | 22 | | | | 21 | |
| * | Rates are not annualized for periods less than a year. |
| ** | Rates are annualized for periods less than a year. |
Note: Net investment income (loss) per share is based on the average shares outstanding during the year.
Performance cited represents past performance. Past performance does not guarantee future results and current performance may be lower or higher than the data quoted. Results shown are annual returns, which assume reinvestment of dividends and capital gains. Investment returns and principal will fluctuate and you may have a gain or loss when you sell shares. For the most current month-end performance information, please call 1-800-742-7272 or visit our Web site at www.williamblairfunds.com.
| June 30, 2020 | William Blair Funds | 163 |
Financial Highlights — For a share outstanding throughout each period
Income Fund
| | | Class R6 | |
| | | (unaudited)
Period Ended
June 30, | | | Period Ended
December 31, | |
| | | 2020 | | | 2019(a) | |
| Net asset value, beginning of year | | | $ | 8.52 | | | | $ | 8.45 | |
| Income (loss) from investment operations: | | | | | | | | | | |
| Net investment income (loss) | | | | 0.08 | | | | | 0.09 | |
| Net realized and unrealized gain (loss) on investments | | | | 0.19 | | | | | 0.18 | |
| Total from investment operations | | | | 0.27 | | | | | 0.27 | |
| Less distributions from: | | | | | | | | | | |
| Net investment income | | | | 0.14 | | | | | 0.20 | |
| Net realized gain | | | | — | | | | | — | |
| Total distributions | | | | 0.14 | | | | | 0.20 | |
| Net asset value, end of year | | | $ | 8.65 | | | | $ | 8.52 | |
| Total Return (%)* | | | | 3.25 | | | | | 3.18 | |
| Ratios to average daily net assets (%)**: | | | | | | | | | | |
| Expenses, before of waivers and reimbursements | | | | 0.78 | | | | | 0.71 | |
| Expenses, net waivers and reimbursements | | | | 0.65 | | | | | 0.65 | |
| Net investment income (loss), before of waivers and reimbursements | | | | 1.78 | | | | | 1.46 | |
| Net investment income (loss), net waivers and reimbursements | | | | 1.91 | | | | | 1.52 | |
| Class R6 net assets at end of year (in thousands) | | | $ | 70 | | | | $ | 52 | |
| Portfolio turnover rate (%)* | | | | 40 | | | | | 114 | |
| (a) | For the period from May 2, 2019 (Commencement of Operations) to December 31, 2019. |
| * | Rates are not annualized for periods less than a year. |
| ** | Rates are annualized for periods less than a year. |
Note: Net investment income (loss) per share is based on the average shares outstanding during the year.
Performance cited represents past performance. Past performance does not guarantee future results and current performance may be lower or higher than the data quoted. Results shown are annual returns, which assume reinvestment of dividends and capital gains. Investment returns and principal will fluctuate and you may have a gain or loss when you sell shares. For the most current month-end performance information, please call 1-800-742-7272 or visit our Web site at www.williamblairfunds.com.
| 164 | Semiannual Report | June 30, 2020 |
Financial Highlights — For a share outstanding throughout each period
Low Duration Fund
| | | Class N | |
| | | (unaudited)
Period Ended
June 30, | | | Years Ended December 31, | |
| | | | 2020 | | | 2019 | | | 2018 | | | 2017 | | | 2016 | | | 2015 | |
| Net asset value, beginning of year | | | $ | 8.68 | | | $ | 8.70 | | | $ | 8.92 | | | $ | 9.07 | | | $ | 9.16 | | | $ | 9.38 | |
| Income (loss) from investment operations: | | | | | | | | | | | | | | | | | | | | | | | | | |
| Net investment income (loss) | | | | 0.06 | | | | 0.19 | | | | 0.17 | | | | 0.11 | | | | 0.09 | | | | 0.07 | |
| Net realized and unrealized gain (loss) on investments | | | | 0.10 | | | | 0.11 | | | | (0.10 | ) | | | (0.04 | ) | | | 0.02 | | | | (0.07 | ) |
| Total from investment operations | | | | 0.16 | | | | 0.30 | | | | 0.07 | | | | 0.07 | | | | 0.11 | | | | — | |
| Less distributions from: | | | | | | | | | | | | | | | | | | | | | | | | | |
| Net investment income | | | | 0.14 | | | | 0.32 | | | | 0.29 | | | | 0.22 | | | | 0.20 | | | | 0.22 | |
| Net realized gain | | | | — | | | | — | | | | — | | | | — | | | | — | | | | — | |
| Total distributions | | | | 0.14 | | | | 0.32 | | | | 0.29 | | | | 0.22 | | | | 0.20 | | | | 0.22 | |
| Net asset value, end of year | | | $ | 8.70 | | | $ | 8.68 | | | $ | 8.70 | | | $ | 8.92 | | | $ | 9.07 | | | $ | 9.16 | |
| Total return (%)* | | | | 1.85 | | | | 3.48 | | | | 0.80 | | | | 0.84 | | | | 1.16 | | | | 0.01 | |
| Ratios to average daily net assets (%)**: | | | | | | | | | | | | | | | | | | | | | | | | | |
| Expenses, before waivers and reimbursements | | | | 0.77 | | | | 0.75 | | | | 0.72 | | | | 0.79 | | | | 0.83 | | | | 0.77 | |
| Expenses, net of waivers and reimbursements | | | | 0.55 | | | | 0.55 | | | | 0.58 | | | | 0.61 | | | | 0.68 | | | | 0.60 | |
| Net investment income (loss), before waivers and reimbursements | | | | 1.22 | | | | 1.96 | | | | 1.83 | | | | 1.04 | | | | 0.83 | | | | 0.54 | |
| Net investment income (loss), net of waivers and reimbursements | | | | 1.44 | | | | 2.16 | | | | 1.97 | | | | 1.22 | | | | 0.98 | | | | 0.71 | |
| Class N net assets at the end of the year (in thousands) | | | $ | 7,192 | | | $ | 1,513 | | | $ | 1,661 | | | $ | 1,979 | | | $ | 7,237 | | | $ | 2,712 | |
| Portfolio turnover rate (%)* | | | | 76 | | | | 183 | | | | 122 | | | | 109 | | | | 81 | | | | 106 | |
| | | | | | | | | | | | | | | | | | | | | | | | | | |
| | | Class I | |
| | | (unaudited)
Period Ended
June 30, | | | Years Ended December 31, | |
| | | | | 2020 | | | | 2019 | | | | 2018 | | | | 2017 | | | | 2016 | | | | 2015 | |
| Net asset value, beginning of year | | | $ | 8.67 | | | $ | 8.70 | | | $ | 8.91 | | | $ | 9.07 | | | $ | 9.16 | | | $ | 9.37 | |
| Income (loss) from investment operations: | | | | | | | | | | | | | | | | | | | | | | | | | |
| Net investment income (loss) | | | | 0.08 | | | | 0.20 | | | | 0.19 | | | | 0.13 | | | | 0.11 | | | | 0.08 | |
| Net realized and unrealized gain (loss) on investments | | | | 0.09 | | | | 0.10 | | | | (0.09 | ) | | | (0.05 | ) | | | 0.02 | | | | (0.05 | ) |
| Total from investment operations | | | | 0.17 | | | | 0.30 | | | | 0.10 | | | | 0.08 | | | | 0.13 | | | | 0.03 | |
| Less distributions from: | | | | | | | | | | | | | | | | | | | | | | | | | |
| Net investment income | | | | 0.15 | | | | 0.33 | | | | 0.31 | | | | 0.24 | | | | 0.22 | | | | 0.24 | |
| Net realized gain | | | | — | | | | — | | | | — | | | | — | | | | — | | | | — | |
| Total distributions | | | | 0.15 | | | | 0.33 | | | | 0.31 | | | | 0.24 | | | | 0.22 | | | | 0.24 | |
| Net asset value, end of year | | | $ | 8.69 | | | $ | 8.67 | | | $ | 8.70 | | | $ | 8.91 | | | $ | 9.07 | | | $ | 9.16 | |
| Total return (%)* | | | | 1.93 | | | | 3.52 | | | | 1.12 | | | | 0.91 | | | | 1.40 | | | | 0.30 | |
| Ratios to average daily net assets (%)**: | | | | | | | | | | | | | | | | | | | | | | | | | |
| Expenses, before waivers and reimbursements | | | | 0.58 | | | | 0.53 | | | | 0.46 | | | | 0.59 | | | | 0.59 | | | | 0.59 | |
| Expenses, net of waivers and reimbursements | | | | 0.40 | | | | 0.40 | | | | 0.39 | | | | 0.41 | | | | 0.44 | | | | 0.42 | |
| Net investment income (loss), before waivers and reimbursements | | | | 1.63 | | | | 2.19 | | | | 2.05 | | | | 1.27 | | | | 1.05 | | | | 0.70 | |
| Net investment income (loss), net of waivers and reimbursements | | | | 1.81 | | | | 2.32 | | | | 2.12 | | | | 1.45 | | | | 1.20 | | | | 0.87 | |
| Class I net assets at the end of the year (in thousands) | | | $ | 63,588 | | | $ | 38,156 | | | $ | 56,120 | | | $ | 131,186 | | | $ | 219,714 | | | $ | 107,137 | |
| Portfolio turnover rate (%)* | | | | 76 | | | | 183 | | | | 122 | | | | 109 | | | | 81 | | | | 106 | |
| * | Rates are not annualized for periods less than a year. |
| ** | Rates are annualized for periods less than a year. |
Note: Net investment income (loss) per share is based on the average shares outstanding during the year.
Performance cited represents past performance. Past performance does not guarantee future results and current performance may be lower or higher than the data quoted. Results shown are annual returns, which assume reinvestment of dividends and capital gains. Investment returns and principal will fluctuate and you may have a gain or loss when you sell shares. For the most current month-end performance information, please call 1-800-742-7272 or visit our Web site at www.williamblairfunds.com.
| June 30, 2020 | William Blair Funds | 165 |
Financial Highlights — For a share outstanding throughout each period
Low Duration Fund
| | | Class R6 | |
| | | (unaudited)
Period Ended
June 30, | | | Years Ended December 31, | |
| | | | 2020 | | | 2019 | | | 2018 | | | 2017 | | | 2016 | | | 2015 | |
| Net asset value, beginning of year | | | $ | 8.68 | | | $ | 8.70 | | | $ | 8.91 | | | $ | 9.07 | | | $ | 9.16 | | | $ | 9.38 | |
| Income (loss) from investment operations: | | | | | | | | | | | | | | | | | | | | | | | | | |
| Net investment income (loss) | | | | 0.08 | | | | 0.21 | | | | 0.19 | | | | 0.14 | | | | 0.11 | | | | 0.09 | |
| Net realized and unrealized gain (loss) on investments | | | | 0.08 | | | | 0.11 | | | | (0.09 | ) | | | (0.05 | ) | | | 0.02 | | | | (0.07 | ) |
| Total from investment operations | | | | 0.16 | | | | 0.32 | | | | 0.10 | | | | 0.09 | | | | 0.13 | | | | 0.02 | |
| Less distributions from: | | | | | | | | | | | | | | | | | | | | | | | | | |
| Net investment income | | | | 0.15 | | | | 0.34 | | | | 0.31 | | | | 0.25 | | | | 0.22 | | | | 0.24 | |
| Net realized gain | | | | — | | | | — | | | | — | | | | — | | | | — | | | | — | |
| Total distributions | | | | 0.15 | | | | 0.34 | | | | 0.31 | | | | 0.25 | | | | 0.22 | | | | 0.24 | |
| Net asset value, end of year | | | $ | 8.69 | | | $ | 8.68 | | | $ | 8.70 | | | $ | 8.91 | | | $ | 9.07 | | | $ | 9.16 | |
| Total return (%)* | | | | 1.84 | | | | 3.69 | | | | 1.15 | | | | 0.96 | | | | 1.43 | | | | 0.22 | |
| Ratios to average daily net assets (%)**: | | | | | | | | | | | | | | | | | | | | | | | | | |
| Expenses, before waivers and reimbursements | | | | 0.54 | | | | 0.50 | | | | 0.42 | | | | 0.40 | | | | 0.40 | | | | 0.42 | |
| Expenses, net of waivers and reimbursements | | | | 0.35 | | | | 0.35 | | | | 0.35 | | | | 0.37 | | | | 0.40 | | | | 0.40 | |
| Net investment income (loss), before waivers and reimbursements | | | | 1.70 | | | | 2.22 | | | | 2.10 | | | | 1.48 | | | | 1.25 | | | | 0.92 | |
| Net investment income (loss), net of waivers and reimbursements | | | | 1.89 | | | | 2.37 | | | | 2.17 | | | | 1.51 | | | | 1.25 | | | | 0.94 | |
| Class R6 net assets at the end of the year (in thousands) | | | $ | 40,582 | | | $ | 36,846 | | | $ | 47,585 | | | $ | 99,912 | | | $ | 53,122 | | | $ | 21,863 | |
| Portfolio turnover rate (%)* | | | | 76 | | | | 183 | | | | 122 | | | | 109 | | | | 81 | | | | 106 | |
| * | Rates are not annualized for periods less than a year. |
| ** | Rates are annualized for periods less than a year. |
Note: Net investment income (loss) per share is based on the average shares outstanding during the year.
Performance cited represents past performance. Past performance does not guarantee future results and current performance may be lower or higher than the data quoted. Results shown are annual returns, which assume reinvestment of dividends and capital gains. Investment returns and principal will fluctuate and you may have a gain or loss when you sell shares. For the most current month-end performance information, please call 1-800-742-7272 or visit our Web site at www.williamblairfunds.com.
| 166 | Semiannual Report | June 30, 2020 |
Financial Highlights — For a share outstanding throughout each period
Macro Allocation Fund
| | | Class N | |
| | | (unaudited)
Period Ended
June 30, | | | Years Ended December 31, | |
| | | | 2020 | | | 2019 | | | 2018 | | | 2017 | | | 2016 | | | 2015 | |
| Net asset value, beginning of year | | | $ | 11.44 | | | $ | 11.41 | | | $ | 11.84 | | | $ | 11.34 | | | $ | 11.32 | | | $ | 12.14 | |
| Income (loss) from investment operations: | | | | | | | | | | | | | | | | | | | | | | | | | |
| Net investment income (loss) | | | | 0.02 | | | | 0.08 | | | | 0.08 | | | | 0.06 | | | | 0.04 | | | | 0.04 | |
| Net realized and unrealized gain (loss) on investments | | | | (0.83 | ) | | | 0.37 | | | | (0.24 | ) | | | 0.51 | | | | 0.19 | | | | (0.80 | ) |
| Total from investment operations | | | | (0.81 | ) | | | 0.45 | | | | (0.16 | ) | | | 0.57 | | | | 0.23 | | | | (0.76 | ) |
| Less distributions from: | | | | | | | | | | | | | | | | | | | | | | | | | |
| Net investment income | | | | — | | | | 0.42 | | | | 0.27 | | | | 0.07 | | | | 0.21 | | | | 0.06 | |
| Net realized gain | | | | — | | | | — | | | | — | | | | — | | | | — | | | | — | |
| Total distributions | | | | — | | | | 0.42 | | | | 0.27 | | | | 0.07 | | | | 0.21 | | | | 0.06 | |
| Net asset value, end of year | | | $ | 10.63 | | | $ | 11.44 | | | $ | 11.41 | | | $ | 11.84 | | | $ | 11.34 | | | $ | 11.32 | |
| Total return (%)* | | | | (7.08 | ) | | | 3.97 | | | | (1.30 | ) | | | 5.06 | | | | 2.01 | | | | (6.24 | ) |
| Ratios to average daily net assets (%)**: | | | | | | | | | | | | | | | | | | | | | | | | | |
| Expenses, before waivers and reimbursements | | | | 1.33 | | | | 1.22 | | | | 1.30 | | | | 1.52 | | | | 1.38 | | | | 1.42 | |
| Expenses, net of waivers and reimbursements | | | | 1.26 | | | | 1.22 | | | | 1.30 | | | | 1.37 | | | | 1.23 | | | | 1.27 | |
| Expenses (excluding interest or short dividend expense), net of waivers and reimbursements | | | | 1.25 | | | | 1.21 | | | | 1.28 | | | | 1.31 | | | | 1.23 | | | | 1.27 | |
| Net investment income (loss), before waivers and reimbursements | | | | 0.33 | | | | 0.70 | | | | 0.66 | | | | 0.35 | | | | 0.17 | | | | 0.17 | |
| Net investment income (loss), net of waivers and reimbursements | | | | 0.40 | | | | 0.70 | | | | 0.66 | | | | 0.50 | | | | 0.32 | | | | 0.32 | |
| Class N net assets at the end of the year (in thousands) | | | $ | 8,519 | | | $ | 13,717 | | | $ | 43,463 | | | $ | 41,483 | | | $ | 61,376 | | | $ | 150,606 | |
| Portfolio turnover rate (%)* | | | | 16 | | | | 31 | | | | 36 | | | | 43 | | | | 50 | | | | 34 | |
| | | | | | | | | | | | | | | | | | | | | | | | | | |
| | | Class I | |
| | | (unaudited)
Period Ended
June 30, | | | Years Ended December 31, | |
| | | | | 2020 | | | | 2019 | | | | 2018 | | | | 2017 | | | | 2016 | | | | 2015 | |
| Net asset value, beginning of year | | | $ | 11.35 | | | $ | 11.38 | | | $ | 11.88 | | | $ | 11.38 | | | $ | 11.38 | | | $ | 12.22 | |
| Income (loss) from investment operations: | | | | | | | | | | | | | | | | | | | | | | | | | |
| Net investment income (loss) | | | | 0.04 | | | | 0.13 | | | | 0.11 | | | | 0.11 | | | | 0.08 | | | | 0.09 | |
| Net realized and unrealized gain (loss) on investments | | | | (0.83 | ) | | | 0.34 | | | | (0.24 | ) | | | 0.51 | | | | 0.18 | | | | (0.82 | ) |
| Total from investment operations | | | | (0.79 | ) | | | 0.47 | | | | (0.13 | ) | | | 0.62 | | | | 0.26 | | | | (0.73 | ) |
| Less distributions from: | | | | | | | | | | | | | | | | | | | | | | | | | |
| Net investment income | | | | — | | | | 0.50 | | | | 0.37 | | | | 0.12 | | | | 0.26 | | | | 0.11 | |
| Net realized gain | | | | — | | | | — | | | | — | | | | — | | | | — | | | | — | |
| Total distributions | | | | — | | | | 0.50 | | | | 0.37 | | | | 0.12 | | | | 0.26 | | | | 0.11 | |
| Net asset value, end of year | | | $ | 10.56 | | | $ | 11.35 | | | $ | 11.38 | | | $ | 11.88 | | | $ | 11.38 | | | $ | 11.38 | |
| Total return (%)* | | | | (6.96 | ) | | | 4.14 | | | | (1.08 | ) | | | 5.50 | | | | 2.26 | | | | (6.00 | ) |
| Ratios to average daily net assets (%)**: | | | | | | | | | | | | | | | | | | | | | | | | | |
| Expenses, before waivers and reimbursements | | | | 1.01 | | | | 0.97 | | | | 0.99 | | | | 1.17 | | | | 1.12 | | | | 1.14 | |
| Expenses, net of waivers and reimbursements | | | | 1.01 | | | | 0.97 | | | | 0.99 | | | | 1.02 | | | | 0.97 | | | | 0.99 | |
| Expenses (excluding interest or short dividend expense), net of waivers and reimbursements | | | | 1.00 | | | | 0.96 | | | | 0.97 | | | | 0.96 | | | | 0.97 | | | | 0.98 | |
| Net investment income (loss), before waivers and reimbursements | | | | 0.65 | | | | 1.09 | | | | 0.95 | | | | 0.75 | | | | 0.52 | | | | 0.58 | |
| Net investment income (loss), net of waivers and reimbursements | | | | 0.65 | | | | 1.09 | | | | 0.95 | | | | 0.90 | | | | 0.67 | | | | 0.73 | |
| Class I net assets at the end of the year (in thousands) | | | $ | 248,277 | | | $ | 358,935 | | | $ | 486,543 | | | $ | 780,075 | | | $ | 937,244 | | | $ | 1,155,051 | |
| Portfolio turnover rate (%)* | | | | 16 | | | | 31 | | | | 36 | | | | 43 | | | | 50 | | | | 34 | |
| * | Rates are not annualized for periods less than a year. |
| ** | Rates are annualized for periods less than a year. |
Note: Net investment income (loss) per share is based on the average shares outstanding during the year.
Performance cited represents past performance. Past performance does not guarantee future results and current performance may be lower or higher than the data quoted. Results shown are annual returns, which assume reinvestment of dividends and capital gains. Investment returns and principal will fluctuate and you may have a gain or loss when you sell shares. For the most current month-end performance information, please call 1-800-742-7272 or visit our Web site at www.williamblairfunds.com.
| June 30, 2020 | William Blair Funds | 167 |
Financial Highlights — For a share outstanding throughout each period
Macro Allocation Fund
| | | Class R6 | |
| | | (unaudited)
Period Ended
June 30, | | | Years Ended December 31, | |
| | | | | 2020 | | | | 2019 | | | | 2018 | | | | 2017 | | | | 2016 | | | | 2015 | |
| Net asset value, beginning of year | | | $ | 11.36 | | | $ | 11.38 | | | $ | 11.89 | | | $ | 11.40 | | | $ | 11.39 | | | $ | 12.23 | |
| Income (loss) from investment operations: | | | | | | | | | | | | | | | | | | | | | | | | | |
| Net investment income (loss) | | | | 0.04 | | | | 0.14 | | | | 0.13 | | | | 0.12 | | | | 0.09 | | | | 0.12 | |
| Net realized and unrealized gain (loss) on investments | | | | (0.82 | ) | | | 0.34 | | | | (0.24 | ) | | | 0.51 | | | | 0.19 | | | | (0.84 | ) |
| Total from investment operations | | | | (0.78 | ) | | | 0.48 | | | | (0.11 | ) | | | 0.63 | | | | 0.28 | | | | (0.72 | ) |
| Less distributions from: | | | | | | | | | | | | | | | | | | | | | | | | | |
| Net investment income | | | | — | | | | 0.50 | | | | 0.40 | | | | 0.14 | | | | 0.27 | | | | 0.12 | |
| Net realized gain | | | | — | | | | — | | | | — | | | | — | | | | — | | | | — | |
| Total distributions | | | | — | | | | 0.50 | | | | 0.40 | | | | 0.14 | | | | 0.27 | | | | 0.12 | |
| Net asset value, end of year | | | $ | 10.58 | | | $ | 11.36 | | | $ | 11.38 | | | $ | 11.89 | | | $ | 11.40 | | | $ | 11.39 | |
| Total return (%)* | | | | (6.87 | ) | | | 4.29 | | | | (0.94 | ) | | | 5.51 | | | | 2.44 | | | | (5.92 | ) |
| Ratios to average daily net assets (%)**: | | | | | | | | | | | | | | | | | | | | | | | | | |
| Expenses, before waivers and reimbursements | | | | 0.92 | | | | 0.89 | | | | 0.91 | | | | 0.92 | | | | 0.89 | | | | 0.90 | |
| Expenses, net of waivers and reimbursements | | | | 0.92 | | | | 0.89 | | | | 0.91 | | | | 0.92 | | | | 0.89 | | | | 0.90 | |
| Expenses (excluding interest or short dividend expense), net of waivers and reimbursements | | | | 0.91 | | | | 0.88 | | | | 0.89 | | | | 0.86 | | | | 0.89 | | | | 0.90 | |
| Net investment income (loss), before waivers and reimbursements | | | | 0.79 | | | | 1.23 | | | | 1.10 | | | | 1.04 | | | | 0.81 | | | | 0.95 | |
| Net investment income (loss), net of waivers and reimbursements | | | | 0.79 | | | | 1.23 | | | | 1.10 | | | | 1.04 | | | | 0.81 | | | | 0.95 | |
| Class R6 net assets at the end of the year (in thousands) | | | $ | 289,668 | | | $ | 378,148 | | | $ | 391,812 | | | $ | 487,082 | | | $ | 582,298 | | | $ | 426,230 | |
| Portfolio turnover rate (%)* | | | | 16 | | | | 31 | | | | 36 | | | | 43 | | | | 50 | | | | 34 | |
| * | Rates are not annualized for periods less than a year. |
| ** | Rates are annualized for periods less than a year. |
Note: Net investment income (loss) per share is based on the average shares outstanding during the year.
Performance cited represents past performance. Past performance does not guarantee future results and current performance may be lower or higher than the data quoted. Results shown are annual returns, which assume reinvestment of dividends and capital gains. Investment returns and principal will fluctuate and you may have a gain or loss when you sell shares. For the most current month-end performance information, please call 1-800-742-7272 or visit our Web site at www.williamblairfunds.com.
| 168 | Semiannual Report | June 30, 2020 |
Renewal of the Management Agreement
On April 29, 2020, the Board of Trustees (the “Board”) of the William Blair Funds (the “Trust”), including the Trustees who are not “interested persons” of the Trust as defined by the Investment Company Act of 1940, as amended (the “Independent Trustees”), approved the renewal for an additional one-year term of the Trust’s Management Agreement with William Blair Investment Management, LLC (the “Adviser”) on behalf of each of the William Blair Funds (each, a “Fund” and collectively, the “Funds”), with the exception of the Small-Mid Cap Core Fund, for which the Management Agreement was approved for an initial two-year term by the Board on July 31, 2019. In deciding to approve the renewal of the Management Agreement, the Board did not identify any single factor or group of factors as all important or controlling and considered all factors together. The Board did not allot a particular weight to any one factor or group of factors.
The information in this summary outlines the Board’s considerations associated with its renewal of the Management Agreement. In connection with its deliberations regarding the continuation of the Management Agreement, the Board considered such information and factors as it believed to be necessary to evaluate the terms of the Management Agreement. As described below, the Board considered the nature, quality and extent of the services performed by the Adviser under the Management Agreement; the investment performance of each Fund and the Adviser; comparative management fees and expense ratios as prepared by an independent provider (Broadridge); the estimated profitability realized by the Adviser; the extent to which the Adviser realizes economies of scale as a Fund grows; and whether fall-out benefits are being realized by the Adviser. In addition, the Independent Trustees discussed the renewal of the Management Agreement with Trust management and in private sessions with independent legal counsel at which no representatives of the Adviser were present.
The Board, including the Independent Trustees, considered the renewal of the Management Agreement pursuant to a process that concluded at the Board’s April 29, 2020 meeting. In preparation for the review process, the Independent Trustees considered the type and nature of information to be requested, and independent legal counsel sent a formal request for information to the Adviser. The Adviser provided extensive information in response to the request. After reviewing the information received, the Independent Trustees requested supplemental information, which the Adviser provided. The Independent Trustees also received a memorandum from legal counsel advising them of their duties and responsibilities in connection with the consideration of the Management Agreement. The Independent Trustees reviewed comparative performance for a performance peer universe and peer group of funds and comparative management fees and expense ratios for an expense peer group and an expense peer universe of funds provided by Broadridge for each Fund. In addition, the Independent Trustees considered: (1) the nature, quality and extent of services provided by the Adviser; (2) information comparing the performance of each Fund to one or more relevant securities indexes; (3) information comparing management fees of each Fund to fees charged by the Adviser to other funds and client accounts with similar investment strategies; (4) the estimated allocated direct or indirect costs of services provided and estimated profits realized by the Adviser for both the Trust as a whole and each Fund individually; and (5) information describing other benefits to the Adviser and its affiliate, William Blair & Company, L.L.C. (the “Distributor,” and collectively with the Adviser, “William Blair”), resulting from their relationship with the Funds. The Independent Trustees also noted that they receive information from the Adviser regarding the Funds throughout the year in connection with regular Board meetings, including presentations from portfolio managers. In addition, the Adviser made a presentation to the Board regarding the contract review information, including addressing the supplemental information requests, and answered questions from the Independent Trustees. The Board, including the Independent Trustees, determined that, given the totality of the information provided with respect to the Management Agreement, the Board had received sufficient information to renew the Management Agreement. The Independent Trustees noted that in evaluating the Management Agreement, they were taking into account their accumulated experience as Board members in working with the Adviser on matters relating to the Funds. Based on their review, the Independent Trustees concluded that it was in the best interest of each Fund to renew the Management Agreement and, accordingly, recommended to the Board of the Trust the renewal of the Management Agreement for each Fund. The Board considered the recommendation of the Independent Trustees along with other factors that the Board deemed relevant.
Nature, Quality and Extent of Services. In evaluating the nature, quality and extent of the services provided by the Adviser to the Funds, the Board noted that the Adviser is a quality firm with a reputation for integrity and honesty that employs high-quality people and has a long association with the Funds, in each case other than the Growth Fund, since the inception of the Funds. The Board believes that a long-term relationship with a capable, conscientious adviser is in the best interests of shareholders and that shareholders have invested in the Funds knowing that the Adviser manages the Funds and knowing the management fees. The Board considered the Adviser’s fundamental research approach in actively managed, process oriented investing. The Board considered biographical information about the Trust’s officers, other Adviser personnel and the Funds’ portfolio managers, including information on the portfolio managers’ personal investments in the Fund(s) they manage. The Board also considered the administrative services performed by the Adviser, financial information regarding the Adviser, the Adviser’s execution quality and use of soft dollars, risk management oversight, compliance program and the expense limitations proposed for each of the Funds’ share classes. The Board also considered the nature, quality and extent of services that the
| June 30, 2020 | William Blair Funds | 169 |
Adviser provides to the Funds compared to the services that the Adviser provides to other clients. The Board noted that the Adviser pays the compensation of all of the officers of the Trust. Based upon all relevant factors, the Board concluded that the nature, quality and extent of the services provided by the Adviser to each Fund were appropriate.
Performance. The Board reviewed information on the annualized total returns of each share class of the Funds for the one-, three-, five- and ten-year periods ended December 31, 2019, as applicable, along with annualized total return information for a Morningstar performance peer universe of funds and one or more benchmark securities indexes. The Morningstar performance peer universe for each Fund included all funds in the same Morningstar category as the Fund. For purposes of this report, Class I shares were used for comparison purposes as the Board noted that Class I shares represent the largest percentage of assets in the Trust. In evaluating performance, the Board recognized that the performance data reflects a snapshot of a period as of a particular date and that selecting a different performance period could produce different results.
The Board considered that the Adviser seeks to provide superior performance over the long term and was committed to managing each Fund consistently with the Fund’s stated investment strategies and that at times relative performance will be affected by whether the market environment favors or disfavors particular investments, styles and/or market capitalizations. The Board concluded that the Adviser had managed the equity Funds in the U.S., Global/International and Emerging Markets growth strategies consistent with its disciplined quality growth philosophy. Based on the information provided, the Board considered the following with respect to the total returns of each Fund.
Growth Fund. The Board considered that the Fund’s total return was above the average of its Morningstar performance peer universe for the one-, three- and five-year periods ended December 31, 2019. The Board also considered that the Fund underperformed the benchmark (Russell 3000® Growth Index) for the one- and five-year periods and outperformed the benchmark for the three-year period ended December 31, 2019.
Large Cap Growth Fund. The Board considered that the Fund’s total return was above the average of its Morningstar performance peer universe for the one-, three- and five-year periods ended December 31, 2019. The Board also considered that the Fund was within range of the benchmark (Russell 1000® Growth Index) for the one-year period and outperformed the benchmark for the three- and five-year periods ended December 31, 2019.
Mid Cap Growth Fund. The Board considered that the Fund’s total return was above the average of its Morningstar performance peer universe and the benchmark (Russell Midcap® Growth Index) for the one- and three-year periods and below the average of its Morningstar performance peer universe and the benchmark for the five-year period ended December 31, 2019.
Small-Mid Cap Growth Fund. The Board considered that the Fund’s total return was below the average of its Morningstar performance peer universe and the benchmark (Russell 2500TM Growth Index) for the one-year period and above the average of its Morningstar performance peer universe and the benchmark for the three- and five-year periods ended December 31, 2019.
Small-Mid Cap Value Fund. The Board considered that the Fund’s total return was below the average of its Morningstar performance peer universe and the benchmark (Russell 2500TM Value Index) for the one-, three- and five-year periods ended December 31, 2019. The Board considered the Adviser’s view that while better stock selection would have lessened underperformance over the three- and five- year periods, that the rally in deeper value stocks and the outperformance of smaller cap and lower quality stocks contributed to underperformance.
Small Cap Growth Fund. The Board considered that the Fund’s total return was below the average of its Morningstar performance peer universe and the benchmark (Russell 2000® Growth Index) for the one-year period and above the average of its Morningstar performance peer universe and the benchmark for the three- and five-year periods ended December 31, 2019.
Small Cap Value Fund. The Board considered that the Fund’s total return was below the average of its Morningstar performance peer universe and the benchmark (Russell 2000® Value Index) for the one-, three- and five-year periods ended December 31, 2019. The Board considered the Adviser’s view that while better stock selection would have lessened underperformance over the three- and five- year periods, that the rally in deeper value stocks and the outperformance of smaller cap and lower quality stocks contributed to underperformance.
Global Leaders Fund. The Board considered that the Fund’s total return was above the average of its Morningstar performance peer universe and the benchmark (MSCI All Country World IMI (net) Index) for the one-, three- and five-year periods ended December 31, 2019.
| 170 | Semiannual Report | June 30, 2020 |
International Leaders Fund. The Board considered that the Fund’s total return was above the average of its Morningstar performance peer universe and the benchmark (MSCI All Country World Ex-U.S. IMI (net) Index) for the one-, three- and five-year periods ended December 31, 2019.
International Growth Fund. The Board considered that the Fund’s total return was above the average of its Morningstar performance peer universe for the one-year period and below the average of its Morningstar performance peer universe for the three- and five-year periods ended December 31, 2019. The Board also considered that the Fund outperformed the benchmark (MSCI All Country World Ex-U.S. IMI (net) Index) for the one-, three- and five-year periods ended December 31, 2019.
Institutional International Growth Fund. The Board considered that the Fund’s total return was above the average of its Morningstar performance peer universe for the one-year period and below the average of its Morningstar performance peer universe for the three- and five-year periods ended December 31, 2019. The Board also considered that the Fund outperformed the benchmark (MSCI All Country World Ex-U.S. IMI (net) Index) for the one-, three- and five-year periods ended December 31, 2019.
International Small Cap Growth Fund. The Board considered that the Fund’s total return was above the average of its Morningstar performance peer universe for the one-year period and below the average of its Morningstar performance peer universe for the three- and five-year periods ended December 31, 2019. The Board also considered that the Fund outperformed the benchmark (MSCI All Country World Ex-U.S. Small Cap (net) Index) for the one-, three- and five-year periods ended December 31, 2019.
Emerging Markets Leaders Fund. The Board considered that the Fund’s total return was above the average of its Morningstar performance peer universe for the one-, three- and five-year periods ended December 31, 2019. The Board also considered that the Fund outperformed the benchmark (MSCI Emerging Markets (net) Index) for the one- and three-year periods and was within range of the benchmark for the five-year period ended December 31, 2019.
Emerging Markets Growth Fund. The Board considered that the Fund’s total return was above the average of its Morningstar performance peer universe and the benchmark (MSCI Emerging Markets IMI (net) Index) for the one-, three- and five-year periods ended December 31, 2019.
Emerging Markets Small Cap Growth Fund. The Board considered that the Fund’s total return was within range of the average of its Morningstar performance peer universe for the one-year period and below the average of its Morningstar performance peer universe for the three- and five-year periods ended December 31, 2019. The Board also considered that the Fund outperformed the benchmark (MSCI Emerging Markets Small Cap (net) Index) for the one- and three-year periods and was within range of the benchmark for the five-year period ended December 31, 2019.
Bond Fund. The Board considered that the Fund’s total return was above the average of its Morningstar performance peer universe and the benchmark (Bloomberg Barclays U.S. Aggregate Bond Index) for the one-, three- and five-year periods ended December 31, 2019.
Income Fund. The Board considered that the Fund’s total return was above the average of its Morningstar performance peer universe for the one- and five-year periods and within range of its Morningstar performance peer universe for the three-year period ended December 31, 2019. The Board also considered that the Fund underperformed the benchmark (Bloomberg Barclays Intermediate Government/Credit Bond Index) for the one-, three- and five-year periods ended December 31, 2019.
Low Duration Fund. The Board considered that the Fund’s total return was above the average of its Morningstar performance peer universe for the one-year period and below the average of its Morningstar performance peer universe for the three- and five-year periods ended December 31, 2019. The Board also considered that the Fund outperformed the benchmark (ICE BofAML 1-Year US Treasury Note Index) for the one-, three- and five-year periods ended December 31, 2019.
Macro Allocation Fund. The Board considered that the Fund’s total return was below the average of its Morningstar performance peer universe for the one- and five-year periods and above the average of its Morningstar performance peer universe for the three-year period ended December 31, 2019. The Board also considered that the Fund outperformed the benchmark (ICE BofAML 3-Month US Treasury Bill Index) for the one- and three-year periods and underperformed the benchmark for the five-year period ended December 31, 2019. The Board considered the Adviser’s view that many of the strategies in the Morningstar peer group were of the type that had a much higher correlation to the global and U.S. equity market than the Fund, and/or realized greater levels of volatility during these time periods, which may have helped contribute to higher returns compared to the Fund as equity markets were generally positively performing, with the U.S. equity market among the strongest segment.
| June 30, 2020 | William Blair Funds | 171 |
Management Fees. The Board reviewed each Fund’s management fee and reviewed information comparing the management fee to those of an expense peer group and an expense peer universe of funds provided by Broadridge for each share class of the Funds. The Broadridge expense peer group for Class N shares of each Fund (“Class N Broadridge Expense Group”) consisted of a group of retail no-load funds with a similar investment strategy and asset size, as classified by Broadridge. The Broadridge expense peer group for Class I (the “Class I Broadridge Expense Group”) and Class R6 of each Fund consisted of a group of institutional funds with a similar investment strategy and asset size, as classified by Broadridge. The Broadridge expense peer universe for each share class of each Fund consisted of the Fund’s Broadridge expense peer group and all other no-load funds with an investment strategy as classified by Broadridge similar to the Fund’s. In considering the Broadridge information and giving effect to the contractual management fee reductions proposed by the Adviser, the Board noted that the contractual management fees for the Growth Fund, the Large Cap Growth Fund, the Small-Mid Cap Value Fund, the International Small Cap Growth Fund, the Emerging Markets Small Cap Growth Fund and the Bond Fund were below the average contractual management fee of their Class I Broadridge Expense Group. The Board also noted that the contractual management fees for the Mid Cap Growth Fund, the Small-Mid Cap Growth Fund, the Small Cap Growth Fund, the Small Cap Value Fund, the Global Leaders Fund, the International Leaders Fund, the International Growth Fund, the Emerging Markets Leaders Fund, the Emerging Markets Growth Fund, the Income Fund, the Low Duration Fund and the Macro Allocation Fund were above the average contractual management fee of their Class I Broadridge Expense Group. The Board also considered the Adviser’s proposal to reduce the contractual management fee for the Small-Mid Cap Value Fund and the Small Cap Value Fund.
In considering the management fee for the Institutional International Growth Fund, which does not have share classes, the Board noted that the contractual management fee for the Fund was above the average contractual management fee of its Broadridge expense peer group.
The Board noted the current and proposed contractual expense limitations for the Funds and further noted that the Adviser proposed reducing the contractual limit on operating expenses for the Small-Mid Cap Value Fund and the Small Cap Value Fund. The Board considered that the Adviser proposed to contractually limit operating expenses until April 30, 2021 for each share class of the Funds. The Board considered the amount of management fees waived and other expenses reimbursed by the Adviser on behalf of the Funds in 2019, noting that the Adviser waived its entire management fee for and reimbursed other expenses to the Small-Mid Cap Value Fund.
For each Fund, the Board also reviewed amounts charged by the Adviser to other pooled investment vehicles, including other registered funds for which the Adviser acts as a sub-adviser, and the Adviser’s fee schedule for institutional accounts. With respect to other pooled investment vehicles and institutional accounts, the Board considered the Adviser’s statements to the effect that the level of services provided to the Funds and the regulatory responsibilities associated with sponsoring registered investment companies were greater as compared to the work involved for other pooled investment vehicles, including other registered funds for which the Adviser acts as a sub-adviser, and institutional accounts. In addition, the Board considered the Adviser’s statements to the effect that institutional accounts are distributed differently, operate under different investment and regulatory structures and have different business risks as compared to the Funds and that there are responsibilities and duties involved in sponsoring a registered fund that are not present in sub-advising a registered fund.
On the basis of all the information provided, the Board concluded that each Fund’s management fee, coupled with the applicable expense limitations, was reasonable.
Profitability. With respect to the profitability of the Management Agreement to the Adviser, the Board considered the overall fees paid under the Management Agreement, including the estimated allocated costs of the services provided, management fees waived and other expenses reimbursed, if any, and profits realized by the Adviser from its relationship with the Trust as a whole and each Fund individually. The Board concluded that the estimated profits realized by the Adviser were not unreasonable.
Economies of Scale. The Board considered the extent to which economies of scale would be realized as the Funds grow and whether fee levels reflect these economies of scale for the benefit of investors. The Board noted the Adviser’s statements to the effect that the resources required for the Adviser’s fundamental investment process typically increase as a Fund increases in size. The Board also considered that certain of the Funds were part of investment strategies that were capacity constrained by the Adviser so that opportunities for economies of scale were limited. The Board further considered that of the Funds that are subject to capacity constraints, the International Growth Fund, Institutional International Growth Fund, International Small Cap Growth Fund and Emerging Markets Small Cap Growth Fund are closed to investors, except as noted in each Fund’s prospectus.
In considering whether fee levels reflect economies of scale for the benefit of Fund investors, the Board considered each Fund’s asset size, management fee breakpoints for applicable Funds, the expense limitations in place for each Fund and the proposed reduction in management fees and/or expense limits for certain Funds and each Fund’s expense ratios. The Board concluded that in the aggregate the Funds’ fee levels reasonably reflect appropriate recognition of economies of scale.
| 172 | Semiannual Report | June 30, 2020 |
Other Benefits. The Board considered benefits derived by the Adviser and its affiliates from their relationship with the Funds, including (1) receipt of research from brokerage firms; (2) soft dollars, which pertain primarily to the Funds investing in equity securities; (3) reimbursement of some intermediary fees in the nature of sub-transfer agency fees; (4) fees from Class N shares of the Funds to the Distributor pursuant to the Rule 12b-1 Plan, nearly all of which are paid to third parties; and (5) favorable media coverage. The Board determined that management fees were reasonable in light of these benefits.
Conclusion. Based upon all of the information considered and the conclusions reached, the Board determined that the terms of the Management Agreement continue to be fair and reasonable and that the continuation of the Management Agreement is in the best interests of each Fund.
| June 30, 2020 | William Blair Funds | 173 |
Review of Liquidity Risk Management Program
The Board of Trustees (the “Board”) of William Blair Funds previously approved the William Blair Funds Liquidity Risk Management Program Policy (the “Policy”) under Rule 22e-4 under the 1940 Act (the “Liquidity Rule”), which sets forth the terms of the William Blair Liquidity Risk Management Program (the “Program”). The Program (through the Policy) seeks to assess, manage and review each Fund’s liquidity risk. For purposes of the Program, the Policy and the Liquidity Rule, “liquidity risk” is defined as the risk that a Fund could not meet requests to redeem shares issued by a Fund without significant dilution of remaining investors’ interest in the Funds. Among other things, the Liquidity Rule requires that a written report be provided to the Board on an annual basis that addresses the operation of the Program and assesses the adequacy and effectiveness of its implementation, including (if applicable) the operation of any highly liquid investment minimum (“HLIM”) established for a Fund and any material changes to the Program.
The Board designated the Liquidity Risk Management Committee of William Blair Investment Management, LLC, the Funds’ investment adviser, to be the administrator for the Program (the “Program Administrator”). On February 19, 2020, the Board of Trustees reviewed the Program Administrator’s written report (the “Report”) concerning the operation of the Program and the Policy as well as the adequacy and effectiveness of the Program’s and Policy’s implementation for the period from December 1, 2018 through December 31, 2019 (the “Program Reporting Period”). There were no material changes to the Program or to the Policy during the Program Reporting Period.
The Report summarized the operation of the Program and the Policy and the information and factors considered by the Program Administrator in assessing whether the Program and the Policy have been adequately and effectively implemented with respect to each Fund. Such information and factors included, among other things: (1) the liquidity risk framework used to assess, manage, and periodically review each Fund’s Liquidity Risk and the results of this assessment; (2) the classification of each of the Funds’ respective investments into one of four liquidity categories that reflect an estimate of their liquidity under normal and reasonably foreseeable stressed conditions; (3) whether a Fund invested primarily in “Highly Liquid Investments” (as defined under the Liquidity Rule) and whether an HLIM should be established for any Fund; (4) whether a Fund invested more than 15% of its assets in “Illiquid Investments” (as defined under the Liquidity Rule); (5) specific liquidity events arising during the Program Reporting Period, including the impact on Fund liquidity caused by extended non-U.S. market closures; and (6) the nature and quality of the services provided by the service provider engaged to assist with determining liquidity classifications for the Funds. Based on this review, the Report concluded that the Program and the Policy meet the requirements of the Liquidity Rule and are operating effectively.
| 174 | Semiannual Report | June 30, 2020 |
Trustees and Officers (Unaudited).† The trustees and officers of the William Blair Funds, their year of birth, their principal occupations during the last five years, their affiliations, if any, with William Blair, and other significant affiliations are set forth below. The address of each officer and trustee is 150 North Riverside Plaza, Chicago, Illinois 60606.
| Name and Year of Birth | | Position(s)
Held with
Trust | | Term of
Office(1) and
Length of
Time
Served | | Principal
Occupation(s)
During Past 5 Years | | Number of
Portfolios
in Trust
Complex
Overseen
by Trustee* | | Other Directorships
Held by Trustee
During Past 5 Years** |
| Interested Trustees | | | | | | | | |
Stephanie G. Braming,
1970(2) | | Chairman of the Board and President, previously Senior Vice President | | Chairman of the Board and President since 2018, and Senior Vice President 2014-2018 | | Global Head of Investment Management since 2017, portfolio manager (2014–2017) and Partner, William Blair | | 20 | | Chairman, William Blair SICAV |
Arthur J. Simon,
1954(2) | | Trustee | | Since 2018 | | General Counsel and Partner, William Blair | | 20 | | Director, William Blair SICAV |
| Non-Interested Trustees | | | | | | | | |
Vann A. Avedisian,
1964(3) | | Trustee | | Since 2012 | | Principal, Highgate Holdings (hotel investments) (since 2009); formerly, co-founder and Managing Director, Oxford Capital Partners Inc. (1994 to 2006) | | 20 | | Potbelly Corporation (2001 to 2015) |
Kathleen T. Barr,
1955 | | Trustee | | Since 2013 | | Retired; Vice Chairman, Independent Directors Council (since 2019); formerly, President, Productive Capital Management, Inc. (registered investment adviser to public entities) and Owner, KT Barr Consulting, LLC (mutual fund and investment management consulting) (2010 to 2013); prior thereto, Chief Administrative Officer, Senior Vice President and Senior Managing Director of Allegiant Asset Management Company (merged with PNC Capital Advisors, LLC in 2009) (2004 to 2010); Chief Administrative Officer, Chief Compliance Officer and Senior Vice President of PNC Funds and PNC Advantage Funds (f/k/a Allegiant Funds) (2003 to 2010) | | 20 | | Muzinich BDC, Inc. (since 2019); Board of Governors, Investment Company Institute (since 2019); Professionally Managed Portfolios (since 2018); Council Member, Independent Directors Council; AmericaFirst Quantitative Funds (5 portfolios) (2012 to 2016) |
| † | William Blair Investment Management, LLC and William Blair & Company, L.L.C. are collectively referred to in this section as “William Blair”, each of which is a wholly owned subsidiary of WBC Holdings, L.P., which is wholly owned by certain William Blair employees (employee owners are referred to as ‘partners’). |
| * | The number shown does not include three additional series of the Trust that are in existence, but not currently offered to the public. |
| ** | Includes directorships of public companies and other registered investment companies held during the past five years. |
| June 30, 2020 | William Blair Funds | 175 |
| Name and Year of Birth | | Position(s)
Held with
Trust | | Term of
Office(1) and
Length of
Time
Served | | Principal
Occupation(s)
During Past 5 Years | | Number of
Portfolios
in Trust
Complex
Overseen
by Trustee* | | Other Directorships
Held by Trustee
During Past 5 Years** |
Daniel N. Leib,
1966(3) | | Trustee | | Since 2016 | | Chief Executive Officer, Donnelley Financial Solutions, Inc. (since 2016); formerly, Executive Vice President and Chief Financial Officer, (2011 to 2016) and Group Chief Financial Officer (2009 to 2011), R.R. Donnelley & Sons Company | | 20 | | Donnelley Financial Solutions, Inc. (since 2016) |
Dorri C. McWhorter,
1973 | | Trustee | | Since 2019 | | Chief Executive Officer, YWCA Metropolitan Chicago (since 2013); formerly Partner, Crowe LLP (2008-2013)(4) | | 20 | | Skyway Concession Company, LLC (since 2018); Illinois CPA Society (since 2017); Lifeway Foods, Inc. (since 2020); American Institute of Certified Public Accountants (2013-2016); Chicago Finance Exchange (2009-2017) |
Thomas J. Skelly,
1951 | | Trustee | | Since 2007 | | Advisory Board Member for various U.S. companies (since 2005); formerly, Managing Partner of various divisions at Accenture (1994-2004) | | 20 | | Mutual Trust Financial Group (provider of insurance and investment products) |
Steven R. Zenz,
1954 | | Trustee | | Since 2018 | | Consultant, Steven R. Zenz Consulting LLC (merger and acquisition transactions and SEC reporting and filings) (since 2011); formerly, Partner, KPMG LLP (1987-2010)(5) | | 20 | | Frankly Inc. (technology products and services for media industry) (since 2016); Insignia Systems, Inc. (in-store advertising services for consumer packaged goods manufacturers) (2013-2019) |
| (1) | Each Trustee serves until the election and qualification of a successor, or until death, resignation or retirement, or removal as provided in the Trust’s Declaration of Trust. Retirement for Independent Trustees occurs no later than at the conclusion of the calendar year that occurs after the earlier of (a) the Independent Trustee’s 75th birthday or (b) the 17th anniversary of the date that the Independent Trustee became a member of the Board of Trustees. |
| (2) | Ms. Braming and Mr. Simon are interested persons of the Trust because they are partners of William Blair, and with respect to Ms. Braming also due to her position as an officer of the Trust. |
| (3) | The Funds and William Blair use Donnelley Financial Solutions, Inc. (“DFS’’) for financial printing and other services. DFS is a public company. The Funds and William Blair in the aggregate paid DFS approximately $122,000 and $188,000 in 2018 and 2019, respectively, for the services provided. DFS’s revenue was approximately $1 billion in 2018 and approximately $900 million in 2019. Mr. Leib, as the Chief Executive Officer of DFS, is not directly involved in any of the services provided to the Funds or William Blair and his compensation is not materially affected by the fees DFS receives from the Funds and William Blair. |
| (4) | As a former partner of the audit firm Crowe LLP (formerly, Crowe Horwath LLP), Ms. McWhorter receives distributions of her capital in the firm over time and those distributions are expected to be completed in March 2021. The Funds and William Blair made no payments to Crowe LLP over the past three years. |
| (5) | The Funds engage KPMG to provide foreign tax services in Taiwan. KPMG does not provide audit or audit-related services to the Funds. Mr. Zenz is a former partner of KPMG and receives pension/retirement funds from KPMG. |
| 176 | Semiannual Report | June 30, 2020 |
| Name and Year of Birth | | Position(s) Held
with Trust | | | Term of Office
and Length of
Time Served(1) | | | Principal Occupation(s)
During Past 5 Years |
| | | | | | | | | | | |
| Officers | | | | | | |
| | | | | | | |
Marcelo Assalin,
1973 | | Senior Vice President | | Since 2020 | | Associate, William Blair (since 2020); formerly, NN Investment Partners (2013-2020) |
| | | | | | | |
Michael P. Balkin,
1959 | | Senior Vice President | | Since 2008 | | Partner, William Blair |
| | | | | | | |
Thomas Clarke,
1968 | | Senior Vice President | | Since 2011 | | Partner, William Blair |
| | | | | | | |
Daniel Crowe,
1972 | | Senior Vice President | | Since 2016 | | Partner, William Blair |
| | | | | | | |
Robert J. Duwa,
1967 | | Senior Vice President | | Since 2019 | | Partner, William Blair |
| | | | | | | |
Simon Fennell,
1969 | | Senior Vice President | | Since 2013 | | Partner, William Blair |
| | | | | | | |
Andrew G. Flynn,
1961 | | Senior Vice President | | Since 2013 | | Partner, William Blair |
| | | | | | | |
David C. Fording,
1967 | | Senior Vice President | | Since 2006 | | Partner, William Blair |
| | | | | | | |
James S. Golan,
1961 | | Senior Vice President | | Since 2005 | | Partner, William Blair |
| | | | | | | |
James E. Jones,
1977 | | Senior Vice President | | Since 2019 | | Partner, William Blair |
| | | | | | | |
Chad M. Kilmer,
1975 | | Senior Vice President | | Since 2006 | | Partner, William Blair |
| | | | | | | |
Robert C. Lanphier IV,
1956 | | Senior Vice President | | Since 2003 | | Partner, William Blair |
| | | | | | | |
Mark T. Leslie,
1967 | | Senior Vice President | | Since 2005 | | Partner, William Blair |
| | | | | | | |
Kenneth J. McAtamney,
1966 | | Senior Vice President | | Since 2008 | | Partner, William Blair |
| | | | | | | |
Todd M. McClone,
1968 | | Senior Vice President | | Since 2005 | | Partner, William Blair |
| | | | | | | |
David S. Mitchell,
1960 | | Senior Vice President | | Since 2003 | | Partner, William Blair |
| | | | | | | |
John C. Murphy,
1969 | | Senior Vice President | | Since 2014 | | Partner, William Blair |
| | | | | | | |
Casey K. Preyss,
1976 | | Senior Vice President | | Since 2015 | | Partner, William Blair |
| | | | | | | |
David P. Ricci,
1958 | | Senior Vice President | | Since 2006 | | Partner, William Blair |
| | | | | | | |
Lisa D. Rusch,
1970 | | Senior Vice President
Vice President | | Since 2020
2018-2020 | | Partner, William Blair (since 2020); formerly, Associate, William Blair |
| | | | | | | |
Ward D. Sexton,
1974 | | Senior Vice President | | Since 2016 | | Partner, William Blair |
| | | | | | | |
Brian D. Singer,
1960 | | Senior Vice President | | Since 2011 | | Partner, William Blair |
| June 30, 2020 | William Blair Funds | 177 |
| Name and Year of Birth | | Position(s) Held
with Trust | | | Term of Office
and Length of
Time Served(1) | | | Principal Occupation(s)
During Past 5 Years |
| | | | | | | | | |
Dan Zelazny,
1971 | | Senior Vice President | | Since 2019 | | Associate, William Blair (since 2019); formerly Managing Director, AQR Capital Management (2011-2019) |
| | | | | | | |
Ruta Ziverte,
1973 | | Senior Vice President | | Since 2020 | | Associate, William Blair (since 2019); formerly, Oppenheimer Funds (2015-2019) |
| | | | | | | |
Kathleen M. Lynch,
1971 | | Vice President | | Since 2020 | | Associate, William Blair |
| | | | | | | |
Marco Ruijer,
1975 | | Vice President | | Since 2020 | | Associate, William Blair (since 2020); formerly, NN Investment Partners (2013-2020) |
| | | | | | | |
Paul J. Sularz,
1971 | | Vice President | | Since 2009 | | | | Associate, William Blair |
| | | | | | | | | |
John M. Raczek,
1970 | | Treasurer Assistant Treasurer | | Since 2019 2010-2019 | | | | Associate, William Blair |
| | | | | | | | | |
Andrew T. Pfau,
1970 | | Secretary | | | | Since 2009 | | | | Associate, William Blair |
| | | | | | | | | | | |
David M. Cihak,
1982 | | Assistant Treasurer | | Since 2019 | | Associate, William Blair |
| | | | | | | |
Walter R. Randall, Jr.,
1960 | | Chief Compliance Officer and Assistant Secretary | | Since 2009 | | Associate, William Blair |
| | | | | | | |
Robert J. Toner,
1967 | | Assistant Secretary | | Since 2016 | | Associate, William Blair |
| (1) | The Trust’s officers, except the Chief Compliance Officer, are elected annually by the Board of Trustees. The Trust’s Chief Compliance Officer is designated by the Board of Trustees and may only be removed by action of the Board of Trustees, including a majority of independent trustees. Length of Time Served for all officers indicates the year the individual became an officer of the Trust. |
The Statement of Additional Information for the William Blair Funds includes additional information about the trustees and is available without charge by calling 1-800-635-2886 (in Massachusetts 1-800-635-2840) or by writing the Fund.
| 178 | Semiannual Report | June 30, 2020 |
(Unaudited)
Proxy Voting
A description of the policies and procedures that the Funds use to determine how to vote proxies relating to portfolio securities and information regarding how the Funds voted proxies relating to portfolio securities for the most recent 12-month period ended December 31 are available without charge, upon request, by calling 1-800-635-2886 (in Massachusetts 1-800-635-2840), at www.williamblairfunds.com and on the SEC’s website at http://www.sec.gov.
Quarterly Portfolio Schedules
Each Fund files its complete schedule of portfolio holdings with the SEC for the first and third fiscal quarters of each fiscal year (quarters ended March 31 and September 30) on Form N-PORT. The Funds’ Forms N-PORT are available on the SEC’s website at http://www.sec.gov.
Additional Federal Income Tax Information: (unaudited)
Under Section 852(b)(3)(C) of the Code, the Funds hereby designate the following amounts as capital gain dividends for the fiscal year ended December 31, 2019 (in thousands):
| Fund | | Capital Gain Dividend |
| Growth | | $ | 23,906 | |
| Large Cap Growth | | | 18,020 | |
| Mid Cap Growth | | | 6,879 | |
| Small-Mid Cap Growth | | | 231,889 | |
| Small-Mid Cap Value | | | 105 | |
| Small Cap Growth | | | 15,356 | |
| Small Cap Value | | | 47,335 | |
| Global Leaders | | | 2,859 | |
| Emerging Markets Leaders | | | 382 | |
| Emerging Markets Growth | | | 24,009 | |
| June 30, 2020 | William Blair Funds | 179 |
Useful Information About Your Report (Unaudited)
Please refer to this information when reviewing the Expense Example for each Fund.
Expense Example
As a shareholder of a Fund, you incur two types of costs: (1) transaction costs and (2) ongoing costs, including management fees, distribution (12b-1) fees (for Class N shares, as applicable), and other Fund expenses. The example is intended to help you understand your ongoing costs (in dollars) of investing in the Fund and to compare these costs with the ongoing costs of investing in other mutual funds. To do so, compare the Fund’s 5% hypothetical example with the 5% hypothetical examples that appear in the shareholder reports of other funds. The example is based on an investment of $1,000 invested at the beginning of the period and held for the entire six-month period from January 1, 2020 to June 30, 2020.
Actual Expenses
In each example, the first line for each share class in the table provides information about the actual account values and actual expenses. These expenses reflect the effect of any expense cap applicable to the share class during the period. Without this expense cap, the costs shown in the table would have been higher. You may use the information in this line, together with the amount you invested, to estimate the expenses that you paid over the period. Simply divide your account value by $1,000 (example, an $8,600 account value divided by $1,000 = 8.6), then multiply the result by the number in the first line under the heading entitled “Expenses Paid During the Period” to estimate the expenses you paid on your account during the period.
Hypothetical Example for Comparison Purposes
In each example, the second line for each share class in the table provides information about hypothetical account values and hypothetical expenses based on the Fund’s actual expense ratio and an assumed rate of return of 5% per year before expenses. This is not the Fund’s actual return. The hypothetical account values and expenses may not be used to estimate your actual ending account balance or the expenses you paid for the period. You may use this information to compare the ongoing costs of investing in the Fund to the costs of investing in other funds. To do so, compare this 5% hypothetical example with the 5% hypothetical examples that appear in the shareholder reports of other funds.
Please note that the expenses shown in both examples are meant to highlight your ongoing costs only and do not reflect any transactional costs or account type fees, such as IRA administration fees. These fees are discussed in the prospectus. Therefore, the second line of each share class in the table is useful in comparing ongoing costs only and will not help you determine the relative costs of owning different funds. In addition, if these transactional costs or account fees were included, your costs would have been higher.
| 180 | Semiannual Report | June 30, 2020 |
Fund Expenses (Unaudited)
| Expense Example | | Beginning
Account Value
1/1/2020 | | Ending
Account Value
6/30/2020 | | Expenses Paid
During
the Period (a) | | Annualized
Expense Ratio |
| Growth Fund | | | | | | | | | | | | | | | | |
| Class N-actual return | | $ | 1,000.00 | | | $ | 1,077.25 | | | $ | 6.20 | | | | 1.20 | % |
| Class N-hypothetical 5% return | | $ | 1,000.00 | | | $ | 1,044.03 | | | $ | 6.10 | | | | 1.20 | |
| Class I-actual return | | $ | 1,000.00 | | | $ | 1,079.11 | | | $ | 4.86 | | | | 0.94 | |
| Class I-hypothetical 5% return | | $ | 1,000.00 | | | $ | 1,045.33 | | | $ | 4.78 | | | | 0.94 | |
| Class R6-actual return | | $ | 1,000.00 | | | $ | 1,079.93 | | | $ | 4.55 | | | | 0.88 | |
| Class R6-hypothetical 5% return | | $ | 1,000.00 | | | $ | 1,045.62 | | | $ | 4.48 | | | | 0.88 | |
| Large Cap Growth Fund | | | | | | | | | | | | | | | | |
| Class N-actual return | | $ | 1,000.00 | | | $ | 1,096.27 | | | $ | 4.69 | | | | 0.90 | |
| Class N-hypothetical 5% return | | $ | 1,000.00 | | | $ | 1,045.52 | | | $ | 4.58 | | | | 0.90 | |
| Class I-actual return | | $ | 1,000.00 | | | $ | 1,097.59 | | | $ | 3.39 | | | | 0.65 | |
| Class I-hypothetical 5% return | | $ | 1,000.00 | | | $ | 1,046.77 | | | $ | 3.31 | | | | 0.65 | |
| Class R6-actual return | | $ | 1,000.00 | | | $ | 1,098.33 | | | $ | 3.13 | | | | 0.60 | |
| Class R6-hypothetical 5% return | | $ | 1,000.00 | | | $ | 1,047.02 | | | $ | 3.05 | | | | 0.60 | |
| Mid Cap Growth Fund | | | | | | | | | | | | | | | | |
| Class N-actual return | | $ | 1,000.00 | | | $ | 986.35 | | | $ | 5.93 | | | | 1.20 | |
| Class N-hypothetical 5% return | | $ | 1,000.00 | | | $ | 1,044.03 | | | $ | 6.10 | | | | 1.20 | |
| Class I-actual return | | $ | 1,000.00 | | | $ | 988.26 | | | $ | 4.70 | | | | 0.95 | |
| Class I-hypothetical 5% return | | $ | 1,000.00 | | | $ | 1,045.28 | | | $ | 4.83 | | | | 0.95 | |
| Class R6-actual return | | $ | 1,000.00 | | | $ | 988.27 | | | $ | 4.45 | | | | 0.90 | |
| Class R6-hypothetical 5% return | | $ | 1,000.00 | | | $ | 1,045.52 | | | $ | 4.58 | | | | 0.90 | |
| Small-Mid Cap Core Fund | | | | | | | | | | | | | | | | |
| Class I-actual return | | $ | 1,000.00 | | | $ | 895.13 | | | $ | 4.48 | | | | 0.95 | |
| Class I-hypothetical 5% return | | $ | 1,000.00 | | | $ | 1,045.28 | | | $ | 4.83 | | | | 0.95 | |
| Class R6-actual return | | $ | 1,000.00 | | | $ | 896.07 | | | $ | 4.24 | | | | 0.90 | |
| Class R6-hypothetical 5% return | | $ | 1,000.00 | | | $ | 1,045.52 | | | $ | 4.58 | | | | 0.90 | |
| Small-Mid Cap Growth Fund | | | | | | | | | | | | | | | | |
| Class N-actual return | | $ | 1,000.00 | | | $ | 1,006.69 | | | $ | 6.74 | | | | 1.35 | |
| Class N-hypothetical 5% return | | $ | 1,000.00 | | | $ | 1,043.29 | | | $ | 6.86 | | | | 1.35 | |
| Class I-actual return | | $ | 1,000.00 | | | $ | 1,007.78 | | | $ | 5.49 | | | | 1.10 | |
| Class I-hypothetical 5% return | | $ | 1,000.00 | | | $ | 1,044.53 | | | $ | 5.59 | | | | 1.10 | |
| Class R6-actual return | | $ | 1,000.00 | | | $ | 1,008.15 | | | $ | 5.24 | | | | 1.05 | |
| Class R6-hypothetical 5% return | | $ | 1,000.00 | | | $ | 1,044.78 | | | $ | 5.34 | | | | 1.05 | |
| Small-Mid Cap Value Fund | | | | | | | | | | | | | | | | |
| Class N-actual return | | $ | 1,000.00 | | | $ | 761.14 | | | $ | 5.34 | | | | 1.22 | |
| Class N-hypothetical 5% return | | $ | 1,000.00 | | | $ | 1,043.93 | | | $ | 6.20 | | | | 1.22 | |
| Class I-actual return | | $ | 1,000.00 | | | $ | 763.70 | | | $ | 4.25 | | | | 0.97 | |
| Class I-hypothetical 5% return | | $ | 1,000.00 | | | $ | 1,045.18 | | | $ | 4.93 | | | | 0.97 | |
| Class R6-actual return | | $ | 1,000.00 | | | $ | 761.90 | | | $ | 4.03 | | | | 0.92 | |
| Class R6-hypothetical 5% return | | $ | 1,000.00 | | | $ | 1,045.43 | | | $ | 4.68 | | | | 0.92 | |
| Small Cap Growth Fund | | | | | | | | | | | | | | | | |
| Class N-actual return | | $ | 1,000.00 | | | $ | 971.17 | | | $ | 7.35 | | | | 1.50 | |
| Class N-hypothetical 5% return | | $ | 1,000.00 | | | $ | 1,042.54 | | | $ | 7.62 | | | | 1.50 | |
| Class I-actual return | | $ | 1,000.00 | | | $ | 972.75 | | | $ | 6.13 | | | | 1.25 | |
| Class I-hypothetical 5% return | | $ | 1,000.00 | | | $ | 1,043.78 | | | $ | 6.35 | | | | 1.25 | |
| Class R6-actual return | | $ | 1,000.00 | | | $ | 972.76 | | | $ | 5.89 | | | | 1.20 | |
| Class R6-hypothetical 5% return | | $ | 1,000.00 | | | $ | 1,044.03 | | | $ | 6.10 | | | | 1.20 | |
| Small Cap Value Fund | | | | | | | | | | | | | | | | |
| Class N-actual return | | $ | 1,000.00 | | | $ | 736.26 | | | $ | 6.13 | | | | 1.42 | |
| Class N-hypothetical 5% return | | $ | 1,000.00 | | | $ | 1,042.94 | | | $ | 7.21 | | | | 1.42 | |
| Class I-actual return | | $ | 1,000.00 | | | $ | 736.58 | | | $ | 5.05 | | | | 1.17 | |
| Class I-hypothetical 5% return | | $ | 1,000.00 | | | $ | 1,044.18 | | | $ | 5.95 | | | | 1.17 | |
| Class R6-actual return | | $ | 1,000.00 | | | $ | 737.27 | | | $ | 4.84 | | | | 1.12 | |
| Class R6-hypothetical 5% return | | $ | 1,000.00 | | | $ | 1,044.43 | | | $ | 5.69 | | | | 1.12 | |
| June 30, 2020 | William Blair Funds | 181 |
Fund Expenses (Unaudited)
| Expense Example | | Beginning
Account Value
1/1/2020 | | Ending
Account Value
6/30/2020 | | Expenses Paid
During
the Period (a) | | Annualized
Expense Ratio |
| Global Leaders Fund | | | | | | | | | | | | | | | | |
| Class N-actual return | | $ | 1,000.00 | | | $ | 1,022.12 | | | $ | 5.78 | | | | 1.15 | % |
| Class N-hypothetical 5% return | | $ | 1,000.00 | | | $ | 1,044.28 | | | $ | 5.85 | | | | 1.15 | |
| Class I-actual return | | $ | 1,000.00 | | | $ | 1,023.44 | | | $ | 4.53 | | | | 0.90 | |
| Class I-hypothetical 5% return | | $ | 1,000.00 | | | $ | 1,045.52 | | | $ | 4.58 | | | | 0.90 | |
| Class R6-actual return | | $ | 1,000.00 | | | $ | 1,024.11 | | | $ | 4.28 | | | | 0.85 | |
| Class R6-hypothetical 5% return | | $ | 1,000.00 | | | $ | 1,045.77 | | | $ | 4.32 | | | | 0.85 | |
| International Leaders Fund | | | | | | | | | | | | | | | | |
| Class N-actual return | | $ | 1,000.00 | | | $ | 987.28 | | | $ | 5.68 | | | | 1.15 | |
| Class N-hypothetical 5% return | | $ | 1,000.00 | | | $ | 1,044.28 | | | $ | 5.85 | | | | 1.15 | |
| Class I-actual return | | $ | 1,000.00 | | | $ | 988.42 | | | $ | 4.45 | | | | 0.90 | |
| Class I-hypothetical 5% return | | $ | 1,000.00 | | | $ | 1,045.52 | | | $ | 4.58 | | | | 0.90 | |
| Class R6-actual return | | $ | 1,000.00 | | | $ | 988.96 | | | $ | 4.20 | | | | 0.85 | |
| Class R6-hypothetical 5% return | | $ | 1,000.00 | | | $ | 1,045.77 | | | $ | 4.32 | | | | 0.85 | |
| International Growth Fund | | | | | | | | | | | | | | | | |
| Class N-actual return | | $ | 1,000.00 | | | $ | 1,002.70 | | | $ | 7.22 | | | | 1.45 | |
| Class N-hypothetical 5% return | | $ | 1,000.00 | | | $ | 1,042.79 | | | $ | 7.36 | | | | 1.45 | |
| Class I-actual return | | $ | 1,000.00 | | | $ | 1,003.95 | | | $ | 5.78 | | | | 1.16 | |
| Class I-hypothetical 5% return | | $ | 1,000.00 | | | $ | 1,044.23 | | | $ | 5.90 | | | | 1.16 | |
| Class R6-actual return | | $ | 1,000.00 | | | $ | 1,004.61 | | | $ | 5.33 | | | | 1.07 | |
| Class R6-hypothetical 5% return | | $ | 1,000.00 | | | $ | 1,044.68 | | | $ | 5.44 | | | | 1.07 | |
| Institutional International Growth Fund | | | | | | | | | | | | | | | | |
| Institutional Class-actual return | | $ | 1,000.00 | | | $ | 1,006.92 | | | $ | 4.94 | | | | 0.99 | |
| Institutional Class-hypothetical 5% return | | $ | 1,000.00 | | | $ | 1,045.08 | | | $ | 5.03 | | | | 0.99 | |
| International Small Cap Growth Fund | | | | | | | | | | | | | | | | |
| Class N-actual return | | $ | 1,000.00 | | | $ | 968.95 | | | $ | 7.54 | | | | 1.54 | |
| Class N-hypothetical 5% return | | $ | 1,000.00 | | | $ | 1,042.34 | | | $ | 7.82 | | | | 1.54 | |
| Class I-actual return | | $ | 1,000.00 | | | $ | 970.67 | | | $ | 6.22 | | | | 1.27 | |
| Class I-hypothetical 5% return | | $ | 1,000.00 | | | $ | 1,043.68 | | | $ | 6.45 | | | | 1.27 | |
| Class R6-actual return | | $ | 1,000.00 | | | $ | 971.53 | | | $ | 5.64 | | | | 1.15 | |
| Class R6-hypothetical 5% return | | $ | 1,000.00 | | | $ | 1,044.28 | | | $ | 5.85 | | | | 1.15 | |
| Emerging Markets Leaders Fund | | | | | | | | | | | | | | | | |
| Class N-actual return | | $ | 1,000.00 | | | $ | 955.28 | | | $ | 6.81 | | | | 1.40 | |
| Class N-hypothetical 5% return | | $ | 1,000.00 | | | $ | 1,043.04 | | | $ | 7.11 | | | | 1.40 | |
| Class I-actual return | | $ | 1,000.00 | | | $ | 957.22 | | | $ | 5.60 | | | | 1.15 | |
| Class I-hypothetical 5% return | | $ | 1,000.00 | | | $ | 1,044.28 | | | $ | 5.85 | | | | 1.15 | |
| Class R6-actual return | | $ | 1,000.00 | | | $ | 957.18 | | | $ | 5.35 | | | | 1.10 | |
| Class R6-hypothetical 5% return | | $ | 1,000.00 | | | $ | 1,044.53 | | | $ | 5.59 | | | | 1.10 | |
| Emerging Markets Growth Fund | | | | | | | | | | | | | | | | |
| Class N-actual return | | $ | 1,000.00 | | | $ | 1,032.19 | | | $ | 7.78 | | | | 1.54 | |
| Class N-hypothetical 5% return | | $ | 1,000.00 | | | $ | 1,042.34 | | | $ | 7.82 | | | | 1.54 | |
| Class I-actual return | | $ | 1,000.00 | | | $ | 1,033.29 | | | $ | 6.57 | | | | 1.30 | |
| Class I-hypothetical 5% return | | $ | 1,000.00 | | | $ | 1,043.54 | | | $ | 6.61 | | | | 1.30 | |
| Class R6-actual return | | $ | 1,000.00 | | | $ | 1,033.72 | | | $ | 6.07 | | | | 1.20 | |
| Class R6-hypothetical 5% return | | $ | 1,000.00 | | | $ | 1,044.03 | | | $ | 6.10 | | | | 1.20 | |
| Emerging Markets Small Cap Growth Fund | | | | | | | | | | | | | | | | |
| Class N-actual return | | $ | 1,000.00 | | | $ | 1,010.12 | | | $ | 7.75 | | | | 1.55 | |
| Class N-hypothetical 5% return | | $ | 1,000.00 | | | $ | 1,042.29 | | | $ | 7.87 | | | | 1.55 | |
| Class I-actual return | | $ | 1,000.00 | | | $ | 1,011.24 | | | $ | 6.50 | | | | 1.30 | |
| Class I-hypothetical 5% return | | $ | 1,000.00 | | | $ | 1,043.54 | | | $ | 6.61 | | | | 1.30 | |
| Class R6-actual return | | $ | 1,000.00 | | | $ | 1,011.22 | | | $ | 6.25 | | | | 1.25 | |
| Class R6-hypothetical 5% return | | $ | 1,000.00 | | | $ | 1,043.78 | | | $ | 6.35 | | | | 1.25 | |
| Bond Fund | | | | | | | | | | | | | | | | |
| Class N-actual return | | $ | 1,000.00 | | | $ | 1,042.94 | | | $ | 3.05 | | | | 0.60 | |
| Class N-hypothetical 5% return | | $ | 1,000.00 | | | $ | 1,047.02 | | | $ | 3.05 | | | | 0.60 | |
| Class I-actual return | | $ | 1,000.00 | | | $ | 1,042.98 | | | $ | 2.29 | | | | 0.45 | |
| Class I-hypothetical 5% return | | $ | 1,000.00 | | | $ | 1,047.76 | | | $ | 2.29 | | | | 0.45 | |
| Class R6-actual return | | $ | 1,000.00 | | | $ | 1,043.24 | | | $ | 2.03 | | | | 0.40 | |
| Class R6-hypothetical 5% return | | $ | 1,000.00 | | | $ | 1,048.01 | | | $ | 2.04 | | | | 0.40 | |
| 182 | Semiannual Report | June 30, 2020 |
Fund Expenses (Unaudited)
| Expense Example | | Beginning
Account Value
1/1/2020 | | Ending
Account Value
6/30/2020 | | Expenses Paid
During
the Period (a) | | Annualized
Expense Ratio |
| Income Fund | | | | | | | | | | | | | | | | |
| Class N-actual return | | $ | 1,000.00 | | | $ | 1,031.41 | | | $ | 4.29 | | | | 0.85 | % |
| Class N-hypothetical 5% return | | $ | 1,000.00 | | | $ | 1,045.77 | | | $ | 4.32 | | | | 0.85 | |
| Class I-actual return | | $ | 1,000.00 | | | $ | 1,032.22 | | | $ | 3.54 | | | | 0.70 | |
| Class I-hypothetical 5% return | | $ | 1,000.00 | | | $ | 1,046.52 | | | $ | 3.56 | | | | 0.70 | |
| Class R6-actual return | | $ | 1,000.00 | | | $ | 1,032.48 | | | $ | 3.28 | | | | 0.65 | |
| Class R6-hypothetical 5% return | | $ | 1,000.00 | | | $ | 1,046.77 | | | $ | 3.31 | | | | 0.65 | |
| Low Duration Fund | | | | | | | | | | | | | | | | |
| Class N-actual return | | $ | 1,000.00 | | | $ | 1,018.58 | | | $ | 2.76 | | | | 0.55 | |
| Class N-hypothetical 5% return | | $ | 1,000.00 | | | $ | 1,047.27 | | | $ | 2.80 | | | | 0.55 | |
| Class I-actual return | | $ | 1,000.00 | | | $ | 1,019.36 | | | $ | 2.01 | | | | 0.40 | |
| Class I-hypothetical 5% return | | $ | 1,000.00 | | | $ | 1,048.01 | | | $ | 2.04 | | | | 0.40 | |
| Class R6-actual return | | $ | 1,000.00 | | | $ | 1,018.44 | | | $ | 1.76 | | | | 0.35 | |
| Class R6-hypothetical 5% return | | $ | 1,000.00 | | | $ | 1,048.26 | | | $ | 1.78 | | | | 0.35 | |
| Macro Allocation Fund | | | | | | | | | | | | | | | | |
| Class N-actual return | | $ | 1,000.00 | | | $ | 929.20 | | | $ | 6.04 | | | | 1.26 | |
| Class N-hypothetical 5% return | | $ | 1,000.00 | | | $ | 1,043.73 | | | $ | 6.40 | | | | 1.26 | |
| Class I-actual return | | $ | 1,000.00 | | | $ | 930.40 | | | $ | 4.85 | | | | 1.01 | |
| Class I-hypothetical 5% return | | $ | 1,000.00 | | | $ | 1,044.98 | | | $ | 5.14 | | | | 1.01 | |
| Class R6-actual return | | $ | 1,000.00 | | | $ | 931.34 | | | $ | 4.42 | | | | 0.92 | |
| Class R6-hypothetical 5% return | | $ | 1,000.00 | | | $ | 1,045.43 | | | $ | 4.68 | | | | 0.92 | |
| (a) | Expenses are equal to the annualized expense ratio, multiplied by the average account value over the period, multiplied by the number of days in the period, 182 and divided by 366 (to reflect the one-half year period). |
| June 30, 2020 | William Blair Funds | 183 |
| | BOARD OF TRUSTEES |
| | |
| | Vann A. Avedisian Principal, Highgate Holdings Kathleen T. Barr Retired Senior Managing Director, PNC Capital Advisors, LLC Stephanie G. Braming, Chairman and President Partner, William Blair Daniel N. Leib Chief Executive Officer, Donnelley Financial Solutions, Inc. Dorri C. McWhorter Chief Executive Officer, YWCA Metropolitan Chicago Arthur J. Simon Partner, William Blair Thomas J. Skelly Retired Managing Partner, Accenture Steven R. Zenz Retired Partner, KPMG LLP |
| | Officers |
| | Marcelo Assalin, Senior Vice President Michael P. Balkin, Senior Vice President Thomas Clarke, Senior Vice President Daniel Crowe, Senior Vice President Robert J. Duwa, Senior Vice President Simon Fennell, Senior Vice President Andrew G. Flynn, Senior Vice President David C. Fording, Senior Vice President James S. Golan, Senior Vice President James E. Jones, Senior Vice President Chad M. Kilmer, Senior Vice President Robert C. Lanphier, IV, Senior Vice President Mark T. Leslie, Senior Vice President Kenneth J. McAtamney, Senior Vice President Todd M. McClone, Senior Vice President David S. Mitchell, Senior Vice President John C. Murphy, Senior Vice President Casey K. Preyss, Senior Vice President David P. Ricci, Senior Vice President Lisa D. Rusch, Senior Vice President Ward D. Sexton, Senior Vice President Brian D. Singer, Senior Vice President Dan Zelazny, Senior Vice President Ruta Ziverte, Senior Vice President Kathleen M. Lynch, Vice President Marco Ruijer, Vice President Paul J. Sularz, Vice President John M. Raczek, Treasurer Andrew T. Pfau, Secretary David M. Cihak, Assistant Treasurer Walter R. Randall, Jr., Chief Compliance Officer and Assistant Secretary Robert J. Toner, Assistant Secretary Investment Adviser William Blair Investment Management, LLC Distributor William Blair & Company, L.L.C. Independent Registered Public Accounting Firm Ernst & Young LLP Transfer Agent DST Asset Manager Solutions, Inc. (formerly known as Boston Financial Data Services, Inc.) For customer assistance, call 1-800-635-2886 P.O. Box 219137 Kansas City, Missouri 64121-9137 |
| 184 | Semiannual Report | June 30, 2020 |
| | | | | | |
| | William Blair Funds | | |
| | | | | | |
| | | | | | |
| | U.S. EQUITY | | GLOBAL EQUITY | | FIXED INCOME |
| | Growth Fund | | Global Leaders Fund | | Bond Fund |
| | Large Cap Growth Fund | | | | Income Fund |
| | Mid Cap Growth Fund | | INTERNATIONAL EQUITY | | Low Duration Fund |
| | Small-Mid Cap Core Fund | | International Leaders Fund | | |
| | Small-Mid Cap Growth Fund | | International Growth Fund | | MULTI-ASSET AND |
| | Small-Mid Cap Value Fund | | Institutional International Growth Fund | | ALTERNATIVE |
| | Small Cap Growth Fund | | International Small Cap Growth Fund | | Macro Allocation Fund |
| | Small Cap Value Fund | | Emerging Markets Leaders Fund | | |
| | | | Emerging Markets Growth Fund | | |
| | | | Emerging Markets Small Cap Growth Fund | | |
 | | © | William Blair & Company, L.L.C., distributor | |
| +1 800 742 7272 | | 150 North Riverside Plaza | |
| williamblairfunds.com | | Chicago, Illinois 60606 | 00103188 |
Not applicable to this filing.
| Item 3. | Audit Committee Financial Expert |
Not applicable to this filing.
| Item 4. | Principal Accountant Fees and Services |
Not applicable to this filing.
| Item 5. | Audit Committee of Listed Registrants |
Not Applicable to this Registrant, insofar as the Registrant is not a listed company.
| Item 6. | Schedule of Investments |
See Schedule of Investments in Item 1.
| Item 7. | Disclosure of Proxy Voting Policies and Procedures for Closed-End Management Investment Companies |
Not applicable to this Registrant, insofar as the Registrant is not a closed-end management investment company.
| Item 8. | Portfolio Managers of Closed-End Management Investment Companies |
Not applicable to this Registrant, insofar as the Registrant is not a closed-end management investment company.
| Item 9. | Purchase of Equity Securities by Closed-End Management Investment Companies and Affiliated Purchasers |
Not applicable to this Registrant, insofar as the Registrant is not a closed-end management investment company.
| Item 10. | Submission of Matters to a Vote of Security Holders |
There have been no material changes to the procedures by which shareholders may recommend nominees to the Registrant’s Board of Trustees since the Registrant last provided disclosure in response to this item.
Controls and Procedures
(a) The Registrant’s principal executive and principal financial officers, or persons performing similar functions, have concluded that the Registrant’s Disclosure Controls and Procedures (as defined in Rule 30a-3(c) under the Investment Company Act of 1940, as amended (the “1940 Act”) (17 CFR 270.30a-3(c)) are effective, as of a date within 90 days of the filing date of this report that includes the disclosure required by this paragraph, based on their evaluation of these controls and procedures required by Rule 30a-3 (b) under the 1940 Act (17 CFR 270.30a-3(b) and Rules 13a-15(b) or 15d-15(b) under the Securities Exchange Act of 1934, as amended to date (17 CFR 240.13a-15(b) or 240.15d-15(b)).
(b) There were no changes in the Registrant’s internal control over financial reporting (as defined in Rule 30a-3(d) under the 1940 Act (17 CFR 270.30a-3(d)) that occurred during the period covered by this report that has materially affected, or is reasonably likely to materially affect, the Registrant’s internal control over financial reporting.
| Item 12. | Disclosure of Securities Lending Activities for Closed-End Management Investment Companies |
Not applicable to this Registrant, insofar as the Registrant is not a closed-end management investment company.
13. (a) (1) Code of Ethics
Not applicable to this filing.
13. (a) (2) (1)
Certification of Principal Executive Officer Required by Rule 30a-2(a) of the Investment Company Act of 1940 is filed as an exhibit hereto.
13. (a) (2) (2)
Certification of Principal Financial Officer Required by Rule 30a-2(a) of the Investment Company Act of 1940 is filed as an exhibit hereto.
13. (a) (3)
Not applicable to this Registrant.
13. (a) (4)
Not applicable to this filing.
13. (b)
Certifications of the Principal Executive Officer and Principal Financial Officer of the issuer as required by Rule 30a-2(b) of the Investment Company Act of 1940 are filed as exhibits hereto.
SIGNATURES
Pursuant to the requirements of the Securities Exchange Act of 1934 and the Investment Company Act of 1940, the Registrant has duly caused this report to be signed on its behalf by the undersigned, thereunto duly authorized.
| | | William Blair Funds |
| | |
| | | /s/ Stephanie G. Braming |
| By: | | Stephanie G. Braming |
| | | President (Principal Executive Officer) |
Date: August 26, 2020
Pursuant to the requirements of the Securities Exchange Act of 1934 and the Investment Company Act of 1940, this report has been signed below by the following persons on behalf of the Registrant and in the capacities and on the dates indicated.
| | | /s/ Stephanie G. Braming |
| By: | | Stephanie G. Braming |
| | | President (Principal Executive Officer) |
Date: August 26, 2020
| | | /s/ John M. Raczek |
| By: | | John M. Raczek |
| | | Treasurer (Principal Financial Officer) |
Date: August 26, 2020