UNITED STATES
SECURITIES AND EXCHANGE COMMISSION
Washington, D.C. 20549
Form N-CSR
CERTIFIED SHAREHOLDER REPORT OF REGISTERED
MANAGEMENT INVESTMENT COMPANIES
Investment Company Act File Number 811-5344
William Blair Funds
(Exact name of registrant as specified in charter)
| 150 North Riverside Plaza, Chicago, IL | | 60606 |
| (Address of principal executive offices) | | (Zip Code) |
Stephanie G. Braming, Principal Executive Officer
William Blair Funds
150 North Riverside Plaza, Chicago, IL 60606
(Name and address of agent for service)
Registrant’s telephone number, including area code: 312-236-1600
Date of fiscal year end: December 31
Date of reporting period: June 30, 2023
Item 1. June 30, 2023 Semiannual Reports transmitted to shareholders.
 | |
| | |
| | |
| | |
| | |
| | |
| | |
| | |
| | June 30, 2023 |
William Blair Funds
Semiannual Report | |
| | | | |
| | | | |
| | | | |
| | | | |
| | | | |
| | | | |
| | | | |
| | | | |
| | | | |
| | | | |
| | | | |
| | | | |
| June 30, 2023 | William Blair Funds | 1 |
The views expressed in the commentary for each Fund reflect those of the portfolio management team only through the end of the period of the report as stated on the cover. The portfolio management team’s views are subject to change at any time based on market and other conditions and should not be construed as a recommendation. Statements involving predictions, assessments, analyses, or outlook for individual securities, industries, market sectors, and/or markets involve risks and uncertainties, and there is no guarantee they will come to pass.
This report is submitted for the general information of the shareholders of William Blair Funds. It is not authorized for distribution to prospective Fund investors unless accompanied or preceded by the Fund’s prospectus. Please carefully consider a Fund’s investment objectives, risks, charges, and expenses before investing. This and other information is contained in the Fund’s prospectus, which you may obtain by calling 1-800-742-7272. Read it carefully before you invest or send money.
| 2 | Semiannual Report | June 30, 2023 |
U.S. Growth & Core Market Review and Outlook
The U.S. equity market showed resilience throughout the first half of 2023, reflected in the positive performance across U.S. equity indices, albeit with a wide range of performance across style and size dimensions. Despite investors’ concerns regarding regional bank failures and higher interest rates, positive developments, such as robust jobs growth and moderating inflation, provided a strong counterbalance for the market.
During the first quarter, moderating inflation and strong employment data provided optimism for a soft landing. The Federal Open Market Committee (“FOMC”) increased the target Federal Funds Rate by 0.25% in both February and March. In March, the market experienced a decline due to the collapse of Silicon Valley Bank and concerns surrounding smaller banks’ viability. This led to a rally in U.S. Government bonds as investors questioned the stability of smaller banks and anticipated a potential pause in U.S. Federal Reserve (“Fed”) tightening. Despite these challenges, the job market remained resilient, with notable employment gains in leisure, hospitality, retail trade, and healthcare, somewhat offset by employment declines in information technology.
U.S. equities continued their advance in the second quarter as the likelihood of further bank failures appeared to diminish and the economy displayed modest growth. The revised Q1 Gross Domestic Product figures revealed a year-over-year expansion of 2.0%, surpassing the previous estimate of 1.3% growth. In May, the Consumer Price Index showed a year-over-year increase of 4.0%, underscoring ongoing inflationary pressures, albeit coming in lower than the multi-decade peak of 9.1% reported in June 2022. The FOMC raised interest rates by 0.25% in May, bringing the Federal Funds Rate to a target range of 5.00%-5.25%, the highest level since August 2007.
As we enter the second half of the year, there is potential for the Fed’s rate-hiking cycle to exert a slowing effect on economic growth in our view. While the pace of inflation has moderated, it remains above the Fed’s target level, indicating the possibility of additional interest rate increases. Although the full impact of rate increases over the past 18 months has yet to be felt, we believe that there are already noticeable effects as lending conditions tighten for businesses, consumers, and real estate developers. Despite these potential headwinds, we believe the current backdrop of a slowly expanding economy, robust consumer spending on areas such as travel and leisure, and new job growth offers support for equity investors.
Looking ahead, companies with strong balance sheets, durable business models, sustainable cash flow, and the ability to self-fund growth are likely to be uniquely positioned as the economic landscape unfolds. We believe our philosophy of identifying durable businesses whose stocks present attractive risk/reward opportunities should serve us well in a variety of economic environments, as it has historically.
| June 30, 2023 | William Blair Funds | 3 |
U.S. Value Market Review and Outlook
In many ways, the second quarter of 2023 was an extension of the first quarter. The market’s strong performance was concentrated in the largest technology companies as equity markets have demonstrated a clear preference for large growth companies. This was further fueled by the excitement over artificial intelligence. Large capitalized stocks, as defined by the S&P 500 Index, gained 16.9% during the six months ended June 30, 2023. In June, a pause by the U.S. Federal Reserve (“Fed”) and a federal debt ceiling deal in sight, caused market breadth to improve. Economic data also showed continued improvement and suggested the actions of the Fed are slowing inflation. The much-watched Consumer Price Index declined every month and was down to a more palatable 4.0% in May from 6.4% in the beginning of the year.
The near-term direction of equity markets will be largely influenced by two debates in our view. First, has the Fed been able to tame inflation without causing wide-spread economic damage, or has the “bill” just not arrived yet? While the Fed has increased rates nearly 500 basis points since March 2022, the real yield has only recently become positive. Similarly, the yield curve remains firmly inverted which has not only historically been a leading indicator of a recession, but also created a viable option to equity investments in the form of short-term interest rates. The second question is: can inflation trend lower with solid employment intact? If the Fed believes inflation is decreasing, then the Fed may be done raising rates. However, if the Fed believes there is an unemployment level that is required to achieve its inflation target, then, in our view, there may be additional rate increases in the future. While the job market, consumer spending and gross domestic product have been resilient in the face of aggressive Fed tightening, we believe that there are signs that the economy is slowing.
Regardless, we believe that if the economy should contract, the depth will be less than many fear. More specifically, our view is that there could be series of smaller or rolling contractions. Indeed, it appears that some industries, such as trucking, aerospace, and auto manufacturing are either currently in a recession, or may have already exited one. Recent employment data supports this argument as it shows that while some industries, such as technology, are experiencing layoffs, others, such as hospitality, are hiring.
The second quarter offered some encouraging signs that the equity markets are increasingly agreeing with our position that some sectors are oversold and offer compelling opportunities. Although cautious in our outlook, given the pace of rates hikes, much of this pessimism is already reflected in the valuation of our portfolios.
| 4 | Semiannual Report | June 30, 2023 |
| | Growth Fund |
| | |
| | The Growth Fund seeks long-term capital appreciation. |
| | |
| | AN OVERVIEW FROM THE PORTFOLIO MANAGER |
| | |

David C. Fording, CFA | The William Blair Growth Fund (Class N shares) (the “Fund”) posted a 25.79% increase, net of fees, for the six months ended June 30, 2023. By comparison, the Fund’s benchmark index, the Russell 3000® Growth Index (the “Index”), increased 28.05%. The Fund lagged the Index in the period, driven by a combination of stock-specific dynamics and a style headwind. The largest source of underperformance as compared to the Index came from not owning Apple (Information Technology) and Tesla (Consumer Discretionary). In the case of Apple, shareholders benefited from share buybacks and valuation multiple expansion despite year-over-year declines in earnings, resulting in a risk/reward profile we view to be less attractive than other Information Technology holdings. As it relates to Tesla, while decelerating sales and price cuts have negatively impacted earnings expectations, the stock appreciated in the period primarily on speculation that Tesla is well positioned to be a beneficiary of Generative Artificial Intelligence. Within the Fund, our top detractors in the period were Warner Music Group (Communication Services) and SBA Communications (Real Estate). Music label Warner Music Group reported mixed earnings results, with ad-supported revenue and subscription growth falling short of expectations. Shares of SBA Communications, one of the largest independent operators of wireless towers, lagged as carrier spending generally slowed in the near term. Other laggards included New Fortress (Energy), UnitedHealth (Health Care) and Nike (Consumer Discretionary). From a style perspective, our typical bias toward small and mid-capitalization stocks was a headwind as mega-capitalization stocks outperformed in the period. In terms of positives, top individual contributors included Palo Alto Networks (Information Technology), Advanced Micro Devices (Information Technology) and MongoDB (Information Technology). Palo Alto Networks, a leading network security company, benefited from strong demand in a challenging security spend environment. Strong stock selection in small capitalization stocks, including our positions in National Instruments (Information Technology) and ACV Auctions (Industrials), contributed positively to relative returns. Shares of National Instruments, a designer and manufacturer of test and measurement tools, advanced as the company announced it agreed to be acquired by Emerson Electric for a premium to the prior closing price. Strong stock selection in Industrials, including our position in Copart, also contributed positively to relative returns. Please refer to the U.S. Growth & Core Market Review and Outlook relating to the Fund on page 3. |
| June 30, 2023 | William Blair Funds | 5 |
Growth Fund
Performance Highlights (Unaudited)
| Average Annual Total Returns through 6/30/2023 |
| | | Year
to Date | | 1 Year | | 3 Year | | 5 Year | | 10 Year | | Since
Inception(a) |
| Class N | | | 25.79 | % | | | 23.83 | % | | | 10.89 | % | | | 12.56 | % | | | 13.05 | % | | | — | % |
| Class I | | | 26.11 | | | | 24.20 | | | | 11.23 | | | | 12.90 | | | | 13.39 | | | | — | |
| Class R6 | | | 26.10 | | | | 24.21 | | | | 11.29 | | | | — | | | | — | | | | 12.75 | |
| Russell 3000® Growth Index | | | 28.05 | | | | 26.60 | | | | 13.24 | | | | 14.39 | | | | 15.26 | | | | 14.92 | |
| S&P 500® Index | | | 16.89 | | | | 19.59 | | | | 14.60 | | | | 12.31 | | | | 12.86 | | | | 12.51 | |
| (a) | Since inception is for the period from May 2, 2019 (Commencement of Operations) to June 30, 2023. |
Performance cited represents past performance. Past performance does not guarantee future results and current performance may be lower or higher than the data quoted. Results shown are average annual total returns, which assume reinvestment of dividends and capital gains. Investment returns and principal will fluctuate and you may have a gain or loss when you sell shares. For the most current month-end performance information, please call 1-800-742-7272, or visit our Web site at www.williamblairfunds.com. From time to time, the investment adviser may waive fees or reimburse expenses for the Fund. Without these waivers/reimbursements, performance would be lower. Class N shares are not subject to a sales load. Class I shares are not subject to a sales load or distribution (Rule 12b-1) fees. Class R6 shares are not subject to a sales load, distribution (Rule 12b-1) fees, or sub-transfer agent fees.
The performance highlights and graph presented above do not reflect the deduction of taxes that a shareholder would pay on fund distributions or the redemption of fund shares.
The Russell 3000® Growth Index consists of large, medium, and small capitalization companies with above average price-to-book ratios and forecasted growth rates. The index is weighted by market capitalization and large/medium/small companies make up approximately 80%/15%/5% of the index.
The S&P 500® Index indicates broad larger capitalization equity market performance.
This report identifies the Fund’s investments on June 30, 2023. These holdings are subject to change. Not all stocks in the Fund performed the same, nor is there any guarantee that these stocks will perform as well in the future. Market forecasts provided in this report may not necessarily come to pass.
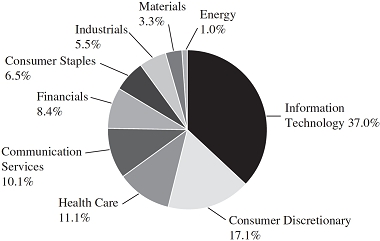
Sector Diversification (Unaudited)

The sector diversification shown is based on the total long-term securities.
| 6 | Semiannual Report | June 30, 2023 |
Growth Fund
Portfolio of Investments, June 30, 2023 (all dollar amounts in thousands) (unaudited)
| | | | | | | | |
| | | | | | | | |
| | Issuer | | Shares | | | Value | |
| | | | | | | | | | |
| | Common Stocks | | | | | | | | |
| | Information Technology—33.8% | | | | | | | | |
| * | Advanced Micro Devices, Inc. | | | 52,052 | | | $ | 5,929 | |
| * | Dynatrace, Inc. | | | 57,845 | | | | 2,977 | |
| | Microsoft Corp. | | | 75,095 | | | | 25,573 | |
| * | MongoDB, Inc. | | | 5,231 | | | | 2,150 | |
| | National Instruments Corp. | | | 38,019 | | | | 2,182 | |
| * | Nice Ltd.—ADR | | | 12,941 | | | | 2,672 | |
| | NVIDIA Corp. | | | 23,720 | | | | 10,034 | |
| * | Palo Alto Networks, Inc. | | | 27,698 | | | | 7,077 | |
| | Power Integrations, Inc. | | | 18,619 | | | | 1,763 | |
| * | Pure Storage, Inc. | | | 70,786 | | | | 2,606 | |
| * | ServiceNow, Inc. | | | 6,715 | | | | 3,774 | |
| | Texas Instruments, Inc. | | | 25,680 | | | | 4,623 | |
| * | Tyler Technologies, Inc. | | | 7,338 | | | | 3,056 | |
| * | Workday, Inc. | | | 10,981 | | | | 2,481 | |
| * | Workiva, Inc. | | | 13,690 | | | | 1,392 | |
| | | | | | | | | 78,289 | |
| | Health Care—14.4% | | | | | | | | |
| | Abbott Laboratories | | | 43,694 | | | | 4,763 | |
| * | HealthEquity, Inc. | | | 23,547 | | | | 1,487 | |
| * | Intuitive Surgical, Inc. | | | 18,331 | | | | 6,268 | |
| * | Repligen Corp. | | | 10,664 | | | | 1,509 | |
| | UnitedHealth Group, Inc. | | | 19,051 | | | | 9,157 | |
| * | Veeva Systems, Inc. | | | 26,582 | | | | 5,256 | |
| | Zoetis, Inc. | | | 28,432 | | | | 4,896 | |
| | | | | | | | | 33,336 | |
| | Consumer Discretionary—11.4% | | | | | | | | |
| * | Amazon.com, Inc. | | | 108,958 | | | | 14,204 | |
| * | Bright Horizons Family Solutions, Inc. | | | 27,928 | | | | 2,582 | |
| * | Burlington Stores, Inc. | | | 8,964 | | | | 1,411 | |
| * | Etsy, Inc. | | | 10,174 | | | | 861 | |
| | NIKE, Inc. | | | 46,230 | | | | 5,102 | |
| * | Revolve Group, Inc. | | | 36,398 | | | | 597 | |
| * | Skyline Champion Corp. | | | 23,720 | | | | 1,552 | |
| | | | | | | | | 26,309 | |
| | Industrials—11.1% | | | | | | | | |
| * | ACV Auctions, Inc. | | | 129,611 | | | | 2,238 | |
| | Brink’s Co. | | | 45,164 | | | | 3,064 | |
| * | Chart Industries, Inc. | | | 14,526 | | | | 2,321 | |
| * | Copart, Inc. | | | 69,518 | | | | 6,341 | |
| * | CoStar Group, Inc. | | | 58,306 | | | | 5,189 | |
| * | Energy Recovery, Inc. | | | 84,793 | | | | 2,370 | |
| * | Kornit Digital Ltd.† | | | 44,702 | | | | 1,313 | |
| * | Verra Mobility Corp. | | | 150,968 | | | | 2,977 | |
| | | | | | | | | 25,813 | |
| | Communication Services—8.4% | | | | | | | | |
| * | Alphabet, Inc. | | | 132,374 | | | | 15,845 | |
| | Warner Music Group Corp. | | | 88,118 | | | | 2,299 | |
| * | ZipRecruiter, Inc. | | | 68,797 | | | | 1,222 | |
| | | | | | | | | 19,366 | |
| | Issuer | | Shares or
Principal
Amount | | | Value | |
| | | | | | | | | | |
| | Common Stocks—(continued) | | | | | | | | |
| | Financials—7.9% | | | | | | | | |
| | Aon PLC† | | | 8,272 | | | $ | 2,855 | |
| | Apollo Global Management, Inc. | | | 35,941 | | | | 2,761 | |
| | Ares Management Corp. | | | 18,331 | | | | 1,766 | |
| | Mastercard, Inc. | | | 27,755 | | | | 10,916 | |
| | | | | | | | | 18,298 | |
| | Consumer Staples—5.0% | | | | | | | | |
| | Coca-Cola Co. | | | 92,662 | | | | 5,580 | |
| | Estee Lauder Cos., Inc. | | | 10,001 | | | | 1,964 | |
| * | Performance Food Group Co. | | | 46,548 | | | | 2,804 | |
| * | Vital Farms, Inc. | | | 104,478 | | | | 1,253 | |
| | | | | | | | | 11,601 | |
| | Energy—4.2% | | | | | | | | |
| | Cameco Corp. | | | 150,564 | | | | 4,717 | |
| * | Green Plains, Inc. | | | 47,902 | | | | 1,544 | |
| | New Fortress Energy, Inc. | | | 67,644 | | | | 1,812 | |
| | Whitecap Resources, Inc. | | | 228,037 | | | | 1,594 | |
| | | | | | | | | 9,667 | |
| | Real Estate—1.5% | | | | | | | | |
| | SBA Communications Corp. | | | 15,650 | | | | 3,627 | |
| | Materials—1.0% | | | | | | | | |
| | Crown Holdings, Inc. | | | 26,030 | | | | 2,261 | |
| | Total Common Stocks—98.7%
(cost $124,388) | | | | | | | 228,567 | |
| | | | | | | | | | |
| | Repurchase Agreement | | | | | | | | |
| | Fixed Income Clearing Corporation, 2.100% dated 06/30/23, due 07/03/23, repurchase price $2,950, collateralized by U.S. Treasury Note, 1.250%, due 08/15/31, valued at $3,009 | | | $2,950 | | | | 2,950 | |
| | Total Repurchase Agreement—1.3%
(cost $2,950) | | | | | | | 2,950 | |
| | Total Investments—100.0%
(cost $127,338) | | | | | | | 231,517 | |
| | Liabilities, plus cash and other assets—(0.0)% | | | | | | | (103 | ) |
| | Net assets—100.0% | | | | | | $ | 231,414 | |
ADR = American Depository Receipt
* = Non-income producing security
† = U.S. listed foreign security
See accompanying Notes to Financial Statements.
| June 30, 2023 | William Blair Funds | 7 |
| | Large Cap Growth Fund |
| | |
| | The Large Cap Growth Fund seeks long-term capital appreciation. |
| | |
| | AN OVERVIEW FROM THE PORTFOLIO MANAGERS |
| | |

James S. Golan, CFA 
David P. Ricci, CFA | The William Blair Large Cap Growth Fund (Class N shares) (the “Fund”) posted a 24.97% increase, net of fees, for the six months ended June 30, 2023. By comparison, the Fund’s benchmark index, the Russell 1000® Growth Index (the “Index”), increased 29.02%. The Fund lagged the Index during the period. Relative performance was primarily driven by stock-specific dynamics, which was amplified as performance of the Index was dominated by a small number of growth companies with large weights, particularly those perceived to be beneficiaries of Generative Artificial Intelligence (“AI”) whose stocks have appreciated primarily on valuation multiple expansion. The largest source of underperformance as compared to the Index came from our underweight position in NVIDIA, as well as not owning Apple (Information Technology) and Tesla (Consumer Discretionary). Shares of fabless semiconductor company NVIDIA advanced as AI applications were used more broadly and demand is expected to continue to accelerate. While we established a position in NVIDIA stock during the second quarter, our current underweight as we build our position was a detractor from relative performance. In the case of Apple, shareholders have benefited from share buybacks and valuation multiple expansion despite year-over-year declines in earnings, resulting in a risk/reward profile we view to be less attractive than other Information Technology holdings. As it relates to Tesla, while decelerating sales and price cuts have negatively impacted earnings expectations, the stock appreciated in the year-to-date period primarily on speculation that Tesla is well positioned to be a beneficiary of Generative AI. Other top detractors for the period included UnitedHealth (Health Care), Estee Lauder (Consumer Staples), Mastercard (Financials) and PayPal (Financials). UnitedHealth Group provides healthcare coverage, software and data consultancy services. Shares were pressured due to valuation multiple compression early in the new year, as well as indications that an increase in elective surgeries could push expenses higher than previously expected. In terms of positives, our top individual contributors included Palo Alto Networks (Information Technology), Copart (Industrials), Salesforce (Information Technology), Advanced Micro Devices (Information Technology) and Chipotle (Consumer Discretionary). Palo Alto Networks, a leading network security company, benefited from strong demand in a challenging security spend environment. Copart, the leading online auction platform for salvage vehicles, reported strong revenues and volume growth. Please refer to the U.S. Growth & Core Market Review and Outlook relating to the Fund on page 3. |
| 8 | Semiannual Report | June 30, 2023 |
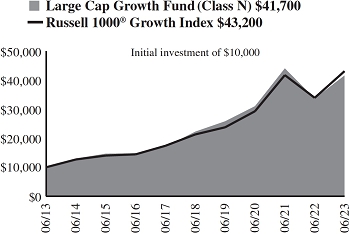
Large Cap Growth Fund
Performance Highlights (Unaudited)
| Average Annual Total Returns through 6/30/2023 |
| | | Year
to Date | | 1 Year | | 3 Year | | 5 Year | | 10 Year | | Since
Inception(a) |
| Class N | | | 24.97 | % | | | 23.49 | % | | | 10.26 | % | | | 13.32 | % | | | 15.34 | % | | | — | % |
| Class I | | | 25.20 | | | | 23.89 | | | | 10.55 | | | | 13.61 | | | | 15.63 | | | | — | |
| Class R6 | | | 25.16 | | | | 23.91 | | | | 10.58 | | | | — | | | | — | | | | 13.51 | |
| Russell 1000® Growth Index | | | 29.02 | | | | 27.11 | | | | 13.73 | | | | 15.14 | | | | 15.74 | | | | 15.58 | |
| (a) | Since inception is for the period from May 2, 2019 (Commencement of Operations) to June 30, 2023. |
Performance cited represents past performance. Past performance does not guarantee future results and current performance may be lower or higher than the data quoted. Results shown are average annual total returns, which assume reinvestment of dividends and capital gains. Investment returns and principal will fluctuate and you may have a gain or loss when you sell shares. For the most current month-end performance information, please call 1-800-742-7272, or visit our Web site at www.williamblairfunds.com. From time to time, the investment adviser may waive fees or reimburse expenses for the Fund. Without these waivers/reimbursements, performance would be lower. Class N shares are not subject to a sales load. Class I shares are not subject to a sales load or distribution (Rule 12b-1) fees. Class R6 shares are not subject to a sales load, distribution (Rule 12b-1) fees, or sub-transfer agent fees.
The performance highlights and graph presented above do not reflect the deduction of taxes that a shareholder would pay on fund distributions or the redemption of fund shares.
The Russell 1000® Growth Index consists of large capitalization companies with above average price-to-book ratios and forecasted growth rates.
This report identifies the Fund’s investments on June 30, 2023. These holdings are subject to change. Not all stocks in the Fund performed the same, nor is there any guarantee that these stocks will perform as well in the future. Market forecasts provided in this report may not necessarily come to pass.
Sector Diversification (Unaudited)
The sector diversification shown is based on the total long-term securities.
| June 30, 2023 | William Blair Funds | 9 |
Large Cap Growth Fund
Portfolio of Investments, June 30, 2023 (all dollar amounts in thousands) (unaudited)
| | | | | | | | |
| | | | | | | | |
| | Issuer | | Shares | | | Value | |
| | | | | | | | |
| | Common Stocks | | | | | | | | |
| | Information Technology—36.8% | | | | | | | | |
| | Accenture PLC† | | | 177,300 | | | $ | 54,711 | |
| * | Advanced Micro Devices, Inc. | | | 359,538 | | | | 40,955 | |
| | Intuit, Inc. | | | 86,900 | | | | 39,817 | |
| | Lam Research Corp. | | | 49,840 | | | | 32,040 | |
| | Microsoft Corp. | | | 656,360 | | | | 223,517 | |
| | NVIDIA Corp. | | | 113,000 | | | | 47,801 | |
| * | Palo Alto Networks, Inc. | | | 165,570 | | | | 42,305 | |
| * | Salesforce, Inc. | | | 183,120 | | | | 38,686 | |
| * | ServiceNow, Inc. | | | 49,220 | | | | 27,660 | |
| | Texas Instruments, Inc. | | | 102,370 | | | | 18,429 | |
| | | | | | | | | 565,921 | |
| | Consumer Discretionary—17.0% | | | | | | | | |
| * | Amazon.com, Inc. | | | 909,870 | | | | 118,611 | |
| * | Chipotle Mexican Grill, Inc. | | | 18,290 | | | | 39,122 | |
| | Marriott International, Inc. | | | 89,860 | | | | 16,506 | |
| | NIKE, Inc. | | | 293,880 | | | | 32,436 | |
| * | O’Reilly Automotive, Inc. | | | 32,310 | | | | 30,866 | |
| | Starbucks Corp. | | | 243,480 | | | | 24,119 | |
| | | | | | | | | 261,660 | |
| | Health Care—11.1% | | | | | | | | |
| * | Intuitive Surgical, Inc. | | | 85,890 | | | | 29,369 | |
| | UnitedHealth Group, Inc. | | | 143,830 | | | | 69,130 | |
| * | Veeva Systems, Inc. | | | 159,200 | | | | 31,479 | |
| | Zoetis, Inc. | | | 233,940 | | | | 40,287 | |
| | | | | | | | | 170,265 | |
| | Communication Services—10.1% | | | | | | | | |
| * | Alphabet, Inc. | | | 1,078,930 | | | | 129,148 | |
| * | Live Nation Entertainment, Inc. | | | 286,882 | | | | 26,138 | |
| | | | | | | | | 155,286 | |
| | Financials—8.4% | | | | | | | | |
| | Apollo Global Management, Inc. | | | 370,951 | | | | 28,493 | |
| | Carlyle Group, Inc. | | | 543,590 | | | | 17,368 | |
| | Mastercard, Inc. | | | 211,750 | | | | 83,281 | |
| | | | | | | | | 129,142 | |
| | Consumer Staples—6.5% | | | | | | | | |
| | Costco Wholesale Corp. | | | 84,660 | | | | 45,579 | |
| | Estee Lauder Cos., Inc. | | | 133,710 | | | | 26,258 | |
| * | Monster Beverage Corp. | | | 479,750 | | | | 27,557 | |
| | | | | | | | | 99,394 | |
| | Industrials—5.4% | | | | | | | | |
| * | Copart, Inc. | | | 467,610 | | | | 42,651 | |
| * | CoStar Group, Inc. | | | 460,680 | | | | 41,000 | |
| | | | | | | | | 83,651 | |
| | Materials—3.3% | | | | | | | | |
| | Linde PLC† | | | 101,180 | | | | 38,558 | |
| | Martin Marietta Materials, Inc. | | | 25,180 | | | | 11,625 | |
| | | | | | | | | 50,183 | |
| | Energy—1.0% | | | | | | | | |
| | Pioneer Natural Resources Co. | | | 73,870 | | | | 15,304 | |
| | Total Common Stocks—99.6%
(cost $1,212,914) | | | | | | | 1,530,806 | |
| | | | | | | | | | |
| | Issuer | | Principal
Amount | | | Value | |
| | | | | | | | | | |
| | Repurchase Agreement | | | | | | | | |
| | Fixed Income Clearing Corporation, 2.100% dated 06/30/23, due 07/03/23, repurchase price $8,692, collateralized by U.S. Treasury Note, 1.375%, due 11/15/31, valued at $8,864 | | | $8,690 | | | $ | 8,690 | |
| | Total Repurchase Agreement—0.5%
(cost $8,690) | | | | | | | 8,690 | |
| | Total Investments—100.1%
(cost $1,221,604) | | | | | | | 1,539,496 | |
| | Liabilities, plus cash and other assets—(0.1)% | | | | | | | (2,016 | ) |
| | Net assets—100.0% | | | | | | $ | 1,537,480 | |
† = U.S. listed foreign security
* = Non-income producing security
See accompanying Notes to Financial Statements.
| 10 | Semiannual Report | June 30, 2023 |
| | Mid Cap Value Fund |
| | |
| | The Mid Cap Value Fund seeks long-term capital appreciation. |
| | |
| | AN OVERVIEW FROM THE PORTFOLIO MANAGERS |
| | |

William Heaphy, CFA 
Matthew Fleming, CFA | The William Blair Mid Cap Value Fund (Class I shares) (the “Fund”) posted a 5.88% increase, net of fees, for the six months ended June 30, 2023. By comparison, the Fund’s benchmark index, the Russell Midcap® Value Index (the “Index”), increased 5.23%. The Fund’s relative outperformance during the period was driven by positive allocation from seven of the eleven economic sectors. At the sector level, the Fund’s Information Technology holdings were the largest contributor to relative performance during the six-month period. The Fund’s technology hardware and equipment companies Jabil Inc. and Flex Ltd. were top contributors during the period adding to relative performance. The Information Technology sector’s strength in hardware and equipment, plus excitement over artificial intelligence, overshadowed more modest gains in semiconductors and software. Also contributing to relative performance for the period was the strategy’s underweight position and relative outperformance by the Fund’s holdings in the Financials sector. Specifically, our underweight to diversified financials and the regional banking subsector contributed to relative outperformance during the period. The Fund benefitted from positive stock selection due to our lone insurance holding, Arch Capital Group, which posted a double digit return during the first half of the year. On the negative side, the Fund’s overweight position and relative underperformance by the Fund’s holdings in the Energy sector hurt relative performance. The Fund’s exploration and production holdings, specifically APA Corp, which suffered a substantial decline due to lowering commodity prices, detracted from relative performance. Although the Fund maintained an overweight position and had mostly positive performances within the Industrials sector, it was not enough to keep pace with Index constituents during the period. Positive performances from the Fund’s transportation holdings were overshadowed by the decline in electrical equipment manufacturer Acuity Brands over concerns of its exposure to the slowing non-residential construction markets. Please refer to the U.S. Value Market Review and Outlook relating to the Fund on page 4. |
| June 30, 2023 | William Blair Funds | 11 |
Mid Cap Value Fund
Performance Highlights (Unaudited)
| Average Annual Total Returns through 6/30/2023 |
| | | Year
to Date | | 1 Year | | Since
Inception(a) |
| Class I | | | 5.88 | % | | | 12.50 | % | | | (1.29 | )% |
| Class R6 | | | 5.76 | | | | 12.53 | | | | (1.27 | ) |
| Russell Midcap® Value Index | | | 5.23 | | | | 10.50 | | | | (0.91 | ) |
| (a) | Since inception is for the period from March 16, 2022 (Commencement of Operations) to June 30, 2023. |
Performance cited represents past performance. Past performance does not guarantee future results and current performance may be lower or higher than the data quoted. Results shown are average annual total returns, which assume reinvestment of dividends and capital gains. Investment returns and principal will fluctuate and you may have a gain or loss when you sell shares. For the most current month-end performance information, please call 1-800-742-7272, or visit our Web site at www.williamblairfunds.com. Investing in smaller and medium capitalization companies involves special risks, including higher volatility and lower liquidity. Smaller and medium capitalization stocks are also more sensitive to purchase/sale transactions and changes in the issuer’s financial condition. From time to time, the investment adviser may waive fees or reimburse expenses for the Fund. Without these waivers/reimbursements, performance would be lower. Class I shares are not subject to a sales load or distribution (Rule 12b-1) fees. Class R6 shares are not subject to a sales load, distribution (Rule 12b-1) fees, or sub-transfer agent fees.
The performance highlights and graph presented above do not reflect the deduction of taxes that a shareholder would pay on fund distributions or the redemption of fund shares.
The Russell Midcap® Value Index measures the performance of the mid-cap value segment of the U.S. equity universe. It includes those Russell Midcap companies with lower price-to-book ratios and lower forecasted growth values.
This report identifies the Fund’s investments on June 30, 2023. These holdings are subject to change. Not all stocks in the Fund performed the same, nor is there any guarantee that these stocks will perform as well in the future. Market forecasts provided in this report may not necessarily come to pass.
Sector Diversification (Unaudited)

The sector diversification shown is based on the total long-term securities.
| 12 | Semiannual Report | June 30, 2023 |
Mid Cap Value Fund
Portfolio of Investments, June 30, 2023 (all dollar amounts in thousands) (unaudited)
| | | | | | | | | | |
| | | | | | | | | | |
| | Issuer | | Shares | | | Value | |
| | | | | | | | | | |
| | Common Stocks | | | | | | | | |
| | Industrials—18.6% | | | | | | | | |
| | Acuity Brands, Inc. | | | 159 | | | $ | 26 | |
| | AGCO Corp. | | | 254 | | | | 33 | |
| * | Alaska Air Group, Inc. | | | 610 | | | | 32 | |
| | Flowserve Corp. | | | 798 | | | | 30 | |
| | ITT, Inc. | | | 354 | | | | 33 | |
| | Knight-Swift Transportation Holdings, Inc. | | | 612 | | | | 34 | |
| | MSC Industrial Direct Co., Inc. | | | 335 | | | | 32 | |
| | Snap-on, Inc. | | | 142 | | | | 41 | |
| | Timken Co. | | | 434 | | | | 40 | |
| | | | | | | | | 301 | |
| | Information Technology—14.2% | | | | | | | | |
| * | Check Point Software Technologies Ltd.† | | | 217 | | | | 27 | |
| | Cognizant Technology Solutions Corp. | | | 427 | | | | 28 | |
| * | DXC Technology Co. | | | 1,058 | | | | 28 | |
| * | F5, Inc. | | | 166 | | | | 25 | |
| * | Flex Ltd.† | | | 1,057 | | | | 29 | |
| | Hewlett Packard Enterprise Co. | | | 1,741 | | | | 29 | |
| | Jabil, Inc. | | | 314 | | | | 34 | |
| | Skyworks Solutions, Inc. | | | 267 | | | | 30 | |
| | | | | | | | | 230 | |
| | Financials—12.0% | | | | | | | | |
| * | Arch Capital Group Ltd.† | | | 451 | | | | 34 | |
| | East West Bancorp, Inc. | | | 418 | | | | 22 | |
| | Hartford Financial Services Group, Inc. | | | 385 | | | | 28 | |
| | Huntington Bancshares, Inc. | | | 1,891 | | | | 20 | |
| | Invesco Ltd.† | | | 1,679 | | | | 28 | |
| | KKR & Co., Inc. | | | 528 | | | | 30 | |
| | Willis Towers Watson PLC† | | | 140 | | | | 33 | |
| | | | | | | | | 195 | |
| | Health Care—11.4% | | | | | | | | |
| | AmerisourceBergen Corp. | | | 161 | | | | 31 | |
| * | Centene Corp. | | | 391 | | | | 26 | |
| | Encompass Health Corp. | | | 421 | | | | 29 | |
| * | Envista Holdings Corp. | | | 776 | | | | 26 | |
| * | Henry Schein, Inc. | | | 228 | | | | 18 | |
| * | Hologic, Inc. | | | 161 | | | | 13 | |
| | Laboratory Corp. of America Holdings | | | 85 | | | | 21 | |
| | Viatris, Inc. | | | 2,086 | | | | 21 | |
| | | | | | | | | 185 | |
| | Consumer Discretionary—11.4% | | | | | | | | |
| | Advance Auto Parts, Inc. | | | 211 | | | | 15 | |
| | Brunswick Corp. | | | 310 | | | | 27 | |
| | LKQ Corp. | | | 595 | | | | 34 | |
| | Ralph Lauren Corp. | | | 269 | | | | 33 | |
| | Toll Brothers, Inc. | | | 579 | | | | 46 | |
| | Whirlpool Corp. | | | 193 | | | | 29 | |
| | | | | | | | | 184 | |
| | | | | | | | | | |
| | | | | | | | | | |
| | Issuer | | Shares | | | Value | |
| | | | | | | | | | |
| | Common Stocks—(continued) | | | | | | | | |
| | Materials—7.2% | | | | | | | | |
| | Crown Holdings, Inc. | | | 347 | | | $ | 30 | |
| | Huntsman Corp. | | | 1,020 | | | | 28 | |
| | PPG Industries, Inc. | | | 211 | | | | 31 | |
| | Westlake Corp. | | | 226 | | | | 27 | |
| | | | | | | | | 116 | |
| | Energy—6.1% | | | | | | | | |
| | APA Corp. | | | 741 | | | | 25 | |
| | Coterra Energy, Inc. | | | 812 | | | | 21 | |
| | Diamondback Energy, Inc. | | | 194 | | | | 25 | |
| | Phillips 66 | | | 279 | | | | 27 | |
| | | | | | | | | 98 | |
| | Consumer Staples—5.1% | | | | | | | | |
| | Ingredion, Inc. | | | 311 | | | | 33 | |
| | Molson Coors Beverage Co. | | | 401 | | | | 26 | |
| | Tyson Foods, Inc. | | | 471 | | | | 24 | |
| | | | | | | | | 83 | |
| | Real Estate—4.7% | | | | | | | | |
| | Camden Property Trust | | | 216 | | | | 24 | |
| | Highwoods Properties, Inc. | | | 968 | | | | 23 | |
| | Host Hotels & Resorts, Inc. | | | 1,731 | | | | 29 | |
| | | | | | | | | 76 | |
| | Utilities—3.3% | | | | | | | | |
| | Entergy Corp. | | | 283 | | | | 27 | |
| | PPL Corp. | | | 974 | | | | 26 | |
| | | | | | | | | 53 | |
| | Communication Services—1.1% | | | | | | | | |
| * | Warner Bros Discovery, Inc. | | | 1,391 | | | | 17 | |
| | Total Common Stocks—95.1%
(cost $1,533) | | | | | | | 1,538 | |
| | Total Investments—95.1%
(cost $1,533) | | | | | | | 1,538 | |
| | Cash and other assets, less liabilities—4.9% | | | | | | | 78 | |
| | Net assets—100.0% | | | | | | $ | 1,616 | |
* = Non-income producing security
† = U.S. listed foreign security
See accompanying Notes to Financial Statements.
| June 30, 2023 | William Blair Funds | 13 |
| | Small-Mid Cap Core Fund |
| | |
| | The Small-Mid Cap Core Fund seeks long-term capital appreciation. |
| | |
| | AN OVERVIEW FROM THE PORTFOLIO MANAGERS |
| | |

Daniel Crowe, CFA 
Ward D. Sexton, CFA | The William Blair Small-Mid Cap Core Fund (Class I shares) (the “Fund”) posted an 8.06% increase, net of fees, for the six months ended June 30, 2023. By comparison, the Fund’s benchmark index, the Russell 2500™ Index (the “Index”), increased 8.79%. Over the period, the Fund trailed the performance of the Index driven by stock specific dynamics. Top detractors from performance included National Vision Holdings (Consumer Discretionary), Western Alliance Bancorp (Financials), Mercury Systems (Industrials), Columbia Banking System (Financials) and New Fortress Energy (Energy). National Vision Holdings, the largest value optical retailer in the U.S., was negatively impacted by a shortage in optometrists, resulting in a lack of available exam slots and pressuring revenue and margins in the near term. Western Alliance is a regional bank headquartered in Phoenix, Arizona. Western Alliance’s deposit exposure to venture capital clients was much smaller than that of SVB Financial Group, but there was concern these deposits could leave and drive a broader liquidation of assets. Stock selection in Consumer Discretionary and Health Care also dampened relative performance. Positive stock selection in Industrials, including our positions in Builders FirstSource, ACV Auctions and Chart Industries, and Energy, including our position in Cameco, added value during the period. Shares of Builders FirstSource benefited from continued operational efficiency, as well as healthy demand for its value-added products and share buybacks. ACV Auctions, a solutions provider that maximizes profitability for used car dealers, experienced better-than-expected volume growth in a challenging environment. Information Technology holding, Verra Mobility, was also among top contributors to performance. Please refer to the U.S. Growth & Core Market Review and Outlook relating to the Fund on page 3. |
| 14 | Semiannual Report | June 30, 2023 |
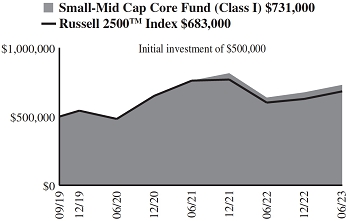
Small-Mid Cap Core Fund
Performance Highlights (Unaudited)
| Average Annual Total Returns through 6/30/2023 |
| | | Year
to Date | | 1 Year | | 3 Year | | Since
Inception(a) |
| Class I | | | 8.06 | % | | | 14.50 | % | | | 15.19 | % | | | 10.65 | % |
| Class R6 | | | 8.13 | | | | 14.57 | | | | 15.20 | | | | 10.70 | |
| Russell 2500TM Index | | | 8.79 | | | | 13.58 | | | | 12.29 | | | | 8.69 | |
| (a) | Since inception is for the period from October 1, 2019 (Commencement of Operations) to June 30, 2023. |
Performance cited represents past performance. Past performance does not guarantee future results and current performance may be lower or higher than the data quoted. Results shown are average annual total returns, which assume reinvestment of dividends and capital gains. Investment returns and principal will fluctuate and you may have a gain or loss when you sell shares. For the most current month-end performance information, please call 1-800-742-7272, or visit our Web site at www.williamblairfunds.com. Investing in smaller and medium capitalization companies involves special risks, including higher volatility and lower liquidity. Smaller and medium capitalization stocks are also more sensitive to purchase/sale transactions and changes in the issuer’s financial condition. From time to time, the investment adviser may waive fees or reimburse expenses for the Fund. Without these waivers/reimbursements, performance would be lower. Class I shares are not subject to a sales load or distribution (Rule 12b-1) fees. Class R6 shares are not subject to a sales load, distribution (Rule 12b-1) fees, or sub-transfer agent fees.
The performance highlights and graph presented above do not reflect the deduction of taxes that a shareholder would pay on fund distributions or the redemption of fund shares.
The Russell 2500TMIndex measures the performance of those Russell 2500 companies with above average price-to-book ratios and forecasted growth rates.
This report identifies the Fund’s investments on June 30, 2023. These holdings are subject to change. Not all stocks in the Fund performed the same, nor is there any guarantee that these stocks will perform as well in the future. Market forecasts provided in this report may not necessarily come to pass.
Sector Diversification (Unaudited)

The sector diversification shown is based on the total long-term securities.
| June 30, 2023 | William Blair Funds | 15 |
Small-Mid Cap Core Fund
Portfolio of Investments, June 30, 2023 (all dollar amounts in thousands) (unaudited)
| | | | | | | | |
| | | | | | | | |
| | Issuer | | Shares | | | Value | |
| | | | | | | | | | |
| | Common Stocks | | | | | | | | |
| | Industrials—24.4% | | | | | | | | |
| * | ACV Auctions, Inc. | | | 125,929 | | | $ | 2,175 | |
| | AGCO Corp. | | | 9,672 | | | | 1,271 | |
| * | Atkore, Inc. | | | 5,698 | | | | 888 | |
| * | Axon Enterprise, Inc. | | | 13,643 | | | | 2,662 | |
| | Brink’s Co. | | | 31,705 | | | | 2,150 | |
| * | Builders FirstSource, Inc. | | | 24,346 | | | | 3,311 | |
| | BWX Technologies, Inc. | | | 51,975 | | | | 3,720 | |
| * | Casella Waste Systems, Inc. | | | 39,564 | | | | 3,579 | |
| * | Chart Industries, Inc. | | | 20,789 | | | | 3,322 | |
| * | Energy Recovery, Inc. | | | 55,806 | | | | 1,560 | |
| * | GXO Logistics, Inc. | | | 39,668 | | | | 2,492 | |
| | Lincoln Electric Holdings, Inc. | | | 5,602 | | | | 1,113 | |
| * | Mercury Systems, Inc. | | | 52,183 | | | | 1,805 | |
| * | Shoals Technologies Group, Inc. | | | 57,223 | | | | 1,463 | |
| * | Trex Co., Inc. | | | 23,315 | | | | 1,528 | |
| * | Verra Mobility Corp. | | | 145,013 | | | | 2,860 | |
| * | WillScot Mobile Mini Holdings Corp. | | | 52,147 | | | | 2,492 | |
| | | | | | | | | 38,391 | |
| | Health Care—15.0% | | | | | | | | |
| * | Acadia Healthcare Co., Inc. | | | 23,015 | | | | 1,833 | |
| * | Avantor, Inc. | | | 42,280 | | | | 869 | |
| | Bio-Techne Corp. | | | 19,304 | | | | 1,576 | |
| * | Certara, Inc. | | | 73,332 | | | | 1,335 | |
| | Chemed Corp. | | | 5,249 | | | | 2,843 | |
| | Encompass Health Corp. | | | 51,873 | | | | 3,512 | |
| * | Globus Medical, Inc. | | | 28,534 | | | | 1,699 | |
| * | Merit Medical Systems, Inc. | | | 38,005 | | | | 3,179 | |
| * | Neogen Corp. | | | 53,796 | | | | 1,170 | |
| * | Penumbra, Inc. | | | 5,078 | | | | 1,747 | |
| * | Repligen Corp. | | | 6,138 | | | | 868 | |
| * | Sotera Health Co. | | | 71,569 | | | | 1,348 | |
| * | Veradigm, Inc. | | | 126,747 | | | | 1,597 | |
| | | | | | | | | 23,576 | |
| | Consumer Discretionary—10.8% | | | | | | | | |
| | ADT, Inc. | | | 114,329 | | | | 689 | |
| * | Boot Barn Holdings, Inc. | | | 11,429 | | | | 968 | |
| * | Bright Horizons Family Solutions, Inc. | | | 37,467 | | | | 3,464 | |
| * | Cavco Industries, Inc. | | | 2,961 | | | | 874 | |
| * | Fox Factory Holding Corp. | | | 12,062 | | | | 1,309 | |
| * | Grand Canyon Education, Inc. | | | 12,096 | | | | 1,248 | |
| * | National Vision Holdings, Inc. | | | 107,625 | | | | 2,614 | |
| | Pool Corp. | | | 5,941 | | | | 2,226 | |
| * | Revolve Group, Inc. | | | 34,083 | | | | 559 | |
| | Signet Jewelers Ltd.† | | | 16,855 | | | | 1,100 | |
| * | Skyline Champion Corp. | | | 28,495 | | | | 1,865 | |
| | | | | | | | | 16,916 | |
| | Financials—10.2% | | | | | | | | |
| | Carlyle Group, Inc. | | | 46,826 | | | | 1,496 | |
| | Columbia Banking System, Inc. | | | 79,067 | | | | 1,604 | |
| | East West Bancorp, Inc. | | | 37,686 | | | | 1,989 | |
| * | Euronet Worldwide, Inc. | | | 19,374 | | | | 2,274 | |
| * | Goosehead Insurance, Inc. | | | 26,147 | | | | 1,644 | |
| | Hannon Armstrong Sustainable Infrastructure Capital, Inc. | | | 52,701 | | | | 1,318 | |
| | Tradeweb Markets, Inc. | | | 14,193 | | | | 972 | |
| | Virtu Financial, Inc. | | | 88,620 | | | | 1,515 | |
| | Western Alliance Bancorp | | | 43,789 | | | | 1,597 | |
| | Wintrust Financial Corp. | | | 21,900 | | | | 1,590 | |
| | | | | | | | | 15,999 | |
| | | | | | | | |
| | | | | | | | |
| | Issuer | | Shares | | | Value | |
| | | | | | | | | | |
| | Common Stocks—(continued) | | | | | | | | |
| | Information Technology—10.0% | | | | | | | | |
| * | Alarm.com Holdings, Inc. | | | 17,769 | | | $ | 918 | |
| * | Ambarella, Inc.† | | | 15,744 | | | | 1,317 | |
| | Cognex Corp. | | | 24,996 | | | | 1,400 | |
| * | Dynatrace, Inc. | | | 40,752 | | | | 2,097 | |
| | Entegris, Inc. | | | 14,901 | | | | 1,651 | |
| * | JFrog Ltd.† | | | 40,617 | | | | 1,125 | |
| | MKS Instruments, Inc. | | | 8,989 | | | | 972 | |
| * | Nice Ltd. —ADR | | | 10,879 | | | | 2,247 | |
| * | Onto Innovation, Inc. | | | 7,132 | | | | 831 | |
| * | Pure Storage, Inc. | | | 28,293 | | | | 1,042 | |
| * | SolarEdge Technologies, Inc. | | | 2,568 | | | | 691 | |
| * | Wolfspeed, Inc. | | | 26,459 | | | | 1,471 | |
| | | | | | | | | 15,762 | |
| | Energy—7.8% | | | | | | | | |
| | Cameco Corp. | | | 108,913 | | | | 3,412 | |
| * | Denbury, Inc. | | | 26,127 | | | | 2,254 | |
| * | Green Plains, Inc. | | | 42,543 | | | | 1,372 | |
| | New Fortress Energy, Inc. | | | 66,074 | | | | 1,770 | |
| * | TechnipFMC PLC† | | | 121,383 | | | | 2,017 | |
| | Whitecap Resources, Inc. | | | 206,926 | | | | 1,446 | |
| | | | | | | | | 12,271 | |
| | Materials—7.4% | | | | | | | | |
| | Berry Global Group, Inc. | | | 40,168 | | | | 2,584 | |
| | CF Industries Holdings, Inc. | | | 24,704 | | | | 1,715 | |
| | Crown Holdings, Inc. | | | 31,250 | | | | 2,715 | |
| | Eagle Materials, Inc. | | | 10,446 | | | | 1,947 | |
| | Sylvamo Corp. | | | 64,610 | | | | 2,614 | |
| | | | | | | | | 11,575 | |
| | Real Estate—6.5% | | | | | | | | |
| | Agree Realty Corp. | | | 29,547 | | | | 1,932 | |
| | Americold Realty Trust, Inc. | | | 88,233 | | | | 2,850 | |
| | Equity LifeStyle Properties, Inc. | | | 36,768 | | | | 2,459 | |
| | Healthcare Realty Trust, Inc. | | | 122,856 | | | | 2,317 | |
| | Pebblebrook Hotel Trust | | | 49,762 | | | | 694 | |
| | | | | | | | | 10,252 | |
| | Consumer Staples—4.6% | | | | | | | | |
| | Inter Parfums, Inc. | | | 12,798 | | | | 1,731 | |
| | Lancaster Colony Corp. | | | 10,556 | | | | 2,123 | |
| * | Performance Food Group Co. | | | 25,459 | | | | 1,534 | |
| | Primo Water Corp. | | | 142,553 | | | | 1,787 | |
| | | | | | | | | 7,175 | |
| | Utilities—1.6% | | | | | | | | |
| | IDACORP, Inc. | | | 24,517 | | | | 2,515 | |
| | Communication Services—1.1% | | | | | | | | |
| * | Live Nation Entertainment, Inc. | | | 9,209 | | | | 839 | |
| * | ZipRecruiter, Inc. | | | 54,164 | | | | 962 | |
| | | | | | | | | 1,801 | |
| | Total Common Stocks—99.4%
(cost $147,737) | | | | | | | 156,233 | |
See accompanying Notes to Financial Statements.
| 16 | Semiannual Report | June 30, 2023 |
Small-Mid Cap Core Fund
Portfolio of Investments, June 30, 2023 (all dollar amounts in thousands) (unaudited)
| | | | | | | | |
| | Issuer | | Principal
Amount | | | Value | |
| | | | | | | | |
| | Repurchase Agreement | | | | | | | | |
| | Fixed Income Clearing Corporation, 2.100% dated 06/30/23, due 07/03/23, repurchase price $1,689, collateralized by U.S. Treasury Note, 1.250%, due 08/15/31, valued at $1,722 | | | $1,689 | | | $ | 1,689 | |
| | Total Repurchase Agreement—1.1%
(cost $1,689) | | | | | | | 1,689 | |
| | Total Investments—100.5%
(cost $149,426) | | | | | | | 157,922 | |
| | Liabilities, plus cash and other assets—(0.5)% | | | | | | | (729 | ) |
| | Net assets—100.0% | | | | | | $ | 157,193 | |
ADR = American Depository Receipt
* = Non-income producing security
† = U.S. listed foreign security
See accompanying Notes to Financial Statements.
| June 30, 2023 | William Blair Funds | 17 |
| | Small-Mid Cap Growth Fund |
| | |
| | The Small-Mid Cap Growth Fund seeks long-term capital appreciation. |
| | |
| | AN OVERVIEW FROM THE PORTFOLIO MANAGERS |
| | |

Daniel Crowe, CFA 
James E. Jones, CFA 
Nicholas Zimmerman, CFA | The William Blair Small-Mid Cap Growth Fund (Class N shares) (the “Fund”) posted an 11.64% increase, net of fees, for the six months ended June 30, 2023. By comparison, the Fund’s benchmark index, the Russell 2500™ Growth Index (the “Index”), increased 13.38%. Over the period, the Fund trailed the performance of the Index driven by stock specific dynamics. Stock selection in Consumer Discretionary, including our position in National Vision Holdings, detracted from relative performance. National Vision Holdings, the largest value optical retailer in the U.S., was negatively impacted by a shortage in optometrists, resulting in a lack of available exam slots and pressuring revenue and margins in the near term. Other notable detractors included our positions in Mercury Systems (Industrials), New Fortress (Energy), Western Alliance Bancorp (Financials) and CF Industries (Materials). Shares of Mercury Systems, a provider of sensor processing subsystems, declined on near term profit pressures amidst manufacturing and supply chain challenges. Positive stock selection in Industrials, including our position in Builders FirstSource, and Energy, including our position in Cameco, added value during the period. Shares of Builders FirstSource benefited from continued operational efficiency, as well as healthy demand for its value-added products and share buybacks. Other top contributors included National Instruments (Information Technology), MongoDB (Information Technology) and Penumbra (Health Care). National Instruments designs and manufactures test and measurement tools utilized in the testing of electrical products. The company announced it would be acquired by Emerson Electric. Please refer to the U.S. Growth & Core Market Review and Outlook relating to the Fund on page 3. |
| 18 | Semiannual Report | June 30, 2023 |
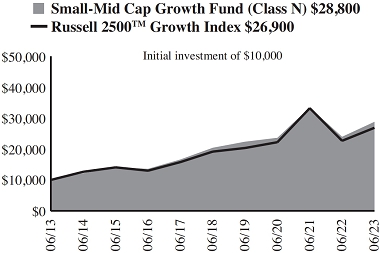
Small-Mid Cap Growth Fund
Performance Highlights (Unaudited)
| Average Annual Total Returns through 6/30/2023 |
| | Year
to Date | | 1 Year | | 3 Year | | 5 Year | | 10 Year | | Since
Inception(a) |
| Class N | | | 11.64 | % | | | 20.23 | % | | | 6.83 | % | | | 7.14 | % | | | 11.15 | % | | | — | % |
| Class I | | | 11.81 | | | | 20.56 | | | | 7.11 | | | | 7.42 | | | | 11.44 | | | | — | |
| Class R6 | | | 11.81 | | | | 20.63 | | | | 7.17 | | | | — | | | | — | | | | 7.32 | |
| Russell 2500TM Growth Index | | | 13.38 | | | | 18.58 | | | | 6.56 | | | | 7.00 | | | | 10.38 | | | | 7.38 | |
| (a) | Since inception is for the period from May 2, 2019 (Commencement of Operations) to June 30, 2023. |
Performance cited represents past performance. Past performance does not guarantee future results and current performance may be lower or higher than the data quoted. Results shown are average annual total returns, which assume reinvestment of dividends and capital gains. Investment returns and principal will fluctuate and you may have a gain or loss when you sell shares. For the most current month-end performance information, please call 1-800-742-7272, or visit our Web site at www.williamblairfunds.com. Investing in smaller and medium capitalization companies involves special risks, including higher volatility and lower liquidity. Smaller and medium capitalization stocks are also more sensitive to purchase/sale transactions and changes in the issuer’s financial condition. From time to time, the investment adviser may waive fees or reimburse expenses for the Fund. Without these waivers/reimbursements, performance would be lower. Class N shares are not subject to a sales load. Class I shares are not subject to a sales load or distribution (Rule 12b-1) fees. Class R6 shares are not subject to a sales load, distribution (Rule 12b-1) fees, or sub-transfer agent fees.
The performance highlights and graph presented above do not reflect the deduction of taxes that a shareholder would pay on fund distributions or the redemption of fund shares.
The Russell 2500TM Growth Index measures the performance of those Russell 2500 companies with above average price-to-book ratios and forecasted growth rates.
This report identifies the Fund’s investments on June 30, 2023. These holdings are subject to change. Not all stocks in the Fund performed the same, nor is there any guarantee that these stocks will perform as well in the future. Market forecasts provided in this report may not necessarily come to pass.
Sector Diversification (Unaudited)

The sector diversification shown is based on the total long-term securities.
| June 30, 2023 | William Blair Funds | 19 |
Small-Mid Cap Growth Fund
Portfolio of Investments, June 30, 2023 (all dollar amounts in thousands) (unaudited)
| | | | | | | | |
| | | | | | | | |
| | Issuer | | Shares | | | Value | |
| | | | | | | | |
| | Common Stocks | | | | | | | | |
| | Health Care—23.5% | | | | | | | | |
| * | Acadia Healthcare Co., Inc. | | | 469,880 | | | $ | 37,421 | |
| | Bio-Techne Corp. | | | 402,300 | | | | 32,840 | |
| * | Blueprint Medicines Corp. | | | 252,204 | | | | 15,939 | |
| * | Certara, Inc. | | | 937,983 | | | | 17,081 | |
| * | Charles River Laboratories International, Inc. | | | 80,337 | | | | 16,891 | |
| | Chemed Corp. | | | 95,684 | | | | 51,829 | |
| | Encompass Health Corp. | | | 776,100 | | | | 52,550 | |
| * | Evolent Health, Inc. | | | 541,100 | | | | 16,395 | |
| * | Globus Medical, Inc. | | | 263,795 | | | | 15,706 | |
| * | HealthEquity, Inc. | | | 524,508 | | | | 33,117 | |
| * | Insmed, Inc. | | | 694,251 | | | | 14,649 | |
| * | Inspire Medical Systems, Inc. | | | 137,142 | | | | 44,522 | |
| * | Insulet Corp. | | | 60,846 | | | | 17,544 | |
| * | Merit Medical Systems, Inc. | | | 458,326 | | | | 38,334 | |
| * | Neogen Corp. | | | 722,400 | | | | 15,712 | |
| * | Penumbra, Inc. | | | 118,659 | | | | 40,826 | |
| * | Repligen Corp. | | | 166,900 | | | | 23,610 | |
| * | Twist Bioscience Corp. | | | 620,273 | | | | 12,691 | |
| | | | | | | | | 497,657 | |
| | Industrials—21.5% | | | | | | | | |
| | Advanced Drainage Systems, Inc. | | | 259,700 | | | | 29,549 | |
| * | Axon Enterprise, Inc. | | | 229,948 | | | | 44,867 | |
| | Brink’s Co. | | | 476,716 | | | | 32,336 | |
| * | Builders FirstSource, Inc. | | | 464,115 | | | | 63,120 | |
| | BWX Technologies, Inc. | | | 875,252 | | | | 62,642 | |
| * | Casella Waste Systems, Inc. | | | 350,861 | | | | 31,735 | |
| * | Chart Industries, Inc. | | | 246,587 | | | | 39,402 | |
| | HEICO Corp. | | | 309,756 | | | | 43,552 | |
| * | Mercury Systems, Inc. | | | 794,301 | | | | 27,475 | |
| * | Shoals Technologies Group, Inc. | | | 668,230 | | | | 17,080 | |
| * | SiteOne Landscape Supply, Inc. | | | 113,000 | | | | 18,912 | |
| * | Trex Co., Inc. | | | 448,721 | | | | 29,418 | |
| * | WillScot Mobile Mini Holdings Corp. | | | 342,700 | | | | 16,377 | |
| | | | | | | | | 456,465 | |
| | Information Technology—18.3% | | | | | | | | |
| * | Alarm.com Holdings, Inc. | | | 370,741 | | | | 19,160 | |
| * | Ambarella, Inc.† | | | 237,320 | | | | 19,857 | |
| | Cognex Corp. | | | 473,047 | | | | 26,500 | |
| * | Dynatrace, Inc. | | | 614,186 | | | | 31,612 | |
| | Entegris, Inc. | | | 274,276 | | | | 30,395 | |
| * | Guidewire Software, Inc. | | | 422,055 | | | | 32,110 | |
| | MKS Instruments, Inc. | | | 176,965 | | | | 19,130 | |
| * | MongoDB, Inc. | | | 39,300 | | | | 16,152 | |
| | National Instruments Corp. | | | 343,751 | | | | 19,731 | |
| * | Nice Ltd.—ADR | | | 125,068 | | | | 25,827 | |
| * | Novanta, Inc.† | | | 167,554 | | | | 30,847 | |
| * | SolarEdge Technologies, Inc. | | | 47,932 | | | | 12,896 | |
| * | SPS Commerce, Inc. | | | 75,600 | | | | 14,520 | |
| * | Tenable Holdings, Inc. | | | 449,288 | | | | 19,566 | |
| * | Tyler Technologies, Inc. | | | 87,500 | | | | 36,441 | |
| * | Varonis Systems, Inc. | | | 491,609 | | | | 13,101 | |
| * | Wolfspeed, Inc. | | | 374,113 | | | | 20,797 | |
| | | | | | | | | 388,642 | |
| | Consumer Discretionary—9.4% | | | | | | | | |
| * | Bright Horizons Family Solutions, Inc. | | | 207,400 | | | | 19,174 | |
| * | Burlington Stores, Inc. | | | 73,961 | | | | 11,641 | |
| * | Five Below, Inc. | | | 111,400 | | | | 21,895 | |
| * | Fox Factory Holding Corp. | | | 181,506 | | | | 19,695 | |
| * | National Vision Holdings, Inc. | | | 1,166,476 | | | | 28,334 | |
| * | Planet Fitness, Inc. | | | 512,300 | | | | 34,549 | |
| | Pool Corp. | | | 90,500 | | | | 33,905 | |
| * | Revolve Group, Inc. | | | 918,892 | | | | 15,070 | |
| | Wyndham Hotels & Resorts, Inc. | | | 206,345 | | | | 14,149 | |
| | | | | | | | | 198,412 | |
| | Issuer | | Shares or
Principal
Amount | | | | Value | |
| | | | | | | | | |
| | Common Stocks—(continued) | | | | | | | | |
| | Energy—6.9% | | | | | | | | |
| | Cameco Corp. | | | 1,104,862 | | | $ | 34,615 | |
| * | Denbury, Inc. | | | 277,385 | | | | 23,927 | |
| * | Kosmos Energy Ltd. | | | 2,059,400 | | | | 12,336 | |
| | New Fortress Energy, Inc. | | | 892,612 | | | | 23,904 | |
| * | TechnipFMC PLC† | | | 1,911,300 | | | | 31,766 | |
| | Whitecap Resources, Inc. | | | 2,733,100 | | | | 19,105 | |
| | | | | | | | | 145,653 | |
| | Financials—6.3% | | | | | | | | |
| | Ares Management Corp. | | | 183,340 | | | | 17,665 | |
| | Carlyle Group, Inc. | | | 433,200 | | | | 13,841 | |
| * | Euronet Worldwide, Inc. | | | 392,980 | | | | 46,124 | |
| | Tradeweb Markets, Inc. | | | 311,500 | | | | 21,331 | |
| | Virtu Financial, Inc. | | | 1,092,136 | | | | 18,665 | |
| | Western Alliance Bancorp | | | 419,416 | | | | 15,296 | |
| | | | | | | | | 132,922 | |
| | Consumer Staples—5.7% | | | | | | | | |
| * | elf Beauty, Inc. | | | 152,800 | | | | 17,454 | |
| * | Freshpet, Inc. | | | 539,779 | | | | 35,523 | |
| | Lancaster Colony Corp. | | | 199,530 | | | | 40,124 | |
| * | Performance Food Group Co. | | | 464,595 | | | | 27,987 | |
| | | | | | | | | 121,088 | |
| | Materials—5.4% | | | | | | | | |
| | CF Industries Holdings, Inc. | | | 503,231 | | | | 34,934 | |
| | Crown Holdings, Inc. | | | 472,087 | | | | 41,010 | |
| | Martin Marietta Materials, Inc. | | | 83,196 | | | | 38,411 | |
| | | | | | | | | 114,355 | |
| | Real Estate—1.1% | | | | | | | | |
| | FirstService Corp. | | | 145,468 | | | | 22,415 | |
| | Communication Services—1.0% | | | | | | | | |
| * | Live Nation Entertainment, Inc. | | | 223,912 | | | | 20,401 | |
| | Total Common Stocks—99.1%
(cost $1,807,141) | | | | | | | 2,098,010 | |
| | | | | | | | | | |
| | Rights | | | | | | | | |
| | Health Care—0.0% | | | | | | | | |
| * | Abiomed, Inc. CVR** | | | 80,133 | | | | — | |
| | Total Rights—0.0%
(cost $82) | | | | | | | — | |
| | | | | | | | | | |
| | Repurchase Agreement | | | | | | | | |
| | Fixed Income Clearing Corporation, 2.100% dated 06/30/23, due 07/03/23, repurchase price $24,440, collateralized by U.S. Treasury Note, 1.375%, due 11/15/31, valued at $24,925 | | | $24,436 | | | | 24,436 | |
| | Total Repurchase Agreement—1.1%
(cost $24,436) | | | | | | | 24,436 | |
| | Total Investments—100.2%
(cost $1,831,659) | | | | | | | 2,122,446 | |
| | Liabilities, plus cash and other assets—(0.2)% | | | | | | | (5,096 | ) |
| | Net assets—100.0% | | | | | | $ | 2,117,350 | |
ADR = American Depository Receipt
CVR = Contingent Value Right
* = Non-income producing security
** = Fair valued pursuant to the Fund’s Valuation Procedures. This holding represents 0.00% of the Fund’s net assets at June 30, 2023.
† = U.S. listed foreign security
See accompanying Notes to Financial Statements.
| 20 | Semiannual Report | June 30, 2023 |
| | Small Cap Growth Fund |
| | |
| | The Small Cap Growth Fund seeks long-term capital appreciation. |
| | |
| | AN OVERVIEW FROM THE PORTFOLIO MANAGERS |
| | |

Ward D. Sexton, CFA 
Mark C. Thompson, CFA | The William Blair Small Cap Growth Fund (Class N shares) (the “Fund”) posted an 11.16% increase, net of fees, for the six months ended June 30, 2023. By comparison, the Fund’s benchmark index, the Russell 2000® Growth Index (the “Index”), increased 13.55%. The Fund underperformed its benchmark during the period, driven by stock specific dynamics. Our top detractors included National Vision Holdings (Consumer Discretionary), Quinstreet (Communication Services), Globus Medical (Health Care), Mercury Systems (Industrials) and Veradigm (Health Care). National Vision Holdings, the largest value optical retailer in the U.S., reported mixed quarterly results and provided disappointing 2023 guidance. QuinStreet, a provider of performance-based marketing and lead generation services, gave a cautious outlook for its insurance vertical as carriers are pausing advertising spend to assess market conditions. Stock selection in Health Care and Industrials also dampened returns. Our top contributors to performance included Vita Coco (Consumer Staples), ACV Auctions (Industrials), Builders FirstSource (Industrials), PDF Solutions (Information Technology) and Verra Mobility (Information Technology). Vita Coco, a supplier and distributer of coconut water, reported strong volume growth and margin expansion. ACV Auctions, a solutions provider that maximizes profitability for used car dealers by offering an online marketplace for wholesale used vehicle transactions, reported strong quarterly results. Stock selection in Energy and Information Technology also provided a tailwind to relative performance. Please refer to the U.S. Growth & Core Market Review and Outlook relating to the Fund on page 3. |
| June 30, 2023 | William Blair Funds | 21 |
Small Cap Growth Fund
Performance Highlights (Unaudited)
| Average Annual Total Returns through 6/30/2023 |
| | | Year to
Date | | 1 Year | | 3 Year | | 5 Year | | 10 Year | | Since
Inception(a) |
| Class N | | | 11.16 | % | | | 21.00 | % | | | 11.91 | % | | | 7.13 | % | | | 11.51 | % | | | — | % |
| Class I | | | 11.30 | | | | 21.31 | | | | 12.19 | | | | 7.40 | | | | 11.78 | | | | — | |
| Class R6 | | | 11.34 | | | | 21.37 | | | | 12.28 | | | | — | | | | — | | | | 8.69 | |
| Russell 2000® Growth Index | | | 13.55 | | | | 18.53 | | | | 6.10 | | | | 4.22 | | | | 8.83 | | | | 5.41 | |
| | |
| (a) | Since inception is for the period from May 2, 2019 (Commencement of Operations) to June 30, 2023. |
Performance cited represents past performance. Past performance does not guarantee future results and current performance may be lower or higher than the data quoted. Results shown are average annual total returns, which assume reinvestment of dividends and capital gains. Investment returns and principal will fluctuate and you may have a gain or loss when you sell shares. For the most current month-end performance information, please call 1-800-742-7272, or visit our Web site at www.williamblairfunds.com. Investing in smaller companies involves special risks, including higher volatility and lower liquidity. Smaller capitalization stocks are also more sensitive to purchase/sale transactions and changes in the issuer’s financial condition. From time to time, the investment adviser may waive fees or reimburse expenses for the Fund. Without these waivers/reimbursements, performance would be lower. Class N shares are not subject to a sales load. Class I shares are not subject to a sales load or distribution (Rule 12b-1) fees. Class R6 shares are not subject to a sales load, distribution (Rule 12b-1) fees, or sub-transfer agent fees.
The performance highlights and graph presented above do not reflect the deduction of taxes that a shareholder would pay on fund distributions or the redemption of fund shares.
The Russell 2000® Growth Index is an unmanaged composite of the smallest 2000 stocks of the Russell 3000® Growth Index.
This report identifies the Fund’s investments on June 30, 2023. These holdings are subject to change. Not all stocks in the Fund performed the same, nor is there any guarantee that these stocks will perform as well in the future. Market forecasts provided in this report may not necessarily come to pass.
Sector Diversification (Unaudited)

The sector diversification shown is based on the total long-term securities.
| 22 | Semiannual Report | June 30, 2023 |
Small Cap Growth Fund
Portfolio of Investments, June 30, 2023 (all dollar amounts in thousands) (unaudited)
| | | | | | | | |
| | | | | | | | |
| | Issuer | | Shares | | | Value | |
| | | | | | | | |
| | Common Stocks | | | | | | | | |
| | Industrials—22.4% | | | | | | | | |
| * | ACV Auctions, Inc. | | | 515,320 | | | $ | 8,900 | |
| | Albany International Corp. | | | 131,855 | | | | 12,299 | |
| * | Atkore, Inc. | | | 46,990 | | | | 7,328 | |
| | Brink’s Co. | | | 207,038 | | | | 14,043 | |
| | BWX Technologies, Inc. | | | 228,977 | | | | 16,388 | |
| * | Casella Waste Systems, Inc. | | | 187,770 | | | | 16,984 | |
| * | Chart Industries, Inc. | | | 57,653 | | | | 9,212 | |
| | Douglas Dynamics, Inc. | | | 223,693 | | | | 6,684 | |
| * | Ducommun, Inc. | | | 148,592 | | | | 6,474 | |
| * | Energy Recovery, Inc. | | | 344,646 | | | | 9,633 | |
| | Luxfer Holdings PLC† | | | 565,666 | | | | 8,049 | |
| * | Mercury Systems, Inc. | | | 213,686 | | | | 7,391 | |
| * | Montrose Environmental Group, Inc. | | | 155,688 | | | | 6,558 | |
| * | Shoals Technologies Group, Inc. | | | 143,560 | | | | 3,669 | |
| * | Stem, Inc. | | | 513,546 | | | | 2,938 | |
| * | Verra Mobility Corp. | | | 593,329 | | | | 11,701 | |
| | | | | | | | | 148,251 | |
| | Health Care—21.4% | | | | | | | | |
| * | Acadia Healthcare Co., Inc. | | | 107,569 | | | | 8,567 | |
| * | Alignment Healthcare, Inc. | | | 437,112 | | | | 2,513 | |
| * | Amicus Therapeutics, Inc. | | | 736,330 | | | | 9,248 | |
| * | Axogen, Inc. | | | 514,294 | | | | 4,696 | |
| * | Azenta, Inc. | | | 77,335 | | | | 3,610 | |
| * | Blueprint Medicines Corp. | | | 75,180 | | | | 4,751 | |
| * | Certara, Inc. | | | 384,443 | | | | 7,001 | |
| | Encompass Health Corp. | | | 199,480 | | | | 13,507 | |
| * | Globus Medical, Inc. | | | 154,520 | | | | 9,200 | |
| * | HealthEquity, Inc. | | | 51,605 | | | | 3,258 | |
| * | Insmed, Inc. | | | 279,570 | | | | 5,899 | |
| * | Inspire Medical Systems, Inc. | | | 38,010 | | | | 12,340 | |
| * | Ligand Pharmaceuticals, Inc. | | | 49,450 | | | | 3,565 | |
| * | Merit Medical Systems, Inc. | | | 150,360 | | | | 12,576 | |
| * | Mirum Pharmaceuticals, Inc. | | | 107,670 | | | | 2,785 | |
| * | OmniAb, Inc. | | | 887,939 | | | | 4,466 | |
| * | OmniAb, Inc. 12.50 Earnout (Acquired 11/02/22, Cost $0)**# | | | 23,037 | | | | — | |
| * | OmniAb, Inc. 15.00 Earnout (Acquired 11/02/22, Cost $0)**# | | | 23,037 | | | | — | |
| * | Sotera Health Co. | | | 233,860 | | | | 4,406 | |
| * | Treace Medical Concepts, Inc. | | | 310,930 | | | | 7,954 | |
| * | Twist Bioscience Corp. | | | 179,526 | | | | 3,673 | |
| * | Veracyte, Inc. | | | 195,320 | | | | 4,975 | |
| * | Veradigm, Inc. | | | 502,658 | | | | 6,334 | |
| * | Vericel Corp. | | | 171,140 | | | | 6,430 | |
| | | | | | | | | 141,754 | |
| | Information Technology—16.3% | | | | | | | | |
| * | Alarm.com Holdings, Inc. | | | 128,070 | | | | 6,619 | |
| * | Ambarella, Inc.† | | | 76,739 | | | | 6,421 | |
| | American Software, Inc. | | | 347,695 | | | | 3,654 | |
| * | Applied Digital Corp. | | | 187,793 | | | | 1,756 | |
| * | Guidewire Software, Inc. | | | 111,450 | | | | 8,479 | |
| * | JFrog Ltd.† | | | 317,880 | | | | 8,805 | |
| * | Novanta, Inc.† | | | 51,000 | | | | 9,389 | |
| * | Onto Innovation, Inc. | | | 56,260 | | | | 6,553 | |
| | | | | | | | |
| | | | | | | | |
| | Issuer | | Shares | | | Value | |
| | | | | | | | |
| | Common Stocks—(continued) | | | | | | | | |
| | Information Technology—(continued) | | | | | | | | |
| * | PDF Solutions, Inc. | | | 222,451 | | | $ | 10,032 | |
| | Power Integrations, Inc. | | | 50,630 | | | | 4,793 | |
| * | PROS Holdings, Inc. | | | 250,860 | | | | 7,726 | |
| * | SiTime Corp. | | | 43,745 | | | | 5,161 | |
| * | SPS Commerce, Inc. | | | 34,520 | | | | 6,630 | |
| * | Varonis Systems, Inc. | | | 198,230 | | | | 5,283 | |
| * | Vertex, Inc. | | | 344,303 | | | | 6,714 | |
| * | Workiva, Inc. | | | 97,470 | | | | 9,909 | |
| | | | | | | | | 107,924 | |
| | Consumer Discretionary—11.4% | | | | | | | | |
| * | Boot Barn Holdings, Inc. | | | 89,764 | | | | 7,602 | |
| | Cheesecake Factory, Inc. | | | 200,230 | | | | 6,924 | |
| * | Fox Factory Holding Corp. | | | 54,400 | | | | 5,903 | |
| * | Golden Entertainment, Inc. | | | 140,920 | | | | 5,890 | |
| * | Grand Canyon Education, Inc. | | | 52,140 | | | | 5,381 | |
| * | National Vision Holdings, Inc. | | | 401,072 | | | | 9,742 | |
| * | OneSpaWorld Holdings Ltd.† | | | 118,276 | | | | 1,431 | |
| * | Overstock.com, Inc. | | | 173,030 | | | | 5,636 | |
| * | Revolve Group, Inc. | | | 127,557 | | | | 2,092 | |
| | Signet Jewelers Ltd.† | | | 81,980 | | | | 5,350 | |
| * | Skyline Champion Corp. | | | 128,070 | | | | 8,382 | |
| | Winmark Corp. | | | 32,110 | | | | 10,676 | |
| | | | | | | | | 75,009 | |
| | Energy—7.2% | | | | | | | | |
| | Cameco Corp. | | | 253,160 | | | | 7,931 | |
| | ChampionX Corp. | | | 256,150 | | | | 7,951 | |
| * | Denbury, Inc. | | | 98,419 | | | | 8,490 | |
| * | Green Plains, Inc. | | | 244,402 | | | | 7,880 | |
| * | TechnipFMC PLC† | | | 589,370 | | | | 9,795 | |
| | Whitecap Resources, Inc. | | | 753,330 | | | | 5,266 | |
| | | | | | | | | 47,313 | |
| | Financials—5.9% | | | | | | | | |
| * | Donnelley Financial Solutions, Inc. | | | 162,080 | | | | 7,379 | |
| * | Euronet Worldwide, Inc. | | | 92,560 | | | | 10,864 | |
| * | Goosehead Insurance, Inc. | | | 114,470 | | | | 7,199 | |
| | Virtu Financial, Inc. | | | 280,330 | | | | 4,791 | |
| | Western Alliance Bancorp | | | 161,685 | | | | 5,897 | |
| | Wintrust Financial Corp. | | | 37,743 | | | | 2,741 | |
| | | | | | | | | 38,871 | |
| | Consumer Staples—4.3% | | | | | | | | |
| * | Beauty Health Co. | | | 383,500 | | | | 3,210 | |
| * | elf Beauty, Inc. | | | 46,820 | | | | 5,348 | |
| * | Performance Food Group Co. | | | 100,120 | | | | 6,031 | |
| * | Vita Coco Co., Inc. | | | 309,320 | | | | 8,311 | |
| * | Vital Farms, Inc. | | | 450,340 | | | | 5,400 | |
| | | | | | | | | 28,300 | |
| | Communication Services—3.0% | | | | | | | | |
| * | Gogo, Inc. | | | 428,420 | | | | 7,287 | |
| * | QuinStreet, Inc. | | | 677,015 | | | | 5,978 | |
| * | ZipRecruiter, Inc. | | | 369,490 | | | | 6,562 | |
| | | | | | | | | 19,827 | |
See accompanying Notes to Financial Statements.
| June 30, 2023 | William Blair Funds | 23 |
Small Cap Growth Fund
Portfolio of Investments, June 30, 2023 (all dollar amounts in thousands) (unaudited)
| Issuer | | Shares or
Principal
Amount | | | Value | |
| | | | | | | | | |
| Common Stocks—(continued) | | | | | | | | |
| Real Estate—2.6% | | | | | | | | |
| Colliers International Group, Inc. | | | 50,358 | | | $ | 4,945 | |
| FirstService Corp. | | | 79,147 | | | | 12,196 | |
| | | | | | | | 17,141 | |
| Materials—2.5% | | | | | | | | |
| Balchem Corp. | | | 46,850 | | | | 6,316 | |
| Orion SA† | | | 238,167 | | | | 5,054 | |
| Sylvamo Corp. | | | 131,470 | | | | 5,318 | |
| | | | | | | | 16,688 | |
Total Common Stocks—97.0%
(cost $556,022) | | | | | | | 641,078 | |
| | | | | | | | | |
| Exchange-Traded Funds | | | | | | | | |
| Exchange-Traded Fund—1.0% | | | | | | | | |
| iShares Russell 2000 Growth ETF | | | 26,280 | | | | 6,377 | |
Total Exchange-Traded Fund—1.0%
(cost $5,993) | | | | | | | 6,377 | |
| | | | | | | | | |
| Repurchase Agreement | | | | | | | | |
| Fixed Income Clearing Corporation, 2.100% dated 06/30/23, due 07/03/23, repurchase price $22,012, collateralized by U.S. Treasury Note, 1.375%, due 11/15/31, valued at $22,449 | | | $22,008 | | | | 22,008 | |
Total Repurchase Agreement—3.3%
(cost $22,008) | | | | | | | 22,008 | |
Total Investments—101.3%
(cost $584,023) | | | | | | | 669,463 | |
| Liabilities, plus cash and other assets—(1.3)% | | | | | | | (8,549 | ) |
| Net assets—100.0% | | | | | | $ | 660,914 | |
* = Non-income producing security
** = Fair valued pursuant to the Fund’s Valuation Procedures. These holdings represent 0.00% of the Fund’s net assets at June 30, 2023.
# = Investment in securities not registered under the Securities Act of 1933 (excluding securities acquired pursuant to Rule 144A and Regulation S). The value of such restricted securities represents 0.00% of the Fund’s net assets at June 30, 2023.
† = U.S. listed foreign security
See accompanying Notes to Financial Statements.
| 24 | Semiannual Report | June 30, 2023 |
| | Small Cap Value Fund |
| | |
| | The Small Cap Value Fund seeks long-term capital appreciation. |
| | |
| | AN OVERVIEW FROM THE PORTFOLIO MANAGERS |
| | |

William Heaphy, CFA 
Gary Merwitz | The William Blair Small Cap Value Fund (Class N shares) (the “Fund”) posted a 1.91% increase, net of fees, for the six months ended June 30, 2023. By comparison, the Fund’s benchmark index, the Russell 2000® Value Index (the “Index”), increased 2.50%. The Fund’s relative underperformance during the period was driven by poor stock selection while allocation to the underlying economic sector was additive to relative performance. At the sector level, the Fund’s Health Care holdings were a major contributor to relative performance in the first half of the year. A lack of exposure to the poorly performing biotechnology subsector, which declined by more than 11%, was a major contributor to this result. Several of the Fund’s Health Care holdings also posted significantly positive returns, including Health Care supplier Lantheus Holdings. The Fund was also positively impacted by an overweight position and relative outperformance by the Fund’s holdings in the Consumer Discretionary sector. The Fund’s Consumer Discretionary holdings surged past index peers with the help of homebuilders Tri Pointe Homes and Taylor Morrison Home Corp, both of which were top contributors for the period adding to relative performance. On the negative side, the Fund’s Information Technology sector holdings could not keep pace with Index constituents, which rose nearly 30% through the first two quarters of the year. The Fund’s investment in AudioCodes Ltd. and Methode Electronics, Inc. caused most of the Fund’s underperformance during the period. Each company is experiencing a known, but greater than anticipated pause in orders from their customers, which has created a larger than estimated decline in near term earnings. In both cases, we expect the pause in orders to be temporary and both are attractively valued on their more normalized earnings power. The Fund’s underweight position and relative underperformance by the Fund’s holdings in the Energy sector were also detractors through the period. Another disappointment in the last two quarters came from the Materials sector, where the Fund’s holdings could not keep pace with the Index constituents primarily due to a lack of steel exposure. Please refer to the U.S. Value Market Review and Outlook relating to the Fund on page 4. |
| June 30, 2023 | William Blair Funds | 25 |
Small Cap Value Fund
Performance Highlights (Unaudited)
| Average Annual Total Returns through 6/30/2023 |
| | | Year to
Date | | 1 Year | | 3 Year | | 5 Year | | 10 Year | | Since
Inception(a) |
| Class N | | | 1.91 | % | | | 6.74 | % | | | — | % | | | — | % | | | — | % | | | (0.98 | )% |
| Class I | | | 2.02 | | | | 6.99 | | | | 15.86 | | | | 4.08 | | | | 8.83 | | | | — | |
| Class R6 | | | 2.09 | | | | 7.06 | | | | — | | | | — | | | | — | | | | (0.63 | ) |
| Russell 2000® Value Index | | | 2.50 | | | | 6.01 | | | | 15.43 | | | | 3.54 | | | | 7.29 | | | | (3.05 | ) |
| | |
| (a) | Since inception is for the period from July 17, 2021 (Commencement of Operations) to June 30, 2023. |
Performance cited represents past performance. Past performance does not guarantee future results and current performance may be lower or higher than the data quoted. Results shown are average annual total returns, which assume reinvestment of dividends and capital gains. Investment returns and principal will fluctuate and you may have a gain or loss when you sell shares. For the most current month-end performance information, please call 1-800-742-7272, or visit our Web site at www.williamblairfunds.com. Investing in smaller companies involves special risks, including higher volatility and lower liquidity. Smaller capitalization stocks are also more sensitive to purchase/sale transactions and changes in the issuer’s financial condition. From time to time, the investment adviser may waive fees or reimburse expenses for the Fund. Without these waivers/reimbursements, performance would be lower. Class N shares are not subject to a sales load. Class I shares are not subject to a sales load or distribution (Rule 12b-1) fees. Class R6 shares are not subject to a sales load, distribution (Rule 12b-1) fees, or sub-transfer agent fees.
The performance highlights and graph presented above do not reflect the deduction of taxes that a shareholder would pay on fund distributions or the redemption of fund shares.
The Russell 2000® Value Index consists of small-capitalization companies with below average price-to-book ratios and forecasted growth rates.
This report identifies the Fund’s investments on June 30, 2023. These holdings are subject to change. Not all stocks in the Fund performed the same, nor is there any guarantee that these stocks will perform as well in the future. Market forecasts provided in this report may not necessarily come to pass.
Sector Diversification (Unaudited)
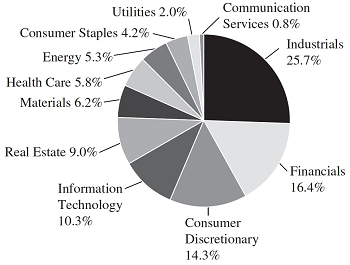
The sector diversification shown is based on the total long-term securities.
| 26 | Semiannual Report | June 30, 2023 |
Small Cap Value Fund
Portfolio of Investments, June 30, 2023 (all dollar amounts in thousands) (unaudited)
| | | | | | | | |
| | | | | | | | |
| | Issuer | | Shares | | | Value | |
| | | | | | | | |
| | Common Stocks | | | | | | | | |
| | Industrials—25.3% | | | | | | | | |
| | ABM Industries, Inc. | | | 328,548 | | | $ | 14,013 | |
| | Albany International Corp. | | | 153,153 | | | | 14,286 | |
| | Armstrong World Industries, Inc. | | | 179,637 | | | | 13,196 | |
| | Astec Industries, Inc. | | | 120,592 | | | | 5,480 | |
| | Brady Corp. | | | 273,916 | | | | 13,030 | |
| * | CBIZ, Inc. | | | 273,412 | | | | 14,567 | |
| * | Conduent, Inc. | | | 2,559,628 | | | | 8,703 | |
| | CSG Systems International, Inc. | | | 247,686 | | | | 13,063 | |
| | Deluxe Corp. | | | 516,501 | | | | 9,028 | |
| | Federal Signal Corp. | | | 175,151 | | | | 11,215 | |
| | GrafTech International Ltd. | | | 1,815,113 | | | | 9,148 | |
| | Granite Construction, Inc. | | | 416,785 | | | | 16,580 | |
| * | Great Lakes Dredge & Dock Corp. | | | 978,865 | | | | 7,987 | |
| | Hillenbrand, Inc. | | | 318,422 | | | | 16,329 | |
| * | Hub Group, Inc. | | | 167,537 | | | | 13,457 | |
| | Korn Ferry | | | 62,865 | | | | 3,114 | |
| | Marten Transport Ltd. | | | 604,073 | | | | 12,988 | |
| | Maximus, Inc. | | | 175,466 | | | | 14,829 | |
| | MillerKnoll, Inc. | | | 449,355 | | | | 6,641 | |
| | Mueller Water Products, Inc. | | | 601,464 | | | | 9,762 | |
| * | OPENLANE, Inc. | | | 606,395 | | | | 9,229 | |
| * | PGT Innovations, Inc. | | | 643,518 | | | | 18,759 | |
| * | SP Plus Corp. | | | 348,205 | | | | 13,618 | |
| | Tennant Co. | | | 59,902 | | | | 4,859 | |
| | Terex Corp. | | | 279,930 | | | | 16,748 | |
| * | Thermon Group Holdings, Inc. | | | 284,604 | | | | 7,570 | |
| * | Titan Machinery, Inc. | | | 168,498 | | | | 4,971 | |
| | Werner Enterprises, Inc. | | | 297,757 | | | | 13,155 | |
| | | | | | | | | 316,325 | |
| | Financials—16.0% | | | | | | | | |
| | Ameris Bancorp | | | 316,753 | | | | 10,836 | |
| | Atlantic Union Bankshares Corp. | | | 276,628 | | | | 7,178 | |
| | Banc of California, Inc. | | | 726,391 | | | | 8,412 | |
| | Brightsphere Investment Group, Inc. | | | 481,521 | | | | 10,088 | |
| | Compass Diversified Holdings | | | 688,674 | | | | 14,937 | |
| | Eastern Bankshares, Inc. | | | 747,643 | | | | 9,174 | |
| | Enterprise Financial Services Corp. | | | 280,191 | | | | 10,955 | |
| | First Bancorp | | | 273,165 | | | | 8,127 | |
| | First Merchants Corp. | | | 331,182 | | | | 9,349 | |
| | Hancock Whitney Corp. | | | 240,042 | | | | 9,213 | |
| | MGIC Investment Corp. | | | 941,332 | | | | 14,864 | |
| | Old National Bancorp | | | 834,882 | | | | 11,638 | |
| | Pacific Premier Bancorp, Inc. | | | 337,214 | | | | 6,974 | |
| | Pinnacle Financial Partners, Inc. | | | 228,961 | | | | 12,971 | |
| * | PRA Group, Inc. | | | 425,235 | | | | 9,717 | |
| | Seacoast Banking Corp. of Florida | | | 377,921 | | | | 8,352 | |
| | Simmons First National Corp. | | | 520,673 | | | | 8,982 | |
| * | Texas Capital Bancshares, Inc. | | | 253,428 | | | | 13,051 | |
| | Veritex Holdings, Inc. | | | 317,639 | | | | 5,695 | |
| | Washington Federal, Inc. | | | 375,170 | | | | 9,949 | |
| | | | | | | | | 200,462 | |
| | | | | | | | |
| | | | | | | | |
| | Issuer | | Shares | | | Value | |
| | | | | | | | | | |
| | Common Stocks—(continued) | | | | | | | | |
| | Consumer Discretionary—14.1% | | | | | | | | |
| * | Adient PLC† | | | 272,611 | | | $ | 10,446 | |
| | Bloomin’ Brands, Inc. | | | 633,084 | | | | 17,024 | |
| | Carter’s, Inc. | | | 215,750 | | | | 15,663 | |
| | Cracker Barrel Old Country Store, Inc. | | | 123,064 | | | | 11,467 | |
| | Designer Brands, Inc. | | | 1,048,825 | | | | 10,593 | |
| | El Pollo Loco Holdings, Inc. | | | 567,223 | | | | 4,975 | |
| | La-Z-Boy, Inc. | | | 486,376 | | | | 13,930 | |
| | Oxford Industries, Inc. | | | 95,465 | | | | 9,396 | |
| | Standard Motor Products, Inc. | | | 376,599 | | | | 14,130 | |
| | Steven Madden Ltd. | | | 363,196 | | | | 11,873 | |
| * | Taylor Morrison Home Corp. | | | 310,818 | | | | 15,159 | |
| * | Tri Pointe Homes, Inc. | | | 455,635 | | | | 14,972 | |
| * | Universal Electronics, Inc. | | | 213,215 | | | | 2,051 | |
| * | Urban Outfitters, Inc. | | | 320,383 | | | | 10,614 | |
| | Winnebago Industries, Inc. | | | 199,047 | | | | 13,274 | |
| | | | | | | | | 175,567 | |
| | Information Technology—10.1% | | | | | | | | |
| | ADTRAN Holdings, Inc. | | | 569,056 | | | | 5,992 | |
| | AudioCodes Ltd.† | | | 560,373 | | | | 5,116 | |
| | Belden, Inc. | | | 153,483 | | | | 14,681 | |
| * | Cognyte Software Ltd.† | | | 1,106,118 | | | | 6,736 | |
| * | Knowles Corp. | | | 898,243 | | | | 16,222 | |
| | Kulicke & Soffa Industries, Inc. | | | 285,009 | | | | 16,944 | |
| | Methode Electronics, Inc. | | | 378,361 | | | | 12,683 | |
| * | NetScout Systems, Inc. | | | 449,994 | | | | 13,928 | |
| * | Plexus Corp. | | | 89,190 | | | | 8,762 | |
| | Progress Software Corp. | | | 218,160 | | | | 12,675 | |
| * | Verint Systems, Inc. | | | 344,901 | | | | 12,092 | |
| | | | | | | | | 125,831 | |
| | Real Estate—8.9% | | | | | | | | |
| | Brandywine Realty Trust | | | 642,784 | | | | 2,989 | |
| | CareTrust REIT, Inc. | | | 625,875 | | | | 12,430 | |
| | Elme Communities | | | 665,097 | | | | 10,934 | |
| | Empire State Realty Trust, Inc. | | | 1,500,806 | | | | 11,241 | |
| | Four Corners Property Trust, Inc. | | | 442,577 | | | | 11,241 | |
| | Kite Realty Group Trust | | | 782,128 | | | | 17,473 | |
| | Pebblebrook Hotel Trust | | | 580,222 | | | | 8,088 | |
| | STAG Industrial, Inc. | | | 377,337 | | | | 13,539 | |
| | Sunstone Hotel Investors, Inc. | | | 963,025 | | | | 9,746 | |
| | UMH Properties, Inc. | | | 804,335 | | | | 12,853 | |
| | | | | | | | | 110,534 | |
| | Materials—6.1% | | | | | | | | |
| * | Ecovyst, Inc. | | | 1,170,918 | | | | 13,419 | |
| | Greif, Inc. | | | 182,766 | | | | 12,591 | |
| | Kaiser Aluminum Corp. | | | 170,180 | | | | 12,191 | |
| | Minerals Technologies, Inc. | | | 220,866 | | | | 12,742 | |
| | Myers Industries, Inc. | | | 647,752 | | | | 12,586 | |
| | Orion SA† | | | 577,893 | | | | 12,263 | |
| | | | | | | | | 75,792 | |
See accompanying Notes to Financial Statements.
| June 30, 2023 | William Blair Funds | 27 |
Small Cap Value Fund
Portfolio of Investments, June 30, 2023 (all dollar amounts in thousands) (unaudited)
| | Issuer | | Shares or
Principal
Amount | | | Value | |
| | | | | | | | |
| | Common Stocks—(continued) | | | | | | | | |
| | Health Care—5.6% | | | | | | | | |
| * | ANI Pharmaceuticals, Inc. | | | 196,404 | | | $ | 10,572 | |
| * | Integer Holdings Corp. | | | 221,414 | | | | 19,620 | |
| * | Lantheus Holdings, Inc. | | | 118,006 | | | | 9,903 | |
| * | ModivCare, Inc. | | | 103,295 | | | | 4,670 | |
| * | NextGen Healthcare, Inc. | | | 716,960 | | | | 11,629 | |
| * | NuVasive, Inc. | | | 176,249 | | | | 7,330 | |
| * | Owens & Minor, Inc. | | | 354,592 | | | | 6,752 | |
| | | | | | | | | 70,476 | |
| | Energy—5.2% | | | | | | | | |
| * | Dril-Quip, Inc. | | | 456,934 | | | | 10,633 | |
| * | Earthstone Energy, Inc. | | | 923,271 | | | | 13,193 | |
| * | Expro Group Holdings NV† | | | 710,441 | | | | 12,589 | |
| | PBF Energy, Inc. | | | 383,351 | | | | 15,694 | |
| | SM Energy Co. | | | 404,101 | | | | 12,782 | |
| | | | | | | | | 64,891 | |
| | Consumer Staples—4.1% | | | | | | | | |
| * | Central Garden & Pet Co. | | | 310,802 | | | | 11,332 | |
| | Edgewell Personal Care Co. | | | 244,042 | | | | 10,081 | |
| | Spectrum Brands Holdings, Inc. | | | 108,734 | | | | 8,487 | |
| * | Sprouts Farmers Market, Inc. | | | 203,569 | | | | 7,477 | |
| * | TreeHouse Foods, Inc. | | | 246,083 | | | | 12,398 | |
| * | United Natural Foods, Inc. | | | 81,342 | | | | 1,590 | |
| | | | | | | | | 51,365 | |
| | Utilities—1.9% | | | | | | | | |
| | NorthWestern Corp. | | | 221,163 | | | | 12,553 | |
| | Spire, Inc. | | | 184,349 | | | | 11,695 | |
| | | | | | | | | 24,248 | |
| | Communication Services—0.8% | | | | | | | | |
| | John Wiley & Sons, Inc. | | | 289,226 | | | | 9,843 | |
| | Total Common Stocks—98.1%
(cost $1,214,908) | | | | | | | 1,225,334 | |
| | | | | | | | | | |
| | Repurchase Agreement | | | | | | | | |
| | Fixed Income Clearing Corporation, 2.100% dated 06/30/23, due 07/03/23, repurchase price $24,063, collateralized by U.S. Treasury Note, 1.375%, due 11/15/31, valued at $24,540 | | | $24,059 | | | | 24,059 | |
| | Total Repurchase Agreement—1.9%
(cost $24,059) | | | | | | | 24,059 | |
| | Total Investments—100.0%
(cost $1,238,967) | | | | | | | 1,249,393 | |
| | Cash and other assets, less liabilities—0.0% | | | | | | | 530 | |
| | Net assets—100.0% | | | | | | $ | 1,249,923 | |
REIT = Real Estate Investment Trust
* = Non-income producing security
† = U.S. listed foreign security
See accompanying Notes to Financial Statements.
| 28 | Semiannual Report | June 30, 2023 |
Global Markets Review and Outlook
Global equities continued to advance in the second quarter of 2023 (the MSCI ACWI IMI Index (“MSCI ACWI IMI”) returned +5.89% for the second quarter and +13.25% year-to-date in USD terms), as the global economy proved to be more resilient than anticipated on easing inflationary pressures and better-than-feared corporate earnings results. From a global sector perspective, leading outperformance was Information Technology (+13.21% for the second quarter and +35.81% year-to-date, as measured by the MSCI ACWI IMI) and Consumer Discretionary (+7.62% for the second quarter and +22.05% year-to-date, as measured by the MSCI ACWI IMI). Information Technology continued its ascent on enthusiasm around artificial intelligence. Alternatively, Materials (-0.71% for the second quarter and +5.09% year-to-date, as measured by the MSCI ACWI IMI) and Real Estate (-0.20% for the second quarter and -0.08% year-to-date, as measured by the MSCI ACWI IMI) lagged during the period. Growth equities outperformed value-oriented equities (the MSCI ACWI IMI Growth returned +8.67% for the second quarter and +22.74% year to date, while the MSCI ACWI IMI Value returned +2.95% for the second quarter and +4.29% year-to-date).
U.S. equities advanced during the period (+8.26% for the second quarter and +16.07% year-to-date, as measured by the MSCI USA IMI) with gains driven primarily by a handful of large capitalized technology stocks, however, the breadth of performance broadened in June with small capitalized companies outperforming. Inflationary pressures continued to ease during the six month period; the personal consumption expenditures (PCE) index was relatively benign, showing an increase of 0.1% in May and 3.8% year-over-year. While the U.S. Federal Reserve paused its rate hiking cycle in June, Federal Reserve Chair Jerome Powell signaled that rates could still be increased further if inflation remains at high levels. Regional banking stress also seemed to subside. The Federal Reserve conducted its annual stress test, which resulted in all the included U.S. banks clearing the stress test hurdle.
European equities gained for the second quarter (+2.46% for the second quarter and +12.95% year-to-date, as measured by the MSCI Europe IMI). The European Central Bank raised the deposit rate by 0.25% to 3.5% in June, with signals of a future hike. The Eurozone’s annual inflation rate continued to slow in June to 5.5%, primarily driven by sharp declines in energy prices, which are down nearly 50% from their peak last year. U.K. equities advanced (+2.08% for the second quarter and +8.09% year-to-date, as measured by the MSCI United Kingdom IMI) despite consumer price inflation holding steady at 8.7%, unchanged from last month. The Bank of England hiked interest rates by 0.50% to 5%, taking the base rate to the highest level since 2008.
Emerging markets posted positive returns (+1.62% for the second quarter and +5.62% year-to-date, as measured by the MSCI EM IMI), lagging developed markets primarily from weakness in China. Chinese equities declined (-9.89% for the second quarter and -6.00% year-to-date, as measured by the MSCI China IMI index) on slower-than-expected consumption recovery driven by low consumer confidence, continuously high youth unemployment, and the reduced wealth effect stemming from the weak property market. Latin America returns gained (+14.80% for the second quarter and +19.52% year-to-date, as measured by the MSCI EM Latin America IMI), with notable strength from Argentina (+35.72% for the second quarter and +42.15% year-to-date, as measured by MSCI Argentina), Brazil (+21.85% for the second quarter and +18.26% year-to-date, as measured by MSCI Brazil IMI), and Mexico’s continued outperformance (+5.39% for the second quarter and +26.96% year-to-date as measured by MSCI Mexico IMI). EMEA outperformed (+3.12% for the second quarter and +1.91% year-to-date, as measured by the MSCI EM EMEA IMI), led by Poland (+23.47% for the second quarter and +23.80% year-to-date, as measured by MSCI Poland IMI).
| June 30, 2023 | William Blair Funds | 29 |
| | Global Leaders Fund |
| | |
| | The Global Leaders Fund seeks long-term capital appreciation. |
| | |
| | AN OVERVIEW FROM THE PORTFOLIO MANAGERS |
| | |

Kenneth J. McAtamney 
Hugo Scott-Gall | The William Blair Global Leaders Fund (Class N shares) (the “Fund”) posted an 18.50% increase, net of fees, for the six months ended June 30, 2023. By comparison, the Fund’s benchmark index, the MSCI All Country World IMI (net) (the “Index”), increased 13.25%. Over the six month period, outperformance versus the Index was largely driven by a combination of positive allocation and stock selection effects across most sectors. Selection was particularly positive within Industrials, Communication Services, and Health Care sectors. In addition, Information Technology overweighting, as well as Financials and Consumer Staples underweighting, also aided relative performance. Partially offsetting this was negative selection within Information Technology and to a lesser extent Financials and Consumer Staples. Within Industrials, Watsco was bolstered by strong performance in the second quarter, and DSV was also a notable contributor to relative performance. DSV, one of the world’s largest freight companies, has an asset-light business model, which has allowed the firm to generate high levels of return on invested capital with minimal ongoing capital expenditures, which in turn has powered market share gains and rising free cash flow. The stock was buoyed by a dividend increase and an announcement of a new share buyback program, leading to a significant increase in the stock price during the first quarter. Communication Services performance was bolstered by Meta Platforms, Inc. as the stock rallied significantly in the first half of the year on recovering fundamental performance and improved sentiment. Intuitive Surgical (“Intuitive”) was a notable contributor to the Health Care sector’s relative performance. Intuitive is the dominant world leader in the robotic surgery market, with high barriers to entry as the company has built the da Vinci Surgical System over 25 years with billions of dollars in research and development. The global surgery market remains significantly underpenetrated, providing a long runway of growth. The stock performance was fueled by Intuitive’s strong operating performance across geographies and products, with sales and earnings exceeding consensus expectations in the recent quarter driven by robust growth in procedures, and management increased guidance for the full year. Selection was negative within Information Technology, partly driven by an underweight to large-capitalization tech hardware names, and by exposure to Enphase Energy (“Enphase”). The stock traded down following very strong performance in 2022 amid investor concerns about the residential housing market, interest rates and inflation, which could impact demand for Enphase. While this may lead to very near-term cyclical growth dampening, we do not view it as a structural change to what is a tailwind environment for sustainable energy. Silicon Valley Bank (“SVB”) dragged down the Financials sector’s relative performance after the bank announced in March that it had sold most of its available-for-sale (AFS) securities portfolio at a loss and attempted to raise capital through an equity offering, which led to a liquidity crisis and SVB was ultimately taken over by U.S. regulators. Estée Lauder, the leading global prestige cosmetics company, hampered relative performance within Consumer Staples. The stock underperformed after the company delivered weak results and lowered its guidance due to slower-than-expected recovery in Chinese mobility and consumption coupled with margin pressure from China inventory build-up. Please refer to the Global Markets Review and Outlook relating to the Fund on page 29. |
| | |
| 30 | Semiannual Report | June 30, 2023 |
Global Leaders Fund
Performance Highlights (Unaudited)
Average Annual Total Returns through 6/30/2023
| | | Year to
Date | | 1 Year | | 3 Year | | 5 Year | | 10 Year |
| Class N | | | 18.50 | % | | | 21.07 | % | | | 7.81 | % | | | 7.78 | % | | | 9.55 | % |
| Class I | | | 18.58 | | | | 21.30 | | | | 8.06 | | | | 8.04 | | | | 9.85 | |
| Class R6 | | | 18.73 | | | | 21.34 | | | | 8.12 | | | | 8.09 | | | | 9.93 | |
| MSCI ACW IMI (net) | | | 13.25 | | | | 16.14 | | | | 10.97 | | | | 7.65 | | | | 8.62 | |
Performance cited represents past performance. Past performance does not guarantee future results and current performance may be lower or higher than the data quoted. Results shown are average annual total returns, which assume reinvestment of dividends and capital gains. Investment returns and principal will fluctuate and you may have a gain or loss when you sell shares. For the most current month-end performance information, please call 1-800-742-7272, or visit our Web site at www.williamblairfunds.com. Investing in smaller and medium capitalization companies involves special risks, including higher volatility and lower liquidity. Smaller and medium capitalization stocks are also more sensitive to purchase/sale transactions and changes in the issuer’s financial condition. International investing involves special risk considerations, including currency fluctuations, lower liquidity, economic and political risk. From time to time, the investment adviser may waive fees or reimburse expenses for the Fund. Without these waivers/reimbursements, performance would be lower. Class N shares are not subject to a sales load. Class I shares are not subject to a sales load or distribution (Rule 12b-1) fees. Class R6 shares are not subject to a sales load, distribution (Rule 12b-1) fees, or sub-transfer agent fees.
The performance highlights and graph presented above do not reflect the deduction of taxes that a shareholder would pay on fund distributions or the redemption of fund shares.
The Morgan Stanley Capital International (MSCI) All Country World (ACW) Investable Market Index (IMI) (net) is a free float-adjusted market capitalization weighted index that is designed to measure the equity market of developed and emerging markets. This index approximates the minimum possible dividend reinvestment by deducting for the highest possible withholding tax rates of those markets.
This report identifies the Fund’s investments on June 30, 2023. These holdings are subject to change. Not all stocks in the Fund performed the same, nor is there any guarantee that these stocks will perform as well in the future. Market forecasts provided in this report may not necessarily come to pass.
Sector Diversification (Unaudited)
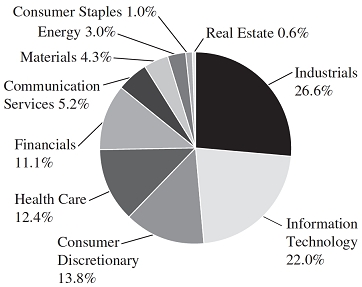
The sector diversification shown is based on the total long-term securities.
| June 30, 2023 | William Blair Funds | 31 |
Global Leaders Fund
Portfolio of Investments, June 30, 2023 (all dollar amounts in thousands) (unaudited)
| | | | | | | | |
| | | | | | | | |
| | Issuer | | Shares | | | Value | |
| | | | | | | | | | |
| | Common Stocks | | | | | | | | |
| | | | | | | | | | |
| | Western Hemisphere—48.9% | | | | | | | | |
| | Canada—2.8% | | | | | | | | |
| | Canadian Pacific Kansas City Ltd. (Ground transportation) | | | 27,919 | | | $ | 2,255 | |
| * | Lululemon Athletica, Inc. (Textiles, apparel & luxury goods) | | | 1,964 | | | | 743 | |
| | | | | | | | | 2,998 | |
| | United States—46.1% | | | | | | | | |
| * | Alphabet, Inc. (Interactive media & services) | | | 26,875 | | | | 3,217 | |
| * | Amazon.com, Inc. (Broadline retail) | | | 20,769 | | | | 2,707 | |
| * | Autodesk, Inc. (Software) | | | 6,005 | | | | 1,229 | |
| | Booz Allen Hamilton Holding Corp. (Professional services) | | | 12,341 | | | | 1,377 | |
| | Chevron Corp. (Oil, gas & consumable fuels) | | | 10,052 | | | | 1,582 | |
| | Crown Holdings, Inc. (Containers & packaging) | | | 14,847 | | | | 1,290 | |
| * | Enphase Energy, Inc. (Semiconductors & semiconductor equipment) | | | 2,196 | | | | 368 | |
| | Estee Lauder Cos., Inc. (Personal care products) | | | 5,017 | | | | 985 | |
| * | IDEXX Laboratories, Inc. (Health care equipment & supplies) | | | 2,679 | | | | 1,345 | |
| * | Inspire Medical Systems, Inc. (Health care equipment & supplies) | | | 1,649 | | | | 535 | |
| | Intercontinental Exchange, Inc. (Capital markets) | | | 12,538 | | | | 1,418 | |
| * | Intuitive Surgical, Inc. (Health care equipment & supplies) | | | 4,172 | | | | 1,427 | |
| | Mastercard, Inc. (Financial services) | | | 8,744 | | | | 3,439 | |
| * | Meta Platforms, Inc. (Interactive media & services) | | | 7,369 | | | | 2,115 | |
| | Microsoft Corp. (Software) | | | 16,870 | | | | 5,745 | |
| | NIKE, Inc. (Textiles, apparel & luxury goods) | | | 16,852 | | | | 1,860 | |
| | Old Dominion Freight Line, Inc. (Ground transportation) | | | 4,743 | | | | 1,754 | |
| | Prologis, Inc. (Industrial REITs) | | | 5,377 | | | | 659 | |
| | Roper Technologies, Inc. (Software) | | | 2,276 | | | | 1,094 | |
| * | Salesforce, Inc. (Software) | | | 6,162 | | | | 1,302 | |
| * | Synopsys, Inc. (Software) | | | 5,550 | | | | 2,417 | |
| | Thermo Fisher Scientific, Inc. (Life sciences tools & services) | | | 3,272 | | | | 1,707 | |
| * | Ulta Beauty, Inc. (Specialty retail) | | | 2,883 | | | | 1,357 | |
| | UnitedHealth Group, Inc. (Health care providers & services) | | | 4,099 | | | | 1,970 | |
| | Vulcan Materials Co. (Construction materials) | | | 6,191 | | | | 1,396 | |
| | Watsco, Inc. (Trading companies & distributors) | | | 3,160 | | | | 1,205 | |
| * | Workday, Inc. (Software) | | | 6,561 | | | | 1,482 | |
| | Zoetis, Inc. (Pharmaceuticals) | | | 7,481 | | | | 1,288 | |
| | | | | | | | | 48,270 | |
| | | | | | | | |
| | | | | | | | |
| | Issuer | | Shares | | | Value | |
| | | | | | | | | | |
| | Common Stocks—(continued) | | | | | | | | |
| | | | | | | | | | |
| | Europe—30.1% | | | | | | | | |
| | Denmark—4.1% | | | | | | | | |
| | DSV AS (Air freight & logistics) | | | 10,361 | | | $ | 2,176 | |
| | Novo Nordisk AS (Pharmaceuticals) | | | 13,013 | | | | 2,097 | |
| | | | | | | | | 4,273 | |
| | France—6.6% | | | | | | | | |
| | Airbus SE (Aerospace & defense) | | | 22,060 | | | | 3,186 | |
| | Hermes International (Textiles, apparel & luxury goods) | | | 269 | | | | 584 | |
| | LVMH Moet Hennessy Louis Vuitton SE (Textiles, apparel & luxury goods) | | | 2,562 | | | | 2,413 | |
| | Vinci SA (Construction & engineering) | | | 6,735 | | | | 782 | |
| | | | | | | | | 6,965 | |
| | Germany—3.7% | | | | | | | | |
| | Infineon Technologies AG (Semiconductors & semiconductor equipment) | | | 37,269 | | | | 1,537 | |
| | MTU Aero Engines AG (Aerospace & defense) | | | 9,097 | | | | 2,356 | |
| | | | | | | | | 3,893 | |
| | Ireland—4.1% | | | | | | | | |
| | Linde PLC (Chemicals)† | | | 4,500 | | | | 1,715 | |
| * | Ryanair Holdings PLC—ADR (Passenger airlines) | | | 11,708 | | | | 1,295 | |
| | Trane Technologies PLC (Building products)† | | | 6,998 | | | | 1,338 | |
| | | | | | | | | 4,348 | |
| | Italy—0.6% | | | | | | | | |
| | Ferrari NV (Automobiles)† | | | 1,866 | | | | 607 | |
| | Netherlands—2.5% | | | | | | | | |
| * | Adyen NV (Financial services) | | | 886 | | | | 1,533 | |
| | ASML Holding NV (Semiconductors & semiconductor equipment) | | | 1,470 | | | | 1,064 | |
| | | | | | | | | 2,597 | |
| | Sweden—5.6% | | | | | | | | |
| | Atlas Copco AB (Machinery) | | | 136,065 | | | | 1,960 | |
| | Evolution AB (Hotels, restaurants & leisure) | | | 8,244 | | | | 1,044 | |
| | Hexagon AB (Electronic equipment, instruments & components) | | | 165,479 | | | | 2,037 | |
| | Indutrade AB (Machinery) | | | 35,215 | | | | 793 | |
| | | | | | | | | 5,834 | |
| | Switzerland—2.9% | | | | | | | | |
| | Lonza Group AG (Life sciences tools & services) | | | 2,357 | | | | 1,405 | |
| | Partners Group Holding AG (Capital markets) | | | 854 | | | | 803 | |
| | Zurich Insurance Group AG (Insurance) | | | 1,800 | | | | 854 | |
| | | | | | | | | 3,062 | |
See accompanying Notes to Financial Statements.
| 32 | Semiannual Report | June 30, 2023 |
Global Leaders Fund
Portfolio of Investments, June 30, 2023 (all dollar amounts in thousands) (unaudited)
| | | | | | | | |
| | | | | | | | |
| | Issuer | | Shares | | | Value | |
| | | | | | | | | | |
| | Common Stocks—(continued) | | | | | | | | |
| | | | | | | | | | |
| | United Kingdom—8.4% | | | | | | | | |
| | Ashtead Group PLC (Trading companies & distributors) | | | 21,278 | | | $ | 1,471 | |
| | Compass Group PLC (Hotels, restaurants & leisure) | | | 75,147 | | | | 2,102 | |
| | Experian PLC (Professional services) | | | 34,892 | | | | 1,337 | |
| | Halma PLC (Electronic equipment, instruments & components) | | | 44,813 | | | | 1,296 | |
| | Rentokil Initial PLC (Commercial services & supplies) | | | 213,210 | | | | 1,665 | |
| | Spirax-Sarco Engineering PLC (Machinery) | | | 6,722 | | | | 885 | |
| | | | | | | | | 8,756 | |
| | | | | | | | | | |
| | Emerging Asia—4.9% | | | | | | | | |
| | India—3.3% | | | | | | | | |
| | HDFC Bank Ltd.—ADR (Banks) | | | 27,608 | | | | 1,924 | |
| | Reliance Industries Ltd. (Oil, gas & consumable fuels) | | | 49,715 | | | | 1,548 | |
| | | | | | | | | 3,472 | |
| | Taiwan—1.6% | | | | | | | | |
| | Taiwan Semiconductor Manufacturing Co. Ltd.—ADR (Semiconductors & semiconductor equipment) | | | 16,315 | | | | 1,646 | |
| | | | | | | | | | |
| | Japan—2.6% | | | | | | | | |
| | Daikin Industries Ltd. (Building products) | | | 6,700 | | | | 1,359 | |
| | Keyence Corp. (Electronic equipment, instruments & components) | | | 2,900 | | | | 1,363 | |
| | | | | | | | | 2,722 | |
| | | | | | | | | | |
| | Asia—2.3% | | | | | | | | |
| | Australia—0.9% | | | | | | | | |
| | CSL Ltd. (Biotechnology) | | | 5,392 | | | | 996 | |
| | Hong Kong—1.4% | | | | | | | | |
| | AIA Group Ltd. (Insurance) | | | 142,200 | | | | 1,436 | |
| | | | | | | | | | |
| | Emerging Latin America—0.8% | | | | | | | | |
| | Brazil—0.8% | | | | | | | | |
| * | MercadoLibre, Inc. (Broadline retail) | | | 672 | | | | 796 | |
| | Total Common Stocks—98.0%
(cost $63,844) | | | | | | | 102,671 | |
| | | | | | | | |
| | Issuer | | Principal
Amount | | | Value | |
| | | | | | | | | | |
| | Repurchase Agreement | | | | | | | | |
| | Fixed Income Clearing Corporation, 2.100% dated 06/30/23, due 07/03/23, repurchase price $2,004, collateralized by U.S. Treasury Note, 1.375%, due 11/15/31, valued at $2,044 | | | $2,004 | | | $ | 2,004 | |
| | Total Repurchase Agreement—1.9%
(cost $2,004) | | | | | | | 2,004 | |
| | Total Investments—99.9%
(cost $65,848) | | | | | | | 104,675 | |
| | Cash and other assets, less liabilities—0.1% | | | | | | | 59 | |
| | Net assets—100.0% | | | | | | $ | 104,734 | |
ADR = American Depository Receipt
REIT = Real Estate Investment Trust
* = Non-income producing security
† = U.S. listed foreign security
At June 30, 2023, the Fund’s Portfolio of Investments includes the following industry categories (as a percentage of long-term investments):
| Industrials | | | 26.6 | % |
| Information Technology | | | 22.0 | % |
| Consumer Discretionary | | | 13.8 | % |
| Health Care | | | 12.4 | % |
| Financials | | | 11.1 | % |
| Communication Services | | | 5.2 | % |
| Materials | | | 4.3 | % |
| Energy | | | 3.0 | % |
| Consumer Staples | | | 1.0 | % |
| Real Estate | | | 0.6 | % |
| Total | | | 100.0 | % |
At June 30, 2023, the Fund’s Portfolio of Investments includes the following currency categories (as a percentage of long-term investments):
| U.S. Dollar | | | 59.0 | % |
| Euro | | | 13.1 | % |
| British Pound Sterling | | | 8.5 | % |
| Swedish Krona | | | 5.7 | % |
| Danish Krone | | | 4.2 | % |
| Swiss Franc | | | 3.0 | % |
| Japanese Yen | | | 2.6 | % |
| Indian Rupee | | | 1.5 | % |
| Hong Kong Dollar | | | 1.4 | % |
| All Other Currencies | | | 1.0 | % |
| Total | | | 100.0 | % |
See accompanying Notes to Financial Statements.
| June 30, 2023 | William Blair Funds | 33 |
| | International Leaders Fund |
| | |
| | The International Leaders Fund seeks long-term capital appreciation. |
| | |
| | AN OVERVIEW FROM THE PORTFOLIO MANAGERS |
| | |

Simon Fennell 
Kenneth J. McAtamney 
Alaina Anderson, CFA | The William Blair International Leaders Fund (Class N shares) (the “Fund”) posted an 11.40% increase, net of fees, for the six months ended June 30, 2023. By comparison, the Fund’s benchmark index, the MSCI All Country World ex-U.S. IMI (net) (the “Index”), increased 9.10%. Outperformance versus the Index was driven by both allocation and selection effects. Positive allocation effect was driven by overweights in the Industrials and Information Technology sectors and an underweight in the Real Estate sector. Positive security selection was primarily driven by Health Care and Materials, but was partially offset by negative selection within Energy and Information Technology. Selection within the Health Care sector was bolstered by Straumann, a global leader in aesthetic dentistry. The company’s first quarter results were in line with consensus estimates and management reiterated its full-year outlook. Patient flow remained good in most countries (China being the exception) while clinicians and patients do not appear to be down-trading despite the inflationary environment. We believe Straumann can grow its top line in the low double digits over the long term driven by continued market share gains and total addressable market expansion. Materials sector security selection was also positive, due in part to not owning stocks within the metals and mining industry, which have fallen along with the prices of commodities such as aluminum, nickel, silver, and copper. Also contributing was exposure to Shin-Etsu Chemical, a Japanese chemical company that specializes in PVC production and semiconductor wafer manufacturing (the base ingredient for computer chips). The company faces macroeconomic cross currents, with demand for PVC potentially falling as the U.S. and Chinese housing markets face headwinds, but demand for semiconductor wafers increasing along with the semi cycle and boom related to 5G and artificial intelligence demand. The company’s recent results were in line with expectations and included 9.3% sales growth year-over-year and an increase in operating profit. Within Energy, selection was negative due to a position in Tenaris, which manufactures seamless pipe products. Recent results showed weaker-than-anticipated U.S. demand and this is reflected in sequential revenue decline guidance for the rest of the year. Our view is that Tenaris may be past peak profitability and volume growth, and we exited the position as a result. Information Technology selection was also negative, largely driven by Infosys, an Indian company that provides information technology services and consulting to clients globally. Recent earnings have come in below expectations amid softer demand. As a result of lower realized earnings, the company also provided full-year guidance that is below consensus estimates. Please refer to the Global Markets Review and Outlook relating to the Fund on page 29. |
| | | |
| 34 | Annual Report | June 30, 2023 |
International Leaders Fund
Performance Highlights (Unaudited)
Average Annual Total Returns through 6/30/2023
| | | Year to
Date | | 1 Year | | 3 Year | | 5 Year | | 10 Year |
| Class N | | | 11.40 | % | | | 15.41 | % | | | 3.80 | % | | | 4.63 | % | | | 7.08 | % |
| Class I | | | 11.60 | | | | 15.73 | | | | 4.06 | | | | 4.90 | | | | 7.34 | |
| Class R6 | | | 11.65 | | | | 15.85 | | | | 4.12 | | | | 4.96 | | | | 7.43 | |
| MSCI ACW ex-U.S. IMI (net) | | | 9.10 | | | | 12.47 | | | | 7.33 | | | | 3.38 | | | | 4.88 | |
Performance cited represents past performance. Past performance does not guarantee future results and current performance may be lower or higher than the data quoted. Results shown are average annual total returns, which assume reinvestment of dividends and capital gains. Investment returns and principal will fluctuate and you may have a gain or loss when you sell shares. For the most current month-end performance information, please call 1-800-742-7272, or visit our Web site at www.williamblairfunds.com. Investing in smaller and medium capitalization companies involves special risks, including higher volatility and lower liquidity. Smaller and medium capitalization stocks are also more sensitive to purchase/sale transactions and changes in the issuer’s financial condition. International investing involves special risk considerations, including currency fluctuations, lower liquidity, economic and political risk. From time to time the investment adviser may waive fees or reimburse expenses for the Fund. Without these waivers/reimbursements, performance would be lower. Class N shares are not subject to a sales load. Class I shares are not subject to a sales load or distribution (Rule 12b-1) fees. Class R6 shares are not subject to a sales load, distribution (Rule 12b-1) fees, or sub-transfer agent fees.
The performance highlights presented above do not reflect the deduction of taxes that a shareholder would pay on fund distributions or the redemption of fund shares.
The Morgan Stanley Capital International (MSCI) All Country World (ACW) ex-U.S. Investable Market Index (IMI) (net) is a free float-adjusted market capitalization weighted index that is designed to measure the equity market performance of developed and emerging markets, excluding the United States. This index approximates the minimum possible dividend reinvestment by deducting for the highest possible withholding tax rates of those markets.
This report identifies the Fund’s investments on June 30, 2023. These holdings are subject to change. Not all stocks in the Fund performed the same, nor is there any guarantee that these stocks will perform as well in the future. Market forecasts provided in this report may not necessarily come to pass.
Sector Diversification (Unaudited)
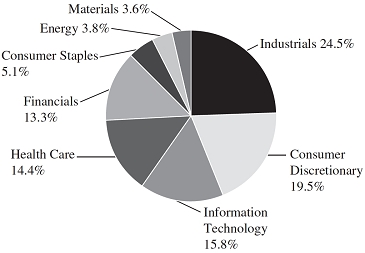
The sector diversification shown is based on the total long-term securities.
| June 30, 2023 | William Blair Funds | 35 |
International Leaders Fund
Portfolio of Investments, June 30, 2023 (all dollar amounts in thousands) (unaudited)
| | | | | | | | |
| | | | | | | | |
| | Issuer | | Shares | | | Value | |
| | | | | | | | |
| | Common Stocks | | | | | | | | |
| | | | | | | | | | |
| | Europe—42.8% | | | | | | | | |
| | Denmark—4.0% | | | | | | | | |
| | DSV AS (Air freight & logistics) | | | 88,806 | | | $ | 18,650 | |
| | Novo Nordisk AS (Pharmaceuticals) | | | 169,529 | | | | 27,314 | |
| | | | | | | | | 45,964 | |
| | France—13.1% | | | | | | | | |
| | Airbus SE (Aerospace & defense) | | | 142,615 | | | | 20,598 | |
| | Dassault Systemes SE (Software) | | | 415,830 | | | | 18,434 | |
| | L’Oreal SA (Personal care products) | | | 47,307 | | | | 22,047 | |
| | LVMH Moet Hennessy Louis Vuitton SE (Textiles, apparel & luxury goods) | | | 33,302 | | | | 31,361 | |
| | Safran SA (Aerospace & defense) | | | 118,623 | | | | 18,570 | |
| | Sartorius Stedim Biotech (Life sciences tools & services) | | | 37,005 | | | | 9,235 | |
| | Vinci SA (Construction & engineering) | | | 248,511 | | | | 28,847 | |
| | | | | | | | | 149,092 | |
| | Germany—1.2% | | | | | | | | |
| | Infineon Technologies AG (Semiconductors & semiconductor equipment) | | | 330,427 | | | | 13,624 | |
| | Ireland—3.3% | | | | | | | | |
| * | ICON PLC (Life sciences tools & services)† | | | 73,539 | | | | 18,400 | |
| | Linde PLC (Chemicals)† | | | 50,678 | | | | 19,312 | |
| | | | | | | | | 37,712 | |
| | Italy—2.6% | | | | | | | | |
| | Ferrari NV (Automobiles)† | | | 49,933 | | | | 16,239 | |
| | Moncler SpA (Textiles, apparel & luxury goods) | | | 188,329 | | | | 13,016 | |
| | | | | | | | | 29,255 | |
| | Netherlands—4.0% | | | | | | | | |
| * | Adyen NV (Financial services) | | | 10,477 | | | | 18,130 | |
| | ASML Holding NV (Semiconductors & semiconductor equipment) | | | 37,286 | | | | 26,975 | |
| | | | | | | | | 45,105 | |
| | Norway—1.1% | | | | | | | | |
| | Equinor ASA (Oil, gas & consumable fuels) | | | 428,685 | | | | 12,465 | |
| | Spain—2.6% | | | | | | | | |
| * | Amadeus IT Group SA (Hotels, restaurants & leisure) | | | 397,492 | | | | 30,232 | |
| | Sweden—5.2% | | | | | | | | |
| | Atlas Copco AB (Machinery) | | | 1,181,951 | | | | 17,030 | |
| | Evolution AB (Hotels, restaurants & leisure) | | | 156,278 | | | | 19,790 | |
| | Hexagon AB (Electronic equipment, instruments & components) | | | 1,404,596 | | | | 17,289 | |
| | Indutrade AB (Machinery) | | | 248,173 | | | | 5,589 | |
| | | | | | | | | 59,698 | |
| | | | | | | | |
| | | | | | | | |
| | Issuer | | Shares | | | Value | |
| | | | | | | | |
| | Common Stocks—(continued) | | | | | | | | |
| | | | | | | | | | |
| | Europe—(continued) | | | | | | | | |
| | Switzerland—5.7% | | | | | | | | |
| | Lonza Group AG (Life sciences tools & services) | | | 38,711 | | | $ | 23,070 | |
| | Partners Group Holding AG (Capital markets) | | | 9,222 | | | | 8,671 | |
| | Straumann Holding AG (Health care equipment & supplies) | | | 103,481 | | | | 16,781 | |
| | Zurich Insurance Group AG (Insurance) | | | 33,561 | | | | 15,932 | |
| | | | | | | | | 64,454 | |
| | | | | | | | | | |
| | United Kingdom—17.8% | | | | | | | | |
| | Ashtead Group PLC (Trading companies & distributors) | | | 254,383 | | | | 17,588 | |
| | AstraZeneca PLC (Pharmaceuticals) | | | 233,195 | | | | 33,395 | |
| | Bunzl PLC (Trading companies & distributors) | | | 569,284 | | | | 21,682 | |
| | Compass Group PLC (Hotels, restaurants & leisure) | | | 981,391 | | | | 27,445 | |
| | Diageo PLC (Beverages) | | | 436,232 | | | | 18,720 | |
| | Experian PLC (Professional services) | | | 463,976 | | | | 17,784 | |
| | Halma PLC (Electronic equipment, instruments & components) | | | 396,388 | | | | 11,463 | |
| | London Stock Exchange Group PLC (Capital markets) | | | 218,606 | | | | 23,226 | |
| | Rentokil Initial PLC (Commercial services & supplies) | | | 2,697,544 | | | | 21,069 | |
| | Spirax-Sarco Engineering PLC (Machinery) | | | 79,472 | | | | 10,461 | |
| | | | | | | | | 202,833 | |
| | | | | | | | | | |
| | Emerging Asia—13.8% | | | | | | | | |
| | China—4.2% | | | | | | | | |
| * | Alibaba Group Holding Ltd. (Broadline retail) | | | 1,971,700 | | | | 20,432 | |
| | Contemporary Amperex Technology Co. Ltd. (Electrical equipment) | | | 395,135 | | | | 12,435 | |
| | Kweichow Moutai Co. Ltd. (Beverages) | | | 65,571 | | | | 15,252 | |
| | | | | | | | | 48,119 | |
| | India—5.7% | | | | | | | | |
| | HDFC Bank Ltd. (Banks) | | | 220,967 | | | | 4,646 | |
| | Housing Development Finance Corp. Ltd. (Financial services) | | | 535,462 | | | | 18,410 | |
| | Infosys Ltd. (IT services) | | | 786,735 | | | | 12,830 | |
| | Reliance Industries Ltd. (Oil, gas & consumable fuels) | | | 944,858 | | | | 29,408 | |
| | | | | | | | | 65,294 | |
| | South Korea—1.2% | | | | | | | | |
| | Samsung SDI Co. Ltd. (Electronic equipment, instruments & components) | | | 26,710 | | | | 13,561 | |
See accompanying Notes to Financial Statements.
| 36 | Semiannual Report | June 30, 2023 |
International Leaders Fund
Portfolio of Investments, June 30, 2023 (all dollar amounts in thousands) (unaudited)
| | | | | | | | |
| | | | | | | | |
| | Issuer | | Shares | | | Value | |
| | | | | | | | |
| | Common Stocks—(continued) | | | | | | | | |
| | | | | | | | | | |
| | Emerging Asia—(continued) | | | | | | | | |
| | Taiwan—2.7% | | | | | | | | |
| | Taiwan Semiconductor Manufacturing Co. Ltd. (Semiconductors & semiconductor equipment) | | | 1,656,000 | | | $ | 30,627 | |
| | | | | | | | | | |
| | Canada—9.5% | | | | | | | | |
| | Canadian Pacific Kansas City Ltd. (Ground transportation) | | | 381,772 | | | | 30,836 | |
| | Dollarama, Inc. (Broadline retail) | | | 366,028 | | | | 24,790 | |
| | Intact Financial Corp. (Insurance) | | | 130,713 | | | | 20,182 | |
| * | Lululemon Athletica, Inc. (Textiles, apparel & luxury goods) | | | 50,534 | | | | 19,127 | |
| | Toronto-Dominion Bank (Banks) | | | 215,136 | | | | 13,334 | |
| | | | | | | | | 108,269 | |
| | | | | | | | | | |
| | Japan—7.0% | | | | | | | | |
| | Daikin Industries Ltd. (Building products) | | | 97,200 | | | | 19,714 | |
| | Hoya Corp. (Health care equipment & supplies) | | | 138,100 | | | | 16,342 | |
| | Keyence Corp. (Electronic equipment, instruments & components) | | | 49,800 | | | | 23,417 | |
| | Shin-Etsu Chemical Co. Ltd. (Chemicals) | | | 609,000 | | | | 20,123 | |
| | | | | | | | | 79,596 | |
| | | | | | | | | | |
| | Asia—3.4% | | | | | | | | |
| | Australia—1.2% | | | | | | | | |
| | CSL Ltd. (Biotechnology) | | | 75,362 | | | | 13,925 | |
| | Hong Kong—2.2% | | | | | | | | |
| | AIA Group Ltd. (Insurance) | | | 1,511,600 | | | | 15,259 | |
| | Techtronic Industries Co. Ltd. (Machinery) | | | 848,000 | | | | 9,215 | |
| | | | | | | | | 24,474 | |
| | | | | | | | | | |
| | Emerging Latin America—2.3% | | | | | | | | |
| | Argentina—0.5% | | | | | | | | |
| * | Globant SA (IT services)† | | | 28,338 | | | | 5,093 | |
| | Brazil—1.8% | | | | | | | | |
| | B3 SA - Brasil Bolsa Balcao (Capital markets) | | | 2,946,200 | | | | 8,990 | |
| * | MercadoLibre, Inc. (Broadline retail) | | | 10,123 | | | | 11,991 | |
| | | | | | | | | 20,981 | |
| | Total Common Stocks—96.6%
(cost $887,782) | | | | | | | 1,100,373 | |
| | | | | | | | |
| | | | Principal | | | | |
| | Issuer | | Amount | | | Value | |
| | | | | | | | |
| | Repurchase Agreement | | | | | | | | |
| | Fixed Income Clearing Corporation, 2.100% dated 06/30/23, due 07/03/23, repurchase price $35,763, collateralized by U.S. Treasury Note, 1.375%, due 11/15/31, valued at $36,472 | | | $35,757 | | | $ | 35,757 | |
| | Total Repurchase Agreement—3.1%
(cost $35,757) | | | | | | | 35,757 | |
| | Total Investments—99.7%
(cost $923,539) | | | | | | | 1,136,130 | |
| | Cash and other assets, less liabilities—0.3% | | | | | | | 3,371 | |
| | Net assets—100.0% | | | | | | $ | 1,139,501 | |
* = Non-income producing security
† = U.S. listed foreign security
At June 30, 2023, the Fund’s Portfolio of Investments includes the following industry categories (as a percentage of long-term investments):
| Industrials | | | 24.5 | % |
| Consumer Discretionary | | | 19.5 | % |
| Information Technology | | | 15.8 | % |
| Health Care | | | 14.4 | % |
| Financials | | | 13.3 | % |
| Consumer Staples | | | 5.1 | % |
| Energy | | | 3.8 | % |
| Materials | | | 3.6 | % |
| Total | | | 100.0 | % |
At June 30, 2023, the Fund’s Portfolio of Investments includes the following currency categories (as a percentage of long-term investments):
| Euro | | | 22.8 | % |
| British Pound Sterling | | | 18.4 | % |
| U.S. Dollar | | | 11.0 | % |
| Japanese Yen | | | 7.2 | % |
| Indian Rupee | | | 6.0 | % |
| Swiss Franc | | | 5.9 | % |
| Swedish Krona | | | 5.4 | % |
| Canadian Dollar | | | 5.3 | % |
| Danish Krone | | | 4.2 | % |
| Hong Kong Dollar | | | 4.1 | % |
| New Taiwan Dollar | | | 2.8 | % |
| Chinese Yuan Renminbi | | | 2.5 | % |
| Australian Dollar | | | 1.3 | % |
| South Korean Won | | | 1.2 | % |
| Norwegian Krone | | | 1.1 | % |
| All Other Currencies | | | 0.8 | % |
| Total | | | 100.0 | % |
See accompanying Notes to Financial Statements.
| June 30, 2023 | William Blair Funds | 37 |
| | International Growth Fund |
| | |
| | The International Growth Fund seeks long-term capital appreciation. |
| | |
| | AN OVERVIEW FROM THE PORTFOLIO MANAGERS |
| | |

Simon Fennell 
Kenneth J. McAtamney 
Andrew Siepker, CFA | The William Blair International Growth Fund (Class N shares) (the “Fund”) posted an 11.12% increase, net of fees, for the six months ended June 30, 2023. By comparison, the Fund’s benchmark index, the MSCI All Country World ex-U.S. IMI (net) (the “Index”), increased 9.10%. Outperformance versus the Index was driven by both allocation and selection effects. Positive allocation effect was driven by overweights in the Industrials and Information Technology sectors and an underweight in the Real Estate sector. Positive security selection was primarily driven by Health Care and Materials, but this was partially offset by negative selection within Industrials and Information Technology. The strategy benefited from an underweight to China, but this was partially offset by an underweight to Japan. Selection within the Health Care sector was bolstered by ICON, a clinical research organization (“CRO”) that has strong competitive advantages that position it to take share in the CRO market, particularly its site network approach and global presence. ICON has a very solid management team, in our view, that has a strong track-record of continuously improving and expanding business operations. ICON performed as expected during the first quarter, with revenues coming in in-line and earnings slightly beating expectations. Forward-looking guidance was also reaffirmed. Execution in the current environment remains impressive. Book-to-bill remained healthy at 1.22 times, which supports the full-year guidance. Materials sector security selection was also positive, due in part to not owning stocks within the metals and mining industry, which has fallen along with the prices of commodities such as aluminum, nickel, silver, and copper. Also contributing was exposure to Shin-Etsu Chemical, a Japanese chemical company that specializes in PVC production and semiconductor wafer manufacturing (the base ingredient for computer chips). The company faces macro cross currents, with demand for PVC potentially falling as the U.S. and Chinese housing markets face headwinds, but demand for semiconductor wafers increasing along with the semi cycle and boom related to 5G and AI demand. The company’s recent results were in line with expectations and included 9.3% sales growth year-over-year and an increase in operating profit. Within Industrials, Shenzhen Inovance Technology was the primary driver of negative selection. The company is a Chinese manufacturer of automation and electrical equipment, specializing in motion drives. From a macroeconomic standpoint, China’s reopening has been less robust than anticipated, which may weigh on near-term earnings. Medium term, forward-looking product mix changes indicate margin pressure from here. We exited the stock as a result. Information Technology selection was also negative, largely driven by the strategy not owning companies within the tech hardware industry, which has had very strong performance in the first half of the year. Also contributing to negative security selection was SES-Imagotag, which fell after a short report came out hinting at potential accounting irregularities. The company has since issued a very robust rebuttal and we believe the short report is misguided. We increased our position slightly toward the end of the quarter. Please refer to the Global Markets Review and Outlook relating to the Fund on page 29. |
| 38 | Semiannual Report | June 30, 2023 |
International Growth Fund
Performance Highlights (Unaudited)
Average Annual Total Returns through 6/30/2023
| | | Year to
Date | | 1 Year | | 3 Year | | 5 Year | | 10 Year | | Since
Inception(a) |
| Class N | | | 11.12 | % | | | 14.61 | % | | | 4.26 | % | | | 4.32 | % | | | 5.50 | % | | | — | % |
| Class I | | | 11.27 | | | | 14.89 | | | | 4.55 | | | | 4.63 | | | | 5.82 | | | | | |
| Class R6 | | | 11.30 | | | | 14.95 | | | | 4.62 | | | | — | | | | — | | | | 6.21 | |
| MSCI ACW ex-U.S. IMI (net) | | | 9.10 | | | | 12.47 | | | | 7.33 | | | | 3.38 | | | | 4.88 | | | | 4.01 | |
| | |
| (a) | Since inception is for the period from May 2, 2019 (Commencement of Operations) to June 30, 2023. |
Performance cited represents past performance. Past performance does not guarantee future results and current performance may be lower or higher than the data quoted. Results shown are average annual total returns, which assume reinvestment of dividends and capital gains. Investment returns and principal will fluctuate and you may have a gain or loss when you sell shares. For the most current month-end performance information, please call 1-800-742-7272, or visit our Web site at www.williamblairfunds.com. Investing in smaller and medium capitalization companies involves special risks, including higher volatility and lower liquidity. Smaller and medium capitalization stocks are also more sensitive to purchase/sale transactions and changes in the issuer’s financial condition. International investing involves special risk considerations, including currency fluctuations, lower liquidity, economic and political risk. From time to time, the investment adviser may waive fees or reimburse expenses for the Fund. Without these waivers/reimbursements, performance would be lower. Class N shares are not subject to a sales load. Class I shares are not subject to a sales load or distribution (Rule 12b-1) fees. Class R6 shares are not subject to a sales load, distribution (Rule 12b-1) fees, or sub-transfer agent fees.
The performance highlights and graph presented above do not reflect the deduction of taxes that a shareholder would pay on fund distributions or the redemption of fund shares.
The Morgan Stanley Capital International (MSCI) All Country World (ACW) ex-U.S. Investable Market Index (IMI) (net) is a free float-adjusted market capitalization weighted index that is designed to measure the equity market performance of developed and emerging markets, excluding the United States. This index approximates the minimum possible dividend reinvestment by deducting for the highest possible withholding tax rates of those markets.
This report identifies the Fund’s investments on June 30, 2023. These holdings are subject to change. Not all stocks in the Fund performed the same, nor is there any guarantee that these stocks will perform as well in the future. Market forecasts provided in this report may not necessarily come to pass.
Sector Diversification (Unaudited)

The sector diversification shown is based on the total long-term securities.
| June 30, 2023 | William Blair Funds | 39 |
International Growth Fund
Portfolio of Investments, June 30, 2023 (all dollar amounts in thousands) (unaudited)
| | | | | | | | |
| | | | | | | | |
| | Issuer | | Shares | | | Value | |
| | | | | | | | | | |
| | Common Stocks | | | | | | | | |
| | | | | | |
| | Europe, Mid-East—43.2% | | | | | | | | |
| | Belgium—0.2% | | | | | | | | |
| | Warehouses De Pauw CVA (Industrial REITs) | | | 82,640 | | | $ | 2,265 | |
| | Denmark—4.5% | | | | | | | | |
| | Coloplast AS (Health care equipment & supplies) | | | 54,971 | | | | 6,873 | |
| | DSV AS (Air freight & logistics) | | | 112,911 | | | | 23,712 | |
| * | Genmab AS (Biotechnology) | | | 29,467 | | | | 11,142 | |
| | Novo Nordisk AS (Pharmaceuticals) | | | 162,220 | | | | 26,137 | |
| | | | | | | | | 67,864 | |
| | Finland—0.3% | | | | | | | | |
| | Metso Oyj (Machinery) | | | 254,009 | | | | 3,061 | |
| | Valmet Oyj (Machinery) | | | 53,341 | | | | 1,483 | |
| | | | | | | | | 4,544 | |
| | France—12.9% | | | | | | | | |
| | Airbus SE (Aerospace & defense) | | | 145,204 | | | | 20,972 | |
| | Capgemini SE (IT services) | | | 66,521 | | | | 12,598 | |
| | Dassault Systemes SE (Software) | | | 452,963 | | | | 20,080 | |
| | Hermes International (Textiles, apparel & luxury goods) | | | 9,818 | | | | 21,320 | |
| | L’Oreal SA (Personal care products) | | | 42,432 | | | | 19,776 | |
| | LVMH Moet Hennessy Louis Vuitton SE (Textiles, apparel & luxury goods) | | | 23,238 | | | | 21,883 | |
| | Safran SA (Aerospace & defense) | | | 130,822 | | | | 20,479 | |
| | Sartorius Stedim Biotech (Life sciences tools & services) | | | 24,625 | | | | 6,145 | |
| | SEB SA (Household durables) | | | 20,549 | | | | 2,122 | |
| * | SES-imagotag SA (Electronic equipment, instruments & components) | | | 18,186 | | | | 1,865 | |
| | Thales SA (Aerospace & defense) | | | 145,698 | | | | 21,813 | |
| | TotalEnergies SE (Oil, gas & consumable fuels) | | | 119,244 | | | | 6,838 | |
| | Vinci SA (Construction & engineering) | | | 170,341 | | | | 19,774 | |
| | | | | | | | | 195,665 | |
| | Germany—3.7% | | | | | | | | |
| | Carl Zeiss Meditec AG (Health care equipment & supplies) | | | 32,981 | | | | 3,564 | |
| | CTS Eventim AG & Co. KGaA (Entertainment) | | | 94,535 | | | | 5,968 | |
| | Hannover Rueck SE (Insurance) | | | 36,314 | | | | 7,701 | |
| | Infineon Technologies AG (Semiconductors & semiconductor equipment) | | | 323,853 | | | | 13,353 | |
| | MTU Aero Engines AG (Aerospace & defense) | | | 78,971 | | | | 20,457 | |
| | Nemetschek SE (Software) | | | 39,751 | | | | 2,977 | |
| | Siltronic AG (Semiconductors & semiconductor equipment) | | | 24,057 | | | | 1,838 | |
| | | | | | | | | 55,858 | |
| | | | | | | | | | |
| | | | | | | | |
| | | | | | | | |
| | Issuer | | Shares | | | Value | |
| | | | | | | | | | |
| | Common Stocks—(continued) | | | | | | | | |
| | | | | | | | | | |
| | Europe, Mid-East—(continued) | | | | | | | | |
| | Ireland—3.2% | | | | | | | | |
| * | ICON PLC (Life sciences tools & services)† | | | 63,756 | | | $ | 15,952 | |
| | Kingspan Group PLC (Building products) | | | 106,553 | | | | 7,081 | |
| | Linde PLC (Chemicals)† | | | 67,222 | | | | 25,617 | |
| | | | | | | | | 48,650 | |
| | Israel—0.8% | | | | | | | | |
| * | Inmode Ltd. (Health care equipment & supplies)† | | | 98,955 | | | | 3,696 | |
| | Mizrahi Tefahot Bank Ltd. (Banks) | | | 89,020 | | | | 2,961 | |
| * | Nice Ltd.—ADR (Software) | | | 27,818 | | | | 5,745 | |
| | | | | | | | | 12,402 | |
| | Italy—2.1% | | | | | | | | |
| | Amplifon SpA (Health care providers & services) | | | 101,068 | | | | 3,705 | |
| | Azimut Holding SpA (Capital markets) | | | 91,621 | | | | 1,975 | |
| | Brembo SpA (Automobile components) | | | 142,341 | | | | 2,109 | |
| | Brunello Cucinelli SpA (Textiles, apparel & luxury goods) | | | 59,423 | | | | 5,227 | |
| | Ferrari NV (Automobiles)† | | | 37,979 | | | | 12,351 | |
| | Moncler SpA (Textiles, apparel & luxury goods) | | | 102,483 | | | | 7,083 | |
| | | | | | | | | 32,450 | |
| | Netherlands—3.7% | | | | | | | | |
| * | Adyen NV (Financial services) | | | 4,910 | | | | 8,496 | |
| | ASML Holding NV (Semiconductors & semiconductor equipment) | | | 41,025 | | | | 29,680 | |
| | BE Semiconductor Industries NV (Semiconductors & semiconductor equipment) | | | 64,554 | | | | 6,995 | |
| | Euronext NV (Capital markets) | | | 57,887 | | | | 3,935 | |
| | IMCD NV (Trading companies & distributors) | | | 31,643 | | | | 4,548 | |
| | JDE Peet’s NV (Food products) | | | 105,941 | | | | 3,151 | |
| | | | | | | | | 56,805 | |
| | Norway—0.4% | | | | | | | | |
| * | AutoStore Holdings Ltd. (Machinery) | | | 1,536,435 | | | | 3,357 | |
| | Gjensidige Forsikring ASA (Insurance) | | | 147,550 | | | | 2,361 | |
| | | | | | | | | 5,718 | |
| | Spain—1.5% | | | | | | | | |
| * | Amadeus IT Group SA (Hotels, restaurants & leisure) | | | 305,400 | | | | 23,228 | |
| | Sweden—4.0% | | | | | | | | |
| | Atlas Copco AB (Machinery) | | | 904,373 | | | | 13,030 | |
| | Beijer Ref AB (Trading companies & distributors) | | | 401,887 | | | | 5,127 | |
| | Evolution AB (Hotels, restaurants & leisure) | | | 80,097 | | | | 10,143 | |
| | Fortnox AB (Software) | | | 447,580 | | | | 2,643 | |
| | Hemnet Group AB (Interactive media & services) | | | 139,661 | | | | 2,445 | |
See accompanying Notes to Financial Statements.
| 40 | Semiannual Report | June 30, 2023 |
International Growth Fund
Portfolio of Investments, June 30, 2023 (all dollar amounts in thousands) (unaudited)
| | | | | | | | |
| | | | | | | | |
| | Issuer | | Shares | | | Value | |
| | | | | | | | | | |
| | Common Stocks—(continued) | | | | | | | | |
| | | | | | | | | | |
| | Europe, Mid-East—(continued) | | | | | | | | |
| | Sweden—(continued) | | | | | | | | |
| | Hexagon AB (Electronic equipment, instruments & components) | | | 1,197,529 | | | $ | 14,740 | |
| | Indutrade AB (Machinery) | | | 202,431 | | | | 4,559 | |
| | Lifco AB (Industrial conglomerates) | | | 232,302 | | | | 5,046 | |
| | Sweco AB (Construction & engineering) | | | 177,262 | | | | 1,951 | |
| | Vitrolife AB (Biotechnology) | | | 68,745 | | | | 1,335 | |
| | | | | | | | | 61,019 | |
| | Switzerland—5.9% | | | | | | | | |
| | Belimo Holding AG (Building products) | | | 7,488 | | | | 3,733 | |
| | Galenica AG (Health care providers & services) | | | 49,778 | | | | 4,018 | |
| | Lonza Group AG (Life sciences tools & services) | | | 30,703 | | | | 18,297 | |
| | Partners Group Holding AG (Capital markets) | | | 8,279 | | | | 7,785 | |
| * | Siegfried Holding AG (Life sciences tools & services) | | | 4,039 | | | | 3,335 | |
| * | SIG Group AG (Containers & packaging) | | | 275,850 | | | | 7,606 | |
| | Sika AG (Chemicals) | | | 38,950 | | | | 11,127 | |
| | Straumann Holding AG (Health care equipment & supplies) | | | 70,055 | | | | 11,361 | |
| | Tecan Group AG (Life sciences tools & services) | | | 13,446 | | | | 5,156 | |
| | VAT Group AG (Machinery) | | | 14,003 | | | | 5,789 | |
| | Zurich Insurance Group AG (Insurance) | | | 24,804 | | | | 11,775 | |
| | | | | | | | | 89,982 | |
| | | | | | | | | | |
| | United Kingdom—15.8% | | | | | | | | |
| | 3i Group PLC (Capital markets) | | | 382,314 | | | | 9,461 | |
| * | Abcam PLC—ADR (Biotechnology) | | | 197,881 | | | | 4,842 | |
| | Ashtead Group PLC (Trading companies & distributors) | | | 185,315 | | | | 12,812 | |
| | AstraZeneca PLC (Pharmaceuticals) | | | 164,784 | | | | 23,598 | |
| | Beazley PLC (Insurance) | | | 417,664 | | | | 3,124 | |
| | Big Yellow Group PLC (Specialized REITs) | | | 205,433 | | | | 2,799 | |
| | Bunzl PLC (Trading companies & distributors) | | | 199,751 | | | | 7,608 | |
| | Compass Group PLC (Hotels, restaurants & leisure) | | | 807,696 | | | | 22,588 | |
| | ConvaTec Group PLC (Health care equipment & supplies) | | | 2,553,997 | | | | 6,656 | |
| | Croda International PLC (Chemicals) | | | 68,108 | | | | 4,866 | |
| | CVS Group PLC (Health care providers & services) | | | 117,080 | | | | 2,943 | |
| | Diageo PLC (Beverages) | | | 367,141 | | | | 15,755 | |
| | Diploma PLC (Trading companies & distributors) | | | 120,200 | | | | 4,555 | |
| | Experian PLC (Professional services) | | | 415,188 | | | | 15,914 | |
| | Greggs PLC (Hotels, restaurants & leisure) | | | 130,281 | | | | 4,226 | |
| | Halma PLC (Electronic equipment, instruments & components) | | | 395,586 | | | | 11,439 | |
| | | | | | | | |
| | | | | | | | |
| | Issuer | | Shares | | | Value | |
| | | | | | | | | | |
| | Common Stocks—(continued) | | | | | | | | |
| | | | | | | | | | |
| | United Kingdom—(continued) | | | | | | | | |
| | Intermediate Capital Group PLC (Capital markets) | | | 295,847 | | | $ | 5,176 | |
| | London Stock Exchange Group PLC (Capital markets) | | | 199,234 | | | | 21,168 | |
| | RELX PLC (Professional services) | | | 233,931 | | | | 7,787 | |
| | Renishaw PLC (Electronic equipment, instruments & components) | | | 43,849 | | | | 2,173 | |
| | Rentokil Initial PLC (Commercial services & supplies) | | | 2,172,372 | | | | 16,967 | |
| | Rotork PLC (Machinery) | | | 1,067,461 | | | | 4,132 | |
| | Segro PLC (Industrial REITs) | | | 358,674 | | | | 3,265 | |
| | Softcat PLC (IT services) | | | 149,681 | | | | 2,692 | |
| | Spectris PLC (Electronic equipment, instruments & components) | | | 95,925 | | | | 4,380 | |
| | Spirax-Sarco Engineering PLC (Machinery) | | | 63,176 | | | | 8,316 | |
| | SSE PLC (Electric utilities) | | | 341,083 | | | | 7,975 | |
| | Weir Group PLC (Machinery) | | | 130,227 | | | | 2,904 | |
| | | | | | | | | 240,121 | |
| | | | | | | | | | |
| | Emerging Asia—13.1% | | | | | | | | |
| | China—2.2% | | | | | | | | |
| | Airtac International Group (Machinery) | | | 106,713 | | | | 3,512 | |
| | Contemporary Amperex Technology Co. Ltd. (Electrical equipment) | | | 115,560 | | | | 3,637 | |
| | Kweichow Moutai Co. Ltd. (Beverages) | | | 41,799 | | | | 9,723 | |
| | Proya Cosmetics Co. Ltd. (Personal care products) | | | 115,189 | | | | 1,781 | |
| | Silergy Corp. (Semiconductors & semiconductor equipment) | | | 100,000 | | | | 1,236 | |
| | Tencent Holdings Ltd. (Interactive media & services) | | | 323,500 | | | | 13,690 | |
| | | | | | | | | 33,579 | |
| | India—5.8% | | | | | | | | |
| | Apollo Hospitals Enterprise Ltd. (Health care providers & services) | | | 49,834 | | | | 3,098 | |
| | Asian Paints Ltd. (Chemicals) | | | 152,482 | | | | 6,245 | |
| | Britannia Industries Ltd. (Food products) | | | 52,294 | | | | 3,203 | |
| | Havells India Ltd. (Electrical equipment) | | | 235,933 | | | | 3,687 | |
| | HDFC Bank Ltd. (Banks) | | | 912,100 | | | | 18,909 | |
| | Hindustan Unilever Ltd. (Personal care products) | | | 239,108 | | | | 7,800 | |
| | Infosys Ltd. (IT services) | | | 386,948 | | | | 6,310 | |
| * | InterGlobe Aviation Ltd. (Passenger airlines) | | | 180,960 | | | | 5,806 | |
| * | Max Healthcare Institute Ltd. (Health care providers & services) | | | 361,568 | | | | 2,645 | |
| | Nestle India Ltd. (Food products) | | | 8,295 | | | | 2,318 | |
| | Petronet LNG Ltd. (Oil, gas & consumable fuels) | | | 1,175,961 | | | | 3,196 | |
| | Reliance Industries Ltd. (Oil, gas & consumable fuels) | | | 663,923 | | | | 20,664 | |
| | Titan Co. Ltd. (Textiles, apparel & luxury goods) | | | 30,215 | | | | 1,134 | |
See accompanying Notes to Financial Statements.
| June 30, 2023 | William Blair Funds | 41 |
International Growth Fund
Portfolio of Investments, June 30, 2023 (all dollar amounts in thousands) (unaudited)
| | | | | | | | |
| | | | | | | | |
| | Issuer | | Shares | | | Value | |
| | | | | | | | | | |
| | Common Stocks—(continued) | | | | | | | | |
| | | | | | | | | | |
| | Emerging Asia—(continued) | | | | | | | | |
| | India—(continued) | | | | | | | | |
| | Varun Beverages Ltd. (Beverages) | | | 99,064 | | | $ | 973 | |
| | Voltas Ltd. (Construction & engineering) | | | 254,560 | | | | 2,360 | |
| | | | | | | | | 88,348 | |
| | Indonesia—1.9% | | | | | | | | |
| | Bank Central Asia Tbk PT (Banks) | | | 32,431,200 | | | | 19,793 | |
| | Telkom Indonesia Persero Tbk PT (Diversified telecommunication services) | | | 30,923,800 | | | | 8,250 | |
| | | | | | | | | 28,043 | |
| | South Korea—0.4% | | | | | | | | |
| | Samsung SDI Co. Ltd. (Electronic equipment, instruments & components) | | | 12,468 | | | | 6,330 | |
| | Taiwan—2.8% | | | | | | | | |
| | Global Unichip Corp. (Semiconductors & semiconductor equipment) | | | 71,000 | | | | 3,659 | |
| | Globalwafers Co. Ltd. (Semiconductors & semiconductor equipment) | | | 114,000 | | | | 1,819 | |
| | MediaTek, Inc. (Semiconductors & semiconductor equipment) | | | 364,000 | | | | 8,041 | |
| | Taiwan Semiconductor Manufacturing Co. Ltd.—ADR (Semiconductors & semiconductor equipment) | | | 287,532 | | | | 29,018 | |
| | | | | | | | | 42,537 | |
| | | | | | | | | | |
| | Canada—8.5% | | | | | | | | |
| | Boyd Group Services, Inc. (Commercial services & supplies) | | | 14,247 | | | | 2,718 | |
| | Canadian National Railway Co. (Ground transportation) | | | 153,177 | | | | 18,549 | |
| | Canadian Pacific Kansas City Ltd. (Ground transportation) | | | 276,527 | | | | 22,335 | |
| | CCL Industries, Inc. (Containers & packaging) | | | 150,606 | | | | 7,403 | |
| | Dollarama, Inc. (Broadline retail) | | | 256,432 | | | | 17,367 | |
| | Intact Financial Corp. (Insurance) | | | 96,501 | | | | 14,900 | |
| * | Kinaxis, Inc. (Software) | | | 25,461 | | | | 3,638 | |
| * | Lululemon Athletica, Inc. (Textiles, apparel & luxury goods) | | | 18,271 | | | | 6,916 | |
| | Metro, Inc. (Consumer staples distribution & retail) | | | 211,446 | | | | 11,942 | |
| | Parkland Corp. (Oil, gas & consumable fuels) | | | 152,968 | | | | 3,811 | |
| | Toromont Industries Ltd. (Trading companies & distributors) | | | 95,970 | | | | 7,884 | |
| | Toronto-Dominion Bank (Banks) | | | 181,674 | | | | 11,260 | |
| | | | | | | | | 128,723 | |
| | | | | | | | | | |
| | Japan—8.4% | | | | | | | | |
| | Ajinomoto Co., Inc. (Food products) | | | 185,500 | | | | 7,359 | |
| | BayCurrent Consulting, Inc. (Professional services) | | | 89,600 | | | | 3,333 | |
| | Benefit One, Inc. (Professional services) | | | 167,100 | | | | 1,696 | |
| | | | | | | | |
| | | | | | | | |
| | Issuer | | Shares | | | Value | |
| | | | | | | | | | |
| | Common Stocks—(continued) | | | | | | | | |
| | | | | | | | | | |
| | Japan—(continued) | | | | | | | | |
| | Daikin Industries Ltd. (Building products) | | | 92,500 | | | $ | 18,760 | |
| | Disco Corp. (Semiconductors & semiconductor equipment) | | | 35,100 | | | | 5,500 | |
| | Food & Life Cos. Ltd. (Hotels, restaurants & leisure) | | | 105,200 | | | | 2,042 | |
| | GMO Payment Gateway, Inc. (Financial services) | | | 35,600 | | | | 2,763 | |
| | Harmonic Drive Systems, Inc. (Machinery) | | | 58,800 | | | | 1,879 | |
| | Hoya Corp. (Health care equipment & supplies) | | | 97,600 | | | | 11,549 | |
| | Japan Elevator Service Holdings Co. Ltd. (Commercial services & supplies) | | | 148,100 | | | | 1,931 | |
| | Keyence Corp. (Electronic equipment, instruments & components) | | | 49,000 | | | | 23,041 | |
| | MonotaRO Co. Ltd. (Trading companies & distributors) | | | 375,000 | | | | 4,738 | |
| | Rakus Co. Ltd. (Software) | | | 156,600 | | | | 2,637 | |
| * | SHIFT, Inc. (IT services) | | | 15,900 | | | | 2,886 | |
| | Shin-Etsu Chemical Co. Ltd. (Chemicals) | | | 375,300 | | | | 12,401 | |
| | SMS Co. Ltd. (Professional services) | | | 71,600 | | | | 1,426 | |
| | TechnoPro Holdings, Inc. (Professional services) | | | 183,900 | | | | 3,955 | |
| | TIS, Inc. (IT services) | | | 166,300 | | | | 4,139 | |
| | Tokio Marine Holdings, Inc. (Insurance) | | | 378,000 | | | | 8,684 | |
| | Tokyo Electron Ltd. (Semiconductors & semiconductor equipment) | | | 52,900 | | | | 7,537 | |
| | | | | | | | | 128,256 | |
| | | | | | | | | | |
| | Emerging Latin America—3.7% | | | | | | | | |
| | Argentina—0.3% | | | | | | | | |
| * | Globant SA (IT services)† | | | 22,410 | | | | 4,028 | |
| | Brazil—1.8% | | | | | | | | |
| | B3 SA - Brasil Bolsa Balcao (Capital markets) | | | 2,484,700 | | | | 7,581 | |
| | Locaweb Servicos de Internet SA (IT services) | | | 1,195,193 | | | | 2,142 | |
| * | MercadoLibre, Inc. (Broadline retail) | | | 6,089 | | | | 7,213 | |
| | Raia Drogasil SA (Consumer staples distribution & retail) | | | 766,064 | | | | 4,736 | |
| | Rumo SA (Ground transportation) | | | 679,100 | | | | 3,148 | |
| | WEG SA (Electrical equipment) | | | 354,900 | | | | 2,798 | |
| | | | | | | | | 27,618 | |
| | Mexico—1.4% | | | | | | | | |
| | Grupo Aeroportuario del Sureste SAB de CV—ADR (Transportation infrastructure) | | | 10,809 | | | | 3,002 | |
| | Wal-Mart de Mexico SAB de CV (Consumer staples distribution & retail) | | | 4,813,500 | | | | 19,091 | |
| | | | | | | | | 22,093 | |
| | Peru—0.2% | | | | | | | | |
| | Credicorp Ltd. (Banks)† | | | 20,509 | | | | 3,028 | |
See accompanying Notes to Financial Statements.
| 42 | Semiannual Report | June 30, 2023 |
International Growth Fund
Portfolio of Investments, June 30, 2023 (all dollar amounts in thousands) (unaudited)
| | Issuer | | Shares or
Principal
Amount | | | Value | |
| | | | | | | | | | |
| | Common Stocks—(continued) | | | | | | | | |
| | | | | | | | | | |
| | Asia—3.7% | | | | | | | | |
| | Australia—1.4% | | | | | | | | |
| | CSL Ltd. (Biotechnology) | | | 64,232 | | | $ | 11,869 | |
| | IDP Education Ltd. (Diversified consumer services) | | | 105,126 | | | | 1,548 | |
| | Pro Medicus Ltd. (Health care technology) | | | 78,745 | | | | 3,443 | |
| | Steadfast Group Ltd. (Insurance) | | | 1,129,204 | | | | 4,513 | |
| | | | | | | | | 21,373 | |
| | Hong Kong—1.7% | | | | | | | | |
| | AIA Group Ltd. (Insurance) | | | 1,712,200 | | | | 17,284 | |
| | Techtronic Industries Co. Ltd. (Machinery) | | | 790,500 | | | | 8,590 | |
| | | | | | | | | 25,874 | |
| | Singapore—0.6% | | | | | | | | |
| | DBS Group Holdings Ltd. (Banks) | | | 405,600 | | | | 9,450 | |
| | | | | | | | | | |
| | Emerging Africa—0.4% | | | | | | | | |
| | South Africa—0.4% | | | | | | | | |
| | Bid Corp. Ltd. (Consumer staples distribution & retail) | | | 243,696 | | | | 5,351 | |
| | Total Common Stocks—96.8%
(cost $1,089,045) | | | | | | | 1,471,202 | |
| | | | | | | | | | |
| | Repurchase Agreement | | | | | | | | |
| | Fixed Income Clearing Corporation, 2.100% dated 06/30/23, due 07/03/23, repurchase price $38,548, collateralized by U.S. Treasury Note, 1.250%, due 08/15/31, valued at $39,312 | | | $38,541 | | | | 38,541 | |
| | Total Repurchase Agreement—2.5%
(cost $38,541) | | | | | | | 38,541 | |
| | Total Investments—99.3%
(cost $1,127,586) | | | | | | | 1,509,743 | |
| | Cash and other assets, less liabilities—0.7% | | | | | | | 11,078 | |
| | Net assets—100.0% | | | | | | $ | 1,520,821 | |
ADR = American Depository Receipt
REIT = Real Estate Investment Trust
* = Non-income producing security
† = U.S. listed foreign security
At June 30, 2023, the Fund’s Portfolio of Investments includes the following industry categories (as a percentage of long-term investments):
| Industrials | | | 26.6 | % |
| Information Technology | | | 16.7 | % |
| Financials | | | 13.9 | % |
| Health Care | | | 13.0 | % |
| Consumer Discretionary | | | 11.5 | % |
| Consumer Staples | | | 7.7 | % |
| Materials | | | 5.1 | % |
| Energy | | | 2.3 | % |
| Communication Services | | | 2.1 | % |
| Real Estate | | | 0.6 | % |
| Utilities | | | 0.5 | % |
| Total | | | 100.0 | % |
At June 30, 2023, the Fund’s Portfolio of Investments includes the following currency categories (as a percentage of long-term investments):
| Euro | | | 24.8 | % |
| British Pound Sterling | | | 16.0 | % |
| U.S. Dollar | | | 9.8 | % |
| Japanese Yen | | | 8.7 | % |
| Canadian Dollar | | | 6.8 | % |
| Swiss Franc | | | 6.1 | % |
| Indian Rupee | | | 6.0 | % |
| Danish Krone | | | 4.6 | % |
| Swedish Krona | | | 4.2 | % |
| Hong Kong Dollar | | | 2.7 | % |
| Indonesian Rupiah | | | 1.9 | % |
| Australian Dollar | | | 1.5 | % |
| Brazilian Real | | | 1.4 | % |
| Mexican Peso | | | 1.3 | % |
| New Taiwan Dollar | | | 1.2 | % |
| Chinese Yuan Renminbi | | | 1.0 | % |
| All Other Currencies | | | 2.0 | % |
| Total | | | 100.0 | % |
See accompanying Notes to Financial Statements.
| June 30, 2023 | William Blair Funds | 43 |
| | Institutional International Growth Fund |
| | |
| | The Institutional International Growth Fund seeks long-term capital appreciation. |
| | |
| | AN OVERVIEW FROM THE PORTFOLIO MANAGERS |
| | |

Simon Fennell 
Kenneth J. McAtamney 
Andrew Siepker, CFA | William Blair Institutional International Growth Fund (the “Fund”) posted a 11.31% increase, net of fees, for the six months ended June 30, 2023. By comparison, the Fund’s benchmark index, the MSCI All Country World ex-U.S. IMI (net) (the “Index”), increased 9.10%. Outperformance versus the Index was driven by both allocation and selection effects. Positive allocation effect was driven by overweights in the Industrials and Information Technology sectors and an underweight in the Real Estate sector. Positive security selection was primarily driven by Health Care and Materials, but this was partially offset by negative selection within Industrials and Information Technology. The strategy benefited from an underweight to China, but this was partially offset by an underweight to Japan. Selection within the Health Care sector was bolstered by ICON, a clinical research organization (“CRO”) that has strong competitive advantages that position it to take share in the CRO market, particularly its site network approach and global presence. ICON has a very solid management team, in our view, that has a strong track-record of continuously improving and expanding business operations. ICON performed as expected during the first quarter, with revenues coming in in-line and earnings slightly beating expectations. Forward-looking guidance was also reaffirmed. Execution in the current environment remains impressive. Book-to-bill remained healthy at 1.22 times, which supports the full-year guidance. Materials sector security selection was also positive, due in part to not owning stocks within the metals and mining industry, which has fallen along with the prices of commodities such as aluminum, nickel, silver, and copper. Also contributing was exposure to Shin-Etsu Chemical, a Japanese chemical company that specializes in PVC production and semiconductor wafer manufacturing (the base ingredient for computer chips). The company faces macro cross currents, with demand for PVC potentially falling as the U.S. and Chinese housing markets face headwinds, but demand for semiconductor wafers increasing along with the semi cycle and boom related to 5G and AI demand. The company’s recent results were in line with expectations and included 9.3% sales growth year-over-year and an increase in operating profit. Within Industrials, Shenzhen Inovance Technology was the primary driver of negative selection. The company is a Chinese manufacturer of automation and electrical equipment, specializing in motion drives. From a macroeconomic standpoint, China’s reopening has been less robust than anticipated, which may weigh on near-term earnings. Medium term, forward-looking product mix changes indicate margin pressure from here. We exited the stock as a result. Information Technology selection was also negative, largely driven by the strategy not owning companies within the tech hardware industry, which has had very strong performance in the first half of the year. Also contributing to negative security selection was SES-Imagotag, which fell after a short report came out hinting at potential accounting irregularities. The company has since issued a very robust rebuttal and we believe the short report is misguided. We increased our position slightly toward the end of the quarter. Please refer to the Global Markets Review and Outlook relating to the Fund on page 29. |
| 44 | Semiannual Report | June 30, 2023 |
Institutional International Growth Fund
Performance Highlights (Unaudited)
Average Annual Total Returns through 6/30/2023
| | | Year to
Date | | 1 Year | | 3 Year | | 5 Year | | 10 Year |
| Institutional International Growth Fund | | | 11.31 | % | | | 15.09 | % | | | 4.73 | % | | | 4.86 | % | | | 5.98 | % |
| MSCI ACW ex-U.S. IMI (net) | | | 9.10 | | | | 12.47 | | | | 7.33 | | | | 3.38 | | | | 4.88 | |
Performance cited represents past performance. Past performance does not guarantee future results and current performance may be lower or higher than the data quoted. Results shown are average annual total returns, which assume reinvestment of dividends and capital gains. Investment returns and principal will fluctuate and you may have a gain or loss when you sell shares. For the most current month-end performance information, please call 1-800-742-7272, or visit our Web site at www.williamblairfunds.com. From time to time, the investment adviser may waive fees or reimburse expenses for the Fund. Without these waivers/reimbursements, performance would be lower. Investing in smaller and medium capitalization companies involves special risks, including higher volatility and lower liquidity. Smaller and medium capitalization stocks are also more sensitive to purchase/sale transactions and changes in the issuer’s financial condition. International investing involves special risk considerations, including currency fluctuations, lower liquidity, economic and political risk. Shares of the Fund are not subject to a sales load, distribution (Rule 12b-1) fees, or sub-transfer agent fees.
The performance highlights and graph presented above do not reflect the deduction of taxes that a shareholder would pay on fund distributions or the redemption of fund shares.
The Morgan Stanley Capital International (MSCI) All Country World (ACW) ex-U.S. Investable Market Index (IMI) (net) is a free float-adjusted market capitalization weighted index that is designed to measure the equity market performance of developed and emerging markets, excluding the United States. This index approximates the minimum possible dividend reinvestment by deducting for the highest possible withholding tax rates of those markets.
This report identifies the Fund’s investments on June 30, 2023. These holdings are subject to change. Not all stocks in the Fund performed the same, nor is there any guarantee that these stocks will perform as well in the future. Market forecasts provided in this report may not necessarily come to pass.
Sector Diversification (Unaudited)

The sector diversification shown is based on the total long-term securities.
| June 30, 2023 | William Blair Funds | 45 |
Institutional International Growth Fund
Portfolio of Investments, June 30, 2023 (all dollar amounts in thousands) (unaudited)
| | | | | | | | |
| | | | | | | | |
| | Issuer | | Shares | | | Value | |
| | | | | | | | |
| | Common Stocks | | | | | | | | |
| | | | | | | | | | |
| | Europe, Mid-East—42.7% | | | | | | | | |
| | Belgium—0.1% | | | | | | | | |
| | Warehouses De Pauw CVA (Industrial REITs) | | | 48,653 | | | $ | 1,334 | |
| | Denmark—4.4% | | | | | | | | |
| | Coloplast AS (Health care equipment & supplies) | | | 32,456 | | | | 4,058 | |
| | DSV AS (Air freight & logistics) | | | 66,667 | | | | 14,001 | |
| * | Genmab AS (Biotechnology) | | | 17,398 | | | | 6,578 | |
| | Novo Nordisk AS (Pharmaceuticals) | | | 95,780 | | | | 15,432 | |
| | | | | | | | | 40,069 | |
| | Finland—0.3% | | | | | | | | |
| | Metso Oyj (Machinery) | | | 150,725 | | | | 1,817 | |
| | Valmet Oyj (Machinery) | | | 31,663 | | | | 880 | |
| | | | | | | | | 2,697 | |
| | France—12.7% | | | | | | | | |
| | Airbus SE (Aerospace & defense) | | | 85,734 | | | | 12,383 | |
| | Capgemini SE (IT services) | | | 39,276 | | | | 7,438 | |
| | Dassault Systemes SE (Software) | | | 267,248 | | | | 11,847 | |
| | Hermes International (Textiles, apparel & luxury goods) | | | 5,793 | | | | 12,579 | |
| | L’Oreal SA (Personal care products) | | | 25,187 | | | | 11,739 | |
| | LVMH Moet Hennessy Louis Vuitton SE (Textiles, apparel & luxury goods) | | | 13,720 | | | | 12,920 | |
| | Safran SA (Aerospace & defense) | | | 77,241 | | | | 12,092 | |
| | Sartorius Stedim Biotech (Life sciences tools & services) | | | 14,577 | | | | 3,638 | |
| | SEB SA (Household durables) | | | 12,119 | | | | 1,252 | |
| * | SES-imagotag SA (Electronic equipment, instruments & components) | | | 10,795 | | | | 1,107 | |
| | Thales SA (Aerospace & defense) | | | 86,025 | | | | 12,879 | |
| | TotalEnergies SE (Oil, gas & consumable fuels) | | | 70,405 | | | | 4,037 | |
| | Vinci SA (Construction & engineering) | | | 100,500 | | | | 11,666 | |
| | | | | | | | | 115,577 | |
| | Germany—3.6% | | | | | | | | |
| | Carl Zeiss Meditec AG (Health care equipment & supplies) | | | 19,402 | | | | 2,097 | |
| | CTS Eventim AG & Co. KGaA (Entertainment) | | | 55,817 | | | | 3,523 | |
| | Hannover Rueck SE (Insurance) | | | 21,441 | | | | 4,547 | |
| | Infineon Technologies AG (Semiconductors & semiconductor equipment) | | | 189,226 | | | | 7,802 | |
| | MTU Aero Engines AG (Aerospace & defense) | | | 46,628 | | | | 12,079 | |
| | Nemetschek SE (Software) | | | 23,335 | | | | 1,748 | |
| | Siltronic AG (Semiconductors & semiconductor equipment) | | | 14,204 | | | | 1,085 | |
| | | | | | | | | 32,881 | |
| | Ireland—3.2% | | | | | | | | |
| * | ICON PLC (Life sciences tools & services)† | | | 37,668 | | | | 9,425 | |
| | Kingspan Group PLC (Building products) | | | 62,913 | | | | 4,181 | |
| | Linde PLC (Chemicals)† | | | 39,690 | | | | 15,125 | |
| | | | | | | | | 28,731 | |
| | | | | | | | |
| | | | | | | | |
| | Issuer | | Shares | | | Value | |
| | | | | | | | |
| | Common Stocks—(continued) | | | | | | | | |
| | | | | | | | | | |
| | Europe, Mid-East—(continued) | | | | | | | | |
| | Israel—0.8% | | | | | | | | |
| * | Inmode Ltd. (Health care equipment & supplies)† | | | 58,371 | | | $ | 2,180 | |
| | Mizrahi Tefahot Bank Ltd. (Banks) | | | 52,406 | | | | 1,743 | |
| * | Nice Ltd.—ADR (Software) | | | 16,381 | | | | 3,383 | |
| | | | | | | | | 7,306 | |
| | Italy—2.1% | | | | | | | | |
| | Amplifon SpA (Health care providers & services) | | | 59,599 | | | | 2,185 | |
| | Azimut Holding SpA (Capital markets) | | | 54,057 | | | | 1,165 | |
| | Brembo SpA (Automobile components) | | | 84,185 | | | | 1,247 | |
| | Brunello Cucinelli SpA (Textiles, apparel & luxury goods) | | | 35,021 | | | | 3,080 | |
| | Ferrari NV (Automobiles)† | | | 22,424 | | | | 7,293 | |
| | Moncler SpA (Textiles, apparel & luxury goods) | | | 59,918 | | | | 4,141 | |
| | | | | | | | | 19,111 | |
| | Netherlands—3.7% | | | | | | | | |
| * | Adyen NV (Financial services) | | | 2,899 | | | | 5,016 | |
| | ASML Holding NV (Semiconductors & semiconductor equipment) | | | 24,352 | | | | 17,618 | |
| | BE Semiconductor Industries NV (Semiconductors & semiconductor equipment) | | | 38,085 | | | | 4,127 | |
| | Euronext NV (Capital markets) | | | 34,009 | | | | 2,312 | |
| | IMCD NV (Trading companies & distributors) | | | 18,613 | | | | 2,675 | |
| | JDE Peet’s NV (Food products) | | | 62,505 | | | | 1,859 | |
| | | | | | | | | 33,607 | |
| | Norway—0.4% | | | | | | | | |
| * | AutoStore Holdings Ltd. (Machinery) | | | 903,208 | | | | 1,973 | |
| | Gjensidige Forsikring ASA (Insurance) | | | 86,726 | | | | 1,388 | |
| | | | | | | | | 3,361 | |
| | Spain—1.5% | | | | | | | | |
| * | Amadeus IT Group SA (Hotels, restaurants & leisure) | | | 180,504 | | | | 13,729 | |
| | Sweden—4.0% | | | | | | | | |
| | Atlas Copco AB (Machinery) | | | 533,976 | | | | 7,694 | |
| | Beijer Ref AB (Trading companies & distributors) | | | 238,634 | | | | 3,044 | |
| | Evolution AB (Hotels, restaurants & leisure) | | | 47,291 | | | | 5,989 | |
| | Fortnox AB (Software) | | | 263,592 | | | | 1,556 | |
| | Hemnet Group AB (Interactive media & services) | | | 82,018 | | | | 1,436 | |
| | Hexagon AB (Electronic equipment, instruments & components) | | | 707,065 | | | | 8,703 | |
| | Indutrade AB (Machinery) | | | 119,177 | | | | 2,684 | |
| | Lifco AB (Industrial conglomerates) | | | 137,159 | | | | 2,980 | |
| | Sweco AB (Construction & engineering) | | | 104,068 | | | | 1,145 | |
| | Vitrolife AB (Biotechnology) | | | 40,441 | | | | 785 | |
| | | | | | | | | 36,016 | |
See accompanying Notes to Financial Statements.
| 46 | Semiannual Report | June 30, 2023 |
Institutional International Growth Fund
Portfolio of Investments, June 30, 2023 (all dollar amounts in thousands) (unaudited)
| | | | | | | | |
| | | | | | | | |
| | Issuer | | Shares | | | Value | |
| | | | | | | | |
| | Common Stocks—(continued) | | | | | | | | |
| | | | | | | | | | |
| | Europe, Mid-East—(continued) | | | | | | | | |
| | Switzerland—5.9% | | | | | | | | |
| | Belimo Holding AG (Building products) | | | 4,419 | | | $ | 2,203 | |
| | Galenica AG (Health care providers & services) | | | 29,289 | | | | 2,364 | |
| | Lonza Group AG (Life sciences tools & services) | | | 18,225 | | | | 10,861 | |
| | Partners Group Holding AG (Capital markets) | | | 4,888 | | | | 4,596 | |
| * | Siegfried Holding AG (Life sciences tools & services) | | | 2,385 | | | | 1,969 | |
| * | SIG Group AG (Containers & packaging) | | | 162,872 | | | | 4,491 | |
| | Sika AG (Chemicals) | | | 22,998 | | | | 6,570 | |
| | Straumann Holding AG (Health care equipment & supplies) | | | 41,363 | | | | 6,708 | |
| | Tecan Group AG (Life sciences tools & services) | | | 7,934 | | | | 3,042 | |
| | VAT Group AG (Machinery) | | | 8,268 | | | | 3,418 | |
| | Zurich Insurance Group AG (Insurance) | | | 14,645 | | | | 6,953 | |
| | | | | | | | | 53,175 | |
| | | | | | | | | | |
| | United Kingdom—15.6% | | | | | | | | |
| | 3i Group PLC (Capital markets) | | | 225,572 | | | | 5,582 | |
| * | Abcam PLC—ADR (Biotechnology) | | | 117,423 | | | | 2,873 | |
| | Ashtead Group PLC (Trading companies & distributors) | | | 109,417 | | | | 7,565 | |
| | AstraZeneca PLC (Pharmaceuticals) | | | 97,223 | | | | 13,923 | |
| | Beazley PLC (Insurance) | | | 245,703 | | | | 1,838 | |
| | Big Yellow Group PLC (Specialized REITs) | | | 121,148 | | | | 1,651 | |
| | Bunzl PLC (Trading companies & distributors) | | | 117,852 | | | | 4,489 | |
| | Compass Group PLC (Hotels, restaurants & leisure) | | | 479,444 | | | | 13,408 | |
| | ConvaTec Group PLC (Health care equipment & supplies) | | | 1,503,440 | | | | 3,918 | |
| | Croda International PLC (Chemicals) | | | 40,213 | | | | 2,873 | |
| | CVS Group PLC (Health care providers & services) | | | 69,129 | | | | 1,737 | |
| | Diageo PLC (Beverages) | | | 216,774 | | | | 9,302 | |
| | Diploma PLC (Trading companies & distributors) | | | 71,239 | | | | 2,700 | |
| | Experian PLC (Professional services) | | | 245,142 | | | | 9,396 | |
| | Greggs PLC (Hotels, restaurants & leisure) | | | 76,713 | | | | 2,488 | |
| | Halma PLC (Electronic equipment, instruments & components) | | | 233,227 | | | | 6,744 | |
| | Intermediate Capital Group PLC (Capital markets) | | | 174,154 | | | | 3,047 | |
| | London Stock Exchange Group PLC (Capital markets) | | | 117,614 | | | | 12,496 | |
| | RELX PLC (Professional services) | | | 138,811 | | | | 4,621 | |
| | Renishaw PLC (Electronic equipment, instruments & components) | | | 26,005 | | | | 1,289 | |
| | | | | | | | |
| | | | | | | | |
| | Issuer | | Shares | | | Value | |
| | | | | | | | |
| | Common Stocks—(continued) | | | | | | | | |
| | | | | | | | | | |
| | United Kingdom—(continued) | | | | | | | | |
| | Rentokil Initial PLC (Commercial services & supplies) | | | 1,279,984 | | | $ | 9,997 | |
| | Rotork PLC (Machinery) | | | 633,414 | | | | 2,452 | |
| | Segro PLC (Industrial REITs) | | | 211,590 | | | | 1,926 | |
| | Softcat PLC (IT services) | | | 88,221 | | | | 1,587 | |
| | Spectris PLC (Electronic equipment, instruments & components) | | | 56,508 | | | | 2,580 | |
| | Spirax-Sarco Engineering PLC (Machinery) | | | 37,170 | | | | 4,893 | |
| | SSE PLC (Electric utilities) | | | 201,389 | | | | 4,709 | |
| | Weir Group PLC (Machinery) | | | 77,275 | | | | 1,723 | |
| | | | | | | | | 141,807 | |
| | | | | | | | | | |
| | Emerging Asia—12.9% | | | | | | | | |
| | China—2.2% | | | | | | | | |
| | Airtac International Group (Machinery) | | | 62,204 | | | | 2,047 | |
| | Contemporary Amperex Technology Co. Ltd. (Electrical equipment) | | | 68,200 | | | | 2,146 | |
| | Kweichow Moutai Co. Ltd. (Beverages) | | | 24,700 | | | | 5,746 | |
| | Proya Cosmetics Co. Ltd. (Personal care products) | | | 69,076 | | | | 1,068 | |
| | Silergy Corp. (Semiconductors & semiconductor equipment) | | | 59,000 | | | | 729 | |
| | Tencent Holdings Ltd. (Interactive media & services) | | | 191,000 | | | | 8,083 | |
| | | | | | | | | 19,819 | |
| | India—5.7% | | | | | | | | |
| | Apollo Hospitals Enterprise Ltd. (Health care providers & services) | | | 29,421 | | | | 1,829 | |
| | Asian Paints Ltd. (Chemicals) | | | 90,481 | | | | 3,706 | |
| | Britannia Industries Ltd. (Food products) | | | 30,874 | | | | 1,891 | |
| | Havells India Ltd. (Electrical equipment) | | | 139,291 | | | | 2,177 | |
| | HDFC Bank Ltd. (Banks) | | | 538,488 | | | | 11,164 | |
| | Hindustan Unilever Ltd. (Personal care products) | | | 141,164 | | | | 4,605 | |
| | Infosys Ltd. (IT services) | | | 228,447 | | | | 3,726 | |
| * | InterGlobe Aviation Ltd. (Passenger airlines) | | | 106,837 | | | | 3,428 | |
| * | Max Healthcare Institute Ltd. (Health care providers & services) | | | 213,463 | | | | 1,561 | |
| | Nestle India Ltd. (Food products) | | | 4,922 | | | | 1,375 | |
| | Petronet LNG Ltd. (Oil, gas & consumable fuels) | | | 694,267 | | | | 1,887 | |
| | Reliance Industries Ltd. (Oil, gas & consumable fuels) | | | 391,968 | | | | 12,200 | |
| | Titan Co. Ltd. (Textiles, apparel & luxury goods) | | | 17,935 | | | | 673 | |
| | Varun Beverages Ltd. (Beverages) | | | 58,804 | | | | 577 | |
| | Voltas Ltd. (Construction & engineering) | | | 150,287 | | | | 1,393 | |
| | | | | | | | | 52,192 | |
See accompanying Notes to Financial Statements.
| June 30, 2023 | William Blair Funds | 47 |
Institutional International Growth Fund
Portfolio of Investments, June 30, 2023 (all dollar amounts in thousands) (unaudited)
| | | | | | | | |
| | | | | | | | |
| | Issuer | | Shares | | | Value | |
| | | | | | | | |
| | Common Stocks—(continued) | | | | | | | | |
| | | | | | | | | | |
| | Emerging Asia—(continued) | | | | | | | | |
| | Indonesia—1.8% | | | | | | | | |
| | Bank Central Asia Tbk PT (Banks) | | | 19,146,830 | | | $ | 11,685 | |
| | Telkom Indonesia Persero Tbk PT (Diversified telecommunication services) | | | 18,256,900 | | | | 4,871 | |
| | | | | | | | | 16,556 | |
| | South Korea—0.4% | | | | | | | | |
| | Samsung SDI Co. Ltd. (Electronic equipment, instruments & components) | | | 7,361 | | | | 3,737 | |
| | Taiwan—2.8% | | | | | | | | |
| | Global Unichip Corp. (Semiconductors & semiconductor equipment) | | | 42,000 | | | | 2,164 | |
| | Globalwafers Co. Ltd. (Semiconductors & semiconductor equipment) | | | 67,000 | | | | 1,069 | |
| | MediaTek, Inc. (Semiconductors & semiconductor equipment) | | | 215,000 | | | | 4,750 | |
| | Taiwan Semiconductor Manufacturing Co. Ltd.—ADR (Semiconductors & semiconductor equipment) | | | 169,600 | | | | 17,116 | |
| | | | | | | | | 25,099 | |
| | | | | | | | | | |
| | Canada—8.4% | | | | | | | | |
| | Boyd Group Services, Inc. (Commercial services & supplies) | | | 8,404 | | | | 1,603 | |
| | Canadian National Railway Co. (Ground transportation) | | | 90,374 | | | | 10,944 | |
| | Canadian Pacific Kansas City Ltd. (Ground transportation) | | | 163,138 | | | | 13,177 | |
| | CCL Industries, Inc. (Containers & packaging) | | | 88,922 | | | | 4,371 | |
| | Dollarama, Inc. (Broadline retail) | | | 151,407 | | | | 10,254 | |
| | Intact Financial Corp. (Insurance) | | | 56,977 | | | | 8,797 | |
| * | Kinaxis, Inc. (Software) | | | 15,033 | | | | 2,148 | |
| * | Lululemon Athletica, Inc. (Textiles, apparel & luxury goods) | | | 10,788 | | | | 4,083 | |
| | Metro, Inc. (Consumer staples distribution & retail) | | | 124,712 | | | | 7,044 | |
| | Parkland Corp. (Oil, gas & consumable fuels) | | | 90,318 | | | | 2,250 | |
| | Toromont Industries Ltd. (Trading companies & distributors) | | | 56,664 | | | | 4,655 | |
| | Toronto-Dominion Bank (Banks) | | | 107,195 | | | | 6,644 | |
| | | | | | | | | 75,970 | |
| | | | | | | | | | |
| | Japan—8.4% | | | | | | | | |
| | Ajinomoto Co., Inc. (Food products) | | | 110,000 | | | | 4,364 | |
| | BayCurrent Consulting, Inc. (Professional services) | | | 52,600 | | | | 1,957 | |
| | Benefit One, Inc. (Professional services) | | | 98,800 | | | | 1,003 | |
| | Daikin Industries Ltd. (Building products) | | | 54,900 | | | | 11,135 | |
| | Disco Corp. (Semiconductors & semiconductor equipment) | | | 20,800 | | | | 3,259 | |
| | Food & Life Cos. Ltd. (Hotels, restaurants & leisure) | | | 61,900 | | | | 1,202 | |
| | | | | | | | |
| | | | | | | | |
| | Issuer | | Shares | | | Value | |
| | | | | | | | |
| | Common Stocks—(continued) | | | | | | | | |
| | | | | | | | | | |
| | Japan—(continued) | | | | | | | | |
| | GMO Payment Gateway, Inc. (Financial services) | | | 20,900 | | | $ | 1,622 | |
| | Harmonic Drive Systems, Inc. (Machinery) | | | 34,700 | | | | 1,109 | |
| | Hoya Corp. (Health care equipment & supplies) | | | 57,600 | | | | 6,816 | |
| | Japan Elevator Service Holdings Co. Ltd. (Commercial services & supplies) | | | 87,100 | | | | 1,135 | |
| | Keyence Corp. (Electronic equipment, instruments & components) | | | 29,000 | | | | 13,636 | |
| | MonotaRO Co. Ltd. (Trading companies & distributors) | | | 222,200 | | | | 2,807 | |
| | Rakus Co. Ltd. (Software) | | | 91,900 | | | | 1,547 | |
| * | SHIFT, Inc. (IT services) | | | 9,400 | | | | 1,707 | |
| | Shin-Etsu Chemical Co. Ltd. (Chemicals) | | | 221,600 | | | | 7,323 | |
| | SMS Co. Ltd. (Professional services) | | | 42,200 | | | | 840 | |
| | TechnoPro Holdings, Inc. (Professional services) | | | 108,600 | | | | 2,335 | |
| | TIS, Inc. (IT services) | | | 98,100 | | | | 2,441 | |
| | Tokio Marine Holdings, Inc. (Insurance) | | | 223,200 | | | | 5,128 | |
| | Tokyo Electron Ltd. (Semiconductors & semiconductor equipment) | | | 31,400 | | | | 4,474 | |
| | | | | | | | | 75,840 | |
| | | | | | | | | | |
| | Asia—3.7% | | | | | | | | |
| | Australia—1.4% | | | | | | | | |
| | CSL Ltd. (Biotechnology) | | | 38,138 | | | | 7,047 | |
| | IDP Education Ltd. (Diversified consumer services) | | | 62,071 | | | | 914 | |
| | Pro Medicus Ltd. (Health care technology) | | | 46,494 | | | | 2,033 | |
| | Steadfast Group Ltd. (Insurance) | | | 665,203 | | | | 2,659 | |
| | | | | | | | | 12,653 | |
| | Hong Kong—1.7% | | | | | | | | |
| | AIA Group Ltd. (Insurance) | | | 1,010,863 | | | | 10,204 | |
| | Techtronic Industries Co. Ltd. (Machinery) | | | 467,000 | | | | 5,075 | |
| | | | | | | | | 15,279 | |
| | Singapore—0.6% | | | | | | | | |
| | DBS Group Holdings Ltd. (Banks) | | | 239,300 | | | | 5,575 | |
| | | | | | | | | | |
| | Emerging Latin America—3.7% | | | | | | | | |
| | Argentina—0.3% | | | | | | | | |
| * | Globant SA (IT services) | | | 13,232 | | | | 2,378 | |
| | Brazil—1.8% | | | | | | | | |
| | B3 SA - Brasil Bolsa Balcao (Capital markets) | | | 1,467,000 | | | | 4,476 | |
| | Locaweb Servicos de Internet SA (IT services) | | | 705,586 | | | | 1,264 | |
| * | MercadoLibre, Inc. (Broadline retail) | | | 3,595 | | | | 4,259 | |
| | Raia Drogasil SA (Consumer staples distribution & retail) | | | 451,400 | | | | 2,791 | |
See accompanying Notes to Financial Statements.
| 48 | Semiannual Report | June 30, 2023 |
Institutional International Growth Fund
Portfolio of Investments, June 30, 2023 (all dollar amounts in thousands) (unaudited)
| | Issuer | | Shares or
Principal
Amount | | | Value | |
| | | | | | | | | | |
| | Common Stocks—(continued) | | | | | | | | |
| | | | | | | | | | |
| | Emerging Latin America—(continued) | | | | | | | | |
| | Brazil—(continued) | | | | | | | | |
| | Rumo SA (Ground transportation) | | | 400,800 | | | $ | 1,858 | |
| | WEG SA (Electrical equipment) | | | 209,600 | | | | 1,652 | |
| | | | | | | | | 16,300 | |
| | Mexico—1.4% | | | | | | | | |
| | Grupo Aeroportuario del Sureste SAB de CV—ADR (Transportation infrastructure) | | | 6,457 | | | | 1,793 | |
| | Wal-Mart de Mexico SAB de CV (Consumer staples distribution & retail) | | | 2,833,800 | | | | 11,240 | |
| | | | | | | | | 13,033 | |
| | Peru—0.2% | | | | | | | | |
| | Credicorp Ltd. (Banks) | | | 12,110 | | | | 1,788 | |
| | | | | | | | | | |
| | Emerging Africa—0.3% | | | | | | | | |
| | South Africa—0.3% | | | | | | | | |
| | Bid Corp. Ltd. (Consumer staples distribution & retail) | | | 143,874 | | | | 3,159 | |
| | Total Common Stocks—95.7%
(cost $646,792) | | | | | | | 868,779 | |
| | | | | | | | | | |
| | Repurchase Agreement | | | | | | | | |
| | Fixed Income Clearing Corporation, 2.100% dated 06/30/23, due 07/03/23, repurchase price $27,627, collateralized by U.S. Treasury Note, 1.375%, due 11/15/31, valued at $28,175 | | | $27,622 | | | | 27,622 | |
| | Total Repurchase Agreement—3.1%
(cost $27,622) | | | | | | | 27,622 | |
| | Total Investments—98.8%
(cost $674,414) | | | | | | | 896,401 | |
| | Cash and other assets, less liabilities—1.2% | | | | | | | 11,341 | |
| | Net assets—100.0% | | | | | | $ | 907,742 | |
ADR = American Depository Receipt
REIT = Real Estate Investment Trust
* = Non-income producing security
† = U.S. listed foreign security
At June 30, 2023, the Fund’s Portfolio of Investments includes the following industry categories (as a percentage of long-term investments):
| Industrials | | | 26.6 | % |
| Information Technology | | | 16.7 | % |
| Financials | | | 13.9 | % |
| Health Care | | | 13.0 | % |
| Consumer Discretionary | | | 11.5 | % |
| Consumer Staples | | | 7.7 | % |
| Materials | | | 5.1 | % |
| Energy | | | 2.3 | % |
| Communication Services | | | 2.1 | % |
| Real Estate | | | 0.6 | % |
| Utilities | | | 0.5 | % |
| Total | | | 100.0 | % |
At June 30, 2023, the Fund’s Portfolio of Investments includes the following currency categories (as a percentage of long-term investments):
| Euro | | | 24.8 | % |
| British Pound Sterling | | | 16.0 | % |
| U.S. Dollar | | | 9.8 | % |
| Japanese Yen | | | 8.7 | % |
| Canadian Dollar | | | 6.8 | % |
| Swiss Franc | | | 6.1 | % |
| Indian Rupee | | | 6.0 | % |
| Danish Krone | | | 4.6 | % |
| Swedish Krona | | | 4.2 | % |
| Hong Kong Dollar | | | 2.7 | % |
| Indonesian Rupiah | | | 1.9 | % |
| Australian Dollar | | | 1.5 | % |
| Brazilian Real | | | 1.4 | % |
| Mexican Peso | | | 1.3 | % |
| New Taiwan Dollar | | | 1.2 | % |
| Chinese Yuan Renminbi | | | 1.0 | % |
| All Other Currencies | | | 2.0 | % |
| Total | | | 100.0 | % |
See accompanying Notes to Financial Statements.
| June 30, 2023 | William Blair Funds | 49 |
| | International Small Cap Growth Fund |
| | |
| | The International Small Cap Growth Fund seeks long-term capital appreciation. |
| | |
| | AN OVERVIEW FROM THE PORTFOLIO MANAGERS |
| | |

Simon Fennell 
D. J. Neiman, CFA | The William Blair International Small Cap Growth Fund (Class N shares) (the “Fund”) posted an 8.66% increase, net of fees, for the six months ended June 30, 2023. By comparison, the Fund’s benchmark index, the MSCI All Country World ex-U.S. Small Cap Index (net) (the “Index”), increased 6.84%. Six-month outperformance versus the Index was primarily driven by strong relative performance in the first quarter of 2023. From an attribution perspective, favorable allocation effects across sectors, especially the underweight to Real Estate, coupled with positive stock selection within the Health Care and Consumer Discretionary sectors, more than offset weaker stock selection within Consumer Staples and Industrials. Health Care stock selection was bolstered by Abcam. Abcam is a leading producer and distributor of life sciences reagents that are fundamental to scientific research. Abcam participates in a market with strong competitors, and consistent new product launches are a requirement to maintain a competitive edge. Abcam’s platform and ongoing relationships with life sciences researchers enable the company to see growing areas of interest in the research community and product launches can be tailored appropriately. The share price strengthened in June after the company announced the possibility of strategic transaction. The comprehensive transaction process will begin immediately and will evaluate a broad range of options to maximize shareholder value, including a potential sale of the company. Consumer Discretionary stock selection was positive due to Jumbo. Jumbo is a variety discount retailer operating 82 stores across Greece (52% of sales) and southern/central Europe (Romania is the No. 2 market). In our view, the appeal of Jumbo is its unique assortment; key categories are seasonal, home products, and toys. The strong returns profile and long-track record of success can be attributed to operational execution (excellent merchandising, cost discipline, working capital management, etc.). The company started off the year strong by delivering 40% sales growth in January and February following a 14% increase in fiscal year 2022. Strong earnings and subsequent upgrades drove share price expansion year-to-date. Partially offsetting these effects was weaker stock selection within Consumer Staples driven by Sichuan Swellfun. Sichuan Swellfun was established in 1993 but traces its origins to China’s oldest baijiu distillery with more than 600 years of history dating to the late Yuan and early Ming dynasties. It is a national strong flavor baijiu brand with well-known high-end positioning. The share price softened on lower first-quarter results, slower payments from distributors as the company focused on reducing inventories, and slow demand recovery. Information Technology stock selection was slightly weaker due to Kin & Carta. Kin & Carta is a digital information technology service consultancy and provider, with strong presence in the United States and growing presence in Europe. The company completed a business transformation over the past three years and is now a focused, pure digital information technology services company. The share price sharply declined in February with the company pointing to significant macroeconomic headwinds, resulting in a first-half 2023 organic revenue decline of 6%. Kin & Carta’s trading update reflects macroeconomic uncertainties impacting customer spending, elongated sales cycles, and slower project ramp-up. We exited the position on continued demand weakness and lowered confidence of a near-term recovery, after the company’s third-quarter trading update. Please refer to the Global Markets Review and Outlook relating to the Fund on page 29. |
| | | |
| 50 | Semiannual Report | June 30, 2023 |
International Small Cap Growth Fund
Performance Highlights (Unaudited)
| Average Annual Total Returns through 6/30/2023 |
| | | Year to
Date | | 1 Year | | 3 Year | | 5 Year | | 10 Year |
| Class N | | | 8.66 | % | | | 15.43 | % | | | 1.24 | % | | | 1.20 | % | | | 4.23 | % |
| Class I | | | 8.81 | | | | 15.71 | | | | 1.49 | | | | 1.46 | | | | 4.53 | |
| Class R6 | | | 8.84 | | | | 15.70 | | | | 1.58 | | | | 1.55 | | | | 4.64 | |
| MSCI ACW ex-U.S. Small Cap Index (net) | | | 6.84 | | | | 10.93 | | | | 8.15 | | | | 2.62 | | | | 5.75 | |
Performance cited represents past performance. Past performance does not guarantee future results and current performance may be lower or higher than the data quoted. Results shown are average annual total returns, which assume reinvestment of dividends and capital gains. Investment returns and principal will fluctuate and you may have a gain or loss when you sell shares. For the most current month-end performance information, please call 1-800-742-7272, or visit our Web site at www.williamblairfunds.com. From time to time, the investment adviser may waive fees or reimburse expenses for the Fund. Without these waivers/reimbursements, performance would be lower. Investing in smaller companies involves special risks, including higher volatility and lower liquidity. Smaller capitalization stocks are also more sensitive to purchase/sale transactions and changes in the issuer’s financial condition. International investing involves special risk considerations, including currency fluctuations, lower liquidity, economic and political risk. Class N shares are not subject to a sales load. Class I shares are not subject to a sales load or distribution (Rule 12b-1) fees. Class R6 shares are not subject to a sales load, distribution (Rule 12b-1) fees, or sub-transfer agent fees.
The performance highlights and graph presented above do not reflect the deduction of taxes that a shareholder would pay on fund distributions or the redemption of fund shares.
The Morgan Stanley Capital International (MSCI) All Country World (ACW) ex-U.S. Small Cap Index (net) is a free float-adjusted market capitalization weighted index that is designed to measure the equity market performance of small capitalization developed and emerging markets, excluding the United States. This index approximates the minimum possible dividend reinvestment by deducting for the highest possible withholding tax rates of those markets.
This report identifies the Fund’s investments on June 30, 2023. These holdings are subject to change. Not all stocks in the Fund performed the same, nor is there any guarantee that these stocks will perform as well in the future. Market forecasts provided in this report may not necessarily come to pass.
Sector Diversification (Unaudited)
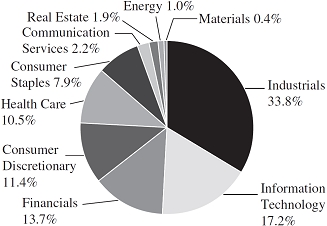
The sector diversification shown is based on the total long-term securities.
| June 30, 2023 | William Blair Funds | 51 |
International Small Cap Growth Fund
Portfolio of Investments, June 30, 2023 (all dollar amounts in thousands) (unaudited)
| | | | | | | | | | |
| | | | | | | | | | |
| | Issuer | | Shares | | | | Value | |
| | | | | | | | | | |
| | Common Stocks | | | | | | | | |
| | | | | | | | | | |
| | Europe, Mid-East—35.4% | | | | | | | | |
| | Belgium—1.4% | | | | | | | | |
| | Melexis NV (Semiconductors & semiconductor equipment) | | | 24,098 | | | $ | 2,364 | |
| | Warehouses De Pauw CVA (Industrial REITs) | | | 32,789 | | | | 899 | |
| | | | | | | | | 3,263 | |
| | Finland—1.2% | | | | | | | | |
| * | Musti Group Oyj (Specialty retail) | | | 53,728 | | | | 1,049 | |
| | Valmet Oyj (Machinery) | | | 60,893 | | | | 1,693 | |
| | | | | | | | | 2,742 | |
| | France—2.5% | | | | | | | | |
| | Dassault Aviation SA (Aerospace & defense) | | | 15,023 | | | | 3,006 | |
| | SEB SA (Household durables) | | | 10,908 | | | | 1,127 | |
| * | SES-imagotag SA (Electronic equipment, instruments & components) | | | 17,337 | | | | 1,778 | |
| | | | | | | | | 5,911 | |
| | Germany—2.8% | | | | | | | | |
| | CTS Eventim AG & Co. KGaA (Entertainment) | | | 58,608 | | | | 3,699 | |
| | Siltronic AG (Semiconductors & semiconductor equipment) | | | 37,819 | | | | 2,889 | |
| | | | | | | | | 6,588 | |
| | Israel—2.2% | | | | | | | | |
| | First International Bank Of Israel Ltd. (Banks) | | | 32,443 | | | | 1,262 | |
| * | Inmode Ltd. (Health care equipment & supplies)† | | | 93,415 | | | | 3,489 | |
| | Maytronics Ltd. (Household durables) | | | 37,210 | | | | 509 | |
| | | | | | | | | 5,260 | |
| | Italy—5.7% | | | | | | | | |
| | Amplifon SpA (Health care providers & services) | | | 28,685 | | | | 1,051 | |
| | Ariston Holding NV (Household durables) | | | 374,983 | | | | 3,961 | |
| | Azimut Holding SpA (Capital markets) | | | 62,247 | | | | 1,342 | |
| | Brembo SpA (Automobile components) | | | 122,410 | | | | 1,814 | |
| | Brunello Cucinelli SpA (Textiles, apparel & luxury goods) | | | 33,271 | | | | 2,926 | |
| | Carel Industries SpA (Building products) | | | 74,169 | | | | 2,234 | |
| | | | | | | | | 13,328 | |
| | Netherlands—2.8% | | | | | | | | |
| | BE Semiconductor Industries NV (Semiconductors & semiconductor equipment) | | | 45,474 | | | | 4,927 | |
| | JDE Peet’s NV (Food products) | | | 52,803 | | | | 1,571 | |
| | | | | | | | | 6,498 | |
| | Norway—1.9% | | | | | | | | |
| * | AutoStore Holdings Ltd. (Machinery) | | | 602,464 | | | | 1,316 | |
| | Gjensidige Forsikring ASA (Insurance) | | | 130,099 | | | | 2,083 | |
| | TOMRA Systems ASA (Machinery) | | | 71,439 | | | | 1,148 | |
| | | | | | | | | 4,547 | |
| | | | | | | | |
| | | | | | | | |
| | Issuer | | Shares | | | Value | |
| | | | | | | | | | |
| | Common Stocks—(continued) | | | | | | | | |
| | | | | | | | | | |
| | Europe, Mid-East—(continued) | | | | | | | | |
| | Sweden—11.2% | | | | | | | | |
| | AddTech AB (Trading companies & distributors) | | | 141,579 | | | $ | 3,082 | |
| | Beijer Ref AB (Trading companies & distributors) | | | 192,421 | | | | 2,455 | |
| | Biotage AB (Life sciences tools & services) | | | 126,170 | | | | 1,570 | |
| | Bravida Holding AB (Commercial services & supplies) | | | 108,995 | | | | 1,047 | |
| | Bufab AB (Trading companies & distributors) | | | 59,829 | | | | 2,046 | |
| | Fortnox AB (Software) | | | 475,444 | | | | 2,807 | |
| | Hemnet Group AB (Interactive media & services) | | | 83,941 | | | | 1,469 | |
| | Lagercrantz Group AB (Electronic equipment, instruments & components) | | | 186,364 | | | | 2,402 | |
| | Lifco AB (Industrial conglomerates) | | | 120,213 | | | | 2,612 | |
| | MIPS AB (Leisure products) | | | 33,646 | | | | 1,666 | |
| | Nolato AB (Industrial conglomerates) | | | 184,638 | | | | 868 | |
| * | Sdiptech AB (Commercial services & supplies) | | | 61,101 | | | | 1,514 | |
| | Sweco AB (Construction & engineering) | | | 140,746 | | | | 1,549 | |
| | Vitrolife AB (Biotechnology) | | | 69,441 | | | | 1,348 | |
| | | | | | | | | 26,435 | |
| | Switzerland—3.7% | | | | | | | | |
| | Galenica AG (Health care providers & services) | | | 39,876 | | | | 3,219 | |
| | Kardex Holding AG (Machinery) | | | 14,584 | | | | 3,267 | |
| * | Siegfried Holding AG (Life sciences tools & services) | | | 2,762 | | | | 2,280 | |
| | | | | | | | | 8,766 | |
| | | | | | | | | | |
| | Emerging Asia—15.3% | | | | | | | | |
| | China—2.7% | | | | | | | | |
| | Chacha Food Co. Ltd. (Food products) | | | 425,200 | | | | 2,430 | |
| | Proya Cosmetics Co. Ltd. (Personal care products) | | | 161,991 | | | | 2,505 | |
| | Sichuan Swellfun Co. Ltd. (Beverages) | | | 185,782 | | | | 1,507 | |
| | | | | | | | | 6,442 | |
| | India—8.2% | | | | | | | | |
| * | Aavas Financiers Ltd. (Financial services) | | | 94,131 | | | | 1,767 | |
| | AU Small Finance Bank Ltd. (Banks) | | | 518,711 | | | | 4,769 | |
| | Cholamandalam Investment & Finance Co. Ltd. (Consumer finance) | | | 125,839 | | | | 1,752 | |
| * | Max Healthcare Institute Ltd. (Health care providers & services) | | | 189,427 | | | | 1,385 | |
| | Motherson Sumi Wiring India Ltd. (Automobile components) | | | 2,691,267 | | | | 1,893 | |
| | Polycab India Ltd. (Electrical equipment) | | | 50,074 | | | | 2,169 | |
| | Tube Investments of India Ltd. (Automobile components) | | | 38,848 | | | | 1,506 | |
See accompanying Notes to Financial Statements.
| 52 | Semiannual Report | June 30, 2023 |
International Small Cap Growth Fund
Portfolio of Investments, June 30, 2023 (all dollar amounts in thousands) (unaudited)
| | | | | | | | |
| | | | | | | | |
| | Issuer | | Shares | | | Value | |
| | | | | | | | | | |
| | Common Stocks—(continued) | | | | | | | | |
| | | | | | | | | | |
| | Emerging Asia—(continued) | | | | | | | | |
| | India—(continued) | | | | | | | | |
| | UPL Ltd. (Chemicals) | | | 109,096 | | | $ | 914 | |
| | Varun Beverages Ltd. (Beverages) | | | 322,366 | | | | 3,163 | |
| | | | | | | | | 19,318 | |
| | Indonesia—0.5% | | | | | | | | |
| | Bank Negara Indonesia Persero Tbk PT (Banks) | | | 1,919,700 | | | | 1,172 | |
| | South Korea—0.7% | | | | | | | | |
| | Koh Young Technology, Inc. (Semiconductors & semiconductor equipment) | | | 133,605 | | | | 1,561 | |
| | Taiwan—2.7% | | | | | | | | |
| | ASPEED Technology, Inc. (Semiconductors & semiconductor equipment) | | | 23,600 | | | | 2,160 | |
| | Global Unichip Corp. (Semiconductors & semiconductor equipment) | | | 34,000 | | | | 1,752 | |
| | Voltronic Power Technology Corp. (Electrical equipment) | | | 38,451 | | | | 2,426 | |
| | | | | | | | | 6,338 | |
| | Thailand—0.5% | | | | | | | | |
| | Tisco Financial Group PCL (Banks) | | | 424,700 | | | | 1,162 | |
| | | | | | | | | | |
| | United Kingdom—13.2% | | | | | | | | |
| * | Abcam PLC—ADR (Biotechnology) | | | 153,084 | | | | 3,746 | |
| | Beazley PLC (Insurance) | | | 512,524 | | | | 3,834 | |
| | Burford Capital Ltd. (Financial services) | | | 167,016 | | | | 2,033 | |
| | CVS Group PLC (Health care providers & services) | | | 55,984 | | | | 1,407 | |
| | Diploma PLC (Trading companies & distributors) | | | 115,453 | | | | 4,375 | |
| | Greggs PLC (Hotels, restaurants & leisure) | | | 78,644 | | | | 2,551 | |
| | IntegraFin Holdings PLC (Capital markets) | | | 248,998 | | | | 749 | |
| | Pets at Home Group PLC (Specialty retail) | | | 394,651 | | | | 1,888 | |
| | Renishaw PLC (Electronic equipment, instruments & components) | | | 59,245 | | | | 2,936 | |
| | Rotork PLC (Machinery) | | | 1,021,784 | | | | 3,955 | |
| | Safestore Holdings PLC (Specialized REITs) | | | 86,867 | | | | 937 | |
| | Softcat PLC (IT services) | | | 148,460 | | | | 2,670 | |
| | | | | | | | | 31,081 | |
| | | | | | | | | | |
| | Japan—12.8% | | | | | | | | |
| | AZ-COM MARUWA Holdings, Inc. (Air freight & logistics) | | | 118,000 | | | | 1,579 | |
| | BayCurrent Consulting, Inc. (Professional services) | | | 104,200 | | | | 3,876 | |
| | Benefit One, Inc. (Professional services) | | | 167,300 | | | | 1,699 | |
| | Food & Life Cos. Ltd. (Hotels, restaurants & leisure) | | | 76,500 | | | | 1,485 | |
| | Fukuoka Financial Group, Inc. (Banks) | | | 49,900 | | | | 1,028 | |
| | GMO Payment Gateway, Inc. (Financial services) | | | 14,700 | | | | 1,141 | |
| | | | | | | | |
| | | | | | | | |
| | Issuer | | Shares | | | Value | |
| | | | | | | | | | |
| | Common Stocks—(continued) | | | | | | | | |
| | | | | | | | | | |
| | Japan—(continued) | | | | | | | | |
| | Japan Elevator Service Holdings Co. Ltd. (Commercial services & supplies) | | | 168,000 | | | $ | 2,190 | |
| | Kotobuki Spirits Co. Ltd. (Food products) | | | 12,500 | | | | 911 | |
| | Meitec Corp. (Professional services) | | | 126,200 | | | | 2,164 | |
| | Nihon M&A Center Holdings, Inc. (Professional services) | | | 88,200 | | | | 672 | |
| | Prestige International, Inc. (Commercial services & supplies) | | | 175,100 | | | | 738 | |
| | Rakus Co. Ltd. (Software) | | | 79,700 | | | | 1,342 | |
| * | SHIFT, Inc. (IT services) | | | 12,500 | | | | 2,269 | |
| | SIGMAXYZ Holdings, Inc. (Professional services) | | | 93,200 | | | | 893 | |
| | SMS Co. Ltd. (Professional services) | | | 146,900 | | | | 2,925 | |
| | TechnoPro Holdings, Inc. (Professional services) | | | 162,300 | | | | 3,490 | |
| | TIS, Inc. (IT services) | | | 63,900 | | | | 1,590 | |
| | | | | | | | | 29,992 | |
| | | | | | | | | | |
| | Emerging Latin America—7.0% | | | | | | | | |
| | Brazil—2.3% | | | | | | | | |
| | Arezzo Industria e Comercio SA (Textiles, apparel & luxury goods) | | | 60,000 | | | | 991 | |
| | Rumo SA (Ground transportation) | | | 412,500 | | | | 1,912 | |
| | TOTVS SA (Software) | | | 379,300 | | | | 2,375 | |
| | | | | | | | | 5,278 | |
| | Mexico—4.7% | | | | | | | | |
| * | Corp. Inmobiliaria Vesta SAB de CV—ADR (Real estate management & development) | | | 6,440 | | | | 208 | |
| | Corp. Inmobiliaria Vesta SAB de CV (Real estate management & development) | | | 708,900 | | | | 2,301 | |
| | Grupo Aeroportuario del Centro Norte SAB de CV (Transportation infrastructure) | | | 360,400 | | | | 3,832 | |
| | Grupo Aeroportuario del Sureste SAB de CV (Transportation infrastructure) | | | 85,825 | | | | 2,399 | |
| | Qualitas Controladora SAB de CV (Insurance) | | | 172,900 | | | | 1,279 | |
| | Regional SAB de CV (Banks) | | | 151,900 | | | | 1,101 | |
| | | | | | | | | 11,120 | |
| | | | | | | | | | |
| | Canada—5.8% | | | | | | | | |
| | Boyd Group Services, Inc. (Commercial services & supplies) | | | 14,418 | | | | 2,751 | |
| | EQB, Inc. (Banks) | | | 27,751 | | | | 1,466 | |
| * | Kinaxis, Inc. (Software) | | | 25,967 | | | | 3,711 | |
| | North West Co., Inc. (Consumer staples distribution & retail) | | | 90,881 | | | | 2,154 | |
| | Parkland Corp. (Oil, gas & consumable fuels) | | | 94,145 | | | | 2,345 | |
| | Richelieu Hardware Ltd. (Trading companies & distributors) | | | 39,334 | | | | 1,244 | |
| | | | | | | | | 13,671 | |
See accompanying Notes to Financial Statements.
| June 30, 2023 | William Blair Funds | 53 |
International Small Cap Growth Fund
Portfolio of Investments, June 30, 2023 (all dollar amounts in thousands) (unaudited)
| | Issuer | | Shares or
Principal
Amount | | | Value | |
| | | | | | | | | | |
| | Common Stocks—(continued) | | | | | | | | |
| | | | | | | | | | |
| | Asia—5.4% | | | | | | | | |
| | Australia—4.0% | | | | | | | | |
| | EBOS Group Ltd. (Health care providers & services) | | | 85,965 | | | $ | 1,939 | |
| | IDP Education Ltd. (Diversified consumer services) | | | 54,750 | | | | 806 | |
| | Johns Lyng Group Ltd. (Construction & engineering) | | | 165,368 | | | | 586 | |
| | Pro Medicus Ltd. (Health care technology) | | | 60,356 | | | | 2,639 | |
| | Steadfast Group Ltd. (Insurance) | | | 878,798 | | | | 3,512 | |
| | | | | | | | | 9,482 | |
| | New Zealand—1.4% | | | | | | | | |
| | Mainfreight Ltd. (Air freight & logistics) | | | 73,165 | | | | 3,233 | |
| | | | | | | | | | |
| | Emerging Europe, Africa—3.0% | | | | | | | | |
| | Greece—0.9% | | | | | | | | |
| | JUMBO SA (Specialty retail) | | | 74,025 | | | | 2,036 | |
| | Poland—0.6% | | | | | | | | |
| | *Dino Polska SA (Consumer staples distribution & retail) | | | 12,438 | | | | 1,452 | |
| | South Africa—1.5% | | | | | | | | |
| | Bidvest Group Ltd. (Industrial conglomerates) | | | 86,478 | | | | 1,202 | |
| | Clicks Group Ltd. (Consumer staples distribution & retail) | | | 174,416 | | | | 2,421 | |
| | | | | | | | | 3,623 | |
| | Total Common Stocks—97.9%
(cost $211,082) | | | | | | | 230,299 | |
| | Repurchase Agreement | | | | | | | | |
| | Fixed Income Clearing Corporation, 2.100% dated 06/30/23, due 07/03/23, repurchase price $4,923, collateralized by U.S. Treasury Note, 1.250%, due 08/15/31, valued at $5,021 | | | $4,922 | | | | 4,922 | |
| | Total Repurchase Agreement—2.1%
(cost $4,922) | | | | | | | 4,922 | |
| | Total Investments—100.0%
(cost $216,004) | | | | | | | 235,221 | |
| | Cash and other assets, less liabilities—0.0% | | | | | | | 113 | |
| | Net assets—100.0% | | | | | | $ | 235,334 | |
ADR = American Depository Receipt
REIT = Real Estate Investment Trust
* = Non-income producing security
† = U.S. listed foreign security
At June 30, 2023, the Fund’s Portfolio of Investments includes the following industry categories (as a percentage of long-term investments):
| Industrials | 33.8% |
| Information Technology | 17.2% |
| Financials | 13.7% |
| Consumer Discretionary | 11.4% |
| Health Care | 10.5% |
| Consumer Staples | 7.9% |
| Communication Services | 2.2% |
| Real Estate | 1.9% |
| Energy | 1.0% |
| Materials | 0.4% |
| Total | 100.0% |
At June 30, 2023, the Fund’s Portfolio of Investments includes the following currency categories (as a percentage of long-term investments):
| Euro | 17.5% |
| Japanese Yen | 13.0% |
| British Pound Sterling | 11.9% |
| Swedish Krona | 11.5% |
| Indian Rupee | 8.4% |
| Canadian Dollar | 5.9% |
| Mexican Peso | 4.7% |
| Swiss Franc | 3.8% |
| Australian Dollar | 3.3% |
| U.S. Dollar | 3.2% |
| Chinese Yuan Renminbi | 2.8% |
| New Taiwan Dollar | 2.8% |
| Brazilian Real | 2.3% |
| New Zealand Dollar | 2.2% |
| Norwegian Krone | 2.0% |
| South African Rand | 1.6% |
| All Other Currencies | 3.1% |
| Total | 100.0% |
See accompanying Notes to Financial Statements.
| 54 | Semiannual Report | June 30, 2023 |
| | Emerging Markets Leaders Fund |
| | |
| | The Emerging Markets Leaders Fund seeks long-term capital appreciation. |
| | |
| | AN OVERVIEW FROM THE PORTFOLIO MANAGERS |
| | |

Todd M. McClone, CFA 
Kenneth J. McAtamney 
Hugo Scott-Gall | The William Blair Emerging Markets Leaders Fund (Class N shares) (the “Fund”) posted a 4.70% increase, net of fees, for the six months ended June 30, 2023. By comparison, the Fund’s benchmark index, the MSCI Emerging Markets Index (net) (the “Index”), increased 4.89%. The slight underperformance against the Index year-to-date was partly due to style headwinds amid strong outperformance of low valuation stocks. From a sector perspective, the underperformance was driven by negative stock selection within Chinese Consumer Discretionary holdings and Energy exposure. Within the Consumer Discretionary sector, China Tourism Duty Free (“China Tourism”) and JD.com (“JD”) were notable detractors to relative results. China Tourism is the leading Chinese duty-free operator. Following a sharp rally in late 2022, as the government announced the abandonment of COVID-19 lockdowns, the stock has weakened year-to-date amid concerns about the pace of the consumer recovery in China and specifically the slow resumption of international travel. While China Tourism operates non-airport duty free shopping, foot traffic in those locations has been lighter than expected. Additionally, operational concerns including gate capacity at arrival airports and maintenance requirements for wide-body jets that were not operated through China’s COVID-19 lockdowns have reduced near-term expectations for a sales recovery in airport locations. JD, which has also faced headwinds from the slower-than-expected consumer recovery in China, was sold on our view of a diminished competitive advantage as the barriers to entry for JD’s logistics business have fallen and there has been a rapid increase of competition in e-commerce from streaming video platforms and other smaller players. Both companies were exited in the second quarter. Despite strong performance by the Energy sector, relative performance was hampered by weak performance by Indian company Reliance Industries Limited (“Reliance”), driven by its diversified business model and lower exposure to energy commodities. We believe Reliance’s transformation from an asset-heavy, cyclical energy business to more diversified, end-consumer businesses with a large and expanding total addressable market will continue to drive strong growth and returns over the long term, while the legacy energy business will continue to provide earnings support in the near term. The stock underperformed early in the year on broad weakness in Indian equities but has recovered into the second quarter as India recovered and Reliance’s fundamental results were strong, quelling investor concerns about Reliance’s increased capital expenditure and rising debt level as well as slower Indian retail growth. Partially offsetting these effects was an overweight to and positive stock selection within Brazil, including MercadoLibre and Banco BTG Pactual (“BTG Pactual”) and positioning within the Information Technology sector. MercadoLibre is a leading e-commerce platform in Latin America with a best-in-class ecosystem of services such as logistics and payments, which allows the company to exploit attractive growth opportunities of the large and underpenetrated total addressable market. MercadoLibre continued to deliver strong results in the fourth quarter of 2022 with robust improvement in profitability that exceeded consensus expectations on the back of its expanding market share in commerce and fintech and increasing traffic monetization and user engagement. BTG Pactual is an investment bank and wealth/asset manager based in Brazil with a presence across Latin America. The company still operates as a partnership and has been on a path of diversifying revenues away from the more volatile investment banking business into a more stable revenue stream from its wealth and asset management and corporate lending businesses. BTG Pactual outperformed on a combination of Brazil’s recovery and strong fundamental results led by above-expectations growth in the more stable business units mentioned above. |
| | | |
| June 30, 2023 | William Blair Funds | 55 |
Emerging Markets Leaders Fund
Within the Information Technology sector, hardware positions drove strong relative performance, led by Taiwan Semiconductor Manufacturing Company (“TSMC”). TSMC is the world-leading independent foundry with unique manufacturing capabilities in leading edge chips. The stock strengthened despite challenging near-term dynamics, including soft demand from China as cutting-edge technology companies globally outperformed on expectations for artificial intelligence to drive long-term demand. Additionally, management provided an encouraging semiconductor cycle outlook for the end of 2023 despite near-term weakness as TSMC expects the ongoing inventory correction to bottom in the first half of 2023, followed by a recovery later in the year.
Please refer to the Global Markets Review and Outlook relating to the Fund on page 29.
| 56 | Semiannual Report | June 30, 2023 |
Emerging Markets Leaders Fund
Performance Highlights (Unaudited)
| Average Annual Total Returns through 6/30/2023 |
| | | Year to
Date | | 1 Year | | 3 Year | | 5 Year | | 10 Year |
| Class N | | | 4.70 | % | | | 1.11 | % | | | (1.65 | )% | | | 0.56 | % | | | 2.56 | % |
| Class I | | | 4.69 | | | | 1.22 | | | | (1.46 | ) | | | 0.81 | | | | 2.84 | |
| Class R6 | | | 4.81 | | | | 1.22 | | | | (1.39 | ) | | | 0.86 | | | | 2.91 | |
| MSCI Emerging Markets Index (net) | | | 4.89 | | | | 1.75 | | | | 2.32 | | | | 0.93 | | | | 2.95 | |
Performance cited represents past performance. Past performance does not guarantee future results and current performance may be lower or higher than the data quoted. Results shown are average annual total returns, which assume reinvestment of dividends and capital gains. Investment returns and principal will fluctuate and you may have a gain or loss when you sell shares. For the most current month-end performance information, please call 1-800-742-7272, or visit our Web site at www.williamblairfunds.com. International investing involves special risk considerations, including currency fluctuations, lower liquidity, economic and political risk. These risks may be magnified when investing in emerging markets. From time to time, the investment adviser may waive fees or reimburse expenses for the Fund. Without these waivers/reimbursements, performance would be lower. Class N shares are not subject to a sales load. Class I shares are not subject to a sales load or distribution (Rule 12b-1) fees. Class R6 shares are not subject to a sales load, distribution (Rule 12b-1) fees, or sub-transfer agent fees.
The performance highlights and graph presented above do not reflect the deduction of taxes that a shareholder would pay on fund distributions or the redemption of fund shares.
The Morgan Stanley Capital International (MSCI) Emerging Markets Index (net) is a free float-adjusted market-capitalization-weighted index that is designed to measure equity market performance of emerging markets. This index approximates the minimum possible dividend reinvestment by deducting for the highest possible withholding tax rates of those markets.
This report identifies the Fund’s investments on June 30, 2023. These holdings are subject to change. Not all stocks in the Fund performed the same, nor is there any guarantee that these stocks will perform as well in the future. Market forecasts provided in this report may not necessarily come to pass.
Sector Diversification (Unaudited)

The sector diversification shown is based on the total long-term securities.
| June 30, 2023 | William Blair Funds | 57 |
Emerging Markets Leaders Fund
Portfolio of Investments, June 30, 2023 (all dollar amounts in thousands) (unaudited)
| | | | | | | | |
| | | | | | | | |
| | Issuer | | Shares | | | Value | |
| | | | | | | | | | |
| | Common Stocks | | | | | | | | |
| | | | | | | | | | |
| | Emerging Asia—71.2% | | | | | | | | |
| | China—23.1% | | | | | | | | |
| | Airtac International Group (Machinery) | | | 137,000 | | | $ | 4,509 | |
| * | Alibaba Group Holding Ltd. (Broadline retail) | | | 743,328 | | | | 7,703 | |
| | ANTA Sports Products Ltd. (Textiles, apparel & luxury goods) | | | 289,000 | | | | 2,952 | |
| | China Merchants Bank Co. Ltd. (Banks) | | | 988,000 | | | | 4,488 | |
| | Contemporary Amperex Technology Co. Ltd. (Electrical equipment) | | | 96,020 | | | | 3,022 | |
| | Foshan Haitian Flavouring & Food Co. Ltd. (Food products) | | | 515,441 | | | | 3,322 | |
| | Kweichow Moutai Co. Ltd. (Beverages) | | | 29,059 | | | | 6,759 | |
| | Midea Group Co. Ltd. (Household durables) | | | 681,800 | | | | 5,526 | |
| | Shenzhen Inovance Technology Co. Ltd. (Machinery) | | | 391,100 | | | | 3,454 | |
| | Silergy Corp. (Semiconductors & semiconductor equipment) | | | 85,000 | | | | 1,051 | |
| | Suzhou Maxwell Technologies Co. Ltd. (Electrical equipment) | | | 150,033 | | | | 3,496 | |
| | Tencent Holdings Ltd. (Interactive media & services) | | | 371,900 | | | | 15,738 | |
| | Wuxi Lead Intelligent Equipment Co. Ltd. (Machinery) | | | 587,869 | | | | 2,925 | |
| | Zhangzhou Pientzehuang Pharmaceutical Co. Ltd. (Pharmaceuticals) | | | 110,800 | | | | 4,364 | |
| | Total China | | | | | | | 69,309 | |
| | India—21.3% | | | | | | | | |
| | Apollo Hospitals Enterprise Ltd. (Health care providers & services) | | | 37,891 | | | | 2,355 | |
| | Asian Paints Ltd. (Chemicals) | | | 63,055 | | | | 2,583 | |
| | Bajaj Finance Ltd. (Consumer finance) | | | 61,526 | | | | 5,373 | |
| | Britannia Industries Ltd. (Food products) | | | 69,848 | | | | 4,278 | |
| | Havells India Ltd. (Electrical equipment) | | | 158,513 | | | | 2,477 | |
| | HDFC Bank Ltd. (Banks) | | | 389,741 | | | | 8,080 | |
| | Hindustan Unilever Ltd. (Personal care products) | | | 69,398 | | | | 2,264 | |
| | Housing Development Finance Corp. Ltd. (Financial services) | | | 160,194 | | | | 5,508 | |
| | Infosys Ltd. (IT services) | | | 248,050 | | | | 4,045 | |
| * | InterGlobe Aviation Ltd. (Passenger airlines) | | | 226,810 | | | | 7,277 | |
| | Pidilite Industries Ltd. (Chemicals) | | | 71,159 | | | | 2,261 | |
| | Reliance Industries Ltd. (Oil, gas & consumable fuels) | | | 323,626 | | | | 10,073 | |
| | Titan Co. Ltd. (Textiles, apparel & luxury goods) | | | 43,856 | | | | 1,633 | |
| | UPL Ltd. (Chemicals) | | | 521,331 | | | | 4,368 | |
| | Varun Beverages Ltd. (Beverages) | | | 149,132 | | | | 1,463 | |
| | | | | | | | | 64,038 | |
| | | | | | | | |
| | | | | | | | |
| | Issuer | | Shares | | | Value | |
| | | | | | | | | | |
| | Common Stocks—(continued) | | | | | | | | |
| | | | | | | | | | |
| | Emerging Asia—(continued) | | | | | | | | |
| | Indonesia—7.1% | | | | | | | | |
| | Bank Central Asia Tbk PT (Banks) | | | 21,578,700 | | | $ | 13,170 | |
| | Bank Rakyat Indonesia Persero Tbk PT (Banks) | | | 16,944,700 | | | | 6,131 | |
| | Telkom Indonesia Persero Tbk PT (Diversified telecommunication services) | | | 8,106,700 | | | | 2,163 | |
| | | | | | | | | 21,464 | |
| | South Korea—5.8% | | | | | | | | |
| | Samsung Electronics Co. Ltd. (Technology hardware, storage & peripherals) | | | 242,954 | | | | 13,312 | |
| | Samsung SDI Co. Ltd. (Electronic equipment, instruments & components) | | | 8,087 | | | | 4,106 | |
| | | | | | | | | 17,418 | |
| | Taiwan—12.5% | | | | | | | | |
| | ASPEED Technology, Inc. (Semiconductors & semiconductor equipment) | | | 20,000 | | | | 1,830 | |
| | E.Sun Financial Holding Co. Ltd. (Banks) | | | 4,204,259 | | | | 3,517 | |
| | eMemory Technology, Inc. (Semiconductors & semiconductor equipment) | | | 37,000 | | | | 2,625 | |
| | MediaTek, Inc. (Semiconductors & semiconductor equipment) | | | 174,000 | | | | 3,844 | |
| | Taiwan Semiconductor Manufacturing Co. Ltd.—ADR (Semiconductors & semiconductor equipment) | | | 240,189 | | | | 24,240 | |
| | Voltronic Power Technology Corp. (Electrical equipment) | | | 25,000 | | | | 1,577 | |
| | | | | | | | | 37,633 | |
| | Thailand—1.4% | | | | | | | | |
| | Bangkok Dusit Medical Services PCL (Health care providers & services) | | | 5,273,700 | | | | 4,128 | |
| | | | | | | | | | |
| | Emerging Latin America—24.7% | | | | | | | | |
| | Argentina—1.7% | | | | | | | | |
| | *Globant SA (IT services)† | | | 28,568 | | | | 5,134 | |
| | Brazil—16.4% | | | | | | | | |
| | B3 SA - Brasil Bolsa Balcao (Capital markets) | | | 3,041,700 | | | | 9,281 | |
| | Banco BTG Pactual SA (Capital markets) | | | 771,900 | | | | 5,070 | |
| | Locaweb Servicos de Internet SA (IT services) | | | 2,122,000 | | | | 3,802 | |
| * | MercadoLibre, Inc. (Broadline retail) | | | 7,766 | | | | 9,200 | |
| | Raia Drogasil SA (Consumer staples distribution & retail) | | | 610,184 | | | | 3,772 | |
| | Rumo SA (Ground transportation) | | | 1,000,900 | | | | 4,640 | |
| | TOTVS SA (Software) | | | 863,200 | | | | 5,405 | |
| | WEG SA (Electrical equipment) | | | 1,027,100 | | | | 8,098 | |
| | | | | | | | | 49,268 | |
See accompanying Notes to Financial Statements.
| 58 | Semiannual Report | June 30, 2023 |
Emerging Markets Leaders Fund
Portfolio of Investments, June 30, 2023 (all dollar amounts in thousands) (unaudited)
| | | | | | | | |
| | | | | | | | |
| | Issuer | | Shares | | | Value | |
| | | | | | | | | | |
| | Common Stocks—(continued) | | | | | | | | |
| | | | | | | | | | |
| | Emerging Latin America—(continued) | | | | | | | | |
| | Mexico—4.9% | | | | | | | | |
| | Grupo Aeroportuario del Pacifico SAB de CV (Transportation infrastructure) | | | 208,500 | | | $ | 3,752 | |
| | Wal-Mart de Mexico SAB de CV (Consumer staples distribution & retail) | | | 2,801,000 | | | | 11,110 | |
| | | | | | | | | 14,862 | |
| | Peru—1.7% | | | | | | | | |
| | Credicorp Ltd. (Banks)† | | | 34,560 | | | | 5,102 | |
| | | | | | | | | | |
| | Emerging Mid-East, Africa—4.0% | | | | | | | | |
| | Saudi Arabia—1.4% | | | | | | | | |
| | Saudi Arabian Oil Co. (Oil, gas & consumable fuels) | | | 485,253 | | | | 4,172 | |
| | South Africa—1.9% | | | | | | | | |
| | Capitec Bank Holdings Ltd. (Banks) | | | 20,956 | | | | 1,746 | |
| | Clicks Group Ltd. (Consumer staples distribution & retail) | | | 271,870 | | | | 3,774 | |
| | | | | | | | | 5,520 | |
| | United Arab Emirates—0.7% | | | | | | | | |
| | Abu Dhabi National Oil Co. for Distribution PJSC (Specialty retail) | | | 2,057,514 | | | | 2,185 | |
| | | | | | | | | | |
| | Asia—0.9% | | | | | | | | |
| | Hong Kong—0.9% | | | | | | | | |
| | AIA Group Ltd. (Insurance) | | | 272,200 | | | | 2,748 | |
| | Total Common Stocks—100.8%
(cost $279,315) | | | | | | | 302,981 | |
| | Total Investments—100.8%
(cost $279,315) | | | | | | | 302,981 | |
| | Liabilities, plus cash and other assets—(0.8)% | | | | | | | (2,522 | ) |
| | Net assets—100.0% | | | | | | $ | 300,459 | |
ADR = American Depository Receipt
* = Non-income producing security
† = U.S. listed foreign security
At June 30, 2023, the Fund’s Portfolio of Investments includes the following industry categories (as a percentage of long-term investments):
| Financials | | | 23.3 | % |
| Information Technology | | | 22.9 | % |
| Industrials | | | 14.9 | % |
| Consumer Staples | | | 12.1 | % |
| Consumer Discretionary | | | 9.6 | % |
| Communication Services | | | 5.9 | % |
| Energy | | | 4.7 | % |
| Health Care | | | 3.6 | % |
| Materials | | | 3.0 | % |
| Total | | | 100.0 | % |
At June 30, 2023, the Fund’s Portfolio of Investments includes the following currency categories (as a percentage of long-term investments):
| Indian Rupee | | | 21.1 | % |
| U.S. Dollar | | | 14.4 | % |
| Brazilian Real | | | 13.2 | % |
| Hong Kong Dollar | | | 11.1 | % |
| Chinese Yuan Renminbi | | | 10.8 | % |
| Indonesian Rupiah | | | 7.1 | % |
| New Taiwan Dollar | | | 6.3 | % |
| South Korean Won | | | 5.8 | % |
| Mexican Peso | | | 4.9 | % |
| South African Rand | | | 3.2 | % |
| Thai Baht | | | 1.4 | % |
| All Other Currencies | | | 0.7 | % |
| Total | | | 100.0 | % |
See accompanying Notes to Financial Statements.
| June 30, 2023 | William Blair Funds | 59 |
| | Emerging Markets Growth Fund |
| | |
| | The Emerging Markets Growth Fund seeks long-term capital appreciation. |
| | |
| | AN OVERVIEW FROM THE PORTFOLIO MANAGERS |
| | |
 Todd M. McClone, CFA 
Casey K. Preyss, CFA 
Vivian Lin Thurston, CFA | The William Blair Emerging Markets Growth Fund (Class N shares) (the “Fund”) posted a 5.22% increase, net of fees, for the six months ended June 30, 2023. By comparison, the Fund’s benchmark index, the MSCI Emerging Markets IMI (net) (the “Index”), increased 5.62%. Performance versus the Index year-to-date was driven by a combination of country allocation and stock selection effects despite continued style headwinds amid strong outperformance of low-valuation stocks. Positive relative performance was primarily driven by stock selection effects across most sectors and an underweight allocation to China. Stock selection was particularly strong within the Information Technology and Communication Services sectors. Within Information Technology, hardware positions drove strong relative performance, led by Taiwan Semiconductor Manufacturing Company (“TSMC”). TSMC is the world’s leading independent foundry with unique manufacturing capabilities in leading-edge chips. The stock strengthened despite challenging near-term dynamics, including soft demand from China as cutting-edge technology companies globally outperformed on expectations for artificial intelligence to drive long-term demand. In addition, management provided an encouraging semiconductor cycle outlook for the end of 2023 despite near-term weakness as TSMC expects the ongoing inventory correction to bottom in the first half of 2023, followed by a recovery later in the year. Within Communication Services, JYP Entertainment (“JYP”) and NetEase added to relative performance in the period. JYP plans, produces, promotes, and markets Korean singers in both Korean and overseas markets. It also engages in licensing, merchandising, and artist management business including non-musical pursuits of its artists. JYP is benefiting from the growing global popularity of Korean pop music, and JYP’s recent stadium tour in Japan reached record profitability as merchandising and intellectual property licensing expands with its fan base. NetEase is a leading internet technology company in China providing online services, including online games, community, communication, and commerce. NetEase has benefited from reduced regulatory scrutiny versus its peers and a strong start to the year, driven by revenue growth in its legacy games portfolio and mobile games growth that outpaced expectations. Partially offsetting these effects was negative stock selection within the Consumer Discretionary sector and China and an underweight to Korea. Within the Consumer Discretionary sector, China Tourism Group Duty Free (“China Tourism”) and Chinese e-commerce positions in JD.com (“JD”) and Alibaba were among the key detractors for the six-month period. China Tourism is the leading Chinese duty-free operator. Following a sharp rally in late 2022, as the government announced the abandonment of COVID-19 lockdowns, China Tourism’s stock has weakened year-to-date amid concerns about the pace of the consumer recovery in China and specifically the slow resumption of international travel. While China Tourism operates non-airport duty-free shopping, foot traffic in those locations has been lighter than expected. In addition, operational concerns including gate capacity at arrival airports and maintenance requirements for wide-body jets that were not operated through China’s COVID-19 lockdowns have reduced near term expectations for a sales recovery in airport locations. The position was exited in the second quarter. |
| 60 | Semiannual Report | June 30, 2023 |
Emerging Markets Growth Fund
In e-commerce, both JD and Alibaba, the leading e-commerce platforms in China, pulled back in the first half of the year following a rebound on reopening news due to softer-than-expected sales at the beginning of the year as consumer and business confidence remained weak. JD was sold on our view of a diminished competitive advantage as the barriers to entry for its logistics business have fallen and the rapid increase of competition in e-commerce from streaming video platforms and other smaller players taking market share. Despite fundamental results being in line with expectations and positive corporate governance news, including the spinoffs of six independent business units, Alibaba also underperformed due to slow consumer recovery. We remain confident in Alibaba’s position as the dominant provider of goods and services through its diversified platform and believe its restructuring will provide a tailwind to Alibaba’s low valuation relative to e-commerce peers.
Please refer to the Global Markets Review and Outlook relating to the Fund on page 29.
| June 30, 2023 | William Blair Funds | 61 |
Emerging Markets Growth Fund
Performance Highlights (Unaudited)
| |
| |
| Average Annual Total Returns through 6/30/2023 |
| | | Year to
Date | | 1 Year | | 3 Year | | 5 Year | | 10 Year |
| Class N | | | 5.22 | % | | | (2.53 | )% | | | (0.58 | )% | | | 1.88 | % | | | 3.80 | % |
| Class I | | | 5.29 | | | | (2.30 | ) | | | (0.34 | ) | | | 2.15 | | | | 4.06 | |
| Class R6 | | | 5.32 | | | | (2.27 | ) | | | (0.25 | ) | | | 2.21 | | | | 4.16 | |
| MSCI Emerging Markets IMI (net) | | | 5.62 | | | | 3.19 | | | | 3.60 | | | | 1.42 | | | | 3.16 | |
Performance cited represents past performance. Past performance does not guarantee future results and current performance may be lower or higher than the data quoted. Results shown are average annual total returns, which assume reinvestment of dividends and capital gains. Investment returns and principal will fluctuate and you may have a gain or loss when you sell shares. For the most current month-end performance information, please call 1-800-742-7272, or visit our Web site at www.williamblairfunds.com. From time to time, the investment adviser may waive fees or reimburse expenses for the Fund. Without these waivers/reimbursements, performance would be lower. International investing involves special risk considerations, including currency fluctuations, lower liquidity, economic and political risk. These risks may be magnified when investing in emerging markets. Class N shares are not subject to a sales load. Class I shares are not subject to a sales load or distribution (Rule 12b-1) fees. Class R6 shares are not subject to a sales load, distribution (Rule 12b-1) fees, or sub-transfer agent fees.
The performance highlights and graph presented above do not reflect the deduction of taxes that a shareholder would pay on fund distributions or the redemption of fund shares.
The Morgan Stanley Capital International (MSCI) Emerging Markets Investable Market Index (IMI) (net) is a free float-adjusted market capitalization weighted index that is designed to measure the equity market performance of emerging markets. This index approximates the minimum possible dividend reinvestment by deducting for the highest possible withholding tax rates of those markets.
This report identifies the Fund’s investments on June 30, 2023. These holdings are subject to change. Not all stocks in the Fund performed the same, nor is there any guarantee that these stocks will perform as well in the future. Market forecasts provided in this report may not necessarily come to pass.
Sector Diversification (Unaudited)

The sector diversification shown is based on the total long-term securities.
| 62 | Semiannual Report | June 30, 2023 |
Emerging Markets Growth Fund
Portfolio of Investments, June 30, 2023 (all dollar amounts in thousands) (unaudited)
| | | | | | | | |
| | | | | | | | |
| | Issuer | | Shares | | | Value | |
| | | | | | | | | | |
| | Common Stocks | | | | | | | | |
| | | | | | | | | | |
| | Emerging Asia—74.5% | | | | | | | | |
| | China—15.5% | | | | | | | | |
| | Airtac International Group (Machinery) | | | 162,852 | | | $ | 5,360 | |
| * | Alibaba Group Holding Ltd. (Broadline retail) | | | 1,745,500 | | | | 18,087 | |
| | ANTA Sports Products Ltd. (Textiles, apparel & luxury goods) | | | 476,000 | | | | 4,863 | |
| | Hundsun Technologies, Inc. (Software) | | | 236,600 | | | | 1,441 | |
| | Kweichow Moutai Co. Ltd. (Beverages) | | | 60,274 | | | | 14,020 | |
| | Li Ning Co. Ltd. (Textiles, apparel & luxury goods) | | | 931,000 | | | | 5,008 | |
| * | Meituan (Hotels, restaurants & leisure) | | | 251,036 | | | | 3,918 | |
| | NetEase, Inc. (Entertainment) | | | 531,300 | | | | 10,347 | |
| | Proya Cosmetics Co. Ltd. (Personal care products) | | | 285,788 | | | | 4,419 | |
| | Shenzhen Inovance Technology Co. Ltd. (Machinery) | | | 221,063 | | | | 1,952 | |
| | Tencent Holdings Ltd. (Interactive media & services) | | | 711,360 | | | | 30,103 | |
| | Wuliangye Yibin Co. Ltd. (Beverages) | | | 329,599 | | | | 7,416 | |
| | Zhangzhou Pientzehuang Pharmaceutical Co. Ltd. (Pharmaceuticals) | | | 76,900 | | | | 3,029 | |
| | Zhejiang Supcon Technology Co. Ltd. (Electronic equipment, instruments & components) | | | 261,050 | | | | 2,254 | |
| | | | | | | | | 112,217 | |
| | India—22.4% | | | | | | | | |
| | ABB India Ltd. (Electrical equipment) | | | 103,074 | | | | 5,552 | |
| | APL Apollo Tubes Ltd. (Metals & mining) | | | 134,009 | | | | 2,124 | |
| | Apollo Hospitals Enterprise Ltd. (Health care providers & services) | | | 69,734 | | | | 4,335 | |
| | Asian Paints Ltd. (Chemicals) | | | 90,342 | | | | 3,700 | |
| | Astral Ltd. (Building products) | | | 72,984 | | | | 1,765 | |
| | Bajaj Finance Ltd. (Consumer finance) | | | 94,726 | | | | 8,273 | |
| | Bharat Electronics Ltd. (Aerospace & defense) | | | 2,423,768 | | | | 3,701 | |
| | Britannia Industries Ltd. (Food products) | | | 79,655 | | | | 4,879 | |
| | CG Power & Industrial Solutions Ltd. (Electrical equipment) | | | 606,367 | | | | 2,787 | |
| | Cholamandalam Investment & Finance Co. Ltd. (Consumer finance) | | | 283,593 | | | | 3,948 | |
| | Cummins India Ltd. (Machinery) | | | 64,857 | | | | 1,535 | |
| * | Devyani International Ltd. (Hotels, restaurants & leisure) | | | 620,032 | | | | 1,422 | |
| | Dixon Technologies India Ltd. (Household durables) | | | 47,912 | | | | 2,567 | |
| | Havells India Ltd. (Electrical equipment) | | | 112,036 | | | | 1,751 | |
| | HDFC Bank Ltd. (Banks) | | | 853,495 | | | | 17,694 | |
| | HDFC Life Insurance Co. Ltd. (Insurance) | | | 68,466 | | | | 541 | |
| | Hindustan Unilever Ltd. (Personal care products) | | | 111,219 | | | | 3,628 | |
| | Housing Development Finance Corp. Ltd. (Financial services) | | | 277,988 | | | | 9,557 | |
| | Indian Hotels Co. Ltd. (Hotels, restaurants & leisure) | | | 762,550 | | | | 3,651 | |
| * | InterGlobe Aviation Ltd. (Passenger airlines) | | | 88,800 | | | | 2,849 | |
| | Kajaria Ceramics Ltd. (Building products) | | | 128,555 | | | | 1,970 | |
| | | | | | | | |
| | | | | | | | |
| | Issuer | | Shares | | | Value | |
| | | | | | | | | | |
| | Common Stocks—(continued) | | | | | | | | |
| | | | | | | | | | |
| | Emerging Asia—(continued) | | | | | | | | |
| | India—(continued) | | | | | | | | |
| | KEI Industries Ltd. (Electrical equipment) | | | 114,308 | | | $ | 3,220 | |
| | KPIT Technologies Ltd. (Software) | | | 303,679 | | | | 4,043 | |
| * | Macrotech Developers Ltd. (Real estate management & development) | | | 279,334 | | | | 2,326 | |
| * | Max Healthcare Institute Ltd. (Health care providers & services) | | | 445,911 | | | | 3,261 | |
| | Motherson Sumi Wiring India Ltd. (Automobile components) | | | 3,103,613 | | | | 2,183 | |
| | Nestle India Ltd. (Food products) | | | 11,910 | | | | 3,328 | |
| | Oberoi Realty Ltd. (Real estate management & development) | | | 137,538 | | | | 1,651 | |
| | PI Industries Ltd. (Chemicals) | | | 49,767 | | | | 2,374 | |
| | Pidilite Industries Ltd. (Chemicals) | | | 78,744 | | | | 2,501 | |
| | Polycab India Ltd. (Electrical equipment) | | | 57,131 | | | | 2,474 | |
| | Reliance Industries Ltd. (Oil, gas & consumable fuels) | | | 584,502 | | | | 18,192 | |
| | SRF Ltd. (Chemicals) | | | 79,145 | | | | 2,211 | |
| | Tata Consultancy Services Ltd. (IT services) | | | 45,501 | | | | 1,829 | |
| | Tata Consumer Products Ltd. (Food products) | | | 245,553 | | | | 2,575 | |
| | Titan Co. Ltd. (Textiles, apparel & luxury goods) | | | 154,604 | | | | 5,757 | |
| | Trent Ltd. (Specialty retail) | | | 148,655 | | | | 3,188 | |
| | Tube Investments of India Ltd. (Automobile components) | | | 79,938 | | | | 3,099 | |
| | UNO Minda Ltd. (Automobile components) | | | 509,425 | | | | 3,614 | |
| | Varun Beverages Ltd. (Beverages) | | | 610,929 | | | | 5,995 | |
| | | | | | | | | 162,050 | |
| | Indonesia—5.8% | | | | | | | | |
| | Astra International Tbk PT (Industrial conglomerates) | | | 4,581,400 | | | | 2,070 | |
| | Bank Central Asia Tbk PT (Banks) | | | 38,110,395 | | | | 23,259 | |
| | Bank Rakyat Indonesia Persero Tbk PT (Banks) | | | 46,199,451 | | | | 16,717 | |
| | | | | | | | | 42,046 | |
| | Philippines—1.1% | | | | | | | | |
| | BDO Unibank, Inc. (Banks) | | | 1,982,934 | | | | 4,947 | |
| | International Container Terminal Services, Inc. (Transportation infrastructure) | | | 771,990 | | | | 2,850 | |
| | | | | | | | | 7,797 | |
| | South Korea—7.9% | | | | | | | | |
| | JYP Entertainment Corp. (Entertainment) | | | 46,717 | | | | 4,638 | |
| | Orion Corp. (Food products) | | | 20,363 | | | | 1,854 | |
| * | Samsung Biologics Co. Ltd. (Life sciences tools & services) | | | 6,260 | | | | 3,535 | |
| | Samsung Electronics Co. Ltd. (Technology | | | | | | | | |
| | hardware, storage & peripherals) | | | 710,260 | | | | 38,918 | |
| | Samsung SDI Co. Ltd. (Electronic equipment, instruments & components) | | | 16,337 | | | | 8,295 | |
| | | | | | | | | 57,240 | |
See accompanying Notes to Financial Statements.
| June 30, 2023 | William Blair Funds | 63 |
Emerging Markets Growth Fund
Portfolio of Investments, June 30, 2023 (all dollar amounts in thousands) (unaudited)
| | | | | | | | |
| | | | | | | | |
| | Issuer | | Shares | | | Value | |
| | | | | | | | | | |
| | Common Stocks—(continued) | | | | | | | | |
| | | | | | | | | | |
| | Emerging Asia—(continued) | | | | | | | | |
| | Taiwan—19.4% | | | | | | | | |
| | Accton Technology Corp. (Communications equipment) | | | 329,000 | | | $ | 3,687 | |
| | Advantech Co. Ltd. (Technology hardware, storage & peripherals) | | | 266,766 | | | | 3,508 | |
| | Alchip Technologies Ltd. (Semiconductors & semiconductor equipment) | | | 102,000 | | | | 5,879 | |
| | ASMedia Technology, Inc. (Semiconductors & semiconductor equipment) | | | 61,000 | | | | 2,066 | |
| | ASPEED Technology, Inc. (Semiconductors & semiconductor equipment) | | | 58,300 | | | | 5,335 | |
| | Chailease Holding Co. Ltd. (Financial services) | | | 277,190 | | | | 1,816 | |
| | Chroma ATE, Inc. (Electronic equipment, instruments & components) | | | 345,000 | | | | 2,775 | |
| | Delta Electronics, Inc. (Electronic equipment, instruments & components) | | | 793,000 | | | | 8,772 | |
| | E.Sun Financial Holding Co. Ltd. (Banks) | | | 3,108,192 | | | | 2,600 | |
| | Elite Material Co. Ltd. (Electronic equipment, instruments & components) | | | 313,000 | | | | 2,447 | |
| | eMemory Technology, Inc. (Semiconductors & semiconductor equipment) | | | 53,000 | | | | 3,761 | |
| | Global Unichip Corp. (Semiconductors & semiconductor equipment) | | | 107,000 | | | | 5,514 | |
| | Lotes Co. Ltd. (Electronic equipment, instruments & components) | | | 137,132 | | | | 3,787 | |
| | MediaTek, Inc. (Semiconductors & semiconductor equipment) | | | 137,000 | | | | 3,026 | |
| | Parade Technologies Ltd. (Semiconductors & semiconductor equipment) | | | 65,000 | | | | 2,244 | |
| | Sinbon Electronics Co. Ltd. (Electronic equipment, instruments & components) | | | 483,000 | | | | 5,730 | |
| | Taiwan Semiconductor Manufacturing Co. Ltd. (Semiconductors & semiconductor equipment) | | | 541,000 | | | | 10,005 | |
| | Taiwan Semiconductor Manufacturing Co. Ltd.—ADR (Semiconductors & semiconductor equipment) | | | 510,309 | | | | 51,500 | |
| | Unimicron Technology Corp. (Electronic equipment, instruments & components) | | | 886,000 | | | | 5,007 | |
| | Voltronic Power Technology Corp. (Electrical equipment) | | | 101,586 | | | | 6,409 | |
| | Wiwynn Corp. (Technology hardware, storage & peripherals) | | | 93,000 | | | | 4,240 | |
| | | | | | | | | 140,108 | |
| | Thailand—2.4% | | | | | | | | |
| * | Airports of Thailand PCL (Transportation infrastructure) | | | 1,020,100 | | | | 2,072 | |
| | Bangkok Dusit Medical Services PCL (Health care providers & services) | | | 8,177,600 | | | | 6,401 | |
| | Bumrungrad Hospital PCL (Health care providers & services) | | | 558,700 | | | | 3,561 | |
| | Central Pattana PCL (Real estate management & development) | | | 2,012,100 | | | | 3,717 | |
| | | | | | | | |
| | | | | | | | |
| | Issuer | | Shares | | | Value | |
| | | | | | | | |
| | Common Stocks—(continued) | | | | | | |
| | | | | | | | |
| | Emerging Asia—(continued) | | | | | | |
| | Thailand—(continued) | | | | | | |
| * | Central Plaza Hotel PCL (Hotels, restaurants & leisure) | | | 1,127,000 | | | $ | 1,573 | |
| | | | | | | | | 17,324 | |
| | | | | | | | | | |
| | Emerging Latin America—14.0% | | | | | | | | |
| | Argentina—0.4% | | | | | | | | |
| * | Globant SA (IT services)† | | | 14,460 | | | | 2,599 | |
| | Brazil—8.3% | | | | | | | | |
| | B3 SA - Brasil Bolsa Balcao (Capital markets) | | | 854,500 | | | | 2,607 | |
| | Banco BTG Pactual SA (Capital markets) | | | 660,200 | | | | 4,336 | |
| | Hypera SA (Pharmaceuticals) | | | 440,700 | | | | 4,235 | |
| | Itau Unibanco Holding SA—ADR (Banks) | | | 975,914 | | | | 5,758 | |
| | Localiza Rent a Car SA (Ground transportation) | | | 236,400 | | | | 3,382 | |
| * | MercadoLibre, Inc. (Broadline retail) | | | 13,569 | | | | 16,074 | |
| | Multiplan Empreendimentos Imobiliarios SA (Real estate management & development) | | | 386,100 | | | | 2,231 | |
| | Patria Investments Ltd. (Capital markets)† | | | 120,472 | | | | 1,723 | |
| | Raia Drogasil SA (Consumer staples distribution & retail) | | | 815,288 | | | | 5,040 | |
| | Rumo SA (Ground transportation) | | | 617,700 | | | | 2,864 | |
| | TOTVS SA (Software) | | | 644,900 | | | | 4,038 | |
| | Vinci Partners Investments Ltd. (Capital markets)† | | | 155,512 | | | | 1,449 | |
| | WEG SA (Electrical equipment) | | | 824,741 | | | | 6,502 | |
| | | | | | | | | 60,239 | |
| | Mexico—4.9% | | | | | | | | |
| | Arca Continental SAB de CV (Beverages) | | | 595,300 | | | | 6,110 | |
| * | Corp. Inmobiliaria Vesta SAB de CV—ADR (Real estate management & development) | | | 11,640 | | | | 375 | |
| | Corp. Inmobiliaria Vesta SAB de CV (Real estate management & development) | | | 649,300 | | | | 2,108 | |
| | Grupo Aeroportuario del Pacifico SAB de CV (Transportation infrastructure) | | | 200,800 | | | | 3,614 | |
| | Grupo Aeroportuario del Sureste SAB de CV—ADR(Transportation infrastructure) | | | 12,051 | | | | 3,346 | |
| | Prologis Property Mexico SA de CV (Industrial REITs) | | | 907,200 | | | | 3,358 | |
| | Wal-Mart de Mexico SAB de CV (Consumer staples distribution & retail) | | | 4,151,100 | | | | 16,464 | |
| | | | | | | | | 35,375 | |
| | Peru—0.4% | | | | | | | | |
| | Credicorp Ltd. (Banks)† | | | 17,810 | | | | 2,630 | |
| | | | | | | | | | |
| | Emerging Europe, Mid-East, Africa—7.0% | | | | | | | | |
| | Poland—0.8% | | | | | | | | |
| * | Dino Polska SA (Consumer staples distribution & retail) | | | 51,097 | | | | 5,967 | |
| | Qatar—0.2% | | | | | | | | |
| | Qatar Gas Transport Co. Ltd. (Oil, gas & consumable fuels) | | | 1,475,389 | | | | 1,648 | |
See accompanying Notes to Financial Statements.
| 64 | Semiannual Report | June 30, 2023 |
Emerging Markets Growth Fund
Portfolio of Investments, June 30, 2023 (all dollar amounts in thousands) (unaudited)
| | | | | | | | |
| | | | | | | | |
| | Issuer | | Shares | | | Value | |
| | | | | | | | | | |
| | Common Stocks—(continued) | | | | | | | | |
| | | | | | | | | | |
| | Emerging Europe, Mid-East, Africa—(continued) | | | | | | | | |
| | Saudi Arabia—2.9% | | | | | | | | |
| | Alinma Bank (Banks) | | | 235,186 | | | $ | 2,101 | |
| | Arabian Internet & Communications Services Co. (IT services) | | | 30,553 | | | | 2,628 | |
| | Bupa Arabia for Cooperative Insurance Co. (Insurance) | | | 44,307 | | | | 2,192 | |
| | Dallah Healthcare Co. (Health care providers & services) | | | 40,838 | | | | 1,827 | |
| | Dr Sulaiman Al Habib Medical Services Group Co. (Health care providers & services) | | | 35,803 | | | | 2,732 | |
| | Elm Co. (IT services) | | | 23,805 | | | | 3,694 | |
| | Leejam Sports Co. JSC (Hotels, restaurants & leisure) | | | 54,346 | | | | 1,869 | |
| | Nahdi Medical Co. (Consumer staples distribution & retail) | | | 38,900 | | | | 1,763 | |
| | Saudi Arabian Oil Co. (Oil, gas & consumable fuels) | | | 202,038 | | | | 1,737 | |
| | | | | | | | | 20,543 | |
| | South Africa—1.4% | | | | | | | | |
| | Bid Corp. Ltd. (Consumer staples distribution & retail) | | | 303,012 | | | | 6,654 | |
| | Bidvest Group Ltd. (Industrial conglomerates) | | | 138,159 | | | | 1,921 | |
| | Clicks Group Ltd. (Consumer staples distribution & retail) | | | 116,574 | | | | 1,618 | |
| | | | | | | | | 10,193 | |
| | United Arab Emirates—1.7% | | | | | | | | |
| | Abu Dhabi National Oil Co. for Distribution PJSC (Specialty retail) | | | 1,155,869 | | | | 1,227 | |
| | Americana Restaurants International PLC (Hotels, restaurants & leisure) | | | 2,420,956 | | | | 2,788 | |
| | Emaar Properties PJSC (Real estate management & development) | | | 2,362,043 | | | | 4,122 | |
| | Emirates Central Cooling Systems Corp. (Water utilities) | | | 3,533,015 | | | | 1,732 | |
| | Salik Co. PJSC (Transportation infrastructure) | | | 2,818,009 | | | | 2,416 | |
| | | | | | | | | 12,285 | |
| | | | | | | | | | |
| | Asia—2.4% | | | | | | | | |
| | Hong Kong—2.4% | | | | | | | | |
| | AIA Group Ltd. (Insurance) | | | 1,717,600 | | | | 17,338 | |
| | Total Common Stocks—97.9%
(cost $610,846) | | | | | | | 707,599 | |
| | | | | | | | |
| | Issuer | | Principal
Amount | | Value | |
| | | | | | | | | | |
| | Repurchase Agreement | | | | | | | | |
| | Fixed Income Clearing Corporation, 2.100% dated 06/30/23, due 07/03/23, repurchase price $5,646, collateralized by U.S. Treasury Note, 1.375%, due 11/15/31, valued at $5,757 | | | $5,645 | | | $ | 5,645 | |
| | Total Repurchase Agreement—0.8%
(cost $5,645) | | | | | | | 5,645 | |
| | Total Investments—98.7%
(cost $616,491) | | | | | | | 713,244 | |
| | Cash and other assets, less liabilities—1.3% | | | | | | | 9,732 | |
| | Net assets—100.0% | | | | | | $ | 722,976 | |
ADR = American Depository Receipt
REIT = Real Estate Investment Trust
* = Non-income producing security
† = U.S. listed foreign security
See accompanying Notes to Financial Statements.
| June 30, 2023 | William Blair Funds | 65 |
Emerging Markets Growth Fund
Portfolio of Investments, June 30, 2023 (unaudited)
At June 30, 2023, the Fund’s Portfolio of Investments includes the following industry categories (as a percentage of long-term investments):
| Information Technology | | | 28.2 | % |
| Financials | | | 18.3 | % |
| Consumer Staples | | | 13.0 | % |
| Consumer Discretionary | | | 11.4 | % |
| Industrials | | | 10.2 | % |
| Communication Services | | | 6.4 | % |
| Health Care | | | 4.7 | % |
| Energy | | | 3.0 | % |
| Real Estate | | | 2.8 | % |
| Materials | | | 1.8 | % |
| Utilities | | | 0.2 | % |
| Total | | | 100.0 | % |
At June 30, 2023, the Fund’s Portfolio of Investments includes the following currency categories (as a percentage of long-term investments):
| Indian Rupee | | | 22.9 | % |
| New Taiwan Dollar | | | 13.3 | % |
| Hong Kong Dollar | | | 12.7 | % |
| U.S. Dollar | | | 12.1 | % |
| South Korean Won | | | 8.1 | % |
| Indonesian Rupiah | | | 5.9 | % |
| Brazilian Real | | | 5.0 | % |
| Chinese Yuan Renminbi | | | 4.9 | % |
| Mexican Peso | | | 4.5 | % |
| South African Rand | | | 4.3 | % |
| Thai Baht | | | 2.4 | % |
| UAE Dirham | | | 1.7 | % |
| Philippine Peso | | | 1.1 | % |
| All Other Currencies | | | 1.1 | % |
| Total | | | 100.0 | % |
See accompanying Notes to Financial Statements.
| 66 | Semiannual Report | June 30, 2023 |
| | Emerging Markets ex China Growth Fund |
| | |
| | The Emerging Markets ex China Growth Fund seeks long-term capital appreciation. |
| | |
| | AN OVERVIEW FROM THE PORTFOLIO MANAGERS |
| | |
 Todd M. McClone, CFA 
Casey K. Preyss, CFA 
Vivian Lin Thurston, CFA | The William Blair Emerging Markets ex China Growth Fund (Class I shares) posted a 13.50% increase, net of fees, for the six months ended June 30, 2023. By comparison, the Fund’s benchmark index, the MSCI Emerging Markets ex-China IMI (the “Index”), increased 10.49%. The outperformance versus the Index year-to-date was driven by a combination of sector allocation and stock selection effects, despite continued style headwinds amid strong outperformance of low-valuation stocks. Positive relative performance was primarily driven by stock selection effects across most sectors and countries, an underweight allocation to Materials and an overweight to Information Technology (“IT”). Stock selection was particularly strong within the Industrials, Financials, and Communication Services sectors. Industrial outperformance was broad based with KEI Industries (“KEI”) as the strongest contributor. KEI is a leading cable and wire manufacturing company in India that is also engaged in engineering and construction activities. KEI outperformed on strong fundamentals including revenue and profit growth that exceeded expectations as copper input costs have fallen. We believe management’s decision to strengthen KEI’s brand visibility and increase presentation will create a strong retail franchise and lay the foundation for long term growth, fueled by multi-year demand drivers like increasing urbanization, nuclearization, housing, electrification, and low penetration of many consumer durables. Within Communication Services, JYP Entertainment (“JYP”) added to relative performance in the period. JYP plans, produces, promotes, and markets Korean singers in both Korean and overseas markets. It also engages in licensing, merchandizing, and artist management business including non-musical pursuits of its artists. JYP is benefiting from the growing global popularity of Korean pop (“K-pop”) music, and its recent stadium tour in Japan reached record profitability as merchandising and intellectual property licensing expands with its fan base. IT hardware positions drove strong relative performance, led by Taiwan Semiconductor Manufacturing Company (“TSMC”). TSMC is the world-leading independent foundry with unique manufacturing capabilities in leading edge chips. The stock strengthened despite challenging near term dynamics, including soft demand from China as cutting-edge technology companies globally outperformed on expectations for artificial intelligence to drive long term demand. In addition, management provided an encouraging semiconductor cycle outlook for the end of 2023, despite near term weakness as TSMC expects the ongoing inventory correction to bottom in the first half of 2023, followed by a recovery later in the year. Partially offsetting these effects was negative stock selection within the Consumer Discretionary and Energy sectors and an overweight to India. Negative selection in Consumer Discretionary was primarily driven by omission of index holdings in Brazil and a position in South African internet and multimedia company Naspers. Naspers underperformed due to significant geopolitical and macroeconomic uncertainty that caused rolling blackouts across the country. Despite strong performance by the Energy sector, relative performance was hampered by weak performance by Indian company Reliance Industries Limited (“Reliance”), driven by its diversified business model and lower exposure to energy commodities. We believe Reliance’s transformation from an asset heavy, cyclical energy business to more diversified, end-consumer businesses with a large and expanding total addressable market will continue to drive strong growth and returns over the long term, while the legacy energy business will continue to provide earnings support in the near term. The stock underperformed early in the year on broad weakness in Indian equities but has recovered into the second quarter as India recovered and Reliance’s fundamental results were strong quelling investor concerns about Reliance’s increased capital expenditures and rising debt level, as well as slower Indian retail growth. Please refer to the Global Markets Review and Outlook relating to the Fund on page 29. |
| June 30, 2023 | William Blair Funds | 67 |
Emerging Markets ex China Growth Fund
Performance Highlights (Unaudited)
Average Annual Total Returns through 6/30/2023
| | | Year to
Date | | Since
Inception(a) |
| Class I | | | 13.50 | % | | | 6.80 | % |
| Class R6 | | | 13.48 | | | | 6.90 | |
| MSCI Emerging Markets ex-China IMI (net) | | | 10.49 | | | | 8.87 | |
| | |
| (a) | Since inception is for the period from July 29, 2022 (Commencement of Operations) to June 30, 2023. |
Performance cited represents past performance. Past performance does not guarantee future results and current performance may be lower or higher than the data quoted. Results shown are average annual total returns, which assume reinvestment of dividends and capital gains. Investment returns and principal will fluctuate and you may have a gain or loss when you sell shares. For the most current month-end performance information, please call 1-800-742-7272, or visit our Web site at www.williamblairfunds.com. From time to time, the investment adviser may waive fees or reimburse expenses for the Fund. Without these waivers/reimbursements, performance would be lower. International investing involves special risk considerations, including currency fluctuations, lower liquidity, economic and political risk. These risks may be magnified when investing in emerging markets. Class I shares are not subject to a sales load or distribution (Rule 12b-1) fees. Class R6 shares are not subject to a sales load, distribution (Rule 12b-1) fees, or sub-transfer agent fees.
The performance highlights and graph presented above do not reflect the deduction of taxes that a shareholder would pay on fund distributions or the redemption of fund shares.
The Morgan Stanley Capital International (MSCI) Emerging Markets ex-China IMI Index (net) is a free float-adjusted market capitalization index that is designed to measure equity market performance of emerging markets excluding China. This series approximates the minimum possible dividend reinvestment.
This report identifies the Fund’s investments on June 30, 2023. These holdings are subject to change. Not all stocks in the Fund performed the same, nor is there any guarantee that these stocks will perform as well in the future. Market forecasts provided in this report may not necessarily come to pass.
Sector Diversification (Unaudited)
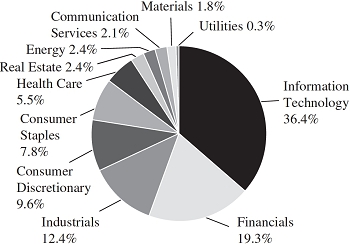
The sector diversification shown is based on the total long-term securities.
| 68 | Semiannual Report | June 30, 2023 |
Emerging Markets ex China Growth Fund
Portfolio of Investments, June 30, 2023 (all dollar amounts in thousands) (unaudited)
| | | | | | | | |
| | | | | | | | |
| | Issuer | | Shares | | | Value | |
| | | | | | | | | | |
| | Common Stocks | | | | | | | | |
| | | | | | | | | | |
| | Emerging Asia—71.2% | | | | | | | | |
| | India—25.2% | | | | | | | | |
| | ABB India Ltd. (Electrical equipment) | | | 3,360 | | | $ | 181 | |
| | APL Apollo Tubes Ltd. (Metals & mining) | | | 5,413 | | | | 86 | |
| | Apollo Hospitals Enterprise Ltd. (Health care providers & services) | | | 2,409 | | | | 150 | |
| | Asian Paints Ltd. (Chemicals) | | | 2,659 | | | | 109 | |
| | Bajaj Finance Ltd. (Consumer finance) | | | 2,482 | | | | 217 | |
| | Bharat Electronics Ltd. (Aerospace & defense) | | | 64,385 | | | | 98 | |
| | Britannia Industries Ltd. (Food products) | | | 1,237 | | | | 76 | |
| | CG Power & Industrial Solutions Ltd. (Electrical equipment) | | | 19,654 | | | | 90 | |
| | Cholamandalam Investment & Finance Co. Ltd. (Consumer finance) | | | 9,634 | | | | 134 | |
| | Cummins India Ltd. (Machinery) | | | 1,924 | | | | 46 | |
| | Dixon Technologies India Ltd. (Household durables) | | | 1,592 | | | | 85 | |
| | Havells India Ltd. (Electrical equipment) | | | 5,716 | | | | 89 | |
| | HDFC Bank Ltd. (Banks) | | | 21,445 | | | | 445 | |
| | Hindustan Unilever Ltd. (Personal care products) | | | 6,881 | | | | 224 | |
| | Housing Development Finance Corp. Ltd. (Financial services) | | | 8,953 | | | | 308 | |
| | Indian Hotels Co. Ltd. (Hotels, restaurants & leisure) | | | 19,925 | | | | 95 | |
| * | InterGlobe Aviation Ltd. (Passenger airlines) | | | 3,201 | | | | 103 | |
| | KEI Industries Ltd. (Electrical equipment) | | | 5,738 | | | | 162 | |
| | KPIT Technologies Ltd. (Software) | | | 11,969 | | | | 159 | |
| * | Max Healthcare Institute Ltd. (Health care providers & services) | | | 17,740 | | | | 130 | |
| | Nestle India Ltd. (Food products) | | | 515 | | | | 144 | |
| | PI Industries Ltd. (Chemicals) | | | 1,583 | | | | 76 | |
| | Polycab India Ltd. (Electrical equipment) | | | 2,255 | | | | 98 | |
| | Reliance Industries Ltd. (Oil, gas & consumable fuels) | | | 9,250 | | | | 288 | |
| | SRF Ltd. (Chemicals) | | | 2,302 | | | | 64 | |
| | Tata Consultancy Services Ltd. (IT services) | | | 4,370 | | | | 176 | |
| | Tata Elxsi Ltd. (Software) | | | 1,149 | | | | 106 | |
| | Titan Co. Ltd. (Textiles, apparel & luxury goods) | | | 5,379 | | | | 200 | |
| | Trent Ltd. (Specialty retail) | | | 6,536 | | | | 140 | |
| | Triveni Turbine Ltd. (Electrical equipment) | | | 19,329 | | | | 95 | |
| | Tube Investments of India Ltd. (Automobile components) | | | 2,695 | | | | 104 | |
| | UNO Minda Ltd. (Automobile components) | | | 17,090 | | | | 121 | |
| | Varun Beverages Ltd. (Beverages) | | | 22,796 | | | | 224 | |
| | | | | | | | | 4,823 | |
| | | | | | | | |
| | | | | | | | |
| | Issuer | | Shares | | | Value | |
| | | | | | | | | | |
| | Common Stocks—(continued) | | | | | | | | |
| | | | | | | | | | |
| | Emerging Asia—(continued) | | | | | | | | |
| | Indonesia—6.2% | | | | | | | | |
| | Astra International Tbk PT (Industrial conglomerates) | | | 157,500 | | | $ | 71 | |
| | Bank Central Asia Tbk PT (Banks) | | | 1,150,100 | | | | 702 | |
| | Bank Rakyat Indonesia Persero Tbk PT (Banks) | | | 1,147,200 | | | | 415 | |
| | | | | | | | | 1,188 | |
| | Philippines—1.7% | | | | | | | | |
| | BDO Unibank, Inc. (Banks) | | | 90,118 | | | | 225 | |
| | International Container Terminal Services, Inc. (Transportation infrastructure) | | | 28,350 | | | | 104 | |
| | | | | | | | | 329 | |
| | South Korea—10.6% | | | | | | | | |
| | JYP Entertainment Corp. (Entertainment) | | | 2,778 | | | | 276 | |
| | NAVER Corp. (Interactive media & services) | | | 801 | | | | 111 | |
| | Orion Corp. (Food products) | | | 575 | | | | 52 | |
| * | Samsung Biologics Co. Ltd. (Life sciences tools & services) | | | 115 | | | | 65 | |
| | Samsung Electronics Co. Ltd. (Technology hardware, storage & peripherals) | | | 23,802 | | | | 1,304 | |
| | Samsung SDI Co. Ltd. (Electronic equipment, instruments & components) | | | 411 | | | | 209 | |
| | | | | | | | | 2,017 | |
| | Taiwan—25.5% | | | | | | | | |
| | Accton Technology Corp. (Communications equipment) | | | 18,000 | | | | 202 | |
| | Alchip Technologies Ltd. (Semiconductors & semiconductor equipment) | | | 2,700 | | | | 156 | |
| | ASMedia Technology, Inc. (Semiconductors & semiconductor equipment) | | | 2,000 | | | | 68 | |
| | ASPEED Technology, Inc. (Semiconductors & semiconductor equipment) | | | 2,100 | | | | 192 | |
| * | Chailease Holding Co. Ltd. (Financial services) | | | 22,000 | | | | 144 | |
| | Chroma ATE, Inc. (Electronic equipment, instruments & components) | | | 15,000 | | | | 121 | |
| | Delta Electronics, Inc. (Electronic equipment, instruments & components) | | | 14,000 | | | | 155 | |
| | E.Sun Financial Holding Co. Ltd. (Banks) | | | 146,926 | | | | 123 | |
| | eMemory Technology, Inc. (Semiconductors & semiconductor equipment) | | | 2,300 | | | | 163 | |
| | Global Unichip Corp. (Semiconductors & semiconductor equipment) | | | 2,000 | | | | 103 | |
| | Lotes Co. Ltd. (Electronic equipment, instruments & components) | | | 4,103 | | | | 113 | |
| | MediaTek, Inc. (Semiconductors & semiconductor equipment) | | | 5,000 | | | | 110 | |
| | Parade Technologies Ltd. (Semiconductors & semiconductor equipment) | | | 3,000 | | | | 104 | |
| | | | | | | | | | |
See accompanying Notes to Financial Statements.
| June 30, 2023 | William Blair Funds | 69 |
Emerging Markets ex China Growth Fund
Portfolio of Investments, June 30, 2023 (all dollar amounts in thousands) (unaudited)
| | | | | | | | |
| | | | | | | | |
| | Issuer | | Shares | | | Value | |
| | | | | | | | | | |
| | Common Stocks—(continued) | | | | | | | | |
| | | | | | | | | | |
| | Emerging Asia—(continued) | | | | | | | | |
| | Taiwan—(continued) | | | | | | | | |
| | Sinbon Electronics Co. Ltd. (Electronic equipment, instruments & components) | | | 12,000 | | | $ | 142 | |
| | Taiwan Semiconductor Manufacturing Co. Ltd. (Semiconductors & semiconductor equipment) | | | 129,000 | | | | 2,386 | |
| | Unimicron Technology Corp. (Electronic equipment, instruments & components) | | | 23,500 | | | | 133 | |
| | Voltronic Power Technology Corp. (Electrical equipment) | | | 3,700 | | | | 233 | |
| | Wiwynn Corp. (Technology hardware, storage & peripherals) | | | 5,000 | | | | 228 | |
| | | | | | | | | 4,876 | |
| | Thailand—2.0% | | | | | | | | |
| | Bangkok Dusit Medical Services PCL (Health care providers & services) | | | 116,800 | | | | 91 | |
| | Bumrungrad Hospital PCL (Health care providers & services) | | | 31,500 | | | | 201 | |
| * | Central Plaza Hotel PCL (Hotels, restaurants & leisure) | | | 69,900 | | | | 98 | |
| | | | | | | | | 390 | |
| | | | | | | | | | |
| | Emerging Latin America—16.8% | | | | | | | | |
| | Argentina—0.6% | | | | | | | | |
| * | Globant SA (IT services)† | | | 624 | | | | 112 | |
| | Brazil—10.7% | | | | | | | | |
| | B3 SA - Brasil Bolsa Balcao (Capital markets) | | | 42,000 | | | | 128 | |
| | Banco BTG Pactual SA (Capital markets) | | | 22,100 | | | | 145 | |
| | Hypera SA (Pharmaceuticals) | | | 11,800 | | | | 114 | |
| | Itau Unibanco Holding SA—ADR (Banks) | | | 34,448 | | | | 203 | |
| | Localiza Rent a Car SA (Ground transportation) | | | 8,800 | | | | 126 | |
| * | MercadoLibre, Inc. (Broadline retail) | | | 393 | | | | 466 | |
| | Multiplan Empreendimentos Imobiliarios SA (Real estate management & development) | | | 16,800 | | | | 97 | |
| | Patria Investments Ltd. (Capital markets)† | | | 6,367 | | | | 91 | |
| | Raia Drogasil SA (Consumer staples distribution & retail) | | | 29,016 | | | | 179 | |
| | Rumo SA (Ground transportation) | | | 31,600 | | | | 147 | |
| | TOTVS SA (Software) | | | 27,200 | | | | 170 | |
| | WEG SA (Electrical equipment) | | | 23,500 | | | | 185 | |
| | | | | | | | | 2,051 | |
| | | | | | | | |
| | | | | | | | |
| | Issuer | | Shares | | | Value | |
| | | | | | | | | | |
| | Common Stocks—(continued) | | | | | | | | |
| | | | | | | | | | |
| | Emerging Latin America—(continued) | | | | | | | | |
| | Mexico—5.0% | | | | | | | | |
| * | Alsea SAB de CV (Hotels, restaurants & leisure) | | | 27,600 | | | $ | 90 | |
| | Arca Continental SAB de CV (Beverages) | | | 10,300 | | | | 106 | |
| | Corp. Inmobiliaria Vesta SAB de CV (Real estate management & development) | | | 69,800 | | | | 226 | |
| | Grupo Aeroportuario del Centro Norte SAB de CV (Transportation infrastructure) | | | 9,100 | | | | 97 | |
| | Grupo Aeroportuario del Sureste SAB de CV (Transportation infrastructure) | | | 3,390 | | | | 95 | |
| | Qualitas Controladora SAB de CV (Insurance) | | | 20,700 | | | | 153 | |
| | Wal-Mart de Mexico SAB de CV (Consumer staples distribution & retail) | | | 48,300 | | | | 191 | |
| | | | | | | | | 958 | |
| | Peru—0.5% | | | | | | | | |
| | Credicorp Ltd. (Banks)† | | | 676 | | | | 100 | |
| | | | | | | | | | |
| | Emerging Europe, Mid-East, Africa—10.2% | | | | | | | | |
| | Poland—1.0% | | | | | | | | |
| * | Dino Polska SA (Consumer staples distribution & retail) | | | 1,564 | | | | 183 | |
| | Qatar—0.3% | | | | | | | | |
| | Qatar Gas Transport Co. Ltd. (Oil, gas & consumable fuels) | | | 42,730 | | | | 48 | |
| | Saudi Arabia—4.6% | | | | | | | | |
| | Aldrees Petroleum & Transport Services Co. (Oil, gas & consumable fuels) | | | 3,403 | | | | 113 | |
| | Arabian Internet & Communications Services Co. (IT services) | | | 921 | | | | 79 | |
| | Bupa Arabia for Cooperative Insurance Co. (Insurance) | | | 1,893 | | | | 94 | |
| | Dallah Healthcare Co. (Health care providers & services) | | | 1,144 | | | | 51 | |
| | Dr Sulaiman Al Habib Medical Services Group Co. (Health care providers & services) | | | 2,922 | | | | 223 | |
| | Elm Co. (IT services) | | | 1,160 | | | | 180 | |
| | Leejam Sports Co. JSC (Hotels, restaurants & leisure) | | | 1,921 | | | | 66 | |
| | Saudia Dairy & Foodstuff Co. (Food products) | | | 913 | | | | 78 | |
| | | | | | | | | 884 | |
| | South Africa—1.9% | | | | | | | | |
| | Bidvest Group Ltd. (Industrial conglomerates) | | | 12,546 | | | | 174 | |
| | Naspers Ltd. (Broadline retail) | | | 1,080 | | | | 195 | |
| | | | | | | | | 369 | |
| | | | | | | | | | |
See accompanying Notes to Financial Statements.
| 70 | Semiannual Report | June 30, 2023 |
Emerging Markets ex China Growth Fund
Portfolio of Investments, June 30, 2023 (all dollar amounts in thousands) (unaudited)
| | Issuer | | Shares or
Principal
Amount | | | Value | |
| | | | | | | | | | |
| | Common Stocks—(continued) | | | | | | | | |
| | | | | | | | | | |
| | Emerging Europe, Mid-East, Africa—(continued) | | | | | | | | |
| | United Arab Emirates—2.4% | | | | | | | | |
| | Americana Restaurants International PLC (Hotels, restaurants & leisure) | | | 122,779 | | | $ | 141 | |
| | Emaar Properties PJSC (Real estate management & development) | | | 73,155 | | | | 128 | |
| | Emirates Central Cooling Systems Corp. (Water utilities) | | | 128,903 | | | | 63 | |
| | Salik Co. PJSC (Transportation infrastructure) | | | 146,898 | | | | 126 | |
| | | | | | | | | 458 | |
| | Total Common Stocks—98.2%
(cost $16,362) | | | | | | | 18,786 | |
| | | | | | | | | | |
| | Repurchase Agreement | | | | | | | | |
| | Fixed Income Clearing Corporation, 2.100% dated 06/30/23, due 07/03/23, repurchase price $255, collateralized by U.S. Treasury Note, 1.375%, due 11/15/31, valued at $260 | | | $255 | | | | 255 | |
| | Total Repurchase Agreement—1.3%
(cost $255) | | | | | | | 255 | |
| | Total Investments—99.5%
(cost $16,617) | | | | | | | 19,041 | |
| | Cash and other assets, less liabilities—0.5% | | | | | | | 89 | |
| | Net assets—100.0% | | | | | | $ | 19,130 | |
ADR = American Depository Receipt
* = Non-income producing security
† = U.S. listed foreign security
At June 30, 2023, the Fund’s Portfolio of Investments includes the following industry categories (as a percentage of long-term investments):
| Information Technology | | | 36.4 | % |
| Financials | | | 19.3 | % |
| Industrials | | | 12.4 | % |
| Consumer Discretionary | | | 9.6 | % |
| Consumer Staples | | | 7.8 | % |
| Health Care | | | 5.5 | % |
| Real Estate | | | 2.4 | % |
| Energy | | | 2.4 | % |
| Communication Services | | | 2.1 | % |
| Materials | | | 1.8 | % |
| Utilities | | | 0.3 | % |
| Total | | | 100.0 | % |
At June 30, 2023, the Fund’s Portfolio of Investments includes the following currency categories (as a percentage of long-term investments):
| New Taiwan Dollar | | | 26.0 | % |
| Indian Rupee | | | 25.7 | % |
| South Korean Won | | | 10.7 | % |
| Brazilian Real | | | 6.9 | % |
| South African Rand | | | 6.7 | % |
| Indonesian Rupiah | | | 6.3 | % |
| U.S. Dollar | | | 5.2 | % |
| Mexican Peso | | | 5.1 | % |
| UAE Dirham | | | 2.4 | % |
| Thai Baht | | | 2.1 | % |
| Philippine Peso | | | 1.7 | % |
| All Other Currencies | | | 1.2 | % |
| Total | | | 100.0 | % |
See accompanying Notes to Financial Statements.
| June 30, 2023 | William Blair Funds | 71 |
| | Emerging Markets Small Cap Growth Fund |
| | |
| | The Emerging Markets Small Cap Growth Fund seeks long-term capital appreciation. |
| | |
| | AN OVERVIEW FROM THE PORTFOLIO MANAGERS |
| | |

Todd M. McClone, CFA 
Casey K. Preyss, CFA 
D.J. Neiman, CFA | The William Blair Emerging Markets Small Cap Growth Fund (Class N shares) (the “Fund”) posted an 11.90% increase, net of fees, for the six months ended June 30, 2023. By comparison, the Fund’s benchmark index, the MSCI Emerging Markets Small Cap Index (net) (the “Index”), increased 10.50%. Outperformance versus the Index was primarily driven by strong stock selection effect within various sectors, in particular Communication Services, Industrials, and Real Estate. JYP Entertainment drove Communication Services outperformance. The stock rallied amid strong momentum for K-pop bands, a growing fanbase with concerts and merchandising growth, and an expanding presence in the United States. Strong results within Industrials were primarily driven by Indian electrical equipment companies Kei Industries and ABB India, as well as Grupo Aeroportuario Del Centro and Grupo Aeroportuario Del Sureste. Kei Industries, the leading cable and wire manufacturer, and ABB India, a global leader in automation with a portfolio geared towards electrification and automation, delivered strong performance as they benefited from increased private and government capital expenditures and weaker raw materials prices. The Mexican airport stocks strengthened in the first quarter on solid operating performance due to robust traffic growth, domestically and internationally, bolstered by pent-up demand for leisure and nearshoring opportunities. Lodha bolstered Real Estate relative performance as the stock performance accelerated in the second quarter on the company’s robust volume growth and buoyant housing demand. Partially offsetting these strong effects was the weak stock selection within Materials, Consumer Discretionary, and Information Technology sectors. Indian specialty chemicals companies, Gujarat Fluorochemicals and Fine Organic Industries were among the most notable detractors within the Materials sector. Gujarat Fluorochemicals is a chemicals company with a diversified portfolio of fluoropolymers. The stock weakened amid decreasing raw material prices and impact on its bulk chemical exposure. Fine Organic Industries, the largest manufacturer of oleochemical-based additives in India, was sold in the first quarter due to a weakening fundamental outlook. Jiumaojiu International Holdings Limited hampered discretionary relative performance amid a disappointing consumer recovery in China. Within Information Technology, Locaweb servicos de internet (“Locaweb”), the Brazilian internet platform, weighed on the sector performance during the first quarter. Locaweb’s continued investments for growth, including consolidating the market, dragged down near-term return and drove the stock weakness in the first quarter. However, evidence of Locaweb’s margin recovery and sustained revenue growth in the second quarter was supportive. Please refer to the Global Markets Review and Outlook relating to the Fund on page 29. |
| 72 | Semiannual Report | June 30, 2023 |
Emerging Markets Small Cap Growth Fund
Performance Highlights (Unaudited)
| |
| Average Annual Total Returns through 6/30/2023 |
| | | Year
to Date | | 1 Year | | 3 Year | | 5 Year | | 10 Year |
| Class N | | | 11.90 | % | | | 10.31 | % | | | 6.67 | % | | | 4.49 | % | | | 5.76 | % |
| Class I | | | 12.10 | | | | 10.65 | | | | 6.96 | | | | 4.77 | | | | 6.06 | |
| Class R6 | | | 12.13 | | | | 10.68 | | | | 7.02 | | | | 4.82 | | | | 6.13 | |
| MSCI Emerging Markets Small Cap Index (net) | | | 10.50 | | | | 13.28 | | | | 13.72 | | | | 4.93 | | | | 4.63 | |
Performance cited represents past performance. Past performance does not guarantee future results and current performance may be lower or higher than the data quoted. Results shown are average annual total returns, which assume reinvestment of dividends and capital gains. Investment returns and principal will fluctuate and you may have a gain or loss when you sell shares. For the most current month-end performance information, please call 1-800-742-7272, or visit our Web site at www.williamblairfunds.com. From time to time, the investment adviser may waive fees or reimburse expenses for the Fund. Without these waivers/reimbursements, performance would be lower. International investing involves special risk considerations, including currency fluctuations, lower liquidity, economic and political risk. These risks may be magnified when investing in emerging markets. Smaller capitalization stocks are also more sensitive to purchase/sale transactions and changes in the issuer’s financial condition. Class N shares are not subject to a sales load. Class I shares are not subject to a sales load or distribution (Rule 12b-1) fees. Class R6 shares are not subject to a sales load, distribution (Rule 12b-1) fees, or sub-transfer agent fees.
The performance highlights and graph presented above do not reflect the deduction of taxes that a shareholder would pay on fund distributions or the redemption of fund shares.
The Morgan Stanley Capital International (MSCI) Emerging Markets Small Cap Index (net) is a free float-adjusted market capitalization index that is designed to measure the equity market performance of emerging markets. This index approximates the minimum possible dividend reinvestment by deducting for the highest possible withholding tax rates of those markets.
This report identifies the Fund’s investments on June 30, 2023. These holdings are subject to change. Not all stocks in the Fund performed the same, nor is there any guarantee that these stocks will perform as well in the future. Market forecasts provided in this report may not necessarily come to pass.
Sector Diversification (Unaudited)

The sector diversification shown is based on the total long-term securities.
| June 30, 2023 | William Blair Funds | 73 |
Emerging Markets Small Cap Growth Fund
Portfolio of Investments, June 30, 2023 (all dollar amounts in thousands) (unaudited)
| | | | | | | | |
| | | | | | |
| | Issuer | | Shares | | | Value | |
| | | | | | | | | | |
| | Common Stocks | | | | | | | | |
| | | | | | | | | | |
| | Emerging Asia—65.4% | | | | | | | | |
| | China—6.5% | | | | | | | | |
| | Airtac International Group (Machinery) | | | 84,158 | | | $ | 2,770 | |
| | Centre Testing International Group Co. Ltd. (Professional services) | | | 869,005 | | | | 2,331 | |
| * | Estun Automation Co. Ltd. (Machinery) | | | 156,800 | | | | 604 | |
| | Huaneng Lancang River Hydropower, Inc. (Independent power & renewable electricity producers) | | | 5,968,312 | | | | 5,853 | |
| | Jiumaojiu International Holdings Ltd. (Hotels, restaurants & leisure) | | | 1,135,000 | | | | 1,860 | |
| | Longshine Technology Group Co. Ltd. (Software) | | | 167,958 | | | | 538 | |
| | Proya Cosmetics Co. Ltd. (Personal care products) | | | 392,488 | | | | 6,068 | |
| | Shanghai M&G Stationery, Inc. (Commercial services & supplies) | | | 88,547 | | | | 544 | |
| | Sunresin New Materials Co. Ltd. (Chemicals) | | | 178,350 | | | | 1,531 | |
| | Topsports International Holdings Ltd. (Specialty retail) | | | 1,167,000 | | | | 1,011 | |
| * | Zhejiang Dingli Machinery Co. Ltd. (Machinery) | | | 49,978 | | | | 385 | |
| | | | | | | | | 23,495 | |
| | India—32.3% | | | | | | | | |
| | ABB India Ltd. (Electrical equipment) | | | 122,086 | | | | 6,576 | |
| | APL Apollo Tubes Ltd. (Metals & mining) | | | 321,321 | | | | 5,092 | |
| | Astral Ltd. (Building products) | | | 201,750 | | | | 4,877 | |
| | AU Small Finance Bank Ltd. (Banks) | | | 536,885 | | | | 4,936 | |
| | Berger Paints India Ltd. (Chemicals) | | | 133,380 | | | | 1,104 | |
| | Carborundum Universal Ltd. (Chemicals) | | | 33,734 | | | | 494 | |
| | Century Plyboards India Ltd. (Paper & forest products) | | | 92,234 | | | | 743 | |
| | CG Power & Industrial Solutions Ltd. (Electrical equipment) | | | 642,639 | | | | 2,953 | |
| | Cholamandalam Investment & Finance Co. Ltd. (Consumer finance) | | | 424,437 | | | | 5,908 | |
| | Coforge Ltd. (IT services) | | | 19,018 | | | | 1,093 | |
| | Cummins India Ltd. (Machinery) | | | 40,254 | | | | 953 | |
| | Dixon Technologies India Ltd. (Household durables) | | | 60,561 | | | | 3,244 | |
| * | Godrej Properties Ltd. (Real estate management & development) | | | 168,758 | | | | 3,229 | |
| | Gujarat Fluorochemicals Ltd. (Chemicals) | | | 67,865 | | | | 2,423 | |
| | IndiaMart InterMesh Ltd. (Trading companies & distributors) | | | 45,315 | | | | 1,555 | |
| | Jindal Stainless Ltd. (Metals & mining) | | | 559,014 | | | | 2,259 | |
| | JK Cement Ltd. (Construction materials) | | | 56,626 | | | | 2,340 | |
| | Kajaria Ceramics Ltd. (Building products) | | | 79,674 | | | | 1,221 | |
| | KEI Industries Ltd. (Electrical equipment) | | | 317,605 | | | | 8,946 | |
| | KPIT Technologies Ltd. (Software) | | | 486,549 | | | | 6,478 | |
| * | Macrotech Developers Ltd. (Real estate management & development) | | | 612,059 | | | | 5,096 | |
| | | | | | | | |
| | | | | | |
| | Issuer | | Shares | | | Value | |
| | | | | | | | | | |
| | Common Stocks—(continued) | | | | | | | | |
| | | | | | | | | | |
| | Emerging Asia—(continued) | | | | | | | | |
| | India—(continued) | | | | | | | | |
| * | Max Healthcare Institute Ltd. (Health care providers & services) | | | 831,490 | | | $ | 6,081 | |
| | Navin Fluorine International Ltd. (Chemicals) | | | 10,073 | | | | 552 | |
| | Oberoi Realty Ltd. (Real estate management & development) | | | 32,202 | | | | 387 | |
| | PI Industries Ltd. (Chemicals) | | | 9,441 | | | | 450 | |
| | Polycab India Ltd. (Electrical equipment) | | | 155,697 | | | | 6,743 | |
| | Radico Khaitan Ltd. (Beverages) | | | 90,711 | | | | 1,349 | |
| | Ramkrishna Forgings Ltd. (Metals & mining) | | | 232,232 | | | | 1,260 | |
| | SRF Ltd. (Chemicals) | | | 82,429 | | | | 2,303 | |
| | Sundram Fasteners Ltd. (Automobile components) | | | 180,271 | | | | 2,664 | |
| | Trent Ltd. (Specialty retail) | | | 235,976 | | | | 5,061 | |
| | Triveni Turbine Ltd. (Electrical equipment) | | | 719,741 | | | | 3,555 | |
| | Tube Investments of India Ltd. (Automobile components) | | | 134,922 | | | | 5,231 | |
| | UNO Minda Ltd. (Automobile components) | | | 88,081 | | | | 625 | |
| | Varun Beverages Ltd. (Beverages) | | | 805,954 | | | | 7,909 | |
| | Venus Pipes & Tubes Ltd. (Metals & mining) | | | 103,693 | | | | 1,454 | |
| | VIP Industries Ltd. (Textiles, apparel & luxury goods) | | | 50,134 | | | | 376 | |
| | | | | | | | | 117,520 | |
| | Indonesia—2.7% | | | | | | | | |
| | Bank Negara Indonesia Persero Tbk PT (Banks) | | | 8,568,700 | | | | 5,230 | |
| * | Mitra Adiperkasa Tbk PT (Broadline retail) | | | 40,453,600 | | | | 4,560 | |
| | | | | | | | | 9,790 | |
| | Philippines—0.3% | | | | | | | | |
| | International Container Terminal Services, Inc. (Transportation infrastructure) | | | 99,430 | | | | 367 | |
| | Wilcon Depot, Inc. (Specialty retail) | | | 1,522,001 | | | | 666 | |
| | | | | | | | | 1,033 | |
| | South Korea—3.5% | | | | | | | | |
| | F&F Co. Ltd. (Textiles, apparel & luxury goods) | | | 3,778 | | | | 343 | |
| | JYP Entertainment Corp. (Entertainment) | | | 57,214 | | | | 5,680 | |
| | Koh Young Technology, Inc. (Semiconductors & semiconductor equipment) | | | 231,923 | | | | 2,711 | |
| | LEENO Industrial, Inc. (Semiconductors & semiconductor equipment) | | | 3,419 | | | | 381 | |
| | Orion Corp. (Food products) | | | 39,324 | | | | 3,581 | |
| | | | | | | | | 12,696 | |
See accompanying Notes to Financial Statements.
| 74 | Semiannual Report | June 30, 2023 |
Emerging Markets Small Cap Growth Fund
Portfolio of Investments, June 30, 2023 (all dollar amounts in thousands) (unaudited)
| | | | | | | | |
| | | | | | |
| | Issuer | | Shares | | | Value | |
| | | | | | | | | | |
| | Common Stocks—(continued) | | | | | | | | |
| | | | | | | | | | |
| | Emerging Asia—(continued) | | | | | | | | |
| | Taiwan—18.4% | | | | | | | | |
| | Alchip Technologies Ltd. (Semiconductors & semiconductor equipment) | | | 103,000 | | | $ | 5,936 | |
| | ASMedia Technology, Inc. (Semiconductors & semiconductor equipment) | | | 103,000 | | | | 3,489 | |
| | ASPEED Technology, Inc. (Semiconductors & semiconductor equipment) | | | 64,900 | | | | 5,939 | |
| | Elite Material Co. Ltd. (Electronic equipment, instruments & components) | | | 332,000 | | | | 2,596 | |
| | eMemory Technology, Inc. (Semiconductors & semiconductor equipment) | | | 73,000 | | | | 5,180 | |
| | Faraday Technology Corp. (Semiconductors & semiconductor equipment) | | | 377,000 | | | | 2,554 | |
| * | Great Tree Pharmacy Co. Ltd. (Consumer staples distribution & retail) | | | 150,000 | | | | 1,821 | |
| | Kaori Heat Treatment Co. Ltd. (Machinery) | | | 160,000 | | | | 1,739 | |
| | Lotes Co. Ltd. (Electronic equipment, instruments & components) | | | 234,669 | | | | 6,480 | |
| | Nanya Technology Corp. (Semiconductors & semiconductor equipment) | | | 3,091,000 | | | | 7,027 | |
| | Parade Technologies Ltd. (Semiconductors & semiconductor equipment) | | | 154,000 | | | | 5,315 | |
| | Sinbon Electronics Co. Ltd. (Electronic equipment, instruments & components) | | | 565,000 | | | | 6,703 | |
| | Voltronic Power Technology Corp. (Electrical equipment) | | | 99,507 | | | | 6,278 | |
| | Wiwynn Corp. (Technology hardware, storage & peripherals) | | | 126,000 | | | | 5,745 | |
| | | | | | | | | 66,802 | |
| | Thailand—1.7% | | | | | | | | |
| | Bumrungrad Hospital PCL (Health care providers & services) | | | 673,900 | | | | 4,296 | |
| * | Central Plaza Hotel PCL (Hotels, restaurants & leisure) | | | 1,234,100 | | | | 1,723 | |
| | Com7 PCL (Specialty retail) | | | 438,100 | | | | 327 | |
| | | | | | | | | 6,346 | |
| | | | | | | | | | |
| | Emerging Latin America—17.4% | | | | | | | | |
| | Argentina—1.3% | | | | | | | | |
| | Arcos Dorados Holdings, Inc. (Hotels, restaurants & leisure)† | | | 457,378 | | | | 4,688 | |
| | Brazil—9.0% | | | | | | | | |
| * | Azul SA—ADR (Passenger airlines) | | | 72,411 | | | | 991 | |
| | Cyrela Brazil Realty SA Empreendimentos e Participacoes (Household durables) | | | 1,456,400 | | | | 6,123 | |
| | Grupo SBF SA (Specialty retail) | | | 866,700 | | | | 2,406 | |
| | Hypera SA (Pharmaceuticals) | | | 518,300 | | | | 4,980 | |
| * | Lojas Quero Quero SA (Specialty retail) | | | 917,700 | | | | 1,167 | |
| | | | | | | | |
| | | | | | |
| | Issuer | | Shares | | | Value | |
| | | | | | | | | | |
| | Common Stocks—(continued) | | | | | | | | |
| | | | | | | | | | |
| | Emerging Latin America—(continued) | | | | | | | | |
| | Brazil—(continued) | | | | | | | | |
| | Multiplan Empreendimentos Imobiliarios SA (Real estate management & development) | | | 1,385,400 | | | $ | 8,006 | |
| | TOTVS SA (Software) | | | 1,419,400 | | | | 8,887 | |
| | | | | | | | | 32,560 | |
| | Mexico—7.1% | | | | | | | | |
| * | Alsea SAB de CV (Hotels, restaurants & leisure) | | | 793,800 | | | | 2,585 | |
| | Banco del Bajio SA (Banks) | | | 298,000 | | | | 910 | |
| * | Corp. Inmobiliaria Vesta SAB de CV—ADR (Real estate management & development) | | | 15,600 | | | | 503 | |
| | Corp. Inmobiliaria Vesta SAB de CV (Real estate management & development) | | | 1,461,400 | | | | 4,743 | |
| | Grupo Aeroportuario del Centro Norte SAB de CV (Transportation infrastructure) | | | 399,299 | | | | 4,246 | |
| | Grupo Aeroportuario del Sureste SAB de CV (Transportation infrastructure) | | | 175,835 | | | | 4,915 | |
| | Prologis Property Mexico SA de CV (Industrial REITs) | | | 1,305,300 | | | | 4,832 | |
| | Qualitas Controladora SAB de CV (Insurance) | | | 239,100 | | | | 1,769 | |
| | Regional SAB de CV (Banks) | | | 176,500 | | | | 1,279 | |
| | | | | | | | | 25,782 | |
| | | | | | | | | | |
| | Emerging Europe, Mid-East—17.0% | | | | | | | | |
| | Greece—2.2% | | | | | | | | |
| | JUMBO SA (Specialty retail) | | | 75,608 | | | | 2,079 | |
| | Terna Energy SA (Independent power & renewable electricity producers) | | | 274,688 | | | | 6,055 | |
| | | | | | | | | 8,134 | |
| | Kazakhstan—1.5% | | | | | | | | |
| | Kaspi.KZ JSC—GDR (Consumer finance) | | | 65,706 | | | | 5,230 | |
| | Poland—3.0% | | | | | | | | |
| * | Dino Polska SA (Consumer staples distribution & retail) | | | 94,350 | | | | 11,018 | |
| | Qatar—0.1% | | | | | | | | |
| | Qatar Gas Transport Co. Ltd. (Oil, gas & consumable fuels) | | | 334,814 | | | | 374 | |
| | Saudi Arabia—7.6% | | | | | | | | |
| | Aldrees Petroleum & Transport Services Co. (Oil, gas & consumable fuels) | | | 71,992 | | | | 2,384 | |
| | Arabian Internet & Communications Services Co. (IT services) | | | 29,535 | | | | 2,540 | |
| | Bupa Arabia for Cooperative Insurance Co. (Insurance) | | | 62,698 | | | | 3,103 | |
See accompanying Notes to Financial Statements.
| June 30, 2023 | William Blair Funds | 75 |
Emerging Markets Small Cap Growth Fund
Portfolio of Investments, June 30, 2023 (all dollar amounts in thousands) (unaudited)
| | Issuer | | Shares or
Principal
Amount | | | Value | |
| | | | | | | | | | |
| | Common Stocks—(continued) | | | | | | | | |
| | | | | | | | | | |
| | Emerging Europe, Mid-East—(continued) | | | | | | | | |
| | Saudi Arabia—(continued) | | | | | | | | |
| | Dallah Healthcare Co. (Health care providers & services) | | | 69,247 | | | $ | 3,098 | |
| | Dr Sulaiman Al Habib Medical Services Group Co. (Health care providers & services) | | | 50,222 | | | | 3,832 | |
| | Elm Co. (IT services) | | | 37,466 | | | | 5,814 | |
| | Leejam Sports Co. JSC (Hotels, restaurants & leisure) | | | 120,612 | | | | 4,148 | |
| | Nahdi Medical Co. (Consumer staples distribution & retail) | | | 12,300 | | | | 557 | |
| | Saudia Dairy & Foodstuff Co. (Food products) | | | 25,885 | | | | 2,202 | |
| | | | | | | | | 27,678 | |
| | United Arab Emirates—2.6% | | | | | | | | |
| | Americana Restaurants International PLC (Hotels, restaurants & leisure) | | | 2,566,584 | | | | 2,956 | |
| | Emirates Central Cooling Systems Corp. (Water utilities) | | | 4,267,015 | | | | 2,091 | |
| | Salik Co. PJSC (Transportation infrastructure) | | | 5,040,825 | | | | 4,323 | |
| | | | | | | | | 9,370 | |
| | Total Common Stocks—99.8%
(cost $298,271) | | | | | | | 362,516 | |
| | | | | | | | | | |
| | Repurchase Agreement | | | | | | | | |
| | Fixed Income Clearing Corporation, 2.100% dated 06/30/23, due 07/03/23, repurchase price $4,112, collateralized by U.S. Treasury Note, 1.375%, due 11/15/31, valued at $4,193 | | | $4,111 | | | | 4,111 | |
| | Total Repurchase Agreement—1.1%
(cost $4,111) | | | | | | | 4,111 | |
| | Total Investments—100.9%
(cost $302,382) | | | | | | | 366,627 | |
| | Liabilities, plus cash and other assets—(0.9)% | | | | | | | (3,235 | ) |
| | Net assets—100.0% | | | | | | $ | 363,392 | |
ADR = American Depository Receipt
GDR = Global Depository Receipt
REIT = Real Estate Investment Trust
* = Non-income producing security
† = U.S. listed foreign security
At June 30, 2023, the Fund’s Portfolio of Investments includes the following industry categories (as a percentage of long-term investments):
| Information Technology | | | 23.5 | % |
| Industrials | | | 18.4 | % |
| Consumer Discretionary | | | 14.9 | % |
| Consumer Staples | | | 9.5 | % |
| Financials | | | 7.8 | % |
| Real Estate | | | 7.4 | % |
| Health Care | | | 6.1 | % |
| Materials | | | 6.1 | % |
| Utilities | | | 3.9 | % |
| Communication Services | | | 1.6 | % |
| Energy | | | 0.8 | % |
| Total | | | 100.0 | % |
At June 30, 2023, the Fund’s Portfolio of Investments includes the following currency categories (as a percentage of long-term investments):
| Indian Rupee | | | 32.4 | % |
| New Taiwan Dollar | | | 19.2 | % |
| Brazilian Real | | | 8.7 | % |
| South African Rand | | | 7.6 | % |
| Mexican Peso | | | 7.0 | % |
| Chinese Yuan Renminbi | | | 4.9 | % |
| South Korean Won | | | 3.5 | % |
| U.S. Dollar | | | 3.2 | % |
| Polish Zloty | | | 3.0 | % |
| Indonesian Rupiah | | | 2.7 | % |
| UAE Dirham | | | 2.6 | % |
| Euro | | | 2.2 | % |
| Thai Baht | | | 1.8 | % |
| All Other Currencies | | | 1.2 | % |
| Total | | | 100.0 | % |
See accompanying Notes to Financial Statements.
| 76 | Semiannual Report | June 30, 2023 |
| | China Growth Fund |
| | |
| | The China Growth Fund seeks long-term capital appreciation. |
| | |
| | AN OVERVIEW FROM THE PORTFOLIO MANAGERS |
| | |

Vivian Lin Thurston, CFA 
Casey K. Preyss, CFA | The William Blair China Growth Fund (Class I shares) (the “Fund”) posted a 15.02% decrease, net of fees, for the six months ended June 30, 2023. By comparison, the Fund’s benchmark index, the MSCI China All Shares Index (net) (the “Index”), decreased 5.36%. Six-month underperformance versus the Index was primarily driven by negative stock selection within Consumer Discretionary and Financials. Within the Consumer Discretionary sector, China Tourism Group (“CTG”) underperformed while the recovery of duty-free sales remained slow as COVID-related headwinds dissipated, consumer confidence remained weak, and air travel remained well below 2019 levels. While the long-term outlook of CTG’s large and growing total addressable market of duty-free shopping in China provides a substantial runway for growth, we continue to monitor the near-term demand recovery and macroeconomic headwinds. Bank of Ningbo underperformed in the Financials sector. Bank of Ningbo is a top-five city commercial bank in China by total assets, loans, and deposits. The company continues to stand out for its focused strategy around higher-margin small and midsize enterprises and nonmortgage retail businesses, which we believe will generate superior growth, good asset quality, and profitability relative to its peers. The stock traded down due to the broad underperformance in the banking sector, which suffered declines that stemmed from the collapse of multiple regional banks earlier this year. Partially offsetting these effects was an underweight allocation to the Real Estate and Materials sectors coupled with positive stock selection within the Communication Services sector. NetEase, within the Communication Services sector, bolstered returns. NetEase operates as a leading internet technology company providing online services including content, community, communication, and commerce. The company develops and operates online games, electronic commerce, internet media, and other businesses. The stock advanced during the period primarily on strong performance within the gaming portfolio, which drove up total net revenues more than 6% year-over-year. Please refer to the Global Markets Review and Outlook relating to the Fund on page 29. |
| June 30, 2023 | William Blair Funds | 77 |
China Growth Fund
Performance Highlights (Unaudited)
| |
| Average Annual Total Return 6/30/2023 |
| | | Year to
Date | | 1 Year | | Since
Inception(a) |
| Class I | | | (15.02 | )% | | | (29.34 | )% | | | (27.76 | )% |
| Class R6 | | | (15.19 | ) | | | (29.55 | ) | | | (27.88 | ) |
| MSCI China All Shares Index (net) | | | (5.36 | ) | | | (18.05 | ) | | | (17.67 | ) |
| (a) | Since inception is for the period from August 27, 2021 (Commencement of Operations) to June 30, 2023. |
Performance cited represents past performance. Past performance does not guarantee future results and current performance may be lower or higher than the data quoted. Results shown are average annual total returns, which assume reinvestment of dividends and capital gains. Investment returns and principal will fluctuate and you may have a gain or loss when you sell shares. For the most current month-end performance information, please call 1-800-742-7272, or visit our Web site at www.williamblairfunds.com. From time to time, the investment adviser may waive fees or reimburse expenses for the Fund. Without these waivers/reimbursements, performance would be lower. International investing involves special risk considerations, including currency fluctuations, lower liquidity, economic and political risk. These risks may be magnified when investing in emerging markets. Smaller capitalization stocks are also more sensitive to purchase/sale transactions and changes in the issuer’s financial condition. Class I shares are not subject to a sales load or distribution (Rule 12b-1) fees. Class R6 shares are not subject to a sales load, distribution (Rule 12b-1) fees, or sub-transfer agent fees.
The performance highlights and graph presented above do not reflect the deduction of taxes that a shareholder would pay on fund distributions or the redemption of fund shares.
The MSCI China All Shares Index (net) captures large and mid-cap representation across China A-shares, B-shares, H-shares, Red-chips, P-chips, and foreign listings. The index aims to reflect the opportunity set of China share classes listed in Hong Kong, Shanghai, Shenzhen, and outside of China. The Index is unmanaged, does not incur fees or expenses, and cannot be invested in directly.
This report identifies the Fund’s investments on June 30, 2023. These holdings are subject to change. Not all stocks in the Fund performed the same, nor is there any guarantee that these stocks will perform as well in the future. Market forecasts provided in this report may not necessarily come to pass.
Sector Diversification (Unaudited)
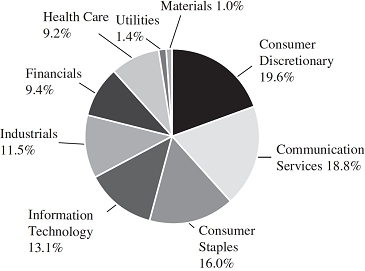
The sector diversification shown is based on the total long-term securities.
| 78 | Semiannual Report | June 30, 2023 |
China Growth Fund
Portfolio of Investments, June 30, 2023 (all dollar amounts in thousands) (unaudited)
| | | | | | |
| | | | | | |
| | Issuer | | Shares | | | Value | |
| | | | | | | | | | |
| | Common Stocks | | | | | | | | |
| | | | | | | | | | |
| | Emerging Asia—93.2% | | | | | | | | |
| | China—93.2% | | | | | | | | |
| | Aier Eye Hospital Group Co. Ltd. (Health care providers & services) | | | 13,048 | | | $ | 33 | |
| | Airtac International Group (Machinery) | | | 1,000 | | | | 33 | |
| | AK Medical Holdings Ltd. (Health care equipment & supplies) | | | 10,000 | | | | 9 | |
| * | Alibaba Group Holding Ltd. (Broadline retail) | | | 9,600 | | | | 100 | |
| * | Bank of Chengdu Co. Ltd. (Banks) | | | 7,900 | | | | 13 | |
| | Bank of Ningbo Co. Ltd. (Banks) | | | 5,990 | | | | 21 | |
| * | Beijing Kingsoft Office Software, Inc. (Software) | | | 629 | | | | 41 | |
| | BYD Co. Ltd. (Automobiles) | | | 1,400 | | | | 45 | |
| | China Tourism Group Duty Free Corp. Ltd. (Specialty retail) | | | 900 | | | | 14 | |
| | Contemporary Amperex Technology Co. Ltd. (Electrical equipment) | | | 1,240 | | | | 39 | |
| | East Money Information Co. Ltd. (Capital markets) | | | 15,744 | | | | 31 | |
| | Eastroc Beverage Group Co. Ltd. (Beverages) | | | 400 | | | | 10 | |
| * | Estun Automation Co. Ltd. (Machinery) | | | 3,000 | | | | 12 | |
| | Foshan Haitian Flavouring & Food Co. Ltd. (Food products) | | | 2,072 | | | | 13 | |
| * | Giant Biogene Holding Co. Ltd. (Personal care products) | | | 1,600 | | | | 7 | |
| * | Hangzhou Tigermed Consulting Co. Ltd. (Life sciences tools & services) | | | 1,217 | | | | 11 | |
| | Huaneng Lancang River Hydropower, Inc. (Independent power & renewable electricity producers) | | | 18,500 | | | | 18 | |
| | Hundsun Technologies, Inc. (Software) | | | 2,100 | | | | 13 | |
| | Inner Mongolia Yili Industrial Group Co. Ltd. (Food products) | | | 4,200 | | | | 16 | |
| | JD.com, Inc. (Broadline retail) | | | 802 | | | | 14 | |
| | Jiangsu Hengli Hydraulic Co. Ltd. (Machinery) | | | 2,500 | | | | 22 | |
| * | Kuaishou Technology (Interactive media & services) | | | 2,100 | | | | 14 | |
| | Kweichow Moutai Co. Ltd. (Beverages) | | | 400 | | | | 93 | |
| | Li Ning Co. Ltd. (Textiles, apparel & luxury goods) | | | 3,500 | | | | 19 | |
| | Maxscend Microelectronics Co. Ltd. (Electronic equipment, instruments & components) | | | 600 | | | | 8 | |
| * | Meituan (Hotels, restaurants & leisure) | | | 2,910 | | | | 45 | |
| | Midea Group Co. Ltd. (Household durables) | | | 1,400 | | | | 11 | |
| | NAURA Technology Group Co. Ltd. (Semiconductors & semiconductor equipment) | | | 900 | | | | 39 | |
| | NetEase, Inc. (Entertainment) | | | 4,000 | | | | 78 | |
| | Proya Cosmetics Co. Ltd. (Personal care products) | | | 2,288 | | | | 35 | |
| | Shenzhen Inovance Technology Co. Ltd. (Machinery) | | | 2,500 | | | | 22 | |
| | | | | | |
| | | | | | |
| | Issuer | | Shares | | | Value | |
| | | | | | | | | | |
| | Common Stocks—(continued) | | | | | | | | |
| | | | | | | | | | |
| | Emerging Asia—(continued) | | | | | | | | |
| | China—(continued) | | | | | | | | |
| | Shenzhen Mindray Bio-Medical Electronics Co. Ltd. (Health care equipment & supplies) | | | 500 | | | $ | 21 | |
| | Silergy Corp. (Semiconductors & semiconductor equipment) | | | 1,100 | | | | 14 | |
| | Sunresin New Materials Co. Ltd. (Chemicals) | | | 1,500 | | | | 13 | |
| | Tencent Holdings Ltd. (Interactive media & services) | | | 3,600 | | | | 152 | |
| | Topsports International Holdings Ltd. (Specialty retail) | | | 12,000 | | | | 10 | |
| | Weichai Power Co. Ltd. (Machinery) | | | 7,000 | | | | 10 | |
| | Will Semiconductor Co. Ltd. Shanghai (Semiconductors & semiconductor equipment) | | | 800 | | | | 11 | |
| | Wuliangye Yibin Co. Ltd. (Beverages) | | | 1,500 | | | | 34 | |
| | WuXi AppTec Co. Ltd. (Life sciences tools & services) | | | 1,400 | | | | 11 | |
| | Wuxi Lead Intelligent Equipment Co. Ltd. (Machinery) | | | 2,300 | | | | 11 | |
| | Zhangzhou Pientzehuang Pharmaceutical Co. Ltd. (Pharmaceuticals) | | | 900 | | | | 35 | |
| | Zhejiang Jingsheng Mechanical & Electrical Co. Ltd. (Semiconductors & semiconductor equipment) | | | 2,200 | | | | 21 | |
| | Zhejiang Supcon Technology Co. Ltd. (Electronic equipment, instruments & components) | | | 2,743 | | | | 24 | |
| | | | | | | | | 1,246 | |
| | | | | | | | | | |
| | Asia—4.3% | | | | | | | | |
| | Hong Kong—4.3% | | | | | | | | |
| | AIA Group Ltd. (Insurance) | | | 4,200 | | | | 43 | |
| | Hong Kong Exchanges & Clearing Ltd. (Capital markets) | | | 400 | | | | 15 | |
| | | | | | | | | 58 | |
| | Total Common Stocks—97.5%
(cost $1,635) | | | | | | | 1,304 | |
| | Total Investments—97.5%
(cost $1,635) | | | | | | | 1,304 | |
| | Cash and other assets, less liabilities—2.5% | | | | | | | 33 | |
| | Net assets—100.0% | | | | | | $ | 1,337 | |
* = Non-income producing security
See accompanying Notes to Financial Statements.
| June 30, 2023 | William Blair Funds | 79 |
China Growth Fund
Portfolio of Investments, June 30, 2023 (unaudited)
At June 30, 2023, the Fund’s Portfolio of Investments includes the following industry categories (as a percentage of long-term investments):
| Consumer Discretionary | | | 19.6 | % |
| Communication Services | | | 18.8 | % |
| Consumer Staples | | | 16.0 | % |
| Information Technology | | | 13.1 | % |
| Industrials | | | 11.5 | % |
| Financials | | | 9.4 | % |
| Health Care | | | 9.2 | % |
| Utilities | | | 1.4 | % |
| Materials | | | 1.0 | % |
| Total | | | 100.0 | % |
At June 30, 2023, the Fund’s Portfolio of Investments includes the following currency categories (as a percentage of long-term investments):
| Chinese Yuan Renminbi | | | 52.5 | % |
| Hong Kong Dollar | | | 43.9 | % |
| New Taiwan Dollar | | | 3.6 | % |
| Total | | | 100.0 | % |
See accompanying Notes to Financial Statements.
| 80 | Semiannual Report | June 30, 2023 |
Emerging Markets Debt Market Review and Outlook
It was a strong first half of the year for emerging market (“EM”) fixed income asset performance against a mixed economic backdrop. Inflation slowed globally and U.S. economic growth beat expectations while Europe and China’s growth lagged expectations. Market volatility subsided across fixed income and equity markets, aiding investor demand for higher-carry strategies. Investors added assets to local currency strategies during the period while hard currency retail strategies continued to experience outflows. Positive EM debt (“EMD”) performance was even more impressive in the context of rising U.S. Treasury (“UST”) yields and a lack of investment flows.
Across the EMD market, local currency led performance from a mix of rate and currency strength. EM central banks are generally seen to be ahead of the curve in the interest rate cycle and are closer to cutting rates as compared to their developed market peers. This rate outlook, combined with high starting yields, which provide additional carry, aided the outperformance of local currency debt which saw 80% of the countries deliver positive returns, many in the double-digit range. Within dollar-denominated EMD, sovereign debt outperformed corporate debt and, from a quality perspective, high yield outperformed investment grade.
In this environment, the credit spread of the J.P. Morgan Emerging Markets Bond Index (EMBI) Global Diversified tightened 0.20%, to 4.32%, producing a positive total return of 4.09% for the six months ended June 30, 2023.
We retain our constructive medium-term outlook for EMD. While the global economy continues to slow down, we believe that a resilient U.S. economy provides reasons for optimism. In China, where economic growth disappointed in the first half of 2023, we believe that increasing stimulus should lead to a better second half of the year. The global disinflationary process should continue, allowing central banks in advanced economies to approach the end of the monetary tightening cycle. Overall, we anticipate a supportive global growth environment and improving prospects for global liquidity conditions.
In EM, the fundamental backdrop remains supportive in most places. In our view, rapidly falling inflation should allow EM central banks to start cutting interest rates, supporting the outlook for economic growth, fiscal and debt dynamics. Moreover, commodity exporting countries should continue to benefit from resilient commodity prices and, importantly, multilateral and bilateral organizations should continue to provide available and affordable funding to EM countries. We expect capital flows into EM countries to increase following EM economic growth outperformance, improving the outlook for EM external accounts and currencies.
EMD valuations remain attractive. In the hard currency space, sovereign and corporate credit yield levels remain significantly above long-term averages. The credit spread differential between the high-yield and investment grade sectors remain above long-term averages, and EM high-yield spread differential versus developed market credit remains appealing in our view. In the distressed credit universe, we continue to see overestimated default probabilities, and underestimated recovery values in the restructuring credit space. In the local currency space, EM currency valuations appear attractive from a real effective rate perspective, and the real interest rate differential versus developed markets favors EMs in most places. Local rates term premium also appears attractive in our view.
Market technical conditions remain the least supportive element in the investment case. While investor cash levels remain elevated, positioning defensive, and foreign ownership of local bond markets at multi-year lows, high market volatility, low liquidity and volatile investor flows remain strong headwinds. However, we do anticipate technical conditions to gradually improve as developed market central banks approach the end of the monetary tightening cycle.
| June 30, 2023 | William Blair Funds | 81 |
| | Emerging Markets Debt Fund |
| | |
| | The Emerging Markets Debt Fund seeks to provide attractive risk-adjusted returns relative to the Fund’s benchmark. |
| | |
| | AN OVERVIEW FROM THE PORTFOLIO MANAGERS |
| | |

Marcelo Assalin, CFA 
Marco Ruijer, CFA | The William Blair Emerging Markets Debt Fund (Class I shares) (the “Fund”) posted a 5.14% increase, net of fees, for the six months ended June 30, 2023. By comparison, the Fund’s benchmark index, the J.P. Morgan EMBI Global Diversified (the “Index”), increased 4.09%. Country allocation drove two-thirds of active performance, while security selection accounted for the remaining one-third. Positioning within the higher-risk countries contributed the most to active performance, followed by lower-risk countries, with medium-risk countries bringing up the rear. The Fund’s cash position was a drag on relative performance as the market posted positive returns. Within the higher-risk country segment, overweight positioning contributed the most to outperformance, especially in Sri Lanka, Argentina, and El Salvador. Conversely, an overweight position in Egypt detracted from relative performance, as did an underweight position in Nigeria. In Sri Lanka, our overweight position was helpful when the International Monetary Fund (“IMF”) approved a four-year $3 billion Extended Fund Facility Arrangement and an approximately $333 million tranche was subsequently disbursed. After securing IMF budget support, Sri Lanka engaged with creditors to undergo comprehensive debt restructuring. In Argentina, we marginally increased our overweight position by adding sovereign and provincial paper. The perceived trajectory in Argentina improved over the period as polling numbers and provincial election results implied that regime change is increasingly likely. Additionally, tail risks declined as the more moderate Sergio Massa became the chosen candidate for the left-leaning incumbent party, Frente de Todos. The next administration is set to assume office in January 2024 and will inherit a challenging macroeconomic environment with weak international reserves; however, it appears possible that more pragmatic policies will be put in place. The improved outlook led to strong performance of Argentine debt, contributing to the Fund’s performance. In El Salvador, our overweight position contributed to relative performance as the country’s bonds outperformed the broader market following the repayment of the 2023 maturity. Historically, El Salvador has had a very high willingness to pay its debts, but its willingness to pay was put into question when Nayib Bukele was elected president. Bukele has been unpredictable and this, has at times, weighed on the country’s credit risk premium. Financing outlets for El Salvador are limited as the country currently does not have market access. However, the government has been creative in utilizing domestic institutions for financing and the economy continues to perform solidly, which increases the probability of El Salvador repaying the remaining maturities due in 2025 and 2027, respectively. Egyptian debt was a notable exception to the high yield rally in the period and our overweight position detracted from performance. The lack of progress in addressing liquidity issues in the foreign exchange market as well as limited proceeds from sale of public assets weighed on the market performance of Egyptian bonds. Our underweight position in Nigeria significantly detracted from relative performance. There was a widespread rally in high yield sovereign credit but also strong relative performance by Nigerian credit amidst surprising reforms undertaken by the new president. |
| 82 | Semiannual Report | June 30, 2023 |
Emerging Markets Debt Fund
Within the lower-risk country segment, underweight positioning and security selection contributed to performance, especially in Malaysia, China, and Kazakhstan. Conversely, security selection in Chile and overweight positions in Bermuda and Guatemala detracted from relative performance.
In Malaysia, our position in a short-duration, quasi-sovereign bond that was fully repaid by the government helped generate positive performance. The Malaysian Ministry of Finance announced a revised 2023 budget in February that forecasted lower economic growth and continued fiscal consolidation.
Our underweight spread duration position in China sovereigns and our selective exposure to financial and utility corporate bonds contributed positively to our performance. We continue to view valuations in China sovereigns as unattractive.
In Kazakhstan, our use of quasi-sovereign debt contributed to positive security selection impact as it outperformed the sovereign in the period.
In Chile, the use of corporate debt detracted from relative performance as it underperformed the market and subtracted from security selection in the period.
Our overweight in Bermuda underperformed as other lower risk countries outperformed. Although we believe fundamentals within the country remain strong, technical factors led to strong performance from other lower risk credits.
The first round of Guatemala’s elections took place during June. Market participants did not cheer the results as it appears the country may take a slightly more populist bent when a new administration is elected in August. Overall, we remain sanguine on the credit due to the strong initial fundamental conditions.
Within the medium-risk country segment, an overweight position and security selection in the Dominican Republic contributed to relative performance, as did an overweight position in Mongolia and an underweight position in Turkey. Conversely, security selection in Mexico, South Africa, and Colombia detracted from relative performance.
The use of local currency positions within the Dominican Republic contributed to outperformance. The Dominican Republic began its rate cutting cycle ahead of most EM and developed market countries, leading to the outperformance of local currency. Although we think local currency investments will continue to perform well, we think they now look less attractive than before.
In Mongolia, our overweight position in government and development bank debt contributed to relative performance as the country’s debt outperformed the broader market.
Elections in Turkey gave rise to sharp moves in Turkish credit spreads. There was a sharp widening of spreads as the belief in the potential for the opposition to win the elections waned after the first round. This move was almost entirely undone as expectations built that Turkish President Erdogan would allow a return to orthodox policy upon winning the elections. A tactical addition in Turkish credit over this period added to our overall performance. We moved further underweight Turkey just ahead of the first round of the elections, and tactically added following the first round, which provided a positive contribution to performance.
Our overweight of Mexico’s Petroleos Mexicanos (“PEMEX”) bonds subtracted from performance over the period as the spread over the sovereign widened. Although signals from the government to support PEMEX have been mixed, the Mexican government’s announcement that they were going to guarantee debt for the Mexican Airport project implied additional support for PEMEX could be forthcoming. If government support for PEMEX becomes more explicit, we could see assets perform well.
In South Africa, our underweight position in South African credit made a positive contribution to relative performance in the first half of the year. Over this period, South Africa’s debt underperformed as geopolitical tensions spiked and power shortages became more severe.
In Colombia, our use of corporate debt detracted from performance as the energy sector faced political headwinds in the country.
Please refer to the Emerging Markets Debt Review and Outlook relating to the Fund on page 81.
| June 30, 2023 | William Blair Funds | 83 |
Emerging Markets Debt Fund
Performance Highlights (Unaudited)
| | | | | | | | | | | |
| Average Annual Total Return 6/30/2023 |
| | | Year to
Date | | 1 Year | | Since
Inception(a) | |
| Class I | | | 5.14 | % | | | 10.05 | % | | | (6.87 | )% | |
| Class R6 | | | 5.16 | | | | 10.04 | | | | (6.83 | ) | |
| JPMorgan EMBI Global Diversified | | | 4.09 | | | | 7.39 | | | | (7.25 | ) | |
| | |
| (a) | Since inception is for the period from May 25, 2021 (Commencement of Operations) to June 30, 2023. |
Performance cited represents past performance. Past performance does not guarantee future results and current performance may be lower or higher than the data quoted. Results shown are average annual total returns, which assume reinvestment of dividends and capital gains. Investment returns and principal will fluctuate and you may have a gain or loss when you sell shares. For the most current month-end performance information, please call 1-800-742-7272, or visit our Web site at www.williamblairfunds.com. From time to time, the investment adviser may waive fees or reimburse expenses for the Fund. Without these waivers/reimbursements, performance would be lower. Class I shares are not subject to a sales load or distribution (Rule 12b-1) fees. Class R6 shares are not subject to a sales load, distribution (Rule 12b-1) fees, or sub-transfer agent fees.
The performance highlights and graph presented above do not reflect the deduction of taxes that a shareholder would pay on fund distributions or the redemption of fund shares.
The JP Morgan Emerging Markets Bond Index (EMBI) Global Diversified tracks the total return of U.S.-dollar denominated debt instruments issued by sovereign and quasi-sovereign entities.
This report identifies the Fund’s investments on June 30, 2023. These holdings are subject to change. Not all investments in the Fund performed the same, nor is there any guarantee that these investments will perform as well in the future. Market forecasts provided in this report may not necessarily come to pass.
Sector Diversification (Unaudited)

The sector diversification shown is based on the total investments.
| 84 | Semiannual Report | June 30, 2023 |
Emerging Markets Debt Fund
Portfolio of Investments, June 30, 2023 (all dollar amounts in thousands) (unaudited)
| | | | | | | | |
| | Issuer | | Principal
Amount | | | Value | |
| | | | | | | | | | |
| | Foreign Government Bonds—63.8% | | | | | |
| | Angola—2.1% | | | | | | | | |
| | Angolan Government International Bond,
8.000%, due 11/26/29 | | $ | 300 | | | $ | 254 | |
| | Angolan Government International Bond,
9.125%, due 11/26/49 | | | 800 | | | | 615 | |
| | Angolan Government International Bond,
9.375%, due 5/8/48 | | | 200 | | | | 158 | |
| | | | | | | | | 1,027 | |
| | Argentina—2.2% | | | | | | | | |
| | Argentine Government International Bond,
1.500%, due 7/9/46 (a) | | | 500 | | | | 150 | |
| | Argentine Government International Bond,
3.000%, due 1/9/38 (a) | | EUR | 320 | | | | 100 | |
| | Argentine Government International Bond,
3.500%, due 7/9/41 (a) | | $ | 2,565 | | | | 820 | |
| | | | | | | | | 1,070 | |
| | Armenia—0.3% | | | | | | | | |
| | Republic of Armenia International Bond,
3.600%, due 2/2/31 | | | 200 | | | | 156 | |
| | Bahrain—1.3% | | | | | | | | |
| | Bahrain Government International Bond,
5.250%, due 1/25/33 | | | 200 | | | | 174 | |
| | Bahrain Government International Bond,
6.250%, due 1/25/51 | | | 300 | | | | 236 | |
| | Bahrain Government International Bond,
7.000%, due 1/26/26 | | | 200 | | | | 203 | |
| | | | | | | | | 613 | |
| | Benin—0.3% | | | | | | | | |
| | Benin Government International Bond,
6.875%, due 1/19/52 | | EUR | 200 | | | | 154 | |
| | Bermuda—0.7% | | | | | | | | |
| | Bermuda Government International Bond,
3.375%, due 8/20/50 | | $ | 460 | | | | 315 | |
| | Brazil—1.5% | | | | | | | | |
| | Brazilian Government International Bond,
4.750%, due 1/14/50 | | | 480 | | | | 353 | |
| | Brazil Notas do Tesouro Nacional Serie F,
10.000%, due 1/1/25 | | BRL | 560 | | | | 116 | |
| | Brazil Notas do Tesouro Nacional Serie F,
10.000%, due 1/1/29 | | BRL | 670 | | | | 137 | |
| | Brazil Notas do Tesouro Nacional Serie F,
10.000%, due 1/1/33 | | BRL | 610 | | | | 122 | |
| | | | | | | | | 728 | |
| | Cameroon—0.4% | | | | | | | | |
| | Republic of Cameroon Government International Bond,
5.950%, due 7/7/32 (b) | | EUR | 250 | | | | 195 | |
| | Chile—0.5% | | | | | | | | |
| | Chile Government International Bond,
3.250%, due 9/21/71 | | $ | 400 | | | | 258 | |
| | Colombia—2.6% | | | | | | | | |
| | Colombia Government International Bond,
3.250%, due 4/22/32 | | | 1,000 | | | | 738 | |
| | Colombia Government International Bond,
4.125%, due 2/22/42 | | | 330 | | | | 209 | |
| | Colombia Government International Bond,
5.000%, due 6/15/45 | | | 450 | | | | 312 | |
| | | | | | | | | 1,259 | |
| | | | | | | | |
| | Issuer | | Principal
Amount | | | Value | |
| | | | | | | | | | |
| | Foreign Government Bonds—(continued) | | | | | |
| | Costa Rica—0.7% | | | | | | | | |
| | Costa Rica Government International Bond,
4.375%, due 4/30/25 | | $ | 340 | | | $ | 331 | |
| | Dominican Republic—3.2% | | | | | | | | |
| | Dominican Republic International Bond,
4.875%, due 9/23/32 | | | 230 | | | | 196 | |
| | Dominican Republic International Bond,
5.300%, due 1/21/41 | | | 200 | | | | 157 | |
| | Dominican Republic International Bond,
5.875%, due 1/30/60 | | | 910 | | | | 702 | |
| | Dominican Republic Central Bank Note,
13.000%, due 12/5/25 | | DOP | 6,000 | | | | 116 | |
| | Dominican Republic Central Bank Note,
13.000%, due 1/30/26 (b) | | DOP | 20,000 | | | | 387 | |
| | | | | | | | | 1,558 | |
| | Ecuador—1.3% | | | | | | | | |
| | Ecuador Government International Bond,
0.000%, due 7/31/30 | | $ | 700 | | | | 200 | |
| | Ecuador Government International Bond,
1.500%, due 7/31/40 (a) | | | 450 | | | | 139 | |
| | Ecuador Government International Bond,
2.500%, due 7/31/35 (a) | | | 420 | | | | 145 | |
| | Ecuador Government International Bond,
5.500%, due 7/31/30 (a) | | | 260 | | | | 125 | |
| | | | | | | | | 609 | |
| | Egypt—3.0% | | | | | | | | |
| | Egypt Government International Bond,
4.550%, due 11/20/23 | | | 200 | | | | 195 | |
| | Egypt Government International Bond,
4.750%, due 4/16/26 | | EUR | 200 | | | | 153 | |
| | Egypt Government International Bond,
7.300%, due 9/30/33 (b) | | | 250 | | | | 137 | |
| | Egypt Government International Bond,
7.500%, due 2/16/61 | | | 250 | | | | 124 | |
| | Egypt Government International Bond,
8.750%, due 9/30/51 (b) | | | 250 | | | | 134 | |
| | Egypt Government International Bond,
8.750%, due 9/30/51 | | | 250 | | | | 134 | |
| | Egypt Government International Bond,
8.875%, due 5/29/50 | | | 1,025 | | | | 550 | |
| | | | | | | | | 1,427 | |
| | El Salvador—0.8% | | | | | | | | |
| | El Salvador Government International Bond,
6.375%, due 1/18/27 | | | 115 | | | | 79 | |
| | El Salvador Government International Bond,
7.625%, due 2/1/41 | | | 300 | | | | 170 | |
| | El Salvador Government International Bond,
9.500%, due 7/15/52 | | | 225 | | | | 141 | |
| | | | | | | | | 390 | |
| | Gabon—1.1% | | | | | | | | |
| | Gabon Government International Bond,
6.950%, due 6/16/25 | | | 200 | | | | 187 | |
| | Gabon Government International Bond,
7.000%, due 11/24/31 | | | 450 | | | | 357 | |
| | | | | | | | | 544 | |
| | Ghana—1.9% | | | | | | | | |
| | Ghana Government International Bond,
0.000%, due 4/7/25 (c) | | | 350 | | | | 133 | |
See accompanying Notes to Financial Statements.
| June 30, 2023 | William Blair Funds | 85 |
Emerging Markets Debt Fund
Portfolio of Investments, June 30, 2023 (all dollar amounts in thousands) (unaudited)
| | | | | | | | |
| | Issuer | | Principal
Amount | | | Value | |
| | | | | | | | | | |
| | Foreign Government Bonds—(continued) | | | | | |
| | Ghana—(continued) | | | | | | | | |
| | Ghana Government International Bond,
6.375%, due 2/11/27 (c) | | $ | 600 | | | $ | 258 | |
| | Ghana Government International Bond,
7.750%, due 4/7/29 (c) | | | 500 | | | | 211 | |
| | Ghana Government International Bond,
8.625%, due 4/7/34 (c) | | | 400 | | | | 170 | |
| | Ghana Government International Bond,
8.950%, due 3/26/51 (c) | | | 350 | | | | 144 | |
| | | | | | | | | 916 | |
| | Guatemala—1.4% | | | | | | | | |
| | Guatemala Government Bond,
3.700%, due 10/7/33 | | | 660 | | | | 531 | |
| | Guatemala Government Bond,
4.650%, due 10/7/41 | | | 200 | | | | 160 | |
| | | | | | | | | 691 | |
| | Hungary—1.2% | | | | | | | | |
| | Hungary Government International Bond,
3.125%, due 9/21/51 | | | 600 | | | | 373 | |
| | Hungary Government International Bond,
6.750%, due 9/25/52 (b) | | | 200 | | | | 206 | |
| | | | | | | | | 579 | |
| | Indonesia—3.1% | | | | | | | | |
| | Indonesia Government International Bond,
3.400%, due 9/18/29 | | | 550 | | | | 506 | |
| | Indonesia Government International Bond,
5.650%, due 1/11/53 | | | 500 | | | | 523 | |
| | Indonesia Government International Bond,
6.500%, due 6/15/25 | | IDR | 3,500,000 | | | | 236 | |
| | Indonesia Government International Bond,
7.125%, due 6/15/42 | | IDR | 3,500,000 | | | | 244 | |
| | | | | | | | | 1,509 | |
| | Iraq—0.3% | | | | | | | | |
| | Iraq International Bond,
5.800%, due 1/15/28 | | $ | 156 | | | | 143 | |
| | Ivory Coast—1.0% | | | | | | | | |
| | Ivory Coast Government International Bond,
6.625%, due 3/22/48 | | EUR | 600 | | | | 463 | |
| | Jordan—0.9% | | | | | | | | |
| | Jordan Government International Bond,
5.850%, due 7/7/30 | | $ | 200 | | | | 182 | |
| | Jordan Government International Bond,
7.375%, due 10/10/47 | | | 300 | | | | 258 | |
| | | | | | | | | 440 | |
| | Kenya—1.9% | | | | | | | | |
| | Kenya Government International Bond,
6.875%, due 6/24/24 | | | 500 | | | | 474 | |
| | Kenya Government International Bond,
8.250%, due 2/28/48 | | | 600 | | | | 457 | |
| | | | | | | | | 931 | |
| | Lebanon—0.4% | | | | | | | | |
| | Lebanon Government International Bond,
5.800%, due 4/14/20 (c) | | | 1,400 | | | | 89 | |
| | Lebanon Government International Bond,
6.850%, due 3/23/27 (c) | | | 600 | | | | 38 | |
| | Lebanon Government International Bond,
7.150%, due 11/20/31 (c) | | | 1,200 | | | | 75 | |
| | | | | | | | | 202 | |
| | | | | | | | |
| | Issuer | | Principal
Amount | | | Value | |
| | | | | | | | | | |
| | Foreign Government Bonds—(continued) | | | | | |
| | Mexico—1.2% | | | | | | | | |
| | Mexico Government International Bond,
3.750%, due 4/19/71 | | $ | 200 | | | $ | 134 | |
| | Mexico Government International Bond,
5.750%, due 10/12/10 | | | 250 | | | | 223 | |
| | Mexican Bonos,
8.500%, due 11/18/38 | | MXN | 3,600 | | | | 205 | |
| | | | | | | | | 562 | |
| | Mongolia—0.8% | | | | | | | | |
| | Mongolia Government International Bond,
4.450%, due 7/7/31 | | $ | 200 | | | | 155 | |
| | Mongolia Government International Bond,
8.650%, due 1/19/28 (b) | | | 200 | | | | 202 | |
| | | | | | | | | 357 | |
| | Morocco—0.3% | | | | | | | | |
| | Morocco Government International Bond,
4.000%, due 12/15/50 | | | 200 | | | | 134 | |
| | Mozambique—0.6% | | | | | | | | |
| | Mozambique International Bond,
5.000%, due 9/15/31 (a) | | | 400 | | | | 302 | |
| | Nigeria—0.5% | | | | | | | | |
| | Nigeria Government International Bond,
6.500%, due 11/28/27 | | | 200 | | | | 174 | |
| | Nigeria Government International Bond,
8.250%, due 9/28/51 | | | 75 | | | | 56 | |
| | | | | | | | | 230 | |
| | Oman—0.8% | | | | | | | | |
| | Oman Government International Bond,
6.750%, due 1/17/48 | | | 400 | | | | 383 | |
| | Pakistan—1.3% | | | | | | | | |
| | Pakistan Government International Bond,
6.875%, due 12/5/27 | | | 400 | | | | 189 | |
| | Pakistan Government International Bond,
8.875%, due 4/8/51 | | | 950 | | | | 418 | |
| | | | | | | | | 607 | |
| | Panama—1.6% | | | | | | | | |
| | Panama Government International Bond,
3.870%, due 7/23/60 | | | 510 | | | | 336 | |
| | Panama Government International Bond,
4.500%, due 4/1/56 | | | 200 | | | | 149 | |
| | Panama Government International Bond,
4.500%, due 1/19/63 | | | 400 | | | | 292 | |
| | | | | | | | | 777 | |
| | Paraguay—1.2% | | | | | | | | |
| | Paraguay Government International Bond,
2.739%, due 1/29/33 | | | 480 | | | | 385 | |
| | Paraguay Government International Bond,
5.400%, due 3/30/50 | | | 200 | | | | 171 | |
| | | | | | | | | 556 | |
| | Peru—1.5% | | | | | | | | |
| | Peruvian Government International Bond,
2.783%, due 1/23/31 | | | 200 | | | | 171 | |
| | Peruvian Government International Bond,
3.230%, due 7/28/21 | | | 230 | | | | 138 | |
| | Peruvian Government International Bond,
3.600%, due 1/15/72 | | | 300 | | | | 202 | |
See accompanying Notes to Financial Statements.
| 86 | Semiannual Report | June 30, 2023 |
Emerging Markets Debt Fund
Portfolio of Investments, June 30, 2023 (all dollar amounts in thousands) (unaudited)
| | | | | | | | |
| | Issuer | | Principal
Amount | | | Value | |
| | | | | | | | | | |
| | Foreign Government Bonds—(continued) | | | | | |
| | Peru—(continued) | | | | | | | | |
| | Peru Government Bond,
7.300%, due 8/12/33 | | PEN | 750 | | | $ | 213 | |
| | | | | | | | | 724 | |
| | Philippines—2.2% | | | | | | | | |
| | Philippine Government International Bond,
3.700%, due 2/2/42 | | $ | 500 | | | | 409 | |
| | Philippines Government International Bond,
5.609%, due 4/13/33 | | | 600 | | | | 632 | |
| | | | | | | | | 1,041 | |
| | Poland—0.4% | | | | | | | | |
| | Poland Government International Bond,
5.500%, due 4/4/53 | | | 200 | | | | 201 | |
| | Qatar—2.3% | | | | | | | | |
| | Qatar Government International Bond,
4.400%, due 4/16/50 | | | 1,000 | | | | 908 | |
| | Qatar Government International Bond,
5.103%, due 4/23/48 | | | 200 | | | | 199 | |
| | | | | | | | | 1,107 | |
| | Romania—1.5% | | | | | | | | |
| | Romanian Government International Bond,
2.875%, due 4/13/42 | | EUR | 100 | | | | 67 | |
| | Romanian Government International Bond,
3.375%, due 1/28/50 | | EUR | 630 | | | | 429 | |
| | Romania Government International Bond,
7.625%, due 1/17/53 (b) | | $ | 200 | | | | 221 | |
| | | | | | | | | 717 | |
| | Saudi Arabia—2.8% | | | | | | | | |
| | Saudi Government International Bond,
2.250%, due 2/2/33 | | | 400 | | | | 322 | |
| | Saudi Government International Bond,
3.250%, due 11/17/51 | | | 200 | | | | 140 | |
| | Saudi Government International Bond,
3.450%, due 2/2/61 | | | 800 | | | | 561 | |
| | Saudi Government International Bond,
3.750%, due 1/21/55 | | | 200 | | | | 151 | |
| | Saudi Government International Bond,
5.000%, due 1/18/53 (b) | | | 200 | | | | 185 | |
| | | | | | | | | 1,359 | |
| | Senegal—0.3% | | | | | | | | |
| | Senegal Government International Bond,
5.375%, due 6/8/37 | | EUR | 200 | | | | 146 | |
| | Serbia—0.3% | | | | | | | | |
| | Serbia International Bond,
2.050%, due 9/23/36 | | EUR | 200 | | | | 133 | |
| | South Africa—1.9% | | | | | | | | |
| | South Africa Government International Bond,
5.750%, due 9/30/49 | | $ | 1,000 | | | | 707 | |
| | South Africa Government International Bond,
8.750%, due 2/28/48 | | ZAR | 5,400 | | | | 208 | |
| | | | | | | | | 915 | |
| | Sri Lanka—1.5% | | | | | | | | |
| | Sri Lanka Government International Bond,
5.750%, due 4/18/23 (a)(c) | | $ | 400 | | | | 176 | |
| | Sri Lanka Government International Bond,
6.850%, due 11/3/25 (a)(c) | | | 400 | | | | 185 | |
| | | | | | | | |
| | Issuer | | Principal
Amount | | | Value | |
| | | | | | | | | | |
| | Foreign Government Bonds—(continued) | | | | | |
| | Sri Lanka—(continued) | | | | | | | | |
| | Sri Lanka Government International Bond,
7.850%, due 3/14/29 (a)(c) | | $ | 800 | | | $ | 350 | |
| | | | | | | | | 711 | |
| | Tunisia—1.0% | | | | | | | | |
| | Tunisian Republic,
5.750%, due 1/30/25 | | | 450 | | | | 298 | |
| | Tunisian Republic,
6.375%, due 7/15/26 | | EUR | 100 | | | | 63 | |
| | Tunisian Republic,
6.750%, due 10/31/23 | | EUR | 100 | | | | 101 | |
| | | | | | | | | 462 | |
| | Turkey—2.5% | | | | | | | | |
| | Turkey Government International Bond,
4.875%, due 10/9/26 | | $ | 200 | | | | 178 | |
| | Turkey Government International Bond,
4.875%, due 4/16/43 | | | 700 | | | | 448 | |
| | Turkey Government International Bond,
6.000%, due 3/25/27 | | | 200 | | | | 182 | |
| | Turkey Government International Bond,
9.375%, due 3/14/29 | | | 200 | | | | 200 | |
| | Turkey Government International Bond,
9.375%, due 1/19/33 | | | 200 | | | | 200 | |
| | | | | | | | | 1,208 | |
| | Ukraine—0.7% | | | | | | | | |
| | Ukraine Government International Bond,
6.876%, due 5/21/31 (a)(c) | | | 200 | | | | 45 | |
| | Ukraine Government International Bond,
7.253%, due 3/15/35 (a)(c) | | | 1,100 | | | | 252 | |
| | Ukraine Government International Bond,
7.750%, due 8/1/41 (a)(c) | | | 140 | | | | 56 | |
| | | | | | | | | 353 | |
| | United Arab Emirates—0.6% | | | | | | | | |
| | Abu Dhabi Government International Bond,
2.700%, due 9/2/70 | | | 450 | | | | 273 | |
| | Uruguay—0.8% | | | | | | | | |
| | Uruguay Government International Bond,
8.250%, due 5/21/31 | | UYU | 8,000 | | | | 196 | |
| | Uruguay Government International Bond,
3.875%, due 7/2/40 | | UYU | 6,189 | | | | 174 | |
| | | | | | | | | 370 | |
| | Vietnam—0.4% | | | | | | | | |
| | Vietnam Government International Bond,
4.800%, due 11/19/24 | | | 200 | | | | 196 | |
| | Zambia—0.7% | | | | | | | | |
| | Zambia Government International Bond,
8.500%, due 4/14/24 (a) | | | 200 | | | | 116 | |
| | Zambia Government International Bond,
8.970%, due 7/30/27 (a) | | | 400 | | | | 229 | |
| | | | | | | | | 345 | |
| | Total Foreign Government Bonds—63.8%
(cost $32,848) | | | | | 30,677 | |
See accompanying Notes to Financial Statements.
| June 30, 2023 | William Blair Funds | 87 |
Emerging Markets Debt Fund
Portfolio of Investments, June 30, 2023 (all dollar amounts in thousands) (unaudited)
| | | | | | | | |
| | Issuer | | Principal
Amount | | | Value | |
| | | | | | | | | | |
| | Foreign Corporate Bonds—29.3% | | | | | |
| | Brazil—2.2% | | | | | | | | |
| | Cosan Luxembourg SA,
7.500%, due 6/27/30 (b) | | $ | 200 | | | $ | 198 | |
| | Embraer Netherlands Finance BV,
5.050%, due 6/15/25 | | | 200 | | | | 197 | |
| | ERO Copper Corp.,
6.500%, due 2/15/30 | | | 200 | | | | 172 | |
| | Hidrovias International Finance Sarl,
4.950%, due 2/8/31 | | | 200 | | | | 159 | |
| | Minerva Luxembourg SA,
4.375%, due 3/18/31 | | | 200 | | | | 155 | |
| | Petrorio Luxembourg Trading Sarl,
6.125%, due 6/9/26 | | | 200 | | | | 190 | |
| | | | | | | | | 1,071 | |
| | Chile—2.0% | | | | | | | | |
| | Antofagasta PLC,
2.375%, due 10/14/30 | | | 200 | | | | 162 | |
| | CAP SA,
3.900%, due 4/27/31 | | | 250 | | | | 180 | |
| | Empresa Nacional del Petroleo,
5.250%, due 11/6/29 | | | 450 | | | | 434 | |
| | Inversiones CMPC SA,
3.000%, due 4/6/31 | | | 200 | | | | 164 | |
| | | | | | | | | 940 | |
| | China—3.3% | | | | | | | | |
| | Airport Authority,
4.875%, due 1/12/33 (b) | | | 200 | | | | 204 | |
| | Bank of East Asia Ltd.,
5 year CMT + 5.527%, 5.825%, due 10/21/25 (d)(e) | | | 250 | | | | 218 | |
| | China Evergrande Group,
9.500%, due 3/29/24 (a)(c) | | | 300 | | | | 17 | |
| | China Hongqiao Group Ltd.,
6.250%, due 6/8/24 | | | 200 | | | | 195 | |
| | China Oil & Gas Group Ltd.,
4.700%, due 6/30/26 | | | 200 | | | | 167 | |
| | ENN Clean Energy International Investment Ltd.,
3.375%, due 5/12/26 | | | 200 | | | | 184 | |
| | Lenovo Group Ltd.,
5.875%, due 4/24/25 | | | 200 | | | | 199 | |
| | Sinochem Offshore Capital Co. Ltd.,
2.375%, due 9/23/31 | | | 500 | | | | 399 | |
| | Yuzhou Group Holdings Co. Ltd.,
7.850%, due 8/12/26 (c) | | | 200 | | | | 11 | |
| | | | | | | | | 1,594 | |
| | Colombia—0.7% | | | | | | | | |
| | Canacol Energy Ltd.,
5.750%, due 11/24/28 (b) | | | 200 | | | | 170 | |
| | SierraCol Energy Andina LLC,
6.000%, due 6/15/28 | | | 200 | | | | 145 | |
| | | | | | | | | 315 | |
| | Costa Rica—0.4% | | | | | | | | |
| | Instituto Costarricense de Electricidad,
6.375%, due 5/15/43 | | | 250 | | | | 210 | |
| | | | | | | | |
| | Issuer | | Principal
Amount | | | Value | |
| | | | | | | | | | |
| | Foreign Corporate Bonds—(continued) | | | | | |
| | Dominican Republic—0.9% | | | | | | | | |
| | Aeropuertos Dominicanos Siglo XXI SA,
6.750%, due 3/30/29 | | $ | 200 | | | $ | 192 | |
| | Empresa Generadora de Electricidad Haina SA,
5.625%, due 11/8/28 (b) | | | 250 | | | | 223 | |
| | | | | | | | | 415 | |
| | Georgia—0.4% | | | | | | | | |
| | Energo-Pro AS,
8.500%, due 2/4/27 | | | 200 | | | | 189 | |
| | Guatemala—1.1% | | | | | | | | |
| | Banco Industrial SA,
5 year CMT + 4.442%, 4.875%, due 1/29/31 (d)(e) | | | 200 | | | | 184 | |
| | Energuate Trust,
5.875%, due 5/3/27 | | | 200 | | | | 185 | |
| | Investment Energy Resources Ltd.,
6.250%, due 4/26/29 (b) | | | 200 | | | | 186 | |
| | | | | | | | | 555 | |
| | Hungary—0.4% | | | | | | | | |
| | OTP Bank Nyrt,
5 year CMT + 5.060%, 8.750%, due 5/15/33 (d)(e) | | | 200 | | | | 200 | |
| | India—1.5% | | | | | | | | |
| | Adani Ports & Special Economic Zone Ltd.,
3.828%, due 2/2/32 | | | 200 | | | | 150 | |
| | Continuum Energy Levanter Pte. Ltd.,
4.500%, due 2/9/27 | | | 186 | | | | 172 | |
| | European Bank for Reconstruction & Development,
5.150%, due 2/16/24 | | INR | 20,000 | | | | 238 | |
| | Export-Import Bank of India,
2.250%, due 1/13/31 | | $ | 200 | | | | 162 | |
| | | | | | | | | 722 | |
| | Indonesia—3.1% | | | | | | | | |
| | Bank Mandiri Persero Tbk PT,
2.000%, due 4/19/26 | | | 200 | | | | 180 | |
| | Medco Laurel Tree Pte. Ltd.,
6.950%, due 11/12/28 | | | 200 | | | | 183 | |
| | Nickel Industries Ltd.,
11.250%, due 10/21/28 (b) | | | 200 | | | | 207 | |
| | Pertamina Persero PT,
2.300%, due 2/9/31 | | | 200 | | | | 163 | |
| | Pertamina Persero PT,
3.100%, due 8/27/30 | | | 400 | | | | 349 | |
| | Pertamina Persero PT,
6.000%, due 5/3/42 | | | 200 | | | | 201 | |
| | Perusahaan Penerbit SBSN Indonesia III,
4.700%, due 6/6/32 (b) | | | 200 | | | | 199 | |
| | | | | | | | | 1,482 | |
| | Kazakhstan—1.3% | | | | | | | | |
| | KazMunayGas National Co. JSC,
3.500%, due 4/14/33 | | | 800 | | | | 618 | |
| | Kuwait—0.4% | | | | | | | | |
| | NBK Tier 1 Ltd.,
6 year CMT + 2.875%, 3.625%, due 8/24/26 (d)(e) | | | 200 | | | | 173 | |
See accompanying Notes to Financial Statements.
| 88 | Semiannual Report | June 30, 2023 |
Emerging Markets Debt Fund
Portfolio of Investments, June 30, 2023 (all dollar amounts in thousands) (unaudited)
| | | | | | | | |
| | Issuer | | Principal
Amount | | | Value | |
| | | | | | | | | | |
| | Foreign Corporate Bonds—(continued) | | | | | |
| | Malaysia—1.4% | | | | | | | | |
| | Dua Capital Ltd.,
2.780%, due 5/11/31 | | $ | 550 | | | $ | 473 | |
| | Petronas Capital Ltd.,
4.550%, due 4/21/50 | | | 200 | | | | 185 | |
| | | | | | | | | 658 | |
| | Mexico—4.9% | | | | | | | | |
| | Banco Mercantil del Norte SA,
5 year CMT + 4.643%, 5.875%, due 1/24/27 (d)(e) | | | 200 | | | | 169 | |
| | Banco Nacional de Comercio Exterior SNC,
5 year CMT + 2.000%, 2.720%, due 8/11/31 (d)(e) | | | 220 | | | | 182 | |
| | Banco Santander Mexico SA Institucion de Banca Multiple Grupo Financiero Santand,
5.375%, due 4/17/25 | | | 200 | | | | 197 | |
| | Credito Real SAB de CV SOFOM ER,
5.000%, due 2/1/27 (c) | | EUR | 200 | | | | 25 | |
| | Petroleos Mexicanos,
5.950%, due 1/28/31 | | $ | 850 | | | | 619 | |
| | Petroleos Mexicanos,
7.690%, due 1/23/50 | | | 250 | | | | 169 | |
| | Petroleos Mexicanos,
6.750%, due 9/21/47 | | | 808 | | | | 505 | |
| | Petroleos Mexicanos,
6.700%, due 2/16/32 | | | 430 | | | | 326 | |
| | Petroleos Mexicanos,
6.490%, due 1/23/27 | | | 200 | | | | 178 | |
| | | | | | | | | 2,370 | |
| | Mongolia—0.4% | | | | | | | | |
| | Development Bank of Mongolia LLC,
7.250%, due 10/23/23 | | | 200 | | | | 199 | |
| | Nigeria—0.3% | | | | | | | | |
| | Access Bank PLC,
6.125%, due 9/21/26 | | | 200 | | | | 168 | |
| | Panama—0.3% | | | | | | | | |
| | Telecomunicaciones Digitales SA,
4.500%, due 1/30/30 | | | 200 | | | | 170 | |
| | Peru—1.1% | | | | | | | | |
| | Corp. Financiera de Desarrollo SA,
2.400%, due 9/28/27 | | | 420 | | | | 367 | |
| | InRetail Consumer,
3.250%, due 3/22/28 | | | 200 | | | | 171 | |
| | | | | | | | | 538 | |
| | Saudi Arabia—0.4% | | | | | | | | |
| | Gaci First Investment Co.,
5.125%, due 2/14/53 | | | 200 | | | | 179 | |
| | South Africa—0.4% | | | | | | | | |
| | Stillwater Mining Co.,
4.000%, due 11/16/26 | | | 200 | | | | 177 | |
| | Thailand—0.3% | | | | | | | | |
| | Bangkok Bank PCL,
5 year CMT + 2.150%, 3.466%, due 9/23/36 (d)(e) | | | 200 | | | | 163 | |
| | Trinidad And Tobago—0.9% | | | | | | | | |
| | Heritage Petroleum Co. Ltd.,
9.000%, due 8/12/29 (b) | | | 200 | | | | 207 | |
| | | | | | | | |
| | Issuer | | Principal
Amount | | | Value | |
| | | | | | | | | | |
| | Foreign Corporate Bonds—(continued) | | | | | |
| | Trinidad And Tobago—(continued) | | | | | | | | |
| | Heritage Petroleum Co. Ltd.,
9.000%, due 8/12/29 | | $ | 200 | | | $ | 207 | |
| | | | | | | | | 414 | |
| | Turkey—0.4% | | | | | | | | |
| | Turkiye Ihracat Kredi Bankasi AS,
9.375%, due 1/31/26 (b) | | | 200 | | | | 199 | |
| | United Arab Emirates—0.4% | | | | | | | | |
| | MAF Global Securities Ltd.,
5 year CMT + 3.539%, 6.375%, due 3/20/26 (d)(e) | | | 200 | | | | 194 | |
| | Uzbekistan—0.4% | | | | | | | | |
| | Ipoteka-Bank ATIB,
5.500%, due 11/19/25 | | | 200 | | | | 184 | |
| | Total Foreign Corporate Bonds—29.3%
(cost $15,183) | | | | | | | 14,097 | |
| | | | | | | | | | |
| | Foreign Municipal Bonds—1.0% | | | | | | | | |
| | Argentina—1.0% | | | | | | | | |
| | Provincia de Buenos Aires,
5.250%, due 9/1/37 (a)(b) | | | 50 | | | | 19 | |
| | Provincia de Buenos Aires,
4.500%, due 9/1/37 (a)(b) | | | 200 | | | | 54 | |
| | Provincia de Buenos Aires,
5.250%, due 9/1/37 (a) | | | 260 | | | | 99 | |
| | Provincia de Cordoba,
6.875%, due 12/10/25 (a) | | | 167 | | | | 125 | |
| | Provincia del Chubut Argentina,
7.750%, due 7/26/30 (a) | | | 204 | | | | 170 | |
| | | | | | | | | 467 | |
| | Total Foreign Municipal Bonds—1.0%
(cost $533) | | | | | | | 467 | |
| | | | | | | | | | |
| | Repurchase Agreement | | | | | | | | |
| | Fixed Income Clearing Corporation, 2.100% dated 06/30/23, due 07/03/23, repurchase price $148, collateralized by U.S. Treasury Note, 1.375%, due 11/15/31, valued at $151 | | | 148 | | | | 148 | |
| | Total Repurchase Agreement—0.3%
(cost $148) | | | | | | | 148 | |
| | | | | | | | | | |
| | U.S. Government—4.4% | | | | | | | | |
| | U.S. Treasury Bill, 4.510%, due 7/25/23 | | | 480 | | | | 478 | |
| | U.S. Treasury Bill, 4.966%, due 8/8/23 | | | 480 | | | | 478 | |
| | U.S. Treasury Bill, 5.024%, due 8/22/23 | | | 475 | | | | 472 | |
| | U.S. Treasury Bill, 4.970%, due 9/14/23 (f) | | | 475 | | | | 470 | |
| | U.S. Treasury Bill, 5.161%, due 10/12/23 (f) | | | 240 | | | | 236 | |
| | Total U.S. Government—4.4%
(cost $2,134) | | | | | | | 2,134 | |
| | Total Investments in Securities—98.8%
(cost $50,846) | | | | | | | 47,523 | |
| | Total Investments—98.8%
(cost $50,846) | | | | | | | 47,523 | |
| | Cash and other assets, less liabilities—1.2% | | | | | | | 599 | |
| | Net assets—100.0% | | | | | | $ | 48,122 | |
See accompanying Notes to Financial Statements.
| June 30, 2023 | William Blair Funds | 89 |
Emerging Markets Debt Fund
Portfolio of Investments, June 30, 2023 (all dollar amounts in thousands) (unaudited)
(a) Variable/Floating interest rate security. Certain variable/floating interest rate securities are not based on a published reference rate and spread but are determined by the issuer or agent and are based on current market conditions. These securities do not indicate a reference rate and spread in their description above. Rate presented is as of June 30, 2023.
(b) Security exempt from registration under Rule 144A of the Securities Act of 1933. These securities may be resold in transactions exempt from registration, normally to qualified institutional buyers.
(c) Security is currently in default and/or non-income producing.
(d) Security is perpetual in nature and has no stated maturity.
(e) Floating Rate Bond. Rate shown is as of June 30, 2023.
(f) Security, or portion of security, is segregated as collateral to cover initial margin requirements on centrally cleared swaps aggregating a total value of $597 (in thousands).
CMT = Constant Maturity Treasury
EURIBOR = Euro Interbank Offered Rate
SOFR = Secured Overnight Financing Rate
At June 30, 2023, the Fund’s Portfolio of Investments includes the following currency categories (as a percentage of long-term investments):
| U.S. Dollar | | | 89.8 | % |
| Euro | | | 4.5 | % |
| Dominican Peso | | | 1.1 | % |
| Indonesian Rupiah | | | 1.0 | % |
| All Other Currencies | | | 3.6 | % |
| Total | | | 100.0 | % |
At June 30, 2023, the Fund’s Portfolio of Investments includes the following industry categories (as a percentage of long-term investments):
| Sovereign | | | 68.8 | % |
| Corporate | | | | |
| Financials | | | 4.6 | % |
| Materials | | | 2.8 | % |
| Utilities | | | 2.5 | % |
| Energy | | | 2.3 | % |
| Industrials | | | 1.5 | % |
| Consumer Staples | | | 0.7 | % |
| Information Technology | | | 0.4 | % |
| Communication Services | | | 0.4 | % |
| Quasi-Sovereign | | | 14.5 | % |
| Sub Sovereign | | | 1.0 | % |
| Supranational | | | 0.5 | % |
| Total | | | 100.0 | % |
Forward Foreign Currency Contracts
Settlement
Date | | Deliver/Receive | | Counterparty | | Local Currency
(in thousands) | | | USD (Base)
Purchased
or Sold | | | Current
Value | | | Net
Unrealized
Appreciation
(Depreciation) | |
| Sold | | | | | | | | | | | | | | | | | |
| 9/20/23 | | British Pound Sterling | | Citibank N.A. | | | 3 | | | $ | 3 | | | $ | 3 | | | | $ | — | |
| 9/20/23 | | Euro | | Citibank N.A. | | | 1,925 | | | | 2,096 | | | | 2,109 | | | | | (13 | ) |
| Total net unrealized appreciation (depreciation) on forward foreign currency contracts | | | | | | | | $ | (13 | ) |
Centrally Cleared Interest Rate Swaps
Floating Rate
Reference | | Pay/Receive
Floating Rate | | Fixed
Rate | | Payment
Frequency | | Maturity
Date | | Cleared
Exchange | | Notional
Amount
(in thousands) | | Upfront
Payment
Paid
(Received) | | Value | | | Unrealized
Appreciation
(Depreciation) | |
| 1-Day USD SOFR | | Receive | | 3.000% | | 1Y | | June 2062 | | LCH | | $ | 236 | | | $ | (13 | ) | | $ | — | | | | $ | 13 | |
| EUR 6M EURIBOR | | Receive | | 3.250% | | 1Y | | September 2032 | | LCH | | EUR | 128 | | | | — | | | | (5 | ) | | | | (5 | ) |
| EUR 6M EURIBOR | | Receive | | 3.000% | | 1Y | | September 2027 | | LCH | | EUR | 220 | | | | (14 | ) | | | — | | | | | 14 | |
| EUR 6M EURIBOR | | Receive | | 3.000% | | 1Y | | September 2029 | | LCH | | EUR | 402 | | | | 2 | | | | (3 | ) | | | | (5 | ) |
| EUR 6M EURIBOR | | Receive | | 3.250% | | 1Y | | September 2037 | | LCH | | EUR | 766 | | | | (3 | ) | | | (42 | ) | | | | (39 | ) |
| EUR 6M EURIBOR | | Receive | | 2.750% | | 1Y | | September 2047 | | LCH | | EUR | 318 | | | | 4 | | | | (8 | ) | | | | (12 | ) |
| 1-Day USD SOFR | | Receive | | 3.000% | | 1Y | | December 2047 | | LCH | | $ | 1,341 | | | | 28 | | | | 83 | | | | | 55 | |
| 1-Day USD SOFR | | Pay | | 3.250% | | 1Y | | December 2042 | | LCH | | | 1,930 | | | | 18 | | | | (66 | ) | | | | (84 | ) |
| 1-Day USD SOFR | | Pay | | 3.250% | | 1Y | | December 2027 | | LCH | | | 3,894 | | | | (39 | ) | | | (148 | ) | | | | (109 | ) |
| 1-Day USD SOFR | | Pay | | 3.250% | | 1Y | | December 2029 | | LCH | | | 811 | | | | (5 | ) | | | (29 | ) | | | | (24 | ) |
| 1-Day USD SOFR | | Pay | | 3.250% | | 1Y | | December 2032 | | LCH | | | 637 | | | | (14 | ) | | | (21 | ) | | | | (7 | ) |
| 1-Day USD SOFR | | Pay | | 3.750% | | 1Y | | December 2025 | | LCH | | | 1,047 | | | | 2 | | | | (26 | ) | | | | (28 | ) |
| | | | | | | | | | | | | | | | | | | | | | | | | | $ | (231 | ) |
See accompanying Notes to Financial Statements.
| 90 | Semiannual Report | June 30, 2023 |
Emerging Markets Debt Fund
Portfolio of Investments, June 30, 2023 (all dollar amounts in thousands) (unaudited)
Centrally Cleared Credit Default Swaps
Reference
Entity | | Buy/Sell
Protection | | Fixed Rate | | Payment
Frequency | | Maturity
Date | | Cleared
Exchange | | Notional
Amount
(in thousands) | | Upfront
Payment
Paid
(Received) | | Value | | | Unrealized
Appreciation
(Depreciation) | |
| Kingdom of Saudi Arabia | | Buy | | 1.000% | | 3M | | June 2026 | | ICE | | $ | 400 | | | $ | (8 | ) | | $ | (7 | ) | | | $ | 1 | |
| Argentine Republic | | Buy | | 5.000% | | 3M | | December 2023 | | ICE | | | 200 | | | | 32 | | | | 17 | | | | | (15 | ) |
| Argentine Republic | | Buy | | 1.000% | | 3M | | December 2025 | | ICE | | | 500 | | | | 304 | | | | 298 | | | | | (6 | ) |
| Argentine Republic | | Buy | | 1.000% | | 3M | | June 2027 | | ICE | | | 250 | | | | 205 | | | | 175 | | | | | (30 | ) |
| CDX.EM.38-V1 - 5 Year Index | | Buy | | 1.000% | | 3M | | December 2027 | | ICE | | | 2,900 | | | | 193 | | | | 120 | | | | | (73 | ) |
| Argentine Republic | | Buy | | 5.000% | | 3M | | June 2033 | | ICE | | | 250 | | | | 186 | | | | 166 | | | | | (20 | ) |
| Republic of Colombia | | Buy | | 1.000% | | 3M | | June 2028 | | ICE | | | 280 | | | | 22 | | | | 16 | | | | | (6 | ) |
| Republic of South Africa | | Buy | | 1.000% | | 3M | | June 2028 | | ICE | | | 450 | | | | 30 | | | | 31 | | | | | 1 | |
| Argentine Republic | | Sell | | 5.000% | | 3M | | December 2031 | | ICE | | | 500 | | | | (293 | ) | | | (330 | ) | | | | (37 | ) |
| Argentine Republic | | Sell | | 5.000% | | 3M | | June 2032 | | ICE | | | 100 | | | | (63 | ) | | | (66 | ) | | | | (3 | ) |
| Argentine Republic | | Sell | | 5.000% | | 3M | | June 2027 | | ICE | | | 250 | | | | (190 | ) | | | (157 | ) | | | | 33 | |
| Republic of Colombia | | Sell | | 1.000% | | 3M | | June 2033 | | ICE | | | 200 | | | | (39 | ) | | | (33 | ) | | | | 6 | |
| | | | | | | | | | | | | | | | | | | | | | | | | | $ | (149 | ) |
| Total net unrealized appreciation (depreciation) on swaps | | | | | | | | | | | | | | | $ | (380 | ) |
Currency Legend
BRL Brazilian Real
DOP Dominican Peso
EUR Euro
GBP British Pound Sterling
IDR Indonesian Rupiah
INR Indian Rupee
MXN Mexican Peso
PEN Peruvian Nouveau Sol
USD U.S. Dollar
UYU Uruguayan Peso
ZAR South African Rand
See accompanying Notes to Financial Statements.
| June 30, 2023 | William Blair Funds | 91 |
Statements of Assets and Liabilities
As of June 30, 2023 (dollar amounts in thousands) (unaudited)
| | | Growth
Fund | | | Large Cap
Growth
Fund | | | Mid Cap
Value
Fund | | | Small-Mid
Cap Core
Fund | |
| Assets | | | | | | | | | | | | | | | | |
| Investments in securities, at cost | | $ | 127,338 | | | $ | 1,221,604 | | | $ | 1,533 | | | $ | 149,426 | |
| Investments in securities, at value | | $ | 231,517 | | | $ | 1,539,496 | | | $ | 1,538 | | | $ | 157,922 | |
| Cash | | | — | | | | — | | | | 81 | | | | — | |
| Receivable for securities sold | | | — | | | | — | | | | — | | | | 23 | |
| Receivable for fund shares sold | | | 60 | | | | 1,273 | | | | — | | | | 157 | |
| Receivable from Adviser | | | 1 | | | | 114 | | | | 11 | | | | 49 | |
| Dividend and interest receivable | | | 67 | | | | 185 | | | | 2 | | | | 68 | |
| Total assets | | | 231,645 | | | | 1,541,068 | | | | 1,632 | | | | 158,219 | |
| Liabilities | | | | | | | | | | | | | | | | |
| Payable for securities purchased | | | — | | | | 2,052 | | | | — | | | | 617 | |
| Payable for fund shares redeemed | | | 28 | | | | 555 | | | | — | | | | 190 | |
| Management fee payable | | | 140 | | | | 742 | | | | 1 | | | | 114 | |
| Distribution fee payable | | | 6 | | | | 30 | | | | — | | | | — | |
| Other payables and accrued expenses | | | 57 | | | | 209 | | | | 15 | | | | 105 | |
| Total liabilities | | | 231 | | | | 3,588 | | | | 16 | | | | 1,026 | |
| Net assets | | $ | 231,414 | | | $ | 1,537,480 | | | $ | 1,616 | | | $ | 157,193 | |
| Capital | | | | | | | | | | | | | | | | |
| Composition of net assets | | | | | | | | | | | | | | | | |
| Paid in capital | | $ | 116,286 | | | $ | 1,304,618 | | | $ | 1,664 | | | $ | 162,505 | |
| Total distributable earnings (loss) | | | 115,128 | | | | 232,862 | | | | (48 | ) | | | (5,312 | ) |
| Net assets | | $ | 231,414 | | | $ | 1,537,480 | | | $ | 1,616 | | | $ | 157,193 | |
| | | | | | | | | | | | | | | | | |
| Class N shares | | | | | | | | | | | | | | | | |
| Net assets | | $ | 30,139 | | | $ | 148,508 | | | | — | | | | — | |
| Shares outstanding | | | 3,012,444 | | | | 7,253,245 | | | | — | | | | — | |
| Net asset value per share | | $ | 10.00 | | | $ | 20.47 | | | | — | | | | — | |
| Class I shares | | | | | | | | | | | | | | | | |
| Net assets | | $ | 165,355 | | | $ | 1,048,642 | | | $ | 79 | | | $ | 97,470 | |
| Shares outstanding | | | 12,922,904 | | | | 47,761,642 | | | | 8,194 | | | | 6,671,585 | |
| Net asset value per share | | $ | 12.80 | | | $ | 21.96 | | | $ | 9.73 | | | $ | 14.61 | |
| Class R6 shares | | | | | | | | | | | | | | | | |
| Net assets | | $ | 35,920 | | | $ | 340,330 | | | $ | 1,537 | | | $ | 59,723 | |
| Shares outstanding | | | 2,795,741 | | | | 15,509,189 | | | | 157,941 | | | | 4,082,357 | |
| Net asset value per share | | $ | 12.85 | | | $ | 21.94 | | | $ | 9.73 | | | $ | 14.63 | |
See accompanying Notes to Financial Statements.
| 92 | Semiannual Report | June 30, 2023 |
Statements of Operations
For the Period Ended June 30, 2023 (all amounts in thousands) (unaudited)
| | | Growth
Fund | | | Large Cap
Growth
Fund | | | Mid Cap
Value
Fund | | | Small-Mid
Cap Core
Fund | |
| Investment income | | | | | | | | | | | | | | | | |
| Dividends | | $ | 911 | | | $ | 5,296 | | | $ | 17 | | | $ | 942 | |
| Less foreign tax withheld | | | (6 | ) | | | — | | | | — | | | | (12 | ) |
| Interest | | | 27 | | | | 108 | | | | — | | | | 26 | |
| Total income | | | 932 | | | | 5,404 | | | | 17 | | | | 956 | |
| Expenses | | | | | | | | | | | | | | | | |
| Investment advisory fees | | | 775 | | | | 3,857 | | | | 5 | | | | 685 | |
| Distribution fees | | | 33 | | | | 174 | | | | — | | | | — | |
| Custodian fees | | | 32 | | | | 30 | | | | 28 | | | | 35 | |
| Transfer agent fees | | | 36 | | | | 89 | | | | 1 | | | | 4 | |
| Sub-transfer agent fees | | | | | | | | | | | | | | | | |
| Class N | | | 16 | | | | 79 | | | | — | | | | — | |
| Class I | | | 33 | | | | 523 | | | | — | | | | 65 | |
| Professional fees | | | 22 | | | | 57 | | | | 15 | | | | 18 | |
| Registration fees | | | 24 | | | | 49 | | | | 15 | | | | 18 | |
| Shareholder reporting fees | | | 5 | | | | 31 | | | | — | | | | 1 | |
| Trustee fees | | | 10 | | | | 49 | | | | — | | | | 6 | |
| Other expenses | | | 6 | | | | 25 | | | | 1 | | | | 6 | |
| Total expenses before expense limitation | | | 992 | | | | 4,963 | | | | 65 | | | | 838 | |
| Expenses waived or reimbursed by the Adviser | | | | | | | | | | | | | | | | |
| Class N | | | (7 | ) | | | (80 | ) | | | — | | | | — | |
| Class I | | | — | | | | (528 | ) | | | (3 | ) | | | (95 | ) |
| Class R6 | | | — | | | | (71 | ) | | | (58 | ) | | | (34 | ) |
| Total expenses waived or reimbursed by the Adviser | | | (7 | ) | | | (679 | ) | | | (61 | ) | | | (129 | ) |
| Net expenses | | | 985 | | | | 4,284 | | | | 4 | | | | 709 | |
| Net investment income (loss) | | | (53 | ) | | | 1,120 | | | | 13 | | | | 247 | |
| Realized and unrealized gain (loss) | | | | | | | | | | | | | | | | |
| Net realized gain (loss) on transactions from: | | | | | | | | | | | | | | | | |
| Investments in securities | | | 7,729 | | | | (51,792 | ) | | | (35 | ) | | | (3,090 | ) |
| Total net realized gain (loss) | | | 7,729 | | | | (51,792 | ) | | | (35 | ) | | | (3,090 | ) |
| Change in net unrealized appreciation (depreciation) of: | | | | | | | | | | | | | | | | |
| Investments in securities | | | 40,678 | | | | 344,131 | | | | 110 | | | | 14,354 | |
| Change in net unrealized appreciation (depreciation) | | | 40,678 | | | | 344,131 | | | | 110 | | | | 14,354 | |
| Net increase (decrease) in net assets resulting from operations | | $ | 48,354 | | | $ | 293,459 | | | $ | 88 | | | $ | 11,511 | |
See accompanying Notes to Financial Statements.
| June 30, 2023 | William Blair Funds | 93 |
Statements of Changes in Net Assets
For the Period Ended June 30, 2023 (unaudited) and the Year Ended December 31, 2022 (all amounts in thousands)
| | | Growth Fund | | | Large Cap
Growth Fund | | | Mid Cap
Value Fund | | | Small-Mid Cap
Core Fund | |
| | | 2023 | | | 2022 | | | 2023 | | | 2022 | | | 2023 | | | 2022 (a) | | | 2023 | | | 2022 | |
| Operations | | | | | | | | | | | | | | | | | | | | | | | | | | | | | | | | |
| Net investment income (loss) | | $ | (53 | ) | | $ | (790 | ) | | $ | 1,120 | | | $ | 1,184 | | | $ | 13 | | | $ | 18 | | | $ | 247 | | | $ | (56 | ) |
| Net realized gain (loss) on investments, and other assets and liabilities | | | 7,729 | | | | 7,497 | | | | (51,792 | ) | | | (30,976 | ) | | | (35 | ) | | | (34 | ) | | | (3,090 | ) | | | (4,236 | ) |
| Change in net unrealized appreciation (depreciation) on investments, and other assets and liabilities | | | 40,678 | | | | (104,075 | ) | | | 344,131 | | | | (412,476 | ) | | | 110 | | | | (105 | ) | | | 14,354 | | | | (19,672 | ) |
| Net increase (decrease) in net assets resulting from operations | | | 48,354 | | | | (97,368 | ) | | | 293,459 | | | | (442,268 | ) | | | 88 | | | | (121 | ) | | | 11,511 | | | | (23,964 | ) |
| Distributions to shareholders | | | | | | | | | | | | | | | | | | | | | | | | | | | | | | | | |
| Class N | | | — | | | | (1,055 | ) | | | — | | | | (1,004 | ) | | | — | | | | — | | | | — | | | | — | |
| Class I | | | — | | | | (4,820 | ) | | | — | | | | (5,758 | ) | | | — | | | | (1 | ) | | | — | | | | — | |
| Class R6 | | | — | | | | (1,050 | ) | | | — | | | | (2,071 | ) | | | — | | | | (15 | ) | | | — | | | | — | |
| Total distributions | | | — | | | | (6,925 | ) | | | — | | | | (8,833 | ) | | | — | | | | (16 | ) | | | — | | | | — | |
| Capital stock transactions | | | | | | | | | | | | | | | | | | | | | | | | | | | | | | | | |
| Proceeds from sale of shares | | | 5,301 | | | | 36,716 | | | | 333,251 | | | | 808,663 | | | | 73 | | | | 1,661 | | | | 17,145 | | | | 109,055 | |
| Shares issued in reinvestment of income dividends and capital gain distributions | | | — | | | | 6,664 | | | | — | | | | 8,463 | | | | — | | | | 16 | | | | — | | | | — | |
| Less cost of shares redeemed | | | (11,249 | ) | | | (95,779 | ) | | | (162,250 | ) | | | (399,025 | ) | | | (52 | ) | | | (33 | ) | | | (15,684 | ) | | | (33,650 | ) |
| Net increase (decrease) in net assets resulting from capital share transactions | | | (5,948 | ) | | | (52,399 | ) | | | 171,001 | | | | 418,101 | | | | 21 | | | | 1,644 | | | | 1,461 | | | | 75,405 | |
| Increase (decrease) in net assets | | | 42,406 | | | | (156,692 | ) | | | 464,460 | | | | (33,000 | ) | | | 109 | | | | 1,507 | | | | 12,972 | | | | 51,441 | |
| Net assets | | | | | | | | | | | | | | | | | | | | | | | | | | | | | | | | |
| Beginning of period | | | 189,008 | | | | 345,700 | | | | 1,073,020 | | | | 1,106,020 | | | | 1,507 | | | | — | | | | 144,221 | | | | 92,780 | |
| End of period | | $ | 231,414 | | | $ | 189,008 | | | $ | 1,537,480 | | | $ | 1,073,020 | | | $ | 1,616 | | | $ | 1,507 | | | $ | 157,193 | | | $ | 144,221 | |
| (a) | For the period from March 16, 2022 (Commencement of Operations) to December 31, 2022. |
See accompanying Notes to Financial Statements.
| 94 | Semiannual Report | June 30, 2023 |
Statements of Assets and Liabilities
As of June 30, 2023 (dollar amounts in thousands) (unaudited)
| | | Small-Mid
Cap Growth
Fund | | | Small Cap
Growth
Fund | | | Small Cap
Value
Fund | |
| Assets | | | | | | | | | | | | |
| Investments in securities, at cost | | $ | 1,831,659 | | | $ | 584,023 | | | $ | 1,238,967 | |
| Investments in securities, at value | | $ | 2,122,446 | | | $ | 669,463 | | | $ | 1,249,393 | |
| Cash | | | — | | | | 971 | | | | — | |
| Receivable for securities sold | | | — | | | | 3,482 | | | | 856 | |
| Receivable for fund shares sold | | | 910 | | | | 2,728 | | | | 693 | |
| Receivable from Adviser | | | 179 | | | | 60 | | | | 10 | |
| Dividend and interest receivable | | | 281 | | | | 123 | | | | 1,528 | |
| Total assets | | | 2,123,816 | | | | 676,827 | | | | 1,252,480 | |
| Liabilities | | | | | | | | | | | | |
| Payable for securities purchased | | | 2,849 | | | | 15,091 | | | | 1,386 | |
| Payable for fund shares redeemed | | | 1,575 | | | | 221 | | | | 162 | |
| Management fee payable | | | 1,591 | | | | 493 | | | | 759 | |
| Distribution fee payable | | | 23 | | | | 25 | | | | 1 | |
| Other payables and accrued expenses | | | 428 | | | | 83 | | | | 249 | |
| Total liabilities | | | 6,466 | | | | 15,913 | | | | 2,557 | |
| Net assets | | $ | 2,117,350 | | | $ | 660,914 | | | $ | 1,249,923 | |
| Capital | | | | | | | | | | | | |
| Composition of net assets | | | | | | | | | | | | |
| Paid in capital | | $ | 1,791,422 | | | $ | 586,510 | | | $ | 1,217,786 | |
| Total distributable earnings (loss) | | | 325,928 | | | | 74,404 | | | | 32,137 | |
| Net assets | | $ | 2,117,350 | | | $ | 660,914 | | | $ | 1,249,923 | |
| Class N shares | | | | | | | | | | | | |
| Net assets | | $ | 115,316 | | | $ | 122,611 | | | $ | 2,623 | |
| Shares outstanding | | | 4,310,520 | | | | 4,593,439 | | | | 92,698 | |
| Net asset value per share | | $ | 26.75 | | | $ | 26.69 | | | $ | 28.29 | |
| Class I shares | | | | | | | | | | | | |
| Net assets | | $ | 1,561,953 | | | $ | 389,181 | | | $ | 783,361 | |
| Shares outstanding | | | 53,920,943 | | | | 12,274,291 | | | | 27,696,805 | |
| Net asset value per share | | $ | 28.97 | | | $ | 31.71 | | | $ | 28.28 | |
| Class R6 shares | | | | | | | | | | | | |
| Net assets | | $ | 440,081 | | | $ | 149,122 | | | $ | 463,939 | |
| Shares outstanding | | | 15,146,168 | | | | 4,687,626 | | | | 16,400,124 | |
| Net asset value per share | | $ | 29.06 | | | $ | 31.81 | | | $ | 28.29 | |
See accompanying Notes to Financial Statements.
| June 30, 2023 | William Blair Funds | 95 |
Statements of Operations
For the Period Ended June 30, 2023 (all amounts in thousands) (unaudited)
| | | Small-Mid
Cap Growth
Fund | | | Small Cap
Growth
Fund | | | Small Cap
Value
Fund | |
| Investment income | | | | | | | | | | | | |
| Dividends | | $ | 7,348 | | | $ | 1,460 | | | $ | 11,243 | |
| Less foreign tax withheld | | | (122 | ) | | | (47 | ) | | | (30 | ) |
| Interest | | | 527 | | | | 170 | | | | 254 | |
| Total income | | | 7,753 | | | | 1,583 | | | | 11,467 | |
| Expenses | | | | | | | | | | | | |
| Investment advisory fees | | | 10,048 | | | | 3,108 | | | | 4,677 | |
| Distribution fees | | | 140 | | | | 148 | | | | 3 | |
| Custodian fees | | | 43 | | | | 37 | | | | 34 | |
| Transfer agent fees | | | 93 | | | | 47 | | | | 34 | |
| Sub-transfer agent fees | | | | | | | | | | | | |
| Class N | | | 85 | | | | 73 | | | | 1 | |
| Class I | | | 1,011 | | | | 184 | | | | 499 | |
| Professional fees | | | 98 | | | | 37 | | | | 83 | |
| Registration fees | | | 30 | | | | 34 | | | | 27 | |
| Shareholder reporting fees | | | 58 | | | | 21 | | | | 14 | |
| Trustee fees | | | 100 | | | | 25 | | | | 59 | |
| Other expenses | | | 37 | | | | 12 | | | | 22 | |
| Total expenses before expense limitation | | | 11,743 | | | | 3,726 | | | | 5,453 | |
| Expenses waived or reimbursed by the Adviser | | | | | | | | | | | | |
| Class N | | | (63 | ) | | | (46 | ) | | | — | |
| Class I | | | (715 | ) | | | (110 | ) | | | (123 | ) |
| Class R6 | | | (28 | ) | | | (1 | ) | | | — | |
| Total expenses waived or reimbursed by the Adviser | | | (806 | ) | | | (157 | ) | | | (123 | ) |
| Net expenses | | | 10,937 | | | | 3,569 | | | | 5,330 | |
| Net investment income (loss) | | | (3,184 | ) | | | (1,986 | ) | | | 6,137 | |
| Realized and unrealized gain (loss) | | | | | | | | | | | | |
| Net realized gain (loss) on transactions from: | | | | | | | | | | | | |
| Investments in securities | | | 41,498 | | | | 17,708 | | | | 12,224 | |
| Foreign currency transactions | | | 3 | | | | 1 | | | | — | |
| Total net realized gain (loss) | | | 41,501 | | | | 17,709 | | | | 12,224 | |
| Change in net unrealized appreciation (depreciation) of: | | | | | | | | | | | | |
| Investments in securities | | | 190,939 | | | | 46,834 | | | | 3,985 | |
| Change in net unrealized appreciation (depreciation) | | | 190,939 | | | | 46,834 | | | | 3,985 | |
| Net increase (decrease) in net assets resulting from operations | | $ | 229,256 | | | $ | 62,557 | | | $ | 22,346 | |
See accompanying Notes to Financial Statements.
| 96 | Semiannual Report | June 30, 2023 |
Statements of Changes in Net Assets
For the Period Ended June 30, 2023 (unaudited) and the Year Ended December 31, 2022 (all amounts in thousands)
| | | Small-Mid Cap
Growth Fund | | | Small Cap
Growth Fund | | | Small Cap
Value Fund | |
| | | 2023 | | | 2022 | | | 2023 | | | 2022 | | | 2023 | | | 2022 | |
| Operations | | | | | | | | | | | | | | | | | | | | | | | | |
| Net investment income (loss) | | $ | (3,184 | ) | | $ | (14,658 | ) | | $ | (1,986 | ) | | $ | (4,622 | ) | | $ | 6,137 | | | $ | 10,262 | |
| Net realized gain (loss) on investments, and other assets and liabilities | | | 41,501 | | | | 12,027 | | | | 17,709 | | | | (12,492 | ) | | | 12,224 | | | | 254,754 | |
| Change in net unrealized appreciation (depreciation) on investments, and other assets and liabilities | | | 190,939 | | | | (679,120 | ) | | | 46,834 | | | | (136,772 | ) | | | 3,985 | | | | (425,307 | ) |
| Net increase (decrease) in net assets resulting from operations | | | 229,256 | | | | (681,751 | ) | | | 62,557 | | | | (153,886 | ) | | | 22,346 | | | | (160,291 | ) |
| Distributions to shareholders | | | | | | | | | | | | | | | | | | | | | | | | |
| Class N | | | — | | | | (3,897 | ) | | | — | | | | (4,693 | ) | | | — | | | | (187 | ) |
| Class I | | | — | | | | (49,427 | ) | | | — | | | | (10,353 | ) | | | — | | | | (54,725 | ) |
| Class R6 | | | — | | | | (12,748 | ) | | | — | | | | (3,839 | ) | | | — | | | | (33,495 | ) |
| Total distributions | | | — | | | | (66,072 | ) | | | — | | | | (18,885 | ) | | | — | | | | (88,407 | ) |
| Capital stock transactions | | | | | | | | | | | | | | | | | | | | | | | | |
| Proceeds from sale of shares | | | 136,323 | | | | 509,350 | | | | 135,063 | | | | 137,373 | | | | 108,241 | | | | 229,728 | |
| Shares issued in reinvestment of income dividends and capital gain distributions | | | — | | | | 64,751 | | | | — | | | | 18,519 | | | | — | | | | 86,757 | |
| Less cost of shares redeemed | | | (260,554 | ) | | | (862,015 | ) | | | (66,543 | ) | | | (163,362 | ) | | | (94,872 | ) | | | (922,977 | ) |
| Net increase (decrease) in net assets resulting from capital share transactions | | | (124,231 | ) | | | (287,914 | ) | | | 68,520 | | | | (7,470 | ) | | | 13,369 | | | | (606,492 | ) |
| Increase (decrease) in net assets | | | 105,025 | | | | (1,035,737 | ) | | | 131,077 | | | | (180,241 | ) | | | 35,715 | | | | (855,190 | ) |
| Net assets | | | | | | | | | | | | | | | | | | | | | | | | |
| Beginning of period | | | 2,012,325 | | | | 3,048,062 | | | | 529,837 | | | | 710,078 | | | | 1,214,208 | | | | 2,069,398 | |
| End of period | | $ | 2,117,350 | | | $ | 2,012,325 | | | $ | 660,914 | | | $ | 529,837 | | | $ | 1,249,923 | | | $ | 1,214,208 | |
See accompanying Notes to Financial Statements.
| June 30, 2023 | William Blair Funds | 97 |
Statements of Assets and Liabilities
As of June 30, 2023 (dollar amounts in thousands) (unaudited)
| | | Global
Leaders
Fund | | | International
Leaders
Fund | | | International
Growth
Fund | | | Institutional
International
Growth
Fund | |
| Assets | | | | | | | | | | | | | | | | |
| Investments in securities, at cost | | $ | 65,848 | | | $ | 923,539 | | | $ | 1,127,586 | | | $ | 674,414 | |
| Investments in securities, at value | | $ | 104,675 | | | $ | 1,136,130 | | | $ | 1,509,743 | | | $ | 896,401 | |
| Cash | | | 4 | | | | — | | | | 77 | | | | 45 | |
| Foreign currency, at value (cost $7; $1,403; $741; $362) | | | 7 | | | | 1,404 | | | | 742 | | | | 363 | |
| Receivable for securities sold | | | — | | | | 24,550 | | | | 15,306 | | | | 8,755 | |
| Receivable for fund shares sold | | | 1 | | | | 744 | | | | 1,528 | | | | 6,139 | |
| Receivable from Adviser | | | 18 | | | | 84 | | | | 139 | | | | 44 | |
| Dividend and interest receivable | | | 160 | | | | 2,526 | | | | 5,826 | | | | 3,215 | |
| Total assets | | | 104,865 | | | | 1,165,438 | | | | 1,533,361 | | | | 914,962 | |
| Liabilities | | | | | | | | | | | | | | | | |
| Payable for securities purchased | | | — | | | | 21,876 | | | | 9,354 | | | | 5,641 | |
| Payable for fund shares redeemed | | | — | | | | 2,519 | | | | 380 | | | | 2 | |
| Management fee payable | | | 72 | | | | 795 | | | | 1,168 | | | | 692 | |
| Distribution fee payable | | | 2 | | | | 8 | | | | 63 | | | | — | |
| Foreign capital gains tax liability | | | — | | | | 519 | | | | 959 | | | | 554 | |
| Other payables and accrued expenses | | | 57 | | | | 220 | | | | 616 | | | | 331 | |
| Total liabilities | | | 131 | | | | 25,937 | | | | 12,540 | | | | 7,220 | |
| Net assets | | $ | 104,734 | | | $ | 1,139,501 | | | $ | 1,520,821 | | | $ | 907,742 | |
| Capital | | | | | | | | | | | | | | | | |
| Composition of net assets | | | | | | | | | | | | | | | | |
| Paid in capital | | $ | 62,427 | | | $ | 1,008,486 | | | $ | 1,118,836 | | | $ | 688,441 | |
| Total distributable earnings (loss) | | | 42,307 | | | | 131,015 | | | | 401,985 | | | | 219,301 | |
| Net assets | | $ | 104,734 | | | $ | 1,139,501 | | | $ | 1,520,821 | | | $ | 907,742 | |
| | | | | | | | | | | | | | | | | |
| Class N shares | | | | | | | | | | | | | | | | |
| Net assets | | $ | 9,753 | | | $ | 37,157 | | | $ | 306,795 | | | | — | |
| Shares outstanding | | | 621,665 | | | | 1,929,788 | | | | 11,078,384 | | | | — | |
| Net asset value per share | | $ | 15.69 | | | $ | 19.25 | | | $ | 27.69 | | | | — | |
| Class I shares | | | | | | | | | | | | | | | | |
| Net assets | | $ | 79,017 | | | $ | 432,772 | | | $ | 1,053,140 | | | | — | |
| Shares outstanding | | | 4,990,153 | | | | 22,272,168 | | | | 36,773,519 | | | | — | |
| Net asset value per share | | $ | 15.83 | | | $ | 19.43 | | | $ | 28.64 | | | | — | |
| Institutional/Class R6 shares | | | | | | | | | | | | | | | | |
| Net assets | | $ | 15,964 | | | $ | 669,572 | | | $ | 160,886 | | | $ | 907,742 | |
| Shares outstanding | | | 1,007,503 | | | | 34,429,193 | | | | 5,611,707 | | | | 63,612,124 | |
| Net asset value per share | | $ | 15.85 | | | $ | 19.45 | | | $ | 28.67 | | | $ | 14.27 | |
See accompanying Notes to Financial Statements.
| 98 | Semiannual Report | June 30, 2023 |
Statements of Operations
For the Period Ended June 30, 2023 (all amounts in thousands) (unaudited)
| | | Global
Leaders
Fund | | | International
Leaders
Fund | | | International
Growth
Fund | | | Institutional
International
Growth
Fund | |
| Investment income | | | | | | | | | | | | | | | | |
| Dividends | | $ | 642 | | | $ | 11,151 | | | $ | 17,720 | | | $ | 10,625 | |
| Less foreign tax withheld | | | (55 | ) | | | (1,320 | ) | | | (1,976 | ) | | | (1,185 | ) |
| Interest | | | 24 | | | | 201 | | | | 217 | | | | 148 | |
| Total income | | | 611 | | | | 10,032 | | | | 15,961 | | | | 9,588 | |
| Expenses | | | | | | | | | | | | | | | | |
| Investment advisory fees | | | 416 | | | | 4,626 | | | | 6,939 | | | | 4,253 | |
| Distribution fees | | | 12 | | | | 46 | | | | 382 | | | | — | |
| Custodian fees | | | 37 | | | | 85 | | | | 161 | | | | 109 | |
| Transfer agent fees | | | 5 | | | | 32 | | | | 50 | | | | 18 | |
| Sub-transfer agent fees | | | | | | | | | | | | | | | | |
| Class N | | | 5 | | | | 18 | | | | 217 | | | | — | |
| Class I | | | 28 | | | | 243 | | | | 509 | | | | — | |
| Professional fees | | | 22 | | | | 64 | | | | 91 | | | | 67 | |
| Registration fees | | | 24 | | | | 53 | | | | 29 | | | | 12 | |
| Shareholder reporting fees | | | 2 | | | | 17 | | | | 37 | | | | 3 | |
| Trustee fees | | | 4 | | | | 47 | | | | 70 | | | | 43 | |
| Other expenses | | | 4 | | | | 21 | | | | 26 | | | | 18 | |
| Total expenses before expense limitation | | | 559 | | | | 5,252 | | | | 8,511 | | | | 4,523 | |
| Expenses waived or reimbursed by the Adviser | | | | | | | | | | | | | | | | |
| Class N | | | (12 | ) | | | (19 | ) | | | (237 | ) | | | — | |
| Class I | | | (83 | ) | | | (261 | ) | | | (574 | ) | | | — | |
| Institutional/Class R6 | | | (15 | ) | | | (189 | ) | | | (50 | ) | | | (271 | ) |
| Total expenses waived or reimbursed by the Adviser | | | (110 | ) | | | (469 | ) | | | (861 | ) | | | (271 | ) |
| Net expenses | | | 449 | | | | 4,783 | | | | 7,650 | | | | 4,252 | |
| Net investment income (loss) | | | 162 | | | | 5,249 | | | | 8,311 | | | | 5,336 | |
| Realized and unrealized gain (loss) | | | | | | | | | | | | | | | | |
| Net realized gain (loss) on transactions from: | | | | | | | | | | | | | | | | |
| Investments in securities (net of foreign capital gains tax paid $— ; $13; $(107); $13) | | | 3,926 | | | | (12,240 | ) | | | 9,752 | | | | 10,518 | |
| Foreign currency transactions | | | (11 | ) | | | (177 | ) | | | (275 | ) | | | (110 | ) |
| Total net realized gain (loss) | | | 3,915 | | | | (12,417 | ) | | | 9,477 | | | | 10,408 | |
| Change in net unrealized appreciation (depreciation) of: | | | | | | | | | | | | | | | | |
| Investments in securities (net of foreign capital gains tax accrual $(12); $(186); $338; $154) | | | 12,584 | | | | 124,316 | | | | 140,845 | | | | 81,026 | |
| Foreign currency translations | | | 2 | | | | 29 | | | | (204 | ) | | | (17 | ) |
| Change in net unrealized appreciation (depreciation) | | | 12,586 | | | | 124,345 | | | | 140,641 | | | | 81,009 | |
| Net increase (decrease) in net assets resulting from operations | | $ | 16,663 | | | $ | 117,177 | | | $ | 158,429 | | | $ | 96,753 | |
See accompanying Notes to Financial Statements.
| June 30, 2023 | William Blair Funds | 99 |
Statements of Changes in Net Assets
For the Period Ended June 30, 2023 (unaudited) and the Year Ended December 31, 2022 (all amounts in thousands)
| | | Global
Leaders Fund | | | International
Leaders Fund | | | International
Growth Fund | | | Institutional
International
Growth Fund | |
| | | 2023 | | | 2022 | | | 2023 | | | 2022 | | | 2023 | | | 2022 | | | 2023 | | | 2022 | |
| Operations | | | | | | | | | | | | | | | | | | | | | | | | | | | | | | | | |
| Net investment income (loss) | | $ | 162 | | | $ | (75 | ) | | $ | 5,249 | | | $ | 4,996 | | | $ | 8,311 | | | $ | 11,837 | | | $ | 5,336 | | | $ | 7,223 | |
| Net realized gain (loss) on investments, and other assets and liabilities | | | 3,915 | | | | 707 | | | | (12,417 | ) | | | (68,687 | ) | | | 9,477 | | | | 62,630 | | | | 10,408 | | | | 44,969 | |
| Change in net unrealized appreciation (depreciation) on investments, and other assets and liabilities | | | 12,586 | | | | (42,397 | ) | | | 124,345 | | | | (337,406 | ) | | | 140,641 | | | | (671,912 | ) | | | 81,009 | | | | (410,590 | ) |
| Net increase (decrease) in net assets resulting from operations | | | 16,663 | | | | (41,765 | ) | | | 117,177 | | | | (401,097 | ) | | | 158,429 | | | | (597,445 | ) | | | 96,753 | | | | (358,398 | ) |
| Distributions to shareholders | | | | | | | | | | | | | | | | | | | | | | | | | | | | | | | | |
| Class N | | | — | | | | (174 | ) | | | — | | | | (68 | ) | | | — | | | | (23,255 | ) | | | — | | | | — | |
| Class I | | | — | | | | (1,502 | ) | | | — | | | | (631 | ) | | | — | | | | (74,123 | ) | | | — | | | | — | |
| Institutional/Class R6 | | | — | | | | (296 | ) | | | — | | | | (1,130 | ) | | | — | | | | (11,497 | ) | | | — | | | | (56,236 | ) |
| Total distributions | | | — | | | | (1,972 | ) | | | — | | | | (1,829 | ) | | | — | | | | (108,875 | ) | | | — | | | | (56,236 | ) |
| Capital stock transactions | | | | | | | | | | | | | | | | | | | | | | | | | | | | | | | | |
| Proceeds from sale of shares | | | 3,032 | | | | 14,887 | | | | 95,335 | | | | 455,376 | | | | 76,552 | | | | 539,922 | | | | 17,941 | | | | 142,332 | |
| Shares issued in reinvestment of income dividends and capital gain distributions | | | — | | | | 1,954 | | | | — | | | | 1,814 | | | | — | | | | 104,297 | | | | — | | | | 56,157 | |
| Less cost of shares redeemed | | | (6,520 | ) | | | (25,327 | ) | | | (77,232 | ) | | | (356,773 | ) | | | (148,796 | ) | | | (626,160 | ) | | | (115,684 | ) | | | (156,966 | ) |
| Net increase (decrease) in net assets resulting from capital share transactions | | | (3,488 | ) | | | (8,486 | ) | | | 18,103 | | | | 100,417 | | | | (72,244 | ) | | | 18,059 | | | | (97,743 | ) | | | 41,523 | |
| Increase (decrease) in net assets | | | 13,175 | | | | (52,223 | ) | | | 135,280 | | | | (302,509 | ) | | | 86,185 | | | | (688,261 | ) | | | (990 | ) | | | (373,111 | ) |
| Net assets | | | | | | | | | | | | | | | | | | | | | | | | | | | | | | | | |
| Beginning of period | | | 91,559 | | | | 143,782 | | | | 1,004,221 | | | | 1,306,730 | | | | 1,434,636 | | | | 2,122,897 | | | | 908,732 | | | | 1,281,843 | |
| End of period | | $ | 104,734 | | | $ | 91,559 | | | $ | 1,139,501 | | | $ | 1,004,221 | | | $ | 1,520,821 | | | $ | 1,434,636 | | | $ | 907,742 | | | $ | 908,732 | |
See accompanying Notes to Financial Statements.
| 100 | Semiannual Report | June 30, 2023 |
Statements of Assets and Liabilities
As of June 30, 2023 (dollar amounts in thousands) (unaudited)
| | | International
Small Cap
Growth
Fund | | | Emerging
Markets
Leaders
Fund | | | Emerging
Markets
Growth
Fund | | | Emerging
Markets
ex China
Growth Fund | |
| Assets | | | | | | | | | | | | | | | | |
| Investments in securities, at cost | | $ | 216,004 | | | $ | 279,315 | | | $ | 616,491 | | | $ | 16,617 | |
| Investments in securities, at value | | $ | 235,221 | | | $ | 302,981 | | | $ | 713,244 | | | $ | 19,041 | |
| Foreign currency, at value (cost $522; $318; $334; $3) | | | 522 | | | | 318 | | | | 334 | | | | 3 | |
| Receivable for securities sold | | | 107 | | | | 37 | | | | 3,174 | | | | 156 | |
| Receivable for fund shares sold | | | 15 | | | | 124 | | | | 10,362 | | | | — | |
| Receivable from Adviser | | | — | | | | 32 | | | | 80 | | | | 21 | |
| Dividend and interest receivable | | | 602 | | | | 1,001 | | | | 2,762 | | | | 67 | |
| Total assets | | | 236,467 | | | | 304,493 | | | | 729,956 | | | | 19,288 | |
| Liabilities | | | | | | | | | | | | | | | | |
| Payable for securities purchased | | | 784 | | | | — | | | | 1,615 | | | | 19 | |
| Payable for fund shares redeemed | | | 15 | | | | 1,567 | | | | 618 | | | | — | |
| Payable to custodian | | | — | | | | 1,560 | | | | — | | | | — | |
| Management fee payable | | | 198 | | | | 236 | | | | 566 | | | | 15 | |
| Distribution fee payable | | | — | | | | — | | | | 3 | | | | — | |
| Foreign capital gains tax liability | | | 24 | | | | 414 | | | | 3,609 | | | | 70 | |
| Other payables and accrued expenses | | | 112 | | | | 257 | | | | 569 | | | | 54 | |
| Total liabilities | | | 1,133 | | | | 4,034 | | | | 6,980 | | | | 158 | |
| Net assets | | $ | 235,334 | | | $ | 300,459 | | | $ | 722,976 | | | $ | 19,130 | |
| Capital | | | | | | | | | | | | | | | | |
| Composition of net assets | | | | | | | | | | | | | | | | |
| Paid in capital | | $ | 263,667 | | | $ | 383,540 | | | $ | 737,430 | | | $ | 17,994 | |
| Total distributable earnings (loss) | | | (28,333 | ) | | | (83,081 | ) | | | (14,454 | ) | | | 1,136 | |
| Net assets | | $ | 235,334 | | | $ | 300,459 | | | $ | 722,976 | | | $ | 19,130 | |
| Class N shares | | | | | | | | | | | | | | | | |
| Net assets | | $ | 1,728 | | | $ | 1,010 | | | $ | 15,159 | | | | — | |
| Shares outstanding | | | 148,049 | | | | 116,427 | | | | 1,392,544 | | | | — | |
| Net asset value per share | | $ | 11.67 | | | $ | 8.68 | | | $ | 10.89 | | | | — | |
| Class I shares | | | | | | | | | | | | | | | | |
| Net assets | | $ | 102,548 | | | $ | 19,309 | | | $ | 193,288 | | | $ | 1,470 | |
| Shares outstanding | | | 8,645,799 | | | | 2,215,765 | | | | 17,356,032 | | | | 137,685 | |
| Net asset value per share | | $ | 11.86 | | | $ | 8.71 | | | $ | 11.14 | | | $ | 10.68 | |
| Class R6 shares | | | | | | | | | | | | | | | | |
| Net assets | | $ | 131,058 | | | $ | 280,140 | | | $ | 514,529 | | | $ | 17,660 | |
| Shares outstanding | | | 10,974,311 | | | | 32,156,338 | | | | 45,626,551 | | | | 1,652,409 | |
| Net asset value per share | | $ | 11.94 | | | $ | 8.71 | | | $ | 11.28 | | | $ | 10.69 | |
See accompanying Notes to Financial Statements.
| June 30, 2023 | William Blair Funds | 101 |
Statements of Operations
For the Period Ended June 30, 2023 (all amounts in thousands) (unaudited)
| | | International
Small Cap
Growth
Fund | | | Emerging
Markets
Leaders
Fund | | | Emerging
Markets
Growth
Fund | | | Emerging
Markets ex
China Growth
Fund | |
| Investment income | | | | | | | | | | | | | | | | |
| Dividends | | $ | 3,070 | | | $ | 4,484 | | | $ | 9,623 | | | $ | 217 | |
| Less foreign tax withheld | | | (360 | ) | | | (467 | ) | | | (1,103 | ) | | | (30 | ) |
| Interest | | | 47 | | | | 37 | | | | 103 | | | | 3 | |
| Total income | | | 2,757 | | | | 4,054 | | | | 8,623 | | | | 190 | |
| Expenses | | | | | | | | | | | | | | | | |
| Investment advisory fees | | | 1,193 | | | | 1,541 | | | | 3,392 | | | | 80 | |
| Distribution fees | | | 2 | | | | 1 | | | | 19 | | | | — | |
| Custodian fees | | | 69 | | | | 94 | | | | 231 | | | | 71 | |
| Transfer agent fees | | | 10 | | | | 12 | | | | 38 | | | | 2 | |
| Sub-transfer agent fees | | | | | | | | | | | | | | | | |
| Class N | | | 1 | | | | 1 | | | | 9 | | | | — | |
| Class I | | | 44 | | | | 11 | | | | 104 | | | | — | |
| Professional fees | | | 36 | | | | 40 | | | | 97 | | | | 32 | |
| Registration fees | | | 24 | | | | 27 | | | | 42 | | | | 6 | |
| Shareholder reporting fees | | | 11 | | | | 4 | | | | 11 | | | | 1 | |
| Trustee fees | | | 11 | | | | 17 | | | | 34 | | | | — | |
| Other expenses | | | 7 | | | | 9 | | | | 14 | | | | 1 | |
| Total expenses before expense limitation | | | 1,408 | | | | 1,757 | | | | 3,991 | | | | 193 | |
| Expenses waived or reimbursed by the Adviser | | | | | | | | | | | | | | | | |
| Class N | | | — | | | | (1 | ) | | | (15 | ) | | | — | |
| Class I | | | — | | | | (20 | ) | | | (177 | ) | | | (8 | ) |
| Class R6 | | | — | | | | (187 | ) | | | (337 | ) | | | (106 | ) |
| Total expenses waived or reimbursed by the Adviser | | | — | | | | (208 | ) | | | (529 | ) | | | (114 | ) |
| Net expenses | | | 1,408 | | | | 1,549 | | | | 3,462 | | | | 79 | |
| Net investment income (loss) | | | 1,349 | | | | 2,505 | | | | 5,161 | | | | 111 | |
| Realized and unrealized gain (loss) | | | | | | | | | | | | | | | | |
| Net realized gain (loss) on transactions from: | | | | | | | | | | | | | | | | |
| Investments in securities (net of foreign capital gains tax paid $—; $456; $(36); $—) | | | (5,007 | ) | | | (28,381 | ) | | | (50,568 | ) | | | (520 | ) |
| Foreign currency transactions | | | (60 | ) | | | (151 | ) | | | (390 | ) | | | (15 | ) |
| Total net realized gain (loss) | | | (5,067 | ) | | | (28,532 | ) | | | (50,958 | ) | | | (535 | ) |
| Change in net unrealized appreciation (depreciation) of: | | | | | | | | | | | | | | | | |
| Investments in securities (net of foreign capital gains tax accrual $(51); $(409); $2,608; $61) | | | 24,085 | | | | 41,037 | | | | 80,721 | | | | 2,514 | |
| Foreign currency translations | | | 8 | | | | 8 | | | | 8 | | | | — | |
| Change in net unrealized appreciation (depreciation) | | | 24,093 | | | | 41,045 | | | | 80,729 | | | | 2,514 | |
| Net increase (decrease) in net assets resulting from operations | | $ | 20,375 | | | $ | 15,018 | | | $ | 34,932 | | | $ | 2,090 | |
See accompanying Notes to Financial Statements.
| 102 | Semiannual Report | June 30, 2023 |
Statements of Changes in Net Assets
For the Period Ended June 30, 2023 (unaudited) and the Year Ended December 31, 2022 (all amounts in thousands)
| | | International Small
Cap Growth Fund | | | Emerging Markets
Leaders Fund | | | Emerging Markets
Growth Fund | | | Emerging Markets
ex China
Growth Fund | |
| | | 2023 | | | 2022 | | | 2023 | | | 2022 | | | 2023 | | | 2022 | | | 2023 | | | 2022(a) | |
| Operations | | | | | | | | | | | | | | | | | | | | | | | | | | | | | | | | |
| Net investment income (loss) | | $ | 1,349 | | | $ | 908 | | | $ | 2,505 | | | $ | 2,435 | | | $ | 5,161 | | | $ | 3,619 | | | $ | 111 | | | $ | 27 | |
| Net realized gain (loss) on investments, and other assets and liabilities | | | (5,067 | ) | | | (40,464 | ) | | | (28,532 | ) | | | (73,852 | ) | | | (50,958 | ) | | | (56,336 | ) | | | (535 | ) | | | (827 | ) |
| Change in net unrealized appreciation (depreciation) on investments, and other assets and liabilities | | | 24,093 | | | | (93,778 | ) | | | 41,045 | | | | (55,424 | ) | | | 80,729 | | | | (283,138 | ) | | | 2,514 | | | | (160 | ) |
| Net increase (decrease) in net assets resulting from operations | | | 20,375 | | | | (133,334 | ) | | | 15,018 | | | | (126,841 | ) | | | 34,932 | | | | (335,855 | ) | | | 2,090 | | | | (960 | ) |
| Distributions to shareholders | | | | | | | | | | | | | | | | | | | | | | | | | | | | | | | | |
| Class N | | | — | | | | — | | | | — | | | | (9 | ) | | | — | | | | (24 | ) | | | — | | | | — | |
| Class I | | | — | | | | (202 | ) | | | — | | | | (289 | ) | | | — | | | | (278 | ) | | | — | | | | — | |
| Class R6 | | | — | | | | (406 | ) | | | — | | | | (3,110 | ) | | | — | | | | (716 | ) | | | — | | | | — | |
| Total distributions | | | — | | | | (608 | ) | | | — | | | | (3,408 | ) | | | — | | | | (1,018 | ) | | | — | | | | — | |
| Capital stock transactions | | | | | | | | | | | | | | | | | | | | | | | | | | | | | | | | |
| Proceeds from sale of shares | | | 5,647 | | | | 43,756 | | | | 15,197 | | | | 100,114 | | | | 130,115 | | | | 313,584 | | | | 4,120 | | | | 19,590 | |
| Shares issued in reinvestment of income dividends and capital gain distributions | | | — | | | | 513 | | | | — | | | | 3,401 | | | | — | | | | 956 | | | | — | | | | — | |
| Less cost of shares redeemed | | | (25,638 | ) | | | (58,888 | ) | | | (81,849 | ) | | | (94,858 | ) | | | (112,205 | ) | | | (349,371 | ) | | | (113 | ) | | | (5,597 | ) |
| Net increase (decrease) in net assets resulting from capital share transactions | | | (19,991 | ) | | | (14,619 | ) | | | (66,652 | ) | | | 8,657 | | | | 17,910 | | | | (34,831 | ) | | | 4,007 | | | | 13,993 | |
| Increase (decrease) in net assets | | | 384 | | | | (148,561 | ) | | | (51,634 | ) | | | (121,592 | ) | | | 52,842 | | | | (371,704 | ) | | | 6,097 | | | | 13,033 | |
| Net assets | | | | | | | | | | | | | | | | | | | | | | | | | | | | | | | | |
| Beginning of period | | | 234,950 | | | | 383,511 | | | | 352,093 | | | | 473,685 | | | | 670,134 | | | | 1,041,838 | | | | 13,033 | | | | — | |
| End of period | | $ | 235,334 | | | $ | 234,950 | | | $ | 300,459 | | | $ | 352,093 | | | $ | 722,976 | | | $ | 670,134 | | | $ | 19,130 | | | $ | 13,033 | |
| (a) | For the period from July 29, 2022 (Commencement of Operations) to December 31, 2022. |
See accompanying Notes to Financial Statements.
| June 30, 2023 | William Blair Funds | 103 |
Statements of Assets and Liabilities
As of June 30, 2023 (dollar amounts in thousands) (unaudited)
| | | Emerging
Markets
Small Cap
Growth Fund | | | China
Growth
Fund | | | Emerging
Markets
Debt
Fund | |
| Assets | | | | | | | | | | | | |
| Investments in securities, at cost | | $ | 302,382 | | | $ | 1,635 | | | $ | 50,846 | |
| Investments in securities, at value | | $ | 366,627 | | | $ | 1,304 | | | $ | 47,523 | |
| Cash | | | — | | | | 30 | | | | 9 | |
| Foreign currency, at value (cost $2,338; $1; $— ) | | | 2,336 | | | | 1 | | | | — | |
| Receivable for securities sold | | | 1,493 | | | | 54 | | | | — | |
| Receivable for fund shares sold | | | 80 | | | | — | | | | 33 | |
| Receivable from Adviser | | | 65 | | | | 11 | | | | 18 | |
| Dividend and interest receivable | | | 983 | | | | — | | | | 859 | |
| Total assets | | | 371,584 | | | | 1,400 | | | | 48,442 | |
| Liabilities | | | | | | | | | | | | |
| Payable for variation margin on centrally cleared swaps | | | — | | | | — | | | | 13 | |
| Payable for securities purchased | | | 3,615 | | | | 37 | | | | 243 | |
| Payable for fund shares redeemed | | | 73 | | | | — | | | | 20 | |
| Unrealized depreciation on forward foreign currency contracts | | | — | | | | — | | | | 13 | |
| Management fee payable | | | 324 | | | | 1 | | | | 25 | |
| Distribution fee payable | | | 1 | | | | — | | | | — | |
| Foreign capital gains tax liability | | | 3,779 | | | | — | | | | — | |
| Other payables and accrued expenses | | | 400 | | | | 25 | | | | 6 | |
| Total liabilities | | | 8,192 | | | | 63 | | | | 320 | |
| Net assets | | $ | 363,392 | | | $ | 1,337 | | | $ | 48,122 | |
| Capital | | | | | | | | | | | | |
| Composition of net assets | | | | | | | | | | | | |
| Paid in capital | | $ | 376,182 | | | $ | 4,213 | | | $ | 61,538 | |
| Total distributable earnings (loss) | | | (12,790 | ) | | | (2,876 | ) | | | (13,416 | ) |
| Net assets | | $ | 363,392 | | | $ | 1,337 | | | $ | 48,122 | |
| | | | | | | | | | | | | |
| Class N shares | | | | | | | | | | | | |
| Net assets | | $ | 3,514 | | | | — | | | | — | |
| Shares outstanding | | | 194,609 | | | | — | | | | — | |
| Net asset value per share | | $ | 18.06 | | | | — | | | | — | |
| Class I shares | | | | | | | | | | | | |
| Net assets | | $ | 124,691 | | | $ | 371 | | | $ | 1,075 | |
| Shares outstanding | | | 6,795,574 | | | | 67,629 | | | | 142,134 | |
| Net asset value per share | | $ | 18.35 | | | $ | 5.49 | | | $ | 7.57 | |
| Class R6 shares | | | | | | | | | | | | |
| Net assets | | $ | 235,187 | | | $ | 966 | | | $ | 47,047 | |
| Shares outstanding | | | 12,780,341 | | | | 176,541 | | | | 6,221,347 | |
| Net asset value per share | | $ | 18.40 | | | $ | 5.47 | | | $ | 7.56 | |
See accompanying Notes to Financial Statements.
| 104 | Semiannual Report | June 30, 2023 |
Statements of Operations
For the Period Ended June 30, 2023 (all amounts in thousands) (unaudited)
| | Emerging
Markets
Small Cap
Growth Fund | | | China
Growth
Fund | | | Emerging
Markets
Debt
Fund | |
| Investment income | | | | | | | | | | | | |
| Dividends | | $ | 3,702 | | | $ | 21 | | | $ | — | |
| Less foreign tax withheld | | | (425 | ) | | | (1 | ) | | | — | |
| Interest | | | 33 | | | | — | | | | 1,760 | |
| Less foreign tax withheld | | | — | | | | — | | | | (6 | ) |
| Total income | | | 3,310 | | | | 20 | | | | 1,754 | |
|
| Expenses | | | | | | | | | | | | |
| Investment advisory fees | | | 1,832 | | | | 9 | | | | 151 | |
| Distribution fees | | | 4 | | | | — | | | | — | |
| Custodian fees | | | 213 | | | | 29 | | | | 55 | |
| Transfer agent fees | | | 26 | | | | — | | | | 1 | |
| Sub-transfer agent fees | | | | | | | | | | | | |
| Class N | | | 2 | | | | — | | | | — | |
| Class I | | | 60 | | | | — | | | | — | |
| Professional fees | | | 85 | | | | 17 | | | | 30 | |
| Registration fees | | | 26 | | | | 18 | | | | 18 | |
| Shareholder reporting fees | | | 10 | | | | — | | | | 2 | |
| Trustee fees | | | 16 | | | | — | | | | 2 | |
| Other expenses | | | 8 | | | | 2 | | | | 7 | |
| Total expenses before expense limitation | | | 2,282 | | | | 75 | | | | 266 | |
| Expenses waived or reimbursed by the Adviser | | | | | | | | | | | | |
| Class N | | | (3 | ) | | | — | | | | — | |
| Class I | | | (108 | ) | | | (18 | ) | | | (3 | ) |
| Class R6 | | | (143 | ) | | | (49 | ) | | | (110 | ) |
| Total expenses waived or reimbursed by the Adviser | | | (254 | ) | | | (67 | ) | | | (113 | ) |
| Net expenses | | | 2,028 | | | | 8 | | | | 153 | |
| Net investment income (loss) | | | 1,282 | | | | 12 | | | | 1,601 | |
| Realized and unrealized gain (loss) | | | | | | | | | | | | |
| Net realized gain (loss) on transactions from: | | | | | | | | | | | | |
| Investments in securities (net of foreign capital gains tax paid $(41); $— ; $2) | | | (15,267 | ) | | | (571 | ) | | | (1,923 | ) |
| Swaps | | | — | | | | — | | | | (64 | ) |
| Forward foreign currency contracts | | | — | | | | — | | | | (22 | ) |
| Foreign currency transactions | | | (249 | ) | | | (1 | ) | | | (4 | ) |
| Total net realized gain (loss) | | | (15,516 | ) | | | (572 | ) | | | (2,013 | ) |
| Change in net unrealized appreciation (depreciation) of: | | | | | | | | | | | | |
| Investments in securities (net of foreign capital gains tax accrual $1,743; $— ; $— ) | | | 53,252 | | | | 278 | | | | 3,128 | |
| Swaps | | | — | | | | — | | | | (368 | ) |
| Forward foreign currency contracts | | | — | | | | — | | | | (7 | ) |
| Foreign currency translations | | | 9 | | | | — | | | | (5 | ) |
| Change in net unrealized appreciation (depreciation) | | | 53,261 | | | | 278 | | | | 2,748 | |
| Net increase (decrease) in net assets resulting from operations | | $ | 39,027 | | | $ | (282 | ) | | $ | 2,336 | |
See accompanying Notes to Financial Statements.
| June 30, 2023 | William Blair Funds | 105 |
Statements of Changes in Net Assets
For the Period Ended June 30, 2023 (unaudited) and the Year Ended December 31, 2022 (all amounts in thousands)
| | | Emerging Markets
Small Cap
Growth Fund | | | China Growth Fund | | | Emerging Markets
Debt Fund | |
| | | 2023 | | | 2022 | | | 2023 | | | 2022 | | | 2023 | | | 2022 | |
| Operations | | | | | | | | | | | | | | | | | | | | | | | | |
| Net investment income (loss) | | $ | 1,282 | | | $ | 857 | | | $ | 12 | | | $ | 13 | | | $ | 1,601 | | | $ | 2,779 | |
| Net realized gain (loss) on investments, and other assets and liabilities | | | (15,516 | ) | | | (56,248 | ) | | | (572 | ) | | | (1,957 | ) | | | (2,013 | ) | | | (7,193 | ) |
| Change in net unrealized appreciation (depreciation) on investments, and other assets and liabilities | | | 53,261 | | | | (81,085 | ) | | | 278 | | | | (178 | ) | | | 2,748 | | | | (4,510 | ) |
| Net increase (decrease) in net assets resulting from operations | | | 39,027 | | | | (136,476 | ) | | | (282 | ) | | | (2,122 | ) | | | 2,336 | | | | (8,924 | ) |
| Distributions to shareholders | | | | | | | | | | | | | | | | | | | | | | | | |
| Class N | | | — | | | | (145 | ) | | | — | | | | — | | | | — | | | | — | |
| Class I | | | — | | | | (5,030 | ) | | | — | | | | — | | | | (32 | ) | | | (75 | )(a) |
| Class R6 | | | — | | | | (9,975 | ) | | | — | | | | (1 | ) | | | (1,519 | ) | | | (3,077 | )(a) |
| Total distributions | | | — | | | | (15,150 | ) | | | — | | | | (1 | ) | | | (1,551 | ) | | | (3,152 | ) |
| Capital stock transactions | | | | | | | | | | | | | | | | | | | | | | | | |
| Proceeds from sale of shares | | | 33,564 | | | | 121,609 | | | | 537 | | | | 420 | | | | 196 | | | | 4,347 | |
| Shares issued in reinvestment of income dividends and capital gain distributions | | | — | | | | 14,983 | | | | — | | | | 1 | | | | 1,552 | | | | 3,151 | |
| Less cost of shares redeemed | | | (31,872 | ) | | | (162,701 | ) | | | (865 | ) | | | (3,576 | ) | | | (237 | ) | | | (1,090 | ) |
| Net increase (decrease) in net assets resulting from capital share transactions | | | 1,692 | | | | (26,109 | ) | | | (328 | ) | | | (3,155 | ) | | | 1,511 | | | | 6,408 | |
| Increase (decrease) in net assets | | | 40,719 | | | | (177,735 | ) | | | (610 | ) | | | (5,278 | ) | | | 2,296 | | | | (5,668 | ) |
| Net assets | | | | | | | | | | | | | | | | | | | | | | | | |
| Beginning of period | | | 322,673 | | | | 500,408 | | | | 1,947 | | | | 7,225 | | | | 45,826 | | | | 51,494 | |
| End of period | | $ | 363,392 | | | $ | 322,673 | | | $ | 1,337 | | | $ | 1,947 | | | $ | 48,122 | | | $ | 45,826 | |
| (a) | Included in the distribution is a tax return of capital in the amount of $1 and $118 (in thousands) for Class I and Class R6, respectively. |
See accompanying Notes to Financial Statements.
| 106 | Semiannual Report | June 30, 2023 |
Notes to Financial Statements (information as of June 30, 2023 is unaudited)
(1) Organization
(a) Description of the Trust
William Blair Funds (the “Trust”) is a Delaware statutory trust registered under the Investment Company Act of 1940, as amended (the “1940 Act”), as an open-end management investment company. As of the date of this report, the Trust has the following eighteen funds (the “Funds”) available for sale, each with its own investment objective and policies. For each Fund, the number of shares authorized is unlimited.
U.S. Equity Funds
Growth
Large Cap Growth
Mid Cap Value
Small-Mid Cap Core
Small-Mid Cap Growth
Small Cap Growth
Small Cap Value | | Global Equity Fund
Global Leaders
International Equity Funds
International Leaders
International Growth
Institutional International Growth
International Small Cap Growth
Emerging Markets Leaders
Emerging Markets Growth
Emerging Markets ex China Growth
Emerging Markets Small Cap Growth
China Growth | | Emerging Markets Debt Fund
Emerging Markets Debt |
William Blair Investment Management, LLC (the “Adviser”) serves as the Trust’s investment adviser. William Blair & Company, L.L.C. (“WBC” or the “Distributor”), an affiliate of the Adviser, serves as the Trust’s principal underwriter and distributor.
(b) Share Classes
Each Fund is comprised of Class N, Class I and Class R6 shares, except the Mid Cap Value, Small-Mid Cap Core, Emerging Markets ex China Growth, China Growth and Emerging Markets Debt Funds, which are comprised of Class I and Class R6 shares, and Institutional International Growth Fund, which does not offer multiple classes of shares.
Class N shares are available to the general public, either directly through the Trust’s distributor or through a select number of financial intermediaries. Class N shares are sold without any sales load and carry an annual 12b-1 distribution fee at a fixed rate (0.25% for all Funds as discussed in Note 4(b) – Transactions with Affiliates – Underwriting and Distribution Services Agreements) and a sub-transfer agent fee that is not a fixed rate and varies by Fund and class, as discussed below.
Class I shares are available to certain retirement and deferred compensation plans, clients of certain financial intermediaries, and asset-based fee advisory clients of William Blair. The minimum initial investment for a Class I account is $500,000, subject to certain exceptions. Class I shares do not carry any sales load or distribution fees and generally have lower ongoing expenses than Class N shares. Class I shares have a sub-transfer agent fee that is not a fixed rate and varies by Fund and class, as discussed below.
Class R6 shares are available to certain retirement and deferred compensation plans, clients of certain financial intermediaries, asset-based fee advisory clients of William Blair, and additional types of investors, provided that neither the investor nor the financial intermediary requires the Funds to make any type of servicing or administrative payment. The minimum initial investment for a Class R6 account is $1 million, subject to certain exceptions.
Shares of the Institutional International Growth Fund require a minimum initial investment of $5 million, subject to certain exceptions.
Class R6 shares and the Institutional International Growth Fund do not carry any sales load, distribution fees or sub-transfer agent fees. Class R6 shares of a Fund generally have lower ongoing expenses than the Fund’s Class N and Class I shares.
| June 30, 2023 | William Blair Funds | 107 |
Notes to Financial Statements (information as of June 30, 2023 is unaudited)
Sub-transfer agent fees: For Class N and Class I shares, the Funds may reimburse WBC for fees paid to intermediaries such as banks, broker-dealers, financial advisers or other financial institutions for sub-administration, sub-transfer agency and other services provided to investors whose shares of record are held in omnibus, other group accounts, retirement plans or accounts traded through registered securities clearing agents. These fees may vary based on, for example, the nature of services provided, but generally range up to 0.15% of the assets of the class serviced or maintained by the intermediary or up to $15 per sub-account maintained by the intermediary, depending on the method by which the intermediary charges for the services.
(c) Fund Objectives
The investment objectives of the Funds are as follows:
| U.S. Equity Funds | | Long-term capital appreciation. |
| Global Equity Fund | | Long-term capital appreciation. |
| International Equity Funds | | Long-term capital appreciation. |
| Emerging Markets Debt Fund | | Provide attractive risk-adjusted returns relative to the Fund’s benchmark. |
(2) Significant Accounting Policies
The following is a summary of the Trust’s significant accounting policies in effect during the periods covered by the financial statements, which are in accordance with U.S. generally accepted accounting principles (“US GAAP”), which includes the accounting and reporting guidelines under Accounting Standards Topic 946, Financial Services—Investment Companies.
(a) Investment income and transactions
Investment income, realized and unrealized gains and losses, and certain Fund level expenses and expense reductions, if any, are allocated based on the relative net assets of each class, except for certain class-specific expenses, which are charged directly to the appropriate class. Differences in class expenses may result in the payment of different per share dividends by class. All share classes of the Funds have equal rights with respect to voting, subject to class specific arrangements.
Dividend income and expenses are recorded on the ex-dividend date, except for those dividends from certain foreign securities that are recorded when the information is available.
Interest income is recorded on an accrual basis, adjusted for amortization of premium or accretion of discount. Variable rate bonds and floating rate notes earn interest at coupon rates that fluctuate at specific time intervals. The interest rates shown in the Portfolio of Investments for the Emerging Markets Debt Fund were the rates in effect on June 30, 2023. Put bonds may be redeemed at the discretion of the holder on specified dates prior to maturity.
Premiums and discounts are amortized and accreted, respectively, on a straight-line basis for short-term investments and on an effective interest method for long-term investments.
The Funds do not isolate the portion of operations resulting from fluctuations in foreign currency exchange rates on investments from the fluctuations arising from changes in the value of securities held. Such currency fluctuations are included with the net realized and unrealized gain or loss from investments.
| 108 | Semiannual Report | June 30, 2023 |
Notes to Financial Statements (information as of June 30, 2023 is unaudited)
Reported net realized foreign currency gains or losses arise from disposition of foreign currency, the difference in the foreign exchange rates between the trade and settlement dates on securities transactions, and the difference between the amounts of dividends, interest and foreign withholding taxes recorded on the ex-date or accrual date and the U.S. dollar equivalent of the amounts actually received or paid. Net unrealized foreign exchange gains and losses arise from changes (due to the changes in the exchange rate) in the value of foreign currency and other assets and liabilities denominated in foreign currencies held at period end.
For financial reporting purposes, security and shareholder transactions are recorded on trade date in accordance with US GAAP. Realized gains and losses from securities transactions are recognized on a specifically identified cost basis.
Awards from class action litigation may be recorded as a reduction of cost. If the Funds no longer own the applicable securities, the proceeds are recorded as realized gains.
(b) Share Valuation and Distributions to Shareholders
Shares are sold and redeemed on a continuous basis at net asset value. The net asset value per share is determined separately for each class by dividing the Fund’s net assets attributable to that class by the number of shares of the class outstanding as of the close of regular trading on the New York Stock Exchange (the “NYSE”), which is generally 4:00 p.m. Eastern time, on each day the NYSE is open.
Distributions from net investment income, if any, for all Equity Funds are declared and paid at least annually. Distributions from net investment income for Emerging Markets Debt Fund are declared daily and paid monthly. Capital gain distributions, if any, for all Funds, are declared and paid at least annually in December and/or January. Distributions payable to shareholders are recorded on the ex-dividend date.
(c) Foreign Currency Translation
The Funds may invest in securities denominated in foreign currencies. As such, assets and liabilities denominated in foreign currencies are translated into U.S. dollar amounts at the current exchange rate on the date of valuation. The values of foreign investments, open forward foreign currency contracts, and cash denominated in foreign currencies are translated into U.S. dollars using a spot market rate of exchange as of the time of the determination of each Fund’s net asset value, typically 4:00 p.m. Eastern time on days when there is regular trading on the NYSE. Payables and receivables for securities transactions, dividends, interest income and tax reclaims are translated into U.S. dollars using a spot market rate of exchange as of 4:00 p.m. Eastern time. Settlement of purchases and sales and dividend and interest receipts are translated into U.S. dollars using a spot market rate of exchange as of 11:00 a.m. Eastern time.
(d) Income Taxes
Each Fund intends to comply with the provisions of Subchapter M of the Code, in order to qualify as regulated investment companies. Each Fund intends to make the requisite distributions of income and capital gains to its shareholders sufficient to relieve it from all, or substantially all, federal income and excise taxes. No provision for federal income and excise taxes has been made.
Certain Funds may be subject to foreign income taxes imposed on realized gains on securities of issuers from certain foreign countries. Such taxes, if applicable, are included within net realized gain (loss) on transactions from investments in securities in the Statement of Operations.
Management evaluates tax positions taken or expected to be taken in the course of preparing the Funds’ tax returns to determine whether it is “more likely than not” that each tax position would be sustained upon examination by a taxing authority based on the technical merits of the positions. Tax positions not deemed to meet the “more likely than not” threshold would be recorded as a tax benefit or expense in the current year. Management has evaluated all of the uncertain tax positions of the Funds and has determined that no liability is required to be recorded in the financial statements.
The statute of limitations on the Funds’ tax returns for the prior three years remains open and the returns are subject to examination.
| June 30, 2023 | William Blair Funds | 109 |
Notes to Financial Statements (information as of June 30, 2023 is unaudited)
Adjustments to the cost of investments for tax purposes may be due to the deferred loss associated with current and prior year wash sales, income recognition from investments in real estate investment trusts, and the Funds’ election to mark-to-market their investments in Passive Foreign Investment Companies (“PFICs”). The cost of investments, including derivatives, for federal income tax purposes and related gross unrealized appreciation (depreciation) and net unrealized appreciation/(depreciation) at June 30, 2023, were as follows (in thousands):
| Fund | | Cost of
Investments | | | Gross
Unrealized
Appreciation | | Gross
Unrealized
Depreciation | | Net
Unrealized
Appreciation/
(Depreciation) |
| Growth | | $ | 129,624 | | | $ | 104,722 | | | $ | 2,829 | | | $ | 101,893 | |
| Large Cap Growth | | | 1,244,881 | | | | 300,739 | | | | 6,124 | | | | 294,615 | |
| Mid Cap Value | | | 1,539 | | | | 153 | | | | 154 | | | | (1 | ) |
| Small-Mid Cap Core | | | 151,619 | | | | 18,378 | | | | 12,075 | | | | 6,303 | |
| Small-Mid Cap Growth | | | 1,869,350 | | | | 392,538 | | | | 139,442 | | | | 253,096 | |
| Small Cap Growth | | | 600,901 | | | | 104,820 | | | | 36,258 | | | | 68,562 | |
| Small Cap Value | | | 1,243,714 | | | | 169,918 | | | | 164,239 | | | | 5,679 | |
| Global Leaders | | | 66,312 | | | | 39,283 | | | | 920 | | | | 38,363 | |
| International Leaders | | | 937,676 | | | | 237,983 | | | | 39,529 | | | | 198,454 | |
| International Growth | | | 1,136,769 | | | | 404,149 | | | | 31,175 | | | | 372,974 | |
| Institutional International Growth | | | 686,721 | | | | 226,614 | | | | 16,934 | | | | 209,680 | |
| International Small Cap Growth | | | 218,646 | | | | 36,765 | | | | 20,190 | | | | 16,575 | |
| Emerging Markets Leaders | | | 296,973 | | | | 27,351 | | | | 21,343 | | | | 6,008 | |
| Emerging Markets Growth | | | 631,412 | | | | 110,737 | | | | 28,905 | | | | 81,832 | |
| Emerging Markets ex China Growth | | | 16,737 | | | | 2,556 | | | | 252 | | | | 2,304 | |
| Emerging Markets Small Cap Growth | | | 305,968 | | | | 65,912 | | | | 5,253 | | | | 60,659 | |
| China Growth | | | 1,783 | | | | 22 | | | | 501 | | | | (479 | ) |
| Emerging Markets Debt | | | 51,745 | | | | 841 | | | | 5,401 | | | | (4,560 | ) |
As of December 31, 2022, the Funds may have unused capital loss carryforwards available for federal income tax purposes to be applied against future capital gains, if any. Under current law, the Funds may carry forward net capital losses indefinitely to use to offset capital gains realized in future years. The following table details the Funds’ available capital loss carryforwards as of December 31, 2022, and the capital loss carryforwards utilized by the Funds in 2022 (in thousands):
| | | Available Capital Loss Carryforwards | | | Capital Loss
Carryforwards |
| Fund | | Short Term | | Long Term | | Total | | | Utilized in 2022 |
| Large Cap Growth | | $ | 18,130 | | | $ | — | | | $ | 18,130 | | | $ | — | |
| Mid Cap Value | | | 32 | | | | — | | | | 32 | | | | — | |
| Small-Mid Cap Core | | | 8,781 | | | | — | | | | 8,781 | | | | — | |
| Small Cap Growth | | | 13,269 | | | | — | | | | 13,269 | | | | — | |
| International Leaders | | | 50,000 | | | | 10,877 | | | | 60,877 | | | | — | |
| International Small Cap Growth | | | 24,803 | | | | 16,045 | | | | 40,848 | | | | — | |
| Emerging Markets Leaders | | | 39,679 | | | | 25,022 | | | | 64,701 | | | | — | |
| Emerging Markets Growth | | | 43,241 | | | | — | | | | 43,241 | | | | — | |
| Emerging Markets ex China Growth | | | 679 | | | | — | | | | 679 | | | | — | |
| Emerging Markets Small Cap Growth | | | 53,252 | | | | — | | | | 53,252 | | | | — | |
| China Growth | | | 1,881 | | | | 49 | | | | 1,930 | | | | — | |
| Emerging Markets Debt | | | 5,818 | | | | 805 | | | | 6,623 | | | | — | |
In order to meet certain excise tax distribution requirements, the Funds are required to measure and distribute annually, net capital gains realized during a twelve month period ending October 31 and net investment income earned during a twelve month period ending December 31. In connection with this, the Funds are permitted for tax purposes to defer into their next fiscal year qualified late year losses. Qualified late year capital losses are any short term or long term capital losses incurred between November 1 and the end of their fiscal year, December 31. Qualified late year ordinary losses are comprised of losses related to swaps, foreign currency and PFICs incurred between November 1 and the end of their fiscal year, December 31.
| 110 | Semiannual Report | June 30, 2023 |
Notes to Financial Statements (information as of June 30, 2023 is unaudited)
As of December 31, 2022, the following Funds deferred, on a tax basis, qualified late year losses of (in thousands):
| | | Qualified Late Year Losses |
| Fund | | Ordinary
Income | | | Net
Capital |
| Gobal Leaders | | $ | — | | | $ | 108 |
| Institutional International Growth | | | — | | | | 4,200 |
| International Small Cap Growth | | | 97 | | | | — |
| Emerging Markets Leaders | | | 86 | | | | — |
| Emerging Markets Small Cap Growth | | | 198 | | | | — |
| Emerging Markets Debt | | | 187 | | | | — |
(e) Repurchase Agreements
In a repurchase agreement, a Fund buys a security at one price and at the time of sale, the seller agrees to repurchase the security at a mutually agreed upon time and price (usually within seven days). The repurchase agreement thereby determines the yield during the purchaser’s holding period, while the seller’s obligation to repurchase is secured by the value of the underlying collateral. The Adviser monitors, on an ongoing basis, the value of the underlying collateral to ensure that the value always equals or exceeds the repurchase price plus accrued interest. Repurchase agreements may involve certain risks in the event of a default or insolvency of the other party to the agreement, including possible delays or restrictions upon a Fund’s ability to dispose of the underlying collateral. The risk to a Fund is limited to the ability of the seller to pay the agreed upon sum on the delivery date. In the event of default, a repurchase agreement provides that a Fund is entitled to sell the underlying collateral. The loss, if any, to a Fund will be the difference between the proceeds from the sale and the repurchase price. However, if bankruptcy proceedings are commenced with respect to the seller of the security, disposition of the collateral by the Fund may be delayed or limited. The Funds have master repurchase agreements which allow the Funds to offset amounts owed to a counterparty with amounts owed from the same counterparty, including any collateral, in the event the counterparty defaults. Each Fund’s outstanding repurchase agreements, if any, and related collateral, are shown on the Fund’s Portfolio of Investments. Although no definitive creditworthiness criteria are used, the Adviser reviews the creditworthiness of the banks and non-bank dealers with which a Fund enters into repurchase agreements to evaluate those risks. A Fund may, for tax purposes, deem repurchase agreements collateralized by U.S. Government securities to be investments in U.S. Government securities.
(f) Use of Estimates
The preparation of financial statements in conformity with US GAAP requires management to make estimates and assumptions that affect the amounts reported in the financial statements. Actual results may differ from those estimates.
(g) Indemnification
In the normal course of business, the Funds have entered into contracts in which the Funds agree to indemnify the other party or parties against various potential costs or liabilities. The Funds’ maximum exposure under these arrangements is unknown. No claim has been made for indemnification pursuant to any such agreement of the Funds.
| June 30, 2023 | William Blair Funds | 111 |
Notes to Financial Statements (information as of June 30, 2023 is unaudited)
(3) Valuation
(a) Investment Valuation
The value of U.S. equity securities, including exchange-traded funds, is determined by valuing securities traded on national securities markets or in the over-the-counter markets at the last sale price or, if applicable, the official closing price or, in the absence of a recent sale on the date of determination, at the mean between the last reported bid and ask prices.
The value of foreign equity securities is generally determined based upon the last sale price on the foreign exchange or market on which it is primarily traded and in the currency of that market as of the close of the appropriate exchange or, if there have been no sales during that day, at the mean between the last reported bid and ask prices. The Adviser has determined that the passage of time between when the foreign exchanges or markets close and when the Funds compute their net asset values could cause the value of foreign equity securities to no longer be representative or accurate and, as a result, may necessitate that such securities be fair valued. Accordingly, for foreign equity securities, the Funds may use an independent pricing service to fair value price the security as of the close of regular trading on the NYSE. As a result, a Fund’s value for a foreign security may be different from the last sale price (or the mean between the last reported bid and ask prices). As of June 30, 2023, fair valuation estimates for foreign equity securities were not obtained.
Fixed income securities are generally valued using evaluated prices provided by an independent pricing service. The evaluated prices are formed using various market inputs that the pricing service believes accurately represent the market value of a security at a particular point in time. The pricing service determines evaluated prices for fixed income securities using inputs including, but not limited to, recent transaction prices for such securities, dealer quotes, transaction prices for other securities with similar characteristics, collateral characteristics, credit quality, payment history, liquidity and market conditions.
Repurchase agreements are valued at cost, which approximates fair value.
Forward foreign currency contracts are valued on the basis of the value of the underlying currencies at the prevailing currency exchange rate as supplied by an independent pricing service.
Swaps that are centrally cleared through an exchange are valued at the most recent settlement price provided by the exchange on which they are cleared. Total return swaps on equities, equity baskets, indices and other financial instruments are valued by an independent pricing service, or if unavailable, based on the security’s or instrument’s underlying reference asset.
Securities, and other assets, for which a market quotation is not available or is deemed unreliable (e.g., securities affected by unusual or extraordinary events, such as natural disasters or securities affected by market or economic events, such as bankruptcy filings), or the value of which is affected by a significant valuation event, are valued at a fair value. Pursuant to Rule 2a-5 under the 1940 Act, the Board of Trustees has designated the Adviser as the valuation designee to perform fair value determinations for the Funds. The value of these fair valued securities may be different from the last sale price (or the mean between the last reported bid and ask prices), and there is no guarantee that a fair valued security will be sold at the price at which a Fund is carrying the security.
| 112 | Semiannual Report | June 30, 2023 |
Notes to Financial Statements (information as of June 30, 2023 is unaudited)
(b) Fair Value Measurements
Fair value is defined as the price that a Fund would receive upon selling a security in an orderly transaction to an independent buyer in the principal or most advantageous market for the investment. Various inputs are used in determining the value of a Fund’s investments. A three-tier hierarchy of inputs is used to classify fair value measurements for disclosure purposes. The three-tier hierarchy of inputs is summarized in the three broad levels listed below:
| | • | Level 1—Quoted prices (unadjusted) in active markets for an identical security. |
| | | |
| | • | Level 2—Prices determined using other significant observable inputs. Observable inputs are inputs that other market participants would use in pricing a security. These may include quoted prices for similar securities, interest rates, prepayment speeds, credit risk, and others. In addition, other observable inputs such as foreign exchange rates, benchmark securities indices and foreign futures contracts may be utilized in the valuation of certain foreign securities when significant events occur between the last sale on the foreign securities exchange and the time at which the net asset value of the Fund is calculated. |
| | | |
| | • | Level 3—Prices determined using significant unobservable inputs. In situations where quoted prices or observable inputs are unavailable (for example, when there is little or no market activity for an investment), unobservable inputs may be used. Unobservable inputs reflect the Fund’s own assumptions about the factors market participants would use in pricing an investment, and are based on the best information available. |
The inputs or methodology used for valuing an investment are not necessarily an indication of the risk associated with investing in those securities.
A description of the valuation methodologies applied to the Funds’ major categories of assets and liabilities measured at fair value on a recurring basis is as follows:
Exchange-Traded Securities
Securities traded on a national securities exchange (or reported on the NASDAQ national market), including exchange-traded funds, are stated at the last reported sales price on the day of valuation. Other securities traded in the over-the-counter market and listed securities for which no sale was reported on that date are stated at the mean between the last reported bid and ask prices. To the extent these securities are actively traded and valuation adjustments are not applied, they are categorized as Level 1 of the fair value hierarchy. Securities traded on inactive markets or valued by reference to similar instruments are generally categorized as Level 2 of the fair value hierarchy.
Fixed Income Securities
Fixed income securities are generally valued using evaluated prices provided by an independent pricing service. The evaluated prices are formed using various market inputs that the pricing service believes accurately represent the fair value of a security at a particular point in time. The pricing service determines evaluated prices for fixed income securities using inputs including, but not limited to, recent transaction prices for such securities, dealer quotes, transaction prices for other securities with similar characteristics, collateral characteristics, credit quality, payment history, liquidity and market conditions. Securities that use similar valuation techniques and observable inputs as described above are categorized as Level 2 of the fair value hierarchy.
Repurchase Agreements
Repurchase agreements are valued at cost, which approximates fair value. Repurchase agreements are categorized as Level 2 of the fair value hierarchy.
Derivative Instruments
Forward foreign currency contracts and swaps are valued using pricing inputs observed from actively quoted markets and are categorized within Level 2 of the fair value hierarchy.
| June 30, 2023 | William Blair Funds | 113 |
Notes to Financial Statements (information as of June 30, 2023 is unaudited)
As of June 30, 2023, the value of investments in securities and other financial instruments, segregated by their hierarchical input levels used in determining fair value and by security class or other financial instruments, are shown below (in thousands).
| Investments in securities | | Growth | | | Large Cap
Growth | | | Mid Cap
Value | | | Small-Mid
Cap Core | |
| Level 1 | | | | | | | | | | | | | | | | |
| Common Stocks | | $ | 228,567 | | | $ | 1,530,806 | | | $ | 1,538 | | | $ | 156,233 | |
| Level 2 | | | | | | | | | | | | | | | | |
| Repurchase Agreements | | | 2,950 | | | | 8,690 | | | | — | | | | 1,689 | |
| Level 3 | | | | | | | | | | | | | | | | |
| None | | | — | | | | — | | | | — | | | | — | |
| Total investments in securities | | $ | 231,517 | | | $ | 1,539,496 | | | $ | 1,538 | | | $ | 157,922 | |
| | | | | | | | | | | | | | |
| Investments in securities | | | | | | Small-Mid
Cap Growth | | | Small Cap
Growth | | | Small Cap
Value | |
| Level 1 | | | | | | | | | | | | | | | | |
| Common Stocks | | | | | | $ | 2,098,010 | | | $ | 641,078 | | | $ | 1,225,334 | |
| Exchange-Traded Funds | | | | | | | — | | | | 6,377 | | | | — | |
| Level 2 | | | | | | | | | | | | | | | | |
| Repurchase Agreements | | | | | | | 24,436 | | | | 22,008 | | | | 24,059 | |
| Level 3 | | | | | | | | | | | | | | | | |
| Common Stocks | | | | | | | — | | | | — | | | | — | |
| Rights | | | | | | | — | | | | — | | | | — | |
| Total investments in securities | | | | | | $ | 2,122,446 | | | $ | 669,463 | | | $ | 1,249,393 | |
| | | | | | | | | | |
| Investments in securities | | Global
Leaders | | | International
Leaders | | | International
Growth | | | Institutional
International
Growth | |
| Level 1 | | | | | | | | | | | | | | | | |
| Common Stocks | | $ | 102,671 | | | $ | 1,100,373 | | | $ | 1,471,202 | | | $ | 868,779 | |
| Level 2 | | | | | | | | | | | | | | | | |
| Repurchase Agreements | | | 2,004 | | | | 35,757 | | | | 38,541 | | | | 27,622 | |
| Level 3 | | | | | | | | | | | | | | | | |
| None | | | — | | | | — | | | | — | | | | — | |
| Total investments in securities | | $ | 104,675 | | | $ | 1,136,130 | | | $ | 1,509,743 | | | $ | 896,401 | |
| | | | | | | | | |
| Investments in securities | | International
Small Cap
Growth | | | Emerging
Markets
Leaders | | | Emerging
Markets
Growth | | | Emerging
Markets
ex China
Growth | |
| Level 1 | | | | | | | | | | | | | | | | |
| Common Stocks | | $ | 229,137 | | | $ | 298,853 | | | $ | 690,275 | | | $ | 18,396 | |
| Level 2 | | | | | | | | | | | | | | | | |
| Common Stocks | | | 1,162 | | | | 4,128 | | | | 17,324 | | | | 390 | |
| Repurchase Agreements | | | 4,922 | | | | — | | | | 5,645 | | | | 255 | |
| Level 3 | | | | | | | | | | | | | | | | |
| None | | | — | | | | — | | | | — | | | | — | |
| Total investments in securities | | $ | 235,221 | | | $ | 302,981 | | | $ | 713,244 | | | $ | 19,041 | |
| 114 | Semiannual Report | June 30, 2023 |
Notes to Financial Statements (information as of June 30, 2023 is unaudited)
| Investments in securities | | Emerging
Markets
Small Cap
Growth | | | China
Growth | | | Emerging
Markets
Debt | |
| Assets | | | | | | | | | | | | | | | |
| Level 1 | | | | | | | | | | | | | | | |
| Common Stocks | | | $ | 356,170 | | | | $ | 1,304 | | | | $ | — | |
| Level 2 | | | | | | | | | | | | | | | |
| Common Stocks | | | | 6,346 | | | | | — | | | | | — | |
| Foreign Corporate Bonds | | | | — | | | | | — | | | | | 14,097 | |
| Foreign Government Bonds | | | | — | | | | | — | | | | | 30,677 | |
| Foreign Municipal Bonds | | | | — | | | | | — | | | | | 467 | |
| Repurchase Agreements | | | | 4,111 | | | | | — | | | | | 148 | |
| U.S. Government | | | | — | | | | | — | | | | | 2,134 | |
| Level 3 | | | | | | | | | | | | | | | |
| None | | | | — | | | | | — | | | | | — | |
| Liabilities | | | | | | | | | | | | | | | |
| Level 1 | | | | | | | | | | | | | | | |
| None | | | | — | | | | | — | | | | | — | |
| Level 2 | | | | | | | | | | | | | | | |
| None | | | | — | | | | | — | | | | | — | |
| Level 3 | | | | | | | | | | | | | | | |
| None | | | | — | | | | | — | | | | | — | |
| Total investments in securities | | | $ | 366,627 | | | | $ | 1,304 | | | | $ | 47,523 | |
| Other financial instruments | | | | | | | | | | | | | | | |
| Assets | | | | | | | | | | | | | | | |
| Level 1 | | | | | | | | | | | | | | | |
| None | | | $ | — | | | | $ | — | | | | $ | — | |
| Level 2 | | | | | | | | | | | | | | | |
| Swaps | | | | — | | | | | — | | | | | 123 | |
| Level 3 | | | | | | | | | | | | | | | |
| None | | | | — | | | | | — | | | | | — | |
| Liabilities | | | | | | | | | | | | | | | |
| Level 1 | | | | | | | | | | | | | | | |
| None | | | | — | | | | | — | | | | | — | |
| Level 2 | | | | | | | | | | | | | | | |
| Forward Foreign Currency Contracts | | | | — | | | | | — | | | | | (13 | ) |
| Swaps | | | | — | | | | | — | | | | | (503 | ) |
| Level 3 | | | | | | | | | | | | | | | |
| None | | | | — | | | | | — | | | | | — | |
| Total other financial instruments | | | $ | — | | | | $ | — | | | | $ | (393 | ) |
See Portfolio of Investments for Sector Classification.
The fair value estimates for the Level 3 securities in the Small-Mid Cap Growth and Small Cap Growth Funds were determined in good faith by the Adviser pursuant to the Fund’s Valuation Procedures. There were various factors considered in reaching the fair value determination, including, but not limited to, the following: the type of security, the extent of public trading of the security, information obtained for the security, and analysis of the company’s performance and market trends that influence its performance. The Level 3 securities represented 0.00% and 0.00% as a percentage of net assets in the Small-Mid Cap Growth and Small Cap Growth Funds, respectively.
| June 30, 2023 | William Blair Funds | 115 |
Notes to Financial Statements (information as of June 30, 2023 is unaudited)
(4) Transactions with Affiliates
(a) Management and Expense Limitation Agreements
Each Fund has a management agreement with the Adviser for investment management, clerical, bookkeeping and administrative services. Each Fund pays the Adviser an annual management fee, which is accrued daily and paid monthly, based on a specified percentage of the Fund’s average daily net assets. Each Fund’s annual management fee rate is as follows:
| U.S. Equity Funds | | | | |
| Growth | | | 0.75 | % |
| Large Cap Growth | | | 0.60 | % |
| Mid Cap Value | | | 0.70 | % |
| Small-Mid Cap Core | | | 0.90 | % |
| Small-Mid Cap Growth1 | | | 0.94 | % |
| Small Cap Growth2 | | | 0.94 | % |
| Small Cap Value | | | 0.75 | % |
| | | | | |
| Emerging Markets Debt Fund | | | | |
| Emerging Markets Debt | | | 0.65 | % |
| | | | | |
| Global Equity Fund | | | | |
| Global Leaders | | | 0.85 | % |
| International Equity Funds | | | | |
| International Leaders | | | 0.85 | % |
| International Growth: | | | | |
| First $3 billion | | | 0.94 | % |
| Next $2 billion | | | 0.90 | % |
| Next $5 billion | | | 0.85 | % |
| Next $5 billion | | | 0.825 | % |
| In excess of $15 billion | | | 0.80 | % |
| Institutional International Growth: | | | | |
| First $1.875 billion | | | 0.94 | % |
| Next $625 million | | | 0.90 | % |
| Next $2.5 billion | | | 0.875 | % |
| Next $5 billion | | | 0.85 | % |
| Next $5 billion | | | 0.825 | % |
| In excess of $15 billion | | | 0.80 | % |
| International Small Cap Growth | | | 1.00 | % |
| Emerging Markets Leaders | | | 0.94 | % |
| Emerging Markets Growth | | | 0.94 | % |
| Emerging Markets ex China Growth | | | 0.94 | % |
| Emerging Markets Small Cap Growth | | | 1.10 | % |
| China Growth | | | 0.94 | % |
| 1 | Prior to May 1, 2023, the Small-Mid Cap Growth Fund paid a management fee at a rate of 1.00% of the Fund’s average daily net assets. Effective May 1, 2023, the management fee paid to the Adviser was reduced to 0.94%. |
| 2 | Prior to May 1, 2023, the Small Cap Growth Fund paid a management fee at a rate of 1.10% of the Fund’s average daily net assets. Effective May 1, 2023, the management fee paid to the Adviser was reduced to 0.94%. |
| 116 | Semiannual Report | June 30, 2023 |
Notes to Financial Statements (information as of June 30, 2023 is unaudited)
The Funds have also entered into an Amended and Restated Expense Limitation Agreement with the Adviser. Under the terms of the agreement, the Adviser will waive its management fee and/or reimburse a Fund for certain operating expenses, subject to certain excluded expenses, in excess of the agreed upon rate through April 30, 2024. Excluded expenses include interest expenses, taxes, brokerage commissions, acquired fund fees and expenses, dividend and interest expenses on short sales, other investment-related costs and extraordinary expenses, such as litigation and other expenses not incurred in the ordinary course of a Fund’s business. The amount the Adviser owes a Fund as of the reporting date is recorded as Receivable from Adviser in the Statements of Assets and Liabilities. The Adviser reimburses the Funds on a monthly basis. The Adviser will waive fees and/or reimburse expenses to the extent that the total operating expenses for the stated class of the Funds, subject to certain excluded expenses, exceed the following rates (as a percentage of average daily net assets):
| | | Class N | | Class I | | Institutional/Class R6 |
| Fund | | Effective
May 1, 2023
through
April 30,
2024 | | Effective
May 1, 2022
through
April 30,
2023 | | Effective
May 1, 2023
through
April 30,
2024 | | Effective
May 1, 2022
through
April 30,
2023 | | Effective
May 1, 2023
through
April 30,
2024 | | Effective
May 1, 2022
through
April 30,
2023 |
| Growth | | | 1.20 | % | | | 1.20 | % | | | 0.95 | % | | | 0.95 | % | | | 0.90 | % | | | 0.90 | % |
| Large Cap Growth | | | 0.90 | % | | | 0.90 | % | | | 0.65 | % | | | 0.65 | % | | | 0.60 | % | | | 0.60 | % |
| Mid Cap Value | | | N/A | | | | N/A | | | | 0.75 | % | | | 0.75 | % | | | 0.70 | % | | | 0.70 | % |
| Small-Mid Cap Core | | | N/A | | | | N/A | | | | 0.95 | % | | | 0.95 | % | | | 0.90 | % | | | 0.90 | % |
| Small-Mid Cap Growth | | | 1.24 | % | | | 1.35 | % | | | 0.99 | % | | | 1.10 | % | | | 0.94 | % | | | 1.05 | % |
| Small Cap Growth | | | 1.24 | % | | | 1.50 | % | | | 0.99 | % | | | 1.25 | % | | | 0.94 | % | | | 1.20 | % |
| Small Cap Value | | | 1.15 | % | | | 1.15 | % | | | 0.89 | % | | | 0.89 | % | | | 0.85 | % | | | 0.85 | % |
| Global Leaders | | | 1.15 | % | | | 1.15 | % | | | 0.90 | % | | | 0.90 | % | | | 0.85 | % | | | 0.85 | % |
| International Leaders | | | 1.15 | % | | | 1.15 | % | | | 0.90 | % | | | 0.90 | % | | | 0.85 | % | | | 0.85 | % |
| International Growth | | | 1.24 | % | | | 1.24 | % | | | 0.99 | % | | | 0.99 | % | | | 0.94 | % | | | 0.94 | % |
| Institutional International Growth | | | N/A | | | | N/A | | | | N/A | | | | N/A | | | | 0.94 | % | | | 0.94 | % |
| International Small Cap Growth | | | 1.35 | % | | | 1.55 | % | | | 1.10 | % | | | 1.30 | % | | | 1.05 | % | | | 1.25 | % |
| Emerging Markets Leaders | | | 1.24 | % | | | 1.24 | % | | | 0.99 | % | | | 0.99 | % | | | 0.94 | % | | | 0.94 | % |
| Emerging Markets Growth | | | 1.24 | % | | | 1.24 | % | | | 0.99 | % | | | 0.99 | % | | | 0.94 | % | | | 0.94 | % |
| Emerging Markets ex China Growth | | | N/A | | | | N/A | | | | 0.99 | % | | | 0.99 | %1 | | | 0.94 | % | | | 0.94 | %1 |
| Emerging Markets Small Cap Growth | | | 1.40 | % | | | 1.55 | % | | | 1.15 | % | | | 1.30 | % | | | 1.10 | % | | | 1.25 | % |
| China Growth | | | N/A | | | | N/A | | | | 0.99 | % | | | 0.99 | % | | | 0.94 | % | | | 0.94 | % |
| Emerging Markets Debt | | | N/A | | | | N/A | | | | 0.70 | % | | | 0.70 | % | | | 0.65 | % | | | 0.65 | % |
| 1 | Effective July 29, 2022 (Commencement of Operations). |
The fee waivers and/or expense reimbursements received by each class are reported in the Statements of Operations.
The Adviser is entitled to recoupment of previously waived fees and reimbursed expenses for a period of three years subsequent to a Fund’s commencement of operations to the extent that such recoupment does not cause the Fund’s annual operating expenses (after the recoupment is taken into account) to exceed both (1) the expense limit in place when such amounts were waived or reimbursed and (2) the Fund’s current expense limitation. The total amounts available for recoupment as of June 30, 2023 were as follows (in thousands):
| Fund | | Available for
Recoupment | | | | Expiration of
Recoupment |
| Mid Cap Value | | | $153 | | | | March 16, 2025 |
| Emerging Markets ex China Growth | | | 230 | | | | July 29, 2025 |
| China Growth | | | 285 | | | | August 27, 2024 |
| Emerging Markets Debt | | | 501 | | | | May 25, 2024 |
| | | | | | | | |
| June 30, 2023 | William Blair Funds | 117 |
Notes to Financial Statements (information as of June 30, 2023 is unaudited)
(b) Underwriting and Distribution Services Agreements
Pursuant to separate Underwriting and Distribution Agreements, WBC is the principal underwriter and distributor for the continuous offering of shares of the Trust and acts as agent of the Trust in the sale of its shares. The Underwriting Agreement provides that the Distributor will use its best efforts to distribute the Trust’s shares. The Distributor is not compensated under the Underwriting Agreement.
Each Fund, except the Mid Cap Value, Small-Mid Cap Core, Emerging Markets ex China Growth, China Growth, Emerging Markets Debt and Institutional International Growth Funds, has a Distribution Agreement with WBC for distribution services to the Funds’ Class N shares. Each Fund pays WBC an annual fee, payable monthly, based on a specified percentage of its average daily net assets of Class N shares. The annual rate expressed as a percentage of average daily net assets for Class N is 0.25% for all Funds. Pursuant to the Distribution Agreement, WBC enters into related selling group agreements with various firms at various rates for sales of the Funds’ Class N shares.
(5) Investment Transactions
Investment transactions, excluding U.S. government securities and short-term securities, for the period ended June 30, 2023, were as follows (in thousands):
| Fund | | Purchases | | | Sales | |
| Growth | | $ | 37,783 | | | $ | 46,038 | |
| Large Cap Growth | | | 451,731 | | | | 274,013 | |
| Mid Cap Value | | | 220 | | | | 248 | |
| Small-Mid Cap Core | | | 41,236 | | | | 37,904 | |
| Small-Mid Cap Growth | | | 508,714 | | | | 604,343 | |
| Small Cap Growth | | | 250,363 | | | | 180,726 | |
| Small Cap Value | | | 156,939 | | | | 137,195 | |
| Global Leaders | | | 16,324 | | | | 20,396 | |
| International Leaders | | | 234,286 | | | | 227,528 | |
| International Growth | | | 248,689 | | | | 355,932 | |
| Institutional International Growth | | | 154,156 | | | | 275,217 | |
| International Small Cap Growth | | | 31,655 | | | | 49,839 | |
| Emerging Markets Leaders | | | 59,448 | | | | 118,456 | |
| Emerging Markets Growth | | | 233,651 | | | | 217,063 | |
| Emerging Markets ex China Growth | | | 8,955 | | | | 5,043 | |
| Emerging Markets Small Cap Growth | | | 193,384 | | | | 190,705 | |
| China Growth | | | 608 | | | | 946 | |
| Emerging Markets Debt | | | 25,799 | | | | 23,112 | |
| | | | | | | | | | |
(6) Financial Derivative Instruments
Each Fund may use derivative instruments to maintain liquidity, to provide hedging, or in anticipation of changes in the composition of its portfolio holdings or as otherwise provided in each Fund’s prospectus. The derivative instruments held as of June 30, 2023 as disclosed in each Fund’s Portfolios of Investments, are representative of each Fund’s derivative instrument trading activity during the period ended June 30, 2023.
Derivative transactions carry counterparty risk as they are based on contracts between a Fund and the applicable counterparty. For exchange-traded or cleared derivative contracts, such counterparty risk is limited due to the role of the exchange or clearinghouse. OTC derivative contracts, however, are exposed to counterparty risk in the amount of unrealized gains, net of collateral held, for the duration of the contract.
The Emerging Markets Debt Fund is subject to certain netting arrangements through International Swaps and Derivatives Association, Inc. Master Agreements and Credit Support Annexes (“ISDAs”). The ISDAs maintain provisions for general obligations, representations, agreements, collateral and events of default or termination. The ISDAs cover certain OTC derivative securities entered into by the Emerging Markets Debt Fund with various counterparties and allow the Emerging Markets Debt Fund to close out and net its total exposure to a counterparty in the event of a default.
| 118 | Semiannual Report | June 30, 2023 |
Notes to Financial Statements (information as of June 30, 2023 is unaudited)
Forward Foreign Currency Contracts
The Global Equity, International Equity and Emerging Markets Debt Funds may enter into forward foreign currency contracts. When entering into a forward foreign currency contract, a Fund agrees to receive or deliver a fixed quantity of foreign currency for an agreed-upon price on an agreed future date. A Fund’s net equity therein, representing unrealized gain or loss on the contracts as measured by the difference between the forward foreign exchange rates at the dates of entry into the contracts and the forward rates at the reporting date, is included in the Statement of Assets and Liabilities as unrealized appreciation/depreciation on forward foreign currency contracts. Realized and unrealized gains and losses are included in the Statement of Operations. These instruments may involve market risk, credit risk, or both kinds of risks in excess of the amount recognized in the Statement of Assets and Liabilities. Risks arise from the possible inability of counterparties to meet the terms of their contracts and from the price movements in currencies.
Swap Contracts
Swap agreements may include total return, interest rate, securities index, commodity, security, currency exchange rate, credit default index, volatility and variance swaps. Cleared swaps are transacted through futures commission merchants that are members of central clearing houses with the clearing house serving as a central counterparty similar to transactions in futures contracts. In a standard “swap” transaction, two parties agree to exchange the returns (or differentials in rates of return) earned or realized on particular predetermined investments or instruments. The gross returns to be exchanged or “swapped” between the parties are calculated with respect to a “notional amount” (i.e., the change in the value of a particular dollar amount invested, for example, at a particular interest rate, in a particular foreign currency, or in a “basket” of securities representing a particular index). Swap agreements are subject to the risk that the counterparty to the swap will default on its obligation to pay a Fund and the risk that a Fund will not be able to meet its obligations to pay the counterparty to the swap. Swap agreements may also involve fees, commissions or other costs that may reduce a Fund’s gains from a swap agreement or may cause a Fund to lose money. To the extent permitted by its investment policies and restrictions, a Fund may invest in the following types of swaps:
Credit Default Swaps—A Fund may invest in credit default swaps as a means of “buying” credit protection (i.e., attempting to mitigate the risk of default or credit quality deterioration in some portion of a Fund’s holdings) or “selling” credit protection (i.e., attempting to gain exposure to an underlying issuer’s credit quality characteristics without directly investing in that issuer). A credit default swap is a contract between a buyer and a seller of protection against a pre-defined credit event (e.g., a ratings downgrade or default) on an underlying reference obligation, which may be a single debt instrument or baskets or indices of securities. Under current regulatory requirements, a Fund may be a buyer or seller of a credit default swap. As a seller of protection on credit default swap agreements, a Fund will generally receive from the buyer of protection a fixed rate of income throughout the term of the swap provided that there is no credit event. A Fund adds leverage to its portfolio because the Fund is subject to investment exposure on the notional amount of the swap. The maximum potential amount of future payments that a Fund as a seller of protection could be required to make under a credit default swap agreement equals the notional amount of the agreement. Notional amounts of each individual credit default swap agreement outstanding as of the period end for which a Fund is the seller of protection are disclosed in the Fund’s Portfolio of Investments. These potential amounts would be partially offset by any recovery values of the respective referenced obligations, upfront payments received upon entering into the agreement, or net amounts received from the settlement of buy protection credit default swap agreements entered into by the same Fund for the same referenced entity or entities. For credit default swap contracts on credit indices, the quoted market prices and resulting values serve as an indicator of the payment performance risk. Increasing market values, in absolute terms when compared to the notional amount of the swap, typically represent deterioration of the referenced entities’ credit soundness and a greater likelihood or risk of default or other credit event occurring as defined under the terms of the swap.
Interest Rate Swap—A Fund may invest in interest rate swaps to gain or mitigate exposure to changes in interest rates. Interest rate swap agreements involve a commitment between parties to pay either a fixed interest rate or a floating interest rate based on a notional amount of principal. The parties make payments at predetermined intervals throughout the life of the swap. As a payer, a Fund would make the fixed payment and receive the floating payment. As a receiver, a Fund would make the floating payment and receive the fixed payment.
Total Return Swap—A Fund may invest in total return swaps to gain or mitigate exposure to an underlying security, or securities. Total return swap agreements may involve commitments to pay interest in exchange for the return on the underlying security, or securities. At maturity, a net cash flow is exchanged between the parties based on the total return of the underlying security, or securities, less a financing rate. As a receiver in the transaction, a Fund would receive a payment for a positive return and would make a payment for a negative return. As a payer in the transaction, a Fund would make a payment for a positive return and would receive a payment for a negative return.
| June 30, 2023 | William Blair Funds | 119 |
Notes to Financial Statements (information as of June 30, 2023 is unaudited)
The following table presents the value of financial derivative instruments, by Fund and primary risk exposure, as of June 30, 2023, and their respective location in the Statements of Assets and Liabilities (in thousands):
| | | Assets | | | Liabilities | |
Fund and
Primary Risk Exposure | | Statements of Assets
and Liabilities | | Value | | | Statements of Assets
and Liabilities | | Value | |
| Emerging Markets Debt | | | | | | | | | | | | |
| Credit | | Receivable for variation margin on centrally cleared swaps(1) | | | $41 | | | Payable for variation margin on centrally cleared swaps(1) | | | $190 | |
| Currency | | Unrealized appreciation on forward foreign currency contracts | | | — | | | Unrealized depreciation on forward foreign currency contracts) | | | 13 | |
| Interest rate | | Receivable for variation margin on centrally cleared swaps(1) | | | 82 | | | Payable for variation margin on centrally cleared swaps(1) | | | 313 | |
| (1) | The table above includes cumulative appreciation/(depreciation) on centrally cleared swaps as reported in the Fund’s Portfolio of Investments. Receivable/payable for variation margin on centrally cleared swaps as reported in the Fund’s Statement of Assets and Liabilities represents the current day’s variation margin. |
The following table indicates the effect of derivatives, by Fund and primary risk exposure, in the Statements of Operations for the period ended June 30, 2023 (in thousands):
| | | Net Realized Gain (Loss) | | | Change in Net Unrealized
Appreciation (Depreciation) | |
Fund and
Primary Risk Exposure | | Statements of Operations | | Value | | | Statements of Operations | | Value | |
| Emerging Markets Debt | | | | | | | | | | | | |
| Credit | | Swaps | | | $ (6 | ) | | Swaps | | | $(158 | ) |
| Currency | | Forward foreign currency contracts | | | (22 | ) | | Forward foreign currency contracts | | | (7 | ) |
| Interest rate | | Swaps | | | (58 | ) | | Swaps | | | (210 | ) |
The following table is a summary by counterparty of the derivative instruments and collateral pledged/(received) included in the Fund’s Statement of Assets and Liabilities at June 30, 2023 (in thousands):
| | | Financial
Derivative Assets | | | Financial
Derivative Liabilities | | | | | | | | | | |
| Counterparty | | Forward
Foreign
Currency
Contracts | | Total | | Forward
Foreign
Currency
Contracts | | Total | | | Net
Market
Value | | Collateral
Pledged
(Received) | | Net
Exposure |
| Emerging Markets Debt | | | | | | | | | | | | | | | | | | | | | |
| Citibank N.A. | | | $— | | | | $— | | | | $(13) | | | | $(13) | | | | $(13) | | | | $— | | | | $(13) | |
| | | | $— | | | | $— | | | | $(13) | | | | $(13) | | | | | | | | | | | | | |
The net exposure represents the amount due from/(due to) the counterparty in the event of default. Any net exposure is generally due to changes in market value of the underlying derivative instruments on the last day of the period as timing of collateral movement occurs the following day.
| 120 | Semiannual Report | June 30, 2023 |
Notes to Financial Statements (information as of June 30, 2023 is unaudited)
(7) Fund Share Transactions
The following tables summarize the activity in capital shares of each Fund for the period ended June 30, 2023 (in thousands):
| | | | | | | | | | | | | | | Class N |
| | | Dollars | | | Shares |
| Fund | | Sales | | | Reinvest | | | Redemptions | | | Total | | | Sales | | | Reinvest | | | Redemptions | | | Total |
| Growth | | $ | 1,784 | | | $ | — | | | $ | 1,557 | | | $ | 227 | | | | 189 | | | | — | | | | 176 | | | | 13 | |
| Large Cap Growth | | | 9,436 | | | | — | | | | 24,594 | | | | (15,158 | ) | | | 522 | | | | — | | | | 1,343 | | | | (821 | ) |
| Small-Mid Cap Growth | | | 6,058 | | | | — | | | | 13,448 | | | | (7,390 | ) | | | 237 | | | | — | | | | 527 | | | | (290 | ) |
| Small Cap Growth | | | 4,333 | | | | — | | | | 8,507 | | | | (4,174 | ) | | | 168 | | | | — | | | | 336 | | | | (168 | ) |
| Small Cap Value | | | 379 | | | | — | | | | 456 | | | | (77 | ) | | | 14 | | | | — | | | | 16 | | | | (2 | ) |
| Global Leaders | | | 742 | | | | — | | | | 859 | | | | (117 | ) | | | 50 | | | | — | | | | 56 | | | | (6 | ) |
| International Leaders | | | 2,421 | | | | — | | | | 5,260 | | | | (2,839 | ) | | | 130 | | | | — | | | | 282 | | | | (152 | ) |
| International Growth | | | 2,917 | | | | — | | | | 30,173 | | | | (27,256 | ) | | | 108 | | | | — | | | | 1,128 | | | | (1,020 | ) |
| International Small Cap Growth | | | 7 | | | | — | | | | 60 | | | | (53 | ) | | | 1 | | | | — | | | | 6 | | | | (5 | ) |
| Emerging Markets Leaders | | | 586 | | | | — | | | | 704 | | | | (118 | ) | | | 67 | | | | — | | | | 83 | | | | (16 | ) |
| Emerging Markets Growth | | | 5,122 | | | | — | | | | 5,470 | | | | (348 | ) | | | 491 | | | | — | | | | 514 | | | | (23 | ) |
| Emerging Markets Small Cap Growth | | | 443 | | | | — | | | | 371 | | | | 72 | | | | 26 | | | | — | | | | 21 | | | | 5 | |
| | | | | | | | | | | | | | | | | | | | | | | | | | | | | | | | | |
| | | | | | | | | | | | | | | Class I |
| | | Dollars | | | Shares |
| Fund | | Sales | | | Reinvest | | | Redemptions | | | Total | | | Sales | | | Reinvest | | | Redemptions | | | Total |
| Growth | | $ | 2,312 | | | $ | — | | | $ | 7,756 | | | $ | (5,444 | ) | | | 201 | | | | — | | | | 683 | | | | (482 | ) |
| Large Cap Growth | | | 251,622 | | | | — | | | | 103,197 | | | | 148,425 | | | | 12,983 | | | | — | | | | 5,268 | | | | 7,715 | |
| Mid Cap Value | | | — | | | | — | | | | — | | | | — | | | | — | | | | — | | | | — | | | | — | |
| Small-Mid Cap Core | | | 11,372 | | | | — | | | | 8,352 | | | | 3,020 | | | | 783 | | | | — | | | | 588 | | | | 195 | |
| Small-Mid Cap Growth | | | 101,563 | | | | — | | | | 219,560 | | | | (117,997 | ) | | | 3,681 | | | | — | | | | 8,026 | | | | (4,345 | ) |
| Small Cap Growth | | | 96,676 | | | | — | | | | 46,883 | | | | 49,793 | | | | 3,184 | | | | — | | | | 1,547 | | | | 1,637 | |
| Small Cap Value | | | 78,050 | | | | — | | | | 66,473 | | | | 11,577 | | | | 2,727 | | | | — | | | | 2,380 | | | | 347 | |
| Global Leaders | | | 1,165 | | | | — | | | | 4,757 | | | | (3,592 | ) | | | 78 | | | | — | | | | 331 | | | | (253 | ) |
| International Leaders | | | 70,916 | | | | — | | | | 50,777 | | | | 20,139 | | | | 3,790 | | | | — | | | | 2,720 | | | | 1,070 | |
| International Growth | | | 70,205 | | | | — | | | | 107,777 | | | | (37,572 | ) | | | 2,529 | | | | — | | | | 3,899 | | | | (1,370 | ) |
| International Small Cap Growth | | | 4,549 | | | | — | | | | 8,874 | | | | (4,325 | ) | | | 389 | | | | — | | | | 764 | | | | (375 | ) |
| Emerging Markets Leaders | | | 1,910 | | | | — | | | | 13,231 | | | | (11,321 | ) | | | 222 | | | | — | | | | 1,574 | | | | (1,352 | ) |
| Emerging Markets Growth | | | 44,114 | | | | — | | | | 34,781 | | | | 9,333 | | | | 4,022 | | | | — | | | | 3,198 | | | | 824 | |
| Emerging Markets ex China Growth | | | 1,429 | | | | — | | | | 89 | | | | 1,340 | | | | 145 | | | | — | | | | 8 | | | | 137 | |
| Emerging Markets Small Cap Growth | | | 19,295 | | | | — | | | | 16,584 | | | | 2,711 | | | | 1,141 | | | | — | | | | 968 | | | | 173 | |
| China Growth | | | 522 | | | | — | | | | 578 | | | | (56 | ) | | | 88 | | | | — | | | | 99 | | | | (11 | ) |
| Emerging Markets Debt | | | 124 | | | | 32 | | | | 18 | | | | 138 | | | | 16 | | | | 4 | | | | 2 | | | | 18 | |
| June 30, 2023 | William Blair Funds | 121 |
Notes to Financial Statements (information as of June 30, 2023 is unaudited)
| | | | | | | | | | | | | | | | | | | | | Institutional/Class R6 |
| | | Dollars | | | Shares |
| Fund | | Sales | | | Reinvest | | | Redemptions | | | Total | | | Sales | | | Reinvest | | | Redemptions | | | Total |
| Growth | | $ | 1,205 | | | $ | — | | | $ | 1,936 | | | $ | (731 | ) | | | 106 | | | | — | | | | 169 | | | | (63 | ) |
| Large Cap Growth | | | 72,193 | | | | — | | | | 34,459 | | | | 37,734 | | | | 3,641 | | | | — | | | | 1,732 | | | | 1,909 | |
| Mid Cap Value | | | 73 | | | | — | | | | 52 | | | | 21 | | | | 7 | | | | — | | | | 5 | | | | 2 | |
| Small-Mid Cap Core | | | 5,773 | | | | — | | | | 7,332 | | | | (1,559 | ) | | | 405 | | | | — | | | | 512 | | | | (107 | ) |
| Small-Mid Cap Growth | | | 28,702 | | | | — | | | | 27,546 | | | | 1,156 | | | | 1,039 | | | | — | | | | 984 | | | | 55 | |
| Small Cap Growth | | | 34,054 | | | | — | | | | 11,153 | | | | 22,901 | | | | 1,118 | | | | — | | | | 367 | | | | 751 | |
| Small Cap Value | | | 29,812 | | | | — | | | | 27,943 | | | | 1,869 | | | | 1,029 | | | | — | | | | 993 | | | | 36 | |
| Global Leaders | | | 1,125 | | | | — | | | | 904 | | | | 221 | | | | 77 | | | | — | | | | 62 | | | | 15 | |
| International Leaders | | | 21,998 | | | | — | | | | 21,195 | | | | 803 | | | | 1,161 | | | | — | | | | 1,117 | | | | 44 | |
| International Growth | | | 3,430 | | | | — | | | | 10,846 | | | | (7,416 | ) | | | 127 | | | | — | | | | 390 | | | | (263 | ) |
| Institutional International Growth | | | 17,941 | | | | — | | | | 115,684 | | | | (97,743 | ) | | | 1,274 | | | | — | | | | 8,556 | | | | (7,282 | ) |
| International Small Cap Growth | | | 1,091 | | | | — | | | | 16,704 | | | | (15,613 | ) | | | 94 | | | | — | | | | 1,424 | | | | (1,330 | ) |
| Emerging Markets Leaders | | | 12,701 | | | | — | | | | 67,914 | | | | (55,213 | ) | | | 1,480 | | | | — | | | | 7,979 | | | | (6,499 | ) |
| Emerging Markets Growth | | | 80,879 | | | | — | | | | 71,954 | | | | 8,925 | | | | 7,154 | | | | — | | | | 6,403 | | | | 751 | |
| Emerging Markets ex China Growth | | | 2,691 | | | | — | | | | 24 | | | | 2,667 | | | | 272 | | | | — | | | | 3 | | | | 269 | |
| Emerging Markets Small Cap Growth | | | 13,826 | | | | — | | | | 14,917 | | | | (1,091 | ) | | | 791 | | | | — | | | | 882 | | | | (91 | ) |
| China Growth | | | 15 | | | | — | | | | 287 | | | | (272 | ) | | | 2 | | | | — | | | | 48 | | | | (46 | ) |
| Emerging Markets Debt | | | 72 | | | | 1,520 | | | | 219 | | | | 1,373 | | | | 8 | | | | 203 | | | | 29 | | | | 182 | |
| | | | | | | | | | | | |
| | | | | | | | | | | | Net Change in Net Assets Relating to Fund Share Activity |
| | | | | | | | | | | | | | | | Dollars | | | | | | | | | | | | | | | | Shares |
| Fund | | Sales | | | Reinvest | | | Redemptions | | | | Total | | | | Sales | | | | Reinvest | | | | Redemptions | | | | Total |
| Growth | | $ | 5,301 | | | $ | — | | | $ | 11,249 | | | $ | (5,948 | ) | | | 496 | | | | — | | | | 1,028 | | | | (532 | ) |
| Large Cap Growth | | | 333,251 | | | | — | | | | 162,250 | | | | 171,001 | | | | 17,146 | | | | — | | | | 8,343 | | | | 8,803 | |
| Mid Cap Value | | | 73 | | | | — | | | | 52 | | | | 21 | | | | 7 | | | | — | | | | 5 | | | | 2 | |
| Small-Mid Cap Core | | | 17,145 | | | | — | | | | 15,684 | | | | 1,461 | | | | 1,188 | | | | — | | | | 1,100 | | | | 88 | |
| Small-Mid Cap Growth | | | 136,323 | | | | — | | | | 260,554 | | | | (124,231 | ) | | | 4,957 | | | | — | | | | 9,537 | | | | (4,580 | ) |
| Small Cap Growth | | | 135,063 | | | | — | | | | 66,543 | | | | 68,520 | | | | 4,470 | | | | — | | | | 2,250 | | | | 2,220 | |
| Small Cap Value | | | 108,241 | | | | — | | | | 94,872 | | | | 13,369 | | | | 3,770 | | | | — | | | | 3,389 | | | | 381 | |
| Global Leaders | | | 3,032 | | | | — | | | | 6,520 | | | | (3,488 | ) | | | 205 | | | | — | | | | 449 | | | | (244 | ) |
| International Leaders | | | 95,335 | | | | — | | | | 77,232 | | | | 18,103 | | | | 5,081 | | | | — | | | | 4,119 | | | | 962 | |
| International Growth | | | 76,552 | | | | — | | | | 148,796 | | | | (72,244 | ) | | | 2,764 | | | | — | | | | 5,417 | | | | (2,653 | ) |
| Institutional International Growth | | | 17,941 | | | | — | | | | 115,684 | | | | (97,743 | ) | | | 1,274 | | | | — | | | | 8,556 | | | | (7,282 | ) |
| International Small Cap Growth | | | 5,647 | | | | — | | | | 25,638 | | | | (19,991 | ) | | | 484 | | | | — | | | | 2,194 | | | | (1,710 | ) |
| Emerging Markets Leaders | | | 15,197 | | | | — | | | | 81,849 | | | | (66,652 | ) | | | 1,769 | | | | — | | | | 9,636 | | | | (7,867 | ) |
| Emerging Markets Growth | | | 130,115 | | | | — | | | | 112,205 | | | | 17,910 | | | | 11,667 | | | | — | | | | 10,115 | | | | 1,552 | |
| Emerging Markets ex China Growth | | | 4,120 | | | | — | | | | 113 | | | | 4,007 | | | | 417 | | | | — | | | | 11 | | | | 406 | |
| Emerging Markets Small Cap Growth | | | 33,564 | | | | — | | | | 31,872 | | | | 1,692 | | | | 1,958 | | | | — | | | | 1,871 | | | | 87 | |
| China Growth | | | 537 | | | | — | | | | 865 | | | | (328 | ) | | | 90 | | | | — | | | | 147 | | | | (57 | ) |
| Emerging Markets Debt | | | 196 | | | | 1,552 | | | | 237 | | | | 1,511 | | | | 24 | | | | 207 | | | | 31 | | | | 200 | |
| 122 | Semiannual Report | June 30, 2023 |
Notes to Financial Statements (information as of June 30, 2023 is unaudited)
The following tables summarize the activity in capital shares of each Fund for the year ended December 31, 2022 (in thousands):
| | | | | | | | | | | | | | | | | | | | | | | | Class N |
| | | Dollars | | | Shares |
| Fund | | Sales | | | Reinvest | | | Redemptions | | | Total | | | Sales | | | Reinvest | | | Redemptions | | | Total |
| Growth | | $ | 3,300 | | | $ | 1,034 | | | $ | 5,457 | | | $ | (1,123 | ) | | | 306 | | | | 128 | | | | 551 | | | | (117 | ) |
| Large Cap Growth | | | 66,244 | | | | 986 | | | | 69,880 | | | | (2,650 | ) | | | 3,478 | | | | 59 | | | | 3,754 | | | | (217 | ) |
| Small-Mid Cap Growth | | | 16,581 | | | | 3,843 | | | | 88,421 | | | | (67,997 | ) | | | 628 | | | | 158 | | | | 3,380 | | | | (2,594 | ) |
| Small Cap Growth | | | 27,063 | | | | 4,597 | | | | 53,914 | | | | (22,254 | ) | | | 973 | | | | 190 | | | | 2,036 | | | | (873 | ) |
| Small Cap Value | | | 438 | | | | 182 | | | | 729 | | | | (109 | ) | | | 13 | | | | 7 | | | | 24 | | | | (4 | ) |
| Global Leaders | | | 224 | | | | 165 | | | | 1,635 | | | | (1,246 | ) | | | 14 | | | | 12 | | | | 113 | | | | (87 | ) |
| International Leaders | | | 18,462 | | | | 68 | | | | 15,537 | | | | 2,993 | | | | 960 | | | | 4 | | | | 827 | | | | 137 | |
| International Growth | | | 156,713 | | | | 22,957 | | | | 61,189 | | | | 118,481 | | | | 5,684 | | | | 905 | | | | 2,302 | | | | 4,287 | |
| International Small Cap Growth | | | 29 | | | | — | | | | 761 | | | | (732 | ) | | | 3 | | | | — | | | | 64 | | | | (61 | ) |
| Emerging Markets Leaders | | | 3,090 | | | | 9 | | | | 3,673 | | | | (574 | ) | | | 317 | | | | 1 | | | | 371 | | | | (53 | ) |
| Emerging Markets Growth | | | 10,620 | | | | 20 | | | | 15,860 | | | | (5,220 | ) | | | 873 | | | | 2 | | | | 1,296 | | | | (421 | ) |
| Emerging Markets Small Cap Growth | | | 584 | | | | 145 | | | | 521 | | | | 208 | | | | 27 | | | | 9 | | | | 27 | | | | 9 | |
| | | | | | | | | | | | | | | | | | | | | | | | | | | | | | | | | |
| | | | | | | | | | | | | | | | | | | | | | | | | | | | | | | | Class I |
| | | | | | | | | | | | | | | | Dollars | | | | | | | | | | | | | | | | Shares |
| Fund | | Sales | | | Reinvest | | | Redemptions | | | Total | | | | Sales | | | | Reinvest | | | | Redemptions | | | | Total |
| Growth | | $ | 11,551 | | | $ | 4,580 | | | $ | 86,472 | | | $ | (70,341 | ) | | | 938 | | | | 443 | | | | 7,693 | | | | (6,312 | ) |
| Large Cap Growth | | | 606,323 | | | | 5,568 | | | | 281,678 | | | | 330,213 | | | | 28,937 | | | | 313 | | | | 14,763 | | | | 14,487 | |
| Mid Cap Value(a) | | | 108 | | | | 1 | | | | 32 | | | | 77 | | | | 11 | | | | — | | | | 3 | | | | 8 | |
| Small-Mid Cap Core | | | 71,963 | | | | — | | | | 27,550 | | | | 44,413 | | | | 4,695 | | | | — | | | | 1,985 | | | | 2,710 | |
| Small-Mid Cap Growth | | | 280,513 | | | | 48,171 | | | | 693,533 | | | | (364,849 | ) | | | 9,846 | | | | 1,832 | | | | 25,066 | | | | (13,388 | ) |
| Small Cap Growth | | | 79,330 | | | | 10,263 | | | | 90,795 | | | | (1,202 | ) | | | 2,593 | | | | 357 | | | | 3,045 | | | | (95 | ) |
| Small Cap Value | | | 109,607 | | | | 53,312 | | | | 295,065 | | | | (132,146 | ) | | | 3,575 | | | | 1,928 | | | | 9,693 | | | | (4,190 | ) |
| Global Leaders | | | 4,757 | | | | 1,493 | | | | 22,285 | | | | (16,035 | ) | | | 315 | | | | 110 | | | | 1,638 | | | | (1,213 | ) |
| International Leaders | | | 230,076 | | | | 617 | | | | 286,493 | | | | (55,800 | ) | | | 12,574 | | | | 35 | | | | 15,639 | | | | (3,030 | ) |
| International Growth | | | 293,273 | | | | 71,737 | | | | 528,810 | | | | (163,800 | ) | | | 10,345 | | | | 2,738 | | | | 18,956 | | | | (5,873 | ) |
| International Small Cap Growth | | | 40,252 | | | | 182 | | | | 30,096 | | | | 10,338 | | | | 3,553 | | | | 16 | | | | 2,676 | | | | 893 | |
| Emerging Markets Leaders | | | 26,985 | | | | 283 | | | | 27,281 | | | | (13 | ) | | | 2,914 | | | | 34 | | | | 3,152 | | | | (204 | ) |
| Emerging Markets Growth | | | 190,957 | | | | 269 | | | | 130,228 | | | | 60,998 | | | | 15,421 | | | | 25 | | | | 10,961 | | | | 4,485 | |
| Emerging Markets ex China Growth (b) | | | 10 | | | | — | | | | — | | | | 10 | | | | 1 | | | | — | | | | — | | | | 1 | |
| Emerging Markets Small Cap Growth | | | 44,207 | | | | 4,873 | | | | 59,722 | | | | (10,642 | ) | | | 2,315 | | | | 292 | | | | 3,214 | | | | (607 | ) |
| China Growth | | | 12 | | | | — | | | | 3,449 | | | | (3,437 | ) | | | 2 | | | | — | | | | 503 | | | | (501 | ) |
| Emerging Markets Debt | | | 415 | | | | 74 | | | | 708 | | | | (219 | ) | | | 49 | | | | 9 | | | | 89 | | | | (31 | ) |
| (a) | For the period from March 16, 2022 (Commencement of Operations) to December 31, 2022. |
| (b) | For the period from July 29, 2022 (Commencement of Operations) to December 31, 2022. |
| June 30, 2023 | William Blair Funds | 123 |
Notes to Financial Statements (information as of June 30, 2023 is unaudited)
| | | | | | | | | | | | | | | | | | | | | Institutional/Class R6 |
| | | Dollars | | | | | | | | Shares |
| Fund | | Sales | | | Reinvest | | | Redemptions | | | Total | | | Sales | | | Reinvest | | | Redemptions | | | Total |
| Growth | | $ | 21,865 | | | $ | 1,050 | | | $ | 3,850 | | | $ | 19,065 | | | | 2,107 | | | | 101 | | | | 352 | | | | 1,856 | |
| Large Cap Growth | | | 136,096 | | | | 1,909 | | | | 47,467 | | | | 90,538 | | | | 6,978 | | | | 107 | | | | 2,430 | | | | 4,655 | |
| Mid Cap Value (a) | | | 1,553 | | | | 15 | | | | 1 | | | | 1,567 | | | | 154 | | | | 2 | | | | — | | | | 156 | |
| Small-Mid Cap Core | | | 37,092 | | | | — | | | | 6,100 | | | | 30,992 | | | | 2,713 | | | | — | | | | 445 | | | | 2,268 | |
| Small-Mid Cap Growth | | | 212,256 | | | | 12,737 | | | | 80,061 | | | | 144,932 | | | | 8,130 | | | | 483 | | | | 2,950 | | | | 5,663 | |
| Small Cap Growth | | | 30,980 | | | | 3,659 | | | | 18,653 | | | | 15,986 | | | | 1,018 | | | | 127 | | | | 604 | | | | 541 | |
| Small Cap Value | | | 119,683 | | | | 33,263 | | | | 627,183 | | | | (474,237 | ) | | | 3,861 | | | | 1,203 | | | | 18,688 | | | | (13,624 | ) |
| Global Leaders | | | 9,906 | | | | 296 | | | | 1,407 | | | | 8,795 | | | | 782 | | | | 22 | | | | 100 | | | | 704 | |
| International Leaders | | | 206,838 | | | | 1,129 | | | | 54,743 | | | | 153,224 | | | | 9,990 | | | | 63 | | | | 3,031 | | | | 7,022 | |
| International Growth | | | 89,936 | | | | 9,603 | | | | 36,161 | | | | 63,378 | | | | 3,526 | | | | 366 | | | | 1,288 | | | | 2,604 | |
| Institutional International Growth | | | 142,332 | | | | 56,157 | | | | 156,966 | | | | 41,523 | | | | 10,211 | | | | 4,307 | | | | 10,970 | | | | 3,548 | |
| International Small Cap Growth | | | 3,475 | | | | 331 | | | | 28,031 | | | | (24,225 | ) | | | 295 | | | | 30 | | | | 2,414 | | | | (2,089 | ) |
| Emerging Markets Leaders | | | 70,039 | | | | 3,109 | | | | 63,904 | | | | 9,244 | | | | 7,781 | | | | 374 | | | | 7,384 | | | | 771 | |
| Emerging Markets Growth | | | 112,007 | | | | 667 | | | | 203,283 | | | | (90,609 | ) | | | 9,621 | | | | 62 | | | | 16,080 | | | | (6,397 | ) |
| Emerging Markets ex China Growth (b) | | | 19,580 | | | | — | | | | 5,597 | | | | 13,983 | | | | 1,970 | | | | — | | | | 587 | | | | 1,383 | |
| Emerging Markets Small Cap Growth | | | 76,818 | | | | 9,965 | | | | 102,458 | | | | (15,675 | ) | | | 4,023 | | | | 595 | | | | 5,344 | | | | (726 | ) |
| China Growth | | | 408 | | | | 1 | | | | 127 | | | | 282 | | | | 64 | | | | — | | | | 18 | | | | 46 | |
| Emerging Markets Debt | | | 3,932 | | | | 3,077 | | | | 382 | | | | 6,627 | | | | 473 | | | | 398 | | | | 49 | | | | 822 | |
| | | | | | | | | | | | | | | | | | | | | | | | | | | | | | | | | |
| | | | | | | | | | | | Net Change in Net Assets Relating to Fund Share Activity |
| | | | | | | | | | | | Dollars | | | | | | | | | | | | Shares |
| Fund | | Sales | | | Reinvest | | | Redemptions | | | Total | | | Sales | | | Reinvest | | | Redemptions | | | Total |
| Growth | | $ | 36,716 | | | $ | 6,664 | | | $ | 95,779 | | | $ | (52,399 | ) | | | 3,351 | | | | 672 | | | | 8,596 | | | | (4,573 | ) |
| Large Cap Growth | | | 808,663 | | | | 8,463 | | | | 399,025 | | | | 418,101 | | | | 39,393 | | | | 479 | | | | 20,947 | | | | 18,925 | |
| Mid Cap Value (a) | | | 1,661 | | | | 16 | | | | 33 | | | | 1,644 | | | | 165 | | | | 2 | | | | 3 | | | | 164 | |
| Small-Mid Cap Core | | | 109,055 | | | | — | | | | 33,650 | | | | 75,405 | | | | 7,408 | | | | — | | | | 2,430 | | | | 4,978 | |
| Small-Mid Cap Growth | | | 509,350 | | | | 64,751 | | | | 862,015 | | | | (287,914 | ) | | | 18,604 | | | | 2,473 | | | | 31,396 | | | | (10,319 | ) |
| Small Cap Growth | | | 137,373 | | | | 18,519 | | | | 163,362 | | | | (7,470 | ) | | | 4,584 | | | | 674 | | | | 5,685 | | | | (427 | ) |
| Small Cap Value | | | 229,728 | | | | 86,757 | | | | 922,977 | | | | (606,492 | ) | | | 7,449 | | | | 3,138 | | | | 28,405 | | | | (17,818 | ) |
| Global Leaders | | | 14,887 | | | | 1,954 | | | | 25,327 | | | | (8,486 | ) | | | 1,111 | | | | 144 | | | | 1,851 | | | | (596 | ) |
| International Leaders | | | 455,376 | | | | 1,814 | | | | 356,773 | | | | 100,417 | | | | 23,524 | | | | 102 | | | | 19,497 | | | | 4,129 | |
| International Growth | | | 539,922 | | | | 104,297 | | | | 626,160 | | | | 18,059 | | | | 19,555 | | | | 4,009 | | | | 22,546 | | | | 1,018 | |
| Institutional International Growth | | | 142,332 | | | | 56,157 | | | | 156,966 | | | | 41,523 | | | | 10,211 | | | | 4,307 | | | | 10,970 | | | | 3,548 | |
| International Small Cap Growth | | | 43,756 | | | | 513 | | | | 58,888 | | | | (14,619 | ) | | | 3,851 | | | | 46 | | | | 5,154 | | | | (1,257 | ) |
| Emerging Markets Leaders | | | 100,114 | | | | 3,401 | | | | 94,858 | | | | 8,657 | | | | 11,012 | | | | 409 | | | | 10,907 | | | | 514 | |
| Emerging Markets Growth | | | 313,584 | | | | 956 | | | | 349,371 | | | | (34,831 | ) | | | 25,915 | | | | 89 | | | | 28,337 | | | | (2,333 | ) |
| Emerging Markets ex China Growth (b) | | | 19,590 | | | | — | | | | 5,597 | | | | 13,993 | | | | 1,971 | | | | — | | | | 587 | | | | 1,384 | |
| Emerging Markets Small Cap Growth | | | 121,609 | | | | 14,983 | | | | 162,701 | | | | (26,109 | ) | | | 6,365 | | | | 896 | | | | 8,585 | | | | (1,324 | ) |
| China Growth | | | 420 | | | | 1 | | | | 3,576 | | | | (3,155 | ) | | | 66 | | | | — | | | | 521 | | | | (455 | ) |
| Emerging Markets Debt | | | 4,347 | | | | 3,151 | | | | 1,090 | | | | 6,408 | | | | 522 | | | | 407 | | | | 138 | | | | 791 | |
| (a) | For the period from March 16, 2022 (Commencement of Operations) to December 31, 2022. |
| (b) | For the period from July 29, 2022 (Commencement of Operations) to December 31, 2022. |
(8) Subsequent Events
The Funds have evaluated subsequent events through the date of issuance of the Funds’ financial statements and have determined there is no impact to the Funds’ financial statements.
| 124 | Semiannual Report | June 30, 2023 |
Financial Highlights — For a share outstanding throughout each period
Growth Fund
| | | Class N | |
| | | (unaudited)
Period Ended
June 30, | | | Years Ended December 31, | |
| | | | 2023 | | | 2022 | | | 2021 | | | 2020 | | | 2019 | | | 2018 | |
| Net asset value, beginning of year | | | $ | 7.95 | | | $ | 11.81 | | | $ | 11.15 | | | $ | 9.45 | | | $ | 7.91 | | | $ | 10.27 | |
| Income (loss) from investment operations: | | | | | | | | | | | | | | | | | | | | | | | | | |
| Net investment income (loss) | | | | (0.01 | ) | | | (0.05 | ) | | | (0.08 | ) | | | (0.05 | ) | | | (0.03 | ) | | | (0.04 | ) |
| Net realized and unrealized gain (loss) on investments | | | | 2.06 | | | | (3.44 | ) | | | 2.49 | | | | 3.43 | | | | 2.54 | | | | 0.75 | |
| Total from investment operations | | | | 2.05 | | | | (3.49 | ) | | | 2.41 | | | | 3.38 | | | | 2.51 | | | | 0.71 | |
| Less distributions from: | | | | | | | | | | | | | | | | | | | | | | | | | |
| Net investment income | | | | — | | | | — | | | | — | | | | — | | | | — | | | | — | |
| Net realized gain | | | | — | | | | 0.37 | | | | 1.75 | | | | 1.68 | | | | 0.97 | | | | 3.07 | |
| Total distributions | | | | — | | | | 0.37 | | | | 1.75 | | | | 1.68 | | | | 0.97 | | | | 3.07 | |
| Net asset value, end of year | | | $ | 10.00 | | | $ | 7.95 | | | $ | 11.81 | | | $ | 11.15 | | | $ | 9.45 | | | $ | 7.91 | |
| Total return (%)* | | | | 25.79 | | | | (29.65 | ) | | | 22.09 | | | | 35.97 | | | | 31.97 | | | | 5.10 | |
| Ratios to average daily net assets (%)**: | | | | | | | | | | | | | | | | | | | | | | | | | |
| Expenses, before waivers and reimbursements | | | | 1.25 | | | | 1.24 | | | | 1.21 | | | | 1.26 | | | | 1.24 | | | | 1.22 | |
| Expenses, net of waivers and reimbursements | | | | 1.20 | | | | 1.20 | | | | 1.20 | | | | 1.20 | | | | 1.20 | | | | 1.20 | |
| Net investment income (loss), before waivers and reimbursements | | | | (0.35 | ) | | | (0.60 | ) | | | (0.67 | ) | | | (0.55 | ) | | | (0.35 | ) | | | (0.36 | ) |
| Net investment income (loss), net of waivers and reimbursements | | | | (0.30 | ) | | | (0.56 | ) | | | (0.66 | ) | | | (0.49 | ) | | | (0.31 | ) | | | (0.34 | ) |
| Class N net assets at the end of the year (in thousands) | | | $ | 30,139 | | | $ | 23,829 | | | $ | 36,807 | | | $ | 35,494 | | | $ | 32,710 | | | $ | 38,370 | |
| Portfolio turnover rate (%)* | | | | 18 | | | | 41 | | | | 30 | | | | 46 | | | | 39 | | | | 46 | |
| | | | | | | | | | | | | | | | | | | | | | | | | | |
| | | Class I | |
| | | (unaudited)
Period Ended
June 30, | | | Years Ended December 31, | |
| | | | 2023 | | | 2022 | | | 2021 | | | 2020 | | | 2019 | | | 2018 | |
| Net asset value, beginning of year | | | $ | 10.15 | | | $ | 14.91 | | | $ | 13.64 | | | $ | 11.25 | | | $ | 9.25 | | | $ | 11.51 | |
| Income (loss) from investment operations: | | | | | | | | | | | | | | | | | | | | | | | | | |
| Net investment income (loss) | | | | (0.00) | ^ | | | (0.04 | ) | | | (0.05 | ) | | | (0.03 | ) | | | (0.00 | )^ | | | (0.01 | ) |
| Net realized and unrealized gain (loss) on investments | | | | 2.65 | | | | (4.35 | ) | | | 3.07 | | | | 4.10 | | | | 2.97 | | | | 0.82 | |
| Total from investment operations | | | | 2.65 | | | | (4.39 | ) | | | 3.02 | | | | 4.07 | | | | 2.97 | | | | 0.81 | |
| Less distributions from: | | | | | | | | | | | | | | | | | | | | | | | | | |
| Net investment income | | | | — | | | | — | | | | — | | | | — | | | | — | | | | 0.00 | ^ |
| Net realized gain | | | | — | | | | 0.37 | | | | 1.75 | | | | 1.68 | | | | 0.97 | | | | 3.07 | |
| Total distributions | | | | — | | | | 0.37 | | | | 1.75 | | | | 1.68 | | | | 0.97 | | | | 3.07 | |
| Net asset value, end of year | | | $ | 12.80 | | | $ | 10.15 | | | $ | 14.91 | | | $ | 13.64 | | | $ | 11.25 | | | $ | 9.25 | |
| Total return (%)* | | | | 26.11 | | | | (29.52 | ) | | | 22.54 | | | | 36.35 | | | | 32.32 | | | | 5.42 | |
| Ratios to average daily net assets (%)**: | | | | | | | | | | | | | | | | | | | | | | | | | |
| Expenses | | | | 0.93 | | | | 0.92 | | | | 0.89 | | | | 0.93 | | | | 0.92 | | | | 0.91 | |
| Net investment income (loss) | | | | (0.02 | ) | | | (0.29 | ) | | | (0.35 | ) | | | (0.23 | ) | | | (0.03 | ) | | | (0.06 | ) |
| Class I net assets at the end of the year (in thousands) | | | $ | 165,355 | | | $ | 136,051 | | | $ | 293,900 | | | $ | 249,716 | | | $ | 220,660 | | | $ | 187,306 | |
| Portfolio turnover rate (%)* | | | | 18 | | | | 41 | | | | 30 | | | | 46 | | | | 39 | | | | 46 | |
| * | Rates are not annualized for periods less than a year. |
| ** | Rates are annualized for periods less than a year. |
| ^ | Amount is less than $0.005 per share. |
Note: Net investment income (loss) per share is based on the average shares outstanding during the year.
Performance cited represents past performance. Past performance does not guarantee future results and current performance may be lower or higher than the data quoted. Results shown are annual returns, which assume reinvestment of dividends and capital gains. Investment returns and principal will fluctuate and you may have a gain or loss when you sell shares. For the most current month-end performance information, please call 1-800-742-7272 or visit our Web site at www.williamblairfunds.com.
| June 30, 2023 | William Blair Funds | 125 |
Financial Highlights — For a share outstanding throughout each period
Growth Fund
| | | Class R6 | |
| | | (unaudited)
Period Ended
June 30, | | | Years Ended December 31, | |
| | | | 2023 | | | 2022 | | | 2021 | | | 2020 | | | 2019(a) | |
| Net asset value, beginning of year | | | $ | 10.19 | | | $ | 14.95 | | | $ | 13.67 | | | $ | 11.26 | | | $ | 11.06 | |
| Income (loss) from investment operations: | | | | | | | | | | | | | | | | | | | | | |
| Net investment income (loss) | | | | 0.00 | ^ | | | (0.02 | ) | | | (0.04 | ) | | | (0.03 | ) | | | (0.00 | )^ |
| Net realized and unrealized gain (loss) on investments | | | | 2.66 | | | | (4.37 | ) | | | 3.07 | | | | 4.12 | | | | 1.17 | |
| Total from investment operations | | | | 2.66 | | | | (4.39 | ) | | | 3.03 | | | | 4.09 | | | | 1.17 | |
| Less distributions from: | | | | | | | | | | | | | | | | | | | | | |
| Net investment income | | | | — | | | | — | | | | — | | | | — | | | | — | |
| Net realized gain | | | | — | | | | 0.37 | | | | 1.75 | | | | 1.68 | | | | 0.97 | |
| Total distributions | | | | — | | | | 0.37 | | | | 1.75 | | | | 1.68 | | | | 0.97 | |
| Net asset value, end of year | | | $ | 12.85 | | | $ | 10.19 | | | $ | 14.95 | | | $ | 13.67 | | | $ | 11.26 | |
| Total return (%)* | | | | 26.10 | | | | (29.44 | ) | | | 22.55 | | | | 36.50 | | | | 10.75 | |
| Ratios to average daily net assets (%)**: | | | | | | | | | | | | | | | | | | | | | |
| Expenses | | | | 0.88 | | | | 0.87 | | | | 0.84 | | | | 0.87 | | | | 0.88 | |
| Net investment income (loss) | | | | 0.02 | | | | (0.18 | ) | | | (0.29 | ) | | | (0.23 | ) | | | (0.06 | ) |
| Class R6 net assets at the end of the year (in thousands) | | | $ | 35,920 | | | $ | 29,128 | | | $ | 14,993 | | | $ | 12,041 | | | $ | 217 | |
| Portfolio turnover rate (%)* | | | | 18 | | | | 41 | | | | 30 | | | | 46 | | | | 39 | |
| (a) | For the period from May 2, 2019 (Commencement of Operations) to December 31, 2019. |
| * | Rates are not annualized for periods less than a year. |
| ** | Rates are annualized for periods less than a year. |
| ^ | Amount is less than $0.005 per share. |
Note: Net investment income (loss) per share is based on the average shares outstanding during the year.
Performance cited represents past performance. Past performance does not guarantee future results and current performance may be lower or higher than the data quoted. Results shown are annual returns, which assume reinvestment of dividends and capital gains. Investment returns and principal will fluctuate and you may have a gain or loss when you sell shares. For the most current month-end performance information, please call 1-800-742-7272 or visit our Web site at www.williamblairfunds.com.
| 126 | Semiannual Report | June 30, 2023 |
Financial Highlights — For a share outstanding throughout each period
Large Cap Growth Fund
| | | Class N | |
| | | (unaudited)
Period Ended
June 30, | | | Years Ended December 31, | |
| | | | 2023 | | | 2022 | | | 2021 | | | 2020 | | | 2019 | | | 2018 | |
| Net asset value, beginning of year | | | $ | 16.38 | | | $ | 24.49 | | | $ | 20.03 | | | $ | 15.27 | | | $ | 11.99 | | | $ | 13.35 | |
| Income (loss) from investment operations: | | | | | | | | | | | | | | | | | | | | | | | | | |
| Net investment income (loss) | | | | (0.00 | )^ | | | (0.03 | ) | | | (0.07 | ) | | | 0.01 | | | | 0.00 | ^ | | | (0.02 | ) |
| Net realized and unrealized gain (loss) on investments | | | | 4.09 | | | | (7.96 | ) | | | 5.65 | | | | 5.52 | | | | 4.29 | | | | 0.81 | |
| Total from investment operations | | | | 4.09 | | | | (7.99 | ) | | | 5.58 | | | | 5.53 | | | | 4.29 | | | | 0.79 | |
| Less distributions from: | | | | | | | | | | | | | | | | | | | | | | | | | |
| Net investment income | | | | — | | | | — | | | | — | | | | 0.00 | ^ | | | 0.01 | | | | — | |
| Net realized gain | | | | — | | | | 0.12 | | | | 1.12 | | | | 0.77 | | | | 1.00 | | | | 2.15 | |
| Total distributions | | | | — | | | | 0.12 | | | | 1.12 | | | | 0.77 | | | | 1.01 | | | | 2.15 | |
| Net asset value, end of year | | | $ | 20.47 | | | $ | 16.38 | | | $ | 24.49 | | | $ | 20.03 | | | $ | 15.27 | | | $ | 11.99 | |
| Total return (%)* | | | | 24.97 | | | | (32.61 | ) | | | 28.03 | | | | 36.30 | | | | 36.00 | | | | 4.96 | |
| Ratios to average daily net assets (%)**: | | | | | | | | | | | | | | | | | | | | | | | | | |
| Expenses, before waivers and reimbursements | | | | 1.01 | | | | 1.03 | | | | 1.05 | | | | 1.09 | | | | 1.12 | | | | 1.21 | |
| Expenses, net of waivers and reimbursements | | | | 0.90 | | | | 0.90 | | | | 0.90 | | | | 0.90 | | | | 0.95 | | | | 1.05 | |
| Net investment income (loss), before waivers and reimbursements | | | | (0.17 | ) | | | (0.28 | ) | | | (0.46 | ) | | | (0.15 | ) | | | (0.14 | ) | | | (0.33 | ) |
| Net investment income (loss), net of waivers and reimbursements | | | | (0.06 | ) | | | (0.15 | ) | | | (0.31 | ) | | | 0.04 | | | | 0.03 | | | | (0.17 | ) |
| Class N net assets at the end of the year (in thousands) | | | $ | 148,508 | | | $ | 132,225 | | | $ | 203,014 | | | $ | 138,152 | | | $ | 65,314 | | | $ | 41,361 | |
| Portfolio turnover rate (%)* | | | | 21 | | | | 29 | | | | 26 | | | | 35 | | | | 37 | | | | 47 | |
| | | | | | | | | | | | | | | | | | | | | | | | | | |
| | | Class I | |
| | | (unaudited)
Period Ended
June 30, | | | Years Ended December 31, | |
| | | | 2023 | | | 2022 | | | 2021 | | | 2020 | | | 2019 | | | 2018 | |
| Net asset value, beginning of year | | | $ | 17.54 | | | $ | 26.18 | | | $ | 21.29 | | | $ | 16.19 | | | $ | 12.66 | | | $ | 13.97 | |
| Income (loss) from investment operations: | | | | | | | | | | | | | | | | | | | | | | | | | |
| Net investment income (loss) | | | | 0.02 | | | | 0.03 | | | | (0.02 | ) | | | 0.06 | | | | 0.04 | | | | 0.01 | |
| Net realized and unrealized gain (loss) on investments | | | | 4.40 | | | | (8.53 | ) | | | 6.03 | | | | 5.85 | | | | 4.54 | | | | 0.85 | |
| Total from investment operations | | | | 4.42 | | | | (8.50 | ) | | | 6.01 | | | | 5.91 | | | | 4.58 | | | | 0.86 | |
| Less distributions from: | | | | | | | | | | | | | | | | | | | | | | | | | |
| Net investment income | | | | — | | | | 0.02 | | | | — | | | | 0.04 | | | | 0.05 | | | | 0.02 | |
| Net realized gain | | | | — | | | | 0.12 | | | | 1.12 | | | | 0.77 | | | | 1.00 | | | | 2.15 | |
| Total distributions | | | | — | | | | 0.14 | | | | 1.12 | | | | 0.81 | | | | 1.05 | | | | 2.17 | |
| Net asset value, end of year | | | $ | 21.96 | | | $ | 17.54 | | | $ | 26.18 | | | $ | 21.29 | | | $ | 16.19 | | | $ | 12.66 | |
| Total return (%)* | | | | 25.20 | | | | (32.46 | ) | | | 28.39 | | | | 36.59 | | | | 36.35 | | | | 5.21 | |
| Ratios to average daily net assets (%)**: | | | | | | | | | | | | | | | | | | | | | | | | | |
| Expenses, before waivers and reimbursements | | | | 0.77 | | | | 0.79 | | | | 0.75 | | | | 0.80 | | | | 0.81 | | | | 0.90 | |
| Expenses, net of waivers and reimbursements | | | | 0.65 | | | | 0.65 | | | | 0.65 | | | | 0.65 | | | | 0.70 | | | | 0.80 | |
| Net investment income (loss), before waivers and reimbursements | | | | 0.07 | | | | (0.01 | ) | | | (0.17 | ) | | | 0.16 | | | | 0.16 | | | | (0.01 | ) |
| Net investment income (loss), net of waivers and reimbursements | | | | 0.19 | | | | 0.13 | | | | (0.07 | ) | | | 0.31 | | | | 0.27 | | | | 0.09 | |
| Class I net assets at the end of the year (in thousands) | | | $ | 1,048,642 | | | $ | 702,441 | | | $ | 669,060 | | | $ | 397,370 | | | $ | 236,930 | | | $ | 137,599 | |
| Portfolio turnover rate (%)* | | | | 21 | | | | 29 | | | | 26 | | | | 35 | | | | 37 | | | | 47 | |
| * | Rates are not annualized for periods less than a year. |
| ** | Rates are annualized for periods less than a year. |
| ^ | Amount is less than $0.005 per share. |
Note: Net investment income (loss) per share is based on the average shares outstanding during the year.
Performance cited represents past performance. Past performance does not guarantee future results and current performance may be lower or higher than the data quoted. Results shown are annual returns, which assume reinvestment of dividends and capital gains. Investment returns and principal will fluctuate and you may have a gain or loss when you sell shares. For the most current month-end performance information, please call 1-800-742-7272 or visit our Web site at www.williamblairfunds.com.
| June 30, 2023 | William Blair Funds | 127 |
Financial Highlights — For a share outstanding throughout each period
Large Cap Growth Fund
| | | Class R6 | |
| | | (unaudited)
Period Ended
June 30, | | | Years Ended December 31, | |
| | | | 2023 | | | 2022 | | | 2021 | | | 2020 | | | 2019(a) | |
| Net asset value, beginning of year | | | $ | 17.53 | | | $ | 26.16 | | | $ | 21.27 | | | $ | 16.17 | | | $ | 15.12 | |
| Income (loss) from investment operations: | | | | | | | | | | | | | | | | | | | | | |
| Net investment income (loss) | | | | 0.02 | | | | 0.04 | | | | (0.00 | )^ | | | 0.01 | | | | 0.04 | |
| Net realized and unrealized gain (loss) on investments | | | | 4.39 | | | | (8.52 | ) | | | 6.01 | | | | 5.91 | | | | 2.07 | |
| Total from investment operations | | | | 4.41 | | | | (8.48 | ) | | | 6.01 | | | | 5.92 | | | | 2.11 | |
| Less distributions from: | | | | | | | | | | | | | | | | | | | | | |
| Net investment income | | | | — | | | | 0.03 | | | | 0.00 | ^ | | | 0.05 | | | | 0.06 | |
| Net realized gain | | | | — | | | | 0.12 | | | | 1.12 | | | | 0.77 | | | | 1.00 | |
| Total distributions | | | | — | | | | 0.15 | | | | 1.12 | | | | 0.82 | | | | 1.06 | |
| Net asset value, end of year | | | $ | 21.94 | | | $ | 17.53 | | | $ | 26.16 | | | $ | 21.27 | | | $ | 16.17 | |
| Total return (%)* | | | | 25.16 | | | | (32.41 | ) | | | 28.42 | | | | 36.70 | | | | 14.13 | |
| Ratios to average daily net assets (%)**: | | | | | | | | | | | | | | | | | | | | | |
| Expenses, before waivers and reimbursements | | | | 0.65 | | | | 0.66 | | | | 0.67 | | | | 0.70 | | | | 0.71 | |
| Expenses, net of waivers and reimbursements | | | | 0.60 | | | | 0.60 | | | | 0.60 | | | | 0.60 | | | | 0.60 | |
| Net investment income (loss), before waivers and reimbursements | | | | 0.19 | | | | 0.13 | | | | (0.08 | ) | | | (0.03 | ) | | | 0.22 | |
| Net investment income (loss), net of waivers and reimbursements | | | | 0.24 | | | | 0.19 | | | | (0.01 | ) | | | 0.07 | | | | 0.33 | |
| Class R6 net assets at the end of the year (in thousands) | | | $ | 340,330 | | | $ | 238,354 | | | $ | 233,946 | | | $ | 177,347 | | | $ | 1,590 | |
| Portfolio turnover rate (%)* | | | | 21 | | | | 29 | | | | 26 | | | | 35 | | | | 37 | |
| (a) | For the period from May 2, 2019 (Commencement of Operations) to December 31, 2019. |
| * | Rates are not annualized for periods less than a year. |
| ** | Rates are annualized for periods less than a year. |
| ^ | Amount is less than $0.005 per share. |
Note: Net investment income (loss) per share is based on the average shares outstanding during the year.
Performance cited represents past performance. Past performance does not guarantee future results and current performance may be lower or higher than the data quoted. Results shown are annual returns, which assume reinvestment of dividends and capital gains. Investment returns and principal will fluctuate and you may have a gain or loss when you sell shares. For the most current month-end performance information, please call 1-800-742-7272 or visit our Web site at www.williamblairfunds.com.
| 128 | Semiannual Report | June 30, 2023 |
Financial Highlights — For a share outstanding throughout each period
Mid Cap Value Fund
| | | Class I | |
| | | (unaudited)
Period Ended
June 30, | | | Period Ended
December 31, | |
| | | | 2023 | | | | 2022(a) | |
| Net asset value, beginning of year | | | $ | 9.19 | | | | $ | 10.00 | |
| Income (loss) from investment operations: | | | | | | | | | | |
| Net investment income (loss) | | | | 0.07 | | | | | 0.12 | |
| Net realized and unrealized gain (loss) on investments | | | | 0.47 | | | | | (0.83 | ) |
| Total from investment operations | | | | 0.54 | | | | | (0.71 | ) |
| Less distributions from: | | | | | | | | | | |
| Net investment income | | | | — | | | | | 0.10 | |
| Net realized gain | | | | — | | | | | — | |
| Total distributions | | | | — | | | | | 0.10 | |
| Net asset value, end of year | | | $ | 9.73 | | | | $ | 9.19 | |
| Total return (%)* | | | | 5.88 | | | | | (7.13 | ) |
| Ratios to average daily net assets (%)**: | | | | | | | | | | |
| Expenses, before waivers and reimbursements | | | | 8.55 | | | | | 8.52 | |
| Expenses, net of waivers and reimbursements | | | | 0.75 | | | | | 0.75 | |
| Net investment income (loss), before waivers and reimbursements | | | | (6.33 | ) | | | | (6.14 | ) |
| Net investment income (loss), net of waivers and reimbursements | | | | 1.47 | | | | | 1.63 | |
| Class I net assets at the end of the year (in thousands) | | | $ | 79 | | | | $ | 76 | |
| Portfolio turnover rate (%)* | | | | 15 | | | | | 21 | |
| | | | | | | | | | | |
| | | Class R6 | |
| | | (unaudited)
Period Ended
June 30, | | | Period Ended
December 31, | |
| | | | 2023 | | | | 2022(a) | |
| Net asset value, beginning of year | | | $ | 9.19 | | | | $ | 10.00 | |
| Income (loss) from investment operations: | | | | | | | | | | |
| Net investment income (loss) | | | | 0.07 | | | | | 0.11 | |
| Net realized and unrealized gain (loss) on investments | | | | 0.47 | | | | | (0.82 | ) |
| Total from investment operations | | | | 0.54 | | | | | (0.71 | ) |
| Less distributions from: | | | | | | | | | | |
| Net investment income | | | | — | | | | | 0.10 | |
| Net realized gain | | | | — | | | | | — | |
| Total distributions | | | | — | | | | | 0.10 | |
| Net asset value, end of year | | | $ | 9.73 | | | | $ | 9.19 | |
| Total return (%)* | | | | 5.76 | | | | | (7.01 | ) |
| Ratios to average daily net assets (%)**: | | | | | | | | | | |
| Expenses, before waivers and reimbursements | | | | 8.50 | | | | | 8.52 | |
| Expenses, net of waivers and reimbursements | | | | 0.70 | | | | | 0.70 | |
| Net investment income (loss), before waivers and reimbursements | | | | (6.28 | ) | | | | (6.35 | ) |
| Net investment income (loss), net of waivers and reimbursements | | | | 1.52 | | | | | 1.47 | |
| Class R6 net assets at the end of the year (in thousands) | | | $ | 1,537 | | | | $ | 1,431 | |
| Portfolio turnover rate (%)* | | | | 15 | | | | | 21 | |
| (a) | For the period from March 16, 2022 (Commencement of Operations) to December 31, 2022. |
| * | Rates are not annualized for periods less than a year. |
| ** | Rates are annualized for periods less than a year. |
Note: Net investment income (loss) per share is based on the average shares outstanding during the year.
Performance cited represents past performance. Past performance does not guarantee future results and current performance may be lower or higher than the data quoted. Results shown are annual returns, which assume reinvestment of dividends and capital gains. Investment returns and principal will fluctuate and you may have a gain or loss when you sell shares. For the most current month-end performance information, please call 1-800-742-7272 or visit our Web site at www.williamblairfunds.com.
| June 30, 2023 | William Blair Funds | 129 |
Financial Highlights — For a share outstanding throughout each period
Small-Mid Cap Core Fund
| | | Class I | |
| | | (unaudited)
Period Ended
June 30, | | | Years Ended December 31, | |
| | | | 2023 | | | 2022 | | | 2021 | | | 2020 | | | 2019(a) | |
| Net asset value, beginning of year | | | $ | 13.52 | | | $ | 16.31 | | | $ | 12.88 | | | $ | 10.68 | | | $ | 10.00 | |
| Income (loss) from investment operations: | | | | | | | | | | | | | | | | | | | | | |
| Net investment income (loss) | | | | 0.02 | | | | (0.01 | ) | | | (0.03 | ) | | | 0.00 | ^ | | | 0.02 | |
| Net realized and unrealized gain (loss) on investments | | | | 1.07 | | | | (2.78 | ) | | | 3.46 | | | | 2.20 | | | | 0.67 | |
| Total from investment operations | | | | 1.09 | | | | (2.79 | ) | | | 3.43 | | | | 2.20 | | | | 0.69 | |
| Less distributions from: | | | | | | | | | | | | | | | | | | | | | |
| Net investment income | | | | — | | | | — | | | | — | | | | — | | | | 0.01 | |
| Net realized gain | | | | — | | | | — | | | | — | | | | — | | | | — | |
| Total distributions | | | | — | | | | — | | | | — | | | | — | | | | 0.01 | |
| Net asset value, end of year | | | $ | 14.61 | | | $ | 13.52 | | | $ | 16.31 | | | $ | 12.88 | | | $ | 10.68 | |
| Total return (%)* | | | | 8.06 | | | | (17.11 | ) | | | 26.63 | | | | 20.60 | | | | 6.87 | |
| Ratios to average daily net assets (%)**: | | | | | | | | | | | | | | | | | | | | | |
| Expenses, before waivers and reimbursements | | | | 1.15 | | | | 1.21 | | | | 1.25 | | | | 1.22 | | | | 3.92 | |
| Expenses, net of waivers and reimbursements | | | | 0.95 | | | | 0.95 | | | | 0.95 | | | | 0.95 | | | | 0.95 | |
| Net investment income (loss), before waivers and reimbursements | | | | 0.11 | | | | (0.32 | ) | | | (0.47 | ) | | | (0.27 | ) | | | (2.23 | ) |
| Net investment income (loss), net of waivers and reimbursements | | | | 0.31 | | | | (0.06 | ) | | | (0.17 | ) | | | 0.00 | | | | 0.74 | |
| Class I net assets at the end of the year (in thousands) | | | $ | 97,470 | | | $ | 87,540 | | | $ | 61,433 | | | $ | 22,958 | | | $ | 1,655 | |
| Portfolio turnover rate (%)* | | | | 25 | | | | 50 | | | | 45 | | | | 244 | | | | 12 | |
| | | | | | | | | | | | | | | | | | | | | | |
| | | Class R6 | |
| | | (unaudited)
Period Ended
June 30, | | | Years Ended December 31, | |
| | | | 2023 | | | 2022 | | | 2021 | | | 2020 | | | 2019(a) | |
| Net asset value, beginning of year | | | $ | 13.53 | | | $ | 16.32 | | | $ | 12.88 | | | $ | 10.68 | | | $ | 10.00 | |
| Income (loss) from investment operations: | | | | | | | | | | | | | | | | | | | | | |
| Net investment income (loss) | | | | 0.02 | | | | 0.00 | ^ | | | (0.02 | ) | | | 0.01 | | | | 0.01 | |
| Net realized and unrealized gain (loss) on investments | | | | 1.08 | | | | (2.79 | ) | | | 3.46 | | | | 2.19 | | | | 0.68 | |
| Total from investment operations | | | | 1.10 | | | | (2.79 | ) | | | 3.44 | | | | 2.20 | | | | 0.69 | |
| Less distributions from: | | | | | | | | | | | | | | | | | | | | | |
| Net investment income | | | | — | | | | — | | | | — | | | | 0.00 | ^ | | | 0.01 | |
| Net realized gain | | | | — | | | | — | | | | — | | | | — | | | | — | |
| Total distributions | | | | — | | | | — | | | | — | | | | 0.00 | ^ | | | 0.01 | |
| Net asset value, end of year | | | $ | 14.63 | | | $ | 13.53 | | | $ | 16.32 | | | $ | 12.88 | | | $ | 10.68 | |
| Total return (%)* | | | | 8.13 | | | | (17.10 | ) | | | 26.71 | | | | 20.60 | | | | 6.88 | |
| Ratios to average daily net assets (%)**: | | | | | | | | | | | | | | | | | | | | | |
| Expenses, before waivers and reimbursements | | | | 1.01 | | | | 1.05 | | | | 1.16 | | | | 1.07 | | | | 3.92 | |
| Expenses, net of waivers and reimbursements | | | | 0.90 | | | | 0.90 | | | | 0.90 | | | | 0.90 | | | | 0.90 | |
| Net investment income (loss), before waivers and reimbursements | | | | 0.25 | | | | (0.14 | ) | | | (0.37 | ) | | | (0.11 | ) | | | (2.71 | ) |
| Net investment income (loss), net of waivers and reimbursements | | | | 0.36 | | | | 0.01 | | | | (0.11 | ) | | | 0.06 | | | | 0.31 | |
| Class R6 net assets at the end of the year (in thousands) | | | $ | 59,723 | | | $ | 56,681 | | | $ | 31,347 | | | $ | 7,087 | | | $ | 4,933 | |
| Portfolio turnover rate (%)* | | | | 25 | | | | 50 | | | | 45 | | | | 244 | | | | 12 | |
| (a) | For the period from October 1, 2019 (Commencement of Operations) to December 31, 2019. |
| * | Rates are not annualized for periods less than a year. |
| ** | Rates are annualized for periods less than a year. |
| ^ | Amount is less than $0.005 per share. |
Note: Net investment income (loss) per share is based on the average shares outstanding during the year.
Performance cited represents past performance. Past performance does not guarantee future results and current performance may be lower or higher than the data quoted. Results shown are annual returns, which assume reinvestment of dividends and capital gains. Investment returns and principal will fluctuate and you may have a gain or loss when you sell shares. For the most current month-end performance information, please call 1-800-742-7272 or visit our Web site at www.williamblairfunds.com.
| 130 | Semiannual Report | June 30, 2023 |
Financial Highlights — For a share outstanding throughout each period
Small-Mid Cap Growth Fund
| | | Class N | |
| | | (unaudited)
Period Ended
June 30, | | | Years Ended December 31, | |
| | | | 2023 | | | 2022 | | | 2021 | | | 2020 | | | 2019 | | | 2018 | |
| Net asset value, beginning of year | | | $ | 23.96 | | | $ | 32.27 | | | $ | 32.96 | | | $ | 25.41 | | | $ | 20.97 | | | $ | 23.36 | |
| Income (loss) from investment operations: | | | | | | | | | | | | | | | | | | | | | | | | | |
| Net investment income (loss) | | | | (0.07 | ) | | | (0.23 | ) | | | (0.36 | ) | | | (0.24 | ) | | | (0.20 | ) | | | (0.18 | ) |
| Net realized and unrealized gain (loss) on investments | | | | 2.86 | | | | (7.22 | ) | | | 2.90 | | | | 8.37 | | | | 6.56 | | | | (0.25 | ) |
| Total from investment operations | | | | 2.79 | | | | (7.45 | ) | | | 2.54 | | | | 8.13 | | | | 6.36 | | | | (0.43 | ) |
| Less distributions from: | | | | | | | | | | | | | | | | | | | | | | | | | |
| Net investment income | | | | — | | | | — | | | | — | | | | — | | | | — | | | | — | |
| Net realized gain | | | | — | | | | 0.86 | | | | 3.23 | | | | 0.58 | | | | 1.92 | | | | 1.96 | |
| Total distributions | | | | — | | | | 0.86 | | | | 3.23 | | | | 0.58 | | | | 1.92 | | | | 1.96 | |
| Net asset value, end of year | | | $ | 26.75 | | | $ | 23.96 | | | $ | 32.27 | | | $ | 32.96 | | | $ | 25.41 | | | $ | 20.97 | |
| Total return (%)* | | | | 11.64 | | | | (23.11 | ) | | | 8.27 | | | | 32.04 | | �� | | 30.41 | | | | (2.29 | ) |
| Ratios to average daily net assets (%)**: | | | | | | | | | | | | | | | | | | | | | | | | | |
| Expenses, before waivers and reimbursements | | | | 1.43 | | | | 1.43 | | | | 1.43 | | | | 1.45 | | | | 1.43 | | | | 1.44 | |
| Expenses, net of waivers and reimbursements | | | | 1.31 | | | | 1.35 | | | | 1.35 | | | | 1.35 | | | | 1.35 | | | | 1.35 | |
| Net investment income (loss), before waivers and reimbursements | | | | (0.68 | ) | | | (0.96 | ) | | | (1.10 | ) | | | (1.01 | ) | | | (0.88 | ) | | | (0.81 | ) |
| Net investment income (loss), net of waivers and reimbursements | | | | (0.56 | ) | | | (0.88 | ) | | | (1.02 | ) | | | (0.91 | ) | | | (0.80 | ) | | | (0.72 | ) |
| Class N net assets at the end of the year (in thousands) | | | $ | 115,316 | | | $ | 110,241 | | | $ | 232,166 | | | $ | 314,572 | | | $ | 334,017 | | | $ | 424,865 | |
| Portfolio turnover rate (%)* | | | | 25 | | | | 49 | | | | 38 | | | | 55 | | | | 56 | | | | 46 | |
| | | | | | | | | | | | | | | | | | | | | | | | | | |
| | | Class I | |
| | | (unaudited)
Period Ended
June 30, | | | Years Ended December 31, | |
| | | | 2023 | | | 2022 | | | 2021 | | | 2020 | | | 2019 | | | 2018 | |
| Net asset value, beginning of year | | | $ | 25.91 | | | $ | 34.72 | | | $ | 35.13 | | | $ | 26.99 | | | $ | 22.12 | | | $ | 24.48 | |
| Income (loss) from investment operations: | | | | | | | | | | | | | | | | | | | | | | | | | |
| Net investment income (loss) | | | | (0.04 | ) | | | (0.18 | ) | | | (0.29 | ) | | | (0.19 | ) | | | (0.14 | ) | | | (0.12 | ) |
| Net realized and unrealized gain (loss) on investments | | | | 3.10 | | | | (7.77 | ) | | | 3.11 | | | | 8.91 | | | | 6.93 | | | | (0.28 | ) |
| Total from investment operations | | | | 3.06 | | | | (7.95 | ) | | | 2.82 | | | | 8.72 | | | | 6.79 | | | | (0.40 | ) |
| Less distributions from: | | | | | | | | | | | | | | | | | | | | | | | | | |
| Net investment income | | | | — | | | | — | | | | — | | | | — | | | | — | | | | — | |
| Net realized gain | | | | — | | | | 0.86 | | | | 3.23 | | | | 0.58 | | | | 1.92 | | | | 1.96 | |
| Total distributions | | | | — | | | | 0.86 | | | | 3.23 | | | | 0.58 | | | | 1.92 | | | | 1.96 | |
| Net asset value, end of year | | | $ | 28.97 | | | $ | 25.91 | | | $ | 34.72 | | | $ | 35.13 | | | $ | 26.99 | | | $ | 22.12 | |
| Total return (%)* | | | | 11.81 | | | | (22.92 | ) | | | 8.56 | | | | 32.35 | | | | 30.77 | | | | (2.06 | ) |
| Ratios to average daily net assets (%)**: | | | | | | | | | | | | | | | | | | | | | | | | | |
| Expenses, before waivers and reimbursements | | | | 1.16 | | | | 1.17 | | | | 1.16 | | | | 1.17 | | | | 1.16 | | | | 1.16 | |
| Expenses, net of waivers and reimbursements | | | | 1.06 | | | | 1.10 | | | | 1.10 | | | | 1.10 | | | | 1.10 | | | | 1.10 | |
| Net investment income (loss), before waivers and reimbursements | | | | (0.41 | ) | | | (0.70 | ) | | | (0.83 | ) | | | (0.73 | ) | | | (0.59 | ) | | | (0.53 | ) |
| Net investment income (loss), net of waivers and reimbursements | | | | (0.31 | ) | | | (0.63 | ) | | | (0.77 | ) | | | (0.66 | ) | | | (0.53 | ) | | | (0.47 | ) |
| Class I net assets at the end of the year (in thousands) | | | $ | 1,561,953 | | | $ | 1,509,931 | | | $ | 2,487,862 | | | $ | 3,139,290 | | | $ | 2,531,823 | | | $ | 1,979,105 | |
| Portfolio turnover rate (%)* | | | | 25 | | | | 49 | | | | 38 | | | | 55 | | | | 56 | | | | 46 | |
| * | Rates are not annualized for periods less than a year. |
| ** | Rates are annualized for periods less than a year. |
Note: Net investment income (loss) per share is based on the average shares outstanding during the year.
Performance cited represents past performance. Past performance does not guarantee future results and current performance may be lower or higher than the data quoted. Results shown are annual returns, which assume reinvestment of dividends and capital gains. Investment returns and principal will fluctuate and you may have a gain or loss when you sell shares. For the most current month-end performance information, please call 1-800-742-7272 or visit our Web site at www.williamblairfunds.com.
| June 30, 2023 | William Blair Funds | 131 |
Financial Highlights — For a share outstanding throughout each period
Small-Mid Cap Growth Fund
| | | Class R6 | |
| | | (unaudited)
Period Ended
June 30, | | | Years Ended December 31, | |
| | | | 2023 | | | 2022 | | | 2021 | | | 2020 | | | 2019(a) | |
| Net asset value, beginning of year | | | $ | 25.99 | | | $ | 34.79 | | | $ | 35.18 | | | $ | 27.01 | | | $ | 26.76 | |
| Income (loss) from investment operations: | | | | | | | | | | | | | | | | | | | | | |
| Net investment income (loss) | | | | (0.04 | ) | | | (0.15 | ) | | | (0.26 | ) | | | (0.17 | ) | | | (0.09 | ) |
| Net realized and unrealized gain (loss) on investments | | | | 3.11 | | | | (7.79 | ) | | | 3.10 | | | | 8.92 | | | | 2.26 | |
| Total from investment operations | | | | 3.07 | | | | (7.94 | ) | | | 2.84 | | | | 8.75 | | | | 2.17 | |
| Less distributions from: | | | | | | | | | | | | | | | | | | | | | |
| Net investment income | | | | — | | | | — | | | | — | | | | — | | | | — | |
| Net realized gain | | | | — | | | | 0.86 | | | | 3.23 | | | | 0.58 | | | | 1.92 | |
| Total distributions | | | | — | | | | 0.86 | | | | 3.23 | | | | 0.58 | | | | 1.92 | |
| Net asset value, end of year | | | $ | 29.06 | | | $ | 25.99 | | | $ | 34.79 | | | $ | 35.18 | | | $ | 27.01 | |
| Total return (%)* | | | | 11.81 | | | | (22.84 | ) | | | 8.60 | | | | 32.44 | | | | 8.17 | |
| Ratios to average daily net assets (%)**: | | | | | | | | | | | | | | | | | | | | | |
| Expenses, before waivers and reimbursements | | | | 1.02 | | | | 1.05 | | | | 1.03 | | | | 1.05 | | | | 1.05 | |
| Expenses, net of waivers and reimbursements | | | | 1.01 | | | | 1.05 | | | | 1.03 | | | | 1.05 | | | | 1.05 | |
| Net investment income (loss), before waivers and reimbursements | | | | (0.27 | ) | | | (0.55 | ) | | | (0.69 | ) | | | (0.61 | ) | | | (0.46 | ) |
| Net investment income (loss), net of waivers and reimbursements | | | | (0.26 | ) | | | (0.55 | ) | | | (0.69 | ) | | | (0.61 | ) | | | (0.46 | ) |
| Class R6 net assets at the end of the year (in thousands) | | | $ | 440,081 | | | $ | 392,153 | | | $ | 328,034 | | | $ | 123,220 | | | $ | 39,974 | |
| Portfolio turnover rate (%)* | | | | 25 | | | | 49 | | | | 38 | | | | 55 | | | | 56 | |
| (a) | For the period from May 2, 2019 (Commencement of Operations) to December 31, 2019. |
| * | Rates are not annualized for periods less than a year. |
| ** | Rates are annualized for periods less than a year. |
Note: Net investment income (loss) per share is based on the average shares outstanding during the year.
Performance cited represents past performance. Past performance does not guarantee future results and current performance may be lower or higher than the data quoted. Results shown are annual returns, which assume reinvestment of dividends and capital gains. Investment returns and principal will fluctuate and you may have a gain or loss when you sell shares. For the most current month-end performance information, please call 1-800-742-7272 or visit our Web site at www.williamblairfunds.com.
| 132 | Semiannual Report | June 30, 2023 |
Financial Highlights — For a share outstanding throughout each period
Small Cap Growth Fund
| | | Class N | |
| | | (unaudited)
Period Ended
June 30, | | | Years Ended December 31, | |
| | | | 2023 | | | 2022 | | | 2021 | | | 2020 | | | 2019 | | | 2018 | |
| Net asset value, beginning of year | | | $ | 24.01 | | | $ | 31.90 | | | $ | 34.49 | | | $ | 27.75 | | | $ | 23.23 | | | $ | 26.87 | |
| Income (loss) from investment operations: | | | | | | | | | | | | | | | | | | | | | | | | | |
| Net investment income (loss) | | | | (0.11 | ) | | | (0.27 | ) | | | (0.45 | ) | | | (0.29 | ) | | | (0.24 | ) | | | (0.27 | ) |
| Net realized and unrealized gain (loss) on investments | | | | 2.79 | | | | (6.61 | ) | | | 4.56 | | | | 10.86 | | | | 5.40 | | | | (0.10 | ) |
| Total from investment operations | | | | 2.68 | | | | (6.88 | ) | | | 4.11 | | | | 10.57 | | | | 5.16 | | | | (0.37 | ) |
| Less distributions from: | | | | | | | | | | | | | | | | | | | | | | | | | |
| Net investment income | | | | — | | | | — | | | | — | | | | — | | | | — | | | | — | |
| Net realized gain | | | | — | | | | 1.01 | | | | 6.70 | | | | 3.83 | | | | 0.64 | | | | 3.27 | |
| Total distributions | | | | — | | | | 1.01 | | | | 6.70 | | | | 3.83 | | | | 0.64 | | | | 3.27 | |
| Net asset value, end of year | | | $ | 26.69 | | | $ | 24.01 | | | $ | 31.90 | | | $ | 34.49 | | | $ | 27.75 | | | $ | 23.23 | |
| Total return (%)* | | | | 11.16 | | | | (21.59 | ) | | | 12.91 | | | | 38.32 | | | | 22.26 | | | | (2.14 | ) |
| Ratios to average daily net assets (%)**: | | | | | | | | | | | | | | | | | | | | | | | | | |
| Expenses, before waivers and reimbursements | | | | 1.49 | | | | 1.55 | | | | 1.56 | | | | 1.58 | | | | 1.54 | | | | 1.55 | |
| Expenses, net of waivers and reimbursements | | | | 1.41 | | | | 1.50 | | | | 1.50 | | | | 1.50 | | | | 1.50 | | | | 1.50 | |
| Net investment income (loss), before waivers and reimbursements | | | | (0.96 | ) | | | (1.08 | ) | | | (1.24 | ) | | | (1.10 | ) | | | (0.92 | ) | | | (0.94 | ) |
| Net investment income (loss), net of waivers and reimbursements | | | | (0.88 | ) | | | (1.03 | ) | | | (1.18 | ) | | | (1.02 | ) | | | (0.88 | ) | | | (0.89 | ) |
| Class N net assets at the end of the year (in thousands) | | | $ | 122,611 | | | $ | 114,324 | | | $ | 179,739 | | | $ | 180,635 | | | $ | 180,706 | | | $ | 169,074 | |
| Portfolio turnover rate (%)* | | | | 31 | | | | 45 | | | | 49 | | | | 71 | | | | 51 | | | | 74 | |
| | | Class I | |
| | | (unaudited)
Period Ended
June 30, | | | Years Ended December 31, | |
| | | | 2023 | | | 2022 | | | 2021 | | | 2020 | | | 2019 | | | 2018 | |
| Net asset value, beginning of year | | | $ | 28.49 | | | $ | 37.52 | | | $ | 39.36 | | | $ | 31.19 | | | $ | 25.99 | | | $ | 29.61 | |
| Income (loss) from investment operations: | | | | | | | | | | | | | | | | | | | | | | | | | |
| Net investment income (loss) | | | | (0.09 | ) | | | (0.24 | ) | | | (0.41 | ) | | | (0.24 | ) | | | (0.19 | ) | | | (0.21 | ) |
| Net realized and unrealized gain (loss) on investments | | | | 3.31 | | | | (7.78 | ) | | | 5.27 | | | | 12.24 | | | | 6.03 | | | | (0.14 | ) |
| Total from investment operations | | | | 3.22 | | | | (8.02 | ) | | | 4.86 | | | | 12.00 | | | | 5.84 | | | | (0.35 | ) |
| Less distributions from: | | | | | | | | | | | | | | | | | | | | | | | | | |
| Net investment income | | | | — | | | | — | | | | — | | | | — | | | | — | | | | — | |
| Net realized gain | | | | — | | | | 1.01 | | | | 6.70 | | | | 3.83 | | | | 0.64 | | | | 3.27 | |
| Total distributions | | | | — | | | | 1.01 | | | | 6.70 | | | | 3.83 | | | | 0.64 | | | | 3.27 | |
| Net asset value, end of year | | | $ | 31.71 | | | $ | 28.49 | | | $ | 37.52 | | | $ | 39.36 | | | $ | 31.19 | | | $ | 25.99 | |
| Total return (%)* | | | | 11.30 | | | | (21.39 | ) | | | 13.22 | | | | 38.68 | | | | 22.51 | | | | (1.88 | ) |
| Ratios to average daily net assets (%)**: | | | | | | | | | | | | | | | | | | | | | | | | | |
| Expenses, before waivers and reimbursements | | | | 1.22 | | | | 1.28 | | | | 1.25 | | | | 1.30 | | | | 1.27 | | | | 1.25 | |
| Expenses, net of waivers and reimbursements | | | | 1.16 | | | | 1.25 | | | | 1.25 | | | | 1.25 | | | | 1.25 | | | | 1.25 | |
| Net investment income (loss), before waivers and reimbursements | | | | (0.69 | ) | | | (0.81 | ) | | | (0.93 | ) | | | (0.82 | ) | | | (0.65 | ) | | | (0.65 | ) |
| Net investment income (loss), net of waivers and reimbursements | | | | (0.63 | ) | | | (0.78 | ) | | | (0.93 | ) | | | (0.77 | ) | | | (0.63 | ) | | | (0.65 | ) |
| Class I net assets at the end of the year (in thousands) | | | $ | 389,181 | | | $ | 303,016 | | | $ | 402,629 | | | $ | 390,511 | | | $ | 423,881 | | | $ | 410,233 | |
| Portfolio turnover rate (%)* | | | | 31 | | | | 45 | | | | 49 | | | | 71 | | | | 51 | | | | 74 | |
| * | Rates are not annualized for periods less than a year. |
| ** | Rates are annualized for periods less than a year. |
Note: Net investment income (loss) per share is based on the average shares outstanding during the year.
Performance cited represents past performance. Past performance does not guarantee future results and current performance may be lower or higher than the data quoted. Results shown are annual returns, which assume reinvestment of dividends and capital gains. Investment returns and principal will fluctuate and you may have a gain or loss when you sell shares. For the most current month-end performance information, please call 1-800-742-7272 or visit our Web site at www.williamblairfunds.com.
| June 30, 2023 | William Blair Funds | 133 |
Financial Highlights — For a share outstanding throughout each period
Small Cap Growth Fund
| | | Class R6 | |
| | | (unaudited)
Period Ended
June 30, | | | Years Ended December 31, | |
| | | | 2023 | | | 2022 | | | 2021 | | | 2020 | | | 2019(a) | |
| Net asset value, beginning of year | | | $ | 28.57 | | | $ | 37.60 | | | $ | 39.40 | | | $ | 31.20 | | | $ | 31.00 | |
| Income (loss) from investment operations: | | | | | | | | | | | | | | | | | | | | | |
| Net investment income (loss) | | | | (0.09 | ) | | | (0.21 | ) | | | (0.37 | ) | | | (0.23 | ) | | | (0.11 | ) |
| Net realized and unrealized gain (loss) on investments | | | | 3.33 | | | | (7.81 | ) | | | 5.27 | | | | 12.26 | | | | 0.95 | |
| Total from investment operations | | | | 3.24 | | | | (8.02 | ) | | | 4.90 | | | | 12.03 | | | | 0.84 | |
| Less distributions from: | | | | | | | | | | | | | | | | | | | | | |
| Net investment income | | | | — | | | | — | | | | — | | | | — | | | | — | |
| Net realized gain | | | | — | | | | 1.01 | | | | 6.70 | | | | 3.83 | | | | 0.64 | |
| Total distributions | | | | — | | | | 1.01 | | | | 6.70 | | | | 3.83 | | | | 0.64 | |
| Net asset value, end of year | | | $ | 31.81 | | | $ | 28.57 | | | $ | 37.60 | | | $ | 39.40 | | | $ | 31.20 | |
| Total return (%)* | | | | 11.34 | | | | (21.35 | ) | | | 13.31 | | | | 38.76 | | | | 2.75 | |
| Ratios to average daily net assets (%)**: | | | | | | | | | | | | | | | | | | | | | |
| Expenses, before waivers and reimbursements | | | | 1.12 | | | | 1.18 | | | | 1.16 | | | | 1.19 | | | | 1.18 | |
| Expenses, net of waivers and reimbursements | | | | 1.11 | | | | 1.18 | | | | 1.16 | | | | 1.19 | | | | 1.18 | |
| Net investment income (loss), before waivers and reimbursements | | | | (0.59 | ) | | | (0.70 | ) | | | (0.84 | ) | | | (0.71 | ) | | | (0.51 | ) |
| Net investment income (loss), net of waivers and reimbursements | | | | (0.58 | ) | | | (0.70 | ) | | | (0.84 | ) | | | (0.71 | ) | | | (0.51 | ) |
| Class R6 net assets at the end of the year (in thousands) | | | $ | 149,122 | | | $ | 112,497 | | | $ | 127,710 | | | $ | 103,462 | | | $ | 69,950 | |
| Portfolio turnover rate (%)* | | | | 31 | | | | 45 | | | | 49 | | | | 71 | | | | 51 | |
| (a) | For the period from May 2, 2019 (Commencement of Operations) to December 31, 2019. |
| * | Rates are not annualized for periods less than a year. |
| ** | Rates are annualized for periods less than a year. |
Note: Net investment income (loss) per share is based on the average shares outstanding during the year.
Performance cited represents past performance. Past performance does not guarantee future results and current performance may be lower or higher than the data quoted. Results shown are annual returns, which assume reinvestment of dividends and capital gains. Investment returns and principal will fluctuate and you may have a gain or loss when you sell shares. For the most current month-end performance information, please call 1-800-742-7272 or visit our Web site at www.williamblairfunds.com.
| 134 | Semiannual Report | June 30, 2023 |
Financial Highlights — For a share outstanding throughout each period
Small Cap Value Fund
| | | | | | | | | | | | | | | Class N | |
| | | (unaudited)
Period Ended
June 30, | | | Year Ended
December 31, | | | Period Ended
December 31, | | | Period Ended
October 31, | |
| | | | 2023 | | | | 2022 | | | | 2021(b) | | | | 2021(a) | |
| Net asset value, beginning of year | | | $ | 27.76 | | | | $ | 33.63 | | | | $ | 33.49 | | | | $ | 32.15 | |
| Income (loss) from investment operations: | | | | | | | | | | | | | | | | | | | | |
| Net investment income (loss) | | | | 0.10 | | | | | 0.15 | | | | | 0.00 | ^ | | | | 0.05 | |
| Net realized and unrealized gain (loss) on investments | | | | 0.43 | | | | | (3.98 | ) | | | | 1.37 | | | | | 1.29 | |
| Total from investment operations | | | | 0.53 | | | | | (3.83 | ) | | | | 1.37 | | | | | 1.34 | |
| Less distributions from: | | | | | | | | | | | | | | | | | | | | |
| Net investment income | | | | — | | | | | 0.12 | | | | | — | | | | | — | |
| Net realized gain | | | | — | | | | | 1.92 | | | | | 1.23 | | | | | — | |
| Total distributions | | | | — | | | | | 2.04 | | | | | 1.23 | | | | | — | |
| Net asset value, end of year | | | $ | 28.29 | | | | $ | 27.76 | | | | $ | 33.63 | | | | $ | 33.49 | |
| Total return (%)* | | | | 1.91 | | | | | (11.36 | ) | | | | 4.24 | | | | | 4.17 | |
| Ratios to average daily net assets (%)**: | | | | | | | | | | | | | | | | | | | | |
| Expenses, before waivers and reimbursements | | | | 1.12 | | | | | 1.15 | | | | | 1.26 | | | | | 1.17 | |
| Expenses, net of waivers and reimbursements | | | | 1.12 | | | | | 1.15 | | | | | 1.15 | | | | | 1.15 | |
| Net investment income (loss), before waivers and reimbursements | | | | 0.73 | | | | | 0.48 | | | | | (0.05 | ) | | | | 0.51 | |
| Net investment income (loss), net of waivers and reimbursements | | | | 0.73 | | | | | 0.48 | | | | | 0.06 | | | | | 0.53 | |
| Class N net assets at the end of the year (in thousands) | | | $ | 2,623 | | | | $ | 2,648 | | | | $ | 3,313 | | | | $ | 9,805 | |
| Portfolio turnover rate (%)* | | | | 11 | | | | | 25 | | | | | 7 | | | | | 35 | |
| | | | | | | | | | | | | | | | | | | | | | | | Class I | |
| | | (unaudited)
Period Ended
June 30, | | | Year Ended
December 31, | | | Period Ended
December 31, | | | | | | | | | | | | Years Ended
October 31, | |
| | | | 2023 | | | | 2022 | | | | 2021(b) | | | 2021 | | | 2020 | | | 2019 | | | | 2018 | |
| Net asset value, beginning of year | | | $ | 27.72 | | | | $ | 33.58 | | | | $ | 33.52 | | | $ | 23.79 | | | $ | 28.84 | | | $ | 31.53 | | | | $ | 35.04 | |
| Income (loss) from investment operations: | | | | | | | | | | | | | | | | | | | | | | | | | | | | | | | | |
| Net investment income (loss) | | | | 0.13 | | | | | 0.22 | | | | | 0.03 | | | | 0.18 | | | | 0.09 | | | | 0.18 | | | | | 0.06 | |
| Net realized and unrealized gain (loss) on investments | | | | 0.43 | | | | | (3.96 | ) | | | | 1.35 | | | | 12.91 | | | | (3.89 | ) | | | 1.59 | | | | | (1.00 | ) |
| Total from investment operations | | | | 0.56 | | | | | (3.74 | ) | | | | 1.38 | | | | 13.09 | | | | (3.80 | ) | | | 1.77 | | | | | (0.94 | ) |
| Less distributions from: | | | | | | | | | | | | | | | | | | | | | | | | | | | | | | | | |
| Net investment income | | | | — | | | | | 0.20 | | | | | 0.09 | | | | 0.11 | | | | 0.07 | | | | 0.15 | | | | | 0.09 | |
| Net realized gain | | | | — | | | | | 1.92 | | | | | 1.23 | | | | 3.25 | | | | 1.18 | | | | 4.31 | | | | | 2.48 | |
| Total distributions | | | | — | | | | | 2.12 | | | | | 1.32 | | | | 3.36 | | | | 1.25 | | | | 4.46 | | | | | 2.57 | |
| Net asset value, end of year | | | $ | 28.28 | | | | $ | 27.72 | | | | $ | 33.58 | | | $ | 33.52 | | | $ | 23.79 | | | $ | 28.84 | | | | $ | 31.53 | |
| Total return (%)* | | | | 2.02 | | | | | (11.12 | ) | | | | 4.31 | | | | 55.32 | | | | (13.91 | ) | | | 8.60 | | | | | (3.06 | ) |
| Ratios to average daily net assets (%)**: | | | | | | | | | | | | | | | | | | | | | | | | | | | | | | | | |
| Expenses, before waivers and reimbursements | | | | 0.92 | | | | | 0.94 | | | | | 0.82 | | | | 0.86 | | | | 0.89 | | | | 0.93 | | | | | 0.93 | |
| Expenses, net of waivers and reimbursements | | | | 0.89 | | | | | 0.89 | | | | | 0.82 | | | | 0.86 | | | | 0.89 | | | | 0.93 | | | | | 0.93 | |
| Net investment income (loss), before waivers and reimbursements | | | | 0.92 | | | | | 0.67 | | | | | 0.55 | | | | 0.52 | | | | 0.37 | | | | 0.63 | | | | | 0.16 | |
| Net investment income (loss), net of waivers and reimbursements | | | | 0.95 | | | | | 0.72 | | | | | 0.55 | | | | 0.52 | | | | 0.37 | | | | 0.63 | | | | | 0.16 | |
| Class I net assets at the end of the year (in thousands) | | | $ | 783,361 | | | | $ | 758,104 | | | | $ | 1,059,157 | | | $ | 1,143,150 | | | $ | 1,181,409 | | | $ | 908,831 | | | | $ | 738,558 | |
| Portfolio turnover rate (%)* | | | | 11 | | | | | 25 | | | | | 7 | | | | 35 | | | | 27 | | | | 31 | | | | | 31 | |
| (a) | For the period from July 17, 2021 (Commencement of Operations) to October 31, 2021. |
| (b) | For the period from November 1, 2021 to December 31, 2021. |
| * | Rates are not annualized for periods less than a year. |
| ** | Rates are annualized for periods less than a year. |
| ^ | Amount is less than $0.005 per share. |
Note: Net investment income (loss) per share is based on the average shares outstanding during the year.
Performance cited represents past performance. Past performance does not guarantee future results and current performance may be lower or higher than the data quoted. Results shown are annual returns, which assume reinvestment of dividends and capital gains. Investment returns and principal will fluctuate and you may have a gain or loss when you sell shares. For the most current month-end performance information, please call 1-800-742-7272 or visit our Web site at www.williamblairfunds.com.
| June 30, 2023 | William Blair Funds | 135 |
Financial Highlights — For a share outstanding throughout each period
Small Cap Value Fund
| | | | | | | | | | | | | | | Class R6 | |
| | | (unaudited)
Period Ended
June 30, | | | Year Ended
December 31, | | | Period Ended
December 31, | | | Period Ended
October 31, | |
| | | | 2023 | | | | 2022 | | | | 2021(b) | | | | 2021(a) | |
| Net asset value, beginning of year | | | $ | 27.71 | | | | $ | 33.58 | | | | $ | 33.53 | | | | $ | 32.15 | |
| Income (loss) from investment operations: | | | | | | | | | | | | | | | | | | | | |
| Net investment income (loss) | | | | 0.15 | | | | | 0.26 | | | | | 0.03 | | | | | 0.06 | |
| Net realized and unrealized gain (loss) on investments | | | | 0.43 | | | | | (3.98 | ) | | | | 1.35 | | | | | 1.32 | |
| Total from investment operations | | | | 0.58 | | | | | (3.72 | ) | | | | 1.38 | | | | | 1.38 | |
| Less distributions from: | | | | | | | | | | | | | | | | | | | | |
| Net investment income | | | | — | | | | | 0.23 | | | | | 0.10 | | | | | — | |
| Net realized gain | | | | — | | | | | 1.92 | | | | | 1.23 | | | | | — | |
| Total distributions | | | | — | | | | | 2.15 | | | | | 1.33 | | | | | — | |
| Net asset value, end of year | | | $ | 28.29 | | | | $ | 27.71 | | | | $ | 33.58 | | | | $ | 33.53 | |
| Total return (%)* | | | | 2.09 | | | | | (11.06 | ) | | | | 4.33 | | | | | 4.26 | |
| Ratios to average daily net assets (%)**: | | | | | | | | | | | | | | | | | | | | |
| Expenses | | | | 0.79 | | | | | 0.81 | | | | | 0.78 | | | | | 0.78 | |
| Net investment income (loss) | | | | 1.04 | | | | | 0.85 | | | | | 0.59 | | | | | 0.64 | |
| Class R6 net assets at the end of the year (in thousands) | | | $ | 463,939 | | | | $ | 453,456 | | | | $ | 1,006,928 | | | | $ | 867,272 | |
| Portfolio turnover rate (%)* | | | | 11 | | | | | 25 | | | | | 7 | | | | | 35 | |
| (a) | For the period from July 17, 2021 (Commencement of Operations) to October 31, 2021. |
| (b) | For the period from November 1, 2021 to December 31, 2021. |
| * | Rates are not annualized for periods less than a year. |
| ** | Rates are annualized for periods less than a year. |
Note: Net investment income (loss) per share is based on the average shares outstanding during the year.
Performance cited represents past performance. Past performance does not guarantee future results and current performance may be lower or higher than the data quoted. Results shown are annual returns, which assume reinvestment of dividends and capital gains. Investment returns and principal will fluctuate and you may have a gain or loss when you sell shares. For the most current month-end performance information, please call 1-800-742-7272 or visit our Web site at www.williamblairfunds.com.
| 136 | Semiannual Report | June 30, 2023 |
Financial Highlights — For a share outstanding throughout each period
Global Leaders Fund
| | | | | | | | | | | | | | Class N | |
| | | (unaudited)
Period Ended
June 30, | | | | | | | | | Years Ended December 31, | |
| | | | 2023 | | | 2022 | | | 2021 | | | 2020 | | | 2019 | | | 2018 | |
| Net asset value, beginning of year | | | $ | 13.24 | | | $ | 19.17 | | | $ | 17.41 | | | $ | 14.92 | | | $ | 11.47 | | | $ | 14.53 | |
| Income (loss) from investment operations: | | | | | | | | | | | | | | | | | | | | | | | | | |
| Net investment income (loss) | | | | 0.01 | | | | (0.04 | ) | | | (0.11 | ) | | | (0.06 | ) | | | 0.01 | | | | 0.02 | |
| Net realized and unrealized gain (loss) on investments | | | | 2.44 | | | | (5.61 | ) | | | 2.96 | | | | 4.74 | | | | 3.61 | | | | (1.12 | ) |
| Total from investment operations | | | | 2.45 | | | | (5.65 | ) | | | 2.85 | | | | 4.68 | | | | 3.62 | | | | (1.10 | ) |
| Less distributions from: | | | | | | | | | | | | | | | | | | | | | | | | | |
| Net investment income | | | | — | | | | — | | | | — | | | | — | | | | 0.03 | | | | — | |
| Net realized gain | | | | — | | | | 0.28 | | | | 1.09 | | | | 2.19 | | | | 0.14 | | | | 1.96 | |
| Total distributions | | | | — | | | | 0.28 | | | | 1.09 | | | | 2.19 | | | | 0.17 | | | | 1.96 | |
| Net asset value, end of year | | | $ | 15.69 | | | $ | 13.24 | | | $ | 19.17 | | | $ | 17.41 | | | $ | 14.92 | | | $ | 11.47 | |
| Total return (%)* | | | | 18.50 | | | | (29.49 | ) | | | 16.55 | | | | 31.50 | | | | 31.57 | | | | (8.23 | ) |
| Ratios to average daily net assets (%)**: | | | | | | | | | | | | | | | | | | | | | | | | | |
| Expenses, before waivers and reimbursements | | | | 1.41 | | | | 1.45 | | | | 1.38 | | | | 1.45 | | | | 1.39 | | | | 1.47 | |
| Expenses, net of waivers and reimbursements | | | | 1.15 | | | | 1.15 | | | | 1.15 | | | | 1.15 | | | | 1.20 | | | | 1.33 | |
| Net investment income (loss), before waivers and reimbursements | | | | (0.16 | ) | | | (0.60 | ) | | | (0.79 | ) | | | (0.67 | ) | | | (0.10 | ) | | | (0.01 | ) |
| Net investment income (loss), net of waivers and reimbursements | | | | 0.10 | | | | (0.30 | ) | | | (0.56 | ) | | | (0.37 | ) | | | 0.09 | | | | 0.13 | |
| Class N net assets at the end of the year (in thousands) | | | $ | 9,753 | | | $ | 8,317 | | | $ | 13,709 | | | $ | 11,861 | | | $ | 8,910 | | | $ | 7,225 | |
| Portfolio turnover rate (%)* | | | | 17 | | | | 15 | | | | 18 | | | | 27 | | | | 27 | | | | 49 | |
| | | | | | | | | | | | | | | | | | | | | | | | | | |
| | | | | | | | | | | | | | Class I | |
| | | (unaudited)
Period Ended
June 30, | | | | | | | | | Years Ended December 31, | |
| | | | 2023 | | | 2022 | | | 2021 | | | 2020 | | | 2019 | | | 2018 | |
| Net asset value, beginning of year | | | $ | 13.35 | | | $ | 19.28 | | | $ | 17.47 | | | $ | 14.93 | | | $ | 11.47 | | | $ | 14.56 | |
| Income (loss) from investment operations: | | | | | | | | | | | | | | | | | | | | | | | | | |
| Net investment income (loss) | | | | 0.03 | | | | (0.01 | ) | | | (0.06 | ) | | | (0.01 | ) | | | 0.05 | | | | 0.06 | |
| Net realized and unrealized gain (loss) on investments | | | | 2.45 | | | | (5.63 | ) | | | 2.96 | | | | 4.74 | | | | 3.61 | | | | (1.13 | ) |
| Total from investment operations | | | | 2.48 | | | | (5.64 | ) | | | 2.90 | | | | 4.73 | | | | 3.66 | | | | (1.07 | ) |
| Less distributions from: | | | | | | | | | | | | | | | | | | | | | | | | | |
| Net investment income | | | | — | | | | 0.01 | | | | — | | | | 0.00 | ^ | | | 0.06 | | | | 0.06 | |
| Net realized gain | | | | — | | | | 0.28 | | | | 1.09 | | | | 2.19 | | | | 0.14 | | | | 1.96 | |
| Total distributions | | | | — | | | | 0.29 | | | | 1.09 | | | | 2.19 | | | | 0.20 | | | | 2.02 | |
| Net asset value, end of year | | | $ | 15.83 | | | $ | 13.35 | | | $ | 19.28 | | | $ | 17.47 | | | $ | 14.93 | | | $ | 11.47 | |
| Total return (%)* | | | | 18.58 | | | | (29.28 | ) | | | 16.78 | | | | 31.86 | | | | 31.96 | | | | (8.06 | ) |
| Ratios to average daily net assets (%)**: | | | | | | | | | | | | | | | | | | | | | | | | | |
| Expenses, before waivers and reimbursements | | | | 1.12 | | | | 1.12 | | | | 1.07 | | | | 1.12 | | | | 1.07 | | | | 1.15 | |
| Expenses, net of waivers and reimbursements | | | | 0.90 | | | | 0.90 | | | | 0.90 | | | | 0.90 | | | | 0.95 | | | | 1.07 | |
| Net investment income (loss), before waivers and reimbursements | | | | 0.13 | | | | (0.27 | ) | | | (0.49 | ) | | | (0.31 | ) | | | 0.22 | | | | 0.31 | |
| Net investment income (loss), net of waivers and reimbursements | | | | 0.35 | | | | (0.05 | ) | | | (0.32 | ) | | | (0.09 | ) | | | 0.34 | | | | 0.39 | |
| Class I net assets at the end of the year (in thousands) | | | $ | 79,017 | | | $ | 69,987 | | | $ | 124,488 | | | $ | 107,375 | | | $ | 114,666 | | | $ | 83,790 | |
| Portfolio turnover rate (%)* | | | | 17 | | | | 15 | | | | 18 | | | | 27 | | | | 27 | | | | 49 | |
| * | Rates are not annualized for periods less than a year. |
| ** | Rates are annualized for periods less than a year. |
| ^ | Amount is less than $0.005 per share. |
Note: Net investment income (loss) per share is based on the average shares outstanding during the year.
Performance cited represents past performance. Past performance does not guarantee future results and current performance may be lower or higher than the data quoted. Results shown are annual returns, which assume reinvestment of dividends and capital gains. Investment returns and principal will fluctuate and you may have a gain or loss when you sell shares. For the most current month-end performance information, please call 1-800-742-7272 or visit our Web site at www.williamblairfunds.com.
| June 30, 2023 | William Blair Funds | 137 |
Financial Highlights — For a share outstanding throughout each period
Global Leaders Fund
| | | | | | | | | | | | | | Class R6 | |
| | | (unaudited)
Period Ended
June 30, | | | | | | | | | Years Ended December 31, | |
| | | | 2023 | | | 2022 | | | 2021 | | | 2020 | | | 2019 | | | 2018 | |
| Net asset value, beginning of year | | | $ | 13.35 | | | $ | 19.30 | | | $ | 17.47 | | | $ | 14.93 | | | $ | 11.47 | | | $ | 14.56 | |
| Income (loss) from investment operations: | | | | | | | | | | | | | | | | | | | | | | | | | |
| Net investment income (loss) | | | | 0.03 | | | | (0.01 | ) | | | (0.05 | ) | | | 0.02 | | | | 0.06 | | | | 0.07 | |
| Net realized and unrealized gain (loss) on investments | | | | 2.47 | | | | (5.64 | ) | | | 2.97 | | | | 4.72 | | | | 3.61 | | | | (1.13 | ) |
| Total from investment operations | | | | 2.50 | | | | (5.65 | ) | | | 2.92 | | | | 4.74 | | | | 3.67 | | | | (1.06 | ) |
| Less distributions from: | | | | | | | | | | | | | | | | | | | | | | | | | |
| Net investment income | | | | — | | | | 0.02 | | | | — | | | | 0.01 | | | | 0.07 | | | | 0.07 | |
| Net realized gain | | | | — | | | | 0.28 | | | | 1.09 | | | | 2.19 | | | | 0.14 | | | | 1.96 | |
| Total distributions | | | | — | | | | 0.30 | | | | 1.09 | | | | 2.20 | | | | 0.21 | | | | 2.03 | |
| Net asset value, end of year | | | $ | 15.85 | | | $ | 13.35 | | | $ | 19.30 | | | $ | 17.47 | | | $ | 14.93 | | | $ | 11.47 | |
| Total return (%)* | | | | 18.73 | | | | (29.30 | ) | | | 16.90 | | | | 31.91 | | | | 32.02 | | | | (7.99 | ) |
| Ratios to average daily net assets (%)**: | | | | | | | | | | | | | | | | | | | | | | | | | |
| Expenses, before waivers and reimbursements | | | | 1.05 | | | | 1.05 | | | | 0.99 | | | | 1.06 | | | | 1.01 | | | | 1.08 | |
| Expenses, net of waivers and reimbursements | | | | 0.85 | | | | 0.85 | | | | 0.85 | | | | 0.85 | | | | 0.90 | | | | 1.00 | |
| Net investment income (loss), before waivers and reimbursements | | | | 0.21 | | | | (0.30 | ) | | | (0.40 | ) | | | (0.10 | ) | | | 0.32 | | | | 0.39 | |
| Net investment income (loss), net of waivers and reimbursements | | | | 0.41 | | | | (0.10 | ) | | | (0.26 | ) | | | 0.11 | | | | 0.43 | | | | 0.47 | |
| Class R6 net assets at the end of the year (in thousands) | | | $ | 15,964 | | | $ | 13,255 | | | $ | 5,585 | | | $ | 2,946 | | | $ | 48,133 | | | $ | 79,685 | |
| Portfolio turnover rate (%)* | | | | 17 | | | | 15 | | | | 18 | | | | 27 | | | | 27 | | | | 49 | |
| * | Rates are not annualized for periods less than a year. |
| ** | Rates are annualized for periods less than a year. |
Note: Net investment income (loss) per share is based on the average shares outstanding during the year.
Performance cited represents past performance. Past performance does not guarantee future results and current performance may be lower or higher than the data quoted. Results shown are annual returns, which assume reinvestment of dividends and capital gains. Investment returns and principal will fluctuate and you may have a gain or loss when you sell shares. For the most current month-end performance information, please call 1-800-742-7272 or visit our Web site at www.williamblairfunds.com.
| 138 | Semiannual Report | June 30, 2023 |
Financial Highlights — For a share outstanding throughout each period
International Leaders Fund
| | | | | | | | | | | | | | Class N | |
| | | (unaudited)
Period Ended
June 30, | | | | | | | | | Years Ended December 31, | |
| | | | 2023 | | | 2022 | | | 2021 | | | 2020 | | | 2019 | | | 2018 | |
| Net asset value, beginning of year | | | $ | 17.28 | | | $ | 24.28 | | | $ | 22.69 | | | $ | 18.08 | | | $ | 13.80 | | | $ | 16.37 | |
| Income (loss) from investment operations: | | | | | | | | | | | | | | | | | | | | | | | | | |
| Net investment income (loss) | | | | 0.06 | | | | 0.04 | | | | (0.12 | ) | | | (0.04 | ) | | | 0.09 | | | | 0.13 | |
| Net realized and unrealized gain (loss) on investments | | | | 1.91 | | | | (7.01 | ) | | | 2.35 | | | | 4.82 | | | | 4.25 | | | | (2.19 | ) |
| Total from investment operations | | | | 1.97 | | | | (6.97 | ) | | | 2.23 | | | | 4.78 | | | | 4.34 | | | | (2.06 | ) |
| Less distributions from: | | | | | | | | | | | | | | | | | | | | | | | | | |
| Net investment income | | | | — | | | | — | | | | 0.00 | ^ | | | — | | | | 0.06 | | | | 0.06 | |
| Net realized gain | | | | — | | | | 0.03 | | | | 0.64 | | | | 0.17 | | | | — | | | | 0.45 | |
| Total distributions | | | | — | | | | 0.03 | | | | 0.64 | | | | 0.17 | | | | 0.06 | | | | 0.51 | |
| Net asset value, end of year | | | $ | 19.25 | | | $ | 17.28 | | | $ | 24.28 | | | $ | 22.69 | | | $ | 18.08 | | | $ | 13.80 | |
| Total return (%)* | | | | 11.40 | | | | (28.70 | ) | | | 9.93 | | | | 26.45 | | | | 31.46 | | | | (12.70 | ) |
| Ratios to average daily net assets (%)**: | | | | | | | | | | | | | | | | | | | | | | | | | |
| Expenses, before waivers and reimbursements | | | | 1.25 | | | | 1.26 | | | | 1.30 | | | | 1.31 | | | | 1.32 | | | | 1.39 | |
| Expenses, net of waivers and reimbursements | | | | 1.15 | | | | 1.15 | | | | 1.15 | | | | 1.15 | | | | 1.18 | | | | 1.28 | |
| Net investment income (loss), before waivers and reimbursements | | | | 0.58 | | | | 0.09 | | | | (0.65 | ) | | | (0.39 | ) | | | 0.44 | | | | 0.70 | |
| Net investment income (loss), net of waivers and reimbursements | | | | 0.68 | | | | 0.20 | | | | (0.50 | ) | | | (0.23 | ) | | | 0.58 | | | | 0.81 | |
| Class N net assets at the end of the year (in thousands) | | | $ | 37,157 | | | $ | 35,966 | | | $ | 47,234 | | | $ | 19,586 | | | $ | 11,163 | | | $ | 8,715 | |
| Portfolio turnover rate (%)* | | | | 21 | | | | 55 | | | | 18 | | | | 34 | | | | 20 | | | | 33 | |
| | | | | | | | | | | | | | | | | | | | | | | | | | |
| | | | | | | | | | | | | | Class I | |
| | | (unaudited)
Period Ended
June 30, | | | | | | | | | Years Ended December 31, | |
| | | | 2023 | | | 2022 | | | 2021 | | | 2020 | | | 2019 | | | 2018 | |
| Net asset value, beginning of year | | | $ | 17.41 | | | $ | 24.41 | | | $ | 22.80 | | | $ | 18.13 | | | $ | 13.84 | | | $ | 16.44 | |
| Income (loss) from investment operations: | | | | | | | | | | | | | | | | | | | | | | | | | |
| Net investment income (loss) | | | | 0.09 | | | | 0.08 | | | | (0.06 | ) | | | (0.00 | )^ | | | 0.12 | | | | 0.17 | |
| Net realized and unrealized gain (loss) on investments | | | | 1.93 | | | | (7.05 | ) | | | 2.36 | | | | 4.85 | | | | 4.27 | | | | (2.19 | ) |
| Total from investment operations | | | | 2.02 | | | | (6.97 | ) | | | 2.30 | | | | 4.85 | | | | 4.39 | | | | (2.02 | ) |
| Less distributions from: | | | | | | | | | | | | | | | | | | | | | | | | | |
| Net investment income | | | | — | | | | — | | | | 0.05 | | | | 0.01 | | | | 0.10 | | | | 0.13 | |
| Net realized gain | | | | — | | | | 0.03 | | | | 0.64 | | | | 0.17 | | | | — | | | | 0.45 | |
| Total distributions | | | | — | | | | 0.03 | | | | 0.69 | | | | 0.18 | | | | 0.10 | | | | 0.58 | |
| Net asset value, end of year | | | $ | 19.43 | | | $ | 17.41 | | | $ | 24.41 | | | $ | 22.80 | | | $ | 18.13 | | | $ | 13.84 | |
| Total return (%)* | | | | 11.60 | | | | (28.55 | ) | | | 10.17 | | | | 26.77 | | | | 31.76 | | | | (12.45 | ) |
| Ratios to average daily net assets (%)**: | | | | | | | | | | | | | | | | | | | | | | | | | |
| Expenses, before waivers and reimbursements | | | | 1.03 | | | | 1.04 | | | | 0.99 | | | | 1.01 | | | | 1.01 | | | | 1.07 | |
| Expenses, net of waivers and reimbursements | | | | 0.90 | | | | 0.90 | | | | 0.90 | | | | 0.90 | | | | 0.93 | | | | 1.03 | |
| Net investment income (loss), before waivers and reimbursements | | | | 0.82 | | | | 0.28 | | | | (0.33 | ) | | | (0.11 | ) | | | 0.64 | | | | 1.02 | |
| Net investment income (loss), net of waivers and reimbursements | | | | 0.95 | | | | 0.42 | | | | (0.24 | ) | | | (0.00 | ) | | | 0.72 | | | | 1.06 | |
| Class I net assets at the end of the year (in thousands) | | | $ | 432,772 | | | $ | 369,171 | | | $ | 591,500 | | | $ | 393,596 | | | $ | 181,617 | | | $ | 76,382 | |
| Portfolio turnover rate (%)* | | | | 21 | | | | 55 | | | | 18 | | | | 34 | | | | 20 | | | | 33 | |
| * | Rates are not annualized for periods less than a year. |
| ** | Rates are annualized for periods less than a year. |
| ^ | Amount is less than $0.005 per share. |
Note: Net investment income (loss) per share is based on the average shares outstanding during the year.
Performance cited represents past performance. Past performance does not guarantee future results and current performance may be lower or higher than the data quoted. Results shown are annual returns, which assume reinvestment of dividends and capital gains. Investment returns and principal will fluctuate and you may have a gain or loss when you sell shares. For the most current month-end performance information, please call 1-800-742-7272 or visit our Web site at www.williamblairfunds.com.
| June 30, 2023 | William Blair Funds | 139 |
Financial Highlights — For a share outstanding throughout each period
International Leaders Fund
| | | | | | | | | | | | | | Class R6 | |
| | | (unaudited)
Period Ended
June 30, | | | | | | | | | Years Ended December 31, | |
| | | | 2023 | | | 2022 | | | 2021 | | | 2020 | | | 2019 | | | 2018 | |
| Net asset value, beginning of year | | | $ | 17.42 | | | $ | 24.41 | | | $ | 22.80 | | | $ | 18.12 | | | $ | 13.83 | | | $ | 16.43 | |
| Income (loss) from investment operations: | | | | | | | | | | | | | | | | | | | | | | | | | |
| Net investment income (loss) | | | | 0.09 | | | | 0.09 | | | | (0.04 | ) | | | 0.02 | | | | 0.14 | | | | 0.18 | |
| Net realized and unrealized gain (loss) on investments | | | | 1.94 | | | | (7.05 | ) | | | 2.35 | | | | 4.85 | | | | 4.26 | | | | (2.19 | ) |
| Total from investment operations | | | | 2.03 | | | | (6.96 | ) | | | 2.31 | | | | 4.87 | | | | 4.40 | | | | (2.01 | ) |
| Less distributions from: | | | | | | | | | | | | | | | | | | | | | | | | | |
| Net investment income | | | | — | | | | — | | | | 0.06 | | | | 0.02 | | | | 0.11 | | | | 0.14 | |
| Net realized gain | | | | — | | | | 0.03 | | | | 0.64 | | | | 0.17 | | | | — | | | | 0.45 | |
| Total distributions | | | | — | | | | 0.03 | | | | 0.70 | | | | 0.19 | | | | 0.11 | | | | 0.59 | |
| Net asset value, end of year | | | $ | 19.45 | | | $ | 17.42 | | | $ | 24.41 | | | $ | 22.80 | | | $ | 18.12 | | | $ | 13.83 | |
| Total return (%)* | | | | 11.65 | | | | (28.51 | ) | | | 10.22 | | | | 26.88 | | | | 31.83 | | | | (12.38 | ) |
| Ratios to average daily net assets (%)**: | | | | | | | | | | | | | | | | | | | | | | | | | |
| Expenses, before waivers and reimbursements | | | | 0.91 | | | | 0.92 | | | | 0.91 | | | | 0.92 | | | | 0.93 | | | | 0.99 | |
| Expenses, net of waivers and reimbursements | | | | 0.85 | | | | 0.85 | | | | 0.85 | | | | 0.85 | | | | 0.88 | | | | 0.95 | |
| Net investment income (loss), before waivers and reimbursements | | | | 0.93 | | | | 0.44 | | | | (0.24 | ) | | | 0.03 | | | | 0.80 | | | | 1.07 | |
| Net investment income (loss), net of waivers and reimbursements | | | | 0.99 | | | | 0.51 | | | | (0.18 | ) | | | 0.10 | | | | 0.85 | | | | 1.11 | |
| Class R6 net assets at the end of the year (in thousands) | | | $ | 669,572 | | | $ | 599,084 | | | $ | 667,996 | | | $ | 687,171 | | | $ | 461,124 | | | $ | 324,902 | |
| Portfolio turnover rate (%)* | | | | 21 | | | | 55 | | | | 18 | | | | 34 | | | | 20 | | | | 33 | |
| * | Rates are not annualized for periods less than a year. |
| ** | Rates are annualized for periods less than a year. |
Note: Net investment income (loss) per share is based on the average shares outstanding during the year.
Performance cited represents past performance. Past performance does not guarantee future results and current performance may be lower or higher than the data quoted. Results shown are annual returns, which assume reinvestment of dividends and capital gains. Investment returns and principal will fluctuate and you may have a gain or loss when you sell shares. For the most current month-end performance information, please call 1-800-742-7272 or visit our Web site at www.williamblairfunds.com.
| 140 | Semiannual Report | June 30, 2023 |
Financial Highlights — For a share outstanding throughout each period
International Growth Fund
| | | | | | | | | | | | | | Class N | |
| | | (unaudited)
Period Ended
June 30, | | | | | | | | | Years Ended December 31, | |
| | | | 2023 | | | 2022 | | | 2021 | | | 2020 | | | 2019 | | | 2018 | |
| Net asset value, beginning of year | | | $ | 24.92 | | | $ | 37.57 | | | $ | 38.75 | | | $ | 29.68 | | | $ | 23.04 | | | $ | 30.41 | |
| Income (loss) from investment operations: | | | | | | | | | | | | | | | | | | | | | | | | | |
| Net investment income (loss) | | | | 0.12 | | | | 0.11 | | | | (0.28 | ) | | | (0.16 | ) | | | 0.09 | | | | 0.16 | |
| Net realized and unrealized gain (loss) on investments | | | | 2.65 | | | | (10.78 | ) | | | 3.51 | | | | 9.55 | | | | 6.87 | | | | (5.56 | ) |
| Total from investment operations | | | | 2.77 | | | | (10.67 | ) | | | 3.23 | | | | 9.39 | | | | 6.96 | | | | (5.40 | ) |
| Less distributions from: | | | | | | | | | | | | | | | | | | | | | | | | | |
| Net investment income | | | | — | | | | 0.02 | | | | — | | | | 0.06 | | | | 0.32 | | | | 0.12 | |
| Net realized gain | | | | — | | | | 1.96 | | | | 4.41 | | | | 0.26 | | | | — | | | | 1.85 | |
| Total distributions | | | | — | | | | 1.98 | | | | 4.41 | | | | 0.32 | | | | 0.32 | | | | 1.97 | |
| Net asset value, end of year | | | $ | 27.69 | | | $ | 24.92 | | | $ | 37.57 | | | $ | 38.75 | | | $ | 29.68 | | | $ | 23.04 | |
| Total return (%)* | | | | 11.12 | | | | (28.51 | ) | | | 8.68 | | | | 31.64 | | | | 30.24 | | | | (18.00 | ) |
| Ratios to average daily net assets (%)**: | | | | | | | | | | | | | | | | | | | | | | | | | |
| Expenses, before waivers and reimbursements | | | | 1.40 | | | | 1.40 | | | | 1.46 | | | | 1.47 | | | | 1.45 | | | | 1.46 | |
| Expenses, net of waivers and reimbursements | | | | 1.24 | | | | 1.31 | | | | 1.45 | | | | 1.45 | | | | 1.45 | | | | 1.45 | |
| Net investment income (loss), before waivers and reimbursements | | | | 0.75 | | | | 0.30 | | | | (0.68 | ) | | | (0.56 | ) | | | 0.34 | | | | 0.54 | |
| Net investment income (loss), net of waivers and reimbursements | | | | 0.91 | | | | 0.39 | | | | (0.67 | ) | | | (0.54 | ) | | | 0.34 | | | | 0.55 | |
| Class N net assets at the end of the year (in thousands) | | | $ | 306,795 | | | $ | 301,485 | | | $ | 293,481 | | | $ | 288,976 | | | $ | 494,788 | | | $ | 456,533 | |
| Portfolio turnover rate (%)* | | | | 17 | | | | 50 | | | | 19 | | | | 27 | | | | 34 | | | | 78 | |
| | | | | | | | | | | | | | | | | | | | | | | | | | |
| | | | | | | | | | | | | | Class I | |
| | | (unaudited)
Period Ended
June 30, | | | | | | | | | Years Ended December 31, | |
| | | | 2023 | | | 2022 | | | 2021 | | | 2020 | | | 2019 | | | 2018 | |
| Net asset value, beginning of year | | | $ | 25.74 | | | $ | 38.68 | | | $ | 39.65 | | | $ | 30.38 | | | $ | 23.56 | | | $ | 31.13 | |
| Income (loss) from investment operations: | | | | | | | | | | | | | | | | | | | | | | | | | |
| Net investment income (loss) | | | | 0.16 | | | | 0.24 | | | | (0.15 | ) | | | (0.08 | ) | | | 0.18 | | | | 0.26 | |
| Net realized and unrealized gain (loss) on investments | | | | 2.74 | | | | (11.16 | ) | | | 3.59 | | | | 9.79 | | | | 7.03 | | | | (5.70 | ) |
| Total from investment operations | | | | 2.90 | | | | (10.92 | ) | | | 3.44 | | | | 9.71 | | | | 7.21 | | | | (5.44 | ) |
| Less distributions from: | | | | | | | | | | | | | | | | | | | | | | | | | |
| Net investment income | | | | — | | | | 0.06 | | | | — | | | | 0.18 | | | | 0.39 | | | | 0.28 | |
| Net realized gain | | | | — | | | | 1.96 | | | | 4.41 | | | | 0.26 | | | | — | | | | 1.85 | |
| Total distributions | | | | — | | | | 2.02 | | | | 4.41 | | | | 0.44 | | | | 0.39 | | | | 2.13 | |
| Net asset value, end of year | | | $ | 28.64 | | | $ | 25.74 | | | $ | 38.68 | | | $ | 39.65 | | | $ | 30.38 | | | $ | 23.56 | |
| Total return (%)* | | | | 11.27 | | | | (28.33 | ) | | | 9.01 | | | | 31.99 | | | | 30.66 | | | | (17.73 | ) |
| Ratios to average daily net assets (%)**: | | | | | | | | | | | | | | | | | | | | | | | | | |
| Expenses, before waivers and reimbursements | | | | 1.10 | | | | 1.12 | | | | 1.14 | | | | 1.16 | | | | 1.14 | | | | 1.13 | |
| Expenses, net of waivers and reimbursements | | | | 0.99 | | | | 1.06 | | | | 1.14 | | | | 1.16 | | | | 1.14 | | | | 1.13 | |
| Net investment income (loss), before waivers and reimbursements | | | | 1.07 | | | | 0.76 | | | | (0.36 | ) | | | (0.24 | ) | | | 0.65 | | | | 0.86 | |
| Net investment income (loss), net of waivers and reimbursements | | | | 1.18 | | | | 0.82 | | | | (0.36 | ) | | | (0.24 | ) | | | 0.65 | | | | 0.86 | |
| Class I net assets at the end of the year (in thousands) | | | $ | 1,053,140 | | | $ | 981,813 | | | $ | 1,702,775 | | | $ | 1,914,460 | | | $ | 1,552,355 | | | $ | 1,646,811 | |
| Portfolio turnover rate (%)* | | | | 17 | | | | 50 | | | | 19 | | | | 27 | | | | 34 | | | | 78 | |
| * | Rates are not annualized for periods less than a year. |
| ** | Rates are annualized for periods less than a year. |
Note: Net investment income (loss) per share is based on the average shares outstanding during the year.
Performance cited represents past performance. Past performance does not guarantee future results and current performance may be lower or higher than the data quoted. Results shown are annual returns, which assume reinvestment of dividends and capital gains. Investment returns and principal will fluctuate and you may have a gain or loss when you sell shares. For the most current month-end performance information, please call 1-800-742-7272 or visit our Web site at www.williamblairfunds.com.
| June 30, 2023 | William Blair Funds | 141 |
Financial Highlights — For a share outstanding throughout each period
International Growth Fund
| | | | | | | | | | | Class R6 | |
| | | (unaudited)
Period Ended
June 30, | | | | | | Years Ended December 31, | |
| | | | 2023 | | | 2022 | | | 2021 | | | 2020 | | | 2019(a) | |
| Net asset value, beginning of year | | | $ | 25.76 | | | $ | 38.72 | | | $ | 39.66 | | | $ | 30.37 | | | $ | 27.56 | |
| Income (loss) from investment operations: | | | | | | | | | | | | | | | | | | | | | |
| Net investment income (loss) | | | | 0.17 | | | | 0.21 | | | | (0.11 | ) | | | (0.07 | ) | | | (0.05 | ) |
| Net realized and unrealized gain (loss) on investments | | | | 2.74 | | | | (11.13 | ) | | | 3.58 | | | | 9.83 | | | | 3.27 | |
| Total from investment operations | | | | 2.91 | | | | (10.92 | ) | | | 3.47 | | | | 9.76 | | | | 3.22 | |
| Less distributions from: | | | | | | | | | | | | | | | | | | | | | |
| Net investment income | | | | — | | | | 0.08 | | | | — | | | | 0.21 | | | | 0.41 | |
| Net realized gain | | | | — | | | | 1.96 | | | | 4.41 | | | | 0.26 | | | | — | |
| Total distributions | | | | — | | | | 2.04 | | | | 4.41 | | | | 0.47 | | | | 0.41 | |
| Net asset value, end of year | | | $ | 28.67 | | | $ | 25.76 | | | $ | 38.72 | | | $ | 39.66 | | | $ | 30.37 | |
| Total return (%)* | | | | 11.30 | | | | (28.30 | ) | | | 9.09 | | | | 32.16 | | | | 11.71 | |
| Ratios to average daily net assets (%)**: | | | | | | | | | | | | | | | | | | | | | |
| Expenses, before waivers and reimbursements | | | | 1.00 | | | | 1.03 | | | | 1.06 | | | | 1.07 | | | | 1.06 | |
| Expenses, net of waivers and reimbursements | | | | 0.94 | | | | 1.01 | | | | 1.06 | | | | 1.07 | | | | 1.06 | |
| Net investment income (loss), before waivers and reimbursements | | | | 1.16 | | | | 0.69 | | | | (0.25 | ) | | | (0.23 | ) | | | (0.26 | ) |
| Net investment income (loss), net of waivers and reimbursements | | | | 1.22 | | | | 0.71 | | | | (0.25 | ) | | | (0.23 | ) | | | (0.26 | ) |
| Class R6 net assets at the end of the year (in thousands) | | | $ | 160,886 | | | $ | 151,338 | | | $ | 126,641 | | | $ | 109,214 | | | $ | 61,916 | |
| Portfolio turnover rate (%)* | | | | 17 | | | | 50 | | | | 19 | | | | 27 | | | | 34 | |
| (a) | For the period from May 2, 2019 (Commencement of Operations) to December 31, 2019. |
| * | Rates are not annualized for periods less than a year. |
| ** | Rates are annualized for periods less than a year. |
Note: Net investment income (loss) per share is based on the average shares outstanding during the year.
Performance cited represents past performance. Past performance does not guarantee future results and current performance may be lower or higher than the data quoted. Results shown are annual returns, which assume reinvestment of dividends and capital gains. Investment returns and principal will fluctuate and you may have a gain or loss when you sell shares. For the most current month-end performance information, please call 1-800-742-7272 or visit our Web site at www.williamblairfunds.com.
| 142 | Semiannual Report | June 30, 2023 |
Financial Highlights — For a share outstanding throughout each period
Institutional International Growth Fund
| | | | | | | | | | | Institutional | |
| | | (unaudited)
Period Ended
June 30, | | | | | | | | | Years Ended December 31, | |
| | | | 2023 | | | 2022 | | | 2021 | | | 2020 | | | 2019 | | | 2018 | |
| Net asset value, beginning of year | | | $ | 12.82 | | | $ | 19.03 | | | $ | 20.37 | | | $ | 17.35 | | | $ | 13.40 | | | $ | 18.08 | |
| Income (loss) from investment operations: | | | | | | | | | | | | | | | | | | | | | | | | | |
| Net investment income (loss) | | | | 0.08 | | | | 0.11 | | | | (0.05 | ) | | | (0.01 | ) | | | 0.12 | | | | 0.18 | |
| Net realized and unrealized gain (loss) on investments | | | | 1.37 | | | | (5.47 | ) | | | 1.86 | | | | 5.60 | | | | 4.00 | | | | (3.29 | ) |
| Total from investment operations | | | | 1.45 | | | | (5.36 | ) | | | 1.81 | | | | 5.59 | | | | 4.12 | | | | (3.11 | ) |
| Less distributions from: | | | | | | | | | | | | | | | | | | | | | | | | | |
| Net investment income | | | | — | | | | 0.06 | | | | — | | | | 0.02 | | | | 0.17 | | | | 0.17 | |
| Net realized gain | | | | — | | | | 0.79 | | | | 3.15 | | | | 2.55 | | | | — | | | | 1.40 | |
| Total distributions | | | | — | | | | 0.85 | | | | 3.15 | | | | 2.57 | | | | 0.17 | | | | 1.57 | |
| Net asset value, end of year | | | $ | 14.27 | | | $ | 12.82 | | | $ | 19.03 | | | $ | 20.37 | | | $ | 17.35 | | | $ | 13.40 | |
| Total return (%)* | | | | 11.31 | | | | (28.28 | ) | | | 9.39 | | | | 32.47 | | | | 30.75 | | | | (17.50 | ) |
| Ratios to average daily net assets (%)**: | | | | | | | | | | | | | | | | | | | | | | | | | |
| Expenses, before waivers and reimbursements | | | | 1.00 | | | | 1.01 | | | | 1.01 | | | | 1.00 | | | | 0.99 | | | | 0.97 | |
| Expenses, net of waivers and reimbursements | | | | 0.94 | | | | 0.98 | | | | 1.01 | | | | 1.00 | | | | 0.99 | | | | 0.97 | |
| Net investment income (loss), before waivers and reimbursements | | | | 1.12 | | | | 0.71 | | | | (0.22 | ) | | | (0.04 | ) | | | 0.77 | | | | 1.01 | |
| Net investment income (loss), net of waivers and reimbursements | | | | 1.18 | | | | 0.74 | | | | (0.22 | ) | | | (0.04 | ) | | | 0.77 | | | | 1.01 | |
| Net assets at the end of the year (in thousands) | | | $ | 907,742 | | | $ | 908,732 | | | $ | 1,281,843 | | | $ | 1,326,482 | | | $ | 1,892,911 | | | $ | 1,784,435 | |
| Portfolio turnover rate (%)* | | | | 17 | | | | 55 | | | | 19 | | | | 31 | | | | 35 | | | | 82 | |
| * | Rates are not annualized for periods less than a year. |
| ** | Rates are annualized for periods less than a year. |
Note: Net investment income (loss) per share is based on the average shares outstanding during the year.
Performance cited represents past performance. Past performance does not guarantee future results and current performance may be lower or higher than the data quoted. Results shown are annual returns, which assume reinvestment of dividends and capital gains. Investment returns and principal will fluctuate and you may have a gain or loss when you sell shares. For the most current month-end performance information, please call 1-800-742-7272 or visit our Web site at www.williamblairfunds.com.
| June 30, 2023 | William Blair Funds | 143 |
Financial Highlights — For a share outstanding throughout each period
International Small Cap Growth Fund
| | | | | | | | | | | | | | Class N | |
| | | (unaudited)
Period Ended
June 30, | | | | Years Ended December 31, | |
| | | | 2023 | | | 2022 | | | 2021 | | | 2020 | | | 2019 | | | 2018 | |
| Net asset value, beginning of year | | | $ | 10.74 | | | $ | 16.56 | | | $ | 17.45 | | | $ | 13.85 | | | $ | 10.36 | | | $ | 15.49 | |
| Income (loss) from investment operations: | | | | | | | | | | | | | | | | | | | | | | | | | |
| Net investment income (loss) | | | | 0.05 | | | | 0.00 | ^ | | | (0.12 | ) | | | (0.05 | ) | | | 0.05 | | | | 0.04 | |
| Net realized and unrealized gain (loss) on investments | | | | 0.88 | | | | (5.82 | ) | | | 1.91 | | | | 4.01 | | | | 3.45 | | | | (3.78 | ) |
| Total from investment operations | | | | 0.93 | | | | (5.82 | ) | | | 1.79 | | | | 3.96 | | | | 3.50 | | | | (3.74 | ) |
| Less distributions from: | | | | | | | | | | | | | | | | | | | | | | | | | |
| Net investment income | | | | — | | | | — | | | | — | | | | — | | | | 0.01 | | | | 0.08 | |
| Net realized gain | | | | — | | | | — | | | | 2.68 | | | | 0.36 | | | | — | | | | 1.31 | |
| Total distributions | | | | — | | | | — | | | | 2.68 | | | | 0.36 | | | | 0.01 | | | | 1.39 | |
| Net asset value, end of year | | | $ | 11.67 | | | $ | 10.74 | | | $ | 16.56 | | | $ | 17.45 | | | $ | 13.85 | | | $ | 10.36 | |
| Total return (%)* | | | | 8.66 | | | | (35.14 | ) | | | 10.87 | | | | 28.68 | | | | 33.81 | | | | (24.48 | ) |
| Ratios to average daily net assets (%)**: | | | | | | | | | | | | | | | | | | | | | | | | | |
| Expenses | | | | 1.50 | | | | 1.49 | | | | 1.46 | | | | 1.52 | | | | 1.48 | | | | 1.48 | |
| Net investment income (loss) | | | | 0.82 | | | | 0.04 | | | | (0.67 | ) | | | (0.36 | ) | | | 0.45 | | | | 0.29 | |
| Class N net assets at the end of the year (in thousands) | | | $ | 1,728 | | | $ | 1,638 | | | $ | 3,540 | | | $ | 3,101 | | | $ | 3,650 | | | $ | 3,440 | |
| Portfolio turnover rate (%)* | | | | 14 | | | | 51 | | | | 52 | | | | 63 | | | | 38 | | | | 88 | |
| | | | | | | | | | | | | | | | | | | | | | | | | | |
| | | | | | | | | | | | | | Class I | |
| | | (unaudited)
Period Ended
June 30, | | | | | | | | | Years Ended December 31, | |
| | | | 2023 | | | 2022 | | | 2021 | | | 2020 | | | 2019 | | | 2018 | |
| Net asset value, beginning of year | | | $ | 10.90 | | | $ | 16.80 | | | $ | 17.66 | | | $ | 13.98 | | | $ | 10.45 | | | $ | 15.65 | |
| Income (loss) from investment operations: | | | | | | | | | | | | | | | | | | | | | | | | | |
| Net investment income (loss) | | | | 0.06 | | | | 0.03 | | | | (0.07 | ) | | | (0.01 | ) | | | 0.09 | | | | 0.09 | |
| Net realized and unrealized gain (loss) on investments | | | | 0.90 | | | | (5.91 | ) | | | 1.93 | | | | 4.06 | | | | 3.48 | | | | (3.84 | ) |
| Total from investment operations | | | | 0.96 | | | | (5.88 | ) | | | 1.86 | | | | 4.05 | | | | 3.57 | | | | (3.75 | ) |
| Less distributions from: | | | | | | | | | | | | | | | | | | | | | | | | | |
| Net investment income | | | | — | | | | 0.02 | | | | 0.04 | | | | 0.01 | | | | 0.04 | | | | 0.14 | |
| Net realized gain | | | | — | | | | — | | | | 2.68 | | | | 0.36 | | | | — | | | | 1.31 | |
| Total distributions | | | | — | | | | 0.02 | | | | 2.72 | | | | 0.37 | | | | 0.04 | | | | 1.45 | |
| Net asset value, end of year | | | $ | 11.86 | | | $ | 10.90 | | | $ | 16.80 | | | $ | 17.66 | | | $ | 13.98 | | | $ | 10.45 | |
| Total return (%)* | | | | 8.81 | | | | (34.99 | ) | | | 11.17 | | | | 29.04 | | | | 34.22 | | | | (24.29 | ) |
| Ratios to average daily net assets (%)**: | | | | | | | | | | | | | | | | | | | | | | | | | |
| Expenses | | | | 1.23 | | | | 1.23 | | | | 1.19 | | | | 1.25 | | | | 1.21 | | | | 1.18 | |
| Net investment income (loss) | | | | 1.09 | | | | 0.28 | | | | (0.40 | ) | | | (0.05 | ) | | | 0.75 | | | | 0.60 | |
| Class I net assets at the end of the year (in thousands) | | | $ | 102,548 | | | $ | 98,330 | | | $ | 136,573 | | | $ | 145,283 | | | $ | 142,951 | | | $ | 165,451 | |
| Portfolio turnover rate (%)* | | | | 14 | | | | 51 | | | | 52 | | | | 63 | | | | 38 | | | | 88 | |
| * | Rates are not annualized for periods less than a year. |
| ** | Rates are annualized for periods less than a year. |
| ^ | Amount is less than $0.005 per share. |
Note: Net investment income (loss) per share is based on the average shares outstanding during the year.
Performance cited represents past performance. Past performance does not guarantee future results and current performance may be lower or higher than the data quoted. Results shown are annual returns, which assume reinvestment of dividends and capital gains. Investment returns and principal will fluctuate and you may have a gain or loss when you sell shares. For the most current month-end performance information, please call 1-800-742-7272 or visit our Web site at www.williamblairfunds.com.
| 144 | Semiannual Report | June 30, 2023 |
Financial Highlights — For a share outstanding throughout each period
International Small Cap Growth Fund
| | | | | | | | | | | | | | | Class R6 | |
| | | (unaudited)
Period Ended
June 30, | | | | | | | | | Years Ended December 31, | |
| | | | 2023 | | | 2022 | | | 2021 | | | 2020 | | | 2019 | | | 2018 | |
| Net asset value, beginning of year | | | $ | 10.97 | | | $ | 16.91 | | | $ | 17.76 | | | $ | 14.05 | | | $ | 10.50 | | | $ | 15.73 | |
| Income (loss) from investment operations: | | | | | | | | | | | | | | | | | | | | | | | | | |
| Net investment income (loss) | | | | 0.07 | | | | 0.05 | | | | (0.06 | ) | | | 0.00 | ^ | | | 0.11 | | | | 0.10 | |
| Net realized and unrealized gain (loss) on investments | | | | 0.90 | | | | (5.96 | ) | | | 1.95 | | | | 4.09 | | | | 3.49 | | | | (3.85 | ) |
| Total from investment operations | | | | 0.97 | | | | (5.91 | ) | | | 1.89 | | | | 4.09 | | | | 3.60 | | | | (3.75 | ) |
| Less distributions from: | | | | | | | | | | | | | | | | | | | | | | | | | |
| Net investment income | | | | — | | | | 0.03 | | | | 0.06 | | | | 0.02 | | | | 0.05 | | | | 0.17 | |
| Net realized gain | | | | — | | | | — | | | | 2.68 | | | | 0.36 | | | | — | | | | 1.31 | |
| Total distributions | | | | — | | | | 0.03 | | | | 2.74 | | | | 0.38 | | | | 0.05 | | | | 1.48 | |
| Net asset value, end of year | | | $ | 11.94 | | | $ | 10.97 | | | $ | 16.91 | | | $ | 17.76 | | | $ | 14.05 | | | $ | 10.50 | |
| Total return (%)* | | | | 8.84 | | | | (34.94 | ) | | | 11.27 | | | | 29.23 | | | | 34.32 | | | | (24.19 | ) |
| Ratios to average daily net assets (%)**: | | | | | | | | | | | | | | | | | | | | | | | | | |
| Expenses | | | | 1.14 | | | | 1.14 | | | | 1.10 | | | | 1.14 | | | | 1.12 | | | | 1.08 | |
| Net investment income (loss) | | | | 1.17 | | | | 0.38 | | | | (0.31 | ) | | | 0.02 | | | | 0.86 | | | | 0.67 | |
| Class R6 net assets at the end of the year (in thousands) | | | $ | 131,058 | | | $ | 134,982 | | | $ | 243,398 | | | $ | 188,497 | | | $ | 162,465 | | | $ | 171,833 | |
| Portfolio turnover rate (%)* | | | | 14 | | | | 51 | | | | 52 | | | | 63 | | | | 38 | | | | 88 | |
| * | Rates are not annualized for periods less than a year. |
| ** | Rates are annualized for periods less than a year. |
| ^ | Amount is less than $0.005 per share. |
Note: Net investment income (loss) per share is based on the average shares outstanding during the year.
Performance cited represents past performance. Past performance does not guarantee future results and current performance may be lower or higher than the data quoted. Results shown are annual returns, which assume reinvestment of dividends and capital gains. Investment returns and principal will fluctuate and you may have a gain or loss when you sell shares. For the most current month-end performance information, please call 1-800-742-7272 or visit our Web site at www.williamblairfunds.com.
| June 30, 2023 | William Blair Funds | 145 |
Financial Highlights — For a share outstanding throughout each period
Emerging Markets Leaders Fund
| | | | | | | | | | | | | | | Class N | |
| | | (unaudited)
Period Ended
June 30, | | | | | | | | | Years Ended December 31, | |
| | | | 2023 | | | 2022 | | | 2021 | | | 2020 | | | 2019 | | | 2018 | |
| Net asset value, beginning of year | | | $ | 8.29 | | | $ | 11.33 | | | $ | 13.26 | | | $ | 10.51 | | | $ | 8.26 | | | $ | 11.06 | |
| Income (loss) from investment operations: | | | | | | | | | | | | | | | | | | | | | | | | | |
| Net investment income (loss) | | | | 0.05 | | | | 0.02 | | | | (0.06 | ) | | | (0.02 | ) | | | 0.03 | | | | 0.03 | |
| Net realized and unrealized gain (loss) on investments | | | | 0.34 | | | | (2.98 | ) | | | (0.98 | ) | | | 2.88 | | | | 2.28 | | | | (1.97 | ) |
| Total from investment operations | | | | 0.39 | | | | (2.96 | ) | | | (1.04 | ) | | | 2.86 | | | | 2.31 | | | | (1.94 | ) |
| Less distributions from: | | | | | | | | | | | | | | | | | | | | | | | | | |
| Net investment income | | | | — | | | | — | | | | 0.01 | | | | — | | | | 0.04 | | | | 0.07 | |
| Net realized gain | | | | — | | | | 0.08 | | | | 0.88 | | | | 0.11 | | | | 0.02 | | | | 0.79 | |
| Total distributions | | | | — | | | | 0.08 | | | | 0.89 | | | | 0.11 | | | | 0.06 | | | | 0.86 | |
| Net asset value, end of year | | | $ | 8.68 | | | $ | 8.29 | | | $ | 11.33 | | | $ | 13.26 | | | $ | 10.51 | | | $ | 8.26 | |
| Total return (%)* | | | | 4.70 | | | | (26.11 | ) | | | (7.69 | ) | | | 27.23 | | | | 27.98 | | | | (17.73 | ) |
| Ratios to average daily net assets (%)**: | | | | | | | | | | | | | | | | | | | | | | | | | |
| Expenses, before waivers and reimbursements | | | | 1.43 | | | | 1.48 | | | | 1.56 | | | | 1.63 | | | | 1.62 | | | | 1.60 | |
| Expenses, net of waivers and reimbursements | | | | 1.24 | | | | 1.29 | | | | 1.40 | | | | 1.40 | | | | 1.45 | | | | 1.58 | |
| Net investment income (loss), before waivers and reimbursements | | | | 0.95 | | | | 0.05 | | | | (0.64 | ) | | | (0.45 | ) | | | 0.17 | | | | 0.27 | |
| Net investment income (loss), net of waivers and reimbursements | | | | 1.14 | | | | 0.24 | | | | (0.48 | ) | | | (0.22 | ) | | | 0.34 | | | | 0.29 | |
| Class N net assets at the end of the year (in thousands) | | | $ | 1,010 | | | $ | 1,092 | | | $ | 2,096 | | | $ | 1,803 | | | $ | 1,856 | | | $ | 2,239 | |
| Portfolio turnover rate (%)* | | | | 18 | | | | 42 | | | | 40 | | | | 47 | | | | 33 | | | | 52 | |
| | | | | | | | | | | | | | | | | | | | | | | | | | |
| | | | | | | | | | | | | | | | Class I | |
| | | (unaudited)
Period Ended
June 30, | | | | | | | | | Years Ended December 31, | |
| | | | 2023 | | | 2022 | | | 2021 | | | 2020 | | | 2019 | | | 2018 | |
| Net asset value, beginning of year | | | $ | 8.32 | | | $ | 11.33 | | | $ | 13.28 | | | $ | 10.52 | | | $ | 8.27 | | | $ | 11.09 | |
| Income (loss) from investment operations: | | | | | | | | | | | | | | | | | | | | | | | | | |
| Net investment income (loss) | | | | 0.06 | | | | 0.06 | | | | (0.04 | ) | | | (0.00 | )^ | | | 0.06 | | | | 0.06 | |
| Net realized and unrealized gain (loss) on investments | | | | 0.33 | | | | (2.99 | ) | | | (0.98 | ) | | | 2.89 | | | | 2.29 | | | | (1.97 | ) |
| Total from investment operations | | | | 0.39 | | | | (2.93 | ) | | | (1.02 | ) | | | 2.89 | | | | 2.35 | | | | (1.91 | ) |
| Less distributions from: | | | | | | | | | | | | | | | | | | | | | | | | | |
| Net investment income | | | | — | | | | — | | | | 0.05 | | | | 0.02 | | | | 0.08 | | | | 0.12 | |
| Net realized gain | | | | — | | | | 0.08 | | | | 0.88 | | | | 0.11 | | | | 0.02 | | | | 0.79 | |
| Total distributions | | | | — | | | | 0.08 | | | | 0.93 | | | | 0.13 | | | | 0.10 | | | | 0.91 | |
| Net asset value, end of year | | | $ | 8.71 | | | $ | 8.32 | | | $ | 11.33 | | | $ | 13.28 | | | $ | 10.52 | | | $ | 8.27 | |
| Total return (%)* | | | | 4.69 | | | | (25.84 | ) | | | (7.48 | ) | | | 27.52 | | | | 28.36 | | | | (17.45 | ) |
| Ratios to average daily net assets (%)**: | | | | | | | | | | | | | | | | | | | | | | | | | |
| Expenses, before waivers and reimbursements | | | | 1.15 | | | | 1.19 | | | | 1.28 | | | | 1.33 | | | | 1.29 | | | | 1.27 | |
| Expenses, net of waivers and reimbursements | | | | 0.99 | | | | 1.05 | | | | 1.15 | | | | 1.15 | | | | 1.20 | | | | 1.27 | |
| Net investment income (loss), before waivers and reimbursements | | | | 1.26 | | | | 0.46 | | | | (0.40 | ) | | | (0.21 | ) | | | 0.53 | | | | 0.58 | |
| Net investment income (loss), net of waivers and reimbursements | | | | 1.42 | | | | 0.60 | | | | (0.27 | ) | | | (0.03 | ) | | | 0.62 | | | | 0.58 | |
| Class I net assets at the end of the year (in thousands) | | | $ | 19,309 | | | $ | 29,682 | | | $ | 42,750 | | | $ | 62,319 | | | $ | 45,090 | | | $ | 34,786 | |
| Portfolio turnover rate (%)* | | | | 18 | | | | 42 | | | | 40 | | | | 47 | | | | 33 | | | | 52 | |
| * | Rates are not annualized for periods less than a year. |
| ** | Rates are annualized for periods less than a year. |
| ^ | Amount is less than $0.005 per share. |
Note: Net investment income (loss) per share is based on the average shares outstanding during the year.
Performance cited represents past performance. Past performance does not guarantee future results and current performance may be lower or higher than the data quoted. Results shown are annual returns, which assume reinvestment of dividends and capital gains. Investment returns and principal will fluctuate and you may have a gain or loss when you sell shares. For the most current month-end performance information, please call 1-800-742-7272 or visit our Web site at www.williamblairfunds.com.
| 146 | Semiannual Report | June 30, 2023 |
Financial Highlights — For a share outstanding throughout each period
Emerging Markets Leaders Fund
| | | | | | | | | | | | | | | | Class R6 | |
| | | (unaudited)
Period Ended
June 30, | | | | | | | | | Years Ended December 31, | |
| | | | 2023 | | | 2022 | | | 2021 | | | 2020 | | | 2019 | | | 2018 | |
| Net asset value, beginning of year | | | $ | 8.31 | | | $ | 11.32 | | | $ | 13.26 | | | $ | 10.51 | | | $ | 8.26 | | | $ | 11.09 | |
| Income (loss) from investment operations: | | | | | | | | | | | | | | | | | | | | | | | | | |
| Net investment income (loss) | | | | 0.07 | | | | 0.06 | | | | (0.02 | ) | | | 0.00 | ^ | | | 0.06 | | | | 0.07 | |
| Net realized and unrealized gain (loss) on investments | | | | 0.33 | | | | (2.99 | ) | | | (0.98 | ) | | | 2.89 | | | | 2.29 | | | | (1.98 | ) |
| Total from investment operations | | | | 0.40 | | | | (2.93 | ) | | | (1.00 | ) | | | 2.89 | | | | 2.35 | | | | (1.91 | ) |
| Less distributions from: | | | | | | | | | | | | | | | | | | | | | | | | | |
| Net investment income | | | | — | | | | — | | | | 0.06 | | | | 0.03 | | | | 0.08 | | | | 0.13 | |
| Net realized gain | | | | — | | | | 0.08 | | | | 0.88 | | | | 0.11 | | | | 0.02 | | | | 0.79 | |
| Total distributions | | | | — | | | | 0.08 | | | | 0.94 | | | | 0.14 | | | | 0.10 | | | | 0.92 | |
| Net asset value, end of year | | | $ | 8.71 | | | $ | 8.31 | | | $ | 11.32 | | | $ | 13.26 | | | $ | 10.51 | | | $ | 8.26 | |
| Total return (%)* | | | | 4.81 | | | | (25.86 | ) | | | (7.35 | ) | | | 27.50 | | | | 28.45 | | | | (17.46 | ) |
| Ratios to average daily net assets (%)**: | | | | | | | | | | | | | | | | | | | | | | | | | |
| Expenses, before waivers and reimbursements | | | | 1.06 | | | | 1.11 | | | | 1.20 | | | | 1.26 | | | | 1.23 | | | | 1.20 | |
| Expenses, net of waivers and reimbursements | | | | 0.94 | | | | 1.00 | | | | 1.10 | | | | 1.10 | | | | 1.15 | | | | 1.20 | |
| Net investment income (loss), before waivers and reimbursements | | | | 1.42 | | | | 0.50 | | | | (0.26 | ) | | | (0.11 | ) | | | 0.57 | | | | 0.71 | |
| Net investment income (loss), net of waivers and reimbursements | | | | 1.54 | | | | 0.61 | | | | (0.16 | ) | | | 0.05 | | | | 0.65 | | | | 0.71 | |
| Class R6 net assets at the end of the year (in thousands) | | | $ | 280,140 | | | $ | 321,319 | | | $ | 428,839 | | | $ | 198,015 | | | $ | 191,337 | | | $ | 161,889 | |
| Portfolio turnover rate (%)* | | | | 18 | | | | 42 | | | | 40 | | | | 47 | | | | 33 | | | | 52 | |
| * | Rates are not annualized for periods less than a year. |
| ** | Rates are annualized for periods less than a year. |
| ^ | Amount is less than $0.005 per share. |
Note: Net investment income (loss) per share is based on the average shares outstanding during the year.
Performance cited represents past performance. Past performance does not guarantee future results and current performance may be lower or higher than the data quoted. Results shown are annual returns, which assume reinvestment of dividends and capital gains. Investment returns and principal will fluctuate and you may have a gain or loss when you sell shares. For the most current month-end performance information, please call 1-800-742-7272 or visit our Web site at www.williamblairfunds.com.
| June 30, 2023 | William Blair Funds | 147 |
Financial Highlights — For a share outstanding throughout each period
Emerging Markets Growth Fund
| | | | | | | | | | | | | | | | Class N | |
| | | (unaudited)
Period Ended
June 30, | | | | | | | | | Years Ended December 31, | |
| | | | 2023 | | | 2022 | | | 2021 | | | 2020 | | | 2019 | | | 2018 | |
| Net asset value, beginning of year | | | $ | 10.35 | | | $ | 15.55 | | | $ | 18.42 | | | $ | 13.67 | | | $ | 11.14 | | | $ | 16.20 | |
| Income (loss) from investment operations: | | | | | | | | | | | | | | | | | | | | | | | | | |
| Net investment income (loss) | | | | 0.06 | | | | 0.02 | | | | (0.13 | ) | | | (0.09 | ) | | | 0.11 | | | | 0.01 | |
| Net realized and unrealized gain (loss) on investments | | | | 0.48 | | | | (5.20 | ) | | | 0.62 | | | | 5.60 | | | | 2.98 | | | | (3.49 | ) |
| Total from investment operations | | | | 0.54 | | | | (5.18 | ) | | | 0.49 | | | | 5.51 | | | | 3.09 | | | | (3.48 | ) |
| Less distributions from: | | | | | | | | | | | | | | | | | | | | | | | | | |
| Net investment income | | | | — | | | | — | | | | — | | | | — | | | | 0.16 | | | | 0.11 | |
| Net realized gain | | | | — | | | | 0.02 | | | | 3.36 | | | | 0.76 | | | | 0.40 | | | | 1.47 | |
| Total distributions | | | | — | | | | 0.02 | | | | 3.36 | | | | 0.76 | | | | 0.56 | | | | 1.58 | |
| Net asset value, end of year | | | $ | 10.89 | | | $ | 10.35 | | | $ | 15.55 | | | $ | 18.42 | | | $ | 13.67 | | | $ | 11.14 | |
| Total return (%)* | | | | 5.22 | | | | (33.33 | ) | | | 2.97 | | | | 40.43 | | | | 27.89 | | | | (21.61 | ) |
| Ratios to average daily net assets (%)**: | | | | | | | | | | | | | | | | | | | | | | | | | |
| Expenses, before waivers and reimbursements | | | | 1.43 | | | | 1.50 | | | | 1.55 | | | | 1.55 | | | | 1.51 | | | | 1.52 | |
| Expenses, net of waivers and reimbursements | | | | 1.24 | | | | 1.36 | | | | 1.55 | | | | 1.55 | | | | 1.51 | | | | 1.52 | |
| Net investment income (loss), before waivers and reimbursements | | | | 0.99 | | | | 0.07 | | | | (0.65 | ) | | | (0.60 | ) | | | 0.84 | | | | 0.09 | |
| Net investment income (loss), net of waivers and reimbursements | | | | 1.18 | | | | 0.21 | | | | (0.65 | ) | | | (0.60 | ) | | | 0.84 | | | | 0.09 | |
| Class N net assets at the end of the year (in thousands) | | | $ | 15,159 | | | $ | 14,664 | | | $ | 28,565 | | | $ | 18,606 | | | $ | 7,804 | | | $ | 7,103 | |
| Portfolio turnover rate (%)* | | | | 31 | | | | 92 | | | | 52 | | | | 77 | | | | 79 | | | | 113 | |
| | | | | | | | | | | | | | | | | | | | | | | | | | |
| | | | | | | | | | | | | | | | | | | Class I | |
| | | (unaudited)
Period Ended
June 30, | | | | | | | | | Years Ended December 31, | |
| | | | 2023 | | | 2022 | | | 2021 | | | 2020 | | | 2019 | | | 2018 | |
| Net asset value, beginning of year | | | $ | 10.58 | | | $ | 15.85 | | | $ | 18.66 | | | $ | 13.82 | | | $ | 11.25 | | | $ | 16.36 | |
| Income (loss) from investment operations: | | | | | | | | | | | | | | | | | | | | | | | | | |
| Net investment income (loss) | | | | 0.08 | | | | 0.05 | | | | (0.07 | ) | | | (0.05 | ) | | | 0.14 | | | | 0.05 | |
| Net realized and unrealized gain (loss) on investments | | | | 0.48 | | | | (5.30 | ) | | | 0.62 | | | | 5.66 | | | | 3.02 | | | | (3.52 | ) |
| Total from investment operations | | | | 0.56 | | | | (5.25 | ) | | | 0.55 | | | | 5.61 | | | | 3.16 | | | | (3.47 | ) |
| Less distributions from: | | | | | | | | | | | | | | | | | | | | | | | | | |
| Net investment income | | | | — | | | | — | | | | — | | | | 0.01 | | | | 0.19 | | | | 0.17 | |
| Net realized gain | | | | — | | | | 0.02 | | | | 3.36 | | | | 0.76 | | | | 0.40 | | | | 1.47 | |
| Total distributions | | | | — | | | | 0.02 | | | | 3.36 | | | | 0.77 | | | | 0.59 | | | | 1.64 | |
| Net asset value, end of year | | | $ | 11.14 | | | $ | 10.58 | | | $ | 15.85 | | | $ | 18.66 | | | $ | 13.82 | | | $ | 11.25 | |
| Total return (%)* | | | | 5.29 | | | | (33.14 | ) | | | 3.25 | | | | 40.72 | | | | 28.29 | | | | (21.37 | ) |
| Ratios to average daily net assets (%)**: | | | | | | | | | | | | | | | | | | | | | | | | | |
| Expenses, before waivers and reimbursements. | | | | 1.18 | | | | 1.24 | | | | 1.27 | | | | 1.30 | | | | 1.26 | | | | 1.27 | |
| Expenses, net of waivers and reimbursements | | | | 0.99 | | | | 1.11 | | | | 1.27 | | | | 1.30 | | | | 1.26 | | | | 1.27 | |
| Net investment income (loss), before waivers and reimbursements | | | | 1.22 | | | | 0.32 | | | | (0.37 | ) | | | (0.33 | ) | | | 1.06 | | | | 0.34 | |
| Net investment income (loss), net of waivers and reimbursements | | | | 1.41 | | | | 0.45 | | | | (0.37 | ) | | | (0.33 | ) | | | 1.06 | | | | 0.34 | |
| Class I net assets at the end of the year (in thousands) | | | $ | 193,288 | | | $ | 174,884 | | | $ | 190,985 | | | $ | 113,697 | | | $ | 73,496 | | | $ | 79,427 | |
| Portfolio turnover rate (%)* | | | | 31 | | | | 92 | | | | 52 | | | | 77 | | | | 79 | | | | 113 | |
| * | Rates are not annualized for periods less than a year. |
| ** | Rates are annualized for periods less than a year. |
Note: Net investment income (loss) per share is based on the average shares outstanding during the year.
Performance cited represents past performance. Past performance does not guarantee future results and current performance may be lower or higher than the data quoted. Results shown are annual returns, which assume reinvestment of dividends and capital gains. Investment returns and principal will fluctuate and you may have a gain or loss when you sell shares. For the most current month-end performance information, please call 1-800-742-7272 or visit our Web site at www.williamblairfunds.com.
| 148 | Semiannual Report | June 30, 2023 |
Financial Highlights — For a share outstanding throughout each period
Emerging Markets Growth Fund
| | | | | | | | | | | | | | | | | Class R6 | |
| | | (unaudited)
Period Ended
June 30, | | | | | | | | | Years Ended December 31, | |
| | | | 2023 | | | 2022 | | | 2021 | | | 2020 | | | 2019 | | | 2018 | |
| Net asset value, beginning of year | | | $ | 10.71 | | | $ | 16.04 | | | $ | 18.84 | | | $ | 13.94 | | | $ | 11.35 | | | $ | 16.49 | |
| Income (loss) from investment operations: | | | | | | | | | | | | | | | | | | | | | | | | | |
| Net investment income (loss) | | | | 0.08 | | | | 0.06 | | | | (0.05 | ) | | | (0.03 | ) | | | 0.15 | | | | 0.07 | |
| Net realized and unrealized gain (loss) on investments | | | | 0.49 | | | | (5.37 | ) | | | 0.63 | | | | 5.71 | | | | 3.04 | | | | (3.56 | ) |
| Total from investment operations | | | | 0.57 | | | | (5.31 | ) | | | 0.58 | | | | 5.68 | | | | 3.19 | | | | (3.49 | ) |
| Less distributions from: | | | | | | | | | | | | | | | | | | | | | | | | | |
| Net investment income | | | | — | | | | — | | | | 0.02 | | | | 0.02 | | | | 0.20 | | | | 0.18 | |
| Net realized gain | | | | — | | | | 0.02 | | | | 3.36 | | | | 0.76 | | | | 0.40 | | | | 1.47 | |
| Total distributions | | | | — | | | | 0.02 | | | | 3.38 | | | | 0.78 | | | | 0.60 | | | | 1.65 | |
| Net asset value, end of year | | | $ | 11.28 | | | $ | 10.71 | | | $ | 16.04 | | | $ | 18.84 | | | $ | 13.94 | | | $ | 11.35 | |
| Total return (%)* | | | | 5.32 | | | | (33.13 | ) | | | 3.37 | | | | 40.90 | | | | 28.28 | | | | (21.29 | ) |
| Ratios to average daily net assets (%)**: | | | | | | | | | | | | | | | | | | | | | | | | | |
| Expenses, before waivers and reimbursements | | | | 1.07 | | | | 1.14 | | | | 1.17 | | | | 1.20 | | | | 1.19 | | | | 1.19 | |
| Expenses, net of waivers and reimbursements | | | | 0.94 | | | | 1.06 | | | | 1.17 | | | | 1.20 | | | | 1.19 | | | | 1.19 | |
| Net investment income (loss), before waivers and reimbursements | | | | 1.32 | | | | 0.41 | | | | (0.27 | ) | | | (0.22 | ) | | | 1.17 | | | | 0.46 | |
| Net investment income (loss), net of waivers and reimbursements | | | | 1.45 | | | | 0.49 | | | | (0.27 | ) | | | (0.22 | ) | | | 1.17 | | | | 0.46 | |
| Class R6 net assets at the end of the year (in thousands) | | | $ | 514,529 | | | $ | 480,586 | | | $ | 822,288 | | | $ | 1,063,433 | | | $ | 708,892 | | | $ | 654,441 | |
| Portfolio turnover rate (%)* | | | | 31 | | | | 92 | | | | 52 | | | | 77 | | | | 79 | | | | 113 | |
| * | Rates are not annualized for periods less than a year. |
| ** | Rates are annualized for periods less than a year. |
Note: Net investment income (loss) per share is based on the average shares outstanding during the year.
Performance cited represents past performance. Past performance does not guarantee future results and current performance may be lower or higher than the data quoted. Results shown are annual returns, which assume reinvestment of dividends and capital gains. Investment returns and principal will fluctuate and you may have a gain or loss when you sell shares. For the most current month-end performance information, please call 1-800-742-7272 or visit our Web site at www.williamblairfunds.com.
| June 30, 2023 | William Blair Funds | 149 |
Financial Highlights — For a share outstanding throughout each period
Emerging Markets ex China Growth Fund
| | | Class I | |
| | | (unaudited)
Period Ended
June 30, | | | Period Ended
December 31, | |
| | | | 2023 | | | | 2022(a) | |
| Net asset value, beginning of year | | | $ | 9.41 | | | | $ | 10.00 | |
| Income (loss) from investment operations: | | | | | | | | | | |
| Net investment income (loss) | | | | 0.08 | | | | | 0.02 | |
| Net realized and unrealized gain (loss) on investments | | | | 1.19 | | | | | (0.61 | ) |
| Total from investment operations | | | | 1.27 | | | | | (0.59 | ) |
| Less distributions from: | | | | | | | | | | |
| Net investment income | | | | — | | | | | — | |
| Net realized gain | | | | — | | | | | — | |
| Total distributions | | | | — | | | | | — | |
| Net asset value, end of year | | | $ | 10.68 | | | | $ | 9.41 | |
| Total return (%)* | | | | 13.50 | | | | | (5.90 | ) |
| Ratios to average daily net assets (%)**: | | | | | | | | | | |
| Expenses, before waivers and reimbursements | | | | 2.34 | | | | | 2.77 | |
| Expenses, net of waivers and reimbursements | | | | 0.99 | | | | | 0.99 | |
| Net investment income (loss), before waivers and reimbursements | | | | 0.21 | | | | | (1.40 | ) |
| Net investment income (loss), net of waivers and reimbursements | | | | 1.56 | | | | | 0.38 | |
| Class I net assets at the end of the year (in thousands) | | | $ | 1,470 | | | | $ | 9 | |
| Portfolio turnover rate (%)* | | | | 30 | | | | | 64 | |
| | | | | | | | | | | |
| | | Class R6 | |
| | | (unaudited)
Period Ended
June 30, | | | Period Ended
December 31, | |
| | | | 2023 | | | | 2022(a) | |
| Net asset value, beginning of year | | | $ | 9.42 | | | | $ | 10.00 | |
| Income (loss) from investment operations: | | | | | | | | | | |
| Net investment income (loss) | | | | 0.06 | | | | | 0.02 | |
| Net realized and unrealized gain (loss) on investments | | | | 1.21 | | | | | (0.60 | ) |
| Total from investment operations | | | | 1.27 | | | | | (0.58 | ) |
| Less distributions from: | | | | | | | | | | |
| Net investment income | | | | — | | | | | — | |
| Net realized gain | | | | — | | | | | — | |
| Total distributions | | | | — | | | | | — | |
| Net asset value, end of year | | | $ | 10.69 | | | | $ | 9.42 | |
| Total return (%)* | | | | 13.48 | | | | | (5.80 | ) |
| Ratios to average daily net assets (%)**: | | | | | | | | | | |
| Expenses, before waivers and reimbursements | | | | 2.27 | | | | | 2.78 | |
| Expenses, net of waivers and reimbursements | | | | 0.94 | | | | | 0.94 | |
| Net investment income (loss), before waivers and reimbursements | | | | (0.08 | ) | | | | (1.42 | ) |
| Net investment income (loss), net of waivers and reimbursements | | | | 1.25 | | | | | 0.42 | |
| Class R6 net assets at the end of the year (in thousands) | | | $ | 17,660 | | | | $ | 13,024 | |
| Portfolio turnover rate (%)* | | | | 30 | | | | | 64 | |
| (a) | For the period from July 29, 2022 (Commencement of Operations) to December 31, 2022. |
| * | Rates are not annualized for periods less than a year. |
| ** | Rates are annualized for periods less than a year. |
Note: Net investment income (loss) per share is based on the average shares outstanding during the year.
Performance cited represents past performance. Past performance does not guarantee future results and current performance may be lower or higher than the data quoted. Results shown are annual returns, which assume reinvestment of dividends and capital gains. Investment returns and principal will fluctuate and you may have a gain or loss when you sell shares. For the most current month-end performance information, please call 1-800-742-7272 or visit our Web site at www.williamblairfunds.com.
| 150 | Semiannual Report | June 30, 2023 |
Financial Highlights — For a share outstanding throughout each period
Emerging Markets Small Cap Growth Fund
| | | Class N | |
| | | (unaudited)
Period Ended
June 30, | | | Years Ended December 31, | |
| | | | 2023 | | | 2022 | | | 2021 | | | 2020 | | | 2019 | | | 2018 | |
| Net asset value, beginning of year | | | $ | 16.13 | | | $ | 23.52 | | | $ | 22.22 | | | $ | 16.80 | | | $ | 13.96 | | | $ | 18.66 | |
| Income (loss) from investment operations: | | | | | | | | | | | | | | | | | | | | | | | | | |
| Net investment income (loss) | | | | 0.04 | | | | (0.01 | ) | | | (0.20 | ) | | | (0.06 | ) | | | 0.00 | ^ | | | (0.02 | ) |
| Net realized and unrealized gain (loss) on investments | | | | 1.89 | | | | (6.59 | ) | | | 3.53 | | | | 5.48 | | | | 2.84 | | | | (4.38 | ) |
| Total from investment operations | | | | 1.93 | | | | (6.60 | ) | | | 3.33 | | | | 5.42 | | | | 2.84 | | | | (4.40 | ) |
| Less distributions from: | | | | | | | | | | | | | | | | | | | | | | | | | |
| Net investment income | | | | — | | | | — | | | | — | | | | — | | | | — | | | | — | |
| Net realized gain | | | | — | | | | 0.79 | | | | 2.03 | | | | — | | | | — | | | | 0.30 | |
| Total distributions | | | | — | | | | 0.79 | | | | 2.03 | | | | — | | | | — | | | | 0.30 | |
| Net asset value, end of year | | | $ | 18.06 | | | $ | 16.13 | | | $ | 23.52 | | | $ | 22.22 | | | $ | 16.80 | | | $ | 13.96 | |
| Total return (%)* | | | | 11.90 | | | | (28.12 | ) | | | 15.23 | | | | 32.26 | | | | 20.34 | | | | (23.57 | ) |
| Ratios to average daily net assets (%)**: | | | | | | | | | | | | | | | | | | | | | | | | | |
| Expenses, before waivers and reimbursements | | | | 1.70 | | | | 1.69 | | | | 1.60 | | | | 1.77 | | | | 1.71 | | | | 1.70 | |
| Expenses, net of waivers and reimbursements | | | | 1.50 | | | | 1.55 | | | | 1.55 | | | | 1.55 | | | | 1.55 | | | | 1.58 | |
| Net investment income (loss), before waivers and reimbursements | | | | 0.31 | | | | (0.18 | ) | | | (0.88 | ) | | | (0.58 | ) | | | (0.14 | ) | | | (0.22 | ) |
| Net investment income (loss), net of waivers and reimbursements | | | | 0.51 | | | | (0.04 | ) | | | (0.83 | ) | | | (0.36 | ) | | | 0.02 | | | | (0.10 | ) |
| Class N net assets at the end of the year (in thousands) | | | $ | 3,514 | | | $ | 3,069 | | | $ | 4,262 | | | $ | 3,947 | | | $ | 4,025 | | | $ | 8,977 | |
| Portfolio turnover rate (%)* | | | | 57 | | | | 101 | | | | 76 | | | | 119 | | | | 142 | | | | 187 | |
| | | | | | | | | | | | | | | | | | | | | | | | | | |
| | | Class I | |
| | | (unaudited)
Period Ended
June 30, | | | Years Ended December 31, | |
| | | | 2023 | | | 2022 | | | 2021 | | | 2020 | | | 2019 | | | 2018 | |
| Net asset value, beginning of year | | | $ | 16.37 | | | $ | 23.79 | | | $ | 22.40 | | | $ | 16.90 | | | $ | 14.03 | | | $ | 18.73 | |
| Income (loss) from investment operations: | | | | | | | | | | | | | | | | | | | | | | | | | |
| Net investment income (loss) | | | | 0.06 | | | | 0.04 | | | | (0.14 | ) | | | (0.02 | ) | | | 0.04 | | | | 0.03 | |
| Net realized and unrealized gain (loss) on investments | | | | 1.92 | | | | (6.67 | ) | | | 3.56 | | | | 5.53 | | | | 2.86 | | | | (4.41 | ) |
| Total from investment operations | | | | 1.98 | | | | (6.63 | ) | | | 3.42 | | | | 5.51 | | | | 2.90 | | | | (4.38 | ) |
| Less distributions from: | | | | | | | | | | | | | | | | | | | | | | | | | |
| Net investment income | | | | — | | | | — | | | | — | | | | 0.01 | | | | 0.03 | | | | 0.02 | |
| Net realized gain | | | | — | | | | 0.79 | | | | 2.03 | | | | — | | | | — | | | | 0.30 | |
| Total distributions | | | | — | | | | 0.79 | | | | 2.03 | | | | 0.01 | | | | 0.03 | | | | 0.32 | |
| Net asset value, end of year | | | $ | 18.35 | | | $ | 16.37 | | | $ | 23.79 | | | $ | 22.40 | | | $ | 16.90 | | | $ | 14.03 | |
| Total return (%)* | | | | 12.10 | | | | (27.93 | ) | | | 15.51 | | | | 32.60 | | | | 20.58 | | | | (23.31 | ) |
| Ratios to average daily net assets (%)**: | | | | | | | | | | | | | | | | | | | | | | | | | |
| Expenses, before waivers and reimbursements | | | | 1.43 | | | | 1.40 | | | | 1.31 | | | | 1.45 | | | | 1.40 | | | | 1.38 | |
| Expenses, net of waivers and reimbursements | | | | 1.25 | | | | 1.30 | | | | 1.30 | | | | 1.30 | | | | 1.30 | | | | 1.33 | |
| Net investment income (loss), before waivers and reimbursements | | | | 0.54 | | | | 0.11 | | | | (0.59 | ) | | | (0.25 | ) | | | 0.18 | | | | 0.13 | |
| Net investment income (loss), net of waivers and reimbursements | | | | 0.72 | | | | 0.21 | | | | (0.58 | ) | | | (0.10 | ) | | | 0.28 | | | | 0.18 | |
| Class I net assets at the end of the year (in thousands) | | | $ | 124,691 | | | $ | 108,401 | | | $ | 171,994 | | | $ | 151,302 | | | $ | 142,885 | | | $ | 169,770 | |
| Portfolio turnover rate (%)* | | | | 57 | | | | 101 | | | | 76 | | | | 119 | | | | 142 | | | | 187 | |
| * | Rates are not annualized for periods less than a year. |
| ** | Rates are annualized for periods less than a year. |
| ^ | Amount is less than $0.005 per share. |
Note: Net investment income (loss) per share is based on the average shares outstanding during the year.
Performance cited represents past performance. Past performance does not guarantee future results and current performance may be lower or higher than the data quoted. Results shown are annual returns, which assume reinvestment of dividends and capital gains. Investment returns and principal will fluctuate and you may have a gain or loss when you sell shares. For the most current month-end performance information, please call 1-800-742-7272 or visit our Web site at www.williamblairfunds.com.
| June 30, 2023 | William Blair Funds | 151 |
Financial Highlights — For a share outstanding throughout each period
Emerging Markets Small Cap Growth Fund
| | | Class R6 | |
| | | (unaudited)
Period Ended
June 30, | | | Years Ended December 31, | |
| | | | 2023 | | | 2022 | | | 2021 | | | 2020 | | | 2019 | | | 2018 | |
| Net asset value, beginning of year | | | $ | 16.41 | | | $ | 23.84 | | | $ | 22.44 | | | $ | 16.93 | | | $ | 14.06 | | | $ | 18.76 | |
| Income (loss) from investment operations: | | | | | | | | | | | | | | | | | | | | | | | | | |
| Net investment income (loss) | | | | 0.07 | | | | 0.05 | | | | (0.12 | ) | | | (0.00 | )^ | | | 0.05 | | | | 0.05 | |
| Net realized and unrealized gain (loss) on investments | | | | 1.92 | | | | (6.69 | ) | | | 3.56 | | | | 5.53 | | | | 2.86 | | | | (4.41 | ) |
| Total from investment operations | | | | 1.99 | | | | (6.64 | ) | | | 3.44 | | | | 5.53 | | | | 2.91 | | | | (4.36 | ) |
| Less distributions from: | | | | | | | | | | | | | | | | | | | | | | | | | |
| Net investment income | | | | — | | | | — | | | | 0.01 | | | | 0.02 | | | | 0.04 | | | | 0.04 | |
| Net realized gain | | | | — | | | | 0.79 | | | | 2.03 | | | | — | | | | — | | | | 0.30 | |
| Total distributions | | | | — | | | | 0.79 | | | | 2.04 | | | | 0.02 | | | | 0.04 | | | | 0.34 | |
| Net asset value, end of year | | | $ | 18.40 | | | $ | 16.41 | | | $ | 23.84 | | | $ | 22.44 | | | $ | 16.93 | | | $ | 14.06 | |
| Total return (%)* | | | | 12.13 | | | | (27.91 | ) | | | 15.58 | | | | 32.66 | | | | 20.69 | | | | (23.24 | ) |
| Ratios to average daily net assets (%)**: | | | | | | | | | | | | | | | | | | | | | | | | | |
| Expenses, before waivers and reimbursements | | | | 1.33 | | | | 1.31 | | | | 1.23 | | | | 1.36 | | | | 1.33 | | | | 1.30 | |
| Expenses, net of waivers and reimbursements | | | | 1.20 | | | | 1.25 | | | | 1.23 | | | | 1.25 | | | | 1.25 | | | | 1.25 | |
| Net investment income (loss), before waivers and reimbursements | | | | 0.67 | | | | 0.18 | | | | (0.49 | ) | | | (0.14 | ) | | | 0.27 | | | | 0.22 | |
| Net investment income (loss), net of waivers and reimbursements | | | | 0.80 | | | | 0.24 | | | | (0.49 | ) | | | (0.03 | ) | | | 0.35 | | | | 0.27 | |
| Class R6 net assets at the end of the year (in thousands) | | | $ | 235,187 | | | $ | 211,203 | | | $ | 324,152 | | | $ | 152,160 | | | $ | 130,711 | | | $ | 98,188 | |
| Portfolio turnover rate (%)* | | | | 57 | | | | 101 | | | | 76 | | | | 119 | | | | 142 | | | | 187 | |
| * | Rates are not annualized for periods less than a year. |
| ** | Rates are annualized for periods less than a year. |
| ^ | Amount is less than $0.005 per share. |
Note: Net investment income (loss) per share is based on the average shares outstanding during the year.
Performance cited represents past performance. Past performance does not guarantee future results and current performance may be lower or higher than the data quoted. Results shown are annual returns, which assume reinvestment of dividends and capital gains. Investment returns and principal will fluctuate and you may have a gain or loss when you sell shares. For the most current month-end performance information, please call 1-800-742-7272 or visit our Web site at www.williamblairfunds.com.
| 152 | Semiannual Report | June 30, 2023 |
Financial Highlights — For a share outstanding throughout each period
China Growth Fund
| | | Class I | |
| | | (unaudited)
Period Ended
June 30, | | | Years Ended December 31, | |
| | | | 2023 | | | 2022 | | | 2021(a) | |
| Net asset value, beginning of year | | | $ | 6.46 | | | $ | 9.54 | | | $ | 10.00 | |
| Income (loss) from investment operations: | | | | | | | | | | | | | |
| Net investment income (loss) | | | | 0.04 | | | | 0.03 | | | | (0.04 | ) |
| Net realized and unrealized gain (loss) on investments | | | | (1.01 | ) | | | (3.11 | ) | | | (0.42 | ) |
| Total from investment operations | | | | (0.97 | ) | | | (3.08 | ) | | | (0.46 | ) |
| Less distributions from: | | | | | | | | | | | | | |
| Net investment income | | | | — | | | | — | | | | — | |
| Net realized gain | | | | — | | | | — | | | | — | |
| Total distributions | | | | — | | | | — | | | | — | |
| Net asset value, end of year | | | $ | 5.49 | | | $ | 6.46 | | | $ | 9.54 | |
| Total return (%)* | | | | (15.02 | ) | | | (32.43 | ) | | | (4.40 | ) |
| Ratios to average daily net assets (%)**: | | | | | | | | | | | | | |
| Expenses, before waivers and reimbursements | | | | 8.29 | | | | 5.31 | | | | 4.74 | |
| Expenses, net of waivers and reimbursements | | | | 0.99 | | | | 1.01 | | | | 1.05 | |
| Net investment income (loss), before waivers and reimbursements | | | | (5.90 | ) | | | (3.90 | ) | | | (4.69 | ) |
| Net investment income (loss), net of waivers and reimbursements | | | | 1.40 | | | | 0.40 | | | | (1.00 | ) |
| Class I net assets at the end of the year (in thousands) | | | $ | 371 | | | $ | 509 | | | $ | 5,538 | |
| Portfolio turnover rate (%)* | | | | 34 | | | | 36 | | | | 4 | |
| | | | | | | | | | | | | | |
| | | Class R6 | |
| | | (unaudited)
Period Ended
June 30, | | | Years Ended December 31, | |
| | | | 2023 | | | 2022 | | | 2021(a) | |
| Net asset value, beginning of year | | | $ | 6.45 | | | $ | 9.54 | | | $ | 10.00 | |
| Income (loss) from investment operations: | | | | | | | | | | | | | |
| Net investment income (loss) | | | | 0.04 | | | | 0.02 | | | | (0.03 | ) |
| Net realized and unrealized gain (loss) on investments | | | | (1.02 | ) | | | (3.11 | ) | | | (0.43 | ) |
| Total from investment operations | | | | (0.98 | ) | | | (3.09 | ) | | | (0.46 | ) |
| Less distributions from: | | | | | | | | | | | | | |
| Net investment income | | | | — | | | | — | | | | — | |
| Net realized gain | | | | — | | | | — | | | | — | |
| Total distributions | | | | — | | | | — | | | | — | |
| Net asset value, end of year | | | $ | 5.47 | | | $ | 6.45 | | | $ | 9.54 | |
| Total return (%)* | | | | (15.19 | ) | | | (32.49 | ) | | | (4.40 | ) |
| Ratios to average daily net assets (%)**: | | | | | | | | | | | | | |
| Expenses, before waivers and reimbursements | | | | 8.26 | | | | 5.27 | | | | 4.72 | |
| Expenses, net of waivers and reimbursements | | | | 0.94 | | | | 0.96 | | | | 1.00 | |
| Net investment income (loss), before waivers and reimbursements | | | | (6.15 | ) | | | (4.01 | ) | | | (4.61 | ) |
| Net investment income (loss), net of waivers and reimbursements | | | | 1.17 | | | | 0.30 | | | | (0.89 | ) |
| Class R6 net assets at the end of the year (in thousands) | | | $ | 966 | | | $ | 1,438 | | | $ | 1,687 | |
| Portfolio turnover rate (%)* | | | | 34 | | | | 36 | | | | 4 | |
| (a) | For the period from August 27, 2021 (Commencement of Operations) to December 31, 2021. |
| * | Rates are not annualized for periods less than a year. |
| ** | Rates are annualized for periods less than a year. |
Note: Net investment income (loss) per share is based on the average shares outstanding during the year.
Performance cited represents past performance. Past performance does not guarantee future results and current performance may be lower or higher than the data quoted. Results shown are annual returns, which assume reinvestment of dividends and capital gains. Investment returns and principal will fluctuate and you may have a gain or loss when you sell shares. For the most current month-end performance information, please call 1-800-742-7272 or visit our Web site at www.williamblairfunds.com.
| June 30, 2023 | William Blair Funds | 153 |
Financial Highlights — For a share outstanding throughout each period
Emerging Markets Debt Fund
| | | Class I | |
| | | (unaudited)
Period Ended
June 30, | | | Years Ended December 31, | |
| | | | 2023 | | | 2022 | | | 2021(a) | |
| Net asset value, beginning of year | | | $ | 7.44 | | | $ | 9.59 | | | $ | 10.00 | |
| Income (loss) from investment operations: | | | | | | | | | | | | | |
| Net investment income (loss) | | | | 0.25 | | | | 0.48 | | | | 0.27 | |
| Net realized and unrealized gain (loss) on investments | | | | 0.13 | | | | (2.10 | ) | | | (0.40 | ) |
| Total from investment operations | | | | 0.38 | | | | (1.62 | ) | | | (0.13 | ) |
| Less distributions from: | | | | | | | | | | | | | |
| Net investment income | | | | 0.25 | | | | 0.51 | | | | 0.28 | |
| Net realized gain | | | | — | | | | — | | | | — | |
| Return of Capital | | | | — | | | | 0.02 | | | | — | |
| Total distributions | | | | 0.25 | | | | 0.53 | | | | 0.28 | |
| Net asset value, end of year | | | $ | 7.57 | | | $ | 7.44 | | | $ | 9.59 | |
| Total return (%)* | | | | 5.14 | | | | (16.93 | ) | | | (1.39 | ) |
| Ratios to average daily netassets (%)**: | | | | | | | | | | | | | |
| Expenses, before waivers and reimbursements | | | | 1.21 | | | | 1.28 | | | | 1.24 | |
| Expenses, net of waivers and reimbursements | | | | 0.70 | | | | 0.70 | | | | 0.70 | |
| Net investment income (loss), before waivers and reimbursements | | | | 6.34 | | | | 5.39 | | | | 4.02 | |
| Net investment income (loss), net of waivers and reimbursements | | | | 6.85 | | | | 5.97 | | | | 4.56 | |
| Class I net assets at the end of the year (in thousands) | | | $ | 1,075 | | | $ | 923 | | | $ | 1,484 | |
| Portfolio turnover rate (%)* | | | | 53 | | | | 118 | | | | 72 | |
| | | | | | | | | | | | | | |
| | | Class R6 | |
| | | (unaudited)
Period Ended
June 30, | | | Years Ended December 31, | |
| | | | 2023 | | | 2022 | | | 2021(a) | |
| Net asset value, beginning of year | | | $ | 7.44 | | | $ | 9.59 | | | $ | 10.00 | |
| Income (loss) from investment operations: | | | | | | | | | | | | | |
| Net investment income (loss) | | | | 0.26 | | | | 0.48 | | | | 0.28 | |
| Net realized and unrealized gain (loss) on investments | | | | 0.11 | | | | (2.09 | ) | | | (0.41 | ) |
| Total from investment operations | | | | 0.37 | | | | (1.61 | ) | | | (0.13 | ) |
| Less distributions from: | | | | | | | | | | | | | |
| Net investment income | | | | 0.25 | | | | 0.52 | | | | 0.28 | |
| Net realized gain | | | | — | | | | — | | | | — | |
| Return of Capital | | | | — | | | | 0.02 | | | | — | |
| Total distributions | | | | 0.25 | | | | 0.54 | | | | 0.28 | |
| Net asset value, end of year | | | $ | 7.56 | | | $ | 7.44 | | | $ | 9.59 | |
| Total return (%)* | | | | 5.16 | | | | (16.95 | ) | | | (1.32 | ) |
| Ratios to average daily net assets (%)**: | | | | | | | | | | | | | |
| Expenses, before waivers and reimbursements | | | | 1.13 | | | | 1.20 | | | | 1.17 | |
| Expenses, net of waivers and reimbursements | | | | 0.65 | | | | 0.65 | | | | 0.65 | |
| Net investment income (loss), before waivers and reimbursements | | | | 6.41 | | | | 5.50 | | | | 4.10 | |
| Net investment income (loss), net of waivers and reimbursements | | | | 6.89 | | | | 6.05 | | | | 4.62 | |
| Class R6 net assets at the end of the year (in thousands) | | | $ | 47,047 | | | $ | 44,903 | | | $ | 50,010 | |
| Portfolio turnover rate (%)* | | | | 53 | | | | 118 | | | | 72 | |
| (a) | For the period from May 25, 2021 (Commencement of Operations) to December 31, 2021. |
| * | Rates are not annualized for periods less than a year. |
| ** | Rates are annualized for periods less than a year. |
Note: Net investment income (loss) per share is based on the average shares outstanding during the year.
Performance cited represents past performance. Past performance does not guarantee future results and current performance may be lower or higher than the data quoted. Results shown are annual returns, which assume reinvestment of dividends and capital gains. Investment returns and principal will fluctuate and you may have a gain or loss when you sell shares. For the most current month-end performance information, please call 1-800-742-7272 or visit our Web site at www.williamblairfunds.com.
| 154 | Semiannual Report | June 30, 2023 |
RENEWAL OF THE MANAGEMENT AGREEMENT
On April 26, 2023, the Board of Trustees (the “Board”) of the William Blair Funds (the “Trust”), including the Trustees who are not “interested persons” of the Trust as defined by the Investment Company Act of 1940, as amended (the “Independent Trustees”), approved the renewal for an additional one-year term of the Trust’s Management Agreement with William Blair Investment Management, LLC (the “Adviser”) on behalf of each of the William Blair Funds (each, a “Fund” and collectively, the “Funds”). In deciding to approve the renewal of the Management Agreement, the Board did not identify any single factor or group of factors as all important or controlling and considered all factors together. The Board did not allot a particular weight to any one factor or group of factors.
The information in this summary outlines the Board’s considerations associated with its renewal of the Management Agreement. In connection with its deliberations regarding the continuation of the Management Agreement, the Board considered such information and factors as it believed to be necessary to evaluate the terms of the Management Agreement. As described below, the Board considered the nature, quality and extent of the services performed by the Adviser under the Management Agreement; the investment performance of each Fund and the Adviser; comparative management fees and expense ratios as prepared by an independent provider (Broadridge); the estimated profitability realized by the Adviser; the extent to which the Adviser realizes economies of scale as a Fund grows; and whether fall-out benefits are being realized by the Adviser. In addition, the Independent Trustees discussed the renewal of the Management Agreement with Trust management and in private sessions with independent legal counsel at which no representatives of the Adviser were present.
The Board, including the Independent Trustees, considered the renewal of the Management Agreement pursuant to a process that concluded at the Board’s April 26, 2023 meeting. In preparation for the review process, the Independent Trustees considered the type and nature of information to be requested, and independent legal counsel sent a formal request for information to the Adviser. The Adviser provided extensive information in response to the request. After reviewing the information received, the Independent Trustees requested supplemental information, which the Adviser provided. The Independent Trustees also received a memorandum from legal counsel advising them of their duties and responsibilities in connection with the consideration of the Management Agreement. The Independent Trustees reviewed comparative performance for a performance peer universe and peer group of funds and comparative management fees and expense ratios for an expense peer group and an expense peer universe of funds provided by Broadridge for each Fund. In addition, the Independent Trustees considered: (1) the nature, quality and extent of the services provided by the Adviser; (2) information comparing the performance of each Fund to one or more relevant securities indexes; (3) information comparing management fees of each Fund to fees charged by the Adviser to other funds and client accounts with similar investment strategies; (4) the estimated allocated direct or indirect costs of services provided and estimated profits realized by the Adviser for both the Trust as a whole and each Fund individually; and (5) information describing other benefits to the Adviser and its affiliate, William Blair & Company, L.L.C. (the “Distributor”), resulting from their relationship with the Funds. The Independent Trustees also noted that they receive information from the Adviser regarding the Funds throughout the year in connection with regular Board meetings, including presentations from portfolio managers. In addition, the Adviser made a presentation to the Board regarding the contract review information, including addressing the supplemental information requests, and answered questions from the Independent Trustees. The Board, including the Independent Trustees, determined that, given the totality of the information provided with respect to the Management Agreement, the Board had received sufficient information to renew the Management Agreement. The Independent Trustees noted that in evaluating the Management Agreement, they were taking into account their accumulated experience as Board members in working with the Adviser on matters relating to the Funds. Based on their review, the Independent Trustees concluded that it was in the best interest of each Fund to renew the Management Agreement and, accordingly, recommended to the Board of the Trust the renewal of the Management Agreement for each Fund. The Board considered the recommendation of the Independent Trustees along with other factors that the Board deemed relevant.
Nature, Quality and Extent of Services. In evaluating the nature, quality and extent of the services provided by the Adviser to the Funds, the Board noted that the Adviser is a quality firm with a reputation for integrity and honesty that employs high-quality people and has a long association with the Funds. The Board believes that a long-term relationship with a capable, conscientious adviser is in the best interests of shareholders, and that shareholders have invested in the Funds knowing that the Adviser manages the Funds and knowing the management fees. The Board considered the Adviser’s fundamental research approach in actively managed, process-oriented investing. The Board considered biographical information about the Trust’s officers, other Adviser personnel and the Funds’ portfolio managers, including information on the portfolio managers’ personal investments in the Fund(s) they manage. The Board also considered the administrative services performed by the Adviser, financial information regarding the Adviser, the Adviser’s execution quality and use of soft dollars, risk management oversight, compliance program and the expense limitations proposed for each of the Funds’ share classes. In addition, the Board considered
| June 30, 2023 | William Blair Funds | 155 |
the nature, quality and extent of the services that the Adviser provides to the Funds compared to the services that the Adviser provides to other clients. The Board noted that the Adviser pays the compensation of all of the officers of the Trust. Based upon all relevant factors, the Board concluded that the nature, quality and extent of the services provided by the Adviser to each Fund were appropriate.
Performance. The Board reviewed information on the annualized net total returns of Class I shares of the Funds (except for the Institutional International Growth Fund, which does not have share classes) for the one-, three-, five- and ten-year periods ended December 31, 2022, as applicable, along with annualized total return information for a Morningstar performance peer universe of funds and one or more benchmark securities indexes. The Morningstar performance peer universe for each Fund included all funds in the same Morningstar category as the Fund. For purposes of this report, Class I shares were used for comparison purposes for all Funds (except for the Institutional International Growth Fund, which does not have share classes) as the Board noted that Class I shares represent the largest percentage of assets in the Trust. In evaluating performance, the Board recognized that the performance data reflects a snapshot of periods as of a particular date and that selecting different performance periods produces different results.
The Board considered that the Adviser seeks to provide superior performance over the long term and was committed to managing each Fund consistently with the Fund’s stated investment strategies and that at times relative performance will be affected by whether the market environment favors or disfavors particular investments, styles and/or market capitalizations. The Board considered that the Adviser had managed the Funds consistent with their respective investment strategies. Based on the information provided, the Board considered the following with respect to the total returns of each Fund:
Growth Fund. The Board considered that the Fund’s total return was above the average of its Morningstar performance peer universe for the one-, three- and five-year periods ended December 31, 2022. The Board also considered that the Fund underperformed the benchmark (Russell 3000® Growth Index) for the one-, three- and five-year periods ended December 31, 2022.
Large Cap Growth Fund. The Board considered that the Fund’s total return was below the average of its Morningstar performance peer universe for the one-year period and above the average of its Morningstar performance peer universe for the three- and five-year periods ended December 31, 2022. The Board also considered that the Fund underperformed the benchmark (Russell 1000® Growth Index) for the one- and three-year periods and outperformed the benchmark for the five-year period ended December 31, 2022.
Mid Cap Value Fund. The Board considered that the Fund commenced operations on March 16, 2022, which provided a limited period of time to evaluate investment performance.
Small-Mid Cap Core Fund. The Board considered that the Fund’s total return was below the average of its Morningstar performance peer universe for the one-year period and above the average of its Morningstar performance peer universe for the three-year period ended December 31, 2022. The Board also considered that the Fund outperformed the benchmark (Russell 2500™ Index) for the one- and three-year periods ended December 31, 2022.
Small-Mid Cap Growth Fund. The Board considered that the Fund’s total return was above the average of its Morningstar performance peer universe for the one- and five-year periods and below the average of its Morningstar performance peer universe for the three-year period ended December 31, 2022. The Board also considered that the Fund outperformed the benchmark (Russell 2500™ Growth Index) for the one-, three- and five-year periods ended December 31, 2022.
Small Cap Growth Fund. The Board considered that the Fund’s total return was above the average of its Morningstar performance peer universe for the one-, three- and five-year periods ended December 31, 2022. The Board also considered that the Fund outperformed the benchmark (Russell 2000® Growth Index) for the one-, three- and five-year periods ended December 31, 2022.
Small Cap Value Fund. The Board considered that the Fund’s total return was below the average of its Morningstar performance peer universe for the one- and three-year periods and above the average of its Morningstar performance peer universe for the five-year period ended December 31, 2022. The Board also considered that the Fund outperformed the benchmark (Russell 2000® Value Index) for the one-, three- and five-year periods ended December 31, 2022.
Global Leaders Fund. The Board considered that the Fund’s total return was below the average of its Morningstar performance peer universe for the one-year period and above the average of its Morningstar performance peer universe for the three- and five-year periods ended December 31, 2022. The Board also considered that the Fund underperformed the benchmark (MSCI All Country World IMI (net) Index) for the one- and three-year periods and outperformed the benchmark for the five-year period ended December 31, 2022.
| 156 | Semiannual Report | June 30, 2023 |
International Leaders Fund. The Board considered that the Fund’s total return was below the average of its Morningstar performance peer universe for the one-year period and above the average of its Morningstar performance peer universe for the three- and five-year periods ended December 31, 2022. The Board also considered that the Fund underperformed the benchmark (MSCI All Country World Ex-U.S. IMI (net) Index) for the one- and three-year periods and outperformed the benchmark for the five-year period ended December 31, 2022.
International Growth Fund. The Board considered that the Fund’s total return was below the average of its Morningstar performance peer universe for the one-year period and above the average of its Morningstar performance peer universe for the three- and five-year periods ended December 31, 2022. The Board also considered that the Fund underperformed the benchmark (MSCI All Country World Ex-U.S. IMI (net) Index) for the one-year period and outperformed the benchmark for three- and five-year periods ended December 31, 2022.
Institutional International Growth Fund. The Board considered that the Fund’s total return was below the average of its Morningstar performance peer universe for the one-year period and above the average of its Morningstar performance peer universe for the three- and five-year periods ended December 31, 2022. The Board also considered that the Fund underperformed the benchmark (MSCI All Country World Ex-U.S. IMI (net) Index) for the one-year period and outperformed the benchmark for the three- and five-year periods ended December 31, 2022.
International Small Cap Growth Fund. The Board considered that the Fund’s total return was below the average of its Morningstar performance peer universe for the one-, three- and five-year periods ended December 31, 2022. The Board also considered that the Fund underperformed the benchmark (MSCI All Country World Ex-U.S. Small Cap (net) Index) for the one-, three- and five-year periods ended December 31, 2022. The Board additionally considered that the Fund’s underperformance for the three-year period was largely attributable to calendar year 2022, when the Fund lagged the return of the benchmark, offsetting positive returns in 2020. The Board further considered that the Fund’s underperformance for the five-year period was largely attributable to calendar years 2018 and 2022, when the Fund lagged the return of the benchmark, offsetting positive returns in 2019 and 2020.
Emerging Markets Leaders Fund. The Board considered that the Fund’s total return was below the average of its Morningstar performance peer universe for the one- and three-year periods and above the average of its Morningstar performance peer universe for the five-year period ended December 31, 2022. The Board also considered that the Fund underperformed the benchmark (MSCI Emerging Markets (net) Index) for the one-, three- and five-year periods ended December 31, 2022. The Board additionally considered that the Fund’s underperformance was largely attributable to calendar years 2021 and 2022, when the Fund lagged the return of the benchmark.
Emerging Markets Growth Fund. The Board considered that the Fund’s total return was below the average of its Morningstar performance peer universe for the one-year period and above the average of its Morningstar performance peer universe for the three- and five-year periods ended December 31, 2022. The Board also considered that the Fund underperformed the benchmark (MSCI Emerging Markets IMI (net) Index) for the one-year period and outperformed the benchmark for the three- and five-year periods ended December 31, 2022.
Emerging Markets ex China Growth Fund. The Board considered that the Fund commenced operations on July 29, 2022, which provided a limited period of time to evaluate investment performance.
Emerging Markets Small Cap Growth Fund. The Board considered that the Fund’s total return was below the average of its Morningstar performance peer universe for the one-year period and above the average of its Morningstar performance peer universe for the three- and five-year periods ended December 31, 2022. The Board also considered that the Fund underperformed the benchmark (MSCI Emerging Markets Small Cap (net) Index) for the one-, three- and five-year periods ended December 31, 2022.
China Growth Fund. The Board considered that the Fund’s total return was below the average of its Morningstar performance peer universe and the benchmark (MSCI China All Shares (net) Index) for the one-year period ended December 31, 2022. The Board also considered that the Fund commenced operations on August 27, 2021, which provided a limited period of time to evaluate investment performance.
Emerging Markets Debt Fund. The Board considered that the Fund’s total return was below the average of its Morningstar performance peer universe and above the benchmark (JPM EMBI Global Diversified (unhedged)) for the one-year period ended December 31, 2022. The Board also considered that the Fund commenced operations on May 25, 2021, which provided a limited period of time to evaluate investment performance.
| June 30, 2023 | William Blair Funds | 157 |
Management Fees. The Board reviewed each Fund’s management fee and reviewed information comparing the management fee to those of an expense peer group and an expense peer universe of funds provided by Broadridge for Class I shares of the Funds (except for the Institutional International Growth Fund, which does not have share classes). The Broadridge expense peer group for Class I (the “Broadridge Expense Group”) of each Fund other than the Institutional International Growth Fund, and the expense peer group for the Institutional International Growth Fund, consisted of a group of institutional funds with a similar investment strategy and asset size, as classified by Broadridge. The Broadridge expense peer universe for each Fund consisted of the Fund’s Broadridge expense peer group and all other no-load funds with an investment strategy as classified by Broadridge similar to the Fund’s. In considering the Broadridge information and giving effect to the contractual management fee reductions proposed by the Adviser for the Small-Mid Cap Growth Fund and the Small Cap Growth Fund, the Board noted that the contractual management fees for the Growth Fund, the Large Cap Growth Fund, the Mid Cap Value Fund, the Small Cap Value Fund, the Emerging Markets Growth Fund, the Emerging Markets Small Cap Growth Fund, the China Growth Fund and the Emerging Markets Debt Fund were below the average contractual management fees of their respective Broadridge Expense Groups. The Board also noted that the contractual management fees for the Emerging Markets Leaders Fund were equal to the average contractual management fees of its Broadridge Expense Group. The Board further noted that the contractual management fees for the Small-Mid Cap Core Fund, the Small-Mid Cap Growth Fund, the Small Cap Growth Fund, the Global Leaders Fund, the International Leaders Fund, the International Growth Fund, the Institutional International Growth Fund, the International Small Cap Growth Fund and the Emerging Markets ex China Growth Fund were above the average contractual management fees of their respective Broadridge Expense Groups.
The Board noted the current and proposed contractual expense limitations for the share classes of the Funds. The Board considered that the Adviser proposed to contractually limit operating expenses until April 30, 2024 for each share class of the Funds. The Board considered the amount of management fees waived and other expenses reimbursed by the Adviser on behalf of the Funds in 2022.
For each Fund, the Board also reviewed amounts charged by the Adviser to other pooled investment vehicles, including other registered funds for which the Adviser acts as a sub-adviser, and the Adviser’s fee schedule for institutional accounts. With respect to other pooled investment vehicles and institutional accounts, the Board considered the Adviser’s statements to the effect that the level of services provided to the Funds and the regulatory responsibilities associated with sponsoring registered investment companies were greater as compared to the work involved for other pooled investment vehicles, including other registered funds for which the Adviser acts as a sub-adviser, and institutional accounts. In addition, the Board considered the Adviser’s statements to the effect that institutional accounts are distributed differently, operate under different investment and regulatory structures and have different business risks as compared to the Funds and that there are responsibilities and duties involved in sponsoring a registered fund that are not present in sub-advising a registered fund.
On the basis of all the information provided, the Board concluded that each Fund’s management fee, coupled with the applicable expense limitations, was reasonable.
Profitability. With respect to the profitability of the Management Agreement to the Adviser, the Board considered the overall fees paid under the Management Agreement, including the estimated allocated costs of the services provided, management fees waived and other expenses reimbursed, if any, and profits realized by the Adviser from its relationship with the Trust as a whole and each Fund individually. The Board concluded that the estimated profits realized by the Adviser were not unreasonable.
Economies of Scale. The Board considered the extent to which economies of scale would be realized as the Funds grow and whether fee levels reflect these economies of scale for the benefit of investors. The Board noted the Adviser’s statements to the effect that the resources required for the Adviser’s fundamental investment process typically increase as a Fund increases in size. The Board also considered that certain of the Funds were part of investment strategies that were capacity constrained by the Adviser so that opportunities for economies of scale were limited. The Board further considered that of the Funds that are subject to capacity constraints, the International Small Cap Growth Fund is closed to investors, except as noted in the Fund’s prospectus.
In considering whether fee levels reflect economies of scale for the benefit of Fund investors, the Board considered each Fund’s asset size, management fee breakpoints for applicable Funds, the expense limitations in place for each Fund and the proposed reductions in management fees and/or improvements in expense limitations for certain Funds and each Fund’s expense ratios. The Board concluded that in the aggregate the Funds’ fee levels reasonably reflect appropriate recognition of economies of scale.
| 158 | Semiannual Report | June 30, 2023 |
Other Benefits. The Board considered benefits derived by the Adviser and its affiliates from their relationship with the Funds, including (1) receipt of research from brokerage firms; (2) soft dollars, which pertain primarily to the Funds investing in equity securities; (3) reimbursement of some intermediary fees in the nature of sub-transfer agency fees; (4) fees from Class N shares of the Funds to the Distributor pursuant to the Rule 12b-1 Plan, nearly all of which are paid to third parties; and (5) favorable media coverage. The Board determined that management fees were reasonable in light of these benefits.
Conclusion. Based upon all of the information considered and the conclusions reached, the Board determined that the terms of the Management Agreement continue to be fair and reasonable and that the continuation of the Management Agreement is in the best interests of each Fund.
| June 30, 2023 | William Blair Funds | 159 |
REVIEW OF LIQUIDITY RISK MANAGEMENT PROGRAM
The Board of Trustees (the “Board”) of William Blair Funds previously approved the William Blair Funds Liquidity Risk Management Program Policy (the “Policy”) under Rule 22e-4 under the 1940 Act (the “Liquidity Rule”), which sets forth the terms of the William Blair Liquidity Risk Management Program (the “Program”). The Program (through the Policy) seeks to assess, manage and review each Fund’s liquidity risk. For purposes of the Program, the Policy and the Liquidity Rule, “liquidity risk” is defined as the risk that a Fund could not meet requests to redeem shares issued by a Fund without significant dilution of remaining investors’ interest in the Funds. Among other things, the Liquidity Rule requires that a written report be provided to the Board on an annual basis that addresses the operation of the Program and assesses the adequacy and effectiveness of its implementation, including, if applicable, the operation of any highly liquid investment minimum (“HLIM”) established for a Fund and any material changes to the Program.
The Board designated the Liquidity Risk Management Committee of William Blair Investment Management, LLC, the Funds’ investment adviser, to be the administrator for the Program (the “Program Administrator”). On February 23, 2023, the Board of Trustees reviewed the Program Administrator’s written report (the “Report”) concerning the operation of the Program and the Policy as well as the adequacy and effectiveness of the Program’s and Policy’s implementation for the period from January 1, 2022 through December 31, 2022 (the “Program Reporting Period”). There were no material changes to the Program or to the Policy during the Program Reporting Period.
The Report summarized the operation of the Program and the Policy and the information and factors considered by the Program Administrator in assessing whether the Program and the Policy have been adequately and effectively implemented with respect to each Fund. Such information and factors included, among other things: (1) the liquidity risk framework used to assess, manage, and periodically review each Fund’s liquidity risk and the results of this assessment; (2) the classification of each of the Funds’ respective investments into one of four liquidity categories that reflect an estimate of their liquidity under normal and reasonably foreseeable stressed conditions; (3) whether a Fund invested primarily in “Highly Liquid Investments” (as defined under the Liquidity Rule) and whether an HLIM should be established for any Fund; (4) whether a Fund invested more than 15% of its assets in “Illiquid Investments” (as defined under the Liquidity Rule); (5) specific liquidity events arising during the Program Reporting Period, including the impact on Fund liquidity caused by extended non-U.S. market closures; and (6) the nature and quality of the services provided by the service provider engaged to assist with determining liquidity classifications for the Funds. Based on this review, the Report concluded that the Program and the Policy meet the requirements of the Liquidity Rule and are operating effectively.
| 160 | Semiannual Report | June 30, 2023 |
Trustees and Officers (Unaudited).† The trustees and officers of the William Blair Funds, their year of birth, their principal occupations during the last five years, their affiliations, if any, with William Blair, and other significant affiliations are set forth below. The address of each officer and trustee is 150 North Riverside Plaza, Chicago, Illinois 60606.
| Name and Year of Birth | | Position(s)
Held with
Trust | | Term of
Office(1) and
Length of
Time
Served | | Principal
Occupation(s)
During Past 5 Years | | Number of
Portfolios
in Trust
Complex
Overseen
by Trustee | | Other Directorships
Held by Trustee
During Past 5 Years* |
| Interested Trustees | | | | | | | | | | |
Stephanie G. Braming, CFA,
1970(2) | | Chairman of the Board and President, previously Senior Vice President | | Chairman of the Board and President since 2018, and Senior Vice President 2014 to 2018 | | Global Head of Investment Management since 2017, portfolio manager (2014 to 2017) and Partner, William Blair | | 19 | | Chairman, William Blair SICAV |
Cissie Citardi,
1975(2) | | Trustee | | Since 2021 | | General Counsel (since 2021), Deputy General Counsel (May 2020 to December 2020) and Partner, William Blair; formerly, General Counsel, PineBridge Investments (2016-2020) | | 19 | | Director, William Blair SICAV |
| Non-Interested Trustees | | | | | | | | | |
Vann A. Avedisian,
1964 | | Trustee | | Since 2012 | | Co-founder and Partner, Newbond Holdings (real estate operations) (since 2021); formerly, Principal, Highgate Holdings (hotel investments) (2009-2021); co-founder and Managing Director, Oxford Capital Partners Inc. (1994 to 2006) | | 19 | | Potbelly Sandwich Works (2001 to 2015 and since 2021)(3) |
Kathleen T. Barr,
1955 | | Trustee | | Since 2013 | | Retired; Chair Emeritus, Independent Directors Council (since 2022); formerly, Chairman of the Governing Council, Independent Directors Council (2020 to 2022); formerly, President, Productive Capital Management, Inc. (registered investment adviser to public entities) and Owner, KT Barr Consulting, LLC (mutual fund and investment management consulting) (2010 to 2013); prior thereto, Chief Administrative Officer, Senior Vice President and Senior Managing Director of Allegiant Asset Management Company (merged with PNC Capital Advisors, LLC in 2009) (2004 to 2010) | | 19 | | Muzinich BDC, Inc. (since 2019); Board of Governors, Investment Company Institute (since 2019); Professionally Managed Portfolios (since 2018) |
| † | William Blair Investment Management, LLC and William Blair & Company, L.L.C. are collectively referred to in this section as “William Blair”, each of which is a wholly owned subsidiary of WBC Holdings, L.P., which is wholly owned by certain William Blair employees (employee owners are referred to as ‘partners’). |
| | |
| * | Includes directorships of public companies and other registered investment companies held during the past five years. |
| June 30, 2023 | William Blair Funds | 161 |
| Name and Year of Birth | | Position(s)
Held with
Trust | | Term of
Office(1) and
Length of
Time
Served | | Principal
Occupation(s)
During Past 5 Years | | Number of
Portfolios
in Trust
Complex
Overseen
by Trustee | | Other Directorships
Held by Trustee
During Past 5 Years* |
Daniel N. Leib,
1966(4) | | Trustee | | Since 2016 | | Chief Executive Officer, Donnelley Financial Solutions, Inc. (since 2016); formerly, Executive Vice President and Chief Financial Officer (2011 to 2016) and Group Chief Financial Officer (2009 to 2011), R.R. Donnelley & Sons Company | | 19 | | Donnelley Financial Solutions, Inc. (since 2016) |
Dorri C. McWhorter,
1973 | | Trustee | | Since 2019 | | President and Chief Executive Officer, YMCA of Metropolitan Chicago (since 2021); formerly, Chief Executive Officer, YWCA Metropolitan Chicago (2013 to 2021); Partner, Crowe LLP (2008 to 2013)(5) | | 19 | | Highland Funds (since 2022); Skyway Concession Company, LLC (since 2018); Illinois CPA Society (since 2017); Lifeway Foods, Inc. (since 2020); Green Thumb Industries (2022); LanzaTech Global (since 2023) |
Thomas J. Skelly,
1951 | | Trustee | | Since 2007 | | Advisory Board Member for various U.S. companies (since 2005); formerly, Managing Partner of various divisions at Accenture (1994 to 2004) | | 19 | | Mutual Trust Financial Group (provider of insurance and investment products) |
Steven R. Zenz,
1954 | | Trustee | | Since 2018 | | Consultant, Steven R. Zenz Consulting LLC (merger and acquisition transactions and SEC reporting and filings) (since 2011); formerly, Partner, KPMG LLP (1987 to 2010)(6) | | 19 | | Engine Media Holdings, Inc. (media group supporting esports, news streaming and gaming) (2020 to 2021); Frankly Inc. (technology products/ services for media industry) (2016 to 2020); Insignia Systems, Inc. (in-store advertising services for consumer packaged goods manufacturers) (2013 to 2019) |
| (1) | Each Trustee serves until the election and qualification of a successor, or until death, resignation or retirement, or removal as provided in the Trust’s Declaration of Trust. Retirement for Independent Trustees occurs no later than at the conclusion of the calendar year that occurs after the earlier of (a) the Independent Trustee’s 75th birthday or (b) the 17th anniversary of the date that the Independent Trustee became a member of the Board of Trustees. |
| (2) | Ms. Braming and Ms. Citardi are interested persons of the Trust because they are partners of William Blair, and with respect to Ms. Braming also due to her position as an officer of the Trust. |
| (3) | On February 9, 2021, Potbelly Corporation (“Potbelly”) entered into a securities purchase agreement with accredited purchasers, pursuant to which Potbelly agreed to issue and sell to the purchasers in a private placement an aggregate of (i) 3,249,668 shares of Potbelly’s common stock, par value $0.01 per share and (ii) warrants to purchase an aggregate of 1,299,861 shares of common stock, for an aggregate purchase price of $15.9 million (the “Offering”). The Offering closed on February 12, 2021. WBC acted as the sole placement agent for the Offering and received fees from Potbelly of approximately $1,025,000. |
| (4) | The Trust and William Blair use Donnelley Financial Solutions, Inc. (“DFS’’) for financial printing and other services. DFS is a public company. The Trust and William Blair in the aggregate paid DFS approximately $252,000 and $295,000 in 2021 and 2022, respectively, for the services provided. DFS’s revenue was approximately $993 million in 2021 and $834 million in 2022. Mr. Leib, as the Chief Executive Officer of DFS, is not directly involved in any of the services provided to the Trust or William Blair and his compensation is not materially affected by the fees DFS receives from the Trust and William Blair. |
| (5) | As a former partner of the audit firm Crowe LLP (formerly, Crowe Horwath LLP), Ms. McWhorter received distributions of her capital in the firm over time and those distributions were completed in March 2021. The Trust and William Blair made no payments to Crowe LLP over the past three years. |
| (6) | The Trust engages KPMG to provide foreign tax services in Taiwan. KPMG does not provide audit or audit-related services to the Trust. Mr. Zenz is a former partner of KPMG and receives pension/retirement funds from KPMG. |
| 162 | Semiannual Report | June 30, 2023 |
| Name and Year of Birth | | Position(s) Held
with Trust | | Term of Office
and Length of
Time Served(1) | | Principal Occupation(s)
During Past 5 Years |
| | | | | | | |
| Officers | | | | | | |
| | | | | | | |
Alaina Anderson, CFA,
1975 | | Senior Vice President | | Since 2021 | | Partner, William Blair |
| | | | | | | |
Marcelo Assalin, CFA,
1973 | | Senior Vice President | | Since 2020 | | Partner, William Blair (since 2022); formerly, Associate, William Blair (2020-2021); NN Investment Partners (formerly, ING Investment Management) (2013-2020) |
| | | | | | | |
Daniel Crowe, CFA,
1972 | | Senior Vice President | | Since 2016 | | Partner, William Blair |
| | | | | | | |
Robert J. Duwa, CFA,
1967 | | Senior Vice President | | Since 2019 | | Partner, William Blair |
| | | | | | | |
Simon Fennell,
1969 | | Senior Vice President | | Since 2013 | | Partner, William Blair |
| | | | | | | |
David C. Fording, CFA,
1967 | | Senior Vice President | | Since 2006 | | Partner, William Blair |
| | | | | | | |
James S. Golan, CFA,
1961 | | Senior Vice President | | Since 2005 | | Partner, William Blair |
| | | | | | | |
William V. Heaphy, CFA,
1967 | | Senior Vice President | | Since 2021 | | Associate, William Blair (since 2021); formerly, Principal, Investment Counselors of Maryland, LLC (1994-2021) |
| | | | | | | |
James E. Jones, CFA,
1977 | | Senior Vice President | | Since 2019 | | Partner, William Blair |
| | | | | | | |
Kenneth J. McAtamney,
1966 | | Senior Vice President | | Since 2008 | | Partner, William Blair |
| | | | | | | |
Todd M. McClone, CFA,
1968 | | Senior Vice President | | Since 2005 | | Partner, William Blair |
| | | | | | | |
D.J. Neiman, CFA,
1975 | | Senior Vice President | | Since 2021 | | Partner, William Blair |
| | | | | | | |
Casey K. Preyss, CFA,
1976 | | Senior Vice President | | Since 2015 | | Partner, William Blair |
| | | | | | | |
David P. Ricci, CFA,
1958 | | Senior Vice President | | Since 2006 | | Partner, William Blair |
| | | | | | | |
Lisa D. Rusch,
1970 | | Senior Vice President Vice President | | Since 2020
2018-2020 | | Partner, William Blair (since 2020); formerly, Associate, William Blair |
| | | | | | | |
Hugo Scott-Gall,
1971 | | Senior Vice President | | Since 2021 | | Partner, William Blair (since 2018); formerly, Managing Director, Goldman Sachs International (1998-2018) |
| | | | | | | |
Ward D. Sexton, CFA,
1974 | | Senior Vice President | | Since 2016 | | Partner, William Blair |
| | | | | | | |
Andrew Siepker, CFA,
1981 | | Senior Vice President | | Since 2022 | | Partner, William Blair (since 2019); formerly, Associate, William Blair |
| June 30, 2023 | William Blair Funds | 163 |
| Name and Year of Birth | | Position(s) Held
with Trust | | Term of Office
and Length of
Time Served(1) | | Principal Occupation(s)
During Past 5 Years |
| | | | | | | |
Mark C. Thompson, CFA,
1976 | | Senior Vice President | | Since 2020 | | Partner, William Blair |
| | | | | | | |
Vivian Lin Thurston, CFA,
1972 | | Senior Vice President | | Since 2021 | | Partner, William Blair |
| | | | | | | |
Dan Zelazny,
1971 | | Senior Vice President | | Since 2019 | | Associate, William Blair (since 2019); formerly, Managing Director, AQR Capital Management (2011-2019) |
| | | | | | | |
Nicholas Zimmerman, CFA,
1980 | | Senior Vice President | | Since 2023 | | Partner, William Blair (since 2022); formerly, Associate, William Blair |
| | | | | | | |
Matthew Fleming, CFA,
1973 | | Vice President | | Since 2022 | | Associate, William Blair (since 2021); formerly, Investment Counselors of Maryland, LLC (2008-2021) |
| | | | | | | |
Gary J. Merwitz,
1970 | | Vice President | | Since 2021 | | Associate, William Blair (since 2021); formerly, Principal, Investment Counselors of Maryland, LLC (2004-2021) |
| | | | | | | |
Marco Ruijer, CFA,
1975 | | Vice President | | Since 2020 | | Associate, William Blair (since 2020); formerly, NN Investment Partners (formerly, ING Investment Management) (2013-2020) |
| | | | | | | |
John M. Raczek,
1970 | | Treasurer
Assistant Treasurer | | Since 2019
2010-2019 | | Associate, William Blair |
| | | | | | | |
Andrew T. Pfau,
1970 | | Secretary | | Since 2009 | | Associate, William Blair |
| | | | | | | |
David M. Cihak,
1982 | | Assistant Treasurer | | Since 2019 | | Associate, William Blair |
| | | | | | | |
Walter R. Randall, Jr.,
1960 | | Chief Compliance Officer and Assistant Secretary | | Since 2009 | | Associate, William Blair |
| | | | | | | |
Daniel Carey,
1977 | | Chief Legal Officer and Assistant Secretary | | Since 2023 | | Associate, William Blair |
| (1) | The Trust’s Officers, except the Chief Compliance Officer, are elected annually by the Board of Trustees. The Trust’s Chief Compliance Officer is designated by the Board of Trustees and may only be removed by action of the Board of Trustees, including a majority of Independent Trustees. Length of Time Served for all Officers indicates the year the individual became an Officer of the Trust. |
The Statement of Additional Information for the William Blair Funds includes additional information about the trustees and is available without charge by calling 1-800-635-2886 (in Massachusetts 1-800-635-2840) or by writing the Fund.
| 164 | Semiannual Report | June 30, 2023 |
(Unaudited)
Proxy Voting
A description of the policies and procedures that the Funds use to determine how to vote proxies relating to portfolio securities and information regarding how the Funds voted proxies relating to portfolio securities for the most recent 12-month period ended December 31 are available without charge, upon request, by calling 1-800-635-2886 (in Massachusetts 1-800-635-2840), at www.williamblairfunds.com and on the SEC’s website at http://www.sec.gov.
Quarterly Portfolio Schedules
Each Fund files its complete schedule of portfolio holdings with the SEC for the first and third fiscal quarters of each fiscal year (quarters ended March 31 and September 30) on Form N-PORT. The Funds’ Forms N-PORT are available on the SEC’s website at http://www.sec.gov.
Additional Federal Income Tax Information: (unaudited)
Under Section 852(b)(3)(C) of the Code, the Funds hereby designate the following amounts as capital gain dividends for the fiscal year ended December 31, 2022 (in thousands):
| Fund | | Capital Gain Dividend |
| Growth | | $ | 10,688 | |
| Large Cap Growth | | | 8,894 | |
| Small-Mid Cap Growth | | | 80,594 | |
| Small Cap Growth | | | 20,795 | |
| Small Cap Value | | | 106,344 | |
| Global Leaders | | | 2,469 | |
| International Leaders | | | 1,829 | |
| International Growth | | | 153,692 | |
| Institutional International Growth | | | 57,898 | |
| Emerging Markets Leaders | | | 3,408 | |
| Emerging Markets Growth | | | 1,018 | |
| Emerging Markets Small Cap Growth | | | 16,730 | |
| June 30, 2023 | William Blair Funds | 165 |
Useful Information About Your Report (Unaudited)
Please refer to this information when reviewing the Expense Example for each Fund.
Expense Example
As a shareholder of a Fund, you incur two types of costs: (1) transaction costs and (2) ongoing costs, including management fees, distribution (12b-1) fees (for Class N shares, as applicable), and other Fund expenses. The example is intended to help you understand your ongoing costs (in dollars) of investing in the Fund and to compare these costs with the ongoing costs of investing in other mutual funds. To do so, compare the Fund’s 5% hypothetical example with the 5% hypothetical examples that appear in the shareholder reports of other funds. The example is based on an investment of $1,000 invested at the beginning of the period and held for the entire six-month period from January 1, 2023 to June 30, 2023.
Actual Expenses
In each example, the first line for each share class in the table provides information about the actual account values and actual expenses. These expenses reflect the effect of any expense cap applicable to the share class during the period. Without this expense cap, the costs shown in the table would have been higher. You may use the information in this line, together with the amount you invested, to estimate the expenses that you paid over the period. Simply divide your account value by $1,000 (example, an $8,600 account value divided by $1,000 = 8.6), then multiply the result by the number in the first line under the heading entitled “Expenses Paid During the Period” to estimate the expenses you paid on your account during the period.
Hypothetical Example for Comparison Purposes
In each example, the second line for each share class in the table provides information about hypothetical account values and hypothetical expenses based on the Fund’s actual expense ratio and an assumed rate of return of 5% per year before expenses. This is not the Fund’s actual return. The hypothetical account values and expenses may not be used to estimate your actual ending account balance or the expenses you paid for the period. You may use this information to compare the ongoing costs of investing in the Fund to the costs of investing in other funds. To do so, compare this 5% hypothetical example with the 5% hypothetical examples that appear in the shareholder reports of other funds.
Please note that the expenses shown in both examples are meant to highlight your ongoing costs only and do not reflect any transactional costs or account type fees. These fees are discussed in the prospectus. Therefore, the second line of each share class in the table is useful in comparing ongoing costs only and will not help you determine the relative costs of owning different funds. In addition, if these transactional costs or account fees were included, your costs would have been higher.
| 166 | Semiannual Report | June 30, 2023 |
Fund Expenses (Unaudited)
| Expense Example | | Beginning
Account Value
1/1/2023 | | Ending
Account Value
6/30/2023 | | Expenses Paid
During
the Period (a) | | Annualized
Expense Ratio |
| Growth Fund | | | | | | | | | |
| Class N-actual return | | $1,000.00 | | $1,257.86 | | $6.72 | | 1.20 | % |
| Class N-hypothetical 5% return | | $1,000.00 | | $1,044.05 | | $6.08 | | 1.20 | |
| Class I-actual return | | $1,000.00 | | $1,261.08 | | $5.21 | | 0.93 | |
| Class I-hypothetical 5% return | | $1,000.00 | | $1,045.39 | | $4.72 | | 0.93 | |
| Class R6-actual return | | $1,000.00 | | $1,261.04 | | $4.93 | | 0.88 | |
| Class R6-hypothetical 5% return | | $1,000.00 | | $1,045.64 | | $4.46 | | 0.88 | |
| Large Cap Growth Fund | | | | | | | | | |
| Class N-actual return | | $1,000.00 | | $1,249.69 | | $5.02 | | 0.90 | |
| Class N-hypothetical 5% return | | $1,000.00 | | $1,045.54 | | $4.56 | | 0.90 | |
| Class I-actual return | | $1,000.00 | | $1,252.00 | | $3.63 | | 0.65 | |
| Class I-hypothetical 5% return | | $1,000.00 | | $1,046.78 | | $3.30 | | 0.65 | |
| Class R6-actual return | | $1,000.00 | | $1,251.57 | | $3.35 | | 0.60 | |
| Class R6-hypothetical 5% return | | $1,000.00 | | $1,047.02 | | $3.05 | | 0.60 | |
| Mid Cap Value Fund | | | | | | | | | |
| Class I-actual return | | $1,000.00 | | $1,058.76 | | $3.83 | | 0.75 | |
| Class I-hypothetical 5% return | | $1,000.00 | | $1,046.28 | | $3.81 | | 0.75 | |
| Class R6-actual return | | $1,000.00 | | $1,057.61 | | $3.57 | | 0.70 | |
| Class R6-hypothetical 5% return | | $1,000.00 | | $1,046.53 | | $3.55 | | 0.70 | |
| Small-Mid Cap Core Fund | | | | | | | | | |
| Class I-actual return | | $1,000.00 | | $1,080.62 | | $4.90 | | 0.95 | |
| Class I-hypothetical 5% return | | $1,000.00 | | $1,045.29 | | $4.82 | | 0.95 | |
| Class R6-actual return | | $1,000.00 | | $1,081.30 | | $4.64 | | 0.90 | |
| Class R6-hypothetical 5% return | | $1,000.00 | | $1,045.54 | | $4.56 | | 0.90 | |
| Small-Mid Cap Growth Fund | | | | | | | | | |
| Class N-actual return | | $1,000.00 | | $1,116.44 | | $6.87 | | 1.31 | |
| Class N-hypothetical 5% return | | $1,000.00 | | $1,043.50 | | $6.64 | | 1.31 | |
| Class I-actual return | | $1,000.00 | | $1,118.10 | | $5.57 | | 1.06 | |
| Class I-hypothetical 5% return | | $1,000.00 | | $1,044.74 | | $5.37 | | 1.06 | |
| Class R6-actual return | | $1,000.00 | | $1,118.12 | | $5.30 | | 1.01 | |
| Class R6-hypothetical 5% return | | $1,000.00 | | $1,044.99 | | $5.12 | | 1.01 | |
| Small Cap Growth Fund | | | | | | | | | |
| Class N-actual return | | $1,000.00 | | $1,111.62 | | $7.38 | | 1.41 | |
| Class N-hypothetical 5% return | | $1,000.00 | | $1,043.01 | | $7.14 | | 1.41 | |
| Class I-actual return | | $1,000.00 | | $1,113.02 | | $6.08 | | 1.16 | |
| Class I-hypothetical 5% return | | $1,000.00 | | $1,044.25 | | $5.88 | | 1.16 | |
| Class R6-actual return | | $1,000.00 | | $1,113.41 | | $5.82 | | 1.11 | |
| Class R6-hypothetical 5% return | | $1,000.00 | | $1,044.50 | | $5.63 | | 1.11 | |
| Small Cap Value Fund | | | | | | | | | |
| Class N-actual return | | $1,000.00 | | $1,019.09 | | $5.61 | | 1.12 | |
| Class N-hypothetical 5% return | | $1,000.00 | | $1,044.45 | | $5.68 | | 1.12 | |
| Class I-actual return | | $1,000.00 | | $1,020.20 | | $4.46 | | 0.89 | |
| Class I-hypothetical 5% return | | $1,000.00 | | $1,045.59 | | $4.51 | | 0.89 | |
| Class R6-actual return | | $1,000.00 | | $1,020.93 | | $3.96 | | 0.79 | |
| Class R6-hypothetical 5% return | | $1,000.00 | | $1,046.08 | | $4.01 | | 0.79 | |
| Global Leaders Fund | | | | | | | | | |
| Class N-actual return | | $1,000.00 | | $1,185.05 | | $6.23 | | 1.15 | |
| Class N-hypothetical 5% return | | $1,000.00 | | $1,044.30 | | $5.83 | | 1.15 | |
| Class I-actual return | | $1,000.00 | | $1,185.77 | | $4.88 | | 0.90 | |
| Class I-hypothetical 5% return | | $1,000.00 | | $1,045.54 | | $4.56 | | 0.90 | |
| Class R6-actual return | | $1,000.00 | | $1,187.27 | | $4.61 | | 0.85 | |
| Class R6-hypothetical 5% return | | $1,000.00 | | $1,045.78 | | $4.31 | | 0.85 | |
| International Leaders Fund | | | | | | | | | |
| Class N-actual return | | $1,000.00 | | $1,114.00 | | $6.03 | | 1.15 | |
| Class N-hypothetical 5% return | | $1,000.00 | | $1,044.30 | | $5.83 | | 1.15 | |
| Class I-actual return | | $1,000.00 | | $1,116.03 | | $4.72 | | 0.90 | |
| Class I-hypothetical 5% return | | $1,000.00 | | $1,045.54 | | $4.56 | | 0.90 | |
| Class R6-actual return | | $1,000.00 | | $1,116.53 | | $4.46 | | 0.85 | |
| Class R6-hypothetical 5% return | | $1,000.00 | | $1,045.78 | | $4.31 | | 0.85 | |
| June 30, 2023 | William Blair Funds | 167 |
Fund Expenses (Unaudited)
| Expense Example | | Beginning
Account Value
1/1/2023 | | Ending
Account Value
6/30/2023 | | Expenses Paid
During the
Period (a) | | Annualized
Expense Ratio |
| International Growth Fund | | | | | | | | | |
| Class N-actual return | | $1,000.00 | | $1,111.16 | | $6.49 | | 1.24 | % |
| Class N-hypothetical 5% return | | $1,000.00 | | $1,043.85 | | $6.28 | | 1.24 | |
| Class I-actual return | | $1,000.00 | | $1,112.67 | | $5.19 | | 0.99 | |
| Class I-hypothetical 5% return | | $1,000.00 | | $1,045.09 | | $5.02 | | 0.99 | |
| Class R6-actual return | | $1,000.00 | | $1,112.97 | | $4.92 | | 0.94 | |
| Class R6-hypothetical 5% return | | $1,000.00 | | $1,045.34 | | $4.77 | | 0.94 | |
| Institutional International Growth Fund | | | | | | | | | |
| Institutional Class-actual return | | $1,000.00 | | $1,113.10 | | $4.92 | | 0.94 | |
| Institutional Class-hypothetical 5% return | | $1,000.00 | | $1,045.34 | | $4.77 | | 0.94 | |
| International Small Cap Growth Fund | | | | | | | | | |
| Class N-actual return | | $1,000.00 | | $1,086.59 | | $7.76 | | 1.50 | |
| Class N-hypothetical 5% return | | $1,000.00 | | $1,042.56 | | $7.60 | | 1.50 | |
| Class I-actual return | | $1,000.00 | | $1,088.07 | | $6.37 | | 1.23 | |
| Class I-hypothetical 5% return | | $1,000.00 | | $1,043.90 | | $6.23 | | 1.23 | |
| Class R6-actual return | | $1,000.00 | | $1,088.42 | | $5.90 | | 1.14 | |
| Class R6-hypothetical 5% return | | $1,000.00 | | $1,044.35 | | $5.78 | | 1.14 | |
| Emerging Markets Leaders Fund | | | | | | | | | |
| Class N-actual return | | $1,000.00 | | $1,047.04 | | $6.29 | | 1.24 | |
| Class N-hypothetical 5% return | | $1,000.00 | | $1,043.85 | | $6.28 | | 1.24 | |
| Class I-actual return | | $1,000.00 | | $1,046.87 | | $5.02 | | 0.99 | |
| Class I-hypothetical 5% return | | $1,000.00 | | $1,045.09 | | $5.02 | | 0.99 | |
| Class R6-actual return | | $1,000.00 | | $1,048.13 | | $4.77 | | 0.94 | |
| Class R6-hypothetical 5% return | | $1,000.00 | | $1,045.34 | | $4.77 | | 0.94 | |
| Emerging Markets Growth Fund | | | | | | | | | |
| Class N-actual return | | $1,000.00 | | $1,052.17 | | $6.31 | | 1.24 | |
| Class N-hypothetical 5% return | | $1,000.00 | | $1,043.85 | | $6.28 | | 1.24 | |
| Class I-actual return | | $1,000.00 | | $1,052.93 | | $5.04 | | 0.99 | |
| Class I-hypothetical 5% return | | $1,000.00 | | $1,045.09 | | $5.02 | | 0.99 | |
| Class R6-actual return | | $1,000.00 | | $1,053.22 | | $4.79 | | 0.94 | |
| Class R6-hypothetical 5% return | | $1,000.00 | | $1,045.34 | | $4.77 | | 0.94 | |
| Emerging Markets ex China Growth Fund | | | | | | | | | |
| Class I-actual return | | $1,000.00 | | $1,134.96 | | $5.24 | | 0.99 | |
| Class I-hypothetical 5% return | | $1,000.00 | | $1,045.09 | | $5.02 | | 0.99 | |
| Class R6-actual return | | $1,000.00 | | $1,134.82 | | $4.98 | | 0.94 | |
| Class R6-hypothetical 5% return | | $1,000.00 | | $1,045.34 | | $4.77 | | 0.94 | |
| Emerging Markets Small Cap Growth Fund | | | | | | | | | |
| Class N-actual return | | $1,000.00 | | $1,119.03 | | $7.88 | | 1.50 | |
| Class N-hypothetical 5% return | | $1,000.00 | | $1,042.56 | | $7.60 | | 1.50 | |
| Class I-actual return | | $1,000.00 | | $1,120.95 | | $6.57 | | 1.25 | |
| Class I-hypothetical 5% return | | $1,000.00 | | $1,043.80 | | $6.33 | | 1.25 | |
| Class R6-actual return | | $1,000.00 | | $1,121.27 | | $6.31 | | 1.20 | |
| Class R6-hypothetical 5% return | | $1,000.00 | | $1,044.05 | | $6.08 | | 1.20 | |
| China Growth Fund | | | | | | | | | |
| Class I-actual return | | $1,000.00 | | $849.85 | | $4.54 | | 0.99 | |
| Class I-hypothetical 5% return | | $1,000.00 | | $1,045.09 | | $5.02 | | 0.99 | |
| Class R6-actual return | | $1,000.00 | | $848.06 | | $4.31 | | 0.94 | |
| Class R6-hypothetical 5% return | | $1,000.00 | | $1,045.34 | | $4.77 | | 0.94 | |
| Emerging Markets Debt Fund | | | | | | | | | |
| Class I-actual return | | $1,000.00 | | $1,051.35 | | $3.56 | | 0.70 | |
| Class I-hypothetical 5% return | | $1,000.00 | | $1,046.53 | | $3.55 | | 0.70 | |
| Class R6-actual return | | $1,000.00 | | $1,051.65 | | $3.31 | | 0.65 | |
| Class R6-hypothetical 5% return | | $1,000.00 | | $1,046.78 | | $3.30 | | 0.65 | |
| (a) | Expenses are equal to the annualized expense ratio, multiplied by the average account value over the period, multiplied by the number of days in the period, 181 and divided by 365 (to reflect the one-half year period). |
| 168 | Semiannual Report | June 30, 2023 |
| | BOARD OF TRUSTEES (as of August 24, 2023) |
| | Vann A. Avedisian |
| | Co-founder and Partner, Newbond Holdings |
| | Kathleen T. Barr |
| | Retired Senior Managing Director, PNC Capital Advisors, LLC |
| | Stephanie G. Braming, CFA, Chairman and President |
| | Partner, William Blair |
| | Cissie Citardi |
| | Partner, William Blair |
| | Daniel N. Leib |
| | Chief Executive Officer, Donnelley Financial Solutions, Inc. |
| | Dorri C. McWhorter |
| | President and Chief Executive Officer, YMCA of Metropolitan Chicago |
| | Thomas J. Skelly |
| | Retired Managing Partner, Accenture |
| | Steven R. Zenz |
| | Retired Partner, KPMG LLP |
| | Officers |
| | Alaina Anderson, CFA, Senior Vice President |
| | Marcelo Assalin, CFA, Senior Vice President |
| | Daniel Crowe, CFA, Senior Vice President |
| | Robert J. Duwa, CFA, Senior Vice President |
| | Simon Fennell, Senior Vice President |
| | David C. Fording, CFA, Senior Vice President |
| | James S. Golan, CFA, Senior Vice President |
| | William V. Heaphy, CFA, Senior Vice President |
| | James E. Jones, CFA, Senior Vice President |
| | Kenneth J. McAtamney, Senior Vice President |
| | Todd M. McClone, CFA, Senior Vice President |
| | D.J. Neiman, CFA, Senior Vice President |
| | Casey K. Preyss, CFA, Senior Vice President |
| | David P. Ricci, CFA, Senior Vice President |
| | Lisa D. Rusch, Senior Vice President |
| | Hugo Scott-Gall, Senior Vice President |
| | Ward D. Sexton, CFA, Senior Vice President |
| | Andrew Siepker, CFA, Senior Vice President |
| | Mark C. Thompson, CFA, Senior Vice President |
| | Vivian Lin Thurston, CFA, Senior Vice President |
| | Dan Zelazny, Senior Vice President |
| | Nicholas Zimmerman, CFA, Senior Vice President |
| | Matthew Fleming, CFA, Vice President |
| | Gary J. Merwitz, Vice President |
| | Marco Ruijer, CFA, Vice President |
| | John M. Raczek, Treasurer |
| | Andrew T. Pfau, Secretary |
| | David M. Cihak, Assistant Treasurer |
| | Walter R. Randall, Jr., Chief Compliance Officer and Assistant Secretary |
| | Daniel Carey, Chief Legal Officer and Assistant Secretary |
| | Investment Adviser |
| | William Blair Investment Management, LLC |
| | Distributor |
| | William Blair & Company, L.L.C. |
| | Independent Registered Public Accounting Firm |
| | Ernst & Young LLP |
| | Transfer Agent |
| | SS&C GIDS, Inc. |
| | For customer assistance, call 1-800-635-2886 |
| | P.O. Box 219137
Kansas City, Missouri 64121-9137 |
| June 30, 2023 | William Blair Funds | 169 |
| | | | | | |
| | William Blair Funds | | |
| | | | | | |
| | U.S. EQUITY | | GLOBAL EQUITY | | EMERGING MARKETS DEBT |
| | Growth Fund | | Global Leaders Fund | | Emerging Markets Debt Fund |
| | Large Cap Growth Fund | | | | |
| | Mid Cap Value Fund | | INTERNATIONAL EQUITY | | |
| | Small-Mid Cap Core Fund | | International Leaders Fund | | |
| | Small-Mid Cap Growth Fund | | International Growth Fund | | |
| | Small Cap Growth Fund | | Institutional International Growth Fund | | |
| | Small Cap Value Fund | | International Small Cap Growth Fund | | |
| | | | Emerging Markets Leaders Fund | | |
| | | | Emerging Markets Growth Fund | | |
| | | | Emerging Markets ex China Growth Fund | | |
| | | | Emerging Markets Small Cap Growth Fund | | |
| | | | China Growth Fund | | |
| | | © | William Blair & Company, L.L.C., distributor | |
 | +1 800 742 7272
williamblairfunds.com | | 150 North Riverside Plaza
Chicago, Illinois 60606 | 00103188 |
Not applicable to this filing.
| Item 3. | Audit Committee Financial Expert |
Not applicable to this filing.
| Item 4. | Principal Accountant Fees and Services |
Not applicable to this filing.
| Item 5. | Audit Committee of Listed Registrants |
Not applicable to this Registrant, insofar as the Registrant is not a listed company.
| Item 6. | Schedule of Investments |
See Schedule of Investments in Item 1.
| Item 7. | Disclosure of Proxy Voting Policies and Procedures for Closed-End Management Investment Companies |
Not applicable to this Registrant, insofar as the Registrant is not a closed-end management investment company.
| Item 8. | Portfolio Managers of Closed-End Management Investment Companies |
Not applicable to this Registrant, insofar as the Registrant is not a closed-end management investment company.
| Item 9. | Purchase of Equity Securities by Closed-End Management Investment Companies and Affiliated Purchasers |
Not applicable to this Registrant, insofar as the Registrant is not a closed-end management investment company.
| Item 10. | Submission of Matters to a Vote of Security Holders |
There have been no material changes to the procedures by which shareholders may recommend nominees to the Registrant’s Board of Trustees since the Registrant last provided disclosure in response to this item.
Controls and Procedures
(a) The Registrant’s principal executive and principal financial officers, or persons performing similar functions, have concluded that the Registrant’s Disclosure Controls and Procedures (as defined in Rule 30a-3(c) under the Investment Company Act of 1940, as amended (the “1940 Act”) (17 CFR 270.30a-3(c)) are effective, as of a date within 90 days of the filing date of this report that includes the disclosure required by this paragraph, based on their evaluation of these controls and procedures required by Rule 30a-3 (b) under the 1940 Act (17 CFR 270.30a-3(b) and Rules 13a-15(b) or 15d-15(b) under the Securities Exchange Act of 1934, as amended to date (17 CFR 240.13a-15(b) or 240.15d-15(b)).
(b) There were no changes in the Registrant’s internal control over financial reporting (as defined in Rule 30a-3(d) under the 1940 Act (17 CFR 270.30a-3(d)) that occurred during the period covered by this report that has materially affected, or is reasonably likely to materially affect, the Registrant’s internal control over financial reporting.
| Item 12. | Disclosure of Securities Lending Activities for Closed-End Management Investment Companies |
Not applicable to this Registrant, insofar as the Registrant is not a closed-end management investment company.
13. (a) (1) Code of Ethics
Not applicable to this filing.
13. (a) (2) (1)
Certification of Principal Executive Officer Required by Rule 30a-2(a) of the Investment Company Act of 1940 is filed as an exhibit hereto.
13. (a) (2) (2)
Certification of Principal Financial Officer Required by Rule 30a-2(a) of the Investment Company Act of 1940 is filed as an exhibit hereto.
13. (a) (3)
Not applicable to this Registrant.
13. (a) (4)
Not applicable to this filing.
13. (b)
Certifications of the Principal Executive Officer and Principal Financial Officer of the issuer as required by Rule 30a-2(b) of the Investment Company Act of 1940 are filed as exhibits hereto.
SIGNATURES
Pursuant to the requirements of the Securities Exchange Act of 1934 and the Investment Company Act of 1940, the Registrant has duly caused this report to be signed on its behalf by the undersigned, thereunto duly authorized.
| | | William Blair Funds |
| | |
| | | /s/ Stephanie G. Braming |
| By: | | Stephanie G. Braming |
| | | President (Principal Executive Officer) |
Date: August 24, 2023
Pursuant to the requirements of the Securities Exchange Act of 1934 and the Investment Company Act of 1940, this report has been signed below by the following persons on behalf of the Registrant and in the capacities and on the dates indicated.
| | | /s/ Stephanie G. Braming |
| By: | | Stephanie G. Braming |
| | | President (Principal Executive Officer) |
Date: August 24, 2023
| | | /s/ John M. Raczek |
| By: | | John M. Raczek |
| | | Treasurer (Principal Financial Officer) |
Date: August 24, 2023