UNITED STATES
SECURITIES AND EXCHANGE COMMISSION
Washington, D.C. 20549
Form N-CSR
CERTIFIED SHAREHOLDER REPORT OF REGISTERED
MANAGEMENT INVESTMENT COMPANIES
Investment Company Act File Number 811-5344
William Blair Funds
(Exact name of registrant as specified in charter)
| 150 North Riverside Plaza, Chicago, IL | | 60606 |
| (Address of principal executive offices) | | (Zip Code) |
Stephanie G. Braming, Principal Executive Officer
William Blair Funds
150 North Riverside Plaza, Chicago, IL 60606
(Name and address of agent for service)
Registrant’s telephone number, including area code: 312-236-1600
Date of fiscal year end: December 31
Date of reporting period: June 30, 2021
Item 1. June 30, 2021 Semiannual Reports transmitted to shareholders.

| | | | | June 30, 2021 |
| | | | | |
| | | | | |
| | | | | |
| | | | | |
| | | | | |
| | | | | |
| | | | | |
| | | | | |
| | | | | |
| | | | | |
| | | | | |
| | | | | |
| | | | | |
| | | | | |
| | | | | |
| | | | | |
| | | | | |
| | | | | |
| | William Blair Funds | | |
| | Semiannual Report | | |
| | | | | |
| | | | | |
| | | | | |
| | | | | |
| | | | | |
| | | | | |
| | | | | |
| | | | | |
| | | | | |
| June 30, 2021 | William Blair Funds | 1 |
The views expressed in the commentary for each Fund reflect those of the portfolio management team only through the end of the period of the report as stated on the cover. The portfolio management team’s views are subject to change at any time based on market and other conditions and should not be construed as a recommendation. Statements involving predictions, assessments, analyses, or outlook for individual securities, industries, market sectors, and/or markets involve risks and uncertainties, and there is no guarantee they will come to pass.
This report is submitted for the general information of the shareholders of William Blair Funds. It is not authorized for distribution to prospective Fund investors unless accompanied or preceded by the Fund’s prospectus. Please carefully consider a Fund’s investment objectives, risks, charges, and expenses before investing. This and other information is contained in the Fund’s prospectus, which you may obtain by calling 1-800-742-7272. Read it carefully before you invest or send money.
| 2 | Semiannual Report | June 30, 2021 |
U.S. Growth Market Review and Outlook
The U.S. equity market remained strong through the first half of 2021 as the U.S. economy continued to demonstrate improvement following disruption in 2020. First quarter market performance was supported by positive economic data, robust job growth and massive stimulus distributed to U.S. households and businesses. Improvements in corporate earnings growth also buoyed equities as corporations reported fourth quarter profits that broadly exceeded Wall Street’s expectations.
While the rate of COVID-19 vaccinations accelerated faster than anticipated across the country during the first quarter, the pace of vaccinations slowed through the second quarter despite an abundant supply of vaccines in the U.S. However, new cases of COVID-19, along with hospitalizations and deaths, significantly declined through the first half of the year, allowing the economy to recover as restrictions were eased across the country.
In the second quarter, manufacturing activity, gross domestic product (GDP), and job growth increased, further supporting the continued economic rebound. Notably, as U.S. employers increased hiring, the number of job openings outpaced the number of potential workers available to claim them, resulting in a sharp increase in wages. While the source of funding is yet to be determined, U.S. President Biden reached a bipartisan deal to boost infrastructure spending by $600 billion late in the second quarter. The Federal Open Market Committee (FOMC) reiterated its commitment to maintain a low target federal funds rate as the economy continues to recover. However, Federal Reserve policymakers announced that they expect an increase in the Federal funds rate by the end of 2023, an accelerated timeline relative to prior expectations. U.S. Treasury yields declined during the second quarter, facilitating a rotation that benefited growth-oriented segments of the market. With a largely positive fundamental backdrop and healthy corporate earnings reports, U.S. equity indices advanced in the second quarter.
Despite strong equity market performance and a continued sense of optimism around U.S. economic potential, some uncertainty remains surrounding the spread of new COVID-19 variants that have the potential to slow down the reopening of the economy. More specifically, the spread of the COVID-19 Delta variant coupled with vaccine hesitancy among some portions of the population may pose a challenge to the U.S. achieving herd immunity. While bolstering the economy, the surge in government spending and recovery in consumer spending activity has fueled inflation concerns among some investors, though the bond market does not appear to share those concerns, at least for the time being.
We continue to monitor economic developments and navigate through the business model implications of COVID-19 disruption and the subsequent economic recovery. Our focus remains on identifying companies with long-term durability, independent of the economic backdrop, whose stocks present compelling risk/reward opportunities. Through bottom-up, fundamental analysis, we seek to identify quality companies with superior management, high barriers to entry and differentiated products or services that we believe can outperform over a market cycle.
| June 30, 2021 | William Blair Funds | 3 |
U.S. Value Market Review and Outlook
After a difficult 2020, we believe that the six month period ended June 30, 2021 has started on a positive note as we return to “normal”. Returns on the Russell 2000 Value index (the “Benchmark”) were robust in the first half of the year as COVID-19 vaccinations became more widely distributed and the country began to reopen.
As COVID-19 vaccines were rolled out, the U.S. went from virtually no fully vaccinated persons at the beginning of the year to roughly half the population fully vaccinated at the end of the second quarter. This has led to the economy reopening and has contributed to driving the unemployment rate down to under 6% after peaking near 15% in 2020. Gross domestic product has followed suit growing 6.4% in the first quarter, an acceleration from a 4.3% increase in the fourth quarter of 2020.
Most of the year-to-date return came in the first quarter with our Benchmark up over 21%, however, positive returns continued in the second quarter, advancing almost another 5%. Robust returns have been driven by COVID-19 vaccine distribution, strong macro data, positive earnings trends, and continued flowthrough of the benefits of government stimulus. All of these positives have overshadowed the risks of the continued spread of the Delta variant of COVID-19 globally.
| 4 | Semiannual Report | June 30, 2021 |
| | Growth Fund |
| | |
| | The Growth Fund seeks long-term capital appreciation. |
| | |
| | AN OVERVIEW FROM THE PORTFOLIO MANAGER |
| | |

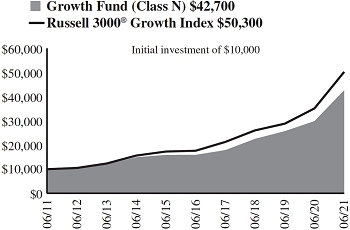
David C. Fording, CFA | The William Blair Growth Fund (Class N shares) (the “Fund”) posted a 13.09% increase, net of fees, for the six months ended June 30, 2021. By comparison, the Fund’s benchmark index, the Russell 3000® Growth Index (the “Index”), increased 12.71%. Outperformance for the six month period was largely driven by stock selection. Selection in Health Care, including our position in Penumbra, and in Consumer Discretionary, including our positions in Revolve Group and Skyline Champion, benefited relative performance during the period. Shares of Penumbra, the market leader in mechanical stroke treatment, advanced on strong fundamental results. Online fashion retailer Revolve Group executed well through the COVID-19 pandemic and was a beneficiary of strong demand for refreshed wardrobes as the U.S. economy began to re-open. Other top contributors within the portfolio were Alphabet (Communication Services) and Cameco (Energy). In addition, not owning Apple (Information Technology) and Tesla (Consumer Discretionary), added to relative results. As it relates to Apple, our decision not to own the stock, due to the maturity of the high-end smart phone, tablet and PC markets, created a significant headwind to relative performance in 2020 given the revaluation of the company’s services business. This began to reverse during the first half of 2021. Top detractors from year-to-date performance included Rush Street Interactive (Consumer Discretionary), Ball Corp. (Materials), New Fortress Energy (Energy), and not owning Facebook (Communication Services). Rush Street Interactive, the largest U.S. online casino operator, was our top individual detractor. While the company had better than expected revenue, an acceleration of marketing spend resulted in earnings that were below expectations. Stock selection in Information Technology also dampened performance due in part to positions in Pure Storage and NICE, and not owning NVIDIA. While flash-based storage solutions provider Pure Storage reported strong results, the stock declined as valuations of longer-duration growth companies were pressured by rising interest rates early in the year. Fabless semiconductor company NVIDIA benefited from robust demand in gaming and datacenter; thus, not owning this strong performing stock resulted in a headwind to relative performance. Please refer to the U.S. Growth Market Review and Outlook relating to the Fund on page 3. |
| June 30, 2021 | William Blair Funds | 5 |
Growth Fund
Performance Highlights (Unaudited)
| Average Annual Total Returns through 6/30/2021 |
| | | Year
to Date | | 1 Year | | 3 Year | | 5 Year | | 10 Year | | Since
Inception(a) |
| Class N | | | 13.09 | % | | | 42.75 | % | | | 23.68 | % | | | 21.77 | % | | | 15.63 | % | | | — | % |
| Class I | | | 13.27 | | | | 43.12 | | | | 24.02 | | | | 22.11 | | | | 15.98 | | | | — | |
| Class R6 | | | 13.31 | | | | 43.22 | | | | — | | | | — | | | | — | | | | 28.23 | |
| Russell 3000® Growth Index | | | 12.71 | | | | 42.99 | | | | 24.47 | | | | 23.31 | | | | 17.54 | | | | 29.78 | |
| S&P 500® Index | | | 15.25 | | | | 40.79 | | | | 18.67 | | | | 17.65 | | | | 14.84 | | | | 21.22 | |
| (a) | Since inception is for the period from May 2, 2019 (Commencement of Operations) to June 30, 2021. |
Performance cited represents past performance. Past performance does not guarantee future results and current performance may be lower or higher than the data quoted. Results shown are average annual total returns, which assume reinvestment of dividends and capital gains. Investment returns and principal will fluctuate and you may have a gain or loss when you sell shares. For the most current month-end performance information, please call 1-800-742-7272, or visit our Web site at www.williamblairfunds.com. From time to time, the investment adviser may waive fees or reimburse expenses for the Fund. Without these waivers/reimbursements, performance would be lower. Class N shares are not subject to a sales load. Class I shares are not subject to a sales load or distribution (Rule 12b-1) fees. Class R6 shares are not subject to a sales load, distribution (Rule 12b-1) fees, or sub-transfer agent fees.
The performance highlights and graph presented above do not reflect the deduction of taxes that a shareholder would pay on fund distributions or the redemption of fund shares.
The Russell 3000® Growth Index consists of large, medium, and small capitalization companies with above average price-to-book ratios and forecasted growth rates. The index is weighted by market capitalization and large/medium/small companies make up approximately 80%/15%/5% of the index.
The S&P 500® Index indicates broad larger capitalization equity market performance.
This report identifies the Fund’s investments on June 30, 2021. These holdings are subject to change. Not all stocks in the Fund performed the same, nor is there any guarantee that these stocks will perform as well in the future. Market forecasts provided in this report may not necessarily come to pass.
Sector Diversification (Unaudited)

The sector diversification shown is based on the total long-term securities.
| 6 | Semiannual Report | June 30, 2021 |
Growth Fund
Portfolio of Investments, June 30, 2021 (all dollar amounts in thousands) (unaudited)
| | | | | | | | |
| | | | | | | | |
| | Issuer | | Shares | | | Value | |
| | | | | | | | | | |
| | Common Stocks | | | | | | | | |
| | Information Technology—38.9% | | | | | | | | |
| * | Adobe, Inc. | | | 16,256 | | | $ | 9,520 | |
| * | Advanced Micro Devices, Inc. | | | 76,929 | | | | 7,226 | |
| * | Alarm.com Holdings, Inc. | | | 20,181 | | | | 1,709 | |
| | Brooks Automation, Inc. | | | 24,419 | | | | 2,327 | |
| | Fidelity National Information Services, Inc. | | | 50,903 | | | | 7,211 | |
| * | GoDaddy, Inc. | | | 57,097 | | | | 4,965 | |
| * | Grid Dynamics Holdings, Inc. | | | 184,373 | | | | 2,771 | |
| | Mastercard, Inc. | | | 37,958 | | | | 13,858 | |
| | Microsoft Corporation | | | 111,018 | | | | 30,075 | |
| * | MongoDB, Inc. | | | 7,635 | | | | 2,760 | |
| | National Instruments Corporation | | | 99,314 | | | | 4,199 | |
| * | Nice, Ltd.—ADR | | | 18,677 | | | | 4,622 | |
| * | PayPal Holdings, Inc. | | | 46,880 | | | | 13,665 | |
| * | Pure Storage, Inc. | | | 266,678 | | | | 5,208 | |
| | Texas Instruments, Inc. | | | 40,066 | | | | 7,705 | |
| * | Verra Mobility Corporation | | | 254,570 | | | | 3,913 | |
| * | Workday, Inc. | | | 22,601 | | | | 5,396 | |
| | | | | | | | | 127,130 | |
| | Consumer Discretionary—14.8% | | | | | | | | |
| | Advance Auto Parts, Inc. | | | 21,784 | | | | 4,469 | |
| * | Amazon.com, Inc. | | | 7,266 | | | | 24,996 | |
| * | Bright Horizons Family Solutions, Inc. | | | 29,148 | | | | 4,288 | |
| * | Burlington Stores, Inc. | | | 7,268 | | | | 2,340 | |
| * | Etsy, Inc. | | | 8,873 | | | | 1,827 | |
| * | Revolve Group, Inc. | | | 32,981 | | | | 2,272 | |
| * | Rush Street Interactive, Inc. | | | 212,743 | | | | 2,608 | |
| * | Skyline Champion Corporation | | | 44,925 | | | | 2,395 | |
| * | Ulta Beauty, Inc. | | | 9,111 | | | | 3,150 | |
| | | | | | | | | 48,345 | |
| | Health Care—13.9% | | | | | | | | |
| * | Aerie Pharmaceuticals, Inc. | | | 127,181 | | | | 2,036 | |
| | Agilent Technologies, Inc. | | | 34,083 | | | | 5,038 | |
| * | Certara, Inc. | | | 102,102 | | | | 2,892 | |
| * | Exact Sciences Corporation | | | 26,798 | | | | 3,331 | |
| * | Horizon Therapeutics plc† | | | 63,406 | | | | 5,937 | |
| | STERIS plc† | | | 24,653 | | | | 5,086 | |
| | Stryker Corporation | | | 32,168 | | | | 8,355 | |
| | UnitedHealth Group, Inc. | | | 22,342 | | | | 8,947 | |
| | Zoetis, Inc. | | | 20,115 | | | | 3,749 | |
| | | | | | | | | 45,371 | |
| | Communication Services—11.1% | | | | | | | | |
| | Activision Blizzard, Inc. | | | 47,891 | | | | 4,571 | |
| * | Alphabet, Inc. Class “A” | | | 10,549 | | | | 25,758 | |
| | Warner Music Group Corporation | | | 91,285 | | | | 3,290 | |
| * | Zynga, Inc. | | | 254,122 | | | | 2,701 | |
| | | | | | | | | 36,320 | |
| | Industrials—8.7% | | | | | | | | |
| | BWX Technologies, Inc. | | | 80,236 | | | | 4,663 | |
| * | Copart, Inc. | | | 47,217 | | | | 6,225 | |
| * | CoStar Group, Inc. | | | 46,470 | | | | 3,849 | |
| | Issuer | | Shares or
Principal
Amount | | | Value | |
| | | | | | | | | | |
| | Common Stocks—(continued) | | | | | | | | |
| | Industrials—(continued) | | | | | | | | |
| | Fortive Corporation | | | 60,892 | | | $ | 4,246 | |
| * | Kornit Digital, Ltd.† | | | 20,879 | | | | 2,596 | |
| | The Brink’s Co. | | | 60,922 | | | | 4,681 | |
| * | Trex Co., Inc. | | | 22,167 | | | | 2,266 | |
| | | | | | | | | 28,526 | |
| | Consumer Staples—4.0% | | | | | | | | |
| | The Coca-Cola Co. | | | 137,829 | | | | 7,458 | |
| | The Estee Lauder Cos., Inc. | | | 18,026 | | | | 5,734 | |
| | | | | | | | | 13,192 | |
| | Financials—2.6% | | | | | | | | |
| | Aon plc† | | | 18,555 | | | | 4,430 | |
| | Ares Management Corporation | | | 62,589 | | | | 3,980 | |
| | | | | | | | | 8,410 | |
| | Energy—2.0% | | | | | | | | |
| | Cameco Corporation† | | | 225,274 | | | | 4,321 | |
| | New Fortress Energy, Inc. | | | 54,935 | | | | 2,081 | |
| | | | | | | | | 6,402 | |
| | Materials—1.4% | | | | | | | | |
| | Ball Corporation | | | 54,789 | | | | 4,439 | |
| | Real Estate—1.1% | | | | | | | | |
| | SBA Communications Corporation | | | 10,837 | | | | 3,454 | |
| | Total Common Stocks—98.5%
(cost $164,351) | | | | | | | 321,589 | |
| | | | | | | | | | |
| | Repurchase Agreement | | | | | | | | |
| | Fixed Income Clearing Corporation, 0.000% dated 6/30/21, due 7/1/21, repurchase price $5,019, collateralized by U.S. Treasury Bond, 1.875%, due 2/15/41,valued at $5,119 | | | $5,019 | | | | 5,019 | |
| | Total Repurchase Agreement—1.5%
(cost $5,019) | | | | | | | 5,019 | |
| | Total Investments—100.0%
(cost $169,370) | | | | | | | 326,608 | |
| | Liabilities, plus cash and other assets—(0.0)% | | | | | | | (141 | ) |
| | Net assets—100.0% | | | | | | $ | 326,467 | |
ADR = American Depository Receipt
* = Non-income producing security
† = U.S. listed foreign security
See accompanying Notes to Financial Statements.
| June 30, 2021 | William Blair Funds | 7 |
| | Large Cap Growth Fund |
| | |
| | The Large Cap Growth Fund seeks long-term capital appreciation. |
| | |
| | AN OVERVIEW FROM THE PORTFOLIO MANAGERS |
| | |

James S. Golan, CFA 
David P. Ricci, CFA | The William Blair Large Cap Growth Fund (Class N shares) posted a 14.18% increase, net of fees, for the six months ended June 30, 2021. By comparison, the Fund’s benchmark index, the Russell 1000® Growth Index (the “Index”), increased 12.99%. Outperformance for the six month period was largely the result of positive stock selection. Information Technology was a standout contributor due to our positions in Lam Research, Intuit and PayPal, as well as not owning Apple. Lam Research, a global supplier of wafer fabrication equipment and services, benefited from robust demand for semiconductor equipment and reported growth in its installed base and services business. As it relates to Apple, our decision not to own the stock, due to the maturity of the high-end smart phone, tablet and PC markets, created a significant headwind to relative performance in 2020 given the revaluation of the company’s services business. This began to reverse during the first half of 2021. Other top contributors were Alphabet (Communication Services), Apollo Global Management (Financials) and not owning Tesla (Consumer Discretionary). Alphabet Inc., an internet search engine company, had accelerating growth across its core segments, most notably in YouTube. Top detractors from relative performance during the period were NVIDIA (Information Technology), Guidewire (Information Technology), Fortive (Industrials), Mastercard (Information Technology) and ABIOMED (Health Care). We initiated a position in fabless semiconductor company NVIDIA during the second quarter. Strong performance of the stock, driven by robust demand in gaming and datacenter, both before and after our initial purchase, resulted in a headwind to relative performance. Guidewire, a software provider to the property & casualty insurance industry, delivered strong sales but increased cloud investments, given its transition to a cloud-based subscription model, which weighed on gross margins. Our decision to not own Facebook (Communication Services) also detracted from relative performance. Please refer to the U.S. Growth Market Review and Outlook relating to the Fund on page 3. |
| 8 | Semiannual Report | June 30, 2021 |
Large Cap Growth Fund
Performance Highlights (Unaudited)
| Average Annual Total Returns through 6/30/2021 |
| | | Year
to Date | | 1 Year | | 3 Year | | 5 Year | | 10 Year | | Since
Inception(a) |
| Class N | | | 14.18 | % | | | 41.96 | % | | | 25.54 | % | | | 24.38 | % | | | 18.16 | % | | | — | % |
| Class I | | | 14.33 | | | | 42.27 | | | | 25.85 | | | | 24.70 | | | | 18.45 | | | | — | |
| Class R6 | | | 14.34 | | | | 42.31 | | | | — | | | | — | | | | — | | | | 30.66 | |
| Russell 1000® Growth Index | | | 12.99 | | | | 42.50 | | | | 25.14 | | | | 23.66 | | | | 17.87 | | | | 30.23 | |
| (a) | Since inception is for the period from May 2, 2019 (Commencement of Operations) to June 30, 2021. |
Performance cited represents past performance. Past performance does not guarantee future results and current performance may be lower or higher than the data quoted. Results shown are average annual total returns, which assume reinvestment of dividends and capital gains. Investment returns and principal will fluctuate and you may have a gain or loss when you sell shares. For the most current month-end performance information, please call 1-800-742-7272, or visit our Web site at www.williamblairfunds.com. From time to time, the investment adviser may waive fees or reimburse expenses for the Fund. Without these waivers/reimbursements, performance would be lower. Class N shares are not subject to a sales load. Class I shares are not subject to a sales load or distribution (Rule 12b-1) fees. Class R6 shares are not subject to a sales load, distribution (Rule 12b-1) fees, or sub-transfer agent fees.
The performance highlights and graph presented above do not reflect the deduction of taxes that a shareholder would pay on fund distributions or the redemption of fund shares.
The Russell 1000® Growth Index consists of large capitalization companies with above average price-to-book ratios and forecasted growth rates.
This report identifies the Fund’s investments on June 30, 2021. These holdings are subject to change. Not all stocks in the Fund performed the same, nor is there any guarantee that these stocks will perform as well in the future. Market forecasts provided in this report may not necessarily come to pass.
Sector Diversification (Unaudited)

The sector diversification shown is based on the total long-term securities.
| June 30, 2021 | William Blair Funds | 9 |
Large Cap Growth Fund
Portfolio of Investments, June 30, 2021 (all dollar amounts in thousands) (unaudited)
| | | | | | | | |
| | | | | | | | |
| | Issuer | | Shares | | | Value | |
| | | | | | | | | | |
| | Common Stocks | | | | | | | | |
| | Information Technology—45.4% | | | | | | | | |
| | Accenture plc† | | | 88,800 | | | $ | 26,177 | |
| * | Adobe, Inc. | | | 46,410 | | | | 27,180 | |
| * | Advanced Micro Devices, Inc. | | | 268,098 | | | | 25,182 | |
| | Fidelity National Information Services, Inc. | | | 88,540 | | | | 12,544 | |
| * | Guidewire Software, Inc. | | | 86,680 | | | | 9,771 | |
| | Intuit, Inc. | | | 50,770 | | | | 24,886 | |
| | Lam Research Corporation | | | 36,920 | | | | 24,024 | |
| | Mastercard, Inc. | | | 104,180 | | | | 38,035 | |
| | Microsoft Corporation | | | 335,450 | | | | 90,873 | |
| | NVIDIA Corporation | | | 15,830 | | | | 12,666 | |
| * | PayPal Holdings, Inc. | | | 124,610 | | | | 36,321 | |
| * | salesforce.com, Inc. | | | 88,480 | | | | 21,613 | |
| | Texas Instruments, Inc. | | | 115,550 | | | | 22,220 | |
| | | | | | | | | 371,492 | |
| | Consumer Discretionary—16.8% | | | | | | | | |
| * | Amazon.com, Inc. | | | 21,365 | | | | 73,499 | |
| * | Marriott International, Inc. | | | 126,920 | | | | 17,327 | |
| | NIKE, Inc. | | | 169,610 | | | | 26,203 | |
| | Starbucks Corporation | | | 186,400 | | | | 20,842 | |
| | | | | | | | | 137,871 | |
| | Communication Services—12.6% | | | | | | | | |
| | Activision Blizzard, Inc. | | | 202,410 | | | | 19,318 | |
| * | Alphabet, Inc. Class “A” | | | 21,790 | | | | 53,207 | |
| * | Alphabet, Inc. Class “C” | | | 5,300 | | | | 13,284 | |
| * | Live Nation Entertainment, Inc. | | | 200,850 | | | | 17,592 | |
| | | | | | | | | 103,401 | |
| | Health Care—9.6% | | | | | | | | |
| * | ABIOMED, Inc. | | | 39,738 | | | | 12,403 | |
| | Stryker Corporation | | | 76,240 | | | | 19,802 | |
| | UnitedHealth Group, Inc. | | | 68,350 | | | | 27,370 | |
| | Zoetis, Inc. | | | 100,850 | | | | 18,794 | |
| | | | | | | | | 78,369 | |
| | Industrials—6.4% | | | | | | | | |
| * | Copart, Inc. | | | 153,580 | | | | 20,246 | |
| | Equifax, Inc. | | | 70,080 | | | | 16,785 | |
| | Fortive Corporation | | | 215,890 | | | | 15,056 | |
| | | | | | | | | 52,087 | |
| | Consumer Staples—5.0% | | | | | | | | |
| | Costco Wholesale Corporation | | | 56,070 | | | | 22,185 | |
| | The Estee Lauder Cos., Inc. | | | 58,970 | | | | 18,757 | |
| | | | | | | | | 40,942 | |
| | Financials—2.0% | | | | | | | | |
| | Apollo Global Management, Inc. | | | 260,930 | | | | 16,230 | |
| | Materials—1.4% | | | | | | | | |
| | Linde plc† | | | 38,720 | | | | 11,194 | |
| | Total Common Stocks—99.2%
(cost $511,330) | | | | | | | 811,586 | |
| | | | | | | | |
| | Issuer | | Principal
Amount | | | Value | |
| | | | | | | | |
| | Repurchase Agreement | | | | | | |
| | Fixed Income Clearing Corporation, 0.000% dated 6/30/21, due 7/1/21, repurchase price $6,451, collateralized by U.S. Treasury Bond, 1.875%,due 2/15/41, valued at $6,580 | | | $6,451 | | | $ | 6,451 | |
| | Total Repurchase Agreement—0.8%
(cost $6,451) | | | | | | | 6,451 | |
| | Total Investments—100.0%
(cost $517,781) | | | | | | | 818,037 | |
| | Cash and other assets, less liabilities—0.0% | | | | | | | 169 | |
| | Net assets—100.0% | | | | | | $ | 818,206 | |
† = U.S. listed foreign security
* = Non-income producing security
See accompanying Notes to Financial Statements.
| 10 | Semiannual Report | June 30, 2021 |
| | Mid Cap Growth Fund |
| | |
| | The Mid Cap Growth Fund seeks long-term capital appreciation. |
| | |
| | AN OVERVIEW FROM THE PORTFOLIO MANAGERS |
| | |

Daniel Crowe, CFA 
James E. Jones, CFA | The William Blair Mid Cap Growth Fund (Class N shares) (the “Fund”) posted a 3.57% increase, net of fees, for the six months ended June 30, 2021. By comparison, the Fund’s benchmark index, the Russell Midcap® Growth Index (the “Index”), increased 10.44%. In the six month period, the Fund lagged the Index, primarily due to stock-specific factors. Stock selection in Information Technology, including our positions in Anaplan, Pure Storage and RingCentral, and Industrials, including our position in CoStar, detracted from relative returns. Other top detractors included Take-Two Interactive Software (Communication Services), as well as not owning Moderna (Health Care). Shares of software company Anaplan declined as the company reported billings growth and revenue guidance below expectations. Concerns surrounding the strength of the gaming industry as we exit the COVID-19 pandemic weighed on software company Take-Two. Given our valuation sensitivity, we believe that normalization in valuations should prove to be beneficial to the relative performance of the Fund in the future. Please refer to the U.S. Growth Market Review and Outlook relating to the Fund on page 3. |
| | |
| | |
| June 30, 2021 | William Blair Funds | 11 |
Mid Cap Growth Fund
Performance Highlights (Unaudited)
| Average Annual Total Returns through 6/30/2021 |
| | | | | | | | | | | | | |
| | | Year
to Date | | 1 Year | | 3 Year | | 5 Year | | 10 Year | | Since
Inception(a) |
| Class N | | | 3.57 | % | | | 33.14 | % | | | 16.49 | % | | | 16.58 | | | | 11.52 | % | | | — | % |
| Class I | | | 3.61 | | | | 33.36 | | | | 16.77 | | | | 16.86 | | | | 11.80 | | | | — | |
| Class R6 | | | 3.68 | | | | 33.42 | | | | — | | | | — | | | | — | | | | 18.30 | |
| Russell Midcap® Growth Index | | | 10.44 | | | | 43.77 | | | | 22.39 | | | | 20.52 | | | | 15.13 | | | | 25.72 | |
| (a) | Since inception is for the period from May 2, 2019 (Commencement of Operations) to June 30, 2021. |
Performance cited represents past performance. Past performance does not guarantee future results and current performance may be lower or higher than the data quoted. Results shown are average annual total returns, which assume reinvestment of dividends and capital gains. Investment returns and principal will fluctuate and you may have a gain or loss when you sell shares. For the most current month-end performance information, please call 1-800-742-7272, or visit our Web site at www.williamblairfunds.com. Investing in medium capitalization companies involves special risks, including higher volatility and lower liquidity. Medium capitalization stocks are also more sensitive to purchase/sale transactions and changes in the issuer’s financial condition. From time to time, the investment adviser may waive fees or reimburse expenses for the Fund. Without these waivers/reimbursements, performance would be lower. Class N shares are not subject to a sales load. Class I shares are not subject to a sales load or distribution (Rule 12b-1) fees. Class R6 shares are not subject to a sales load, distribution (Rule 12b-1) fees, or sub-transfer agent fees.
The performance highlights and graph presented above do not reflect the deduction of taxes that a shareholder would pay on fund distributions or the redemption of fund shares.
The Russell Midcap® Growth Index is an index that is constructed to provide a comprehensive and unbiased barometer of the mid-cap growth market.
This report identifies the Fund’s investments on June 30, 2021. These holdings are subject to change. Not all stocks in the Fund performed the same, nor is there any guarantee that these stocks will perform as well in the future. Market forecasts provided in this report may not necessarily come to pass.
Sector Diversification (Unaudited)

The sector diversification shown is based on the total long-term securities.
| 12 | Semiannual Report | June 30, 2021 |
Mid Cap Growth Fund
Portfolio of Investments, June 30, 2021 (all dollar amounts in thousands) (unaudited)
| | | | | | | | |
| | | | | | | | |
| | Issuer | | Shares | | | Value | |
| | | | | | | | | | |
| | Common Stocks | | | | | | | | |
| | Information Technology—30.5% | | | | | | | | |
| * | Anaplan, Inc. | | | 23,480 | | | $ | 1,251 | |
| * | Aspen Technology, Inc. | | | 7,872 | | | | 1,083 | |
| * | Cadence Design Systems, Inc. | | | 20,450 | | | | 2,798 | |
| | Dolby Laboratories, Inc. | | | 11,715 | | | | 1,151 | |
| * | Dynatrace, Inc. | | | 35,905 | | | | 2,098 | |
| * | EPAM Systems, Inc. | | | 2,970 | | | | 1,518 | |
| * | Euronet Worldwide, Inc. | | | 13,755 | | | | 1,862 | |
| * | GoDaddy, Inc. | | | 17,805 | | | | 1,548 | |
| * | Guidewire Software, Inc. | | | 6,937 | | | | 782 | |
| | Microchip Technology, Inc. | | | 9,845 | | | | 1,474 | |
| | MKS Instruments, Inc. | | | 7,415 | | | | 1,320 | |
| * | MongoDB, Inc. | | | 4,915 | | | | 1,777 | |
| * | Nice, Ltd.—ADR | | | 6,620 | | | | 1,638 | |
| | Pegasystems, Inc. | | | 12,545 | | | | 1,746 | |
| * | Pure Storage, Inc. | | | 84,290 | | | | 1,646 | |
| * | RingCentral, Inc. | | | 4,810 | | | | 1,398 | |
| * | Zendesk, Inc. | | | 7,915 | | | | 1,142 | |
| | | | | | | | | 26,232 | |
| | Health Care—21.1% | | | | | | | | |
| * | 10X Genomics, Inc. | | | 5,825 | | | | 1,141 | |
| * | ABIOMED, Inc. | | | 3,698 | | | | 1,154 | |
| | Agilent Technologies, Inc. | | | 14,635 | | | | 2,163 | |
| * | Align Technology, Inc. | | | 3,195 | | | | 1,952 | |
| | Bio-Techne Corporation | | | 2,742 | | | | 1,235 | |
| * | Centene Corporation | | | 12,105 | | | | 883 | |
| * | Exact Sciences Corporation | | | 10,000 | | | | 1,243 | |
| * | Horizon Therapeutics plc† | | | 28,340 | | | | 2,654 | |
| * | IDEXX Laboratories, Inc. | | | 2,390 | | | | 1,509 | |
| * | Insulet Corporation | | | 6,295 | | | | 1,728 | |
| * | Mettler-Toledo International, Inc. | | | 945 | | | | 1,309 | |
| | STERIS plc† | | | 5,450 | | | | 1,124 | |
| | | | | | | | | 18,095 | |
| | Industrials—16.6% | | | | | | | | |
| * | Axon Enterprise, Inc. | | | 7,525 | | | | 1,330 | |
| | BWX Technologies, Inc. | | | 35,744 | | | | 2,077 | |
| * | Clarivate plc† | | | 63,475 | | | | 1,748 | |
| * | Copart, Inc. | | | 23,567 | | | | 3,107 | |
| * | CoStar Group, Inc. | | | 29,790 | | | | 2,467 | |
| | Equifax, Inc. | | | 4,545 | | | | 1,089 | |
| | Rockwell Automation, Inc. | | | 4,025 | | | | 1,151 | |
| * | Teledyne Technologies, Inc. | | | 3,145 | | | | 1,317 | |
| | | | | | | | | 14,286 | |
| | Consumer Discretionary—10.1% | | | | | | | | |
| | Advance Auto Parts, Inc. | | | 6,873 | | | | 1,410 | |
| * | Aptiv plc† | | | 9,425 | | | | 1,483 | |
| * | Bright Horizons Family Solutions, Inc. | | | 14,010 | | | | 2,061 | |
| * | Burlington Stores, Inc. | | | 6,065 | | | | 1,953 | |
| * | Etsy, Inc. | | | 8,809 | | | | 1,813 | |
| | | | | | | | | 8,720 | |
| | Issuer | | Shares or
Principal
Amount | | | Value | |
| | | | | | | | | | |
| | Common Stocks—(continued) | | | | | | | | |
| | Communication Services—6.0% | | | | | | | | |
| | Cable One, Inc. | | | 305 | | | $ | 583 | |
| * | Live Nation Entertainment, Inc. | | | 11,029 | | | | 966 | |
| * | Take-Two Interactive Software, Inc. | | | 6,050 | | | | 1,071 | |
| | Warner Music Group Corporation | | | 41,770 | | | | 1,505 | |
| * | Zillow Group, Inc. | | | 8,645 | | | | 1,057 | |
| | | | | | | | | 5,182 | |
| | Materials—5.4% | | | | | | | | |
| | Ball Corporation | | | 17,665 | | | | 1,431 | |
| | FMC Corporation | | | 8,550 | | | | 925 | |
| | Vulcan Materials Co. | | | 13,365 | | | | 2,327 | |
| | | | | | | | | 4,683 | |
| | Financials—4.2% | | | | | | | | |
| | Arthur J Gallagher & Co. | | | 15,055 | | | | 2,109 | |
| | East West Bancorp, Inc. | | | 21,040 | | | | 1,508 | |
| | | | | | | | | 3,617 | |
| | Consumer Staples—1.4% | | | | | | | | |
| * | BJ’s Wholesale Club Holdings, Inc. | | | 24,399 | | | | 1,161 | |
| | Real Estate—1.3% | | | | | | | | |
| | SBA Communications Corporation | | | 3,365 | | | | 1,073 | |
| | Energy—0.7% | | | | | | | | |
| | New Fortress Energy, Inc. | | | 16,593 | | | | 629 | |
| | Total Common Stocks—97.3%
(cost $58,072) | | | | | | | 83,678 | |
| | | | | | | | | | |
| | Repurchase Agreement | | | | | | | | |
| | Fixed Income Clearing Corporation, 0.000% dated 6/30/21, due 7/1/21, repurchase price $3,224, collateralized by U.S. Treasury Bond, 1.875%,due 2/15/41, valued at $3,289 | | | $3,224 | | | | 3,224 | |
| | Total Repurchase Agreement—3.8%
(cost $3,224) | | | | | | | 3,224 | |
| | Total Investments—101.1%
(cost $61,296) | | | | | | | 86,902 | |
| | Liabilities, plus cash and other assets—(1.1)% | | | | | | | (924 | ) |
| | Net assets—100.0% | | | | | | $ | 85,978 | |
ADR = American Depository Receipt
* = Non-income producing security
† = U.S. listed foreign security
See accompanying Notes to Financial Statements.
| June 30, 2021 | William Blair Funds | 13 |
| | Small-Mid Cap Core Fund |
| | |
| | The Small-Mid Cap Core Fund seeks long-term capital appreciation. |
| | |
| | AN OVERVIEW FROM THE PORTFOLIO MANAGERS |
| | |
 Daniel Crowe, CFA 
Ward D. Sexton, CFA | The William Blair Small-Mid Cap Core Fund (Class I shares) posted a 18.32% increase, net of fees, for the six months ended June 30, 2021. By comparison, the Fund’s benchmark index, the Russell 2500™ Index (the “Index”), increased 16.97%. The Fund outperformed the Index in the six month period, primarily driven by stock-specific factors. Stock selection in Health Care, including our position in Owens & Minor, was a positive contributor to relative returns. Additionally, our typical underweight to speculative Biotechnology, which consists of companies without approved products, was a tailwind during the period. Other top contributors included Denbury (Energy) and Boot Barn Holdings (Consumer Discretionary), as well as Western Alliance Bancorp (Financials) and Stem (Industrials). Conversely, stock selection in Information Technology, including our positions in Vertex, NICE and Alarm.com, was a detractor during the period. Vertex, a provider of comprehensive tax solutions for businesses, lagged as slower growth among on-premise customers created a drag on the company’s overall revenue growth rate. Other laggards included New Fortress Energy (Energy) and BWX Technologies (Industrials). New Fortress Energy, an energy infrastructure company, reported lower-than-expected revenues and margins due to higher gas costs. Please refer to the U.S. Growth Market Review and Outlook relating to the Fund on page 3. |
| 14 | Semiannual Report | June 30, 2021 |
Small-Mid Cap Core Fund
Performance Highlights (Unaudited)
Average Annual Total Returns through 6/30/2021
| | | Year
to Date | | 1 Year | | Since
Inception(a) |
| Class I | | | 18.32 | % | | | 59.41 | % | | | 27.26 | % |
| Class R6 | | | 18.40 | | | | 59.36 | | | | 27.31 | |
| Russell 2500TM Index | | | 16.97 | | | | 57.79 | | | | 27.19 | |
| | |
| (a) | Since inception is for the period from October 1, 2019 (Commencement of Operations) to June 30, 2021. |
Performance cited represents past performance. Past performance does not guarantee future results and current performance may be lower or higher than the data quoted. Results shown are average annual total returns, which assume reinvestment of dividends and capital gains. Investment returns and principal will fluctuate and you may have a gain or loss when you sell shares. For the most current month-end performance information, please call 1-800-742-7272, or visit our Web site at www.williamblairfunds.com. Investing in smaller and medium capitalization companies involves special risks, including higher volatility and lower liquidity. Smaller and medium capitalization stocks are also more sensitive to purchase/sale transactions and changes in the issuer’s financial condition. From time to time, the investment adviser may waive fees or reimburse expenses for the Fund. Without these waivers/reimbursements, performance would be lower. Class I shares are not subject to a sales load or distribution (Rule 12b-1) fees. Class R6 shares are not subject to a sales load, distribution (Rule 12b-1) fees, or sub-transfer agent fees.
The performance highlights and graph presented above do not reflect the deduction of taxes that a shareholder would pay on fund distributions or the redemption of fund shares.
The Russell 2500TMIndex measures the performance of those Russell 2500 companies with above average price-to-book ratios and forecasted growth rates.
This report identifies the Fund’s investments on June 30, 2021. These holdings are subject to change. Not all stocks in the Fund performed the same, nor is there any guarantee that these stocks will perform as well in the future. Market forecasts provided in this report may not necessarily come to pass.
Sector Diversification (Unaudited)

The sector diversification shown is based on the total long-term securities.
| June 30, 2021 | William Blair Funds | 15 |
Small-Mid Cap Core Fund
Portfolio of Investments, June 30, 2021 (all dollar amounts in thousands) (unaudited)
| | | | | | | | | |
| | | | | | | | | |
| | Issuer | | Shares | | | | Value | |
| | | | | | | | | | |
| | Common Stocks | | | | | | | | |
| | Industrials—18.9% | | | | | | | | |
| * | Axon Enterprise, Inc. | | | 4,582 | | | $ | 810 | |
| * | Builders FirstSource, Inc. | | | 23,375 | | | | 997 | |
| | BWX Technologies, Inc. | | | 13,575 | | | | 789 | |
| * | Casella Waste Systems, Inc. | | | 4,261 | | | | 270 | |
| | Douglas Dynamics, Inc. | | | 7,603 | | | | 309 | |
| * | Generac Holdings, Inc. | | | 1,193 | | | | 495 | |
| * | IAA, Inc. | | | 5,301 | | | | 289 | |
| * | Kornit Digital, Ltd.† | | | 3,699 | | | | 460 | |
| | Lincoln Electric Holdings, Inc. | | | 4,451 | | | | 586 | |
| | Luxfer Holdings plc† | | | 34,516 | | | | 768 | |
| * | Mercury Systems, Inc. | | | 5,723 | | | | 379 | |
| | Owens Corning | | | 9,537 | | | | 934 | |
| * | Stem, Inc. | | | 15,292 | | | | 551 | |
| | The Brink’s Co. | | | 13,242 | | | | 1,018 | |
| * | Trex Co., Inc. | | | 5,503 | | | | 563 | |
| * | WillScot Mobile Mini Holdings Corporation | | | 14,222 | | | | 396 | |
| | | | | | | | | 9,614 | |
| | Health Care—14.9% | | | | | | | | |
| * | Acadia Healthcare Co., Inc. | | | 8,654 | | | | 543 | |
| * | Certara, Inc. | | | 16,936 | | | | 480 | |
| * | Codexis, Inc. | | | 26,354 | | | | 597 | |
| | Encompass Health Corporation | | | 6,614 | | | | 516 | |
| * | Globus Medical, Inc. | | | 4,905 | | | | 380 | |
| * | Hanger, Inc. | | | 23,686 | | | | 599 | |
| * | HealthEquity, Inc. | | | 4,379 | | | | 352 | |
| * | Horizon Therapeutics plc† | | | 6,997 | | | | 655 | |
| * | LHC Group, Inc. | | | 2,732 | | | | 547 | |
| * | Ligand Pharmaceuticals, Inc. | | | 2,003 | | | | 263 | |
| * | Merit Medical Systems, Inc. | | | 14,467 | | | | 936 | |
| | Owens & Minor, Inc. | | | 29,782 | | | | 1,261 | |
| | STERIS plc† | | | 2,340 | | | | 483 | |
| | | | | | | | | 7,612 | |
| | Financials—14.6% | | | | | | | | |
| | Ares Management Corporation | | | 10,795 | | | | 686 | |
| | East West Bancorp, Inc. | | | 14,681 | | | | 1,053 | |
| * | Encore Capital Group, Inc. | | | 8,265 | | | | 392 | |
| | FirstCash, Inc. | | | 3,785 | | | | 289 | |
| | Glacier Bancorp, Inc. | | | 12,690 | | | | 699 | |
| | Hannon Armstrong Sustainable Infrastructure Capital, Inc. | | | 5,776 | | | | 324 | |
| | LPL Financial Holdings, Inc. | | | 4,129 | | | | 557 | |
| | PacWest Bancorp | | | 11,153 | | | | 459 | |
| | Virtu Financial, Inc. | | | 19,950 | | | | 551 | |
| | Voya Financial, Inc. | | | 6,545 | | | | 403 | |
| | Western Alliance Bancorp | | | 13,319 | | | | 1,237 | |
| | Wintrust Financial Corporation | | | 10,291 | | | | 778 | |
| | | | | | | | | 7,428 | |
| | Consumer Discretionary—12.1% | | | | | | | | |
| | Aramark | | | 13,003 | | | | 484 | |
| * | Boot Barn Holdings, Inc. | | | 9,546 | | | | 802 | |
| * | Bright Horizons Family Solutions, Inc. | | | 3,436 | | | | 505 | |
| * | Burlington Stores, Inc. | | | 1,816 | | | | 585 | |
| * | Callaway Golf Co. | | | 13,541 | | | | 457 | |
| * | Fox Factory Holding Corporation | | | 3,787 | | | | 590 | |
| * | Grand Canyon Education, Inc. | | | 6,263 | | | | 564 | |
| * | National Vision Holdings, Inc. | | | 8,517 | | | | 436 | |
| | | | | | | | | |
| | | | | | | | | |
| | Issuer | | Shares | | | | Value | |
| | | | | | | | | | |
| | Common Stocks—(continued) | | | | | | | | |
| | Consumer Discretionary—(continued) | | |
| * | Skyline Champion Corporation | | | 14,545 | | | $ | 775 | |
| * | Terminix Global Holdings, Inc. | | | 7,816 | | | | 373 | |
| | Wyndham Hotels & Resorts, Inc. | | | 8,513 | | | | 615 | |
| | | | | | | | | 6,186 | |
| | Information Technology—10.8% | | | | | | | | |
| * | Alarm.com Holdings, Inc. | | | 5,578 | | | | 473 | |
| | Brooks Automation, Inc. | | | 6,709 | | | | 639 | |
| | CMC Materials, Inc. | | | 2,094 | | | | 316 | |
| * | Cree, Inc. | | | 4,034 | | | | 395 | |
| | Dolby Laboratories, Inc. | | | 5,110 | | | | 502 | |
| | Entegris, Inc. | | | 3,213 | | | | 395 | |
| * | Euronet Worldwide, Inc. | | | 3,975 | | | | 538 | |
| * | j2 Global, Inc. | | | 3,332 | | | | 458 | |
| * | Nice, Ltd.—ADR | | | 2,501 | | | | 619 | |
| * | Pure Storage, Inc. | | | 22,288 | | | | 435 | |
| * | Verra Mobility Corporation | | | 47,711 | | | | 734 | |
| | | | | | | | | 5,504 | |
| | Energy—7.2% | | | | | | | | |
| | Cameco Corporation† | | | 47,979 | | | | 920 | |
| * | Denbury, Inc. | | | 22,942 | | | | 1,762 | |
| * | Green Plains, Inc. | | | 16,661 | | | | 560 | |
| | New Fortress Energy, Inc. | | | 11,591 | | | | 439 | |
| | | | | | | | | 3,681 | |
| | Real Estate—6.4% | | | | | | | | |
| | Acadia Realty Trust | | | 29,505 | | | | 648 | |
| | Americold Realty Trust | | | 11,585 | | | | 438 | |
| | CoreSite Realty Corporation | | | 4,156 | | | | 559 | |
| | Equity LifeStyle Properties, Inc. | | | 10,210 | | | | 759 | |
| | Healthcare Realty Trust, Inc. | | | 12,578 | | | | 380 | |
| * | Sunstone Hotel Investors, Inc. | | | 37,358 | | | | 464 | |
| | | | | | | | | 3,248 | |
| | Materials—5.4% | | | | | | | | |
| | Crown Holdings, Inc. | | | 7,899 | | | | 808 | |
| | Eagle Materials, Inc. | | | 4,532 | | | | 644 | |
| | FMC Corporation | | | 2,403 | | | | 260 | |
| | Martin Marietta Materials, Inc. | | | 1,421 | | | | 500 | |
| * | Orion Engineered Carbons S.A.† | | | 29,241 | | | | 555 | |
| | | | | | | | | 2,767 | |
| | Consumer Staples—5.1% | | | | | | | | |
| * | BJ’s Wholesale Club Holdings, Inc. | | | 9,844 | | | | 469 | |
| | Inter Parfums, Inc. | | | 6,641 | | | | 478 | |
| * | Performance Food Group Co. | | | 14,871 | | | | 721 | |
| | Primo Water Corporation† | | | 21,951 | | | | 367 | |
| | Spectrum Brands Holdings, Inc. | | | 6,483 | | | | 551 | |
| | | | | | | | | 2,586 | |
| | Communication Services—2.2% | | | | | | | | |
| | Cable One, Inc. | | | 193 | | | | 369 | |
| * | Live Nation Entertainment, Inc. | | | 4,060 | | | | 356 | |
| * | Zynga, Inc. | | | 36,969 | | | | 393 | |
| | | | | | | | | 1,118 | |
| | Utilities—1.1% | | | | | | | | |
| | IDACORP, Inc. | | | 5,920 | | | | 577 | |
| | Total Common Stocks—98.7%
(cost $38,668) | | | | | | | 50,321 | |
See accompanying Notes to Financial Statements.
| 16 | Semiannual Report | June 30, 2021 |
Small-Mid Cap Core Fund
Portfolio of Investments, June 30, 2021 (all dollar amounts in thousands) (unaudited)
| | | | | | | | |
| | Issuer | | Principal
Amount | | | | Value | |
| | | | | | | | | | |
| | Repurchase Agreement | | | | | | | | |
| | Fixed Income Clearing Corporation, 0.000% dated 6/30/21, due 7/1/21, repurchase price $761, collateralized by U.S. Treasury Bond, 1.875%, due 2/15/41, valued at $777 | | | $761 | | | $ | 761 | |
| | Total Repurchase Agreement—1.5%
(cost $761) | | | | | | | 761 | |
| | Total Investments—100.2%
(cost $39,429) | | | | | | | 51,082 | |
| | Liabilities, plus cash and other assets—(0.2)% | | | | | | | (123 | ) |
| | Net assets—100.0% | | | | | | $ | 50,959 | |
ADR = American Depository Receipt
* = Non-income producing security
† = U.S. listed foreign security
See accompanying Notes to Financial Statements.
| June 30, 2021 | William Blair Funds | 17 |
| | Small-Mid Cap Growth Fund |
| | |
| | The Small-Mid Cap Growth Fund seeks long-term capital appreciation. |
| | |
| | AN OVERVIEW FROM THE PORTFOLIO MANAGERS |
| | |
 Daniel Crowe, CFA 
James E. Jones, CFA | The William Blair Small-Mid Cap Growth Fund (Class N shares) (the “Fund”) posted an 8.04% increase, net of fees, for the six months ended June 30, 2021. By comparison, the Fund’s benchmark index, the Russell 2500™ Growth Index (the “Index”), increased 8.67%. The Fund performed in-line with the Index in the six month period, driven by a combination of style factors and stock-specific dynamics. From a style perspective, our bias toward companies with higher returns on invested capital and our underweight to the most expensive stocks in the Index were tailwinds as stocks with higher returns on invested capital and more attractive valuations generally outperformed during the period – a contrast to 2020. Partly offsetting this tailwind was our typical larger market cap profile relative to the Index as the smallest stocks in our universe outperformed. From a stock-specific standpoint, selection in Health Care, including our positions in Penumbra and Ligand Pharmaceuticals, was a standout contributor to relative returns. Penumbra, the market leader in mechanical stroke treatment, reported revenue results that exceeded expectations, led by strength in the peripheral vascular segment of the business and encouraging stability in the neuro segment. Additionally, our typical underweight to speculative Biotechnology, which consists of companies without approved products, was a tailwind during the period. Other top contributors included Generac Holdings (Industrials) and Axon Enterprise (Industrials), for the reasons outlined above, as well as Brooks Automation (Information Technology). Conversely, our top detractors during the period included Mercury Systems (Industrials), LiveRamp Holdings (Information Technology), NICE (Information Technology), Ritchie Bros Auctioneers (Industrials) and Pure Storage (Information Technology). Shares of Mercury Systems, a provider of sensor processing subsystems, were pressured, along with other defense-oriented companies, following the Democratic Senate victories in early January. Shares of technology company LiveRamp Holdings were pressured in the period as Google announced that it would cease the usage of cookies based on individuals’ web browsing history and shift to a cohort approach, which may inhibit LiveRamp’s and other industry participants’ ability to facilitate targeted advertising in the same way they have historically. Stock selection in Consumer Discretionary and Information Technology also detracted from relative returns. Please refer to the U.S. Growth Market Review and Outlook relating to the Fund on page 3. |
| 18 | Semiannual Report | June 30, 2021 |
Small-Mid Cap Growth Fund
Performance Highlights (Unaudited)
Average Annual Total Returns through 6/30/2021
| | | Year
to Date | | 1 Year | | 3 Year | | 5 Year | | 10 Year | | Since
Inception(a) |
| Class N | | | 8.04 | % | | | 41.71 | % | | | 17.96 | % | | | 19.76 | % | | | 14.86 | % | | | — | % |
| Class I | | | 8.17 | | | | 42.06 | | | | 18.25 | | | | 20.07 | | | | 15.14 | | | | — | |
| Class R6 | | | 8.19 | | | | 42.13 | | | | — | | | | — | | | | — | | | | 22.44 | |
| Russell 2500TM Growth Index | | | 8.67 | | | | 49.63 | | | | 20.15 | | | | 20.68 | | | | 14.83 | | | | 26.52 | |
| (a) | Since inception is for the period from May 2, 2019 (Commencement of Operations) to June 30, 2021. |
Performance cited represents past performance. Past performance does not guarantee future results and current performance may be lower or higher than the data quoted. Results shown are average annual total returns, which assume reinvestment of dividends and capital gains. Investment returns and principal will fluctuate and you may have a gain or loss when you sell shares. For the most current month-end performance information, please call 1-800-742-7272, or visit our Web site at www.williamblairfunds.com. Investing in smaller and medium capitalization companies involves special risks, including higher volatility and lower liquidity. Smaller and medium capitalization stocks are also more sensitive to purchase/sale transactions and changes in the issuer’s financial condition. From time to time, the investment adviser may waive fees or reimburse expenses for the Fund. Without these waivers/reimbursements, performance would be lower. Class N shares are not subject to a sales load. Class I shares are not subject to a sales load or distribution (Rule 12b-1) fees. Class R6 shares are not subject to a sales load, distribution (Rule 12b-1) fees, or sub-transfer agent fees.
The performance highlights and graph presented above do not reflect the deduction of taxes that a shareholder would pay on fund distributions or the redemption of fund shares.
The Russell 2500TM Growth Index measures the performance of those Russell 2500 companies with above average price-to-book ratios and forecasted growth rates.
This report identifies the Fund’s investments on June 30, 2021. These holdings are subject to change. Not all stocks in the Fund performed the same, nor is there any guarantee that these stocks will perform as well in the future. Market forecasts provided in this report may not necessarily come to pass.
Sector Diversification (Unaudited)

The sector diversification shown is based on the total long-term securities.
| June 30, 2021 | William Blair Funds | 19 |
Small-Mid Cap Growth Fund
Portfolio of Investments, June 30, 2021 (all dollar amounts in thousands) (unaudited)
| | | | | | | | | |
| | | | | | | | | |
| | Issuer | | Shares | | | | Value | |
| | | | | | | | | | |
| | Common Stocks | | | | | | | | |
| | Health Care—26.7% | | | | | | | | |
| * | 10X Genomics, Inc. | | | 241,959 | | | $ | 47,380 | |
| * | ABIOMED, Inc. | | | 168,372 | | | | 52,551 | |
| * | Acadia Healthcare Co., Inc. | | | 872,854 | | | | 54,772 | |
| * | Amedisys, Inc. | | | 168,112 | | | | 41,176 | |
| | Bio-Techne Corporation | | | 148,829 | | | | 67,012 | |
| * | Blueprint Medicines Corporation | | | 196,148 | | | | 17,253 | |
| * | Certara, Inc. | | | 659,106 | | | | 18,673 | |
| * | Charles River Laboratories International, Inc. | | | 180,586 | | | | 66,802 | |
| | Encompass Health Corporation | | | 849,082 | | | | 66,254 | |
| * | Halozyme Therapeutics, Inc. | | | 998,791 | | | | 45,355 | |
| * | HealthEquity, Inc. | | | 743,210 | | | | 59,814 | |
| * | Horizon Therapeutics plc† | | | 840,340 | | | | 78,690 | |
| * | Insmed, Inc. | | | 957,210 | | | | 27,242 | |
| * | Inspire Medical Systems, Inc. | | | 144,273 | | | | 27,882 | |
| * | Insulet Corporation | | | 160,232 | | | | 43,985 | |
| * | Ligand Pharmaceuticals, Inc. | | | 227,839 | | | | 29,890 | |
| * | Masimo Corporation | | | 99,086 | | | | 24,023 | |
| * | Merit Medical Systems, Inc. | | | 539,751 | | | | 34,900 | |
| * | Penumbra, Inc. | | | 158,547 | | | | 43,451 | |
| | Teleflex, Inc. | | | 78,369 | | | | 31,488 | |
| * | Twist Bioscience Corporation | | | 129,906 | | | | 17,310 | |
| * | Veracyte, Inc. | | | 811,474 | | | | 32,443 | |
| | | | | | | | | 928,346 | |
| | Information Technology—24.9% | | | | | | | | |
| * | Alarm.com Holdings, Inc. | | | 471,258 | | | | 39,916 | |
| * | Aspen Technology, Inc. | | | 325,833 | | | | 44,815 | |
| * | Avalara, Inc. | | | 289,090 | | | | 46,775 | |
| | Brooks Automation, Inc. | | | 700,830 | | | | 66,775 | |
| * | Cree, Inc. | | | 295,330 | | | | 28,922 | |
| * | Dynatrace, Inc. | | | 1,211,355 | | | | 70,767 | |
| | Entegris, Inc. | | | 323,976 | | | | 39,839 | |
| * | Euronet Worldwide, Inc. | | | 468,087 | | | | 63,356 | |
| * | GoDaddy, Inc. | | | 492,514 | | | | 42,829 | |
| * | Guidewire Software, Inc. | | | 380,153 | | | | 42,851 | |
| * | j2 Global, Inc. | | | 262,991 | | | | 36,174 | |
| | National Instruments Corporation | | | 905,848 | | | | 38,299 | |
| * | Nice, Ltd.—ADR | | | 227,468 | | | | 56,289 | |
| * | Novanta, Inc.† | | | 200,299 | | | | 26,992 | |
| | Pegasystems, Inc. | | | 259,495 | | | | 36,119 | |
| * | Pure Storage, Inc. | | | 2,675,368 | | | | 52,250 | |
| * | Q2 Holdings, Inc. | | | 196,178 | | | | 20,124 | |
| * | Varonis Systems, Inc. | | | 723,473 | | | | 41,686 | |
| * | Workiva, Inc. | | | 264,725 | | | | 29,472 | |
| * | Zendesk, Inc. | | | 290,659 | | | | 41,954 | |
| | | | | | | | | 866,204 | |
| | Industrials—17.2% | | | | | | | | |
| * | Axon Enterprise, Inc. | | | 385,080 | | | | 68,082 | |
| * | Builders FirstSource, Inc. | | | 1,546,217 | | | | 65,962 | |
| | BWX Technologies, Inc. | | | 1,297,270 | | | | 75,397 | |
| * | Generac Holdings, Inc. | | | 174,965 | | | | 72,637 | |
| | HEICO Corporation | | | 213,002 | | | | 26,451 | |
| | Lincoln Electric Holdings, Inc. | | | 207,617 | | | | 27,345 | |
| * | Mercury Systems, Inc. | | | 673,106 | | | | 44,613 | |
| | Ritchie Bros Auctioneers, Inc.† | | | 797,140 | | | | 47,254 | |
| * | Stem, Inc. | | | 876,012 | | | | 31,545 | |
| | The Brink’s Co. | | | 907,662 | | | | 69,745 | |
| * | Trex Co., Inc. | | | 659,954 | | | | 67,454 | |
| | �� | | | | | | | 596,485 | |
| | Issuer | | Shares or
Principal
Amount | | | | Value | |
| | | | | | | | | | |
| | Common Stocks—(continued) | | | | | | | | |
| | Consumer Discretionary—12.1% | | | | | | | | |
| * | Bright Horizons Family Solutions, Inc. | | | 404,873 | | | $ | 59,561 | |
| * | Burlington Stores, Inc. | | | 134,902 | | | | 43,437 | |
| * | Fox Factory Holding Corporation | | | 343,210 | | | | 53,424 | |
| * | Grand Canyon Education, Inc. | | | 410,485 | | | | 36,931 | |
| * | Helen of Troy, Ltd.† | | | 175,412 | | | | 40,015 | |
| * | Leslie’s, Inc. | | | 1,342,088 | | | | 36,894 | |
| * | National Vision Holdings, Inc. | | | 696,237 | | | | 35,599 | |
| * | Revolve Group, Inc. | | | 448,711 | | | | 30,916 | |
| * | Terminix Global Holdings, Inc. | | | 766,029 | | | | 36,547 | |
| | Wyndham Hotels & Resorts, Inc. | | | 642,445 | | | | 46,443 | |
| | | | | | | | | 419,767 | |
| | Materials—4.2% | | | | | | | | |
| | Crown Holdings, Inc. | | | 718,277 | | | | 73,415 | |
| | Martin Marietta Materials, Inc. | | | 210,736 | | | | 74,139 | |
| | | | | | | | | 147,554 | |
| | Financials—4.1% | | | | | | | | |
| | Ares Management Corporation | | | 631,948 | | | | 40,186 | |
| | FirstCash, Inc. | | | 321,643 | | | | 24,586 | |
| | Virtu Financial, Inc. | | | 1,454,330 | | | | 40,183 | |
| | Western Alliance Bancorp | | | 401,676 | | | | 37,296 | |
| | | | | | | | | 142,251 | |
| | Communication Services—3.7% | | | | | | | | |
| | Cable One, Inc. | | | 22,181 | | | | 42,428 | |
| * | Live Nation Entertainment, Inc. | | | 466,644 | | | | 40,874 | |
| * | Zynga, Inc. | | | 4,157,975 | | | | 44,199 | |
| | | | | | | | | 127,501 | |
| | Energy—3.3% | | | | | | | | |
| | Cameco Corporation† | | | 2,557,201 | | | | 49,047 | |
| * | Denbury, Inc. | | | 569,874 | | | | 43,755 | |
| | New Fortress Energy, Inc. | | | 622,854 | | | | 23,594 | |
| | | | | | | | | 116,396 | |
| | Consumer Staples—1.5% | | | | | | | | |
| * | BJ’s Wholesale Club Holdings, Inc. | | | 540,598 | | | | 25,721 | |
| * | Celsius Holdings, Inc. | | | 360,057 | | | | 27,397 | |
| | | | | | | | | 53,118 | |
| | Real Estate—1.0% | | | | | | | | |
| | FirstService Corporation† | | | 199,605 | | | | 34,184 | |
| | Total Common Stocks—98.7%
(cost $2,351,508) | | | | | | | 3,431,806 | |
| | | | | | | | | | |
| | Repurchase Agreement | | | | | | | | |
| | Fixed Income Clearing Corporation, 0.000% dated 6/30/21, due 7/1/21, repurchase price $11,036, collateralized by U.S. Treasury Bond, 1.875%, due 2/15/41, valued at $11,257 | | | $11,036 | | | | 11,036 | |
| | Total Repurchase Agreement—0.3%
(cost $11,036) | | | | | | 11,036 | |
| | Total Investments—99.0%
(cost $2,362,544) | | | | | | | 3,442,842 | |
| | Cash and other assets, less liabilities—1.0% | | | | | | | 35,417 | |
| | Net assets—100.0% | | | | | | $ | 3,478,259 | |
ADR = American Depository Receipt
* = Non-income producing security
† = U.S. listed foreign security
See accompanying Notes to Financial Statements.
| 20 | Semiannual Report | June 30, 2021 |
| | Small Cap Growth Fund |
| | |
| | The Small Cap Growth Fund seeks long-term capital appreciation. |
| | |
| | AN OVERVIEW FROM THE PORTFOLIO MANAGERS |
| | |
 Ward D. Sexton, CFA 
Mark C. Thompson, CFA | The William Blair Small Cap Growth Fund (Class N shares) posted an 12.84% increase, net of fees, for the six months ended June 30, 2021. By comparison, the Fund’s benchmark index, the Russell 2000® Growth Index (the “Index”), increased 8.98%. Outperformance for the six month period was due to a combination of style dynamics and stock-specific factors. From a style perspective, our smaller market cap bias and our typical underweight to the most expensive stocks in the Index were tailwinds as the least expensive and smaller market capitalization companies in the Index outperformed. From a stock-specific standpoint, selection was positive across several sectors, most notably Health Care, including our position in Ligand Pharmaceuticals and our typical underweight to Biotechnology. Other top contributors were Consumer Discretionary holdings Revolve Group and Boot Barn Holdings. Online fashion retailer Revolve Group and western and work wear retailer Boot Barn executed well through the COVID-19 pandemic and, despite appealing to different demographics, were both beneficiaries of strong demand for refreshed wardrobes as the U.S. economy began to re-open. Other standout performers included Denbury (Energy) and Stem Inc. (Industrials). Stock selection in Information Technology, including our position in LiveRamp Holdings, detracted from relative performance. LiveRamp lagged as Google announced that it would cease the usage of cookies based on individuals’ web browsing history and shift to a cohort approach, which may inhibit LiveRamp’s and other industry participants’ ability to facilitate targeted advertising in the same way they have historically. Rush Street Interactive, the largest U.S. online casino operator, was our top individual detractor.While the company had better than expected revenue, an acceleration of marketing spend resulted in earnings that were below expectations. Other notable laggards included Amicus Therapeutics (Health Care), Mercury Systems (Industrials) and QuinStreet (Communication Services). Please refer to the U.S. Growth Market Review and Outlook relating to the Fund on page 3. |
| June 30, 2021 | William Blair Funds | 21 |
Small Cap Growth Fund
Performance Highlights (Unaudited)
Average Annual Total Returns through 6/30/2021
| | | Year
to Date | | 1 Year | | 3 Year | | 5 Year | | 10 Year | | Since
Inception(a) |
| Class N | | | 12.84 | % | | | 60.72 | % | | | 17.40 | % | | | 22.04 | % | | | 15.59 | % | | | — | % |
| Class I | | | 13.01 | | | | 61.11 | | | | 17.69 | | | | 22.34 | | | | 15.88 | | | | — | |
| Class R6 | | | 13.05 | | | | 61.26 | | | | — | | | | — | | | | — | | | | 24.67 | |
| Russell 2000® Growth Index | | | 8.98 | | | | 51.36 | | | | 15.94 | | | | 18.76 | | | | 13.52 | | | | 23.48 | |
| (a) | Since inception is for the period from May 2, 2019 (Commencement of Operations) to June 30, 2021. |
Performance cited represents past performance. Past performance does not guarantee future results and current performance may be lower or higher than the data quoted. Results shown are average annual total returns, which assume reinvestment of dividends and capital gains. Investment returns and principal will fluctuate and you may have a gain or loss when you sell shares. For the most current month-end performance information, please call 1-800-742-7272, or visit our Web site at www.williamblairfunds.com. Investing in smaller companies involves special risks, including higher volatility and lower liquidity. Smaller capitalization stocks are also more sensitive to purchase/sale transactions and changes in the issuer’s financial condition. From time to time, the investment adviser may waive fees or reimburse expenses for the Fund. Without these waivers/reimbursements, performance would be lower. Class N shares are not subject to a sales load. Class I shares are not subject to a sales load or distribution (Rule 12b-1) fees. Class R6 shares are not subject to a sales load, distribution (Rule 12b-1) fees, or sub-transfer agent fees.
The performance highlights and graph presented above do not reflect the deduction of taxes that a shareholder would pay on fund distributions or the redemption of fund shares.
The Russell 2000® Growth Index is an unmanaged composite of the smallest 2000 stocks of the Russell 3000® Growth Index.
This report identifies the Fund’s investments on June 30, 2021. These holdings are subject to change. Not all stocks in the Fund performed the same, nor is there any guarantee that these stocks will perform as well in the future. Market forecasts provided in this report may not necessarily come to pass.
Sector Diversification (Unaudited)

The sector diversification shown is based on the total long-term securities.
| 22 | Semiannual Report | June 30, 2021 |
Small Cap Growth Fund
Portfolio of Investments, June 30, 2021 (all dollar amounts in thousands) (unaudited)
| | | | | | | | | |
| | | | | | | | | |
| | Issuer | | Shares | | | | Value | |
| | | | | | | | | | |
| | Common Stocks | | | | | | | | |
| | Health Care—25.4% | | | | | | | | |
| * | Acadia Healthcare Co., Inc. | | | 184,489 | | | $ | 11,577 | |
| * | Aerie Pharmaceuticals, Inc. | | | 563,111 | | | | 9,015 | |
| * | Amicus Therapeutics, Inc. | | | 578,590 | | | | 5,578 | |
| * | AxoGen, Inc. | | | 417,040 | | | | 9,012 | |
| * | Blueprint Medicines Corporation | | | 52,970 | | | | 4,659 | |
| * | Butterfly Network, Inc. | | | 297,189 | | | | 4,303 | |
| * | CareDx, Inc. | | | 98,597 | | | | 9,024 | |
| * | Certara, Inc. | | | 320,584 | | | | 9,082 | |
| * | Codexis, Inc. | | | 409,638 | | | | 9,282 | |
| * | CryoLife, Inc. | | | 271,152 | | | | 7,701 | |
| * | Halozyme Therapeutics, Inc. | | | 155,700 | | | | 7,070 | |
| * | Hanger, Inc. | | | 432,170 | | | | 10,925 | |
| * | Health Catalyst, Inc. | | | 232,578 | | | | 12,910 | |
| * | HealthEquity, Inc. | | | 99,095 | | | | 7,975 | |
| * | Innovage Holding Corporation | | | 330,850 | | | | 7,050 | |
| * | Insmed, Inc. | | | 251,690 | | | | 7,163 | |
| * | Inspire Medical Systems, Inc. | | | 38,650 | | | | 7,470 | |
| * | LHC Group, Inc. | | | 47,913 | | | | 9,595 | |
| * | Ligand Pharmaceuticals, Inc. | | | 54,728 | | | | 7,180 | |
| * | Merit Medical Systems, Inc. | | | 175,300 | | | | 11,335 | |
| * | Twist Bioscience Corporation | | | 41,056 | | | | 5,471 | |
| | US Physical Therapy, Inc. | | | 53,147 | | | | 6,158 | |
| * | Veracyte, Inc. | | | 148,090 | | | | 5,921 | |
| * | Vericel Corporation | | | 67,900 | | | | 3,565 | |
| | | | | | | | | 189,021 | |
| | Industrials—23.5% | | | | | | | | |
| | Albany International Corporation | | | 102,435 | | | | 9,143 | |
| * | Builders FirstSource, Inc. | | | 275,770 | | | | 11,764 | |
| | BWX Technologies, Inc. | | | 234,129 | | | | 13,608 | |
| * | Casella Waste Systems, Inc. | | | 187,600 | | | | 11,900 | |
| | Douglas Dynamics, Inc. | | | 170,063 | | | | 6,920 | |
| * | Ducommun, Inc. | | | 264,009 | | | | 14,404 | |
| * | Energy Recovery, Inc. | | | 369,016 | | | | 8,406 | |
| * | Forrester Research, Inc. | | | 146,739 | | | | 6,721 | |
| * | IAA, Inc. | | | 100,970 | | | | 5,507 | |
| * | Kornit Digital, Ltd.† | | | 60,870 | | | | 7,568 | |
| | Lincoln Electric Holdings, Inc. | | | 50,920 | | | | 6,707 | |
| | Luxfer Holdings plc† | | | 482,306 | | | | 10,731 | |
| * | Mercury Systems, Inc. | | | 94,996 | | | | 6,296 | |
| * | Montrose Environmental Group, Inc. | | | 221,568 | | | | 11,889 | |
| * | PAE, Inc. | | | 997,208 | | | | 8,875 | |
| | Ritchie Bros Auctioneers, Inc.† | | | 143,695 | | | | 8,518 | |
| * | Stem, Inc. | | | 262,194 | | | | 9,442 | |
| | The Brink’s Co. | | | 208,516 | | | | 16,023 | |
| | | | | | | | | 174,422 | |
| | Information Technology—22.8% | | | | | | | | |
| * | Alarm.com Holdings, Inc. | | | 96,870 | | | | 8,205 | |
| | American Software, Inc. | | | 271,000 | | | | 5,951 | |
| | Brooks Automation, Inc. | | | 139,515 | | | | 13,293 | |
| * | BTRS Holdings, Inc. | | | 343,880 | | | | 4,340 | |
| | CMC Materials, Inc. | | | 50,150 | | | | 7,560 | |
| | Computer Services, Inc. | | | 110,659 | | | | 6,225 | |
| * | Euronet Worldwide, Inc. | | | 59,700 | | | | 8,080 | |
| * | Grid Dynamics Holdings, Inc. | | | 820,795 | | | | 12,337 | |
| | | | | | | | | |
| | | | | | | | | |
| | Issuer | | Shares | | | | Value | |
| | | | | | | | | | |
| | Common Stocks—(continued) | | | | | | | | |
| | Information Technology—(continued) | | | | | | | | |
| * | j2 Global, Inc. | | | 85,483 | | | $ | 11,758 | |
| | Littelfuse, Inc. | | | 14,063 | | | | 3,583 | |
| * | LivePerson, Inc. | | | 141,397 | | | | 8,942 | |
| * | LiveRamp Holdings, Inc. | | | 154,520 | | | | 7,239 | |
| * | Novanta, Inc.† | | | 38,630 | | | | 5,206 | |
| * | PAR Technology Corporation | | | 30,350 | | | | 2,123 | |
| * | PDF Solutions, Inc. | | | 217,182 | | | | 3,948 | |
| * | PROS Holdings, Inc. | | | 189,070 | | | | 8,616 | |
| * | Pure Storage, Inc. | | | 474,656 | | | | 9,270 | |
| * | SiTime Corporation | | | 40,625 | | | | 5,143 | |
| * | Upland Software, Inc. | | | 174,130 | | | | 7,169 | |
| * | Varonis Systems, Inc. | | | 138,630 | | | | 7,988 | |
| * | Verra Mobility Corporation | | | 713,949 | | | | 10,973 | |
| * | Vertex, Inc. | | | 201,519 | | | | 4,421 | |
| * | WNS Holdings, Ltd.—ADR | | | 92,092 | | | | 7,355 | |
| | | | | | | | | 169,725 | |
| | Consumer Discretionary—9.2% | | | | | | | | |
| * | Boot Barn Holdings, Inc. | | | 147,094 | | | | 12,363 | |
| * | Dine Brands Global, Inc. | | | 56,780 | | | | 5,068 | |
| * | National Vision Holdings, Inc. | | | 159,788 | | | | 8,170 | |
| * | Porch Group, Inc. | | | 357,518 | | | | 6,914 | |
| * | Revolve Group, Inc. | | | 184,647 | | | | 12,722 | |
| * | Rush Street Interactive, Inc. | | | 464,450 | | | | 5,694 | |
| * | Skyline Champion Corporation | | | 219,790 | | | | 11,715 | |
| | Winmark Corporation | | | 28,100 | | | | 5,398 | |
| | | | | | | | | 68,044 | |
| | Financials—4.3% | | | | | | | | |
| * | Encore Capital Group, Inc. | | | 148,353 | | | | 7,030 | |
| | FirstCash, Inc. | | | 125,832 | | | | 9,619 | |
| | Home BancShares, Inc. | | | 329,828 | | | | 8,140 | |
| * | Open Lending Corporation | | | 172,167 | | | | 7,419 | |
| | | | | | | | | 32,208 | |
| | Energy—4.3% | | | | | | | | |
| | Cameco Corporation† | | | 685,120 | | | | 13,141 | |
| * | Denbury, Inc. | | | 147,559 | | | | 11,329 | |
| * | Green Plains, Inc. | | | 224,680 | | | | 7,554 | |
| | | | | | | | | 32,024 | |
| | Consumer Staples—2.8% | | | | | | | | |
| * | BJ’s Wholesale Club Holdings, Inc. | | | 149,550 | | | | 7,115 | |
| * | The Beauty Health Co. | | | 510,400 | | | | 8,575 | |
| * | Vital Farms, Inc. | | | 234,460 | | | | 4,680 | |
| | | | | | | | | 20,370 | |
| | Communication Services—2.2% | | | | | | | | |
| * | Gogo, Inc. | | | 636,260 | | | | 7,240 | |
| * | QuinStreet, Inc. | | | 505,165 | | | | 9,386 | |
| | | | | | | | | 16,626 | |
| | Real Estate—2.2% | | | | | | | | |
| | Colliers International Group, Inc.† | | | 68,568 | | | | 7,678 | |
| | FirstService Corporation† | | | 51,357 | | | | 8,796 | |
| | | | | | | | | 16,474 | |
See accompanying Notes to Financial Statements.
| June 30, 2021 | William Blair Funds | 23 |
Small Cap Growth Fund
Portfolio of Investments, June 30, 2021 (all dollar amounts in thousands) (unaudited)
| | Issuer | | Shares or
Principal
Amount | | | | Value | |
| | | | | | | | | | |
| | Common Stocks—(continued) | | | | | | | | |
| | Materials—1.3% | | | | | | | | |
| * | Orion Engineered Carbons S.A.† | | | 520,997 | | | $ | 9,894 | |
| | Total Common Stocks—98.0%
(cost $503,164) | | | | | | | 728,808 | |
| | | | | | | | | | |
| | Exchange-Traded Funds | | | | | | | | |
| | Exchange-Traded Fund—1.0% | | | | | | | | |
| | iShares Russell 2000 Growth ETF | | | 24,370 | | | | 7,596 | |
| | Total Exchange-Traded Fund—1.0%
(cost $7,303) | | | | | | | 7,596 | |
| | | | | | | | | | |
| | Repurchase Agreement | | | | | | | | |
| | Fixed Income Clearing Corporation, 0.000% dated 6/30/21, due 7/1/21, repurchase price $3,521, collateralized by U.S. Treasury Bond, 1.875%, due 2/15/41, valued at $3,591 | | $ | 3,521 | | | | 3,521 | |
| | Total Repurchase Agreement—0.5%
(cost $3,521) | | | | | | | 3,521 | |
| | Total Investments—99.5%
(cost $513,988) | | | | | | | 739,925 | |
| | Cash and other assets, less liabilities—0.5% | | | | | | | 3,874 | |
| | Net assets—100.0% | | | | | | $ | 743,799 | |
ADR = American Depository Receipt
* = Non-income producing security
† = U.S. listed foreign security
See accompanying Notes to Financial Statements.
| 24 | Semiannual Report | June 30, 2021 |
| | Small Cap Value Fund |
| | |
| | The Small Cap Value Fund seeks long-term capital appreciation. |
| | |
| | AN OVERVIEW FROM THE PORTFOLIO MANAGERS |
| | |

Mark T. Leslie, CFA 
Stephen Livingston, CFA 
David S. Mitchell, CFA | The William Blair Small Cap Value Fund (Class N shares) (the “Fund”) posted a 17.64% increase, net of fees, for six months ended June 30, 2021. By comparison, the Fund’s benchmark index, the Russell 2000® Value Index (the “Index”), increased 26.69%. The Fund’s relative performance was impacted by the combination of stock selection and style headwinds during the period given its larger market capitalization and higher quality biases. During the first half of 2021 there was significant performance dispersion across the size and quality spectrum as smaller capitalizations and lower quality stocks dramatically outperformed. At the sector level, Consumer Discretionary was the largest detractor during the period due to lack of exposure to Specialty Retail broadly, but also not owning GameStop, which resulted in 91 basis points (bps) of underperformance in the period. Within Communication Services, lack of exposure to Entertainment, particularly AMC Entertainment, resulted in 137 basis points of underperformance in the period. The relative return in Industrials was driven by stock selection in Commercial Services & Supplies, Aerospace & Defense, Building Products, and Machinery. The relative outperformance in Financials was driven by strong stock selection in Regional Banks. Looking specifically at stock selection, the strategy’s largest detractors during the period were AMC Entertainment (Communication Services), GameStop (Consumer Discretionary), and LiveRamp Holdings (Information Technology). Offsetting these detractors were our investments in PDC Energy (Energy), Western Alliance Bank (Financials), and Boston Private Financial (Financials). Please refer to the U.S. Value Market Review and Outlook relating to the Fund on page 4. |
The portfolio managers have changed due to the Fund’s reorganization effective July 16, 2021. Refer to Note 8—Subsequent Events for further details of the reorganization.
| June 30, 2021 | William Blair Funds | 25 |
Small Cap Value Fund
Performance Highlights (Unaudited)
| Average Annual Total Returns through 6/30/2021 |
| | | Year
to Date | | 1 Year | | 3 Year | | 5 Year | | 10 Year | | Since
Inception(a) |
| Class N | | | 17.64 | % | | | 50.57 | % | | | 3.45 | % | | | 7.30 | % | | | 7.85 | % | | | — | % |
| Class I | | | 17.83 | | | | 51.06 | | | | 3.72 | | | | 7.56 | | | | 8.12 | | | | — | |
| Class R6 | | | 17.85 | | | | 50.97 | | | | — | | | | — | | | | — | | | | 6.37 | |
| Russell 2000® Value Index | | | 26.69 | | | | 73.28 | | | | 10.27 | | | | 13.62 | | | | 10.85 | | | | 17.13 | |
| (a) | Since inception is for the period from May 2, 2019 (Commencement of Operations) to June 30, 2021. |
Performance cited represents past performance. Past performance does not guarantee future results and current performance may be lower or higher than the data quoted. Results shown are average annual total returns, which assume reinvestment of dividends and capital gains. Investment returns and principal will fluctuate and you may have a gain or loss when you sell shares. For the most current month-end performance information, please call 1-800-742-7272, or visit our Web site at www.williamblairfunds.com. Investing in smaller companies involves special risks, including higher volatility and lower liquidity. Smaller capitalization stocks are also more sensitive to purchase/sale transactions and changes in the issuer’s financial condition. From time to time, the investment adviser may waive fees or reimburse expenses for the Fund. Without these waivers/reimbursements, performance would be lower. Class N shares are not subject to a sales load. Class I shares are not subject to a sales load or distribution (Rule 12b-1) fees. Class R6 shares are not subject to a sales load, distribution (Rule 12b-1) fees, or sub-transfer agent fees.
The performance highlights and graph presented above do not reflect the deduction of taxes that a shareholder would pay on fund distributions or the redemption of fund shares.
The Russell 2000® Value Index consists of small-capitalization companies with below average price-to-book ratios and forecasted growth rates.
This report identifies the Fund’s investments on June 30, 2021. These holdings are subject to change. Not all stocks in the Fund performed the same, nor is there any guarantee that these stocks will perform as well in the future. Market forecasts provided in this report may not necessarily come to pass.
| Sector Diversification (Unaudited) |

The sector diversification shown is based on the total long-term securities.
| 26 | Semiannual Report | June 30, 2021 |
Small Cap Value Fund
Portfolio of Investments, June 30, 2021 (all dollar amounts in thousands) (unaudited)
| | | | | | | | |
| | | | | | | | |
| | Issuer | | Shares | | | Value | |
| | | | | | | | | | |
| | Common Stocks | | | | | | | | |
| | Financials—27.9% | | | | | | | | |
| | Banc of California, Inc. | | | 18,678 | | | $ | 328 | |
| | Banner Corporation | | | 8,849 | | | | 480 | |
| | Boston Private Financial Holdings, Inc. | | | 27,047 | | | | 399 | |
| | Cadence BanCorp | | | 26,841 | | | | 560 | |
| | CNO Financial Group, Inc. | | | 26,324 | | | | 622 | |
| | First American Financial Corporation | | | 7,356 | | | | 459 | |
| | FNB Corporation | | | 46,979 | | | | 579 | |
| | Glacier Bancorp, Inc. | | | 12,239 | | | | 674 | |
| | Hancock Whitney Corporation | | | 20,799 | | | | 924 | |
| | Home BancShares, Inc. | | | 31,877 | | | | 787 | |
| | Horace Mann Educators Corporation | | | 11,426 | | | | 427 | |
| | National Bank Holdings Corporation | | | 13,470 | | | | 508 | |
| | OceanFirst Financial Corporation | | | 19,449 | | | | 405 | |
| | PacWest Bancorp | | | 17,079 | | | | 703 | |
| | Radian Group, Inc. | | | 32,724 | | | | 728 | |
| | Renasant Corporation | | | 13,147 | | | | 526 | |
| | Sandy Spring Bancorp, Inc. | | | 13,642 | | | | 602 | |
| | Seacoast Banking Corporation of Florida | | | 19,522 | | | | 667 | |
| | Selective Insurance Group, Inc. | | | 10,705 | | | | 869 | |
| | The Hanover Insurance Group, Inc. | | | 4,695 | | | | 637 | |
| | Umpqua Holdings Corporation | | | 32,891 | | | | 607 | |
| | Western Alliance Bancorp | | | 10,883 | | | | 1,010 | |
| | | | | | | | | 13,501 | |
| | Industrials—16.4% | | | | | | | | |
| | Alamo Group, Inc. | | | 1,405 | | | | 214 | |
| | Brady Corporation | | | 17,644 | | | | 989 | |
| * | Chart Industries, Inc. | | | 5,010 | | | | 733 | |
| | Curtiss-Wright Corporation | | | 6,323 | | | | 751 | |
| | ESCO Technologies, Inc. | | | 4,035 | | | | 379 | |
| | Federal Signal Corporation | | | 8,696 | | | | 350 | |
| * | FTI Consulting, Inc. | | | 4,610 | | | | 630 | |
| * | Gibraltar Industries, Inc. | | | 9,900 | | | | 755 | |
| | Rexnord Corporation | | | 10,530 | | | | 527 | |
| * | Saia, Inc. | | | 2,294 | | | | 481 | |
| | Simpson Manufacturing Co., Inc. | | | 4,817 | | | | 532 | |
| | UniFirst Corporation | | | 2,945 | | | | 691 | |
| | Watts Water Technologies, Inc. | | | 6,094 | | | | 889 | |
| | | | | | | | | 7,921 | |
| | Consumer Discretionary—11.2% | | | | | | | | |
| | Carter’s, Inc. | | | 5,507 | | | | 568 | |
| * | Cavco Industries, Inc. | | | 1,502 | | | | 334 | |
| | Churchill Downs, Inc. | | | 2,500 | | | | 496 | |
| * | Deckers Outdoor Corporation | | | 2,471 | | | | 949 | |
| * | Helen of Troy, Ltd.† | | | 2,992 | | | | 683 | |
| | KB Home | | | 9,565 | | | | 389 | |
| * | Monarch Casino & Resort, Inc. | | | 9,718 | | | | 643 | |
| | Murphy USA, Inc. | | | 4,390 | | | | 585 | |
| * | TopBuild Corporation | | | 3,881 | | | | 768 | |
| | | | | | | | | 5,415 | |
| | Real Estate—8.3% | | | | | | | | |
| | Acadia Realty Trust | | | 14,070 | | | | 309 | |
| | Agree Realty Corporation | | | 7,693 | | | | 542 | |
| | American Assets Trust, Inc. | | | 14,769 | | | | 551 | |
| | CoreSite Realty Corporation | | | 2,356 | | | | 317 | |
| | Healthcare Realty Trust, Inc. | | | 18,651 | | | | 563 | |
| | | | | | | | |
| | | | | | | | |
| | Issuer | | Shares | | | Value | |
| | | | | | | | | | |
| | Common Stocks—(continued) | | | | | | | | |
| | Real Estate—(continued) | | | | | | | | |
| | Highwoods Properties, Inc. | | | 12,070 | | | $ | 545 | |
| | Life Storage, Inc. | | | 5,987 | | | | 643 | |
| | Terreno Realty Corporation | | | 8,200 | | | | 529 | |
| | | | | | | | | 3,999 | |
| | Health Care—6.3% | | | | | | | | |
| * | Allscripts Healthcare Solutions, Inc. | | | 16,975 | | | | 314 | |
| * | Avanos Medical, Inc. | | | 8,110 | | | | 295 | |
| | CONMED Corporation | | | 6,502 | | | | 894 | |
| | Encompass Health Corporation | | | 9,923 | | | | 774 | |
| * | Integer Holdings Corporation | | | 8,291 | | | | 781 | |
| | | | | | | | | 3,058 | |
| | Materials—5.9% | | | | | | | | |
| | Avient Corporation | | | 12,682 | | | | 624 | |
| | Carpenter Technology Corporation | | | 12,065 | | | | 485 | |
| | Minerals Technologies, Inc. | | | 7,885 | | | | 620 | |
| | Sensient Technologies Corporation | | | 6,242 | | | | 540 | |
| | Silgan Holdings, Inc. | | | 13,857 | | | | 575 | |
| | | | | | | | | 2,844 | |
| | Information Technology—5.8% | | | | | | | | |
| | Belden, Inc. | | | 9,825 | | | | 497 | |
| * | j2 Global, Inc. | | | 4,421 | | | | 608 | |
| * | LiveRamp Holdings, Inc. | | | 7,197 | | | | 337 | |
| | MAXIMUS, Inc. | | | 5,974 | | | | 525 | |
| * | Semtech Corporation | | | 2,800 | | | | 193 | |
| * | Viavi Solutions, Inc. | | | 35,559 | | | | 628 | |
| | | | | | | | | 2,788 | |
| | Energy—5.6% | | | | | | | | |
| | Archrock, Inc. | | | 43,973 | | | | 392 | |
| | Brigham Minerals, Inc. | | | 24,589 | | | | 523 | |
| | Cactus, Inc. | | | 7,287 | | | | 268 | |
| * | CNX Resources Corporation | | | 36,682 | | | | 501 | |
| | HollyFrontier Corporation | | | 8,044 | | | | 265 | |
| | PDC Energy, Inc. | | | 16,922 | | | | 775 | |
| | | | | | | | | 2,724 | |
| | Consumer Staples—4.6% | | | | | | | | |
| * | BJ’s Wholesale Club Holdings, Inc. | | | 7,643 | | | | 364 | |
| | Casey’s General Stores, Inc. | | | 2,692 | | | | 524 | |
| * | Darling Ingredients, Inc. | | | 11,701 | | | | 790 | |
| | J&J Snack Foods Corporation | | | 3,148 | | | | 549 | |
| | | | | | | | | 2,227 | |
| | Utilities—4.1% | | | | | | | | |
| | Black Hills Corporation | | | 8,057 | | | | 529 | |
| | Chesapeake Utilities Corporation | | | 3,865 | | | | 465 | |
| | IDACORP, Inc. | | | 4,738 | | | | 462 | |
| | ONE Gas, Inc. | | | 7,469 | | | | 553 | |
| | | | | | | | | 2,009 | |
| | Communication Services—2.2% | | | | | | | | |
| | John Wiley & Sons, Inc. | | | 6,380 | | | | 384 | |
| | Nexstar Media Group, Inc. | | | 2,395 | | | | 354 | |
| * | QuinStreet, Inc. | | | 16,348 | | | | 304 | |
| | | | | | | | | 1,042 | |
| | Total Common Stocks—98.3%
(cost $30,861) | | | | | | | 47,528 | |
See accompanying Notes to Financial Statements.
| June 30, 2021 | William Blair Funds | 27 |
Small Cap Value Fund
Portfolio of Investments, June 30, 2021 (all dollar amounts in thousands) (unaudited)
| | | | | | | | |
| | | | Principal | | | | |
| | Issuer | | Amount | | | Value | |
| | | | | | | | | | |
| | Common Stocks—(continued) | | | | | | | | |
| | Repurchase Agreement | | | | | | | | |
| | Fixed Income Clearing Corporation, 0.000% dated 6/30/21, due 7/1/21, repurchase price $932, collateralized by U.S. Treasury Bond, 1.875%, due 2/15/41, valued at $950 | | | $932 | | | $ | 932 | |
| | Total Repurchase Agreement—1.9%
(cost $932) | | | | | | | 932 | |
| | Total Investments—100.2%
(cost $31,793) | | | | | | | 48,460 | |
| | Liabilities, plus cash and other assets—(0.2)% | | | | | | | (81 | ) |
| | Net assets—100.0% | | | | | | $ | 48,379 | |
* = Non-income producing security
† = U.S. listed foreign security
The composition of the portfolio of investments has changed due to the Fund’s reorganization effective July 16, 2021. Refer to Note 8—Subsequent Events for further details of the reorganization.
See accompanying Notes to Financial Statements.
| 28 | Semiannual Report | June 30, 2021 |
Global Markets Review and Outlook
Global equities continued to advance in the second quarter (the MSCI All Country World IMI Index (the “Index”) gained +7.18% in the second quarter and 12.68% year-to-date through June 30, 2021 in USD terms) amid further success of COVID-19 vaccination rollouts and a healthy rebound in economic activity, especially in developed markets. The sharp style rotation in the first quarter which favored value areas subsided in the second quarter with growth stocks outperforming. From a global sector perspective, Information Technology outperformed (+10.22% for the quarter and +12.39% year-to-date) while Utilities significantly underperformed (-0.09% for the quarter and +0.86% year-to-date). Energy also continued to rally (+10.08% for the quarter and +30.51% year-to-date) as rising demand drove stronger crude oil prices.
US equities advanced (+8.36% for the quarter and +15.05% year-to-date) as investors welcomed news of additional federal spending to revive the economy. In addition to the $1.9 trillion COVID-19 relief plan and $2.3 trillion infrastructure plan introduced in the first quarter, President Biden’s Administration also announced a $1.8 trillion American Families Plan emphasizing strong support for national childcare to ensure an equitable recovery from the COVID-19 pandemic, especially for female workers and mothers. Significant federal spending drove concerns over rising inflation. In May, headline inflation rose to 5.0% year on year, above expectations.
European equities kept pace with the Index (+7.26% for the quarter and +11.81% year-to-date) as several European countries gradually relaxed restrictions on travel and business activity. Economic data was also supportive, specifically the Eurozone manufacturing purchasing manager’s index (PMI) which rose to a record high level (63.4) in June.
Strength within Latin America (+15.56% for the quarter and +9.64% year-to-date) was primarily driven by Brazil (+23.60% for the quarter and +11.89% year-to-date) bolstered by stronger commodity prices and currency tailwinds. China underperformed on a relative basis (+2.35% for the quarter and +2.36% year-to-date) amid concerns over tightening liquidity and increased regulatory oversight on large capitalization technology companies.
In our view, the market is experiencing a tug of war between the impressive acceleration of economic growth due to global re-openings, and fears of a resurgence of COVID-19 case counts. We believe economic growth will win out. While concerning, the positive view is that the COVID-19 vaccines appear to be working, and the COVID-19 Delta variant is proving so far not as harmful.
As for recent economic activity, it has been more of the same, with both consumption and production activity strong – in some cases above 2019 levels. While we expect a sequential peak in gross domestic product (GDP) growth likely occurred in the second quarter, we also expect the remainder of the year should continue to be quite strong.
We believe that corporate earnings growth, which has been impressive thus far in 2021, remains underestimated. In fact, projected bottom-up corporate profit growth lags top-down GDP estimates by a wider margin than we saw coming out of the global financial crisis of 2008 (“GFC”). Thus, we are confident profit growth will continue to surprise to the upside.
As is the case in almost every economic expansion period, earnings growth has been the key market driver. We believe we are now clearly in expansion mode, with the corporate profit picture and market leadership following the script.
During the second quarter, we saw earnings revisions and momentum lead market performance, while valuation flipped from dominating in the first quarter (typical of recovery periods) to not much of a factor. Quality and Growth re-asserted themselves positively. All of these characteristics are very typical of performance during an economic expansion and we believe they are likely to continue.
Inflation concerns have been a natural topic of debate all year. We continue to foresee reflation back to long-term, i.e., manageable, levels. In this unique cycle, we are experiencing price increases driven by the re-opening of supply not keeping up with demand fast enough. While in some cases we are already seeing a few industrial commodity prices reverting, we expect that it will take another three-to-six months for the supply catch up to occur across most industries.
The global market, as measured by the MSCI All Country World IMI, is up close to 40% over the last twelve months. While market valuations receive a lot of attention, perhaps unnoticed is that this market appreciation has been driven entirely by earnings growth. The market valuation has actually somewhat come down during this period.
| June 30, 2021 | William Blair Funds | 29 |
Global Markets Review and Outlook (continued)
The valuation multiple of more economically sensitive sectors of the market (e.g., cyclicals and financials) have increased along with a resurgence of their growth. In contrast, companies with stronger structural long-term growth have lagged on a relative basis, and in some cases have seen their stock multiples compress. We view this is a classic period of structural winners “growing into” their multiples.
Consistent with our growth outlook we believe most of this experience is likely behind us but may occur off and on during the balance of the year while the market digests the economic and profit picture. Ultimately as economic growth reverts to the long-term mean and the market begins to discount peak cyclical earnings, the structural growers will again have their day.
Corporate profit margins and cash flows have been impressive, and we believe we are entering an era where more of that cash flow is likely to be directed to capital investment and research and development.
We see two reasons for rapidly ramping capital spending by corporates: 1) digitalization of businesses is now a survival imperative; and 2) shortening supply chains has become necessary to improve operational resilience.
We are witnessing it already: After the GFC, it took US private sector investment (excluding housing) nearly four years to recover to pre-crisis levels. By contrast, capital expenditures in the first quarter of 2021 already surpassed the fourth quarter of 2019 peak. Intellectual property and software investment recovered by the fourth quarter of 2020, compared to six quarters post-GFC.
We believe the COVID-19 pandemic has elevated operational efficiencies of digital business models into a survival imperative for virtually all companies. Digital businesses generally were able to operate relatively unscathed during the COVID-19 pandemic lockdowns, while more traditional, high physical contact businesses were more likely to be forced to shut down. Within industries, those companies who had proactively employed more data and digitally-enabled business practices pressed their competitive advantage. We are seeing companies of all sizes accelerate their investment into cloud-based systems, remote work, digitally driven customer service solutions, and the requisite software applications.
Companies have spent decades rationalizing their supply chains with the goal of maximum operational efficiency. Such extreme efficiency comes with high potential fragility. And we believe this fragility was fully exposed by COVID-19-related lockdowns and associated export restrictions. Companies are looking to shore up their supply chains, in some instances by reducing or duplicating some parts of the chain. Some of this was starting to happen in response to chilling economic relations between the U.S. and China prior to the COVID-19 pandemic. COVID-19 has only added more reasons to accelerate the buildout.
In our view, shifts in the geopolitical environment in which corporates operate also support investment rather than cash preservation. Since the early 1980s everything from taxation to antitrust to regulatory and labor policies was geared to improving corporate profitability. Today, there is growing recognition that these policies may have gone too far. The operating environment is changing on the margin: pressure for stronger wage growth, especially at the bottom of the income distribution is rising.
The Group of Seven (G7) agreeing on a minimum corporate tax rate suggests that the race to the bottom is over. Antitrust authorities in China, Europe and the U.S. are openly exploring ways to bring competition standards to industries and businesses that have been able to behave as monopolies or quasi monopolies. These changes incentivize corporate investment, which in turn will likely expand supply and enable stronger economic growth without higher inflation. We will have more to say on this topic in the coming months and quarters.
| 30 | Semiannual Report | June 30, 2021 |
| | Global Leaders Fund |
| | |
| | The Global Leaders Fund seeks long-term capital appreciation. |
| | |
| | AN OVERVIEW FROM THE PORTFOLIO MANAGERS |
| | |

Andrew G. Flynn, CFA 
Kenneth J. McAtamney 
Hugo Scott-Gall | The William Blair Global Leaders Fund (Class N shares) (the “Fund”) posted a 10.80% increase, net of fees, for six months ended June 30, 2021. By comparison, the Fund’s benchmark index, the MSCI All Country World IMI (net) (the “Index”), increased 12.68%. Six-month underperformance versus the Index was primarily driven by weaker stock selection within Industrials, as Nihon M&A Center Inc detracted. Nihon M&A is a high-quality Japanese growth company that provides advisory services to small and medium-sized businesses facing succession-oriented challenges, which is common given Japan’s aging demographics. It is led by an entrepreneurial management team that has built an attractive network of national relationships aimed at identifying buyers and sellers and sourcing transactions. Management recently noted that with the second stage of lockdowns related to COVID-19 in Japan, deal times could extend. While this has weighed on near-term expectations, our long-term outlook remains unchanged as the company continues to benefit from structural tailwinds. We believe it is the dominant player in the market due to its extensive network and continued strong execution should continue to result in steady deal flow, attractive margins, and expanding returns. Partially offsetting these effects was positive stock selection within the Consumer Discretionary and Health Care sectors. Within Consumer Discretionary, Aristocrat Leisure drove outperformance. Aristocrat Leisure is a leading content and equipment supplier in the global slot machine market, with an expanding share in the higher-margin revenue-sharing segment thanks to strong performance of innovative products. Digital has been a new growth driver for Aristocrat, with in-house games and M&A steadily expanding the addressable market beyond land-based casinos for sustainable longer-term growth. The company is recovering faster than market expectations where revenues have normalized close to pre-COVID levels. Within Health Care sector, Charles River Laboratories contributed to relative results. Charles River is a contract research organization (CRO) that has evolved to be the global leader in the early stage portion of the research market with a dominant market share lead, working on 85% of all FDA-approved drugs in both 2018 and 2019. In our view, the company has several key competitive advantages that support its market-leading position including a global network, strong brand reputation, and broad product/service portfolio. Please refer to the Global Markets Review and Outlook relating to the Fund beginning on page 29. |
| June 30, 2021 | William Blair Funds | 31 |
Global Leaders Fund
Performance Highlights (Unaudited)
| Average Annual Total Returns through 6/30/2021 |
| | | Year
to Date | | 1 Year | | 3 Year | | 5 Year | | 10 Year | | Since
Inception(a) |
| Class N | | | 10.80 | % | | | 42.55 | % | | | 18.27 | % | | | 18.59 | % | | | 12.19 | % | | | — | % |
| Class I | | | 10.93 | | | | 42.92 | | | | 18.57 | | | | 18.91 | | | | 12.50 | | | | — | |
| Class R6 | | | 10.99 | | | | 42.96 | | | | 18.63 | | | | 18.98 | | | | — | | | | 13.94 | |
| MSCI ACW IMI (net) | | | 12.68 | | | | 40.94 | | | | 14.24 | | | | 14.55 | | | | 9.90 | | | | 11.31 | |
| (a) | Since inception is for the period from December 19, 2012 (Commencement of Operations) to June 30, 2021. |
Performance cited represents past performance. Past performance does not guarantee future results and current performance may be lower or higher than the data quoted. Results shown are average annual total returns, which assume reinvestment of dividends and capital gains. Investment returns and principal will fluctuate and you may have a gain or loss when you sell shares. For the most current month-end performance information, please call 1-800-742-7272, or visit our Web site at www.williamblairfunds.com. Investing in smaller and medium capitalization companies involves special risks, including higher volatility and lower liquidity. Smaller and medium capitalization stocks are also more sensitive to purchase/sale transactions and changes in the issuer’s financial condition. International investing involves special risk considerations, including currency fluctuations, lower liquidity, economic and political risk. From time to time, the investment adviser may waive fees or reimburse expenses for the Fund. Without these waivers/reimbursements, performance would be lower. Class N shares are not subject to a sales load. Class I shares are not subject to a sales load or distribution (Rule 12b-1) fees. Class R6 shares are not subject to a sales load, distribution (Rule 12b-1) fees, or sub-transfer agent fees.
The performance highlights and graph presented above do not reflect the deduction of taxes that a shareholder would pay on fund distributions or the redemption of fund shares.
The Morgan Stanley Capital International (MSCI) All Country World (ACW) Investable Market Index (IMI) (net) is a free float-adjusted market capitalization weighted index that is designed to measure the equity market of developed and emerging markets. This index approximates the minimum possible dividend reinvestment by deducting for the highest possible withholding tax rates of those markets.
This report identifies the Fund’s investments on June 30, 2021. These holdings are subject to change. Not all stocks in the Fund performed the same, nor is there any guarantee that these stocks will perform as well in the future. Market forecasts provided in this report may not necessarily come to pass.
Sector Diversification (Unaudited)

The sector diversification shown is based on the total long-term securities.
| 32 | Semiannual Report | June 30, 2021 |
Global Leaders Fund
Portfolio of Investments, June 30, 2021 (all dollar amounts in thousands) (unaudited)
| | | | | | | | |
| | | | | | | | |
| | Issuer | | Shares | | | Value | |
| | | | | | | | | | |
| | Common Stocks | | | | | | | | |
| | Western Hemisphere—49.8% | | | | | | | | |
| | Canada—1.3% | | | | | | | | |
| * | Lululemon Athletica, Inc. (Textiles, apparel & luxury goods) | | | 4,961 | | | $ | 1,811 | |
| | United States—48.5% | | | | | | | | |
| * | Adobe, Inc. (Software) | | | 3,173 | | | | 1,858 | |
| * | Align Technology, Inc. (Health care equipment & supplies) | | | 2,227 | | | | 1,361 | |
| * | Alphabet, Inc. Class “A” (Interactive Media & Services) | | | 1,713 | | | | 4,183 | |
| * | Amazon.com, Inc. (Internet & direct marketing retail) | | | 1,115 | | | | 3,836 | |
| | BlackRock, Inc. (Capital markets) | | | 2,288 | | | | 2,002 | |
| * | Charles River Laboratories International, Inc. (Life sciences tools & services) | | | 6,701 | | | | 2,479 | |
| * | CoStar Group, Inc. (Professional services) | | | 14,870 | | | | 1,231 | |
| | Ecolab, Inc. (Chemicals) | | | 5,452 | | | | 1,123 | |
| * | Edwards Lifesciences Corporation (Health care equipment & supplies) | | | 15,213 | | | | 1,576 | |
| * | Facebook, Inc. Class “A” (Interactive Media & Services) | | | 10,162 | | | | 3,533 | |
| | Fidelity National Information Services, Inc. (IT services) | | | 12,022 | | | | 1,703 | |
| * | IDEXX Laboratories, Inc. (Health care equipment & supplies) | | | 3,155 | | | | 1,992 | |
| | Intercontinental Exchange, Inc. (Capital markets) | | | 14,765 | | | | 1,752 | |
| * | Intuitive Surgical, Inc. (Health care equipment & supplies) | | | 1,638 | | | | 1,506 | |
| | Lockheed Martin Corporation (Aerospace & defense) | | | 5,753 | | | | 2,177 | |
| | Mastercard, Inc. Class “A” (IT services) | | | 9,411 | | | | 3,436 | |
| | Microsoft Corporation (Software) | | | 14,599 | | | | 3,955 | |
| | NextEra Energy, Inc. (Electric utilities) | | | 14,592 | | | | 1,069 | |
| | NIKE, Inc. Class “B” (Textiles, apparel & luxury goods) | | | 14,142 | | | | 2,185 | |
| * | PayPal Holdings, Inc. (IT services) | | | 8,992 | | | | 2,621 | |
| | Prologis, Inc. (Equity REIT) | | | 11,032 | | | | 1,319 | |
| | Roper Technologies, Inc. (Industrial conglomerates) | | | 3,394 | | | | 1,596 | |
| * | salesforce.com, Inc. (Software) | | | 12,239 | | | | 2,990 | |
| | The Estee Lauder Cos., Inc. Class “A” (Personal products) | | | 7,035 | | | | 2,238 | |
| | Thermo Fisher Scientific, Inc. (Life sciences tools & services) | | | 3,853 | | | | 1,944 | |
| * | Ulta Beauty, Inc. (Specialty retail) | | | 7,706 | | | | 2,664 | |
| | Union Pacific Corporation (Road & rail) | | | 9,699 | | | | 2,133 | |
| | UnitedHealth Group, Inc. (Health care providers & services) | | | 5,564 | | | | 2,228 | |
| * | Veeva Systems, Inc. Class “A” (Health care technology) | | | 2,998 | | | | 932 | |
| * | Workday, Inc. Class “A” (Software) | | | 7,876 | | | | 1,880 | |
| | Zoetis, Inc. (Pharmaceuticals) | | | 9,846 | | | | 1,835 | |
| | | | | | | | | 67,337 | |
| | | | | | | | |
| | | | | | | | |
| | Issuer | | Shares | | | Value | |
| | | | | | | | | | |
| | Common Stocks—(continued) | | | | | | | | |
| | | | | | | | | | |
| | Europe—25.3% | | | | | | | | |
| | Denmark—3.6% | | | | | | | | |
| | Chr Hansen Holding A/S (Chemicals) | | | 10,259 | | | $ | 926 | |
| | DSV PANALPINA A/S (Air freight & logistics) | | | 9,956 | | | | 2,322 | |
| | Novo Nordisk A/S Class “B” (Pharmaceuticals) | | | 21,057 | | | | 1,764 | |
| | | | | | | | | 5,012 | |
| | France—4.2% | | | | | | | | |
| * | Airbus SE (Aerospace & defense) | | | 27,279 | | | | 3,508 | |
| | LVMH Moet Hennessy Louis Vuitton SE (Textiles, apparel & luxury goods) | | | 2,963 | | | | 2,323 | |
| | | | | | | | | 5,831 | |
| | Germany—4.4% | | | | | | | | |
| | Infineon Technologies AG (Semiconductors & semiconductor equipment) | | | 76,506 | | | | 3,068 | |
| | MTU Aero Engines AG (Aerospace & defense) | | | 8,793 | | | | 2,178 | |
| | Rational AG (Machinery) | | | 883 | | | | 800 | |
| | | | | | | | | 6,046 | |
| | Ireland—3.6% | | | | | | | | |
| | Allegion plc (Building products)† | | | 7,618 | | | | 1,061 | |
| * | Aptiv plc (Auto components)† | | | 15,672 | | | | 2,466 | |
| * | Ryanair Holdings plc—ADR (Airlines) | | | 13,789 | | | | 1,492 | |
| | | | | | | | | 5,019 | |
| | Netherlands—1.0% | | | | | | | | |
| * | Adyen N.V. (IT services) | | | 581 | | | | 1,420 | |
| | Sweden—5.2% | | | | | | | | |
| | Atlas Copco AB Class “A” (Machinery) | | | 40,061 | | | | 2,453 | |
| | Evolution Gaming Group AB (Hotels, restaurants & leisure) | | | 5,210 | | | | 823 | |
| | Hexagon AB Class “B” (Electronic equipment, instruments & components) | | | 194,885 | | | | 2,887 | |
| | Indutrade AB (Machinery) | | | 41,640 | | | | 1,066 | |
| | | | | | | | | 7,229 | |
| | Switzerland—3.3% | | | | | | | | |
| | Lonza Group AG (Life sciences tools & services) | | | 2,776 | | | | 1,968 | |
| | Partners Group Holding AG (Capital markets) | | | 1,695 | | | | 2,567 | |
| | | | | | | | | 4,535 | |
| | | | | | | | | | |
| | Emerging Asia—8.1% | | | | | | | | |
| | China—4.4% | | | | | | | | |
| * | Alibaba Group Holding, Ltd. (Internet & direct marketing retail) | | | 90,344 | | | | 2,560 | |
| | Shenzhou International Group Holdings, Ltd. (Textiles, apparel & luxury goods) | | | 48,300 | | | | 1,220 | |
| | Tencent Holdings, Ltd. (Interactive Media & Services) | | | 30,400 | | | | 2,286 | |
| | | | | | | | | 6,066 | |
See accompanying Notes to Financial Statements.
| June 30, 2021 | William Blair Funds | 33 |
Global Leaders Fund
Portfolio of Investments, June 30, 2021 (all dollar amounts in thousands) (unaudited)
| | | | | | | | |
| | | | | | | | |
| | Issuer | | Shares | | | Value | |
| | | | | | | | | | |
| | Common Stocks—(continued) | | | | | | | | |
| | | | | | | | | | |
| | Emerging Asia—(continued) | | | | | | | | |
| | India—1.4% | | | | | | | | |
| * | HDFC Bank, Ltd.—ADR (Banks) | | | 27,882 | | | $ | 2,039 | |
| | Taiwan—2.3% | | | | | | | | |
| | Taiwan Semiconductor Manufacturing Co., Ltd.—ADR (Semiconductors & semiconductor equipment) | | | 26,620 | | | | 3,199 | |
| | | | | | | | | | |
| | Asia—5.6% | | | | | | | | |
| | Australia—3.7% | | | | | | | | |
| | Aristocrat Leisure, Ltd. (Hotels, restaurants & leisure) | | | 77,246 | | | | 2,496 | |
| * | Atlassian Corporation plc Class “A” (Software)† | | | 4,924 | | | | 1,265 | |
| | CSL, Ltd. (Biotechnology) | | | 6,350 | | | | 1,358 | |
| | | | | | | | | 5,119 | |
| | Hong Kong—1.5% | | | | | | | | |
| | AIA Group, Ltd. (Insurance) | | | 167,400 | | | | 2,081 | |
| | New Zealand—0.4% | | | | | | | | |
| | Fisher & Paykel Healthcare Corp., Ltd. (Health care equipment & supplies) | | | 23,878 | | | | 519 | |
| | | | | | | | | | |
| | Japan—4.6% | | | | | | | | |
| | Daikin Industries, Ltd. (Building products) | | | 9,600 | | | | 1,788 | |
| | Keyence Corporation (Electronic equipment, instruments & components) | | | 3,400 | | | | 1,716 | |
| | Nihon M&A Center, Inc. (Professional services) | | | 57,400 | | | | 1,489 | |
| | SMC Corporation (Machinery) | | | 2,400 | | | | 1,418 | |
| | | | | | | | | 6,411 | |
| | | | | | | | | | |
| | United Kingdom—3.5% | | | | | | | | |
| * | Compass Group plc (Hotels, restaurants & leisure) | | | 118,703 | | | | 2,499 | |
| | Experian plc (Professional services) | | | 27,176 | | | | 1,047 | |
| | Halma plc (Electronic equipment, instruments & components) | | | 15,487 | | | | 577 | |
| | Rentokil Initial plc (Commercial services & supplies) | | | 114,974 | | | | 787 | |
| | | | | | | | | 4,910 | |
| | | | | | | | | | |
| | Emerging Latin America—1.6% | | | | | | | | |
| | Argentina—1.6% | | | | | | | | |
| * | Globant S.A. (IT services)† | | | 5,695 | | | | 1,248 | |
| * | MercadoLibre, Inc. (Internet & direct marketing retail) | | | 590 | | | | 920 | |
| | | | | | | | | 2,168 | |
| | Total Common Stocks—98.5%
(cost $71,771) | | | | | | | 136,752 | |
| | | | | | | | |
| | | | Principal | | | | |
| | Issuer | | Amount | | | Value | |
| | | | | | | | | | |
| | Common Stocks—(continued) | | | | | | | | |
| | Repurchase Agreement | | | | | | | | |
| | Fixed Income Clearing Corporation, 0.000% dated 6/30/21, due 7/1/21, repurchase price $1,591, collateralized by U.S. Treasury Bond, 1.875%, due 2/15/41, valued at $1,623 | | | $1,591 | | | $ | 1,591 | |
| | Total Repurchase Agreement—1.2%
(cost $1,591) | | | | | | | 1,591 | |
| | Total Investments—99.7%
(cost $73,362) | | | | | | | 138,343 | |
| | Cash and other assets, less liabilities—0.3% | | | | | | | 485 | |
| | Net assets—100.0% | | | | | | $ | 138,828 | |
ADR = American Depository Receipt
REIT = Real Estate Investment Trust
* = Non-income producing security
† = U.S. listed foreign security
At June 30, 2021, the Fund’s Portfolio of Investments includes the following industry categories (as a percentage of long-term investments):
| Information Technology | | 24.7 | % |
| Industrials | | 20.9 | % |
| Consumer Discretionary | | 18.9 | % |
| Health Care | | 15.7 | % |
| Financials | | 7.6 | % |
| Communication Services | | 7.3 | % |
| Consumer Staples | | 1.6 | % |
| Materials | | 1.5 | % |
| Real Estate | | 1.0 | % |
| Utilities | | 0.8 | % |
| Total | | 100.0 | % |
At June 30, 2021, the Fund’s Portfolio of Investments includes the following currency categories (as a percentage of long-term investments):
| U.S. Dollar | | 60.6 | % |
| Euro | | 9.7 | % |
| Hong Kong Dollar | | 5.9 | % |
| Swedish Krona | | 5.3 | % |
| Japanese Yen | | 4.7 | % |
| Danish Krone | | 3.7 | % |
| British Pound Sterling | | 3.6 | % |
| Swiss Franc | | 3.3 | % |
| Australian Dollar | | 2.8 | % |
| All Other Currencies | | 0.4 | % |
| Total | | 100.0 | % |
See accompanying Notes to Financial Statements.
| 34 | Semiannual Report | June 30, 2021 |
| | International Leaders Fund |
| | |
| | The International Leaders Fund seeks long-term capital appreciation. |
| | |
| | AN OVERVIEW FROM THE PORTFOLIO MANAGERS |
| | |

Simon Fennell 
Kenneth J. McAtamney 
Alaina Anderson, CFA | The William Blair International Leaders Fund (Class N shares) (the “Fund”) posted a 6.21% increase, net of fees, for the six months ended June 30, 2021. By comparison, the Fund’s benchmark index, the MSCI All Country World ex-U.S. IMI (net) (the “Index”), increased 9.58%. Six-month underperformance versus the Index was primarily driven by negative stock selection across most sectors. The Consumer Discretionary, Energy and Information Technology sectors had the largest impact on relative returns. Within Consumer Discretionary, TAL Education Group hampered relative performance as the company declined amid regulatory headwinds as the Chinese government seeks to enhance standards of after school education and tutoring and reduce the tutoring burden for children. Neste, a producer of renewable diesel within the Energy sector, hurt relative results. Neste is the world’s largest producer of renewable diesel and jet fuel refined from waste and residues. We believe that Neste offers a superior product compared to petroleum diesel as it not only helps meet renewable/carbon reduction targets, but also burns cleaner in internal combustion engines, resulting in lower emissions and engine maintenance cost. The COVID-19 pandemic is anticipated to have a negative impact on demand this year, but we expect it will have limited impact on longer-term growth. Within the Information Technology sector Keyence hindered relative returns as the company’s share price adjusted lower after strong performance in 2020. Keyence develops and manufactures sensors and measuring instruments used for factory automation. We believe fundamentals in factory automation are inflecting sharply higher as demand recovers against year-over-year comparisons. We continue to see Keyence as well positioned to drive innovation that will expand its total addressable market and enhance an already attractive growth opportunity. Partially offsetting these effects was positive stock selection within the Communication Services and Health Care sectors. Within Communication Services, Sea helped relative performance. Sea is a South East Asian mobile gaming and e-commerce company that primarily operates in seven South East Asian markets, including Indonesia, Malaysia, the Philippines, Singapore, Thailand, Taiwan and Vietnam. More recently, it has expanded its gaming operations to include India, Russia and Latin America. The company is the market leader in both gaming revenues and e-commerce, and current game success coupled with a robust pipeline are driving higher revenue growth and profitability expectations, and e-commerce operating metrics continue to be strong. Straumann, the global market leader in esthetic dentistry within Health Care, was an additional source of outperformance. The company develops, manufactures, and supplies dental implants, instruments, biomaterials, CADCAM prosthetics, digital equipment, software, and clear aligners for applications in replacement, restorative, and orthodontic dentistry. We believe that Straumann is more than just a products company. As a total solution provider, it offers training, support, and a wide range of services to dental practitioners, clinics, and laboratories all over the world. Please refer to the Global Markets Review and Outlook relating to the Fund beginning on page 29. |
| June 30, 2021 | William Blair Funds | 35 |
International Leaders Fund
Performance Highlights (Unaudited)
| Average Annual Total Returns through 6/30/2021 |
| | | Year
to Date | | 1 Year | | 3 Year | | 5 Year | | Since
Inception |
| Class N(a) | | | 6.21 | % | | | 36.04 | % | | | 15.12 | % | | | 15.38 | % | | | 11.71 | % |
| Class I(a) | | | 6.32 | | | | 36.36 | | | | 15.41 | | | | 15.68 | | | | 11.98 | |
| MSCI ACW Ex-U.S. IMI (net)(a) | | | 9.58 | | | | 37.18 | | | | 9.42 | | | | 11.20 | | | | 7.79 | |
| Class R6(b) | | | 6.36 | | | | 36.46 | | | | 15.48 | | | | 15.78 | | | | 12.10 | |
| MSCI ACW Ex-U.S. IMI (net)(b) | | | 9.58 | | | | 37.18 | | | | 9.42 | | | | 11.20 | | | | 7.52 | |
| (a) | Since inception is for the period from August 16, 2012 (Commencement of Operations) to June 30, 2021. |
| (b) | Since inception is for the period from November 2, 2012 (Commencement of Operations) to June 30, 2021. |
Performance cited represents past performance. Past performance does not guarantee future results and current performance may be lower or higher than the data quoted. Results shown are average annual total returns, which assume reinvestment of dividends and capital gains. Investment returns and principal will fluctuate and you may have a gain or loss when you sell shares. For the most current month-end performance information, please call 1-800-742-7272, or visit our Web site at www.williamblairfunds.com. Investing in smaller and medium capitalization companies involves special risks, including higher volatility and lower liquidity. Smaller and medium capitalization stocks are also more sensitive to purchase/sale transactions and changes in the issuer’s financial condition. International investing involves special risk considerations, including currency fluctuations, lower liquidity, economic and political risk. From time to time the investment adviser may waive fees or reimburse expenses for the Fund. Without these waivers/reimbursements, performance would be lower. Class N shares are not subject to a sales load. Class I shares are not subject to a sales load or distribution (Rule 12b-1) fees. Class R6 shares are not subject to a sales load, distribution (Rule 12b-1) fees, or sub-transfer agent fees.
The performance highlights presented above do not reflect the deduction of taxes that a shareholder would pay on fund distributions or the redemption of fund shares.
The Morgan Stanley Capital International (MSCI) All Country World (ACW) Ex-U.S. Investable Market Index (IMI) (net) is a free float-adjusted market capitalization weighted index that is designed to measure the equity market performance of developed and emerging markets, excluding the United States. This index approximates the minimum possible dividend reinvestment by deducting for the highest possible withholding tax rates of those markets.
This report identifies the Fund’s investments on June 30, 2021. These holdings are subject to change. Not all stocks in the Fund performed the same, nor is there any guarantee that these stocks will perform as well in the future. Market forecasts provided in this report may not necessarily come to pass.
Sector Diversification (Unaudited)

The sector diversification shown is based on the total long-term securities.
| 36 | Semiannual Report | June 30, 2021 |
International Leaders Fund
Portfolio of Investments, June 30, 2021 (all dollar amounts in thousands) (unaudited)
| | | | | | | | |
| | | | | | | | |
| | Issuer | | Shares | | | Value | |
| | | | | | | | | | |
| | Common Stocks | | | | | | | | |
| | | | | | | | | | |
| | Europe, Mid-East—50.8% | | | | | | | | |
| | Denmark—6.5% | | | | | | | | |
| | Chr Hansen Holding A/S (Chemicals) | | | 103,186 | | | $ | 9,313 | |
| | Coloplast A/S Class “B” (Health care equipment & supplies) | | | 103,985 | | | | 17,062 | |
| | DSV PANALPINA A/S (Air freight & logistics) | | | 74,473 | | | | 17,368 | |
| | Novo Nordisk A/S Class “B” (Pharmaceuticals) | | | 249,651 | | | | 20,915 | |
| | Orsted A/S (Electric utilities) | | | 88,167 | | | | 12,372 | |
| | | | | | | | | 77,030 | |
| | Finland—1.4% | | | | | | | | |
| | Neste Oyj (Oil, gas & consumable fuels) | | | 275,306 | | | | 16,858 | |
| | France—13.0% | | | | | | | | |
| * | Airbus SE (Aerospace & defense) | | | 274,493 | | | | 35,295 | |
| | L’Oreal S.A. (Personal products) | | | 43,360 | | | | 19,322 | |
| | LVMH Moet Hennessy Louis Vuitton SE (Textiles, apparel & luxury goods) | | | 57,056 | | | | 44,740 | |
| | Safran S.A. (Aerospace & defense) | | | 200,969 | | | | 27,862 | |
| | Sartorius Stedim Biotech (Life sciences tools & services) | | | 32,834 | | | | 15,530 | |
| | Teleperformance (Professional services) | | | 32,020 | | | | 12,996 | |
| | | | | | | | | 155,745 | |
| | Germany—4.3% | | | | | | | | |
| | Infineon Technologies AG (Semiconductors & semiconductor equipment) | | | 629,573 | | | | 25,247 | |
| | Rational AG (Machinery) | | | 16,364 | | | | 14,825 | |
| * | TeamViewer AG (Software) | | | 310,830 | | | | 11,691 | |
| | | | | | | | | 51,763 | |
| | Ireland—3.2% | | | | | | | | |
| * | ICON plc (Life sciences tools & services)† | | | 19,745 | | | | 4,081 | |
| | Kingspan Group plc (Building products) | | | 219,393 | | | | 20,718 | |
| * | Ryanair Holdings plc—ADR (Airlines) | | | 123,638 | | | | 13,379 | |
| | | | | | | | | 38,178 | |
| | Israel—0.2% | | | | | | | | |
| * | Wix.com, Ltd. (IT services)† | | | 9,075 | | | | 2,634 | |
| | Netherlands—4.3% | | | | | | | | |
| * | Adyen N.V. (IT services) | | | 9,296 | | | | 22,712 | |
| | ASML Holding N.V. (Semiconductors & semiconductor equipment) | | | 41,348 | | | | 28,407 | |
| | | | | | | | | 51,119 | |
| | Norway—1.0% | | | | | | | | |
| | TOMRA Systems ASA (Commercial services & supplies) | | | 218,942 | | | | 12,078 | |
| | Spain—1.8% | | | | | | | | |
| * | Amadeus IT Group S.A. (IT services) | | | 309,705 | | | | 21,784 | |
| | Sweden—5.6% | | | | | | | | |
| | Atlas Copco AB Class “A” (Machinery) | | | 404,322 | | | | 24,756 | |
| | Hexagon AB Class “B” (Electronic equipment, instruments & components) | | | 1,781,914 | | | | 26,402 | |
| | Nibe Industrier AB Class “B” (Building products) | | | 1,501,613 | | | | 15,795 | |
| | | | | | | | | 66,953 | |
| | | | | | | | |
| | | | | | | | |
| | Issuer | | Shares | | | Value | |
| | | | | | | | | | |
| | Common Stocks—(continued) | | | | | | | | |
| | | | | | | | | | |
| | Europe, Mid-East—(continued) | | | | | | | | |
| | Switzerland—9.5% | | | | | | | | |
| | Lonza Group AG (Life sciences tools & services) | | | 38,228 | | | $ | 27,095 | |
| | Partners Group Holding AG (Capital markets) | | | 15,769 | | | | 23,886 | |
| | Sika AG (Chemicals) | | | 51,459 | | | | 16,824 | |
| | Straumann Holding AG (Health care equipment & supplies) | | | 19,958 | | | | 31,816 | |
| | Temenos AG (Software) | | | 88,178 | | | | 14,162 | |
| | | | | | | | | 113,783 | |
| | | | | | | | | | |
| | Emerging Asia—17.0% | | | | | | | | |
| | China—9.3% | | | | | | | | |
| * | Alibaba Group Holding, Ltd. (Internet & direct marketing retail) | | | 958,156 | | | | 27,149 | |
| | Foshan Haitian Flavouring & Food Co., Ltd. Class “A” (Food products) | | | 489,572 | | | | 9,770 | |
| | Kweichow Moutai Co., Ltd. Class “A” (Beverages) | | | 43,500 | | | | 13,846 | |
| | NetEase, Inc. (Entertainment) | | | 966,575 | | | | 21,898 | |
| * | TAL Education Group—ADR (Diversified consumer services) | | | 284,804 | | | | 7,186 | |
| | Tencent Holdings, Ltd. (Interactive Media & Services) | | | 371,100 | | | | 27,913 | |
| * | Wuxi Biologics Cayman, Inc. (Life sciences tools & services) | | | 177,000 | | | | 3,244 | |
| | | | | | | | | 111,006 | |
| | India—3.9% | | | | | | | | |
| | Housing Development Finance Corporation, Ltd. (Thrifts & mortgage finance) | | | 643,514 | | | | 21,451 | |
| | Reliance Industries, Ltd. (Oil, gas & consumable fuels) | | | 919,740 | | | | 25,763 | |
| | | | | | | | | 47,214 | |
| | Taiwan—2.7% | | | | | | | | |
| | Taiwan Semiconductor Manufacturing Co., Ltd. (Semiconductors & semiconductor equipment) | | | 1,511,000 | | | | 32,267 | |
| | Thailand—1.1% | | | | | | | | |
| * | Sea, Ltd.—ADR (Entertainment) | | | 48,657 | | | | 13,361 | |
| | | | | | | | | | |
| | United Kingdom—12.0% | | | | | | | | |
| | Ashtead Group plc (Trading companies & distributors) | | | 369,321 | | | | 27,404 | |
| * | Compass Group plc (Hotels, restaurants & leisure) | | | 669,961 | | | | 14,105 | |
| | Experian plc (Professional services) | | | 511,214 | | | | 19,702 | |
| | Halma plc (Electronic equipment, instruments & components) | | | 311,514 | | | | 11,600 | |
| | London Stock Exchange Group plc (Capital markets) | | | 187,833 | | | | 20,708 | |
| | Rentokil Initial plc (Commercial services & supplies) | | | 1,651,799 | | | | 11,311 | |
| | Segro plc (Equity REIT) | | | 1,113,285 | | | | 16,855 | |
| | Spirax-Sarco Engineering plc (Machinery) | | | 75,042 | | | | 14,133 | |
| * | Trainline plc (Hotels, restaurants & leisure) | | | 1,810,907 | | | | 7,355 | |
| | | | | | | | | 143,173 | |
See accompanying Notes to Financial Statements.
| June 30, 2021 | William Blair Funds | 37 |
International Leaders Fund
Portfolio of Investments, June 30, 2021 (all dollar amounts in thousands) (unaudited)
| | Issuer | | Shares or
Principal
Amount | | | Value | |
| | | | | | | | | | |
| | Common Stocks—(continued) | | | | | | | | |
| | | | | | | | | | |
| | Japan—8.4% | | | | | | | | |
| | Asahi Intecc Co., Ltd. (Health care equipment & supplies) | | | 228,200 | | | $ | 5,456 | |
| | Daikin Industries, Ltd. (Building products) | | | 99,100 | | | | 18,456 | |
| | Hoya Corporation (Health care equipment & supplies) | | | 146,700 | | | | 19,451 | |
| | Keyence Corporation (Electronic equipment, instruments & components) | | | 46,400 | | | | 23,418 | |
| | M3, Inc. (Health care technology) | | | 90,700 | | | | 6,623 | |
| | Nihon M&A Center, Inc. (Professional services) | | | 379,300 | | | | 9,836 | |
| | SMC Corporation (Machinery) | | | 29,600 | | | | 17,492 | |
| | | | | | | | | 100,732 | |
| | | | | | | | | | |
| | Asia—6.1% | | | | | | | | |
| | Australia—3.6% | | | | | | | | |
| | Aristocrat Leisure, Ltd. (Hotels, restaurants & leisure) | | | 706,296 | | | | 22,824 | |
| * | Atlassian Corporation plc Class “A” (Software)† | | | 41,505 | | | | 10,661 | |
| | CSL, Ltd. (Biotechnology) | | | 45,082 | | | | 9,642 | |
| | | | | | | | | 43,127 | |
| | Hong Kong—1.8% | | | | | | | | |
| | AIA Group, Ltd. (Insurance) | | | 1,744,400 | | | | 21,681 | |
| | New Zealand—0.7% | | | | | | | | |
| | Fisher & Paykel Healthcare Corp., Ltd. (Health care equipment & supplies) | | | 384,906 | | | | 8,373 | |
| | | | | | | | | | |
| | Canada—3.1% | | | | | | | | |
| | Canadian National Railway Co. (Road & rail) | | | 221,612 | | | | 23,382 | |
| * | Lululemon Athletica, Inc. (Textiles, apparel & luxury goods) | | | 38,125 | | | | 13,915 | |
| | | | | | | | | 37,297 | |
| | | | | | | | | | |
| | Emerging Latin America—1.2% | | | | | | | | |
| | Argentina—1.2% | | | | | | | | |
| * | MercadoLibre, Inc. (Internet & direct marketing retail) | | | 8,984 | | | | 13,995 | |
| | Total Common Stocks—98.6%
(cost $808,230) | | | | | | | 1,180,151 | |
| | | | | | | | | | |
| | Repurchase Agreement | | | | | | | | |
| | Fixed Income Clearing Corporation, 0.000% dated 6/30/21, due 7/1/21, repurchase price $16,293, collateralized by U.S. Treasury Bond, 1.875%, due 2/15/41, valued at $16,619 | | | $16,293 | | | | 16,293 | |
| | Total Repurchase Agreement—1.4%
(cost $16,293) | | | | | | | 16,293 | |
| | Total Investments—100.0%
(cost $824,523) | | | | | | | 1,196,444 | |
| | Liabilities, plus cash and other assets—(0.0)% | | | | | | | (191 | ) |
| | Net assets—100.0% | | | | | | $ | 1,196,253 | |
ADR = American Depository Receipt
REIT = Real Estate Investment Trust
* = Non-income producing security
† = U.S. listed foreign security
At June 30, 2021, the Fund’s Portfolio of Investments includes the following industry categories (as a percentage of long-term investments):
| Industrials | | | 28.7 | % |
| Information Technology | | | 19.6 | % |
| Health Care | | | 14.3 | % |
| Consumer Discretionary | | | 12.8 | % |
| Financials | | | 7.4 | % |
| Communication Services | | | 5.4 | % |
| Consumer Staples | | | 3.6 | % |
| Energy | | | 3.6 | % |
| Materials | | | 2.2 | % |
| Real Estate | | | 1.4 | % |
| Utilities | | | 1.0 | % |
| Total | | | 100.0 | % |
| | | | | |
| At June 30, 2021, the Fund’s Portfolio of Investments includes the following currency categories (as a percentage of long-term investments): |
| | | | | |
| Euro | | | 27.0 | % |
| British Pound Sterling | | | 12.1 | % |
| Swiss Franc | | | 9.7 | % |
| Hong Kong Dollar | | | 8.6 | % |
| Japanese Yen | | | 8.5 | % |
| U.S. Dollar | | | 6.7 | % |
| Danish Krone | | | 6.5 | % |
| Swedish Krona | | | 5.7 | % |
| Indian Rupee | | | 4.0 | % |
| Australian Dollar | | | 2.8 | % |
| New Taiwan Dollar | | | 2.7 | % |
| Chinese Yuan Renminbi | | | 2.0 | % |
| Canadian Dollar | | | 2.0 | % |
| Norwegian Krone | | | 1.0 | % |
| All Other Currencies | | | 0.7 | % |
| Total | | | 100.0 | % |
See accompanying Notes to Financial Statements.
| 38 | Semiannual Report | June 30, 2021 |
| | International Growth Fund |
| | |
| | The International Growth Fund seeks long-term capital appreciation. |
| | |
| | AN OVERVIEW FROM THE PORTFOLIO MANAGERS |
| | |

Simon Fennell 
Kenneth J. McAtamney | The William Blair International Growth Fund (Class N shares) posted a 8.28% increase, net of fees, for the six months ended June 30, 2021. By comparison, the Fund’s benchmark index, the MSCI All Country World ex-U.S. IMI (net) (the “Index”), increased 9.58%. Six-month underperformance versus the Index was primarily driven by negative stock selection across most sectors. Stock selection within the Financials sector was particularly weak, as Ping An Insurance and Bank Central Asia weighed on relative performance in the period. Ping An is the largest insurance company by market cap globally and the leading life insurance in what we expect will be the largest market (by size and growth) for life insurance over the next decade. Although Ping An remains firmly in the expanding growth phase of its corporate lifecycle, its breadth of services propels it into a different category and closer to becoming a dominant technology-powered retail financial services group. It has developed a broad ecosystem comprising over 6oo million internet users and over 220 million retail customers. Ping An continues to improve its cross-sell of products from other parts of the group, which increases income without incurring the cost of acquiring new clients. While recent results have been below average due to COVID-19, we believe it will revert to its previous growth trajectory as the economy recovers. Partially offsetting these effects was positive stock selection within the Health Care and Communication Services sectors. Within Health Care, Wuxi Biologics and Lonza added to relative returns. Wuxi Biologics is a contract development and manufacturing organization (CDMO) that offers a full range of research and manufacturing services for biologic drugs. The services are designed to help clients improve research and development efficiency, shorten development timelines and lower costs. Importantly, Wuxi is the only company offering comprehensive CDMO services for biologics in China. As a result, Wuxi is the domestic market leader with approximately 50% market share. Supporting Wuxi’s growth profile is strong demand for biologics outsourcing services worldwide. We believe Wuxi’s strong execution and favorable market dynamics will generate strong earnings growth for the foreseeable future. Lonza is a leader in custom manufacturing of biopharmaceuticals and specialty ingredients. Lonza offers highly visible growth and given the strong market demand for outsourced biopharma production and related services, we remain confident it can deliver on growth in the future. Within Communication Services, Kakao boosted relative returns. Kakao is a South Korean online platform. It operates KakaoTalk, the largest mobile messaging app, and Daum, the second largest web portal. Other businesses include ride-hailing, music streaming, and financial services businesses with Kakao Pay and Kakao Bank. We believe Kakao will sustain its position as one of the most dominant tech companies in South Korea, given the strong market position, management execution, business development, and potential to drive synergies and capture sustained value around its various platform, content, and new businesses. Please refer to the Global Markets Review and Outlook relating to the Fund beginning on page 29. |
| June 30, 2021 | William Blair Funds | 39 |
International Growth Fund
Performance Highlights (Unaudited)
Average Annual Total Returns through 6/30/2021
| | | Year
to Date | | 1 Year | | 3 Year | | 5 Year | | 10 Year | | Since
Inception(a) |
| Class N | | | 8.28 | % | | | 42.17 | % | | | 15.73 | % | | | 14.69 | % | | | 8.52 | % | | | — | % |
| Class I | | | 8.45 | | | | 42.58 | | | | 16.09 | | | | 15.04 | | | | 8.85 | | | | — | |
| Class R6 | | | 8.47 | | | | 42.70 | | | | — | | | | — | | | | — | | | | 24.31 | |
| MSCI ACW Ex-U.S. IMI (net) | | | 9.58 | | | | 37.18 | | | | 9.42 | | | | 11.20 | | | | 5.65 | | | | 13.16 | |
| (a) | Since inception is for the period from May 2, 2019 (Commencement of Operations) to June 30, 2021. |
Performance cited represents past performance. Past performance does not guarantee future results and current performance may be lower or higher than the data quoted. Results shown are average annual total returns, which assume reinvestment of dividends and capital gains. Investment returns and principal will fluctuate and you may have a gain or loss when you sell shares. For the most current month-end performance information, please call 1-800-742-7272, or visit our Web site at www.williamblairfunds.com. Investing in smaller and medium capitalization companies involves special risks, including higher volatility and lower liquidity. Smaller and medium capitalization stocks are also more sensitive to purchase/sale transactions and changes in the issuer’s financial condition. International investing involves special risk considerations, including currency fluctuations, lower liquidity, economic and political risk. From time to time, the investment adviser may waive fees or reimburse expenses for the Fund. Without these waivers/reimbursements, performance would be lower. Class N shares are not subject to a sales load. Class I shares are not subject to a sales load or distribution (Rule 12b-1) fees. Class R6 shares are not subject to a sales load, distribution (Rule 12b-1) fees, or sub-transfer agent fees.
The performance highlights and graph presented above do not reflect the deduction of taxes that a shareholder would pay on fund distributions or the redemption of fund shares.
The Morgan Stanley Capital International (MSCI) All Country World (ACW) Ex-U.S. Investable Market Index (IMI) (net) is a free float-adjusted market capitalization weighted index that is designed to measure the equity market performance of developed and emerging markets, excluding the United States. This index approximates the minimum possible dividend reinvestment by deducting for the highest possible withholding tax rates of those markets.
This report identifies the Fund’s investments on June 30, 2021. These holdings are subject to change. Not all stocks in the Fund performed the same, nor is there any guarantee that these stocks will perform as well in the future. Market forecasts provided in this report may not necessarily come to pass.
Sector Diversification (Unaudited)

The sector diversification shown is based on the total long-term securities.
| 40 | Semiannual Report | June 30, 2021 |
International Growth Fund
Portfolio of Investments, June 30, 2021 (all dollar amounts in thousands) (unaudited)
| | | | | | | | |
| | | | | | | | |
| | Issuer | | Shares | | | Value | |
| | | | | | | | |
| | Common Stocks | | | | | | |
| | | | | | | | |
| | Europe, Mid-East—45.4% | | | | | | |
| | Belgium—0.3% | | | | | | |
| | Warehouses De Pauw CVA (Equity REIT) | | | 167,727 | | | $ | 6,404 | |
| | Denmark—4.1% | | | | | | | | |
| | Chr Hansen Holding A/S (Chemicals) | | | 67,200 | | | | 6,065 | |
| | Coloplast A/S Class “B” (Health care equipment & supplies) | | | 58,540 | | | | 9,605 | |
| | DSV PANALPINA A/S (Air freight & logistics) | | | 180,021 | | | | 41,982 | |
| * | Genmab A/S (Biotechnology) | | | 36,970 | | | | 15,127 | |
| | Netcompany Group A/S (Software) | | | 51,304 | | | | 5,829 | |
| | Orsted A/S (Electric utilities) | | | 84,520 | | | | 11,860 | |
| | Royal Unibrew A/S (Beverages) | | | 38,877 | | | | 4,952 | |
| | | | | | | | | 95,420 | |
| | Finland—0.9% | | | | | | | | |
| | Neste Oyj (Oil, gas & consumable fuels) | | | 353,022 | | | | 21,616 | |
| | France—10.5% | | | | | | | | |
| * | Airbus SE (Aerospace & defense) | | | 308,528 | | | | 39,671 | |
| | Dassault Systemes SE (Software) | | | 77,298 | | | | 18,744 | |
| | Hermes International (Textiles, apparel & luxury goods) | | | 8,077 | | | | 11,766 | |
| | Kering S.A. (Textiles, apparel & luxury goods) | | | 36,217 | | | | 31,650 | |
| | L’Oreal S.A. (Personal products) | | | 54,069 | | | | 24,093 | |
| | LVMH Moet Hennessy Louis Vuitton SE (Textiles, apparel & luxury goods) | | | 49,760 | | | | 39,018 | |
| | Safran S.A. (Aerospace & defense) | | | 189,420 | | | | 26,261 | |
| | Sartorius Stedim Biotech (Life sciences tools & services) | | | 34,021 | | | | 16,092 | |
| | Teleperformance (Professional services) | | | 72,200 | | | | 29,305 | |
| * | Worldline S.A. (IT services) | | | 99,633 | | | | 9,326 | |
| | | | | | | | | 245,926 | |
| | Germany—5.9% | | | | | | | | |
| | Carl Zeiss Meditec AG (Health care equipment & supplies) | | | 55,353 | | | | 10,695 | |
| | CompuGroup Medical SE & Co. KgaA (Health care technology) | | | 58,310 | | | | 4,567 | |
| * | CTS Eventim AG & Co. KGaA (Entertainment) | | | 95,342 | | | | 5,958 | |
| * | HelloFresh SE (Internet & direct marketing retail) | | | 139,023 | | | | 13,514 | |
| * | Hypoport SE (Diversified financial services) | | | 6,469 | | | | 3,344 | |
| | Infineon Technologies AG (Semiconductors & semiconductor equipment) | | | 583,628 | | | | 23,405 | |
| | KION Group AG (Machinery) | | | 85,145 | | | | 9,074 | |
| | MTU Aero Engines AG (Aerospace & defense) | | | 123,966 | | | | 30,707 | |
| | Nemetschek SE (Software) | | | 49,522 | | | | 3,789 | |
| | Puma SE (Textiles, apparel & luxury goods) | | | 148,357 | | | | 17,688 | |
| * | TeamViewer AG (Software) | | | 100,753 | | | | 3,789 | |
| | Vonovia SE (Real estate management & development) | | | 186,284 | | | | 12,043 | |
| | | | | | | | | 138,573 | |
| | | | | | | | |
| | | | | | | | |
| | Issuer | | Shares | | | Value | |
| | | | | | | | | | |
| | Common Stocks—(continued) | | | | | | | | |
| | | | | | | | | | |
| | Europe, Mid-East—(continued) | | | | | | | | |
| | Ireland—2.1% | | | | | | | | |
| * | ICON plc (Life sciences tools & services)† | | | 80,305 | | | $ | 16,600 | |
| | Kingspan Group plc (Building products) | | | 177,389 | | | | 16,751 | |
| * | Ryanair Holdings plc—ADR (Airlines) | | | 150,477 | | | | 16,283 | |
| | | | | | | | | 49,634 | |
| | Israel—1.0% | | | | | | | | |
| * | Inmode, Ltd. (Health care equipment & supplies)† | | | 51,530 | | | | 4,879 | |
| * | Nice, Ltd.—ADR (Software) | | | 19,868 | | | | 4,917 | |
| * | Wix.com, Ltd. (IT services)† | | | 46,977 | | | | 13,636 | |
| | | | | | | | | 23,432 | |
| | Italy—0.7% | | | | | | | | |
| | Amplifon SpA (Health care providers & services) | | | 125,920 | | | | 6,217 | |
| * | Brunello Cucinelli SpA (Textiles, apparel & luxury goods) | | | 74,032 | | | | 4,330 | |
| | Moncler SpA (Textiles, apparel & luxury goods) | | | 90,292 | | | | 6,109 | |
| | | | | | | | | 16,656 | |
| | Luxembourg—0.9% | | | | | | | | |
| * | Eurofins Scientific SE (Life sciences tools & services) | | | 138,968 | | | | 15,885 | |
| | Tenaris S.A. (Energy equipment & services) | | | 485,810 | | | | 5,295 | |
| | | | | | | | | 21,180 | |
| | Netherlands—3.7% | | | | | | | | |
| * | Adyen N.V. (IT services) | | | 10,296 | | | | 25,156 | |
| | ASML Holding N.V. (Semiconductors & semiconductor equipment) | | | 67,210 | | | | 46,175 | |
| | BE Semiconductor Industries N.V. (Semiconductors & semiconductor equipment) | | | 44,902 | | | | 3,809 | |
| | Euronext N.V. (Capital markets) | | | 56,115 | | | | 6,102 | |
| | IMCD N.V. (Trading companies & distributors) | | | 39,422 | | | | 6,268 | |
| | | | | | | | | 87,510 | |
| | Norway—0.7% | | | | | | | | |
| * | Pexip Holding ASA (Software) | | | 270,767 | | | | 2,418 | |
| | Scatec ASA (Independent power & renewable electricity producers) | | | 132,851 | | | | 3,518 | |
| | TOMRA Systems ASA (Commercial services & supplies) | | | 177,930 | | | | 9,816 | |
| | | | | | | | | 15,752 | |
| | Spain—1.6% | | | | | | | | |
| * | Amadeus IT Group S.A. (IT services) | | | 399,224 | | | | 28,081 | |
| | EDP Renovaveis S.A. (Independent power & renewable electricity producers) | | | 356,629 | | | | 8,263 | |
| * | Solaria Energia y Medio Ambiente S.A. (Independent power & renewable electricity producers) | | | 139,739 | | | | 2,525 | |
| | | | | | | | | 38,869 | |
See accompanying Notes to Financial Statements.
| June 30, 2021 | William Blair Funds | 41 |
International Growth Fund
Portfolio of Investments, June 30, 2021 (all dollar amounts in thousands) (unaudited)
| | | | | | | | |
| | | | | | | | |
| | Issuer | | Shares | | | Value | |
| | | | | | | | | | |
| | Common Stocks—(continued) | | | | | | | | |
| | | | | | | | | | |
| | Europe, Mid-East—(continued) | | | | | | | | |
| | Sweden—6.1% | | | | | | | | |
| | AddTech AB Class “B” (Trading companies & distributors) | | | 221,990 | | | $ | 3,683 | |
| | Atlas Copco AB Class “A” (Machinery) | | | 643,938 | | | | 39,428 | |
| | Beijer Ref AB (Trading companies & distributors) | | | 327,187 | | | | 5,830 | |
| | Evolution Gaming Group AB (Hotels, restaurants & leisure) | | | 121,729 | | | | 19,236 | |
| | Hexagon AB Class “B” (Electronic equipment, instruments & components) | | | 1,782,817 | | | | 26,415 | |
| | Indutrade AB (Machinery) | | | 354,824 | | | | 9,080 | |
| | Investment AB Latour Class “B” (Industrial conglomerates) | | | 217,844 | | | | 7,148 | |
| | Lifco AB Class “B” (Industrial conglomerates) | | | 281,605 | | | | 6,581 | |
| | Nibe Industrier AB Class “B” (Building products) | | | 881,586 | | | | 9,273 | |
| | Nolato AB Class “B” (Industrial conglomerates) | | | 489,162 | | | | 4,813 | |
| | Sweco AB Class “B” (Construction & engineering) | | | 220,842 | | | | 4,018 | |
| | Thule Group AB (Leisure products) | | | 98,345 | | | | 4,360 | |
| | Vitrolife AB (Biotechnology) | | | 90,663 | | | | 3,767 | |
| | | | | | | | | 143,632 | |
| | Switzerland—6.9% | | | | | | | | |
| | Belimo Holding AG (Building products) | | | 9,327 | | | | 4,264 | |
| | Logitech International S.A. (Technology hardware, storage & peripherals) | | | 42,659 | | | | 5,168 | |
| | Lonza Group AG (Life sciences tools & services) | | | 40,841 | | | | 28,947 | |
| | Partners Group Holding AG (Capital markets) | | | 18,433 | | | | 27,921 | |
| | Siegfried Holding AG (Life sciences tools & services) | | | 6,047 | | | | 5,670 | |
| * | SIG Combibloc Group AG (Containers & packaging) | | | 277,302 | | | | 7,535 | |
| | Sika AG (Chemicals) | | | 106,091 | | | | 34,685 | |
| * | Softwareone Holding AG (Electronic equipment, instruments & components) | | | 137,061 | | | | 3,237 | |
| | Straumann Holding AG (Health care equipment & supplies) | | | 12,701 | | | | 20,247 | |
| | Tecan Group AG (Life sciences tools & services) | | | 12,736 | | | | 6,310 | |
| | Temenos AG (Software) | | | 44,952 | | | | 7,220 | |
| | VAT Group AG (Machinery) | | | 23,473 | | | | 7,804 | |
| * | Zur Rose Group AG (Food & staples retailing) | | | 9,415 | | | | 3,607 | |
| | | | | | | | | 162,615 | |
| | | | | | | | | | |
| | Emerging Asia—23.3% | | | | | | | | |
| | China—12.9% | | | | | | | | |
| | A-Living Smart City Services Co., Ltd. (Commercial services & supplies) | | | 1,194,250 | | | | 5,945 | |
| | Aier Eye Hospital Group Co., Ltd. Class “A” (Health care providers & services) | | | 1,185,612 | | | | 13,024 | |
| | | | | | | | |
| | | | | | | | |
| | Issuer | | Shares | | | Value | |
| | | | | | | | | | |
| | Common Stocks—(continued) | | | | | | | | |
| | | | | | | | | | |
| | Emerging Asia—(continued) | | | | | | | | |
| | China—(continued) | | | | | | | | |
| | AK Medical Holdings, Ltd. (Health care equipment & supplies) | | | 750,000 | | | $ | 1,323 | |
| * | Alibaba Group Holding, Ltd. (Internet & direct marketing retail) | | | 1,017,484 | | | | 28,830 | |
| * | Alibaba Health Information Technology, Ltd. (Health care technology) | | | 1,526,000 | | | | 3,384 | |
| | Centre Testing International Group Co., Ltd. Class “A” (Professional services) | | | 1,361,600 | | | | 6,718 | |
| | Chacha Food Co., Ltd. Class “A” (Food products) | | | 416,642 | | | | 2,779 | |
| | Country Garden Services Holdings Co., Ltd. (Commercial services & supplies) | | | 807,000 | | | | 8,720 | |
| | Foshan Haitian Flavouring & Food Co., Ltd. Class “A” (Food products) | | | 383,165 | | | | 7,647 | |
| | Hangzhou Tigermed Consulting Co., Ltd. Class “A” (Life sciences tools & services) | | | 333,970 | | | | 9,991 | |
| * | JD.com, Inc. Class “A” (Internet & direct marketing retail) | | | 295,700 | | | | 11,631 | |
| | Kweichow Moutai Co., Ltd. Class “A” (Beverages) | | | 27,453 | | | | 8,738 | |
| | Li Ning Co., Ltd. (Textiles, apparel & luxury goods) | | | 1,936,500 | | | | 23,644 | |
| * | Meituan Class “B” (Internet & direct marketing retail) | | | 322,700 | | | | 13,317 | |
| * | NAURA Technology Group Co., Ltd. Class “A” (Semiconductors & semiconductor equipment) | | | 158,913 | | | | 6,822 | |
| | NetEase, Inc. (Entertainment) | | | 661,325 | | | | 14,982 | |
| * | Offcn Education Technology Co., Ltd. Class “A” (Diversified consumer services) | | | 845,721 | | | | 2,734 | |
| | Ping An Insurance Group Co. of China, Ltd. Class “H” (Insurance) | | | 2,427,000 | | | | 23,772 | |
| | Proya Cosmetics Co., Ltd. Class “A” (Personal products) | | | 157,899 | | | | 4,807 | |
| | Shenzhen Mindray Bio-Medical Electronics Co., Ltd. Class “A” (Health care equipment & supplies) | | | 116,350 | | | | 8,644 | |
| | Silergy Corporation (Semiconductors & semiconductor equipment) | | | 32,000 | | | | 4,353 | |
| * | TAL Education Group—ADR (Diversified consumer services) | | | 170,416 | | | | 4,300 | |
| | Tencent Holdings, Ltd. (Interactive Media & Services) | | | 429,300 | | | | 32,290 | |
| * | Tencent Music Entertainment Group—ADR (Entertainment) | | | 221,496 | | | | 3,429 | |
| * | Topchoice Medical Corporation Class “A” (Health care providers & services) | | | 159,139 | | | | 10,123 | |
| * | Venus MedTech Hangzhou, Inc. Class “H” (Health care equipment & supplies) | | | 393,500 | | | | 3,282 | |
| * | Weimob, Inc. (Software) | | | 1,348,000 | | | | 2,972 | |
| | WuXi AppTec Co., Ltd. Class “A” (Life sciences tools & services) | | | 311,436 | | | | 7,548 | |
| * | Wuxi Biologics Cayman, Inc. (Life sciences tools & services) | | | 1,482,500 | | | | 27,171 | |
| | | | | | | | | 302,920 | |
See accompanying Notes to Financial Statements.
| 42 | Semiannual Report | June 30, 2021 |
International Growth Fund
Portfolio of Investments, June 30, 2021 (all dollar amounts in thousands) (unaudited)
| | | | | | | | |
| | | | | | | | |
| | Issuer | | Shares | | | Value | |
| | | | | | | | | | |
| | Common Stocks—(continued) | | | | | | | | |
| | | | | | | | | | |
| | Emerging Asia—(continued) | | | | | | | | |
| | India—3.9% | | | | | | | | |
| | Crompton Greaves Consumer Electricals, Ltd. (Household durables) | | | 766,384 | | | $ | 4,472 | |
| | Dr. Lal PathLabs, Ltd. (Health care providers & services) | | | 142,034 | | | | 6,262 | |
| | Havells India, Ltd. (Electrical equipment) | | | 293,939 | | | | 3,875 | |
| | HDFC Bank, Ltd. (Banks) | | | 1,136,344 | | | | 22,886 | |
| | Info Edge India, Ltd. (Interactive Media & Services) | | | 63,087 | | | | 4,184 | |
| * | InterGlobe Aviation, Ltd. (Airlines) | | | 281,995 | | | | 6,532 | |
| | Ipca Laboratories, Ltd. (Pharmaceuticals) | | | 106,867 | | | | 2,916 | |
| * | Pidilite Industries, Ltd. (Chemicals) | | | 142,748 | | | | 4,137 | |
| | Reliance Industries, Ltd. (Oil, gas & consumable fuels) | | | 1,194,967 | | | | 33,579 | |
| | Voltas, Ltd. (Construction & engineering) | | | 246,034 | | | | 3,379 | |
| | | | | | | | | 92,222 | |
| | Indonesia—1.0% | | | | | | | | |
| | Bank Central Asia Tbk PT (Banks) | | | 11,549,100 | | | | 23,994 | |
| | South Korea—1.3% | | | | | | | | |
| | Kakao Corporation (Interactive Media & Services) | | | 123,548 | | | | 17,882 | |
| | Samsung SDI Co., Ltd. (Electronic equipment,instruments & components) | | | 19,596 | | | | 12,146 | |
| | | | | | | | | 30,028 | |
| | Taiwan—3.2% | | | | | | | | |
| | Airtac International Group (Machinery) | | | 125,000 | | | | 4,823 | |
| | ASMedia Technology, Inc. (Semiconductors & semiconductor equipment) | | | 59,000 | | | | 2,848 | |
| | Globalwafers Co., Ltd. (Semiconductors & semiconductor equipment) | | | 139,000 | | | | 4,585 | |
| | MediaTek, Inc. (Semiconductors & semiconductor equipment) | | | 737,000 | | | | 25,446 | |
| | Taiwan Semiconductor Manufacturing Co., Ltd.—ADR (Semiconductors &semiconductor equipment) | | | 310,395 | | | | 37,297 | |
| | | | | | | | | 74,999 | |
| | Thailand—1.0% | | | | | | | | |
| | Carabao Group PCL Class “F” (Beverages) | | | 712,500 | | | | 3,146 | |
| * | Sea, Ltd.—ADR (Entertainment) | | | 73,887 | | | | 20,289 | |
| | | | | | | | | 23,435 | |
| | | | | | | | | | |
| | United Kingdom—11.5% | | | | | | | | |
| | 3i Group plc (Capital markets) | | | 476,304 | | | | 7,729 | |
| | Ashtead Group plc (Trading companies & distributors) | | | 561,802 | | | | 41,686 | |
| | Avast plc (Software) | | | 1,188,280 | | | | 8,051 | |
| | AVEVA Group plc (Software) | | | 137,030 | | | | 7,029 | |
| | Big Yellow Group plc (Equity REIT) | | | 255,942 | | | | 4,627 | |
| * | boohoo Group plc (Internet & direct marketing retail) | | | 864,217 | | | | 3,711 | |
| * | Ceres Power Holdings plc (Electrical equipment) | | | 180,907 | | | | 2,645 | |
| * | Compass Group plc (Hotels, restaurants & leisure) | | | 1,209,212 | | | | 25,458 | |
| | | | | | | | |
| | | | | | | | |
| | Issuer | | Shares | | | Value | |
| | | | | | | | | | |
| | Common Stocks—(continued) | | | | | | | | |
| | | | | | | | | | |
| | United Kingdom—(continued) | | | | | | | | |
| | Croda International plc (Chemicals) | | | 179,226 | | | $ | 18,267 | |
| * | CVS Group plc (Health care providers & services) | | | 115,476 | | | | 3,858 | |
| | Diploma plc (Trading companies & distributors) | | | 127,849 | | | | 5,136 | |
| | Experian plc (Professional services) | | | 478,693 | | | | 18,448 | |
| | Halma plc (Electronic equipment, instruments & components) | | | 462,339 | | | | 17,217 | |
| | Intermediate Capital Group plc (Capital markets) | | | 368,581 | | | | 10,829 | |
| | Intertek Group plc (Professional services) | | | 110,867 | | | | 8,481 | |
| | London Stock Exchange Group plc (Capital markets) | | | 197,596 | | | | 21,785 | |
| | Renishaw plc (Electronic equipment, instruments & components) | | | 54,628 | | | | 3,722 | |
| | Rentokil Initial plc (Commercial services & supplies) | | | 1,837,201 | | | | 12,580 | |
| | Rotork plc (Machinery) | | | 1,823,991 | | | | 8,589 | |
| | Segro plc (Equity REIT) | | | 933,118 | | | | 14,128 | |
| | Softcat plc (IT services) | | | 186,480 | | | | 4,581 | |
| | Spirax-Sarco Engineering plc (Machinery) | | | 83,523 | | | | 15,730 | |
| * | Trainline plc (Hotels, restaurants & leisure) | | | 702,877 | | | | 2,855 | |
| * | Trustpilot Group plc (Interactive Media & Services) | | | 775,505 | | | | 3,662 | |
| | | | | | | | | 270,804 | |
| | | | | | | | | | |
| | Japan—9.2% | | | | | | | | |
| | Asahi Intecc Co., Ltd. (Health care equipment & supplies) | | | 254,500 | | | | 6,084 | |
| * | BASE, Inc. (IT services) | | | 236,800 | | | | 3,600 | |
| | Benefit One, Inc. (Professional services) | | | 172,400 | | | | 5,424 | |
| * | Bengo4.com, Inc. (Interactive Media & Services) | | | 29,900 | | | | 2,616 | |
| | Daikin Industries, Ltd. (Building products) | | | 110,400 | | | | 20,560 | |
| | Disco Corporation (Semiconductors & semiconductor equipment) | | | 10,900 | | | | 3,331 | |
| | Food & Life Cos., Ltd. (Hotels, restaurants & leisure) | | | 131,400 | | | | 5,671 | |
| | GMO Payment Gateway, Inc. (IT services) | | | 44,000 | | | | 5,731 | |
| | Harmonic Drive Systems, Inc. (Machinery) | | | 73,100 | | | | 4,027 | |
| | Hoya Corporation (Health care equipment & supplies) | | | 121,700 | | | | 16,136 | |
| | Keyence Corporation (Electronic equipment, instruments & components) | | | 47,600 | | | | 24,024 | |
| | M3, Inc. (Health care technology) | | | 183,900 | | | | 13,430 | |
| | MISUMI Group, Inc. (Machinery) | | | 187,300 | | | | 6,339 | |
| | MonotaRO Co., Ltd. (Trading companies & distributors) | | | 335,400 | | | | 7,940 | |
| | Nihon M&A Center, Inc. (Professional services) | | | 381,300 | | | | 9,888 | |
See accompanying Notes to Financial Statements.
| June 30, 2021 | William Blair Funds | 43 |
International Growth Fund
Portfolio of Investments, June 30, 2021 (all dollar amounts in thousands) (unaudited)
| | | | | | | | |
| | | | | | | | |
| | Issuer | | Shares | | | Value | |
| | | | | | | | | | |
| | Common Stocks—(continued) | | | | | | | | |
| | | | | | | | | | |
| | Japan—(continued) | | | | | | | | |
| | Olympus Corporation (Health care equipment & supplies) | | | 848,300 | | | $ | 16,860 | |
| | Omron Corporation (Electronic equipment, instruments & components) | | | 205,500 | | | | 16,296 | |
| | Rakus Co., Ltd. (Software) | | | 195,200 | | | | 5,333 | |
| * | SHIFT, Inc. (IT services) | | | 29,100 | | | | 4,508 | |
| | SMC Corporation (Machinery) | | | 43,400 | | | | 25,647 | |
| | TechnoPro Holdings, Inc. (Professional services) | | | 228,900 | | | | 5,415 | |
| | TIS, Inc. (IT services) | | | 312,600 | | | | 7,983 | |
| | | | | | | | | 216,843 | |
| | | | | | | | | | |
| | Asia—3.3% | | | | | | | | |
| | Australia—1.5% | | | | | | | | |
| | Aristocrat Leisure, Ltd. (Hotels, restaurants & leisure) | | | 405,474 | | | | 13,103 | |
| * | Atlassian Corporation plc Class “A” (Software)† | | | 57,763 | | | | 14,837 | |
| | Netwealth Group, Ltd. (Capital markets) | | | 297,447 | | | | 3,826 | |
| | Pro Medicus, Ltd. (Health care technology) | | | 98,105 | | | | 4,320 | |
| | | | | | | | | 36,086 | |
| | Hong Kong—1.8% | | | | | | | | |
| | AIA Group, Ltd. (Insurance) | | | 3,288,600 | | | | 40,873 | |
| | | | | | | | | | |
| | Canada—3.0% | | | | | | | | |
| * | Canada Goose Holdings, Inc. (Textiles, apparel & luxury goods) | | | 145,671 | | | | 6,372 | |
| | Canadian National Railway Co. (Road & rail) | | | 327,347 | | | | 34,538 | |
| | Enghouse Systems, Ltd. (Software) | | | 59,565 | | | | 2,652 | |
| * | Kinaxis, Inc. (Software) | | | 30,998 | | | | 4,078 | |
| * | Lululemon Athletica, Inc. (Textiles, apparel & luxury goods) | | | 49,944 | | | | 18,228 | |
| * | Nuvei Corporation (IT services) | | | 15,130 | | | | 1,238 | |
| | Toromont Industries, Ltd. (Trading companies & distributors) | | | 45,102 | | | | 3,930 | |
| | | | | | | | | 71,036 | |
| | | | | | | | | | |
| | Emerging Latin America—2.3% | | | | | | | | |
| | Argentina—0.8% | | | | | | | | |
| * | Globant S.A. (IT services)† | | | 27,916 | | | | 6,118 | |
| * | MercadoLibre, Inc. (Internet & direct marketing retail) | | | 8,971 | | | | 13,975 | |
| | | | | | | | | 20,093 | |
| | Brazil—1.2% | | | | | | | | |
| | B3 S.A. - Brasil Bolsa Balcao (Capital markets) | | | 2,327,700 | | | | 7,872 | |
| | Locaweb Servicos de Internet S.A. (IT services) | | | 1,489,293 | | | | 8,103 | |
| | Magazine Luiza S.A. (Multiline retail) | | | 1,727,100 | | | | 7,344 | |
| | Notre Dame Intermedica Participacoes S.A. (Health care providers & services) | | | 330,200 | | | | 5,638 | |
| | | | | | | | | 28,957 | |
| | Issuer | | Shares or
Principal
Amount | | | Value | |
| | | | | | | | |
| | Common Stocks—(continued) | | | | | | |
| | | | | | | | |
| | Emerging Latin America—(continued) |
| | Mexico—0.2% | | | | | | |
| * | Grupo Aeroportuario del Sureste S.A.B. de C.V.—ADR (Transportation infrastructure) | | | 23,134 | | | $ | 4,277 | |
| | Uruguay—0.1% | | | | | | | | |
| * | Dlocal, Ltd. (IT services)† | | | 33,408 | | | | 1,755 | |
| | | | | | | | | | |
| | Emerging Europe—1.0% | | | | | | | | |
| | Poland—0.5% | | | | | | | | |
| * | Allegro.eu S.A. (Internet & direct marketing retail) | | | 408,173 | | | | 7,025 | |
| * | InPost S.A. (Air freight & logistics) | | | 247,897 | | | | 4,975 | |
| | | | | | | | | 12,000 | |
| | Russia—0.5% | | | | | | | | |
| * | Yandex N.V. Class “A” (Interactive Media & Services)† | | | 164,137 | | | | 11,612 | |
| | Total Common Stocks—99.0%
(cost $1,340,147) | | | | | | | 2,329,153 | |
| | | | | | | | | | |
| | Repurchase Agreement | | | | | | | | |
| | Fixed Income Clearing Corporation, 0.000% dated 6/30/21, due 7/1/21, repurchase price $14,005, collateralized by U.S. Treasury Bond, 1.875%,due 2/15/41, valued at $14,285 | | | $14,005 | | | | 14,005 | |
| | Total Repurchase Agreement—0.6%
(cost $14,005) | | | | | | | 14,005 | |
| | Total Investments—99.6%
(cost $1,354,152) | | | | | | | 2,343,158 | |
| | Cash and other assets, less liabilities—0.4% | | | | | | | 9,372 | |
| | Net assets—100.0% | | | | | | $ | 2,352,530 | |
ADR = American Depository Receipt
REIT = Real Estate Investment Trust
* = Non-income producing security
† = U.S. listed foreign security
See accompanying Notes to Financial Statements.
| 44 | Semiannual Report | June 30, 2021 |
International Growth Fund
Portfolio of Investments, June 30, 2021 (unaudited)
At June 30, 2021, the Fund’s Portfolio of Investments includes the following industry categories (as a percentage of long-term investments):
| Industrials | | | 26.5 | % |
| Information Technology | | | 20.5 | % |
| Consumer Discretionary | | | 14.6 | % |
| Health Care | | | 13.9 | % |
| Financials | | | 8.6 | % |
| Communication Services | | | 5.0 | % |
| Materials | | | 3.0 | % |
| Energy | | | 2.6 | % |
| Consumer Staples | | | 2.6 | % |
| Real Estate | | | 1.6 | % |
| Utilities | | | 1.1 | % |
| Total | | | 100.0 | % |
At June 30, 2021, the Fund’s Portfolio of Investments includes the following currency categories (as a percentage of long-term investments):
| Euro | | | 25.7 | % |
| British Pound Sterling | | | 11.6 | % |
| Hong Kong Dollar | | | 10.4 | % |
| Japanese Yen | | | 9.3 | % |
| U.S. Dollar | | | 8.5 | % |
| Swiss Franc | | | 7.0 | % |
| Swedish Krona | | | 6.2 | % |
| Danish Krone | | | 4.1 | % |
| Indian Rupee | | | 4.0 | % |
| Chinese Yuan Renminbi | | | 3.9 | % |
| Canadian Dollar | | | 2.0 | % |
| New Taiwan Dollar | | | 1.8 | % |
| South Korean Won | | | 1.3 | % |
| Brazilian Real | | | 1.2 | % |
| Indonesian Rupiah | | | 1.0 | % |
| All Other Currencies | | | 2.0 | % |
| Total | | | 100.0 | % |
See accompanying Notes to Financial Statements.
| June 30, 2021 | William Blair Funds | 45 |
| | Institutional International Growth Fund |
| | |
| | The Institutional International Growth Fund seeks long-term capital appreciation. |
| | |
| | AN OVERVIEW FROM THE PORTFOLIO MANAGERS |
| | |

Simon Fennell 
Kenneth J. McAtamney | The William Blair Institutional International Growth Fund posted a 8.49% increase, net of fees, for the six months ended June 30, 2021. By comparison, the Fund’s benchmark index, the MSCI All Country World ex-U.S. IMI (net) (the “Index”), increased 9.58%. Six-month underperformance versus the Index was primarily driven by negative stock selection across most sectors. Stock selection within the Financials sector was particularly weak, as Ping An Insurance and Bank Central Asia weighed on relative performance in the period. Ping An is the largest insurance company by market cap globally and the leading life insurance in what we expect will be the largest market (by size and growth) for life insurance over the next decade. Although Ping An remains firmly in the expanding growth phase of its corporate lifecycle, its breadth of services propels it into a different category, and closer to becoming a dominant technology-powered retail financial services group. It has developed a broad ecosystem comprising over 6oo million internet users and over 220 million retail customers. Ping An continues to improve its cross-sell of products from other parts of the group, which increases income without incurring the cost of acquiring new clients. While recent results have been below average due to COVID-19, we believe it will revert to its previous growth trajectory as the economy recovers. Partially offsetting these effects was positive stock selection within the Health Care and Communication Services sectors. Within Health Care, Wuxi Biologics and Lonza added to relative returns. Wuxi Biologics is a contract development and manufacturing organization (CDMO) that offers a full range of research and manufacturing services for biologic drugs. The services are designed to help clients improve research and development efficiency, shorten development timelines and lower costs. Importantly, Wuxi is the only company offering comprehensive CDMO services for biologics in China. As a result, Wuxi is the domestic market leader with approximately 50% market share. Supporting Wuxi’s growth profile is strong demand for biologics outsourcing services worldwide. We believe Wuxi’s strong execution and favorable market dynamics will generate strong earnings growth for the foreseeable future. Lonza is a leader in custom manufacturing of biopharmaceuticals and specialty ingredients. Lonza offers highly visible growth and given the strong market demand for outsourced biopharma production and related services, we remain confident it can deliver on growth in the future. Within Communication Services, Kakao boosted relative returns. Kakao is a South Korean online platform. It operates KakaoTalk, the largest mobile messaging app, and Daum, the second largest web portal. Other businesses include ride-hailing, music streaming, and financial services businesses with Kakao Pay and Kakao Bank. We believe Kakao will sustain its position as one of the most dominant tech companies in South Korea, given the strong market position, management execution, business development, and potential to drive synergies and capture sustained value around its various platform, content, and new businesses. Please refer to the Global Markets Review and Outlook relating to the Fund beginning on page 29. |
| 46 | Semiannual Report | June 30, 2021 |
Institutional International Growth Fund
Performance Highlights (Unaudited)
| Average Annual Total Returns through 6/30/2021 |
| | | Year
to Date | | 1 Year | | 3 Year | | 5 Year | | 10 Year |
| Institutional International Growth Fund | | | 8.49 | % | | | 42.73 | % | | | 16.36 | % | | | 15.24 | % | | | 9.06 | % |
| MSCI ACW Ex-U.S. IMI (net) | | | 9.58 | | | | 37.18 | | | | 9.42 | | | | 11.20 | | | | 5.65 | |
Performance cited represents past performance. Past performance does not guarantee future results and current performance may be lower or higher than the data quoted. Results shown are average annual total returns, which assume reinvestment of dividends and capital gains. Investment returns and principal will fluctuate and you may have a gain or loss when you sell shares. For the most current month-end performance information, please call 1-800-742-7272, or visit our Web site at www.williamblairfunds.com. From time to time, the investment adviser may waive fees or reimburse expenses for the Fund. Without these waivers/reimbursements, performance would be lower. Investing in smaller and medium capitalization companies involves special risks, including higher volatility and lower liquidity. Smaller and medium capitalization stocks are also more sensitive to purchase/sale transactions and changes in the issuer’s financial condition. International investing involves special risk considerations, including currency fluctuations, lower liquidity, economic and political risk. Shares of the Fund are not subject to a sales load, distribution (Rule 12b-1) fees, or sub-transfer agent fees.
The performance highlights and graph presented above do not reflect the deduction of taxes that a shareholder would pay on fund distributions or the redemption of fund shares.
The Morgan Stanley Capital International (MSCI) All Country World (ACW) Ex-U.S. Investable Market Index (IMI) (net) is a free float-adjusted market capitalization weighted index that is designed to measure the equity market performance of developed and emerging markets, excluding the United States. This index approximates the minimum possible dividend reinvestment by deducting for the highest possible withholding tax rates of those markets.
This report identifies the Fund’s investments on June 30, 2021. These holdings are subject to change. Not all stocks in the Fund performed the same, nor is there any guarantee that these stocks will perform as well in the future. Market forecasts provided in this report may not necessarily come to pass.
Sector Diversification (Unaudited)

The sector diversification shown is based on the total long-term securities.
| June 30, 2021 | William Blair Funds | 47 |
Institutional International Growth Fund
Portfolio of Investments, June 30, 2021 (all dollar amounts in thousands) (unaudited)
| | | | | | | | |
| | | | | | | | |
| | Issuer | | Shares | | | Value | |
| | |
| | Common Stocks | | | | | | | | |
| | | | | | | | | | |
| | Europe, Mid-East—45.3% | | | | | | | | |
| | Belgium—0.3% | | | | | | | | |
| | Warehouses De Pauw CVA (Equity REIT) | | | 93,950 | | | $ | 3,587 | |
| | Denmark—4.1% | | | | | | | | |
| | Chr Hansen Holding A/S (Chemicals) | | | 37,641 | | | | 3,397 | |
| | Coloplast A/S Class “B” (Health care equipment & supplies) | | | 32,790 | | | | 5,380 | |
| | DSV PANALPINA A/S (Air freight & logistics) | | | 100,745 | | | | 23,495 | |
| * | Genmab A/S (Biotechnology) | | | 20,708 | | | | 8,473 | |
| | Netcompany Group A/S (Software) | | | 28,737 | | | | 3,265 | |
| | Orsted A/S (Electric utilities) | | | 47,343 | | | | 6,643 | |
| | Royal Unibrew A/S (Beverages) | | | 21,776 | | | | 2,774 | |
| | | | | | | | | 53,427 | |
| | Finland—0.9% | | | | | | | | |
| | Neste Oyj (Oil, gas & consumable fuels) | | | 197,740 | | | | 12,108 | |
| | France—10.4% | | | | | | | | |
| * | Airbus SE (Aerospace & defense) | | | 172,817 | | | | 22,221 | |
| | Dassault Systemes SE (Software) | | | 43,297 | | | | 10,499 | |
| | Hermes International (Textiles, apparel & luxury goods) | | | 4,524 | | | | 6,590 | |
| | Kering S.A. (Textiles, apparel & luxury goods) | | | 20,286 | | | | 17,728 | |
| | L’Oreal S.A. (Personal products) | | | 30,286 | | | | 13,496 | |
| | LVMH Moet Hennessy Louis Vuitton SE (Textiles, apparel & luxury goods) | | | 27,872 | | | | 21,855 | |
| | Safran S.A. (Aerospace & defense) | | | 106,101 | | | | 14,710 | |
| | Sartorius Stedim Biotech (Life sciences tools & services) | | | 19,056 | | | | 9,013 | |
| | Teleperformance (Professional services) | | | 40,442 | | | | 16,415 | |
| * | Worldline S.A. (IT services) | | | 55,808 | | | | 5,224 | |
| | | | | | | | | 137,751 | |
| | Germany—5.9% | | | | | | | | |
| | Carl Zeiss Meditec AG (Health care equipment & supplies) | | | 31,005 | | | | 5,991 | |
| | CompuGroup Medical SE & Co. KgaA (Health care technology) | | | 32,662 | | | | 2,558 | |
| * | CTS Eventim AG & Co. KGaA (Entertainment) | | | 53,404 | | | | 3,337 | |
| * | HelloFresh SE (Internet & direct marketing retail) | | | 77,872 | | | | 7,570 | |
| * | Hypoport SE (Diversified financial services) | | | 3,624 | | | | 1,873 | |
| | Infineon Technologies AG (Semiconductors & semiconductor equipment) | | | 326,910 | | | | 13,110 | |
| | KION Group AG (Machinery) | | | 47,693 | | | | 5,083 | |
| | MTU Aero Engines AG (Aerospace & defense) | | | 69,438 | | | | 17,200 | |
| | Nemetschek SE (Software) | | | 27,739 | | | | 2,122 | |
| | Puma SE (Textiles, apparel & luxury goods) | | | 83,100 | | | | 9,908 | |
| * | TeamViewer AG (Software) | | | 56,435 | | | | 2,123 | |
| | Vonovia SE (Real estate management & development) | | | 104,344 | | | | 6,745 | |
| | | | | | | | | 77,620 | |
| | | | | | | | |
| | | | | | | | |
| | Issuer | | Shares | | | Value | |
| | |
| | Common Stocks—(continued) | | | | | | | | |
| | | | | | | | | | |
| | Europe, Mid-East—(continued) | | | | | | | | |
| | Ireland—2.1% | | | | | | | | |
| * | ICON plc (Life sciences tools &services)† | | | 44,981 | | | $ | 9,298 | |
| | Kingspan Group plc (Building products) | | | 99,362 | | | | 9,383 | |
| * | Ryanair Holdings plc—ADR (Airlines) | | | 84,288 | | | | 9,121 | |
| | | | | | | | | 27,802 | |
| | Israel—1.0% | | | | | | | | |
| * | Inmode, Ltd. (Health care equipment & supplies)† | | | 28,864 | | | | 2,733 | |
| * | Nice, Ltd.—ADR (Software) | | | 11,129 | | | | 2,754 | |
| * | Wix.com, Ltd. (IT services)† | | | 26,314 | | | | 7,638 | |
| | | | | | | | | 13,125 | |
| | Italy—0.7% | | | | | | | | |
| | Amplifon SpA (Health care providers & services) | | | 70,532 | | | | 3,482 | |
| * | Brunello Cucinelli SpA (Textiles, apparel & luxury goods) | | | 41,468 | | | | 2,425 | |
| | Moncler SpA (Textiles, apparel & luxury goods) | | | 50,576 | | | | 3,422 | |
| | | | | | | | | 9,329 | |
| | Luxembourg—0.9% | | | | | | | | |
| * | Eurofins Scientific SE (Life sciences tools & services) | | | 77,841 | | | | 8,898 | |
| | Tenaris S.A. (Energy equipment & services) | | | 272,119 | | | | 2,966 | |
| | | | | | | | | 11,864 | |
| | Netherlands—3.7% | | | | | | | | |
| * | Adyen N.V. (IT services) | | | 5,767 | | | | 14,090 | |
| | ASML Holding N.V. (Semiconductors & semiconductor equipment) | | | 37,646 | | | | 25,864 | |
| | BE Semiconductor Industries N.V. (Semiconductors & semiconductor equipment) | | | 25,251 | | | | 2,142 | |
| | Euronext N.V. (Capital markets) | | | 31,957 | | | | 3,475 | |
| | IMCD N.V. (Trading companies & distributors) | | | 22,082 | | | | 3,511 | |
| | | | | | | | | 49,082 | |
| | Norway—0.7% | | | | | | | | |
| * | Pexip Holding ASA (Software) | | | 151,666 | | | | 1,355 | |
| | Scatec ASA (Independent power &renewable electricity producers) | | | 74,415 | | | | 1,970 | |
| | TOMRA Systems ASA (Commercial services & supplies) | | | 99,665 | | | | 5,498 | |
| | | | | | | | | 8,823 | |
| | Spain—1.6% | | | | | | | | |
| * | Amadeus IT Group S.A. (IT services) | | | 223,619 | | | | 15,729 | |
| | EDP Renovaveis S.A. (Independent power & renewable electricity producers) | | | 199,760 | | | | 4,628 | |
| * | Solaria Energia y Medio Ambiente S.A. (Independent power & renewable electricity producers) | | | 78,273 | | | | 1,415 | |
| | | | | | | | | 21,772 | |
See accompanying Notes to Financial Statements.
| 48 | Semiannual Report | June 30, 2021 |
Institutional International Growth Fund
Portfolio of Investments, June 30, 2021 (all dollar amounts in thousands) (unaudited)
| | | | | | | | |
| | | | | | | | |
| | Issuer | | Shares | | | Value | |
| | |
| | Common Stocks—(continued) | | | | | | | | |
| | | | | | | | | | |
| | Europe, Mid-East—(continued) | | | | | | | | |
| | Sweden—6.1% | | | | | | | | |
| | AddTech AB Class “B” (Trading companies & distributors) | | | 124,344 | | | $ | 2,063 | |
| | Atlas Copco AB Class “A” (Machinery) | | | 360,692 | | | | 22,085 | |
| | Beijer Ref AB (Trading companies & distributors) | | | 183,269 | | | | 3,266 | |
| | Evolution Gaming Group AB (Hotels, restaurants & leisure) | | | 68,184 | | | | 10,775 | |
| | Hexagon AB Class “B” (Electronic equipment, instruments &components) | | | 998,618 | | | | 14,796 | |
| | Indutrade AB (Machinery) | | | 198,749 | | | | 5,086 | |
| | Investment AB Latour Class “B” (Industrial conglomerates) | | | 122,022 | | | | 4,004 | |
| | Lifco AB Class “B” (Industrial conglomerates) | | | 155,945 | | | | 3,644 | |
| | Nibe Industrier AB Class “B” (Building products) | | | 492,272 | | | | 5,178 | |
| | Nolato AB Class “B” (Industrial conglomerates) | | | 273,996 | | | | 2,696 | |
| | Sweco AB Class “B” (Construction & engineering) | | | 123,702 | | | | 2,250 | |
| | Thule Group AB (Leisure products) | | | 55,086 | | | | 2,442 | |
| | Vitrolife AB (Biotechnology) | | | 50,783 | | | | 2,110 | |
| | | | | | | | | 80,395 | |
| | Switzerland—6.9% | | | | | | | | |
| | Belimo Holding AG (Building products) | | | 5,225 | | | | 2,389 | |
| | Logitech International S.A. (Technology hardware, storage & peripherals) | | | 23,895 | | | | 2,895 | |
| | Lonza Group AG (Life sciences tools & services) | | | 22,877 | | | | 16,215 | |
| | Partners Group Holding AG (Capital markets) | | | 10,325 | | | | 15,640 | |
| | Siegfried Holding AG (Life sciences tools & services)* | | | 3,387 | | | | 3,176 | |
| | SIG Combibloc Group AG (Containers & packaging)* | | | 155,326 | | | | 4,220 | |
| | Sika AG (Chemicals) | | | 59,372 | | | | 19,411 | |
| | Softwareone Holding AG (Electronic equipment, instruments & components)* | | | 76,773 | | | | 1,813 | |
| | Straumann Holding AG (Health care equipment & supplies) | | | 7,114 | | | | 11,341 | |
| | Tecan Group AG (Life sciences tools & services) | | | 7,134 | | | | 3,534 | |
| | Temenos AG (Software) | | | 25,179 | | | | 4,044 | |
| | VAT Group AG (Machinery) | | | 13,148 | | | | 4,371 | |
| * | Zur Rose Group AG (Food & staples retailing) | | | 5,273 | | | | 2,020 | |
| | | | | | | | | 91,069 | |
| | | | | | | | |
| | | | | | | | |
| | Issuer | | Shares | | | Value | |
| | |
| | Common Stocks—(continued) | | | | | | | | |
| | | | | | | | | | |
| | Emerging Asia—23.3% | | | | | | | | |
| | China—12.9% | | | | | | | | |
| | A-Living Smart City Services Co., Ltd. (Commercial services & supplies) | | | 670,250 | | | $ | 3,336 | |
| | Aier Eye Hospital Group Co., Ltd. Class “A” (Health care providers & services) | | | 660,127 | | | | 7,252 | |
| | AK Medical Holdings, Ltd. (Health care equipment & supplies) | | | 422,000 | | | | 745 | |
| * | Alibaba Group Holding, Ltd. (Internet &direct marketing retail) | | | 570,000 | | | | 16,151 | |
| * | Alibaba Health Information Technology, Ltd. (Health care technology) | | | 854,000 | | | | 1,894 | |
| | Centre Testing International Group Co., Ltd. Class “A” (Professional services) | | | 762,700 | | | | 3,763 | |
| | Chacha Food Co., Ltd. Class “A” (Food products) | | | 233,400 | | | | 1,557 | |
| | Country Garden Services Holdings Co., Ltd. (Commercial services & supplies) | | | 452,000 | | | | 4,884 | |
| | Foshan Haitian Flavouring & Food Co., Ltd. Class “A” (Food products) | | | 214,612 | | | | 4,283 | |
| | Hangzhou Tigermed Consulting Co., Ltd. Class “A” (Life sciences tools & services) | | | 187,100 | | | | 5,597 | |
| * | JD.com, Inc. Class “A” (Internet & direct marketing retail) | | | 165,650 | | | | 6,516 | |
| | Kweichow Moutai Co., Ltd. Class “A” (Beverages) | | | 15,317 | | | | 4,875 | |
| | Li Ning Co., Ltd. (Textiles, apparel &luxury goods) | | | 1,084,500 | | | | 13,241 | |
| * | Meituan Class “B” (Internet & direct marketing retail) | | | 180,700 | | | | 7,457 | |
| | NAURA Technology Group Co., Ltd. Class “A” (Semiconductors & semiconductor equipment)* | | | 89,000 | | | | 3,821 | |
| | NetEase, Inc. (Entertainment) | | | 370,400 | | | | 8,391 | |
| | Offcn Education Technology Co., Ltd. Class “A” (Diversified consumer services) | | | 473,700 | | | | 1,532 | |
| | Ping An Insurance Group Co. of China, Ltd. Class “H” (Insurance) | | | 1,359,500 | | | | 13,316 | |
| | Proya Cosmetics Co., Ltd. Class “A” (Personal products) | | | 88,500 | | | | 2,694 | |
| | Shenzhen Mindray Bio-Medical Electronics Co., Ltd. Class “A” (Health care equipment & supplies) | | | 65,200 | | | | 4,844 | |
| | Silergy Corporation (Semiconductors & semiconductor equipment) | | | 18,000 | | | | 2,448 | |
| * | TAL Education Group—ADR (Diversified consumer services) | | | 95,456 | | | | 2,408 | |
| | Tencent Holdings, Ltd. (Interactive Media & Services) | | | 240,500 | | | | 18,089 | |
| * | Tencent Music Entertainment Group—ADR (Entertainment) | | | 124,068 | | | | 1,921 | |
| * | Topchoice Medical Corporation Class “A” (Health care providers & services) | | | 89,200 | | | | 5,674 | |
See accompanying Notes to Financial Statements.
| June 30, 2021 | William Blair Funds | 49 |
Institutional International Growth Fund
Portfolio of Investments, June 30, 2021 (all dollar amounts in thousands) (unaudited)
| | | | | | | | |
| | | | | | | | |
| | Issuer | | Shares | | | Value | |
| | |
| | Common Stocks—(continued) | | | | | | | | |
| | | | | | | | | | |
| | Emerging Asia—(continued) | | | | | | | | |
| | China—(continued) | | | | | | | | |
| * | Venus MedTech Hangzhou, Inc. Class “H” (Health care equipment & supplies) | | | 220,500 | | | $ | 1,839 | |
| * | Weimob, Inc. (Software) | | | 755,000 | | | | 1,665 | |
| | WuXi AppTec Co., Ltd. Class “A” (Life sciences tools & services) | | | 174,456 | | | | 4,228 | |
| * | Wuxi Biologics Cayman, Inc. (Life sciences tools & services) | | | 830,500 | | | | 15,221 | |
| | | | | | | | | 169,642 | |
| | India—3.9% | | | | | | | | |
| | Crompton Greaves Consumer Electricals, Ltd. (Household durables) | | | 429,278 | | | | 2,505 | |
| | Dr. Lal PathLabs, Ltd. (Health care providers & services) | | | 79,558 | | | | 3,507 | |
| | Havells India, Ltd. (Electrical equipment) | | | 164,645 | | | | 2,171 | |
| | HDFC Bank, Ltd. (Banks) | | | 636,506 | | | | 12,819 | |
| | Info Edge India, Ltd. (Interactive Media & Services) | | | 35,337 | | | | 2,344 | |
| * | InterGlobe Aviation, Ltd. (Airlines) | | | 157,955 | | | | 3,659 | |
| | Ipca Laboratories, Ltd. (Pharmaceuticals) | | | 59,860 | | | | 1,633 | |
| * | Pidilite Industries, Ltd. (Chemicals) | | | 79,958 | | | | 2,318 | |
| | Reliance Industries, Ltd. (Oil, gas &consumable fuels) | | | 669,208 | | | | 18,806 | |
| | Voltas, Ltd. (Construction & engineering) | | | 138,355 | | | | 1,900 | |
| | | | | | | | | 51,662 | |
| | Indonesia—1.0% | | | | | | | | |
| | Bank Central Asia Tbk PT (Banks) | | | 6,469,106 | | | | 13,440 | |
| | South Korea—1.3% | | | | | | | | |
| | Kakao Corporation (Interactive Media & Services) | | | 69,204 | | | | 10,017 | |
| | Samsung SDI Co., Ltd. (Electronic equipment, instruments & components) | | | 10,976 | | | | 6,803 | |
| | | | | | | | | 16,820 | |
| | Taiwan—3.2% | | | | | | | | |
| | Airtac International Group (Machinery) | | | 70,000 | | | | 2,701 | |
| | ASMedia Technology, Inc. (Semiconductors & semiconductor equipment) | | | 33,000 | | | | 1,593 | |
| | Globalwafers Co., Ltd. (Semiconductors & semiconductor equipment) | | | 78,000 | | | | 2,573 | |
| | MediaTek, Inc. (Semiconductors & semiconductor equipment) | | | 413,000 | | | | 14,259 | |
| | Taiwan Semiconductor Manufacturing Co., Ltd.—ADR (Semiconductors & semiconductor equipment) | | | 173,863 | | | | 20,891 | |
| | | | | | | | | 42,017 | |
| | Thailand—1.0% | | | | | | | | |
| | Carabao Group PCL Class “F” (Beverages) | | | 399,100 | | | | 1,762 | |
| * | Sea, Ltd.—ADR (Entertainment) | | | 41,387 | | | | 11,365 | |
| | | | | | | | | 13,127 | |
| | | | | | | | |
| | | | | | | | |
| | Issuer | | Shares | | | Value | |
| | |
| | Common Stocks—(continued) | | | | | | | | |
| | | | | | | | | | |
| | United Kingdom—11.5% | | | | | | | | |
| | 3i Group plc (Capital markets) | | | 266,795 | | | $ | 4,329 | |
| | Ashtead Group plc (Trading companies & distributors) | | | 314,685 | | | | 23,350 | |
| | Avast plc (Software) | | | 665,597 | | | | 4,510 | |
| | AVEVA Group plc (Software) | | | 76,755 | | | | 3,937 | |
| | Big Yellow Group plc (Equity REIT) | | | 143,362 | | | | 2,592 | |
| * | boohoo Group plc (Internet & direct marketing retail) | | | 484,078 | | | | 2,079 | |
| * | Ceres Power Holdings plc (Electrical equipment) | | | 101,332 | | | | 1,482 | |
| * | Compass Group plc (Hotels, restaurants & leisure) | | | 677,322 | | | | 14,260 | |
| | Croda International plc (Chemicals) | | | 100,391 | | | | 10,232 | |
| * | CVS Group plc (Health care providers & services) | | | 64,610 | | | | 2,158 | |
| | Diploma plc (Trading companies & distributors) | | | 71,613 | | | | 2,877 | |
| | Experian plc (Professional services) | | | 268,132 | | | | 10,333 | |
| | Halma plc (Electronic equipment, instruments & components) | | | 258,972 | | | | 9,644 | |
| | Intermediate Capital Group plc (Capital markets) | | | 206,455 | | | | 6,066 | |
| | Intertek Group plc (Professional services) | | | 62,101 | | | | 4,751 | |
| | London Stock Exchange Group plc (Capital markets) | | | 110,680 | | | | 12,202 | |
| | Renishaw plc (Electronic equipment, instruments & components) | | | 30,599 | | | | 2,085 | |
| | Rentokil Initial plc (Commercial services & supplies) | | | 1,029,080 | | | | 7,046 | |
| | Rotork plc (Machinery) | | | 1,021,681 | | | | 4,811 | |
| | Segro plc (Equity REIT) | | | 522,672 | | | | 7,913 | |
| | Softcat plc (IT services) | | | 104,454 | | | | 2,566 | |
| | Spirax-Sarco Engineering plc (Machinery) | | | 46,784 | | | | 8,811 | |
| * | Trainline plc (Hotels, restaurants & leisure) | | | 393,706 | | | | 1,599 | |
| * | Trustpilot Group plc (Interactive Media & Services) | | | 434,387 | | | | 2,051 | |
| | | | | | | | | 151,684 | |
| | |
| | Japan—9.2% | | | | | | | | |
| | Asahi Intecc Co., Ltd. (Health care equipment & supplies) | | | 142,500 | | | | 3,407 | |
| * | BASE, Inc. (IT services) | | | 132,700 | | | | 2,017 | |
| | Benefit One, Inc. (Professional services) | | | 96,600 | | | | 3,039 | |
| * | Bengo4.com, Inc. (Interactive Media & Services) | | | 16,900 | | | | 1,479 | |
| | Daikin Industries, Ltd. (Building products) | | | 61,800 | | | | 11,509 | |
| | Disco Corporation (Semiconductors & semiconductor equipment) | | | 6,100 | | | | 1,864 | |
| | Food & Life Cos., Ltd. (Hotels, restaurants & leisure) | | | 73,600 | | | | 3,177 | |
| | GMO Payment Gateway, Inc. (IT services) | | | 24,600 | | | | 3,204 | |
See accompanying Notes to Financial Statements.
| 50 | Semiannual Report | June 30, 2021 |
Institutional International Growth Fund
Portfolio of Investments, June 30, 2021 (all dollar amounts in thousands) (unaudited)
| | | | | | | | |
| | | | | | | | |
| | Issuer | | Shares | | | Value | |
| | |
| | Common Stocks—(continued) | | | | | | | | |
| | | | | | | | | | |
| | Japan—(continued) | | | | | | | | |
| | Harmonic Drive Systems, Inc. (Machinery) | | | 41,000 | | | $ | 2,259 | |
| | Hoya Corporation (Health care equipment & supplies) | | | 68,200 | | | | 9,043 | |
| | Keyence Corporation (Electronic equipment, instruments & components) | | | 26,600 | | | | 13,425 | |
| | M3, Inc. (Health care technology) | | | 103,000 | | | | 7,522 | |
| | MISUMI Group, Inc. (Machinery) | | | 104,900 | | | | 3,550 | |
| | MonotaRO Co., Ltd. (Trading companies & distributors) | | | 187,800 | | | | 4,446 | |
| | Nihon M&A Center, Inc. (Professional services) | | | 213,600 | | | | 5,539 | |
| | Olympus Corporation (Health care equipment & supplies) | | | 475,200 | | | | 9,444 | |
| | Omron Corporation (Electronic equipment, instruments & components) | | | 115,100 | | | | 9,128 | |
| | Rakus Co., Ltd. (Software) | | | 109,400 | | | | 2,989 | |
| * | SHIFT, Inc. (IT services) | | | 16,300 | | | | 2,525 | |
| | SMC Corporation (Machinery) | | | 24,300 | | | | 14,360 | |
| | TechnoPro Holdings, Inc. (Professional services) | | | 128,100 | | | | 3,030 | |
| | TIS, Inc. (IT services) | | | 175,100 | | | | 4,471 | |
| | | | | | | | | 121,427 | |
| | Asia—3.3% | | | | | | | | |
| | Australia—1.5% | | | | | | | | |
| | Aristocrat Leisure, Ltd. (Hotels, restaurants & leisure) | | | 227,120 | | | | 7,339 | |
| * | Atlassian Corporation plc Class “A” (Software)† | | | 32,355 | | | | 8,311 | |
| | Netwealth Group, Ltd. (Capital markets) | | | 166,610 | | | | 2,143 | |
| | Pro Medicus, Ltd. (Health care technology) | | | 54,952 | | | | 2,420 | |
| | | | | | | | | 20,213 | |
| | Hong Kong—1.8% | | | | | | | | |
| | AIA Group, Ltd. (Insurance) | | | 1,842,063 | | | | 22,895 | |
| | |
| | Canada—3.0% | | | | | | | | |
| * | Canada Goose Holdings, Inc. (Textiles, apparel & luxury goods)† | | | 81,595 | | | | 3,569 | |
| | Canadian National Railway Co. (Road & rail) | | | 183,359 | | | | 19,346 | |
| | Enghouse Systems, Ltd. (Software) | | | 33,590 | | | | 1,496 | |
| * | Kinaxis, Inc. (Software) | | | 17,363 | | | | 2,284 | |
| * | Lululemon Athletica, Inc. (Textiles, apparel & luxury goods) | | | 27,976 | | | | 10,210 | |
| * | Nuvei Corporation (IT services) | | | 8,467 | | | | 693 | |
| | Toromont Industries, Ltd. (Trading companies & distributors) | | | 25,263 | | | | 2,201 | |
| | | | | | | | | 39,799 | |
| | Issuer | | Share or
Principal
Amount | | | Value | |
| | |
| | Common Stocks—(continued) | | | | | | | | |
| | | | | | | | | | |
| | Emerging Latin America—2.3% | | | | | | | | |
| | Argentina—0.8% | | | | | | | | |
| * | Globant S.A. (IT services)† | | | 15,637 | | | $ | 3,427 | |
| * | MercadoLibre, Inc. (Internet & direct marketing retail) | | | 5,025 | | | | 7,828 | |
| | | | | | | | | 11,255 | |
| | Brazil—1.2% | | | | | | | | |
| | B3 S.A. - Brasil Bolsa Balcao (Capital markets) | | | 1,303,800 | | | | 4,409 | |
| | Locaweb Servicos de Internet S.A. (IT services) | | | 834,186 | | | | 4,538 | |
| | Magazine Luiza S.A. (Multiline retail) | | | 967,400 | | | | 4,114 | |
| | Notre Dame Intermedica Participacoes S.A. (Health care providers & services) | | | 185,000 | | | | 3,159 | |
| | | | | | | | | 16,220 | |
| | Mexico—0.2% | | | | | | | | |
| * | Grupo Aeroportuario del Sureste S.A.B. de C.V.—ADR (Transportation infrastructure) | | | 12,958 | | | | 2,396 | |
| | Uruguay—0.1% | | | | | | | | |
| | *Dlocal, Ltd. (IT services)† | | | 18,633 | | | | 979 | |
| | |
| | Emerging Europe—1.0% | | | | | | | | |
| | Poland—0.5% | | | | | | | | |
| * | Allegro.eu S.A. (Internet & direct marketing retail) | | | 228,632 | | | | 3,934 | |
| * | InPost S.A. (Air freight & logistics) | | | 138,856 | | | | 2,787 | |
| | | | | | | | | 6,721 | |
| | Russia—0.5% | | | | | | | | |
| * | Yandex N.V. Class “A” (Interactive Media & Services)† | | | 91,939 | | | | 6,505 | |
| | Total Common Stocks—98.9%
(cost $746,376) | | | | | | | 1,304,556 | |
| | |
| | Repurchase Agreement | | | | | | | | |
| | Fixed Income Clearing Corporation, 0.000% dated 6/30/21, due 7/1/21, repurchase price $7,763, collateralized by U.S. Treasury Bond, 1.875%, due 2/15/41, valued at $7,918 | | | $7,763 | | | | 7,763 | |
| | Total Repurchase Agreement—0.6%
(cost $7,763) | | | | | | | 7,763 | |
| | Total Investments—99.5%
(cost $754,139) | | | | | | | 1,312,319 | |
| | Cash and other assets, less liabilities—0.5% | | | | | | | 6,488 | |
| | Net assets—100.0% | | | | | | $ | 1,318,807 | |
ADR = American Depository Receipt
REIT = Real Estate Investment Trust
* = Non-income producing security
† = U.S. listed foreign security
See accompanying Notes to Financial Statements.
| June 30, 2021 | William Blair Funds | 51 |
Institutional International Growth Fund
Portfolio of Investments, June 30, 2021 (unaudited)
At June 30, 2021, the Fund’s Portfolio of Investments includes the following industry categories (as a percentage of long-term investments):
| Industrials | | | 26.5 | % |
| Information Technology | | | 20.5 | % |
| Consumer Discretionary | | | 14.6 | % |
| Health Care | | | 13.9 | % |
| Financials | | | 8.6 | % |
| Communication Services | | | 5.0 | % |
| Materials | | | 3.0 | % |
| Energy | | | 2.6 | % |
| Consumer Staples | | | 2.6 | % |
| Real Estate | | | 1.6 | % |
| Utilities | | | 1.1 | % |
| Total | | | 100.0 | % |
At June 30, 2021, the Fund’s Portfolio of Investments includes the following currency categories (as a percentage of long-term investments):
| Euro | | | 25.7 | % |
| British Pound Sterling | | | 11.6 | % |
| Hong Kong Dollar | | | 10.4 | % |
| Japanese Yen | | | 9.3 | % |
| U.S. Dollar | | | 8.5 | % |
| Swiss Franc | | | 7.0 | % |
| Swedish Krona | | | 6.2 | % |
| Danish Krone | | | 4.1 | % |
| Indian Rupee | | | 4.0 | % |
| Chinese Yuan Renminbi | | | 3.8 | % |
| Canadian Dollar | | | 2.0 | % |
| New Taiwan Dollar | | | 1.8 | % |
| South Korean Won | | | 1.3 | % |
| Brazilian Real | | | 1.3 | % |
| Indonesian Rupiah | | | 1.0 | % |
| All Other Currencies | | | 2.0 | % |
| Total | | | 100.0 | % |
See accompanying Notes to Financial Statements.
| 52 | Semiannual Report | June 30, 2021 |
| | International Small Cap Growth Fund |
| | |
| | The International Small Cap Growth Fund seeks long-term capital appreciation. |
| | |
| | AN OVERVIEW FROM THE PORTFOLIO MANAGERS |
| | |
 Simon Fennell 
Andrew G. Flynn, CFA 
D.J. Neiman, CFA | The William Blair International Small Cap Growth Fund (Class N shares) posted a 7.28% increase, net of fees, for the six months ended June 30, 2021. By comparison, the Fund’s benchmark index, the MSCI All Country World ex-U.S. Small Cap Index (net) (the “Index”), increased 12.24%. Underperformance for the six-month period was driven primarily by stock selection within the Industrials and Information Technology sectors, which had been the strongest contributors in 2020. Within Industrials, Japanese automation company Harmonic Drive Systems was the largest detractor. Harmonic Drive dominates its niche in small speed reducers (80% market share), resulting in consistently high profitability and returns. Long running relationships with robot original equipment manufacturers, technical advantages for a high cost of failure product, and scale are competitive advantages. The share price weakened during the period despite a strong recovery in orders (+63% year over year for the company’s fiscal fourth quarter), and management’s increased operating income guidance for the 2022 fiscal year which exceeded consensus estimates. Within the Information Technology sector, Japanese holdings Nihon Unisys and Hennge KK were the largest detractors. Nihon Unisys is a traditional IT services vendor based in Japan. The company still has a large part of its business in traditional IT services, but it has focused more on building standardized products that it can deliver to multiple clients, improving operating margins and creating more stable revenues. Negative revenue growth during the fourth quarter was driven by system services declining due to low demand for legacy system development projects. Smaller projects continued to be pushed-out by customers due to the COVID-19 pandemic, while operating expenses related to order activities stayed high, driving a decline in earnings before interest and taxes. These negative effects were partially mitigated by positive stock selection within the Health Care and Real Estate sectors. Within Health Care, Australia-based Pro Medicus was the top contributor during the period. We believe that the company has developed a best-of-breed software solution for medical imaging. Through its proprietary streaming architecture, its platform has evolved to become the market leader in viewer speed, implementation speed, clinical efficiency, and cost benefits. Real Estate sector performance was bolstered by real estate investment trust holding Safestore, one of the leading self-storage companies in the UK, with operations in both the UK and Paris. Within Real Estate, the self-storage category has been resilient amid the COVID-19 pandemic, and Safestore’s share price was supported by a strong second quarter trading update amid robust occupancy levels and an increase in the development pipeline. Please refer to the Global Markets Review and Outlook relating to the Fund beginning on page 29. |
| June 30, 2021 | William Blair Funds | 53 |
International Small Cap Growth Fund
Performance Highlights (Unaudited)
| Average Annual Total Returns through 6/30/2021 |
| | | Year
to Date | | 1 Year | | 3 Year | | 5 Year | | 10 Year |
| Class N | | | 7.28 | % | | | 42.47 | % | | | 13.37 | % | | | 12.93 | % | | | 8.38 | % |
| Class I | | | 7.42 | | | | 42.79 | | | | 13.66 | | | | 13.25 | | | | 8.69 | |
| Class R6 | | | 7.49 | | | | 42.98 | | | | 13.79 | | | | 13.37 | | | | 8.85 | |
| MSCI ACW Ex-U.S. Small Cap Index (net) | | | 12.24 | | | | 47.04 | | | | 9.78 | | | | 11.97 | | | | 7.02 | |
Performance cited represents past performance. Past performance does not guarantee future results and current performance may be lower or higher than the data quoted. Results shown are average annual total returns, which assume reinvestment of dividends and capital gains. Investment returns and principal will fluctuate and you may have a gain or loss when you sell shares. For the most current month-end performance information, please call 1-800-742-7272, or visit our Web site at www.williamblairfunds.com. From time to time, the investment adviser may waive fees or reimburse expenses for the Fund. Without these waivers/reimbursements, performance would be lower. Investing in smaller companies involves special risks, including higher volatility and lower liquidity. Smaller capitalization stocks are also more sensitive to purchase/sale transactions and changes in the issuer’s financial condition. International investing involves special risk considerations, including currency fluctuations, lower liquidity, economic and political risk. Class N shares are not subject to a sales load. Class I shares are not subject to a sales load or distribution (Rule 12b-1) fees. Class R6 shares are not subject to a sales load, distribution (Rule 12b-1) fees, or sub-transfer agent fees.
The performance highlights and graph presented above do not reflect the deduction of taxes that a shareholder would pay on fund distributions or the redemption of fund shares.
The Morgan Stanley Capital International (MSCI) All Country World (ACW) Ex-U.S. Small Cap Index (net) is a free float-adjusted market capitalization weighted index that is designed to measure the equity market performance of small capitalization developed and emerging markets, excluding the United States. This index approximates the minimum possible dividend reinvestment by deducting for the highest possible withholding tax rates of those markets.
This report identifies the Fund’s investments on June 30, 2021. These holdings are subject to change. Not all stocks in the Fund performed the same, nor is there any guarantee that these stocks will perform as well in the future. Market forecasts provided in this report may not necessarily come to pass.
| Sector Diversification (Unaudited) |

The sector diversification shown is based on the total long-term securities.
| 54 | Semiannual Report | June 30, 2021 |
International Small Cap Growth Fund
Portfolio of Investments, June 30, 2021 (all dollar amounts in thousands) (unaudited)
| | | | | | | | |
| | | | | | | | |
| | Issuer | | Shares | | | Value | |
| | | | | | | | | | |
| | Common Stocks | | | | | | | | |
| | | | | | | | | | |
| | Europe, Mid-East—38.5% | | | | | | | | |
| | Belgium—1.9% | | | | | | | | |
| | Melexis N.V. (Semiconductors & semiconductor equipment) | | | 39,897 | | | $ | 4,142 | |
| | Warehouses De Pauw CVA (Equity REIT) | | | 77,877 | | | | 2,974 | |
| | | | | | | | | 7,116 | |
| | Denmark—0.7% | | | | | | | | |
| | Netcompany Group A/S (Software) | | | 22,112 | | | | 2,512 | |
| | Finland—0.8% | | | | | | | | |
| * | Musti Group Oyj (Specialty retail) | | | 81,284 | | | | 3,009 | |
| | Germany—4.2% | | | | | | | | |
| | Carl Zeiss Meditec AG (Health care equipment & supplies) | | | 16,984 | | | | 3,282 | |
| | CompuGroup Medical SE & Co. KgaA (Health care technology) | | | 34,729 | | | | 2,720 | |
| * | CTS Eventim AG & Co. KGaA (Entertainment) | | | 36,420 | | | | 2,276 | |
| * | Hypoport SE (Diversified financial services) | | | 7,211 | | | | 3,728 | |
| * | Westwing Group AG (Internet & direct marketing retail) | | | 60,085 | | | | 3,287 | |
| | | | | | | | | 15,293 | |
| | Israel—1.8% | | | | | | | | |
| * | Inmode, Ltd. (Health care equipment & supplies)† | | | 56,007 | | | | 5,303 | |
| * | NEOGAMES S.A. (Hotels, restaurants & leisure)† | | | 20,863 | | | | 1,282 | |
| | | | | | | | | 6,585 | |
| | Italy—2.8% | | | | | | | | |
| | Amplifon SpA (Health care providers & services) | | | 125,374 | | | | 6,190 | |
| * | Brunello Cucinelli SpA (Textiles, apparel & luxury goods) | | | 37,631 | | | | 2,201 | |
| | Carel Industries SpA (Electronic equipment, instruments & components) | | | 83,043 | | | | 1,994 | |
| | | | | | | | | 10,385 | |
| | Netherlands—0.5% | | | | | | | | |
| | BE Semiconductor Industries N.V. (Semiconductors & semiconductor equipment) | | | 22,400 | | | | 1,900 | |
| | Norway—1.5% | | | | | | | | |
| * | Pexip Holding ASA (Software) | | | 203,240 | | | | 1,815 | |
| | TOMRA Systems ASA (Commercial services & supplies) | | | 70,326 | | | | 3,880 | |
| | | | | | | | | 5,695 | |
| | Spain—2.1% | | | | | | | | |
| | EDP Renovaveis S.A. (Independent power & renewable electricity producers) | | | 214,671 | | | | 4,974 | |
| * | Solaria Energia y Medio Ambiente S.A. (Independent power & renewable electricity producers) | | | 144,613 | | | | 2,613 | |
| | | | | | | | | 7,587 | |
| | | | | | | | |
| | | | | | | | |
| | Issuer | | Shares | | | Value | |
| | | | | | | | | | |
| | Common Stocks—(continued) | | | | | | | | |
| | | | | | | | | | |
| | Europe, Mid-East—(continued) | | | | | | | | |
| | Sweden—16.7% | | | | | | | | |
| | AddTech AB Class “B” (Trading companies & distributors) | | | 318,627 | | | $ | 5,287 | |
| | Arjo AB Class “B” (Health care equipment & supplies) | | | 516,904 | | | | 5,327 | |
| | Beijer Ref AB (Trading companies & distributors) | | | 402,735 | | | | 7,177 | |
| | Biotage AB (Life sciences tools & services) | | | 113,910 | | | | 2,697 | |
| * | Hemnet Group AB (Interactive Media & Services) | | | 54,858 | | | | 1,234 | |
| | Indutrade AB (Machinery) | | | 97,042 | | | | 2,483 | |
| | Investment AB Latour Class “B” (Industrial conglomerates) | | | 199,103 | | | | 6,533 | |
| | Lagercrantz Group AB (Electronic equipment, instruments & components) | | | 86,095 | | | | 937 | |
| | Lifco AB Class “B” (Industrial conglomerates) | | | 245,505 | | | | 5,737 | |
| | MIPS AB (Leisure products) | | | 81,444 | | | | 7,004 | |
| | Nolato AB Class “B” (Industrial conglomerates) | | | 430,560 | | | | 4,236 | |
| | Paradox Interactive AB (Entertainment) | | | 60,432 | | | | 1,271 | |
| * | Sdiptech AB (Commercial services & supplies) | | | 53,161 | | | | 2,711 | |
| | Sweco AB Class “B” (Construction & engineering) | | | 188,210 | | | | 3,424 | |
| | Vitrolife AB (Biotechnology) | | | 129,358 | | | | 5,375 | |
| | | | | | | | | 61,433 | |
| | Switzerland—5.5% | | | | | | | | |
| | Belimo Holding AG (Building products) | | | 7,060 | | | | 3,228 | |
| | Kardex Holding AG (Machinery) | | | 15,183 | | | | 3,512 | |
| * | Siegfried Holding AG (Life sciences tools & services) | | | 4,440 | | | | 4,163 | |
| * | Softwareone Holding AG (Electronic equipment, instruments & components) | | | 144,672 | | | | 3,416 | |
| | Tecan Group AG (Life sciences tools & services) | | | 4,205 | | | | 2,083 | |
| * | Zur Rose Group AG (Food & staples retailing) | | | 9,668 | | | | 3,704 | |
| | | | | | | | | 20,106 | |
| | | | | | | | | | |
| | Emerging Asia—18.0% | | | | | | | | |
| | Cambodia—0.9% | | | | | | | | |
| | NagaCorp, Ltd. (Hotels, restaurants & leisure) | | | 3,290,000 | | | | 3,174 | |
| | China—5.9% | | | | | | | | |
| | A-Living Smart City Services Co., Ltd. (Commercial services & supplies) | | | 675,750 | | | | 3,364 | |
| | AK Medical Holdings, Ltd. (Health care equipment & supplies) | | | 1,552,000 | | | | 2,738 | |
| | Centre Testing International Group Co., Ltd. Class “A” (Professional services) | | | 1,026,890 | | | | 5,067 | |
| | Chacha Food Co., Ltd. Class “A” (Food products) | | | 346,400 | | | | 2,311 | |
See accompanying Notes to Financial Statements.
| June 30, 2021 | William Blair Funds | 55 |
International Small Cap Growth Fund
Portfolio of Investments, June 30, 2021 (all dollar amounts in thousands) (unaudited)
| | | | | | | | |
| | | | | | | | |
| | Issuer | | Shares | | | Value | |
| | | | | | | | | | |
| | Common Stocks—(continued) | | | | | | | | |
| | | | | | | | | | |
| | Emerging Asia—(continued) | | | | | | | | |
| | China—(continued) | | | | | | | | |
| | Changzhou Xingyu Automotive Lighting Systems Co., Ltd. Class “A” (Auto components) | | | 51,962 | | | $ | 1,815 | |
| * | iClick Interactive Asia Group, Ltd.—ADR (Media) | | | 63,987 | | | | 706 | |
| | Proya Cosmetics Co., Ltd. Class “A” (Personal products) | | | 88,744 | | | | 2,702 | |
| * | Venus MedTech Hangzhou, Inc. Class “H” (Health care equipment & supplies) | | | 359,500 | | | | 2,998 | |
| | | | | | | | | 21,701 | |
| | India—6.4% | | | | | | | | |
| * | Aavas Financiers, Ltd. (Thrifts & mortgage finance) | | | 53,092 | | | | 1,906 | |
| * | Affle India, Ltd. (Media) | | | 18,917 | | | | 1,095 | |
| * | AU Small Finance Bank, Ltd. (Banks) | | | 361,548 | | | | 5,056 | |
| * | IndiaMart InterMesh, Ltd. (Trading companies & distributors) | | | 17,990 | | | | 1,694 | |
| | Info Edge India, Ltd. (Interactive Media & Services) | | | 42,809 | | | | 2,839 | |
| | Ipca Laboratories, Ltd. (Pharmaceuticals) | | | 140,634 | | | | 3,837 | |
| * | Motherson Sumi Systems, Ltd. (Auto components) | | | 2,167,643 | | | | 7,071 | |
| | | | | | | | | 23,498 | |
| | Indonesia—0.3% | | | | | | | | |
| | Ace Hardware Indonesia Tbk PT (Specialty retail) | | | 14,560,400 | | | | 1,255 | |
| | Malaysia—0.2% | | | | | | | | |
| | MR DIY Group M Bhd (Specialty retail) | | | 829,400 | | | | 717 | |
| | South Korea—0.9% | | | | | | | | |
| | Koh Young Technology, Inc. (Semiconductors & semiconductor equipment) | | | 155,575 | | | | 3,288 | |
| | Taiwan—3.4% | | | | | | | | |
| | ASPEED Technology, Inc. (Semiconductors & semiconductor equipment) | | | 35,000 | | | | 2,525 | |
| | Globalwafers Co., Ltd. (Semiconductors & semiconductor equipment) | | | 84,000 | | | | 2,771 | |
| | momo.com, Inc. (Internet & direct marketing retail) | | | 45,000 | | | | 3,044 | |
| | Voltronic Power Technology Corporation (Electrical equipment) | | | 85,451 | | | | 4,125 | |
| | | | | | | | | 12,465 | |
| | | | | | | | | | |
| | Japan—15.3% | | | | | | | | |
| * | BASE, Inc. (IT services) | | | 222,000 | | | | 3,375 | |
| | BayCurrent Consulting, Inc. (Professional services) | | | 19,900 | | | | 7,147 | |
| | Benefit One, Inc. (Professional services) | | | 177,600 | | | | 5,587 | |
| * | Bengo4.com, Inc. (Interactive Media & Services) | | | 35,000 | | | | 3,062 | |
| | Food & Life Cos., Ltd. (Hotels, restaurants & leisure) | | | 129,400 | | | | 5,585 | |
| | GMO Payment Gateway, Inc. (IT services) | | | 17,400 | | | | 2,266 | |
| | Harmonic Drive Systems, Inc. (Machinery) | | | 56,800 | | | | 3,129 | |
| | | | | | | | |
| | | | | | | | |
| | Issuer | | Shares | | | Value | |
| | | | | | | | | | |
| | Common Stocks—(continued) | | | | | | | | |
| | | | | | | | | | |
| | Japan—(continued) | | | | | | | | |
| * | Hennge KK (IT services) | | | 33,200 | | | $ | 1,137 | |
| | Japan Elevator Service Holdings Co., Ltd. (Commercial services & supplies) | | | 140,700 | | | | 3,270 | |
| | JINS Holdings, Inc. (Specialty retail) | | | 65,900 | | | | 5,048 | |
| | Rakus Co., Ltd. (Software) | | | 196,100 | | | | 5,357 | |
| * | SHIFT, Inc. (IT services) | | | 19,000 | | | | 2,944 | |
| | SMS Co., Ltd. (Professional services) | | | 136,500 | | | | 4,086 | |
| | TechnoPro Holdings, Inc. (Professional services) | | | 187,500 | | | | 4,436 | |
| | | | | | | | | 56,429 | |
| | | | | | | | | | |
| | United Kingdom—11.6% | | | | | | | | |
| | AVEVA Group plc (Software) | | | 34,987 | | | | 1,795 | |
| * | Beazley plc (Insurance) | | | 525,433 | | | | 2,416 | |
| * | boohoo Group plc (Internet & direct marketing retail) | | | 852,300 | | | | 3,660 | |
| | Burford Capital, Ltd. (Diversified financial services) | | | 189,113 | | | | 1,946 | |
| * | Ceres Power Holdings plc (Electrical equipment) | | | 36,688 | | | | 537 | |
| * | CVS Group plc (Health care providers & services) | | | 49,337 | | | | 1,648 | |
| | Diploma plc (Trading companies & distributors) | | | 85,899 | | | | 3,451 | |
| | dotdigital group plc (Software) | | | 554,606 | | | | 1,772 | |
| | IntegraFin Holdings plc (Capital markets) | | | 476,338 | | | | 3,393 | |
| * | Moonpig Group plc (Internet & direct marketing retail) | | | 134,701 | | | | 799 | |
| | Renishaw plc (Electronic equipment, instruments & components) | | | 37,466 | | | | 2,553 | |
| | Rotork plc (Machinery) | | | 764,677 | | | | 3,601 | |
| | Safestore Holdings plc (Equity REIT) | | | 474,956 | | | | 6,222 | |
| | Softcat plc (IT services) | | | 203,902 | | | | 5,009 | |
| * | Trainline plc (Hotels, restaurants & leisure) | | | 531,151 | | | | 2,157 | |
| * | Trustpilot Group plc (Interactive Media & Services) | | | 406,859 | | | | 1,921 | |
| | | | | | | | | 42,880 | |
| | | | | | | | | | |
| | Emerging Latin America—3.9% | | | | | | | | |
| | Brazil—2.3% | | | | | | | | |
| | Arezzo Industria e Comercio S.A. (Textiles, apparel & luxury goods) | | | 201,900 | | | | 3,836 | |
| | Locaweb Servicos de Internet S.A. (IT services) | | | 312,700 | | | | 1,701 | |
| | Pet Center Comercio e Participacoes S.A. (Specialty retail) | | | 557,800 | | | | 2,889 | |
| | | | | | | | | 8,426 | |
| | Mexico—1.6% | | | | | | | | |
| * | Grupo Aeroportuario del Centro Norte S.A.B. de C.V. (Transportation infrastructure) | | | 893,400 | | | | 5,852 | |
See accompanying Notes to Financial Statements.
| 56 | Semiannual Report | June 30, 2021 |
International Small Cap Growth Fund
Portfolio of Investments, June 30, 2021 (all dollar amounts in thousands) (unaudited)
| | Issuer | | Share or
Principal
Amount | | | Value | |
| | | | | | | | | | |
| | Common Stocks—(continued) | | | | | | | | |
| | | | | | | | | | |
| | Canada—3.2% | | | | | | | | |
| * | Canada Goose Holdings, Inc. (Textiles, apparel & luxury goods)† | | | 47,620 | | | $ | 2,083 | |
| | Enghouse Systems, Ltd. (Software) | | | 67,474 | | | | 3,004 | |
| * | Kinaxis, Inc. (Software) | | | 29,380 | | | | 3,865 | |
| | Toromont Industries, Ltd. (Trading companies & distributors) | | | 32,515 | | | | 2,833 | |
| | | | | | | | | 11,785 | |
| | | | | | | | | | |
| | Asia—2.8% | | | | | | | | |
| | Australia—2.2% | | | | | | | | |
| * | Nanosonics, Ltd. (Health care equipment & supplies) | | | 397,052 | | | | 1,748 | |
| | Netwealth Group, Ltd. (Capital markets) | | | 150,464 | | | | 1,935 | |
| | Pro Medicus, Ltd. (Health care technology) | | | 96,971 | | | | 4,271 | |
| | | | | | | | | 7,954 | |
| | New Zealand—0.6% | | | | | | | | |
| | Ryman Healthcare, Ltd. (Health care providers & services) | | | 258,029 | | | | 2,368 | |
| | | | | | | | | | |
| | Mid-East, Africa—1.8% | | | | | | | | |
| | South Africa—0.9% | | | | | | | | |
| | Clicks Group, Ltd. (Food & staples retailing) | | | 197,447 | | | | 3,397 | |
| | United Arab Emirates—0.9% | | | | | | | | |
| * | Network International Holdings plc (IT services) | | | 650,987 | | | | 3,292 | |
| | Total Common Stocks—95.1%
(cost $267,772) | | | | | | | 350,102 | |
| | | | | | | | | | |
| | Repurchase Agreement | | | | | | | | |
| | Fixed Income Clearing Corporation, 0.000% dated 6/30/21, due 7/1/21, repurchase price $7,595, collateralized by U.S. Treasury Bond, 1.875% due 2/15/41, valued at $7,746 | | | $7,595 | | | | 7,595 | |
| | Total Repurchase Agreement—2.1%
(cost $7,595) | | | | | | | 7,595 | |
| | Total Investments—97.2%
(cost $275,367) | | | | | | | 357,697 | |
| | Cash and other assets, less liabilities—2.8% | | | | | | | 10,243 | |
| | Net assets—100.0% | | | | | | $ | 367,940 | |
ADR = American Depository Receipt
REIT = Real Estate Investment Trust
* = Non-income producing security
† = U.S. listed foreign security
At June 30, 2021, the Fund’s Portfolio of Investments includes the following industry categories (as a percentage of long-term investments):
| Industrials | | | 31.0 | % |
| Information Technology | | | 17.5 | % |
| Consumer Discretionary | | | 17.1 | % |
| Health Care | | | 16.2 | % |
| Financials | | | 5.8 | % |
| Communication Services | | | 4.1 | % |
| Consumer Staples | | | 3.5 | % |
| Real Estate | | | 2.6 | % |
| Utilities | | | 2.2 | % |
| Total | | | 100.0 | % |
At June 30, 2021, the Fund’s Portfolio of Investments includes the following currency categories (as a percentage of long-term investments):
| Swedish Krona | | | 17.5 | % |
| Japanese Yen | | | 16.1 | % |
| British Pound Sterling | | | 13.2 | % |
| Euro | | | 12.9 | % |
| Indian Rupee | | | 6.7 | % |
| Swiss Franc | | | 5.7 | % |
| New Taiwan Dollar | | | 3.6 | % |
| Hong Kong Dollar | | | 3.5 | % |
| Chinese Yuan Renminbi | | | 3.4 | % |
| Canadian Dollar | | | 2.8 | % |
| U.S. Dollar | | | 2.7 | % |
| Brazilian Real | | | 2.4 | % |
| Australian Dollar | | | 2.3 | % |
| Mexican Peso | | | 1.7 | % |
| Norwegian Krone | | | 1.6 | % |
| All Other Currencies | | | 3.9 | % |
| Total | | | 100.0 | % |
See accompanying Notes to Financial Statements.
| June 30, 2021 | William Blair Funds | 57 |
| | Emerging Markets Leaders Fund |
| | |
| | The Emerging Markets Leaders Fund seeks long-term capital appreciation. |
| | |
| | AN OVERVIEW FROM THE PORTFOLIO MANAGERS |
| | |

Todd M. McClone, CFA 
John C. Murphy, CFA | The William Blair Emerging Markets Leaders Fund (Class N shares) posted a 3.70% increase, net of fees, for the six months ended June 30, 2021. By comparison, the Fund’s benchmark index, the MSCI Emerging Markets Index (net) (the “Index”) increased 7.45%. Six-month underperformance versus the Index was driven by a combination of allocation and stock selection effects. An underweight allocation to Materials, coupled with weak stock selection within the Financials and Consumer Discretionary sectors weighed on relative returns. Within the Financials sector, Ping An Insurance Group detracted from relative results. The stock declined on continued weakness in their value of new business (VNB), compounded by ongoing restructuring of their Life business. This was further impacted by credit losses because of the default of China Fortune Land Development. Credicorp of Peru also weighed on relative results amid uncertainty regarding Presidential elections in Peru. Midea Group hurt relative performance in the Consumer Discretionary sector. The stock price declined due to increased profit margin pressure on the back of soaring raw material prices and the slow uptick in demand amid relatively cool summer weather. Partially offsetting these effects was positive stock selection within the Communication Services and Materials sectors. Within Communication Services, Kakao Corp. and Sea Ltd. bolstered relative results amid continued strong business trends. UPL Ltd., the Indian agrochemical company, outperformed within the Materials sector amid robust volume growth, favorable agriculture commodity prices and an encouraging growth outlook. We believe that the company continues to gain market share amid increased product innovation and strong execution. Please refer to the Global Markets Review and Outlook relating to the Fund beginning on page 29. |
| 58 | Semiannual Report | June 30, 2021 |
Emerging Markets Leaders Fund
Performance Highlights (Unaudited)
Average Annual Total Returns through 6/30/2021
| | | Year
to Date | | 1 Year | | 3 Year | | 5 Year | | 10 Year |
| Class N | | | 3.70 | % | | | 38.11 | % | | | 14.30 | % | | | 13.84 | % | | | 5.55 | % |
| Class I | | | 3.84 | | | | 38.33 | | | | 14.59 | | | | 14.14 | | | | 5.85 | |
| Class R6 | | | 3.92 | | | | 38.42 | | | | 14.64 | | | | 14.19 | | | | 5.93 | |
| MSCI Emerging Markets Index (net) | | | 7.45 | | | | 40.90 | | | | 11.27 | | | | 13.03 | | | | 4.28 | |
Performance cited represents past performance. Past performance does not guarantee future results and current performance may be lower or higher than the data quoted. Results shown are average annual total returns, which assume reinvestment of dividends and capital gains. Investment returns and principal will fluctuate and you may have a gain or loss when you sell shares. For the most current month-end performance information, please call 1-800-742-7272, or visit our Web site at www.williamblairfunds.com. International investing involves special risk considerations, including currency fluctuations, lower liquidity, economic and political risk. These risks may be magnified when investing in emerging markets. From time to time, the investment adviser may waive fees or reimburse expenses for the Fund. Without these waivers/reimbursements, performance would be lower. Class N shares are not subject to a sales load. Class I shares are not subject to a sales load or distribution (Rule 12b-1) fees. Class R6 shares are not subject to a sales load, distribution (Rule 12b-1) fees, or sub-transfer agent fees.
The performance highlights and graph presented above do not reflect the deduction of taxes that a shareholder would pay on fund distributions or the redemption of fund shares.
The Morgan Stanley Capital International (MSCI) Emerging Markets Index (net) is a free float-adjusted market-capitalization-weighted index that is designed to measure equity market performance of emerging markets. This index approximates the minimum possible dividend reinvestment by deducting for the highest possible withholding tax rates of those markets.
This report identifies the Fund’s investments on June 30, 2021. These holdings are subject to change. Not all stocks in the Fund performed the same, nor is there any guarantee that these stocks will perform as well in the future. Market forecasts provided in this report may not necessarily come to pass.
Sector Diversification (Unaudited)

The sector diversification shown is based on the total long-term securities.
| June 30, 2021 | William Blair Funds | 59 |
Emerging Markets Leaders Fund
Portfolio of Investments, June 30, 2021 (all dollar amounts in thousands) (unaudited)
| | | | | | | | |
| | | | | | | | |
| | Issuer | | Shares | | | Value | |
| | | | | | | | | | |
| | Common Stocks | | | | | | | | |
| | | | | | | | | | |
| | Emerging Asia—76.3% | | | | | | | | |
| | China—34.6% | | | | | | | | |
| | Aier Eye Hospital Group Co., Ltd. Class “A” (Health care providers & services) | | | 314,686 | | | $ | 3,457 | |
| * | Alibaba Group Holding, Ltd. (Internet & direct marketing retail) | | | 808,628 | | | | 22,912 | |
| | China Tourism Group Duty Free Corporation, Ltd. Class “A” (Specialty retail) | | | 116,856 | | | | 5,427 | |
| | Foshan Haitian Flavouring & Food Co., Ltd. Class “A” (Food products) | | | 144,500 | | | | 2,884 | |
| | Kweichow Moutai Co., Ltd. Class “A” (Beverages) | | | 14,659 | | | | 4,666 | |
| | Midea Group Co., Ltd. Class “A” (Household durables) | | | 505,100 | | | | 5,579 | |
| | NetEase, Inc. (Entertainment) | | | 504,350 | | | | 11,426 | |
| | Ping An Insurance Group Co. of China, Ltd. Class “H” (Insurance) | | | 956,000 | | | | 9,364 | |
| | Shenzhou International Group Holdings, Ltd. (Textiles, apparel & luxury goods) | | | 117,200 | | | | 2,960 | |
| * | TAL Education Group—ADR (Diversified consumer services) | | | 53,687 | | | | 1,355 | |
| | Tencent Holdings, Ltd. (Interactive Media & Services) | | | 317,100 | | | | 23,851 | |
| * | Tencent Music Entertainment Group—ADR (Entertainment) | | | 369,682 | | | | 5,723 | |
| | TravelSky Technology, Ltd. Class “H” (IT services) | | | 1,664,000 | | | | 3,592 | |
| | Zhangzhou Pientzehuang Pharmaceutical Co., Ltd. Class “A” (Pharmaceuticals) | | | 90,400 | | | | 6,272 | |
| | | | | | | | | 109,468 | |
| | India—18.1% | | | | | | | | |
| | Asian Paints, Ltd. (Chemicals) | | | 85,508 | | | | 3,453 | |
| * | Bajaj Finance, Ltd. (Consumer finance) | | | 39,309 | | | | 3,178 | |
| | Britannia Industries, Ltd. (Food products) | | | 54,972 | | | | 2,702 | |
| | HDFC Bank, Ltd. (Banks) | | | 370,619 | | | | 7,464 | |
| | Housing Development Finance Corporation, Ltd. (Thrifts & mortgage finance) | | | 129,568 | | | | 4,319 | |
| | Infosys, Ltd. (IT services) | | | 384,374 | | | | 8,171 | |
| * | InterGlobe Aviation, Ltd. (Airlines) | | | 140,970 | | | | 3,265 | |
| * | Motherson Sumi Systems, Ltd. (Auto components) | | | 1,938,870 | | | | 6,324 | |
| | Reliance Industries, Ltd. (Oil, gas & consumable fuels) | | | 418,568 | | | | 11,710 | |
| | UPL, Ltd. (Chemicals) | | | 636,325 | | | | 6,797 | |
| | | | | | | | | 57,383 | |
| | Indonesia—1.5% | | | | | | | | |
| | Bank Central Asia Tbk PT (Banks) | | | 2,206,500 | | | | 4,584 | |
| | South Korea—8.4% | | | | | | | | |
| * | Coupang, Inc. (Internet & direct marketing retail) | | | 86,565 | | | | 3,620 | |
| | Douzone Bizon Co., Ltd. (Software) | | | 36,636 | | | | 2,700 | |
| | Kakao Corporation (Interactive Media & Services) | | | 41,992 | | | | 6,078 | |
| | LG Household & Health Care, Ltd. (Personal products) | | | 4,632 | | | | 7,247 | |
| | NAVER Corporation (Interactive Media & Services) | | | 18,945 | | | | 7,024 | |
| | | | | | | | | 26,669 | |
| | | | | | | | |
| | | | | | | | |
| | Issuer | | Shares | | | Value | |
| | | | | | | | | | |
| | Common Stocks—(continued) | | | | | | | | |
| | | | | | | | | | |
| | Emerging Asia—(continued) | | | | | | | | |
| | Taiwan—11.7% | | | | | | | | |
| | E.Sun Financial Holding Co., Ltd. (Banks) | | | 3,091,301 | | | $ | 2,918 | |
| * | eMemory Technology, Inc. (Semiconductors & semiconductor equipment) | | | 39,000 | | | | 1,869 | |
| | MediaTek, Inc. (Semiconductors & semiconductor equipment) | | | 213,000 | | | | 7,354 | |
| | Taiwan Semiconductor Manufacturing Co., Ltd.—ADR (Semiconductors & semiconductor equipment) | | | 207,150 | | | | 24,891 | |
| | | | | | | | | 37,032 | |
| | Thailand—2.0% | | | | | | | | |
| * | Sea, Ltd.—ADR (Entertainment) | | | 23,292 | | | | 6,396 | |
| | | | | | | | | | |
| | Emerging Latin America—14.6% | | | | | | | | |
| | Argentina—3.9% | | | | | | | | |
| * | Globant S.A. (IT services)† | | | 23,488 | | | | 5,148 | |
| * | MercadoLibre, Inc. (Internet & direct marketing retail) | | | 4,658 | | | | 7,256 | |
| | | | | | | | | 12,404 | |
| | Brazil—6.0% | | | | | | | | |
| | B3 S.A. - Brasil Bolsa Balcao (Capital markets) | | | 1,822,300 | | | | 6,162 | |
| | Raia Drogasil S.A. (Food & staples retailing) | | | 435,500 | | | | 2,164 | |
| * | Rumo S.A. (Road & rail) | | | 1,586,800 | | | | 6,109 | |
| | TOTVS S.A. (Software) | | | 610,800 | | | | 4,624 | |
| | | | | | | | | 19,059 | |
| | Mexico—3.3% | | | | | | | | |
| * | Grupo Aeroportuario del Pacifico S.A.B. de C.V. Class “B” (Transportation infrastructure) | | | 560,500 | | | | 6,001 | |
| | Wal-Mart de Mexico S.A.B. de C.V. (Food & staples retailing) | | | 1,326,800 | | | | 4,334 | |
| | | | | | | | | 10,335 | |
| | Peru—1.4% | | | | | | | | |
| * | Credicorp, Ltd. (Banks)† | | | 35,226 | | | | 4,266 | |
| | | | | | | | | | |
| | Emerging Europe, Mid-East, Africa—8.5% | | | | | | | | |
| | Poland—0.9% | | | | | | | | |
| * | Allegro.eu S.A. (Internet & direct marketing retail) | | | 161,372 | | | | 2,777 | |
| | Russia—3.6% | | | | | | | | |
| | HeadHunter Group plc—ADR (Professional services) | | | 110,658 | | | | 4,689 | |
| * | Yandex N.V. Class “A” (Interactive Media & Services)† | | | 97,321 | | | | 6,885 | |
| | | | | | | | | 11,574 | |
| | South Africa—3.1% | | | | | | | | |
| | Capitec Bank Holdings, Ltd. (Banks) | | | 53,400 | | | | 6,307 | |
| | Clicks Group, Ltd. (Food & staples retailing) | | | 202,099 | | | | 3,477 | |
| | | | | | | | | 9,784 | |
See accompanying Notes to Financial Statements.
| 60 | Semiannual Report | June 30, 2021 |
Emerging Markets Leaders Fund
Portfolio of Investments, June 30, 2021 (all dollar amounts in thousands) (unaudited)
| | Issuer | | Shares or
Principal
Amount | | | Value | |
| | | | | | | | | | |
| | Common Stocks—(continued) | | | | | | | | |
| | | | | | | | | | |
| | Emerging Europe, Mid-East, Africa—(continued) | | | | | | | | |
| | United Arab Emirates—0.9% | | | | | | | | |
| * | Network International Holdings plc (IT services) | | | 546,240 | | | $ | 2,763 | |
| | Total Common Stocks—99.4%
(cost $233,492) | | | | | | | 314,494 | |
| | | | | | | | | | |
| | Corporate Obligation | | | | | | | | |
| | | | | | | | | | |
| | Emerging Asia—0.0% | | | | | | | | |
| | India—0.0% | | | | | | | | |
| * | Britannia Industries, Ltd. (Food products) | | $ | 1,388,984 | | | | 19 | |
| | Total Corporate Obligations—(0.0)%
(cost $19) | | | | | | | 19 | |
| | | | | | | | | | |
| | Repurchase Agreement | | | | | | | | |
| | Fixed Income Clearing Corporation, 0.000% dated 6/30/21, due 7/1/21, repurchase price $29,547, collateralized by U.S. Treasury Bond, 1.875%, due 2/15/41, valued at $30,138 | | $ | 29,547 | | | | 29,547 | |
| | Total Repurchase Agreement—9.3%
(cost $29,547) | | | | | | | 29,547 | |
| | Total Investments—108.7%
(cost $263,058) | | | | | | | 344,060 | |
| | Liabilities, plus cash and other assets—(8.7)% | | | | | | | (27,525 | ) |
| | Net assets—100.0% | | | | | | $ | 316,535 | |
ADR = American Depository Receipt
* = Non-income producing security
† = U.S. listed foreign security
At June 30, 2021, the Fund’s Portfolio of Investments includes the following industry categories (as a percentage of long-term investments):
| Communication Services | | | 21.5 | % |
| Information Technology | | | 19.4 | % |
| Consumer Discretionary | | | 18.5 | % |
| Financials | | | 15.4 | % |
| Consumer Staples | | | 8.7 | % |
| Industrials | | | 6.4 | % |
| Energy | | | 3.7 | % |
| Materials | | | 3.3 | % |
| Health Care | | | 3.1 | % |
| Total | | | 100.0 | % |
At June 30, 2021, the Fund’s Portfolio of Investments includes the following currency categories (as a percentage of long-term investments):
| Hong Kong Dollar | | | 23.6 | % |
| U.S. Dollar | | | 22.3 | % |
| Indian Rupee | | | 18.1 | % |
| Chinese Yuan Renminbi | | | 9.0 | % |
| South Korean Won | | | 7.3 | % |
| Brazilian Real | | | 6.0 | % |
| New Taiwan Dollar | | | 3.9 | % |
| Mexican Peso | | | 3.3 | % |
| South African Rand | | | 3.1 | % |
| Indonesian Rupiah | | | 1.5 | % |
| All Other Currencies | | | 1.9 | % |
| Total | | | 100.0 | % |
See accompanying Notes to Financial Statements.
| June 30, 2021 | William Blair Funds | 61 |
| | Emerging Markets Growth Fund |
| | |
| | The Emerging Markets Growth Fund seeks long-term capital appreciation. |
| | |
| | AN OVERVIEW FROM THE PORTFOLIO MANAGERS |
| | |
 Todd M. McClone, CFA 
Casey K. Preyss, CFA 
Vivian Lin Thurston, CFA | The William Blair Emerging Markets Growth Fund (Class N shares) posted a 10.37% increase, net of fees, for the six months ended June 30, 2021. By comparison, the Fund’s benchmark index, the MSCI Emerging Markets IMI (net) (the “Index”), increased 8.75%. Six-month outperformance versus the Index was primarily driven by positive stock selection across most sectors. Stock selection within the Communication Services sector was particularly strong, propelled by Kakao Corp. and Sea Ltd. We believe that Kakao’s strong operating momentum across all divisions and the upcoming initial public offering of its fintech businesses lifted the share price. Sea Ltd. continued to outperform on the back of strong momentum in its gaming business with Free Fire leading in Latin America, Southeast Asia and India, and accelerating growth in its ecommerce business amid increasing penetration and market share gains. Partially offsetting these effects was the underweight allocation to the Materials sector, coupled with below average stock selection within the Industrials and Consumer Staples sectors. Within Industrials, the lack of the exposure to Taiwanese shipping companies which rallied in the second quarter hurt relative performance. Jiangsu Hengli Hydraulic Co., the Chinese machinery company specializing in the manufacturing of hydraulic cylinders, hindered relative results in the first quarter of 2021 as the stock weakened amid the decelerating machinery cycle in China. Within the Consumer Staples sector, Foshan Haitian Flavouring & Food, the largest condiments producer in China, also hindered relative results. The stock underperformance was due to increased raw materials prices and broad market rotation in the first quarter. Please refer to the Global Markets Review and Outlook relating to the Fund beginning on page 29. |
| 62 | Semiannual Report | June 30, 2021 |
Emerging Markets Growth Fund
Performance Highlights (Unaudited)
Average Annual Total Returns through 6/30/2021
| | | Year
to Date | | 1 Year | | 3 Year | | 5 Year | | 10 Year |
| Class N | | | 10.37 | % | | | 50.16 | % | | | 18.81 | % | | | 17.39 | % | | | 7.65 | % |
| Class I | | | 10.50 | | | | 50.49 | | | | 19.13 | | | | 17.69 | | | | 7.94 | |
| Class R6 | | | 10.56 | | | | 50.70 | | | | 19.22 | | | | 17.79 | | | | 8.07 | |
| MSCI Emerging Markets IMI (net) | | | 8.75 | | | | 43.21 | | | | 11.38 | | | | 12.86 | | | | 4.31 | |
Performance cited represents past performance. Past performance does not guarantee future results and current performance may be lower or higher than the data quoted. Results shown are average annual total returns, which assume reinvestment of dividends and capital gains. Investment returns and principal will fluctuate and you may have a gain or loss when you sell shares. For the most current month-end performance information, please call 1-800-742-7272, or visit our Web site at www.williamblairfunds.com. From time to time, the investment adviser may waive fees or reimburse expenses for the Fund. Without these waivers/reimbursements, performance would be lower. International investing involves special risk considerations, including currency fluctuations, lower liquidity, economic and political risk. These risks may be magnified when investing in emerging markets. Class N shares are not subject to a sales load. Class I shares are not subject to a sales load or distribution (Rule 12b-1) fees. Class R6 shares are not subject to a sales load, distribution (Rule 12b-1) fees, or sub-transfer agent fees.
The performance highlights and graph presented above do not reflect the deduction of taxes that a shareholder would pay on fund distributions or the redemption of fund shares.
The Morgan Stanley Capital International (MSCI) Emerging Markets Investable Market Index (IMI) (net) is a free float-adjusted market capitalization weighted index that is designed to measure the equity market performance of emerging markets. This index approximates the minimum possible dividend reinvestment by deducting for the highest possible withholding tax rates of those markets.
This report identifies the Fund’s investments on June 30, 2021. These holdings are subject to change. Not all stocks in the Fund performed the same, nor is there any guarantee that these stocks will perform as well in the future. Market forecasts provided in this report may not necessarily come to pass.
Sector Diversification (Unaudited)

The sector diversification shown is based on the total long-term securities.
| June 30, 2021 | William Blair Funds | 63 |
Emerging Markets Growth Fund
Portfolio of Investments, June 30, 2021 (all dollar amounts in thousands) (unaudited)
| | | | | | | | |
| | | | | | | | |
| | Issuer | | Shares | | | Value | |
| | | | | | | | |
| | Common Stocks | | | | | | | | |
| | | | | | | | | | |
| | Emerging Asia—86.1% | | | | | | | | |
| | China—29.6% | | | | | | | | |
| | Aier Eye Hospital Group Co., Ltd. Class “A” (Health care providers & services) | | | 490,377 | | | $ | 5,387 | |
| * | Alibaba Group Holding, Ltd. (Internet & direct marketing retail) | | | 945,832 | | | | 26,800 | |
| | ANTA Sports Products, Ltd. (Textiles, apparel & luxury goods) | | | 437,000 | | | | 10,289 | |
| * | BeiGene, Ltd. (Biotechnology) | | | 117,900 | | | | 3,207 | |
| | Beijing Oriental Yuhong Waterproof Technology Co., Ltd. Class “A” (Construction materials) | | | 523,230 | | | | 4,480 | |
| | By-health Co., Ltd. Class “A” (Personal products) | | | 598,700 | | | | 3,048 | |
| | Centre Testing International Group Co., Ltd. Class “A” (Professional services) | | | 1,190,800 | | | | 5,875 | |
| | China Education Group Holdings, Ltd. (Diversified consumer services) | | | 1,555,000 | | | | 3,469 | |
| | China Meidong Auto Holdings, Ltd. (Specialty retail) | | | 1,096,000 | | | | 5,978 | |
| | China Merchants Bank Co., Ltd. Class “H” (Banks) | | | 2,159,000 | | | | 18,422 | |
| | China Tourism Group Duty Free Corporation, Ltd. Class “A” (Specialty retail) | | | 174,258 | | | | 8,093 | |
| | Chongqing Zhifei Biological Products Co., Ltd. Class “A” (Biotechnology) | | | 138,000 | | | | 3,988 | |
| * | Contemporary Amperex Technology Co., Ltd. Class “A” (Electrical equipment) | | | 131,100 | | | | 10,851 | |
| | Country Garden Services Holdings Co., Ltd. (Commercial services & supplies) | | | 1,148,000 | | | | 12,405 | |
| | Foshan Haitian Flavouring & Food Co., Ltd. Class “A” (Food products) | | | 231,765 | | | | 4,625 | |
| | Hangzhou Tigermed Consulting Co., Ltd. Class “A” (Life sciences tools & services) | | | 223,566 | | | | 6,688 | |
| * | JD.com, Inc. Class “A” (Internet & direct marketing retail) | | | 262,450 | | | | 10,323 | |
| | Jiumaojiu International Holdings, Ltd. (Hotels, restaurants & leisure) | | | 1,329,000 | | | | 5,435 | |
| * | Kingdee International Software Group Co., Ltd. (Software) | | | 722,000 | | | | 2,450 | |
| | Kweichow Moutai Co., Ltd. Class “A” (Beverages) | | | 28,642 | | | | 9,117 | |
| | Li Ning Co., Ltd. (Textiles, apparel & luxury goods) | | | 1,330,000 | | | | 16,239 | |
| * | Meituan Class “B” (Internet & direct marketing retail) | | | 265,500 | | | | 10,956 | |
| | NetEase, Inc. (Entertainment) | | | 762,500 | | | | 17,274 | |
| | Shenzhen Inovance Technology Co., Ltd. Class “A” (Machinery) | | | 662,864 | | | | 7,618 | |
| | Shenzhen Mindray Bio-Medical Electronics Co., Ltd. Class “A” (Health care equipment & supplies) | | | 109,168 | | | | 8,111 | |
| | Shenzhou International Group Holdings, Ltd. (Textiles, apparel & luxury goods) | | | 361,000 | | | | 9,118 | |
| | Silergy Corporation (Semiconductors & semiconductor equipment) | | | 157,000 | | | | 21,356 | |
| | | | | | | | |
| | | | | | | | |
| | Issuer | | Shares | | | Value | |
| | | | | | | | |
| | Common Stocks—(continued) | | | | | | | | |
| | | | | | | | | | |
| | Emerging Asia—(continued) | | | | | | | | |
| | China—(continued) | | | | | | | | |
| | Tencent Holdings, Ltd. (Interactive Media & Services) | | | 764,360 | | | $ | 57,492 | |
| * | Topchoice Medical Corporation Class “A” (Health care providers & services) | | | 69,100 | | | | 4,395 | |
| * | Wuliangye Yibin Co., Ltd. Class “A” (Beverages) | | | 208,894 | | | | 9,631 | |
| | WuXi AppTec Co., Ltd. Class “H” (Life sciences tools & services) | | | 473,460 | | | | 11,056 | |
| * | Wuxi Biologics Cayman, Inc. (Life sciences tools & services) | | | 1,110,000 | | | | 20,344 | |
| | Zhangzhou Pientzehuang Pharmaceutical Co., Ltd. Class “A” (Pharmaceuticals) | | | 140,329 | | | | 9,736 | |
| | Zhongsheng Group Holdings, Ltd. (Specialty retail) | | | 1,003,500 | | | | 8,349 | |
| | | | | | | | | 372,605 | |
| | India—18.2% | | | | | | | | |
| | Aarti Industries, Ltd. (Chemicals) | | | 248,062 | | | | 2,913 | |
| * | Affle India, Ltd. (Media) | | | 40,294 | | | | 2,333 | |
| * | Amber Enterprises India, Ltd. (Household durables) | | | 72,372 | | | | 2,844 | |
| * | APL Apollo Tubes, Ltd. (Metals & mining) | | | 179,840 | | | | 3,944 | |
| | Apollo Hospitals Enterprise, Ltd. (Health care providers & services) | | | 109,155 | | | | 5,313 | |
| | Asian Paints, Ltd. (Chemicals) Astral Poly Technik, Ltd. | | | 198,321 | | | | 8,010 | |
| | (Building products) | | | 146,761 | | | | 3,929 | |
| * | Atul, Ltd. (Chemicals) | | | 24,978 | | | | 2,994 | |
| * | Bajaj Finance, Ltd. (Consumer finance) | | | 74,788 | | | | 6,046 | |
| | Balkrishna Industries, Ltd. (Auto components) | | | 140,707 | | | | 4,255 | |
| | Coforge, Ltd. (IT services) | | | 73,977 | | | | 4,141 | |
| | Crompton Greaves Consumer Electricals, Ltd. (Household durables) | | | 790,913 | | | | 4,615 | |
| | Dabur India, Ltd. (Personal products) | | | 557,895 | | | | 4,264 | |
| * | Divi’s Laboratories, Ltd. (Life sciences tools & services) | | | 97,639 | | | | 5,786 | |
| * | Dixon Technologies India, Ltd. (Household durables) | | | 89,331 | | | | 5,302 | |
| | Dr. Lal PathLabs, Ltd. (Health care providers & services) | | | 90,379 | | | | 3,984 | |
| | Escorts, Ltd. (Machinery) | | | 152,102 | | | | 2,503 | |
| | Havells India, Ltd. (Electrical equipment) | | | 367,880 | | | | 4,850 | |
| | HDFC Bank, Ltd. (Banks) | | | 917,898 | | | | 18,486 | |
| | HDFC Life Insurance Co., Ltd. (Insurance) | | | 272,068 | | | | 2,518 | |
| | Hindustan Unilever, Ltd. (Household products) | | | 129,997 | | | | 4,329 | |
| | Housing Development Finance Corporation, Ltd. (Thrifts & mortgage finance) | | | 430,060 | | | | 14,336 | |
| * | IndiaMart InterMesh, Ltd. (Trading companies & distributors) | | | 28,562 | | | | 2,689 | |
| | Indraprastha Gas, Ltd. (Gas utilities) | | | 409,610 | | | | 3,069 | |
| | Info Edge India, Ltd. (Interactive Media & Services) | | | 84,534 | | | | 5,607 | |
| * | JK Cement, Ltd. (Construction materials) | | | 71,541 | | | | 2,744 | |
See accompanying Notes to Financial Statements.
| 64 | Semiannual Report | June 30, 2021 |
Emerging Markets Growth Fund
Portfolio of Investments, June 30, 2021 (all dollar amounts in thousands) (unaudited)
| | | | | | | | |
| | | | | | | | |
| | Issuer | | Shares | | | Value | |
| | | | | | | | |
| | Common Stocks—(continued) | | | | | | | | |
| | | | | | | | | | |
| | Emerging Asia—(continued) | | | | | | | | |
| | India—(continued) | | | | | | | | |
| | Kajaria Ceramics, Ltd. (Building products) | | | 230,553 | | | $ | 3,030 | |
| | Larsen & Toubro Infotech, Ltd. (IT services) | | | 52,699 | | | | 2,886 | |
| | Laurus Labs Ltd. (Pharmaceuticals) | | | 508,338 | | | | 4,729 | |
| * | MakeMyTrip, Ltd. (Hotels, restaurants & leisure)† | | | 79,438 | | | | 2,387 | |
| | Metropolis Healthcare, Ltd. (Health care providers & services) | | | 80,017 | | | | 3,030 | |
| | Navin Fluorine International, Ltd. (Chemicals) | | | 66,394 | | | | 3,354 | |
| | Nestle India, Ltd. (Food products) | | | 14,139 | | | | 3,370 | |
| | PI Industries, Ltd. (Chemicals) | | | 135,084 | | | | 5,309 | |
| * | Pidilite Industries, Ltd. (Chemicals) | | | 219,877 | | | | 6,373 | |
| | Reliance Industries, Ltd. (Oil, gas & consumable fuels) | | | 765,204 | | | | 21,196 | |
| | SRF, Ltd. (Chemicals) | | | 68,084 | | | | 6,668 | |
| | Tata Consultancy Services, Ltd. (IT services) | | | 279,286 | | | | 12,591 | |
| | Tata Consumer Products, Ltd. (Food products) | | | 461,410 | | | | 4,694 | |
| | Tata Elxsi, Ltd. (Software) | | | 89,012 | | | | 5,209 | |
| | UPL, Ltd. (Chemicals) | | | 545,582 | | | | 5,828 | |
| | Varun Beverages, Ltd. (Beverages) | | | 327,666 | | | | 3,216 | |
| | Voltas, Ltd. (Construction & engineering) | | | 220,997 | | | | 3,036 | |
| | | | | | | | | 228,710 | |
| | Indonesia—1.1% | | | | | | | | |
| | Bank Central Asia Tbk PT (Banks) | | | 4,254,999 | | | | 8,840 | |
| | Bank Rakyat Indonesia Persero Tbk PT (Banks) | | | 17,791,100 | | | | 4,834 | |
| | | | | | | | | 13,674 | |
| | South Korea—14.6% | | | | | | | | |
| | Hansol Chemical Co., Ltd. (Chemicals) | | | 23,864 | | | | 5,202 | |
| | JYP Entertainment Corporation (Entertainment) | | | 64,224 | | | | 2,310 | |
| | Kakao Corporation (Interactive Media & Services) | | | 275,221 | | | | 39,836 | |
| | Koh Young Technology, Inc. (Semiconductors & semiconductor equipment) | | | 125,151 | | | | 2,645 | |
| | LEENO Industrial, Inc. (Semiconductors & semiconductor equipment) | | | 32,125 | | | | 5,007 | |
| | LG Household & Health Care, Ltd. (Personal products) | | | 6,155 | | | | 9,630 | |
| | NAVER Corporation (Interactive Media & Services) | | | 57,658 | | | | 21,376 | |
| | NCSoft Corporation (Entertainment) | | | 7,258 | | | | 5,285 | |
| | NICE Information Service Co., Ltd. (Professional services) | | | 135,551 | | | | 3,021 | |
| | PI Advanced Materials Co., Ltd. (Chemicals) | | | 75,308 | | | | 3,678 | |
| | Samsung Electronics Co., Ltd. (Technology hardware, storage & peripherals) | | | 861,021 | | | | 61,701 | |
| | Samsung SDI Co., Ltd. (Electronic equipment, instruments & components) | | | 13,345 | | | | 8,271 | |
| | | | | | | | |
| | | | | | | | |
| | Issuer | | Shares | | | Value | |
| | | | | | | | |
| | Common Stocks—(continued) | | | | | | | | |
| | | | | | | | | | |
| | Emerging Asia—(continued) | | | | | | | | |
| | South Korea—(continued) | | | | | | | | |
| | SK Hynix, Inc. (Semiconductors & semiconductor equipment) | | | 109,747 | | | $ | 12,425 | |
| | WONIK IPS Co., Ltd. (Semiconductors & semiconductor equipment) | | | 83,051 | | | | 3,658 | |
| | | | | | | | | 184,045 | |
| | Taiwan—20.3% | | | | | | | | |
| | Accton Technology Corporation (Communications equipment) | | | 369,000 | | | | 4,377 | |
| | Advantech Co., Ltd. (Technology hardware, storage & peripherals) | | | 339,766 | | | | 4,207 | |
| | Airtac International Group (Machinery) | | | 358,000 | | | | 13,812 | |
| | ASMedia Technology, Inc. (Semiconductors & semiconductor equipment) | | | 61,000 | | | | 2,945 | |
| | ASPEED Technology, Inc. (Semiconductors & semiconductor equipment) | | | 122,000 | | | | 8,801 | |
| * | Chailease Holding Co., Ltd. (Diversified financial services) | | | 1,269,000 | | | | 9,223 | |
| | Chroma ATE, Inc. (Electronic equipment, instruments & components) | | | 524,000 | | | | 3,601 | |
| | E.Sun Financial Holding Co., Ltd. (Banks) | | | 4,324,313 | | | | 4,082 | |
| | Elite Material Co., Ltd. (Electronic equipment, instruments & components) | | | 498,000 | | | | 3,896 | |
| * | eMemory Technology, Inc. (Semiconductors & semiconductor equipment) | | | 115,000 | | | | 5,510 | |
| | Globalwafers Co., Ltd. (Semiconductors & semiconductor equipment) | | | 138,000 | | | | 4,552 | |
| | Hiwin Technologies Corporation (Machinery) | | | 224,000 | | | | 3,176 | |
| | Lotes Co., Ltd. (Electronic equipment, instruments & components) | | | 214,000 | | | | 4,485 | |
| | MediaTek, Inc. (Semiconductors & semiconductor equipment) | | | 1,204,000 | | | | 41,570 | |
| * | momo.com, Inc. (Internet & direct marketing retail) | | | 113,000 | | | | 7,645 | |
| | Parade Technologies, Ltd. (Semiconductors & semiconductor equipment) | | | 151,000 | | | | 7,506 | |
| * | Poya International Co., Ltd. (Multiline retail) | | | 100,000 | | | | 1,949 | |
| | Realtek Semiconductor Corporation (Semiconductors & semiconductor equipment) | | | 489,000 | | | | 8,863 | |
| | Sinbon Electronics Co., Ltd. (Electronic equipment, instruments & components) | | | 555,000 | | | | 5,458 | |
| | Taiwan Semiconductor Manufacturing Co., Ltd.—ADR (Semiconductors & semiconductor equipment) | | | 635,033 | | | | 76,306 | |
| | Taiwan Semiconductor Manufacturing Co., Ltd. (Semiconductors & semiconductor equipment) | | | 1,073,000 | | | | 22,914 | |
| | Voltronic Power Technology Corporation (Electrical equipment) | | | 120,586 | | | | 5,821 | |
| | Wiwynn Corporation (Technology hardware, storage & peripherals) | | | 131,000 | | | | 4,687 | |
| | | | | | | | | 255,386 | |
See accompanying Notes to Financial Statements.
| June 30, 2021 | William Blair Funds | 65 |
Emerging Markets Growth Fund
Portfolio of Investments, June 30, 2021 (all dollar amounts in thousands) (unaudited)
| | | | | | | | |
| | | | | | | | |
| | Issuer | | Shares | | | Value | |
| | | | | | | | |
| | Common Stocks—(continued) | | | | | | | | |
| | | | | | | | | | |
| | Emerging Asia—(continued) | | | | | | | | |
| | Thailand—1.4% | | | | | | | | |
| | Com7 PCL Class “F” (Specialty retail) | | | 1,590,600 | | | $ | 3,462 | |
| * | Sea, Ltd.—ADR (Entertainment) | | | 54,856 | | | | 15,063 | |
| | | | | | | | | 18,525 | |
| | Vietnam—0.9% | | | | | | | | |
| | Hoa Phat Group JSC (Metals & mining) | | | 4,940,001 | | | | 11,054 | |
| | | | | | | | | | |
| | Emerging Europe, Africa—7.1% | | | | | | | | |
| | Kenya—0.3% | | | | | | | | |
| | Safaricom plc (Wireless telecommunication services) | | | 9,013,654 | | | | 3,508 | |
| | Poland—1.3% | | | | | | | | |
| * | Allegro.eu S.A. (Internet & direct marketing retail) | | | 352,581 | | | | 6,068 | |
| * | Dino Polska S.A. (Food & staples retailing) | | | 94,603 | | | | 6,944 | |
| * | InPost S.A. (Air freight & logistics) | | | 196,668 | | | | 3,947 | |
| | | | | | | | | 16,959 | |
| | Russia—3.2% | | | | | | | | |
| * | Ozon Holdings plc—ADR (Internet & direct marketing retail) | | | 72,421 | | | | 4,245 | |
| | TCS Group Holding plc—GDR (Banks) | | | 202,406 | | | | 17,711 | |
| * | Yandex N.V. Class “A” (Interactive Media & Services)† | | | 257,862 | | | | 18,244 | |
| | | | | | | | | 40,200 | |
| | South Africa—2.3% | | | | | | | | |
| | Capitec Bank Holdings, Ltd. (Banks) | | | 100,167 | | | | 11,830 | |
| | Clicks Group, Ltd. (Food & staples retailing) | | | 233,027 | | | | 4,009 | |
| | Naspers, Ltd. Class “N” (Internet & direct marketing retail) | | | 60,163 | | | | 12,632 | |
| | | | | | | | | 28,471 | |
| | | | | | | | | | |
| | Emerging Latin America—7.0% | | | | | | | | |
| | Argentina—1.6% | | | | | | | | |
| * | Globant S.A. (IT services)† | | | 29,388 | | | | 6,441 | |
| * | MercadoLibre, Inc. (Internet & direct marketing retail) | | | 8,879 | | | | 13,832 | |
| | | | | | | | | 20,273 | |
| | Brazil—4.5% | | | | | | | | |
| | B3 S.A. - Brasil Bolsa Balcao (Capital markets) | | | 1,842,200 | | | | 6,230 | |
| | Localiza Rent a Car S.A. (Road & rail) | | | 438,300 | | | | 5,640 | |
| | Locaweb Servicos de Internet S.A. (IT services) | | | 862,900 | | | | 4,695 | |
| | Magazine Luiza S.A. (Multiline retail) | | | 1,624,900 | | | | 6,909 | |
| | Patria Investments, Ltd. Class “A” (Capital markets)† | | | 206,741 | | | | 3,643 | |
| | Raia Drogasil S.A. (Food & staples retailing) | | | 1,145,600 | | | | 5,691 | |
| * | StoneCo, Ltd. Class “A” (IT services)† | | | 95,928 | | | | 6,433 | |
| | TOTVS S.A. (Software) | | | 924,500 | | | | 6,998 | |
| | | | | | | | |
| | | | | | | | |
| | Issuer | | Shares | | | Value | |
| | | | | | | | |
| | Common Stocks—(continued) | | | | | | | | |
| | | | | | | | | | |
| | Emerging Latin America—(continued) | | | | | | | | |
| | Brazil—(continued) | | | | | | | | |
| * | Vinci Partners Investments, Ltd. Class “A” (Capital markets)† | | | 233,097 | | | $ | 3,380 | |
| | WEG S.A. (Electrical equipment) | | | 1,012,640 | | | | 6,859 | |
| | | | | | | | | 56,478 | |
| | Mexico—0.5% | | | | | | | | |
| | Wal-Mart de Mexico S.A.B. de C.V. (Food & staples retailing) | | | 1,840,800 | | | | 6,012 | |
| | Uruguay—0.4% | | | | | | | | |
| * | Dlocal, Ltd. (IT services)† | | | 88,615 | | | | 4,655 | |
| | Total Common Stocks—100.2%
(cost $826,669) | | | | | | | 1,260,555 | |
| | Total Investments—100.2%
(cost $826,669) | | | | | | | 1,260,555 | |
| | Liabilities, plus cash and other assets—(0.2)% | | | | | | | (2,045 | ) |
| | Net assets—100.0% | | | | | | $ | 1,258,510 | |
ADR = American Depository Receipt
GDR = Global Depository Receipt
* = Non-income producing security
† = U.S. listed foreign security
At June 30, 2021, the Fund’s Portfolio of Investments includes the following industry categories (as a percentage of long-term investments):
| Information Technology | | | 30.2 | % |
| Consumer Discretionary | | | 15.2 | % |
| Communication Services | | | 14.9 | % |
| Financials | | | 10.3 | % |
| Industrials | | | 7.9 | % |
| Health Care | | | 7.6 | % |
| Consumer Staples | | | 6.2 | % |
| Materials | | | 5.8 | % |
| Energy | | | 1.7 | % |
| Utilities | | | 0.2 | % |
| Total | | | 100.0 | % |
At June 30, 2021, the Fund’s Portfolio of Investments includes the following currency categories (as a percentage of long-term investments):
| Hong Kong Dollar | | | 19.8 | % |
| Indian Rupee | | | 17.9 | % |
| New Taiwan Dollar | | | 15.9 | % |
| South Korean Won | | | 14.6 | % |
| U.S. Dollar | | | 13.7 | % |
| Chinese Yuan Renminbi | | | 8.1 | % |
| Brazilian Real | | | 3.4 | % |
| South African Rand | | | 2.3 | % |
| Indonesian Rupiah | | | 1.1 | % |
| Polish Zloty | | | 1.0 | % |
| All Other Currencies | | | 2.2 | % |
| Total | | | 100.0 | % |
See accompanying Notes to Financial Statements.
| 66 | Semiannual Report | June 30, 2021 |
| | Emerging Markets Small Cap Growth Fund |
| | |
| | The Emerging Markets Small Cap Growth Fund seeks long-term capital appreciation. |
| | |
| | AN OVERVIEW FROM THE PORTFOLIO MANAGERS |
| | |
 Todd M. McClone, CFA 
Casey K. Preyss, CFA 
D.J. Neiman, CFA | The William Blair Emerging Markets Small Cap Growth Fund (Class N shares) (the “Fund”) posted a 13.55% increase, net of fees, for the six months ended June 30, 2021. By comparison, the Fund’s benchmark index, the MSCI Emerging Markets Small Cap Index (net) (the “Index”), increased 19.78%. Six-month underperformance versus the Index was primarily driven by negative stock selection across most sectors amid the broad style headwind. Stock selection within the Industrials sector was particularly weak, hurt by lack of exposure to Marine Transportation and Machinery names. Zhejiang Dingli Machinery, the largest supplier of aerial working platforms in China, and Randon Implementos, the Brazilian truck and automotive equipment manufacturer, dragged down results within the Machinery industry. Escorts, the Indian tractor manufacturer, also detracted to relative performance as COVID-19 concerns led to downward revisions to earnings estimates. Partially offsetting these effects was positive stock selection within the Consumer Discretionary and Health Care sectors. Within Consumer Discretionary, Momo.com and F&F Holdings were notable contributors on the back of strong performance in the second quarter. Ovctek China Inc and Laurus Labs Ltd enhanced relative returns within the Health Care sector. Ovctek is the domestic leader and a pioneer of OrthoK lenses in China. The company continued to deliver strong fundamental performance amid robust demand, and margin improvement from a favorable product mix and the company’s transition to a direct sales model. Please refer to the Global Markets Review and Outlook relating to the Fund beginning on page 29. |
| June 30, 2021 | William Blair Funds | 67 |
Emerging Markets Small Cap Growth Fund
Performance Highlights (Unaudited)
Average Annual Total Returns through 6/30/2021
| | | Year
to Date | | 1 Year | | 3 Year | | 5 Year | | Since
Inception |
| Class N(a) | | | 13.55 | % | | | 48.67 | % | | | 15.13 | % | | | 12.67 | % | | | 11.94 | % |
| Class I(a) | | | 13.71 | | | | 49.10 | | | | 15.43 | | | | 13.00 | | | | 12.25 | |
| MSCI Emerging Markets Small Cap Index (net)(a) | | | 19.78 | | | | 63.75 | | | | 12.31 | | | | 11.86 | | | | 7.04 | |
| Class R6(b) | | | 13.73 | | | | 49.20 | | | | 15.49 | | | | 13.06 | | | | 10.77 | |
| MSCI Emerging Markets Small Cap Index (net)(b) | | | 19.78 | | | | 63.75 | | | | 12.31 | | | | 11.86 | | | | 6.53 | |
| (a) | Since inception is for the period from October 24, 2011 (Commencement of Operations) to June 30, 2021. |
| (b) | Since inception is for the period from December 20, 2012 (Commencement of Operations) to June 30, 2021. |
Performance cited represents past performance. Past performance does not guarantee future results and current performance may be lower or higher than the data quoted. Results shown are average annual total returns, which assume reinvestment of dividends and capital gains. Investment returns and principal will fluctuate and you may have a gain or loss when you sell shares. For the most current month-end performance information, please call 1-800-742-7272, or visit our Web site at www.williamblairfunds.com. From time to time, the investment adviser may waive fees or reimburse expenses for the Fund. Without these waivers/reimbursements, performance would be lower. International investing involves special risk considerations, including currency fluctuations, lower liquidity, economic and political risk. These risks may be magnified when investing in emerging markets. Smaller capitalization stocks are also more sensitive to purchase/sale transactions and changes in the issuer’s financial condition. Class N shares are not subject to a sales load. Class I shares are not subject to a sales load or distribution (Rule 12b-1) fees. Class R6 shares are not subject to a sales load, distribution (Rule 12b-1) fees, or sub-transfer agent fees.
The performance highlights and graph presented above do not reflect the deduction of taxes that a shareholder would pay on fund distributions or the redemption of fund shares.
The Morgan Stanley Capital International (MSCI) Emerging Markets Small Cap Index (net) is a free float-adjusted market capitalization index that is designed to measure the equity market performance of emerging markets. This index approximates the minimum possible dividend reinvestment by deducting for the highest possible withholding tax rates of those markets.
This report identifies the Fund’s investments on June 30, 2021. These holdings are subject to change. Not all stocks in the Fund performed the same, nor is there any guarantee that these stocks will perform as well in the future. Market forecasts provided in this report may not necessarily come to pass.
Sector Diversification (Unaudited)

The sector diversification shown is based on the total long-term securities.
| 68 | Semiannual Report | June 30, 2021 |
Emerging Markets Small Cap Growth Fund
Portfolio of Investments, June 30, 2021 (all dollar amounts in thousands) (unaudited)
| | | | | | | | |
| | | | | | | | |
| | Issuer | | Shares | | | Value | |
| | | | | | | | |
| | Common Stocks | | | | | | | | |
| | | | | | | | | | |
| | Emerging Asia—80.2% | | | | | | | | |
| | Cambodia—0.2% | | | | | | | | |
| | NagaCorp, Ltd. (Hotels, restaurants & leisure) | | | 856,000 | | | $ | 826 | |
| | China—14.1% | | | | | | | | |
| | A-Living Smart City Services Co., Ltd. (Commercial services & supplies) | | | 740,500 | | | | 3,686 | |
| | By-health Co., Ltd. Class “A” (Personal products) | | | 1,032,500 | | | | 5,257 | |
| | Centre Testing International Group Co., Ltd. Class “A” (Professional services) | | | 2,531,705 | | | | 12,491 | |
| | Chacha Food Co., Ltd. Class “A” (Food products) | | | 156,173 | | | | 1,042 | |
| | Changzhou Xingyu Automotive Lighting Systems Co., Ltd. Class “A” (Auto components) | | | 121,735 | | | | 4,253 | |
| | China Lesso Group Holdings, Ltd. (Building products) | | | 1,686,000 | | | | 4,161 | |
| | China Meidong Auto Holdings, Ltd. (Specialty retail) | | | 670,000 | | | | 3,654 | |
| * | Estun Automation Co., Ltd. Class “A” (Machinery) | | | 459,000 | | | | 2,774 | |
| | Ever Sunshine Lifestyle Services Group, Ltd. (Commercial services & supplies) | | | 1,662,000 | | | | 4,127 | |
| * | iClick Interactive Asia Group, Ltd.—ADR (Media) | | | 175,660 | | | | 1,939 | |
| | Jiumaojiu International Holdings, Ltd. (Hotels, restaurants & leisure) | | | 2,047,000 | | | | 8,371 | |
| | JNBY Design, Ltd. (Textiles, apparel & luxury goods) | | | 712,000 | | | | 1,265 | |
| * | Kingsoft Cloud Holdings, Ltd.—ADR (IT services) | | | 21,413 | | | | 726 | |
| | Ovctek China, Inc. Class “A” (Health care equipment & supplies) | | | 120,006 | | | | 1,923 | |
| | Proya Cosmetics Co., Ltd. Class “A” (Personal products) | | | 173,824 | | | | 5,292 | |
| | Shanghai M&G Stationery, Inc. Class “A” (Commercial services & supplies) | | | 138,319 | | | | 1,810 | |
| | Skshu Paint Co., Ltd. Class “A” (Chemicals) | | | 116,363 | | | | 3,170 | |
| * | Weimob, Inc. (Software) | | | 1,535,000 | | | | 3,385 | |
| | | | | | | | | 69,326 | |
| | India—35.3% | | | | | | | | |
| | Aarti Industries, Ltd. (Chemicals) | | | 582,732 | | | | 6,844 | |
| * | Aavas Financiers, Ltd. (Thrifts & mortgage finance) | | | 71,661 | | | | 2,573 | |
| * | Affle India, Ltd. (Media) | | | 50,739 | | | | 2,938 | |
| * | Amber Enterprises India, Ltd. (Household durables) | | | 56,959 | | | | 2,238 | |
| | Apollo Hospitals Enterprise, Ltd. (Health care providers & services) | | | 55,654 | | | | 2,709 | |
| | Astral Poly Technik, Ltd. (Building products) | | | 318,088 | | | | 8,516 | |
| * | Atul, Ltd. (Chemicals) | | | 67,431 | | | | 8,083 | |
| * | AU Small Finance Bank Ltd. (Banks) | | | 632,417 | | | | 8,844 | |
| | Balkrishna Industries, Ltd. (Auto components) | | | 267,928 | | | | 8,103 | |
| | | | | | | | |
| | | | | | | | |
| | Issuer | | Shares | | | Value | |
| | | | | | | | |
| | Common Stocks—(continued) | | | | | | | | |
| | | | | | | | | | |
| | Emerging Asia—(continued) | | | | | | | | |
| | India—(continued) | | | | | | | | |
| | Berger Paints India, Ltd. (Chemicals) | | | 117,586 | | | $ | 1,275 | |
| | Cholamandalam Investment and Finance Co., Ltd. (Consumer finance) | | | 691,128 | | | | 4,769 | |
| | City Union Bank, Ltd. (Banks) | | | 732,830 | | | | 1,642 | |
| | Coforge, Ltd. (IT services) | | | 103,695 | | | | 5,804 | |
| | Computer Age Management Services, Ltd. (IT services) | | | 93,286 | | | | 3,508 | |
| | Crompton Greaves Consumer Electricals, Ltd. (Household durables) | | | 463,942 | | | | 2,707 | |
| * | Dixon Technologies India, Ltd. (Household durables) | | | 89,971 | | | | 5,340 | |
| | Dr. Lal PathLabs, Ltd. (Health care providers & services) | | | 93,030 | | | | 4,101 | |
| * | Endurance Technologies, Ltd. (Auto components) | | | 59,371 | | | | 1,294 | |
| * | Godrej Properties, Ltd. (Real estate management & development) | | | 193,880 | | | | 3,638 | |
| | Havells India, Ltd. (Electrical equipment) | | | 75,382 | | | | 994 | |
| | HDFC Asset Management Co., Ltd. (Capital markets) | | | 18,627 | | | | 731 | |
| * | IndiaMart InterMesh Ltd. (Trading companies & distributors) | | | 25,641 | | | | 2,414 | |
| | Indraprastha Gas, Ltd. (Gas utilities) | | | 200,319 | | | | 1,501 | |
| * | JK Cement, Ltd. (Construction materials) | | | 94,659 | | | | 3,631 | |
| | Kajaria Ceramics, Ltd. (Building products) | | | 90,303 | | | | 1,187 | |
| | Kansai Nerolac Paints, Ltd. (Chemicals) | | | 307,741 | | | | 2,310 | |
| * | KEC International, Ltd. (Construction & engineering) | | | 126,246 | | | | 774 | |
| | Larsen & Toubro Infotech Ltd. (IT services) | | | 99,520 | | | | 5,451 | |
| | Laurus Labs Ltd. (Pharmaceuticals) | | | 541,230 | | | | 5,035 | |
| * | MakeMyTrip, Ltd. (Hotels, restaurants & leisure)† | | | 58,439 | | | | 1,756 | |
| | Metropolis Healthcare, Ltd. (Health care providers & services) | | | 95,347 | | | | 3,610 | |
| * | Motherson Sumi Systems, Ltd. (Auto components) | | | 1,230,554 | | | | 4,014 | |
| | Navin Fluorine International, Ltd. (Chemicals) | | | 113,957 | | | | 5,757 | |
| * | Oberoi Realty, Ltd. (Real estate management & development) | | | 363,119 | | | | 3,070 | |
| | PI Industries, Ltd. (Chemicals) | | | 165,023 | | | | 6,486 | |
| * | Pidilite Industries, Ltd. (Chemicals) | | | 26,073 | | | | 756 | |
| | Radico Khaitan, Ltd. (Beverages) | | | 328,814 | | | | 3,347 | |
| * | RBL Bank, Ltd. (Banks) | | | 348,999 | | | | 988 | |
| * | Relaxo Footwears, Ltd. (Textiles, apparel & luxury goods) | | | 320,210 | | | | 4,963 | |
| | SRF, Ltd. (Chemicals) | | | 84,322 | | | | 8,259 | |
| | Sundram Fasteners, Ltd. (Auto components) | | | 164,973 | | | | 1,799 | |
| | Tata Elxsi, Ltd. (Software) | | | 113,242 | | | | 6,627 | |
| | Trent, Ltd. (Multiline retail) | | | 343,958 | | | | 3,931 | |
| * | V-Mart Retail, Ltd. (Multiline retail) | | | 29,504 | | | | 1,119 | |
| | Varun Beverages, Ltd. (Beverages) | | | 611,448 | | | | 6,002 | |
| | Vinati Organics, Ltd. (Chemicals) | | | 71,863 | | | | 1,771 | |
| | | | | | | | | 173,209 | |
See accompanying Notes to Financial Statements.
| June 30, 2021 | William Blair Funds | 69 |
Emerging Markets Small Cap Growth Fund
Portfolio of Investments, June 30, 2021 (all dollar amounts in thousands) (unaudited)
| | | | | | | | |
| | | | | | | | |
| | Issuer | | Shares | | | Value | |
| | | | | | | | |
| | Common Stocks—(continued) | | | | | | | | |
| | | | | | | | | | |
| | Emerging Asia—(continued) | | | | | | | | |
| | Indonesia—0.4% | | | | | | | | |
| | PT Bank Tabungan Pensiunan Nasional Syariah Tbk (Banks) | | | 9,273,700 | | | $ | 1,842 | |
| | Malaysia—1.3% | | | | | | | | |
| | Inari Amertron Bhd (Electronic equipment, instruments & components) | | | 5,925,000 | | | | 4,524 | |
| | MR DIY Group M Bhd (Specialty retail) | | | 2,238,800 | | | | 1,936 | |
| | | | | | | | | 6,460 | |
| | Philippines—1.1% | | | | | | | | |
| | International Container Terminal Services, Inc. (Transportation infrastructure) | | | 630,560 | | | | 2,115 | |
| | Wilcon Depot, Inc. (Specialty retail) | | | 7,721,600 | | | | 3,187 | |
| | | | | | | | | 5,302 | |
| | South Korea—9.4% | | | | | | | | |
| * | Doosan Fuel Cell Co., Ltd. (Electrical equipment) | | | 19,309 | | | | 857 | |
| | Douzone Bizon Co., Ltd. (Software) | | | 14,768 | | | | 1,089 | |
| * | F&F Co., Ltd. (Textiles, apparel & luxury goods) | | | 19,881 | | | | 9,886 | |
| | Hansol Chemical Co., Ltd. (Chemicals) | | | 33,293 | | | | 7,258 | |
| | LEENO Industrial, Inc. (Semiconductors & semiconductor equipment) | | | 50,471 | | | | 7,865 | |
| * | NHN KCP Corporation (IT services) | | | 51,323 | | | | 2,648 | |
| | NICE Information Service Co., Ltd. (Professional services) | | | 267,310 | | | | 5,958 | |
| | PI Advanced Materials Co., Ltd. (Chemicals) | | | 100,351 | | | | 4,901 | |
| | RFHIC Corporation (Semiconductors & semiconductor equipment) | | | 7,960 | | | | 281 | |
| | WONIK IPS Co., Ltd. (Semiconductors & semiconductor equipment) | | | 116,704 | | | | 5,140 | |
| | | | | | | | | 45,883 | |
| | Taiwan—15.6% | | | | | | | | |
| | Airtac International Group (Machinery) | | | 211,000 | | | | 8,141 | |
| | Alchip Technologies, Ltd. (Semiconductors & semiconductor equipment) | | | 57,000 | | | | 1,250 | |
| | ASMedia Technology, Inc. (Semiconductors & semiconductor equipment) | | | 26,000 | | | | 1,255 | |
| | ASPEED Technology, Inc. (Semiconductors & semiconductor equipment) | | | 133,000 | | | | 9,595 | |
| | Elite Material Co., Ltd. (Electronic equipment, instruments & components) | | | 533,000 | | | | 4,170 | |
| * | eMemory Technology, Inc. (Semiconductors & semiconductor equipment) | | | 155,000 | | | | 7,427 | |
| | Hiwin Technologies Corporation (Machinery) | | | 160,106 | | | | 2,270 | |
| | Lotes Co., Ltd. (Electronic equipment, instruments & components) | | | 240,000 | | | | 5,030 | |
| | Makalot Industrial Co., Ltd. (Textiles, apparel & luxury goods) | | | 361,000 | | | | 3,550 | |
| * | momo.com, Inc. (Internet & direct marketing retail) | | | 123,000 | | | | 8,321 | |
| | Parade Technologies, Ltd. (Semiconductors & semiconductor equipment) | | | 134,000 | | | | 6,661 | |
| | | | | | | | |
| | | | | | | | |
| | Issuer | | Shares | | | Value | |
| | | | | | | | |
| | Common Stocks—(continued) | | | | | | | | |
| | | | | | | | | | |
| | Emerging Asia—(continued) | | | | | | | | |
| | Taiwan—(continued) | | | | | | | | |
| * | Poya International Co., Ltd. (Multiline retail) | | | 111,000 | | | $ | 2,163 | |
| | RichWave Technology Corporation (Semiconductors & semiconductor equipment) | | | 105,000 | | | | 1,826 | |
| | Sinbon Electronics Co., Ltd. (Electronic equipment, instruments & components) | | | 799,000 | | | | 7,857 | |
| | Sporton International, Inc. (Professional services) | | | 261,000 | | | | 2,248 | |
| | Voltronic Power Technology Corporation (Electrical equipment) | | | 103,507 | | | | 4,997 | |
| | | | | | | | | 76,761 | |
| | Thailand—2.1% | | | | | | | | |
| | Carabao Group PCL Class “F” (Beverages) | | | 124,000 | | | | 547 | |
| | Com7 PCL Class “F” (Specialty retail) | | | 2,935,800 | | | | 6,389 | |
| | Muangthai Capital PCL (Consumer finance) | | | 1,945,200 | | | | 3,490 | |
| | | | | | | | | 10,426 | |
| | Vietnam—0.7% | | | | | | | | |
| | Hoa Phat Group JSC (Metals & mining) | | | 1,516,220 | | | | 3,393 | |
| | | | | | | | | | |
| | Emerging Latin America—12.0% | | | | | | | | |
| | Brazil—9.3% | | | | | | | | |
| * | Aeris Industria E Comercio De Equipamentos Para Geracao De Energia S.A. (Electrical equipment) | | | 648,500 | | | | 1,293 | |
| | Arezzo Industria e Comercio S.A. (Textiles, apparel & luxury goods) | | | 167,600 | | | | 3,184 | |
| * | Azul S.A.—ADR (Airlines) | | | 136,068 | | | | 3,592 | |
| | Cyrela Brazil Realty S.A. Empreendimentos e Participacoes (Household durables) | | | 158,300 | | | | 743 | |
| * | Grupo SBF S.A. (Specialty retail) | | | 267,100 | | | | 2,055 | |
| * | Infracommerce CXAAS S.A. (Interactive Media & Services) | | | 671,000 | | | | 3,208 | |
| | Locaweb Servicos de Internet S.A. (IT services) | | | 1,690,578 | | | | 9,198 | |
| | Pet Center Comercio e Participacoes S.A. (Specialty retail) | | | 1,215,600 | | | | 6,296 | |
| * | Sequoia Logistica e Transportes S.A. (Air freight & logistics) | | | 661,500 | | | | 3,743 | |
| | TOTVS S.A. (Software) | | | 1,625,600 | | | | 12,305 | |
| | | | | | | | | 45,617 | |
| | Mexico—2.0% | | | | | | | | |
| * | Grupo Aeroportuario del Centro Norte S.A.B. de C.V. (Transportation infrastructure) | | | 689,799 | | | | 4,519 | |
| * | Grupo Aeroportuario del Sureste S.A.B. de C.V. Class “B” (Transportation infrastructure) | | | 297,510 | | | | 5,477 | |
| | | | | | | | | 9,996 | |
| | Uruguay—0.7% | | | | | | | | |
| * | Dlocal, Ltd. (IT services)† | | | 64,324 | | | | 3,379 | |
See accompanying Notes to Financial Statements.
| 70 | Semiannual Report | June 30, 2021 |
Emerging Markets Small Cap Growth Fund
Portfolio of Investments, June 30, 2021 (all dollar amounts in thousands) (unaudited)
| | Issuer | | Shares or
Principal
Amount | | | Value | |
| | | | | | | | |
| | Common Stocks—(continued) | | | | | | | | |
| | | | | | | | | | |
| | Emerging Europe, Mid-East, Africa—8.5% | | | | | | | | |
| | Greece—0.7% | | | | | | | | |
| | Terna Energy S.A. (Independent power & renewable electricity producers) | | | 233,614 | | | $ | 3,296 | |
| | Kenya—0.8% | | | | | | | | |
| | Safaricom plc (Wireless telecommunication services) | | | 10,331,200 | | | | 4,022 | |
| | Poland—1.4% | | | | | | | | |
| * | Dino Polska S.A. (Food & staples retailing) | | | 92,425 | | | | 6,785 | |
| | Russia—3.7% | | | | | | | | |
| | HeadHunter Group plc—ADR (Professional services) | | | 152,513 | | | | 6,462 | |
| * | Ozon Holdings plc—ADR (Internet & direct marketing retail) | | | 58,407 | | | | 3,424 | |
| | TCS Group Holding plc—GDR (Banks) | | | 96,302 | | | | 8,426 | |
| | | | | | | | | 18,312 | |
| | South Africa—1.4% | | | | | | | | |
| | Clicks Group, Ltd. (Food & staples retailing) | | | 70,316 | | | | 1,210 | |
| | Transaction Capital, Ltd. (Consumer finance) | | | 2,115,179 | | | | 5,602 | |
| | | | | | | | | 6,812 | |
| | United Arab Emirates—0.5% | | | | | | | | |
| | Abu Dhabi National Oil Co. for Distribution PJSC (Specialty retail) | | | 2,307,721 | | | | 2,720 | |
| | Total Common Stocks—100.7%
(cost $385,723) | | | | | | | 494,367 | |
| | | | | | | | | | |
| | Repurchase Agreement | | | | | | | | |
| | Fixed Income Clearing Corporation, 0.000% dated 6/30/21, due 7/1/21, repurchase price $2,969, collateralized by U.S. Treasury Bond, 1.875%, due 2/15/41, valued at $3,029 | | | $2,969 | | | | 2,969 | |
| | Total Repurchase Agreement—0.6%
(cost $2,969) | | | | | | | 2,969 | |
| | Total Investments—101.3%
(cost $388,692) | | | | | | | 497,336 | |
| | Liabilities, plus cash and other assets—(1.3)% | | | | | | | (6,482 | ) |
| | Net assets—100.0% | | | | | | $ | 490,854 | |
ADR = American Depository Receipt
GDR = Global Depository Receipt
* = Non-income producing security
† = U.S. listed foreign security
At June 30, 2021, the Fund’s Portfolio of Investments includes the following industry categories (as a percentage of long-term investments):
| Information Technology | | | 23.7 | % |
| Consumer Discretionary | | | 22.1 | % |
| Industrials | | | 19.1 | % |
| Materials | | | 12.9 | % |
| Financials | | | 7.9 | % |
| Consumer Staples | | | 6.0 | % |
| Health Care | | | 3.5 | % |
| Communication Services | | | 2.4 | % |
| Real Estate | | | 1.4 | % |
| Utilities | | | 1.0 | % |
| Total | | | 100.0 | % |
At June 30, 2021, the Fund’s Portfolio of Investments includes the following currency categories (as a percentage of long-term investments):
| Indian Rupee | | | 34.7 | % |
| New Taiwan Dollar | | | 15.5 | % |
| South Korean Won | | | 9.3 | % |
| Brazilian Real | | | 8.5 | % |
| Chinese Yuan Renminbi | | | 7.7 | % |
| U.S. Dollar | | | 6.0 | % |
| Hong Kong Dollar | | | 5.9 | % |
| Thai Baht | | | 2.1 | % |
| Mexican Peso | | | 2.0 | % |
| South African Rand | | | 1.4 | % |
| Polish Zloty | | | 1.4 | % |
| Malaysian Ringgit | | | 1.3 | % |
| Philippine Peso | | | 1.1 | % |
| All Other Currencies | | | 3.1 | % |
| Total | | | 100.0 | % |
See accompanying Notes to Financial Statements.
| June 30, 2021 | William Blair Funds | 71 |
Fixed Income Market Review and Outlook
The Bloomberg Barclays U.S. Aggregate Index decreased 1.60% in the first half of 2021. Treasury yields peaked at 1.74% for the 10-year in March, driven by an improving economic outlook as the COVID-19 vaccine continued to roll out, fiscal stimulus, record amounts of Treasury issuance, and rising inflation expectations. In the second quarter intermediate and long-end Treasury yields fell as optimism was tempered by weaker-than-expected data, which reinforced the Federal Reserve’s (Fed) accommodative posture and “transitory” inflation narrative. With rising yields as a headwind to start the year, longer-dated assets such as U.S. Treasuries, Investment Grade Corporates, Agencies, Emerging Market Debt and Mortgage-Backed Securities sectors posted negative returns. On the positive side, improving economic conditions and falling default expectations aided the outperformance of high yield corporate debt, while increasing inflation expectations supported the performance of U.S. Treasury Inflation-Protected Securities (TIPS).
Markit Purchasing Managers Index (PMI) readings improved in the first half of the year, topping out in May as Services touched 70.4, and Manufacturing hit 62.1, where measurements of 50+ are considered expansionary. The pace of COVID-19-driven relocation home purchases slowed, down to 5.8 million after hitting a high of 6.7 million in October 2020. In a sign of strength for the consumer, credit card delinquencies continued to fall, hitting lows in May. New vehicle purchases hit a high in April but reverted to the lower end of the 15-16 million unit range at the end of June, and the value of used cars hit their high point in May before slowing in June.
The Fed’s Federal Open Market Committee (FOMC) held rates steady in the period and reiterated their commitment to maintaining an accommodative stance to generate moderately higher inflation and reduce the jobless rate. The Fed did adjust the floor for overnight rates (“IOER,” Interest on Excess Reserves, and “RRP,” Reverse Repo Program) by +5 basis points to address collateral needs in that segment of the market. The Fed has communicated that they will not hike Federal Funds rates in 2021, and the markets are pricing in 1-2 hikes starting in 2022. The Fed’s balance sheet pushed north of $8 trillion as it continued open market purchases, also known as quantitative easing, to enable looser monetary conditions.
Our base case is that the FOMC will not hike rates in 2021, which will hold short-end rates to the zero lower-bound, despite recent adjustments to the floor. Further, we believe that the FOMC will be very patient in reducing or removing stimulus and tightening monetary conditions. In this environment we continue to find that TIPS are an attractive alternative to fixed-rate Treasuries to mitigate the effects of rising rates driven by accelerating inflationary pressures.
In our opinion spread sectors remain relatively attractive to Treasuries over the intermediate-to-long term as Treasury supply has been increasing at record levels. However, in the shorter-term, if economic data disappoints to the downside, Treasuries could outperform. Within corporate bonds, it appears that security selection will continue to be critical going forward as certain industries and business models are more adapted to successfully navigating the post-COVID-19 pandemic environment than others. Nominal yields are near all-time lows but we believe tight spreads and valuations are supported by strong fundamentals. Default projections have improved, and companies continued to be opportunistic in issuance, extending maturities, and managing their debt profile.
We continue to look for opportunities in the mortgage sector given the potential for attractive spreads, income generation, and duration profile. The sector also benefits from the fundamental tailwind provided by the undersupply of housing. We are also focused on pre-payment speeds given greater refinancing activity driven by factors such as higher home prices, lower interest rates, and new technology.
In asset-backed securities, we are looking for opportunities within autos and credit cards as the consumer is recovering after entering the COVID-19 pandemic in a relatively stronger position compared to previous periods. Our focus has been on prime borrowers, who have continued to do well.
| 72 | Semiannual Report | June 30, 2021 |
| | Bond Fund |
| | |
| | The Bond Fund seeks to outperform the Bloomberg Barclays U.S. Aggregate Index by maximizing total return through a combination of income and capital appreciation. |
| | |
| | AN OVERVIEW FROM THE PORTFOLIO MANAGERS |
| | |

Ruta Ziverte 
Vesta Marks, CFA, CAIA | The William Blair Bond Fund (Class N shares) returned a 1.23% decrease, net of fees, for the six months ended June 30, 2021. By comparison, the Fund’s benchmark, the Bloomberg Barclays U.S. Aggregate Index (the “Index”), decreased 1.60%. The Fund outperformed the Index in the first half of the year as security selection and sector allocation drove excess returns, which offset the negative performance impact of rising yields in the first quarter. The yield curve steepened in the first half of the year as longer-term yields rose while front-end (under two years maturity) yields declined modestly. Our underweight to U.S. Treasuries, driven by valuations, was the largest contributor to relative performance. Within the Treasury sector we opted to use a portion of our allocation to invest in inflation-linked U.S. Treasury Inflation-Protected Securities as they looked attractive versus nominal Treasuries as inflation expectations rose in the period. We held an overweight position in agency mortgage-backed securities (“MBS”) in the period and security selection within the sector drove relative performance as coupon income outweighed the negative performance impact of rising rates. The Federal Reserve has been actively purchasing lower-coupon agency MBS to support the housing market. We have held an underweight in this portion of the market given poor valuations, low income, and longer duration profile, which has benefitted relative performance as this segment underperformed the rest of the sector. The asset allocation decision to invest in high yield corporate debt benefitted performance as this was the best performing sector of the market given falling default expectations. Security selection in emerging markets debt was also beneficial for performance as Fund holdings outperformed the emerging markets debt portion of the Index. Conversely, the Fund’s emphasis of non-cyclical and long-maturity high grade bonds detracted from performance as the yield curve steepened and corporate performance favored cyclical names. Overall, interest rate positioning was a relative detractor from an attribution perspective, driven primarily by the Fund’s positioning in agency MBS and investment grade corporate debt. The use of credit default swap index hedging, used to reduce credit exposure at the margin, detracted from performance as credit spreads tightened in the period. Please refer to the Fixed Income Market Review and Outlook relating to the Fund on page 72. |
| June 30, 2021 | William Blair Funds | 73 |
Bond Fund
Performance Highlights (Unaudited)
| Average Annual Total Returns through 6/30/2021 |
| | | Year
to Date | | 1 Year | | 3 Year | | 5 Year | | 10 Year |
| Class N | | | (1.23 | )% | | | 1.93 | % | | | 5.65 | % | | | 3.46 | % | | | 3.86 | % |
| Class I | | | (1.09 | ) | | | 2.16 | | | | 5.79 | | | | 3.64 | | | | 4.04 | |
| Class R6 | | | (1.16 | ) | | | 2.12 | | | | 5.85 | | | | 3.70 | | | | 4.13 | |
| Bloomberg Barclays U.S. Aggregate Index | | | (1.60 | ) | | | (0.33 | ) | | | 5.34 | | | | 3.03 | | | | 3.39 | |
Performance cited represents past performance. Past performance does not guarantee future results and current performance may be lower or higher than the data quoted. Results shown are average annual total returns, which assume reinvestment of dividends and capital gains. Investment returns and principal will fluctuate and you may have a gain or loss when you sell shares. For the most current month-end performance information, please call 1-800-742-7272, or visit our Web site at www.williamblairfunds.com. From time to time, the investment adviser may waive fees or reimburse expenses for the Fund. Without these waivers/reimbursements, performance would be lower. Class N shares are not subject to a sales load. Class I shares are not subject to a sales load or distribution (Rule 12b-1) fees. Class R6 shares are not subject to a sales load, distribution (Rule 12b-1) fees, or sub-transfer agent fees.
The performance highlights and graph presented above do not reflect the deduction of taxes that a shareholder would pay on fund distributions or the redemption of fund shares.
The Bloomberg Barclays U.S. Aggregate Index indicates broad intermediate government/corporate bond market performance.
This report identifies the Fund’s investments on June 30, 2021. These holdings are subject to change. Not all investments in the Fund performed the same, nor is there any guarantee that these investments will perform as well in the future. Market forecasts provided in this report may not necessarily come to pass.
| Sector Diversification (Unaudited) |

The sector diversification shown is based on the total investments.
| 74 | Semiannual Report | June 30, 2021 |
Bond Fund
Portfolio of Investments, June 30, 2021 (all dollar amounts in thousands) (unaudited)
| | | | | | | | |
| | Issuer | | Principal
Amount | | Value | |
| | | | | | | | | | |
| | U.S. Government and U.S. Government Agency—51.9% | | | |
| | U.S. Treasury Inflation Indexed Notes/Bonds—7.0% | | | | | | | | |
| | U.S. Treasury Inflation Indexed Bond, 3.875%, due 4/15/29 | | $ | 11,937 | | | $ | 16,804 | |
| | U.S. Treasury Inflation Indexed Bond, 3.375%, due 4/15/32 | | | 541 | | | | 800 | |
| | U.S. Treasury Inflation Indexed Bond, 1.375%, due 2/15/44 | | | 4,176 | | | | 5,781 | |
| | Total U.S. Treasury Inflation Indexed Notes/Bonds | | | | | | | 23,385 | |
| | U.S. Treasury—7.8% | | | | | | | | |
| | U.S. Treasury Bill, 0.101%, due 7/15/21 | | | 1,000 | | | | 1,000 | |
| | U.S. Treasury Bill, 0.123%, due 10/7/21(a) | | | 2,000 | | | | 1,999 | |
| | U.S. Treasury Bond, 1.125%, due 5/15/40 | | | 2,000 | | | | 1,729 | |
| | U.S. Treasury Bond, 2.375%, due 11/15/49 | | | 2,267 | | | | 2,416 | |
| | U.S. Treasury Bond, 1.250%, due 5/15/50 | | | 1,500 | | | | 1,226 | |
| | U.S. Treasury Note, 0.350%, due 10/31/21 | | | 5,000 | | | | 5,005 | |
| | U.S. Treasury Note, 1.125%, due 2/28/27 | | | 2,250 | | | | 2,268 | |
| | U.S. Treasury Note, 0.625%, due 5/15/30 | | | 2,100 | | | | 1,965 | |
| | U.S. Treasury Note, 0.625%, due 8/15/30 | | | 4,300 | | | | 4,010 | |
| | U.S. Treasury Strip Principal, 0.000%, due 8/15/27 | | | 4,750 | | | | 4,451 | |
| | Total U.S. Treasury | | | | | | | 26,069 | |
| | Federal Home Loan Mortgage Corp. (FHLMC)—9.1% | | | | | | | | |
| | #G30255, 7.000%, due 7/1/21 | | | — | | | | — | (b) |
| | #J02986, 6.500%, due 7/1/21 | | | — | | | | — | (b) |
| | #G02210, 7.000%, due 12/1/28 | | | 23 | | | | 26 | |
| | #G02183, 6.500%, due 3/1/30 | | | 3 | | | | 3 | |
| | #G01400, 7.000%, due 4/1/32 | | | 293 | | | | 346 | |
| | #G01728, 7.500%, due 7/1/32 | | | 48 | �� | | | 57 | |
| | #C01385, 6.500%, due 8/1/32 | | | 37 | | | | 43 | |
| | #ZT1221, 5.500%, due 1/1/33 | | | 420 | | | | 485 | |
| | #C01623, 5.500%, due 9/1/33 | | | 42 | | | | 49 | |
| | #A15039, 5.500%, due 10/1/33 | | | 2 | | | | 2 | |
| | #A17603, 5.500%, due 1/1/34 | | | 1,104 | | | | 1,287 | |
| | #G01843, 6.000%, due 6/1/35 | | | 8 | | | | 10 | |
| | #A62858, 6.500%, due 7/1/37 | | | 54 | | | | 62 | |
| | #G03170, 6.500%, due 8/1/37 | | | 95 | | | | 113 | |
| | #A78138, 5.500%, due 6/1/38 | | | 106 | | | | 121 | |
| | #G04466, 5.500%, due 7/1/38 | | | 7,876 | | | | 9,282 | |
| | #G60366, 6.000%, due 10/1/39 | | | 7,528 | | | | 9,004 | |
| | #G61450, 6.000%, due 4/1/40 | | | 7,943 | | | | 9,511 | |
| | #C03665, 9.000%, due 4/1/41 | | | 165 | | | | 200 | |
| | Total FHLMC Mortgage Obligations | | | | | | | 30,601 | |
| | Federal National Mortgage Association (FNMA)—28.0% | | | | | | | | |
| | #900725, 6.000%, due 8/1/21 | | | — | | | | — | (b) |
| | #893325, 7.000%, due 9/1/21 | | | — | | | | — | (b) |
| | #735104, 7.000%, due 5/1/22 | | | — | | | | — | (b) |
| | | | | | | | |
| | Issuer | | Principal
Amount | | Value | |
| | | | | | | | | | |
| | U.S. Government and U.S. Government Agency—(continued) | | | |
| | Federal National Mortgage Association (FNMA)—(continued) | | | | | | | | |
| | #255956, 5.500%, due 10/1/25 | | $ | 4 | | | $ | 5 | |
| | #252925, 7.500%, due 12/1/29 | | | — | | | | 1 | |
| | #AD0729, 7.500%, due 12/1/30 | | | 2,023 | | | | 2,353 | |
| | #535977, 6.500%, due 4/1/31 | | | 3 | | | | 4 | |
| | #253907, 7.000%, due 7/1/31 | | | 1 | | | | 1 | |
| | #587849, 6.500%, due 11/1/31 | | | 4 | | | | 4 | |
| | #545437, 7.000%, due 2/1/32 | | | 23 | | | | 26 | |
| | #545759, 6.500%, due 7/1/32 | | | 191 | | | | 226 | |
| | #545869, 6.500%, due 7/1/32 | | | 658 | | | | 775 | |
| | #670385, 6.500%, due 9/1/32 | | | 283 | | | | 334 | |
| | #254548, 5.500%, due 12/1/32 | | | 17 | | | | 20 | |
| | #AD0725, 7.000%, due 12/1/32 | | | 946 | | | | 1,130 | |
| | #555340, 5.500%, due 4/1/33 | | | 144 | | | | 168 | |
| | #741850, 5.500%, due 9/1/33 | | | 228 | | | | 263 | |
| | #555800, 5.500%, due 10/1/33 | | | 20 | | | | 23 | |
| | #756153, 5.500%, due 11/1/33 | | | 210 | | | | 242 | |
| | #AL3455, 5.500%, due 11/1/33 | | | 3,164 | | | | 3,678 | |
| | #CA2754, 4.500%, due 11/1/33 | | | 539 | | | | 590 | |
| | #AL3401, 5.500%, due 2/1/34 | | | 617 | | | | 717 | |
| | #763798, 5.500%, due 3/1/34 | | | 38 | | | | 44 | |
| | #725228, 6.000%, due 3/1/34 | | | 1,993 | | | | 2,336 | |
| | #725611, 5.500%, due 6/1/34 | | | 47 | | | | 54 | |
| | #745563, 5.500%, due 8/1/34 | | | 268 | | | | 310 | |
| | #AL6413, 8.000%, due 8/1/34 | | | 234 | | | | 268 | |
| | #794474, 6.000%, due 10/1/34 | | | 24 | | | | 28 | |
| | #745092, 6.500%, due 7/1/35 | | | 148 | | | | 170 | |
| | #357944, 6.000%, due 9/1/35 | | | 7 | | | | 8 | |
| | #AL6412, 7.500%, due 9/1/35 | | | 393 | | | | 450 | |
| | #AD0979, 7.500%, due 10/1/35 | | | 28 | | | | 33 | |
| | #CA8368, 2.000%, due 12/1/35 | | | 4,744 | | | | 4,924 | |
| | #888305, 7.000%, due 3/1/36 | | | 5 | | | | 5 | |
| | #895637, 6.500%, due 5/1/36 | | | 25 | | | | 30 | |
| | #831540, 6.000%, due 6/1/36 | | | 11 | | | | 13 | |
| | #893318, 6.500%, due 8/1/36 | | | 7 | | | | 8 | |
| | #902974, 6.000%, due 12/1/36 | | | 91 | | | | 108 | |
| | #831926, 6.000%, due 12/1/36 | | | 329 | | | | 390 | |
| | #AB0265, 6.000%, due 2/1/37 | | | 6,079 | | | | 7,251 | |
| | #938440, 6.000%, due 7/1/37 | | | 49 | | | | 58 | |
| | #948689, 6.000%, due 8/1/37 | | | 64 | | | | 74 | |
| | #AL6411, 7.000%, due 12/1/37 | | | 968 | | | | 1,115 | |
| | #AL0904, 5.500%, due 1/1/38 | | | 55 | | | | 63 | |
| | #986856, 6.500%, due 9/1/38 | | | 48 | | | | 56 | |
| | #FM1735, 6.500%, due 10/1/38 | | | 3,686 | | | | 4,510 | |
| | #991911, 7.000%, due 11/1/38 | | | 71 | | | | 80 | |
| | #995076, 6.000%, due 11/1/38 | | | 2,808 | | | | 3,364 | |
| | #AD0752, 7.000%, due 1/1/39 | | | 311 | | | | 386 | |
| | #FM2467, 6.000%, due 1/1/39 | | | 3,439 | | | | 4,127 | |
| | #AC1619, 5.500%, due 8/1/39 | | | 162 | | | | 188 | |
| | #FM1736, 6.500%, due 10/1/39 | | | 5,937 | | | | 7,155 | |
| | #BM5204, 6.500%, due 6/1/40 | | | 3,623 | | | | 4,350 | |
| | #AD7137, 5.500%, due 7/1/40 | | | 2,130 | | | | 2,483 | |
| | #BM1689, 5.500%, due 8/1/40 | | | 1,710 | | | | 1,980 | |
| | #AL5815, 5.500%, due 4/1/41 | | | 2,071 | | | | 2,410 | |
| | #BM3525, 6.000%, due 4/1/41 | | | 7,597 | | | | 9,031 | |
| | #AL9226, 5.500%, due 12/1/41 | | | 8,772 | | | | 10,308 | |
| | #AL9225, 6.000%, due 1/1/42 | | | 3,886 | | | | 4,620 | |
| | #BM5121, 5.500%, due 12/1/48 | | | 8,793 | | | | 10,499 | |
| | Total FNMA Mortgage Obligations | | | | | | | 93,847 | |
See accompanying Notes to Financial Statements.
| June 30, 2021 | William Blair Funds | 75 |
Bond Fund
Portfolio of Investments, June 30, 2021 (all dollar amounts in thousands) (unaudited)
| | | | | | | | |
| | Issuer | | Principal
Amount | | Value | |
| | | | | | | | | | |
| | Asset-Backed Securities—2.1% | | | | | | | | |
| | Automobile—2.1% | | | | | | | | |
| | Carmax Auto Owner Trust, 2021-1, Tranche D,
1.280%, 7/15/27 | | $ | 500 | | | $ | 498 | |
| | GM Financial Automobile Leasing Trust, 2020-1, Tranche D,
2.280%, 6/20/24 | | | 3,050 | | | | 3,107 | |
| | Tesla Auto Lease Trust—144A, 2019-A, Tranche E, 5.480%, 5/22/23 | | | 1,650 | | | | 1,732 | |
| | Tesla Auto Lease Trust—144A, 2019-A, Tranche D,
3.370%, 1/20/23 | | | 1,750 | | | | 1,809 | |
| | Total Automobile | | | | | | | 7,146 | |
| | Total Asset-Backed Securities | | | | | | | 7,146 | |
| | | | | | | | | | |
| | Corporate Obligations—45.5% | | | | | | | | |
| | Financials—8.8% | | | | | | | | |
| | Banco Inbursa S.A. Institucion de Banca Multiple—144A,
4.125%, due 6/6/24 | | | 2,000 | | | | 2,135 | |
| | Bank of America Corporation,
5.875%, due 2/7/42 | | | 2,000 | | | | 2,878 | |
| | Boston Properties L.P.,
2.550%, due 4/1/32 | | | 3,200 | | | | 3,227 | |
| | Citigroup, Inc.,
5.875%, due 1/30/42 | | | 2,000 | | | | 2,885 | |
| | ERP Operating L.P.,
4.500%, due 6/1/45 | | | 2,500 | | | | 3,138 | |
| | Itau Unibanco Holding S.A.—144A,
5 year CMT + 3.446%, 3.875%, due 4/15/31, VRN | | | 1,250 | | | | 1,239 | |
| | JPMorgan Chase & Co.,
SOFR + 3.125%, 4.600%, due 2/1/25, VRN | | | 3,000 | | | | 3,113 | |
| | Royal Bank of Canada,
SOFR + 0.525%, 0.548%, due 1/20/26, VRN | | | 3,100 | | | | 3,110 | |
| | Simon Property Group L.P.,
3.300%, due 1/15/26 | | | 2,750 | | | | 2,994 | |
| | The Bank of Nova Scotia,
SOFR + 0.545%, 0.587%, due 3/2/26, VRN | | | 3,100 | | | | 3,105 | |
| | Wells Fargo & Co.,
4.480%, due 1/16/24 | | | 1,500 | | | | 1,642 | |
| | Total Financial | | | | | | | 29,466 | |
| | Communication Services—6.9% | | | | | | | | |
| | Activision Blizzard, Inc.,
2.500%, due 9/15/50 | | | 2,600 | | | | 2,342 | |
| | Alphabet, Inc.,
1.100%, due 8/15/30 | | | 2,620 | | | | 2,492 | |
| | Amazon.com, Inc.,
2.700%, due 6/3/60 | | | 2,500 | | | | 2,404 | |
| | AT&T, Inc.,
SOFR + 0.640%, 0.690%, due 3/25/24, VRN | | | 750 | | | | 752 | |
| | AT&T, Inc.,
5.700%, due 3/1/57 | | | 2,400 | | | | 3,378 | |
| | | | | | | | |
| | Issuer | | Principal
Amount | | Value | |
| | | | | | | | | | |
| | Corporate Obligations—(continued) | | | | | | | | |
| | Communication Services—(continued) | | | | | | | | |
| | Comcast Corporation,
4.950%, due 10/15/58 | | $ | 2,000 | | | $ | 2,778 | |
| | Motorola Solutions, Inc.,
4.600%, due 2/23/28 | | | 2,750 | | | | 3,211 | |
| | Omnicom Group, Inc., 2.450%, due 4/30/30 | | | 2,800 | | | | 2,852 | |
| | Verizon Communications, Inc.,
SOFR + 0.790%, 0.840%, due 3/20/26, VRN | | | 3,000 | | | | 3,057 | |
| | Total Communication Services | | | | | | | 23,266 | |
| | Information Technology—6.2% | | | | | | | | |
| | Apple, Inc.,
4.650%, due 2/23/46 | | | 2,250 | | | | 3,001 | |
| | Booz Allen Hamilton, Inc.—144A,
4.000%, due 7/1/29 | | | 100 | | | | 102 | |
| | Corning, Inc.,
5.850%, due 11/15/68 | | | 2,150 | | | | 3,157 | |
| | FLIR Systems, Inc.,
2.500%, due 8/1/30 | | | 2,500 | | | | 2,525 | |
| | HP, Inc.—144A,
1.450%, due 6/17/26 | | | 325 | | | | 323 | |
| | HP, Inc.—144A,
2.650%, due 6/17/31 | | | 1,850 | | | | 1,858 | |
| | Intuit, Inc.,
1.650%, due 7/15/30 | | | 1,200 | | | | 1,182 | |
| | Microsoft Corporation,
3.041%, due 3/17/62 | | | 2,032 | | | | 2,188 | |
| | Oracle Corporation,
3.950%, due 3/25/51 | | | 3,250 | | | | 3,562 | |
| | Roper Technologies, Inc.,
4.200%, due 9/15/28 | | | 2,500 | | | | 2,876 | |
| | Total InformationTechnology | | | | | | | 20,774 | |
| | Consumer Discretionary—5.5% | | | | | | | | |
| | Costco Wholesale Corporation,
1.750%, due 4/20/32 | | | 2,500 | | | | 2,468 | |
| | Dana, Inc.,
4.250%, due 9/1/30 | | | 500 | | | | 515 | |
| | Ford Motor Co.,
9.000%, due 4/22/25 | | | 500 | | | | 617 | |
| | Ford Motor Credit Co. LLC,
3M USD LIBOR + 1.235%, 1.391%, due 2/15/23, VRN | | | 700 | | | | 697 | |
| | General Motors Financial Co., Inc.,
SOFR + 0.760%, 0.804%, due 3/8/24, VRN | | | 1,475 | | | | 1,486 | |
| | Las Vegas Sands Corporation,
3.900%, due 8/8/29 | | | 1,600 | | | | 1,706 | |
| | Lennar Corporation,
4.500%, due 4/30/24 | | | 2,450 | | | | 2,683 | |
| | Meritage Homes Corporation,
5.125%, due 6/6/27 | | | 1,500 | | | | 1,681 | |
| | The Goodyear Tire & Rubber Co.,
5.250%, due 4/30/31 | | | 2,000 | | | | 2,090 | |
| | Toll Brothers Finance Corporation,
4.375%, due 4/15/23 | | | 1,250 | | | | 1,306 | |
See accompanying Notes to Financial Statements.
| 76 | Semiannual Report | June 30, 2021 |
Bond Fund
Portfolio of Investments, June 30, 2021 (all dollar amounts in thousands) (unaudited)
| | | | | | | | |
| | Issuer | | Principal
Amount | | Value | |
| | | | | | | | | | |
| | Corporate Obligations—(continued) | | | | | | | | |
| | Consumer Discretionary—(continued) | | | | | | | | |
| | Toll Brothers Finance Corporation,
3.800%, due 11/1/29 | | $ | 1,500 | | | $ | 1,611 | |
| | Yum! Brands, Inc.,
6.875%, due 11/15/37 | | | 1,250 | | | | 1,557 | |
| | Total Consumer Discretionary | | | | | | | 18,417 | |
| | Industrials—5.1% | | | | | | | | |
| | ACCO Brands Corp.—144A,
4.250%, due 3/15/29 | | | 2,000 | | | | 1,982 | |
| | Caterpillar Financial Services Corporation,
SOFR + 0.245%, 0.280%, due 5/17/24, VRN | | | 2,025 | | | | 2,028 | |
| | CNH Industrial Capital LLC,
1.950%, due 7/2/23 | | | 2,500 | | | | 2,563 | |
| | Johnson Controls International plc,
1.750%, due 9/15/30 | | | 2,100 | | | | 2,021 | |
| | Owens Corning,
7.000%, due 12/1/36 | | | 2,250 | | | | 3,277 | |
| | Republic Services, Inc.,
2.900%, due 7/1/26 | | | 2,500 | | | | 2,681 | |
| | Xylem, Inc.,
3.250%, due 11/1/26 | | | 2,225 | | | | 2,440 | |
| | Total Industrial | | | | | | | 16,992 | |
| | Consumer Staples—4.6% | | | | | | | | |
| | Altria Group, Inc.,
6.200%, due 2/14/59 | | | 2,250 | | | | 2,920 | |
| | Fresenius Medical Care U.S. Finance III, Inc.—144A,
2.375%, due 2/16/31 | | | 1,800 | | | | 1,761 | |
| | Grupo Bimbo S.A.B. de C.V.—144A,
3.875%, due 6/27/24 | | | 2,000 | | | | 2,153 | |
| | PepsiCo, Inc.,
4.450%, due 4/14/46 | | | 2,250 | | | | 2,910 | |
| | The Kroger Co.,
8.000%, due 9/15/29 | | | 2,000 | | | | 2,828 | |
| | TreeHouse Foods, Inc.,
4.000%, due 9/1/28 | | | 1,400 | | | | 1,391 | |
| | United Rentals North America, Inc.,
5.250%, due 1/15/30 | | | 1,250 | | | | 1,371 | |
| | Total Consumer Staples | | | | | | | 15,334 | |
| | Real Estate—2.5% | | | | | | | | |
| | American Tower Corporation,
4.000%, due 6/1/25 | | | 2,500 | | | | 2,757 | |
| | Jones Lang LaSalle, Inc.,
4.400%, due 11/15/22 | | | 2,500 | | | | 2,601 | |
| | Public Storage,
1.850%, due 5/1/28 | | | 3,100 | | | | 3,129 | |
| | Total Real Estate | | | | | | | 8,487 | |
| | Health Care—2.3% | | | | | | | | |
| | Abbott Laboratories,
1.400%, due 6/30/30 | | | 2,000 | | | | 1,936 | |
| | AbbVie, Inc.,
4.700%, due 5/14/45 | | | 2,250 | | | | 2,816 | |
| | Centene Corporation,
2.450%, due 7/15/28 | | | 1,300 | | | | 1,319 | |
| | | | | | | | |
| | Issuer | | Principal
Amount | | Value | |
| | | | | | | | | | |
| | Corporate Obligations—(continued) | | | | | |
| | Health Care—(continued) | | | | | | | | |
| | Gilead Sciences, Inc.,
1.200%, due 10/1/27 | | $ | 1,600 | | | $ | 1,562 | |
| | Total Health Care | | | | | | | 7,633 | |
| | Materials—1.5% | | | | | | | | |
| | Orbia Advance Corp S.A.B. de C.V.—144A,
5.875%, due 9/17/44 | | | 2,250 | | | | 2,721 | |
| | Suzano Austria GmbH,
3.125%, due 1/15/32 | | | 2,420 | | | | 2,397 | |
| | Total Materials | | | | | | | 5,118 | |
| | Energy—1.4% | | | | | | | | |
| | ConocoPhillips,
6.500%, due 2/1/39 | | | 2,000 | | | | 2,975 | |
| | S.A. Global Sukuk Ltd.—144A,
2.694%, due 6/17/31 | | | 1,800 | | | | 1,817 | |
| | Total Energy | | | | | | | 4,792 | |
| | Utilities—0.7% | | | | | | | | |
| | NextEra Energy Capital Holdings, Inc.,
1.900%, due 6/15/28 | | | 2,400 | | | | 2,425 | |
| | Total Corporate Obligations | | | | | | | 152,704 | |
| | Total Long-Term Investments—99.5%
(cost $317,820) | | | | | | | 333,752 | |
| | Repurchase Agreement—0.1% | | | | | | | | |
| | Fixed Income Clearing Corporation, 0.000% dated 6/30/21, due 7/1/21, repurchase price $291, collateralized by U.S. Treasury Bond, 1.875%, due 2/15/41, valued at $297 | | | 291 | | | | 291 | |
| | Total Repurchase Agreement—0.1%
(cost $291) | | | | | | | 291 | |
| | Commercial Paper—0.3% | | | | | | | | |
| | Sonoco Product Co.,
0.102%, due 7/1/21 | | | 1,100 | | | | 1,100 | |
| | Total Commercial Paper—0.3%
(cost $1,100) | | | | | | | 1,100 | |
| | Total Investments—99.9%
(cost $319,211) | | | | | | | 335,143 | |
| | |
| | Securities Sold , Not Yet Purchased | | | | | | | | |
| | | | | | | | | | |
| | U.S. Government Agency—(1.6)% | | | | | | | | |
| | Federal National Mortgage Association (FNMA)—(1.6)% | | | | | | | | |
| | TBA, 4.000%, due 7/1/51 | | | (5,000 | ) | | | (5,326 | ) |
| | Total Securities Sold, Not Yet Purchased—(1.6)%
(proceeds $5,350) | | | | | | | (5,326 | ) |
| | Cash and other assets, less liabilities—1.7% | | | | | | | 5,614 | |
| | Net assets—100.0% | | | | | | $ | 335,431 | |
See accompanying Notes to Financial Statements.
| June 30, 20201 | William Blair Funds | 77 |
Bond Fund
Portfolio of Investments, June 30, 2021 (all dollar amounts in thousands) (unaudited)
The obligations of certain U.S. Government-sponsored securities are neither issued nor guaranteed by the U.S. Treasury.
144A = Security exempt from registration under Rule 144A of the Securities Act of 1933. These securities may be resold in transactions exempt from registration, normally to qualified institutional buyers.
SOFR = Secured Overnight Financing Rate
TBA = To Be Announced—TBAs are mortgage-backed securities traded under delayed delivery commitments, settling after June 30, 2021. The term TBA comes from the fact that the specific mortgage-backed security that will be delivered to fulfill a TBA trade is not designated at the time the trade is made.
VRN = Variable Rate Note
(a) Security, or a portion of security, is segregated as collateral for the centrally cleared credit default swaps, aggregating a total of $1,086 (in thousands).
(b) Amount is less than the minimum amount disclosed.
Centrally Cleared Credit Default Swaps
Reference
Entity | | Buy/Sell
Protection | | Fixed
Rate | | Payment
Frequency | | Maturity
Date | | Cleared
Exchange | | Notional
Amount
(in thousands) | | Upfront
Payment
Paid
(Received) | | Value | | Unrealized
Appreciation
(Depreciation) | |
| CDX.NA.HY- 34 | | Buy | | 5.000% | | 3M | | June 2025 | | ICE | | $ 9,200 | | $(907) | | $(922) | | | $ | (15) | |
| CDX.NA.HY- 35 | | Buy | | 5.000% | | 3M | | December 2025 | | ICE | | 5,000 | | (501) | | (513) | | | | (12) | |
| CDX.NA.IG- 35 | | Buy | | 1.000% | | 3M | | December 2030 | | ICE | | 15,000 | | (186) | | (201) | | | | (15) | |
| Total net unrealized appreciation (depreciation) on swaps | | | | | | | | | $ | (42) | |
See accompanying Notes to Financial Statements.
| 78 | Semiannual Report | June 30, 2021 |
| | Income Fund |
| | |
| | The Income Fund seeks a high level of current income with relative stability of principal. |
| | |
| | AN OVERVIEW FROM THE PORTFOLIO MANAGER |
| | |
 Ruta Ziverte | The William Blair Income Fund (Class N shares) (the “Fund”) returned a 0.83% decrease, net of fees, for the six months ended June 30, 2021. By comparison, the Fund’s benchmark index, the Bloomberg Barclays Intermediate Government/Credit Bond Index (the “Index”), decreased 0.90%. The Fund outperformed the Index on a relative basis in the first half of the year as sector allocation, security selection, and interest rate positioning drove excess returns, which offset the negative performance impact of rising yields in the first quarter. The yield curve steepened in the period as longer-term yields rose while front-end (under two years maturity) yields declined modestly. Our underweight to U.S. Treasuries, driven by valuations, was the largest contributor to relative performance. Within the Treasury sector we opted to use a portion of our allocation to invest in inflation-linked U.S. Treasury Inflation-Protected Securities as they looked attractive versus nominal Treasuries as inflation expectations rose in the period. Conversely, security selection within investment grade corporate exposure detracted from performance as Fund holdings emphasized higher-quality, more defensive companies. This was more than offset, however, by rate positioning within the sector. During the period lower-quality debt outperformed higher-quality debt and the strategy’s 10% limit on BBB-rated debt was a relative detractor. From an attribution perspective, interest rate impacts within the Fund’s agency mortgage-backed securities holdings detracted from relative performance. The use of credit default swap index hedging, used to reduce credit exposure at the margin, detracted from performance as credit spreads tightened in the period. Please refer to the Fixed Income Market Review and Outlook relating to the Fund on page 72. |
| | |
| June 30, 2021 | William Blair Funds | 79 |
Income Fund
Performance Highlights (Unaudited)
| Average Annual Total Returns through 6/30/2021 |
| | | Year
to Date | | 1 Year | | 3 Year | | 5 Year | | 10 Year | | Since
Inception(a) |
| Class N | | | (0.83 | )% | | | 0.33 | % | | | 3.19 | % | | | 1.87 | % | | | 2.27 | % | | | — | % |
| Class I | | | (0.76 | ) | | | 0.36 | | | | 3.36 | | | | 2.05 | | | | 2.48 | | | | — | |
| Class R6 | | | (0.73 | ) | | | 0.41 | | | | — | | | | — | | | | — | | | | 3.16 | |
| Bloomberg Barclays Intermediate Government/Credit Bond Index | | | (0.90 | ) | | | 0.19 | | | | 4.70 | | | | 2.63 | | | | 2.76 | | | | 4.48 | |
| (a) | Since inception is for the period from May 2, 2019 (Commencement of Operations) to June 30, 2021. |
Performance cited represents past performance. Past performance does not guarantee future results and current performance may be lower or higher than the data quoted. Results shown are average annual total returns, which assume reinvestment of dividends and capital gains. Investment returns and principal will fluctuate and you may have a gain or loss when you sell shares. For the most current month-end performance information, please call 1-800-742-7272, or visit our Web site at www.williamblairfunds.com. From time to time, the investment adviser may waive fees or reimburse expenses for the Fund. Without these waivers/reimbursements, performance would be lower. Class N shares are not subject to a sales load. Class I shares are not subject to a sales load or distribution (Rule 12b-1) fees. Class R6 shares are not subject to a sales load, distribution (Rule 12b-1) fees, or sub-transfer agent fees.
The performance highlights and graph presented above do not reflect the deduction of taxes that a shareholder would pay on fund distributions or the redemption of fund shares.
The Bloomberg Barclays Intermediate Government/Credit Bond Index indicates broad intermediate government/corporate bond market performance.
This report identifies the Fund’s investments on June 30, 2021. These holdings are subject to change. Not all investments in the Fund performed the same, nor is there any guarantee that these investments will perform as well in the future. Market forecasts provided in this report may not necessarily come to pass.
| Sector Diversification (Unaudited) |

The sector diversification shown is based on the total investments.
| 80 | Semiannual Report | June 30, 2021 |
Income Fund
Portfolio of Investments, June 30, 2021 (all dollar amounts in thousands) (unaudited)
| | | | | | | | |
| | Issuer | | Principal
Amount | | | Value | |
| | | | | | | | | | |
| | U.S. Government and U.S. Government Agency—47.4% |
| | U.S. Treasury Inflation Indexed Notes/Bonds—5.0% | | | | | | | | |
| | U.S. Treasury Inflation Indexed Bond, 2.375%, due 1/15/27 | | $ | 331 | | | $ | 406 | |
| | U.S. Treasury Inflation Indexed Bond, 3.875%, due 4/15/29 | | | 1,462 | | | | 2,058 | |
| | U.S. Treasury Inflation Indexed Bond, 3.375%, due 4/15/32 | | | 90 | | | | 133 | |
| | Total U.S. Treasury Inflation Indexed Notes/Bonds | | | | | | | 2,597 | |
| | U.S. Treasury—7.2% | | | | | | | | |
| | U.S. Treasury Note, 0.350%, due 10/31/21 | | | 450 | | | | 450 | |
| | U.S. Treasury Note, 2.500%, due 2/15/22(a) | | | 470 | | | | 477 | |
| | U.S. Treasury Note, 0.099%, due 1/31/23 | | | 500 | | | | 500 | |
| | U.S. Treasury Note, 0.250%, due 7/31/25 | | | 1,000 | | | | 982 | |
| | U.S. Treasury Note, 1.125%, due 2/28/27 | | | 600 | | | | 605 | |
| | U.S. Treasury Strip Principal, 0.000%, due 8/15/27 | | | 775 | | | | 726 | |
| | Total U.S. Treasury | | | | | | | 3,740 | |
| | Federal Home Loan Mortgage Corp. (FHLMC)—7.3% | | | | | | | | |
| | #J13022, 4.000%, due 9/1/25 | | | 126 | | | | 135 | |
| | #G14150, 4.500%, due 4/1/26 | | | 38 | | | | 40 | |
| | #J16051, 4.500%, due 7/1/26 | | | 312 | | | | 334 | |
| | #G15030, 4.000%, due 3/1/29 | | | 232 | | | | 251 | |
| | #A17603, 5.500%, due 1/1/34 | | | 320 | | | | 372 | |
| | #G01705, 5.500%, due 6/1/34 | | | 578 | | | | 674 | |
| | #A45790, 7.500%, due 5/1/35 | | | 58 | | | | 66 | |
| | #G04126, 6.000%, due 6/1/37 | | | 131 | | | | 156 | |
| | #G04564, 6.000%, due 12/1/37 | | | 101 | | | | 120 | |
| | #G05566, 5.500%, due 12/1/38 | | | 74 | | | | 86 | |
| | #G05875, 5.500%, due 2/1/40 | | | 50 | | | | 59 | |
| | #G61450, 6.000%, due 4/1/40 | | | 1,191 | | | | 1,426 | |
| | #C03665, 9.000%, due 4/1/41 | | | 80 | | | | 97 | |
| | Total FHLMC Mortgage Obligations | | | | | | | 3,816 | |
| | Federal National Mortgage Association (FNMA)—27.9% | | | | | | | | |
| | FNR G93-19 SH, 1M USD LIBOR + 56.169%, 11.234%, due 4/25/23, VRN | | | 4 | | | | 4 | |
| | #255956, 5.500%, due 10/1/25 | | | 13 | | | | 14 | |
| | #AL2853, 4.500%, due 6/1/26 | | | 201 | | | | 211 | |
| | #AJ6954, 4.000%, due 11/1/26 | | | 65 | | | | 70 | |
| | #256639, 5.000%, due 2/1/27 | | | 3 | | | | 4 | |
| | #806458, 8.000%, due 6/1/28 | | | 54 | | | | 60 | |
| | #880155, 8.500%, due 7/1/29 | | | 85 | | | | 96 | |
| | #745519, 8.500%, due 5/1/32 | | | 38 | | | | 41 | |
| | #654674, 6.500%, due 9/1/32 | | | 25 | | | | 29 | |
| | #AD0725, 7.000%, due 12/1/32 | | | 404 | | | | 482 | |
| | #254693, 5.500%, due 4/1/33 | | | 3 | | | | 4 | |
| | #555531, 5.500%, due 6/1/33 | | | 29 | | | | 33 | |
| | #711736, 5.500%, due 6/1/33 | | | 47 | | | | 54 | |
| | #555591, 5.500%, due 7/1/33 | | | 5 | | | | 6 | |
| | #AL3455, 5.500%, due 11/1/33 | | | 929 | | | | 1,080 | |
| | #CA2754, 4.500%, due 11/1/33 | | | — | | | | — | (b) |
| | #725424, 5.500%, due 4/1/34 | | | 31 | | | | 36 | |
| | #AL6413, 8.000%, due 8/1/34 | | | 114 | | | | 131 | |
| | | | | | | | |
| | Issuer | | Principal
Amount | | | Value | |
| | | | | | | | | | |
| | U.S. Government and U.S. Government Agency—(continued) |
| | Federal National Mortgage Association (FNMA)—(continued) | |
| | #AL6412, 7.500%, due 9/1/35 | | $ | 295 | | | $ | 338 | |
| | #888884, 5.500%, due 12/1/35 | | | 73 | | | | 84 | |
| | #928658, 6.500%, due 9/1/37 | | | 12 | | | | 14 | |
| | #889371, 6.000%, due 1/1/38 | | | 1,357 | | | | 1,613 | |
| | #FM1735, 6.500%, due 10/1/38 | | | 1,043 | | | | 1,276 | |
| | #995076, 6.000%, due 11/1/38 | | | 374 | | | | 449 | |
| | #991911, 7.000%, due 11/1/38 | | | 45 | | | | 51 | |
| | #FM2467, 6.000%, due 1/1/39 | | | 382 | | | | 459 | |
| | #FM1736, 6.500%, due 10/1/39 | | | 982 | | | | 1,184 | |
| | #BM5204, 6.500%, due 6/1/40 | | | 106 | | | | 127 | |
| | #BM1689, 5.500%, due 8/1/40 | | | 231 | | | | 267 | |
| | #AL9226, 5.500%, due 12/1/41 | | | 1,655 | | | | 1,945 | |
| | #AL9225, 6.000%, due 1/1/42 | | | 1,069 | | | | 1,270 | |
| | #BM1328, 6.000%, due 1/1/42 | | | 1,157 | | | | 1,380 | |
| | #BM5121, 5.500%, due 12/1/48 | | | 1,446 | | | | 1,726 | |
| | Total FNMA Mortgage Obligations | | | | | | | 14,538 | |
| | | | | | | | | | |
| | Asset-Backed Securities—5.3% | | | | | | | | |
| | Automobile—2.9% | | | | | | | | |
| | Carmax Auto Owner Trust, 2021-1, Tranche C, 0.940%, 12/15/26 | | | 550 | | | | 548 | |
| | GM Financial Automobile Leasing Trust, 2020-1, Tranche C, 2.040%, 12/20/23 | | | 950 | | | | 966 | |
| | Total Automobile | | | | | | | 1,514 | |
| | Credit Card—1.6% | | | | | | | | |
| | Citibank Credit Card Issuance Trust, 2016-A3, Tranche A3, 1M USD LIBOR + 0.490%, 0.570%, 12/7/23, VRN | | | 800 | | | | 802 | |
| | Other—0.8% | | | | | | | | |
| | Verizon Owner Trust, 2020-A, Tranche C,2.060%, 7/22/24 | | | 425 | | | | 436 | |
| | Total Asset-Backed Securities | | | | | | | 2,752 | |
| | | | | | | | | | |
| | Corporate Obligations—46.6% | | | | | | | | |
| | Financials—20.3% | | | | | | | | |
| | Bank of America Corporation,
SOFR + 0.910%, 0.981%, due 9/25/25, VRN | | | 700 | | | | 700 | |
| | Bank of Montreal,
SOFR + 0.680%, 0.726%, due 3/10/23, VRN | | | 600 | | | | 605 | |
| | Brookfield Finance, Inc.,
4.250%, due 6/2/26 | | | 550 | | | | 619 | |
| | Canadian Imperial Bank of Commerce,
SOFR + 0.800%, 0.850%, due 3/17/23, VRN | | | 750 | | | | 756 | |
| | Capital One Financial Corporation,
4.200%, due 10/29/25 | | | 500 | | | | 559 | |
| | Citigroup, Inc.,
SOFR + 0.770%, 0.817%, due 6/9/27, VRN | | | 625 | | | | 626 | |
See accompanying Notes to Financial Statements.
| June 30, 2021 | William Blair Funds | 81 |
Income Fund
Portfolio of Investments, June 30, 2021 (all dollar amounts in thousands) (unaudited)
| | | | | | | | |
| | Issuer | | Principal
Amount | | | Value | |
| | | | | | | | | | |
| | Corporate Obligations—(continued) | | | | | | | | |
| | Financials—(continued) | | | | | | | | |
| | Intercontinental Exchange, Inc.,
3.750%, due 12/1/25 | | $ | 450 | | | $ | 499 | |
| | JPMorgan Chase & Co.,
SOFR + 3.125%, 4.600%, due 2/1/25, VRN | | | 450 | | | | 467 | |
| | KeyBank NA,
SOFR + 0.340%, 0.390%, due 1/3/24, VRN | | | 700 | | | | 701 | |
| | Morgan Stanley,
SOFR + 0.745%, 0.864%, due 10/21/25, VRN | | | 550 | | | | 550 | |
| | New York Life Global Funding—144A,
SOFR + 0.480%, 0.526%, due 6/9/26, VRN | | | 600 | | | | 601 | |
| | Royal Bank of Canada,
SOFR + 0.450%, 0.475%, due 10/26/23, VRN | | | 350 | | | | 352 | |
| | Simon Property Group L.P.,
3.300%, due 1/15/26 | | | 550 | | | | 599 | |
| | Skandinaviska Enskilda Banken AB—144A,
0.850%, due 9/2/25 | | | 500 | | | | 495 | |
| | The Bank of Nova Scotia,
SOFR + 0.545%, 0.587%, due 3/2/26, VRN | | | 675 | | | | 676 | |
| | The Charles Schwab Corporation,
SOFR + 0.520%, 0.554%, due 5/13/26, VRN | | | 470 | | | | 472 | |
| | The Goldman Sachs Group, Inc.,
SOFR + 0.810%, 0.856%, due 3/9/27, VRN | | | 600 | | | | 600 | |
| | Wells Fargo & Co.,
4.480%, due 1/16/24 | | | 650 | | | | 711 | |
| | Total Financials | | | | | | | 10,588 | |
| | Communication Services—5.6% | | | | | | | | |
| | Amazon.com, Inc.,
1.500%, due 6/3/30 | | | 450 | | | | 442 | |
| | AT&T, Inc.,
4.125%, due 2/17/26 | | | 400 | | | | 450 | |
| | Comcast Corporation,
3.950%, due 10/15/25 | | | 600 | | | | 673 | |
| | Tencent Holdings Ltd.—144A,
1.810%, due 1/26/26 | | | 700 | | | | 711 | |
| | Verizon Communications, Inc.,
SOFR + 0.790%, 0.840%, due 3/20/26, VRN | | | 600 | | | | 611 | |
| | Total Communication Services | | | | | | | 2,887 | |
| | Consumer Discretionary—4.8% | | | | | | | | |
| | American Honda Finance Corporation,
1.200%, due 7/8/25 | | | 450 | | | | 454 | |
| | BMW US Capital LLC Co.—144A,
SOFR + 0.530%, 0.580%, due 4/1/24, VRN | | | 110 | | | | 111 | |
| | Costco Wholesale Corporation,
1.375%, due 6/20/27 | | | 500 | | | | 504 | |
| | | | | | | | |
| | Issuer | | Principal
Amount | | | Value | |
| | | | | | | | | | |
| | Corporate Obligations—(continued) | | | | | | | | |
| | Consumer Discretionary—(continued) | | | | | | | | |
| | General Motors Financial Co., Inc.,
SOFR + 0.760%, 0.804%, due 3/8/24, VRN | | $ | 500 | | �� | $ | 504 | |
| | Toll Brothers Finance Corporation,
3.800%, due 11/1/29 | | | 250 | | | | 268 | |
| | Toyota Motor Credit Corporation,
SOFR + 0.330%, 0.349%, due 1/11/24, VRN | | | 650 | | | | 652 | |
| | Total Consumer Discretionary | | | | | | | 2,493 | |
| | Consumer Staples—2.0% | | | | | | | | |
| | The Hershey Co.,
0.900%, due 6/1/25 | | | 525 | | | | 527 | |
| | The Kroger Co.,
8.000%, due 9/15/29 | | | 350 | | | | 495 | |
| | Total Consumer Staples | | | | | | | 1,022 | |
| | Industrials—2.9% | | | | | | | | |
| | Caterpillar Financial Services Corporation,
SOFR + 0.245%, 0.280%, due 5/17/24, VRN | | | 600 | | | | 601 | |
| | Johnson Controls International plc,
1.750%, due 9/15/30 | | | 350 | | | | 337 | |
| | United Parcel Service, Inc.,
3.900%, due 4/1/25 | | | 500 | | | | 554 | |
| | Total Industrials | | | | | | | 1,492 | |
| | Information Technology—2.8% | | | | | | | | |
| | HP, Inc.—144A,
1.450%, due 6/17/26 | | | 600 | | | | 597 | |
| | Intuit, Inc.,
0.950%, due 7/15/25 | | | 450 | | | | 452 | |
| | Roper Technologies, Inc.,
4.200%, due 9/15/28 | | | 375 | | | | 431 | |
| | Total Information Technology | | | | | | | 1,480 | |
| | Energy—2.6% | | | | | | | | |
| | ConocoPhillips Co.,
4.950%, due 3/15/26 | | | 600 | | | | 698 | |
| | S.A. Global Sukuk Ltd.—144A,
1.602%, due 6/17/26 | | | 175 | | | | 175 | |
| | Shell International Finance BV,
0.375%, due 9/15/23 | | | 500 | | | | 500 | |
| | Total Energy | | | | | | | 1,373 | |
| | Health Care —4.2% | | | | | | | | |
| | Abbott Laboratories,
1.150%, due 1/30/28 | | | 600 | | | | 588 | |
| | Centene Corporation,
2.450%, due 7/15/28 | | | 200 | | | | 203 | |
| | Gilead Sciences, Inc.,
1.200%, due 10/1/27 | | | 400 | | | | 390 | |
| | GlaxoSmithKline Capital plc,
0.534%, due 10/1/23 | | | 300 | | | | 300 | |
| | Merck & Co., Inc.,
0.750%, due 2/24/26 | | | 700 | | | | 697 | |
| | Total Health Care | | | | | | | 2,178 | |
See accompanying Notes to Financial Statements.
| 82 | Semiannual Report | June 30, 2021 |
Income Fund
Portfolio of Investments, June 30, 2021 (all dollar amounts in thousands) (unaudited)
| | | | | | | | |
| | Issuer | | Principal
Amount | | | Value | |
| | | | | | | | | | |
| | Corporate Obligations—(continued) |
| | Materials—1.1% | | | | | | | | |
| | Fibria Overseas Finance, Ltd.,
5.500%, due 1/17/27 | | $ | 500 | | | $ | 580 | |
| | Real Estate—0.3% | | | | | | | | |
| | Public Storage,
SOFR + 0.470%, 0.495%, due 4/23/24, VRN | | | 175 | | | | 175 | |
| | Total Corporate Obligations | | | | | | | 24,268 | |
| | Total Long-Term Investments—99.3%
(cost $50,609) | | | | | | | 51,711 | |
| | | | | | | | | | |
| | Repurchase Agreement | | | | | | | | |
| | Fixed Income Clearing Corporation, 0.000% dated 6/30/21, due 7/1/21, repurchase price $149, collateralized by U.S. Treasury Bond, 1.875%, due 2/15/41, valued at $152 | | | 149 | | | | 149 | |
| | Total Repurchase Agreement—0.3%
(cost $149) | | | | | | | 149 | |
| | Total Investments—99.6%
(cost $50,758) | | | | | | | 51,860 | |
| | | | | | | | | | |
| | Securities Sold, Not Yet Purchased | | | | | | | | |
| | | | | | | | | | |
| | U.S. Government Agency—(2.0)% | | | | | | | | |
| | Federal National Mortgage Association (FNMA)—(2.0)% | | | | | | | | |
| | TBA, 4.000%, due 7/1/51 | | | (1,000 | ) | | | (1,065 | ) |
| | Total Securities Sold, Not Yet Purchased—(2.0)%
(proceeds $1,070) | | | | | | | (1,065 | ) |
| | Cash and other assets, less liabilities—2.4% | | | | | | | 1,254 | |
| | Net assets—100.0% | | | | | | $ | 52,049 | |
The obligations of certain U.S. Government-sponsored securities are neither issued nor guaranteed by the U.S. Treasury.
144A = Security exempt from registration under Rule 144A of the Securities Act of 1933. These securities may be resold in transactions exempt from registration, normally to qualified institutional buyers.
SOFR = Secured Overnight Financing Rate
TBA = To Be Announced—TBAs are mortgage-backed securities traded under delayed delivery commitments, settling after June 30, 2021. The term TBA comes from the fact that the specific mortgage-backed security that will be delivered to fulfill a TBA trade is not designated at the time the trade is made.
VRN = Variable Rate Note
(a) Security, or a portion of security, is segregated as collateral for the centrally cleared credit default swap, aggregating a total of $214 (in thousands).
(b) Amount is less than the minimum amount disclosed.
Centrally Cleared Credit Default Swap
Reference
Entity | | Buy/Sell
Protection | | Fixed
Rate | | Payment
Frequency | | Maturity
Date | | Cleared
Exchange | | Notional
Amount
(in thousands) | | Upfront
Payment
Paid
(Received) | | Value | | Unrealized
Appreciation
(Depreciation) | |
| CDX.NA.HY- 34 | | Buy | | 5.000% | | 3M | | June 2025 | | ICE | | $4,600 | | $(454) | | $(462) | | | | $(8) | |
See accompanying Notes to Financial Statements.
| June 30, 2021 | William Blair Funds | 83 |
| | Low Duration Fund |
| | |
| | The Low Duration Fund seeks to maximize total return. Total return includes both income and capital appreciation. |
| | |
| | AN OVERVIEW FROM THE PORTFOLIO MANAGERS |
| | |

Kathleen M. Lynch, CFA 
Vesta Marks, CFA, CAIA 
Ruta Ziverte | The William Blair Low Duration Fund (Class N shares) (the “Fund”) returned 0.05%, net of fees, for the six months ended June 30, 2021. By comparison, the Fund’s benchmark index, the ICE BofAML 1-Year US Treasury Note Index (the “Index”), returned 0.09%. Relative performance was driven by coupon income, which offset the negative impact of paydowns. Specifically, income from the Fund’s holdings of agency mortgage-backed securities (“MBS”), investment grade corporates, and asset-backed securities sectors drove absolute and relative performance in the first half. The use of floating rate securities also contributed to relative performance as they outperformed fixed-rate securities in the period. Conversely, the Fund’s underweight position in the U.S. Treasury sector detracted from relative performance. The Index uses a single Treasury security to represent market performance of the risk-free rate. From an attribution perspective, paydown and price impacts in the agency MBS sector was a relative detractor in the period. However, in total, this sector was a contributor to absolute and relative performance given the income earned. Please refer to the Fixed Income Market Review and Outlook relating to the Fund on page 72. |
| 84 | Semiannual Report | June 30, 2021 |
Low Duration Fund
Performance Highlights (Unaudited)
| Average Annual Total Returns through 6/30/2021 |
| | | Year
to Date | | 1 Year | | 3 Year | | 5 Year | | 10 Year |
| Class N | | | 0.05 | % | | | 0.74 | % | | | 2.19 | % | | | 1.54 | % | | | 1.28 | % |
| Class I | | | 0.12 | | | | 0.90 | | | | 2.35 | | | | 1.70 | | | | 1.44 | |
| Class R6 | | | 0.15 | | | | 0.94 | | | | 2.39 | | | | 1.75 | | | | 1.51 | |
| ICE BofAML 1-Year US Treasury Note Index | | | 0.09 | | | | 0.22 | | | | 2.01 | | | | 1.47 | | | | 0.90 | |
Performance cited represents past performance. Past performance does not guarantee future results and current performance may be lower or higher than the data quoted. Results shown are average annual total returns, which assume reinvestment of dividends and capital gains. Investment returns and principal will fluctuate and you may have a gain or loss when you sell shares. For the most current month-end performance information, please call 1-800-742-7272, or visit our Web site at www.williamblairfunds.com. From time to time, the investment adviser may waive fees or reimburse expenses for the Fund. Without these waivers/reimbursements, performance would be lower. Class N shares are not subject to a sales load. Class I shares are not subject to a sales load or distribution (Rule 12b-1) fees. Class R6 shares are not subject to a sales load, distribution (Rule 12b-1) fees, or sub-transfer agent fees.
The performance highlights and graph presented above do not reflect the deduction of taxes that a shareholder would pay on fund distributions or the redemption of fund shares.
The ICE BofAML 1-Year US Treasury Note Index is comprised of a single U.S. Treasury Note issue purchased at the beginning of the month and held for a full month. Each month the index is rebalanced and the issue selected is the outstanding U.S. Treasury Note that matures closest to, but not beyond one year from the rebalancing date.
This report identifies the Fund’s investments on June 30, 2021. These holdings are subject to change. Not all investments in the Fund performed the same, nor is there any guarantee that these investments will perform as well in the future. Market forecasts provided in this report may not necessarily come to pass.
| Sector Diversification (Unaudited) |

The sector diversification shown is based on the total investments.
| June 30, 2021 | William Blair Funds | 85 |
Low Duration Fund
Portfolio of Investments, June 30, 2021 (all dollar amounts in thousands) (unaudited)
| | | | | | | | |
| | Issuer | | Principal
Amount | | Value | |
| | | | | | | | | | |
| | U.S. Government and U.S. Government Agency—51.6% | |
| | U.S. Treasury—7.0% | | | | | | | | |
| | U.S. Treasury Note, 2.500%, due 1/15/22 | | $ | 2,300 | | | $ | 2,330 | |
| | U.S. Treasury Note, 0.204%, due 1/31/22 | | | 2,000 | | | | 2,002 | |
| | U.S. Treasury Note, 0.164%, due 4/30/22 | | | 2,500 | | | | 2,502 | |
| | U.S. Treasury Strip Principal, 0.000%, due 8/15/21 | | | 3,000 | | | | 3,000 | |
| | Total U.S. Treasury | | | | | | | 9,834 | |
| | Federal Home Loan Mortgage Corp. (FHLMC)—10.8% | | | | | | | | |
| | #E02322, 5.500%, due 5/1/22 | | | 2 | | | | 2 | |
| | #G12725, 6.000%, due 6/1/22 | | | 8 | | | | 8 | |
| | #G13225, 5.000%, due 6/1/23 | | | 253 | | | | 264 | |
| | #J08450, 5.500%, due 7/1/23 | | | 4 | | | | 4 | |
| | #J08703, 5.500%, due 9/1/23 | | | 3 | | | | 3 | |
| | #C00351, 8.000%, due 7/1/24 | | | 14 | | | | 14 | |
| | #J11208, 5.000%, due 11/1/24 | | | 12 | | | | 12 | |
| | #G00363, 8.000%, due 6/1/25 | | | 23 | | | | 24 | |
| | #C80329, 8.000%, due 8/1/25 | | | 4 | | | | 5 | |
| | #G14643, 4.000%, due 8/1/26 | | | 61 | | | | 65 | |
| | #G14550, 4.500%, due 9/1/26 | | | 353 | | | | 372 | |
| | #G15360, 4.500%, due 11/1/26 | | | 139 | | | | 148 | |
| | #G04821, 8.500%, due 7/1/31 | | | 1,027 | | | | 1,250 | |
| | #G02454, 6.500%, due 7/1/32 | | | 441 | | | | 504 | |
| | #ZT1221, 5.500%, due 1/1/33 | | | 417 | | | | 481 | |
| | #A81372, 6.000%, due 8/1/38 | | | 123 | | | | 143 | |
| | #G04745, 6.000%, due 9/1/38 | | | 121 | | | | 139 | |
| | #G04687, 6.000%, due 9/1/38 | | | 31 | | | | 36 | |
| | #G06085, 6.500%, due 9/1/38 | | | 30 | | | | 36 | |
| | #G60681, 7.000%, due 2/1/39 | | | 4,230 | | | | 5,156 | |
| | #G07480, 6.000%, due 5/1/39 | | | 539 | | | | 638 | |
| | #G07058, 6.000%, due 9/1/39 | | | 548 | | | | 669 | |
| | #G60680, 6.500%, due 9/1/39 | | | 516 | | | | 619 | |
| | #G61450, 6.000%, due 4/1/40 | | | 3,572 | | | | 4,277 | |
| | #G61050, 5.500%, due 3/1/41 | | | 247 | | | | 289 | |
| | Total FHLMC Mortgage Obligations | | | | | | | 15,158 | |
| | Federal National Mortgage Association (FNMA)—33.8% | | | | | | | | |
| | #323933, 7.000%, due 9/1/29 | | | 194 | | | | 225 | |
| | #880993, 6.000%, due 1/1/22 | | | — | | | | — | (a) |
| | #888982, 6.000%, due 12/1/22 | | | 12 | | | | 12 | |
| | #972934, 5.500%, due 2/1/23 | | | 14 | | | | 14 | |
| | #889670, 5.500%, due 6/1/23 | | | 3 | | | | 3 | |
| | #AE0011, 5.500%, due 9/1/23 | | | 2 | | | | 1 | |
| | #995253, 5.500%, due 12/1/23 | | | 103 | | | | 105 | |
| | #995395, 6.000%, due 12/1/23 | | | 5 | | | | 5 | |
| | #190988, 9.000%, due 6/1/24 | | | 1 | | | | 1 | |
| | #AL8529, 6.000%, due 11/1/24 | | | 1,477 | | | | 1,536 | |
| | #AL2853, 4.500%, due 6/1/26 | | | 636 | | | | 670 | |
| | #AL9730, 4.500%, due 2/1/27 | | | 1,108 | | | | 1,178 | |
| | #AL3388, 4.000%, due 9/1/27 | | | 235 | | | | 250 | |
| | #AL9870, 6.500%, due 2/1/28 | | | 520 | | | | 584 | |
| | #AL4502, 4.000%, due 11/1/28 | | | 391 | | | | 423 | |
| | | | | | | | |
| | Issuer | | Principal
Amount | | Value | |
| | | | | | | | | | |
| | U.S. Government and U.S. Government Agency—(continued) | | |
| | Federal National Mortgage Association (FNMA)—(continued) | | |
| | #AL9857, 4.000%, due 2/1/29 | | $ | 3,002 | | | $ | 3,200 | |
| | #555933, 7.000%, due 6/1/32 | | | 259 | | | | 293 | |
| | #555866, 7.500%, due 3/1/33 | | | 148 | | | | 172 | |
| | #745409, 7.000%, due 4/1/33 | | | 352 | | | | 397 | |
| | #CA2408, 4.000%, due 10/1/33 | | | 137 | | | | 150 | |
| | #CA2754, 4.500%, due 11/1/33 | | | 88 | | | | 97 | |
| | #725228, 6.000%, due 3/1/34 | | | 639 | | | | 749 | |
| | #AL6413, 8.000%, due 8/1/34 | | | 133 | | | | 152 | |
| | #AD0720, 5.500%, due 12/1/34 | | | 177 | | | | 204 | |
| | #CA5298, 4.000%, due 2/1/35 | | | 3,849 | | | | 4,238 | |
| | #AL6412, 7.500%, due 9/1/35 | | | 492 | | | | 563 | |
| | #CA8368, 2.000%, due 12/1/35 | | | — | | | | — | (a) |
| | #886762, 7.000%, due 9/1/36 | | | 156 | | | | 187 | |
| | #AD0731, 7.500%, due 8/1/37 | | | 3,619 | | | | 4,358 | |
| | #888530, 7.500%, due 8/1/37 | | | 1,367 | | | | 1,720 | |
| | #AL6411, 7.000%, due 12/1/37 | | | 968 | | | | 1,115 | |
| | #889219, 6.000%, due 3/1/38 | | | 930 | | | | 1,144 | |
| | #FM1735, 6.500%, due 10/1/38 | | | 1,862 | | | | 2,278 | |
| | #995076, 6.000%, due 11/1/38 | | | 1,708 | | | | 2,047 | |
| | #AD0100, 7.000%, due 12/1/38 | | | 374 | | | | 447 | |
| | #FM2467, 6.000%, due 1/1/39 | | | 1,529 | | | | 1,834 | |
| | #FM1736, 6.500%, due 10/1/39 | | | 2,372 | | | | 2,859 | |
| | #BM5204, 6.500%, due 6/1/40 | | | 2,053 | | | | 2,465 | |
| | #AL0515, 6.000%, due 7/1/40 | | | 414 | | | | 503 | |
| | #BM3525, 6.000%, due 4/1/41 | | | 2,157 | | | | 2,564 | |
| | #AL9226, 5.500%, due 12/1/41 | | | 2,234 | | | | 2,625 | |
| | #BM1328, 6.000%, due 1/1/42 | | | 1,113 | | | | 1,327 | |
| | #AL9225, 6.000%, due 1/1/42 | | | 1,749 | | | | 2,079 | |
| | #AL6276, 5.500%, due 10/1/43 | | | 133 | | | | 154 | |
| | #BM5121, 5.500%, due 12/1/48 | | | 954 | | | | 1,139 | |
| | #CA5837, 6.000%, due 7/1/49 | | | 1,273 | | | | 1,524 | |
| | Total FNMA Mortgage Obligations | | | | | | | 47,591 | |
| | | | | | | | | | |
| | Asset-Backed Securities—11.2% | | | | | | | | |
| | Automobile—5.9% | | | | | | | | |
| | CarMax Auto Owner Trust, 2020-1, Tranche C,
2.340%, 11/17/25 | | | 600 | | | | 620 | |
| | Ford Credit Auto Lease Trust 2019-B, 2019-B, Tranche A4,
2.270%, 11/15/22 | | | 329 | | | | 332 | |
| | GM Financial Automobile Leasing Trust, 2019-2, Tranche C, 3.120%, 3/20/23 | | | 500 | | | | 505 | |
| | GM Financial Automobile Leasing Trust, 2020-1, Tranche C,
2.040%, 12/20/23 | | | 1,400 | | | | 1,423 | |
| | GM Financial Consumer Automobile Receivables Trust, 2018-4, Tranche A3,
3.210%, 10/16/23 | | | 328 | | | | 332 | |
| | Mercedes-Benz Auto Lease Trust 2020-B, 2020-B, Tranche A2,
0.310%, 2/15/23 | | | 355 | | | | 356 | |
See accompanying Notes to Financial Statements.
| 86 | Semiannual Report | June 30, 2021 |
Low Duration Fund
Portfolio of Investments, June 30, 2021 (all dollar amounts in thousands) (unaudited)
| | | | | | | | |
| | Issuer | | Principal
Amount | | Value | |
| | | | | | | | | | |
| | Asset-Backed Securities—(continued) | | | | | |
| | Automobile—(continued) | | | | | | | | |
| | Nissan Auto Lease Trust 2020-B, 2020-B, Tranche A3,
0.430%, 10/16/23 | | $ | 550 | | | $ | 551 | |
| | Nissan Auto Receivables 2020-A Owner Trust, 2020-A, Tranche A3,
1.380%, 12/16/24 | | | 1,126 | | | | 1,140 | |
| | Tesla Auto Lease Trust 2018-B—144A, 2018-B, Tranche A,
3.710%, 8/20/21 | | | 4 | | | | 4 | |
| | Tesla Auto Lease Trust—144A, 2019-A, Tranche C,
2.680%, 1/20/23 | | | 675 | | | | 691 | |
| | Toyota Auto Receivables 2020-B Owner Trust, 2020-B, Tranche A2,
1.380%, 12/15/22 | | | 434 | | | | 435 | |
| | Toyota Auto Receivables 2021-B Owner Trust, 2021-B, Tranche A2,
0.140%, 1/16/24 | | | 1,900 | | | | 1,900 | |
| | Total Automobile | | | | | | | 8,289 | |
| | Credit Card—2.2% | | | | | | | | |
| | American Express Credit Account Master Trust, 2017-5, Tranche B,
1M USD LIBOR + 0.580%, 0.653%, 2/18/25, VRN | | | 450 | | | | 452 | |
| | Chase Issuance Trust, 2017-A2, Tranche A,
1M USD LIBOR + 0.400%, 0.473%, 3/15/24, VRN | | | 1,545 | | | | 1,551 | |
| | Citibank Credit Card Issuance Trust, 2016-A3, Tranche A3,
1M USD LIBOR + 0.490%, 0.570%, 12/7/23, VRN | | | 1,150 | | | | 1,153 | |
| | Total Credit Card | | | | | | | 3,156 | |
| | Other—3.1% | | | | | | | | |
| | CNH Equipment Trust 2020-A, 2020-A, Tranche A3,
1.160%, 6/16/25 | | | 300 | | | | 303 | |
| | Kubota Credit Owner Trust—144A, 2020-2A, Tranche A2,
0.410%, 6/15/23 | | | 1,167 | | | | 1,168 | |
| | PFS Financing Corp.—144A, 2018-F, Tranche B,
3.770%, 10/15/23 | | | 1,000 | | | | 1,010 | |
| | Verizon Owner Trust, 2020-A, Tranche C,
2.060%, 7/22/24 | | | 1,250 | | | | 1,282 | |
| | Verizon Owner Trust 2018-A, 2018-A, Tranche A1A,
3.230%, 4/20/23 | | | 520 | | | | 524 | |
| | Verizon Owner Trust 2019-C, 2019-C, Tranche C,
2.160%, 4/22/24 | | | 60 | | | | 62 | |
| | Total Other | | | | | | | 4,349 | |
| | Total Asset-Backed Securities | | | | | | | 15,794 | |
| | | | | | | | |
| | Issuer | | Principal
Amount | | Value | |
| | | | | | | | | | |
| | Corporate Obligations—36.7% | | | | | | | | |
| | Financials—27.9% | | | | | | | | |
| | Bank of America Corporation,
SOFR + 0.970%, 0.995%, due 7/22/27, VRN | | $ | 2,850 | | | $ | 2,894 | |
| | Bank of Montreal,
SOFR + 0.680%, 0.726%, due 3/10/23, VRN | | | 2,700 | | | | 2,722 | |
| | Canadian Imperial Bank of Commerce,
SOFR + 0.800%, 0.850%, due 3/17/23, VRN | | | 1,000 | | | | 1,009 | |
| | Canadian Imperial Bank of Commerce,
SOFR + 0.400%, 0.447%, due 12/14/23, VRN | | | 1,900 | | | | 1,903 | |
| | Citigroup, Inc.,
SOFR + 0.770%, 0.817%, due 6/9/27, VRN | | | 2,750 | | | | 2,754 | |
| | JPMorgan Chase & Co.,
SOFR + 0.885%, 0.910%, due 4/22/27, VRN | | | 2,750 | | | | 2,785 | |
| | KeyBank NA,
SOFR + 0.340%, 0.390%, due 1/3/24, VRN | | | 2,700 | | | | 2,703 | |
| | Met Tower Global Funding—144A,
SOFR + 0.550%, 0.572%, due 1/17/23, VRN | | | 1,481 | | | | 1,490 | |
| | Metropolitan Life Global Funding I—144A,
SOFR + 0.320%, 0.337%, due 1/7/24, VRN | | | 1,500 | | | | 1,505 | |
| | Morgan Stanley,
SOFR + 0.700%, 0.725%, due 1/20/23, VRN | | | 2,750 | | | | 2,760 | |
| | New York Life Global Funding—144A,
SOFR + 0.480%, 0.526%, due 6/9/26, VRN | | | 2,750 | | | | 2,754 | |
| | Royal Bank of Canada,
SOFR + 0.450%, 0.475%, due 10/26/23, VRN | | | 1,500 | | | | 1,507 | |
| | Royal Bank of Canada,
SOFR + 0.525%, 0.548%, due 1/20/26, VRN | | | 1,500 | | | | 1,505 | |
| | The Bank of Nova Scotia,
SOFR + 0.550%, 0.598%, due 9/15/23, VRN | | | 2,000 | | | | 2,014 | |
| | The Bank of Nova Scotia,
SOFR + 0.545%, 0.587%, due 3/2/26, VRN | | | 980 | | | | 982 | |
| | The Charles Schwab Corporation,
SOFR + 0.520%, 0.554%, due 5/13/26, VRN | | | 2,500 | | | | 2,513 | |
| | The Goldman Sachs Group, Inc.,
SOFR + 0.810%, 0.856%, due 3/9/27, VRN | | | 2,750 | | | | 2,749 | |
| | The Toronto-Dominion Bank,
SOFR + 0.355%, 0.399%, due 3/4/24, VRN | | | 2,700 | | | | 2,707 | |
| | Total Financials | | | | | | | 39,256 | |
See accompanying Notes to Financial Statements.
| June 30, 2021 | William Blair Funds | 87 |
Low Duration Fund
Portfolio of Investments, June 30, 2021 (all dollar amounts in thousands) (unaudited)
| | | | | | | | |
| | Issuer | | Principal
Amount | | Value | |
| | | | | | | | | | |
| | Corporate Obligations—(continued) | | | | | | | | |
| | Consumer Discretionary —2.4% | | | | | | | | |
| | BMW US Capital LLC Co.—144A,
SOFR + 0.530%, 0.580%, due 4/1/24, VRN | | $ | 500 | | | $ | 504 | |
| | Toyota Motor Credit Corporation,
SOFR + 0.330%, 0.349%, due 1/11/24, VRN | | | 2,800 | | | | 2,810 | |
| | Total Consumer Discretionary | | | | | | | 3,314 | |
| | Communication Services—2.1% | | | | | | | | |
| | Verizon Communications, Inc.,
SOFR + 0.790%, 0.840%, due 3/20/26, VRN | | | 2,900 | | | | 2,955 | |
| | Industrials—2.0% | | | | | | | | |
| | Caterpillar Financial Services Corporation,
SOFR + 0.245%, 0.280%, due 5/17/24, VRN | | | 2,750 | | | | 2,754 | |
| | Real Estate—1.4% | | | | | | | | |
| | Public Storage,
SOFR + 0.470%, 0.495%, due 4/23/24, VRN | | | 2,005 | | | | 2,009 | |
| | Health Care—0.9% | | | | | | | | |
| | Roche Holdings, Inc.—144A,
SOFR + 0.240%, 0.284%, due 3/5/24, VRN | | | 1,275 | | | | 1,277 | |
| | Total Corporate Obligations | | | | | | | 51,565 | |
| | Total Long-Term Investments—99.5%
(cost $139,422) | | | | | | | 139,942 | |
| | Total Investments—99.5%
(cost $139,422) | | | | | | | 139,942 | |
| | | | | | | | |
| | Issuer | | Principal
Amount | | Value | |
| | | | | | | | | | |
| | Securities Sold, Not Yet Purchased U.S. Government Agency—(15.0)% | | |
| | Federal National Mortgage Association (FNMA)—(15.0)% | | | | | | | | |
| | TBA, 2.500%, due 7/1/36 | | $ | (10,000 | ) | | $ | (10,428 | ) |
| | TBA, 4.000%, due 7/1/51 | | | (10,000 | ) | | | (10,652 | ) |
| | Total Securities Sold, Not Yet Purchased—(15.0)%
(proceeds $21,129) | | | | | | | (21,080 | ) |
| | Cash and other assets, less liabilities—15.5% | | | | | | | 21,831 | |
| | Net assets—100.0% | | | | | | $ | 140,693 | |
The obligations of certain U.S. Government-sponsored securities are neither issued nor guaranteed by the U.S. Treasury.
144A = Security exempt from registration under Rule 144A of the Securities Act of 1933. These securities may be resold in transactions exempt from registration, normally to qualified institutional buyers.
SOFR = Secured Overnight Financing Rate
TBA = To Be Announced—TBAs are mortgage-backed securities traded under delayed delivery commitments, settling after June 30, 2021. The term TBA comes from the fact that the specific mortgage-backed security that will be delivered to fulfill a TBA trade is not designated at the time the trade is made.
VRN = Variable Rate Note
(a) Amount is less than the minimum amount disclosed.
See accompanying Notes to Financial Statements.
| 88 | Semiannual Report | June 30, 2021 |
Emerging Markets Debt Market Review and Outlook
Markets traded on a positive note throughout the second quarter of 2021 amid improved prospects for global economic activity as a growing number of economies continued to reopen, supported by falling COVID-19 cases and accelerating vaccination programs.
In the United States, where economic growth conditions have rebounded sharply versus those in 2020, the Federal Reserve continued to indicate the continuation of extraordinary monetary policy accommodation as concerns about rising inflationary pressures were mitigated by disappointing job creation. Overall, a positive combination of improving global growth and favorable liquidity conditions continued to support investor sentiment, leading to higher equity and commodity prices and tighter credit spreads during the period.
In this context, the credit spread of the J.P. Morgan Emerging Markets Bond Index Global Diversified (EMBIGD) ended the second quarter at 340 basis points (bps), compressing by 15 bps, with the index returning 4.06% in U.S. dollar terms during the period. The strong performance of the index was driven by high-yielding countries, where credit spreads compressed by 37 bps, on average.
We retain a constructive outlook for the asset class. We believe that a positive combination of improving global growth and favorable liquidity conditions will continue supporting investor sentiment throughout the third quarter of the year.
Across emerging markets (EMs), we believe credit fundamentals should continue to recover amid improving economic growth, rising global trade, and higher commodity prices. Moreover, prospects for a $650 billion increase in the International Monetary Fund’s Special Drawing Rights (SDR) allocation to EM countries underscore strong support from multilateral organizations.
While we believe U.S. Treasury yields should remain the main headwind for EM debt returns over the coming quarter, we see limited scope for a significant increase in yields. We anticipate the continuation of extraordinary monetary policy accommodation in the United States as concerns about rising inflationary pressures may be mitigated by disappointing job creation.
In our opinion, technical conditions should also remain supported by positive investor flows, contained new net debt issuance, and strong inflows from non-dedicated, crossover investors attracted by favorable valuations of EM debt relative to developed-market credit.
In our view, EM debt hard currency valuations remain attractive, especially in the high-yield space, where credit spreads remain above long-term averages. These valuations are particularly attractive relative to U.S. high-yield corporate credit. We believe the risk premia in EM debt hard currency sovereign credit overcompensate investors for default and loss-given-default risks.
In this overall context, we see prospects for EM debt risk premia compression, and we expect tighter credit spreads to partly offset marginally higher U.S. Treasury yields in the coming months.
We believe that improving credit fundamentals, ample liquidity conditions, positive investor flows, strong support from multilateral organizations, and attractive valuations should all underpin the performance of the asset class during the third quarter of the year.
| June 30, 2021 | William Blair Funds | 89 |
| | Emerging Markets Debt Fund |
| | |
| | The Emerging Markets Debt Fund seeks to provide attractive risk-adjusted returns relative to the Fund’s benchmark through investments in hard currency denominated debt issued in emerging market countries. |
| | |
| | AN OVERVIEW FROM THE PORTFOLIO MANAGERS |
| | |
 Marcelo Assalin, CFA 
Marco Ruijer, CFA | The William Blair Emerging Markets Debt Fund (Class I shares) posted a 0.37% increase, net of fees, for the period since inception (May 25, 2021) through June 30, 2021 (the “period”). By comparison, the Fund’s benchmark index, the JPMorgan Emerging Markets Bond Index (EMBI) Global Diversified (the “Index”), increased 0.92%. Higher-Risk Countries In higher-risk countries, our overweight positions in Ukraine, Cameroon and Ghana contributed the most to performance during the period, while our overweight positions in Sri Lanka, Lebanon and Egypt detracted the most. In Ukraine, while uncertainty remained about the timeline of further disbursements from the International Monetary Fund (IMF), our overweight position in warrants linked to gross domestic product (GDP) outperformed. This outperformance in Ukraine was driven by higher expectations for future payout ratios of the instrument amid growing prospects for economic improvement in the country. In Cameroon, our overweight position benefitted from an export boost driven by a surge in commodity prices and staff level agreement agreed at the end of May with the IMF. Through the result of a successful liability management exercise, Cameroon has not only eased its medium term amortization program but also reduced concerns that Cameroon would apply for debt relief under the common framework. In Ghana, bonds continue to perform well amid improving prospects for policy continuity under President Nana Akufo-Addo’s second term. Investors expect the ruling party to continue to seek fiscal prudence through a combination of revenue and expenditure measures. Our corporate exposure to an oil company operating in Ghana also added meaningfully to performance. In Sri Lanka, bond prices fell sharply during the period reversing stellar investor optimism throughout April and May. Fitch affirmed Sri Lanka’s external debt at a CCC rating citing concerns about a problematic medium-term debt repayment burden, low levels of FX reserves and rising government debt levels. Lebanon continued to underperform given the continued delay in the formation of a government. Lebanon also faced further headwinds as the number of COVID-19 infections surged during the festive season. The government has limited means to curb the deterioration of economic conditions. Lastly, in Egypt sentiment waned on the back of concerns that Egypt is unlikely to extend the IMF program which has been such a strong anchor for policy reform. These fears came on the back of weak balance of payments data for the first quarter which showed imports rising significantly. As Egypt is a favored overweight position for EMBI investors the impact has been more emphatic as positions were reduced during the period on these negative headlines. Medium-risk countries In medium-risk countries, overweight positions in Brazil, Dominican Republic and Bahrain contributed the most to performance during the period. Meanwhile, overweight positions in Paraguay, Senegal and Benin detracted the most. |
| 90 | Semiannual Report | June 30, 2021 |
Emerging Markets Debt Fund
Our diverse corporate positions continued to contribute to outperformance in Brazil through security selection in Brazil. Performance was led by investments in oil and gas, consumer, financials, and metals and mining. This was slightly offset by a new issue in transportation.
In the Dominican Republic, while we believe growth is picking up and there is renewed momentum in fiscal reform, inflation has spiked to the highest level in more than a decade. Moreover, although the country has one of the highest COVID-19 vaccination rates in the region at roughly 70% of the adult population, questions about the efficacy of the Sinovac vaccine have led to concerns about how vulnerable the country remains to the virus. Within corporates, we benefited from a position in a local utility. Security selection was the primary driver of outperformance in the Dominican Republic.
In Bahrain our overweight position added value as higher oil prices have improved market confidence that GCC support will be more forthcoming and will help to alleviate the fiscal burden following the announcement of an economic stimulus package designed to limit the impact of COVID-19.
In Senegal an announcement of delays to oil and gas production have increased fears that debt levels will continue to rise for longer whilst the market also had to absorb the issuance of a new 15-year euro denominated bond. Similarly, in Benin expectations of a new issue and the stronger performance of USD denominated bonds in Sub Saharan Africa held back the performance of our euro denominated holding.
Lower-risk countries
In lower-risk countries, overweight positions in India and Thailand contributed the most to performance, while overweight positions in Romania and Serbia and an underweight position in Peru detracted the most.
In India, where we maintained an overweight position mainly through corporates, performance was driven by security selection. A diversified commodity producer generated most of the outperformance in India. Positions in renewable energy, steel, and infrastructure also contributed, although this was marginally offset by quasi-sovereign credit exposures.
In Thailand, our position in a local bank underperformed amid local protests and worsening COVID-19 situation.
In Romania and Serbia, our holdings in euro-denominated bonds, which are more sensitive to German bunds than to U.S. Treasury price movement, underperformed as a retracement in U.S. yields was not matched by euro-denominated fixed income.
Lastly, Peru outperformed over the month of June, as the pessimism priced in by markets following recent Presidential elections was faded. Some ratings sensitive insurance companies bought bonds in the days after the election, despite the market unfriendly candidate winning the election, as they found valuations in Peruvian bonds to be attractive given its rating. Others pointed to signs of moderation from the Castillo administration such as Castillo asking Central Bank President Velarde to stay in his post as reasons to buy. We however remain skeptical about how moderate Castillo’s administration will be.
Please refer to the Emerging Markets Debt Market Review and Outlook relating to the Fund on page 89.
| June 30, 2021 | William Blair Funds | 91 |
Emerging Markets Debt Fund
Performance Highlights (Unaudited)
| Average Annual Total Returns through 6/30/2021 |
| | | Since
Inception(a) |
| Class I | | | 0.37 | % |
| Class R6 | | | 0.37 | |
| JPMorgan EMBI Global Diversified | | | 0.92 | |
| (a) | Since inception is for the period from May 25, 2021 (Commencement of Operations) to June 30, 2021. |
Performance cited represents past performance. Past performance does not guarantee future results and current performance may be lower or higher than the data quoted. Results shown are average annual total returns, which assume reinvestment of dividends and capital gains. Investment returns and principal will fluctuate and you may have a gain or loss when you sell shares. For the most current month-end performance information, please call 1-800-742-7272, or visit our Web site at www.williamblairfunds.com. From time to time, the investment adviser may waive fees or reimburse expenses for the Fund. Without these waivers/reimbursements, performance would be lower. Class I shares are not subject to a sales load or distribution (Rule 12b-1) fees. Class R6 shares are not subject to a sales load, distribution (Rule 12b-1) fees, or sub-transfer agent fees.
The performance highlights and graph presented above do not reflect the deduction of taxes that a shareholder would pay on fund distributions or the redemption of fund shares.
The JP Morgan Emerging Markets Bond Index (EMBI) Global Diversified tracks the total return of U.S.-dollar denominated debt instruments issued by sovereign and quasi-sovereign entities.
This report identifies the Fund’s investments on June 30, 2021. These holdings are subject to change. Not all investments in the Fund performed the same, nor is there any guarantee that these investments will perform as well in the future. Market forecasts provided in this report may not necessarily come to pass.
Sector Diversification (Unaudited)

The sector diversification shown is based on the total investments.
| 92 | Semiannual Report | June 30, 2021 |
Emerging Markets Debt Fund
Portfolio of Investments, June 30, 2021 (all dollar amounts in thousands) (unaudited)
| | | | | | | | |
| | Issuer | | Principal
Amount | | | Value | |
| | | | | | | | |
| | Foreign Government Bonds—61.6% | | | | | | | | |
| | Angola—2.0% | | | | | | | | |
| | Angolan Government International Bond,
9.500%, due 11/12/25 | | $ | 250 | | | $ | 274 | |
| | Angolan Government International Bond,
9.375%, due 5/8/48 | | | 200 | | | | 209 | |
| | | | | | | | | 483 | |
| | Argentina—0.8% | | | | | | | | |
| | Argentine Republic Government International Bond,
0.125%, due 7/9/41, VRN(a) | | | 300 | | | | 107 | |
| | Argentine Republic Government International Bond,
0.125%, due 7/9/46, VRN(a) | | | 125 | | | | 40 | |
| | Argentine Republic Government International Bond,
0.125%, due 7/9/41, VRN(a) | | EUR | 125 | | | | 46 | |
| | | | | | | | | 193 | |
| | Armenia—0.8% | | | | | | | | |
| | Republic of Armenia International Bond,
3.600%, due 2/2/31 | | $ | 200 | | | | 189 | |
| | Bahrain—2.0% | | | | | | | | |
| | Bahrain Government International Bond,
5.450%, due 9/16/32 | | | 200 | | | | 199 | |
| | Bahrain Government International Bond,
6.250%, due 1/25/51 | | | 300 | | | | 285 | |
| | | | | | | | | 484 | |
| | Belarus—0.7% | | | | | | | | |
| | Republic of Belarus International Bond,
6.378%, due 2/24/31 | | | 200 | | | | 173 | |
| | Belize—0.4% | | | | | | | | |
| | Belize Government International Bond,
4.938%, due 2/20/34, VRN(a) | | | 213 | | | | 85 | |
| | Benin—0.5% | | | | | | | | |
| | Benin Government International Bond,
6.875%, due 1/19/52 | | EUR | 100 | | | | 124 | |
| | Brazil—1.7% | | | | | | | | |
| | Brazilian Government International Bond, 5.625%, due 1/7/41 | | $ | 200 | | | | 217 | |
| | Fed Republic of Brazil,
3.750%, due 9/12/31 | | | 200 | | | | 198 | |
| | | | | | | | | 415 | |
| | Cameroon—2.0% | | | | | | | | |
| | Republic of Cameroon International Bond,
9.500%, due 11/19/25 | | | 200 | | | | 234 | |
| | Republic of Cameroon—144A,
5.950%, due 7/7/32 | | EUR | 200 | | | | 237 | |
| | | | | | | | | 471 | |
| | Chile—0.8% | | | | | | | | |
| | Chile Government International Bond,
3.100%, due 1/22/61 | | $ | 200 | | | | 191 | |
| | Colombia—2.2% | | | | | | | | |
| | Colombia Government International Bond,
6.125%, due 1/18/41 | | | 450 | | | | 532 | |
| | | | | | | | |
| | Issuer | | Principal
Amount | | | Value | |
| | | | | | | | |
| | Foreign Government Bonds—(continued) | | | | | | | | |
| | Dominican Republic—1.4% | | | | | | | | |
| | Dominican Republic International Bond,
5.875%, due 1/30/60 | | $ | 350 | | | $ | 349 | |
| | Ecuador—1.9% | | | | | | | | |
| | Ecuador Government International Bond,
0.500%, due 7/31/30, VRN(a) | | | 160 | | | | 137 | |
| | Ecuador Government International Bond,
0.500%, due 7/31/35, VRN(a) | | | 150 | | | | 103 | |
| | Ecuador Government International Bond,
0.500%, due 7/31/40, VRN(a) | | | 150 | | | | 93 | |
| | Ecuador Government International Bond,
0.000%, due 7/31/30 | | | 250 | | | | 138 | |
| | | | | | | | | 471 | |
| | Egypt—3.2% | | | | | | | | |
| | Egypt Government International Bond,
5.875%, due 2/16/31 | | | 200 | | | | 193 | |
| | Egypt Government International Bond,
3.875%, due 2/16/26 | | | 250 | | | | 246 | |
| | Egypt Government International Bond,
7.500%, due 2/16/61 | | | 350 | | | | 326 | |
| | | | | | | | | 765 | |
| | El Salvador—0.8% | | | | | | | | |
| | El Salvador Government International Bond,
8.250%, due 4/10/32 | | | 200 | | | | 189 | |
| | Gabon—1.3% | | | | | | | | |
| | Gabon Government International Bond,
6.625%, due 2/6/31 | | | 300 | | | | 301 | |
| | Ghana—1.7% | | | | | | | | |
| | Ghana Government International Bond,
8.875%, due 5/7/42 | | | 200 | | | | 202 | |
| | Ghana Government International Bond,
8.625%, due 4/7/34 | | | 200 | | | | 206 | |
| | | | | | | | | 408 | |
| | Indonesia—1.6% | | | | | | | | |
| | Indonesia Government International Bond,
3.400%, due 9/18/29 | | | 350 | | | | 379 | |
| | Iraq—1.1% | | | | | | | | |
| | Iraq International Bond,
6.752%, due 3/9/23 | | | 250 | | | | 255 | |
| | Ivory Coast—0.5% | | | | | | | | |
| | Ivory Coast Government International Bond,
6.625%, due 3/22/48 | | EUR | 100 | | | | 125 | |
| | Jamaica—1.0% | | | | | | | | |
| | Jamaica Government International Bond,
6.750%, due 4/28/28 | | $ | 200 | | | | 234 | |
| | Kenya—0.8% | | | | | | | | |
| | Kenya Government International Bond-144A,
6.300%, due 1/23/34 | | | 200 | | | | 200 | |
| | Lebanon—0.6% | | | | | | | | |
| | Lebanon Government International Bond,
6.850%, due 3/23/27(b) | | | 600 | | | | 74 | |
See accompanying Notes to Financial Statements.
| June 30, 2021 | William Blair Funds | 93 |
Emerging Markets Debt Fund
Portfolio of Investments, June 30, 2021 (all dollar amounts in thousands) (unaudited)
| | | | | | | | |
| | Issuer | | Principal
Amount | | | Value | |
| | | | | | | | |
| | Foreign Government Bonds—(continued) |
| | Lebanon (continued) | | | | | | | | |
| | Lebanon Government International Bond,
5.800%, due 4/14/20(b) | | | 600 | | | $ | 74 | |
| | | | | | | | | 148 | |
| | Macedonia—0.5% | | | | | | | | |
| | North Macedonia Government International Bond,
3.675%, due 6/3/26 | | EUR | 100 | | | | 131 | |
| | Mexico—0.8% | | | | | | | | |
| | Mexico Government International Bond,
3.750%, due 4/19/71 | | $ | 200 | | | | 183 | |
| | Nigeria—0.9% | | | | | | | | |
| | Nigeria Government International Bond,
7.696%, due 2/23/38 | | | 200 | | | | 205 | |
| | Oman—1.9% | | | | | | | | |
| | Oman Government International Bond,
6.000%, due 8/1/29 | | | 200 | | | | 212 | |
| | Oman Government International Bond,
6.750%, due 1/17/48 | | | 250 | | | | 249 | |
| | | | | | | | | 461 | |
| | Pakistan—1.0% | | | | | | | | |
| | Pakistan Government International Bond,
6.000%, due 4/8/26 | | | 250 | | | | 252 | |
| | Panama—1.9% | | | | | | | | |
| | Panama Government International Bond,
4.500%, due 5/15/47 | | | 200 | | | | 227 | |
| | Panama Government International Bond,
4.500%, due 4/1/56 | | | 200 | | | | 227 | |
| | | | | | | | | 454 | |
| | Paraguay—1.0% | | | | | | | | |
| | Paraguay Government International Bond,
5.600%, due 3/13/48 | | | 200 | | | | 235 | |
| | Peru—0.7% | | | | | | | | |
| | Peruvian Government International Bond,
3.230%, due 7/28/21 | | | 180 | | | | 158 | |
| | Philippines—1.1% | | | | | | | | |
| | Philippine Government International Bond,
3.700%, due 2/2/42 | | | 250 | | | | 269 | |
| | Qatar—2.9% | | | | | | | | |
| | Qatar Government International Bond,
3.750%, due 4/16/30 | | | 300 | | | | 340 | |
| | Qatar Government International Bond,
4.400%, due 4/16/50 | | | 300 | | | | 365 | |
| | | | | | | | | 705 | |
| | Romania—1.8% | | | | | | | | |
| | Romanian Government International Bond,
4.625%, due 4/3/49 | | EUR | 200 | | | | 301 | |
| | Romanian Government International Bond,
3.500%, due 4/3/34 | | | 100 | | | | 135 | |
| | | | | | | | | 436 | |
| | | | | | | | |
| | Issuer | | Principal
Amount | | | Value | |
| | | | | | | | | | |
| | Foreign Government Bonds—(continued) |
| | Russia—2.1% | | | | | | | | |
| | Russian Foreign Bond,
5.100%, due 3/28/35 | | $ | 200 | | | $ | 238 | |
| | Russian Foreign Bond,
5.625%, due 4/4/42 | | | 200 | | | | 256 | |
| | | | | | | | | 494 | |
| | Saudi Arabia—2.1% | | | | | | | | |
| | Saudi Government International Bond,
2.250%, due 2/2/33 | | | 200 | | | | 195 | |
| | Saudi Government International Bond,
3.450%, due 2/2/61 | | | 300 | | | | 299 | |
| | | | | | | | | 494 | |
| | Senegal—0.5% | | | | | | | | |
| | Senegal Government International Bond—144A,
5.375%, due 6/8/37 | | EUR | 100 | | | | 117 | |
| | Serbia—1.6% | | | | | | | | |
| | Serbia International Bond,
3.125%, due 5/15/27 | | | 300 | | | | 395 | |
| | South Africa—0.8% | | | | | | | | |
| | Republic of South Africa Government International Bond,
5.650%, due 9/27/47 | | $ | 200 | | | | 204 | |
| | Sri Lanka—1.6% | | | | | | | | |
| | Sri Lanka Government International Bond,
6.850%, due 3/14/24 | | | 200 | | | | 138 | |
| | Sri Lanka Government International Bond,
7.850%, due 3/14/29 | | | 400 | | | | 253 | |
| | | | | | | | | 391 | |
| | Tunisia—0.7% | | | | | | | | |
| | Banque Centrale de Tunisie International Bond,
5.625%, due 2/17/24 | | EUR | 150 | | | | 166 | |
| | Turkey—3.1% | | | | | | | | |
| | Hazine Mustesarligi Varlik Kiralama A.S.—144A,
5.125%, due 6/22/26 | | $ | 200 | | | | 200 | |
| | Turkey Government International Bond,
4.875%, due 4/16/43 | | | 200 | | | | 159 | |
| | Turkey Government International Bond,
5.750%, due 5/11/47 | | | 200 | | | | 170 | |
| | Turkey Government International Bond,
5.600%, due 11/14/24 | | | 200 | | | | 205 | |
| | | | | | | | | 734 | |
| | Ukraine—2.9% | | | | | | | | |
| | Ukraine Government International Bond,
1.258%, due 5/31/40, VRN(a) | | | 200 | | | | 237 | |
| | Ukraine Government International Bond,
7.750%, due 9/1/22 | | | 150 | | | | 157 | |
| | Ukraine Government International Bond,
7.253%, due 3/15/33 | | | 300 | | | | 312 | |
| | | | | | | | | 706 | |
| | Uruguay—0.8% | | | | | | | | |
| | Uruguay Government International Bond,
4.975%, due 4/20/55 | | | 150 | | | | 193 | |
See accompanying Notes to Financial Statements.
| 94 | Semiannual Report | June 30, 2021 |
Emerging Markets Debt Fund
Portfolio of Investments, June 30, 2021 (all dollar amounts in thousands) (unaudited)
| | | | | | | | |
| | Issuer | | Principal
Amount | | | Value | |
| | | | | | | | |
| | Foreign Government Bonds—(continued) | |
| | Zambia—1.1% | | | | | | | | |
| | Zambia Government International Bond,
8.500%, due 4/14/24 | | $ | 200 | | | $ | 128 | |
| | Zambia Government International Bond,
8.970%, due 7/30/27 | | | 200 | | | | 126 | |
| | | | | | | | | 254 | |
| | Total Foreign Government Bonds—61.6%
(cost $14,892) | | | | | | | 14,801 | |
| | | | | | | | | | |
| | Foreign Corporate Bonds—32.1% | | | | | | | | |
| | Brazil—1.7% | | | | | | | | |
| | Atento Luxco 1 S.A.,
8.000%, due 2/10/26 | | | 100 | | | | 109 | |
| | CSN Islands XII Corporation,
7.000%, (c) | | | 100 | | | | 100 | |
| | MV24 Capital BV,
6.748%, due 6/1/34 | | | 187 | | | | 207 | |
| | | | | | | | | 416 | |
| | Chile—1.8% | | | | | | | | |
| | Empresa Nacional del Petroleo,
5.250%, due 11/6/29 | | | 200 | | | | 223 | |
| | Kenbourne Invest S.A.,
4.700%, due 1/22/28 | | | 200 | | | | 201 | |
| | | | | | | | | 424 | |
| | China—1.9% | | | | | | | | |
| | CNAC HK Finbridge Co., Ltd.,
4.875%, due 3/14/25 | | | 200 | | | | 219 | |
| | Sinopec Group Overseas Development 2015, Ltd.,
4.100%, due 4/28/45 | | | 200 | | | | 226 | |
| | | | | | | | | 445 | |
| | Colombia—0.8% | | | | | | | | |
| | SierraCol Energy Andina LLC—144A,
6.000%, due 6/15/28 | | | 200 | | | | 203 | |
| | Costa Rica—0.7% | | | | | | | | |
| | Instituto Costarricense,
6.375%, due 5/15/43 | | | 200 | | | | 172 | |
| | Dominican Republic—0.9% | | | | | | | | |
| | AES Andres BV—144A,
5.700%, due 5/4/28 | | | 200 | | | | 206 | |
| | Ghana—0.7% | | | | | | | | |
| | Tullow Oil plc,
7.000%, due 3/1/25 | | | 200 | | | | 177 | |
| | Guatemala—0.9% | | | | | | | | |
| | Investment Energy Resources Ltd.—144A,
6.250%, due 4/26/29 | | | 200 | | | | 216 | |
| | India—1.6% | | | | | | | | |
| | Continuum Energy Levante,
4.500%, due 2/9/27 | | | 200 | | | | 205 | |
| | Export-Import Bank of India,
2.250%, due 1/13/31 | | | 200 | | | | 186 | |
| | | | | | | | | 391 | |
| | | | | | | | |
| | Issuer | | Principal
Amount | | | Value | |
| | | | | | | | | | |
| | Foreign Corporate Bonds—(continued) | |
| | | | | | | | | | |
| | Indonesia—3.8% | | | | | | | | |
| | Perusahaan Perseroan Persero PT Perusahaan Listrik Negara,
5.250%, due 10/24/42 | | $ | 250 | | | $ | 282 | |
| | Perusahaan Perseroan Persero PT Perusahaan Listrik Negara,
5.375%, due 1/25/29 | | | 200 | | | | 233 | |
| | PT Bank Tabungan Negara Persero Tbk,
4.200%, due 1/23/25 | | | 200 | | | | 204 | |
| | PT Pertamina Persero,
2.300%, due 2/9/31 | | | 200 | | | | 192 | |
| | | | | | | | | 911 | |
| | Jamaica—0.9% | | | | | | | | |
| | Sagicor Financial Co. Ltd.—144A,
5.300%, due 5/13/28 | | | 200 | | | | 207 | |
| | Kazakhstan—1.0% | | | | | | | | |
| | KazMunayGas National Co. JSC,
5.750%, due 4/19/47 | | | 200 | | | | 249 | |
| | Malaysia—3.1% | | | | | | | | |
| | 1MDB Global Investments, Ltd.,
4.400%, due 3/9/23 | | | 500 | | | | 504 | |
| | Petronas Capital, Ltd.,
4.550%, due 4/21/50 | | | 200 | | | | 247 | |
| | | | | | | | | 751 | |
| | Mexico—3.3% | | | | | | | | |
| | Banco Mercantil De Norte,
7.625%, due 12/31/99 | | | 200 | | | | 226 | |
| | Petroleos Mexicanos,
6.500%, due 1/23/29 | | | 200 | | | | 207 | |
| | Petroleos Mexicanos,
7.690%, due 1/23/50 | | | 200 | | | | 191 | |
| | Petroleos Mexicanos,
6.950%, due 1/28/60 | | | 200 | | | | 177 | |
| | | | | | | | | 801 | |
| | Mongolia—0.9% | | | | | | | | |
| | Development Bank of Mongolia,
7.250%, due 10/23/23 | | | 200 | | | | 215 | |
| | Qatar—2.1% | | | | | | | | |
| | Qatar Petroleum—144A,
3.300%, due 7/12/51 | | | 200 | | | | 200 | |
| | Qatar Petroleum—144A,
2.250%, due 7/12/31 | | | 300 | | | | 297 | |
| | | | | | | | | 497 | |
| | South Africa—0.9% | | | | | | | | |
| | Eskom Holdings SOC, Ltd.,
8.450%, due 8/10/28 | | | 200 | | | | 226 | |
| | Supranational—0.8% | | | | | | | | |
| | The African Export-Import Bank—144A,
3.798%, due 5/17/31 | | | 200 | | | | 204 | |
| | Thailand—0.9% | | | | | | | | |
| | Bangkik Bank PCL/HKJ,
5.000%, due 12/31/99, VRN(a) | | | 200 | | | | 211 | |
See accompanying Notes to Financial Statements.
| June 30, 2021 | William Blair Funds | 95 |
Emerging Markets Debt Fund
Portfolio of Investments, June 30, 2021 (all dollar amounts in thousands) (unaudited)
| | | | | | | | |
| | Issuer | | Principal
Amount | | | Value | |
| | | | | | | | |
| | Foreign Corporate Bonds—(continued) | |
| | Ukraine—0.9% | | | | | | | | |
| | NAK Naftogaz Ukraine via Kondor Finance plc,
7.625%, due 11/8/26 | | $ | 200 | | | $ | 206 | |
| | United Arab Emirates—1.6% | | | | | | | | |
| | Abu Dhabi Government International Bond,
2.700%, due 9/2/70 | | | 200 | | | | 182 | |
| | Finance Department Government of Sharjah,
4.375%, due 3/10/51 | | | 200 | | | | 193 | |
| | | | | | | | | 375 | |
| | Uzbekistan—0.9% | | | | | | | | |
| | Ipoteka—Bank ATIB,
5.500%, due 11/19/25 | | | 200 | | | | 210 | |
| | Total Foreign Corporate Bonds—32.1%
(cost $7,666) | | | | | | | 7,713 | |
| | | | | | | | | | |
| | Foreign Municipal Bonds—1.8% | | | | | | | | |
| | Argentina—1.8% | | | | | | | | |
| | Provincia de Buenos Aires, 9.950%, due 6/9/21(b) | | | 250 | | | | 114 | |
| | Provincia de Buenos Aires,
9.125%, due 3/16/24 | | | 250 | | | | 108 | |
| | Provincia de Cordoba,
5.000%, due 6/1/27, VRN(a) | | | 150 | | | | 103 | |
| | Provincia de Entre Rios Argentina,
5.000%, due 8/8/28, VRN(a) | | | 150 | | | | 96 | |
| | | | | | | | | 421 | |
| | Total Foreign Municipal Bonds—1.8%
(cost $426) | | | | | | | 421 | |
| | | | | | | | | | |
| | Repurchase Agreement—6.0% | | | | | | | | |
| | Fixed Income Clearing Corporation, 0.000% dated 6/30/21, due 7/1/21, repurchase price $1,443, collateralized by U.S. Treasury Bond, 1.875%, due 2/15/41, valued at $1,472 | | $ | 1,443 | | | $ | 1,443 | |
| | Total Repurchase Agreement—6.0%
(cost $1,443) | | | | | | | 1,443 | |
| | Total Investments in Securities—101.5%
(cost $24,427) | | | | | | | 24,378 | |
| | Total Investments—101.5%
(cost $24,427) | | | | | | | 24,378 | |
| | Liabilities, plus cash and other assets—(1.5)% | | | | | | | (353 | ) |
| | Net assets—100.0% | | | | | | $ | 24,025 | |
(a) Variable/Floating interest rate security. Certain variable/floating interest rate securities are not based on a published reference rate and spread but are determined by the issuer or agent and are based on current market conditions. These securities do not indicate a reference rate and spread in their description above. Rate presented is as of June 30, 2021.
(b) Defaulted security.
(c) Security is perpetual in nature and has no stated maturity.
VRN = Variable Rate Note
144A = Security exempt from registration under Rule 144A of the Securities Act of 1933. These securities may be resold in transactions exempt from registration, normally to qualified institutional buyers.
At June 30, 2021, the Fund’s Portfolio of Investments includes the following categories (as a percentage of long-term investments):
| Foreign Government Bonds | | | 64.5 | % |
| Foreign Corporate Bonds | | | 33.6 | % |
| Foreign Municipal Bonds | | | 1.9 | % |
| Total | | | 100.0 | % |
| | | | | |
| At June 30, 2021, the Fund’s Portfolio of Investments includes exposure to the following countries (as a percentage of long-term investments): |
| | | | | |
| Angola | | | 2.1 | % |
| Argentina | | | 2.7 | % |
| Armenia | | | 0.8 | % |
| Bahrain | | | 2.1 | % |
| Belarus | | | 0.8 | % |
| Belize | | | 0.4 | % |
| Benin | | | 0.5 | % |
| Brazil | | | 3.6 | % |
| Cameroon | | | 2.1 | % |
| Chile | | | 2.7 | % |
| China | | | 1.9 | % |
| Colombia | | | 3.2 | % |
| Costa Rica | | | 0.7 | % |
| Dominican Republic | | | 2.4 | % |
| Ecuador | | | 2.1 | % |
| Egypt | | | 3.3 | % |
| El Salvador | | | 0.8 | % |
| Gabon | | | 1.3 | % |
| Ghana | | | 2.6 | % |
| Guatemala | | | 0.9 | % |
| India | | | 1.7 | % |
| Indonesia | | | 5.6 | % |
| Iraq | | | 1.1 | % |
| Ivory Coast | | | 0.5 | % |
| Jamaica | | | 1.9 | % |
| Kazakhstan | | | 1.1 | % |
| Kenya | | | 0.9 | % |
| Lebanon | | | 0.6 | % |
| Macedonia | | | 0.6 | % |
| Malaysia | | | 3.3 | % |
| Mexico | | | 4.3 | % |
| Mongolia | | | 0.9 | % |
| Nigeria | | | 0.9 | % |
| Oman | | | 2.0 | % |
| Pakistan | | | 1.1 | % |
| Panama | | | 2.0 | % |
| Paraguay | | | 1.0 | % |
| Peru | | | 0.7 | % |
| Philippines | | | 1.2 | % |
| Qatar | | | 5.2 | % |
| Romania | | | 1.9 | % |
| Russia | | | 2.2 | % |
| Saudi Arabia | | | 2.2 | % |
| Senegal | | | 0.5 | % |
| Serbia | | | 1.7 | % |
| South Africa | | | 1.9 | % |
| Sri Lanka | | | 1.7 | % |
| Supranational | | | 0.9 | % |
| Thailand | | | 0.9 | % |
| Tunisia | | | 0.7 | % |
| Turkey | | | 3.2 | % |
| Ukraine | | | 4.0 | % |
| United Arab Emirates | | | 1.6 | % |
| Uruguay | | | 0.9 | % |
| Uzbekistan | | | 1.0 | % |
| Zambia | | | 1.1 | % |
| Total | | | 100.0 | % |
See accompanying Notes to Financial Statements.
| 96 | Semiannual Report | June 30, 2021 |
Emerging Markets Debt Fund
Portfolio of Investments, June 30, 2021 (all dollar amounts in thousands) (unaudited)
Forward Foreign Currency Contracts
Settlement
Date | | Deliver/Receive | | Counterparty | | Local Currency (in thousands) | | USD (Base)
Purchased
or Sold | | Current
Value | | Net
Unrealized
Appreciation
(Depreciation) |
| Sold 9/15/21 | | Euro | | Citibank N.A. London | | | 1,273 | | | | | 1,552 | | | | $ | 1,512 | | | | | $40 | |
Centrally Cleared Interest Rate Swaps
Floating Rate
Reference | | Pay/Receive
Floating Rate | | Fixed
Rate | | Payment
Frequency | | Maturity
Date | | Cleared
Exchange | | Notional
Amount
(in thousands) | | | Upfront
Payment
Paid
(Received) | | | Value | | Unrealized
Appreciation
(Depreciation) |
| 3 Month USD LIBOR | | Receive | | | 1.774 | % | | 6M | | February 2071 | | LCH | | | $260 | | | $ | 3 | | | | $(17 | ) | | | $(20 | ) |
| 3 Month USD LIBOR | | Receive | | | 0.750 | % | | 6M | | June 2031 | | LCH | | | 263 | | | | 20 | | | | 17 | | | | (3 | ) |
| 3 Month USD LIBOR | | Receive | | | 0.750 | % | | 6M | | June 2036 | | LCH | | | 390 | | | | 57 | | | | 47 | | | | (10 | ) |
| 3 Month USD LIBOR | | Receive | | | 1.250 | % | | 6M | | June 2051 | | LCH | | | 406 | | | | 69 | | | | 49 | | | | (20 | ) |
| 6 Month EURIBOR | | Receive | | | (0.250 | )% | | 1Y | | June 2026 | | LCH | | | EUR 585 | | | | — | | | | (1 | ) | | | (1 | ) |
| 6 Month EURIBOR | | Receive | | | 0.000 | % | | 1Y | | June 2036 | | LCH | | | EUR 270 | | | | 20 | | | | 17 | | | | (3 | ) |
| 6 Month EURIBOR | | Receive | | | 0.250 | % | | 1Y | | June 2041 | | LCH | | | EUR 220 | | | | 14 | | | | 10 | | | | (4 | ) |
| 3 Month USD LIBOR | | Pay | | | 0.500 | % | | 6M | | June 2026 | | LCH | | | $485 | | | | (9 | ) | | | (10 | ) | | | (1 | ) |
| 3 Month USD LIBOR | | Pay | | | 0.500 | % | | 6M | | June 2028 | | LCH | | | 538 | | | | (27 | ) | | | (25 | ) | | | 2 | |
| 3 Month USD LIBOR | | Pay | | | 1.000 | % | | 6M | | June 2041 | | LCH | | | 1,173 | | | | (187 | ) | | | (146 | ) | | | 41 | |
| | | | | | | | | | | | | | | | | | | | | | | | | | | | $(19 | ) |
Centrally Cleared Credit Default Swaps
Reference
Entity | | Buy/Sell
Protection | | Fixed Rate | | Payment
Frequency | | Maturity
Date | | Cleared
Exchange | | Notional
Amount
(in thousands) | | | Upfront
Payment
Paid
(Received) | | | Value | | Unrealized
Appreciation
(Depreciation) |
| Russian Federation | | Buy | | | 1.000 | % | | 3M | | June 2026 | | ICE | | $ | 200 | | | | $— | | | | $(2 | ) | | | $(2 | ) |
| Republic of South Africa | | Buy | | | 1.000 | % | | 3M | | June 2026 | | ICE | | | 250 | | | | 11 | | | | 10 | | | | (1 | ) |
| | | | | | | | | | | | | | | | | | | | | | | | | | | | $(3 | ) |
| Total net unrealized appreciation (depreciation) on swaps | | | $(22 | ) |
See accompanying Notes to Financial Statements.
| June 30, 2021 | William Blair Funds | 97 |
| | Macro Allocation Fund |
| | |
| | The Macro Allocation Fund seeks to maximize long-term risk-adjusted total return. |
| | |
| | AN OVERVIEW FROM THE PORTFOLIO MANAGERS |

Thomas Clarke 
Brian D. Singer, CFA | |
The William Blair Macro Allocation Fund (Class N shares) posted a 3.84% increase, net of fees, for the six months ended June 30, 2021. By comparison, the Fund’s benchmark index, the ICE BofAML US 3-Month Treasury Bill Index (the “Index”), increased 0.02%. The first six months of 2021 stand in stark contrast to the first half of 2020. Equity markets rose, generally, with the MSCI All Country World Index (hedged) gaining 13%, while bonds generally fell, with the Bloomberg Barclays Global Aggregate losing 1.5%. This “risk-on” environment comes on the back of a continued recovery from the COVID-19 pandemic that shook markets in the first half 2020. Developed equities outperformed broad emerging equities consistent with vaccination progress, government stimulus, and economic recovery. From an equity sector perspective, cyclicals such as Energy and Financials outperformed, while defensives such as Consumer Staples and Utilities underperformed. Risk-on carried into the currency landscape as well, with the strongest performers in Brazil real, South Africa rand, and Russia ruble, and the weakest currency being the Japanese yen. The Fund’s market and currency segments were both positive during the period. Within markets, the Fund benefitted from long exposures (which may be obtained indirectly through derivatives or directly through exchange-traded funds or other securities) to U.S., United Kingdom (U.K.), Australia, Vietnam, and global energy sector equities. Detracting from the market segment performance were long exposures to Indonesia and Chile equities, and short exposure to Switzerland equities, as well as long exposure to U.S. Treasuries. Currency contributions came from long exposure to the Brazilian real, and short exposures in the Swiss franc and Thai baht. Detractors within currency were long exposures in the Turkish lira, Colombian peso, and Japanese yen. As we entered 2021, our view was that several of the macro headwinds that had been an influence on global markets had abated. There was greater optimism that the economically disruptive impact of the COVID-19 pandemic, while ongoing, would be overcome with the rollout of vaccinations in several regions. Notably, developed markets have had (for the most part) successful vaccination campaigns thus far. Vaccination campaigns have started in many developing nations, but progress to date has been limited. Nonetheless, some of the uncertainty over how long global economic activity would be constrained by the COVID-19 pandemic has mostly cleared. Another macro headwind that has abated is the specter of protectionism harming trade and growth, for which we had accounted in a macro theme. The risk arose primarily from former U.S. President Trump’s Administration, and for the last few years had been directed at China. Although U.S. President Biden’s Administration in the near term is not likely to unwind any of the trade barriers with China erected by former U.S. President Trump, increased protectionism is also not likely. Following the two-year agreement that the Trump Administration reached with China one year ago, where China pledged to increase imports from the United States, fulfilment of China’s targets has been partial to date, but China’s imports have been influenced (downward) by the COVID-19 pandemic, which was not foreseen at the time the agreement was reached. Third, the disorderly prospect of a “no-deal Brexit” in Europe was averted just before the 2020 year-end deadline. According to data released in 2021, however, there has been a sharp fall in U.K. exports to the European Union (EU), and a smaller fall in imports the other way. This may reflect adjustment to new regulatory hurdles to trade activities, as well as partly being an |
| 98 | Semiannual Report | June 30, 2021 |
Macro Allocation Fund
offset to increased pre-deadline preparations. But less U.K.-EU trade is consistent with the impact of Brexit—even with the deal reached—being growth-adverse in comparison with the previous status quo.
Our portfolio strategy accounted for the fading of the aforementioned headwinds by increasing exposure to those equity markets we believe are fundamentally attractive, and similarly by stepping into the currency opportunities that presented themselves. Our overall equity exposure is at the highest level it has been at for some years (although by no means aggressively bullish, as some markets are not sufficiently attractive to justify this). Similarly, we increased aggregate active risk within our currency strategy in the second half of 2020 after being significantly more cautious earlier due to prior headwinds, the most influential of which was the COVID-19 pandemic shock. Our view remains that that the gravitation of prices to fundamental value has a somewhat clearer path ahead than has been the case for the last year and more.
A new thematic influence came into focus in early 2021 and influenced several markets and currencies, which conventional wisdom refers to as the “reflation” theme. The influence of this theme is essentially opposite that of the fears of the economic slump of the previous 12 months. In contrast to early 2020, market expectations in early 2021 quickly evolved to that of some concern about overly rapid economic growth and potentially higher-than-desired inflation—a result of the prolonged history of easy monetary conditions, the aggressive fiscal stimulus in 2020 in developed countries, and the likelihood that vaccination against COVID-19 will result in relatively quicker lifting of lingering restrictions on economic activity. All three of these influences apply to the United States, some of them more widely.
This development caused long-term government bond yields to rise quite significantly in the United States, and to a lesser extent across all developed world markets. Consistent with this, some equity sectors suffered, in particular growth-sensitive sectors. In contrast, sectors of a more cyclical nature benefited from the reflation theme. Our strategy has been to disfavor government bonds, and this included a net short position to Germany sovereign debt. Strategy also has favored cyclical equities (such as financials and energy) over growth sectors (such as information technology). The reflation theme has therefore been a somewhat beneficial tailwind to our portfolios in these areas.
In currencies, the impact of reflation expectations has been negative for currencies like the Swiss franc and the Japanese yen, which have negative interest rates and are typically used as “funding” currencies (sold against higher-yielding currencies). We used the fall in the franc to buy back (reduce) some short exposure during the second quarter. Emerging currencies were not significantly affected overall, although the currencies of countries where growth is particularly slow, and where public indebtedness has increased significantly, are more vulnerable to increased reflation expectations. In our view, the macro theme is therefore a headwind to some fundamentally attractive currencies.
Changes to strategy over the past six months have mostly been in response to relative price movements in both markets and currencies. Exposure was increased in those markets that underperformed, such as Philippines and Malaysia equities, and decreased in those that outperformed, such as Vietnam and U.S. equities. Similarly, our changes in the currency space added to fundamentally attractive currencies such as the Brazilian real and Russian ruble, while reducing exposure in strong performers such as the South African rand and Mexican peso.
As indicated above, the exposures within the Fund are a combination of instruments, including exchange-traded funds, physical baskets of securities, and derivatives. The decision on what instrument to use is a function of liquidity, cost, precision, tax treatment, and transparency. Derivatives are used both to gain desired exposures and hedge away undesired exposures. The performance of the Fund will be predominantly dictated by the macro exposures themselves (such as long Brazil equity) as opposed to the instrument used to gain the exposure (exchange-traded fund or physical basket of securities vs. derivative).
| June 30, 2021 | William Blair Funds | 99 |
Macro Allocation Fund
Performance Highlights (Unaudited)
| Average Annual Total Returns through 6/30/2021 |
| | | Year
to Date | | 1 Year | | 3 Year | | 5 Year | | Since
Inception |
| Class N(a) | | | 3.84 | % | | | 7.86 | % | | | 1.49 | % | | | 1.91 | % | | | 3.61 | % |
| Class I(a) | | | 3.96 | | | | 8.22 | | | | 1.74 | | | | 2.18 | | | | 3.88 | |
| ICE BofAML US 3-Month Treasury Bill Index(a) | | | 0.02 | | | | 0.09 | | | | 1.34 | | | | 1.17 | | | | 0.65 | |
| Class R6(b) | | | 4.06 | | | | 8.23 | | | | 1.85 | | | | 2.28 | | | | 1.38 | |
| ICE BofAML US 3-Month Treasury Bill Index(b) | | | 0.02 | | | | 0.09 | | | | 1.34 | | | | 1.17 | | | | 0.79 | |
| (a) | Since inception is for the period from November 29, 2011 (Commencement of Operations) to June 30, 2021. |
| | |
| (b) | Since inception is for the period from October 21, 2013 (Commencement of Operations) to June 30, 2021. |
Performance cited represents past performance. Past performance does not guarantee future results and current performance may be lower or higher than the data quoted. Results shown are average annual total returns, which assume reinvestment of dividends and capital gains. Investment returns and principal will fluctuate and you may have a gain or loss when you sell shares. For the most current month-end performance information, please call 1-800-742-7272, or visit our Web site at www.williamblairfunds.com. The Fund involves a high level of risk and may not be appropriate for everyone. You could lose money by investing in the Fund. There can be no assurance that the Fund’s investment objective will be achieved or that the Fund’s investment strategies will be successful. The Fund is not a complete investment program. From time to time, the investment adviser may waive fees or reimburse expenses for the Fund. Without these waivers/reimbursements, performance would be lower. Class N shares are not subject to a sales load. Class I shares are not subject to a sales load or distribution (Rule 12b-1) fees. Class R6 shares are not subject to a sales load, distribution (Rule 12b-1) fees, or sub-transfer agent fees.
The performance highlights and graph presented above do not reflect the deduction of taxes that a shareholder would pay on fund distributions or the redemption of fund shares.
The ICE BofAML US 3-Month Treasury Bill Index measures total return on cash, including price and interest income, based on short-term government Treasury Bills of about 90-day maturity. The Index is unmanaged, does not incur fees or expenses, and cannot be invested in directly.
This report identifies the Fund’s investments on June 30, 2021. These holdings are subject to change. Not all investments in the Fund performed the same, nor is there any guarantee that these investments will perform as well in the future. Market forecasts provided in this report may not necessarily come to pass.
Portfolio Allocation (Unaudited)
The table below provides the allocation of the Fund’s holdings as a percent of net assets as of June 30, 2021.
| Category | | % of net
assets |
| Equity Exchange-Traded Funds | | | 62.0 | |
| Fixed Income Exchange-Traded Funds | | | 4.2 | |
| Common Stocks | | | 4.9 | |
| Foreign Government Bonds | | | 12.3 | |
| Preferred Stocks | | | 0.4 | |
| Repurchase Agreement | | | 4.3 | |
| U.S. Government | | | 9.8 | |
| Purchased Options | | | 0.2 | |
| Cash and other assets, less liabilities | | | 1.9 | |
| Total | | | 100.0 | % |
| 100 | Semiannual Report | June 30, 2021 |
Macro Allocation Fund
Portfolio of Investments, June 30, 2021 (all dollar amounts in thousands)(unaudited)
| | | | | | | | |
| | | | | | | | |
| | Issuer | | Shares | | | Value | |
| | |
| | Exchange-Traded Funds—66.2% | | | | | | | | |
| | Equity Exchange-Traded Funds—62.0% | | | | | | | | |
| | Financial Select Sector SPDR Fund | | | 59,200 | | | $ | 2,172 | |
| | iShares MSCI Brazil ETF | | | 65,000 | | | | 2,635 | |
| | iShares MSCI Chile ETF | | | 42,000 | | | | 1,217 | |
| | iShares MSCI India ETF | | | 8,300 | | | | 367 | |
| | SPDR S&P 500 ETF Trust (a) | | | 297,700 | | | | 127,433 | |
| | Utilities Select Sector SPDR Fund | | | 8,200 | | | | 519 | |
| | Vietnam Enterprise Investments, Ltd. Class “C” | | | 228,300 | | | | 2,211 | |
| | Total Equity Exchange-Traded Funds | | | | | | | 136,554 | |
| | Fixed Income Exchange-Traded Funds—4.2% | | | | | | | | |
| | iShares iBoxx $ Investment Grade Corporate Bond ETF | | | 51,200 | | | | 6,880 | |
| | SPDR Bloomberg Barclays High Yield Bond ETF | | | 21,900 | | | | 2,408 | |
| | Total Fixed Income Exchange-Traded Funds | | | | | | | 9,288 | |
| | Total Exchange-Traded Funds—66.2%
(cost $102,888) | | | | | | | 145,842 | |
| | |
| | Common Stocks—4.9% | | | | | | | | |
| | |
| | Emerging Asia—2.8% | | | | | | | | |
| | Philippines—2.8% | | | | | | | | |
| | Aboitiz Equity Ventures, Inc. (Industrial conglomerates) | | | 248,168 | | | | 214 | |
| | Ayala Corporation (Industrial conglomerates) | | | 33,552 | | | | 550 | |
| | Ayala Land, Inc. (Real estate management & development) | | | 923,619 | | | | 682 | |
| | Bank of the Philippine Islands (Banks) | | | 213,075 | | | | 387 | |
| | BDO Unibank, Inc. (Banks) | | | 230,665 | | | | 535 | |
| | Globe Telecom, Inc. (Wireless telecommunication services) | | | 3,160 | | | | 119 | |
| | GT Capital Holdings, Inc. (Diversified financial services) | | | 11,878 | | | | 148 | |
| | International Container Terminal Services, Inc. (Transportation infrastructure) | | | 119,131 | | | | 399 | |
| | JG Summit Holdings, Inc. (Industrial conglomerates) | | | 344,760 | | | | 439 | |
| | Jollibee Foods Corporation (Hotels, restaurants & leisure) | | | 53,147 | | | | 233 | |
| | Manila Electric Co. (Electric utilities) | | | 27,347 | | | | 155 | |
| | Metro Pacific Investments Corporation (Diversified financial services) | | | 1,454,264 | | | | 116 | |
| | Metropolitan Bank & Trust Co. (Banks) | | | 212,149 | | | | 212 | |
| | PLDT, Inc. (Wireless telecommunication services) | | | 9,033 | | | | 239 | |
| | SM Investments Corporation (Industrial conglomerates) | | | 28,190 | | | | 577 | |
| | SM Prime Holdings, Inc. (Real estate management & development) | | | 1,186,350 | | | | 887 | |
| | Universal Robina Corporation (Food products) | | | 105,596 | | | | 313 | |
| | | | | | | | | 6,205 | |
| | Issuer | | Shares or
Principal
Amount | | | Value | |
| | |
| | Common Stocks (continued) | | | | | | | | |
| | | | | | | | | | |
| | Emerging Latin America—2.1% | | | | | | | | |
| | Chile—2.1% | | | | | | | | |
| | Banco de Chile (Banks) | | | 6,648,294 | | | $ | 656 | |
| | Banco de Credito e Inversiones S.A. (Banks) | | | 7,088 | | | | 299 | |
| | Banco Santander Chile (Banks) | | | 9,607,446 | | | | 475 | |
| | Cencosud S.A. (Food & staples retailing) | | | 219,957 | | | | 438 | |
| | Cencosud Shopping S.A | | | 71,867 | | | | 118 | |
| | Cia Cervecerias Unidas S.A. (Beverages) | | | 23,118 | | | | 233 | |
| | Colbun S.A. (Independent power & renewable electricity producers) | | | 1,176,202 | | | | 164 | |
| | Empresas CMPC S.A. (Paper & forest products) | | | 157,830 | | | | 376 | |
| | Empresas COPEC S.A. (Oil, gas & consumable fuels) | | | 56,120 | | | | 552 | |
| | Enel Americas S.A. (Electric utilities) | | | 3,115,256 | | | | 457 | |
| | Enel Chile S.A. (Electric utilities) | | | 4,113,165 | | | | 237 | |
| | Falabella S.A. (Multiline retail) | | | 110,904 | | | | 494 | |
| | | | | | | | | 4,499 | |
| | Total Common Stocks—4.9%
(cost $9,799) | | | | | | | 10,704 | |
| | |
| | Foreign Government Bonds—12.3% | | | | | | | | |
| | Brazil—4.1% | | | | | | | | |
| | Brazil Notas do Tesouro Nacional | | | | | | | | |
| | Serie F, 10.000%, due 1/1/25 | | BRL 42,370 | | | | 8,990 | |
| | Malaysia—5.8% | | | | | | | | |
| | Malaysia Government Bond, 3.480%, due 3/15/23 | | MYR 51,730 | | | | 12,775 | |
| | South Africa—2.4% | | | | | | | | |
| | Republic of South Africa Government | | | | | | | | |
| | Bond, 7.000%, due 2/28/31 | | ZAR 90,163 | | | | 5,418 | |
| | Total Foreign Government Bonds—12.3%
(cost $26,360) | | | | | | | 27,183 | |
| | |
| | Preferred Stock—0.4% | | | | | | | | |
| | Chile—0.4% | | | | | | | | |
| | Sociedad Quimica y Minera de Chile S.A. Class “B” (Chemicals) | | | 20,252 | | | | 954 | |
| | Total Preferred Stock—0.4%
(cost $856) | | | | | | | 954 | |
| | |
| | Repurchase Agreement—4.3% | | | | | | | | |
| | Fixed Income Clearing Corporation, 0.000% dated 6/30/21, due 7/1/21, repurchase price $9,466, collateralized by U.S. Treasury Bond, 1.875%, due 2/15/41, valued at $9,656 | | | $9,466 | | | | 9,466 | |
| | Total Repurchase Agreement—4.3%
(cost $9,466) | | | | | | | 9,466 | |
See accompanying Notes to Financial Statements.
| June 30, 2021 | William Blair Funds | 101 |
Macro Allocation Fund
Portfolio of Investments, June 30, 2021 (all dollar amounts in thousands)(unaudited)
| | | | | | | | |
| | Issuer | | Principal
Amount | | | Value | |
| | |
| | U.S. Government—9.8% | | | | | | | | |
| | U.S. Treasury Bill, 0.080%, due 10/7/21 | | | 500 | | | $ | 500 | |
| | U.S. Treasury Bill, 0.081%, due 11/4/21 | | | 500 | | | | 500 | |
| | U.S. Treasury Bill, 0.085%, due 12/2/21 | | | 500 | | | | 500 | |
| | U.S. Treasury Bill, 0.100%, due 12/30/21(b) | | | 5,000 | | | | 4,999 | |
| | U.S. Treasury Bill, 0.086%, due 1/27/22(b) | | | 5,500 | | | | 5,499 | |
| | U.S. Treasury Bill, 0.074%, due 2/24/22(b) | | | 3,000 | | | | 2,999 | |
| | U.S. Treasury Bill, 0.068%, due 3/24/22(b) | | | 2,000 | | | | 1,999 | |
| | U.S. Treasury Bill, 0.058%, due 4/21/22 | | | 1,500 | | | | 1,499 | |
| | U.S. Treasury Bill, 0.044%, due 5/19/22(b) | | | 1,500 | | | | 1,499 | |
| | U.S. Treasury Bill, 0.066%, due 6/16/22 | | | 1,500 | | | | 1,499 | |
| | Total U.S. Government—9.8%
(cost $21,490) | | | | | | | 21,493 | |
| | Total Purchased Options—0.2%
(cost $441) | | | | | | | 561 | |
| | Total Investments in Securities—98.1%
(cost $171,300) | | | | | | | 216,203 | |
| | Cash and other assets, less liabilities—1.9% | | | | | | | 4,238 | |
| | Net assets—100.0% | | | | | | $ | 220,441 | |
(a) The SPDR S&P 500 ETF Trust’s financial statements are available free of charge on the SEC’s website at https://www.sec.gov.
(b) Security, or portion of security, is segregated as collateral for centrally cleared swaps and to cover initial margin requirements on open futures contracts aggregating a total value of $14,015 (in thousands).
See accompanying Notes to Financial Statements.
| 102 | Semiannual Report | June 30, 2021 |
Macro Allocation Fund
Portfolio of Investments, June 30, 2021 (all dollar amounts in thousands)(unaudited)
Purchased Options Contracts
| Description | | Counterparty | | Exercise
Price/
FX Rate | | | Expiration
Date | | Number of
Contracts | | | Notional
Amount | | Market
Value | | Premiums
Paid
(Received)
by Fund | | Unrealized
Appreciation/
(Depreciation) | |
| Calls Euro Stoxx 50 | | Credit Suisse International | | 4,150 | | | 09/17/21 | | 442 | | | EUR | 17,964 | | | $ | 324 | | | $ | 258 | | | $ | 66 | |
| Puts NZD Put/ JPY Call | | Citibank N.A. | | 78 | | | 09/16/21 | | 15,843,000 | | | NZD | 15,843 | | | $ | 237 | | | $ | 183 | | | $ | 54 | |
| Total purchased options contracts | | | | | | | | $ | 561 | | | $ | 441 | | | $ | 120 | |
Forward Foreign Currency Contracts
Settlement
Date | | Deliver/Receive | | Counterparty | | Local Currency
(in thousands) | | USD (Base)
Purchased
or Sold | | Current
Value | | Net Unrealized
Appreciation
(Depreciation) |
| Purchased | | | | | | | | | | | | | | | | | | | | | | | |
| 7/21/21 | | Brazilian Real | | Citibank N.A. London | | | 71,622 | | | | | 14,087 | | | | $ | 14,370 | | | | $ | 283 | |
| 7/21/21 | | Chilean Peso | | Citibank N.A. London | | | 1,078,191 | | | | | 1,457 | | | | | 1,467 | | | | | 10 | |
| 7/21/21 | | Chinese Yuan Renminbi | | Citibank N.A. London | | | 12,290 | | | | | 1,899 | | | | | 1,899 | | | | | — | |
| 7/21/21 | | Colombian Peso | | Citibank N.A. London | | | 83,443,364 | | | | | 23,181 | | | | | 22,214 | | | | | (967 | ) |
| 7/21/21 | | Czech Koruna | | Citibank N.A. London | | | 51,236 | | | | | 2,393 | | | | | 2,382 | | | | | (11 | ) |
| 7/21/21 | | Hong Kong Dollar | | Citibank N.A. London | | | 20,738 | | | | | 2,670 | | | | | 2,670 | | | | | — | |
| 7/21/21 | | Indonesian Rupiah | | Citibank N.A. London | | | 28,682,500 | | | | | 1,976 | | | | | 1,966 | | | | | (10 | ) |
| 7/21/21 | | Israeli Shekel | | Citibank N.A. London | | | 13,334 | | | | | 4,096 | | | | | 4,091 | | | | | (5 | ) |
| 7/21/21 | | Mexican Peso | | Citibank N.A. London | | | 348,507 | | | | | 17,611 | | | | | 17,442 | | | | | (169 | ) |
| 7/21/21 | | Philippine Peso | | Citibank N.A. London | | | 287,612 | | | | | 6,017 | | | | | 5,881 | | | | | (136 | ) |
| 7/21/21 | | Russian Ruble | | Citibank N.A. London | | | 1,807,766 | | | | | 25,044 | | | | | 24,641 | | | | | (403 | ) |
| 7/21/21 | | Singapore Dollar | | Citibank N.A. London | | | 44,792 | | | | | 33,797 | | | | | 33,310 | | | | | (487 | ) |
| 7/21/21 | | South African Rand | | Citibank N.A. London | | | 6,347 | | | | | 445 | | | | | 443 | | | | | (2 | ) |
| 7/21/21 | | South Korean Won | | Citibank N.A. London | | | 1,078,542 | | | | | 952 | | | | | 954 | | | | | 2 | |
| 7/21/21 | | Taiwan Dollar | | Citibank N.A. London | | | 176,706 | | | | | 6,416 | | | | | 6,336 | | | | | (80 | ) |
| 7/21/21 | | Thai Baht | | Citibank N.A. London | | | 91,954 | | | | | 2,898 | | | | | 2,869 | | | | | (29 | ) |
| 7/22/21 | | Indian Rupee | | Citibank N.A. London | | | 924,896 | | | | | 12,574 | | | | | 12,411 | | | | | (163 | ) |
| 7/26/21 | | New Turkish Lira | | Citibank N.A. London | | | 97,205 | | | | | 11,320 | | | | | 11,024 | | | | | (296 | ) |
| 9/15/21 | | Australian Dollar | | Citibank N.A. London | | | 5,049 | | | | | 3,812 | | | | | 3,787 | | | | | (25 | ) |
| 9/15/21 | | British Pound Sterling | | Citibank N.A. London | | | 4,082 | | | | | 5,762 | | | | | 5,648 | | | | | (114 | ) |
| 9/15/21 | | Canadian Dollar | | Citibank N.A. London | | | 4,444 | | | | | 3,592 | | | | | 3,585 | | | | | (7 | ) |
| 9/15/21 | | Euro | | Citibank N.A. London | | | 3,836 | | | | | 4,575 | | | | | 4,556 | | | | | (19 | ) |
| 9/15/21 | | Japanese Yen | | Citibank N.A. London | | | 2,426,124 | | | | | 22,176 | | | | | 21,852 | | | | | (324 | ) |
| 9/15/21 | | New Zealand Dollar | | Citibank N.A. London | | | 8,083 | | | | | 5,666 | | | | | 5,649 | | | | | (17 | ) |
| 9/15/21 | | Swedish Krona | | Citibank N.A. London | | | 56,571 | | | | | 6,863 | | | | | 6,615 | | | | | (248 | ) |
| 9/15/21 | | Swiss Franc | | Citibank N.A. London | | | 2,395 | | | | | 2,610 | | | | | 2,594 | | | | | (16 | ) |
| | | | | | | | | | | | | | | | | | | | | | $ | (3,233 | ) |
| Sold | | | | | | | | | | | | | | | | | | | | | | | |
| 7/21/21 | | Brazilian Real | | Citibank N.A. London | | | 15,941 | | | | | 3,186 | | | | $ | 3,198 | | | | $ | (12 | ) |
| 7/21/21 | | Chilean Peso | | Citibank N.A. London | | | 5,953,540 | | | | | 8,265 | | | | | 8,103 | | | | | 162 | |
| 7/21/21 | | Chinese Yuan Renminbi | | Citibank N.A. London | | | 45,146 | | | | | 7,052 | | | | | 6,972 | | | | | 80 | |
| 7/21/21 | | Colombian Peso | | Citibank N.A. London | | | 14,928,367 | | | | | 3,949 | | | | | 3,974 | | | | | (25 | ) |
| 7/21/21 | | Czech Koruna | | Citibank N.A. London | | | 284,741 | | | | | 13,653 | | | | | 13,238 | | | | | 415 | |
| 7/21/21 | | Hong Kong Dollar | | Citibank N.A. London | | | 102,512 | | | | | 13,211 | | | | | 13,203 | | | | | 8 | |
| 7/21/21 | | Indonesian Rupiah | | Citibank N.A. London | | | 167,197,577 | | | | | 11,721 | | | | | 11,460 | | | | | 261 | |
| 7/21/21 | | Israeli Shekel | | Citibank N.A. London | | | 75,407 | | | | | 23,254 | | | | | 23,133 | | | | | 121 | |
| 7/21/21 | | Mexican Peso | | Citibank N.A. London | | | 62,806 | | | | | 3,098 | | | | | 3,143 | | | | | (45 | ) |
| 7/21/21 | | Philippine Peso | | Citibank N.A. London | | | 64,910 | | | | | 1,332 | | | | | 1,327 | | | | | 5 | |
| 7/21/21 | | Russian Ruble | | Citibank N.A. London | | | 324,156 | | | | | 4,454 | | | | | 4,419 | | | | | 35 | |
| 7/21/21 | | Singapore Dollar | | Citibank N.A. London | | | 7,926 | | | | | 5,899 | | | | | 5,895 | | | | | 4 | |
| 7/21/21 | | South African Rand | | Citibank N.A. London | | | 35,894 | | | | | 2,621 | | | | | 2,508 | | | | | 113 | |
| 7/21/21 | | South Korean Won | | Citibank N.A. London | | | 6,429,898 | | | | | 5,767 | | | | | 5,690 | | | | | 77 | |
| 7/21/21 | | Taiwan Dollar | | Citibank N.A. London | | | 32,855 | | | | | 1,180 | | | | | 1,178 | | | | | 2 | |
| 7/21/21 | | Thai Baht | | Citibank N.A. London | | | 526,160 | | | | | 16,852 | | | | | 16,416 | | | | | 436 | |
| 7/22/21 | | Indian Rupee | | Citibank N.A. London | | | 176,399 | | | | | 2,371 | | | | | 2,367 | | | | | 4 | |
See accompanying Notes to Financial Statements.
| June 30, 2021 | William Blair Funds | 103 |
Macro Allocation Fund
Portfolio of Investments, June 30, 2021 (all dollar amounts in thousands)(unaudited)
Forward Foreign Currency Contracts
Settlement
Date | | Deliver/Receive | | Counterparty | | Local Currency
(in thousands) | | | USD (Base)
Purchased
or Sold | | Current
Value | | Net Unrealized
Appreciation
(Depreciation) |
| 7/26/21 | | New Turkish Lira | | Citibank N.A. London | | | 16,764 | | | | | 1,890 | | | | | 1,901 | | | | $ | (11 | ) |
| 9/15/21 | | Australian Dollar | | Citibank N.A. London | | | 28,624 | | | | | 22,175 | | | | | 21,473 | | | | | 702 | |
| 9/15/21 | | British Pound Sterling | | Citibank N.A. London | | | 546 | | | | | 758 | | | | | 756 | | | | | 2 | |
| 9/15/21 | | Canadian Dollar | | Citibank N.A. London | | | 25,364 | | | | | 20,958 | | | | | 20,461 | | | | | 497 | |
| 9/15/21 | | Euro | | Citibank N.A. London | | | 21,951 | | | | | 26,752 | | | | | 26,068 | | | | | 684 | |
| 9/15/21 | | Japanese Yen | | Citibank N.A. London | | | 430,269 | | | | | 3,895 | | | | | 3,876 | | | | | 19 | |
| 9/15/21 | | New Zealand Dollar | | Citibank N.A. London | | | 47,428 | | | | | 34,071 | | | | | 33,145 | | | | | 926 | |
| 9/15/21 | | Swedish Krona | | Citibank N.A. London | | | 10,302 | | | | | 1,210 | | | | | 1,205 | | | | | 5 | |
| 9/15/21 | | Swiss Franc | | Citibank N.A. London | | | 13,691 | | | | | 15,313 | | | | | 14,826 | | | | | 487 | |
| | | | | | | | | | | | | | | | | | | | | | $ | 4,952 | |
| Total net unrealized appreciation (depreciation) on forward foreign currency contracts | | | | | | $ | 1,719 | |
Futures Contracts
Number of
Contracts | | Description | | Expiration Date | | Local Currency | | Notional Value
(Local,
in Thousands) | | Notional
Amount
(USD) | | Notional
Value
(USD) | | Net Unrealized
Appreciation
(Depreciation) |
| Long | | | | | | | | | | | | | | | | | | | | | | | | | |
| 38 | | CAC 40 Index | | July 2021 | | Euro | | | 2,472 | | | | | 2,973 | | | | | 2,931 | | | | $ | (42 | ) |
| 42 | | IBEX 35 Index | | July 2021 | | Euro | | | 3,691 | | | | | 4,558 | | | | | 4,377 | | | | | (181 | ) |
| 71 | | OMXS 30 Index | | July 2021 | | Swedish Krona | | | 16,089 | | | | | 1,877 | | | | | 1,880 | | | | | 3 | |
| 12 | | FTSE Taiwan Index | | July 2021 | | U.S. Dollar | | | 732 | | | | | 718 | | | | | 732 | | | | | 14 | |
| 249 | | MSCI Singapore E TS Index | | July 2021 | | Singapore Dollar | | | 8,851 | | | | | 6,554 | | | | | 6,582 | | | | | 28 | |
| 111 | | FTSE KLCI Index | | July 2021 | | Malaysian Ringgit | | | 8,508 | | | | | 2,089 | | | | | 2,049 | | | | | (40 | ) |
| 12 | | KOSPI 200 Index | | September 2021 | | South Korean Won | | | 1,316,550 | | | | | 1,152 | | | | | 1,169 | | | | | 17 | |
| 50 | | SPI 200 Index | | September 2021 | | Australian Dollar | | | 9,029 | | | | | 6,809 | | | | | 6,771 | | | | | (38 | ) |
| 6 | | DAX Index | | September 2021 | | Euro | | | 2,329 | | | | | 2,790 | | | | | 2,762 | | | | | (28 | ) |
| 197 | | FTSE 100 Index | | September 2021 | | British Pound Sterling | | | 13,752 | | | | | 19,321 | | | | | 19,023 | | | | | (298 | ) |
| 14 | | FTSE MIB Index | | September 2021 | | Euro | | | 1,750 | | | | | 2,121 | | | | | 2,075 | | | | | (46 | ) |
| 279 | | MSCI Indonesia Index September 2021 | | U.S. Dollar | | | | | 3,896 | | | | | 4,229 | | | | | 3,896 | | | | | (333 | ) |
| 246 | | MSCI World Energy Index | | September 2021 | | U.S. Dollar | | | 7,127 | | | | | 7,402 | | | | | 7,127 | | | | | (275 | ) |
| 10 | | SWISS Markets Index | | September 2021 | | Swiss Franc | | | 1,193 | | | | | 1,290 | | | | | 1,289 | | | | | (1 | ) |
| | | | | | | | | | | | | | | | | | | | | | | | $ | (1,220 | ) |
| Short | | | | | | | | | | | | | | | | | | | | | | | | | |
| 3 | | Amsterdam Index | | July 2021 | | Euro | | | 438 | | | | | 520 | | | | | 519 | | | | $ | 1 | |
| 27 | | FTSE/JSE Top 40 Index | | September 2021 | | South African Rand | | | 16,167 | | | | | 1,166 | | | | | 1,132 | | | | | 34 | |
| 220 | | EURO STOXX 50 Index | | September 2021 | | Euro | | | 8,922 | | | | | 10,696 | | | | | 10,579 | | | | | 117 | |
| 1 | | MSCI China Free Net Index | | September 2021 | | U.S. Dollar | | | 60 | | | | | 60 | | | | | 60 | | | | | — | |
| 64 | | MSCI Emerging Markets Index | | September 2021 | | U.S. Dollar | | | 4,367 | | | | | 4,369 | | | | | 4,367 | | | | | 2 | |
| 93 | | MSCI Mexico Index | | September 2021 | | U.S. Dollar | | | 2,471 | | | | | 2,494 | | | | | 2,471 | | | | | 23 | |
| 32 | | NASDAQ 100 E Mini Index | | September 2021 | | U.S. Dollar | | | 9,311 | | | | | 8,905 | | | | | 9,311 | | | | | (406 | ) |
| 495 | | S&P 500 E Mini Index | | September 2021 | | U.S. Dollar | | | 106,143 | | | | | 104,524 | | | | | 106,143 | | | | | (1,619 | ) |
| 11 | | S&P E Mini Com Ser Index | | September 2021 | | U.S. Dollar | | | 1,165 | | | | | 1,146 | | | | | 1,165 | | | | | (19 | ) |
| 7 | | XAK Technology | | September 2021 | | U.S. Dollar | | | 1,041 | | | | | 999 | | | | | 1,041 | | | | | (42 | ) |
| 12 | | XAY Cons Discret | | September 2021 | | U.S. Dollar | | | 2,164 | | | | | 2,095 | | | | | 2,164 | | | | | (69 | ) |
| 28 | | 10YR Can Bond | | September 2021 | | Canadian Dollar | | | 4,075 | | | | | 3,250 | | | | | 3,287 | | | | | (37 | ) |
| | | | | | | | | | | | | | | | | | | | | | | | $ | (2,015 | ) |
| Total net unrealized appreciation (depreciation) on futures contracts | | | | $ | (3,235 | ) |
See accompanying Notes to Financial Statements.
| 104 | Semiannual Report | June 30, 2021 |
Macro Allocation Fund
Portfolio of Investments, June 30, 2021 (all dollar amounts in thousands)(unaudited)
Centrally Cleared Interest Rate Swaps
Floating
Rate
Reference | | Pay/Receive
Floating
Rate | | Fixed Rate | | Payment
Frequency | | Maturity
Dates | | Cleared
Exchange | | Notional
Amount
(in thousands) | | Upfront
Payment
Paid
(Received) | | Value | | Unrealized
Appreciation
(Depreciation) | |
| Brazil CDI ON Deposit Rate | | Pay | | 6.010% | | 1M | | January 2023 | | CME | | BRL 92,768 | | | $(109 | ) | | $ | (123 | ) | | | $ | (14 | ) |
| China 1-Week Repo Rate | | Pay | | 2.850% | | 3M | | June 2026 | | LCH | | CNY 39,940 | | | 1 | | | | 21 | | | | | 20 | |
| | | | | | | | | | | | | | | | | | | | | | | | $ | 6 | |
Total Return Swaps
Reference
Entity | | Pay/Receive
Floating Rate | | Floating Rates | | Maturity
Dates | | Counterparty | | Notional
Amount (in
thousands) | | | Market
Value | | Unrealized
Appreciation
(Depreciation) |
| CSI 500 Net Total Return Index | | Pay | | (1,305) bp | | Sep 2021 | | Credit Suisse International | | | $6,324 | | | | $1,241 | | | | $ | 1,241 | |
| EUR-Bund Future | | Receive | | 0 bp | | Sep 2021 | | Credit Suisse International | | | EUR 859 | | | | (5 | ) | | | | (5 | ) |
| MSCI Philippines Index Future | | Pay | | 0 bp | | Sep 2021 | | Goldman Sachs International | | | $527 | | | | (4 | ) | | | | (4 | ) |
| RTS Index Future | | Pay | | 0 bp | | Sep 2021 | | Credit Suisse International | | | 2,585 | | | | (38 | ) | | | | (38 | ) |
| 10YR T-Note Future | | Pay | | 0 bp | | Sep 2021 | | Credit Suisse International | | | 3,038 | | | | 10 | | | | | 10 | |
| 5YR T-Note Future | | Pay | | 0 bp | | Sep 2021 | | Credit Suisse International | | | 12,760 | | | | (47 | ) | | | | (47 | ) |
| | | | | | | | | | | | | | | | | | | | $ | 1,157 | |
Centrally Cleared Credit Default Swap
Reference
Entity | | Buy/Sell
Protection | | Fixed Rate | | Payment
Frequency | | Maturity
Date | | Cleared
Exchange | | Notional
Amount
(in thousands) | | Upfront
Payment
Paid
(Received) | | Value | | Unrealized
Appreciation
(Depreciation) |
| ITRAXX-EUROPE S35V1-5Y | | Sell | | 1.000% | | 3M | | June 2026 | | ICE | | EUR 3,865 | | $123 | | | $123 | | | $ | — | |
| Total net unrealized appreciation (depreciation) on swaps | | | | | | | $ | 1,163 | |
See accompanying Notes to Financial Statements.
| June 30, 2021 | William Blair Funds | 105 |
Statements of Assets and Liabilities
As of June 30, 2021 (dollar amounts in thousands) (unaudited)
| | | Growth
Fund | | | Large Cap
Growth
Fund | | | Mid Cap
Growth
Fund | | | Small-Mid
Cap Core
Fund | |
| Assets | | | | | | | | | | | | | | | | |
| Investments in securities, at cost | | | $ | 169,370 | | | | $ | 517,781 | | | | $ | 61,296 | | | | $ | 39,429 | |
| Investments in securities, at value | | | $ | 326,608 | | | | $ | 818,037 | | | | $ | 86,902 | | | | $ | 51,082 | |
| Receivable for securities sold | | | | — | | | | | 4,807 | | | | | 1,047 | | | | | 34 | |
| Receivable for fund shares sold | | | | 179 | | | | | 1,212 | | | | | 4 | | | | | 1,545 | |
| Receivable from Adviser | | | | — | | | | | 49 | | | | | 19 | | | | | 12 | |
| Dividend and interest receivable | | | | 99 | | | | | 141 | | | | | 16 | | | | | 22 | |
| Total assets | | | | 326,886 | | | | | 824,246 | | | | | 87,988 | | | | | 52,695 | |
| Liabilities | | | | | | | | | | | | | | | | | | | | |
| Payable for securities purchased | | | | — | | | | | 4,928 | | | | | 1,882 | | | | | 1,631 | |
| Payable for fund shares redeemed | | | | 142 | | | | | 576 | | | | | 11 | | | | | — | |
| Management fee payable | | | | 197 | | | | | 390 | | | | | 63 | | | | | 35 | |
| Distribution fee payable | | | | 7 | | | | | 33 | | | | | 1 | | | | | — | |
| Other payables and accrued expenses | | | | 73 | | | | | 113 | | | | | 53 | | | | | 70 | |
| Total liabilities | | | | 419 | | | | | 6,040 | | | | | 2,010 | | | | | 1,736 | |
| Net assets | | | $ | 326,467 | | | | $ | 818,206 | | | | $ | 85,978 | | | | $ | 50,959 | |
| Capital | | | | | | | | | | | | | | | | | | | | |
| Composition of net assets | | | | | | | | | | | | | | | | | | | | |
| Paid in capital | | | $ | 138,485 | | | | $ | 481,754 | | | | $ | 53,322 | | | | $ | 50,767 | |
| Total distributable earnings (loss) | | | | 187,982 | | | | | 336,452 | | | | | 32,656 | | | | | 192 | |
| Net assets | | | $ | 326,467 | | | | $ | 818,206 | | | | $ | 85,978 | | | | $ | 50,959 | |
| | | | | | | | | | | | | | | | | | | | | |
| Class N shares | | | | | | | | | | | | | | | | | | | | |
| Net assets | | | $ | 34,360 | | | | $ | 164,108 | | | | $ | 5,621 | | | | | — | |
| Shares outstanding | | | | 2,725,049 | | | | | 7,175,466 | | | | | 421,127 | | | | | — | |
| Net asset value per share | | | $ | 12.61 | | | | $ | 22.87 | | | | $ | 13.35 | | | | | — | |
| Class I shares | | | | | | | | | | | | | | | | | | | | |
| Net assets | | | $ | 278,636 | | | | $ | 455,229 | | | | $ | 79,711 | | | | $ | 30,517 | |
| Shares outstanding | | | | 18,036,289 | | | | | 18,699,598 | | | | | 5,442,892 | | | | | 2,002,130 | |
| Net asset value per share | | | $ | 15.45 | | | | $ | 24.34 | | | | $ | 14.64 | | | | $ | 15.24 | |
| Class R6 shares | | | | | | | | | | | | | | | | | | | | |
| Net assets | | | $ | 13,471 | | | | $ | 198,869 | | | | $ | 646 | | | | $ | 20,442 | |
| Shares outstanding | | | | 869,811 | | | | | 8,175,683 | | | | | 44,075 | | | | | 1,340,474 | |
| Net asset value per share | | | $ | 15.49 | | | | $ | 24.32 | | | | $ | 14.66 | | | | $ | 15.25 | |
See accompanying Notes to Financial Statements.
| 106 | Semiannual Report | June 30, 2021 |
Statements of Operations
For the Period Ended June 30, 2021 (all amounts in thousands) (unaudited)
| | | Growth
Fund | | | Large Cap
Growth
Fund | | | Mid Cap
Growth
Fund | | | Small-Mid
Cap Core
Fund | |
| Investment income | | | | | | | | | | | | | | | | |
| Dividends | | | $ | 895 | | | | $ | 2,473 | | | | $ | 160 | | | | $ | 155 | |
| Total income | | | | 895 | | | | | 2,473 | | | | | 160 | | | | | 155 | |
| Expenses | | | | | | | | | | | | | | | | | | | | |
| Investment advisory fees | | | | 1,148 | | | | | 2,201 | | | | | 377 | | | | | 178 | |
| Distribution fees | | | | 43 | | | | | 184 | | | | | 7 | | | | | — | |
| Custodian fees | | | | 32 | | | | | 28 | | | | | 30 | | | | | 44 | |
| Transfer agent fees | | | | 36 | | | | | 57 | | | | | 7 | | | | | 1 | |
| Sub-transfer agent fees | | | | | | | | | | | | | | | | | | | | |
| Class N | | | | 22 | | | | | 96 | | | | | 3 | | | | | — | |
| Class I | | | | 69 | | | | | 188 | | | | | 47 | | | | | 15 | |
| Professional fees | | | | 19 | | | | | 42 | | | | | 14 | | | | | 16 | |
| Registration fees | | | | 26 | | | | | 49 | | | | | 28 | | | | | 17 | |
| Shareholder reporting fees | | | | 8 | | | | | 36 | | | | | 1 | | | | | 1 | |
| Trustee fees | | | | 10 | | | | | 21 | | | | | 3 | | | | | 3 | |
| Other expenses | | | | 9 | | | | | 18 | | | | | 5 | | | | | 4 | |
| Total expenses before expense limitation | | | | 1,422 | | | | | 2,920 | | | | | 522 | | | | | 279 | |
| Expenses waived or reimbursed by the Adviser | | | | | | | | | | | | | | | | | | | | |
| Class N | | | | (3 | ) | | | | (110 | ) | | | | (8 | ) | | | | — | |
| Class I | | | | — | | | | | (226 | ) | | | | (109 | ) | | | | (68 | ) |
| Class R6 | | | | — | | | | | (60 | ) | | | | (1 | ) | | | | (26 | ) |
| Total expenses waived or reimbursed by the Adviser | | | | (3 | ) | | | | (396 | ) | | | | (118 | ) | | | | (94 | ) |
| Net expenses | | | | 1,419 | | | | | 2,524 | | | | | 404 | | | | | 185 | |
| Net investment income (loss) | | | | (524 | ) | | | | (51 | ) | | | | (244 | ) | | | | (30 | ) |
| Realized and unrealized gain (loss) | | | | | | | | | | | | | | | | | | | | |
| Net realized gain (loss) on transactions from: | | | | | | | | | | | | | | | | | | | | |
| Investments in securities | | | | 22,076 | | | | | 33,132 | | | | | 5,861 | | | | | 2,113 | |
| Total net realized gain (loss) | | | | 22,076 | | | | | 33,132 | | | | | 5,861 | | | | | 2,113 | |
| Change in net unrealized appreciation (depreciation) of: | | | | | | | | | | | | | | | | | | | | |
| Investments in securities | | | | 16,781 | | | | | 68,610 | | | | | (2,575 | ) | | | | 4,020 | |
| Change in net unrealized appreciation (depreciation) | | | | 16,781 | | | | | 68,610 | | | | | (2,575 | ) | | | | 4,020 | |
| Net increase (decrease) in net assets resulting from operations | | | $ | 38,333 | | | | $ | 101,691 | | | | $ | 3,042 | | | | $ | 6,103 | |
See accompanying Notes to Financial Statements.
| June 30, 2021 | William Blair Funds | 107 |
Statements of Changes in Net Assets
For the Period Ended June 30, 2021 (unaudited) and the Year Ended December 31, 2020 (all amounts in thousands)
| | | Growth Fund | | | Large Cap
Growth Fund | | | Mid Cap
Growth Fund | | | Small-Mid Cap
Core Fund | |
| | | 2021 | | | 2020 | | | 2021 | | | 2020 | | | 2021 | | | 2020 | | | 2021 | | | 2020 | |
| Operations | | | | | | | | | | | | | | | | | | | | | | | | | | | | | | | | |
| Net investment income (loss) | | $ | (524 | ) | | $ | (660 | ) | | $ | (51 | ) | | $ | 1,218 | | | $ | (244 | ) | | $ | (342 | ) | | $ | (30 | ) | | $ | 6 | |
| Net realized gain (loss) on investments, and other assets and liabilities | | | 22,076 | | | | 42,176 | | | | 33,132 | | | | 34,530 | | | | 5,861 | | | | 6,414 | | | | 2,113 | | | | (13,678 | ) |
| Change in net unrealized appreciation (depreciation) on investments, and other assets and liabilities | | | 16,781 | | | | 40,608 | | | | 68,610 | | | | 144,802 | | | | (2,575 | ) | | | 12,060 | | | | 4,020 | | | | 7,247 | |
| Net increase (decrease) in net assets resulting from operations | | | 38,333 | | | | 82,124 | | | | 101,691 | | | | 180,550 | | | | 3,042 | | | | 18,132 | | | | 6,103 | | | | (6,425 | ) |
| Distributions to shareholders from | | | | | | | | | | | | | | | | | | | | | | | | | | | | | | | | |
| Class N | | | — | | | | (4,769 | ) | | | — | | | | (5,187 | ) | | | — | | | | (466 | ) | | | — | | | | — | |
| Class I | | | — | | | | (27,747 | ) | | | — | | | | (14,681 | ) | | | — | | | | (5,249 | ) | | | — | | | | — | |
| Class R6 | | | — | | | | (1,332 | ) | | | — | | | | (6,012 | ) | | | — | | | | (42 | ) | | | — | | | | — | |
| Total distributions | | | — | | | | (33,848 | ) | | | — | | | | (25,880 | ) | | | — | | | | (5,757 | ) | | | — | | | | — | |
| Capital stock transactions | | | | | | | | | | | | | | | | | | | | | | | | | | | | | | | | |
| Proceeds from sale of shares | | | 11,141 | | | | 28,188 | | | | 149,862 | | | | 494,318 | | | | 4,588 | | | | 11,489 | | | | 17,123 | | | | 266,207 | |
| Shares issued in reinvestment of income dividends and capital gain distributions | | | — | | | | 32,736 | | | | — | | | | 22,621 | | | | — | | | | 5,537 | | | | — | | | | — | |
| Less cost of shares redeemed | | | (20,258 | ) | | | (65,536 | ) | | | (146,216 | ) | | | (262,574 | ) | | | (5,622 | ) | | | (18,977 | ) | | | (2,312 | ) | | | (236,325 | ) |
| Net increase (decrease) in net assets resulting from capital share transactions | | | (9,117 | ) | | | (4,612 | ) | | | 3,646 | | | | 254,365 | | | | (1,034 | ) | | | (1,951 | ) | | | 14,811 | | | | 29,882 | |
| Increase (decrease) in net assets | | | 29,216 | | | | 43,664 | | | | 105,337 | | | | 409,035 | | | | 2,008 | | | | 10,424 | | | | 20,914 | | | | 23,457 | |
| Net assets | | | | | | | | | | | | | | | | | | | | | | | | | | | | | | | | |
| Beginning of period | | | 297,251 | | | | 253,587 | | | | 712,869 | | | | 303,834 | | | | 83,970 | | | | 73,546 | | | | 30,045 | | | | 6,588 | |
| End of period | | $ | 326,467 | | | $ | 297,251 | | | $ | 818,206 | | | $ | 712,869 | | | $ | 85,978 | | | $ | 83,970 | | | $ | 50,959 | | | $ | 30,045 | |
See accompanying Notes to Financial Statements.
| 108 | Semiannual Report | June 30, 2021 |
Statements of Assets and Liabilities
As of June 30, 2021 (dollar amounts in thousands) (unaudited)
| | | Small-Mid
Cap Growth
Fund | | | Small Cap
Growth
Fund | | | Small Cap
Value
Fund | |
| Assets | | | | | | | | | |
| Investments in securities, at cost | | $ | 2,362,544 | | | $ | 513,988 | | | $ | 31,793 | |
| Investments in securities, at value | | $ | 3,442,842 | | | $ | 739,925 | | | $ | 48,460 | |
| Receivable for securities sold | | | 42,650 | | | | 287 | | | | — | |
| Receivable for fund shares sold | | | 2,492 | | | | 7,303 | | | | 28 | |
| Receivable from Adviser | | | 157 | | | | 8 | | | | 21 | |
| Dividend and interest receivable | | | 411 | | | | 82 | | | | 24 | |
| Total assets | | | 3,488,552 | | | | 747,605 | | | | 48,533 | |
| Liabilities | | | | | | | | | | | | |
| Payable for securities purchased | | | 1,773 | | | | 2,791 | | | | — | |
| Payable for fund shares redeemed | | | 5,066 | | | | 171 | | | | 35 | |
| Management fee payable | | | 2,850 | | | | 664 | | | | 32 | |
| Distribution fee payable | | | 55 | | | | 39 | | | | 2 | |
| Other payables and accrued expenses | | | 549 | | | | 141 | | | | 85 | |
| Total liabilities | | | 10,293 | | | | 3,806 | | | | 154 | |
| Net assets | | $ | 3,478,259 | | | $ | 743,799 | | | $ | 48,379 | |
| Capital | | | | | | | | | | | | |
| Composition of net assets | | | | | | | | | | | | |
| Paid in capital | | $ | 1,930,698 | | | $ | 433,121 | | | $ | 38,207 | |
| Total distributable earnings (loss) | | | 1,547,561 | | | | 310,678 | | | | 10,172 | |
| Net assets | | $ | 3,478,259 | | | $ | 743,799 | | | $ | 48,379 | |
| | | | | | | | | | | | | |
| Class N shares | | | | | | | | | | | | |
| Net assets | | $ | 267,143 | | | $ | 191,361 | | | $ | 10,865 | |
| Shares outstanding | | | 7,503,036 | | | | 4,916,421 | | | | 708,190 | |
| Net asset value per share | | $ | 35.60 | | | $ | 38.92 | | | $ | 15.34 | |
| Class I shares | | | | | | | | | | | | |
| Net assets | | $ | 2,881,276 | | | $ | 428,670 | | | $ | 25,982 | |
| Shares outstanding | | | 75,817,606 | | | | 9,637,811 | | | | 1,625,002 | |
| Net asset value per share | | $ | 38.00 | | | $ | 44.48 | | | $ | 15.99 | |
| Class R6 shares | | | | | | | | | | | | |
| Net assets | | $ | 329,840 | | | $ | 123,768 | | | $ | 11,532 | |
| Shares outstanding | | | 8,665,512 | | | | 2,778,624 | | | | 721,866 | |
| Net asset value per share | | $ | 38.06 | | | $ | 44.54 | | | $ | 15.98 | |
See accompanying Notes to Financial Statements.
| June 30, 2021 | William Blair Funds | 109 |
Statements of Operations
For the Period Ended June 30, 2021 (all amounts in thousands) (unaudited)
| | | Small-Mid
Cap Growth
Fund | | | Small Cap
Growth
Fund | | | Small Cap
Value Fund | |
| Investment income | | | | | | | | | | | | |
| Dividends | | $ | 5,852 | | | $ | 1,068 | | | $ | 390 | |
| Less foreign tax withheld | | | (69 | ) | | | (13 | ) | | | — | |
| Total income | | | 5,783 | | | | 1,055 | | | | 390 | |
| Expenses | | | | | | | | | | | | |
| Investment advisory fees | | | 17,767 | | | | 3,939 | | | | 211 | |
| Distribution fees | | | 379 | | | | 235 | | | | 11 | |
| Custodian fees | | | 41 | | | | 36 | | | | 38 | |
| Transfer agent fees | | | 116 | | | | 45 | | | | 9 | |
| Sub-transfer agent fees | | | | | | | | | | | | |
| Class N | | | 217 | | | | 131 | | | | 6 | |
| Class I | | | 1,831 | | | | 193 | | | | 59 | |
| Professional fees | | | 103 | | | | 33 | | | | 14 | |
| Registration fees | | | 44 | | | | 32 | | | | 41 | |
| Shareholder reporting fees | | | 95 | | | | 26 | | | | 2 | |
| Trustee fees | | | 120 | | | | 24 | | | | 3 | |
| Other expenses | | | 65 | | | | 18 | | | | 4 | |
| Total expenses before expense limitation | | | 20,778 | | | | 4,712 | | | | 398 | |
| Expenses waived or reimbursed by the Adviser | | | | | | | | | | | | |
| Class N | | | (116 | ) | | | (46 | ) | | | (20 | ) |
| Class I | | | (830 | ) | | | (8 | ) | | | (110 | ) |
| Class R6 | | | — | | | | — | | | | (20 | ) |
| Total expenses waived or reimbursed by the Adviser | | | (946 | ) | | | (54 | ) | | | (150 | ) |
| Net expenses | | | 19,832 | | | | 4,658 | | | | 248 | |
| Net investment income (loss) | | | (14,049 | ) | | | (3,603 | ) | | | 142 | |
| Realized and unrealized gain (loss) | | | | | | | | | | | | |
| Net realized gain (loss) on transactions from: | | | | | | | | | | | | |
| Investments in securities | | | 318,292 | | | | 77,885 | | | | 7,739 | |
| Redemptions in-kind | | | 89,621 | | | | — | | | | — | |
| Total net realized gain (loss) | | | 407,913 | | | | 77,885 | | | | 7,739 | |
| Change in net unrealized appreciation (depreciation) of: | | | | | | | | | | | | |
| Investments in securities | | | (115,298 | ) | | | 11,979 | | | | 816 | |
| Change in net unrealized appreciation (depreciation) | | | (115,298 | ) | | | 11,979 | | | | 816 | |
| Net increase (decrease) in net assets resulting from operations | | $ | 278,566 | | | $ | 86,261 | | | $ | 8,697 | |
See accompanying Notes to Financial Statements.
| 110 | Semiannual Report | June 30, 2021 |
Statements of Changes in Net Assets
For the Period Ended June 30, 2021 (unaudited) and the Year Ended December 31, 2020 (all amounts in thousands)
| | | Small-Mid
Cap Growth Fund | | | Small Cap
Growth Fund | | | Small Cap
Value Fund | |
| | | 2021 | | | 2020 | | | 2021 | | | 2020 | | | 2021 | | | 2020 | |
| Operations | | | | | | | | | | | | | | | | | | | | | | | | |
| Net investment income (loss) | | $ | (14,049 | ) | | $ | (20,276 | ) | | $ | (3,603 | ) | | $ | (4,664 | ) | | $ | 142 | | | $ | 838 | |
| Net realized gain (loss) on investments, and other assets and liabilities | | | 407,913 | | | | 172,271 | | | | 77,885 | | | | 88,364 | | | | 7,739 | | | | (4,844 | ) |
| Change in net unrealized appreciation (depreciation) on investments, and other assets and liabilities | | | (115,298 | ) | | | 703,070 | | | | 11,979 | | | | 88,533 | | | | 816 | | | | (26,660 | ) |
| Net increase (decrease) in net assets resulting from operations | | | 278,566 | | | | 855,065 | | | | 86,261 | | | | 172,233 | | | | 8,697 | | | | (30,666 | ) |
| Distributions to shareholders from | | | | | | | | | | | | | | | | | | | | | | | | |
| Class N | | | — | | | | (5,612 | ) | | | — | | | | (18,482 | ) | | | — | | | | (2,130 | ) |
| Class I | | | — | | | | (51,667 | ) | | | — | | | | (35,006 | ) | | | — | | | | (26,640 | ) |
| Class R6 | | | — | | | | (1,737 | ) | | | — | | | | (9,448 | ) | | | — | | | | (202 | ) |
| Total distributions | | | — | | | | (59,016 | ) | | | — | | | | (62,936 | ) | | | — | | | | (28,972 | ) |
| Capital stock transactions | | | | | | | | | | | | | | | | | | | | | | | | |
| Proceeds from sale of shares | | | 545,344 | | | | 829,348 | | | | 76,296 | | | | 113,709 | | | | 6,361 | | | | 22,998 | |
| Shares issued in reinvestment of income dividends and capital gain distributions | | | — | | | | 58,002 | | | | — | | | | 62,018 | | | | — | | | | 27,878 | |
| Less cost of shares redeemed | | | (922,733 | ) | | | (1,012,131 | ) | | | (93,366 | ) | | | (280,953 | ) | | | (26,580 | ) | | | (106,615 | ) |
| Net increase (decrease) in net assets resulting from capital share transactions | | | (377,389 | ) | | | (124,781 | ) | | | (17,070 | ) | | | (105,226 | ) | | | (20,219 | ) | | | (55,739 | ) |
| Increase (decrease) in net assets | | | (98,823 | ) | | | 671,268 | | | | 69,191 | | | | 4,071 | | | | (11,522 | ) | | | (115,377 | ) |
| Net assets | | | | | | | | | | | | | | | | | | | | | | | | |
| Beginning of period | | | 3,577,082 | | | | 2,905,814 | | | | 674,608 | | | | 670,537 | | | | 59,901 | | | | 175,278 | |
| End of period | | $ | 3,478,259 | | | $ | 3,577,082 | | | $ | 743,799 | | | $ | 674,608 | | | $ | 48,379 | | | $ | 59,901 | |
See accompanying Notes to Financial Statements.
| June 30, 2021 | William Blair Funds | 111 |
Statements of Assets and Liabilities
As of June 30, 2021 (dollar amounts in thousands) (unaudited)
| | | | Global
Leaders
Fund | | | International
Leaders
Fund | | | International
Growth
Fund | | | Institutional
International
Growth
Fund | |
| Assets | | | | | | | | | | | | | | |
| Investments in securities, at cost | | | $ | 73,362 | | | | $ | 824,523 | | | $ | 1,354,152 | | | $ | 754,139 | |
| Investments in securities, at value | | | $ | 138,343 | | | | $ | 1,196,444 | | | $ | 2,343,158 | | | $ | 1,312,319 | |
| Cash | | | | 3 | | | | | 99 | | | | 142 | | | | 80 | |
| Foreign currency, at value (cost $12; $254; $1,535; $266) | | | | 12 | | | | | 254 | | | | 1,527 | | | | 265 | |
| Receivable for securities sold | | | | 322 | | | | | 8,610 | | | | 10,988 | | | | 6,219 | |
| Receivable for fund shares sold | | | | 180 | | | | | 1,380 | | | | 343 | | | | 452 | |
| Receivable from Adviser | | | | 18 | | | | | 72 | | | | 1 | | | | — | |
| Dividend and interest receivable | | | | 128 | | | | | 1,526 | | | | 5,073 | | | | 2,975 | |
| Total assets | | | | 139,006 | | | | | 1,208,385 | | | | 2,361,232 | | | | 1,322,310 | |
| Liabilities | | | | | | | | | | | | | | | | | | |
| Payable for securities purchased | | | | — | | | | | 10,046 | | | | 3,024 | | | | 1,692 | |
| Payable for fund shares redeemed | | | | 1 | | | | | 150 | | | | 2,420 | | | | 49 | |
| Management fee payable | | | | 95 | | | | | 853 | | | | 1,958 | | | | 1,037 | |
| Distribution fee payable | | | | 3 | | | | | 7 | | | | 62 | | | | — | |
| Foreign capital gains tax liability | | | | — | | | | | 955 | | | | 717 | | | | 447 | |
| Other payables and accrued expenses | | | | 79 | | | | | 121 | | | | 521 | | | | 278 | |
| Total liabilities | | | | 178 | | | | | 12,132 | | | | 8,702 | | | | 3,503 | |
| Net assets | | | $ | 138,828 | | | | $ | 1,196,253 | | | $ | 2,352,530 | | | $ | 1,318,807 | |
| Capital | | | | | | | | | | | | | | | | | | |
| Composition of net assets | | | | | | | | | | | | | | | | | | |
| Paid in capital | | | $ | 68,209 | | | | $ | 780,173 | | | $ | 1,098,916 | | | $ | 588,777 | |
| Total distributable earnings (loss) | | | | 70,619 | | | | | 416,080 | | | | 1,253,614 | | | | 730,030 | |
| Net assets | | | $ | 138,828 | | | | $ | 1,196,253 | | | $ | 2,352,530 | | | $ | 1,318,807 | |
| | | | | | | | | | | | | | | | | | | |
| Class N shares | | | | | | | | | | | | | | | | | | |
| Net assets | | | $ | 12,925 | | | | $ | 35,254 | | | $ | 300,351 | | | | — | |
| Shares outstanding | | | | 670,023 | | | | | 1,462,509 | | | | 7,158,228 | | | | — | |
| Net asset value per share | | | $ | 19.29 | | | | $ | 24.10 | | | $ | 41.96 | | | | — | |
| Class I shares | | | | | | | | | | | | | | | | | | |
| Net assets | | | $ | 121,059 | | | | $ | 511,382 | | | $ | 1,888,879 | | | | — | |
| Shares outstanding | | | | 6,248,056 | | | | | 21,092,697 | | | | 43,928,268 | | | | — | |
| Net asset value per share | | | $ | 19.38 | | | | $ | 24.24 | | | $ | 43.00 | | | | — | |
| Institutional/Class R6 shares | | | | | | | | | | | | | | | | | | |
| Net assets | | | $ | 4,844 | | | | $ | 649,617 | | | $ | 163,300 | | | $ | 1,318,807 | |
| Shares outstanding | | | | 249,897 | | | | | 26,786,079 | | | | 3,796,142 | | | | 59,679,373 | |
| Net asset value per share | | | $ | 19.39 | | | | $ | 24.25 | | | $ | 43.02 | | | $ | 22.10 | |
See accompanying Notes to Financial Statements.
| 112 | Semiannual Report | June 30, 2021 |
Statements of Operations
For the Period Ended June 30, 2021 (all amounts in thousands) (unaudited)
| | | Global
Leaders
Fund | | | International
Leaders
Fund | | | International
Growth
Fund | | | Institutional
International
Growth
Fund | |
| Investment income | | | | | | | | | | | | | | | | | | | | |
| Dividends | | | $ | 515 | | | | $ | 6,221 | | | | $ | 12,773 | | | | $ | 7,218 | |
| Less foreign tax withheld | | | | (38 | ) | | | | (747 | ) | | | | (1,297 | ) | | | | (750 | ) |
| Interest | | | | — | | | | | — | | | | | 1,255 | | | | | 7 | |
| Total income | | | | 477 | | | | | 5,474 | | | | | 12,731 | | | | | 6,475 | |
| Expenses | | | | | | | | | | | | | | | | | | | | |
| Investment advisory fees | | | | 542 | | | | | 4,946 | | | | | 11,628 | | | | | 6,243 | |
| Distribution fees | | | | 15 | | | | | 35 | | | | | 363 | | | | | — | |
| Custodian fees | | | | 41 | | | | | 87 | | | | | 152 | | | | | 162 | |
| Transfer agent fees | | | | 4 | | | | | 26 | | | | | 60 | | | | | 21 | |
| Sub-transfer agent fees | | | | | | | | | | | | | | | | | | | | |
| Class N | | | | 8 | | | | | 17 | | | | | 219 | | | | | — | |
| Class I | | | | 41 | | | | | 170 | | | | | 773 | | | | | — | |
| Professional fees | | | | 26 | | | | | 66 | | | | | 114 | | | | | 92 | |
| Registration fees | | | | 23 | | | | | 43 | | | | | 29 | | | | | 12 | |
| Shareholder reporting fees | | | | 2 | | | | | 11 | | | | | 40 | | | | | 5 | |
| Trustee fees | | | | 5 | | | | | 34 | | | | | 78 | | | | | 53 | |
| Other expenses | | | | 5 | | | | | 24 | | | | | 39 | | | | | 18 | |
| Total expenses before expense limitation | | | | 712 | | | | | 5,459 | | | | | 13,495 | | | | | 6,606 | |
| Expenses waived or reimbursed by the Adviser | | | | | | | | | | | | | | | | | | | | |
| Class N | | | | (15 | ) | | | | (17 | ) | | | | (14 | ) | | | | — | |
| Class I | | | | (106 | ) | | | | (170 | ) | | | | — | | | | | — | |
| Institutional/Class R6 | | | | (3 | ) | | | | (171 | ) | | | | — | | | | | — | |
| Total expenses waived or reimbursed by the Adviser | | | | (124 | ) | | | | (358 | ) | | | | (14 | ) | | | | — | |
| Net expenses | | | | 588 | | | | | 5,101 | | | | | 13,481 | | | | | 6,606 | |
| Net investment income (loss) | | | | (111 | ) | | | | 373 | | | | | (750 | ) | | | | (131 | ) |
| Realized and unrealized gain (loss) | | | | | | | | | | | | | | | | | | | | |
| Net realized gain (loss) on transactions from: | | | | | | | | | | | | | | | | | | | | |
| Investments in securities (net of foreign capital gains tax paid $—; $67; $—; $13) | | | | 5,074 | | | | | 47,585 | | | | | 236,570 | | | | | 151,598 | |
| Foreign currency transactions | | | | 2 | | | | | (77 | ) | | | | (225 | ) | | | | (159 | ) |
| Total net realized gain (loss) | | | | 5,076 | | | | | 47,508 | | | | | 236,345 | | | | | 151,439 | |
| Change in net unrealized appreciation (depreciation) of: | | | | | | | | | | | | | | | | | | | | |
| Investments in securities (net of foreign capital gains tax accrual $—; $7; $274; $21) | | | | 8,538 | | | | | 25,683 | | | | | (47,769 | ) | | | | (44,644 | ) |
| Foreign currency translations | | | | (6 | ) | | | | (23 | ) | | | | (160 | ) | | | | (79 | ) |
| Change in net unrealized appreciation (depreciation) | | | | 8,532 | | | | | 25,660 | | | | | (47,929 | ) | | | | (44,723 | ) |
| Net increase (decrease) in net assets resulting from operations | | | $ | 13,497 | | | | $ | 73,541 | | | | $ | 187,666 | | | | $ | 106,585 | |
See accompanying Notes to Financial Statements.
| June 30, 2021 | William Blair Funds | 113 |
Statements of Changes in Net Assets
For the Period Ended June 30, 2021 (unaudited) and the Year Ended December 31, 2020 (all amounts in thousands)
| | | Global
Leaders Fund | | | International
Leaders Fund | | | International
Growth Fund | | | Institutional
International
Growth Fund | |
| | | 2021 | | | 2020 | | | 2021 | | | 2020 | | | 2021 | | | 2020 | | | 2021 | | | 2020 | |
| Operations | | | | | | | | | | | | | | | | | | | | | | | | | | | | | | | | |
| Net investment income (loss) | | $ | (111 | ) | | $ | (101 | ) | | $ | 373 | | | $ | 449 | | | $ | (750 | ) | | $ | (5,712 | ) | | $ | (131 | ) | | $ | (553 | ) |
| Net realized gain (loss) on investments, and other assets and liabilities | | | 5,076 | | | | 24,259 | | | | 47,508 | | | | 8,912 | | | | 236,345 | | | | 74,910 | | | | 151,439 | | | | 258,776 | |
| Change in net unrealized appreciation (depreciation) on investments, and other assets and liabilities | | | 8,532 | | | | 7,605 | | | | 25,660 | | | | 191,243 | | | | (47,929 | ) | | | 491,289 | | | | (44,723 | ) | | | 130,546 | |
| Net increase (decrease) in net assets resulting from operations | | | 13,497 | | | | 31,763 | | | | 73,541 | | | | 200,604 | | | | 187,666 | | | | 560,487 | | | | 106,585 | | | | 388,769 | |
| Distributions to shareholders from | | | | | | | | | | | | | | | | | | | | | | | | | | | | | | | | |
| Class N | | | — | | | | (1,323 | ) | | | — | | | | (140 | ) | | | — | | | | (2,350 | ) | | | — | | | | — | |
| Class I | | | — | | | | (12,213 | ) | | | — | | | | (2,856 | ) | | | — | | | | (21,253 | ) | | | — | | | | — | |
| Institutional/Class R6 | | | — | | | | (323 | ) | | | — | | | | (5,774 | ) | | | — | | | | (1,273 | ) | | | — | | | | (151,353 | ) |
| Total distributions | | | — | | | | (13,859 | ) | | | — | | | | (8,770 | ) | | | — | | | | (24,876 | ) | | | — | | | | (151,353 | ) |
| Capital stock transactions | | | | | | | | | | | | | | | | | | | | | | | | | | | | | | | | |
| Proceeds from sale of shares | | | 7,553 | | | | 17,101 | | | | 231,568 | | | | 390,602 | | | | 98,730 | | | | 345,376 | | | | 29,938 | | | | 148,064 | |
| Shares issued in reinvestment of income dividends and capital gain distributions | | | — | | | | 13,852 | | | | — | | | | 8,654 | | | | — | | | | 23,253 | | | | — | | | | 150,369 | |
| Less cost of shares redeemed | | | (4,404 | ) | | | (98,384 | ) | | | (209,209 | ) | | | (144,641 | ) | | | (246,516 | ) | | | (700,649 | ) | | | (144,198 | ) | | | (1,102,278 | ) |
| Net increase (decrease) in net assets resulting from capital share transactions | | | 3,149 | | | | (67,431 | ) | | | 22,359 | | | | 254,615 | | | | (147,786 | ) | | | (332,020 | ) | | | (114,260 | ) | | | (803,845 | ) |
| Increase (decrease) in net assets | | | 16,646 | | | | (49,527 | ) | | | 95,900 | | | | 446,449 | | | | 39,880 | | | | 203,591 | | | | (7,675 | ) | | | (566,429 | ) |
| Net assets | | | | | | | | | | | | | | | | | | | | | | | | | | | | | | | | |
| Beginning of period | | | 122,182 | | | | 171,709 | | | | 1,100,353 | | | | 653,904 | | | | 2,312,650 | | | | 2,109,059 | | | | 1,326,482 | | | | 1,892,911 | |
| End of period | | $ | 138,828 | | | $ | 122,182 | | | $ | 1,196,253 | | | $ | 1,100,353 | | | $ | 2,352,530 | | | $ | 2,312,650 | | | $ | 1,318,807 | | | $ | 1,326,482 | |
See accompanying Notes to Financial Statements.
| 114 | Semiannual Report | June 30, 2021 |
Statements of Assets and Liabilities
As of June 30, 2021 (dollar amounts in thousands) (unaudited)
| | | International
Small Cap
Growth
Fund | | | Emerging
Markets
Leaders
Fund | | | Emerging
Markets
Growth
Fund | | | Emerging
Markets
Small Cap
Growth Fund | |
| Assets | | | | | | | | | | | | | | | | | | |
| Investments in securities, at cost | | | $ | 275,367 | | | $ | 263,058 | | | $ | 826,669 | | | | $ | 388,692 | |
| Investments in securities, at value | | | $ | 357,697 | | | $ | 344,060 | | | $ | 1,260,555 | | | | $ | 497,336 | |
| Cash | | | | — | | | | — | | | | — | | | | | 849 | |
| Foreign currency, at value (cost $103; $8,233; $1,400; $108) | | | | 103 | | | | 8,233 | | | | 1,399 | | | | | 108 | |
| Receivable for securities sold | | | | — | | | | — | | | | 4,003 | | | | | 795 | |
| Receivable for fund shares sold | | | | 10,250 | | | | 60 | | | | 1,447 | | | | | 365 | |
| Receivable from Adviser | | | | — | | | | 24 | | | | — | | | | | — | |
| Dividend and interest receivable | | | | 710 | | | | 366 | | | | 1,743 | | | | | 387 | |
| Total assets | | | | 368,760 | | | | 352,743 | | | | 1,269,147 | | | | | 499,840 | |
| Liabilities | | | | | | | | | | | | | | | | | | |
| Payable for securities purchased | | | | 235 | | | | 33,645 | | | | 797 | | | | | 3,336 | |
| Payable for fund shares redeemed | | | | 147 | | | | 8 | | | | 3,327 | | | | | 49 | |
| Payable to custodian | | | | — | | | | — | | | | 316 | | | | | — | |
| Management fee payable | | | | 291 | | | | 255 | | | | 1,127 | | | | | 378 | |
| Distribution fee payable | | | | 1 | | | | — | | | | 7 | | | | | 1 | |
| Foreign capital gains tax liability | | | | — | | | | 2,142 | | | | 4,574 | | | | | 4,862 | |
| Other payables and accrued expenses | | | | 146 | | | | 158 | | | | 489 | | | | | 360 | |
| Total liabilities | | | | 820 | | | | 36,208 | | | | 10,637 | | | | | 8,986 | |
| Net assets | | | $ | 367,940 | | | $ | 316,535 | | | $ | 1,258,510 | | | | $ | 490,854 | |
| Capital | | | | | | | | | | | | | | | | | | |
| Composition of net assets | | | | | | | | | | | | | | | | | | |
| Paid in capital | | | $ | 235,472 | | | $ | 206,602 | | | $ | 672,413 | | | | $ | 357,475 | |
| Total distributable earnings (loss) | | | | 132,468 | | | | 109,933 | | | | 586,097 | | | | | 133,379 | |
| Net assets | | | $ | 367,940 | | | $ | 316,535 | | | $ | 1,258,510 | | | | $ | 490,854 | |
| | | | | | | | | | | | | | | | | | | |
| Class N shares | | | | | | | | | | | | | | | | | | |
| Net assets | | | $ | 3,201 | | | $ | 2,223 | | | $ | 35,790 | | | | $ | 4,254 | |
| Shares outstanding | | | | 171,007 | | | | 161,597 | | | | 1,760,729 | | | | | 168,597 | |
| Net asset value per share | | | $ | 18.72 | | | $ | 13.75 | | | $ | 20.33 | | | | $ | 25.23 | |
| Class I shares | | | | | | | | | | | | | | | | | | |
| Net assets | | | $ | 147,051 | | | $ | 55,679 | | | $ | 195,390 | | | | $ | 166,794 | |
| Shares outstanding | | | | 7,750,893 | | | | 4,036,654 | | | | 9,474,857 | | | | | 6,548,723 | |
| Net asset value per share | | | $ | 18.97 | | | $ | 13.79 | | | $ | 20.62 | | | | $ | 25.47 | |
| Class R6 shares | | | | | | | | | | | | | | | | | | |
| Net assets | | | $ | 217,688 | | | $ | 258,633 | | | $ | 1,027,330 | | | | $ | 319,806 | |
| Shares outstanding | | | | 11,405,583 | | | | 18,765,701 | | | | 49,330,454 | | | | | 12,532,097 | |
| Net asset value per share | | | $ | 19.09 | | | $ | 13.78 | | | $ | 20.83 | | | | $ | 25.52 | |
See accompanying Notes to Financial Statements.
| June 30, 2021 | William Blair Funds | 115 |
Statements of Operations
For the Period Ended June 30, 2021 (all amounts in thousands) (unaudited)
| | | International
Small Cap
Growth
Fund | | | Emerging
Markets
Leaders
Fund | | | Emerging
Markets
Growth
Fund | | | Emerging
Markets
Small Cap
Growth Fund | |
| Investment income | | | | | | | | | | | | | | | | | | |
| Dividends | | | $ | 2,061 | | | $ | 1,522 | | | $ | 5,838 | | | | $ | 1,306 | |
| Less foreign tax withheld | | | | (253 | ) | | | (184 | ) | | | (822 | ) | | | | (128 | ) |
| Interest | | | | 102 | | | | — | | | | — | | | | | — | |
| Total income | | | | 1,910 | | | | 1,338 | | | | 5,016 | | | | | 1,178 | |
| Expenses | | | | | | | | | | | | | | | | | | |
| Investment advisory fees | | | | 1,710 | | | | 1,526 | | | | 6,738 | | | | | 1,917 | |
| Distribution fees | | | | 4 | | | | 3 | | | | 41 | | | | | 5 | |
| Custodian fees | | | | 71 | | | | 61 | | | | 186 | | | | | 111 | |
| Transfer agent fees | | | | 10 | | | | 8 | | | | 29 | | | | | 15 | |
| Sub-transfer agent fees | | | | | | | | | | | | | | | | | | |
| Class N | | | | 2 | | | | 1 | | | | 17 | | | | | 2 | |
| Class I | | | | 64 | | | | 23 | | | | 56 | | | | | 54 | |
| Professional fees | | | | 49 | | | | 37 | | | | 73 | | | | | 62 | |
| Registration fees | | | | 26 | | | | 30 | | | | 31 | | | | | 26 | |
| Shareholder reporting fees | | | | 13 | | | | 4 | | | | 4 | | | | | 11 | |
| Trustee fees | | | | 11 | | | | 9 | | | | 37 | | | | | 10 | |
| Other expenses | | | | 8 | | | | 8 | | | | 24 | | | | | 8 | |
| Total expenses before expense limitation | | | | 1,968 | | | | 1,710 | | | | 7,236 | | | | | 2,221 | |
| Expenses waived or reimbursed by the Adviser | | | | | | | | | | | | | | | | | | |
| Class N | | | | — | | | | (2 | ) | | | — | | | | | (1 | ) |
| Class I | | | | — | | | | (42 | ) | | | — | | | | | (7 | ) |
| Class R6 | | | | — | | | | (123 | ) | | | — | | | | | — | |
| Total expenses waived or reimbursed by the Adviser | | | | — | | | | (167 | ) | | | — | | | | | (8 | ) |
| Net expenses | | | | 1,968 | | | | 1,543 | | | | 7,236 | | | | | 2,213 | |
| Net investment income (loss) | | | | (58 | ) | | | (205 | ) | | | (2,220 | ) | | | | (1,035 | ) |
| Realized and unrealized gain (loss) | | | | | | | | | | | | | | | | | | |
| Net realized gain (loss) on transactions from: | | | | | | | | | | | | | | | | | | |
| Investments in securities (net of foreign capital gains tax paid $—; $392; $1,069; $1) | | | | 44,720 | | | | 26,245 | | | | 136,684 | | | | | 32,987 | |
| Foreign currency transactions | | | | (14 | ) | | | (22 | ) | | | (598 | ) | | | | (269 | ) |
| Total net realized gain (loss) | | | | 44,706 | | | | 26,223 | | | | 136,086 | | | | | 32,718 | |
| Change in net unrealized appreciation (depreciation) of: | | | | | | | | | | | | | | | | | | |
| Investments in securities (net of foreign capital gains tax accrual $—; $674; $1,684; $4,340) | | | | (19,738 | ) | | | (16,875 | ) | | | (13,300 | ) | | | | 13,737 | |
| Foreign currency translations | | | | (43 | ) | | | 43 | | | | (14 | ) | | | | (6 | ) |
| Change in net unrealized appreciation (depreciation) | | | | (19,781 | ) | | | (16,832 | ) | | | (13,314 | ) | | | | 13,731 | |
| Net increase (decrease) in net assets resulting from operations | | | $ | 24,867 | | | $ | 9,186 | | | $ | 120,552 | | | | $ | 45,414 | |
See accompanying Notes to Financial Statements.
| 116 | Semiannual Report | June 30, 2021 |
Statements of Changes in Net Assets
For the Period Ended June 30, 2021 (unaudited) and the Year Ended December 31, 2020 (all amounts in thousands)
| | | International
Small Cap
Growth Fund | | | Emerging Markets
Leaders Fund | | | Emerging Markets
Growth Fund | | | Emerging Markets
Small Cap
Growth Fund | |
| | | 2021 | | | 2020 | | | 2021 | | | 2020 | | | 2021 | | | 2020 | | | 2021 | | | 2020 | |
| Operations | | | | | | | | | | | | | | | | | | | | | | | | | | | | | | | | |
| Net investment income (loss) | | $ | (58 | ) | | $ | (46 | ) | | $ | (205 | ) | | $ | 75 | | | $ | (2,220 | ) | | $ | (2,057 | ) | | $ | (1,035 | ) | | $ | (188 | ) |
| Net realized gain (loss) on investments, and other assets and liabilities | | | 44,706 | | | | 32,819 | | | | 26,223 | | | | 8,003 | | | | 136,086 | | | | 74,647 | | | | 32,718 | | | | 46,512 | |
| Change in net unrealized appreciation (depreciation) on investments, and other assets and liabilities | | | (19,781 | ) | | | 41,601 | | | | (16,832 | ) | | | 49,105 | | | | (13,314 | ) | | | 265,671 | | | | 13,731 | | | | 29,571 | |
| Net increase (decrease) in net assets resulting from operations | | | 24,867 | | | | 74,374 | | | | 9,186 | | | | 57,183 | | | | 120,552 | | | | 338,261 | | | | 45,414 | | | | 75,895 | |
| Distributions to shareholders from | | | | | | | | | | | | | | | | | | | | | | | | | | | |
| Class N | | | — | | | | (63 | ) | | | — | | | | (15 | ) | | | — | | | | (531 | ) | | | — | | | | — | |
| Class I | | | — | | | | (3,008 | ) | | | — | | | | (621 | ) | | | — | | | | (4,443 | ) | | | — | | | | (65 | ) |
| Class R6 | | | — | | | | (4,066 | ) | | | — | | | | (2,293 | ) | | | — | | | | (42,354 | ) | | | — | | | | (129 | ) |
| Total distributions | | | — | | | | (7,137 | ) | | | — | | | | (2,929 | ) | | | — | | | | (47,328 | ) | | | — | | | | (194 | ) |
| Capital stock transactions | | | | | | | | | | | | | | | | | | | | | | | | | | | |
| Proceeds from sale of shares | | | 29,212 | | | | 42,647 | | | | 122,211 | | | | 61,028 | | | | 210,479 | | | | 318,162 | | | | 173,762 | | | | 71,699 | |
| Shares issued in reinvestment of income dividends and capital gain distributions | | | — | | | | 6,416 | | | | — | | | | 2,899 | | | | — | | | | 44,146 | | | | — | | | | 191 | |
| Less cost of shares redeemed | | | (23,020 | ) | | | (88,485 | ) | | | (76,999 | ) | | | (94,327 | ) | | | (268,257 | ) | | | (247,697 | ) | | | (35,731 | ) | | | (117,803 | ) |
| Net increase (decrease) in net assets resulting from capital share transactions | | | 6,192 | | | | (39,422 | ) | | | 45,212 | | | | (30,400 | ) | | | (57,778 | ) | | | 114,611 | | | | 138,031 | | | | (45,913 | ) |
| Increase (decrease) in net assets | | | 31,059 | | | | 27,815 | | | | 54,398 | | | | 23,854 | | | | 62,774 | | | | 405,544 | | | | 183,445 | | | | 29,788 | |
| Net assets | | | | | | | | | | | | | | | | | | | | | | | | | | | |
| Beginning of period | | | 336,881 | | | | 309,066 | | | | 262,137 | | | | 238,283 | | | | 1,195,736 | | | | 790,192 | | | | 307,409 | | | | 277,621 | |
| End of period | | $ | 367,940 | | | $ | 336,881 | | | $ | 316,535 | | | $ | 262,137 | | | $ | 1,258,510 | | | $ | 1,195,736 | | | $ | 490,854 | | | $ | 307,409 | |
See accompanying Notes to Financial Statements.
| June 30, 2021 | William Blair Funds | 117 |
Statements of Assets and Liabilities
As of June 30, 2021 (dollar amounts in thousands) (unaudited)
| | | Bond
Fund | | | | Income
Fund | | | | Low
Duration
Fund | |
| Assets | | | | | | | | | | | | |
| Investments in securities, at cost | | $ | 319,211 | | | $ | 50,758 | | | $ | 139,422 | |
| Investments in securities, at value | | $ | 335,143 | | | $ | 51,860 | | | $ | 139,942 | |
| Cash | | | 497 | | | | — | | | | 28 | |
| Receivable for securities sold | | | 7,726 | | | | 1,213 | | | | 21,641 | |
| Receivable for fund shares sold | | | 377 | | | | 152 | | | | 65 | |
| Receivable from Adviser | | | 4 | | | | 2 | | | | 16 | |
| Dividend and interest receivable | | | 1,871 | | | | 220 | | | | 343 | |
| Total assets | | | 345,618 | | | | 53,447 | | | | 162,035 | |
| Liabilities | | | | | | | | | | | | |
Security sold, not yet purchased, at value
(proceeds $5,350; $1,070; $21,129) | | | 5,326 | | | | 1,065 | | | | 21,080 | |
| Payable for variation margin on centrally cleared swaps | | | 3 | | | | — | | | | — | |
| Payable for securities purchased | | | 4,184 | | | | 200 | | | | — | |
| Payable for fund shares redeemed | | | 369 | | | | 62 | | | | 147 | |
| Management fee payable | | | 83 | | | | 15 | | | | 37 | |
| Distribution fee payable | | | 5 | | | | 2 | | | | 2 | |
| Distributions payable to shareholders | | | 124 | | | | 4 | | | | 23 | |
| Other payables and accrued expenses | | | 93 | | | | 50 | | | | 53 | |
| Total liabilities | | | 10,187 | | | | 1,398 | | | | 21,342 | |
| Net assets | | $ | 335,431 | | | $ | 52,049 | | | $ | 140,693 | |
| Capital | | | | | | | | | | | | |
| Composition of net assets | | | | | | | | | | | | |
| Paid in capital | | $ | 341,599 | | | $ | 58,283 | | | $ | 170,819 | |
| Total distributable earnings (loss) | | | (6,168 | ) | | | (6,234 | ) | | | (30,126 | ) |
| Net assets | | $ | 335,431 | | | $ | 52,049 | | | $ | 140,693 | |
| | | | | | | | | | | | | |
| Class N shares | | | | | | | | | | | | |
| Net assets | | $ | 39,108 | | | $ | 17,205 | | | $ | 16,119 | |
| Shares outstanding | | | 3,707,731 | | | | 2,009,770 | | | | 1,881,820 | |
| Net asset value per share | | $ | 10.55 | | | $ | 8.56 | | | $ | 8.57 | |
| Class I shares | | | | | | | | | | | | |
| Net assets | | $ | 246,624 | | | $ | 34,654 | | | $ | 102,003 | |
| Shares outstanding | | | 23,630,357 | | | | 4,075,582 | | | | 11,916,949 | |
| Net asset value per share | | $ | 10.44 | | | $ | 8.50 | | | $ | 8.56 | |
| Class R6 shares | | | | | | | | | | | | |
| Net assets | | $ | 49,699 | | | $ | 190 | | | $ | 22,571 | |
| Shares outstanding | | | 4,764,363 | | | | 22,287 | | | | 2,635,669 | |
| Net asset value per share | | $ | 10.43 | | | $ | 8.50 | | | $ | 8.56 | |
See accompanying Notes to Financial Statements.
| 118 | Semiannual Report | June 30, 2021 |
Statements of Operations
For the Period Ended June 30, 2021 (all amounts in thousands) (unaudited)
| | | Bond
Fund | | | | Income
Fund | | | | Low
Duration
Fund | |
| Investment income | | | | | | | | | |
| Interest | | $ | 3,897 | | | $ | 529 | | | $ | 816 | |
| Total income | | | 3,897 | | | | 529 | | | | 816 | |
| Expenses | | | | | | | | | | | | |
| Investment advisory fees | | | 483 | | | | 99 | | | | 244 | |
| Distribution fees | | | 29 | | | | 16 | | | | 12 | |
| Custodian fees | | | 48 | | | | 38 | | | | 47 | |
| Transfer agent fees | | | 47 | | | | 6 | | | | 9 | |
| Sub-transfer agent fees | | | | | | | | | | | | |
| Class N | | | 27 | | | | 15 | | | | 8 | |
| Class I | | | 84 | | | | 11 | | | | 22 | |
| Professional fees | | | 33 | | | | 15 | | | | 35 | |
| Registration fees | | | 33 | | | | 27 | | | | 30 | |
| Shareholder reporting fees | | | 7 | | | | 3 | | | | 2 | |
| Trustee fees | | | 11 | | | | 3 | | | | 5 | |
| Other expenses | | | 8 | | | | 5 | | | | 6 | |
| Total expenses before expense limitation | | | 810 | | | | 238 | | | | 420 | |
| Expenses waived or reimbursed by the Adviser | | | | | | | | | | | | |
| Class N | | | (20 | ) | | | (8 | ) | | | (13 | ) |
| Class I | | | (44 | ) | | | — | | | | (58 | ) |
| Class R6 | | | (4 | ) | | | — | | | | (21 | ) |
| Total expenses waived or reimbursed by the Adviser | | | (68 | ) | | | (8 | ) | | | (92 | ) |
| Net expenses | | | 742 | | | | 230 | | | | 328 | |
| Net investment income (loss) | | | 3,155 | | | | 299 | | | | 488 | |
| Realized and unrealized gain (loss) | | | | | | | | | | | | |
| Net realized gain (loss) on transactions from: | | | | | | | | | | | | |
| Investments in securities | | | 674 | | | | 262 | | | | 314 | |
| Swaps | | | (1,427 | ) | | | (460 | ) | | | — | |
| Total net realized gain (loss) | | | (753 | ) | | | (198 | ) | | | 314 | |
| Change in net unrealized appreciation (depreciation) of: | | | | | | | | | | | | |
| Investments in securities | | | (6,878 | ) | | | (907 | ) | | | (645 | ) |
| Swaps | | | 836 | | | | 316 | | | | — | |
| Change in net unrealized appreciation (depreciation) | | | (6,042 | ) | | | (591 | ) | | | (645 | ) |
| Net increase (decrease) in net assets resulting from operations | | $ | (3,640 | ) | | $ | (490 | ) | | $ | 157 | |
See accompanying Notes to Financial Statements.
| June 30, 2021 | William Blair Funds | 119 |
Statements of Changes in Net Assets
For the Period Ended June 30, 2021 (unaudited) and the Year Ended December 31, 2020 (all amounts in thousands)
| | | | Bond Fund | | | Income Fund | | | Low Duration Fund | |
| | | | 2021 | | | 2020 | | | 2021 | | | 2020 | | | 2021 | | | 2020 | |
| Operations | | | | | | | | | | | | | | | | | | | | | | | | | |
| Net investment income (loss) | | | $ | 3,155 | | | $ | 6,928 | | | $ | 299 | | | $ | 829 | | | $ | 488 | | | $ | 1,343 | |
| Net realized gain (loss) on investments, and other assets and liabilities | | | | (753 | ) | | | 3,824 | | | | (198 | ) | | | 161 | | | | 314 | | | | (409 | ) |
| Change in net unrealized appreciation (depreciation) on investments, and other assets and liabilities | | | | (6,042 | ) | | | 9,883 | | | | (591 | ) | | | 1,281 | | | | (645 | ) | | | 1,479 | |
| Net increase (decrease) in net assets resulting from operations | | | | (3,640 | ) | | | 20,635 | | | | (490 | ) | | | 2,271 | | | | 157 | | | | 2,413 | |
| Distributions to shareholders from | | | | | | | | | | | | | | | | | | | | | | | | | |
| Class N | | | | (544 | ) | | | (1,089 | ) | | | (195 | ) | | | (546 | ) | | | (158 | ) | | | (189 | ) |
| Class I | | | | (3,432 | ) | | | (7,496 | ) | | | (408 | ) | | | (1,009 | ) | | | (1,177 | ) | | | (1,833 | ) |
| Class R6 | | | | (723 | ) | | | (1,641 | ) | | | (1 | ) | | | (2 | ) | | | (390 | ) | | | (1,168 | ) |
| Total distributions | | | | (4,699 | ) | | | (10,226 | ) | | | (604 | ) | | | (1,557 | ) | | | (1,725 | ) | | | (3,190 | ) |
| Capital stock transactions | | | | | | | | | | | | | | | | | | | | | | | | | |
| Proceeds from sale of shares | | | | 59,350 | | | | 95,911 | | | | 9,305 | | | | 33,540 | | | | 56,197 | | | | 166,102 | |
| Shares issued in reinvestment of income dividends and capital gain distributions | | | | 3,949 | | | | 8,711 | | | | 568 | | | | 1,470 | | | | 1,557 | | | | 2,649 | |
| Less cost of shares redeemed | | | | (40,249 | ) | | | (76,446 | ) | | | (25,052 | ) | | | (18,745 | ) | | | (73,873 | ) | | | (86,109 | ) |
| Net increase (decrease) in net assets resulting from capital share transactions | | | | 23,050 | | | | 28,176 | | | | (15,179 | ) | | | 16,265 | | | | (16,119 | ) | | | 82,642 | |
| Increase (decrease) in net assets | | | | 14,711 | | | | 38,585 | | | | (16,273 | ) | | | 16,979 | | | | (17,687 | ) | | | 81,865 | |
| Net assets | | | | | | | | | | | | | | | | | | | | | | | | | |
| Beginning of period | | | | 320,720 | | | | 282,135 | | | | 68,322 | | | | 51,343 | | | | 158,380 | | | | 76,515 | |
| End of period | | | $ | 335,431 | | | $ | 320,720 | | | $ | 52,049 | | | $ | 68,322 | | | $ | 140,693 | | | $ | 158,380 | |
See accompanying Notes to Financial Statements.
| 120 | Semiannual Report | June 30, 2021 |
Statements of Assets and Liabilities
As of June 30, 2021 (dollar amounts in thousands) (unaudited)
| | | Emerging
Markets
Debt Fund | | | Macro
Allocation
Fund | |
| Assets | | | | | | |
| Investments in securities, at cost | | $ | 24,427 | | | $ | 171,300 | |
| Investments in securities, at value | | $ | 24,378 | | | $ | 216,203 | |
| Cash | | | 400 | | | | — | |
| Segregated cash at broker | | | 84 | | | | — | |
| Receivable for securities sold | | | 354 | | | | 3,802 | |
| Receivable for fund shares sold | | | 25 | | | | 164 | |
| Receivable from Adviser | | | 17 | | | | 13 | |
| Dividend and interest receivable | | | 312 | | | | 1,212 | |
| Unrealized appreciation on swap contracts | | | — | | | | 1,251 | |
| Unrealized appreciation on forward foreign currency contracts | | | 40 | | | | 5,340 | |
| Total assets | | | 25,610 | | | | 227,985 | |
| Liabilities | | | | | | | | |
| Payable for futures variation margin | | | — | | | | 130 | |
| Payable for variation margin on centrally cleared swaps | | | 5 | | | | 23 | |
| Payable for securities purchased | | | 1,538 | | | | — | |
| Payable for fund shares redeemed | | | 8 | | | | 130 | |
| Cash received as collateral, due to broker | | | — | | | | 3,170 | |
| Unrealized depreciation on swap contracts | | | — | | | | 94 | |
| Unrealized depreciation on forward foreign currency contracts | | | — | | | | 3,621 | |
| Management fee payable | | | 13 | | | | 171 | |
| Distribution fee payable | | | — | | | | 1 | |
| Other payables and accrued expenses | | | 21 | | | | 204 | |
| Total liabilities | | | 1,585 | | | | 7,544 | |
| Net assets | | $ | 24,025 | | | $ | 220,441 | |
| Capital | | | | | | | | |
| Composition of net assets | | | | | | | | |
| Paid in capital | | $ | 24,028 | | | $ | 390,320 | |
| Total distributable earnings (loss) | | | (3 | ) | | | (169,879 | ) |
| Net assets | | $ | 24,025 | | | $ | 220,441 | |
| | | | | | | | | |
| Class N shares | | | | | | | | |
| Net assets | | $ | — | | | $ | 7,124 | |
| Shares outstanding | | | — | | | | 627,647 | |
| Net asset value per share | | $ | — | | | $ | 11.35 | |
| Class I shares | | | | | | | | |
| Net assets | | $ | 1,151 | | | $ | 95,007 | |
| Shares outstanding | | | 115,148 | | | | 8,422,191 | |
| Net asset value per share | | $ | 10.00 | | | $ | 11.28 | |
| Class R6 shares | | | | | | | | |
| Net assets | | $ | 22,874 | | | $ | 118,310 | |
| Shares outstanding | | | 2,287,676 | | | | 10,483,787 | |
| Net asset value per share | | $ | 10.00 | | | $ | 11.29 | |
See accompanying Notes to Financial Statements.
| June 30, 2021 | William Blair Funds | 121 |
Statements of Operations
For the Period Ended June 30, 2021 (all amounts in thousands) (unaudited)
| | | Emerging
Markets
Debt Fund (a) | | | Macro
Allocation
Fund | |
| Investment income | | | | | | | | |
| Dividends | | $ | — | | | $ | 1,532 | |
| Less foreign tax withheld | | | — | | | | (77 | ) |
| Interest | | | 111 | | | | 866 | |
| Total income | | | 111 | | | | 2,321 | |
| Expenses | | | | | | | | |
| Investment advisory fees | | | 15 | | | | 1,158 | |
| Distribution fees | | | — | | | | 9 | |
| Custodian fees | | | 4 | | | | 110 | |
| Transfer agent fees | | | 2 | | | | 28 | |
| Sub-transfer agent fees | | | | | | | | |
| Class N | | | — | | | | 5 | |
| Class I | | | — | | | | 72 | |
| Professional fees | | | 7 | | | | 45 | |
| Registration fees | | | 4 | | | | 34 | |
| Shareholder reporting fees | | | 1 | | | | 9 | |
| Trustee fees | | | 1 | | | | 19 | |
| Other expenses | | | 1 | | | | 33 | |
| Total expenses before expense limitation | | | 35 | | | | 1,522 | |
| Expenses waived or reimbursed by the Adviser | | | | | | | | |
| Class N | | | — | | | | (4 | ) |
| Class I | | | (1 | ) | | | (57 | ) |
| Class R6 | | | (19 | ) | | | (24 | ) |
| Total expenses waived or reimbursed by the Adviser | | | (20 | ) | | | (85 | ) |
| Net expenses | | | 15 | | | | 1,437 | |
| Net investment income (loss) | | | 96 | | | | 884 | |
| Realized and unrealized gain (loss) | | | | | | | | |
| Net realized gain (loss) on transactions from: | | | | | | | | |
| Investments in securities | | | 19 | | | | 39,580 | |
| Futures contracts | | | — | | | | (18,587 | ) |
| Swaps | | | (3 | ) | | | (265 | ) |
| Forward foreign currency contracts | | | 4 | | | | (1,304 | ) |
| Foreign currency transactions | | | (1 | ) | | | — | |
| Total net realized gain (loss) | | | 19 | | | | 19,424 | |
| Change in net unrealized appreciation (depreciation) of: | | | | | | | | |
| Investments in securities | | | (49 | ) | | | (13,137 | ) |
| Futures contracts | | | — | | | | 2,804 | |
| Swaps | | | (22 | ) | | | 591 | |
| Forward foreign currency contracts | | | 40 | | | | 907 | |
| Foreign currency translations | | | 1 | | | | 17 | |
| Change in net unrealized appreciation (depreciation) | | | (30 | ) | | | (8,818 | ) |
| Net increase (decrease) in net assets resulting from operations | | $ | 85 | | | $ | 11,490 | |
| (a) | For the period from May 25, 2021 (Commencement of Operations) to June 30, 2021. |
See accompanying Notes to Financial Statements.
| 122 | Semiannual Report | June 30, 2021 |
Statements of Changes in Net Assets
For the Period Ended June 30, 2021 (unaudited) and the Year Ended December 31, 2020 (all amounts in thousands)
| | | Emerging
Markets
Debt Fund (a) | | | Macro Allocation Fund | |
| | | 2021 | | | 2021 | | | 2020 | |
| Operations | | | | | | | | | | | | | |
| Net investment income (loss) | | | $ | 96 | | | $ | 884 | | | $ | 3,426 | |
| Net realized gain (loss) on investments, and other assets and liabilities | | | | 19 | | | | 19,424 | | | | (31,014 | ) |
| Change in net unrealized appreciation (depreciation) on investments, and other assets and liabilities | | | | (30 | ) | | | (8,818 | ) | | | (7,205 | ) |
| Net increase (decrease) in net assets resulting from operations | | | | 85 | | | | 11,490 | | | | (34,793 | ) |
| Distributions to shareholders from | | | | | | | | | | | | | |
| Class N | | | | — | | | | — | | | | (79 | ) |
| Class I | | | | (3 | ) | | | — | | | | (2,289 | ) |
| Class R6 | | | | (85 | ) | | | — | | | | (2,567 | ) |
| Total distributions | | | | (88 | ) | | | — | | | | (4,935 | ) |
| Capital stock transactions | | | | | | | | | | | | | |
| Proceeds from sale of shares | | | | 23,957 | | | | 10,396 | | | | 75,968 | |
| Shares issued in reinvestment of income dividends and capital gain distributions | | | | 88 | | | | — | | | | 4,686 | |
| Less cost of shares redeemed | | | | (17 | ) | | | (155,160 | ) | | | (438,011 | ) |
| Net increase (decrease) in net assets resulting from capital share transactions | | | | 24,028 | | | | (144,764 | ) | | | (357,357 | ) |
| Increase (decrease) in net assets | | | | 24,025 | | | | (133,274 | ) | | | (397,085 | ) |
| Net assets | | | | | | | | | | | | | |
| Beginning of period | | | | — | | | | 353,715 | | | | 750,800 | |
| End of period | | | $ | 24,025 | | | $ | 220,441 | | | $ | 353,715 | |
| (a) | For the period from May 25, 2021 (Commencement of Operations) to June 30, 2021. |
See accompanying Notes to Financial Statements.
| June 30, 2021 | William Blair Funds | 123 |
Notes to Financial Statements (information as of June 30, 2021 is unaudited)
(1) Organization
(a) Description of the Trust
William Blair Funds (the “Trust”) is a Delaware statutory trust registered under the Investment Company Act of 1940, as amended (the “1940 Act”), as an open-end management investment company. As of the date of this report, the Trust has the following twenty funds (the “Funds”) available for sale, each with its own investment objective and policies. For each Fund, the number of shares authorized is unlimited.
| U.S. Equity Funds | Global Equity Fund | Fixed Income Funds |
| Growth | Global Leaders | Bond |
| Large Cap Growth | | Income |
| Mid Cap Growth | International Equity Funds | Low Duration |
| Small-Mid Cap Core | International Leaders | |
| Small-Mid Cap Growth | International Growth | Emerging Markets Debt Fund |
| Small Cap Growth | Institutional International Growth | Emerging Markets Debt |
| Small Cap Value | International Small Cap Growth | |
| | Emerging Markets Leaders | Multi-Asset and Alternative Fund |
| | Emerging Markets Growth | Macro Allocation |
| | Emerging Markets Small Cap Growth | |
William Blair Investment Management, LLC (the “Adviser”) serves as the Trust’s investment adviser. William Blair & Company, L.L.C. (“WBC” or the “Distributor”), an affiliate of the Adviser, serves as the Trust’s principal underwriter and distributor.
(b) Share Classes
Each Fund is comprised of Class N, Class I and Class R6 shares, except the Small-Mid Cap Core and Emerging Markets Debt Funds, which are comprised of Class I and Class R6 shares, and Institutional International Growth Fund, which does not offer multiple classes of shares.
Class N shares are available to the general public, either directly through the Trust’s distributor or through a select number of financial intermediaries. Class N shares are sold without any sales load and carry an annual 12b-1 distribution fee at a fixed rate (0.25% for the U.S. Equity, Global Equity, International Equity and Multi-Asset and Alternative Funds and 0.15% for the Fixed Income Funds as discussed in Note 4(b) – Transactions with Affiliates – Underwriting Distribution Services and Shareholder Administration Agreements) and a sub-transfer agent fee that is not a fixed rate and varies by Fund and class, as discussed below.
Class I shares are available to certain retirement and deferred compensation plans, clients of certain financial intermediaries, and asset-based fee advisory clients of William Blair. The minimum initial investment for a Class I account is $500,000, subject to certain exceptions. Class I shares do not carry any sales load or distribution fees and generally have lower ongoing expenses than Class N shares. Class I shares have a sub-transfer agent fee that is not a fixed rate and varies by Fund and class, as discussed below.
Class R6 shares are available to certain retirement and deferred compensation plans, clients of certain financial intermediaries, asset-based fee advisory clients of William Blair, and additional types of investors, provided that neither the investor nor the financial intermediary requires the Funds to make any type of servicing or administrative payment. The minimum initial investment for a Class R6 account is $1 million, subject to certain exceptions.
Shares of the Institutional International Growth Fund require a minimum initial investment of $5 million, subject to certain exceptions.
Class R6 shares and the Institutional International Growth Fund do not carry any sales load, distribution fees or sub-transfer agents fees. Class R6 shares of a Fund generally have lower ongoing expenses than the Fund’s Class N and Class I shares.
Sub-transfer agent fees: For Class N and Class I shares, the Funds may reimburse WBC for fees paid to intermediaries such as banks, broker-dealers, financial advisers or other financial institutions for sub-administration, sub-transfer agency and other
| 124 | Semiannual Report | June 30, 2021 |
Notes to Financial Statements (information as of June 30, 2021 is unaudited)
services provided to investors whose shares of record are held in omnibus, other group accounts, retirement plans or accounts traded through registered securities clearing agents. These fees may vary based on, for example, the nature of services provided, but generally range up to 0.15% of the assets of the class serviced or maintained by the intermediary or up to $15 per sub-account maintained by the intermediary, depending on the method by which the intermediary charges for the services.
(c) Fund Objectives
The investment objectives of the Funds are as follows:
| U.S. Equity Funds | Long-term capital appreciation. |
| Global Equity Fund | Long-term capital appreciation. |
| International Equity Funds | Long-term capital appreciation. |
| Bond Fund | Outperform the Bloomberg Barclays U.S. Aggregate Index by maximizing total return through a combination of income and capital appreciation. |
| Income Fund | High level of current income with relative stability of principal. |
| Low Duration Fund | Maximize total return. Total return includes both income and capital appreciation. |
| Emerging Markets Debt Fund | Provide attractive risk-adjusted returns relative to the Fund’s benchmark through investments in hard currency denominated debt issued in emerging market countries. |
| Macro Allocation Fund | Maximize long-term risk-adjusted total return. |
(2) Significant Accounting Policies
The following is a summary of the Trust’s significant accounting policies in effect during the periods covered by the financial statements, which are in accordance with U.S. generally accepted accounting principles (“US GAAP”), which includes the accounting and reporting guidelines under Accounting Standards Topic 946, Financial Services—Investment Companies.
(a) Investment income and transactions
Investment income, realized and unrealized gains and losses, and certain Fund level expenses and expense reductions, if any, are allocated based on the relative net assets of each class, except for certain class-specific expenses, which are charged directly to the appropriate class. Differences in class expenses may result in the payment of different per share dividends by class. All share classes of the Funds have equal rights with respect to voting, subject to class specific arrangements.
Dividend income and expenses are recorded on the ex-dividend date, except for those dividends from certain foreign securities that are recorded when the information is available.
Interest income is recorded on an accrual basis, adjusted for amortization of premium or accretion of discount. Variable rate bonds and floating rate notes earn interest at coupon rates that fluctuate at specific time intervals. The interest rates shown in the Portfolio of Investments for the Bond, Income, Low Duration, Emerging Markets Debt and Macro Allocation Funds were the rates in effect on June 30, 2021. Put bonds may be redeemed at the discretion of the holder on specified dates prior to maturity.
Premiums and discounts are amortized and accreted, respectively, on a straight-line basis for short-term investments and on an effective interest method for long-term investments.
Paydown gains and losses on mortgage-backed and asset-backed securities are treated as an adjustment to interest income. For the period ended June 30, 2021, the Bond, Income and Low Duration Funds recognized a reduction of interest income and a corresponding increase in net realized gain of $1,987, $420 and $1,237, respectively (in thousands). This reclassification had no effect on the net increase (decrease) in net assets resulting from operations, net asset value or the net assets of the Funds.
The Funds do not isolate the portion of operations resulting from fluctuations in foreign currency exchange rates on investments from the fluctuations arising from changes in the value of securities held. Such currency fluctuations are included with the net realized and unrealized gain or loss from investments.
Reported net realized foreign currency gains or losses arise from disposition of foreign currency, the difference in the foreign exchange rates between the trade and settlement dates on securities transactions, and the difference between the amounts of
| June 30, 2021 | William Blair Funds | 125 |
Notes to Financial Statements (information as of June 30, 2021 is unaudited)
dividends, interest and foreign withholding taxes recorded on the ex-date or accrual date and the U.S. dollar equivalent of the amounts actually received or paid. Net unrealized foreign exchange gains and losses arise from changes (due to the changes in the exchange rate) in the value of foreign currency and other assets and liabilities denominated in foreign currencies held at period end.
For financial reporting purposes, security and shareholder transactions are recorded on trade date in accordance with US GAAP. Realized gains and losses from securities transactions are recognized on a specifically identified cost basis.
Awards from class action litigation may be recorded as a reduction of cost. If the Funds no longer own the applicable securities, the proceeds are recorded as realized gains.
(b) Share Valuation and Distributions to Shareholders
Shares are sold and redeemed on a continuous basis at net asset value. The net asset value per share is determined separately for each class by dividing the Fund’s net assets attributable to that class by the number of shares of the class outstanding as of the close of regular trading on the New York Stock Exchange (the “NYSE”), which is generally 4:00 p.m. Eastern time, on each day the NYSE is open.
Distributions from net investment income, if any, for all Equity and Multi-Asset and Alternative Funds are declared and paid at least annually. Distributions from net investment income for the Fixed Income Funds and Emerging Markets Debt Fund are declared daily and paid monthly. Capital gain distributions, if any, for all Funds, are declared and paid at least annually in December and/or January. Distributions payable to shareholders are recorded on the ex-dividend date.
(c) Foreign Currency Translation
The Funds may invest in securities denominated in foreign currencies. As such, assets and liabilities denominated in foreign currencies are translated into U.S. dollar amounts at the current exchange rate on the date of valuation. The values of foreign investments, open forward foreign currency contracts, and cash denominated in foreign currencies are translated into U.S. dollars using a spot market rate of exchange as of the time of the determination of each Fund’s net asset value, typically 4:00 p.m. Eastern time on days when there is regular trading on the NYSE. Payables and receivables for securities transactions, dividends, interest income and tax reclaims are translated into U.S. dollars using a spot market rate of exchange as of 4:00 p.m. Eastern time. Settlement of purchases and sales and dividend and interest receipts are translated into U.S. dollars using a spot market rate of exchange as of 11:00 a.m. Eastern time.
(d) Income Taxes
Each Fund intends to comply with the provisions of Subchapter M of the Internal Revenue Code of 1986, as amended (the “Code”), in order to qualify as regulated investment companies. Each Fund intends to make the requisite distributions of income and capital gains to its shareholders sufficient to relieve it from all, or substantially all, federal income and excise taxes. No provision for federal income and excise taxes has been made.
Certain Funds may be subject to foreign income taxes imposed on realized gains on securities of issuers from certain foreign countries. Such taxes, if applicable, are included within net realized gain (loss) on transactions from investments in securities in the Statement of Operations.
Management evaluates tax positions taken or expected to be taken in the course of preparing the Funds’ tax returns to determine whether it is “more likely than not” that each tax position would be sustained upon examination by a taxing authority based on the technical merits of the positions. Tax positions not deemed to meet the “more likely than not” threshold would be recorded as a tax benefit or expense in the current year. Management has evaluated all of the uncertain tax positions of the Funds and has determined that no liability is required to be recorded in the financial statements.
The statute of limitations on the Funds’ tax returns for the prior three years remains open and the returns are subject to examination.
| 126 | Semiannual Report | June 30, 2021 |
Notes to Financial Statements (information as of June 30, 2021 is unaudited)
Adjustments to the cost of investments for tax purposes may be due to the deferred loss associated with current and prior year wash sales, income recognition from investments in real estate investment trusts, and the Funds’ election to mark-to-market their investments in Passive Foreign Investment Companies (“PFICs”). The cost of investments, including derivatives, for federal income tax purposes and related gross unrealized appreciation (depreciation) and net unrealized appreciation/(depreciation) at June 30, 2021, were as follows (in thousands):
| | | | | | | | | | | | Net |
| | | | | | Gross | | Gross | | Unrealized |
| | | Cost of | | | Unrealized | | Unrealized | | Appreciation/ |
| Fund | | Investments | | | Appreciation | | Depreciation | | (Depreciation) |
| Growth | | $ | 169,987 | | | $ | 157,279 | | | $ | 658 | | | $ | 156,621 | |
| Large Cap Growth | | | 519,831 | | | | 298,206 | | | | — | | | | 298,206 | |
| Mid Cap Growth | | | 61,449 | | | | 26,360 | | | | 907 | | | | 25,453 | |
| Small-Mid Cap Core | | | 40,051 | | | | 11,301 | | | | 270 | | | | 11,031 | |
| Small-Mid Cap Growth | | | 2,373,128 | | | | 1,105,807 | | | | 36,093 | | | | 1,069,714 | |
| Small Cap Growth | | | 525,992 | | | | 224,483 | | | | 10,550 | | | | 213,933 | |
| Small Cap Value | | | 32,789 | | | | 15,923 | | | | 252 | | | | 15,671 | |
| Global Leaders | | | 74,025 | | | | 64,456 | | | | 138 | | | | 64,318 | |
| International Leaders | | | 829,546 | | | | 385,454 | | | | 18,556 | | | | 366,898 | |
| International Growth | | | 1,369,962 | | | | 1,000,370 | | | | 27,174 | | | | 973,196 | |
| Institutional International Growth | | | 767,708 | | | | 559,340 | | | | 14,729 | | | | 544,611 | |
| International Small Cap Growth | | | 279,081 | | | | 89,857 | | | | 11,241 | | | | 78,616 | |
| Emerging Markets Leaders | | | 267,512 | | | | 79,207 | | | | 2,659 | | | | 76,548 | |
| Emerging Markets Growth | | | 837,262 | | | | 429,589 | | | | 6,296 | | | | 423,293 | |
| Emerging Markets Small Cap Growth | | | 390,774 | | | | 110,665 | | | | 4,103 | | | | 106,562 | |
| Bond | | | 320,911 | | | | 17,205 | | | | 2,973 | | | | 14,232 | |
| Income | | | 51,101 | | | | 897 | | | | 138 | | | | 759 | |
| Low Duration | | | 139,422 | | | | 1,269 | | | | 749 | | | | 520 | |
| Emerging Markets Debt | | | 24,427 | | | | 212 | | | | 221 | | | | (9 | ) |
| Macro Allocation | | | 176,004 | | | | 48,252 | | | | 3,678 | | | | 44,574 | |
As of December 31, 2020, the Funds may have unused capital loss carryforwards available for federal income tax purposes to be applied against future capital gains, if any. Under current law, the Funds may carry forward net capital losses indefinitely to use to offset capital gains realized in future years. The following table details the Funds’ available capital loss carryforwards as of December 31, 2020, and the capital loss carryforwards utilized by the Funds in 2020:
| | | Available Capital Loss Carryforwards | | Capital Loss
Carryforwards |
| Fund | | Short Term | | Long Term | | Total | | Utilized in 2020 |
| Small-Mid Cap Core | | $ | 12,855 | | | $ | 51 | | | $ | 12,906 | | | $ | — | |
| Small Cap Value | | | 13,368 | | | | — | | | | 13,368 | | | | — | |
| International Growth | | | — | | | | — | | | | — | | | | 8,604 | |
| Institutional International Growth | | | — | | | | — | | | | — | | | | 33,252 | |
| International Small Cap Growth | | | — | | | | — | | | | — | | | | 15,355 | |
| Emerging Markets Small Cap Growth | | | — | | | | — | | | | — | | | | 46,476 | |
| Bond | | | 9,761 | | | | 10,043 | | | | 19,804 | | | | 523 | |
| Income | | | 2,596 | | | | 4,313 | | | | 6,909 | | | | — | |
| Low Duration | | | 13,806 | | | | 15,977 | | | | 29,783 | | | | — | |
| Macro Allocation | | | 224,668 | | | | 11,978 | | | | 236,646 | | | | — | |
In order to meet certain excise tax distribution requirements, the Funds are required to measure and distribute annually, net capital gains realized during a twelve month period ending October 31 and net investment income earned during a twelve month period ending December 31. In connection with this, the Funds are permitted for tax purposes to defer into their next fiscal year qualified late year losses. Qualified late year capital losses are any short term or long term capital losses incurred between November 1 and the end of their fiscal year, December 31, 2020. Qualified late year ordinary losses are comprised of losses related to swaps, foreign currency and PFICs incurred between November 1 and the end of their fiscal year, December 31, 2020.
| June 30, 2021 | William Blair Funds | 127 |
Notes to Financial Statements (information as of June 30, 2021 is unaudited)
As of December 31, 2020, the following Funds deferred, on a tax basis, qualified late year losses of (in thousands):
| | | Qualified Late Year Losses | |
| | | Ordinary | | | Net | |
| Fund | | Income | | | Capital | |
| Emerging Markets Small Cap Growth | | $ | 102 | | | $ | — | |
| Bond | | | 741 | | | | — | |
| Income | | | 228 | | | | — | |
(e) Repurchase Agreements
In a repurchase agreement, a Fund buys a security at one price and at the time of sale, the seller agrees to repurchase the security at a mutually agreed upon time and price (usually within seven days). The repurchase agreement thereby determines the yield during the purchaser’s holding period, while the seller’s obligation to repurchase is secured by the value of the underlying collateral. The Adviser monitors, on an ongoing basis, the value of the underlying collateral to ensure that the value always equals or exceeds the repurchase price plus accrued interest. Repurchase agreements may involve certain risks in the event of a default or insolvency of the other party to the agreement, including possible delays or restrictions upon a Fund’s ability to dispose of the underlying collateral. The risk to a Fund is limited to the ability of the seller to pay the agreed upon sum on the delivery date. In the event of default, a repurchase agreement provides that a Fund is entitled to sell the underlying collateral. The loss, if any, to a Fund will be the difference between the proceeds from the sale and the repurchase price. However, if bankruptcy proceedings are commenced with respect to the seller of the security, disposition of the collateral by the Fund may be delayed or limited. The Funds have master repurchase agreements which allow the Funds to offset amounts owed to a counterparty with amounts owed from the same counterparty, including any collateral, in the event the counterparty defaults. Each Fund’s outstanding repurchase agreements, if any, and related collateral, are shown on the Fund’s Portfolio of Investments. Although no definitive creditworthiness criteria are used, the Adviser reviews the creditworthiness of the banks and non-bank dealers with which a Fund enters into repurchase agreements to evaluate those risks. A Fund may, for tax purposes, deem repurchase agreements collateralized by U.S. Government securities to be investments in U.S. Government securities.
(f) TBA Securities
The Fixed Income Funds may invest in mortgage pass-through securities eligible to be sold in the “to-be announced” market (“TBAs”). TBAs provide for the forward or delayed delivery of the underlying instrument with settlement in up to 180 days. The term TBA comes from the fact that the specific mortgage-backed security that will be delivered to fulfill a TBA trade is not designated at the time the trade is made, but rather is generally announced 48 hours before the settlement date. A Fund generally has the ability to close out a TBA obligation on or before the settlement date, rather than take delivery of the security. When a Fund sells TBAs, it incurs risks similar to those incurred in short sales. For example, when a Fund sells TBAs without owning or having the right to obtain the deliverable securities it incurs a risk of loss because it could have to purchase the securities at a price that is higher than the price at which it sold the securities.
(g) Securities Sold, Not Yet Purchased
A Fund may sell a security it does not own (known as selling a security short) in anticipation of a decline in the fair value of that security. When a Fund sells a security short, it must borrow the security sold short and deliver it to the broker through which it made the short sale. A gain, limited to the price at which the fund sold the security short, or a loss, unlimited in size, will be recognized upon the termination of the short sale. A Fund is also subject to the risk that it may be unable to acquire a security to terminate a short position except at a price substantially in excess of the price at which it sold the security short.
(h) Use of Estimates
The preparation of financial statements in conformity with US GAAP requires management to make estimates and assumptions that affect the amounts reported in the financial statements. Actual results may differ from those estimates.
(i) Indemnification
In the normal course of business, the Funds have entered into contracts in which the Funds agree to indemnify the other party or parties against various potential costs or liabilities. The Funds’ maximum exposure under these arrangements is unknown. No claim has been made for indemnification pursuant to any such agreement of the Funds.
| 128 | Semiannual Report | June 30, 2021 |
Notes to Financial Statements (information as of June 30, 2021 is unaudited)
(j) Redemption In-Kind
In accordance with the Trust’s prospectus, the Funds may distribute portfolio securities rather than cash as payment for a redemption of Fund shares (in-kind redemption). For financial reporting purposes, the Fund recognizes a gain or loss on the transfer of securities depending on the value of those securities on the date of redemption. Gains and losses realized on in-kind redemptions may not be recognized for tax purposes and are reclassified from accumulated net realized gain (loss) to capital paid in excess of par value. During the period ended June 30, 2021, the Small-Mid Cap Growth Fund redeemed $224,500 (in thousands) of Fund shares in-kind rather than with cash and recognized net realized gains of $89,621 (in thousands) on the securities distributed to shareholders.
(3) Valuation
(a) Investment Valuation
The value of U.S. equity securities, including exchange-traded funds, is determined by valuing securities traded on national securities markets or in the over-the-counter markets at the last sale price or, if applicable, the official closing price or, in the absence of a recent sale on the date of determination, at the mean between the last reported bid and ask prices.
The value of foreign equity securities is generally determined based upon the last sale price on the foreign exchange or market on which it is primarily traded and in the currency of that market as of the close of the appropriate exchange or, if there have been no sales during that day, at the mean between the last reported bid and ask prices. The Board of Trustees has determined that the passage of time between when the foreign exchanges or markets close and when the Funds compute their net asset values could cause the value of foreign equity securities to no longer be representative or accurate and, as a result, may necessitate that such securities be fair valued. Accordingly, for foreign equity securities, the Funds may use an independent pricing service to fair value price the security as of the close of regular trading on the NYSE. As a result, a Fund’s value for a foreign security may be different from the last sale price (or the mean between the last reported bid and ask prices). As of June 30, 2021, fair valuation estimates for foreign equity securities were not obtained.
Fixed income securities are generally valued using evaluated prices provided by an independent pricing service. The evaluated prices are formed using various market inputs that the pricing service believes accurately represent the market value of a security at a particular point in time. The pricing service determines evaluated prices for fixed income securities using inputs including, but not limited to, recent transaction prices for such securities, dealer quotes, transaction prices for other securities with similar characteristics, collateral characteristics, credit quality, payment history, liquidity and market conditions.
Repurchase agreements are valued at cost, which approximates fair value.
Option contracts on securities, currencies and other financial instruments traded on one or more exchanges are valued at their most recent sale price on the exchange on which they are traded most extensively. Option contracts on foreign indices are valued at the settlement price. If there were no sales that day or if no settlement price is available, such option contracts are valued at the mean between the last reported bid and ask prices. Option contracts traded in the Over-the-Counter (“OTC”) market shall be valued by an independent pricing service. Futures contracts are valued at the most recent settlement price on the exchange on which they are traded most extensively, or if no settlement price is available, at the last sale price as of the close of the exchange. Forward foreign currency contracts are valued on the basis of the value of the underlying currencies at the prevailing currency exchange rate as supplied by an independent pricing service.
Swaps that are centrally cleared through an exchange are valued at the most recent settlement price provided by the exchange on which they are cleared. Total return swaps on equities, equity baskets, indices and other financial instruments are valued by an independent pricing service, or if unavailable, based on the security’s or instrument’s underlying reference asset. All other swap contracts are valued by an independent pricing service. Depending on the product and the terms of the transaction, the independent pricing service may use a series of techniques, including simulation pricing models. The pricing models use inputs that are observed from actively quoted markets such as issuer details, indices, spreads, interest rates, yield curves, dividends and exchange rates.
Securities, and other assets, for which a market price is not available or is deemed unreliable (e.g., securities affected by unusual or extraordinary events, such as natural disasters or securities affected by market or economic events, such as bankruptcy filings), or the value of which is affected by a significant valuation event, are valued at a fair value as determined in good faith by, or under the direction of, the Board of Trustees and in accordance with the Valuation Procedures approved by the Board of Trustees. The value of these fair valued securities may be different from the last sale price (or the mean between the last reported bid and ask prices), and there is no guarantee that a fair valued security will be sold at the price at which a Fund is carrying the security.
| June 30, 2021 | William Blair Funds | 129 |
Notes to Financial Statements (information as of June 30, 2021 is unaudited)
(b) Fair Value Measurements
Fair value is defined as the price that a Fund would receive upon selling a security in an orderly transaction to an independent buyer in the principal or most advantageous market for the investment. Various inputs are used in determining the value of a Fund’s investments. A three-tier hierarchy of inputs is used to classify fair value measurements for disclosure purposes. The three-tier hierarchy of inputs is summarized in the three broad levels listed below:
| | • | Level 1—Quoted prices (unadjusted) in active markets for an identical security. |
| | | |
| | • | Level 2—Prices determined using other significant observable inputs. Observable inputs are inputs that other market participants would use in pricing a security. These may include quoted prices for similar securities, interest rates, prepayment speeds, credit risk, and others. In addition, other observable inputs such as foreign exchange rates, benchmark securities indices and foreign futures contracts may be utilized in the valuation of certain foreign securities when significant events occur between the last sale on the foreign securities exchange and the time at which the net asset value of the Fund is calculated. |
| | | |
| | • | Level 3—Prices determined using significant unobservable inputs. In situations where quoted prices or observable inputs are unavailable (for example, when there is little or no market activity for an investment), unobservable inputs may be used. Unobservable inputs reflect the Fund’s own assumptions about the factors market participants would use in pricing an investment, and are based on the best information available. |
The inputs or methodology used for valuing an investment are not necessarily an indication of the risk associated with investing in those securities.
A description of the valuation methodologies applied to the Funds’ major categories of assets and liabilities measured at fair value on a recurring basis is as follows:
Exchange-Traded Securities
Securities traded on a national securities exchange (or reported on the NASDAQ national market), including exchange-traded funds, are stated at the last reported sales price on the day of valuation. Other securities traded in the over-the-counter market and listed securities for which no sale was reported on that date are stated at the mean between the last reported bid and ask prices. To the extent these securities are actively traded and valuation adjustments are not applied, they are categorized as Level 1 of the fair value hierarchy. Securities traded on inactive markets or valued by reference to similar instruments are generally categorized as Level 2 of the fair value hierarchy.
Fixed Income Securities
Fixed income securities including corporate, convertible and municipal bonds and notes, U.S. government agency obligations, U.S. treasury obligations, sovereign issues, bank loans, convertible preferred securities, asset-backed securities, non-U.S. bonds and commercial paper are generally valued using evaluated prices provided by an independent pricing service. The evaluated prices are formed using various market inputs that the pricing service believes accurately represent the fair value of a security at a particular point in time. The pricing service determines evaluated prices for fixed income securities using inputs including, but not limited to, recent transaction prices for such securities, dealer quotes, transaction prices for other securities with similar characteristics, collateral characteristics, credit quality, payment history, liquidity and market conditions. Securities that use similar valuation techniques and observable inputs as described above are categorized as Level 2 of the fair value hierarchy.
Repurchase Agreements
Repurchase agreements are valued at cost, which approximates fair value. Repurchase agreements are categorized as Level 2 of the fair value hierarchy.
Derivative Instruments
Listed derivatives, such as certain options and futures contracts, that are actively traded are valued based on quoted prices from the exchange on which they are traded most extensively and are categorized as Level 1 of the fair value hierarchy. OTC derivative contracts include forward foreign currency contracts, swap and certain option contracts related to interest rates, foreign currencies, the credit standing of reference entities, equity prices, or commodity prices. Depending on the product and the terms of the transaction, the fair value of OTC derivative products can be modeled by independent pricing services taking into account the counterparties’ creditworthiness and using a series of techniques, including simulation models. Many pricing models do not entail material subjectivity because the methodologies employed do not necessitate significant judgments and the pricing inputs are
| 130 | Semiannual Report | June 30, 2021 |
Notes to Financial Statements (information as of June 30, 2021 is unaudited)
observed from actively quoted markets, as is the case of forward foreign currency contracts and interest rate swaps. A substantial majority of OTC derivative products valued by a Fund using pricing models fall into this category and are categorized as Level 2 of the fair value hierarchy.
As of June 30, 2021, the value of investments in securities and other financial instruments, segregated by their hierarchical input levels used in determining fair value and by security class or other financial instruments, are shown below (in thousands).
| | | | | | Large Cap | | | Mid Cap | | | Small-Mid | |
| Investments in securities | | Growth | | | Growth | | | Growth | | | Cap Core | |
| Level 1—Quoted prices | | | | | | | | | | | | | | | | |
| Common Stocks | | $ | 321,589 | | | $ | 811,586 | | | $ | 83,678 | | | $ | 50,321 | |
| Level 2—Other significant observable inputs | | | | | | | | | | | | | | | | |
| Repurchase Agreements | | | 5,019 | | | | 6,451 | | | | 3,224 | | | | 761 | |
| Level 3—Significant unobservable inputs | | | | | | | | | | | | | | | | |
| None | | | — | | | | — | | | | — | | | | — | |
| Total investments in securities | | $ | 326,608 | | | $ | 818,037 | | | $ | 86,902 | | | $ | 51,082 | |
| | | | | | | | | | | | | |
| | | | | | Small-Mid | | | Small Cap | | | Small Cap | |
| Investments in securities | | | | | Cap Growth | | | Growth | | | Value | |
| Level 1—Quoted prices | | | | | | | | | | | | | | | | |
| Common Stocks | | | | | | $ | 3,431,806 | | | $ | 728,808 | | | $ | 47,528 | |
| Exchange-Traded Funds | | | | | | | — | | | | 7,596 | | | | — | |
| Level 2—Other significant observable inputs | | | | | | | | | | | | | | | | |
| Repurchase Agreements | | | | | | | 11,036 | | | | 3,521 | | | | 932 | |
| Level 3—Significant unobservable inputs | | | | | | | | | | | | | | | | |
| None | | | | | | | — | | | | — | | | | — | |
| Total investments in securities | | | | | | $ | 3,442,842 | | | $ | 739,925 | | | $ | 48,460 | |
| | | | | | | | | | | | | | | | | |
| | | Global | | | International | | | International | | | Institutional
International | |
| Investments in securities | | Leaders | | | Leaders | | | Growth | | | Growth | |
| Level 1—Quoted prices | | | | | | | | | | | | | | | | |
| Common Stocks | | $ | 136,752 | | | $ | 1,180,151 | | | $ | 2,326,007 | | | $ | 1,302,794 | |
| Level 2—Other significant observable inputs | | | | | | | | | | | | | | | | |
| Common Stocks | | | — | | | | — | | | | 3,146 | | | | 1,762 | |
| Repurchase Agreements | | | 1,591 | | | | 16,293 | | | | 14,005 | | | | 7,763 | |
| Level 3—Significant unobservable inputs | | | | | | | | | | | | | | | | |
| None | | | — | | | | — | | | | — | | | | — | |
| Total investments in securities | | $ | 138,343 | | | $ | 1,196,444 | | | $ | 2,343,158 | | | $ | 1,312,319 | |
| | | | | | | | | | | | | | | | | |
| | | | | | | | | | | | | | | Emerging | |
| | | International | | | Emerging | | | Emerging | | | Markets | |
| | | Small Cap | | | Markets | | | Markets | | | Small Cap | |
| Investments in securities | | Growth | | | Leaders | | | Growth | | | Growth | |
| Level 1—Quoted prices | | | | | | | | | | | | | | | | |
| Common Stocks | | $ | 350,102 | | | $ | 314,494 | | | $ | 1,257,093 | | | $ | 483,941 | |
| Level 2—Other significant observable inputs | | | | | | | | | | | | | | | | |
| Common Stocks | | | — | | | | — | | | | 3,462 | | | | 10,426 | |
| Corporate Obligations | | | — | | | | 19 | | | | — | | | | — | |
| Repurchase Agreements | | | 7,595 | | | | 29,547 | | | | — | | | | 2,969 | |
| Level 3—Significant unobservable inputs | | | | | | | | | | | | | | | | |
| None | | | — | | | | — | | | | — | | | | — | |
| Total investments in securities | | $ | 357,697 | | | $ | 344,060 | | | $ | 1,260,555 | | | $ | 497,336 | |
| June 30, 2021 | William Blair Funds | 131 |
Notes to Financial Statements (information as of June 30, 2021 is unaudited)
| Investments in securities | | Bond | | | Income | | | Low
Duration | | | Emerging
Markets
Debt | | | Macro
Allocation | |
| Assets | | | | | | | | | | | | | | | | | | | | |
| Level 1—Quoted prices | | | | | | | | | | | | | | | | | | | | |
| Exchange-Traded Funds | | $ | — | | | $ | — | | | $ | — | | | $ | — | | | $ | 145,842 | |
| Common Stocks | | | — | | | | — | | | | — | | | | — | | | | 10,704 | |
| Preferred Stocks | | | — | | | | — | | | | — | | | | — | | | | 954 | |
| Level 2—Other significant observable inputs | | | | | | | | | | | | | | | | | | | | |
| Asset-Backed Securities | | | 7,146 | | | | 2,752 | | | | 15,794 | | | | — | | | | — | |
| Commercial Paper | | | 1,100 | | | | — | | | | — | | | | — | | | | — | |
| Corporate Obligations | | | 152,704 | | | | 24,268 | | | | 51,565 | | | | — | | | | — | |
| Foreign Corporate Obligations | | | — | | | | — | | | | — | | | | 7,713 | | | | — | |
| Foreign Government Bonds | | | — | | | | — | | | | — | | | | 14,801 | | | | 27,183 | |
| Foreign Municipal Bonds | | | — | | | | — | | | | — | | | | 421 | | | | — | |
| Purchased Options | | | — | | | | — | | | | — | | | | — | | | | 561 | |
| Repurchase Agreements | | | 291 | | | | 149 | | | | — | | | | 1,443 | | | | 9,466 | |
| U.S. Government and U.S. Government Agency | | | 173,902 | | | | 24,691 | | | | 72,583 | | | | — | | | | 21,493 | |
| Level 3—Significant unobservable inputs | | | | | | | | | | | | | | | | | | | | |
| None | | | — | | | | — | | | | — | | | | — | | | | — | |
| Liabilities | | | | | | | | | | | | | | | | | | | | |
| Level 1—Quoted prices | | | | | | | | | | | | | | | | | | | | |
| None | | | — | | | | — | | | | — | | | | — | | | | — | |
| Level 2—Other significant observable inputs | | | | | | | | | | | | | | | | | | | | |
| None | | | — | | | | — | | | | — | | | | — | | | | — | |
| Level 3—Significant unobservable inputs | | | | | | | | | | | | | | | | | | | | |
| None | | | — | | | | — | | | | — | | | | — | | | | — | |
| Total investments in securities | | $ | 335,143 | | | $ | 51,860 | | | $ | 139,942 | | | $ | 24,378 | | | $ | 216,203 | |
| Other financial instruments | | | | | | | | | | | | | | | | | | | | |
| Assets | | | | | | | | | | | | | | | | | | | | |
| Level 1—Quoted prices | | | | | | | | | | | | | | | | | | | | |
| Futures Contracts | | $ | — | | | $ | — | | | $ | — | | | $ | — | | | $ | 239 | |
| Level 2—Other significant observable inputs | | | | | | | | | | | | | | | | | | | | |
| Forward Foreign Currency Contracts | | | — | | | | — | | | | — | | | | 40 | | | | 5,340 | |
| Swaps | | | — | | | | — | | | | — | | | | 43 | | | | 1,271 | |
| Level 3—Significant unobservable inputs | | | | | | | | | | | | | | | | | | | | |
| None | | | — | | | | — | | | | — | | | | — | | | | — | |
| Liabilities | | | | | | | | | | | | | | | | | | | | |
| Level 1—Quoted prices | | | | | | | | | | | | | | | | | | | | |
| Futures Contracts | | | — | | | | — | | | | — | | | | — | | | | (3,474 | ) |
| Level 2—Other significant observable inputs | | | | | | | | | | | | | | | | | | | | |
| Forward Foreign Currency Contracts | | | — | | | | — | | | | — | | | | — | | | | (3,621 | ) |
| Swaps | | | (42 | ) | | | (8 | ) | | | — | | | | (65 | ) | | | (108 | ) |
| U.S. Government Agency | | | (5,326 | ) | | | (1,065 | ) | | | (21,080 | ) | | | — | | | | — | |
| Level 3—Significant unobservable inputs | | | | | | | | | | | | | | | | | | | | |
| None | | | — | | | | — | | | | — | | | | — | | | | — | |
| Total other financial instruments | | $ | (5,368 | ) | | $ | (1,073 | ) | | $ | (21,080 | ) | | $ | 18 | | | $ | (353 | ) |
See Portfolio of Investments for Sector Classification.
| 132 | Semiannual Report | June 30, 2021 |
Notes to Financial Statements (information as of June 30, 2021 is unaudited)
(4) Transactions with Affiliates
(a) Management and Expense Limitation Agreements
Each Fund has a management agreement with the Adviser for investment management, clerical, bookkeeping and administrative services. Each Fund pays the Adviser an annual management fee, which is accrued daily and paid monthly, based on a specified percentage of the Fund’s average daily net assets. Each Fund’s annual management fee rate is as follows:
| U.S. Equity Funds | | | | |
| Growth | | | 0.75 | % |
| Large Cap Growth | | | 0.60 | % |
| Mid Cap Growth | | | 0.90 | % |
| Small-Mid Cap Core | | | 0.90 | % |
| Small-Mid Cap Growth | | | 1.00 | % |
| Small Cap Growth | | | 1.10 | % |
| Small Cap Value2 | | | 0.75 | % |
| | | | | |
| Fixed Income Funds | | | | |
| Bond | | | 0.30 | % |
| Income1: | | | | |
| First $250 million | | | 0.25 | % |
| In excess of $250 million | | | 0.20 | % |
| Low Duration | | | 0.30 | % |
| | | | | |
| Emerging Markets Debt Fund | | | | |
| Emerging Markets Debt | | | 0.65 | % |
| | | | | |
| Multi-Asset and Alternative Fund | | | | |
| Macro Allocation | | | 0.80 | % |
| | | | | |
| Global Equity Fund | | | | |
| Global Leaders | | | 0.85 | % |
| International Equity Funds | | | | |
| International Leaders | | | 0.85 | % |
| International Growth: | | | | |
| First $250 million | | | 1.10 | % |
| Next $2.25 billion | | | 1.00 | % |
| Next $2.5 billion | | | 0.975 | % |
| Next $5 billion | | | 0.95 | % |
| Next $5 billion | | | 0.925 | % |
| In excess of $15 billion | | | 0.90 | % |
| Institutional International Growth: | | | | |
| First $500 million | | | 1.00 | % |
| Next $500 million | | | 0.95 | % |
| Next $1.5 billion | | | 0.90 | % |
| Next $2.5 billion | | | 0.875 | % |
| Next $5 billion | | | 0.85 | % |
| Next $5 billion | | | 0.825 | % |
| In excess of $15 billion | | | 0.80 | % |
| International Small Cap Growth | | | 1.00 | % |
| Emerging Markets Leaders | | | 1.10 | % |
| Emerging Markets Growth | | | 1.10 | % |
| Emerging Markets Small Cap Growth | | | 1.10 | % |
| 1 | Management fee also includes a charge of 5% of gross income. |
| 2 | Prior to March 1, 2021, the Small Cap Value Fund paid a management fee at a rate of 0.95% of the Fund’s average daily net assets. Effective March 1, 2021, the management fee paid to the Adviser was reduced to 0.75%. |
| June 30, 2021 | William Blair Funds | 133 |
Notes to Financial Statements (information as of June 30, 2021 is unaudited)
The Funds have also entered into an Amended and Restated Expense Limitation Agreement with the Adviser. Under the terms of the agreement, the Adviser will waive its management fee and/or reimburse a Fund for certain operating expenses, subject to certain excluded expenses, in excess of the agreed upon rate through April 30, 2022. Excluded expenses include interest expenses, taxes, brokerage commissions, acquired fund fees and expenses, dividend and interest expenses on short sales, other investment-related costs and extraordinary expenses, such as litigation and other expenses not incurred in the ordinary course of a Fund’s business. The amount the Adviser owes a Fund as of the reporting date is recorded as Receivable from Adviser in the Statements of Assets and Liabilities. The Adviser reimburses the Funds on a monthly basis. The Adviser will waive fees and/or reimburse expenses to the extent that the total operating expenses for the stated class of the Funds, subject to certain excluded expenses, exceed the following rates (as a percentage of average daily net assets):
| | | Class N | | Class I | | Institutional/Class R6 |
| | | Effective | | Effective | | Effective | | Effective | | Effective | | Effective |
| | | May 1, 2021 | | May 1, 2020 | | May 1, 2021 | | May 1, 2020 | | May 1, 2021 | | May 1, 2020 |
| | | through | | through | | through | | through | | through | | through |
| | | April 30, | | April 30, | | April 30, | | April 30, | | April 30, | | April 30, |
| Fund | | 2022 | | 2021 | | 2022 | | 2021 | | 2022 | | 2021 |
| Growth | | | 1.20 | % | | | 1.20 | % | | | 0.95 | % | | | 0.95 | % | | | 0.90 | % | | | 0.90 | % |
| Large Cap Growth | | | 0.90 | % | | | 0.90 | % | | | 0.65 | % | | | 0.65 | % | | | 0.60 | % | | | 0.60 | % |
| Mid Cap Growth | | | 1.20 | % | | | 1.20 | % | | | 0.95 | % | | | 0.95 | % | | | 0.90 | % | | | 0.90 | % |
| Small-Mid Cap Core | | | N/A | | | | N/A | | | | 0.95 | % | | | 0.95 | % | | | 0.90 | % | | | 0.90 | % |
| Small-Mid Cap Growth | | | 1.35 | % | | | 1.35 | % | | | 1.10 | % | | | 1.10 | % | | | 1.05 | % | | | 1.05 | % |
| Small Cap Growth | | | 1.50 | % | | | 1.50 | % | | | 1.25 | % | | | 1.25 | % | | | 1.20 | % | | | 1.20 | % |
| Small Cap Value | | | 1.15 | %2 | | | 1.25 | %1 | | | 0.89 | %2 | | | 1.00 | %1 | | | 0.85 | %2 | | | 0.95 | %1 |
| Global Leaders | | | 1.15 | % | | | 1.15 | % | | | 0.90 | % | | | 0.90 | % | | | 0.85 | % | | | 0.85 | % |
| International Leaders | | | 1.15 | % | | | 1.15 | % | | | 0.90 | % | | | 0.90 | % | | | 0.85 | % | | | 0.85 | % |
| International Growth | | | 1.45 | % | | | 1.45 | % | | | 1.20 | % | | | 1.20 | % | | | 1.15 | % | | | 1.15 | % |
| Institutional International Growth | | | N/A | | | | N/A | | | | N/A | | | | N/A | | | | 1.05 | % | | | 1.05 | % |
| International Small Cap Growth | | | 1.55 | % | | | 1.55 | % | | | 1.30 | % | | | 1.30 | % | | | 1.25 | % | | | 1.25 | % |
| Emerging Markets Leaders | | | 1.40 | % | | | 1.40 | % | | | 1.15 | % | | | 1.15 | % | | | 1.10 | % | | | 1.10 | % |
| Emerging Markets Growth | | | 1.60 | % | | | 1.60 | % | | | 1.35 | % | | | 1.35 | % | | | 1.30 | % | | | 1.30 | % |
| Emerging Markets Small Cap Growth | | | 1.55 | % | | | 1.55 | % | | | 1.30 | % | | | 1.30 | % | | | 1.25 | % | | | 1.25 | % |
| Bond | | | 0.60 | % | | | 0.60 | % | | | 0.45 | % | | | 0.45 | % | | | 0.40 | % | | | 0.40 | % |
| Income | | | 0.85 | % | | | 0.85 | % | | | 0.70 | % | | | 0.70 | % | | | 0.65 | % | | | 0.65 | % |
| Low Duration | | | 0.55 | % | | | 0.55 | % | | | 0.40 | % | | | 0.40 | % | | | 0.35 | % | | | 0.35 | % |
| Emerging Markets Debt | | | N/A | | | | N/A | | | | 0.70 | %3 | | | N/A | | | | 0.65 | %3 | | | N/A | |
| Macro Allocation | | | 1.25 | % | | | 1.25 | % | | | 1.00 | % | | | 1.00 | % | | | 0.95 | % | | | 0.95 | % |
| 1 | Effective May 1, 2020 through February 28, 2021. |
| 2 | Effective March 1, 2021 through April 30, 2023. |
| 3 | Effective May 25, 2021 (Commencement of Operations). |
The fee waivers and/or expense reimbursements received by each class are reported in the Statements of Operations.
The Adviser is entitled to recoupment of previously waived fees and reimbursed expenses for a period of three years subsequent to a fund’s commencement of operations to the extent that such recoupment does not cause the fund’s annual operating expenses (after the recoupment is taken into account) to exceed both (1) the expense limit in place when such amounts were waived or reimbursed and (2) the fund’s current expense limitation. The total amounts available for recoupment as of June 30, 2021 were as follows (in thousands):
| Fund | | | Available for
Recoupment | | | | Expiration of
Recoupment | |
| Small-Mid Cap Core | | $501 | | | October 1, 2022 | |
| Emerging Markets Debt | | 20 | | | May 25, 2024 | |
| 134 | Semiannual Report | June 30, 2021 |
Notes to Financial Statements (information as of June 30, 2021 is unaudited)
(b) Underwriting and Distribution Services Agreements
Pursuant to separate Underwriting and Distribution Agreements, WBC is the principal underwriter and distributor for the continuous offering of shares of the Trust and acts as agent of the Trust in the sale of its shares. The Underwriting Agreement provides that the Distributor will use its best efforts to distribute the Trust’s shares. The Distributor is not compensated under the Underwriting Agreement.
Each Fund, except the Small-Mid Cap Core, Emerging Markets Debt and Institutional International Growth Funds, has a Distribution Agreement with WBC for distribution services to the Funds’ Class N shares. Each Fund pays WBC an annual fee, payable monthly, based on a specified percentage of its average daily net assets of Class N shares. The annual rate expressed as a percentage of average daily net assets for Class N is 0.25% for all Funds except the Bond, Income and Low Duration Funds, which is 0.15%. Pursuant to the Distribution Agreement, WBC enters into related selling group agreements with various firms at various rates for sales of the Funds’ Class N shares.
(5) Investment Transactions
Investment transactions, excluding U.S. government securities and short-term securities, for the period ended June 30, 2021, were as follows (in thousands):
| Fund | | Purchases | | | Sales | |
| Growth | | $ | 40,171 | | | $ | 53,968 | |
| Large Cap Growth | | | 131,446 | | | | 127,820 | |
| Mid Cap Growth | | | 18,616 | | | | 19,351 | |
| Small-Mid Cap Core | | | 23,810 | | | | 9,027 | |
| Small-Mid Cap Growth | | | 704,598 | | | | 890,321 | |
| Small Cap Growth | | | 190,252 | | | | 208,292 | |
| Small Cap Value | | | 5,540 | | | | 25,564 | |
| Global Leaders | | | 12,469 | | | | 9,345 | |
| International Leaders | | | 165,908 | | | | 137,945 | |
| International Growth | | | 363,749 | | | | 523,048 | |
| Institutional International Growth | | | 202,271 | | | | 321,051 | |
| International Small Cap Growth | | | 108,210 | | | | 114,566 | |
| Emerging Markets Leaders | | | 123,569 | | | | 80,504 | |
| Emerging Markets Growth | | | 379,818 | | | | 423,906 | |
| Emerging Markets Small Cap Growth | | | 296,183 | | | | 156,463 | |
| Bond | | | 97,991 | | | | 65,995 | |
| Income | | | 19,523 | | | | 31,952 | |
| Low Duration | | | 165,772 | | | | 124,360 | |
| Emerging Markets Debt(a) | | | 26,635 | | | | 3,782 | |
| Macro Allocation | | | 58,322 | | | | 170,090 | |
| (a) | For the period from May 25, 2021 (Commencement of Operations) to June 30, 2021. |
Investment transactions in U.S. government securities, excluding short-term securities, for the period ended June 30, 2021, were as follows (in thousands):
| Fund | | Purchases | | | Sales | |
| Bond | | $ | 9,071 | | | $ | 501 | |
| Income | | | 1,378 | | | | 675 | |
| Low Duration | | | 2,000 | | | | 12,234 | |
| Macro Allocation | | | — | | | | — | |
(6) Financial Derivative Instruments
Each Fund may use derivative instruments to maintain liquidity, to provide hedging, or in anticipation of changes in the composition of its portfolio holdings or as otherwise provided in each Fund’s prospectus. The Macro Allocation Fund may also use derivative instruments to implement its investment strategy and obtain desired investment exposures, including by taking long or short positions indirectly through derivative instruments such as, but not limited to, futures, swaps, options and forward
| June 30, 2021 | William Blair Funds | 135 |
Notes to Financial Statements (information as of June 30, 2021 is unaudited)
foreign currency contracts. Such long and short positions may be intended to enhance expected return, reduce expected risk, or both. For additional information regarding the asset class exposures the Macro Allocation Fund typically seeks through futures, swaps, options and forward foreign currency contracts, see the Fund’s principal investment strategy disclosure in its prospectus. The derivative instruments held as of June 30, 2021, as disclosed in each Fund’s Portfolios of Investments, are representative of each Fund’s derivative instrument trading activity during the year ended June 30, 2021.
Derivative transactions carry counterparty risk as they are based on contracts between a Fund and the applicable counterparty. For exchange-traded or cleared derivative contracts, such counterparty risk is limited due to the role of the exchange or clearinghouse. OTC derivative contracts, however, are exposed to counterparty risk in the amount of unrealized gains, net of collateral held, for the duration of the contract.
The Macro Allocation Fund is subject to certain netting arrangements through International Swaps and Derivatives Association, Inc. Master Agreements and Credit Support Annexes (“ISDAs”). The ISDAs maintain provisions for general obligations, representations, agreements, collateral and events of default or termination. The ISDAs cover certain OTC derivative securities entered into by the Macro Allocation Fund with various counterparties and allow the Macro Allocation Fund to close out and net its total exposure to a counterparty in the event of a default.
Futures Contracts
A futures contract provides for the future sale by one party and purchase by another party of a specified amount of a specific financial instrument for a specified price at a designated date, time and place. An index futures contract is an agreement pursuant to which the parties agree to take or make delivery of an amount of cash equal to the difference between the value of the index at the close of the last trading day of the contract and the price at which the index futures contract was originally written. A futures contract can be closed out prior to delivery by entering into an offsetting transaction in a matching futures contract. Although the value of an index might be a function of the value of certain specified securities, no physical delivery of those securities is made. If the offsetting purchase price is less than the original sale price, a Fund realizes a gain; if it is more, a Fund realizes a loss. Conversely, if the offsetting sale price is more than the original purchase price, a Fund realizes a gain; if it is less, a Fund realizes a loss. The transaction costs must also be included in these calculations. There can be no assurance, however, that a Fund will be able to enter into an offsetting transaction with respect to a particular futures contract at a particular time. If a Fund is not able to enter into an offsetting transaction, a Fund will continue to be required to maintain the margin deposits on the futures contract.
Upon entering into a futures contract, a Fund is required to pledge to the broker an amount of cash, U.S. government securities, or other liquid assets equal to a certain percentage of the contract amount (“initial margin deposit”). Futures contracts are marked to market daily and an appropriate payable or receivable for the change in value (“variation margin”) is recorded by a Fund and a cash payment is either made to or received from the broker each day. Gains or losses on futures contracts are recognized but not considered realized until the contracts expire or are closed and are included in the Statement of Operations.
Options
The purchase or sale of an option by a Fund involves the payment or receipt of a premium by the investor and the corresponding right or obligation, as the case may be, either to purchase or sell the underlying security, commodity, or other instrument for a specific price at a certain time or during a certain period. Purchasing options involves the risk that the underlying instrument will not change price in the manner expected, so the investor loses its premium. Writing options involves potentially greater risk because the investor is exposed to the extent of the actual price movement in the underlying security rather than only the amount of the premium paid (which could result in a potentially unlimited loss). OTC options also involve counterparty credit risk. Purchased options are shown as an asset in the Statement of Assets and Liabilities and are included in Investments in securities. Premiums received for written options are shown as a liability in the Statement of Assets and Liabilities. Realized gains and losses on the sale, expiration or assignment of an option are disclosed in the Statement of Operations.
Forward Foreign Currency Contracts
The Global Equity, International Equity, Emerging Markets Debt and Multi-Asset and Alternative Funds may enter into forward foreign currency contracts. When entering into a forward foreign currency contract, a Fund agrees to receive or deliver a fixed quantity of foreign currency for an agreed-upon price on an agreed future date. A Fund’s net equity therein, representing unrealized gain or loss on the contracts as measured by the difference between the forward foreign exchange rates at the dates of entry into the contracts and the forward rates at the reporting date, is included in the Statement of Assets and Liabilities as
| 136 | Semiannual Report | June 30, 2021 |
Notes to Financial Statements (information as of June 30, 2021 is unaudited)
unrealized appreciation/depreciation on forward foreign currency contracts. Realized and unrealized gains and losses are included in the Statement of Operations. These instruments may involve market risk, credit risk, or both kinds of risks in excess of the amount recognized in the Statement of Assets and Liabilities. Risks arise from the possible inability of counterparties to meet the terms of their contracts and from the price movements in currencies.
Swap Contracts
Swap agreements may include total return, interest rate, securities index, commodity, security, currency exchange rate, credit default index, volatility and variance swaps. Cleared swaps are transacted through futures commission merchants that are members of central clearing houses with the clearing house serving as a central counterparty similar to transactions in futures contracts. In a standard “swap” transaction, two parties agree to exchange the returns (or differentials in rates of return) earned or realized on particular predetermined investments or instruments. The gross returns to be exchanged or “swapped” between the parties are calculated with respect to a “notional amount” (i.e., the change in the value of a particular dollar amount invested, for example, at a particular interest rate, in a particular foreign currency, or in a “basket” of securities representing a particular index). Swap agreements are subject to the risk that the counterparty to the swap will default on its obligation to pay a Fund and the risk that a Fund will not be able to meet its obligations to pay the counterparty to the swap. Swap agreements may also involve fees, commissions or other costs that may reduce a Fund’s gains from a swap agreement or may cause a Fund to lose money. To the extent permitted by its investment policies and restrictions, a Fund may invest in the following types of swaps:
Credit Default Swaps—A Fund may invest in credit default swaps as a means of “buying” credit protection (i.e., attempting to mitigate the risk of default or credit quality deterioration in some portion of a Fund’s holdings) or “selling” credit protection (i.e., attempting to gain exposure to an underlying issuer’s credit quality characteristics without directly investing in that issuer). A credit default swap is a contract between a buyer and a seller of protection against a pre-defined credit event (e.g., a ratings downgrade or default) on an underlying reference obligation, which may be a single debt instrument or baskets or indices of securities. Under current regulatory requirements, a Fund may be a buyer or seller of a credit default swap. As a seller of protection on credit default swap agreements, a Fund will generally receive from the buyer of protection a fixed rate of income throughout the term of the swap provided that there is no credit event. A Fund adds leverage to its portfolio because the Fund is subject to investment exposure on the notional amount of the swap. The maximum potential amount of future payments that a Fund as a seller of protection could be required to make under a credit default swap agreement equals the notional amount of the agreement. Notional amounts of each individual credit default swap agreement outstanding as of the period end for which a Fund is the seller of protection are disclosed in the Fund’s Portfolio of Investments. These potential amounts would be partially offset by any recovery values of the respective referenced obligations, upfront payments received upon entering into the agreement, or net amounts received from the settlement of buy protection credit default swap agreements entered into by the same Fund for the same referenced entity or entities. For credit default swap contracts on credit indices, the quoted market prices and resulting values serve as an indicator of the payment performance risk. Increasing market values, in absolute terms when compared to the notional amount of the swap, typically represent deterioration of the referenced entities’ credit soundness and a greater likelihood or risk of default or other credit event occurring as defined under the terms of the swap.
Interest Rate Swap—A Fund may invest in interest rate swaps to gain or mitigate exposure to changes in interest rates. Interest rate swap agreements involve a commitment between parties to pay either a fixed interest rate or a floating interest rate based on a notional amount of principal. The parties make payments at predetermined intervals throughout the life of the swap. As a payer, a Fund would make the fixed payment and receive the floating payment. As a receiver, a Fund would make the floating payment and receive the fixed payment.
Total Return Swap—A Fund may invest in total return swaps to gain or mitigate exposure to an underlying security, or securities. Total return swap agreements may involve commitments to pay interest in exchange for the return on the underlying security, or securities. At maturity, a net cash flow is exchanged between the parties based on the total return of the underlying security, or securities, less a financing rate. As a receiver in the transaction, a Fund would receive a payment for a positive return and would make a payment for a negative return. As a payer in the transaction, a Fund would make a payment for a positive return and would receive a payment for a negative return.
Variance Swap—A Fund may invest in variance swaps in order to gain or mitigate its exposure to an underlying reference entity such as a broad based index. A variance swap is an agreement between two parties to exchange cash flows based on the measured variance of a reference entity. The payer agrees to exchange the fixed rate, which is the variance strike price of the reference entity, to the receiver for the floating rate, which is the realized variance price of the reference entity. At the time the trade is
| June 30, 2021 | William Blair Funds | 137 |
Notes to Financial Statements (information as of June 30, 2021 is unaudited)
originated, the agreed upon variance strike price is generally set so that the fair value of the swap is near zero. At maturity, a net cash flow is exchanged between the parties based on the difference between the final realized variance price of the swap and the variance strike price multiplied by the notional, or vega amount. As a receiver of the floating rate, a Fund would receive a payment if the final realized variance price is greater than the variance strike price and would make a payment if the final realized variance price is less than the variance strike price. As a payer of the floating rate, a Fund would receive a payment if the final realized variance price is less than the variance strike price and would make a payment if the final realized variance price is greater than the variance strike price.
The following table presents the value of financial derivative instruments, by Fund and primary risk exposure, as of June 30, 2021, and their respective location in the Statements of Assets and Liabilities (in thousands):
| | | Assets | | | Liabilities | |
Fund and
Primary Risk Exposure | | Statements of Assets
and Liabilities | | Value | | | Statements of Assets
and Liabilities | | Value | |
| Bond | | | | | | | | | | | | |
| Credit | | Receivable for variation margin on centrally cleared swaps(1) | | $ | — | | | Payable for variation margin on centrally cleared swaps(1) | | $ | 42 | |
| Income | | | | | | | | | | | | |
| Credit | | Receivable for variation margin on centrally cleared swaps(1) | | | — | | | Payable for variation margin on centrally cleared swaps(1) | | | 8 | |
| Emerging Markets Debt | | | | | | | | | | | |
| Credit | | Receivable for variation margin on centrally cleared swaps(1) | | | — | | | Payable for variation margin on centrally cleared swaps(1) | | | 3 | |
| Currency | | Unrealized appreciation on forward foreign currency contracts | | | 40 | | | Unrealized depreciation on forward foreign currency contracts) | | | — | |
| Interest rate | | Receivable for variation margin on centrally cleared swaps(1) | | | 43 | | | Payable for variation margin on centrally cleared swaps(1) | | | 62 | |
| Macro Allocation | | | | | | | | | | | | |
| Currency | | Unrealized appreciation on forward foreign currency contracts | | | 5,340 | | | Unrealized depreciation on forward foreign currency contracts | | | 3,621 | |
| Currency | | Investments in securities, at value | | | 237 | | | Options written, at value | | | — | |
| Equity | | Receivable for futures variation margin(1) | | | 239 | | | Payable for futures variation margin(1) | | | 3,437 | |
| Equity | | Investments in securities, at value | | | 324 | | | Options written, at value | | | — | |
| Equity | | Unrealized appreciation on swap contracts | | | 1,241 | | | Unrealized depreciation on swap contracts | | | 42 | |
| Interest rate | | Unrealized appreciation on swap contracts | | | 10 | | | Unrealized depreciation on swap contracts | | | 52 | |
| Interest rate | | Receivable for futures variation margin(1) | | | — | | | Payable for futures variation margin(1) | | | 37 | |
| Interest rate | | Receivable for variation margin on centrally cleared swaps(1) | | | 20 | | | Payable for variation margin on centrally cleared swaps(1) | | | 14 | |
| (1) | The table above includes cumulative appreciation/(depreciation) on futures contracts and centrally cleared swaps as reported in the applicable Fund’s Portfolio of Investments. Receivable/payable for variation margin on futures contracts and centrally cleared swaps as reported in the applicable Fund’s Statement of Assets and Liabilities represents the current day’s variation margin. |
| 138 | Semiannual Report | June 30, 2021 |
Notes to Financial Statements (information as of June 30, 2021 is unaudited)
The following table indicates the effect of derivatives, by Fund and primary risk exposure, in the Statements of Operations for the period ended June 30, 2021 (in thousands):
| | | Net Realized Gain (Loss) | | | Change in Net Unrealized
Appreciation (Depreciation) | |
Fund and
Primary Risk Exposure | | Statements of Operations | | Value | | | Statements of Operations | | Value | |
| Bond | | | | | | | | | | | | |
| Credit | | Swaps | | $ | (1,427 | ) | | Swaps | | $ | 836 | |
| Income | | | | | | | | | | | | |
| Credit | | Swaps | | | (460 | ) | | Swaps | | | 316 | |
| Emerging Markets Debt | | | | | | | | | | | |
| Credit | | Swaps | | | — | | | Swaps | | | (3 | ) |
| Currency | | Forward foreign currency contracts | | | 4 | | | Forward foreign currency contracts | | | 40 | |
| Interest rate | | Swaps | | | (3 | ) | | Swaps | | | (19 | ) |
| Macro Allocation | | | | | | | | | | | | |
| Credit | | Swaps | | | 76 | | | Swaps | | | (43 | ) |
| Currency | | Forward foreign currency contracts | | | (1,304 | ) | | Forward foreign currency contracts | | | 907 | |
| Currency | | Options | | | — | | | Options | | | 54 | |
| Equity | | Futures contracts | | | (19,015 | ) | | Futures contracts | | | 2,824 | |
| Equity | | Options | | | 292 | | | Options | | | 66 | |
| Equity | | Swaps | | | 923 | | | Swaps | | | 930 | |
| Interest rate | | Futures contracts | | | 428 | | | Futures contracts | | | (20 | ) |
| Interest rate | | Swaps | | | (1,264 | ) | | Swaps | | | (296 | ) |
The following table is a summary by counterparty of the derivative instruments and collateral pledged/(received) included in the Fund’s Statement of Assets and Liabilities at June 30, 2021 (in thousands):
| | | Financial Derivative Assets | | Financial Derivative Liabilities | | | | | | | | | |
| Counterparty | | Forward
Foreign
Currency
Contracts | | Purchased
Options | | Swaps | | Total | | Forward
Foreign
Currency
Contracts | | Swaps | | Total | | Net Market
Value | | Collateral
Pledged
(Received) | | Net
Exposure |
| Macro Allocation | | | | | | | | | | | | | | | | | | | | | | | | | | | | | | | | | | | | | | | |
| Citibank N.A. | | $ | 5,340 | | | $ | 237 | | | $ | — | | | $ | 5,577 | | | $ | (3,621 | ) | | $ | — | | | $ | (3,621 | ) | | $ | 1,956 | | | $ | (1,956 | )(1) | | $ | — | |
| Credit Suisse | | | — | | | | 324 | | | �� | 1,251 | | | | 1,575 | | | | — | | | | (90 | ) | | | (90 | ) | | | 1,485 | | | | (1,200 | ) | | | 285 | |
| Goldman Sachs | | | — | | | | — | | | | — | | | | — | | | | — | | | | (4 | ) | | | (4 | ) | | | (4 | ) | | | — | | | | (4 | ) |
| | | $ | 5,340 | | | $ | 561 | | | $ | 1,251 | | | $ | 7,152 | | | $ | (3,621 | ) | | $ | (94 | ) | | $ | (3,715 | ) | | | | | | | | | | | | |
| |
| Emerging Markets Debt | | | | | | | | | | | | | | | | | | | | | | | | | | | | | | | | | | | | | |
| Citibank N.A. | | $ | 40 | | | $ | — | | | $ | — | | | $ | 40 | | | $ | — | | | $ | — | | | $ | — | | | $ | 40 | | | $ | — | | | $ | 40 | |
| | | $ | 40 | | | $ | — | | | $ | — | | | $ | 40 | | | $ | — | | | $ | — | | | $ | — | | | | | | | | | | | | | |
| (1) | Does not include additional cash collateral received in the amount of $14 (in thousands). |
The net exposure represents the amount due from/(due to) the counterparty in the event of default. Any net exposure is generally due to changes in market value of the underlying derivative instruments on the last day of the period as timing of collateral movement occurs the following day.
| June 30, 2021 | William Blair Funds | 139 |
Notes to Financial Statements (information as of June 30, 2021 is unaudited)
(7) Fund Share Transactions
The following tables summarize the activity in capital shares of each Fund for the period ended June 30, 2021 (in thousands):
| | | | | | | | | | | | | | | | | | | | | | | | Class N |
| | | | | | | | | | | | Dollars | | | | | | | | | | | | Shares |
| Fund | | Sales | | | Reinvest | | | Redemptions | | | Total | | | Sales | | | Reinvest | | | Redemptions | | | Total |
| Growth | | $ | 1,012 | | | $ | — | | | $ | 6,367 | | | $ | (5,355 | ) | | | 85 | | | | — | | | | 542 | | | | (457 | ) |
| Large Cap Growth | | | 26,518 | | | | — | | | | 20,763 | | | | 5,755 | | | | 1,279 | | | | — | | | | 1,002 | | | | 277 | |
| Mid Cap Growth | | | 151 | | | | — | | | | 800 | | | | (649 | ) | | | 12 | | | | — | | | | 62 | | | | (50 | ) |
| Small-Mid Cap Growth | | | 25,254 | | | | — | | | | 96,476 | | | | (71,222 | ) | | | 724 | | | | — | | | | 2,766 | | | | (2,042 | ) |
| Small Cap Growth | | | 18,718 | | | | — | | | | 30,411 | | | | (11,693 | ) | | | 492 | | | | — | | | | 814 | | | | (322 | ) |
| Small Cap Value | | | 4,131 | | | | — | | | | 1,861 | | | | 2,270 | | | | 263 | | | | — | | | | 123 | | | | 140 | |
| Global Leaders | | | 169 | | | | — | | | | 379 | | | | (210 | ) | | | 10 | | | | — | | | | 21 | | | | (11 | ) |
| International Leaders | | | 19,182 | | | | — | | | | 5,131 | | | | 14,051 | | | | 820 | | | | — | | | | 220 | | | | 600 | |
| International Growth | | | 4,627 | | | | — | | | | 16,582 | | | | (11,955 | ) | | | 115 | | | | — | | | | 414 | | | | (299 | ) |
| International Small Cap Growth | | | 60 | | | | — | | | | 178 | | | | (118 | ) | | | 3 | | | | — | | | | 10 | | | | (7 | ) |
| Emerging Markets Leaders | | | 2,378 | | | | — | | | | 1,994 | | | | 384 | | | | 170 | | | | — | | | | 144 | | | | 26 | |
| Emerging Markets Growth | | | 25,969 | | | | — | | | | 10,873 | | | | 15,096 | | | | 1,314 | | | | — | | | | 563 | | | | 751 | |
| Emerging Markets Small Cap Growth | | | 109 | | | | — | | | | 323 | | | | (214 | ) | | | 5 | | | | — | | | | 14 | | | | (9 | ) |
| Bond | | | 7,697 | | | | 530 | | | | 7,556 | | | | 671 | | | | 729 | | | | 50 | | | | 721 | | | | 58 | |
| Income | | | 2,213 | | | | 187 | | | | 7,435 | | | | (5,035 | ) | | | 257 | | | | 22 | | | | 866 | | | | (587 | ) |
| Low Duration | | | 10,027 | | | | 154 | | | | 7,648 | | | | 2,533 | | | | 1,164 | | | | 18 | | | | 889 | | | | 293 | |
| Macro Allocation | | | 618 | | | | — | | | | 1,435 | | | | (817 | ) | | | 56 | | | | — | | | | 130 | | | | (74 | ) |
| | | | | | | | | | | | | | | | | | | | | | | | | | | | | | | | | |
| | | | | | | | | | | | | | | | | | | | | | | | Class I |
| | | | | | | | | | | | Dollars | | | | | | | | | | | | Shares |
| Fund | | Sales | | | Reinvest | | | Redemptions | | | Total | | | Sales | | | Reinvest | | | Redemptions | | | Total |
| Growth | | $ | 9,234 | | | $ | — | | | $ | 12,830 | | | $ | (3,596 | ) | | | 631 | | | | — | | | | 897 | | | | (266 | ) |
| Large Cap Growth | | | 74,022 | | | | — | | | | 73,409 | | | | 613 | | | | 3,362 | | | | — | | | | 3,325 | | | | 37 | |
| Mid Cap Growth | | | 4,437 | | | | — | | | | 4,822 | | | | (385 | ) | | | 311 | | | | — | | | | 337 | | | | (26 | ) |
| Small-Mid Cap Core | | | 5,506 | | | | — | | | | 2,232 | | | | 3,274 | | | | 373 | | | | — | | | | 154 | | | | 219 | |
| Small-Mid Cap Growth | | | 303,305 | | | | — | | | | 805,605 | | | | (502,300 | ) | | | 8,151 | | | | — | | | | 21,686 | | | | (13,535 | ) |
| Small Cap Growth | | | 46,414 | | | | — | | | | 58,249 | | | | (11,835 | ) | | | 1,079 | | | | — | | | | 1,362 | | | | (283 | ) |
| Small Cap Value | | | 1,482 | | | | — | | | | 23,538 | | | | (22,056 | ) | | | 95 | | | | — | | | | 1,588 | | | | (1,493 | ) |
| Global Leaders | | | 5,977 | | | | — | | | | 4,025 | | | | 1,952 | | | | 322 | | | | — | | | | 221 | | | | 101 | |
| International Leaders | | | 176,551 | | | | — | | | | 87,933 | | | | 88,618 | | | | 7,472 | | | | — | | | | 3,645 | | | | 3,827 | |
| International Growth | | | 40,154 | | | | — | | | | 220,204 | | | | (180,050 | ) | | | 977 | | | | — | | | | 5,327 | | | | (4,350 | ) |
| International Small Cap Growth | | | 10,366 | | | | — | | | | 19,055 | | | | (8,689 | ) | | | 577 | | | | — | | | | 1,053 | | | | (476 | ) |
| Emerging Markets Leaders | | | 9,268 | | | | — | | | | 18,088 | | | | (8,820 | ) | | | 666 | | | | — | | | | 1,323 | | | | (657 | ) |
| Emerging Markets Growth | | | 98,212 | | | | — | | | | 31,397 | | | | 66,815 | | | | 4,973 | | | | — | | | | 1,591 | | | | 3,382 | |
| Emerging Markets Small Cap Growth | | | 15,361 | | | | — | | | | 19,819 | | | | (4,458 | ) | | | 643 | | | | — | | | | 849 | | | | (206 | ) |
| Bond | | | 48,256 | | | | 2,707 | | | | 31,060 | | | | 19,903 | | | | 4,634 | | | | 260 | | | | 2,988 | | | | 1,906 | |
| Income | | | 6,973 | | | | 380 | | | | 17,617 | | | | (10,264 | ) | | | 817 | | | | 44 | | | | 2,064 | | | | (1,203 | ) |
| Low Duration | | | 38,885 | | | | 1,121 | | | | 41,014 | | | | (1,008 | ) | | | 4,515 | | | | 131 | | | | 4,777 | | | | (131 | ) |
| Emerging Markets Debt (a) | | | 1,151 | | | | 3 | | | | 3 | | | | 1,151 | | | | 115 | | | | — | | | | — | | | | 115 | |
| Macro Allocation | | | 9,378 | | | | — | | | | 90,151 | | | | (80,773 | ) | | | 854 | | | | — | | | | 8,212 | | | | (7,358 | ) |
| (a) | For the period from May 25, 2021 (Commencement of Operations) to June 30, 2021. |
| 140 | Semiannual Report | June 30, 2021 |
Notes to Financial Statements (information as of June 30, 2021 is unaudited)
| | | | | | | | | | | | | | | | | | | | | Institutional/Class R6 | |
| | | | | | | | | | | | Dollars | | | | | | | | | | | | Shares | |
| Fund | | Sales | | | Reinvest | | | Redemptions | | | Total | | | Sales | | | Reinvest | | | Redemptions | | | Total | |
| Growth | | $ | 895 | | | $ | — | | | $ | 1,061 | | | $ | (166 | ) | | | 62 | | | | — | | | | 73 | | | | (11 | ) |
| Large Cap Growth | | | 49,322 | | | | — | | | | 52,044 | | | | (2,722 | ) | | | 2,220 | | | | — | | | | 2,382 | | | | (162 | ) |
| Mid Cap Growth | | | — | | | | — | | | | — | | | | — | | | | — | | | | — | | | | — | | | | — | |
| Small-Mid Cap Core | | | 11,617 | | | | — | | | | 80 | | | | 11,537 | | | | 795 | | | | — | | | | 5 | | | | 790 | |
| Small-Mid Cap Growth | | | 216,785 | | | | — | | | | 20,652 | | | | 196,133 | | | | 5,719 | | | | — | | | | 556 | | | | 5,163 | |
| Small Cap Growth | | | 11,164 | | | | — | | | | 4,706 | | | | 6,458 | | | | 263 | | | | — | | | | 110 | | | | 153 | |
| Small Cap Value | | | 748 | | | | — | | | | 1,181 | | | | (433 | ) | | | 47 | | | | — | | | | 76 | | | | (29 | ) |
| Global Leaders | | | 1,407 | | | | — | | | | — | | | | 1,407 | | | | 81 | | | | — | | | | — | | | | 81 | |
| International Leaders | | | 35,835 | | | | — | | | | 116,145 | | | | (80,310 | ) | | | 1,554 | | | | — | | | | 4,912 | | | | (3,358 | ) |
| International Growth | | | 53,949 | | | | — | | | | 9,730 | | | | 44,219 | | | | 1,281 | | | | — | | | | 239 | | | | 1,042 | |
| Institutional International Growth | | | 29,938 | | | | — | | | | 144,198 | | | | (114,260 | ) | | | 1,425 | | | | — | | | | 6,855 | | | | (5,430 | ) |
| International Small Cap Growth | | | 18,786 | | | | — | | | | 3,787 | | | | 14,999 | | | | 998 | | | | — | | | | 208 | | | | 790 | |
| Emerging Markets Leaders | | | 110,565 | | | | — | | | | 56,917 | | | | 53,648 | | | | 7,955 | | | | — | | | | 4,122 | | | | 3,833 | |
| Emerging Markets Growth | | | 86,298 | | | | — | | | | 225,987 | | | | (139,689 | ) | | | 4,279 | | | | — | | | | 11,402 | | | | (7,123 | ) |
| Emerging Markets Small Cap Growth | | | 158,292 | | | | — | | | | 15,589 | | | | 142,703 | | | | 6,394 | | | | — | | | | 644 | | | | 5,750 | |
| Bond | | | 3,397 | | | | 712 | | | | 1,633 | | | | 2,476 | | | | 325 | | | | 68 | | | | 157 | | | | 236 | |
| Income | | | 119 | | | | 1 | | | | — | | | | 120 | | | | 14 | | | | — | | | | — | | | | 14 | |
| Low Duration | | | 7,285 | | | | 282 | | | | 25,211 | | | | (17,644 | ) | | | 849 | | | | 33 | | | | 2,938 | | | | (2,056 | ) |
| Emerging Markets Debt (a) | | | 22,806 | | | | 85 | | | | 14 | | | | 22,877 | | | | 2,281 | | | | 8 | | | | 1 | | | | 2,288 | |
| Macro Allocation | | | 400 | | | | — | | | | 63,574 | | | | (63,174 | ) | | | 37 | | | | — | | | | 5,671 | | | | (5,634 | ) |
| | | | | | | | | | | | | | | | | | | | | | | | | | | | | | | | | |
| | | | | | | | | | | | Net Change in Net Assets Relating to Fund Share Activity | |
| | | | | | | | | | | | | | | Dollars | | | | | | | | | | | | | | Shares | |
| Fund | | Sales | | | Reinvest | | | Redemptions | | | Total | | | Sales | | | Reinvest | | | Redemptions | | | Total | |
| Growth | | $ | 11,141 | | | $ | — | | | $ | 20,258 | | | $ | (9,117 | ) | | | 778 | | | | — | | | | 1,512 | | | | (734 | ) |
| Large Cap Growth | | | 149,862 | | | | — | | | | 146,216 | | | | 3,646 | | | | 6,861 | | | | — | | | | 6,709 | | | | 152 | |
| Mid Cap Growth | | | 4,588 | | | | — | | | | 5,622 | | | | (1,034 | ) | | | 323 | | | | — | | | | 399 | | | | (76 | ) |
| Small-Mid Cap Core | | | 17,123 | | | | — | | | | 2,312 | | | | 14,811 | | | | 1,168 | | | | — | | | | 159 | | | | 1,009 | |
| Small-Mid Cap Growth | | | 545,344 | | | | — | | | | 922,733 | | | | (377,389 | ) | | | 14,594 | | | | — | | | | 25,008 | | | | (10,414 | ) |
| Small Cap Growth | | | 76,296 | | | | — | | | | 93,366 | | | | (17,070 | ) | | | 1,834 | | | | — | | | | 2,286 | | | | (452 | ) |
| Small Cap Value | | | 6,361 | | | | — | | | | 26,580 | | | | (20,219 | ) | | | 405 | | | | — | | | | 1,787 | | | | (1,382 | ) |
| Global Leaders | | | 7,553 | | | | — | | | | 4,404 | | | | 3,149 | | | | 413 | | | | — | | | | 242 | | | | 171 | |
| International Leaders | | | 231,568 | | | | — | | | | 209,209 | | | | 22,359 | | | | 9,846 | | | | — | | | | 8,777 | | | | 1,069 | |
| International Growth | | | 98,730 | | | | — | | | | 246,516 | | | | (147,786 | ) | | | 2,373 | | | | — | | | | 5,980 | | | | (3,607 | ) |
| Institutional International Growth | | | 29,938 | | | | — | | | | 144,198 | | | | (114,260 | ) | | | 1,425 | | | | — | | | | 6,855 | | | | (5,430 | ) |
| International Small Cap Growth | | | 29,212 | | | | — | | | | 23,020 | | | | 6,192 | | | | 1,578 | | | | — | | | | 1,271 | | | | 307 | |
| Emerging Markets Leaders | | | 122,211 | | | | — | | | | 76,999 | | | | 45,212 | | | | 8,791 | | | | — | | | | 5,589 | | | | 3,202 | |
| Emerging Markets Growth | | | 210,479 | | | | — | | | | 268,257 | | | | (57,778 | ) | | | 10,566 | | | | — | | | | 13,556 | | | | (2,990 | ) |
| Emerging Markets Small Cap Growth | | | 173,762 | | | | — | | | | 35,731 | | | | 138,031 | | | | 7,042 | | | | — | | | | 1,507 | | | | 5,535 | |
| Bond | | | 59,350 | | | | 3,949 | | | | 40,249 | | | | 23,050 | | | | 5,688 | | | | 378 | | | | 3,866 | | | | 2,200 | |
| Income | | | 9,305 | | | | 568 | | | | 25,052 | | | | (15,179 | ) | | | 1,088 | | | | 66 | | | | 2,930 | | | | (1,776 | ) |
| Low Duration | | | 56,197 | | | | 1,557 | | | | 73,873 | | | | (16,119 | ) | | | 6,528 | | | | 182 | | | | 8,604 | | | | (1,894 | ) |
| Emerging Markets Debt (a) | | | 23,957 | | | | 88 | | | | 17 | | | | 24,028 | | | | 2,396 | | | | 8 | | | | 1 | | | | 2,403 | |
| Macro Allocation | | | 10,396 | | | | — | | | | 155,160 | | | | (144,764 | ) | | | 947 | | | | — | | | | 14,013 | | | | (13,066 | ) |
| (a) | For the period from May 25, 2021 (Commencement of Operations) to June 30, 2021. |
| June 30, 2021 | William Blair Funds | 141 |
Notes to Financial Statements (information as of June 30, 2021 is unaudited)
The following tables summarize the activity in capital shares of each Fund for the year ended December 31, 2020 (in thousands):
| | | | | | | | | | | | | | | | | | | | | | | | Class N | |
| | | | | | | | | | | | Dollars | | | | | | | | | | | | Shares | |
| Fund | | Sales | | | Reinvest | | | Redemptions | | | Total | | | Sales | | | Reinvest | | | Redemptions | | | Total | |
| Growth | | $ | 2,054 | | | $ | 4,719 | | | $ | 9,133 | | | $ | (2,360 | ) | | | 199 | | | | 428 | | | | 907 | | | | (280 | ) |
| Large Cap Growth | | | 103,916 | | | | 5,098 | | | | 72,994 | | | | 36,020 | | | | 6,564 | | | | 257 | | | | 4,199 | | | | 2,622 | |
| Mid Cap Growth | | | 580 | | | | 436 | | | | 1,290 | | | | (274 | ) | | | 58 | | | | 34 | | | | 118 | | | | (26 | ) |
| Small-Mid Cap Growth | | | 52,389 | | | | 5,571 | | | | 146,798 | | | | (88,838 | ) | | | 2,096 | | | | 172 | | | | 5,868 | | | | (3,600 | ) |
| Small Cap Growth | | | 33,285 | | | | 18,183 | | | | 79,823 | | | | (28,355 | ) | | | 1,253 | | | | 536 | | | | 3,063 | | | | (1,274 | ) |
| Small Cap Value | | | 1,442 | | | | 2,112 | | | | 5,248 | | | | (1,694 | ) | | | 132 | | | | 176 | | | | 465 | | | | (157 | ) |
| Global Leaders | | | 1,294 | | | | 1,318 | | | | 1,082 | | | | 1,530 | | | | 79 | | | | 76 | | | | 71 | | | | 84 | |
| International Leaders | | | 13,189 | | | | 140 | | | | 7,585 | | | | 5,744 | | | | 660 | | | | 6 | | | | 420 | | | | 246 | |
| International Growth | | | 35,689 | | | | 2,302 | | | | 270,854 | | | | (232,863 | ) | | | 1,431 | | | | 60 | | | | 10,703 | | | | (9,212 | ) |
| International Small Cap Growth | | | 156 | | | | 57 | | | | 1,156 | | | | (943 | ) | | | 12 | | | | 3 | | | | 101 | | | | (86 | ) |
| Emerging Markets Leaders | | | 4,442 | | | | 16 | | | | 4,880 | | | | (422 | ) | | | 432 | | | | 1 | | | | 474 | | | | (41 | ) |
| Emerging Markets Growth | | | 11,134 | | | | 382 | | | | 3,715 | | | | 7,801 | | | | 677 | | | | 21 | | | | 259 | | | | 439 | |
| Emerging Markets Small Cap Growth | | | 97 | | | | — | | | | 1,036 | | | | (939 | ) | | | 5 | | | | — | | | | 67 | | | | (62 | ) |
| Bond | | | 17,987 | | | | 1,085 | | | | 12,752 | | | | 6,320 | | | | 1,685 | | | | 102 | | | | 1,228 | | | | 559 | |
| Income | | | 9,681 | | | | 538 | | | | 7,582 | | | | 2,637 | | | | 1,117 | | | | 62 | | | | 875 | | | | 304 | |
| Low Duration | | | 21,451 | | | | 185 | | | | 9,322 | | | | 12,314 | | | | 2,468 | | | | 21 | | | | 1,074 | | | | 1,415 | |
| Macro Allocation | | | 1,054 | | | | 78 | | | | 6,566 | | | | (5,434 | ) | | | 97 | | | | 7 | | | | 602 | | | | (498 | ) |
| | | | | | | | | | | | | | | | | | | | | | | | | | | | | | | | | |
| | | | | | | | | | | | | | | | | | | | | | | | | | | | | | | Class I | |
| | | | | | | | | | | | | | | Dollars | | | | | | | | | | | | | | Shares | |
| Fund | | Sales | | | Reinvest | | | Redemptions | | | Total | | | Sales | | | Reinvest | | | Redemptions | | | Total | |
| Growth | | $ | 14,750 | | | $ | 26,685 | | | $ | 54,977 | | | $ | (13,542 | ) | | | 1,235 | | | | 1,980 | | | | 4,530 | | | | (1,315 | ) |
| Large Cap Growth | | | 219,016 | | | | 11,860 | | | | 185,086 | | | | 45,790 | | | | 12,682 | | | | 563 | | | | 9,216 | | | | 4,029 | |
| Mid Cap Growth | | | 10,548 | | | | 5,059 | | | | 17,687 | | | | (2,080 | ) | | | 885 | | | | 363 | | | | 1,472 | | | | (224 | ) |
| Small-Mid Cap Core | | | 265,306 | | | | — | | | | 236,282 | | | | 29,024 | | | | 24,899 | | | | — | | | | 23,271 | | | | 1,628 | |
| Small-Mid Cap Growth | | | 704,716 | | | | 50,709 | | | | 850,114 | | | | (94,689 | ) | | | 25,299 | | | | 1,466 | | | | 31,213 | | | | (4,448 | ) |
| Small Cap Growth | | | 53,293 | | | | 34,928 | | | | 185,988 | | | | (97,767 | ) | | | 1,750 | | | | 902 | | | | 6,319 | | | | (3,667 | ) |
| Small Cap Value | | | 13,215 | | | | 25,566 | | | | 100,768 | | | | (61,987 | ) | | | 1,144 | | | | 2,043 | | | | 9,063 | | | | (5,876 | ) |
| Global Leaders | | | 12,040 | | | | 12,211 | | | | 46,586 | | | | (22,335 | ) | | | 853 | | | | 705 | | | | 3,092 | | | | (1,534 | ) |
| International Leaders | | | 216,096 | | | | 2,810 | | | | 68,924 | | | | 149,982 | | | | 10,917 | | | | 125 | | | | 3,796 | | | | 7,246 | |
| International Growth | | | 272,612 | | | | 19,944 | | | | 417,516 | | | | (124,960 | ) | | | 10,406 | | | | 512 | | | | 13,740 | | | | (2,822 | ) |
| International Small Cap Growth | | | 23,282 | | | | 2,718 | | | | 51,685 | | | | (25,685 | ) | | | 1,680 | | | | 158 | | | | 3,837 | | | | (1,999 | ) |
| Emerging Markets Leaders | | | 15,739 | | | | 590 | | | | 10,915 | | | | 5,414 | | | | 1,480 | | | | 45 | | | | 1,115 | | | | 410 | |
| Emerging Markets Growth | | | 28,566 | | | | 4,194 | | | | 18,435 | | | | 14,325 | | | | 1,793 | | | | 230 | | | | 1,249 | | | | 774 | |
| Emerging Markets Small Cap Growth | | | 17,451 | | | | 62 | | | | 44,837 | | | | (27,324 | ) | | | 1,057 | | | | 3 | | | | 2,759 | | | | (1,699 | ) |
| Bond | | | 71,936 | | | | 5,973 | | | | 59,078 | | | | 18,831 | | | | 6,799 | | | | 567 | | | | 5,669 | | | | 1,697 | |
| Income | | | 23,843 | | | | 930 | | | | 11,163 | | | | 13,610 | | | | 2,754 | | | | 108 | | | | 1,297 | | | | 1,565 | |
| Low Duration | | | 111,572 | | | | 1,820 | | | | 46,902 | | | | 66,490 | | | | 12,854 | | | | 210 | | | | 5,414 | | | | 7,650 | |
| Macro Allocation | | | 46,704 | | | | 2,087 | | | | 218,856 | | | | (170,065 | ) | | | 4,300 | | | | 192 | | | | 20,335 | | | | (15,843 | ) |
| 142 | Semiannual Report | June 30, 2021 |
Notes to Financial Statements (information as of June 30, 2021 is unaudited)
| | | | | | | | | | | | | | | | | | | | | Institutional/Class R6 | |
| | | | | | | | | | | | Dollars | | | | | | | | | | | | Shares | |
| Fund | | Sales | | | Reinvest | | | Redemptions | | | Total | | | Sales | | | Reinvest | | | Redemptions | | | Total | |
| Growth | | $ | 11,384 | | | $ | 1,332 | | | $ | 1,426 | | | $ | 11,290 | | | | 868 | | | | 99 | | | | 105 | | | | 862 | |
| Large Cap Growth | | | 171,386 | | | | 5,663 | | | | 4,494 | | | | 172,555 | | | | 8,196 | | | | 269 | | | | 225 | | | | 8,240 | |
| Mid Cap Growth | | | 361 | | | | 42 | | | | — | | | | 403 | | | | 29 | | | | 3 | | | | — | | | | 32 | |
| Small-Mid Cap Core | | | 901 | | | | — | | | | 43 | | | | 858 | | | | 93 | | | | — | | | | 5 | | | | 88 | |
| Small-Mid Cap Growth | | | 72,243 | | | | 1,722 | | | | 15,219 | | | | 58,746 | | | | 2,470 | | | | 50 | | | | 497 | | | | 2,023 | |
| Small Cap Growth | | | 27,131 | | | | 8,907 | | | | 15,142 | | | | 20,896 | | | | 748 | | | | 230 | | | | 466 | | | | 512 | |
| Small Cap Value | | | 8,341 | | | | 200 | | | | 599 | | | | 7,942 | | | | 758 | | | | 16 | | | | 51 | | | | 723 | |
| Global Leaders | | | 3,767 | | | | 323 | | | | 50,716 | | | | (46,626 | ) | | | 263 | | | | 19 | | | | 3,336 | | | | (3,054 | ) |
| International Leaders | | | 161,317 | | | | 5,704 | | | | 68,132 | | | | 98,889 | | | | 8,186 | | | | 253 | | | | 3,738 | | | | 4,701 | |
| International Growth | | | 37,075 | | | | 1,007 | | | | 12,279 | | | | 25,803 | | | | 1,104 | | | | 26 | | | | 414 | | | | 716 | |
| Institutional International Growth | | | 148,064 | | | | 150,369 | | | | 1,102,278 | | | | (803,845 | ) | | | 8,792 | | | | 7,511 | | | | 60,324 | | | | (44,021 | ) |
| International Small Cap Growth | | | 19,209 | | | | 3,641 | | | | 35,644 | | | | (12,794 | ) | | | 1,297 | | | | 210 | | | | 2,453 | | | | (946 | ) |
| Emerging Markets Leaders | | | 40,847 | | | | 2,293 | | | | 78,532 | | | | (35,392 | ) | | | 3,598 | | | | 175 | | | | 7,041 | | | | (3,268 | ) |
| Emerging Markets Growth | | | 278,462 | | | | 39,570 | | | | 225,547 | | | | 92,485 | | | | 18,092 | | | | 2,152 | | | | 14,653 | | | | 5,591 | |
| Emerging Markets Small Cap Growth | | | 54,151 | | | | 129 | | | | 71,930 | | | | (17,650 | ) | | | 3,232 | | | | 6 | | | | 4,178 | | | | (940 | ) |
| Bond | | | 5,988 | | | | 1,653 | | | | 4,616 | | | | 3,025 | | | | 568 | | | | 157 | | | | 437 | | | | 288 | |
| Income | | | 16 | | | | 2 | | | | — | | | | 18 | | | | 2 | | | | — | | | | — | | | | 2 | |
| Low Duration | | | 33,079 | | | | 644 | | | | 29,885 | | | | 3,838 | | | | 3,815 | | | | 74 | | | | 3,442 | | | | 447 | |
| Macro Allocation | | | 28,210 | | | | 2,521 | | | | 212,589 | | | | (181,858 | ) | | | 2,528 | | | | 232 | | | | 19,934 | | | | (17,174 | ) |
| | | | | | | | | | | | | | | | | | | | | | | | | | | | | | | | | |
| | | | | | | | | | | | Net Change in Net Assets Relating to Fund Share Activity | |
| | | | | | | | | | | | | | | Dollars | | | | | | | | | | | | | | | Shares | |
| Fund | | Sales | | | Reinvest | | | Redemptions | | | Total | | | Sales | | | Reinvest | | | Redemptions | | | Total | |
| Growth | | $ | 28,188 | | | $ | 32,736 | | | $ | 65,536 | | | $ | (4,612 | ) | | | 2,302 | | | | 2,507 | | | | 5,542 | | | | (733 | ) |
| Large Cap Growth | | | 494,318 | | | | 22,621 | | | | 262,574 | | | | 254,365 | | | | 27,442 | | | | 1,089 | | | | 13,640 | | | | 14,891 | |
| Mid Cap Growth | | | 11,489 | | | | 5,537 | | | | 18,977 | | | | (1,951 | ) | | | 972 | | | | 400 | | | | 1,590 | | | | (218 | ) |
| Small-Mid Cap Core | | | 266,207 | | | | — | | | | 236,325 | | | | 29,882 | | | | 24,992 | | | | — | | | | 23,276 | | | | 1,716 | |
| Small-Mid Cap Growth | | | 829,348 | | | | 58,002 | | | | 1,012,131 | | | | (124,781 | ) | | | 29,865 | | | | 1,688 | | | | 37,578 | | | | (6,025 | ) |
| Small Cap Growth | | | 113,709 | | | | 62,018 | | | | 280,953 | | | | (105,226 | ) | | | 3,751 | | | | 1,668 | | | | 9,848 | | | | (4,429 | ) |
| Small Cap Value | | | 22,998 | | | | 27,878 | | | | 106,615 | | | | (55,739 | ) | | | 2,034 | | | | 2,235 | | | | 9,579 | | | | (5,310 | ) |
| Global Leaders | | | 17,101 | | | | 13,852 | | | | 98,384 | | | | (67,431 | ) | | | 1,195 | | | | 800 | | | | 6,499 | | | | (4,504 | ) |
| International Leaders | | | 390,602 | | | | 8,654 | | | | 144,641 | | | | 254,615 | | | | 19,763 | | | | 384 | | | | 7,954 | | | | 12,193 | |
| International Growth | | | 345,376 | | | | 23,253 | | | | 700,649 | | | | (332,020 | ) | | | 12,941 | | | | 598 | | | | 24,857 | | | | (11,318 | ) |
| Institutional International Growth | | | 148,064 | | | | 150,369 | | | | 1,102,278 | | | | (803,845 | ) | | | 8,792 | | | | 7,511 | | | | 60,324 | | | | (44,021 | ) |
| International Small Cap Growth | | | 42,647 | | | | 6,416 | | | | 88,485 | | | | (39,422 | ) | | | 2,989 | | | | 371 | | | | 6,391 | | | | (3,031 | ) |
| Emerging Markets Leaders | | | 61,028 | | | | 2,899 | | | | 94,327 | | | | (30,400 | ) | | | 5,510 | | | | 221 | | | | 8,630 | | | | (2,899 | ) |
| Emerging Markets Growth | | | 318,162 | | | | 44,146 | | | | 247,697 | | | | 114,611 | | | | 20,562 | | | | 2,403 | | | | 16,161 | | | | 6,804 | |
| Emerging Markets Small Cap Growth | | | 71,699 | | | | 191 | | | | 117,803 | | | | (45,913 | ) | | | 4,294 | | | | 9 | | | | 7,004 | | | | (2,701 | ) |
| Bond | | | 95,911 | | | | 8,711 | | | | 76,446 | | | | 28,176 | | | | 9,052 | | | | 826 | | | | 7,334 | | | | 2,544 | |
| Income | | | 33,540 | | | | 1,470 | | | | 18,745 | | | | 16,265 | | | | 3,873 | | | | 170 | | | | 2,172 | | | | 1,871 | |
| Low Duration | | | 166,102 | | | | 2,649 | | | | 86,109 | | | | 82,642 | | | | 19,137 | | | | 305 | | | | 9,930 | | | | 9,512 | |
| Macro Allocation | | | 75,968 | | | | 4,686 | | | | 438,011 | | | | (357,357 | ) | | | 6,925 | | | | 431 | | | | 40,871 | | | | (33,515 | ) |
| June 30, 2021 | William Blair Funds | 143 |
Notes to Financial Statements (information as of June 30, 2021 is unaudited)
(8) Subsequent Events
In connection with the Adviser’s acquisition of Investment Counselors of Maryland, LLC (“ICM”), the Board of Trustees of William Blair Funds and the Board of Trustees of The Advisors’ Inner Circle Fund (“AIC”) approved the reorganization of the ICM Small Company Portfolio (“Target Fund”), a series of AIC advised by ICM, into the William Blair Small Cap Value Fund (the “Reorganization”). The Reorganization occurred on July 16, 2021. The Target Fund is the accounting survivor of the Reorganization, and as a result, the William Blair Small Cap Value Fund Class I has adopted the operating and performance history of the ICM Small Company Portfolio for financial reporting purposes. The performance and accounting history for Class N and Class R6 of the reorganized William Blair Small Cap Value Fund begins effective July 19, 2021. The reorganized William Blair Small Cap Value Fund is managed by William V. Heaphy, CFA and Gary J. Merwitz, former employees of ICM, who are employees of the Adviser.
The Funds have evaluated subsequent events through the date of issuance of the Funds’ financial statements and have determined there are no other impacts to the Funds’ financial statements.
| 144 | Semiannual Report | June 30, 2021 |
Financial Highlights — For a share outstanding throughout each period
Growth Fund
| | Class N | |
| | (unaudited)
Period Ended
June 30, | | | Years Ended December 31, | |
| | | 2021 | | | 2020 | | | 2019 | | | 2018 | | | 2017 | | | 2016 | |
| Net asset value, beginning of year | | $ | 11.15 | | | $ | 9.45 | | | $ | 7.91 | | | $ | 10.27 | | | $ | 11.41 | | | $ | 12.52 | |
| Income (loss) from investment operations: | | | | | | | | | | | | | | | | | | | | | | | | |
| Net investment income (loss) | | | (0.04 | ) | | | (0.05 | ) | | | (0.03 | ) | | | (0.04 | ) | | | (0.02 | ) | | | (0.02 | ) |
| Net realized and unrealized gain (loss) on investments | | | 1.50 | | | | 3.43 | | | | 2.54 | | | | 0.75 | | | | 2.78 | | | | (0.08 | ) |
| Total from investment operations | | | 1.46 | | | | 3.38 | | | | 2.51 | | | | 0.71 | | | | 2.76 | | | | (0.10 | ) |
| Less distributions from: | | | | | | | | | | | | | | | | | | | | | | | | |
| Net investment income | | | — | | | | — | | | | — | | | | — | | | | — | | | | — | |
| Net realized gain | | | — | | | | 1.68 | | | | 0.97 | | | | 3.07 | | | | 3.90 | | | | 1.01 | |
| Total distributions | | | — | | | | 1.68 | | | | 0.97 | | | | 3.07 | | | | 3.90 | | | | 1.01 | |
| Net asset value, end of year | | $ | 12.61 | | | $ | 11.15 | | | $ | 9.45 | | | $ | 7.91 | | | $ | 10.27 | | | $ | 11.41 | |
| Total return (%)* | | | 13.09 | | | | 35.97 | | | | 31.97 | | | | 5.10 | | | | 24.35 | | | | (0.98 | ) |
| Ratios to average daily net assets (%)**: | | | | | | | | | | | | | | | | | | | | | | | | |
| Expenses, before waivers and reimbursements | | | 1.22 | | | | 1.26 | | | | 1.24 | | | | 1.22 | | | | 1.20 | | | | 1.21 | |
| Expenses, net of waivers and reimbursements | | | 1.20 | | | | 1.20 | | | | 1.20 | | | | 1.20 | | | | 1.20 | | | | 1.21 | |
| Net investment income (loss), before waivers and reimbursements | | | (0.64 | ) | | | (0.55 | ) | | | (0.35 | ) | | | (0.36 | ) | | | (0.14 | ) | | | (0.15 | ) |
| Net investment income (loss), net of waivers and reimbursements | | | (0.62 | ) | | | (0.49 | ) | | | (0.31 | ) | | | (0.34 | ) | | | (0.14 | ) | | | (0.15 | ) |
| Class N net assets at the end of the year (in thousands) | | $ | 34,360 | | | $ | 35,494 | | | $ | 32,710 | | | $ | 38,370 | | | $ | 34,886 | | | $ | 62,936 | |
| Portfolio turnover rate (%)* | | | 13 | | | | 46 | | | | 39 | | | | 46 | | | | 38 | | | | 79 | |
| | | | | | | | | | | | | | | | | | | | | | | | | |
| | Class I | |
| | (unaudited)
Period Ended
June 30, | | | Years Ended December 31, | |
| | | 2021 | | | 2020 | | | 2019 | | | 2018 | | | 2017 | | | 2016 | |
| Net asset value, beginning of year | | $ | 13.64 | | | $ | 11.25 | | | $ | 9.25 | | | $ | 11.51 | | | $ | 12.39 | | | $ | 13.50 | |
| Income (loss) from investment operations: | | | | | | | | | | | | | | | | | | | | | | | | |
| Net investment income (loss) | | | (0.02 | ) | | | (0.03 | ) | | | (0.00 | )^ | | | (0.01 | ) | | | 0.02 | | | | 0.03 | |
| Net realized and unrealized gain (loss) on investments | | | 1.83 | | | | 4.10 | | | | 2.97 | | | | 0.82 | | | | 3.02 | | | | (0.10 | ) |
| Total from investment operations | | | 1.81 | | | | 4.07 | | | | 2.97 | | | | 0.81 | | | | 3.04 | | | | (0.07 | ) |
| Less distributions from: | | | | | | | | | | | | | | | | | | | | | | | | |
| Net investment income | | | — | | | | — | | | | — | | | | 0.00 | ^ | | | 0.02 | | | | 0.03 | |
| Net realized gain | | | — | | | | 1.68 | | | | 0.97 | | | | 3.07 | | | | 3.90 | | | | 1.01 | |
| Total distributions | | | — | | | | 1.68 | | | | 0.97 | | | | 3.07 | | | | 3.92 | | | | 1.04 | |
| Net asset value, end of year | | $ | 15.45 | | | $ | 13.64 | | | $ | 11.25 | | | $ | 9.25 | | | $ | 11.51 | | | $ | 12.39 | |
| Total return (%)* | | | 13.27 | | | | 36.35 | | | | 32.32 | | | | 5.42 | | | | 24.64 | | | | (0.69 | ) |
| Ratios to average daily net assets (%)**: | | | | | | | | | | | | | | | | | | | | | | | | |
| Expenses | | | 0.89 | | | | 0.93 | | | | 0.92 | | | | 0.91 | | | | 0.92 | | | | 0.90 | |
| Net investment income (loss) | | | (0.31 | ) | | | (0.23 | ) | | | (0.03 | ) | | | (0.06 | ) | | | 0.12 | | | | 0.20 | |
| Class I net assets at the end of the year (in thousands) | | $ | 278,636 | | | $ | 249,716 | | | $ | 220,660 | | | $ | 187,306 | | | $ | 318,848 | | | $ | 514,870 | |
| Portfolio turnover rate (%)* | | | 13 | | | | 46 | | | | 39 | | | | 46 | | | | 38 | | | | 79 | |
| * | Rates are not annualized for periods less than a year. |
| ** | Rates are annualized for periods less than a year. |
| ^ | Amount is less than $0.005 per share. |
Note: Net investment income (loss) per share is based on the average shares outstanding during the year.
Performance cited represents past performance. Past performance does not guarantee future results and current performance may be lower or higher than the data quoted. Results shown are annual returns, which assume reinvestment of dividends and capital gains. Investment returns and principal will fluctuate and you may have a gain or loss when you sell shares. For the most current month-end performance information, please call 1-800-742-7272 or visit our Web site at www.williamblairfunds.com.
| June 30, 2021 | William Blair Funds | 145 |
Financial Highlights — For a share outstanding throughout each period
Growth Fund
| | | Class R6 | |
| | | (unaudited)
Period Ended
June 30, | | | Years Ended December 31, | |
| | | | 2021 | | | | 2020 | | | | 2019(a) | |
| Net asset value, beginning of year | | | $ | 13.67 | | | | $ | 11.26 | | | | $ | 11.06 | |
| Income (loss) from investment operations: | | | | | | | | | | | | | | | |
| Net investment income (loss) | | | | (0.02 | ) | | | | (0.03 | ) | | | | (0.00 | )^ |
| Net realized and unrealized gain (loss) on investments | | | | 1.84 | | | | | 4.12 | | | | | 1.17 | |
| Total from investment operations | | | | 1.82 | | | | | 4.09 | | | | | 1.17 | |
| Less distributions from: | | | | | | | | | | | | | | | |
| Net investment income | | | | — | | | | | — | | | | | — | |
| Net realized gain | | | | — | | | | | 1.68 | | | | | 0.97 | |
| Total distributions | | | | — | | | | | 1.68 | | | | | 0.97 | |
| Net asset value, end of year | | | $ | 15.49 | | | | $ | 13.67 | | | | $ | 11.26 | |
| Total return (%)* | | | | 13.31 | | | | | 36.50 | | | | | 10.75 | |
| Ratios to average daily net assets (%)**: | | | | | | | | | | | | | | | |
| Expenses | | | | 0.84 | | | | | 0.87 | | | | | 0.88 | |
| Net investment income (loss) | | | | (0.26 | ) | | | | (0.23 | ) | | | | (0.06 | ) |
| Class R6 net assets at the end of the year (in thousands) | | | $ | 13,471 | | | | $ | 12,041 | | | | $ | 217 | |
| Portfolio turnover rate (%)* | | | | 13 | | | | | 46 | | | | | 39 | |
| (a) | For the period from May 2, 2019 (Commencement of Operations) to December 31, 2019. |
| * | Rates are not annualized for periods less than a year. |
| ** | Rates are annualized for periods less than a year. |
| ^ | Amount is less than $0.005 per share. |
Note: Net investment income (loss) per share is based on the average shares outstanding during the year.
Performance cited represents past performance. Past performance does not guarantee future results and current performance may be lower or higher than the data quoted. Results shown are annual returns, which assume reinvestment of dividends and capital gains. Investment returns and principal will fluctuate and you may have a gain or loss when you sell shares. For the most current month-end performance information, please call 1-800-742-7272 or visit our Web site at www.williamblairfunds.com.
| 146 | Semiannual Report | June 30, 2021 |
Financial Highlights — For a share outstanding throughout each period
Large Cap Growth Fund
| | Class N | |
| | (unaudited)
Period Ended
June 30, | | | Years Ended December 31, | |
| | | 2021 | | | 2020 | | | 2019 | | | 2018 | | | 2017 | | | 2016 | |
| Net asset value, beginning of year | | $ | 20.03 | | | $ | 15.27 | | | $ | 11.99 | | | $ | 13.35 | | | $ | 10.26 | | | $ | 10.15 | |
| Income (loss) from investment operations: | | | | | | | | | | | | | | | | | | | | | | | | |
| Net investment income (loss) | | | (0.02 | ) | | | 0.01 | | | | 0.00 | ^ | | | (0.02 | ) | | | (0.02 | ) | | | 0.02 | |
| Net realized and unrealized gain (loss) on investments | | | 2.86 | | | | 5.52 | | | | 4.29 | | | | 0.81 | | | | 3.19 | | | | 0.18 | |
| Total from investment operations | | | 2.84 | | | | 5.53 | | | | 4.29 | | | | 0.79 | | | | 3.17 | | | | 0.20 | |
| Less distributions from: | | | | | | | | | | | | | | | | | | | | | | | | |
| Net investment income | | | — | | | | 0.00 | ^ | | | 0.01 | | | | — | | | | — | | | | 0.01 | |
| Net realized gain | | | — | | | | 0.77 | | | | 1.00 | | | | 2.15 | | | | 0.08 | | | | 0.08 | |
| Total distributions | | | — | | | | 0.77 | | | | 1.01 | | | | 2.15 | | | | 0.08 | | | | 0.09 | |
| Net asset value, end of year | | $ | 22.87 | | | $ | 20.03 | | | $ | 15.27 | | | $ | 11.99 | | | $ | 13.35 | | | $ | 10.26 | |
| Total return (%)* | | | 14.18 | | | | 36.30 | | | | 36.00 | | | | 4.96 | | | | 30.88 | | | | 1.97 | |
| Ratios to average daily net assets (%)**: | | | | | | | | | | | | | | | | | | | | | | | | |
| Expenses, before waivers and reimbursements | | | 1.05 | | | | 1.09 | | | | 1.12 | | | | 1.21 | | | | 1.19 | | | | 1.23 | |
| Expenses, net of waivers and reimbursements | | | 0.90 | | | | 0.90 | | | | 0.95 | | | | 1.05 | | | | 1.05 | | | | 1.05 | |
| Net investment income (loss), before waivers and reimbursements | | | (0.38 | ) | | | (0.15 | ) | | | (0.14 | ) | | | (0.33 | ) | | | (0.27 | ) | | | (0.01 | ) |
| Net investment income (loss), net of waivers and reimbursements | | | (0.23 | ) | | | 0.04 | | | | 0.03 | | | | (0.17 | ) | | | (0.13 | ) | | | 0.17 | |
| Class N net assets at the end of the year (in thousands) | | $ | 164,108 | | | $ | 138,152 | | | $ | 65,314 | | | $ | 41,361 | | | $ | 25,604 | | | $ | 11,860 | |
| Portfolio turnover rate (%)* | | | 17 | | | | 35 | | | | 37 | | | | 47 | | | | 29 | | | | 44 | |
| | | | | | | | | | | | | | | | | | | | | | | | | |
| | Class I | |
| | (unaudited)
Period Ended
June 30, | | | Years Ended December 31, | |
| | | | 2021 | | | | 2020 | | | | 2019 | | | | 2018 | | | | 2017 | | | | 2016 | |
| Net asset value, beginning of year | | $ | 21.29 | | | $ | 16.19 | | | $ | 12.66 | | | $ | 13.97 | | | $ | 10.70 | | | $ | 10.58 | |
| Income (loss) from investment operations: | | | | | | | | | | | | | | | | | | | | | | | | |
| Net investment income (loss) | | | 0.00 | ^ | | | 0.06 | | | | 0.04 | | | | 0.01 | | | | 0.02 | | | | 0.04 | |
| Net realized and unrealized gain (loss) on investments | | | 3.05 | | | | 5.85 | | | | 4.54 | | | | 0.85 | | | | 3.33 | | | | 0.19 | |
| Total from investment operations | | | 3.05 | | | | 5.91 | | | | 4.58 | | | | 0.86 | | | | 3.35 | | | | 0.23 | |
| Less distributions from: | | | | | | | | | | | | | | | | | | | | | | | | |
| Net investment income | | | — | | | | 0.04 | | | | 0.05 | | | | 0.02 | | | | — | | | | 0.03 | |
| Net realized gain | | | — | | | | 0.77 | | | | 1.00 | | | | 2.15 | | | | 0.08 | | | | 0.08 | |
| Total distributions | | | — | | | | 0.81 | | | | 1.05 | | | | 2.17 | | | | 0.08 | | | | 0.11 | |
| Net asset value, end of year | | $ | 24.34 | | | $ | 21.29 | | | $ | 16.19 | | | $ | 12.66 | | | $ | 13.97 | | | $ | 10.70 | |
| Total return (%)* | | | 14.33 | | | | 36.59 | | | | 36.35 | | | | 5.21 | | | | 31.29 | | | | 2.22 | |
| Ratios to average daily net assets (%)**: | | | | | | | | | | | | | | | | | | | | | | | | |
| Expenses, before waivers and reimbursements | | | 0.76 | | | | 0.80 | | | | 0.81 | | | | 0.90 | | | | 0.90 | | | | 0.91 | |
| Expenses, net of waivers and reimbursements | | | 0.65 | | | | 0.65 | | | | 0.70 | | | | 0.80 | | | | 0.80 | | | | 0.80 | |
| Net investment income (loss), before waivers and reimbursements | | | (0.09 | ) | | | 0.16 | | | | 0.16 | | | | (0.01 | ) | | | 0.03 | | | | 0.30 | |
| Net investment income (loss), net of waivers and reimbursements | | | 0.02 | | | | 0.31 | | | | 0.27 | | | | 0.09 | | | | 0.13 | | | | 0.41 | |
| Class I net assets at the end of the year (in thousands) | | $ | 455,229 | | | $ | 397,370 | | | $ | 236,930 | | | $ | 137,599 | | | $ | 177,959 | | | $ | 110,475 | |
| Portfolio turnover rate (%)* | | | 17 | | | | 35 | | | | 37 | | | | 47 | | | | 29 | | | | 44 | |
| * | Rates are not annualized for periods less than a year. |
| ** | Rates are annualized for periods less than a year. |
| ^ | Amount is less than $0.005 per share. |
Note: Net investment income (loss) per share is based on the average shares outstanding during the year.
Performance cited represents past performance. Past performance does not guarantee future results and current performance may be lower or higher than the data quoted. Results shown are annual returns, which assume reinvestment of dividends and capital gains. Investment returns and principal will fluctuate and you may have a gain or loss when you sell shares. For the most current month-end performance information, please call 1-800-742-7272 or visit our Web site at www.williamblairfunds.com.
| June 30, 2021 | William Blair Funds | 147 |
Financial Highlights — For a share outstanding throughout each period
Large Cap Growth Fund
| | Class R6 | |
| | (unaudited)
Period Ended
June 30, | | | Years Ended December 31, | |
| | | 2021 | | | | 2020 | | | | 2019(a) |
| Net asset value, beginning of year | | $ | 21.27 | | | | $ | 16.17 | | | | $ | 15.12 | |
| Income (loss) from investment operations: | | | | | | | | | | | | | | |
| Net investment income (loss) | | | 0.01 | | | | | 0.01 | | | | | 0.04 | |
| Net realized and unrealized gain (loss) on investments | | | 3.04 | | | | | 5.91 | | | | | 2.07 | |
| Total from investment operations | | | 3.05 | | | | | 5.92 | | | | | 2.11 | |
| Less distributions from: | | | | | | | | | | | | | | |
| Net investment income | | | — | | | | | 0.05 | | | | | 0.06 | |
| Net realized gain | | | — | | | | | 0.77 | | | | | 1.00 | |
| Total distributions | | | — | | | | | 0.82 | | | | | 1.06 | |
| Net asset value, end of year | | $ | 24.32 | | | | $ | 21.27 | | | | $ | 16.17 | |
| Total return (%)* | | | 14.34 | | | | | 36.70 | | | | | 14.13 | |
| Ratios to average daily net assets (%)**: | | | | | | | | | | | | | | |
| Expenses, before waivers and reimbursements | | | 0.67 | | | | | 0.70 | | | | | 0.71 | |
| Expenses, net of waivers and reimbursements | | | 0.60 | | | | | 0.60 | | | | | 0.60 | |
| Net investment income (loss), before waivers and reimbursements | | | 0.01 | | | | | (0.03 | ) | | | | 0.22 | |
| Net investment income (loss), net of waivers and reimbursements | | | 0.08 | | | | | 0.07 | | | | | 0.33 | |
| Class R6 net assets at the end of the year (in thousands) | | $ | 198,869 | | | | $ | 177,347 | | | | $ | 1,590 | |
| Portfolio turnover rate (%)* | | | 17 | | | | | 35 | | | | | 37 | |
| (a) | For the period from May 2, 2019 (Commencement of Operations) to December 31, 2019. |
| * | Rates are not annualized for periods less than a year. |
| ** | Rates are annualized for periods less than a year. |
Note: Net investment income (loss) per share is based on the average shares outstanding during the year.
Performance cited represents past performance. Past performance does not guarantee future results and current performance may be lower or higher than the data quoted. Results shown are annual returns, which assume reinvestment of dividends and capital gains. Investment returns and principal will fluctuate and you may have a gain or loss when you sell shares. For the most current month-end performance information, please call 1-800-742-7272 or visit our Web site at www.williamblairfunds.com.
| 148 | Semiannual Report | June 30, 2021 |
Financial Highlights — For a share outstanding throughout each period
Mid Cap Growth Fund
| | Class N | |
| | (unaudited)
Period Ended
June 30, | | | Years Ended December 31, | |
| | | 2021 | | | 2020 | | | 2019 | | | 2018 | | | 2017 | | | 2016 | |
| Net asset value, beginning of year | | $ | 12.89 | | | $ | 10.99 | | | $ | 8.87 | | | $ | 10.92 | | | $ | 10.69 | | | $ | 11.28 | |
| Income (loss) from investment operations: | | | | | | | | | | | | | | | | | | | | | | | | |
| Net investment income (loss) | | | (0.05 | ) | | | (0.08 | ) | | | (0.05 | ) | | | (0.06 | ) | | | (0.08 | ) | | | (0.06 | ) |
| Net realized and unrealized gain (loss) on investments | | | 0.51 | | | | 3.01 | | | | 3.22 | | | | 0.03 | | | | 2.29 | | | | 0.09 | |
| Total from investment operations | | | 0.46 | | | | 2.93 | | | | 3.17 | | | | (0.03 | ) | | | 2.21 | | | | 0.03 | |
| Less distributions from: | | | | | | | | | | | | | | | | | | | | | | | | |
| Net investment income | | | — | | | | — | | | | — | | | | — | | | | — | | | | — | |
| Net realized gain | | | — | | | | 1.03 | | | | 1.05 | | | | 2.02 | | | | 1.98 | | | | 0.62 | |
| Total distributions | | | — | | | | 1.03 | | | | 1.05 | | | | 2.02 | | | | 1.98 | | | | 0.62 | |
| Net asset value, end of year | | $ | 13.35 | | | $ | 12.89 | | | $ | 10.99 | | | $ | 8.87 | | | $ | 10.92 | | | $ | 10.69 | |
| Total return (%)* | | | 3.57 | | | | 26.80 | | | | 36.02 | | | | (1.20 | ) | | | 20.88 | | | | 0.23 | |
| Ratios to average daily net assets (%)**: | | | | | | | | | | | | | | | | | | | | | | | | |
| Expenses, before waivers and reimbursements | | | 1.47 | | | | 1.54 | | | | 1.51 | | | | 1.57 | | | | 1.49 | | | | 1.45 | |
| Expenses, net of waivers and reimbursements | | | 1.20 | | | | 1.20 | | | | 1.20 | | | | 1.23 | | | | 1.30 | | | | 1.30 | |
| Net investment income (loss), before waivers and reimbursements | | | (1.09 | ) | | | (1.06 | ) | | | (0.79 | ) | | | (0.85 | ) | | | (0.84 | ) | | | (0.68 | ) |
| Net investment income (loss), net of waivers and reimbursements | | | (0.82 | ) | | | (0.72 | ) | | | (0.48 | ) | | | (0.51 | ) | | | (0.65 | ) | | | (0.53 | ) |
| Class N net assets at the end of the year (in thousands) | | $ | 5,621 | | | $ | 6,074 | | | $ | 5,465 | | | $ | 4,944 | | | $ | 6,166 | | | $ | 16,234 | |
| Portfolio turnover rate (%)* | | | 23 | | | | 45 | | | | 43 | | | | 58 | | | | 59 | | | | 60 | |
| | | | | | | | | | | | | | | | | | | | | | | | | |
| | Class I | |
| | (unaudited)
Period Ended
June 30, | | | Years Ended December 31, | |
| | | 2021 | | | 2020 | | | 2019 | | | 2018 | | | 2017 | | | 2016 | |
| Net asset value, beginning of year | | $ | 14.13 | | | $ | 11.93 | | | $ | 9.55 | | | $ | 11.57 | | | $ | 11.20 | | | $ | 11.76 | |
| Income (loss) from investment operations: | | | | | | | | | | | | | | | | | | | | | | | | |
| Net investment income (loss) | | | (0.04 | ) | | | (0.06 | ) | | | (0.03 | ) | | | (0.03 | ) | | | (0.05 | ) | | | (0.03 | ) |
| Net realized and unrealized gain (loss) on investments | | | 0.55 | | | | 3.29 | | | | 3.46 | | | | 0.03 | | | | 2.40 | | | | 0.09 | |
| Total from investment operations | | | 0.51 | | | | 3.23 | | | | 3.43 | | | | — | | | | 2.35 | | | | 0.06 | |
| Less distributions from: | | | | | | | | | | | | | | | | | | | | | | | | |
| Net investment income | | | — | | | | — | | | | — | | | | — | | | | — | | | | — | |
| Net realized gain | | | — | | | | 1.03 | | | | 1.05 | | | | 2.02 | | | | 1.98 | | | | 0.62 | |
| Total distributions | | | — | | | | 1.03 | | | | 1.05 | | | | 2.02 | | | | 1.98 | | | | 0.62 | |
| Net asset value, end of year | | $ | 14.64 | | | $ | 14.13 | | | $ | 11.93 | | | $ | 9.55 | | | $ | 11.57 | | | $ | 11.20 | |
| Total return (%)* | | | 3.61 | | | | 27.21 | | | | 36.17 | | | | (0.86 | ) | | | 21.18 | | | | 0.48 | |
| Ratios to average daily net assets (%)**: | | | | | | | | | | | | | | | | | | | | | | | | |
| Expenses, before waivers and reimbursements | | | 1.23 | | | | 1.29 | | | | 1.28 | | | | 1.31 | | | | 1.23 | | | | 1.18 | |
| Expenses, net of waivers and reimbursements | | | 0.95 | | | | 0.95 | | | | 0.95 | | | | 0.98 | | | | 1.05 | | | | 1.05 | |
| Net investment income (loss), before waivers and reimbursements | | | (0.85 | ) | | | (0.80 | ) | | | (0.56 | ) | | | (0.58 | ) | | | (0.58 | ) | | | (0.39 | ) |
| Net investment income (loss), net of waivers and reimbursements | | | (0.57 | ) | | | (0.46 | ) | | | (0.23 | ) | | | (0.25 | ) | | | (0.40 | ) | | | (0.26 | ) |
| Class I net assets at the end of the year (in thousands) | | $ | 79,711 | | | $ | 77,273 | | | $ | 67,936 | | | $ | 51,173 | | | $ | 71,369 | | | $ | 119,424 | |
| Portfolio turnover rate (%)* | | | 23 | | | | 45 | | | | 43 | | | | 58 | | | | 59 | | | | 60 | |
| * | Rates are not annualized for periods less than a year. |
| ** | Rates are annualized for periods less than a year. |
Note: Net investment income (loss) per share is based on the average shares outstanding during the year.
Performance cited represents past performance. Past performance does not guarantee future results and current performance may be lower or higher than the data quoted. Results shown are annual returns, which assume reinvestment of dividends and capital gains. Investment returns and principal will fluctuate and you may have a gain or loss when you sell shares. For the most current month-end performance information, please call 1-800-742-7272 or visit our Web site at www.williamblairfunds.com.
| June 30, 2021 | William Blair Funds | 149 |
Financial Highlights — For a share outstanding throughout each period
Mid Cap Growth Fund
| | Class R6 | |
| | (unaudited)
Period Ended
June 30, | | | Years Ended December 31, | |
| | | 2021 | | | | 2020 | | | | 2019(a) | |
| Net asset value, beginning of year | | $ | 14.14 | | | | $ | 11.94 | | | | $ | 11.93 | |
| Income (loss) from investment operations: | | | | | | | | | | | | | | |
| Net investment income (loss) | | | (0.04 | ) | | | | (0.06 | ) | | | | (0.01 | ) |
| Net realized and unrealized gain (loss) on investments | | | 0.56 | | | | | 3.29 | | | | | 1.07 | |
| Total from investment operations | | | 0.52 | | | | | 3.23 | | | | | 1.06 | |
| Less distributions from: | | | | | | | | | | | | | | |
| Net investment income | | | — | | | | | — | | | | | — | |
| Net realized gain | | | — | | | | | 1.03 | | | | | 1.05 | |
| Total distributions | | | — | | | | | 1.03 | | | | | 1.05 | |
| Net asset value, end of year | | $ | 14.66 | | | | $ | 14.14 | | | | $ | 11.94 | |
| Total return (%)* | | | 3.68 | | | | | 27.18 | | | | | 9.10 | |
| Ratios to average daily net assets (%)**: | | | | | | | | | | | | | | |
| Expenses, before waivers and reimbursements | | | 1.11 | | | | | 1.16 | | | | | 1.14 | |
| Expenses, net of waivers and reimbursements | | | 0.90 | | | | | 0.90 | | | | | 0.90 | |
| Net investment income (loss), before waivers and reimbursements | | | (0.73 | ) | | | | (0.70 | ) | | | | (0.41 | ) |
| Net investment income (loss), net of waivers and reimbursements | | | (0.52 | ) | | | | (0.44 | ) | | | | (0.17 | ) |
| Class R6 net assets at the end of the year (in thousands) | | $ | 646 | | | | $ | 623 | | | | $ | 145 | |
| Portfolio turnover rate (%)* | | | 23 | | | | | 45 | | | | | 43 | |
| (a) | For the period from May 2, 2019 (Commencement of Operations) to December 31, 2019. |
| * | Rates are not annualized for periods less than a year. |
| ** | Rates are annualized for periods less than a year. |
Note: Net investment income (loss) per share is based on the average shares outstanding during the year.
Performance cited represents past performance. Past performance does not guarantee future results and current performance may be lower or higher than the data quoted. Results shown are annual returns, which assume reinvestment of dividends and capital gains. Investment returns and principal will fluctuate and you may have a gain or loss when you sell shares. For the most current month-end performance information, please call 1-800-742-7272 or visit our Web site at www.williamblairfunds.com.
| 150 | Semiannual Report | June 30, 2021 |
Financial Highlights — For a share outstanding throughout each period
Small-Mid Cap Core Fund
| | Class I | |
| | (unaudited)
Period Ended
June 30, | | | Years Ended December 31, | |
| | | 2021 | | | | 2020 | | | | 2019(a) | |
| Net asset value, beginning of year | | $ | 12.88 | | | | $ | 10.68 | | | | $ | 10.00 | |
| Income (loss) from investment operations: | | | | | | | | | | | | | | |
| Net investment income (loss) | | | (0.01 | ) | | | | 0.00 | ^ | | | | 0.02 | |
| Net realized and unrealized gain (loss) on investments | | | 2.37 | | | | | 2.20 | | | | | 0.67 | |
| Total from investment operations | | | 2.36 | | | | | 2.20 | | | | | 0.69 | |
| Less distributions from: | | | | | | | | | | | | | | |
| Net investment income | | | — | | | | | — | | | | | 0.01 | |
| Net realized gain | | | — | | | | | — | | | | | — | |
| Total distributions | | | — | | | | | — | | | | | 0.01 | |
| Net asset value, end of year | | $ | 15.24 | | | | $ | 12.88 | | | | $ | 10.68 | |
| Total return (%)* | | | 18.32 | | | | | 20.60 | | | | | 6.87 | |
| Ratios to average daily net assets (%)**: | | | | | | | | | | | | | | |
| Expenses, before waivers and reimbursements | | | 1.46 | | | | | 1.22 | | | | | 3.92 | |
| Expenses, net of waivers and reimbursements | | | 0.95 | | | | | 0.95 | | | | | 0.95 | |
| Net investment income (loss), before waivers and reimbursements | | | (0.69 | ) | | | | (0.27 | ) | | | | (2.23 | ) |
| Net investment income (loss), net of waivers and reimbursements | | | (0.18 | ) | | | | 0.00 | | | | | 0.74 | |
| Class N net assets at the end of the year (in thousands) | | $ | 30,517 | | | | $ | 22,958 | | | | $ | 1,655 | |
| Portfolio turnover rate (%)* | | | 23 | | | | | 244 | | | | | 12 | |
| | | | | | | | | | | | | | | |
| | Class R6 | |
| | (unaudited)
Period Ended
June 30, | | | Years Ended December 31, | |
| | | 2021 | | | | 2020 | | | | 2019(a) | |
| Net asset value, beginning of year | | $ | 12.88 | | | | $ | 10.68 | | | | $ | 10.00 | |
| Income (loss) from investment operations: | | | | | | | | | | | | | | |
| Net investment income (loss) | | | (0.01 | ) | | | | 0.01 | | | | | 0.01 | |
| Net realized and unrealized gain (loss) on investments | | | 2.38 | | | | | 2.19 | | | | | 0.68 | |
| Total from investment operations | | | 2.37 | | | | | 2.20 | | | | | 0.69 | |
| Less distributions from: | | | | | | | | | | | | | | |
| Net investment income | | | — | | | | | 0.00 | ^ | | | | 0.01 | |
| Net realized gain | | | — | | | | | — | | | | | — | |
| Total distributions | | | — | | | | | 0.00 | ^ | | | | 0.01 | |
| Net asset value, end of year | | $ | 15.25 | | | | $ | 12.88 | | | | $ | 10.68 | |
| Total return (%)* | | | 18.40 | | | | | 20.60 | | | | | 6.88 | |
| Ratios to average daily net assets (%)**: | | | | | | | | | | | | | | |
| Expenses, before waivers and reimbursements | | | 1.30 | | | | | 1.07 | | | | | 3.92 | |
| Expenses, net of waivers and reimbursements | | | 0.90 | | | | | 0.90 | | | | | 0.90 | |
| Net investment income (loss), before waivers and reimbursements | | | (0.50 | ) | | | | (0.11 | ) | | | | (2.71 | ) |
| Net investment income (loss), net of waivers and reimbursements | | | (0.10 | ) | | | | 0.06 | | | | | 0.31 | |
| Class I net assets at the end of the year (in thousands) | | $ | 20,442 | | | | $ | 7,087 | | | | $ | 4,933 | |
| Portfolio turnover rate (%)* | | | 23 | | | | | 244 | | | | | 12 | |
| (a) | For the period from October 1, 2019 (Commencement of Operations) to December 31, 2019. |
| * | Rates are not annualized for periods less than a year. |
| ** | Rates are annualized for periods less than a year. |
| ^ | Amount is less than $0.005 per share. |
Note: Net investment income (loss) per share is based on the average shares outstanding during the year.
Performance cited represents past performance. Past performance does not guarantee future results and current performance may be lower or higher than the data quoted. Results shown are annual returns, which assume reinvestment of dividends and capital gains. Investment returns and principal will fluctuate and you may have a gain or loss when you sell shares. For the most current month-end performance information, please call 1-800-742-7272 or visit our Web site at www.williamblairfunds.com.
| June 30, 2021 | William Blair Funds | 151 |
Financial Highlights — For a share outstanding throughout each period
Small-Mid Cap Growth Fund
| | Class N | |
| | (unaudited)
Period Ended
June 30, | | | Years Ended December 31, | |
| | | 2021 | | | 2020 | | | 2019 | | | 2018 | | | 2017 | | | 2016 | |
| Net asset value, beginning of year | | $ | 32.96 | | | $ | 25.41 | | | $ | 20.97 | | | $ | 23.36 | | | $ | 19.20 | | | $ | 18.53 | |
| Income (loss) from investment operations: | | | | | | | | | | | | | | | | | | | | | | | | |
| Net investment income (loss) | | | (0.18 | ) | | | (0.24 | ) | | | (0.20 | ) | | | (0.18 | ) | | | (0.16 | ) | | | (0.09 | ) |
| Net realized and unrealized gain (loss) on investments | | | 2.82 | | | | 8.37 | | | | 6.56 | | | | (0.25 | ) | | | 5.62 | | | | 1.29 | |
| Total from investment operations | | | 2.64 | | | | 8.13 | | | | 6.36 | | | | (0.43 | ) | | | 5.46 | | | | 1.20 | |
| Less distributions from: | | | | | | | | | | | | | | | | | | | | | | | | |
| Net investment income | | | — | | | | — | | | | — | | | | — | | | | — | | | | — | |
| Net realized gain | | | — | | | | 0.58 | | | | 1.92 | | | | 1.96 | | | | 1.30 | | | | 0.53 | |
| Total distributions | | | — | | | | 0.58 | | | | 1.92 | | | | 1.96 | | | | 1.30 | | | | 0.53 | |
| Net asset value, end of year | | $ | 35.60 | | | $ | 32.96 | | | $ | 25.41 | | | $ | 20.97 | | | $ | 23.36 | | | $ | 19.20 | |
| Total return (%)* | | | 8.04 | | | | 32.04 | | | | 30.41 | | | | (2.29 | ) | | | 28.57 | | | | 6.45 | |
| Ratios to average daily net assets (%)**: | | | | | | | | | | | | | | | | | | | | | | | | |
| Expenses, before waivers and reimbursements | | | 1.43 | | | | 1.45 | | | | 1.43 | | | | 1.44 | | | | 1.43 | | | | 1.43 | |
| Expenses, net of waivers and reimbursements | | | 1.35 | | | | 1.35 | | | | 1.35 | | | | 1.35 | | | | 1.35 | | | | 1.35 | |
| Net investment income (loss), before waivers and reimbursements | | | (1.11 | ) | | | (1.01 | ) | | | (0.88 | ) | | | (0.81 | ) | | | (0.82 | ) | | | (0.59 | ) |
| Net investment income (loss), net of waivers and reimbursements | | | (1.03 | ) | | | (0.91 | ) | | | (0.80 | ) | | | (0.72 | ) | | | (0.74 | ) | | | (0.51 | ) |
| Class N net assets at the end of the year (in thousands) | | $ | 267,143 | | | $ | 314,572 | | | $ | 334,017 | | | $ | 424,865 | | | $ | 228,828 | | | $ | 171,638 | |
| Portfolio turnover rate (%)* | | | 20 | | | | 55 | | | | 56 | | | | 46 | | | | 64 | | | | 66 | |
| | | | | | | | | | | | | | | | | | | | | | | | | |
| | Class I | |
| | (unaudited)
Period Ended
June 30, | | | Years Ended December 31, | |
| | | 2021 | | | 2020 | | | 2019 | | | 2018 | | | 2017 | | | 2016 | |
| Net asset value, beginning of year | | $ | 35.13 | | | $ | 26.99 | | | $ | 22.12 | | | $ | 24.48 | | | $ | 20.02 | | | $ | 19.25 | |
| Income (loss) from investment operations: | | | | | | | | | | | | | | | | | | | | | | | | |
| Net investment income (loss) | | | (0.14 | ) | | | (0.19 | ) | | | (0.14 | ) | | | (0.12 | ) | | | (0.11 | ) | | | (0.05 | ) |
| Net realized and unrealized gain (loss) on investments | | | 3.01 | | | | 8.91 | | | | 6.93 | | | | (0.28 | ) | | | 5.87 | | | | 1.35 | |
| Total from investment operations | | | 2.87 | | | | 8.72 | | | | 6.79 | | | | (0.40 | ) | | | 5.76 | | | | 1.30 | |
| Less distributions from: | | | | | | | | | | | | | | | | | | | | | | | | |
| Net investment income | | | — | | | | — | | | | — | | | | — | | | | — | | | | — | |
| Net realized gain | | | — | | | | 0.58 | | | | 1.92 | | | | 1.96 | | | | 1.30 | | | | 0.53 | |
| Total distributions | | | — | | | | 0.58 | | | | 1.92 | | | | 1.96 | | | | 1.30 | | | | 0.53 | |
| Net asset value, end of year | | $ | 38.00 | | | $ | 35.13 | | | $ | 26.99 | | | $ | 22.12 | | | $ | 24.48 | | | $ | 20.02 | |
| Total return (%)* | | | 8.17 | | | | 32.35 | | | | 30.77 | | | | (2.06 | ) | | | 28.90 | | | | 6.72 | |
| Ratios to average daily net assets (%)**: | | | | | | | | | | | | | | | | | | | | | | | | |
| Expenses, before waivers and reimbursements | | | 1.16 | | | | 1.17 | | | | 1.16 | | | | 1.16 | | | | 1.16 | | | | 1.16 | |
| Expenses, net of waivers and reimbursements | | | 1.10 | | | | 1.10 | | | | 1.10 | | | | 1.10 | | | | 1.10 | | | | 1.10 | |
| Net investment income (loss), before waivers and reimbursements | | | (0.84 | ) | | | (0.73 | ) | | | (0.59 | ) | | | (0.53 | ) | | | (0.55 | ) | | | (0.34 | ) |
| Net investment income (loss), net of waivers and reimbursements | | | (0.78 | ) | | | (0.66 | ) | | | (0.53 | ) | | | (0.47 | ) | | | (0.49 | ) | | | (0.28 | ) |
| Class I net assets at the end of the year (in thousands) | | $ | 2,881,276 | | | $ | 3,139,290 | | | $ | 2,531,823 | | | $ | 1,979,105 | | | $ | 1,576,180 | | | $ | 1,090,939 | |
| Portfolio turnover rate (%)* | | | 20 | | | | 55 | | | | 56 | | | | 46 | | | | 64 | | | | 66 | |
| * | Rates are not annualized for periods less than a year. |
| ** | Rates are annualized for periods less than a year. |
Note: Net investment income (loss) per share is based on the average shares outstanding during the year.
Performance cited represents past performance. Past performance does not guarantee future results and current performance may be lower or higher than the data quoted. Results shown are annual returns, which assume reinvestment of dividends and capital gains. Investment returns and principal will fluctuate and you may have a gain or loss when you sell shares. For the most current month-end performance information, please call 1-800-742-7272 or visit our Web site at www.williamblairfunds.com.
| 152 | Semiannual Report | June 30, 2021 |
Financial Highlights — For a share outstanding throughout each period
Small-Mid Cap Growth Fund
| | Class R6 | |
| | (unaudited)
Period Ended
June 30, | | | Years Ended December 31, | |
| | | 2021 | | | | 2020 | | | 2019(a) | |
| Net asset value, beginning of year | | $ | 35.18 | | | | $ | 27.01 | | | | $ | 26.76 | |
| Income (loss) from investment operations: | | | | | | | | | | | | | | |
| Net investment income (loss) | | | (0.13 | ) | | | | (0.17 | ) | | | | (0.09 | ) |
| Net realized and unrealized gain (loss) on investments | | | 3.01 | | | | | 8.92 | | | | | 2.26 | |
| Total from investment operations | | | 2.88 | | | | | 8.75 | | | | | 2.17 | |
| Less distributions from: | | | | | | | | | | | | | | |
| Net investment income | | | — | | | | | — | | | | | — | |
| Net realized gain | | | — | | | | | 0.58 | | | | | 1.92 | |
| Total distributions | | | — | | | | | 0.58 | | | | | 1.92 | |
| Net asset value, end of year | | $ | 38.06 | | | | $ | 35.18 | | | | $ | 27.01 | |
| Total return (%)* | | | 8.19 | | | | | 32.44 | | | | | 8.17 | |
| Ratios to average daily net assets (%)**: | | | | | | | | | | | | | | |
| Expenses | | | 1.03 | | | | | 1.05 | | | | | 1.05 | |
| Net investment income (loss) | | | (0.68 | ) | | | | (0.61 | ) | | | | (0.46 | ) |
| Class R6 net assets at the end of the year (in thousands) | | $ | 329,840 | | | | $ | 123,220 | | | | $ | 39,974 | |
| Portfolio turnover rate (%)* | | | 20 | | | | | 55 | | | | | 56 | |
| (a) | For the period from May 2, 2019 (Commencement of Operations) to December 31, 2019. |
| * | Rates are not annualized for periods less than a year. |
| ** | Rates are annualized for periods less than a year. |
Note: Net investment income (loss) per share is based on the average shares outstanding during the year.
Performance cited represents past performance. Past performance does not guarantee future results and current performance may be lower or higher than the data quoted. Results shown are annual returns, which assume reinvestment of dividends and capital gains. Investment returns and principal will fluctuate and you may have a gain or loss when you sell shares. For the most current month-end performance information, please call 1-800-742-7272 or visit our Web site at www.williamblairfunds.com.
| June 30, 2021 | William Blair Funds | 153 |
Financial Highlights — For a share outstanding throughout each period
Small Cap Growth Fund
| | Class N | |
| | (unaudited)
Period Ended
June 30, | | | Years Ended December 31, | |
| | | 2021 | | | 2020 | | | 2019 | | | 2018 | | | 2017 | | | 2016 | |
| Net asset value, beginning of year | | $ | 34.49 | | | $ | 27.75 | | | $ | 23.23 | | | $ | 26.87 | | | $ | 25.24 | | | $ | 22.47 | |
| Income (loss) from investment operations: | | | | | | | | | | | | | | | | | | | | | | | | |
| Net investment income (loss) | | | (0.22 | ) | | | (0.29 | ) | | | (0.24 | ) | | | (0.27 | ) | | | (0.25 | ) | | | (0.18 | ) |
| Net realized and unrealized gain (loss) on investments | | | 4.65 | | | | 10.86 | | | | 5.40 | | | | (0.10 | ) | | | 6.88 | | | | 4.43 | |
| Total from investment operations | | | 4.43 | | | | 10.57 | | | | 5.16 | | | | (0.37 | ) | | | 6.63 | | | | 4.25 | |
| Less distributions from: | | | | | | | | | | | | | | | | | | | | | | | | |
| Net investment income | | | — | | | | — | | | | — | | | | — | | | | — | | | | — | |
| Net realized gain | | | — | | | | 3.83 | | | | 0.64 | | | | 3.27 | | | | 5.00 | | | | 1.48 | |
| Total distributions | | | — | | | | 3.83 | | | | 0.64 | | | | 3.27 | | | | 5.00 | | | | 1.48 | |
| Net asset value, end of year | | $ | 38.92 | | | $ | 34.49 | | | $ | 27.75 | | | $ | 23.23 | | | $ | 26.87 | | | $ | 25.24 | |
| Total return (%)* | | | 12.84 | | | | 38.32 | | | | 22.26 | | | | (2.14 | ) | | | 26.70 | | | | 18.89 | |
| Ratios to average daily net assets (%)**: | | | | | | | | | | | | | | | | | | | | | | | | |
| Expenses, before waivers and reimbursements | | | 1.55 | | | | 1.58 | | | | 1.54 | | | | 1.55 | | | | 1.54 | | | | 1.55 | |
| Expenses, net of waivers and reimbursements | | | 1.50 | | | | 1.50 | | | | 1.50 | | | | 1.50 | | | | 1.50 | | | | 1.50 | |
| Net investment income (loss), before waivers and reimbursements | | | (1.26 | ) | | | (1.10 | ) | | | (0.92 | ) | | | (0.94 | ) | | | (0.93 | ) | | | (0.84 | ) |
| Net investment income (loss), net of waivers and reimbursements | | | (1.21 | ) | | | (1.02 | ) | | | (0.88 | ) | | | (0.89 | ) | | | (0.89 | ) | | | (0.79 | ) |
| Class N net assets at the end of the year (in thousands) | | $ | 191,361 | | | $ | 180,635 | | | $ | 180,706 | | | $ | 169,074 | | | $ | 146,291 | | | $ | 117,068 | |
| Portfolio turnover rate (%)* | | | 27 | | | | 71 | | | | 51 | | | | 74 | | | | 81 | | | | 90 | |
| | | | | | | | | | | | | | | | | | | | | | | | | |
| | Class I | |
| | (unaudited)
Period Ended
June 30, | | | Years Ended December 31, | |
| | | 2021 | | | 2020 | | | 2019 | | | 2018 | | | 2017 | | | 2016 | |
| Net asset value, beginning of year | | $ | 39.36 | | | $ | 31.19 | | | $ | 25.99 | | | $ | 29.61 | | | $ | 27.34 | | | $ | 24.17 | |
| Income (loss) from investment operations: | | | | | | | | | | | | | | | | | | | | | | | | |
| Net investment income (loss) | | | (0.20 | ) | | | (0.24 | ) | | | (0.19 | ) | | | (0.21 | ) | | | (0.20 | ) | | | (0.13 | ) |
| Net realized and unrealized gain (loss) on investments | | | 5.32 | | | | 12.24 | | | | 6.03 | | | | (0.14 | ) | | | 7.47 | | | | 4.78 | |
| Total from investment operations | | | 5.12 | | | | 12.00 | | | | 5.84 | | | | (0.35 | ) | | | 7.27 | | | | 4.65 | |
| Less distributions from: | | | | | | | | | | | | | | | | | | | | | | | | |
| Net investment income | | | — | | | | — | | | | — | | | | — | | | | — | | | | — | |
| Net realized gain | | | — | | | | 3.83 | | | | 0.64 | | | | 3.27 | | | | 5.00 | | | | 1.48 | |
| Total distributions | | | — | | | | 3.83 | | | | 0.64 | | | | 3.27 | | | | 5.00 | | | | 1.48 | |
| Net asset value, end of year | | $ | 44.48 | | | $ | 39.36 | | | $ | 31.19 | | | $ | 25.99 | | | $ | 29.61 | | | $ | 27.34 | |
| Total return (%)* | | | 13.01 | | | | 38.68 | | | | 22.51 | | | | (1.88 | ) | | | 26.99 | | | | 19.22 | |
| Ratios to average daily net assets (%)**: | | | | | | | | | | | | | | | | | | | | | | | | |
| Expenses, before waivers and reimbursements | | | 1.25 | | | | 1.30 | | | | 1.27 | | | | 1.25 | | | | 1.25 | | | | 1.27 | |
| Expenses, net of waivers and reimbursements | | | 1.25 | | | | 1.25 | | | | 1.25 | | | | 1.25 | | | | 1.25 | | | | 1.25 | |
| Net investment income (loss), before waivers and reimbursements | | | (0.95 | ) | | | (0.82 | ) | | | (0.65 | ) | | | (0.65 | ) | | | (0.64 | ) | | | (0.56 | ) |
| Net investment income (loss), net of waivers and reimbursements | | | (0.95 | ) | | | (0.77 | ) | | | (0.63 | ) | | | (0.65 | ) | | | (0.64 | ) | | | (0.54 | ) |
| Class I net assets at the end of the year (in thousands) | | $ | 428,670 | | | $ | 390,511 | | | $ | 423,881 | | | $ | 410,233 | | | $ | 343,119 | | | $ | 271,830 | |
| Portfolio turnover rate (%)* | | | 27 | | | | 71 | | | | 51 | | | | 74 | | | | 81 | | | | 90 | |
| * | Rates are not annualized for periods less than a year. |
| ** | Rates are annualized for periods less than a year. |
Note: Net investment income (loss) per share is based on the average shares outstanding during the year.
Performance cited represents past performance. Past performance does not guarantee future results and current performance may be lower or higher than the data quoted. Results shown are annual returns, which assume reinvestment of dividends and capital gains. Investment returns and principal will fluctuate and you may have a gain or loss when you sell shares. For the most current month-end performance information, please call 1-800-742-7272 or visit our Web site at www.williamblairfunds.com.
| 154 | Semiannual Report | June 30, 2021 |
Financial Highlights — For a share outstanding throughout each period
Small Cap Growth Fund
| | | Class R6 | |
| | | (unaudited)
Period Ended
June 30, | | | Years Ended December 31, | |
| | | | 2021 | | | | 2020 | | | | 2019(a) |
| Net asset value, beginning of year | | | $ | 39.40 | | | | $ | 31.20 | | | | $ | 31.00 | |
| Income (loss) from investment operations: | | | | | | | | | | | | | | | |
| Net investment income (loss) | | | | (0.18 | ) | | | | (0.23 | ) | | | | (0.11 | ) |
| Net realized and unrealized gain (loss) on investments | | | | 5.32 | | | | | 12.26 | | | | | 0.95 | |
| Total from investment operations | | | | 5.14 | | | | | 12.03 | | | | | 0.84 | |
| Less distributions from: | | | | | | | | | | | | | | | |
| Net investment income | | | | — | | | | | — | | | | | — | |
| Net realized gain | | | | — | | | | | 3.83 | | | | | 0.64 | |
| Total distributions | | | | — | | | | | 3.83 | | | | | 0.64 | |
| Net asset value, end of year | | | $ | 44.54 | | | | $ | 39.40 | | | | $ | 31.20 | |
| Total return (%)* | | | | 13.05 | | | | | 38.76 | | | | | 2.75 | |
| Ratios to average daily net assets (%)**: | | | | | | | | | | | | | | | |
| Expenses | | | | 1.16 | | | | | 1.19 | | | | | 1.18 | |
| Net investment income (loss) | | | | (0.86 | ) | | | | (0.71 | ) | | | | (0.51 | ) |
| Class R6 net assets at the end of the year (in thousands) | | | $ | 123,768 | | | | $ | 103,462 | | | | $ | 65,950 | |
| Portfolio turnover rate (%)* | | | | 27 | | | | | 71 | | | | | 51 | |
| (a) | For the period from May 2, 2019 (Commencement of Operations) to December 31, 2019. |
| * | Rates are not annualized for periods less than a year. |
| ** | Rates are annualized for periods less than a year. |
Note: Net investment income (loss) per share is based on the average shares outstanding during the year.
Performance cited represents past performance. Past performance does not guarantee future results and current performance may be lower or higher than the data quoted. Results shown are annual returns, which assume reinvestment of dividends and capital gains. Investment returns and principal will fluctuate and you may have a gain or loss when you sell shares. For the most current month-end performance information, please call 1-800-742-7272 or visit our Web site at www.williamblairfunds.com.
| June 30, 2021 | William Blair Funds | 155 |
Financial Highlights — For a share outstanding throughout each period
Small Cap Value Fund
| | Class N | |
| | (unaudited)
Period Ended
June 30, | | | Years Ended December 31, | |
| | | 2021 | | | 2020 | | | 2019 | | | 2018 | | | 2017 | | | 2016 | |
| Net asset value, beginning of year | | $ | 13.04 | | | $ | 17.47 | | | $ | 15.04 | | | $ | 20.15 | | | $ | 20.18 | | | $ | 16.68 | |
| Income (loss) from investment operations: | | | | | | | | | | | | | | | | | | | | | | | | |
| Net investment income (loss) | | | 0.03 | | | | 0.08 | | | | 0.09 | | | | 0.03 | | | | 0.01 | | | | 0.04 | |
| Net realized and unrealized gain (loss) on investments | | | 2.27 | | | | (1.38 | ) | | | 2.92 | | | | (3.12 | ) | | | 1.50 | | | | 4.34 | |
| Total from investment operations | | | 2.30 | | | | (1.30 | ) | | | 3.01 | | | | (3.09 | ) | | | 1.51 | | | | 4.38 | |
| Less distributions from: | | | | | | | | | | | | | | | | | | | | | | | | |
| Net investment income | | | — | | | | 0.05 | | | | 0.09 | | | | — | | | | — | | | | 0.04 | |
| Net realized gain | | | — | | | | 3.08 | | | | 0.49 | | | | 2.02 | | | | 1.54 | | | | 0.84 | |
| Total distributions | | | — | | | | 3.13 | | | | 0.58 | | | | 2.02 | | | | 1.54 | | | | 0.88 | |
| Net asset value, end of year | | $ | 15.34 | | | $ | 13.04 | | | $ | 17.47 | | | $ | 15.04 | | | $ | 20.15 | | | $ | 20.18 | |
| Total return (%)* | | | 17.64 | | | | (5.76 | ) | | | 20.09 | | | | (15.93 | ) | | | 7.57 | | | | 26.19 | |
| Ratios to average daily net assets (%)**: | | | | | | | | | | | | | | | | | | | | | | | | |
| Expenses, before waivers and reimbursements | | | 1.61 | | | | 1.71 | | | | 1.55 | | | | 1.56 | | | | 1.55 | | | | 1.53 | |
| Expenses, net of waivers and reimbursements | | | 1.18 | | | | 1.33 | | | | 1.50 | | | | 1.50 | | | | 1.50 | | | | 1.50 | |
| Net investment income (loss), before waivers and reimbursements | | | (0.05 | ) | | | 0.26 | | | | 0.49 | | | | 0.08 | | | | (0.01 | ) | | | 0.19 | |
| Net investment income (loss), net of waivers and reimbursements | | | 0.38 | | | | 0.64 | | | | 0.54 | | | | 0.14 | | | | 0.04 | | | | 0.22 | |
| Class N net assets at the end of the year (in thousands) | | $ | 10,865 | | | $ | 7,402 | | | $ | 12,672 | | | $ | 16,381 | | | $ | 29,271 | | | $ | 33,359 | |
| Portfolio turnover rate (%)* | | | 11 | | | | 64 | | | | 116 | | | | 56 | | | | 38 | | | | 33 | |
| | | | | | | | | | | | | | | | | | | | | | | | | |
| | Class I | |
| | (unaudited)
Period Ended
June 30, | | | Years Ended December 31, | |
| | | 2021 | | | 2020 | | | 2019 | | | 2018 | | | 2017 | | | 2016 | |
| Net asset value, beginning of year | | $ | 13.57 | | | $ | 18.02 | | | $ | 15.50 | | | $ | 20.70 | | | $ | 20.68 | | | $ | 17.08 | |
| Income (loss) from investment operations: | | | | | | | | | | | | | | | | | | | | | | | | |
| Net investment income (loss) | | | 0.04 | | | | 0.11 | | | | 0.14 | | | | 0.08 | | | | 0.06 | | | | 0.09 | |
| Net realized and unrealized gain (loss) on investments | | | 2.38 | | | | (1.40 | ) | | | 3.01 | | | | (3.21 | ) | | | 1.54 | | | | 4.44 | |
| Total from investment operations | | | 2.42 | | | | (1.29 | ) | | | 3.15 | | | | (3.13 | ) | | | 1.60 | | | | 4.53 | |
| Less distributions from: | | | | | | | | | | | | | | | | | | | | | | | | |
| Net investment income | | | — | | | | 0.08 | | | | 0.14 | | | | 0.05 | | | | 0.04 | | | | 0.09 | |
| Net realized gain | | | — | | | | 3.08 | | | | 0.49 | | | | 2.02 | | | | 1.54 | | | | 0.84 | |
| Total distributions | | | — | | | | 3.16 | | | | 0.63 | | | | 2.07 | | | | 1.58 | | | | 0.93 | |
| Net asset value, end of year | | $ | 15.99 | | | $ | 13.57 | | | $ | 18.02 | | | $ | 15.50 | | | $ | 20.70 | | | $ | 20.68 | |
| Total return (%)* | | | 17.83 | | | | (5.57 | ) | | | 20.45 | | | | (15.74 | ) | | | 7.85 | | | | 26.46 | |
| Ratios to average daily net assets (%)**: | | | | | | | | | | | | | | | | | | | | | | | | |
| Expenses, before waivers and reimbursements | | | 1.63 | | | | 1.48 | | | | 1.31 | | | | 1.30 | | | | 1.29 | | | | 1.29 | |
| Expenses, net of waivers and reimbursements | | | 0.93 | | | | 1.08 | | | | 1.25 | | | | 1.25 | | | | 1.25 | | | | 1.25 | |
| Net investment income (loss), before waivers and reimbursements | | | (0.13 | ) | | | 0.48 | | | | 0.74 | | | | 0.36 | | | | 0.25 | | | | 0.43 | |
| Net investment income (loss), net of waivers and reimbursements | | | 0.57 | | | | 0.88 | | | | 0.80 | | | | 0.41 | | | | 0.29 | | | | 0.47 | |
| Class I net assets at the end of the year (in thousands) | | $ | 25,982 | | | $ | 42,311 | | | $ | 162,093 | | | $ | 475,134 | | | $ | 644,749 | | | $ | 675,272 | |
| Portfolio turnover rate (%)* | | | 11 | | | | 64 | | | | 116 | | | | 56 | | | | 38 | | | | 33 | |
| * | Rates are not annualized for periods less than a year. |
| ** | Rates are annualized for periods less than a year. |
Note: Net investment income (loss) per share is based on the average shares outstanding during the year.
Performance cited represents past performance. Past performance does not guarantee future results and current performance may be lower or higher than the data quoted. Results shown are annual returns, which assume reinvestment of dividends and capital gains. Investment returns and principal will fluctuate and you may have a gain or loss when you sell shares. For the most current month-end performance information, please call 1-800-742-7272 or visit our Web site at www.williamblairfunds.com.
| 156 | Semiannual Report | June 30, 2021 |
Financial Highlights — For a share outstanding throughout each period
Small Cap Value Fund
| | | Class R6 | |
| | | (unaudited)
Period Ended
June 30, | | | Years Ended December 31, | |
| | | | 2021 | | | | 2020 | | | | 2019(a) |
| Net asset value, beginning of year | | | $ | 13.56 | | | | $ | 18.03 | | | | $ | 18.19 | |
| Income (loss) from investment operations: | | | | | | | | | | | | | | | |
| Net investment income (loss) | | | | 0.05 | | | | | 0.12 | | | | | 0.16 | |
| Net realized and unrealized gain (loss) on investments | | | | 2.37 | | | | | (1.41 | ) | | | | 0.32 | |
| Total from investment operations | | | | 2.42 | | | | | (1.29 | ) | | | | 0.48 | |
| Less distributions from: | | | | | | | | | | | | | | | |
| Net investment income | | | | — | | | | | 0.10 | | | | | 0.15 | |
| Net realized gain | | | | — | | | | | 3.08 | | | | | 0.49 | |
| Total distributions | | | | — | | | | | 3.18 | | | | | 0.64 | |
| Net asset value, end of year | | | $ | 15.98 | | | | $ | 13.56 | | | | $ | 18.03 | |
| Total return (%)* | | | | 17.85 | | | | | (5.55 | ) | | | | 2.69 | |
| Ratios to average daily net assets (%)**: | | | | | | | | | | | | | | | |
| Expenses, before waivers and reimbursements | | | | 1.24 | | | | | 1.30 | | | | | 1.17 | |
| Expenses, net of waivers and reimbursements | | | | 0.88 | | | | | 1.03 | | | | | 1.17 | |
| Net investment income (loss), before waivers and reimbursements | | | | 0.27 | | | | | 0.75 | | | | | 1.28 | |
| Net investment income (loss), net of waivers and reimbursements | | | | 0.63 | | | | | 1.02 | | | | | 1.28 | |
| Class R6 net assets at the end of the year (in thousands) | | | $ | 11,532 | | | | $ | 10,188 | | | | $ | 513 | |
| Portfolio turnover rate (%)* | | | | 11 | | | | | 64 | | | | | 116 | |
| (a) | For the period from May 2, 2019 (Commencement of Operations) to December 31, 2019. |
| * | Rates are not annualized for periods less than a year. |
| ** | Rates are annualized for periods less than a year. |
Note: Net investment income (loss) per share is based on the average shares outstanding during the year.
Performance cited represents past performance. Past performance does not guarantee future results and current performance may be lower or higher than the data quoted. Results shown are annual returns, which assume reinvestment of dividends and capital gains. Investment returns and principal will fluctuate and you may have a gain or loss when you sell shares. For the most current month-end performance information, please call 1-800-742-7272 or visit our Web site at www.williamblairfunds.com.
| June 30, 2021 | William Blair Funds | 157 |
Financial Highlights — For a share outstanding throughout each period
Global Leaders Fund
| | Class N | |
| | (unaudited)
Period Ended
June 30, | | | Years Ended December 31, | |
| | | 2021 | | | 2020 | | | 2019 | | | 2018 | | | 2017 | | | 2016 | |
| Net asset value, beginning of year | | $ | 17.41 | | | $ | 14.92 | | | $ | 11.47 | | | $ | 14.53 | | | $ | 11.60 | | | $ | 11.58 | |
| Income (loss) from investment operations: | | | | | | | | | | | | | | | | | | | | | | | | |
| Net investment income (loss) | | | (0.04 | ) | | | (0.06 | ) | | | 0.01 | | | | 0.02 | | | | 0.05 | | | | 0.03 | |
| Net realized and unrealized gain (loss) on investments | | | 1.92 | | | | 4.74 | | | | 3.61 | | | | (1.12 | ) | | | 3.46 | | | | 0.04 | |
| Total from investment operations | | | 1.88 | | | | 4.68 | | | | 3.62 | | | | (1.10 | ) | | | 3.51 | | | | 0.07 | |
| Less distributions from: | | | | | | | | | | | | | | | | | | | | | | | | |
| Net investment income | | | — | | | | — | | | | 0.03 | | | | — | | | | 0.10 | | | | — | |
| Net realized gain | | | — | | | | 2.19 | | | | 0.14 | | | | 1.96 | | | | 0.48 | | | | 0.05 | |
| Total distributions | | | — | | | | 2.19 | | | | 0.17 | | | | 1.96 | | | | 0.58 | | | | 0.05 | |
| Net asset value, end of year | | $ | 19.29 | | | $ | 17.41 | | | $ | 14.92 | | | $ | 11.47 | | | $ | 14.53 | | | $ | 11.60 | |
| Total return (%)* | | | 10.80 | | | | 31.50 | | | | 31.57 | | | | (8.23 | ) | | | 30.31 | | | | 0.62 | |
| Ratios to average daily net assets (%)**: | | | | | | | | | | | | | | | | | | | | | | | | |
| Expenses, before waivers and reimbursements | | | 1.40 | | | | 1.45 | | | | 1.39 | | | | 1.47 | | | | 1.63 | | | | 1.62 | |
| Expenses, net of waivers and reimbursements | | | 1.15 | | | | 1.15 | | | | 1.20 | | | | 1.33 | | | | 1.37 | | | | 1.36 | |
| Net investment income (loss), before waivers and reimbursements | | | (0.65 | ) | | | (0.67 | ) | | | (0.10 | ) | | | (0.01 | ) | | | 0.09 | | | | (0.03 | ) |
| Net investment income (loss), net of waivers and reimbursements | | | (0.40 | ) | | | (0.37 | ) | | | 0.09 | | | | 0.13 | | | | 0.35 | | | | 0.23 | |
| Class N net assets at the end of the year (in thousands) | | $ | 12,925 | | | $ | 11,861 | | | $ | 8,910 | | | $ | 7,225 | | | $ | 7,761 | | | $ | 5,760 | |
| Portfolio turnover rate (%)* | | | 7 | | | | 27 | | | | 27 | | | | 49 | | | | 41 | | | | 75 | |
| | | | | | | | | | | | | | | | | | | | | | | | | |
| | Class I | |
| | (unaudited)
Period Ended
June 30, | | | Years Ended December 31, | |
| | | 2021 | | | 2020 | | | 2019 | | | 2018 | | | 2017 | | | 2016 | |
| Net asset value, beginning of year | | $ | 17.47 | | | $ | 14.93 | | | $ | 11.47 | | | $ | 14.56 | | | $ | 11.62 | | | $ | 11.59 | |
| Income (loss) from investment operations: | | | | | | | | | | | | | | | | | | | | | | | | |
| Net investment income (loss) | | | (0.01 | ) | | | (0.01 | ) | | | 0.05 | | | | 0.06 | | | | 0.09 | | | | 0.06 | |
| Net realized and unrealized gain (loss) on investments | | | 1.92 | | | | 4.74 | | | | 3.61 | | | | (1.13 | ) | | | 3.47 | | | | 0.05 | |
| Total from investment operations | | | 1.91 | | | | 4.73 | | | | 3.66 | | | | (1.07 | ) | | | 3.56 | | | | 0.11 | |
| Less distributions from: | | | | | | | | | | | | | | | | | | | | | | | | |
| Net investment income | | | — | | | | 0.00^ | | | | 0.06 | | | | 0.06 | | | | 0.14 | | | | 0.03 | |
| Net realized gain | | | — | | | | 2.19 | | | | 0.14 | | | | 1.96 | | | | 0.48 | | | | 0.05 | |
| Total distributions | | | — | | | | 2.19 | | | | 0.20 | | | | 2.02 | | | | 0.62 | | | | 0.08 | |
| Net asset value, end of year | | $ | 19.38 | | | $ | 17.47 | | | $ | 14.93 | | | $ | 11.47 | | | $ | 14.56 | | | $ | 11.62 | |
| Total return (%)* | | | 10.93 | | | | 31.86 | | | | 31.96 | | | | (8.06 | ) | | | 30.69 | | | | 0.98 | |
| Ratios to average daily net assets (%)**: | | | | | | | | | | | | | | | | | | | | | | | | |
| Expenses, before waivers and reimbursements | | | 1.09 | | | | 1.12 | | | | 1.07 | | | | 1.15 | | | | 1.33 | | | | 1.31 | |
| Expenses, net of waivers and reimbursements | | | 0.90 | | | | 0.90 | | | | 0.95 | | | | 1.07 | | | | 1.07 | | | | 1.05 | |
| Net investment income (loss), before waivers and reimbursements | | | (0.34 | ) | | | (0.31 | ) | | | 0.22 | | | | 0.31 | | | | 0.39 | | | | 0.28 | |
| Net investment income (loss), net of waivers and reimbursements | | | (0.15 | ) | | | (0.09 | ) | | | 0.34 | | | | 0.39 | | | | 0.65 | | | | 0.54 | |
| Class I net assets at the end of the year (in thousands) | | $ | 121,059 | | | $ | 107,375 | | | $ | 114,666 | | | $ | 83,790 | | | $ | 60,067 | | | $ | 45,772 | |
| Portfolio turnover rate (%)* | | | 7 | | | | 27 | | | | 27 | | | | 49 | | | | 41 | | | | 75 | |
| * | Rates are not annualized for periods less than a year. |
| ** | Rates are annualized for periods less than a year. |
| ^ | Amount is less than $0.005 per share. |
Note: Net investment income (loss) per share is based on the average shares outstanding during the year.
Performance cited represents past performance. Past performance does not guarantee future results and current performance may be lower or higher than the data quoted. Results shown are annual returns, which assume reinvestment of dividends and capital gains. Investment returns and principal will fluctuate and you may have a gain or loss when you sell shares. For the most current month-end performance information, please call 1-800-742-7272 or visit our Web site at www.williamblairfunds.com.
| 158 | Semiannual Report | June 30, 2021 |
Financial Highlights — For a share outstanding throughout each period
Global Leaders Fund
| | Class R6 | |
| | (unaudited)
Period Ended
June 30, | | | Years Ended December 31, | |
| | | | 2021 | | | | 2020 | | | | 2019 | | | | 2018 | | | | 2017 | | | | 2016 | |
| Net asset value, beginning of year | | $ | 17.47 | | | $ | 14.93 | | | $ | 11.47 | | | $ | 14.56 | | | $ | 11.62 | | | $ | 11.59 | |
| Income (loss) from investment operations: | | | | | | | | | | | | | | | | | | | | | | | | |
| Net investment income (loss) | | | (0.01 | ) | | | 0.02 | | | | 0.06 | | | | 0.07 | | | | 0.10 | | | | 0.07 | |
| Net realized and unrealized gain (loss) on investments | | | 1.93 | | | | 4.72 | | | | 3.61 | | | | (1.13 | ) | | | 3.47 | | | | 0.05 | |
| Total from investment operations | | | 1.92 | | | | 4.74 | | | | 3.67 | | | | (1.06 | ) | | | 3.57 | | | | 0.12 | |
| Less distributions from: | | | | | | | | | | | | | | | | | | | | | | | | |
| Net investment income | | | — | | | | 0.01 | | | | 0.07 | | | | 0.07 | | | | 0.15 | | | | 0.04 | |
| Net realized gain | | | — | | | | 2.19 | | | | 0.14 | | | | 1.96 | | | | 0.48 | | | | 0.05 | |
| Total distributions | | | — | | | | 2.20 | | | | 0.21 | | | | 2.03 | | | | 0.63 | | | | 0.09 | |
| Net asset value, end of year | | $ | 19.39 | | | $ | 17.47 | | | $ | 14.93 | | | $ | 11.47 | | | $ | 14.56 | | | $ | 11.62 | |
| Total return (%)* | | | 10.99 | | | | 31.91 | | | | 32.02 | | | | (7.99 | ) | | | 30.78 | | | | 1.03 | |
| Ratios to average daily net assets (%)**: | | | | | | | | | | | | | | | | | | | | | | | | |
| Expenses, before waivers and reimbursements | | | 1.01 | | | | 1.06 | | | | 1.01 | | | | 1.08 | | | | 1.10 | | | | 1.11 | |
| Expenses, net of waivers and reimbursements | | | 0.85 | | | | 0.85 | | | | 0.90 | | | | 1.00 | | | | 1.00 | | | | 1.00 | |
| Net investment income (loss), before waivers and reimbursements | | | (0.22 | ) | | | (0.10 | ) | | | 0.32 | | | | 0.39 | | | | 0.65 | | | | 0.48 | |
| Net investment income (loss), net of waivers and reimbursements | | | (0.06 | ) | | | 0.11 | | | | 0.43 | | | | 0.47 | | | | 0.75 | | | | 0.59 | |
| Class R6 net assets at the end of the year (in thousands) | | $ | 4,844 | | | $ | 2,946 | | | $ | 48,133 | | | $ | 79,685 | | | $ | 143,521 | | | $ | 125,199 | |
| Portfolio turnover rate (%)* | | | 7 | | | | 27 | | | | 27 | | | | 49 | | | | 41 | | | | 75 | |
| * | Rates are not annualized for periods less than a year. |
| ** | Rates are annualized for periods less than a year. |
Note: Net investment income (loss) per share is based on the average shares outstanding during the year.
Performance cited represents past performance. Past performance does not guarantee future results and current performance may be lower or higher than the data quoted. Results shown are annual returns, which assume reinvestment of dividends and capital gains. Investment returns and principal will fluctuate and you may have a gain or loss when you sell shares. For the most current month-end performance information, please call 1-800-742-7272 or visit our Web site at www.williamblairfunds.com.
| June 30, 2021 | William Blair Funds | 159 |
Financial Highlights — For a share outstanding throughout each period
International Leaders Fund
| | Class N | |
| | (unaudited)
Period Ended
June 30, | | | Years Ended December 31, | |
| | | 2021 | | | 2020 | | | 2019 | | | 2018 | | | 2017 | | | 2016 | |
| Net asset value, beginning of year | | $ | 22.69 | | | $ | 18.08 | | | $ | 13.80 | | | $ | 16.37 | | | $ | 12.88 | | | $ | 12.89 | |
| Income (loss) from investment operations: | | | | | | | | | | | | | | | | | | | | | | | | |
| Net investment income (loss) | | | (0.02 | ) | | | (0.04 | ) | | | 0.09 | | | | 0.13 | | | | 0.11 | | | | 0.03 | |
| Net realized and unrealized gain (loss) on investments | | | 1.43 | | | | 4.82 | | | | 4.25 | | | | (2.19 | ) | | | 3.70 | | | | 0.08 | |
| Total from investment operations | | | 1.41 | | | | 4.78 | | | | 4.34 | | | | (2.06 | ) | | | 3.81 | | | | 0.11 | |
| Less distributions from: | | | | | | | | | | | | | | | | | | | | | | | | |
| Net investment income | | | — | | | | — | | | | 0.06 | | | | 0.06 | | | | 0.20 | | | | 0.12 | |
| Net realized gain | | | — | | | | 0.17 | | | | — | | | | 0.45 | | | | 0.12 | | | | — | |
| Total distributions | | | — | | | | 0.17 | | | | 0.06 | | | | 0.51 | | | | 0.32 | | | | 0.12 | |
| Net asset value, end of year | | $ | 24.10 | | | $ | 22.69 | | | $ | 18.08 | | | $ | 13.80 | | | $ | 16.37 | | | $ | 12.88 | |
| Total return (%)* | | | 6.21 | | | | 26.45 | | | | 31.46 | | | | (12.70 | ) | | | 29.65 | | | | 0.88 | |
| Ratios to average daily net assets (%)**: | | | | | | | | | | | | | | | | | | | | | | | | |
| Expenses, before waivers and reimbursements | | | 1.27 | | | | 1.31 | | | | 1.32 | | | | 1.39 | | | | 1.59 | | | | 1.56 | |
| Expenses, net of waivers and reimbursements | | | 1.15 | | | | 1.15 | | | | 1.18 | | | | 1.28 | | | | 1.35 | | | | 1.30 | |
| Net investment income (loss), before waivers and reimbursements | | | (0.27 | ) | | | (0.39 | ) | | | 0.44 | | | | 0.70 | | | | 0.48 | | | | (0.02 | ) |
| Net investment income (loss), net of waivers and reimbursements | | | (0.15 | ) | | | (0.23 | ) | | | 0.58 | | | | 0.81 | | | | 0.72 | | | | 0.24 | |
| Class N net assets at the end of the year (in thousands) | | $ | 35,254 | | | $ | 19,586 | | | $ | 11,163 | | | $ | 8,715 | | | $ | 9,651 | | | $ | 2,922 | |
| Portfolio turnover rate (%)* | | | 12 | | | | 34 | | | | 20 | | | | 33 | | | | 41 | | | | 59 | |
| | | | | | | | | | | | | | | | | | | | | | | | | |
| | Class I | |
| | (unaudited)
Period Ended
June 30, | | | Years Ended December 31, | |
| | | | 2021 | | | | 2020 | | | | 2019 | | | | 2018 | | | | 2017 | | | | 2016 | |
| Net asset value, beginning of year | | $ | 22.80 | | | $ | 18.13 | | | $ | 13.84 | | | $ | 16.44 | | | $ | 12.92 | | | $ | 12.91 | |
| Income (loss) from investment operations: | | | | | | | | | | | | | | | | | | | | | | | | |
| Net investment income (loss) | | | 0.01 | | | | (0.00 | )^ | | | 0.12 | | | | 0.17 | | | | 0.16 | | | | 0.10 | |
| Net realized and unrealized gain (loss) on investments | | | 1.43 | | | | 4.85 | | | | 4.27 | | | | (2.19 | ) | | | 3.71 | | | | 0.04 | |
| Total from investment operations | | | 1.44 | | | | 4.85 | | | | 4.39 | | | | (2.02 | ) | | | 3.87 | | | | 0.14 | |
| Less distributions from: | | | | | | | | | | | | | | | | | | | | | | | | |
| Net investment income | | | — | | | | 0.01 | | | | 0.10 | | | | 0.13 | | | | 0.23 | | | | 0.13 | |
| Net realized gain | | | — | | | | 0.17 | | | | — | | | | 0.45 | | | | 0.12 | | | | — | |
| Total distributions | | | — | | | | 0.18 | | | | 0.10 | | | | 0.58 | | | | 0.35 | | | | 0.13 | |
| Net asset value, end of year | | $ | 24.24 | | | $ | 22.80 | | | $ | 18.13 | | | $ | 13.84 | | | $ | 16.44 | | | $ | 12.92 | |
| Total return (%)* | | | 6.32 | | | | 26.77 | | | | 31.76 | | | | (12.45 | ) | | | 30.05 | | | | 1.10 | |
| Ratios to average daily net assets (%)**: | | | | | | | | | | | | | | | | | | | | | | | | |
| Expenses, before waivers and reimbursements | | | 0.98 | | | | 1.01 | | | | 1.01 | | | | 1.07 | | | | 1.28 | | | | 1.30 | |
| Expenses, net of waivers and reimbursements | | | 0.90 | | | | 0.90 | | | | 0.93 | | | | 1.03 | | | | 1.05 | | | | 1.04 | |
| Net investment income (loss), before waivers and reimbursements | | | (0.02 | ) | | | (0.11 | ) | | | 0.64 | | | | 1.02 | | | | 0.86 | | | | 0.48 | |
| Net investment income (loss), net of waivers and reimbursements | | | 0.06 | | | | (0.00 | ) | | | 0.72 | | | | 1.06 | | | | 1.09 | | | | 0.74 | |
| Class I net assets at the end of the year (in thousands) | | $ | 511,382 | | | $ | 393,596 | | | $ | 181,617 | | | $ | 76,382 | | | $ | 60,279 | | | $ | 30,944 | |
| Portfolio turnover rate (%)* | | | 12 | | | | 34 | | | | 20 | | | | 33 | | | | 41 | | | | 59 | |
| * | Rates are not annualized for periods less than a year. |
| ** | Rates are annualized for periods less than a year. |
| ^ | Amount is less than $0.005 per share. |
Note: Net investment income (loss) per share is based on the average shares outstanding during the year.
Performance cited represents past performance. Past performance does not guarantee future results and current performance may be lower or higher than the data quoted. Results shown are annual returns, which assume reinvestment of dividends and capital gains. Investment returns and principal will fluctuate and you may have a gain or loss when you sell shares. For the most current month-end performance information, please call 1-800-742-7272 or visit our Web site at www.williamblairfunds.com.
| 160 | Semiannual Report | June 30, 2021 |
Financial Highlights — For a share outstanding throughout each period
International Leaders Fund
| | Class R6 | |
| | (unaudited)
Period Ended
June 30, | | | Years Ended December 31, | |
| | | | 2021 | | | | 2020 | | | | 2019 | | | | 2018 | | | | 2017 | | | | 2016 | |
| Net asset value, beginning of year | | $ | 22.80 | | | $ | 18.12 | | | $ | 13.83 | | | $ | 16.43 | | | $ | 12.92 | | | $ | 12.90 | |
| Income (loss) from investment operations: | | | | | | | | | | | | | | | | | | | | | | | | |
| Net investment income (loss) | | | 0.01 | | | | 0.02 | | | | 0.14 | | | | 0.18 | | | | 0.18 | | | | 0.12 | |
| Net realized and unrealized gain (loss) on investments | | | 1.44 | | | | 4.85 | | | | 4.26 | | | | (2.19 | ) | | | 3.70 | | | | 0.04 | |
| Total from investment operations | | | 1.45 | | | | 4.87 | | | | 4.40 | | | | (2.01 | ) | | | 3.88 | | | | 0.16 | |
| Less distributions from: | | | | | | | | | | | | | | | | | | | | | | | | |
| Net investment income | | | — | | | | 0.02 | | | | 0.11 | | | | 0.14 | | | | 0.25 | | | | 0.14 | |
| Net realized gain | | | — | | | | 0.17 | | | | — | | | | 0.45 | | | | 0.12 | | | | — | |
| Total distributions | | | — | | | | 0.19 | | | | 0.11 | | | | 0.59 | | | | 0.37 | | | | 0.14 | |
| Net asset value, end of year | | $ | 24.25 | | | $ | 22.80 | | | $ | 18.12 | | | $ | 13.83 | | | $ | 16.43 | | | $ | 12.92 | |
| Total return (%)* | | | 6.36 | | | | 26.88 | | | | 31.83 | | | | (12.38 | ) | | | 30.08 | | | | 1.25 | |
| Ratios to average daily net assets (%)**: | | | | | | | | | | | | | | | | | | | | | | | | |
| Expenses, before waivers and reimbursements | | | 0.90 | | | | 0.92 | | | | 0.93 | | | | 0.99 | | | | 1.03 | | | | 1.06 | |
| Expenses, net of waivers and reimbursements | | | 0.85 | | | | 0.85 | | | | 0.88 | | | | 0.95 | | | | 0.95 | | | | 0.95 | |
| Net investment income (loss), before waivers and reimbursements | | | 0.02 | | | | 0.03 | | | | 0.80 | | | | 1.07 | | | | 1.10 | | | | 0.81 | |
| Net investment income (loss), net of waivers and reimbursements | | | 0.07 | | | | 0.10 | | | | 0.85 | | | | 1.11 | | | | 1.18 | | | | 0.92 | |
| Class R6 net assets at the end of the year (in thousands) | | $ | 649,617 | | | $ | 687,171 | | | $ | 461,124 | | | $ | 324,902 | | | $ | 308,898 | | | $ | 221,356 | |
| Portfolio turnover rate (%)* | | | 12 | | | | 34 | | | | 20 | | | | 33 | | | | 41 | | | | 59 | |
| * | Rates are not annualized for periods less than a year. |
| ** | Rates are annualized for periods less than a year. |
Note: Net investment income (loss) per share is based on the average shares outstanding during the year.
Performance cited represents past performance. Past performance does not guarantee future results and current performance may be lower or higher than the data quoted. Results shown are annual returns, which assume reinvestment of dividends and capital gains. Investment returns and principal will fluctuate and you may have a gain or loss when you sell shares. For the most current month-end performance information, please call 1-800-742-7272 or visit our Web site at www.williamblairfunds.com.
| June 30, 2021 | William Blair Funds | 161 |
Financial Highlights — For a share outstanding throughout each period
International Growth Fund
| | Class N | |
| | (unaudited)
Period Ended
June 30, | | | Years Ended December 31, | |
| | | 2021 | | | 2020 | | | 2019 | | | 2018 | | | 2017 | | | 2016 | |
| Net asset value, beginning of year | | $ | 38.75 | | | $ | 29.68 | | | $ | 23.04 | | | $ | 30.41 | | | $ | 23.86 | | | $ | 24.94 | |
| Income (loss) from investment operations: | | | | | | | | | | | | | | | | | | | | | | | | |
| Net investment income (loss) | | | (0.07 | ) | | | (0.16 | ) | | | 0.09 | | | | 0.16 | | | | 0.21 | | | | 0.20 | |
| Net realized and unrealized gain (loss) on investments | | | 3.28 | | | | 9.55 | | | | 6.87 | | | | (5.56 | ) | | | 6.73 | | | | (0.92 | ) |
| Total from investment operations | | | 3.21 | | | | 9.39 | | | | 6.96 | | | | (5.40 | ) | | | 6.94 | | | | (0.72 | ) |
| Less distributions from: | | | | | | | | | | | | | | | | | | | | | | | | |
| Net investment income | | | — | | | | 0.06 | | | | 0.32 | | | | 0.12 | | | | 0.39 | | | | 0.36 | |
| Net realized gain | | | — | | | | 0.26 | | | | — | | | | 1.85 | | | | — | | | | — | |
| Total distributions | | | — | | | | 0.32 | | | | 0.32 | | | | 1.97 | | | | 0.39 | | | | 0.36 | |
| Net asset value, end of year | | $ | 41.96 | | | $ | 38.75 | | | $ | 29.68 | | | $ | 23.04 | | | $ | 30.41 | | | $ | 23.86 | |
| Total return (%)* | | | 8.28 | | | | 31.64 | | | | 30.24 | | | | (18.00 | ) | | | 29.11 | | | | (2.88 | ) |
| Ratios to average daily net assets (%)**: | | | | | | | | | | | | | | | | | | | | | | | | |
| Expenses, before waivers and reimbursements | | | 1.46 | | | | 1.47 | | | | 1.45 | | | | 1.46 | | | | 1.47 | | | | 1.43 | |
| Expenses, net of waivers and reimbursements | | | 1.45 | | | | 1.45 | | | | 1.45 | | | | 1.45 | | | | 1.45 | | | | 1.43 | |
| Net investment income (loss), before waivers and reimbursements | | | (0.34 | ) | | | (0.56 | ) | | | 0.34 | | | | 0.54 | | | | 0.76 | | | | 0.84 | |
| Net investment income (loss), net of waivers and reimbursements | | | (0.33 | ) | | | (0.54 | ) | | | 0.34 | | | | 0.55 | | | | 0.78 | | | | 0.84 | |
| Class N net assets at the end of the year (in thousands) | | $ | 300,351 | | | $ | 288,976 | | | $ | 494,788 | | | $ | 456,533 | | | $ | 763,740 | | | $ | 729,544 | |
| Portfolio turnover rate (%)* | | | 16 | | | | 27 | | | | 34 | | | | 78 | | | | 82 | | | | 101 | |
| | | | | | | | | | | | | | | | | | | | | | | | | |
| | Class I | |
| | (unaudited)
Period Ended
June 30, | | | Years Ended December 31, | |
| | | | 2021 | | | | 2020 | | | | 2019 | | | | 2018 | | | | 2017 | | | | 2016 | |
| Net asset value, beginning of year | | $ | 39.65 | | | $ | 30.38 | | | $ | 23.56 | | | $ | 31.13 | | | $ | 24.42 | | | $ | 25.51 | |
| Income (loss) from investment operations: | | | | | | | | | | | | | | | | | | | | | | | | |
| Net investment income (loss) | | | (0.01 | ) | | | (0.08 | ) | | | 0.18 | | | | 0.26 | | | | 0.30 | | | | 0.29 | |
| Net realized and unrealized gain (loss) on investments | | | 3.36 | | | | 9.79 | | | | 7.03 | | | | (5.70 | ) | | | 6.89 | | | | (0.94 | ) |
| Total from investment operations | | | 3.35 | | | | 9.71 | | | | 7.21 | | | | (5.44 | ) | | | 7.19 | | | | (0.65 | ) |
| Less distributions from: | | | | | | | | | | | | | | | | | | | | | | | | |
| Net investment income | | | — | | | | 0.18 | | | | 0.39 | | | | 0.28 | | | | 0.48 | | | | 0.44 | |
| Net realized gain | | | — | | | | 0.26 | | | | — | | | | 1.85 | | | | — | | | | — | |
| Total distributions | | | — | | | | 0.44 | | | | 0.39 | | | | 2.13 | | | | 0.48 | | | | 0.44 | |
| Net asset value, end of year | | $ | 43.00 | | | $ | 39.65 | | | $ | 30.38 | | | $ | 23.56 | | | $ | 31.13 | | | $ | 24.42 | |
| Total return (%)* | | | 8.45 | | | | 31.99 | | | | 30.66 | | | | (17.73 | ) | | | 29.49 | | | | (2.54 | ) |
| Ratios to average daily net assets (%)**: | | | | | | | | | | | | | | | | | | | | | | | | |
| Expenses | | | 1.14 | | | | 1.16 | | | | 1.14 | | | | 1.13 | | | | 1.14 | | | | 1.13 | |
| Net investment income (loss) | | | (0.04 | ) | | | (0.24 | ) | | | 0.65 | | | | 0.86 | | | | 1.08 | | | | 1.16 | |
| Class I net assets at the end of the year (in thousands) | | $ | 1,888,879 | | | $ | 1,914,460 | | | $ | 1,552,355 | | | $ | 1,646,811 | | | $ | 2,375,326 | | | $ | 2,251,701 | |
| Portfolio turnover rate (%)* | | | 16 | | | | 27 | | | | 34 | | | | 78 | | | | 82 | | | | 101 | |
| * | Rates are not annualized for periods less than a year. |
| ** | Rates are annualized for periods less than a year. |
Note: Net investment income (loss) per share is based on the average shares outstanding during the year.
Performance cited represents past performance. Past performance does not guarantee future results and current performance may be lower or higher than the data quoted. Results shown are annual returns, which assume reinvestment of dividends and capital gains. Investment returns and principal will fluctuate and you may have a gain or loss when you sell shares. For the most current month-end performance information, please call 1-800-742-7272 or visit our Web site at www.williamblairfunds.com.
| 162 | Semiannual Report | June 30, 2021 |
Financial Highlights — For a share outstanding throughout each period
International Growth Fund
| | | Class R6 | |
| | | (unaudited)
Period Ended
June 30, | | | Years Ended December 31, | |
| | | | 2021 | | | 2020 | | | 2019(a) | |
| Net asset value, beginning of year | | | $ | 39.66 | | | $ | 30.37 | | | $ | 27.56 | |
| Income (loss) from investment operations: | | | | | | | | | | | | | |
| Net investment income (loss) | | | | 0.03 | | | | (0.07 | ) | | | (0.05 | ) |
| Net realized and unrealized gain (loss) on investments | | | | 3.33 | | | | 9.83 | | | | 3.27 | |
| Total from investment operations | | | | 3.36 | | | | 9.76 | | | | 3.22 | |
| Less distributions from: | | | | | | | | | | | | | |
| Net investment income | | | | — | | | | 0.21 | | | | 0.41 | |
| Net realized gain | | | | — | | | | 0.26 | | | | — | |
| Total distributions | | | | — | | | | 0.47 | | | | 0.41 | |
| Net asset value, end of year | | | $ | 43.02 | | | $ | 39.66 | | | $ | 30.37 | |
| Total return (%)* | | | | 8.47 | | | | 32.16 | | | | 11.71 | |
| Ratios to average daily net assets (%)**: | | | | | | | | | | | | | |
| Expenses | | | | 1.06 | | | | 1.07 | | | | 1.06 | |
| Net investment income (loss) | | | | 0.14 | | | | (0.23 | ) | | | (0.26 | ) |
| Class R6 net assets at end of year (in thousands) | | | $ | 163,300 | | | $ | 109,214 | | | $ | 61,916 | |
| Portfolio turnover rate (%)* | | | | 16 | | | | 27 | | | | 34 | |
| (a) | For the period from May 2, 2019 (Commencement of Operations) to December 31, 2019. |
| * | Rates are not annualized for periods less than a year. |
| ** | Rates are annualized for periods less than a year. |
Note: Net investment income (loss) per share is based on the average shares outstanding during the year.
Performance cited represents past performance. Past performance does not guarantee future results and current performance may be lower or higher than the data quoted. Results shown are annual returns, which assume reinvestment of dividends and capital gains. Investment returns and principal will fluctuate and you may have a gain or loss when you sell shares. For the most current month-end performance information, please call 1-800-742-7272 or visit our Web site at www.williamblairfunds.com.
| June 30, 2021 | William Blair Funds | 163 |
Financial Highlights — For a share outstanding throughout each period
Institutional International Growth Fund
| | | Institutional | |
| | | (unaudited)
Period Ended
June 30, | | | Years Ended December 31, | |
| | | | 2021 | | | 2020 | | | 2019 | | | 2018 | | | 2017 | | | 2016 | |
| Net asset value, beginning of year | | | $ | 20.37 | | | $ | 17.35 | | | $ | 13.40 | | | $ | 18.08 | | | $ | 14.55 | | | $ | 15.08 | |
| Income (loss) from investment operations: | | | | | | | | | | | | | | | | | | | | | | | | | |
| Net investment income (loss) | | | | (0.00) | ^ | | | (0.01 | ) | | | 0.12 | | | | 0.18 | | | | 0.21 | | | | 0.18 | |
| Net realized and unrealized gain (loss) on investments | | | | 1.73 | | | | 5.60 | | | | 4.00 | | | | (3.29 | ) | | | 4.07 | | | | (0.54 | ) |
| Total from investment operations | | | | 1.73 | | | | 5.59 | | | | 4.12 | | | | (3.11 | ) | | | 4.28 | | | | (0.36 | ) |
| Less distributions from: | | | | | | | | | | | | | | | | | | | | | | | | | |
| Net investment income | | | | — | | | | 0.02 | | | | 0.17 | | | | 0.17 | | | | 0.44 | | | | 0.17 | |
| Net realized gain | | | | — | | | | 2.55 | | | | — | | | | 1.40 | | | | 0.31 | | | | — | |
| Total distributions | | | | — | | | | 2.57 | | | | 0.17 | | | | 1.57 | | | | 0.75 | | | | 0.17 | |
| Net asset value, end of year | | | $ | 22.10 | | | $ | 20.37 | | | $ | 17.35 | | | $ | 13.40 | | | $ | 18.08 | | | $ | 14.55 | |
| Total return (%)* | | | | 8.49 | | | | 32.47 | | | | 30.75 | | | | (17.50 | ) | | | 29.53 | | | | (2.40 | ) |
| Ratios to average daily net assets (%)**: | | | | | | | | | | | | | | | | | | | | | | | | | |
| Expenses | | | | 1.01 | | | | 1.00 | | | | 0.99 | | | | 0.97 | | | | 0.97 | | | | 0.98 | |
| Net investment income (loss), | | | | (0.02 | ) | | | (0.04 | ) | | | 0.77 | | | | 1.01 | | | | 1.22 | | | | 1.25 | |
| Net assets at the end of the year (in thousands) | | | $ | 1,318,807 | | | $ | 1,326,482 | | | $ | 1,892,911 | | | $ | 1,784,435 | | | $ | 2,330,299 | | | $ | 2,093,971 | |
| Portfolio turnover rate (%)* | | | | 16 | | | | 31 | | | | 35 | | | | 82 | | | | 84 | | | | 105 | |
| * | Rates are not annualized for periods less than a year. |
| ** | Rates are annualized for periods less than a year. |
| ^ | Amount is less than $0.005 per share. |
Note: Net investment income (loss) per share is based on the average shares outstanding during the year.
Performance cited represents past performance. Past performance does not guarantee future results and current performance may be lower or higher than the data quoted. Results shown are annual returns, which assume reinvestment of dividends and capital gains. Investment returns and principal will fluctuate and you may have a gain or loss when you sell shares. For the most current month-end performance information, please call 1-800-742-7272 or visit our Web site at www.williamblairfunds.com.
| 164 | Semiannual Report | June 30, 2021 |
Financial Highlights — For a share outstanding throughout each period
International Small Cap Growth Fund
| | | Class N | |
| | | (unaudited)
Period Ended
June 30, | | | Years Ended December 31, | |
| | | | 2021 | | | 2020 | | | 2019 | | | 2018 | | | 2017 | | | 2016 | |
| Net asset value, beginning of year | | | $ | 17.45 | | | $ | 13.85 | | | $ | 10.36 | | | $ | 15.49 | | | $ | 12.87 | | | $ | 13.50 | |
| Income (loss) from investment operations: | | | | | | | | | | | | | | | | | | | | | | | | | |
| Net investment income (loss) | | | | (0.03 | ) | | | (0.05 | ) | | | 0.05 | | | | 0.04 | | | | 0.12 | | | | 0.10 | |
| Net realized and unrealized gain (loss) on investments | | | | 1.30 | | | | 4.01 | | | | 3.45 | | | | (3.78 | ) | | | 3.98 | | | | (0.72 | ) |
| Total from investment operations | | | | 1.27 | | | | 3.96 | | | | 3.50 | | | | (3.74 | ) | | | 4.10 | | | | (0.62 | ) |
| Less distributions from: | | | | | | | | | | | | | | | | | | | | | | | | | |
| Net investment income | | | | — | | | | — | | | | 0.01 | | | | 0.08 | | | | 0.32 | | | | 0.01 | |
| Net realized gain | | | | — | | | | 0.36 | | | | — | | | | 1.31 | | | | 1.16 | | | | 0.00 | ^ |
| Total distributions | | | | — | | | | 0.36 | | | | 0.01 | | | | 1.39 | | | | 1.48 | | | | 0.01 | |
| Net asset value, end of year | | | $ | 18.72 | | | $ | 17.45 | | | $ | 13.85 | | | $ | 10.36 | | | $ | 15.49 | | | $ | 12.87 | |
| Total return (%)* | | | | 7.28 | | | | 28.68 | | | | 33.81 | | | | (24.48 | ) | | | 32.17 | | | | (4.60 | ) |
| Ratios to average daily net assets (%)**: | | | | | | | | | | | | | | | | | | | | | | | | | |
| Expenses, before waivers and reimbursements | | | | 1.47 | | | | 1.52 | | | | 1.48 | | | | 1.48 | | | | 1.62 | | | | 1.59 | |
| Expenses, net of waivers and reimbursements | | | | 1.47 | | | | 1.52 | | | | 1.48 | | | | 1.48 | | | | 1.47 | | | | 1.44 | |
| Net investment income (loss), before waivers and reimbursements | | | | (0.36 | ) | | | (0.36 | ) | | | 0.45 | | | | 0.29 | | | | 0.70 | | | | 0.62 | |
| Net investment income (loss), net of waivers and reimbursements | | | | (0.36 | ) | | | (0.36 | ) | | | 0.45 | | | | 0.29 | | | | 0.85 | | | | 0.77 | |
| Class N net assets at the end of the year (in thousands) | | | $ | 3,201 | | | $ | 3,101 | | | $ | 3,650 | | | $ | 3,440 | | | $ | 6,275 | | | $ | 10,361 | |
| Portfolio turnover rate (%)* | | | | 32 | | | | 63 | | | | 38 | | | | 88 | | | | 64 | | | | 73 | |
| | | | | | | | | | | | | | | | | | | | | | | | | | |
| | | Class I | |
| | | (unaudited)
Period Ended
June 30, | | | Years Ended December 31, | |
| | | | | 2021 | | | | 2020 | | | | 2019 | | | | 2018 | | | | 2017 | | | | 2016 | |
| Net asset value, beginning of year | | | $ | 17.66 | | | $ | 13.98 | | | $ | 10.45 | | | $ | 15.65 | | | $ | 13.00 | | | $ | 13.65 | |
| Income (loss) from investment operations: | | | | | | | | | | | | | | | | | | | | | | | | | |
| Net investment income (loss) | | | | (0.01 | ) | | | (0.01 | ) | | | 0.09 | | | | 0.09 | | | | 0.14 | | | | 0.14 | |
| Net realized and unrealized gain (loss) on investments | | | | 1.32 | | | | 4.06 | | | | 3.48 | | | | (3.84 | ) | | | 4.07 | | | | (0.75 | ) |
| Total from investment operations | | | | 1.31 | | | | 4.05 | | | | 3.57 | | | | (3.75 | ) | | | 4.21 | | | | (0.61 | ) |
| Less distributions from: | | | | | | | | | | | | | | | | | | | | | | | | | |
| Net investment income | | | | — | | | | 0.01 | | | | 0.04 | | | | 0.14 | | | | 0.40 | | | | 0.04 | |
| Net realized gain | | | | — | | | | 0.36 | | | | — | | | | 1.31 | | | | 1.16 | | | | 0.00 | ^ |
| Total distributions | | | | — | | | | 0.37 | | | | 0.04 | | | | 1.45 | | | | 1.56 | | | | 0.04 | |
| Net asset value, end of year | | | $ | 18.97 | | | $ | 17.66 | | | $ | 13.98 | | | $ | 10.45 | | | $ | 15.65 | | | $ | 13.00 | |
| Total return (%)* | | | | 7.42 | | | | 29.04 | | | | 34.22 | | | | (24.29 | ) | | | 32.70 | | | | (4.41 | ) |
| Ratios to average daily net assets (%)**: | | | | | | | | | | | | | | | | | | | | | | | | | |
| Expenses, before waivers and reimbursements | | | | 1.20 | | | | 1.25 | | | | 1.21 | | | | 1.18 | | | | 1.31 | | | | 1.30 | |
| Expenses, net of waivers and reimbursements | | | | 1.20 | | | | 1.25 | | | | 1.21 | | | | 1.18 | | | | 1.16 | | | | 1.15 | |
| Net investment income (loss), before waivers and reimbursements | | | | (0.09 | ) | | | (0.05 | ) | | | 0.75 | | | | 0.60 | | | | 0.77 | | | | 0.91 | |
| Net investment income (loss), net of waivers and reimbursements | | | | (0.09 | ) | | | (0.05 | ) | | | 0.75 | | | | 0.60 | | | | 0.92 | | | | 1.06 | |
| Class I net assets at the end of the year (in thousands) | | | $ | 147,051 | | | $ | 145,283 | | | $ | 142,951 | | | $ | 165,451 | | | $ | 338,920 | | | $ | 306,526 | |
| Portfolio turnover rate (%)* | | | | 32 | | | | 63 | | | | 38 | | | | 88 | | | | 64 | | | | 73 | |
| * | Rates are not annualized for periods less than a year. |
| ** | Rates are annualized for periods less than a year. |
| ^ | Amount is less than $0.005 per share. |
Note: Net investment income (loss) per share is based on the average shares outstanding during the year.
Performance cited represents past performance. Past performance does not guarantee future results and current performance may be lower or higher than the data quoted. Results shown are annual returns, which assume reinvestment of dividends and capital gains. Investment returns and principal will fluctuate and you may have a gain or loss when you sell shares. For the most current month-end performance information, please call 1-800-742-7272 or visit our Web site at www.williamblairfunds.com.
| June 30, 2021 | William Blair Funds | 165 |
Financial Highlights — For a share outstanding throughout each period
International Small Cap Growth Fund
| | | Class R6 | |
| | | (unaudited)
Period Ended
June 30, | | | Years Ended December 31, | |
| | | | 2021 | | | 2020 | | | 2019 | | | 2018 | | | 2017 | | | 2016 | |
| Net asset value, beginning of year | | | $ | 17.76 | | | $ | 14.05 | | | $ | 10.50 | | | $ | 15.73 | | | $ | 13.07 | | | $ | 13.72 | |
| Income (loss) from investment operations: | | | | | | | | | | | | | | | | | | | | | | | | | |
| Net investment income (loss) | | | | 0.00 | ^ | | | 0.00 | ^ | | | 0.11 | | | | 0.10 | | | | 0.15 | | | | 0.15 | |
| Net realized and unrealized gain (loss) on investments | | | | 1.33 | | | | 4.09 | | | | 3.49 | | | | (3.85 | ) | | | 4.08 | | | | (0.74 | ) |
| Total from investment operations | | | | 1.33 | | | | 4.09 | | | | 3.60 | | | | (3.75 | ) | | | 4.23 | | | | (0.59 | ) |
| Less distributions from: | | | | | | | | | | | | | | | | | | | | | | | | | |
| Net investment income | | | | — | | | | 0.02 | | | | 0.05 | | | | 0.17 | | | | 0.41 | | | | 0.06 | |
| Net realized gain | | | | — | | | | 0.36 | | | | — | | | | 1.31 | | | | 1.16 | | | | 0.00 | ^ |
| Total distributions | | | | — | | | | 0.38 | | | | 0.05 | | | | 1.48 | | | | 1.57 | | | | 0.06 | |
| Net asset value, end of year | | | $ | 19.09 | | | $ | 17.76 | | | $ | 14.05 | | | $ | 10.50 | | | $ | 15.73 | | | $ | 13.07 | |
| Total return (%)* | | | | 7.49 | | | | 29.23 | | | | 34.32 | | | | (24.19 | ) | | | 32.70 | | | | (4.31 | ) |
| Ratios to average daily net assets (%)**: | | | | | | | | | | | | | | | | | | | | | | | | | |
| Expenses | | | | 1.11 | | | | 1.14 | | | | 1.12 | | | | 1.08 | | | | 1.08 | | | | 1.07 | |
| Net investment income (loss) | | | | 0.02 | | | | 0.02 | | | | 0.86 | | | | 0.67 | | | | 0.99 | | | | 1.13 | |
| Class R6 net assets at the end of the year (in thousands) | | | $ | 217,688 | | | $ | 188,497 | | | $ | 162,465 | | | $ | 171,833 | | | $ | 256,558 | | | $ | 199,746 | |
| Portfolio turnover rate (%)* | | | | 32 | | | | 63 | | | | 38 | | | | 88 | | | | 64 | | | | 73 | |
| * | Rates are not annualized for periods less than a year. |
| ** | Rates are annualized for periods less than a year. |
| ^ | Amount is less than $0.005 per share. |
Note: Net investment income (loss) per share is based on the average shares outstanding during the year.
Performance cited represents past performance. Past performance does not guarantee future results and current performance may be lower or higher than the data quoted. Results shown are annual returns, which assume reinvestment of dividends and capital gains. Investment returns and principal will fluctuate and you may have a gain or loss when you sell shares. For the most current month-end performance information, please call 1-800-742-7272 or visit our Web site at www.williamblairfunds.com.
| 166 | Semiannual Report | June 30, 2021 |
Financial Highlights — For a share outstanding throughout each period
Emerging Markets Leaders Fund
| | | Class N | |
| | | (unaudited)
Period Ended
June 30, | | | Years Ended December 31, | |
| | | | 2021 | | | 2020 | | | 2019 | | | 2018 | | | 2017 | | | 2016 | |
| Net asset value, beginning of year | | | $ | 13.26 | | | $ | 10.51 | | | $ | 8.26 | | | $ | 11.06 | | | $ | 7.84 | | | $ | 7.73 | |
| Income (loss) from investment operations: | | | | | | | | | | | | | | | | | | | | | | | | | |
| Net investment income (loss) | | | | (0.03 | ) | | | (0.02 | ) | | | 0.03 | | | | 0.03 | | | | 0.01 | | | | 0.02 | |
| Net realized and unrealized gain (loss) on investments | | | | 0.52 | | | | 2.88 | | | | 2.28 | | | | (1.97 | ) | | | 3.26 | | | | 0.09 | |
| Total from investment operations | | | | 0.49 | | | | 2.86 | | | | 2.31 | | | | (1.94 | ) | | | 3.27 | | | | 0.11 | |
| Less distributions from: | | | | | | | | | | | | | | | | | | | | | | | | | |
| Net investment income | | | | — | | | | — | | | | 0.04 | | | | 0.07 | | | | 0.05 | | | | — | |
| Net realized gain | | | | — | | | | 0.11 | | | | 0.02 | | | | 0.79 | | | | — | | | | — | |
| Total distributions | | | | — | | | | 0.11 | | | | 0.06 | | | | 0.86 | | | | 0.05 | | | | — | |
| Net asset value, end of year | | | $ | 13.75 | | | $ | 13.26 | | | $ | 10.51 | | | $ | 8.26 | | | $ | 11.06 | | | $ | 7.84 | |
| Total return (%)* | | | | 3.70 | | | | 27.23 | | | | 27.98 | | | | (17.73 | ) | | | 41.68 | | | | 1.42 | |
| Ratios to average daily net assets (%)**: | | | | | | | | | | | | | | | | | | | | | | | | | |
| Expenses, before waivers and reimbursements | | | | 1.58 | | | | 1.63 | | | | 1.62 | | | | 1.60 | | | | 1.62 | | | | 1.81 | |
| Expenses, net of waivers and reimbursements | | | | 1.40 | | | | 1.40 | | | | 1.45 | | | | 1.58 | | | | 1.47 | | | | 1.57 | |
| Net investment income (loss), before waivers and reimbursements | | | | (0.62 | ) | | | (0.45 | ) | | | 0.17 | | | | 0.27 | | | | (0.01 | ) | | | 0.05 | |
| Net investment income (loss), net of waivers and reimbursements | | | | (0.44 | ) | | | (0.22 | ) | | | 0.34 | | | | 0.29 | | | | 0.14 | | | | 0.29 | |
| Class N net assets at the end of the year (in thousands) | | | $ | 2,223 | | | $ | 1,803 | | | $ | 1,856 | | | $ | 2,239 | | | $ | 2,766 | | | $ | 2,479 | |
| Portfolio turnover rate (%)* | | | | 29 | | | | 47 | | | | 33 | | | | 52 | | | | 59 | | | | 135 | |
| | | | | | | | | | | | | | | | | | | | | | | | | | |
| | | Class I | |
| | | (unaudited)
Period Ended
June 30, | | | Years Ended December 31, | |
| | | | | 2021 | | | | 2020 | | | | 2019 | | | | 2018 | | | | 2017 | | | | 2016 | |
| Net asset value, beginning of year | | | $ | 13.28 | | | $ | 10.52 | | | $ | 8.27 | | | $ | 11.09 | | | $ | 7.87 | | | $ | 7.74 | |
| Income (loss) from investment operations: | | | | | | | | | | | | | | | | | | | | | | | | | |
| Net investment income (loss) | | | | (0.02 | ) | | | (0.00 | )^ | | | 0.06 | | | | 0.06 | | | | 0.02 | | | | 0.04 | |
| Net realized and unrealized gain (loss) on investments | | | | 0.53 | | | | 2.89 | | | | 2.29 | | | | (1.97 | ) | | | 3.27 | | | | 0.10 | |
| Total from investment operations | | | | 0.51 | | | | 2.89 | | | | 2.35 | | | | (1.91 | ) | | | 3.29 | | | | 0.14 | |
| Less distributions from: | | | | | | | | | | | | | | | | | | | | | | | | | |
| Net investment income | | | | — | | | | 0.02 | | | | 0.08 | | | | 0.12 | | | | 0.07 | | | | 0.01 | |
| Net realized gain | | | | — | | | | 0.11 | | | | 0.02 | | | | 0.79 | | | | — | | | | — | |
| Total distributions | | | | — | | | | 0.13 | | | | 0.10 | | | | 0.91 | | | | 0.07 | | | | 0.01 | |
| Net asset value, end of year | | | $ | 13.79 | | | $ | 13.28 | | | $ | 10.52 | | | $ | 8.27 | | | $ | 11.09 | | | $ | 7.87 | |
| Total return (%)* | | | | 3.84 | | | | 27.52 | | | | 28.36 | | | | (17.45 | ) | | | 41.89 | | | | 1.82 | |
| Ratios to average daily net assets (%)**: | | | | | | | | | | | | | | | | | | | | | | | | | |
| Expenses, before waivers and reimbursements | | | | 1.29 | | | | 1.33 | | | | 1.29 | | | | 1.27 | | | | 1.40 | | | | 1.54 | |
| Expenses, net of waivers and reimbursements | | | | 1.15 | | | | 1.15 | | | | 1.20 | | | | 1.27 | | | | 1.25 | | | | 1.30 | |
| Net investment income (loss), before waivers and reimbursements | | | | (0.38 | ) | | | (0.21 | ) | | | 0.53 | | | | 0.58 | | | | 0.09 | | | | 0.28 | |
| Net investment income (loss), net of waivers and reimbursements | | | | (0.24 | ) | | | (0.03 | ) | | | 0.62 | | | | 0.58 | | | | 0.24 | | | | 0.52 | |
| Class I net assets at the end of the year (in thousands) | | | $ | 55,679 | | | $ | 62,319 | | | $ | 45,090 | | | $ | 34,786 | | | $ | 47,666 | | | $ | 30,346 | |
| Portfolio turnover rate (%)* | | | | 29 | | | | 47 | | | | 33 | | | | 52 | | | | 59 | | | | 135 | |
| * | Rates are not annualized for periods less than a year. |
| ** | Rates are annualized for periods less than a year. |
| ^ | Amount is less than $0.005 per share. |
Note: Net investment income (loss) per share is based on the average shares outstanding during the year.
Performance cited represents past performance. Past performance does not guarantee future results and current performance may be lower or higher than the data quoted. Results shown are annual returns, which assume reinvestment of dividends and capital gains. Investment returns and principal will fluctuate and you may have a gain or loss when you sell shares. For the most current month-end performance information, please call 1-800-742-7272 or visit our Web site at www.williamblairfunds.com.
| June 30, 2021 | William Blair Funds | 167 |
Financial Highlights — For a share outstanding throughout each period
Emerging Markets Leaders Fund
| | | Class R6 | |
| | | (unaudited)
Period Ended
June 30, | | | Years Ended December 31, | |
| | | | 2021 | | | 2020 | | | 2019 | | | 2018 | | | 2017 | | | 2016 | |
| Net asset value, beginning of year | | | $ | 13.26 | | | $ | 10.51 | | | $ | 8.26 | | | $ | 11.09 | | | $ | 7.86 | | | $ | 7.74 | |
| Income (loss) from investment operations: | | | | | | | | | | | | | | | | | | | | | | | | | |
| Net investment income (loss) | | | | (0.01 | ) | | | 0.00 | ^ | | | 0.06 | | | | 0.07 | | | | 0.03 | | | | 0.03 | |
| Net realized and unrealized gain (loss) on investments | | | | 0.53 | | | | 2.89 | | | | 2.29 | | | | (1.98 | ) | | | 3.28 | | | | 0.10 | |
| Total from investment operations | | | | 0.52 | | | | 2.89 | | | | 2.35 | | | | (1.91 | ) | | | 3.31 | | | | 0.13 | |
| Less distributions from: | | | | | | | | | | | | | | | | | | | | | | | | | |
| Net investment income | | | | — | | | | 0.03 | | | | 0.08 | | | | 0.13 | | | | 0.08 | | | | 0.01 | |
| Net realized gain | | | | — | | | | 0.11 | | | | 0.02 | | | | 0.79 | | | | — | | | | — | |
| Total distributions | | | | — | | | | 0.14 | | | | 0.10 | | | | 0.92 | | | | 0.08 | | | | 0.01 | |
| Net asset value, end of year | | | $ | 13.78 | | | $ | 13.26 | | | $ | 10.51 | | | $ | 8.26 | | | $ | 11.09 | | | $ | 7.86 | |
| Total return (%)* | | | | 3.92 | | | | 27.50 | | | | 28.45 | | | | (17.46 | ) | | | 42.15 | | | | 1.74 | |
| Ratios to average daily net assets (%)**: | | | | | | | | | | | | | | | | | | | | | | | | | |
| Expenses, before waivers and reimbursements | | | | 1.21 | | | | 1.26 | | | | 1.23 | | | | 1.20 | | | | 1.19 | | | | 1.34 | |
| Expenses, net of waivers and reimbursements | | | | 1.10 | | | | 1.10 | | | | 1.15 | | | | 1.20 | | | | 1.19 | | | | 1.25 | |
| Net investment income (loss), before waivers and reimbursements | | | | (0.23 | ) | | | (0.11 | ) | | | 0.57 | | | | 0.71 | | | | 0.33 | | | | 0.30 | |
| Net investment income (loss), net of waivers and reimbursements | | | | (0.12 | ) | | | 0.05 | | | | 0.65 | | | | 0.71 | | | | 0.33 | | | | 0.39 | |
| Class R6 net assets at the end of the year (in thousands) | | | $ | 258,633 | | | $ | 198,015 | | | $ | 191,337 | | | $ | 161,889 | | | $ | 427,480 | | | $ | 272,678 | |
| Portfolio turnover rate (%)* | | | | 29 | | | | 47 | | | | 33 | | | | 52 | | | | 59 | | | | 135 | |
| * | Rates are not annualized for periods less than a year. |
| ** | Rates are annualized for periods less than a year. |
| ^ | Amount is less than $0.005 per share. |
Note: Net investment income (loss) per share is based on the average shares outstanding during the year.
Performance cited represents past performance. Past performance does not guarantee future results and current performance may be lower or higher than the data quoted. Results shown are annual returns, which assume reinvestment of dividends and capital gains. Investment returns and principal will fluctuate and you may have a gain or loss when you sell shares. For the most current month-end performance information, please call 1-800-742-7272 or visit our Web site at www.williamblairfunds.com.
| 168 | Semiannual Report | June 30, 2021 |
Financial Highlights — For a share outstanding throughout each period
Emerging Markets Growth Fund
| | | Class N | |
| | | (unaudited)
Period Ended
June 30, | | | Years Ended December 31, | |
| | | | 2021 | | | 2020 | | | 2019 | | | 2018 | | | 2017 | | | 2016 | |
| Net asset value, beginning of year | | | $ | 18.42 | | | $ | 13.67 | | | $ | 11.14 | | | $ | 16.20 | | | $ | 10.99 | | | $ | 10.85 | |
| Income (loss) from investment operations: | | | | | | | | | | | | | | | | | | | | | | | | | |
| Net investment income (loss) | | | | (0.07 | ) | | | (0.09 | ) | | | 0.11 | | | | 0.01 | | | | (0.02 | ) | | | 0.03 | |
| Net realized and unrealized gain (loss) on investments | | | | 1.98 | | | | 5.60 | | | | 2.98 | | | | (3.49 | ) | | | 5.35 | | | | 0.13 | |
| Total from investment operations | | | | 1.91 | | | | 5.51 | | | | 3.09 | | | | (3.48 | ) | | | 5.33 | | | | 0.16 | |
| Less distributions from: | | | | | | | | | | | | | | | | | | | | | | | | | |
| Net investment income | | | | — | | | | — | | | | 0.16 | | | | 0.11 | | | | 0.12 | | | | 0.02 | |
| Net realized gain | | | | — | | | | 0.76 | | | | 0.40 | | | | 1.47 | | | | — | | | | — | |
| Total distributions | | | | — | | | | 0.76 | | | | 0.56 | | | | 1.58 | | | | 0.12 | | | | 0.02 | |
| Net asset value, end of year | | | $ | 20.33 | | | $ | 18.42 | | | $ | 13.67 | | | $ | 11.14 | | | $ | 16.20 | | | $ | 10.99 | |
| Total return (%)* | | | | 10.37 | | | | 40.43 | | | | 27.89 | | | | (21.61 | ) | | | 48.53 | | | | 1.49 | |
| Ratios to average daily net assets (%)**: | | | | | | | | | | | | | | | | | | | | | | | | | |
| Expenses, before waivers and reimbursements | | | | 1.52 | | | | 1.55 | | | | 1.51 | | | | 1.52 | | | | 1.65 | | | | 1.65 | |
| Expenses, net of waivers and reimbursements | | | | 1.52 | | | | 1.55 | | | | 1.51 | | | | 1.52 | | | | 1.50 | | | | 1.50 | |
| Net investment income (loss), before waivers and reimbursements | | | | (0.70 | ) | | | (0.60 | ) | | | 0.84 | | | | 0.09 | | | | (0.29 | ) | | | 0.13 | |
| Net investment income (loss), net of waivers and reimbursements | | | | (0.70 | ) | | | (0.60 | ) | | | 0.84 | | | | 0.09 | | | | (0.14 | ) | | | 0.28 | |
| Class N net assets at the end of the year (in thousands) | | | $ | 35,790 | | | $ | 18,606 | | | $ | 7,804 | | | $ | 7,103 | | | $ | 10,479 | | | $ | 8,488 | |
| Portfolio turnover rate (%)* | | | | 31 | | | | 77 | | | | 79 | | | | 113 | | | | 91 | | | | 105 | |
| | | | | | | | | | | | | | | | | | | | | | | | | | |
| | | Class I | |
| | | (unaudited)
Period Ended
June 30, | | | Years Ended December 31, | |
| | | | | 2021 | | | | 2020 | | | | 2019 | | | | 2018 | | | | 2017 | | | | 2016 | |
| Net asset value, beginning of year | | | $ | 18.66 | | | $ | 13.82 | | | $ | 11.25 | | | $ | 16.36 | | | $ | 11.10 | | | $ | 10.96 | |
| Income (loss) from investment operations: | | | | | | | | | | | | | | | | | | | | | | | | | |
| Net investment income (loss) | | | | (0.04 | ) | | | (0.05 | ) | | | 0.14 | | | | 0.05 | | | | 0.01 | | | | 0.06 | |
| Net realized and unrealized gain (loss) on investments | | | | 2.00 | | | | 5.66 | | | | 3.02 | | | | (3.52 | ) | | | 5.40 | | | | 0.13 | |
| Total from investment operations | | | | 1.96 | | | | 5.61 | | | | 3.16 | | | | (3.47 | ) | | | 5.41 | | | | 0.19 | |
| Less distributions from: | | | | | | | | | | | | | | | | | | | | | | | | | |
| Net investment income | | | | — | | | | 0.01 | | | | 0.19 | | | | 0.17 | | | | 0.15 | | | | 0.05 | |
| Net realized gain | | | | — | | | | 0.76 | | | | 0.40 | | | | 1.47 | | | | — | | | | — | |
| Total distributions | | | | — | | | | 0.77 | | | | 0.59 | | | | 1.64 | | | | 0.15 | | | | 0.05 | |
| Net asset value, end of year | | | $ | 20.62 | | | $ | 18.66 | | | $ | 13.82 | | | $ | 11.25 | | | $ | 16.36 | | | $ | 11.10 | |
| Total return (%)* | | | | 10.50 | | | | 40.72 | | | | 28.29 | | | | (21.37 | ) | | | 48.83 | | | | 1.73 | |
| Ratios to average daily net assets (%)**: | | | | | | | | | | | | | | | | | | | | | | | | | |
| Expenses, before waivers and reimbursements | | | | 1.23 | | | | 1.30 | | | | 1.26 | | | | 1.27 | | | | 1.42 | | | | 1.41 | |
| Expenses, net of waivers and reimbursements | | | | 1.23 | | | | 1.30 | | | | 1.26 | | | | 1.27 | | | | 1.27 | | | | 1.26 | |
| Net investment income (loss), before waivers and reimbursements | | | | (0.40 | ) | | | (0.33 | ) | | | 1.06 | | | | 0.34 | | | | (0.07 | ) | | | 0.38 | |
| Net investment income (loss), net of waivers and reimbursements | | | | (0.40 | ) | | | (0.33 | ) | | | 1.06 | | | | 0.34 | | | | 0.08 | | | | 0.53 | |
| Class I net assets at the end of the year (in thousands) | | | $ | 195,390 | | | $ | 113,697 | | | $ | 73,496 | | | $ | 79,427 | | | $ | 129,481 | | | $ | 93,668 | |
| Portfolio turnover rate (%)* | | | | 31 | | | | 77 | | | | 79 | | | | 113 | | | | 91 | | | | 105 | |
| * | Rates are not annualized for periods less than a year. |
| ** | Rates are annualized for periods less than a year. |
Note: Net investment income (loss) per share is based on the average shares outstanding during the year.
Performance cited represents past performance. Past performance does not guarantee future results and current performance may be lower or higher than the data quoted. Results shown are annual returns, which assume reinvestment of dividends and capital gains. Investment returns and principal will fluctuate and you may have a gain or loss when you sell shares. For the most current month-end performance information, please call 1-800-742-7272 or visit our Web site at www.williamblairfunds.com.
| June 30, 2021 | William Blair Funds | 169 |
Financial Highlights — For a share outstanding throughout each period
Emerging Markets Growth Fund
| | | Class R6 | |
| | | (unaudited)
Period Ended
June 30, | | | Years Ended December 31, | |
| | | | 2021 | | | 2020 | | | 2019 | | | 2018 | | | 2017 | | | 2016 | |
| Net asset value, beginning of year | | | $ | 18.84 | | | $ | 13.94 | | | $ | 11.35 | | | $ | 16.49 | | | $ | 11.18 | | | $ | 11.05 | |
| Income (loss) from investment operations: | | | | | | | | | | | | | | | | | | | | | | | | | |
| Net investment income (loss) | | | | (0.03 | ) | | | (0.03 | ) | | | 0.15 | | | | 0.07 | | | | 0.02 | | | | 0.07 | |
| Net realized and unrealized gain (loss) on investments | | | | 2.02 | | | | 5.71 | | | | 3.04 | | | | (3.56 | ) | | | 5.46 | | | | 0.12 | |
| Total from investment operations | | | | 1.99 | | | | 5.68 | | | | 3.19 | | | | (3.49 | ) | | | 5.48 | | | | 0.19 | |
| Less distributions from: | | | | | | | | | | | | | | | | | | | | | | | | | |
| Net investment income | | | | — | | | | 0.02 | | | | 0.20 | | | | 0.18 | | | | 0.17 | | | | 0.06 | |
| Net realized gain | | | | — | | | | 0.76 | | | | 0.40 | | | | 1.47 | | | �� | — | | | | — | |
| Total distributions | | | | — | | | | 0.78 | | | | 0.60 | | | | 1.65 | | | | 0.17 | | | | 0.06 | |
| Net asset value, end of year | | | $ | 20.83 | | | $ | 18.84 | | | $ | 13.94 | | | $ | 11.35 | | | $ | 16.49 | | | $ | 11.18 | |
| Total return (%)* | | | | 10.56 | | | | 40.90 | | | | 28.28 | | | | (21.29 | ) | | | 49.06 | | | | 1.71 | |
| Ratios to average daily net assets (%)**: | | | | | | | | | | | | | | | | | | | | | | | | | |
| Expenses | | | | 1.16 | | | | 1.20 | | | | 1.19 | | | | 1.19 | | | | 1.17 | | | | 1.19 | |
| Net investment income (loss) | | | | (0.35 | ) | | | (0.22 | ) | | | 1.17 | | | | 0.46 | | | | 0.17 | | | | 0.60 | |
| Class R6 net assets at the end of the year (in thousands) | | | $ | 1,027,330 | | | $ | 1,063,433 | | | $ | 708,892 | | | $ | 654,441 | | | $ | 1,178,853 | | | $ | 831,587 | |
| Portfolio turnover rate (%)* | | | | 31 | | | | 77 | | | | 79 | | | | 113 | | | | 91 | | | | 105 | |
| * | Rates are not annualized for periods less than a year. |
| ** | Rates are annualized for periods less than a year. |
Note: Net investment income (loss) per share is based on the average shares outstanding during the year.
Performance cited represents past performance. Past performance does not guarantee future results and current performance may be lower or higher than the data quoted. Results shown are annual returns, which assume reinvestment of dividends and capital gains. Investment returns and principal will fluctuate and you may have a gain or loss when you sell shares. For the most current month-end performance information, please call 1-800-742-7272 or visit our Web site at www.williamblairfunds.com.
| 170 | Semiannual Report | June 30, 2021 |
Financial Highlights — For a share outstanding throughout each period
Emerging Markets Small Cap Growth Fund
| | | Class N | |
| | | (unaudited)
Period Ended
June 30, | | | Years Ended December 31, | |
| | | | 2021 | | | 2020 | | | 2019 | | | 2018 | | | 2017 | | | 2016 | |
| Net asset value, beginning of year | | | $ | 22.22 | | | $ | 16.80 | | | $ | 13.96 | | | $ | 18.66 | | | $ | 13.73 | | | $ | 14.84 | |
| Income (loss) from investment operations: | | | | | | | | | | | | | | | | | | | | | | | | | |
| Net investment income (loss) | | | | (0.10 | ) | | | (0.06 | ) | | | 0.00 | ^ | | | (0.02 | ) | | | 0.01 | | | | 0.09 | |
| Net realized and unrealized gain (loss) on investments | | | | 3.11 | | | | 5.48 | | | | 2.84 | | | | (4.38 | ) | | | 5.46 | | | | (0.88 | ) |
| Total from investment operations | | | | 3.01 | | | | 5.42 | | | | 2.84 | | | | (4.40 | ) | | | 5.47 | | | | (0.79 | ) |
| Less distributions from: | | | | | | | | | | | | | | | | | | | | | | | | | |
| Net investment income | | | | — | | | | — | | | | — | | | | — | | | | 0.50 | | | | 0.32 | |
| Net realized gain | | | | — | | | | — | | | | — | | | | 0.30 | | | | 0.04 | | | | — | |
| Total distributions | | | | — | | | | — | | | | — | | | | 0.30 | | | | 0.54 | | | | 0.32 | |
| Net asset value, end of year | | | $ | 25.23 | | | $ | 22.22 | | | $ | 16.80 | | | $ | 13.96 | | | $ | 18.66 | | | $ | 13.73 | |
| Total return (%)* | | | | 13.55 | | | | 32.26 | | | | 20.34 | | | | (23.57 | ) | | | 40.09 | | | | (5.33 | ) |
| Ratios to average daily net assets (%)**: | | | | | | | | | | | | | | | | | | | | | | | | | |
| Expenses, before waivers and reimbursements | | | | 1.61 | | | | 1.77 | | | | 1.71 | | | | 1.70 | | | | 1.83 | | | | 1.82 | |
| Expenses, net of waivers and reimbursements | | | | 1.55 | | | | 1.55 | | | | 1.55 | | | | 1.58 | | | | 1.64 | | | | 1.61 | |
| Net investment income (loss), before waivers and reimbursements | | | | (0.95 | ) | | | (0.58 | ) | | | (0.14 | ) | | | (0.22 | ) | | | (0.11 | ) | | | 0.41 | |
| Net investment income (loss), net of waivers and reimbursements | | | | (0.89 | ) | | | (0.36 | ) | | | 0.02 | | | | (0.10 | ) | | | 0.08 | | | | 0.62 | |
| Class N net assets at the end of the year (in thousands) | | | $ | 4,254 | | | $ | 3,947 | | | $ | 4,025 | | | $ | 8,977 | | | $ | 15,082 | | | $ | 9,263 | |
| Portfolio turnover rate (%)* | | | | 44 | | | | 119 | | | | 142 | | | | 187 | | | | 183 | | | | 157 | |
| | | | | | | | | | | | | | | | | | | | | | | | | | |
| | | Class I | |
| | | (unaudited)
Period Ended
June 30, | | | Years Ended December 31, | |
| | | | | 2021 | | | | 2020 | | | | 2019 | | | | 2018 | | | | 2017 | | | | 2016 | |
| Net asset value, beginning of year | | | $ | 22.40 | | | $ | 16.90 | | | $ | 14.03 | | | $ | 18.73 | | | $ | 13.77 | | | $ | 14.90 | |
| Income (loss) from investment operations: | | | | | | | | | | | | | | | | | | | | | | | | | |
| Net investment income (loss) | | | | (0.07 | ) | | | (0.02 | ) | | | 0.04 | | | | 0.03 | | | | 0.08 | | | | 0.13 | |
| Net realized and unrealized gain (loss) on investments | | | | 3.14 | | | | 5.53 | | | | 2.86 | | | | (4.41 | ) | | | 5.47 | | | | (0.89 | ) |
| Total from investment operations | | | | 3.07 | | | | 5.51 | | | | 2.90 | | | | (4.38 | ) | | | 5.55 | | | | (0.76 | ) |
| Less distributions from: | | | | | | | | | | | | | | | | | | | | | | | | | |
| Net investment income | | | | — | | | | 0.01 | | | | 0.03 | | | | 0.02 | | | | 0.55 | | | | 0.37 | |
| Net realized gain | | | | — | | | | — | | | | — | | | | 0.30 | | | | 0.04 | | | | — | |
| Total distributions | | | | — | | | | 0.01 | | | | 0.03 | | | | 0.32 | | | | 0.59 | | | | 0.37 | |
| Net asset value, end of year | | | $ | 25.47 | | | $ | 22.40 | | | $ | 16.90 | | | $ | 14.03 | | | $ | 18.73 | | | $ | 13.77 | |
| Total return (%)* | | | | 13.71 | | | | 32.60 | | | | 20.58 | | | | (23.31 | ) | | | 40.53 | | | | (5.11 | ) |
| Ratios to average daily net assets (%)**: | | | | | | | | | | | | | | | | | | | | | | | | | |
| Expenses, before waivers and reimbursements | | | | 1.31 | | | | 1.45 | | | | 1.40 | | | | 1.38 | | | | 1.50 | | | | 1.51 | |
| Expenses, net of waivers and reimbursements | | | | 1.30 | | | | 1.30 | | | | 1.30 | | | | 1.33 | | | | 1.31 | | | | 1.30 | |
| Net investment income (loss), before waivers and reimbursements | | | | (0.65 | ) | | | (0.25 | ) | | | 0.18 | | | | 0.13 | | | | 0.30 | | | | 0.66 | |
| Net investment income (loss), net of waivers and reimbursements | | | | (0.64 | ) | | | (0.10 | ) | | | 0.28 | | | | 0.18 | | | | 0.49 | | | | 0.87 | |
| Class I net assets at the end of the year (in thousands) | | | $ | 166,794 | | | $ | 151,302 | | | $ | 142,885 | | | $ | 169,770 | | | $ | 282,620 | | | $ | 147,949 | |
| Portfolio turnover rate (%)* | | | | 44 | | | | 119 | | | | 142 | | | | 187 | | | | 183 | | | | 157 | |
| * | Rates are not annualized for periods less than a year. |
| ** | Rates are annualized for periods less than a year. |
| ^ | Amount is less than $0.005 per share. |
Note: Net investment income (loss) per share is based on the average shares outstanding during the year.
Performance cited represents past performance. Past performance does not guarantee future results and current performance may be lower or higher than the data quoted. Results shown are annual returns, which assume reinvestment of dividends and capital gains. Investment returns and principal will fluctuate and you may have a gain or loss when you sell shares. For the most current month-end performance information, please call 1-800-742-7272 or visit our Web site at www.williamblairfunds.com.
| June 30, 2021 | William Blair Funds | 171 |
Financial Highlights — For a share outstanding throughout each period
Emerging Markets Small Cap Growth Fund
| | | Class R6 | |
| | | (unaudited)
Period Ended
June 30, | | | Years Ended December 31, | |
| | | | 2021 | | | 2020 | | | 2019 | | | 2018 | | | 2017 | | | 2016 | |
| Net asset value, beginning of year | | | $ | 22.44 | | | $ | 16.93 | | | $ | 14.06 | | | $ | 18.76 | | | $ | 13.79 | | | $ | 14.92 | |
| Income (loss) from investment operations: | | | | | | | | | | | | | | | | | | | | | | | | | |
| Net investment income (loss) | | | | (0.07 | ) | | | (0.00 | )^ | | | 0.05 | | | | 0.05 | | | | 0.10 | | | | 0.14 | |
| Net realized and unrealized gain (loss) on investments | | | | 3.15 | | | | 5.53 | | | | 2.86 | | | | (4.41 | ) | | | 5.47 | | | | (0.89 | ) |
| Total from investment operations | | | | 3.08 | | | | 5.53 | | | | 2.91 | | | | (4.36 | ) | | | 5.57 | | | | (0.75 | ) |
| Less distributions from: | | | | | | | | | | | | | | | | | | | | | | | | | |
| Net investment income | | | | — | | | | 0.02 | | | | 0.04 | | | | 0.04 | | | | 0.56 | | | | 0.38 | |
| Net realized gain | | | | — | | | | — | | | | — | | | | 0.30 | | | | 0.04 | | | | — | |
| Total distributions | | | | — | | | | 0.02 | | | | 0.04 | | | | 0.34 | | | | 0.60 | | | | 0.38 | |
| Net asset value, end of year | | | $ | 25.52 | | | $ | 22.44 | | | $ | 16.93 | | | $ | 14.06 | | | $ | 18.76 | | | $ | 13.79 | |
| Total return (%)* | | | | 13.73 | | | | 32.66 | | | | 20.69 | | | | (23.24 | ) | | | 40.62 | | | | (5.05 | ) |
| Ratios to average daily net assets (%)**: | | | | | | | | | | | | | | | | | | | | | | | | | |
| Expenses, before waivers and reimbursements | | | | 1.24 | | | | 1.36 | | | | 1.33 | | | | 1.30 | | | | 1.29 | | | | 1.31 | |
| Expenses, net of waivers and reimbursements | | | | 1.24 | | | | 1.25 | | | | 1.25 | | | | 1.25 | | | | 1.25 | | | | 1.25 | |
| Net investment income (loss), before waivers and reimbursements | | | | (0.55 | ) | | | (0.14 | ) | | | 0.27 | | | | 0.22 | | | | 0.53 | | | | 0.88 | |
| Net investment income (loss), net of waivers and reimbursements | | | | (0.55 | ) | | | (0.03 | ) | | | 0.35 | | | | 0.27 | | | | 0.57 | | | | 0.94 | |
| Class R6 net assets at the end of the year (in thousands) | | | $ | 319,806 | | | $ | 152,160 | | | $ | 130,711 | | | $ | 98,188 | | | $ | 166,927 | | | $ | 125,650 | |
| Portfolio turnover rate (%)* | | | | 44 | | | | 119 | | | | 142 | | | | 187 | | | | 183 | | | | 157 | |
| * | Rates are not annualized for periods less than a year. |
| ** | Rates are annualized for periods less than a year. |
| ^ | Amount is less than $0.005 per share. |
Note: Net investment income (loss) per share is based on the average shares outstanding during the year.
Performance cited represents past performance. Past performance does not guarantee future results and current performance may be lower or higher than the data quoted. Results shown are annual returns, which assume reinvestment of dividends and capital gains. Investment returns and principal will fluctuate and you may have a gain or loss when you sell shares. For the most current month-end performance information, please call 1-800-742-7272 or visit our Web site at www.williamblairfunds.com.
| 172 | Semiannual Report | June 30, 2021 |
Financial Highlights — For a share outstanding throughout each period
Bond Fund
| | Class N | |
| | (unaudited)
Period Ended
June 30, | | | Years Ended December 31, | |
| | | 2021 | | | 2020 | | | 2019 | | | 2018 | | | 2017 | | | 2016 | |
| Net asset value, beginning of year | | $ | 10.83 | | | $ | 10.41 | | | $ | 9.75 | | | $ | 10.41 | | | $ | 10.41 | | | $ | 10.34 | |
| Income (loss) from investment operations: | | | | | | | | | | | | | | | | | | | | | | | | |
| Net investment income (loss) | | | 0.10 | | | | 0.24 | | | | 0.30 | | | | 0.31 | | | | 0.27 | | | | 0.27 | |
| Net realized and unrealized gain (loss) on investments | | | (0.24 | ) | | | 0.54 | | | | 0.77 | | | | (0.56 | ) | | | 0.12 | | | | 0.18 | |
| Total from investment operations | | | (0.14 | ) | | | 0.78 | | | | 1.07 | | | | (0.25 | ) | | | 0.39 | | | | 0.45 | |
| Less distributions from: | | | | | | | | | | | | | | | | | | | | | | | | |
| Net investment income | | | 0.14 | | | | 0.36 | | | | 0.41 | | | | 0.41 | | | | 0.39 | | | | 0.38 | |
| Net realized gain | | | — | | | | — | | | | — | | | | — | | | | — | | | | — | |
| Total distributions | | | 0.14 | | | | 0.36 | | | | 0.41 | | | | 0.41 | | | | 0.39 | | | | 0.38 | |
| Net asset value, end of year | | $ | 10.55 | | | $ | 10.83 | | | $ | 10.41 | | | $ | 9.75 | | | $ | 10.41 | | | $ | 10.41 | |
| Total return (%)* | | | (1.23 | ) | | | 7.63 | | | | 11.09 | | | | (2.42 | ) | | | 3.83 | | | | 4.40 | |
| Ratios to average daily net assets (%)**: | | | | | | | | | | | | | | | | | | | | | | | | |
| Expenses, before waivers and reimbursements | | | 0.70 | | | | 0.79 | | | | 0.69 | | | | 0.69 | | | | 0.82 | | | | 0.82 | |
| Expenses, net of waivers and reimbursements | | | 0.60 | | | | 0.60 | | | | 0.60 | | | | 0.62 | | | | 0.65 | | | | 0.65 | |
| Net investment income (loss), before waivers and reimbursements | | | 1.72 | | | | 2.04 | | | | 2.90 | | | | 3.01 | | | | 2.40 | | | | 2.43 | |
| Net investment income (loss), net of waivers and reimbursements | | | 1.82 | | | | 2.23 | | | | 2.99 | | | | 3.08 | | | | 2.57 | | | | 2.60 | |
| Class N net assets at the end of the year (in thousands) | | $ | 39,108 | | | $ | 39,522 | | | $ | 32,176 | | | $ | 70,253 | | | $ | 83,662 | | | $ | 125,866 | |
| Portfolio turnover rate (%)* | | | 21 | | | | 71 | | | | 58 | | | | 40 | | | | 17 | | | | 17 | |
| | | | | | | | | | | | | | | | | | | | | | | | | |
| | Class I | |
| | (unaudited)
Period Ended
June 30, | | | Years Ended December 31, | |
| | | | 2021 | | | | 2020 | | | | 2019 | | | | 2018 | | | | 2017 | | | | 2016 | |
| Net asset value, beginning of year | | $ | 10.71 | | | $ | 10.30 | | | $ | 9.65 | | | $ | 10.31 | | | $ | 10.30 | | | $ | 10.24 | |
| Income (loss) from investment operations: | | | | | | | | | | | | | | | | | | | | | | | | |
| Net investment income (loss) | | | 0.10 | | | | 0.25 | | | | 0.31 | | | | 0.32 | | | | 0.29 | | | | 0.30 | |
| Net realized and unrealized gain (loss) on investments | | | (0.22 | ) | | | 0.54 | | | | 0.76 | | | | (0.56 | ) | | | 0.13 | | | | 0.16 | |
| Total from investment operations | | | (0.12 | ) | | | 0.79 | | | | 1.07 | | | | (0.24 | ) | | | 0.42 | | | | 0.46 | |
| Less distributions from: | | | | | | | | | | | | | | | | | | | | | | | | |
| Net investment income | | | 0.15 | | | | 0.38 | | | | 0.42 | | | | 0.42 | | | | 0.41 | | | | 0.40 | |
| Net realized gain | | | — | | | | — | | | | — | | | | — | | | | — | | | | — | |
| Total distributions | | | 0.15 | | | | 0.38 | | | | 0.42 | | | | 0.42 | | | | 0.41 | | | | 0.40 | |
| Net asset value, end of year | | $ | 10.44 | | | $ | 10.71 | | | $ | 10.30 | | | $ | 9.65 | | | $ | 10.31 | | | $ | 10.30 | |
| Total return (%)* | | | (1.09 | ) | | | 7.73 | | | | 11.22 | | | | (2.31 | ) | | | 4.16 | | | | 4.55 | |
| Ratios to average daily net assets (%)**: | | | | | | | | | | | | | | | | | | | | | | | | |
| Expenses, before waivers and reimbursements | | | 0.49 | | | | 0.55 | | | | 0.47 | | | | 0.46 | | | | 0.60 | | | | 0.58 | |
| Expenses, net of waivers and reimbursements | | | 0.45 | | | | 0.45 | | | | 0.45 | | | | 0.46 | | | | 0.43 | | | | 0.41 | |
| Net investment income (loss), before waivers and reimbursements | | | 1.93 | | | | 2.29 | | | | 3.10 | | | | 3.24 | | | | 2.62 | | | | 2.66 | |
| Net investment income (loss), net of waivers and reimbursements | | | 1.97 | | | | 2.39 | | | | 3.12 | | | | 3.24 | | | | 2.79 | | | | 2.83 | |
| Class I net assets at the end of the year (in thousands) | | $ | 246,624 | | | $ | 232,716 | | | $ | 206,304 | | | $ | 281,442 | | | $ | 384,464 | | | $ | 322,174 | |
| Portfolio turnover rate (%)* | | | 21 | | | | 71 | | | | 58 | | | | 40 | | | | 17 | | | | 17 | |
| * | Rates are not annualized for periods less than a year. |
| ** | Rates are annualized for periods less than a year. |
Note: Net investment income (loss) per share is based on the average shares outstanding during the year.
Performance cited represents past performance. Past performance does not guarantee future results and current performance may be lower or higher than the data quoted. Results shown are annual returns, which assume reinvestment of dividends and capital gains. Investment returns and principal will fluctuate and you may have a gain or loss when you sell shares. For the most current month-end performance information, please call 1-800-742-7272 or visit our Web site at www.williamblairfunds.com.
| June 30, 2021 | William Blair Funds | 173 |
Financial Highlights — For a share outstanding throughout each period
Bond Fund
| | Class R6 | |
| | (unaudited)
Period Ended
June 30, | | | Years Ended December 31, | |
| | | | 2021 | | | | 2020 | | | | 2019 | | | | 2018 | | | | 2017 | | | | 2016 | |
| Net asset value, beginning of year | | $ | 10.71 | | | $ | 10.30 | | | $ | 9.64 | | | $ | 10.30 | | | $ | 10.29 | | | $ | 10.23 | |
| Income (loss) from investment operations: | | | | | | | | | | | | | | | | | | | | | | | | |
| Net investment income (loss) | | | 0.10 | | | | 0.26 | | | | 0.32 | | | | 0.33 | | | | 0.30 | | | | 0.30 | |
| Net realized and unrealized gain (loss) on investments | | | (0.23 | ) | | | 0.53 | | | | 0.76 | | | | (0.56 | ) | | | 0.13 | | | | 0.17 | |
| Total from investment operations | | | (0.13 | ) | | | 0.79 | | | | 1.08 | | | | (0.23 | ) | | | 0.43 | | | | 0.47 | |
| Less distributions from: | | | | | | | | | | | | | | | | | | | | | | | | |
| Net investment income | | | 0.15 | | | | 0.38 | | | | 0.42 | | | | 0.43 | | | | 0.42 | | | | 0.41 | |
| Net realized gain | | | — | | | | — | | | | — | | | | — | | | | — | | | | — | |
| Total distributions | | | 0.15 | | | | 0.38 | | | | 0.42 | | | | 0.43 | | | | 0.42 | | | | 0.41 | |
| Net asset value, end of year | | $ | 10.43 | | | $ | 10.71 | | | $ | 10.30 | | | $ | 9.64 | | | $ | 10.30 | | | $ | 10.29 | |
| Total return (%)* | | | (1.16 | ) | | | 7.79 | | | | 11.39 | | | | (2.26 | ) | | | 4.24 | | | | 4.61 | |
| Ratios to average daily net assets (%)**: | | | | | | | | | | | | | | | | | | | | | | | | |
| Expenses, before waivers and reimbursements | | | 0.42 | | | | 0.46 | | | | 0.41 | | | | 0.38 | | | | 0.37 | | | | 0.37 | |
| Expenses, net of waivers and reimbursements | | | 0.40 | | | | 0.40 | | | | 0.40 | | | | 0.38 | | | | 0.35 | | | | 0.35 | |
| Net investment income (loss), before waivers and reimbursements | | | 2.00 | | | | 2.39 | | | | 3.17 | | | | 3.32 | | | | 2.85 | | | | 2.88 | |
| Net investment income (loss), net of waivers and reimbursements | | | 2.02 | | | | 2.45 | | | | 3.18 | | | | 3.32 | | | | 2.87 | | | | 2.90 | |
| Class R6 net assets at the end of the year (in thousands) | | $ | 49,699 | | | $ | 48,482 | | | $ | 43,655 | | | $ | 70,851 | | | $ | 91,629 | | | $ | 95,216 | |
| Portfolio turnover rate (%)* | | | 21 | | | | 71 | | | | 58 | | | | 40 | | | | 17 | | | | 17 | |
| * | Rates are not annualized for periods less than a year. |
| ** | Rates are annualized for periods less than a year. |
Note: Net investment income (loss) per share is based on the average shares outstanding during the year.
Performance cited represents past performance. Past performance does not guarantee future results and current performance may be lower or higher than the data quoted. Results shown are annual returns, which assume reinvestment of dividends and capital gains. Investment returns and principal will fluctuate and you may have a gain or loss when you sell shares. For the most current month-end performance information, please call 1-800-742-7272 or visit our Web site at www.williamblairfunds.com.
| 174 | Semiannual Report | June 30, 2021 |
Financial Highlights — For a share outstanding throughout each period
Income Fund
| | Class N | |
| | (unaudited)
Period Ended
June 30, | | | Years Ended December 31, | |
| | | 2021 | | | 2020 | | | 2019 | | | 2018 | | | 2017 | | | 2016 | |
| Net asset value, beginning of year | | $ | 8.71 | | | $ | 8.57 | | | $ | 8.36 | | | $ | 8.72 | | | $ | 8.86 | | | $ | 8.90 | |
| Income (loss) from investment operations: | | | | | | | | | | | | | | | | | | | | | | | | |
| Net investment income (loss) | | | 0.04 | | | | 0.12 | | | | 0.17 | | | | 0.17 | | | | 0.16 | | | | 0.16 | |
| Net realized and unrealized gain (loss) on investments | | | (0.11 | ) | | | 0.25 | | | | 0.32 | | | | (0.25 | ) | | | (0.03 | ) | | | 0.06 | |
| Total from investment operations | | | (0.07 | ) | | | 0.37 | | | | 0.49 | | | | (0.08 | ) | | | 0.13 | | | | 0.22 | |
| Less distributions from: | | | | | | | | | | | | | | | | | | | | | | | | |
| Net investment income | | | 0.08 | | | | 0.23 | | | | 0.28 | | | | 0.28 | | | | 0.27 | | | | 0.26 | |
| Net realized gain | | | — | | | | — | | | | — | | | | — | | | | — | | | | — | |
| Total distributions | | | 0.08 | | | | 0.23 | | | | 0.28 | | | | 0.28 | | | | 0.27 | | | | 0.26 | |
| Net asset value, end of year | | $ | 8.56 | | | $ | 8.71 | | | $ | 8.57 | | | $ | 8.36 | | | $ | 8.72 | | | $ | 8.86 | |
| Total return (%)* | | | (0.83 | ) | | | 4.34 | | | | 5.92 | | | | (0.86 | ) | | | 1.46 | | | | 2.44 | |
| Ratios to average daily net assets (%)**: | | | | | | | | | | | | | | | | | | | | | | | | |
| Expenses, before waivers and reimbursements | | | 0.92 | | | | 1.03 | | | | 0.98 | | | | 0.91 | | | | 0.88 | | | | 0.79 | |
| Expenses, net of waivers and reimbursements | | | 0.85 | | | | 0.85 | | | | 0.85 | | | | 0.85 | | | | 0.85 | | | | 0.79 | |
| Net investment income (loss), before waivers and reimbursements | | | 0.77 | | | | 1.16 | | | | 1.85 | | | | 1.96 | | | | 1.77 | | | | 1.80 | |
| Net investment income (loss), net of waivers and reimbursements | | | 0.84 | | | | 1.34 | | | | 1.98 | | | | 2.02 | | | | 1.80 | | | | 1.80 | |
| Class N net assets at the end of the year (in thousands) | | $ | 17,205 | | | $ | 22,610 | | | $ | 19,662 | | | $ | 22,422 | | | $ | 39,625 | | | $ | 52,710 | |
| Portfolio turnover rate (%)* | | | 33 | | | | 57 | | | | 114 | | | | 97 | | | | 37 | | | | 22 | |
| | | | | | | | | | | | | | | | | | | | | | | | | |
| | Class I | |
| | (unaudited)
Period Ended
June 30, | | | Years Ended December 31, | |
| | | | 2021 | | | | 2020 | | | | 2019 | | | | 2018 | | | | 2017 | | | | 2016 | |
| Net asset value, beginning of year | | $ | 8.65 | | | $ | 8.52 | | | $ | 8.30 | | | $ | 8.66 | | | $ | 8.80 | | | $ | 8.83 | |
| Income (loss) from investment operations: | | | | | | | | | | | | | | | | | | | | | | | | |
| Net investment income (loss) | | | 0.04 | | | | 0.12 | | | | 0.18 | | | | 0.19 | | | | 0.18 | | | | 0.18 | |
| Net realized and unrealized gain (loss) on investments | | | (0.11 | ) | | | 0.25 | | | | 0.33 | | | | (0.25 | ) | | | (0.03 | ) | | | 0.06 | |
| Total from investment operations | | | (0.07 | ) | | | 0.37 | | | | 0.51 | | | | (0.06 | ) | | | 0.15 | | | | 0.24 | |
| Less distributions from: | | | | | | | | | | | | | | | | | | | | | | | | |
| Net investment income | | | 0.08 | | | | 0.24 | | | | 0.29 | | | | 0.30 | | | | 0.29 | | | | 0.27 | |
| Net realized gain | | | — | | | | — | | | | — | | | | — | | | | — | | | | — | |
| Total distributions | | | 0.08 | | | | 0.24 | | | | 0.29 | | | | 0.30 | | | | 0.29 | | | | 0.27 | |
| Net asset value, end of year | | $ | 8.50 | | | $ | 8.65 | | | $ | 8.52 | | | $ | 8.30 | | | $ | 8.66 | | | $ | 8.80 | |
| Total return (%)* | | | (0.76 | ) | | | 4.39 | | | | 6.24 | | | | (0.69 | ) | | | 1.68 | | | | 2.78 | |
| Ratios to average daily net assets (%)**: | | | | | | | | | | | | | | | | | | | | | | | | |
| Expenses, before waivers and reimbursements | | | 0.68 | | | | 0.78 | | | | 0.74 | | | | 0.65 | | | | 0.62 | | | | 0.57 | |
| Expenses, net of waivers and reimbursements | | | 0.68 | | | | 0.70 | | | | 0.70 | | | | 0.65 | | | | 0.62 | | | | 0.57 | |
| Net investment income (loss), before waivers and reimbursements | | | 1.01 | | | | 1.35 | | | | 2.10 | | | | 2.22 | | | | 2.03 | | | | 2.05 | |
| Net investment income (loss), net of waivers and reimbursements | | | 1.01 | | | | 1.43 | | | | 2.14 | | | | 2.22 | | | | 2.03 | | | | 2.05 | |
| Class I net assets at the end of the year (in thousands) | | $ | 34,654 | | | $ | 45,641 | | | $ | 31,629 | | | $ | 34,793 | | | $ | 51,153 | | | $ | 58,160 | |
| Portfolio turnover rate (%)* | | | 33 | | | | 57 | | | | 114 | | | | 97 | | | | 37 | | | | 22 | |
| * | Rates are not annualized for periods less than a year. |
| ** | Rates are annualized for periods less than a year. |
Note: Net investment income (loss) per share is based on the average shares outstanding during the year.
Performance cited represents past performance. Past performance does not guarantee future results and current performance may be lower or higher than the data quoted. Results shown are annual returns, which assume reinvestment of dividends and capital gains. Investment returns and principal will fluctuate and you may have a gain or loss when you sell shares. For the most current month-end performance information, please call 1-800-742-7272 or visit our Web site at www.williamblairfunds.com.
| June 30, 2021 | William Blair Funds | 175 |
Financial Highlights — For a share outstanding throughout each period
Income Fund
| | | Class R6 | |
| | | (unaudited)
Period Ended
June 30, | | | Years Ended December 31, | |
| | | | 2021 | | | 2020 | | | 2019(a) |
| Net asset value, beginning of year | | | $ | 8.65 | | | | $ | 8.52 | | | | $ | 8.45 | |
| Income (loss) from investment operations: | | | | | | | | | | | | | | | |
| Net investment income (loss) | | | | 0.04 | | | | | 0.13 | | | | | 0.09 | |
| Net realized and unrealized gain (loss) on investments | | | | (0.10 | ) | | | | 0.24 | | | | | 0.18 | |
| Total from investment operations | | | | (0.06 | ) | | | | 0.37 | | | | | 0.27 | |
| Less distributions from: | | | | | | | | | | | | | | | |
| Net investment income | | | | 0.09 | | | | | 0.24 | | | | | 0.20 | |
| Net realized gain | | | | — | | | | | — | | | | | — | |
| Total distributions | | | | 0.09 | | | | | 0.24 | | | | | 0.20 | |
| Net asset value, end of year | | | $ | 8.50 | | | | $ | 8.65 | | | | $ | 8.52 | |
| Total return (%)* | | | | (0.73 | ) | | | | 4.44 | | | | | 3.18 | |
| Ratios to average daily net assets (%)**: | | | | | | | | | | | | | | | |
| Expenses, before of waivers and reimbursements | | | | 0.62 | | | | | 0.73 | | | | | 0.71 | |
| Expenses, net waivers and reimbursements | | | | 0.62 | | | | | 0.65 | | | | | 0.65 | |
| Net investment income (loss), before of waivers and reimbursements | | | | 1.00 | | | | | 1.47 | | | | | 1.46 | |
| Net investment income (loss), net waivers and reimbursements | | | | 1.00 | | | | | 1.55 | | | | | 1.52 | |
| Class R6 net assets at end of year (in thousands) | | | $ | 190 | | | | $ | 71 | | | | $ | 52 | |
| Portfolio turnover rate (%)* | | | | 33 | | | | | 57 | | | | | 114 | |
| (a) | For the period from May 2, 2019 (Commencement of Operations) to December 31, 2019. |
| * | Rates are not annualized for periods less than a year. |
| ** | Rates are annualized for periods less than a year. |
Note: Net investment income (loss) per share is based on the average shares outstanding during the year.
Performance cited represents past performance. Past performance does not guarantee future results and current performance may be lower or higher than the data quoted. Results shown are annual returns, which assume reinvestment of dividends and capital gains. Investment returns and principal will fluctuate and you may have a gain or loss when you sell shares. For the most current month-end performance information, please call 1-800-742-7272 or visit our Web site at www.williamblairfunds.com.
| 176 | Semiannual Report | June 30, 2021 |
Financial Highlights — For a share outstanding throughout each period
Low Duration Fund
| | Class N | |
| | (unaudited)
Period Ended
June 30, | | | Years Ended December 31, | |
| | | 2021 | | | 2020 | | | 2019 | | | 2018 | | | 2017 | | | 2016 | |
| Net asset value, beginning of year | | $ | 8.65 | | | $ | 8.68 | | | $ | 8.70 | | | $ | 8.92 | | | $ | 9.07 | | | $ | 9.16 | |
| Income (loss) from investment operations: | | | | | | | | | | | | | | | | | | | | | | | | |
| Net investment income (loss) | | | 0.02 | | | | 0.08 | | | | 0.19 | | | | 0.17 | | | | 0.11 | | | | 0.09 | |
| Net realized and unrealized gain (loss) on investments | | | (0.02 | ) | | | 0.14 | | | | 0.11 | | | | (0.10 | ) | | | (0.04 | ) | | | 0.02 | |
| Total from investment operations | | | — | | | | 0.22 | | | | 0.30 | | | | 0.07 | | | | 0.07 | | | | 0.11 | |
| Less distributions from: | | | | | | | | | | | | | | | | | | | | | | | | |
| Net investment income | | | 0.08 | | | | 0.25 | | | | 0.32 | | | | 0.29 | | | | 0.22 | | | | 0.20 | |
| Net realized gain | | | — | | | | — | | | | — | | | | — | | | | — | | | | — | |
| Total distributions | | | 0.08 | | | | 0.25 | | | | 0.32 | | | | 0.29 | | | | 0.22 | | | | 0.20 | |
| Net asset value, end of year | | $ | 8.57 | | | $ | 8.65 | | | $ | 8.68 | | | $ | 8.70 | | | $ | 8.92 | | | $ | 9.07 | |
| Total return (%)* | | | 0.05 | | | | 2.56 | | | | 3.48 | | | | 0.80 | | | | 0.84 | | | | 1.16 | |
| Ratios to average daily net assets (%)**: | | | | | | | | | | | | | | | | | | | | | | | | |
| Expenses, before waivers and reimbursements | | | 0.71 | | | | 0.84 | | | | 0.75 | | | | 0.72 | | | | 0.79 | | | | 0.83 | |
| Expenses, net of waivers and reimbursements | | | 0.55 | | | | 0.55 | | | | 0.55 | | | | 0.58 | | | | 0.61 | | | | 0.68 | |
| Net investment income (loss), before waivers and reimbursements | | | 0.28 | | | | 0.60 | | | | 1.96 | | | | 1.83 | | | | 1.04 | | | | 0.83 | |
| Net investment income (loss), net of waivers and reimbursements | | | 0.44 | | | | 0.89 | | | | 2.16 | | | | 1.97 | | | | 1.22 | | | | 0.98 | |
| Class N net assets at the end of the year (in thousands) | | $ | 16,119 | | | $ | 13,736 | | | $ | 1,513 | | | $ | 1,661 | | | $ | 1,979 | | | $ | 7,237 | |
| Portfolio turnover rate (%)* | | | 82 | | | | 72 | | | | 183 | | | | 122 | | | | 109 | | | | 81 | |
| | | | | | | | | | | | | | | | | | | | | | | | | |
| | Class I | |
| | (unaudited)
Period Ended
June 30, | | | Years Ended December 31, | |
| | | | 2021 | | | | 2020 | | | | 2019 | | | | 2018 | | | | 2017 | | | | 2016 | |
| Net asset value, beginning of year | | $ | 8.64 | | | $ | 8.67 | | | $ | 8.70 | | | $ | 8.91 | | | $ | 9.07 | | | $ | 9.16 | |
| Income (loss) from investment operations: | | | | | | | | | | | | | | | | | | | | | | | | |
| Net investment income (loss) | | | 0.03 | | | | 0.10 | | | | 0.20 | | | | 0.19 | | | | 0.13 | | | | 0.11 | |
| Net realized and unrealized gain (loss) on investments | | | (0.02 | ) | | | 0.13 | | | | 0.10 | | | | (0.09 | ) | | | (0.05 | ) | | | 0.02 | |
| Total from investment operations | | | 0.01 | | | | 0.23 | | | | 0.30 | | | | 0.10 | | | | 0.08 | | | | 0.13 | |
| Less distributions from: | | | | | | | | | | | | | | | | | | | | | | | | |
| Net investment income | | | 0.09 | | | | 0.26 | | | | 0.33 | | | | 0.31 | | | | 0.24 | | | | 0.22 | |
| Net realized gain | | | — | | | | — | | | | — | | | | — | | | | — | | | | — | |
| Total distributions | | | 0.09 | | | | 0.26 | | | | 0.33 | | | | 0.31 | | | | 0.24 | | | | 0.22 | |
| Net asset value, end of year | | $ | 8.56 | | | $ | 8.64 | | | $ | 8.67 | | | $ | 8.70 | | | $ | 8.91 | | | $ | 9.07 | |
| Total return (%)* | | | 0.12 | | | | 2.72 | | | | 3.52 | | | | 1.12 | | | | 0.91 | | | | 1.40 | |
| Ratios to average daily net assets (%)**: | | | | | | | | | | | | | | | | | | | | | | | | |
| Expenses, before waivers and reimbursements | | | 0.51 | | | | 0.60 | | | | 0.53 | | | | 0.46 | | | | 0.59 | | | | 0.59 | |
| Expenses, net of waivers and reimbursements | | | 0.40 | | | | 0.40 | | | | 0.40 | | | | 0.39 | | | | 0.41 | | | | 0.44 | |
| Net investment income (loss), before waivers and reimbursements | | | 0.49 | | | | 0.98 | | | | 2.19 | | | | 2.05 | | | | 1.27 | | | | 1.05 | |
| Net investment income (loss), net of waivers and reimbursements | | | 0.60 | | | | 1.18 | | | | 2.32 | | | | 2.12 | | | | 1.45 | | | | 1.20 | |
| Class I net assets at the end of the year (in thousands) | | $ | 102,003 | | | $ | 104,093 | | | $ | 38,156 | | | $ | 56,120 | | | $ | 131,186 | | | $ | 219,714 | |
| Portfolio turnover rate (%)* | | | 82 | | | | 72 | | | | 183 | | | | 122 | | | | 109 | | | | 81 | |
| * | Rates are not annualized for periods less than a year. |
| ** | Rates are annualized for periods less than a year. |
Note: Net investment income (loss) per share is based on the average shares outstanding during the year.
Performance cited represents past performance. Past performance does not guarantee future results and current performance may be lower or higher than the data quoted. Results shown are annual returns, which assume reinvestment of dividends and capital gains. Investment returns and principal will fluctuate and you may have a gain or loss when you sell shares. For the most current month-end performance information, please call 1-800-742-7272 or visit our Web site at www.williamblairfunds.com.
| June 30, 2021 | William Blair Funds | 177 |
Financial Highlights — For a share outstanding throughout each period
Low Duration Fund
| | Class R6 | |
| | (unaudited)
Period Ended
June 30, | | | Years Ended December 31, | |
| | | | 2021 | | | | 2020 | | | | 2019 | | | | 2018 | | | | 2017 | | | | 2016 | |
| Net asset value, beginning of year | | $ | 8.64 | | | $ | 8.68 | | | $ | 8.70 | | | $ | 8.91 | | | $ | 9.07 | | | $ | 9.16 | |
| Income (loss) from investment operations: | | | | | | | | | | | | | | | | | | | | | | | | |
| Net investment income (loss) | | | 0.03 | | | | 0.12 | | | | 0.21 | | | | 0.19 | | | | 0.14 | | | | 0.11 | |
| Net realized and unrealized gain (loss) on investments | | | (0.02 | ) | | | 0.11 | | | | 0.11 | | | | (0.09 | ) | | | (0.05 | ) | | | 0.02 | |
| Total from investment operations | | | 0.01 | | | | 0.23 | | | | 0.32 | | | | 0.10 | | | | 0.09 | | | | 0.13 | |
| Less distributions from: | | | | | | | | | | | | | | | | | | | | | | | | |
| Net investment income | | | 0.09 | | | | 0.27 | | | | 0.34 | | | | 0.31 | | | | 0.25 | | | | 0.22 | |
| Net realized gain | | | — | | | | — | | | | — | | | | — | | | | — | | | | — | |
| Total distributions | | | 0.09 | | | | 0.27 | | | | 0.34 | | | | 0.31 | | | | 0.25 | | | | 0.22 | |
| Net asset value, end of year | | $ | 8.56 | | | $ | 8.64 | | | $ | 8.68 | | | $ | 8.70 | | | $ | 8.91 | | | $ | 9.07 | |
| Total return (%)* | | | 0.15 | | | | 2.65 | | | | 3.69 | | | | 1.15 | | | | 0.96 | | | | 1.43 | |
| Ratios to average daily net assets (%)**: | | | | | | | | | | | | | | | | | | | | | | | | |
| Expenses, before waivers and reimbursements | | | 0.47 | | | | 0.53 | | | | 0.50 | | | | 0.42 | | | | 0.40 | | | | 0.40 | |
| Expenses, net of waivers and reimbursements | | | 0.35 | | | | 0.35 | | | | 0.35 | | | | 0.35 | | | | 0.37 | | | | 0.40 | |
| Net investment income (loss), before waivers and reimbursements | | | 0.53 | | | | 1.19 | | | | 2.22 | | | | 2.10 | | | | 1.48 | | | | 1.25 | |
| Net investment income (loss), net of waivers and reimbursements | | | 0.65 | | | | 1.37 | | | | 2.37 | | | | 2.17 | | | | 1.51 | | | | 1.25 | |
| Class R6 net assets at the end of the year (in thousands) | | $ | 22,571 | | | $ | 40,551 | | | $ | 36,846 | | | $ | 47,585 | | | $ | 99,912 | | | $ | 53,122 | |
| Portfolio turnover rate (%)* | | | 82 | | | | 72 | | | | 183 | | | | 122 | | | | 109 | | | | 81 | |
| * | Rates are not annualized for periods less than a year. |
| ** | Rates are annualized for periods less than a year. |
Note: Net investment income (loss) per share is based on the average shares outstanding during the year.
Performance cited represents past performance. Past performance does not guarantee future results and current performance may be lower or higher than the data quoted. Results shown are annual returns, which assume reinvestment of dividends and capital gains. Investment returns and principal will fluctuate and you may have a gain or loss when you sell shares. For the most current month-end performance information, please call 1-800-742-7272 or visit our Web site at www.williamblairfunds.com.
| 178 | Semiannual Report | June 30, 2021 |
Financial Highlights — For a share outstanding throughout each period
Emerging Markets Debt Fund
| | Class I | |
| | (unaudited)
Period Ended
June 30, | |
| | | 2021(a) | |
| Net asset value, beginning of year | | $ | 10.00 | |
| Income (loss) from investment operations: | | | | |
| Net investment income (loss) | | | 0.04 | |
| Net realized and unrealized gain (loss) on investments | | | (0.00 | )^ |
| Total from investment operations | | | 0.04 | |
| Less distributions from: | | | | |
| Net investment income | | | 0.04 | |
| Net realized gain | | | — | |
| Total distributions | | | 0.04 | |
| Net asset value, end of year | | $ | 10.00 | |
| Total return (%)* | | | 0.37 | |
| Ratios to average daily net assets (%)**: | | | | |
| Expenses, before waivers and reimbursements | | | 1.51 | |
| Expenses, net of waivers and reimbursements | | | 0.70 | |
| Net investment income (loss), before waivers and reimbursements | | | 3.22 | |
| Net investment income (loss), net of waivers and reimbursements | | | 4.03 | |
| Class I net assets at end of year (in thousands) | | $ | 1,151 | |
| Portfolio turnover rate (%)* | | | 17 | |
| | | | | |
| | Class R6 | |
| | (unaudited)
Period Ended
June 30, | |
| | | | 2021(a) | |
| Net asset value, beginning of year | | $ | 10.00 | |
| Income (loss) from investment operations: | | | | |
| Net investment income (loss) | | | 0.04 | |
| Net realized and unrealized gain (loss) on investments | | | (0.00 | )^ |
| Total from investment operations | | | 0.04 | |
| Less distributions from: | | | | |
| Net investment income | | | 0.04 | |
| Net realized gain | | | — | |
| Total distributions | | | 0.04 | |
| Net asset value, end of year | | $ | 10.00 | |
| Total return (%)* | | | 0.37 | |
| Ratios to average daily net assets (%)**: | | | | |
| Expenses, before waivers and reimbursements | | | 1.53 | |
| Expenses, net of waivers and reimbursements | | | 0.65 | |
| Net investment income (loss), before waivers and reimbursements | | | 3.23 | |
| Net investment income (loss), net of waivers and reimbursements | | | 4.11 | |
| Class R6 net assets at end of year (in thousands) | | $ | 22,874 | |
| Portfolio turnover rate (%)* | | | 17 | |
| (a) | For the period from May 25, 2021 (Commencement of Operations) to June 30, 2021. |
| * | Rates are not annualized for periods less than a year. |
| ** | Rates are annualized for periods less than a year. |
| ^ | Amount is less than $0.005 per share. |
Note: Net investment income (loss) per share is based on the average shares outstanding during the year.
Performance cited represents past performance. Past performance does not guarantee future results and current performance may be lower or higher than the data quoted. Results shown are annual returns, which assume reinvestment of dividends and capital gains. Investment returns and principal will fluctuate and you may have a gain or loss when you sell shares. For the most current month-end performance information, please call 1-800-742-7272 or visit our Web site at www.williamblairfunds.com.
| June 30, 2021 | William Blair Funds | 179 |
Financial Highlights — For a share outstanding throughout each period
Macro Allocation Fund
| | Class N | |
| | (unaudited)
Period Ended
June 30, | | | Years Ended December 31, | |
| | | | 2021 | | | | 2020 | | | | 2019 | | | | 2018 | | | | 2017 | | | | 2016 | |
| Net asset value, beginning of year | | $ | 10.93 | | | $ | 11.44 | | | $ | 11.41 | | | $ | 11.84 | | | $ | 11.34 | | | $ | 11.32 | |
| Income (loss) from investment operations: | | | | | | | | | | | | | | | | | | | | | | | | |
| Net investment income (loss) | | | 0.02 | | | | 0.04 | | | | 0.08 | | | | 0.08 | | | | 0.06 | | | | 0.04 | |
| Net realized and unrealized gain (loss) on investments | | | 0.40 | | | | (0.44 | ) | | | 0.37 | | | | (0.24 | ) | | | 0.51 | | | | 0.19 | |
| Total from investment operations | | | 0.42 | | | | (0.40 | ) | | | 0.45 | | | | (0.16 | ) | | | 0.57 | | | | 0.23 | |
| Less distributions from: | | | | | | | | | | | | | | | | | | | | | | | | |
| Net investment income | | | — | | | | 0.11 | | | | 0.42 | | | | 0.27 | | | | 0.07 | | | | 0.21 | |
| Net realized gain | | | — | | | | — | | | | — | | | | — | | | | — | | | | — | |
| Total distributions | | | — | | | | 0.11 | | | | 0.42 | | | | 0.27 | | | | 0.07 | | | | 0.21 | |
| Net asset value, end of year | | $ | 11.35 | | | $ | 10.93 | | | $ | 11.44 | | | $ | 11.41 | | | $ | 11.84 | | | $ | 11.34 | |
| Total return (%)* | | | 3.84 | | | | (3.49 | ) | | | 3.97 | | | | (1.30 | ) | | | 5.06 | | | | 2.01 | |
| Ratios to average daily net assets (%)**: | | | | | | | | | | | | | | | | | | | | | | | | |
| Expenses, before waivers and reimbursements | | | 1.37 | | | | 1.36 | | | | 1.22 | | | | 1.30 | | | | 1.52 | | | | 1.38 | |
| Expenses, net of waivers and reimbursements | | | 1.25 | | | | 1.26 | | | | 1.22 | | | | 1.30 | | | | 1.37 | | | | 1.23 | |
| Expenses (excluding interest or short dividend expense), net of waivers and reimbursements | | | 1.23 | | | | 1.25 | | | | 1.21 | | | | 1.28 | | | | 1.31 | | | | 1.23 | |
| Net investment income (loss), before waivers and reimbursements | | | 0.24 | | | | 0.26 | | | | 0.70 | | | | 0.66 | | | | 0.35 | | | | 0.17 | |
| Net investment income (loss), net of waivers and reimbursements | | | 0.36 | | | | 0.36 | | | | 0.70 | | | | 0.66 | | | | 0.50 | | | | 0.32 | |
| Class N net assets at the end of the year (in thousands) | | $ | 7,124 | | | $ | 7,674 | | | $ | 13,717 | | | $ | 43,463 | | | $ | 41,483 | | | $ | 61,376 | |
| Portfolio turnover rate (%)* | | | 25 | | | | 29 | | | | 31 | | | | 36 | | | | 43 | | | | 50 | |
| | | | | | | | | | | | | | | | | | | | | | | | | |
| | Class I | |
| | (unaudited)
Period Ended
June 30, | | | Years Ended December 31, | |
| | | | 2021 | | | | 2020 | | | | 2019 | | | | 2018 | | | | 2017 | | | | 2016 | |
| Net asset value, beginning of year | | $ | 10.85 | | | $ | 11.35 | | | $ | 11.38 | | | $ | 11.88 | | | $ | 11.38 | | | $ | 11.38 | |
| Income (loss) from investment operations: | | | | | | | | | | | | | | | | | | | | | | | | |
| Net investment income (loss) | | | 0.03 | | | | 0.06 | | | | 0.13 | | | | 0.11 | | | | 0.11 | | | | 0.08 | |
| Net realized and unrealized gain (loss) on investments | | | 0.40 | | | | (0.42 | ) | | | 0.34 | | | | (0.24 | ) | | | 0.51 | | | | 0.18 | |
| Total from investment operations | | | 0.43 | | | | (0.36 | ) | | | 0.47 | | | | (0.13 | ) | | | 0.62 | | | | 0.26 | |
| Less distributions from: | | | | | | | | | | | | | | | | | | | | | | | | |
| Net investment income | | | — | | | | 0.14 | | | | 0.50 | | | | 0.37 | | | | 0.12 | | | | 0.26 | |
| Net realized gain | | | — | | | | — | | | | — | | | | — | | | | — | | | | — | |
| Total distributions | | | — | | | | 0.14 | | | | 0.50 | | | | 0.37 | | | | 0.12 | | | | 0.26 | |
| Net asset value, end of year | | $ | 11.28 | | | $ | 10.85 | | | $ | 11.35 | | | $ | 11.38 | | | $ | 11.88 | | | $ | 11.38 | |
| Total return (%)* | | | 3.96 | | | | (3.15 | ) | | | 4.14 | | | | (1.08 | ) | | | 5.50 | | | | 2.26 | |
| Ratios to average daily net assets (%)**: | | | | | | | | | | | | | | | | | | | | | | | | |
| Expenses, before waivers and reimbursements | | | 1.10 | | | | 1.04 | | | | 0.97 | | | | 0.99 | | | | 1.17 | | | | 1.12 | |
| Expenses, net of waivers and reimbursements | | | 1.00 | | | | 1.01 | | | | 0.97 | | | | 0.99 | | | | 1.02 | | | | 0.97 | |
| Expenses (excluding interest or short dividend expense), net of waivers and reimbursements | | | 0.98 | | | | 1.00 | | | | 0.96 | | | | 0.97 | | | | 0.96 | | | | 0.97 | |
| Net investment income (loss), before waivers and reimbursements | | | 0.39 | | | | 0.56 | | | | 1.09 | | | | 0.95 | | | | 0.75 | | | | 0.52 | |
| Net investment income (loss), net of waivers and reimbursements | | | 0.49 | | | | 0.59 | | | | 1.09 | | | | 0.95 | | | | 0.90 | | | | 0.67 | |
| Class I net assets at the end of the year (in thousands) | | $ | 95,007 | | | $ | 171,153 | | | $ | 358,935 | | | $ | 486,543 | | | $ | 780,075 | | | $ | 937,244 | |
| Portfolio turnover rate (%)* | | | 25 | | | | 29 | | | | 31 | | | | 36 | | | | 43 | | | | 50 | |
| * | Rates are not annualized for periods less than a year. |
| ** | Rates are annualized for periods less than a year. |
Note: Net investment income (loss) per share is based on the average shares outstanding during the year.
Performance cited represents past performance. Past performance does not guarantee future results and current performance may be lower or higher than the data quoted. Results shown are annual returns, which assume reinvestment of dividends and capital gains. Investment returns and principal will fluctuate and you may have a gain or loss when you sell shares. For the most current month-end performance information, please call 1-800-742-7272 or visit our Web site at www.williamblairfunds.com.
| 180 | Semiannual Report | June 30, 2021 |
Financial Highlights — For a share outstanding throughout each period
Macro Allocation Fund
| | Class R6 | |
| | (unaudited)
Period Ended
June 30, | | | Years Ended December 31, | |
| | | | 2021 | | | | 2020 | | | | 2019 | | | | 2018 | | | | 2017 | | | | 2016 | |
| Net asset value, beginning of year | | $ | 10.85 | | | $ | 11.36 | | | $ | 11.38 | | | $ | 11.89 | | | $ | 11.40 | | | $ | 11.39 | |
| Income (loss) from investment operations: | | | | | | | | | | | | | | | | | | | | | | | | |
| Net investment income (loss) | | | 0.04 | | | | 0.08 | | | | 0.14 | | | | 0.13 | | | | 0.12 | | | | 0.09 | |
| Net realized and unrealized gain (loss) on investments | | | 0.40 | | | | (0.44 | ) | | | 0.34 | | | | (0.24 | ) | | | 0.51 | | | | 0.19 | |
| Total from investment operations | | | 0.44 | | | | (0.36 | ) | | | 0.48 | | | | (0.11 | ) | | | 0.63 | | | | 0.28 | |
| Less distributions from: | | | | | | | | | | | | | | | | | | | | | | | | |
| Net investment income | | | — | | | | 0.15 | | | | 0.50 | | | | 0.40 | | | | 0.14 | | | | 0.27 | |
| Net realized gain | | | — | | | | — | | | | — | | | | — | | | | — | | | | — | |
| Total distributions | | | — | | | | 0.15 | | | | 0.50 | | | | 0.40 | | | | 0.14 | | | | 0.27 | |
| Net asset value, end of year | | $ | 11.29 | | | $ | 10.85 | | | $ | 11.36 | | | $ | 11.38 | | | $ | 11.89 | | | $ | 11.40 | |
| Total return (%)* | | | 4.06 | | | | (3.13 | ) | | | 4.29 | | | | (0.94 | ) | | | 5.51 | | | | 2.44 | |
| Ratios to average daily net assets (%)**: | | | | | | | | | | | | | | | | | | | | | | | | |
| Expenses, before waivers and reimbursements | | | 0.98 | | | | 0.93 | | | | 0.89 | | | | 0.91 | | | | 0.92 | | | | 0.89 | |
| Expenses, net of waivers and reimbursements | | | 0.95 | | | | 0.93 | | | | 0.89 | | | | 0.91 | | | | 0.92 | | | | 0.89 | |
| Expenses (excluding interest or short dividend expense), net of waivers and reimbursements | | | 0.94 | | | | 0.92 | | | | 0.88 | | | | 0.89 | | | | 0.86 | | | | 0.89 | |
| Net investment income (loss), before waivers and reimbursements | | | 0.68 | | | | 0.70 | | | | 1.23 | | | | 1.10 | | | | 1.04 | | | | 0.81 | |
| Net investment income (loss), net of waivers and reimbursements | | | 0.71 | | | | 0.70 | | | | 1.23 | | | | 1.10 | | | | 1.04 | | | | 0.81 | |
| Class R6 net assets at the end of the year (in thousands) | | $ | 118,310 | | | $ | 174,888 | | | $ | 378,148 | | | $ | 391,812 | | | $ | 487,082 | | | $ | 582,298 | |
| Portfolio turnover rate (%)* | | | 25 | | | | 29 | | | | 31 | | | | 36 | | | | 43 | | | | 50 | |
| * | Rates are not annualized for periods less than a year. |
| ** | Rates are annualized for periods less than a year. |
Note: Net investment income (loss) per share is based on the average shares outstanding during the year.
Performance cited represents past performance. Past performance does not guarantee future results and current performance may be lower or higher than the data quoted. Results shown are annual returns, which assume reinvestment of dividends and capital gains. Investment returns and principal will fluctuate and you may have a gain or loss when you sell shares. For the most current month-end performance information, please call 1-800-742-7272 or visit our Web site at www.williamblairfunds.com.
| June 30, 2021 | William Blair Funds | 181 |
Renewal of the Management Agreement
On April 28, 2021, the Board of Trustees (the “Board”) of the William Blair Funds (the “Trust”), including the Trustees who are not “interested persons” of the Trust as defined by the Investment Company Act of 1940, as amended (the “Independent Trustees”), approved the renewal for an additional one-year term of the Trust’s Management Agreement with William Blair Investment Management, LLC (the “Adviser”) on behalf of each of the William Blair Funds (each, a “Fund” and collectively, the “Funds”), with the exception of the Emerging Markets Debt Fund, for which the Management Agreement was approved for an initial two-year term by the Board on April 29, 2020, and the China Growth Fund, for which the Management Agreement was approved for an initial two-year term by the Board on April 28, 2021. In deciding to approve the renewal of the Management Agreement, the Board did not identify any single factor or group of factors as all important or controlling and considered all factors together. The Board did not allot a particular weight to any one factor or group of factors.
The information in this summary outlines the Board’s considerations associated with its renewal of the Management Agreement. In connection with its deliberations regarding the continuation of the Management Agreement, the Board considered such information and factors as it believed to be necessary to evaluate the terms of the Management Agreement. As described below, the Board considered the nature, quality and extent of the services performed by the Adviser under the Management Agreement; the investment performance of each Fund and the Adviser; comparative management fees and expense ratios as prepared by an independent provider (Broadridge); the estimated profitability realized by the Adviser; the extent to which the Adviser realizes economies of scale as a Fund grows; and whether fall-out benefits are being realized by the Adviser. In addition, the Independent Trustees discussed the renewal of the Management Agreement with Trust management and in private sessions with independent legal counsel at which no representatives of the Adviser were present.
The Board, including the Independent Trustees, considered the renewal of the Management Agreement pursuant to a process that concluded at the Board’s April 28, 2021 meeting. In preparation for the review process, the Independent Trustees considered the type and nature of information to be requested, and independent legal counsel sent a formal request for information to the Adviser. The Adviser provided extensive information in response to the request. After reviewing the information received, the Independent Trustees requested supplemental information, which the Adviser provided. The Independent Trustees also received a memorandum from legal counsel advising them of their duties and responsibilities in connection with the consideration of the Management Agreement. The Independent Trustees reviewed comparative performance for a performance peer universe and peer group of funds and comparative management fees and expense ratios for an expense peer group and an expense peer universe of funds provided by Broadridge for each Fund. In addition, the Independent Trustees considered:(1) the nature, quality and extent of the services provided by the Adviser; (2) information comparing the performance of each Fund to one or more relevant securities indexes; (3) information comparing management fees of each Fund to fees charged by the Adviser to other funds and client accounts with similar investment strategies; (4) the estimated allocated direct or indirect costs of services provided and estimated profits realized by the Adviser for both the Trust as a whole and each Fund individually; and (5) information describing other benefits to the Adviser and its affiliate, William Blair & Company, L.L.C. (the “Distributor,” and collectively with the Adviser, “William Blair”), resulting from their relationship with the Funds. The Independent Trustees also noted that they receive information from the Adviser regarding the Funds throughout the year in connection with regular Board meetings, including presentations from portfolio managers. In addition, the Adviser made a presentation to the Board regarding the contract review information, including addressing the supplemental information requests, and answered questions from the Independent Trustees. The Board, including the Independent Trustees, determined that, given the totality of the information provided with respect to the Management Agreement, the Board had received sufficient information to renew the Management Agreement. The Independent Trustees noted that in evaluating the Management Agreement, they were taking into account their accumulated experience as Board members in working with the Adviser on matters relating to the Funds. Based on their review, the Independent Trustees concluded that it was in the best interest of each Fund to renew the Management Agreement and, accordingly, recommended to the Board of the Trust the renewal of the Management Agreement for each Fund. The Board considered the recommendation of the Independent Trustees along with other factors that the Board deemed relevant.
Nature, Quality and Extent of Services. In evaluating the nature, quality and extent of the services provided by the Adviser to the Funds, the Board noted that the Adviser is a quality firm with a reputation for integrity and honesty that employs high-quality people and has a long association with the Funds, in each case other than the Growth Fund, since the inception of the Funds. The Board believes that a long-term relationship with a capable, conscientious adviser is in the best interests of shareholders and that shareholders have invested in the Funds knowing that the Adviser manages the Funds and knowing the management fees. The Board considered the Adviser’s fundamental research approach in actively managed, process oriented investing. The Board considered biographical information about the Trust’s officers, other Adviser personnel and the Funds’ portfolio managers, including information on the portfolio managers’ personal investments in the Fund(s) they manage. The Board also considered the administrative services performed by the Adviser, financial information regarding the Adviser, the Adviser’s execution quality and use of soft dollars, risk management oversight, compliance program and the expense limitations
| 182 | Semiannual Report | June 30, 2021 |
proposed for each of the Funds’ share classes. The Board also considered the nature, quality and extent of services that the Adviser provides to the Funds compared to the services that the Adviser provides to other clients. The Board noted that the Adviser pays the compensation of all of the officers of the Trust. Based upon all relevant factors, the Board concluded that the nature, quality and extent of the services provided by the Adviser to each Fund were appropriate.
Performance. The Board reviewed information on the annualized total returns of each share class of the Funds for the one-, three-, five- and ten-year periods ended December 31, 2020, as applicable, along with annualized total return information for a Morningstar performance peer universe of funds and one or more benchmark securities indexes. The Morningstar performance peer universe for each Fund included all funds in the same Morningstar category as the Fund. For purposes of this report, Class I shares were used for comparison purposes as the Board noted that Class I shares represent the largest percentage of assets in the Trust. In evaluating performance, the Board recognized that the performance data reflects a snapshot of a period as of a particular date and that selecting a different performance period could produce different results.
The Board considered that the Adviser seeks to provide superior performance over the long term and was committed to managing each Fund consistently with the Fund’s stated investment strategies and that at times relative performance will be affected by whether the market environment favors or disfavors particular investments, styles and/or market capitalizations. The Board considered that the Adviser had managed the Funds consistent with their respective investment strategies. Based on the information provided, the Board considered the following with respect to the total returns of each Fund.
Growth Fund. The Board considered that the Fund’s total return was below the average of its Morningstar performance peer universe for the one-year period and above the average of its Morningstar performance peer universe for the three- and five-year periods ended December 31, 2020.The Board also considered that the Fund underperformed the benchmark (Russell 3000® Growth Index) for the one- and five-year periods and outperformed the benchmark for the three-year period ended December 31, 2020.
Large Cap Growth Fund. The Board considered that the Fund’s total return was below the average of its Morningstar performance peer universe and the benchmark (Russell 1000® Growth Index) for the one-year period and above the average of its Morningstar performance peer universe and the benchmark for the three- and five-year periods ended December 31, 2020.
Mid Cap Growth Fund. The Board considered that the Fund’s total return was below the average of its Morningstar performance peer universe and the benchmark (Russell Midcap® Growth Index) for the one-, three- and five-year periods ended December 31, 2020.The Board considered the Adviser’s view that the Fund’s relative underperformance for the three- and five-year periods was the result of stock specific issues and style headwinds.
Small-Mid Cap Core Fund. The Board considered that the Fund’s total return was above the average of its Morningstar performance peer universe and the benchmark (Russell 2500™ Total Return Index) for the one-year period ended December 31, 2020.The Board also considered that the Fund commenced operations on October 1, 2019.
Small-Mid Cap Growth Fund. The Board considered that the Fund’s total return was below the average of its Morningstar performance peer universe for the one- and three-year periods and above the average of its Morningstar performance peer universe for the five-year period ended December 31, 2020.The Board also considered that the Fund underperformed the benchmark (Russell 2500™ Growth Index) for the one-, three- and five-year periods ended December 31, 2020.
Small Cap Growth Fund. The Board considered that the Fund’s total return was below the average of its Morningstar performance peer universe for the one- and three-year periods and above the average of its Morningstar performance peer universe for the five-year period ended December 31, 2020.The Board also considered that the Fund outperformed the benchmark (Russell 2000® Growth Index) for the one-, three- and five-year periods ended December 31, 2020.
Small Cap Value Fund. The Board considered that the Fund’s total return was below the average of its Morningstar performance peer universe and the benchmark (Russell 2000® Value Index) for the one-, three- and five-year periods ended December 31, 2020.The Board also considered the proposed reorganization of the ICM Small Company Portfolio with the Fund.
Global Leaders Fund. The Board considered that the Fund’s total return was above the average of its Morningstar performance peer universe and the benchmark (MSCI All Country World IMI (net) Index) for the one-, three- and five-year periods ended December 31, 2020.
International Leaders Fund. The Board considered that the Fund’s total return was above the average of its Morningstar performance peer universe and the benchmark (MSCI All Country World Ex-U.S. IMI (net) Index) for the one-, three- and five-year periods ended December 31, 2020.
| June 30, 2021 | William Blair Funds | 183 |
International Growth Fund. The Board considered that the Fund’s total return was above the average of its Morningstar performance peer universe and the benchmark (MSCI All Country World Ex-U.S. IMI (net) Index) for the one-, three- and five-year periods ended December 31, 2020.
Institutional International Growth Fund. The Board considered that the Fund’s total return was above the average of its Morningstar performance peer universe and the benchmark (MSCI All Country World Ex-U.S. IMI (net) Index) for the one-, three- and five-year periods ended December 31, 2020.
International Small Cap Growth Fund. The Board considered that the Fund’s total return was above the average of its Morningstar performance peer universe for the one- and three-year periods and below the average of its Morningstar performance peer universe for the five-year period ended December 31, 2020.The Board also considered that the Fund outperformed the benchmark (MSCI All Country World Ex-U.S. Small Cap (net) Index) for the one-, three- and five-year periods ended December 31, 2020.
Emerging Markets Leaders Fund. The Board considered that the Fund’s total return was above the average of its Morningstar performance peer universe and the benchmark (MSCI Emerging Markets (net) Index) for the one-, three- and five-year periods ended December 31, 2020.
Emerging Markets Growth Fund. The Board considered that the Fund’s total return was above the average of its Morningstar performance peer universe and the benchmark (MSCI Emerging Markets IMI (net) Index) for the one-, three- and five-year periods ended December 31, 2020.
Emerging Markets Small Cap Growth Fund. The Board considered that the Fund’s total return was above the average of its Morningstar performance peer universe for the one- and three-year periods and below the average of its Morningstar performance peer universe for the five-year period ended December 31, 2020.The Board also considered that the Fund outperformed the benchmark (MSCI Emerging Markets Small Cap (net) Index) for the one-, three- and five-year periods ended December 31, 2020.
Bond Fund. The Board considered that the Fund’s total return was below the average of its Morningstar performance peer universe for the one-year period and above the average of its Morningstar performance peer universe for the three- and five-year periods ended December 31, 2020.The Board also considered that the Fund outperformed the benchmark (Bloomberg Barclays U.S. Aggregate Bond Index) for the one-, three- and five-year periods ended December 31, 2020.
Income Fund. The Board considered that the Fund’s total return was above the average of its Morningstar performance peer universe for the one-, three- and five-year periods ended December 31, 2020.The Board also considered that the Fund underperformed the benchmark (Bloomberg Barclays Intermediate Government/Credit Bond Index) for the one-, three- and five-year periods ended December 31, 2020.
Low Duration Fund. The Board considered that the Fund’s total return was above the average of its Morningstar performance peer universe and the benchmark (ICE BofAML 1-Year US Treasury Note Index) for the one-, three- and five-year periods ended December 31, 2020.
Macro Allocation Fund. The Board considered that the Fund’s total return was below the average of its Morningstar performance peer universe for the one-, three- and five-year periods ended December 31, 2020.The Board also considered that the Fund underperformed the benchmark (ICE BofAML 3-Month US Treasury Bill Index) for the one- and three-year periods and outperformed the benchmark for the five-year period ended December 31, 2020.The Board considered that the portfolio managers’ process was based on fundamental valuation, which had faced headwinds from market forces in recent years, including from the low to negative interest rate environment, and also considered the Advisers’ view that as the investment environment evolves back to one in which fundamentals exert a more consistent influence on prices, prices are expected to gravitate to fundamental valuations.
Management Fees. The Board reviewed each Fund’s management fee and reviewed information comparing the management fee to those of an expense peer group and an expense peer universe of funds provided by Broadridge for each share class of the Funds. The Broadridge expense peer group for Class N shares of each Fund (“Class N Broadridge Expense Group”) consisted of a group of retail no-load funds with a similar investment strategy and asset size, as classified by Broadridge. The Broadridge expense peer group for Class I (the “Class I Broadridge Expense Group”) and Class R6 of each Fund consisted of a group of institutional funds with a similar investment strategy and asset size, as classified by Broadridge. The Broadridge expense peer universe for each share class of each Fund consisted of the Fund’s Broadridge expense peer group and all other no-load funds with an investment strategy as classified by Broadridge similar to the Fund’s. In considering the Broadridge information, the Board noted that the contractual management fees for the Growth Fund, the Large Cap Growth Fund, the Small Cap Value Fund,
| 184 | Semiannual Report | June 30, 2021 |
the International Small Cap Growth Fund, the Emerging Markets Small Cap Growth Fund, the Bond Fund, the Income Fund, the Low Duration Fund and the Macro Allocation Fund were below the average contractual management fees of their respective Class I Broadridge Expense Groups. The Board also noted that the contractual management fees for the Mid Cap Growth Fund, the Small-Mid Cap Core Fund, the Small-Mid Cap Growth Fund, the Small Cap Growth Fund, the Global Leaders Fund, the International Leaders Fund, the International Growth Fund, the Emerging Markets Leaders Fund and the Emerging Markets Growth Fund were above the average contractual management fees of their respective Class I Broadridge Expense Groups. The Board also considered that the Adviser had reduced the contractual management fee for the Small Cap Value Fund effective March 1, 2021.
In considering the management fee for the Institutional International Growth Fund, which does not have share classes, the Board noted that the contractual management fee for the Fund was above the average contractual management fee of its Broadridge expense peer group.
The Board noted the current and proposed contractual expense limitations for the Funds and further noted that the Adviser had reduced the contractual limit on operating expenses for the Small Cap Value Fund effective March 1, 2021. The Board considered that the Adviser proposed to contractually limit operating expenses until April 30, 2022 for each share class of the Funds. The Board considered the amount of management fees waived and other expenses reimbursed by the Adviser on behalf of the Funds in 2020.
For each Fund, the Board also reviewed amounts charged by the Adviser to other pooled investment vehicles, including other registered funds for which the Adviser acts as a sub-adviser, and the Adviser’s fee schedule for institutional accounts. With respect to other pooled investment vehicles and institutional accounts, the Board considered the Adviser’s statements to the effect that the level of services provided to the Funds and the regulatory responsibilities associated with sponsoring registered investment companies were greater as compared to the work involved for other pooled investment vehicles, including other registered funds for which the Adviser acts as a sub-adviser, and institutional accounts. In addition, the Board considered the Adviser’s statements to the effect that institutional accounts are distributed differently, operate under different investment and regulatory structures and have different business risks as compared to the Funds and that there are responsibilities and duties involved in sponsoring a registered fund that are not present in sub-advising a registered fund.
On the basis of all the information provided, the Board concluded that each Fund’s management fee, coupled with the applicable expense limitations, was reasonable.
Profitability. With respect to the profitability of the Management Agreement to the Adviser, the Board considered the overall fees paid under the Management Agreement, including the estimated allocated costs of the services provided, management fees waived and other expenses reimbursed, if any, and profits realized by the Adviser from its relationship with the Trust as a whole and each Fund individually. The Board concluded that the estimated profits realized by the Adviser were not unreasonable.
Economies of Scale. The Board considered the extent to which economies of scale would be realized as the Funds grow and whether fee levels reflect these economies of scale for the benefit of investors. The Board noted the Adviser’s statements to the effect that the resources required for the Adviser’s fundamental investment process typically increase as a Fund increases in size. The Board also considered that certain of the Funds were part of investment strategies that were capacity constrained by the Adviser so that opportunities for economies of scale were limited. The Board further considered that of the Funds that are subject to capacity constraints, the International Growth Fund, Institutional International Growth Fund, International Small Cap Growth Fund and Emerging Markets Small Cap Growth Fund are closed to investors, except as noted in each Fund’s prospectus.
In considering whether fee levels reflect economies of scale for the benefit of Fund investors, the Board considered each Fund’s asset size, management fee breakpoints for applicable Funds, the expense limitations in place for each Fund and the proposed reduction in management fees and/or expense limits for certain Funds and each Fund’s expense ratios. The Board concluded that in the aggregate the Funds’ fee levels reasonably reflect appropriate recognition of economies of scale.
Other Benefits. The Board considered benefits derived by the Adviser and its affiliates from their relationship with the Funds, including (1) receipt of research from brokerage firms; (2) soft dollars, which pertain primarily to the Funds investing in equity securities; (3) reimbursement of some intermediary fees in the nature of sub-transfer agency fees; (4) fees from Class N shares of the Funds to the Distributor pursuant to the Rule 12b-1 Plan, nearly all of which are paid to third parties; and (5) favorable media coverage. The Board determined that management fees were reasonable in light of these benefits.
Conclusion. Based upon all of the information considered and the conclusions reached, the Board determined that the terms of the Management Agreement continue to be fair and reasonable and that the continuation of the Management Agreement is in the best interests of each Fund.
| June 30, 2021 | William Blair Funds | 185 |
Approval of the Management Agreement for the William Blair Emerging Markets Debt Fund
On April 29, 2020, the Board of Trustees (the “Board”) of William Blair Funds (the “Trust”), including the Trustees who are not interested persons of the Trust as defined by the Investment Company Act of 1940, as amended (the “Independent Trustees”), approved the Management Agreement between the Trust, on behalf of the William Blair Emerging Markets Debt Fund (the “Fund”), and William Blair Investment Management, LLC (the “Adviser”).The Independent Trustees met independently of Trust management and the interested Trustees of the Trust to consider the approval of the Management Agreement. The Independent Trustees reviewed materials provided by the Adviser and Broadridge for the approval of the Management Agreement and were assisted by independent legal counsel in making their determination. The Board determined that, given the totality of the information provided with respect to the Management Agreement, the Board had received sufficient information to consider the approval of the Management Agreement. The Board considered the following factors in making its determination, but did not identify any single factor or group of factors as all important or controlling and considered all factors together.
Nature, Quality and Extent of Services. In evaluating the nature, quality and extent of the services expected to be provided by the Adviser to the Fund, the Board noted that the Adviser is a quality firm with a reputation for integrity and honesty that employs high quality people. The Board considered biographical information about the Fund’s portfolio managers and financial information regarding the Adviser. The Board considered the proposed portfolio management team members’ previous experience investing in emerging markets debt. The Board also considered the Adviser’s experience in managing new funds. Based upon all relevant factors, the Board concluded that the nature, quality and extent of the services to be provided by the Adviser to the Fund were expected to be satisfactory.
Fees and Expenses. The Board reviewed the proposed advisory fee for the Fund and reviewed information comparing the advisory fee to a peer group and a peer universe of institutional funds provided by Broadridge. The Broadridge peer group consisted of the Fund and eleven other no-load institutional emerging markets hard currency debt funds with no Rule 12b-1 fees, as classified by Broadridge. The Broadridge peer universe consisted of the Fund, the Fund’s Broadridge peer group and all other institutional emerging markets hard currency debt funds, excluding outliers. In considering the information, the Board noted that the proposed advisory fee for the Fund was below the average contractual management fee of the peer group. The Board also considered that the Adviser had proposed to limit total operating expenses, including waiving advisory fees for each share class of the Fund until April 30, 2022.On the basis of the information provided, the Board concluded that the proposed advisory fee was reasonable in light of the nature, quality and extent of services expected to be provided by the Adviser.
Profitability. With respect to the estimated profitability of the Management Agreement to the Adviser, the Board considered the proposed advisory fee, that the Fund was newly organized, the amount of assets under management that the Adviser initially expected in the Fund and the Adviser’s agreement to limit total expenses until April 30, 2022.The Board considered that the Adviser will be incurring all expenses related to the organization of the Fund. The Board concluded that the expected profits to be realized by the Adviser were not expected to be unreasonable.
Economies of Scale. The Board considered the extent to which economies of scale would be realized as the Fund grows and whether fee levels reflect these economies of scale for the benefit of investors. In considering whether fee levels reflect economies of scale for the benefit of Fund investors, the Board reviewed the Fund’s advisory fee compared to peer funds and the Fund’s estimated expense ratios giving effect to the Adviser’s agreement to limit total expenses until April 30, 2022, and concluded that the advisory fee was reasonable. The Board noted the Adviser’s statements to the effect that the resources required for the Adviser’s fundamental investment process typically increase as a Fund increases in size. The Board also considered that the asset capacity of the Fund’s investment strategy was constrained by the Adviser and that opportunities for economies of scale would be limited.
Other Benefits to the Adviser. The Board considered benefits to be derived by the Adviser from its relationship with the Fund, including receipt of research from brokerage firms; for Class I shares, reimbursement of some intermediary fees in the nature of sub-transfer agency fees and favorable media coverage. The Board concluded that, after taking into account these benefits, the proposed advisory fee was reasonable.
Conclusion. Based upon all of the information considered and the conclusions reached, the Board determined that the terms of the Management Agreement are fair and reasonable and that the approval of the Management Agreement is in the best interests of the Fund.
| 186 | Semiannual Report | June 30, 2021 |
Review of Liquidity Risk Management Program
The Board of Trustees (the “Board”) of William Blair Funds previously approved the William Blair Funds Liquidity Risk Management Program Policy (the “Policy”) under Rule 22e-4 under the 1940 Act (the “Liquidity Rule”), which sets forth the terms of the William Blair Liquidity Risk Management Program (the “Program”). The Program (through the Policy) seeks to assess, manage and review each Fund’s liquidity risk. For purposes of the Program, the Policy and the Liquidity Rule, “liquidity risk” is defined as the risk that a Fund could not meet requests to redeem shares issued by a Fund without significant dilution of remaining investors’ interest in the Funds. Among other things, the Liquidity Rule requires that a written report be provided to the Board on an annual basis that addresses the operation of the Program and assesses the adequacy and effectiveness of its implementation, including (if applicable) the operation of any highly liquid investment minimum (“HLIM”) established for a Fund and any material changes to the Program.
The Board designated the Liquidity Risk Management Committee of William Blair Investment Management, LLC, the Funds’ investment adviser, to be the administrator for the Program (the “Program Administrator”). On February 23, 2021, the Board of Trustees reviewed the Program Administrator’s written report (the “Report”) concerning the operation of the Program and the Policy as well as the adequacy and effectiveness of the Program’s and Policy’s implementation for the period from January 1, 2020 through December 31, 2020 (the “Program Reporting Period”). There were no material changes to the Program or to the Policy during the Program Reporting Period.
The Report summarized the operation of the Program and the Policy and the information and factors considered by the Program Administrator in assessing whether the Program and the Policy have been adequately and effectively implemented with respect to each Fund. Such information and factors included, among other things: (1) the liquidity risk framework used to assess, manage, and periodically review each Fund’s liquidity risk and the results of this assessment; (2) the classification of each of the Funds’ respective investments into one of four liquidity categories that reflect an estimate of their liquidity under normal and reasonably foreseeable stressed conditions; (3) whether a Fund invested primarily in “Highly Liquid Investments” (as defined under the Liquidity Rule) and whether an HLIM should be established for any Fund; (4) whether a Fund invested more than 15% of its assets in “Illiquid Investments” (as defined under the Liquidity Rule); (5) specific liquidity events arising during the Program Reporting Period, including the impact on Fund liquidity caused by extended non-U.S. market closures; and (6) the nature and quality of the services provided by the service provider engaged to assist with determining liquidity classifications for the Funds. Based on this review, the Report concluded that the Program and the Policy meet the requirements of the Liquidity Rule and are operating effectively.
| June 30, 2021 | William Blair Funds | 187 |
Trustees and Officers (Unaudited).† The trustees and officers of the William Blair Funds, their year of birth, their principal occupations during the last five years, their affiliations, if any, with William Blair, and other significant affiliations are set forth below. The address of each officer and trustee is 150 North Riverside Plaza, Chicago, Illinois 60606.
| Name and Year of Birth | | Position(s)
Held with
Trust | | Term of
Office(1) and
Length of
Time
Served | | Principal
Occupation(s)
During Past 5 Years | | Number of
Portfolios
in Trust
Complex
Overseen
by Trustee* | | Other Directorships
Held by Trustee
During Past 5 Years** |
| Interested Trustees | | | | | | | | | | |
Stephanie G. Braming, CFA,
1970(2) | | Chairman of the Board and President, previously Senior Vice President | | Chairman of the Board and President since 2018, and Senior Vice President 2014 to 2018 | | Global Head of Investment Management since 2017, portfolio manager (2014 to 2017) and Partner, William Blair | | 20 | | Chairman, William Blair SICAV |
Arthur J. Simon,
1954(2) | | Trustee | | Since 2018 | | General Counsel and Partner, William Blair | | 20 | | Director, William Blair SICAV |
| Non-Interested Trustees | | | | | | | | | | |
Vann A. Avedisian,
1964 | | Trustee | | Since 2012 | | Co-founder and Partner, Newbond Holdings (real estate operations) (since 2021); formerly, Principal, Highgate Holdings (hotel investments) (2009-2021); formerly, co-founder and Managing Director, Oxford Capital Partners Inc. (1994 to 2006) | | 20 | | Potbelly Sandwich Works (2001 to 2015 and since 2021) |
Kathleen T. Barr,
1955 | | Trustee | | Since 2013 | | Retired; Chairman of the Governing Council, Independent Directors Council (since 2020); formerly, President, Productive Capital Management, Inc. (registered investment adviser to public entities) and Owner, KT Barr Consulting, LLC (mutual fund and investment management consulting) (2010 to 2013); prior thereto, Chief Administrative Officer, Senior Vice President and Senior Managing Director of Allegiant Asset Management Company (merged with PNC Capital Advisors, LLC in 2009) (2004 to 2010) | | 20 | | Muzinich BDC, Inc. (since 2019); Board of Governors, Investment Company Institute (since 2019); Professionally Managed Portfolios (since 2018) |
| † | William Blair Investment Management, LLC and William Blair & Company, L.L.C. are collectively referred to in this section as “William Blair”, each of which is a wholly owned subsidiary of WBC Holdings, L.P., which is wholly owned by certain William Blair employees (employee owners are referred to as ‘partners’). |
| * | The number shown does not include three additional series of the Trust that are in existence, but not currently offered to the public. |
| ** | Includes directorships of public companies and other registered investment companies held during the past five years. |
| 188 | Semiannual Report | June 30, 2021 |
| Name and Year of Birth | | Position(s)
Held with
Trust | | Term of
Office(1) and
Length of
Time
Served | | Principal
Occupation(s)
During Past 5 Years | | Number of
Portfolios
in Trust
Complex
Overseen
by Trustee* | | Other Directorships
Held by Trustee
During Past 5 Years** |
Daniel N. Leib,
1966(3) | | Trustee | | Since 2016 | | Chief Executive Officer, Donnelley Financial Solutions, Inc. (since 2016); formerly, Executive Vice President and Chief Financial Officer (2011 to 2016) and Group Chief Financial Officer (2009 to 2011), R.R. Donnelley & Sons Company | | 20 | | Donnelley Financial Solutions, Inc. (since 2016) |
Dorri C. McWhorter,
1973 | | Trustee | | Since 2019 | | Chief Executive Officer, YWCA Metropolitan Chicago (since 2013); formerly Partner, Crowe LLP (2008 to 2013)(4) | | 20 | | Skyway Concession Company, LLC (since 2018); Illinois CPA Society (since 2017); Lifeway Foods, Inc. (since 2020); American Institute of Certified Public Accountants (2013 to 2016); Chicago Finance Exchange (2009 to 2017) |
Thomas J. Skelly,
1951 | | Trustee | | Since 2007 | | Advisory Board Member for various U.S. companies (since 2005); formerly, Managing Partner of various divisions at Accenture (1994 to 2004) | | 20 | | Mutual Trust Financial Group (provider of insurance and investment products) |
Steven R. Zenz,
1954 | | Trustee | | Since 2018 | | Consultant, Steven R. Zenz Consulting LLC (merger and acquisition transactions and SEC reporting and filings) (since 2011); formerly, Partner, KPMG LLP (1987 to 2010)(5) | | 20 | | Engine Media Holdings, Inc. (media group supporting esports, news streaming and gaming) (2020 to 2021); Frankly Inc. (technology products/ services for media industry) (2016 to its 2020 acquisition by Engine Media Holdings); Insignia Systems, Inc. (in-store advertising services for consumer packaged goods manufacturers) (2013 to 2019) |
| (1) | Each Trustee serves until the election and qualification of a successor, or until death, resignation or retirement, or removal as provided in the Trust’s Declaration of Trust. Retirement for Independent Trustees occurs no later than at the conclusion of the calendar year that occurs after the earlier of (a) the Independent Trustee’s 75th birthday or (b) the 17th anniversary of the date that the Independent Trustee became a member of the Board of Trustees. |
| (2) | Ms. Braming and Mr. Simon are interested persons of the Trust because they are partners of William Blair, and with respect to Ms. Braming also due to her position as an officer of the Trust. |
| (3) | The Trust and William Blair use Donnelley Financial Solutions, Inc. (“DFS’’) for financial printing and other services. DFS is a public company. The Trust and William Blair in the aggregate paid DFS approximately $188,000 and $214,000 in 2019 and 2020, respectively, for the services provided. DFS’s revenue was approximately $900 million in 2019 and $895 million in 2020. Mr. Leib, as the Chief Executive Officer of DFS, is not directly involved in any of the services provided to the Trust or William Blair and his compensation is not materially affected by the fees DFS receives from the Trust and William Blair. |
| (4) | As a former partner of the audit firm Crowe LLP (formerly, Crowe Horwath LLP), Ms. McWhorter received distributions of her capital in the firm over time and those distributions were completed in March 2021. The Trust and William Blair made no payments to Crowe LLP over the past three years. |
| (5) | The Trust engages KPMG to provide foreign tax services in Taiwan. KPMG does not provide audit or audit-related services to the Trust. Mr. Zenz is a former partner of KPMG and receives pension/retirement funds from KPMG. |
| June 30, 2021 | William Blair Funds | 189 |
| Name and Year of Birth | | Position(s) Held
with Trust | | | Term of Office
and Length of
Time Served(1) | | | Principal Occupation(s)
During Past 5 Years |
| | | | | | | | | |
| Officers | | | | | | | | | | |
| | | | | | | | | | | |
Alaina Anderson, CFA,
1975 | | Senior Vice President | | Since 2021 | | Partner, William Blair |
| | | | | | | |
Marcelo Assalin, CFA,
1973 | | Senior Vice President | | Since 2020 | | Associate, William Blair (since 2020); formerly, NN Investment Partners (2013- 2020) |
| | | | | | | |
Thomas Clarke,
1968 | | Senior Vice President | | Since 2011 | | Partner, William Blair |
| | | | | | | |
Daniel Crowe, CFA,
1972 | | Senior Vice President | | Since 2016 | | Partner, William Blair |
| | | | | | | |
Robert J. Duwa, CFA,
1967 | | Senior Vice President | | Since 2019 | | Partner, William Blair |
| | | | | | | |
Simon Fennell,
1969 | | Senior Vice President | | Since 2013 | | Partner, William Blair |
| | | | | | | |
Andrew G. Flynn, CFA,
1961 | | Senior Vice President | | Since 2013 | | Partner, William Blair |
| | | | | | | |
David C. Fording, CFA,
1967 | | Senior Vice President | | Since 2006 | | Partner, William Blair |
| | | | | | | |
James S. Golan, CFA,
1961 | | Senior Vice President | | Since 2005 | | Partner, William Blair |
| | | | | | | |
William V. Heaphy, CFA,
1967 | | Senior Vice President | | Since 2021 | | Associate, William Blair (since 2021); formerly, Principal, Investment Counselors of Maryland, LLC (1994-2021) |
| | | | | | | |
James E. Jones, CFA,
1977 | | Senior Vice President | | Since 2019 | | Partner, William Blair |
| | | | | | | |
Kenneth J. McAtamney,
1966 | | Senior Vice President | | Since 2008 | | Partner, William Blair |
| | | | | | | |
Todd M. McClone, CFA,
1968 | | Senior Vice President | | Since 2005 | | Partner, William Blair |
| | | | | | | |
John C. Murphy, CFA,
1969 | | Senior Vice President | | Since 2014 | | Partner, William Blair |
| | | | | | | |
D.J. Neiman, CFA,
1975 | | Senior Vice President | | Since 2021 | | Partner, William Blair |
| | | | | | | |
Casey K. Preyss, CFA,
1976 | | Senior Vice President | | Since 2015 | | Partner, William Blair |
| | | | | | | |
David P. Ricci, CFA,
1958 | | Senior Vice President | | Since 2006 | | Partner, William Blair |
| | | | | | | |
Lisa D. Rusch,
1970 | | Senior Vice President Vice President | | Since 2020 2018-2020 | | Partner, William Blair (since 2020); formerly, Associate, William Blair |
| | | | | | | |
Hugo Scott-Gall,
1971 | | Senior Vice President | | Since 2021 | | Partner, William Blair (since 2018); formerly, Managing Director, Goldman Sachs (1998-2018) |
| | | | | | | |
Ward D. Sexton, CFA,
1974 | | Senior Vice President | | Since 2016 | | Partner, William Blair |
| 190 | Semiannual Report | June 30, 2021 |
| Name and Year of Birth | | Position(s) Held
with Trust | | | Term of Office
and Length of
Time Served(1) | | | Principal Occupation(s)
During Past 5 Years |
| | | | | | | | | | | |
Brian D. Singer, CFA,
1960 | | Senior Vice President | | Since 2011 | | Partner, William Blair |
| | | | | | | |
Mark C. Thompson, CFA,
1976 | | Senior Vice President | | Since 2020 | | Partner, William Blair |
| | | | | | | |
Vivian Lin Thurston, CFA,
1972 | | Senior Vice President | | Since 2021 | | Partner, William Blair |
| | | | | | | |
Dan Zelazny,
1971 | | Senior Vice President | | Since 2019 | | Associate, William Blair (since 2019); formerly, Managing Director, AQR Capital Management (2011-2019) |
| | | | | | | |
Ruta Ziverte,
1973 | | Senior Vice President | | Since 2020 | | Partner, William Blair (since 2021); formerly, Associate, William Blair (2019-2021), Oppenheimer Funds (2015-2019) |
| | | | | | | |
Kathleen M. Lynch, CFA,
1971 | | Vice President | | Since 2020 | | Associate, William Blair |
| | | | | | | |
Vesta Marks, CFA, CAIA,
1978 | | Vice President | | Since 2021 | | Associate, William Blair (since 2021); formerly, Managing Director, Tortoise Capital Advisors (2018-2021), Palmer Square Capital Management LLC (2015-2018) |
| | | | | | | |
Gary J. Merwitz,
1970 | | Vice President | | Since 2021 | | Associate, William Blair (since 2021); formerly, Principal, Investment Counselors of Maryland, LLC (2004-2021) |
| | | | | | | |
Marco Ruijer, CFA,
1975 | | Vice President | | Since 2020 | | Associate, William Blair (since 2020); formerly, NN Investment Partners (2013-2020) |
| | | | | | | |
John M. Raczek,
1970 | | Treasurer Assistant Treasurer | | Since 2019 2010-2019 | | Associate, William Blair |
| | | | | | | |
Andrew T. Pfau,
1970 | | Secretary | | Since 2009 | | Associate, William Blair |
| | | | | | | |
David M. Cihak,
1982 | | Assistant Treasurer | | Since 2019 | | Associate, William Blair |
| | | | | | | |
Walter R. Randall, Jr.,
1960 | | Chief Compliance Officer and Assistant Secretary | | Since 2009 | | Associate, William Blair |
| | | | | | | |
Robert J. Toner,
1967 | | Assistant Secretary | | Since 2016 | | Associate, William Blair |
| (1) | The Trust’s officers, except the Chief Compliance Officer, are elected annually by the Board of Trustees. The Trust’s Chief Compliance Officer is designated by the Board of Trustees and may only be removed by action of the Board of Trustees, including a majority of independent trustees. Length of Time Served for all officers indicates the year the individual became an officer of the Trust. |
The Statement of Additional Information for the William Blair Funds includes additional information about the trustees and is available without charge by calling 1-800-635-2886 (in Massachusetts 1-800-635-2840) or by writing the Fund.
| June 30, 2021 | William Blair Funds | 191 |
(Unaudited)
Proxy Voting
A description of the policies and procedures that the Funds use to determine how to vote proxies relating to portfolio securities and information regarding how the Funds voted proxies relating to portfolio securities for the most recent 12-month period ended December 31 are available without charge, upon request, by calling 1-800-635-2886 (in Massachusetts 1-800-635-2840), at www.williamblairfunds.com and on the SEC’s website at http://www.sec.gov.
Quarterly Portfolio Schedules
Each Fund files its complete schedule of portfolio holdings with the SEC for the first and third fiscal quarters of each fiscal year (quarters ended March 31 and September 30) on Form N-PORT. The Funds’ Forms N-PORT are available on the SEC’s website at http://www.sec.gov.
Additional Federal Income Tax Information: (unaudited)
Under Section 852(b)(3)(C) of the Code, the Funds hereby designate the following amounts as capital gain dividends for the fiscal year ended December 31, 2020 (in thousands):
| Fund | | Capital Gain Dividend |
| Growth | | $ | 38,359 | |
| Large Cap Growth | | | 32,144 | |
| Mid Cap Growth | | | 5,611 | |
| Small-Mid Cap Growth | | | 64,284 | |
| Small Cap Growth | | | 51,936 | |
| Small Cap Value | | | 28,599 | |
| Global Leaders | | | 15,321 | |
| International Leaders | | | 8,192 | |
| International Growth | | | 17,392 | |
| Institutional International Growth | | | 183,461 | |
| International Small Cap Growth | | | 7,037 | |
| Emerging Markets Leaders | | | 2,367 | |
| Emerging Markets Growth | | | 48,790 | |
| 192 | Semiannual Report | June 30, 2021 |
Useful Information About Your Report (Unaudited)
Please refer to this information when reviewing the Expense Example for each Fund.
Expense Example
As a shareholder of a Fund, you incur two types of costs: (1) transaction costs and (2) ongoing costs, including management fees, distribution (12b-1) fees (for Class N shares, as applicable), and other Fund expenses. The example is intended to help you understand your ongoing costs (in dollars) of investing in the Fund and to compare these costs with the ongoing costs of investing in other mutual funds. To do so, compare the Fund’s 5% hypothetical example with the 5% hypothetical examples that appear in the shareholder reports of other funds. The example is based on an investment of $1,000 invested at the beginning of the period and held for the entire six-month period from January 1, 2021 to June 30, 2021.
Actual Expenses
In each example, the first line for each share class in the table provides information about the actual account values and actual expenses. These expenses reflect the effect of any expense cap applicable to the share class during the period. Without this expense cap, the costs shown in the table would have been higher. You may use the information in this line, together with the amount you invested, to estimate the expenses that you paid over the period. Simply divide your account value by $1,000 (example, an $8,600 account value divided by $1,000 = 8.6), then multiply the result by the number in the first line under the heading entitled “Expenses Paid During the Period” to estimate the expenses you paid on your account during the period.
Hypothetical Example for Comparison Purposes
In each example, the second line for each share class in the table provides information about hypothetical account values and hypothetical expenses based on the Fund’s actual expense ratio and an assumed rate of return of 5% per year before expenses. This is not the Fund’s actual return. The hypothetical account values and expenses may not be used to estimate your actual ending account balance or the expenses you paid for the period. You may use this information to compare the ongoing costs of investing in the Fund to the costs of investing in other funds. To do so, compare this 5% hypothetical example with the 5% hypothetical examples that appear in the shareholder reports of other funds.
Please note that the expenses shown in both examples are meant to highlight your ongoing costs only and do not reflect any transactional costs or account type fees, such as IRA administration fees. These fees are discussed in the prospectus. Therefore, the second line of each share class in the table is useful in comparing ongoing costs only and will not help you determine the relative costs of owning different funds. In addition, if these transactional costs or account fees were included, your costs would have been higher.
| June 30, 2021 | William Blair Funds | 193 |
Fund Expenses (Unaudited)
| Expense Example | | Beginning
Account Value
1/1/2021 | | Ending
Account Value
6/30/2021 | | Expenses Paid
During
the Period (a) | | Annualized
Expense Ratio |
| Growth Fund | | | | | | | | | | | | | | | | |
| Class N-actual return | | $ | 1,000.00 | | | $ | 1,130.94 | | | $ | 6.34 | | | | 1.20 | % |
| Class N-hypothetical 5% return | | $ | 1,000.00 | | | $ | 1,044.05 | | | $ | 6.08 | | | | 1.20 | |
| Class I-actual return | | $ | 1,000.00 | | | $ | 1,132.70 | | | $ | 4.71 | | | | 0.89 | |
| Class I-hypothetical 5% return | | $ | 1,000.00 | | | $ | 1,045.59 | | | $ | 4.51 | | | | 0.89 | |
| Class R6-actual return | | $ | 1,000.00 | | | $ | 1,133.14 | | | $ | 4.44 | | | | 0.84 | |
| Class R6-hypothetical 5% return | | $ | 1,000.00 | | | $ | 1,045.83 | | | $ | 4.26 | | | | 0.84 | |
| Large Cap Growth Fund | | | | | | | | | | | | | | | | |
| Class N-actual return | | $ | 1,000.00 | | | $ | 1,141.79 | | | $ | 4.78 | | | | 0.90 | |
| Class N-hypothetical 5% return | | $ | 1,000.00 | | | $ | 1,045.54 | | | $ | 4.56 | | | | 0.90 | |
| Class I-actual return | | $ | 1,000.00 | | | $ | 1,143.26 | | | $ | 3.45 | | | | 0.65 | |
| Class I-hypothetical 5% return | | $ | 1,000.00 | | | $ | 1,046.78 | | | $ | 3.30 | | | | 0.65 | |
| Class R6-actual return | | $ | 1,000.00 | | | $ | 1,143.39 | | | $ | 3.19 | | | | 0.60 | |
| Class R6-hypothetical 5% return | | $ | 1,000.00 | | | $ | 1,047.02 | | | $ | 3.05 | | | | 0.60 | |
| Mid Cap Growth Fund | | | | | | | | | | | | | | | | |
| Class N-actual return | | $ | 1,000.00 | | | $ | 1,035.69 | | | $ | 6.06 | | | | 1.20 | |
| Class N-hypothetical 5% return | | $ | 1,000.00 | | | $ | 1,044.05 | | | $ | 6.08 | | | | 1.20 | |
| Class I-actual return | | $ | 1,000.00 | | | $ | 1,036.09 | | | $ | 4.80 | | | | 0.95 | |
| Class I-hypothetical 5% return | | $ | 1,000.00 | | | $ | 1,045.29 | | | $ | 4.82 | | | | 0.95 | |
| Class R6-actual return | | $ | 1,000.00 | | | $ | 1,036.78 | | | $ | 4.55 | | | | 0.90 | |
| Class R6-hypothetical 5% return | | $ | 1,000.00 | | | $ | 1,045.54 | | | $ | 4.56 | | | | 0.90 | |
| Small-Mid Cap Core Fund | | | | | | | | | | | | | | | | |
| Class I-actual return | | $ | 1,000.00 | | | $ | 1,183.23 | | | $ | 5.14 | | | | 0.95 | |
| Class I-hypothetical 5% return | | $ | 1,000.00 | | | $ | 1,045.29 | | | $ | 4.82 | | | | 0.95 | |
| Class R6-actual return | | $ | 1,000.00 | | | $ | 1,184.01 | | | $ | 4.87 | | | | 0.90 | |
| Class R6-hypothetical 5% return | | $ | 1,000.00 | | | $ | 1,045.54 | | | $ | 4.56 | | | | 0.90 | |
| Small-Mid Cap Growth Fund | | | | | | | | | | | | | | | | |
| Class N-actual return | | $ | 1,000.00 | | | $ | 1,080.40 | | | $ | 6.96 | | | | 1.35 | |
| Class N-hypothetical 5% return | | $ | 1,000.00 | | | $ | 1,043.31 | | | $ | 6.84 | | | | 1.35 | |
| Class I-actual return | | $ | 1,000.00 | | | $ | 1,081.70 | | | $ | 5.68 | | | | 1.10 | |
| Class I-hypothetical 5% return | | $ | 1,000.00 | | | $ | 1,044.55 | | | $ | 5.58 | | | | 1.10 | |
| Class R6-actual return | | $ | 1,000.00 | | | $ | 1,081.86 | | | $ | 5.32 | | | | 1.03 | |
| Class R6-hypothetical 5% return | | $ | 1,000.00 | | | $ | 1,044.89 | | | $ | 5.22 | | | | 1.03 | |
| Small Cap Growth Fund | | | | | | | | | | | | | | | | |
| Class N-actual return | | $ | 1,000.00 | | | $ | 1,128.44 | | | $ | 7.92 | | | | 1.50 | |
| Class N-hypothetical 5% return | | $ | 1,000.00 | | | $ | 1,042.56 | | | $ | 7.60 | | | | 1.50 | |
| Class I-actual return | | $ | 1,000.00 | | | $ | 1,130.08 | | | $ | 6.60 | | | | 1.25 | |
| Class I-hypothetical 5% return | | $ | 1,000.00 | | | $ | 1,043.80 | | | $ | 6.33 | | | | 1.25 | |
| Class R6-actual return | | $ | 1,000.00 | | | $ | 1,130.46 | | | $ | 6.13 | | | | 1.16 | |
| Class R6-hypothetical 5% return | | $ | 1,000.00 | | | $ | 1,044.25 | | | $ | 5.88 | | | | 1.16 | |
| Small Cap Value Fund | | | | | | | | | | | | | | | | |
| Class N-actual return | | $ | 1,000.00 | | | $ | 1,176.38 | | | $ | 6.21 | | | | 1.15 | |
| Class N-hypothetical 5% return | | $ | 1,000.00 | | | $ | 1,044.30 | | | $ | 5.83 | | | | 1.15 | |
| Class I-actual return | | $ | 1,000.00 | | | $ | 1,178.33 | | | $ | 4.81 | | | | 0.89 | |
| Class I-hypothetical 5% return | | $ | 1,000.00 | | | $ | 1,045.59 | | | $ | 4.51 | | | | 0.89 | |
| Class R6-actual return | | $ | 1,000.00 | | | $ | 1,178.47 | | | $ | 4.59 | | | | 0.85 | |
| Class R6-hypothetical 5% return | | $ | 1,000.00 | | | $ | 1,045.78 | | | $ | 4.31 | | | | 0.85 | |
| Global Leaders Fund | | | | | | | | | | | | | | | | |
| Class N-actual return | | $ | 1,000.00 | | | $ | 1,107.98 | | | $ | 6.01 | | | | 1.15 | |
| Class N-hypothetical 5% return | | $ | 1,000.00 | | | $ | 1,044.30 | | | $ | 5.83 | | | | 1.15 | |
| Class I-actual return | | $ | 1,000.00 | | | $ | 1,109.33 | | | $ | 4.71 | | | | 0.90 | |
| Class I-hypothetical 5% return | | $ | 1,000.00 | | | $ | 1,045.54 | | | $ | 4.56 | | | | 0.90 | |
| Class R6-actual return | | $ | 1,000.00 | | | $ | 1,109.90 | | | $ | 4.45 | | | | 0.85 | |
| Class R6-hypothetical 5% return | | $ | 1,000.00 | | | $ | 1,045.78 | | | $ | 4.31 | | | | 0.85 | |
| 194 | Semiannual Report | June 30, 2021 |
Fund Expenses (Unaudited)
| Expense Example | | Beginning
Account Value
1/1/2021 | | Ending
Account Value
6/30/2021 | | Expenses Paid
During
the Period (a) | | Annualized
Expense Ratio |
| International Leaders Fund | | | | | | | | | | | | | | | | |
| Class N-actual return | | $ | 1,000.00 | | | $ | 1,062.14 | | | $ | 5.88 | | | | 1.15 | % |
| Class N-hypothetical 5% return | | $ | 1,000.00 | | | $ | 1,044.30 | | | $ | 5.83 | | | | 1.15 | |
| Class I-actual return | | $ | 1,000.00 | | | $ | 1,063.16 | | | $ | 4.60 | | | | 0.90 | |
| Class I-hypothetical 5% return | | $ | 1,000.00 | | | $ | 1,045.54 | | | $ | 4.56 | | | | 0.90 | |
| Class R6-actual return | | $ | 1,000.00 | | | $ | 1,063.60 | | | $ | 4.35 | | | | 0.85 | |
| Class R6-hypothetical 5% return | | $ | 1,000.00 | | | $ | 1,045.78 | | | $ | 4.31 | | | | 0.85 | |
| International Growth Fund | | | | | | | | | | | | | | | | |
| Class N-actual return | | $ | 1,000.00 | | | $ | 1,082.84 | | | $ | 7.49 | | | | 1.45 | |
| Class N-hypothetical 5% return | | $ | 1,000.00 | | | $ | 1,042.81 | | | $ | 7.34 | | | | 1.45 | |
| Class I-actual return | | $ | 1,000.00 | | | $ | 1,084.49 | | | $ | 5.89 | | | | 1.14 | |
| Class I-hypothetical 5% return | | $ | 1,000.00 | | | $ | 1,044.35 | | | $ | 5.78 | | | | 1.14 | |
| Class R6-actual return | | $ | 1,000.00 | | | $ | 1,084.72 | | | $ | 5.48 | | | | 1.06 | |
| Class R6-hypothetical 5% return | | $ | 1,000.00 | | | $ | 1,044.74 | | | $ | 5.37 | | | | 1.06 | |
| Institutional International Growth Fund | | | | | | | | | | | | | | | | |
| Institutional Class-actual return | | $ | 1,000.00 | | | $ | 1,084.93 | | | $ | 5.22 | | | | 1.01 | |
| Institutional Class-hypothetical 5% return | | $ | 1,000.00 | | | $ | 1,044.99 | | | $ | 5.12 | | | | 1.01 | |
| International Small Cap Growth Fund | | | | | | | | | | | | | | | | |
| Class N-actual return | | $ | 1,000.00 | | | $ | 1,072.78 | | | $ | 7.55 | | | | 1.47 | |
| Class N-hypothetical 5% return | | $ | 1,000.00 | | | $ | 1,042.71 | | | $ | 7.45 | | | | 1.47 | |
| Class I-actual return | | $ | 1,000.00 | | | $ | 1,074.18 | | | $ | 6.17 | | | | 1.20 | |
| Class I-hypothetical 5% return | | $ | 1,000.00 | | | $ | 1,044.05 | | | $ | 6.08 | | | | 1.20 | |
| Class R6-actual return | | $ | 1,000.00 | | | $ | 1,074.89 | | | $ | 5.71 | | | | 1.11 | |
| Class R6-hypothetical 5% return | | $ | 1,000.00 | | | $ | 1,044.50 | | | $ | 5.63 | | | | 1.11 | |
| Emerging Markets Leaders Fund | | | | | | | | | | | | | | | | |
| Class N-actual return | | $ | 1,000.00 | | | $ | 1,036.95 | | | $ | 7.07 | | | | 1.40 | |
| Class N-hypothetical 5% return | | $ | 1,000.00 | | | $ | 1,043.06 | | | $ | 7.09 | | | | 1.40 | |
| Class I-actual return | | $ | 1,000.00 | | | $ | 1,038.40 | | | $ | 5.81 | | | | 1.15 | |
| Class I-hypothetical 5% return | | $ | 1,000.00 | | | $ | 1,044.30 | | | $ | 5.83 | | | | 1.15 | |
| Class R6-actual return | | $ | 1,000.00 | | | $ | 1,039.22 | | | $ | 5.56 | | | | 1.10 | |
| Class R6-hypothetical 5% return | | $ | 1,000.00 | | | $ | 1,044.55 | | | $ | 5.58 | | | | 1.10 | |
| Emerging Markets Growth Fund | | | | | | | | | | | | | | | | |
| Class N-actual return | | $ | 1,000.00 | | | $ | 1,103.69 | | | $ | 7.93 | | | | 1.52 | |
| Class N-hypothetical 5% return | | $ | 1,000.00 | | | $ | 1,042.46 | | | $ | 7.70 | | | | 1.52 | |
| Class I-actual return | | $ | 1,000.00 | | | $ | 1,105.04 | | | $ | 6.42 | | | | 1.23 | |
| Class I-hypothetical 5% return | | $ | 1,000.00 | | | $ | 1,043.90 | | | $ | 6.23 | | | | 1.23 | |
| Class R6-actual return | | $ | 1,000.00 | | | $ | 1,105.63 | | | $ | 6.06 | | | | 1.16 | |
| Class R6-hypothetical 5% return | | $ | 1,000.00 | | | $ | 1,044.25 | | | $ | 5.88 | | | | 1.16 | |
| Emerging Markets Small Cap Growth Fund | | | | | | | | | | | | | | | | |
| Class N-actual return | | $ | 1,000.00 | | | $ | 1,135.46 | | | $ | 8.21 | | | | 1.55 | |
| Class N-hypothetical 5% return | | $ | 1,000.00 | | | $ | 1,042.31 | | | $ | 7.85 | | | | 1.55 | |
| Class I-actual return | | $ | 1,000.00 | | | $ | 1,137.05 | | | $ | 6.89 | | | | 1.30 | |
| Class I-hypothetical 5% return | | $ | 1,000.00 | | | $ | 1,043.55 | | | $ | 6.59 | | | | 1.30 | |
| Class R6-actual return | | $ | 1,000.00 | | | $ | 1,137.25 | | | $ | 6.57 | | | | 1.24 | |
| Class R6-hypothetical 5% return | | $ | 1,000.00 | | | $ | 1,043.85 | | | $ | 6.28 | | | | 1.24 | |
| Bond Fund | | | | | | | | | | | | | | | | |
| Class N-actual return | | $ | 1,000.00 | | | $ | 987.67 | | | $ | 2.96 | | | | 0.60 | |
| Class N-hypothetical 5% return | | $ | 1,000.00 | | | $ | 1,047.02 | | | $ | 3.05 | | | | 0.60 | |
| Class I-actual return | | $ | 1,000.00 | | | $ | 989.06 | | | $ | 2.22 | | | | 0.45 | |
| Class I-hypothetical 5% return | | $ | 1,000.00 | | | $ | 1,047.77 | | | $ | 2.28 | | | | 0.45 | |
| Class R6-actual return | | $ | 1,000.00 | | | $ | 988.36 | | | $ | 1.97 | | | | 0.40 | |
| Class R6-hypothetical 5% return | | $ | 1,000.00 | | | $ | 1,048.02 | | | $ | 2.03 | | | | 0.40 | |
| Income Fund | | | | | | | | | | | | | | | | |
| Class N-actual return | | $ | 1,000.00 | | | $ | 991.66 | | | $ | 4.20 | | | | 0.85 | |
| Class N-hypothetical 5% return | | $ | 1,000.00 | | | $ | 1,045.78 | | | $ | 4.31 | | | | 0.85 | |
| Class I-actual return | | $ | 1,000.00 | | | $ | 992.38 | | | $ | 3.36 | | | | 0.68 | |
| Class I-hypothetical 5% return | | $ | 1,000.00 | | | $ | 1,046.63 | | | $ | 3.45 | | | | 0.68 | |
| Class R6-actual return | | $ | 1,000.00 | | | $ | 992.64 | | | $ | 3.06 | | | | 0.62 | |
| Class R6-hypothetical 5% return | | $ | 1,000.00 | | | $ | 1,046.93 | | | $ | 3.15 | | | | 0.62 | |
| June 30, 2021 | William Blair Funds | 195 |
Fund Expenses (Unaudited)
| Expense Example | | Beginning
Account Value
1/1/2021 | | Ending
Account Value
6/30/2021 | | Expenses Paid
During
the Period (a) | | Annualized
Expense Ratio |
| Low Duration Fund | | | | | | | | | | | | | | | | |
| Class N-actual return | | $ | 1,000.00 | | | $ | 1,000.48 | | | $ | 2.73 | | | | 0.55 | % |
| Class N-hypothetical 5% return | | $ | 1,000.00 | | | $ | 1,047.27 | | | $ | 2.79 | | | | 0.55 | |
| Class I-actual return | | $ | 1,000.00 | | | $ | 1,001.25 | | | $ | 1.98 | | | | 0.40 | |
| Class I-hypothetical 5% return | | $ | 1,000.00 | | | $ | 1,048.02 | | | $ | 2.03 | | | | 0.40 | |
| Class R6-actual return | | $ | 1,000.00 | | | $ | 1,001.47 | | | $ | 1.74 | | | | 0.35 | |
| Class R6-hypothetical 5% return | | $ | 1,000.00 | | | $ | 1,048.26 | | | $ | 1.78 | | | | 0.35 | |
| Emerging Markets Debt Fund | | | | | | | | | | | | | | | | |
| Class I-actual return (b) | | $ | 1,000.00 | | | $ | 1,003.69 | | | $ | 0.71 | | | | 0.70 | |
| Class I-hypothetical 5% return (6 month period) | | $ | 1,000.00 | | | $ | 1,046.53 | | | $ | 3.55 | | | | 0.70 | |
| Class R6-actual return (b) | | $ | 1,000.00 | | | $ | 1,003.73 | | | $ | 0.66 | | | | 0.65 | |
| Class R6-hypothetical 5% return (6 month period) | | $ | 1,000.00 | | | $ | 1,046.78 | | | $ | 3.30 | | | | 0.65 | |
| Macro Allocation Fund | | | | | | | | | | | | | | | | |
| Class N-actual return | | $ | 1,000.00 | | | $ | 1,038.43 | | | $ | 6.37 | | | | 1.26 | |
| Class N-hypothetical 5% return | | $ | 1,000.00 | | | $ | 1,043.75 | | | $ | 6.38 | | | | 1.26 | |
| Class I-actual return | | $ | 1,000.00 | | | $ | 1,039.63 | | | $ | 5.11 | | | | 1.01 | |
| Class I-hypothetical 5% return | | $ | 1,000.00 | | | $ | 1,044.99 | | | $ | 5.12 | | | | 1.01 | |
| Class R6-actual return | | $ | 1,000.00 | | | $ | 1,040.55 | | | $ | 4.86 | | | | 0.96 | |
| Class R6-hypothetical 5% return | | $ | 1,000.00 | | | $ | 1,045.24 | | | $ | 4.87 | | | | 0.96 | |
| (a) | Expenses are equal to the annualized expense ratio, multiplied by the average account value over the period, multiplied by the number of days in the period, 181 and divided by 365 (to reflect the one-half year period). |
| (b) | For the period May 25, 2021 (Commencement of Operations) to June 30, 2021. |
| 196 | Semiannual Report | June 30, 2021 |
| | BOARD OF TRUSTEES (as of August 26, 2021) |
| | |
| | Vann A. Avedisian |
| | Co-founder and Partner, Newbond Holdings |
| | Kathleen T. Barr |
| | Retired Senior Managing Director, PNC Capital Advisors, LLC |
| | Stephanie G. Braming, CFA, Chairman and President |
| | Partner, William Blair |
| | Daniel N. Leib |
| | Chief Executive Officer, Donnelley Financial Solutions, Inc. |
| | Dorri C. McWhorter |
| | Chief Executive Officer, YWCA Metropolitan Chicago |
| | Arthur J. Simon |
| | Partner, William Blair |
| | Thomas J. Skelly |
| | Retired Managing Partner, Accenture |
| | Steven R. Zenz |
| | Retired Partner, KPMG LLP |
| | |
| | Officers |
| | |
| | Alaina Anderson, CFA, Senior Vice President |
| | Marcelo Assalin, CFA, Senior Vice President |
| | Thomas Clarke, Senior Vice President |
| | Daniel Crowe, CFA, Senior Vice President |
| | Robert J. Duwa, CFA, Senior Vice President |
| | Simon Fennell, Senior Vice President |
| | Andrew G. Flynn, CFA, Senior Vice President |
| | David C. Fording, CFA, Senior Vice President |
| | James S. Golan, CFA, Senior Vice President |
| | William V. Heaphy, CFA, Senior Vice President |
| | James E. Jones, CFA, Senior Vice President |
| | Kenneth J. McAtamney, Senior Vice President |
| | Todd M. McClone, CFA, Senior Vice President |
| | John C. Murphy, CFA, Senior Vice President |
| | D.J. Neiman, CFA, Senior Vice President |
| | Casey K. Preyss, CFA, Senior Vice President |
| | David P. Ricci, CFA, Senior Vice President |
| | Lisa D. Rusch, Senior Vice President |
| | Hugo Scott-Gall, Senior Vice President |
| | Ward D. Sexton, CFA, Senior Vice President |
| | Brian D. Singer, CFA, Senior Vice President |
| | Mark C. Thompson, CFA, Senior Vice President |
| | Vivian Lin Thurston, CFA, Senior Vice President |
| | Dan Zelazny, Senior Vice President |
| | Ruta Ziverte, Senior Vice President |
| | Kathleen M. Lynch, CFA, Vice President |
| | Vesta Marks, CFA, CAIA, Vice President |
| | Gary J. Merwitz, Vice President |
| | Marco Ruijer, CFA, Vice President |
| | John M. Raczek, Treasurer |
| | Andrew T. Pfau, Secretary |
| | David M. Cihak, Assistant Treasurer |
| | Walter R. Randall, Jr., Chief Compliance Officer and Assistant Secretary |
| | Robert J. Toner, Assistant Secretary |
| | Investment Adviser |
| | William Blair Investment Management, LLC |
| | Distributor |
| | William Blair & Company, L.L.C. |
| | Independent Registered Public Accounting Firm |
| | Ernst & Young LLP |
| | Transfer Agent |
| | DST Asset Manager Solutions, Inc. |
| | For customer assistance, call 1-800-635-2886 |
| | P.O. Box 219137 |
| | Kansas City, Missouri 64121-9137 |
| June 30, 2021 | William Blair Funds | 197 |
| | | | | | |
| | William Blair Funds | | | |
| | | | | | |
| | | | | | |
| | U.S. EQUITY | | GLOBAL EQUITY | | FIXED INCOME |
| | Growth Fund | | Global Leaders Fund | | Bond Fund |
| | Large Cap Growth Fund | | | | Income Fund |
| | Mid Cap Growth Fund | | INTERNATIONAL EQUITY | | Low Duration Fund |
| | Small-Mid Cap Core Fund | | International Leaders Fund | | |
| | Small-Mid Cap Growth Fund | | International Growth Fund | | EMERGING MARKETS |
| | Small Cap Growth Fund | | Institutional International Growth Fund | | DEBT |
| | Small Cap Value Fund | | International Small Cap Growth Fund | | Emerging Markets Debt Fund |
| | | | Emerging Markets Leaders Fund | | |
| | | | Emerging Markets Growth Fund | | MULTI-ASSET AND |
| | | | Emerging Markets Small Cap Growth Fund | | ALTERNATIVE |
| | | | | | Macro Allocation Fund |
| | | | | | |
| | | | | | |
 | | © | William Blair & Company, L.L.C., distributor | |
| +1 800 742 7272 | | 150 North Riverside Plaza | |
| williamblairfunds.com | | Chicago, Illinois 60606 | 00103188 |
Not applicable to this filing.
| Item 3. | Audit Committee Financial Expert |
Not applicable to this filing.
| Item 4. | Principal Accountant Fees and Services |
Not applicable to this filing.
| Item 5. | Audit Committee of Listed Registrants |
Not applicable to this Registrant, insofar as the Registrant is not a listed company.
| Item 6. | Schedule of Investments |
See Schedule of Investments in Item 1.
| Item 7. | Disclosure of Proxy Voting Policies and Procedures for Closed-End Management Investment Companies |
Not applicable to this Registrant, insofar as the Registrant is not a closed-end management investment company.
| Item 8. | Portfolio Managers of Closed-End Management Investment Companies |
Not applicable to this Registrant, insofar as the Registrant is not a closed-end management investment company.
| Item 9. | Purchase of Equity Securities by Closed-End Management Investment Companies and Affiliated Purchasers |
Not applicable to this Registrant, insofar as the Registrant is not a closed-end management investment company.
| Item 10. | Submission of Matters to a Vote of Security Holders |
There have been no material changes to the procedures by which shareholders may recommend nominees to the Registrant’s Board of Trustees since the Registrant last provided disclosure in response to this item.
Controls and Procedures
(a) The Registrant’s principal executive and principal financial officers, or persons performing similar functions, have concluded that the Registrant’s Disclosure Controls and Procedures (as defined in Rule 30a-3(c) under the Investment Company Act of 1940, as amended (the “1940 Act”) (17 CFR 270.30a-3(c)) are effective, as of a date within 90 days of the filing date of this report that includes the disclosure required by this paragraph, based on their evaluation of these controls and procedures required by Rule 30a-3 (b) under the 1940 Act (17 CFR 270.30a-3(b) and Rules 13a-15(b) or 15d-15(b) under the Securities Exchange Act of 1934, as amended to date (17 CFR 240.13a-15(b) or 240.15d-15(b)).
(b) There were no changes in the Registrant’s internal control over financial reporting (as defined in Rule 30a-3(d) under the 1940 Act (17 CFR 270.30a-3(d)) that occurred during the period covered by this report that has materially affected, or is reasonably likely to materially affect, the Registrant’s internal control over financial reporting.
| Item 12. | Disclosure of Securities Lending Activities for Closed-End Management Investment Companies |
Not applicable to this Registrant, insofar as the Registrant is not a closed-end management investment company.
13. (a) (1) Code of Ethics
Not applicable to this filing.
13. (a) (2) (1)
Certification of Principal Executive Officer Required by Rule 30a-2(a) of the Investment Company Act of 1940 is filed as an exhibit hereto.
13. (a) (2) (2)
Certification of Principal Financial Officer Required by Rule 30a-2(a) of the Investment Company Act of 1940 is filed as an exhibit hereto.
13. (a) (3)
Not applicable to this Registrant.
13. (a) (4)
Not applicable to this filing.
13. (b)
Certifications of the Principal Executive Officer and Principal Financial Officer of the issuer as required by Rule 30a-2(b) of the Investment Company Act of 1940 are filed as exhibits hereto.
SIGNATURES
Pursuant to the requirements of the Securities Exchange Act of 1934 and the Investment Company Act of 1940, the Registrant has duly caused this report to be signed on its behalf by the undersigned, thereunto duly authorized.
| | | William Blair Funds |
| | |
| | | /s/ Stephanie G. Braming |
| By: | | Stephanie G. Braming |
| | | President (Principal Executive Officer) |
Date: August 26, 2021
Pursuant to the requirements of the Securities Exchange Act of 1934 and the Investment Company Act of 1940, this report has been signed below by the following persons on behalf of the Registrant and in the capacities and on the dates indicated.
| | | /s/ Stephanie G. Braming |
| By: | | Stephanie G. Braming |
| | | President (Principal Executive Officer) |
Date: August 26, 2021
| | | /s/ John M. Raczek |
| By: | | John M. Raczek |
| | | Treasurer (Principal Financial Officer) |
Date: August 26, 2021