UNITED STATES
SECURITIES AND EXCHANGE COMMISSION
Washington, D.C. 20549
FORM N-CSR
CERTIFIED SHAREHOLDER REPORT OF REGISTERED
MANAGEMENT INVESTMENT COMPANIES
Investment Company Act file number 811-05349
Goldman Sachs Trust
(Exact name of registrant as specified in charter)71 South Wacker Drive, Chicago, Illinois 60606
(Address of principal executive offices) (Zip code)| | | |
| Peter V. Bonanno, Esq. | | Copies to: |
| Goldman, Sachs & Co. | | Geoffrey R.T. Kenyon, Esq. |
| 200 West Street | | Dechert LLP |
| New York, New York 10282 | | 200 Clarendon Street |
| | | 27th Floor
Boston, MA 02116-5021 |
|
(Name and address of agents for service)
|
Registrant’s telephone number, including area code: (312) 655-4400
Date of fiscal year end: March 31
Date of reporting period: September 30, 2011
| | | |
| ITEM 1. | | REPORTS TO STOCKHOLDERS. |
| | | |
| | | The Semi-Annual Report to Stockholders is filed herewith. |
Goldman Sachs Funds
| | | | |
| | | | |
Semi-Annual Report | | | September 30, 2011 |
| | | | |
| | | | |
| | | | |
| | | | |
| | | | Single Sector Fixed Income Funds |
| | | | Emerging Markets Debt |
| | | | High Yield |
| | | | High Yield Floating Rate |
| | | | Investment Grade Credit |
| | | | Local Emerging Markets Debt |
| | | | U.S. Mortgages |
| | | | |
Goldman Sachs Single Sector Fixed Income Funds
| |
| n | EMERGING MARKETS DEBT |
| |
| n | HIGH YIELD |
| |
| n | HIGH YIELD FLOATING RATE |
| |
| n | INVESTMENT GRADE CREDIT |
| |
| n | LOCAL EMERGING MARKETS DEBT |
| |
| n | U.S. MORTGAGES |
| | | |
| TABLE OF CONTENTS | | |
| |
| | | |
| Principal Investment Strategies and Risks | | 1 |
| | | |
| Investment Process | | 3 |
| | | |
| Market Review | | 4 |
| | | |
Portfolio Management Discussion
and Performance Summaries | | 11 |
| | | |
| Schedules of Investments | | 37 |
| | | |
| Financial Statements | | 90 |
| | | |
| Financial Highlights | | 98 |
| | | |
| Notes to Financial Statements | | 110 |
| | | |
| Other Information | | 134 |
| | | | | | | |
NOT FDIC-INSURED | | | May Lose Value | | | No Bank Guarantee |
| | | | | | | |
GOLDMAN SACHS SINGLE SECTOR FIXED INCOME FUNDS
Principal Investment Strategies and Risks
This is not a complete list of risks that affect the Funds. For additional information concerning the risks applicable to the Funds, please see the Funds’ prospectus.
The Emerging Markets Debt Fund invests primarily in sovereign and corporate debt of issuers located in or tied economically to emerging countries. The Fund’s investments in fixed income securities are subject to the risks associated with debt securities generally, including credit, liquidity and interest rate risk. The countries in which the Fund invests may have sovereign ratings that are below investment grade or are unrated. High yield, lower rated securities involve greater price volatility and present greater risks than higher rated fixed income securities. Fixed income securities of emerging countries may be less liquid and may be subject to greater price volatility than U.S. fixed income securities and will be subject to the risks of currency fluctuations and sudden economic or political developments. The liquidity of particular portfolio securities may shrink or disappear suddenly and without warning as a result of adverse economic, market or political events, or adverse investor perceptions, whether or not accurate. At times, the Fund may be unable to sell certain of its portfolio securities without a substantial drop in price, if at all. The securities markets of emerging countries may have more or less government regulation and may be subject to less extensive accounting and financial reporting requirements than the markets of more developed countries. The Fund is also subject to the risk that the issuers of sovereign debt or the government authorities that control the payment of debt may be unable or unwilling to repay principal or interest when due. The Fund may also engage in foreign currency transactions for hedging purposes (including cross hedging) or for speculative purposes. Forward foreign currency exchange contracts are subject to the risk that the counterparty to the contract will default on its obligations. The Fund may make substantial investments in derivative instruments, including options, financial futures, Eurodollar futures contracts, swaps, options on swaps, structured securities and other derivative investments. Derivative instruments may involve a high degree of financial risk. These risks include the risk that a small movement in the price of the underlying security or benchmark may result in a disproportionately large movement, unfavorable or favorable, in the price of the derivative instrument; the risk of default by a counterparty; and the risk that transactions may not be liquid. The Fund may concentrate its investments in particular countries or regions and may be subject to greater losses than if it were less concentrated in a particular country or region. The Fund is non-diversified and may invest more of its assets in fewer issuers than diversified funds and may be more susceptible to adverse developments affecting any single issuer held in its portfolio and may be susceptible to greater losses because of these developments.
The High Yield Fund invests primarily in high yield, fixed income securities that, at the time of purchase, are non-investment grade securities. The Fund’s investments in fixed income securities are subject to the risks associated with debt securities generally, including credit, liquidity and interest rate risk. High yield, lower rated securities involve greater price volatility and present greater risks than higher rated fixed income securities. The Fund may also invest in securities of foreign issuers denominated in currencies other than the U.S. dollar and in securities of issuers located in emerging countries. The Fund’s foreign and emerging market investments may be more volatile and less liquid than its investments in U.S. securities and will be subject to the risks of currency fluctuations and sudden economic or political developments. The liquidity of particular portfolio securities may shrink or disappear suddenly and without warning as a result of adverse economic, market or political events, or adverse investor perceptions, whether or not accurate. At times, the Fund may be unable to sell certain of its portfolio securities without a substantial drop in price, if at all. The Fund may also engage in foreign currency transactions for hedging purposes (including cross hedging) or for speculative purposes. The Fund may make substantial investments in derivative instruments, including options, financial futures, Eurodollar futures contracts, swaps, options on swaps, structured securities and other derivative investments. Derivative instruments may involve a high degree of financial risk. These risks include the risk that a small movement in the price of the underlying security or benchmark may result in a disproportionately large movement, unfavorable or favorable, in the price of the derivative instrument; the risk of default by a counterparty; and the risk that transactions may not be liquid.
The High Yield Floating Rate Fund invests primarily in domestic or foreign floating rate loans and other floating or variable rate obligations rated below investment grade. High yield, lower rated instruments involve greater price volatility and present greater risks than higher rated instruments. The Fund may invest in loans directly or indirectly, by purchasing participations or sub-participations from financial institutions. Indirect purchases may subject the Fund to greater delays, expenses and risks than direct obligations in the case that a borrower fails to pay scheduled principal and interest. The Fund’s investments in loans and fixed income instruments are subject to the risks associated with debt instruments generally, including credit, liquidity and interest rate risk. The Fund may invest in securities of foreign issuers denominated in currencies other than the U.S. dollar and in securities of issuers located in emerging countries. The Fund’s foreign and emerging market investments may be more volatile and less liquid than its investments in U.S. securities and will be subject to the risks of currency fluctuations and sudden economic or political developments. At times, the Fund may be unable to sell certain of its portfolio securities without a substantial drop in price, if at all. The liquidity of particular portfolio securities may shrink or disappear suddenly and without warning as a result of adverse economic, market or political events, or adverse investor perceptions, whether or not accurate. The Fund may also engage in foreign currency transactions for hedging purposes (including cross-hedging) or for speculative purposes. Forward foreign currency exchange
GOLDMAN SACHS SINGLE SECTOR FIXED INCOME FUNDS
contracts are subject to the risk that the counterparty to the contract will default on its obligations. The Fund may make considerable investments in derivative instruments, including options, financial futures, swaps, options on swaps, structured securities and other derivative instruments. Derivative instruments may involve a high degree of financial risk. These risks include the risk that a small movement in the price of the underlying security or benchmark may result in a disproportionately large movement, unfavorable or favorable, in the price of the derivative instrument; the risk of default by a counterparty; and the risk that transactions may not be liquid.
The Investment Grade Credit Fund invests primarily in investment grade fixed income securities. The Fund’s investments in fixed income securities are subject to the risks associated with debt securities generally, including credit, liquidity and interest rate risk. The guarantee on U.S. government securities applies only to the underlying securities of the Fund if held to maturity and not to the value of the Fund’s shares. The Fund’s investments in mortgage-backed securities are subject to prepayment risks. These risks may result in greater share price volatility. The Fund may invest in foreign and emerging markets securities, which may be more volatile and less liquid than its investments in U.S. securities and will be subject to the risks of currency fluctuations and sudden economic or political developments. At times, the Fund may be unable to sell certain of its portfolio securities without a substantial drop in price, if at all. The Fund may also engage in foreign currency transactions for hedging purposes (including cross hedging) or for speculative purposes. Forward foreign currency exchange contracts are subject to the risk that the counterparty to the contract will default on its obligations. The Fund may make substantial investments in derivative instruments, including options, financial futures, Eurodollar futures contracts, swaps, options on swaps, structured securities and other derivative investments. Derivative instruments may involve a high degree of financial risk. These risks include the risk that a small movement in the price of the underlying security or benchmark may result in a disproportionately large movement, unfavorable or favorable, in the price of the derivative instrument; the risk of default by a counterparty; and the risk that transactions may not be liquid.
The Local Emerging Markets Debt Fund invests primarily in (i) sovereign and corporate debt of issuers located in or tied economically to emerging countries, denominated in the local currency of such emerging countries, or (ii) currencies of such emerging countries. The Fund’s investments in fixed income securities are subject to the risks associated with debt securities generally, including credit, liquidity and interest rate risk. The countries in which the Fund invests may have sovereign ratings that are below investment grade or are unrated. High yield, lower rated securities involve greater price volatility and present greater risks than higher rated fixed income securities. Fixed income securities of emerging countries may be less liquid and may be subject to greater price volatility and will be subject to the risks of currency fluctuations and sudden economic or political developments. The liquidity of particular portfolio securities may shrink or disappear suddenly and without warning as a result of adverse economic, market or political events, or adverse investor perceptions, whether or not accurate. At times, the Fund may be unable to sell certain of its portfolio securities without a substantial drop in price, if at all. The securities markets of emerging countries may have more or less government regulation and may be subject to less extensive accounting and financial reporting requirements than the markets of more developed countries. The Fund is also subject to the risk that the issuers of sovereign debt or the government authorities that control the payment of debt may be unable or unwilling to repay principal or interest when due. The Fund may also engage in foreign currency transactions for hedging purposes (including cross hedging) or for speculative purposes. Forward foreign currency exchange contracts are subject to the risk that the counterparty to the contract will default on its obligations. The Fund may make substantial investments in derivative instruments, including options, financial futures, Eurodollar futures contracts, swaps, options on swaps, structured securities and other derivative investments. Derivative instruments may involve a high degree of financial risk. These risks include the risk that a small movement in the price of the underlying security or benchmark may result in a disproportionately large movement, unfavorable or favorable, in the price of the derivative instrument; the risk of default by a counterparty; and the risk that transactions may not be liquid. The Fund is non-diversified and may invest more of its assets in fewer issuers than diversified funds and may be more susceptible to adverse developments affecting any single issuer held in its portfolio, and may be susceptible to greater losses because of these developments.
The U.S. Mortgages Fund invests primarily in securities representing direct or indirect interests in or that are collateralized by mortgage-backed securities of U.S. issuers. The Fund’s investments in fixed income securities are subject to the risks associated with debt securities generally, including credit, liquidity and interest rate risk. The Fund’s investments in mortgage-backed securities (MBS) are subject to prepayment risk, the risk that in a declining interest rate environment the Fund’s underlying mortgages may be prepaid, causing the Fund to have to reinvest at lower interest rates. This risk may result in greater share price volatility than a fixed income fund not invested in MBS. The guarantee on U.S. government securities applies only to the underlying securities of the Fund if held to maturity and not to the value of the Fund’s shares. The Fund may make substantial investments in derivative instruments, including options, financial futures, Eurodollar futures contracts, swaps, options on swaps, structured securities and other derivative investments. Derivative instruments may involve a high degree of financial risk. These risks include the risk that a small movement in the price of the underlying security or benchmark may result in a disproportionately large movement, unfavorable or favorable, in the price of the derivative instrument; the risk of default by a counterparty; and the risk that transactions may not be liquid.
GOLDMAN SACHS SINGLE SECTOR FIXED INCOME FUNDS
What Differentiates the Goldman Sachs Asset Management Fixed Income Investment Process?
At Goldman Sachs Asset Management, L.P. (“GSAM”), the goal of our fixed income investment process is to provide consistent, strong performance by actively managing our portfolios within a research-intensive, risk-managed framework.
A key element of our fixed income investment philosophy is to evaluate the broadest global opportunity set to capture relative value across sectors and instruments. Our globally integrated investment process involves managing dynamically along the risk/return spectrum, as we continue to develop value-added strategies through:
| |
| n | Assess relative value among securities and sectors |
| |
| n | Leverage the vast resources of GSAM in selecting securities for each portfolio |
| |
| n | Team approach to decision making |
| |
| n | Manage risk by avoiding significant sector and interest rate bets |
| |
| Fixed Income portfolios that: |
| |
n Include domestic and global investment options, income opportunities, and access to areas of specialization such as high yield |
n Capitalize on GSAM’s industry-renowned credit research capabilities |
n Use a risk-managed framework to seek total return, recognizing the importance of investors’ capital accumulation goals as well as their need for income |
MARKET REVIEW
Goldman Sachs Single Sector Fixed Income Funds
Market Review
The six months ended September 30, 2011 (the “Reporting Period”) were dominated in the fixed income market by investor concerns about the economic outlook and fiscal challenges in the U.S. and Europe, resulting in significant volatility.
Economic growth was already slowing when the Reporting Period began in April 2011, as political unrest in the Middle East and North Africa had caused oil prices to spike, thereby reducing consumers’ disposable income. Economic growth was also under pressure in the aftermath of the massive earthquake and tsunami that had struck Japan in mid-March. The tragedy in Japan created severe disruptions in global supply chains that rely on Japanese parts, leading to a sharp drop in U.S. and global industrial production. The crisis at the Fukushima nuclear power plant also appeared to weigh heavily on sentiment among consumers, businesses and investors.
Challenges to global economic growth continued to build as the second calendar quarter progressed, as Greek budget data revealed a larger than expected deficit, raising concerns that Greece would require additional support to avoid defaulting on its debt. Despite these challenges, riskier fixed income sectors performed relatively well during the quarter even as the yield on the 10-year U.S. Treasury note fell from approximately 3.5% at the start of April to below 3% in late June. For example, high yield corporate bonds returned 1.05% in the second calendar quarter, as measured by the Barclays Capital U.S. Corporate High Yield Index, 2% Issuer Capped, while emerging market bonds returned 3.37%, as measured by the Barclays Capital Emerging Markets Index.
Early in the third calendar quarter, investors became increasingly concerned about the possibility of a Greek default and the potential implications for the rest of Europe. Policymakers responded with a number of steps that helped to stabilize markets, leading to a continuation of the relatively positive performance in riskier sectors of the fixed income market. In particular, Greece approved additional austerity measures in a closely watched vote that allowed the country to receive funds under the 2010 bailout agreement, and the International Monetary Fund and European Union agreed to a second bailout plan for Greece near the end of July.
Market volatility, however, increased dramatically in late July and early August as investors’ focus turned to the U.S. A contentious debate over increasing the U.S. debt ceiling raised concerns about the potential for a U.S. default and the possibility of a downgrade of the U.S.’ AAA credit rating. Although U.S. policymakers eventually reached an agreement to raise the debt ceiling, the budget cuts agreed to were not enough to prevent Standard & Poor’s from downgrading the U.S. to AA+. The unprecedented downgrade of U.S. sovereign debt appeared to weigh heavily on investors’ risk appetite, and riskier sectors of the financial markets fell sharply during the first week of August.
The sell-off in riskier asset classes continued throughout the rest of August and September, leading policymakers to respond with additional measures in an effort to calm markets. In a historic move, the Federal Reserve (the “Fed”) announced in August that it would maintain short-term interest rates at current low levels into 2013. It was the first time the Fed had pegged its “exceptionally low” rates to a specific date. The European Central Bank announced that it would begin buying Spanish and Italian government bonds. In September, the Fed took another unconventional step to boost the economy when it announced a new program, dubbed “Operation Twist” to extend the maturity of its Treasury security holdings. The Fed’s stated goal was to lower longer-term interest rates and thereby spur spending and investment.
MARKET REVIEW
By the end of the third calendar quarter, 10-year U.S. Treasury yields had fallen to 1.92%, a decline of more than 150 basis points since the start of the Reporting Period. (A basis point is 1/100th of a percentage point.) Riskier fixed income sectors underperformed U.S. Treasuries, with both the high yield corporate bonds and emerging markets debt sectors lagging U.S. Treasuries by more than 10% during the third calendar quarter overall.
n Investment grade corporate bonds sold off heavily during the Reporting Period because of ongoing concerns about Greece’s sovereign debt crisis and the potential of contagion to the rest of Europe as well as the financial sector. Indeed, the third calendar quarter was the most challenging three months for investment grade corporate bonds since the 2008-2009 credit crisis. During the Reporting Period as a whole, credit spreads, or the difference in yields between corporate bonds and duration-equivalent U.S. Treasury securities, widened by 78 basis points to reach 2.18% by September 30, 2011. U.S. investment grade corporate bonds generally outperformed their European counterparts. Many companies, particularly in the U.S., continued to show positive trends in cash balances and earnings per share.
The banking industry, however, struggled. European banks performed poorly after the release in July of stress test results that were not perceived as particularly meaningful. Thereafter, Bank of America was hit by litigation related to mortgage servicing, raising doubts about the bank’s level of liquidity and financial stability. During the Reporting Period, rating agencies underscored their concerns about the financial sector. Moody’s Investors Service made one- notch cuts to its ratings of Credit Agricole and Société Générale. It then downgraded Bank of America, Citigroup and Wells Fargo, with Bank of America receiving a larger than expected two-notch downgrade. On the regulatory front, the U.K. continued to discuss the so-called “ring-fencing” process (that is, placing legal barriers between “good” banks and “bad” banks in the U.K.).
New issuance of investment grade corporate bonds was muted overall, although it ramped up swiftly toward the end of the Reporting Period. Because of challenging market conditions, however, issuers had to offer substantial concessions to attract buyers.
n U.S. mortgage-backed securities lagged the rally in U.S. Treasuries during the Reporting Period amid increased market volatility and concern that falling interest rates would lead to faster prepayments. (Prepayment means paying off a debt partially or entirely before the loan term expires.) Prepayment is a risk for investors who hold mortgage-backed securities because it can deprive them of interest payments they might otherwise have received. The lower rate environment during the Reporting Period spurred economic incentives for eligible borrowers to refinance. Moreover, expectations of further homeowner relief efforts added to prepayment volatility, as government organizations hinted at modifications to existing refinancing programs to help reduce mortgage costs for credit impaired borrowers. In September, agency mortgage-backed securities rallied on the Fed’s decision to reinvest paydowns from its mortgage-backed securities and agency debt holdings back into the mortgage-backed securities market.
MARKET REVIEW
n High yield corporate bonds experienced great tumult during the Reporting Period. The second calendar quarter offered modest gains with strong corporate fundamentals overshadowed by mixed U.S. economic data. Uncertainty was the key word in the third calendar quarter. Concerns about the U.S. debt ceiling escalated as did fears about a slowdown in global economic growth and the fiscal sustainability of peripheral European countries. The high yield bond market, as represented by the Barclays Capital U.S. Corporate High Yield Index, 2% Issuer Capped, fell 5.12% during the Reporting Period, with the three months ended September 30, 2011 posting the worst quarterly performance since the first quarter of 2008. Yields trended higher, rising 251 basis points to 9.54%. During the Reporting Period, high yield bond spreads, or the difference in yields between high yield bonds and duration- equivalent U.S. Treasury securities, reached their widest levels since August 2009.
New issuance was mixed during the Reporting Period with $92.4 billion in the second quarter and $25.5 billion in the third quarter for total new issuance of $117.9 billion.1 Demand moderated as investors became wary of riskier assets. During the Reporting Period, investment outflows from high yield mutual funds totaled $6.5 billion.2 Default rates remained at historic lows with only five issuers defaulting during the Reporting Period. According to JP Morgan, the 12-month par-weighted high yield bond default rate ended September 2011 at 1.2%, well below the historical average of 4.2%.3
n The high yield loan market was adversely affected by volatility across the financial markets. During the Reporting Period, high yield loans, as represented by the Barclays Capital U.S. High Yield Loan Index, declined 4.33%. Much of the volatility was due to macroeconomic concerns in the developed markets, specifically in the European Union and the U.S. Higher quality loans performed well during the Reporting Period as investors responded to market volatility and uncertainty by targeting defensive names at attractive valuations and increasing the quality of their holdings. In general, BB-rated credit outperformed other sectors in the Barclays Capital U.S. High Yield Loan Index. Interbank offered rates, such as LIBOR and Euribor, remained relatively low as a result of central banks’ easy monetary policies. (LIBOR, or London interbank offered rates, are floating interest rates that are widely used as reference rates in bank, corporate and government lending agreements. Euribor, or the euro interbank offered rate, is a reference rate based on the averaged interest rates at which Eurozone banks lend to each other.) Furthermore, as policymakers expressed their intention to keep interest rates low for an extended period, investors had less reason to guard against rising rates, and the high yield loan market experienced investment outflows during the Reporting Period. The impact of such outflows, however, was somewhat mitigated by repayments and the presence of institutional investors who entered the market because of its attractive valuations.
n Emerging markets debt posted a modest positive return during the Reporting Period. The emerging external debt markets, as represented by J.P. Morgan EMBI Global Diversified Index, returned 1.69%. The top performers during the Reporting Period were (in U.S. dollar terms*) Mexico (+6.97%), Brazil (+6.77%) and the Philippines (+6.04%). Argentina (-18.54%), Ukraine (-9.47%) and Kazakhstan (-3.40%) turned in the weakest performance.
| |
| 1 | Source: JP Morgan as of September 30, 2011 |
| |
| 2 | Source: Lipper/AMG Data |
| |
| 3 | Source: JP Morgan as of September 30, 2011 |
| |
| * | All regional and market returns are in U.S. dollar terms (unless otherwise specified), are based on country-specific stock market indices and reflect the reinvestment of any dividends, if applicable. |
MARKET REVIEW
For most of the Reporting Period, emerging markets debt weathered the volatility in the fixed income market. However, in September, concerns about global economic growth and European sovereign debt risk overwhelmed investor sentiment. Argentina took the brunt of selling. Declines in Argentina’s agricultural commodities prices undermined its soy export revenues, and the country’s current account balance deteriorated. Ratings agency Moody’s Investors Service lowered its outlook for Argentina’s banking system from stable to negative, citing lackluster earnings, fragile depositor confidence and exposure to political and event risks. Sentiment across Latin American markets also weakened on the sharp depreciation of Brazil’s real. The Ukrainian external debt market was roiled by concerns that the government would miss the September payment on its domestic debt. Ultimately, Ukraine’s finance ministry made the payment of approximately $400 billion, enabling the country to avoid a technical default. On the positive side, Peruvian external debt benefited from its government’s focus on fiscal policy. The finance minister pledged not to increase public spending in 2012, saying that authorities “must remain cautious” in the current global financial turmoil. During the Reporting Period, Standard & Poor’s Ratings upgraded Peru’s long-term foreign currency rating by one notch to BBB with a stable outlook.
n Local emerging markets debt declined during the Reporting Period on concerns about global economic growth and European sovereign debt risk. Currency depreciation was the main reason for local debt underperformance, as the U.S. dollar proved once again to be the preferred currency for safe-haven flows in volatile market conditions. The emerging local debt markets, as represented by the J.P. Morgan Government Bond Index-Emerging Markets Global Diversified Index, declined 4.94%. Of that return, +3.85% was derived from interest rates and -8.79% from currencies’ depreciation versus the U.S. dollar. The U.S. Dollar Index, a measure of the value of the U.S. dollar against a basket of international currencies, increased 3.55%, while emerging market currencies, as represented by the J.P. Morgan Emerging Local Markets Plus (ELMI+) Index, dropped 7.29%. Among countries, the top performers during the Reporting Period were (in U.S. dollar terms*) Indonesia (+13.35%), Peru (+9.33%) and Colombia (+4.29%). The weakest performers were Turkey (-12.36%), Russia (-11.38%) and South Africa (-10.27%).
South Africa weakened, largely as a result of the depreciation of its currency against the U.S. dollar. In addition, labor strikes hurt manufacturing output, and slowing global economic growth increased the likelihood of additional output declines. However, these challenges dispelled expectations for interest rate hikes at least in the near term. Indonesia gained mainly because of a rally in local interest rates, though the Indonesian rupiah depreciated against the U.S. dollar. Increased capital investment has helped Indonesia boost its own economic growth, and its central bank left interest rates unchanged during the Reporting Period. Peru benefited from its government’s focus on fiscal policy. The finance minister pledged not to increase public spending in 2012, as authorities “must remain cautious” in the current global financial turmoil. During the Reporting Period, Standard & Poor’s Ratings upgraded Peru’s long-term foreign currency rating by one notch to BBB with a stable outlook.
MARKET REVIEW
Looking Ahead
Weak economic data prompted downward revisions to economic forecasts during the third calendar quarter, but looking ahead we believe policy developments will likely be the more dominant influence on the global economic outlook. At the end of September, the primary risk to growth in our view remained the turmoil in the Eurozone, where policymakers are working to reach consensus on how to address the severe debt and fiscal problems in the peripheries and to prevent further contagion across global risk markets. Though we believe economic growth will continue, albeit at a slow pace, across the largest developed economies, we see risk of a potentially sharp downturn if Europe’s sovereign debt crisis escalates. In the near term, we do not anticipate a resolution sufficient to restore either investor confidence or market stability, and thus we expect market volatility to continue in the months ahead within the financial markets.
At the end of the Reporting Period, U.S. policy was caught between two conflicting objectives — narrowing the deficit and stimulating weak economic growth. Clearly, the resolution of the policy debate has major implications for the U.S. economic outlook. Sentiment and growth forecasts had deteriorated since mid-2011, with the July/August budget impasse and debt ceiling gridlock underscoring the political challenge in rectifying the U.S.’ economic problems, including unemployment and widening deficits. These issues were clearly overshadowing economic fundamentals, which, in our view, were less dire than market conditions suggested. In our view, purchasing manager indices and industrial output indicators pointed to continued, though modest, expansion. Corporate balance sheets were strong and well positioned, in our view, for increased capital expenditure. Further, commodity prices had receded substantially from their peaks earlier in 2011. In short, we believe the U.S. economy is not headed back into recession unless pushed. Factors that could provide that push would be a more substantial tightening in credit conditions, possibly as a result of systemic crisis in Europe or another fiscal deadlock in the U.S.
Similarly, from an investment perspective, we believe external macro-level factors were overshadowing more positive fundamentals in fixed income markets at the end of the Reporting Period. In our view, the strongest balance sheets were to be found in two key risk asset classes — the corporate sector and the emerging markets debt sector. Several weeks of risk-averse trade had taken yields in these sectors to what we considered very attractive levels, and absent the uncertain macro environment, we believe that investors were being well compensated for the underlying risks. For example, by the end of the Reporting Period, yields on corporate bonds overall had risen back to their mid-2009 levels, yet corporate balance sheets were strong, earnings reports continued to reflect generally solid profits, and defaults in the high yield segment of the sector were near historic lows. As for emerging market debt, despite the global economic slowdown, emerging markets generally continued to display healthier growth rates and lower debt-to-Gross Domestic Product (“GDP”) ratios than much of the developed world. Moreover, during the third calendar quarter, many central banks in developing economies shifted from a tightening bias to an easing bias, which is usually supportive of local rates markets. Overall, at the end of the Reporting Period, cautiously constructive in our outlook for risk assets over the months ahead.
Meanwhile, U.S. monetary policy continues to anchor short-dated U.S. Treasury yields near historic lows, and we see the potential for further declines in U.S. Treasury yields if the situation in Europe or the U.S. economy deteriorates. That said, we believe that the very low yields at the longer end of the U.S. Treasury yield curve, or spectrum of maturities, reflect rather pessimistic growth expectations driven to extremes by central bank policy. We see a risk of these longer-dated U.S. Treasury yields rising substantially on any reversal of these factors.
MARKET REVIEW
We remain positive on investment grade corporate bonds though we expect relatively high volatility at least through the end of 2011. In our opinion, credit spreads at the end of the Reporting Period were generally wider than we might have expected given default expectations, economic growth and both the performance and volatility of the equity markets. Furthermore, credit fundamentals were strong and improving in many sectors. Because companies are generally carrying a relatively lower than average amount of debt, we expect an increase in mergers, acquisitions and share buybacks in the coming months. We have a neutral view on the banking industry. The fragility of certain peripheral Eurozone nations has affected some European bank funding. We are also concerned about risks related to U.S. banks’ mortgage exposures, the potential effects of contagion from Europe and the risk of a further slowdown in the macroeconomic picture. Although regulatory risk remains a concern, we believe changes to the regulatory framework for banks — including the Dodd-Frank legislation in the U.S. and Basel III globally — will be beneficial for financial companies in the long run. Basel III is a global regulatory standard relating to banks’ capital adequacy and liquidity. At the same time, we favor bonds lower in the capital structure because we think defensive bonds offer limited return potential.
Within U.S. mortgage-backed securities, we had, at the end of the Reporting Period, a preference for lower coupon securities. We believe that pricing of premium agency mortgage-backed securities at the end of the Reporting Period did not reflect growing prepayment risk as refinancing activity increases, possibly with the help of further housing policy initiatives. Also, we believe that improved technical and fundamental factors should continue to support attractive pricing among non-agency mortgage-backed securities. We were constructive on student loan asset-backed securities (ABS) backed by the Federal Family Education Loan Program (FFELP) relative to other ABS sectors such as credit cards and autos. We were neutral on commercial mortgage-backed securities (CMBS) as a result of our cautious outlook for U.S. economic growth.
We were cautiously optimistic on high yield corporate bonds at the end of the Reporting Period despite deterioration in the macroeconomic backdrop. Yields were approximately 10% at the end of September 2011, and given market volatility, we expect them to remain higher than fundamentals would suggest. Typically, corporations significantly increase leverage during the expansion phase of an economic cycle, which is why defaults rise when growth slows. We do not think that is the case today. During the relatively modest expansion in 2010, corporations continued to de-leverage their balance sheets. Although high yield spreads at the end of the Reporting Period seemed to suggest a 2012 default rate of 8% to 9%, we believe the default rate is likely to be approximately 3%, ranging between 2% and 4% depending on the economic environment. In our view, spreads are wide because investors want compensation for other risks, including those to the economy or to market liquidity. We believe spreads are likely to remain wide until European policymakers resolve sovereign debt concerns and could even widen further if banks are not adequately capitalized to withstand systemic risks. We expect demand for high yield corporate bonds to continue as long as U.S. government bond yields remain very low (which may drive yield-seeking investors to take more credit risk) and equity market valuations remain vulnerable to the worsening economic outlook.
MARKET REVIEW
In our opinion, the high yield loan market has the potential for dollar price appreciation and attractive current income. However, because market volatility has had a negative impact on investor appetite, we believe that there must be greater overall pricing stability across riskier fixed income assets for such potential to be realized. At the end of the Reporting Period, we viewed valuations at the upper end of the non-investment grade credit spectrum as most attractive and expected higher rated credits to lead a recovery in the asset class in general. Further, at the end of the Reporting Period, we considered the risk premium on high yield bank loans to be greater than what might be warranted in the event of a higher default rate.
In emerging markets debt, we favored Colombian and Indonesian bonds at the end of the Reporting Period. Colombia’s advantages include decreasing debt levels and strong capital inflows, while Indonesia is benefiting from continued growth in Asia and improving fundamentals. We also had a positive view on inflation-linked local Brazilian debt and believed that rates are very high even after adjusting for risk. We continued to believe that emerging markets debt can better withstand shocks to the global financial system than in years past, thanks in part to reserve accumulation and improved external debt positions. In our opinion, greater policy autonomy has also played a key role, as credible monetary policy has helped to moderate inflation and fiscal consolidation has reduced public sector debt burdens. At the end of the Reporting Period, stand-alone valuations in emerging markets debt reflected these fundamental improvements to some extent, but we believe increasing recognition of emerging markets debt as a mature fixed income sector should lead to more strategic investment allocations, consequently boosting valuations.
Local emerging markets debt has dramatically transformed in the last few years, in our view. The sector has deepened and become more liquid. The investor base has grown and become more diversified. Emerging market economies have undergone structural changes that promote macroeconomic stability and active debt management. As a result, investment inflows to local debt funds have become more consistent and stem from strategic investors. We believe that these trends are likely to persist in the future. Over the medium term, we believe that returns in local emerging markets debt are likely to be supported by currency appreciation. We base this view on the strong divergence in real GDP growth between emerging markets and mature markets as well as on expected continuing inflows to emerging markets countries. We expect current account balances and investment flows into emerging markets regions to remain robust as well. In addition, many emerging markets central banks, especially in Asia, appeared more willing to let their currencies appreciate. Finally, we believe the potential appreciation of emerging markets currencies make currency exposure through unhedged local debt look compelling over the long run. Overall, we believe emerging markets local debt continues to offer more attractive yield relative to developed markets bonds, despite the apparent gradual convergence of inflation expectations and sovereign debt risk between emerging and developed economies.
PORTFOLIO RESULTS
Goldman Sachs Emerging Markets Debt Fund
Investment Objective
The Fund seeks a high level of total return consisting of income and capital appreciation.
Portfolio Management Discussion and Analysis
Below, the Goldman Sachs Global Fixed Income Investment Management Team discusses the Goldman Sachs Emerging Markets Debt Fund’s (the “Fund”) performance and positioning for the six-month period ended September 30, 2011 (the “Reporting Period”).
| |
| Q | How did the Fund perform during the Reporting Period? |
| |
| A | During the Reporting Period, the Fund’s Class A, C, Institutional and IR Shares generated cumulative total returns, without sales charges, of 0.48%, 0.10%, 0.65% and 0.52%, respectively. These returns compare to the 1.69% cumulative total return of the Fund’s benchmark, the J.P. Morgan EMBI Global Diversified Index (with dividends reinvested) (the “Index”), during the same time period. |
| |
| Q | What key factors were responsible for the Fund’s performance during the Reporting Period? |
| |
| A | Country and issue selection among local currency denominated bonds detracted from the Fund’s relative performance during the Reporting Period. The Fund’s U.S. duration and yield curve positioning also dampened results. Duration is a measure of the Fund’s sensitivity to changes in interest rates. Yield curve indicates the spectrum of maturities within a particular sector. Adding slightly to returns was country and issue selection of hard currency denominated debt. |
| |
| Q | Which segments of emerging markets debt most significantly affected Fund performance? |
| |
| A | The Fund’s overweighted exposure to the Mexican peso and the Taiwan dollar, accomplished through the use of forward foreign currency exchange contracts, detracted from relative results. The Mexican peso depreciated 14.3% during the Reporting Period, and the Taiwan dollar depreciated 4.8% in September alone. The Fund’s position in Mexican corporate debt also dampened returns. Specifically, the Fund was hampered by an investment in the bonds of a Mexican building supplies company; the holding underperformed as investor risk aversion increased during August and September. |
On the positive side, the Fund benefited from an overweighted position in Brazilian local bonds, which rallied after Brazil’s central bank cut interest rates in August. Also contributing were the Fund’s holdings in Venezuelan external debt, which outperformed on news that President Chavez’s chance of winning re-election had decreased. An underweighted position in the euro, accomplished through the use of forward foreign currency exchange contracts, further enhanced results, as the currency depreciated 6.8% during September.
| |
| Q | Did the Fund’s duration and yield curve positioning strategy help or hurt its results during the Reporting Period? |
| |
| A | The Fund’s U.S. duration and yield curve positioning detracted from relative results during the Reporting Period. Between April and the end of July, the Fund had a short duration bias. This position detracted when yields fell. |
| |
| Q | How did the Fund use derivatives and similar instruments during the Reporting Period? |
| |
| A | The Fund invested in U.S. Treasury futures, forward foreign currency exchange contracts, interest rate swaps, non-deliverable bond forwards and credit linked notes. U.S. Treasury futures were used to manage U.S. interest rate duration. Forward foreign currency exchange contracts were used for hedging purposes as well as to express a positive view on a given currency. Interest rate swaps were used to express our views on the direction of a country’s interest rates. Non-deliverable bond forwards and credit linked notes were used in place of buying a local currency denominated bond when a particular market was otherwise inaccessible as well as a more efficient means of gaining access to a local market. |
PORTFOLIO RESULTS
| |
| Q | Were there any notable changes in the Fund’s weightings during the Reporting Period? |
| |
| A | Through most of the Reporting Period, the Fund had little exposure to Mexican local debt. In September 2011, we shifted from that underweighted position to an overweighted allocation, as we believe that Mexico’s interest rates will decrease as a result of slack in that nation’s economy and its relatively stable inflation rate. We increased the Fund’s overweighted position in Indonesian external debt. During the Reporting Period, we shifted the Fund from an overweighted position in Peruvian external debt to an underweighted position. |
| |
| Q | How was the Fund positioned relative to its benchmark index at the end of the Reporting Period? |
| |
| A | At the end of the Reporting Period, the Fund had over- weighted positions relative to the Index in Colombian and Indonesian external debt and in Brazilian local bonds. It was underweight to Peruvian external debt relative to the Index. |
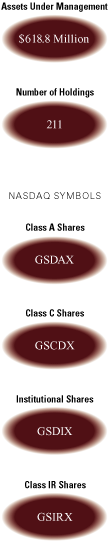
FUND BASICS
Emerging Markets Debt Fund
as of September 30, 2011
| | | | | | | | | | | | | | | | | | | |
| | | | | J.P. Morgan EMBI
| | 30-Day
| | 30-Day
| | |
April 1, 2011–
| | Fund Total Return
| | Global Diversified
| | Standardized
| | Standardized
| | |
| September 30, 2011 | | (based on NAV)1 | | Index2 | | Subsidized Yield3 | | Unsubsidized Yield3 | | |
|
| |
| Class A | | | 0.48 | % | | | 1.69 | % | | | 4.88 | % | | | 4.82 | % | | |
| Class C | | | 0.10 | | | | 1.69 | | | | 4.33 | | | | 4.26 | | | |
| Institutional | | | 0.65 | | | | 1.69 | | | | 5.47 | | | | 5.40 | | | |
| Class IR | | | 0.52 | | | | 1.69 | | | | 5.38 | | | | 5.31 | | | |
|
| | |
| 1 | | The net asset value (“NAV”) represents the net assets of the class of the Fund (ex-dividend) divided by the total number of shares of the class outstanding. The Fund’s performance assumes the reinvestment of dividends and other distributions. The Fund’s performance does not reflect the deduction of any applicable sales charges. |
| |
| 2 | | The J.P. Morgan EMBI Global Diversified Index (with dividends reinvested) is an unmanaged index of debt instruments of 31 emerging countries. The Index figures do not reflect any deduction for fees, expenses or taxes. It is not possible to invest directly in an index. |
| |
| 3 | | The 30-Day Standardized Subsidized Yield of the Fund is calculated by dividing the net investment income per share (as defined by securities industry regulations) earned by the Fund over a 30-day period (ending on the stated month-end date) by the maximum public offering price (“POP”) per share of the Fund on the last day of the period. This number is then annualized. This yield does not necessarily reflect income actually earned and distributed by the Fund and, therefore, may not be correlated with the dividends or other distributions paid to shareholders. The 30-Day Standardized Unsubsidized Yield does not reflect any applicable expense reductions. |
| |
| STANDARDIZED AVERAGE ANNUAL TOTAL RETURNS4 | |
| | | | | | | | | | | | | | | | | |
| For the period ended 9/30/11 | | One Year | | Five Years | | Since Inception | | Inception Date | | |
|
| |
| Class A | | | -5.54 | % | | | 6.38 | % | | | 9.47 | % | | 8/29/03 | | |
| Class C | | | -2.72 | | | | 6.57 | | | | 6.56 | | | 9/29/06 | | |
| Institutional | | | -0.73 | | | | 7.73 | | | | 10.49 | | | 8/29/03 | | |
| Class IR | | | -0.90 | | | | N/A | | | | 2.97 | | | 7/30/10 | | |
|
| | |
| 4 | | The Standardized Average Annual Total Returns are average annual total returns as of the most recent calendar quarter-end. They assume reinvestment of all distributions at NAV. These returns reflect a maximum initial sales charge of 4.5% for Class A Shares and the assumed contingent deferred sales charge for Class C Shares (1% if redeemed within 12 months of purchase). Because Institutional and Class IR Shares do not involve a sales charge, such a charge is not applied to their Standardized Average Annual Total Returns. The Fund will charge a 2% redemption fee on the redemption of shares (including by exchange) held for 30 calendar days or less. The performance figures do not reflect the deduction of the redemption fee. If reflected, the redemption fee would reduce the performance quoted. |
| |
| | The returns represent past performance. Past performance does not guarantee future results. The Fund’s investment return and principal value will fluctuate so that an investor’s shares, when redeemed, may be worth more or less than their original cost. Current performance may be lower or higher than the performance quoted above. Please visit our Web site at: www.goldmansachsfunds.com to obtain the most recent month-end returns. Performance reflects expense limitations in effect. In their absence, performance would be reduced. Returns do not reflect the deduction of taxes that a shareholder would pay on Fund distributions or the redemption of Fund shares. |
FUND BASICS
| | | | | | | | | | | |
| | | Net Expense Ratio
| | Gross Expense Ratio
| | |
| | | (Current) | | (Before Waivers) | | |
|
| |
| Class A | | | 1.22 | % | | | 1.29 | % | | |
| Class C | | | 1.97 | | | | 2.04 | | | |
| Institutional | | | 0.88 | | | | 0.95 | | | |
| Class IR | | | 0.97 | | | | 1.04 | | | |
|
| | |
| 5 | | The expense ratios of the Fund, both current (net of applicable fee waivers or expense limitations) and before waivers (gross of applicable fee waivers or expense limitations), are as set forth above according to the most recent publicly available Prospectus for the Fund and may differ from the expense ratios disclosed in the Financial Highlights in this report. The Fund’s waivers and/or expense limitations, if any, will remain in place through at least July 29, 2012, and prior to such date the investment adviser may not terminate the arrangements without the approval of the Fund’s Board of Trustees. If these arrangements are discontinued in the future, the expense ratios may change without shareholder approval. |
| |
| TOP TEN COUNTRY ALLOCATION6 | |
| | | | | | | | | | | |
| | | Percentage of Net Assets | | |
| | | |
| | | as of 9/30/11 | | as of 3/31/11 | | |
|
| |
| Indonesia | | | 8.6 | % | | | 5.6 | % | | |
| Colombia | | | 7.6 | | | | 6.3 | | | |
| Brazil | | | 6.8 | | | | 5.8 | | | |
| Russia | | | 6.1 | | | | 4.8 | | | |
| Mexico | | | 6.1 | | | | 5.1 | | | |
| Venezuela | | | 5.3 | | | | 4.1 | | | |
| Philippines | | | 5.2 | | | | 3.8 | | | |
| Ukraine | | | 3.8 | | | | 3.0 | | | |
| Turkey | | | 3.6 | | | | 5.1 | | | |
| South Africa | | | 3.0 | | | | 1.2 | | | |
|
| | |
| 6 | | The percentage shown for each investment category reflects the value of investments in that country as a percentage of net assets. The above table does not include repurchase agreements of 7.4% as of 9/30/11 and 14.8% as of 3/31/11. The above table depicts the Fund’s investments but may not represent the Fund’s market exposure due to the exclusion of derivatives, if any, as listed in the Additional Investment Information section of the Schedule of Investments. |
PORTFOLIO RESULTS
Goldman Sachs High Yield Fund
Investment Objective
The Fund seeks a high level of current income and may also consider the potential for capital appreciation.
Portfolio Management Discussion and Analysis
Below, the Goldman Sachs High Yield Fixed Income Investment Management Team discusses the Goldman Sachs High Yield Fund’s (the “Fund”) performance and positioning for the six-month period ended September 30, 2011 (the “Reporting Period”).
| |
| Q | How did the Fund perform during the Reporting Period? |
| |
| A | During the Reporting Period, the Fund’s Class A, B, C, Institutional, Service, IR and R Shares generated cumulative total returns, without sales charges, of -7.10%, -7.42%, -7.43%, -6.91%, -7.17%, -6.83% and -7.21%, respectively. These returns compare to the -5.12% cumulative total return of the Fund’s benchmark, the Barclays Capital U.S. Corporate High Yield Index, 2% Issuer Capped (the “Index”), during the same time period. |
| |
| Q | What key factors were responsible for the Fund’s performance during the Reporting Period? |
| |
| A | Security selection was the primary reason for the Fund’s relative underperformance during the Reporting Period. Other detractors included an underweighted position in high quality credits, an overweighted allocation to Europe and holdings of euro-denominated bonds and restructured equity. The Fund benefited from its underweighted position in emerging markets corporate bonds. |
| |
| Q | Which segments within high yield most significantly affected Fund performance? |
| |
| A | The Fund was hampered by its underweighted position relative to the Index in high quality credits, which performed well during the Reporting Period, especially during the flight to quality in August and September. Security selection was also a drag on the Fund’s relative results. The largest single detractor was the Fund’s overweight to wireless operator Sprint Nextel. Sprint Nextel’s high yield bonds sold off during the Reporting Period on speculation that selling Apple’s iPhone would curtail its profits in the short term. The Fund’s overweight to Reynolds Group Holdings also hurt its performance. Reynolds Group Holdings’ high yield bonds declined after the packaging company announced its planned $4.5 billion acquisition of Graham Packaging. In addition, a position in the restructured equity of Nortek — which the Fund received in exchange for Nortek’s bonds when the company emerged from bankruptcy — dampened relative returns as the share price fell on news of poor second quarter earnings. Overall, issue selection in the financial sector detracted. The Fund was overweight the high yield bonds of ALLY Bank and insurance companies Lloyd’s and AXA Equitable. The prices of these securities declined as investors grew increasingly concerned about the European sovereign debt crisis and its potential impact on the global financial system. |
On the positive side, the Fund had a small allocation to cash during the Reporting Period, which helped reduce the impact of the market declines of August and September. In addition, an underweighted allocation to emerging markets corporate bonds was advantageous. This sector sold off amid worries about the U.S. debt ceiling and heightened fears of Eurozone sovereign debt contagion. From an industry perspective, the Fund benefited from an underweighted exposure to home construction and an overweighted allocation to consumer products. In home construction, for example, the Fund did not own K. Hovnanian Homes, Beazer Homes or Standard Pacific Homes, each of which underperformed during the Reporting Period. In consumer products, it was overweight Spectrum Brands and Sally Beauty Supply. The Fund also sought to avoid individual names that were either under stress, in bankruptcy or headed towards restructuring. It did not hold paper manufacturer NewPage, wireless broadband company Clearwire and commercial forest plantation operation Sino-Forest.
PORTFOLIO RESULTS
| |
| Q | Did the Fund’s duration and yield curve positioning strategy help or hurt its results during the Reporting Period? |
| |
| A | The Fund does not use duration and yield curve positioning as active management strategies within its investment process. |
| |
| Q | How did the Fund use derivatives and similar instruments during the Reporting Period? |
| |
| A | To hedge against currency risk (that is, the risk that certain currencies might fluctuate in value), the Fund employed forward foreign currency exchange contracts during the Reporting Period. |
| |
| Q | Were there any notable changes in the Fund’s weightings during the Reporting Period? |
| |
| A | During the Reporting Period, we scaled back the Fund’s risk exposure by reducing its holdings of high yield bonds rated CCC and re-allocated the proceeds to holdings in high yield bonds rated BB. We reduced the Fund’s exposure to Europe. In addition, we added exposure to traditionally defensive industries, including energy, health care, cable, telecommunications and transportation in an effort to better position the Fund should macroeconomic uncertainty persist. We continued to reduce the Fund’s holdings of economically sensitive credits, specifically those we considered most vulnerable to adverse economic outcomes in both developed and growth markets. |
| |
| Q | How was the Fund positioned relative to its benchmark index at the end of the Reporting Period? |
| |
| A | At the end of the Reporting Period, the Fund was overweight gaming and lodging, commercial services and capital goods relative to the Index. It was underweight financials, building materials and home construction versus the Index. |
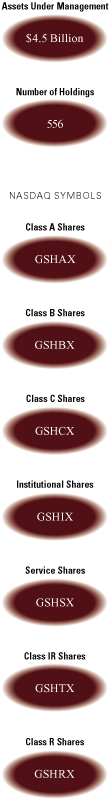
FUND BASICS
High Yield Fund
as of September 30, 2011
| | | | | | | | | | | | | | | | | |
| | | | | Barclays Capital
| | | | |
| | | | | U.S. Corporate High
| | 30-Day
| | 30-Day
|
April 1, 2011–
| | Fund Total Return
| | Yield Bond Index
| | Standardized
| | Standardized
|
| September 30, 2011 | | (based on NAV)1 | | 2% Issuer Capped2 | | Subsidized Yield3 | | Unsubsidized Yield3 |
|
| |
| Class A | | | -7.10 | % | | | -5.12 | % | | | 7.38 | % | | | 7.38 | % |
| Class B | | | -7.42 | | | | -5.12 | | | | 6.94 | | | | 6.94 | |
| Class C | | | -7.43 | | | | -5.12 | | | | 6.95 | | | | 6.95 | |
| Institutional | | | -6.91 | | | | -5.12 | | | | 8.09 | | | | 8.09 | |
| Service | | | -7.17 | | | | -5.12 | | | | 7.56 | | | | 7.56 | |
| Class IR | | | -6.83 | | | | -5.12 | | | | 7.99 | | | | 7.99 | |
| Class R | | | -7.21 | | | | -5.12 | | | | 7.47 | | | | 7.47 | |
|
| | |
| 1 | | The net asset value (“NAV”) represents the net assets of the class of the Fund (ex-dividend) divided by the total number of shares of the class outstanding. The Fund’s performance assumes the reinvestment of dividends and other distributions. The Fund’s performance does not reflect the deduction of any applicable sales charges. |
| |
| 2 | | The Barclays Capital U.S. Corporate High Yield Bond Index , 2% Issuer Capped, an unmanaged index, covers the universe of U.S. dollar denominated, non-convertible, fixed rate, non-investment grade debt. Index holdings must have at least one year to final maturity, at least $150 million par amount outstanding, and be publicly issued with a rating of Ba1 or lower. The Index figures do not reflect any deduction for fees, expenses or taxes. It is not possible to invest directly in an index. |
| |
| 3 | | The 30-Day Standardized Subsidized Yield of the Fund is calculated by dividing the net investment income per share (as defined by securities industry regulations) earned by the Fund over a 30-day period (ending on the stated month-end date) by the maximum public offering price (“POP”) per share of the Fund on the last day of the period. This number is then annualized. This yield does not necessarily reflect income actually earned and distributed by the Fund and, therefore, may not be correlated with the dividends or other distributions paid to shareholders. The 30-Day Standardized Unsubsidized Yield does not reflect any applicable expense reductions. |
FUND BASICS
| |
| STANDARDIZED AVERAGE ANNUAL TOTAL RETURNS4 | |
| | | | | | | | | | | | | | | | | | | | | |
| For the period ended 9/30/11 | | One Year | | Five Years | | Ten Years | | Since Inception | | Inception Date | | |
|
| |
| Class A | | | -5.23 | % | | | 3.53 | % | | | 7.55 | % | | | 5.54 | % | | 8/1/97 | | |
| Class B | | | -6.25 | | | | 3.34 | | | | 7.39 | | | | 5.44 | | | 8/1/97 | | |
| Class C | | | -2.45 | | | | 3.73 | | | | 7.26 | | | | 5.13 | | | 8/15/97 | | |
| Institutional | | | -0.38 | | | | 4.89 | | | | 8.45 | | | | 6.28 | | | 8/1/97 | | |
| Service | | | -0.90 | | | | 4.35 | | | | 7.89 | | | | 5.74 | | | 8/1/97 | | |
| Class IR | | | -0.33 | | | | N/A | | | | N/A | | | | 4.83 | | | 11/30/07 | | |
| Class R | | | -0.98 | | | | N/A | | | | N/A | | | | 4.24 | | | 11/30/07 | | |
|
| | |
| 4 | | The Standardized Average Annual Total Returns are average annual total returns as of the most recent calendar quarter-end. They assume reinvestment of all distributions at NAV. These returns reflect a maximum initial sales charge of 4.5% for Class A Shares, the assumed contingent deferred sales charge for Class B Shares (5% maximum declining to 0% after six years) and the assumed contingent deferred sales charge for Class C Shares (1% if redeemed within 12 months of purchase). Class B Shares convert automatically to Class A Shares on or about the fifteenth day of the last month of the calendar quarter that is eight years after purchase. Returns for Class B Shares for the period after conversion reflect the performance of Class A Shares. Because Institutional, Service, Class R and IR Shares do not involve a sales charge, such a charge is not applied to their Standardized Average Annual Total Returns. The Fund will charge a 2% redemption fee on the redemption of shares (including by exchange) held for 60 calendar days or less. The performance figures do not reflect the deduction of the redemption fee. If reflected, the redemption fee would reduce the performance quoted. The Fund’s Class B Shares are no longer available for purchase by new or existing shareholders (although current Class B shareholders may continue to reinvest income and capital gains distributions into Class B Shares, and Class B shareholders may continue to exchange their shares for Class B Shares of certain other Goldman Sachs Funds). |
| |
| | The returns represent past performance. Past performance does not guarantee future results. The Fund’s investment return and principal value will fluctuate so that an investor’s shares, when redeemed, may be worth more or less than their original cost. Current performance may be lower or higher than the performance quoted above. Please visit our Web site at: www.goldmansachsfunds.com to obtain the most recent month-end returns. Performance reflects expense limitations in effect. In their absence, performance would be reduced. Returns do not reflect the deduction of taxes that a shareholder would pay on Fund distributions or the redemption of Fund shares. |
| | | | | | | | | | | |
| | | Net Expense Ratio
| | Gross Expense Ratio
| | |
| | | (Current) | | (Before Waivers) | | |
|
| |
| Class A | | | 1.05 | % | | | 1.06 | % | | |
| Class B | | | 1.80 | | | | 1.81 | | | |
| Class C | | | 1.80 | | | | 1.81 | | | |
| Institutional | | | 0.71 | | | | 0.72 | | | |
| Service | | | 1.21 | | | | 1.22 | | | |
| Class IR | | | 0.80 | | | | 0.81 | | | |
| Class R | | | 1.30 | | | | 1.31 | | | |
|
| | |
| 5 | | The expense ratios of the Fund, both current (net of applicable fee waivers or expense limitations) and before waivers (gross of applicable fee waivers or expense limitations), are as set forth above according to the most recent publicly available Prospectus for the Fund and may differ from the expense ratios disclosed in the Financial Highlights in this report. The Fund’s waivers and/or expense limitations, if any, will remain in place through at least July 29, 2012, and prior to such date the investment adviser may not terminate the arrangements without the approval of the Fund’s Board of Trustees. If these arrangements are discontinued in the future, the expense ratios may change without shareholder approval. |
FUND BASICS
| |
| TOP TEN ISSUERS AS OF 9/30/116 | |
| | | | | | | | | |
| Company | | % of Net Assets | | Line of Business | | |
|
| |
| Sprint Nextel | | | 2.7 | % | | Telecommunications – Cellular | | |
| Intelsat | | | 2.4 | | | Telecommunications – Satellites | | |
| HCA | | | 2.3 | | | Health Care – Services | | |
| CIT Group | | | 2.0 | | | Finance | | |
| Ford | | | 2.0 | | | Automotive | | |
| Ally Financial | | | 1.6 | | | Finance | | |
| MGM Mirage | | | 1.5 | | | Gaming | | |
| Reynolds Group | | | 1.3 | | | Packaging | | |
| AIG | | | 1.3 | | | Finance | | |
| AES | | | 1.3 | | | Utilities – Electric | | |
|
| | |
| 6 | | The top 10 issuers may not be representative of the Fund’s future investments. |
| |
| TOP TEN INDUSTRY ALLOCATIONS7 | |
| | | | | | | | | | | |
| | | Percentage of Net Assets | | |
| | | |
| | | as of 9/30/11 | | as of 3/31/11 | | |
|
| |
| Energy | | | 9.1 | % | | | 7.1 | % | | |
| Health Care | | | 8.1 | | | | 7.5 | | | |
| Finance | | | 7.6 | | | | 7.9 | | | |
| Utilities | | | 6.4 | | | | 4.6 | | | |
| Media | | | 6.1 | | | | 5.8 | | | |
| Gaming | | | 5.8 | | | | 6.3 | | | |
| Technology | | | 5.2 | | | | 6.6 | | | |
| Automotive | | | 4.9 | | | | 4.8 | | | |
| Telecommunications – Non Cellular | | | 4.7 | | | | 5.4 | | | |
| Packaging | | | 3.7 | | | | 3.4 | | | |
|
| | |
| 7 | | The percentage shown for each investment category reflects the value of investments in that category as a percentage of net assets. The above table does not include repurchase agreements of 5.8% as of 9/30/11 and 5.0% as of 3/31/11. The above table depicts the Fund’s investments but may not represent the Fund’s market exposure due to the exclusion of derivatives, if any, as listed in the Additional Investment Information section of the Schedule of Investments. |
PORTFOLIO RESULTS
Goldman Sachs High Yield Floating Rate Fund
Investment Objective
The Fund seeks a high level of current income.
Portfolio Management Discussion and Analysis
Below, the Goldman Sachs High Yield Fixed Income Investment Management Team discusses the Goldman Sachs High Yield Floating Rate Fund’s (the “Fund”)performance and positioning for the six-month period ended September 30, 2011 (the “Reporting Period”).
| |
| Q | How did the Fund perform during the Reporting Period? |
| |
| A | During the Reporting Period, the Fund’s Class A, C, Institutional, IR and R Shares generated cumulative total returns, without sales charges, of -3.52%, -3.86%, -3.26%, -3.31% and -3.52%, respectively. These returns compare to the -4.33% cumulative total return of the Fund’s benchmark, the Barclays Capital Bank Loan Index/U.S. High Yield Loan Index (the “Index”), during the same time period. |
| |
| Q | What key factors were responsible for the Fund’s performance during the Reporting Period? |
| |
| A | The Fund’s bias toward higher quality securities contributed the most to its relative performance during the Reporting Period. Security selection overall was also a plus. |
| |
| Q | Which segments of the high yield floating rate loan market significantly affected Fund performance? |
| |
| A | We focused on constructing a portfolio of high yield bank loans rated BB and high single-B. Higher quality loans historically outperform lower quality loans on a risk-adjusted basis during periods of high volatility and when default rates are low — as was the case during the Reporting Period. In addition, the Fund was underweight non-rated bank loans and in bank loans rated CCC and less. This “up in quality” bias contributed to the Fund’s relative outperformance as macroeconomic uncertainty increased, U.S. policymakers debated the raising of the nation’s debt ceiling and Europe’s sovereign debt challenges continued. |
The Fund also benefited from overweighted positions in traditionally defensive industries, including health care, pharmaceuticals, food and beverage, and energy. Similarly, investments in specific defensive names, such as Dollar General and Clean Harbors, enhanced performance. Select purchases of new issues also added value.
Detracting from performance was the Fund’s exposure to large and liquid names in more cyclical industries. Such holdings included The Chrysler Group, First Data Corporation and Univision.
| |
| Q | Did the Fund’s duration and yield curve positioning strategy help or hurt its results during the Reporting Period? |
| |
| A | The Fund does not use duration and yield curve positioning as active management strategies within its investment process. |
| |
| Q | How did the Fund use derivatives and similar instruments during the Reporting Period? |
| |
| A | As we sought to increase the Fund’s total return, a specialized index of loan-only credit default swaps was used as a cost- efficient instrument to grant us versatility in the management of the Fund’s investment strategy. |
| |
| Q | Were there any notable changes in the Fund’s weightings during the Reporting Period? |
| |
| A | No significant changes were made to the Fund’s weightings during the Reporting Period. However, the Fund made a few purchases worthy of note. The Fund bought a secured term loan and 6.5% secured notes issued by HCA (Hospital Corporation of America), the largest for-profit hospital operator in the U.S. Both purchases represent our focus on higher quality non-investment grade issues, while the secured notes additionally reflected our relative value focus and ability to target bonds with risk profiles similar to senior secured loans. Also, the Fund bought a secure term loan issued by Intelsat Jackson Holdings, which operates the world’s largest fixed satellite services business. The purchase reflects our quality focus and emphasis on the securities of industry leaders that also have substantial collateral supporting the debt they issue. |
PORTFOLIO RESULTS
| |
| Q | How was the Fund positioned relative to its benchmark index at the end of the Reporting Period? |
| |
| A | At the end of the Reporting Period, the Fund was overweight energy; food, beverage and tobacco; and health care relative to the Index. It was underweight aerospace and defense, consumer products and technology compared to the Index. |
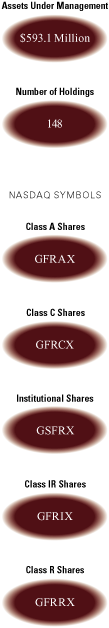
FUND BASICS
High Yield Floating Rate Fund
as of September 30, 2011
| | | | | | | | | | | | | | | | | |
| | | | | | | 30-Day
| | 30-Day
|
April 1, 2011–
| | Fund Total Return
| | Barclays Capital
| | Standardized
| | Standardized
|
| September 30, 2011 | | (based on NAV)1 | | Bank Loan Index2 | | Subsidized Yield3 | | Unsubsidized Yield3 |
|
| |
| Class A | | | -3.52 | % | | | -4.33 | % | | | 3.11 | % | | | 3.01 | % |
| Class C | | | -3.86 | | | | -4.33 | | | | 2.43 | | | | 2.33 | |
| Institutional | | | -3.26 | | | | -4.33 | | | | 3.51 | | | | 3.42 | |
| Class IR | | | -3.31 | | | | -4.33 | | | | 3.39 | | | | 3.27 | |
| Class R | | | -3.52 | | | | -4.33 | | | | 2.95 | | | | 2.86 | |
|
| | |
| 1 | | The net asset value (“NAV”) represents the net assets of the class of the Fund (ex-dividend) divided by the total number of shares of the class outstanding. The Fund’s performance assumes the reinvestment of dividends and other distributions. The Fund’s performance does not reflect the deduction of any applicable sales charges. |
| |
| 2 | | The Barclays Capital Bank Loan Index provides broad and comprehensive total return metrics of the universe of syndicated term loans. To be included in the index, a bank loan must be dollar denominated, have at least $150 million funded loan, a minimum term of one year, and a minimum initial spread of LIBOR+125. It is not possible to invest directly in an index. |
| |
| 3 | | The 30-Day Standardized Subsidized Yield of the Fund is calculated by dividing the net investment income per share (as defined by securities industry regulations) earned by the Fund over a 30-day period (ending on the stated month-end date) by the maximum public offering price (“POP”) per share of the Fund on the last day of the period. This number is then annualized. This yield does not necessarily reflect income actually earned and distributed by the Fund and, therefore, may not be correlated with the dividends or other distributions paid to shareholders. The 30-Day Standardized Unsubsidized Yield does not reflect any applicable expense reductions. |
| |
| STANDARDIZED AVERAGE ANNUAL TOTAL RETURNS4 | |
| | | | | | | | | |
| For the period ended 9/30/11 | | Since Inception | | Inception Date | | |
|
| |
| Class A | | | -5.69 | % | | 3/31/11 | | |
| Class C | | | -4.82 | | | 3/31/11 | | |
| Institutional | | | -3.26 | | | 3/31/11 | | |
| Class IR | | | -3.31 | | | 3/31/11 | | |
| Class R | | | -3.52 | | | 3/31/11 | | |
|
| | |
| 4 | | The Standardized Average Annual Total Returns are average annual total returns or cumulative total returns (only if performance is one year or less) as of the most recent calendar quarter-end. They assume reinvestment of all distributions at NAV. These returns reflect a maximum initial sales charge of 2.25% for Class A Shares and the assumed contingent deferred sales charge for Class C Shares (1% if redeemed within 12 months of purchase). Because Institutional, Class IR and Class R Shares do not involve a sales charge, such a charge is not applied to their Standardized Average Annual Total Returns. |
| |
| | The returns represent past performance. Past performance does not guarantee future results. The Fund’s investment return and principal value will fluctuate so that an investor’s shares, when redeemed, may be worth more or less than their original cost. Current performance may be lower or higher than the performance quoted above. Please visit our Web site at: www.goldmansachsfunds.com to obtain the most recent month-end returns. Performance reflects expense limitations in effect. In their absence, performance would be reduced. Returns do not reflect the deduction of taxes that a shareholder would pay on Fund distributions or the redemption of Fund shares. |
FUND BASICS
| | | | | | | | | | | |
| | | Net Expense Ratio
| | Gross Expense Ratio
| | |
| | | (Current) | | (Before Waivers) | | |
|
| |
| Class A | | | 1.08 | % | | | 1.10 | % | | |
| Class C | | | 1.83 | | | | 1.85 | | | |
| Institutional | | | 0.74 | | | | 0.76 | | | |
| Class IR | | | 0.83 | | | | 0.85 | | | |
| Class R | | | 1.33 | | | | 1.35 | | | |
|
| | |
| 5 | | The expense ratios of the Fund, both current (net of applicable fee waivers or expense limitations) and before waivers (gross of applicable fee waivers or expense limitations), are as set forth above according to the most recent publicly available Prospectus for the Fund and may differ from the expense ratios disclosed in the Financial Highlights in this report. The Fund’s waivers and/or expense limitations, if any, will remain in place through at least July 29, 2012, and prior to such date the investment adviser may not terminate the arrangements without the approval of the Fund’s Board of Trustees. If these arrangements are discontinued in the future, the expense ratios may change without shareholder approval. |
| |
| TOP TEN INDUSTRY ALLOCATIONS6 | |
| | | | | | | | | | | |
| | | Percentage of Net Assets | | |
| | | |
| | | as of 9/30/11 | | as of 3/31/11 | | |
|
| |
| Health Care | | | 8.4 | % | | | — | | | |
| Retailers | | | 6.8 | | | | 1.1 | % | | |
| Food & Beverages | | | 6.0 | | | | 1.3 | | | |
| Services Cyclical – Business Services | | | 5.5 | | | | — | | | |
| Health Care – Services | | | 5.3 | | | | 1.7 | | | |
| Automotive – Parts | | | 5.1 | | | | — | | | |
| Chemicals | | | 4.6 | | | | — | | | |
| Technology – Software/Services | | | 4.5 | | | | 1.6 | | | |
| Wireless Telecommunications | | | 3.9 | | | | 1.7 | | | |
| Media – Broadcasting & Radio | | | 2.8 | | | | — | | | |
|
| | |
| 6 | | The percentage shown for each investment category reflects the value of investments in that category as a percentage of net assets. The above table does not include repurchase agreements of 14.5% as of 9/30/11. Please note, the Fund commenced operations on 3/31/11 and thus was not fully invested on that day. The above table depicts the Fund’s investments but may not represent the Fund’s market exposure due to the exclusion of derivatives, if any, as listed in the Additional Investment Information section of the Schedule of Investments. |
PORTFOLIO RESULTS
Goldman Sachs Investment Grade Credit Fund
Investment Objective
The Fund seeks a high level of total return consisting of capital appreciation and income that exceeds the total return of the Barclays Capital U.S. Credit Index.
Portfolio Management Discussion and Analysis
Below, the Goldman Sachs U.S. Fixed Income Investment Management Team discusses the Goldman Sachs Investment Grade Credit Fund’s (the “Fund”) performance and positioning for the six-month period ended September 30, 2011 (the “Reporting Period”).
| |
| Q | How did the Fund perform during the Reporting Period? |
| |
| A | During the Reporting Period, the Fund’s Class A, Institutional and Separate Account Institutional Shares generated cumulative total returns, without sales charges, of 4.69%, 4.87% and 4.87%, respectively. These returns compare to the 5.60% cumulative total return of the Fund’s benchmark, the Barclays Capital U.S. Credit Index (the “Index”), during the same time period. During the period from inception on July 29, 2011 to September 30, 2011, the Fund’s Class IR Shares generated a cumulative total return, without sales charges, of -0.34%. This compares to the 0.61% cumulative total return of the Index during the same time period. |
| |
| Q | What key factors were responsible for the Fund’s performance during the Reporting Period? |
| |
| A | The Fund’s cross-sector strategy detracted the most from relative performance. In our cross-sector strategy, we invest Fund assets across a variety of fixed income sectors, including some that may not be included in the Fund’s benchmark. The combined effect of the Fund’s duration and yield curve positioning also detracted from results. Duration is a measure of the Fund’s sensitivity to changes in interest rates. Yield curve indicates the spectrum of maturities within a particular sector. On the positive side, issue selection among investment grade corporate bonds contributed to the Fund’s relative returns. |
| |
| Q | Which segments of investment grade credit most significantly affected Fund performance? |
| |
| A | During the Reporting Period, the Fund was hampered by its cross-sector positioning, specifically its overweighted positions relative to the Index in investment-grade corporate bonds and non-agency mortgage-backed securities. As mentioned in the Market Review, riskier fixed income classes underperformed during the Reporting Period. The bearish sentiment was driven by weakness in global economic data, ongoing concerns about the future of Greece and the potential contagion to the rest of Europe and the financial sector. |
On the positive side, our individual issue selection of investment grade corporate bonds added to relative results. In particular, the Fund benefited from its select investments in the bonds of financials companies, which outperformed the lagging financials sector overall. Also advantageous was the Fund’s bias toward issues at the lower end of the ratings spectrum. Many of these names performed strongly during the Reporting Period.
| |
| Q | Did the Fund’s duration and yield curve positioning strategy help or hurt its results during the Reporting Period? |
| |
| A | The Fund’s U.S. duration and yield curve positioning detracted overall from its relative returns during the Reporting Period. The Fund was underweight five-year maturities on the U.S. Treasury yield curve, which dampened results when yields in this segment of the U.S. Treasury yield curve declined. |
PORTFOLIO RESULTS
| |
| Q | How did the Fund use derivatives and similar instruments during the Reporting Period? |
| |
| A | As market conditions warranted, during the Reporting Period, the Fund used Treasury financial futures contracts to hedge interest rate exposure and facilitate specific duration and yield curve strategies; interest rate swaps to hedge interest rate exposure and express an outright term structure view (term structure, most often depicted as a yield curve, refers to the term structure of interest rates, which is the relationship between the yield to maturity and the time to maturity for pure discount bonds); credit default swaps to implement specific credit-related investment strategies and hedge corporate spread duration (or the price sensitivity of a corporate bond to a 100 basis point change in its spread over LIBOR, or London interbank offered rates, i.e. floating interest rates widely used as reference rates in bank, corporate and government lending agreements); swaptions (or options on interest rate swap contracts) to hedge and express an outright term structure view; and forward foreign currency exchange contracts to hedge currency exposure. |
| |
| Q | Were there any notable changes in the Fund’s weightings during the Reporting Period? |
| |
| A | We reduced the Fund’s exposure to the banking industry during the reporting period. |
| |
| Q | How was the Fund positioned relative to its benchmark index at the end of the Reporting Period? |
| |
| A | At the end of the Reporting Period, the Fund had an overweighted position relative to the Index in investment grade corporate credit. Within corporate bonds, the Fund was overweight banking, insurance, real estate investment trusts (REITs) and energy. Relative to the Index, the Fund was underweight information technology, pharmaceuticals and media cable corporate bonds. |
FUND BASICS
Investment Grade Credit Fund
as of September 30, 2011
| | | | | | | | | | | | | | | | | | | |
| | | | | Barclays Capital
| | 30-Day
| | 30-Day
| | |
April 1, 2011–
| | Fund Total Return
| | U.S. Credit
| | Standardized
| | Standardized
| | |
| September 30, 2011 | | (based on NAV)1 | | Index2 | | Subsidized Yield3 | | Unsubsidized Yield3 | | |
|
| |
| Class A | | | 4.69 | % | | | 5.60 | % | | | 3.41 | % | | | 3.25 | % | | |
| Institutional | | | 4.87 | | | | 5.60 | | | | 3.89 | | | | 3.73 | | | |
| Separate Account | | | 4.87 | | | | 5.60 | | | | 3.89 | | | | 3.72 | | | |
| Institutional | | | | | | | | | | | | | | | | | | |
|
July 29, 2011–
| | | | | | | | | | |
| September 30, 2011 | | | | | | | | | | |
|
| |
| Class IR | | | -0.34 | % | | | 0.61 | % | | | 3.95 | % | | | 3.75 | % | | |
|
| | |
| 1 | | The net asset value (“NAV”) represents the net assets of the class of the Fund (ex-dividend) divided by the total number of shares of the class outstanding. The Fund’s performance assumes the reinvestment of dividends and other distributions. The Fund’s performance does not reflect the deduction of any applicable sales charges. |
| |
| 2 | | The Barclays Capital U.S. Credit Index is an unmanaged index which is unbundled into pure corporates (industrial, utility, and finance, including both U.S. and non-U.S. corporations) and non-corporates (sovereign, supranational, foreign agencies, and foreign local governments). The index figures do not reflect any deduction for fees, expenses or taxes. It is not possible to invest directly in an index. |
| |
| 3 | | The 30-Day Standardized Subsidized Yield of the Fund is calculated by dividing the net investment income per share (as defined by securities industry regulations) earned by the Fund over a 30-day period (ending on the stated month-end date) by the maximum public offering price (“POP”) per share of the Fund on the last day of the period. This number is then annualized. This yield does not necessarily reflect income actually earned and distributed by the Fund and, therefore, may not be correlated with the dividends or other distributions paid to shareholders. The 30-Day Standardized Unsubsidized Yield does not reflect any applicable expense reductions. |
| |
| STANDARDIZED AVERAGE ANNUAL TOTAL RETURNS4 | |
| | | | | | | | | | | | | | | | | | | |
| For the period ended 9/30/11 | | One Year | | Five Years | | Since Inception | | Inception Date | | |
|
| |
| Class A | | | 0.73 | % | | | 4.00 | % | | | 3.99 | % | | | 11/3/03 | | | |
| Institutional | | | 5.03 | | | | 5.15 | | | | 4.89 | | | | 11/3/03 | | | |
| Separate Account Institutional | | | 5.03 | | | | 5.21 | | | | 4.94 | | | | 11/3/03 | | | |
| Class IR | | | N/A | | | | N/A | | | | -0.34 | | | | 7/29/11 | | | |
|
| | |
| 4 | | The Standardized Average Annual Total Returns are average annual total returns or cumulative total returns (only if performance is one year or less) as of the most recent calendar quarter-end. They assume reinvestment of all distributions at NAV. These returns reflect a maximum initial sales charge of 3.75% for Class A Shares. Prior to July 29, 2009, the maximum initial sales charge applicable to Class A Shares was 4.5%, which is not reflected in the average annual total return figures shown. Because Institutional, Separate Account Institutional and Class IR Shares do not involve a sales charge, such a charge is not applied to their Standardized Average Annual Total Returns. |
| |
| | The returns represent past performance. Past performance does not guarantee future results. The Fund’s investment return and principal value will fluctuate so that an investor’s shares, when redeemed, may be worth more or less than their original cost. Current performance may be lower or higher than the performance quoted above. Please visit our Web site at: www.goldmansachsfunds.com to obtain the most recent month-end returns. Performance reflects fee waivers and/or expense limitations in effect. In their absence, performance would be reduced. Returns do not reflect the deduction of taxes that a shareholder would pay on Fund distributions or the redemption of Fund shares. |
FUND BASICS
| | | | | | | | | | | |
| | | Net Expense Ratio
| | Gross Expense Ratio
| | |
| | | (Current) | | (Before Waivers) | | |
|
| |
| Class A | | | 0.71 | % | | | 0.84 | % | | |
| Institutional | | | 0.37 | | | | 0.50 | | | |
| Separate Account Institutional | | | 0.37 | | | | 0.50 | | | |
| Class IR | | | 0.46 | | | | 0.59 | | | |
|
| | |
| 5 | | The expense ratios of the Fund, both current (net of applicable fee waivers or expense limitations) and before waivers (gross of applicable fee waivers or expense limitations), are as set forth above according to the most recent publicly available Prospectus for the Fund and may differ from the expense ratios disclosed in the Financial Highlights in this report. The Fund’s waivers and/or expense limitations, if any, will remain in place through at least July 29, 2012, and prior to such date the investment adviser may not terminate the arrangements without the approval of the Fund’s Board of Trustees. If these arrangements are discontinued in the future, the expense ratios may change without shareholder approval. |
Percentage of Net Assets
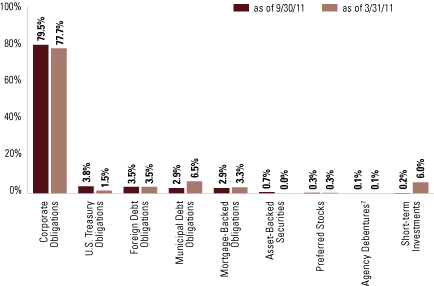
| | |
| 6 | | The Fund is actively managed and, as such, its composition may differ over time. The percentage shown for each investment category reflects the value of investments in that category as a percentage of net assets. Short-term investments represent repurchase agreements. Figures in the above graph may not sum to 100% due to the exclusion of other assets and liabilities. The above graph depicts the Fund’s investments but may not represent the Fund’s market exposure due to the exclusion of derivatives, if any, as listed in the Additional Investment Information section of the Schedule of Investments. |
| |
| 7 | | “Agency Debentures” include agency securities offered by companies such as the Federal National Mortgage Association (“FNMA”) and Federal Home Loan Mortgage Corp. (“FHLMC”), which operate under a government charter. While they are required to report to a government regulator, their assets are not explicitly guaranteed by the government and they otherwise operate like any other publicly traded company. |
FUND BASICS
| |
| TOP TEN INDUSTRY ALLOCATIONS8 | |
| | | | | | | | | | | |
| | | Percentage of Net Assets | | |
| | | |
| | | as of 9/30/11 | | as of 3/31/11 | | |
|
| |
| Banks | | | 17.3 | % | | | 27.9 | % | | |
| Energy | | | 9.2 | | | | 7.5 | | | |
| Real Estate Investment Trusts | | | 5.7 | | | | 6.1 | | | |
| Wirelines and Wireless Telecommunications | | | 5.3 | | | | 3.4 | | | |
| Insurance | | | 4.9 | | | | 4.8 | | | |
| Electric | | | 4.5 | | | | 3.9 | | | |
| Food & Beverage | | | 4.3 | | | | 3.5 | | | |
| Media | | | 4.1 | | | | 2.1 | | | |
| Health Care | | | 3.9 | | | | 3.9 | | | |
| Pipelines | | | 3.3 | | | | 4.4 | | | |
|
| | |
| 8 | | The percentage shown for each investment category reflects the value of investments in that category as a percentage of net assets. The above table depicts the Fund’s investments but may not represent the Fund’s market exposure due to the exclusion of derivatives, if any, as listed in the Additional Investment Information section of the Schedule of Investments. |
PORTFOLIO RESULTS
Goldman Sachs Local Emerging
Markets Debt Fund
Investment Objective
The Fund seeks a high level of total return consisting of income and capital appreciation.
Portfolio Management Discussion and Analysis
Below, the Goldman Sachs Global Fixed Income Investment Management Team discusses the Goldman Sachs Local Emerging Markets Debt Fund’s (the “Fund”) performance and positioning for the six-month period ended September 30, 2011 (the “Reporting Period”).
| |
| Q | How did the Fund perform during the Reporting Period? |
| |
| A | During the Reporting Period, the Fund’s Class A, C, Institutional and IR Shares generated cumulative total returns, without sales charges, of -7.69%, -8.02%, -7.43% and -7.58%, respectively. These returns compare to the -4.94% cumulative total return of the Fund’s benchmark, the J.P. Morgan Government Bond Index – Emerging Markets Global Diversified Index (with dividends reinvested) (the “Index”), during the same time period. |
| |
| Q | What key factors were responsible for the Fund’s performance during the Reporting Period? |
| |
| A | Country and issue selection among local currency denominated bonds detracted from the Fund’s relative performance. Overall, the Fund’s positioning within emerging markets currencies added value. |
| |
| Q | Which segments of local emerging markets debt most significantly affected Fund performance? |
| |
| A | The Fund’s overweighted exposure to the Mexican peso, accomplished through the use of forward foreign currency exchange contracts, detracted from relative results. The currency depreciated 14.3% during the Reporting Period. As Indonesia’s bond market rallied, an underweighted position in Indonesian local debt further hampered performance. Also, the Fund’s position in Turkey’s inflation-linked local bonds detracted as inflation increased and Turkish bond prices declined. |
On the positive side, the Fund benefited from an over- weighted position in Brazilian local bonds, which rallied after Brazil’s central bank cut interest rates during August. Also, underweighted positions in the Hungarian forint and Brazilian real, accomplished through the sale of forward foreign currency exchange contracts and through an underweight relative to the Index, contributed to performance. The two currencies depreciated by 13.8% and 15.4%, respectively, during September.
| |
| Q | Did the Fund’s duration and yield curve positioning strategy help or hurt its results during the Reporting Period? |
| |
| A | The Fund does not use duration and yield curve positioning as active management strategies within its investment process. |
| |
| Q | How did the Fund use derivatives and similar instruments during the Reporting Period? |
| |
| A | The Fund invested in forward foreign currency exchange contracts, interest rate swaps, non-deliverable bond forwards and credit linked notes. Forward foreign currency exchange contracts were used for hedging purposes as well as to express a positive view on a given currency. Interest rate swaps were used to express our views on the direction of a country’s interest rates. Non-deliverable bond forwards and credit linked notes were used in place of buying a local currency denominated bond when a particular market was otherwise inaccessible as well as a more efficient means of gaining access to a local market. |
PORTFOLIO RESULTS
| |
| Q | Were there any notable changes in the Fund’s weightings during the Reporting Period? |
| |
| A | Through most of the Reporting Period, the Fund had little exposure to Mexican local debt. In September 2011, we shifted from that underweighted position to an overweighted position, as we believe that Mexico’s interest rates will decrease as a result of slack in that nation’s economy and its relatively stable inflation rate. We reduced the Fund’s underweighted exposure to Thai local debt and increased the Fund’s underweighted allocation to Poland’s local bonds. In our opinion, Poland’s fiscal deficit is quite high and plans to reduce it are moving at a slow pace. Further, Poland’s government debt is high with what we believe are worsening sources of stable financing. During the Reporting Period, we reduced the Fund’s overweighted exposure to the Chinese renminbi. Nevertheless, we continue to have a positive view of the renminbi and believe China’s central bank is more willing that it was in the recent past to tolerate further currency appreciation. We also reduced the Fund’s overweighted position in the Indian rupee. Although India’s balance of payments improved as exports increased, we were concerned about the possible impact of deteriorating global economic growth. |
| |
| Q | How was the Fund positioned relative to its benchmark index at the end of the Reporting Period? |
| |
| A | At the end of the Reporting Period, the Fund had over- weighted positions in Brazilian, South African and Mexican local bonds as well as an overweighted position in a number of Asian currencies, including the Chinese renminbi, South Korean won and Malaysian ringgit. The Fund held underweighted positions in Polish and Thai local debt at the end of the Reporting Period. |
FUND BASICS
Local Emerging Markets Debt Fund
as of September 30, 2011
| | | | | | | | | | | | | | | | | | | |
| | | | | J.P. Morgan
| | 30-Day
| | 30-Day
| | |
April 1, 2011–
| | Fund Total Return
| | GBI EM Global
| | Standardized
| | Standardized
| | |
| September 30, 2011 | | (based on NAV)1 | | Diversified Index2 | | Subsidized Yield3 | | Unsubsidized Yield3 | | |
|
| |
| Class A | | | -7.69 | % | | | -4.94 | % | | | 4.45 | % | | | 4.25 | % | | |
| Class C | | | -8.02 | | | | -4.94 | | | | 3.85 | | | | 3.65 | | | |
| Institutional | | | -7.43 | | | | -4.94 | | | | 5.02 | | | | 4.82 | | | |
| Class IR | | | -7.58 | | | | -4.94 | | | | 4.94 | | | | 4.73 | | | |
|
| | |
| 1 | | The net asset value (“NAV”) represents the net assets of the class of the Fund (ex-dividend) divided by the total number of shares of the class outstanding. The Fund’s performance assumes the reinvestment of dividends and other distributions. The Fund’s performance does not reflect the deduction of any applicable sales charges. |
| |
| 2 | | The J.P. Morgan Government Bond Index-Emerging Markets (GBI-EM) Global Diversified Index is an unmanaged index of debt instruments of 14 Emerging Countries. The Index figures do not reflect any deduction for fees, expenses or taxes. It is not possible to invest directly in an index. |
| |
| 3 | | The 30-Day Standardized Subsidized Yield of the Fund is calculated by dividing the net investment income per share (as defined by securities industry regulations) earned by the Fund over a 30-day period (ending on the stated month-end date) by the maximum public offering price (“POP”) per share of the Fund on the last day of the period. This number is then annualized. This yield does not necessarily reflect income actually earned and distributed by the Fund and, therefore, may not be correlated with the dividends or other distributions paid to shareholders. The 30-Day Standardized Unsubsidized Yield does not reflect any applicable expense reductions. |
| |
| STANDARDIZED AVERAGE ANNUAL TOTAL RETURNS4 | |
| | | | | | | | | | | | | |
| For the period ended 9/30/11 | | One Year | | Since Inception | | Inception Date | | |
|
| |
| Class A | | | -9.98 | % | | | 0.61 | % | | 2/15/08 | | |
| Class C | | | -7.32 | | | | 1.20 | | | 2/15/08 | | |
| Institutional | | | -5.27 | | | | 2.27 | | | 2/15/08 | | |
| Class IR | | | -5.46 | | | | -0.05 | | | 7/30/10 | | |
|
| | |
| 4 | | The Standardized Average Annual Total Returns are average annual total returns as of the most recent calendar quarter-end. They assume reinvestment of all distributions at NAV. These returns reflect a maximum initial sales charge of 4.5% for Class A Shares and the assumed contingent deferred sales charge for Class C Shares (1% if redeemed within 12 months of purchase). Because Institutional and Class IR Shares do not involve a sales charge, such a charge is not applied to their Standardized Average Annual Total Returns. The Fund will charge a 2% redemption fee on the redemption of shares (including by exchange) held for 30 calendar days or less. The performance figures do not reflect the deduction of the redemption fee. If reflected, the redemption fee would reduce the performance quoted. |
| |
| | The returns represent past performance. Past performance does not guarantee future results. The Fund’s investment return and principal value will fluctuate so that an investor’s shares, when redeemed, may be worth more or less than their original cost. Current performance may be lower or higher than the performance quoted above. Please visit our Web site at: www.goldmansachsfunds.com to obtain the most recent month-end returns. Performance reflects expense limitations in effect. In their absence, performance would be reduced. Returns do not reflect the deduction of taxes that a shareholder would pay on Fund distributions or the redemption of Fund shares. |
FUND BASICS
| | | | | | | | | | | |
| | | Net Expense Ratio
| | Gross Expense Ratio
| | |
| | | (Current) | | (Before Waivers) | | |
|
| |
| Class A | | | 1.25 | % | | | 1.43 | % | | |
| Class C | | | 2.00 | | | | 2.18 | | | |
| Institutional | | | 0.91 | | | | 1.09 | | | |
| Class IR | | | 1.00 | | | | 1.18 | | | |
|
| | |
| 5 | | The expense ratios of the Fund, both current (net of applicable fee waivers or expense limitations) and before waivers (gross of applicable fee waivers or expense limitations), are as set forth above according to the most recent publicly available Prospectus for the Fund and may differ from the expense ratios disclosed in the Financial Highlights in this report. The Fund’s waivers and/or expense limitations, if any, will remain in place through at least July 29, 2012, and prior to such date the investment adviser may not terminate the arrangements without the approval of the Fund’s Board of Trustees. If these arrangements are discontinued in the future, the expense ratios may change without shareholder approval. |
| |
| TOP TEN COUNTRY ALLOCATION6 | |
| | | | | | | | | | | |
| | | Percentage of Net Assets | | |
| | | |
| | | as of 9/30/11 | | as of 3/31/11 | | |
|
| |
| Brazil | | | 11.2 | % | | | 7.4 | % | | |
| Indonesia | | | 9.0 | | | | 6.0 | | | |
| Thailand | | | 8.5 | | | | 10.1 | | | |
| Turkey | | | 6.7 | | | | 3.7 | | | |
| Malaysia | | | 6.6 | | | | 8.8 | | | |
| South Africa | | | 6.1 | | | | 8.6 | | | |
| Russia | | | 5.9 | | | | 1.1 | | | |
| Mexico | | | 5.1 | | | | 5.3 | | | |
| Colombia | | | 4.5 | | | | 2.4 | | | |
| Hungary | | | 4.3 | | | | 9.0 | | | |
|
| | |
| 6 | | The percentage shown for each investment category reflects the value of investments in that country as a percentage of net assets. The above table does not include repurchase agreements of 19.7% as of 9/30/11 and 25.7% as of 3/31/11. The above table depicts the Fund’s investments but may not represent the Fund’s market exposure due to the exclusion of derivatives, if any, as listed in the Additional Investment Information section of the Schedule of Investments. |
PORTFOLIO RESULTS
Goldman Sachs U.S. Mortgages Fund
Investment Objective
The Fund seeks a high level of total return consisting of income and capital appreciation.
Portfolio Management Discussion and Analysis
Below, the Goldman Sachs U.S. Fixed Income Investment Management Team discusses the Goldman Sachs U.S. Mortgages Fund’s (the “Fund”) performance and positioning for the six-month period ended September 30, 2011 (the “Reporting Period”).
| |
| Q | How did the Fund perform during the Reporting Period? |
| |
| A | During the Reporting Period, the Fund’s Class A, Institutional and Separate Account Institutional Shares generated cumulative total returns, without sales charges, of 3.75%, 4.02% and 3.93%, respectively. These returns compare to the 4.44% cumulative total return of the Fund’s benchmark, the Barclays Capital U.S. Securitized Bond Index (with dividends reinvested) (the “Index”), during the same time period. During the period from inception on July 29, 2011 to September 30, 2011, the Fund’s Class IR Shares generated a cumulative total return, without sales charges, of 0.95%. This compares to the 1.22% cumulative total return of the Index during the same time period. |
| |
| Q | What key factors were responsible for the Fund’s performance during the Reporting Period? |
| |
| A | The Fund’s duration strategy detracted the most from relative performance during the Reporting Period. Duration is a measure of the Fund’s sensitivity to changes in interest rates. The Fund’s cross-sector strategy also dampened relative results. In our cross-sector strategy, we invest Fund assets across a variety of fixed income sectors, including some that may not be included in the Fund’s benchmark. Bottom-up individual issue selection among agency mortgage-backed securities contributed to the Fund’s relative returns. |
| |
| Q | Which segments of the U.S. mortgage-backed securities sector most significantly affected Fund performance? |
| |
| A | During the Reporting Period, the Fund’s cross-sector positioning hampered relative results. Specifically, the Fund’s exposure to non-agency mortgage-backed securities (MBS) and commercial mortgage-backed securities (CMBS) detracted. These sectors sold off during the Reporting Period in response to the downgrade of U.S. government debt, weaker than expected U.S. economic growth and continued uncertainty about the European sovereign debt crisis. |
From an issue selection perspective, the Fund benefited from our focus on agency MBS with lower prepayment risk. These securities performed well as fears increased that recent record low mortgage rates could spur renewed refinancing activity. In addition, investors were concerned that the federal government might modify existing mortgage refinancing programs to support credit-impaired homeowners with high interest rate mortgages.
| |
| Q | Did the Fund’s duration and yield curve positioning strategy help or hurt its results during the Reporting Period? |
| |
| A | The Fund’s duration and yield curve positioning strategy detracted from relative results during the Reporting Period. In particular, the Fund’s short duration bias early in the Reporting Period hampered relative performance as 10-year Treasury yields fell in response to slowing economic growth. |
PORTFOLIO RESULTS
| |
| Q | How did the Fund use derivatives and similar instruments during the Reporting Period? |
| |
| A | The Fund used U.S. Treasury futures to hedge interest rate exposure and to facilitate specific duration and yield curve strategies. Interest rate swaps were used to hedge interest rate exposure and express an outright term structure view. (Term structure, most often depicted as a yield curve, refers to the terms structure of interest rates, which is the relationship between the yield to the maturity and the time to maturity for pure discount bonds.) |
| |
| Q | Were there any notable changes in the Fund’s weightings during the Reporting Period? |
| |
| A | We shifted the Fund from a shorter duration bias to a longer duration bias in August after the Fed announced its intention to keep interest rates low and because we expected economic growth to remain subdued. |
| |
| Q | How was the Fund positioned relative to its benchmark index at the end of the Reporting Period? |
| |
| A | At the end of the Reporting Period, the Fund had overweighted allocations relative to the Index in agency collateralized mortgage obligations (CMO), non-agency adjustable rates mortgages (ARMs), asset-backed securities (ABS) and CMBS. It was underweight relative to the Index in agency residential mortgage-backed securities (RMBS) in market value terms, specifically agency ARMS and agency pass-through mortgage securities. Pass-through mortgage securities consist of a pool of residential mortgage loans, where homeowners’ monthly payments of principal, interest and prepayments pass from the original bank through a government agency or investment bank to investors. |
FUND BASICS
U.S. Mortgages Fund
as of September 30, 2011
| | | | | | | | | | | | | | | | | | | |
| | | | | Barclays Capital
| | 30-Day
| | 30-Day
| | |
April 1, 2011–
| | Fund Total Return
| | U.S. Securitized
| | Standardized
| | Standardized
| | |
| September 30, 2011 | | (based on NAV)1 | | Bond Index2 | | Subsidized Yield3 | | Unsubsidized Yield3 | | |
|
| |
| Class A | | | 3.75 | % | | | 4.44 | % | | | 1.01 | % | | | 0.79 | % | | |
| Institutional | | | 4.02 | | | | 4.44 | | | | 1.39 | | | | 1.16 | | | |
| Separate Account | | | 3.93 | | | | 4.44 | | | | 1.39 | | | | 1.16 | | | |
| Institutional | | | | | | | | | | | | | | | | | | |
|
July 29, 2011–
| | | | | | | | | | |
| September 30, 2011 | | | | | | | | | | |
|
| |
| Class IR | | | 0.95 | % | | | 1.22 | % | | | 1.41 | % | | | 1.29 | % | | |
|
| | |
| 1 | | The net asset value (“NAV”) represents the net assets of the class of the Fund (ex-dividend) divided by the total number of shares of the class outstanding. The Fund’s performance assumes the reinvestment of dividends and other distributions. The Fund’s performance does not reflect the deduction of any applicable sales charges. |
| |
| 2 | | The Barclays Capital U.S. Securitized Bond Index (with dividends reinvested) is an unmanaged composite of asset-backed securities, collateralized mortgage-backed securities and fixed rate mortgage-backed securities. The index figures do not reflect any deduction for fees, expenses or taxes. It is not possible to invest directly in an index. |
| |
| 3 | | The 30-Day Standardized Subsidized Yield of the Fund is calculated by dividing the net investment income per share (as defined by securities industry regulations) earned by the Fund over a 30-day period (ending on the stated month-end date) by the maximum public offering price (“POP”) per share of the Fund on the last day of the period. This number is then annualized. This yield does not necessarily reflect income actually earned and distributed by the Fund and, therefore, may not be correlated with the dividends or other distributions paid to shareholders. The 30-Day Standardized Unsubsidized Yield does not reflect any applicable expense reductions. |
| |
| STANDARDIZED AVERAGE ANNUAL TOTAL RETURNS4 | |
| | | | | | | | | | | | | | | | | |
| For the period ended 9/30/11 | | One Year | | Five Years | | Since Inception | | Inception Date | | |
|
| |
| Class A | | | 0.57 | % | | | 4.25 | % | | | 4.11 | % | | 11/3/03 | | |
| Institutional | | | 4.95 | | | | 5.44 | | | | 5.02 | | | 11/3/03 | | |
| Separate Account Institutional | | | 4.86 | | | | 5.46 | | | | 5.04 | | | 11/3/03 | | |
| Class IR | | | N/A | | | | N/A | | | | 0.95 | | | 7/29/11 | | |
|
| | |
| 4 | | The Standardized Average Annual Total Returns are average annual total returns or cumulative total returns (only if performance is one year or less) as of the most recent calendar quarter-end. They assume reinvestment of all distributions at NAV. These returns reflect a maximum initial sales charge of 3.75% for Class A Shares. Prior to July 29, 2009, the maximum initial sales charge applicable to Class A Shares was 4.5%, which is not reflected in the average annual return figures shown. Because Institutional, Separate Account Institutional and Class IR Shares do not involve a sales charge, such a charge is not applied to their Standardized Average Annual Total Returns. |
| |
| | The returns represent past performance. Past performance does not guarantee future results. The Fund’s investment return and principal value will fluctuate so that an investor’s shares, when redeemed, may be worth more or less than their original cost. Current performance may be lower or higher than the performance quoted above. Please visit our Web site at: www.goldmansachsfunds.com to obtain the most recent month-end returns. Performance reflects fee waivers and/or expense limitations in effect. In their absence, performance would be reduced. Returns do not reflect the deduction of taxes that a shareholder would pay on Fund distributions or the redemption of Fund shares. |
FUND BASICS
| | | | | | | | | | | |
| | | Net Expense Ratio
| | Gross Expense Ratio
| | |
| | | (Current) | | (Before Waivers) | | |
|
| |
| Class A | | | 0.71 | % | | | 0.89 | % | | |
| Institutional | | | 0.37 | | | | 0.55 | | | |
| Separate Account Institutional | | | 0.37 | | | | 0.55 | | | |
| Class IR | | | 0.46 | | | | 0.64 | | | |
|
| | |
| 5 | | The expense ratios of the Fund, both current (net of applicable fee waivers or expense limitations) and before waivers (gross of applicable fee waivers or expense limitations), are as set forth above according to the most recent publicly available Prospectus for the Fund and may differ from the expense ratios disclosed in the Financial Highlights in this report. The Fund’s waivers and/or expense limitations, if any, will remain in place through at least July 29, 2012, and prior to such date the investment adviser may not terminate the arrangements without the approval of the Fund’s Board of Trustees. If these arrangements are discontinued in the future, the expense ratios may change without shareholder approval. |
Percentage of Net Assets
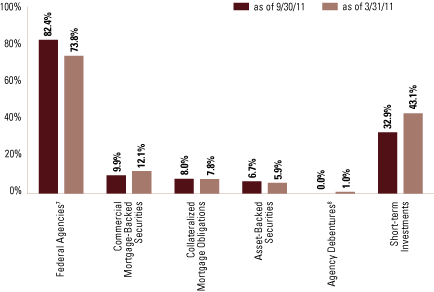
| | |
| 6 | | The Fund is actively managed and, as such, its composition may differ over time. The percentage shown for each investment category reflects the value of investments in that category as a percentage of net assets. Short-term investments represent repurchase agreements. Figures in the above graph may not sum up to 100% due to the exclusion of other assets and liabilities. The above graph depicts the Fund’s investments but may not represent the Fund’s market exposure due to the exclusion of derivatives, if any, as listed in the Additional Investment Information section of the Schedule of Investments. |
| |
| 7 | | “Federal Agencies” are mortgage-backed securities guaranteed by Government National Mortgage Association (“GNMA”), Federal National Mortgage Association (“FNMA”) and Federal Home Loan Mortgage Corp. (“FHLMC”). GNMA instruments are backed by the full faith and credit of the U.S. Government. |
| |
| 8 | | “Agency Debentures” include agency securities offered by companies such as FNMA and FHLMC, which operate under a government charter. While they are required to report to a government regulator, their assets are not explicitly guaranteed by the government and they otherwise operate like any other publicly traded company. |
GOLDMAN SACHS EMERGING MARKETS DEBT FUND
Schedule of Investments
September 30, 2011 (Unaudited)
| | | | | | | | | | | | | | | |
Principal
| | Interest
| | Maturity
| | |
| Amount | | Rate | | Date | | Value |
| |
Sovereign Debt Obligations – 65.5% |
Argentina – 2.5% |
| Republic of Argentina (NR/NR) |
| EUR | 6,136,656 | | | | 7.820 | %(a) | | | 12/31/33 | | | $ | 4,645,195 | |
| | 28,560,000 | | | | 0.000 | (a) | | | 12/15/35 | | | | 4,648,985 | |
| $ | 3,400,000 | | | | 0.000 | (a) | | | 12/15/35 | | | | 469,200 | |
| | 1,380,000 | | | | 7.000 | | | | 10/03/15 | | | | 1,150,383 | |
| EUR | 5,429,578 | | | | 7.820 | | | | 12/31/33 | | | | 4,164,523 | |
| | 1,320,000 | | | | 2.260 | (b) | | | 12/31/38 | | | | 499,593 | |
| | | | | | | | | | | | | | | |
| | | | | | | | | | | | | | 15,577,879 | |
| |
| |
Belarus – 0.7% |
| Republic of Belarus (B-/B3) |
| $ | 5,519,000 | | | | 8.750 | | | | 08/03/15 | | | | 3,987,478 | |
| | 400,000 | | | | 8.950 | | | | 01/26/18 | | | | 286,000 | |
| | | | | | | | | | | | | | | |
| | | | | | | | | | | | | | 4,273,478 | |
| |
| |
Belize(b) – 0.1% |
| Government of Belize (B-/B3) |
| | 1,330,000 | | | | 6.000 | | | | 02/20/29 | | | | 798,000 | |
| |
| |
Brazil – 3.1% |
| Federal Republic of Brazil (NR/Baa2) |
| | 10,917,000 | | | | 4.875 | | | | 01/22/21 | | | | 11,653,898 | |
| Federal Republic of Brazil (BBB-/Baa2) |
| | 1,000,000 | | | | 8.875 | | | | 10/14/19 | | | | 1,355,000 | |
| | 2,210,000 | | | | 8.250 | | | | 01/20/34 | | | | 3,105,050 | |
| | 540,000 | | | | 7.125 | | | | 01/20/37 | | | | 688,500 | |
| | 2,360,000 | | | | 5.625 | | | | 01/07/41 | | | | 2,542,900 | |
| | | | | | | | | | | | | | | |
| | | | | | | | | | | | | | 19,345,348 | |
| |
| |
Chile – 0.7% |
| Republic of Chile (A+/Aa3) |
| | 1,750,000 | | | | 3.875 | | | | 08/05/20 | | | | 1,825,292 | |
| | 2,800,000 | | | | 3.250 | | | | 09/14/21 | | | | 2,718,834 | |
| | | | | | | | | | | | | | | |
| | | | | | | | | | | | | | 4,544,126 | |
| |
| |
Colombia – 6.9% |
| Republic of Colombia (BBB-/Baa3) |
| | 370,000 | | | | 8.250 | | | | 12/22/14 | | | | 433,825 | |
| | 3,368,000 | | | | 7.375 | | | | 01/27/17 | | | | 4,016,340 | |
| | 9,020,000 | | | | 7.375 | | | | 03/18/19 | | | | 11,117,150 | |
| | 5,100,000 | | | | 4.375 | | | | 07/12/21 | | | | 5,176,449 | |
| | 9,970,000 | | | | 7.375 | | | | 09/18/37 | | | | 12,961,000 | |
| | 8,020,000 | | | | 6.125 | | | | 01/18/41 | | | | 9,062,600 | |
| | | | | | | | | | | | | | | |
| | | | | | | | | | | | | | 42,767,364 | |
| |
| |
Costa Rica – 0.1% |
| Republic of Costa Rica (BB+/Baa3) |
| | 469,000 | | | | 9.995 | | | | 08/01/20 | | | | 633,150 | |
| |
| |
Croatia – 0.9% |
| Republic of Croatia (BBB-/Baa3) |
| | 660,000 | | | | 6.625 | | | | 07/14/20 | | | | 617,100 | |
| | 5,650,000 | | | | 6.375 | (c) | | | 03/24/21 | | | | 5,113,250 | |
| | | | | | | | | | | | | | | |
| | | | | | | | | | | | | | 5,730,350 | |
| |
| |
Dominican Republic – 1.8% |
| Dominican Republic (B+/B1) |
| | 5,246,289 | | | | 9.040 | | | | 01/23/18 | | | | 5,718,455 | |
| | 2,630,000 | | | | 7.500 | (c) | | | 05/06/21 | | | | 2,551,100 | |
| | 1,964,000 | | | | 7.500 | | | | 05/06/21 | | | | 1,901,638 | |
| | 1,060,000 | | | | 8.625 | | | | 04/20/27 | | | | 1,102,400 | |
| | | | | | | | | | | | | | | |
| | | | | | | | | | | | | | 11,273,593 | |
| |
| |
El Salvador – 0.6% |
| Republic of El Salvador (BB-/Ba2) |
| | 2,582,000 | | | | 8.250 | | | | 04/10/32 | | | | 2,724,010 | |
| | 600,000 | | | | 7.650 | | | | 06/15/35 | | | | 582,000 | |
| | 640,000 | | | | 7.625 | (c) | | | 02/01/41 | | | | 614,400 | |
| | | | | | | | | | | | | | | |
| | | | | | | | | | | | | | 3,920,410 | |
| |
| |
Gabon – 0.4% |
| Republic of Gabon (BB-/NR) |
| | 590,000 | | | | 8.200 | (c) | | | 12/12/17 | | | | 641,625 | |
| | 1,640,000 | | | | 8.200 | | | | 12/12/17 | | | | 1,783,500 | |
| | | | | | | | | | | | | | | |
| | | | | | | | | | | | | | 2,425,125 | |
| |
| |
Georgia(c) – 0.2% |
| Republic of Georgia (B+/Ba3) |
| | 1,170,000 | | | | 6.875 | | | | 04/12/21 | | | | 1,140,750 | |
| |
| |
Ghana – 0.3% |
| Republic of Ghana (B/NR) |
| | 1,650,000 | | | | 8.500 | | | | 10/04/17 | | | | 1,707,750 | |
| |
| |
Hungary – 0.9% |
| Hungary Government Bond (BBB-/Baa3) |
| | 880,000 | | | | 6.375 | | | | 03/29/21 | | | | 849,200 | |
| | 4,610,000 | | | | 7.625 | | | | 03/29/41 | | | | 4,464,793 | |
| | | | | | | | | | | | | | | |
| | | | | | | | | | | | | | 5,313,993 | |
| |
| |
Iceland(c) – 1.2% |
| Republic of Iceland (BBB-/Baa3) |
| | 7,800,000 | | | | 4.875 | | | | 06/16/16 | | | | 7,680,820 | |
| |
| |
Indonesia – 8.6% |
| Republic of Indonesia (BB+/Ba1) |
| | 4,650,000 | | | | 6.750 | | | | 03/10/14 | | | | 4,998,750 | |
| | 820,000 | | | | 7.500 | | | | 01/15/16 | | | | 932,750 | |
| | 7,664,000 | | | | 11.625 | | | | 03/04/19 | | | | 10,921,200 | |
| | 8,929,000 | | | | 5.875 | (c) | | | 03/13/20 | | | | 9,643,320 | |
| | 340,000 | | | | 5.875 | | | | 03/13/20 | | | | 367,200 | |
| | 4,950,000 | | | | 4.875 | (c) | | | 05/05/21 | | | | 4,999,500 | |
| | 490,000 | | | | 4.875 | | | | 05/05/21 | | | | 494,900 | |
| | 2,490,000 | | | | 8.500 | | | | 10/12/35 | | | | 3,349,050 | |
| | 3,198,000 | | | | 7.750 | (c) | | | 01/17/38 | | | | 4,005,495 | |
| | 10,844,000 | | | | 7.750 | | | | 01/17/38 | | | | 13,582,110 | |
| | | | | | | | | | | | | | | |
| | | | | | | | | | | | | | 53,294,275 | |
| |
| |
Iraq – 0.9% |
| Republic of Iraq (NR/NR) |
| | 6,830,000 | | | | 5.800 | | | | 01/15/28 | | | | 5,429,850 | |
| |
| |
The accompanying notes are an integral part of these financial statements. 37
GOLDMAN SACHS EMERGING MARKETS DEBT FUND
Schedule of Investments (continued)
September 30, 2011 (Unaudited)
| | | | | | | | | | | | | | | |
Principal
| | Interest
| | Maturity
| | |
| Amount | | Rate | | Date | | Value |
| |
Sovereign Debt Obligations – (continued) |
| | | | | | | | | | | | | | | |
Ivory Coast(d) – 1.0% |
| Republic of Ivory Coast (NR/NR) |
| $ | 11,280,000 | | | | 2.500 | % | | | 12/31/32 | | | $ | 5,470,800 | |
| | 1,000,000 | | | | 2.500 | (c) | | | 12/31/32 | | | | 485,000 | |
| | | | | | | | | | | | | | | |
| | | | | | | | | | | | | | 5,955,800 | |
| |
| |
Malaysia(c) – 0.9% |
| Wakala Global Sukuk Bhd (A-/A3) |
| | 5,180,000 | | | | 4.646 | | | | 07/06/21 | | | | 5,371,223 | |
| |
| |
Mexico – 3.6% |
| Mexican Bonos (A-/Baa1) |
| MXN | 46,708,300 | | | | 8.500 | | | | 11/18/38 | | | | 3,673,427 | |
| United Mexican States (BBB/Baa1) |
| $ | 1,000 | | | | 7.500 | | | | 01/14/12 | | | | 1,013 | |
| | 540,000 | | | | 5.875 | | | | 01/15/14 | | | | 581,310 | |
| | 250,000 | | | | 6.625 | | | | 03/03/15 | | | | 282,500 | |
| | 1,040,000 | | | | 5.625 | | | | 01/15/17 | | | | 1,157,000 | |
| | 3,100,000 | | | | 5.950 | | | | 03/19/19 | | | | 3,534,000 | |
| | 580,000 | | | | 8.300 | | | | 08/15/31 | | | | 826,500 | |
| | 3,696,000 | | | | 6.750 | | | | 09/27/34 | | | | 4,536,840 | |
| | 1,080,000 | | | | 6.050 | | | | 01/11/40 | | | | 1,225,800 | |
| | 6,350,000 | | | | 5.750 | (e) | | | 10/12/2110 | | | | 6,191,250 | |
| | | | | | | | | | | | | | | |
| | | | | | | | | | | | | | 22,009,640 | |
| |
| |
Nigeria – 0.8% |
| Republic of Nigeria (B+/NR) |
| | 1,800,000 | | | | 6.750 | (c) | | | 01/28/21 | | | | 1,755,000 | |
| | 2,970,000 | | | | 6.750 | | | | 01/28/21 | | | | 2,895,750 | |
| | | | | | | | | | | | | | | |
| | | | | | | | | | | | | | 4,650,750 | |
| |
| |
Pakistan – 0.4% |
| Islamic Republic of Pakistan (B-/B3) |
| | 1,320,000 | | | | 6.875 | | | | 06/01/17 | | | | 990,000 | |
| | 1,070,000 | | | | 6.875 | (c) | | | 06/01/17 | | | | 802,500 | |
| | 1,420,000 | | | | 7.875 | | | | 03/31/36 | | | | 923,000 | |
| | | | | | | | | | | | | | | |
| | | | | | | | | | | | | | 2,715,500 | |
| |
| |
Panama – 1.7% |
| Republic of Panama (BBB-/Baa3) |
| | 184,000 | | | | 7.250 | | | | 03/15/15 | | | | 210,220 | |
| | 90,000 | | | | 7.125 | | | | 01/29/26 | | | | 112,500 | |
| | 2,247,000 | | | | 8.875 | | | | 09/30/27 | | | | 3,213,210 | |
| | 3,610,000 | | | | 9.375 | | | | 04/01/29 | | | | 5,378,900 | |
| | 1,340,000 | | | | 6.700 | | | | 01/26/36 | | | | 1,608,000 | |
| | | | | | | | | | | | | | | |
| | | | | | | | | | | | | | 10,522,830 | |
| |
| |
Peru – 1.5% |
| Republic of Peru (BBB/Baa3) |
| | 310,000 | | | | 7.125 | | | | 03/30/19 | | | | 373,550 | |
| | 3,442,000 | | | | 7.350 | | | | 07/21/25 | | | | 4,268,080 | |
| | 3,484,000 | | | | 8.750 | | | | 11/21/33 | | | | 4,955,990 | |
| | | | | | | | | | | | | | | |
| | | | | | | | | | | | | | 9,597,620 | |
| |
| |
Philippines – 4.8% |
| Republic of Philippines (BB/Ba2) |
| | 3,169,000 | | | | 8.375 | | | | 06/17/19 | | | | 4,016,707 | |
| | 965,000 | | | | 7.500 | | | | 09/25/24 | | | | 1,160,413 | |
| | 3,450,000 | | | | 5.500 | | | | 03/30/26 | | | | 3,600,937 | |
| | 3,302,000 | | | | 9.500 | | | | 02/02/30 | | | | 4,829,175 | |
| | 1,912,000 | | | | 7.750 | | | | 01/14/31 | | | | 2,452,140 | |
| | 11,826,000 | | | | 6.375 | | | | 10/23/34 | | | | 13,481,640 | |
| | | | | | | | | | | | | | | |
| | | | | | | | | | | | | | 29,541,012 | |
| |
| |
Russia – 6.1% |
Russian Federation (NR/Baa1)(c) |
| | 800,000 | | | | 3.625 | | | | 04/29/15 | | | | 786,000 | |
Russian Federation (BBB/Baa1)(b) |
| | 1,470,500 | | | | 7.500 | | | | 03/31/30 | | | | 1,652,842 | |
| | 31,370,950 | | | | 7.500 | | | | 03/31/30 | | | | 35,260,948 | |
| | | | | | | | | | | | | | | |
| | | | | | | | | | | | | | 37,699,790 | |
| |
| |
Serbia(b) – 0.4% |
| Republic of Serbia (BB/NR) |
| | 2,520,000 | | | | 6.750 | | | | 11/01/24 | | | | 2,356,200 | |
| |
| |
South Africa – 1.7% |
| Republic of South Africa (NR/A3) |
| ZAR | 23,205,000 | | | | 6.750 | | | | 03/31/21 | | | | 2,586,116 | |
| Republic of South Africa (A/A3) |
| | 8,090,000 | | | | 7.250 | | | | 01/15/20 | | | | 941,787 | |
| | 22,305,000 | | | | 10.500 | | | | 12/21/26 | | | | 3,202,165 | |
| Republic of South Africa (BBB+/A3) |
| $ | 3,220,000 | | | | 6.250 | | | | 03/08/41 | | | | 3,586,275 | |
| | | | | | | | | | | | | | | |
| | | | | | | | | | | | | | 10,316,343 | |
| |
| |
Sri Lanka – 0.3% |
| Republic of Sri Lanka (B+/NR) |
| | 540,000 | | | | 7.400 | (c) | | | 01/22/15 | | | | 564,300 | |
| | 274,000 | | | | 7.400 | | | | 01/22/15 | | | | 286,330 | |
Republic of Sri Lanka (B+/B1)(c) |
| | 1,170,000 | | | | 6.250 | | | | 07/27/21 | | | | 1,131,621 | |
| | | | | | | | | | | | | | | |
| | | | | | | | | | | | | | 1,982,251 | |
| |
| |
Turkey – 3.0% |
| Republic of Turkey (BB/Ba2) |
| | 2,370,000 | | | | 7.000 | | | | 09/26/16 | | | | 2,621,812 | |
| | 11,635,000 | | | | 5.625 | | | | 03/30/21 | | | | 11,882,244 | |
| | 610,000 | | | | 7.375 | | | | 02/05/25 | | | | 696,163 | |
| | 590,000 | | | | 11.875 | | | | 01/15/30 | | | | 964,650 | |
| | 2,310,000 | | | | 6.750 | | | | 05/30/40 | | | | 2,428,387 | |
| | | | | | | | | | | | | | | |
| | | | | | | | | | | | | | 18,593,256 | |
| |
| |
38 The accompanying notes are an integral part of these financial statements.
GOLDMAN SACHS EMERGING MARKETS DEBT FUND
| | | | | | | | | | | | | | | |
Principal
| | Interest
| | Maturity
| | |
| Amount | | Rate | | Date | | Value |
| |
Sovereign Debt Obligations – (continued) |
| | | | | | | | | | | | | | | |
Ukraine – 3.7% |
| Ukraine Government (B+/B2) |
| EUR | 1,000,000 | | | | 4.950 | % | | | 10/13/15 | | | $ | 1,118,691 | |
| $ | 7,680,000 | | | | 6.250 | (c) | | | 06/17/16 | | | | 6,833,686 | |
| | 3,940,000 | | | | 6.580 | | | | 11/21/16 | | | | 3,536,150 | |
| | 1,200,000 | | | | 6.750 | | | | 11/14/17 | | | | 1,068,000 | |
| | 5,550,000 | | | | 7.750 | | | | 09/23/20 | | | | 4,981,125 | |
| | 4,750,000 | | | | 7.950 | (c) | | | 02/23/21 | | | | 4,298,750 | |
| | 1,340,000 | | | | 7.950 | | | | 02/23/21 | | | | 1,212,700 | |
| | | | | | | | | | | | | | | |
| | | | | | | | | | | | | | 23,049,102 | |
| |
| |
Uruguay – 1.8% |
| Republic of Uruguay (BBB-/Ba1) |
| | 1,146,907 | | | | 8.000 | | | | 11/18/22 | | | | 1,427,899 | |
| | 466,000 | | | | 6.875 | | | | 09/28/25 | | | | 545,220 | |
| | 680,000 | | | | 7.875 | (f) | | | 01/15/33 | | | | 843,200 | |
| | 6,596,000 | | | | 7.625 | | | | 03/21/36 | | | | 8,113,080 | |
| | | | | | | | | | | | | | | |
| | | | | | | | | | | | | | 10,929,399 | |
| |
| |
Venezuela – 3.9% |
| Republic of Venezuela (B+/B2) |
| | 650,000 | | | | 5.750 | | | | 02/26/16 | | | | 468,000 | |
| | 1,170,000 | | | | 13.625 | | | | 08/15/18 | | | | 1,140,750 | |
| | 510,000 | | | | 13.625 | | | | 08/15/18 | | | | 489,600 | |
| | 8,750,000 | | | | 7.750 | | | | 10/13/19 | | | | 5,578,125 | |
| | 6,531,000 | | | | 6.000 | | | | 12/09/20 | | | | 3,608,378 | |
| | 4,030,000 | | | | 9.000 | | | | 05/07/23 | | | | 2,518,750 | |
| | 7,790,000 | | | | 8.250 | | | | 10/13/24 | | | | 4,557,150 | |
| | 7,610,000 | | | | 7.650 | | | | 04/21/25 | | | | 4,318,675 | |
| | 710,000 | | | | 9.250 | | | | 05/07/28 | | | | 436,650 | |
| | 850,000 | | | | 11.950 | | | | 08/05/31 | | | | 626,450 | |
| | 1,170,000 | | | | 7.000 | | | | 03/31/38 | | | | 614,250 | |
| | | | | | | | | | | | | | | |
| | | | | | | | | | | | | | 24,356,778 | |
| |
| |
TOTAL SOVEREIGN DEBT OBLIGATIONS |
(Cost $412,748,790) | | $ | 405,503,755 | |
| |
| |
| | | | | | | | | | | | | | | |
| | | | | | | | | | | | | | | |
Foreign Debt Obligation – 1.3% |
Supranational – 1.3% |
| Corporation Andina de Fomento (A+/A1) |
| $ | 8,029,000 | | | | 3.750 | % | | | 01/15/16 | | | $ | 8,092,083 | |
(Cost $8,168,681) | | | | |
| |
| |
| | | | | | | | | | | | | | | |
| | | | | | | | | | | | | | | |
Corporate Obligations – 21.5% |
Brazil – 2.0% |
Banco Safra SA (NR/Baa1)(c) |
| BRL | 1,070,000 | | | | 10.250 | % | | | 08/08/16 | | | $ | 540,614 | |
Banco Votorantim SA (BB+/Baa1)(c) |
| | 1,389,732 | | | | 6.250 | | | | 05/16/16 | | | | 724,875 | |
BFF International Ltd. (BB+/Ba1)(g) |
| $ | 2,730,000 | | | | 7.250 | | | | 01/28/20 | | | | 2,844,765 | |
| CCL Finance Ltd. (BB/NR) |
| | 1,058,000 | | | | 9.500 | | | | 08/15/14 | | | | 1,201,752 | |
| Companhia Energetica de Sao Paulo (NR/Ba1) |
| BRL | 2,329,129 | | | | 9.750 | | | | 01/15/15 | | | | 1,372,187 | |
Independencia International Ltd. (NR/NR)(c)(d)(g) |
| $ | 1,277,436 | | | | 12.000 | | | | 12/30/16 | | | | 9,708 | |
Petrobras International Finance Co. (BBB-/A3)(g) |
| | 2,710,000 | | | | 5.375 | | | | 01/27/21 | | | | 2,695,546 | |
Vale Overseas, Ltd. (BBB+/Baa2)(g) |
| | 1,100,000 | | | | 5.625 | | | | 09/15/19 | | | | 1,143,908 | |
| | 2,180,000 | | | | 4.625 | | | | 09/15/20 | | | | 2,106,735 | |
| | | | | | | | | | | | | | | |
| | | | | | | | | | | | | | 12,640,090 | |
| |
| |
Canada – 0.5% |
PTT Exploration and Production Public Co. Ltd. (BBB+/Baa1)(c) |
| | 3,080,000 | | | | 5.692 | | | | 04/05/21 | | | | 3,112,340 | |
Sino-Forest Corp. (NR/Caa1)(d)(g) |
| | 1,359,000 | | | | 6.250 | | | | 10/21/17 | | | | 298,980 | |
| | | | | | | | | | | | | | | |
| | | | | | | | | | | | | | 3,411,320 | |
| |
| |
Chile – 2.1% |
AES Gener SA (BBB-/Baa3)(c)(g) |
| | 1,320,000 | | | | 5.250 | | | | 08/15/21 | | | | 1,260,344 | |
Banco del Estado de Chile (A+/Aa3)(c)(g) |
| | 4,670,000 | | | | 4.125 | | | | 10/07/20 | | | | 4,665,729 | |
| Corporacion Nacional del Cobre (A/A1) |
| | 1,160,000 | | | | 3.750 | (c) | | | 11/04/20 | | | | 1,150,310 | |
| | 3,385,000 | | | | 6.150 | | | | 10/24/36 | | | | 4,081,396 | |
E-CL SA (BBB-/NR)(c)(g) |
| | 2,070,000 | | | | 5.625 | | | | 01/15/21 | | | | 2,130,523 | |
| | | | | | | | | | | | | | | |
| | | | | | | | | | | | | | 13,288,302 | |
| |
| |
Colombia(g) – 0.7% |
| EEB International Ltd. (BB/NR) |
| | 690,000 | | | | 8.750 | (c) | | | 10/31/14 | | | | 710,700 | |
| | 1,020,000 | | | | 8.750 | | | | 10/31/14 | | | | 1,050,600 | |
| TGI International Ltd. (BB/NR) |
| | 760,000 | | | | 9.500 | (c) | | | 10/03/17 | | | | 816,603 | |
| | 1,440,000 | | | | 9.500 | | | | 10/03/17 | | | | 1,549,417 | |
| | | | | | | | | | | | | | | |
| | | | | | | | | | | | | | 4,127,320 | |
| |
| |
Hong Kong – 1.0% |
Country Garden Holdings Co. (BB-/Ba3)(h) |
| CNY | 6,700,000 | | | | 2.500 | | | | 02/22/13 | | | | 1,135,346 | |
ENN Energy Holdings Ltd. (BBB-/Baa3)(c)(g) |
| $ | 1,010,000 | | | | 6.000 | | | | 05/13/21 | | | | 989,315 | |
| Evergrande Real Estate Group Ltd. (BB-/B2) |
| CNY | 14,110,000 | | | | 7.500 | | | | 01/19/14 | | | | 1,601,618 | |
Sinochem Overseas Capital Co. Ltd. (BBB+/Baa1)(c) |
| $ | 1,490,000 | | | | 6.300 | | | | 11/12/40 | | | | 1,354,112 | |
| Zijin International Finance Co. Ltd. (NR/A1) |
| | 1,260,000 | | | | 4.250 | | | | 06/30/16 | | | | 1,201,788 | |
| | | | | | | | | | | | | | | |
| | | | | | | | | | | | | | 6,282,179 | |
| |
| |
India – 0.5% |
| NTPC, Ltd. (BBB-/NR) |
| | 3,250,000 | | | | 5.625 | | | | 07/14/21 | | | | 3,174,919 | |
| |
| |
The accompanying notes are an integral part of these financial statements. 39
GOLDMAN SACHS EMERGING MARKETS DEBT FUND
Schedule of Investments (continued)
September 30, 2011 (Unaudited)
| | | | | | | | | | | | | | | |
Principal
| | Interest
| | Maturity
| | |
| Amount | | Rate | | Date | | Value |
| |
Corporate Obligations – (continued) |
| | | | | | | | | | | | | | | |
Ireland – 0.4% |
| MTS International Funding Ltd. (BB/Ba2) |
| $ | 660,000 | | | | 8.625 | % | | | 06/22/20 | | | $ | 650,100 | |
| VIP Finance Ireland Ltd. for OJSC Vimpel Communications (BB/Ba3) |
| | 1,850,000 | | | | 7.748 | (c) | | | 02/02/21 | | | | 1,526,250 | |
| | | | | | | | | | | | | | | |
| | | | | | | | | | | | | | 2,176,350 | |
| |
| |
Kazakhstan – 2.6% |
Development Bank of Kazakhstan JSC (BBB/Baa3)(c) |
| | 1,700,000 | | | | 5.500 | | | | 12/20/15 | | | | 1,598,000 | |
Kazakhstan Temir Zholy Finance BV (BBB-/Baa3)(c) |
| | 700,000 | | | | 6.375 | | | | 10/06/20 | | | | 680,750 | |
| Kazatomprom (NR/Baa3) |
| | 700,000 | | | | 6.250 | (c) | | | 05/20/15 | | | | 703,500 | |
| | 450,000 | | | | 6.250 | | | | 05/20/15 | | | | 452,250 | |
| KazMunaiGaz Finance Sub BV (BBB-/Baa3) |
| | 10,000 | | | | 8.375 | (c) | | | 07/02/13 | | | | 10,350 | |
| | 2,100,000 | | | | 11.750 | (c) | | | 01/23/15 | | | | 2,420,250 | |
| | 4,560,000 | | | | 11.750 | | | | 01/23/15 | | | | 5,255,400 | |
| | 1,080,000 | | | | 7.000 | (c) | | | 05/05/20 | | | | 1,090,800 | |
| KazMunayGas National Co. (BBB-/Baa3) |
| | 610,000 | | | | 9.125 | | | | 07/02/18 | | | | 689,300 | |
| | 400,000 | | | | 7.000 | | | | 05/05/20 | | | | 404,000 | |
| | 2,530,000 | | | | 6.375 | (c) | | | 04/09/21 | | | | 2,466,750 | |
| | 340,000 | | | | 6.375 | | | | 04/09/21 | | | | 331,500 | |
| | | | | | | | | | | | | | | |
| | | | | | | | | | | | | | 16,102,850 | |
| |
| |
Luxembourg – 2.9% |
| Alrosa Finance SA (BB-/Ba3) |
| | 1,330,000 | | | | 7.750 | | | | 11/03/20 | | | | 1,236,900 | |
| | 1,700,000 | | | | 7.750 | (c) | | | 11/03/20 | | | | 1,581,000 | |
Gaz Capital SA for Gazprom (BBB/Baa1)(h) |
| | 6,080,000 | | | | 9.250 | | | | 04/23/19 | | | | 7,052,800 | |
| Gazprom International SA for Gazprom (BBB+/NR) |
| | 1,913,206 | | | | 7.201 | | | | 02/01/20 | | | | 2,027,999 | |
TNK-BP Finance SA (BBB-/Baa2) |
| | 4,180,000 | | | | 7.875 | | | | 03/13/18 | | | | 4,347,200 | |
| | 1,410,000 | | | | 7.250 | | | | 02/02/20 | | | | 1,410,000 | |
| | | | | | | | | | | | | | | |
| | | | | | | | | | | | | | 17,655,899 | |
| |
| |
Malaysia – 0.7% |
| Petronas Capital Ltd. (A-/A1) |
| | 1,630,000 | | | | 5.250 | | | | 08/12/19 | | | | 1,767,208 | |
| | 2,200,000 | | | | 5.250 | (c) | | | 08/12/19 | | | | 2,385,189 | |
| | | | | | | | | | | | | | | |
| | | | | | | | | | | | | | 4,152,397 | |
| |
| |
Mexico – 2.5% |
Cemex Finance LLC (B/NR)(g) |
| | 660,000 | | | | 9.500 | | | | 12/14/16 | | | | 481,531 | |
| | 1,900,000 | | | | 9.500 | (c) | | | 12/14/16 | | | | 1,386,224 | |
| EUR | 450,000 | | | | 9.625 | (c) | | | 12/14/17 | | | | 412,978 | |
Cemex SAB de CV (B/NR)(a)(c) |
| $ | 1,460,000 | | | | 5.369 | | | | 09/30/15 | | | | 949,014 | |
GEO Maquinaria (NR/NR)(c)(g) |
| | 1,095,875 | | | | 9.625 | | | | 05/02/21 | | | | 931,494 | |
Pemex Project Funding Master Trust (BBB/Baa1)(g) |
| | 386,000 | | | | 5.750 | | | | 03/01/18 | | | | 419,775 | |
| | 6,420,000 | | | | 6.625 | | | | 06/15/35 | | | | 6,869,400 | |
Petroleos Mexicanos (BBB/Baa1)(g) |
| | 512,000 | | | | 8.000 | | | | 05/03/19 | | | | 627,200 | |
| | 3,410,000 | | | | 5.500 | (c) | | | 01/21/21 | | | | 3,580,500 | |
| | | | | | | | | | | | | | | |
| | | | | | | | | | | | | | 15,658,116 | |
| |
| |
Netherlands – 0.4% |
Arcos Dorados Holdings, Inc. (NR/Ba2)(g) |
| | 879,000 | | | | 7.500 | | | | 10/01/19 | | | | 918,109 | |
| Myriad International Holding BV (NR/Baa3) |
| | 310,000 | | | | 6.375 | | | | 07/28/17 | | | | 320,850 | |
VimpelCom Holdings BV (BB/Ba3)(c) |
| | 1,180,000 | | | | 7.504 | | | | 03/01/22 | | | | 961,700 | |
| VimpelCom Holdings BV (NR/Ba3) |
| | 350,000 | | | | 7.504 | | | | 03/01/22 | | | | 278,250 | |
| | | | | | | | | | | | | | | |
| | | | | | | | | | | | | | 2,478,909 | |
| |
| |
Philippines – 0.4% |
| Development Bank of Philippines (BB/NR) |
| | 310,000 | | | | 5.500 | | | | 03/25/21 | | | | 300,700 | |
| Energy Development Corp. (NR/NR) |
| | 1,820,000 | | | | 6.500 | | | | 01/20/21 | | | | 1,738,100 | |
Quezon Power Philippines Ltd. (B+/B1)(g) |
| | 379,500 | | | | 8.860 | | | | 06/15/17 | | | | 409,860 | |
| | | | | | | | | | | | | | | |
| | | | | | | | | | | | | | 2,448,660 | |
| |
| |
Qatar(g) – 0.5% |
| Ras Laffan Liquefied Natural Gas Co. Ltd. II (A/Aa3) |
| | 2,511,420 | | | | 5.298 | | | | 09/30/20 | | | | 2,687,219 | |
Ras Laffan Liquefied Natural Gas Co. Ltd. III (A/Aa3)(c) |
| | 180,000 | | | | 5.500 | | | | 09/30/14 | | | | 194,670 | |
| | | | | | | | | | | | | | | |
| | | | | | | | | | | | | | 2,881,889 | |
| |
| |
South Africa – 1.3% |
Eskom Holdings Ltd. (BBB+/Baa2)(c)(g) |
| | 1,270,000 | | | | 5.750 | | | | 01/26/21 | | | | 1,304,208 | |
Peermont Proprietary Global Ltd. (B-/B3)(g) |
| EUR | 3,670,000 | | | | 7.750 | | | | 04/30/14 | | | | 3,785,999 | |
| Transnet Ltd. (NR/A3) |
| $ | 1,810,000 | | | | 4.500 | (c) | | | 02/10/16 | | | | 1,855,250 | |
| | 1,220,000 | | | | 4.500 | | | | 02/10/16 | | | | 1,250,500 | |
| | | | | | | | | | | | | | | |
| | | | | | | | | | | | | | 8,195,957 | |
| |
| |
South Korea(c) – 0.2% |
| National Agricultural Cooperative Federation (A/A1) |
| | 1,090,000 | | | | 3.500 | | | | 02/08/17 | | | | 1,035,304 | |
| |
| |
Turkey – 0.6% |
| Akbank TAS (NR/Ba1) |
| | 1,930,000 | | | | 5.125 | | | | 07/22/15 | | | | 1,833,500 | |
Turkiye Garanti Bankasi AS (NR/Ba1)(c) |
| | 2,080,000 | | | | 6.250 | | | | 04/20/21 | | | | 1,913,600 | |
| | | | | | | | | | | | | | | |
| | | | | | | | | | | | | | 3,747,100 | |
| |
| |
Ukraine – 0.1% |
| Financing of Infrastructural Projects State Enterprise (NR/B2) |
| | 600,000 | | | | 8.375 | | | | 11/03/17 | | | | 561,060 | |
40 The accompanying notes are an integral part of these financial statements.
GOLDMAN SACHS EMERGING MARKETS DEBT FUND
| | | | | | | | | | | | | | | |
Principal
| | Interest
| | Maturity
| | |
| Amount | | Rate | | Date | | Value |
| |
Corporate Obligations – (continued) |
Ukraine – (continued) |
| | | | | | | | | | | | | | | |
| NAK Naftogaz Ukraine (NR/NR) |
| $ | 310,000 | | | | 9.500 | % | | | 09/30/14 | | | $ | 292,175 | |
| | | | | | | | | | | | | | | |
| | | | | | | | | | | | | | 853,235 | |
| |
| |
United Arab Emirates – 0.7% |
Dolphin Energy Ltd. (NR/A1)(g) |
| | 927,780 | | | | 5.888 | (c) | | | 06/15/19 | | | | 994,116 | |
| | 1,210,532 | | | | 5.888 | | | | 06/15/19 | | | | 1,297,085 | |
Dubai Holding Commercial Operations MTN Ltd. (NR/B3)(a) |
| | 510,000 | | | | 0.629 | | | | 02/01/12 | | | | 478,125 | |
ICICI Bank Ltd. (BBB-/Baa2)(c)(g) |
| | 1,590,000 | | | | 4.750 | | | | 11/25/16 | | | | 1,503,663 | |
| | | | | | | | | | | | | | | |
| | | | | | | | | | | | | | 4,272,989 | |
| |
| |
Venezuela(g) – 1.4% |
| Petroleos de Venezuela SA (B+/NR) |
| | 310,000 | | | | 5.500 | | | | 04/12/37 | | | | 137,950 | |
| | 811,900 | | | | 5.250 | | | | 04/12/17 | | | | 456,694 | |
| | 1,320,000 | | | | 8.500 | | | | 11/02/17 | | | | 864,600 | |
| | 7,160,000 | | | | 8.500 | (c) | | | 11/02/17 | | | | 4,689,800 | |
| | 3,720,000 | | | | 5.375 | | | | 04/12/27 | | | | 1,701,900 | |
| Petroleos de Venezuela SA (NR/NR) |
| | 910,000 | | | | 4.900 | | | | 10/28/14 | | | | 618,800 | |
| | | | | | | | | | | | | | | |
| | | | | | | | | | | | | | 8,469,744 | |
| |
| |
TOTAL CORPORATE OBLIGATIONS |
(Cost $140,637,060) | | $ | 133,053,529 | |
| |
| |
| | | | | | | | | | | | | | | |
| | | | | | | | | | | | | | | |
Structured Note(a) – 1.7% |
Brazil – 1.7% |
| Notas do Tesouro Nacional Series B (Issuer HSBC Corp.) (NR/NR) |
| BRL | 18,674,828 | | | | 0.000 | % | | | 08/15/40 | | | $ | 10,226,428 | |
(Cost $11,245,191) | | | | |
| |
| |
TOTAL INVESTMENTS BEFORE SHORT-TERM INVESTMENT |
(Cost $572,799,722) | | $ | 556,875,795 | |
| |
| |
| | | | | | | | | | | | | | | |
| | | | | | | | | | | | | | | |
Short-term Investment(i) – 7.4% |
Repurchase Agreement – 7.4% |
| Joint Repurchase Agreement Account II |
| $ | 46,100,000 | | | | 0.095 | % | | | 10/03/11 | | | $ | 46,100,000 | |
(Cost $46,100,000) | | | | |
| |
| |
TOTAL INVESTMENTS – 97.4% |
(Cost $618,899,722) | | $ | 602,975,795 | |
| |
| |
OTHER ASSETS IN EXCESS OF LIABILITIES – 2.6% | | | 15,810,783 | |
| |
| |
NET ASSETS – 100.0% | | $ | 618,786,578 | |
| |
| |
The percentage shown for each investment category reflects the value of investments in that category as a percentage of net assets.
| | |
| (a) | | Variable rate security. Interest rate disclosed is that which is in effect at September 30, 2011. |
| |
| (b) | | Coupon increases periodically based upon a predetermined schedule. Stated interest rate in effect at September 30, 2011. |
| |
| (c) | | Exempt from registration under Rule 144A of the Securities Act of 1933. Under procedures approved by the Board of Trustees, such securities have been determined to be liquid by the investment adviser and may be resold, normally to qualified institutional buyers in transactions exempt from registration. Total market value of Rule 144A securities amounts to $112,058,873, which represents approximately 18.1% of net assets as of September 30, 2011. |
| |
| (d) | | Security is currently in default and/or non-income producing. |
| |
| (e) | | All or a portion of security is segregated as collateral for initial margin requirement on futures transactions. |
| |
| (f) | | Pay-in-kind securities. |
| |
| (g) | | Security with “Call” features with resetting interest rates. Maturity dates disclosed are the final maturity dates. |
| |
| (h) | | Security with “Put” features with resetting interest rates. Maturity dates disclosed are the final maturity dates. |
| |
| (i) | | Joint repurchase agreement was entered into on September 30, 2011. Additional information appears on pages 88-89. |
Security ratings disclosed, if any, are obtained from Standard & Poor’s/Moody’s Investor Service. A brief description of the ratings is available in the Fund’s Statement of Additional Information.
| | | | | |
| |
| |
Currency Abbreviations: |
| BRL | | — | | Brazilian Real |
| CNY | | — | | Chinese Yuan |
| COP | | — | | Colombian Peso |
| EUR | | — | | Euro |
| HUF | | — | | Hungarian Forint |
| IDR | | — | | Indonesian Rupiah |
| INR | | — | | Indian Rupee |
| KRW | | — | | South Korean Won |
| MXN | | — | | Mexican Peso |
| MYR | | — | | Malaysian Ringgit |
| PHP | | — | | Philippine Peso |
| PLN | | — | | Polish Zloty |
| RUB | | — | | Russian Ruble |
| SGD | | — | | Singapore Dollar |
| TRY | | — | | Turkish Lira |
| TWD | | — | | Taiwan Dollar |
| ZAR | | — | | South African Rand |
| |
Investment Abbreviations: |
| MTN | | — | | Medium Term Note |
| NR | | — | | Not Rated |
| TIIE | | — | | La Tasa de Interbank Equilibrium Interest Rate |
| |
| |
The accompanying notes are an integral part of these financial statements. 41
GOLDMAN SACHS EMERGING MARKETS DEBT FUND
Schedule of Investments (continued)
September 30, 2011 (Unaudited)
| |
| ADDITIONAL INVESTMENT INFORMATION | |
FORWARD FOREIGN CURRENCY EXCHANGE CONTRACTS — At September 30, 2011, the Fund had outstanding forward foreign currency exchange contracts, both to purchase and sell foreign currencies:
FORWARD FOREIGN CURRENCY EXCHANGE CONTRACTS WITH UNREALIZED GAIN
| | | | | | | | | | | | | |
| | | Contracts to
| | Expiration
| | Current
| | Unrealized
|
| Counterparty | | Buy/Sell | | Date | | Value | | Gain |
| |
| Barclays Bank PLC | | USD/CNY | | 03/01/12 | | $ | 3,191,759 | | | $ | 14,241 | |
| | | USD/CNY | | 05/09/12 | | | 34,280,904 | | | | 116,813 | |
| | | USD/EUR | | 12/21/11 | | | 11,479,973 | | | | 564,267 | |
| | | USD/HUF | | 10/18/11 | | | 1,771,705 | | | | 257,120 | |
| | | USD/INR | | 10/18/11 | | | 3,945,357 | | | | 63,051 | |
| | | USD/KRW | | 10/18/11 | | | 4,670,052 | | | | 299,140 | |
| | | USD/KRW | | 10/31/11 | | | 948,110 | | | | 5,249 | |
| | | USD/PHP | | 10/18/11 | | | 1,499,232 | | | | 37,683 | |
| | | USD/TRY | | 12/21/11 | | | 1,575,877 | | | | 24,123 | |
| | | USD/ZAR | | 12/21/11 | | | 1,463,336 | | | | 142,664 | |
| Citibank NA | | USD/CNY | | 03/01/12 | | | 3,191,258 | | | | 14,742 | |
| | | USD/EUR | | 12/21/11 | | | 4,607,226 | | | | 183,822 | |
| | | USD/INR | | 10/18/11 | | | 4,393,613 | | | | 82,867 | |
| | | USD/INR | | 10/21/11 | | | 1,566,011 | | | | 45,989 | |
| | | USD/KRW | | 10/18/11 | | | 3,691,063 | | | | 381,937 | |
| | | USD/MXN | | 12/21/11 | | | 12,565,735 | | | | 1,262,965 | |
| | | USD/MYR | | 10/11/11 | | | 3,988,344 | | | | 27,656 | |
| | | USD/MYR | | 10/18/11 | | | 2,973,420 | | | | 243,580 | |
| | | USD/TWD | | 10/18/11 | | | 1,422,146 | | | | 558 | |
| | | USD/TWD | | 10/31/11 | | | 1,992,003 | | | | 9,470 | |
| Credit Suisse International (London) | | USD/BRL | | 10/18/11 | | | 2,928,979 | | | | 475,864 | |
| | | USD/RUB | | 10/18/11 | | | 4,441,903 | | | | 414,097 | |
| | | USD/ZAR | | 10/28/11 | | | 13,297,446 | | | | 1,982,507 | |
| Deutsche Bank AG (London) | | USD/CNY | | 03/01/12 | | | 3,211,856 | | | | 19,144 | |
| | | USD/INR | | 10/18/11 | | | 4,394,097 | | | | 461,903 | |
| | | USD/KRW | | 10/18/11 | | | 5,727,697 | | | | 600,303 | |
| HSBC Bank PLC | | USD/BRL | | 10/18/11 | | | 3,192,866 | | | | 518,738 | |
| | | USD/IDR | | 10/06/11 | | | 1,548,293 | | | | 45,158 | |
| | | USD/INR | | 10/18/11 | | | 1,509,399 | | | | 108,601 | |
| JPMorgan Securities, Inc. | | USD/BRL | | 10/18/11 | | | 551,193 | | | | 101,807 | |
| | | USD/CNY | | 10/25/11 | | | 3,204,193 | | | | 13,795 | |
| | | USD/EUR | | 10/13/11 | | | 22,460,311 | | | | 1,677,622 | |
| | | USD/KRW | | 10/31/11 | | | 946,467 | | | | 5,176 | |
| | | USD/MXN | | 12/21/11 | | | 2,407,149 | | | | 351 | |
| | | USD/MYR | | 10/11/11 | | | 791,231 | | | | 14,769 | |
| | | USD/MYR | | 10/18/11 | | | 4,816,557 | | | | 361,443 | |
| | | USD/TWD | | 10/18/11 | | | 7,683,576 | | | | 150,392 | |
| | | USD/TWD | | 10/25/11 | | | 1,568,738 | | | | 43,262 | |
| | | ZAR/USD | | 10/28/11 | | | 1,562,154 | | | | 51,530 | |
| Merrill Lynch International Bank Ltd | | CNY/USD | | 10/25/11 | | | 3,204,193 | | | | 23,193 | |
| Morgan Stanley & Co. | | USD/EUR | | 12/21/11 | | | 1,556,278 | | | | 59,878 | |
| | | ZAR/USD | | 10/28/11 | | | 1,582,006 | | | | 1,346 | |
| Royal Bank of Canada | | USD/MYR | | 10/18/11 | | | 1,501,739 | | | | 112,261 | |
| | | USD/RUB | | 10/18/11 | | | 1,690,238 | | | | 186,762 | |
| State Street Bank | | EUR/PLN | | 12/21/11 | | | 2,205,689 | | | | 63,142 | |
| | | USD/EUR | | 12/21/11 | | | 4,729,103 | | | | 108,845 | |
| | | USD/ZAR | | 12/21/11 | | | 2,724,325 | | | | 41,131 | |
| UBS AG (London) | | USD/BRL | | 10/18/11 | | | 9,241,669 | | | | 1,677,523 | |
| | | USD/RUB | | 10/18/11 | | | 9,229,195 | | | | 994,005 | |
| | | USD/ZAR | | 10/28/11 | | | 3,172,548 | | | | 305,093 | |
| |
| |
TOTAL | | | | | | | | | | $ | 14,397,578 | |
| |
| |
42 The accompanying notes are an integral part of these financial statements.
GOLDMAN SACHS EMERGING MARKETS DEBT FUND
| |
| ADDITIONAL INVESTMENT INFORMATION (continued) | |
FORWARD FOREIGN CURRENCY EXCHANGE CONTRACTS WITH UNREALIZED LOSS
| | | | | | | | | | | | | |
| | | Contracts to
| | Expiration
| | Current
| | Unrealized
|
| Counterparty | | Buy/Sell | | Date | | Value | | Loss |
| |
| Barclays Bank PLC | | CNY/USD | | 03/01/12 | | $ | 4,781,040 | | | $ | (61,960 | ) |
| | | EUR/USD | | 12/21/11 | | | 3,083,091 | | | | (35,106 | ) |
| | | INR/USD | | 10/18/11 | | | 5,088,051 | | | | (390,153 | ) |
| | | INR/USD | | 10/21/11 | | | 1,566,011 | | | | (3,667 | ) |
| | | KRW/USD | | 10/18/11 | | | 2,994,853 | | | | (363,056 | ) |
| | | KRW/USD | | 10/31/11 | | | 1,532,908 | | | | (26,092 | ) |
| | | MXN/EUR | | 12/21/11 | | | 1,504,045 | | | | (57,659 | ) |
| | | MXN/USD | | 11/29/11 | | | 10,038,944 | | | | (266,907 | ) |
| | | MXN/USD | | 12/21/11 | | | 1,525,058 | | | | (86,942 | ) |
| | | PLN/EUR | | 12/21/11 | | | 774,121 | | | | (31,962 | ) |
| | | RUB/USD | | 10/18/11 | | | 576,406 | | | | (57,594 | ) |
| | | TWD/USD | | 10/18/11 | | | 9,105,722 | | | | (574,585 | ) |
| Citibank NA | | CNY/USD | | 05/09/12 | | | 11,569,037 | | | | (93,233 | ) |
| | | IDR/USD | | 10/06/11 | | | 1,548,293 | | | | (65,707 | ) |
| | | IDR/USD | | 10/18/11 | | | 1,523,546 | | | | (94,454 | ) |
| | | INR/USD | | 10/18/11 | | | 768,548 | | | | (2,452 | ) |
| | | KRW/USD | | 10/18/11 | | | 7,104,184 | | | | (774,816 | ) |
| | | MYR/USD | | 10/18/11 | | | 9,649,430 | | | | (631,955 | ) |
| | | RUB/USD | | 10/18/11 | | | 7,686,970 | | | | (792,030 | ) |
| | | TWD/USD | | 10/25/11 | | | 1,568,738 | | | | (7,034 | ) |
| | | USD/CNY | | 10/25/11 | | | 3,225,435 | | | | (1,435 | ) |
| | | USD/KRW | | 10/18/11 | | | 2,409,846 | | | | (2,846 | ) |
| | | ZAR/USD | | 10/28/11 | | | 4,371,837 | | | | (599,104 | ) |
| Credit Suisse International (London) | | MXN/USD | | 12/21/11 | | | 1,439,651 | | | | (186,349 | ) |
| | | RUB/USD | | 10/18/11 | | | 5,499,708 | | | | (810,292 | ) |
| Deutsche Bank AG (London) | | INR/USD | | 10/18/11 | | | 6,938,117 | | | | (649,464 | ) |
| | | MXN/USD | | 12/21/11 | | | 1,439,709 | | | | (186,291 | ) |
| | | MYR/USD | | 10/18/11 | | | 6,685,391 | | | | (411,341 | ) |
| | | USD/MXN | | 12/21/11 | | | 2,417,491 | | | | (9,991 | ) |
| | | ZAR/USD | | 12/21/11 | | | 1,218,011 | | | | (154,651 | ) |
| HSBC Bank PLC | | BRL/USD | | 10/18/11 | | | 1,364,493 | | | | (231,507 | ) |
| | | CNY/USD | | 03/01/12 | | | 8,981,521 | | | | (112,800 | ) |
| | | CNY/USD | | 05/09/12 | | | 11,522,983 | | | | (70,083 | ) |
| | | IDR/USD | | 10/18/11 | | | 1,513,569 | | | | (77,029 | ) |
| | | MXN/USD | | 12/21/11 | | | 1,457,419 | | | | (163,581 | ) |
| | | MYR/USD | | 10/18/11 | | | 1,842,375 | | | | (115,625 | ) |
| | | PHP/USD | | 10/18/11 | | | 1,499,232 | | | | (23,266 | ) |
| | | TWD/USD | | 10/31/11 | | | 1,992,003 | | | | (18,037 | ) |
| JPMorgan Securities, Inc. | | BRL/USD | | 10/18/11 | | | 1,372,262 | | | | (211,738 | ) |
| | | CNY/USD | | 03/01/12 | | | 3,196,912 | | | | (41,431 | ) |
| | | HUF/USD | | 12/21/11 | | | 1,778,425 | | | | (209,023 | ) |
| | | KRW/USD | | 10/18/11 | | | 4,170,394 | | | | (483,243 | ) |
| | | PLN/EUR | | 12/21/11 | | | 1,540,206 | | | | (76,676 | ) |
| | | TRY/USD | | 12/21/11 | | | 1,585,664 | | | | (19,336 | ) |
| | | ZAR/USD | | 10/28/11 | | | 2,085,620 | | | | (315,912 | ) |
| | | ZAR/USD | | 12/21/11 | | | 1,409,827 | | | | (216,173 | ) |
| Morgan Stanley & Co. | | CNY/USD | | 05/09/12 | | | 11,522,983 | | | | (88,298 | ) |
| | | MYR/USD | | 10/18/11 | | | 483,705 | | | | (9,295 | ) |
| Royal Bank of Canada | | INR/USD | | 10/18/11 | | | 1,447,751 | | | | (154,249 | ) |
| State Street Bank | | EUR/USD | | 12/21/11 | | | 5,654,566 | | | | (49,435 | ) |
| | | KRW/USD | | 10/18/11 | | | 9,680,980 | | | | (671,061 | ) |
| | | MXN/USD | | 12/21/11 | | | 2,593,883 | | | | (75,117 | ) |
| | | ZAR/USD | | 12/21/11 | | | 1,228,541 | | | | (55,467 | ) |
| UBS AG (London) | | RUB/USD | | 10/18/11 | | | 1,464,213 | | | | (161,787 | ) |
| |
| |
TOTAL | | | | | | | | | | $ | (11,079,297 | ) |
| |
| |
The accompanying notes are an integral part of these financial statements. 43
GOLDMAN SACHS EMERGING MARKETS DEBT FUND
Schedule of Investments (continued)
September 30, 2011 (Unaudited)
| |
| ADDITIONAL INVESTMENT INFORMATION (continued) | |
FUTURES CONTRACTS — At September 30, 2011, the following futures contracts were open:
| | | | | | | | | | | | | | | |
| | | Number of
| | | | | | |
| | | Contracts
| | Expiration
| | Current
| | Unrealized
|
| Type | | Long (Short) | | Date | | Value | | Gain (Loss) |
| |
| Ultra Long U.S. Treasury Bonds | | | (99 | ) | | December 2011 | | $ | (15,703,875 | ) | | $ | (1,421,113 | ) |
| 2 Year U.S. Treasury Notes | | | 110 | | | December 2011 | | | 24,222,344 | | | | (33,131 | ) |
| 5 Year U.S. Treasury Notes | | | 775 | | | December 2011 | | | 94,925,391 | | | | (12,283 | ) |
| 10 Year U.S. Treasury Notes | | | 159 | | | December 2011 | | | 20,684,906 | | | | 168,397 | |
| 30 Year U.S. Treasury Bonds | | | 20 | | | December 2011 | | | 2,852,500 | | | | 70,279 | |
| |
| |
TOTAL | | | | | | | | | | | | $ | (1,227,851 | ) |
| |
| |
SWAP CONTRACTS — At September 30, 2011, the Fund had outstanding swap contracts with the following terms:
INTEREST RATE SWAP CONTRACTS
| | | | | | | | | | | | | | | | | | | |
| | | | | | | Rates Exchanged | | |
| | | Notional
| | | | Payments
| | Payments
| | |
| | | Amount
| | Termination
| | Received by
| | Made by
| | Unrealized
|
| Counterparty | | (000s) | | Date | | the Fund | | the Fund | | Gain (Loss)* |
| |
| Bank of America Securities LLC | | MXN | 244,110 | | | 09/16/13 | | | 4.700 | % | | | Mexico Interbank TIIE 28 Days | | | $ | (70,768 | ) |
| Deutsche Bank Securities, Inc. | | | 176,730 | | | 09/09/13 | | | 4.570 | | | | Mexico Interbank TIIE 28 Days | | | | (82,467 | ) |
| JPMorgan Securities, Inc. | | | 25,060 | | | 08/05/21 | | | 6.250 | | | | Mexico Interbank TIIE 28 Days | | | | (77,090 | ) |
| |
| |
TOTAL | | | | | | | | | | | | | | | | $ | (230,325 | ) |
| |
| |
| | |
| * | | There are no upfront payments on the swap contract(s), therefore the unrealized gain/loss of the swap contract(s) is equal to their market value. |
CREDIT DEFAULT SWAP CONTRACTS
| | | | | | | | | | | | | | | | | | | | | | | | | | | | | |
| | | | | | | | | | | Credit
| | | | | | |
| | | | | | | Rates
| | | | Spread at
| | | | Upfront
| | |
| | | | | Notional
| | Received
| | | | September 30,
| | | | Payments
| | |
| | | Referenced
| | Amount
| | (Paid) by
| | Termination
| | 2011
| | Market
| | Made (Received)
| | Unrealized
|
| Counterparty | | Obligation | | (000s) | | Fund | | Date | | (Basis Points)(a) | | Value | | by the Fund | | Gain (Loss) |
| |
Protection Sold: | | | | | | | | | | | | | | | | | | | | | | | | | | | | |
Bank of America
Securities LLC | | Ukraine Government
6.75%, 11/14/17 | | $ | 3,070 | | | | 5.000 | % | | 03/20/16 | | | 898 | | | $ | (402,895 | ) | | $ | 69,250 | | | $ | (472,145 | ) |
Deutsche Bank
Securities, Inc. | | Ukraine Government
6.75%, 11/14/17 | | | 1,650 | | | | 5.000 | | | 12/20/16 | | | 898 | | | | (244,179 | ) | | | (114,559 | ) | | | (129,620 | ) |
| |
| |
TOTAL | | | | | | | | | | | | | | | | | | $ | (647,074 | ) | | $ | (45,309 | ) | | $ | (601,765 | ) |
| |
| |
| | |
| (a) | | Credit spread on the Referenced Obligation, together with the term of the swap contract, are indicators of payment/performance risk. The likelihood of a credit event occurring which would require a fund to make a payment or otherwise be required to perform under swap contract is generally greater as the credit spread and the term of the swap contract increase. |
44 The accompanying notes are an integral part of these financial statements.
GOLDMAN SACHS EMERGING MARKETS DEBT FUND
| |
| ADDITIONAL INVESTMENT INFORMATION (continued) | |
NON-DELIVERABLE BOND FORWARD CONTRACTS*
| | | | | | | | | | | | | | | |
| | | Notional
| | | | | | |
| | | Amount
| | Referenced
| | Settlement
| | Unrealized
|
| Counterparty | | (000s) | | Obligation | | Date | | Gain (Loss) |
| |
| Deutsche Bank Securities, Inc. | | COP | 5,526,000 | | | Titulos de Tesoreia
10.000% 7/24/24 | | | 10/28/11 | | | $ | 26,428 | |
| | | | 2,442,000 | | | Titulos de Tesoreia
10.000% 7/24/24 | | | 10/31/11 | | | | 11,830 | |
| |
| |
TOTAL | | | | | | | | | | | | $ | 38,258 | |
| |
| |
| | |
| * | | Represents a short term forward contract to purchase the referenced obligation denominated in a non-deliverable foreign currency. |
The accompanying notes are an integral part of these financial statements. 45
GOLDMAN SACHS HIGH YIELD FUND
Schedule of Investments
September 30, 2011 (Unaudited)
| | | | | | | | | | | | | | | |
Principal
| | Interest
| | Maturity
| | |
| Amount | | Rate | | Date | | Value |
| |
Corporate Obligations – 89.9% |
Aerospace – 0.6% |
| Spirit AeroSystems, Inc. (BB-/Ba3) |
| $ | 3,000,000 | | | | 7.500 | % | | | 10/01/17 | | | $ | 3,105,000 | |
| | 4,900,000 | | | | 6.750 | | | | 12/15/20 | | | | 4,887,750 | |
| TransDigm, Inc. (B-/B3) |
| | 17,750,000 | | | | 7.750 | | | | 12/15/18 | | | | 18,060,625 | |
| | | | | | | | | | | | | | | |
| | | | | | | | | | | | | | 26,053,375 | |
| |
| |
Airlines(a) – 0.4% |
| Air Canada (B+/B1) |
| | 16,475,000 | | | | 9.250 | | | | 08/01/15 | | | | 15,651,250 | |
| |
| |
Automotive – 2.6% |
Chrysler Group LLC/CG Co-Issuer, Inc. (B/B2)(a) |
| | 11,000,000 | | | | 8.000 | | | | 06/15/19 | | | | 8,607,500 | |
| | 19,750,000 | | | | 8.250 | | | | 06/15/21 | | | | 15,256,875 | |
| Ford Motor Co. (BB-/Ba3) |
| | 1,750,000 | | | | 6.625 | | | | 10/01/28 | | | | 1,710,625 | |
| | 26,500,000 | | | | 7.450 | | | | 07/16/31 | | | | 29,150,000 | |
| Ford Motor Credit Co. LLC (BB-/Ba2) |
| | 19,750,000 | | | | 7.000 | | | | 04/15/15 | | | | 20,638,750 | |
| | 8,000,000 | | | | 12.000 | | | | 05/15/15 | | | | 9,520,000 | |
| | 10,000,000 | | | | 8.000 | | | | 12/15/16 | | | | 10,900,000 | |
| | 11,125,000 | | | | 6.625 | | | | 08/15/17 | | | | 11,570,000 | |
| | 4,100,000 | | | | 5.875 | | | | 08/02/21 | | | | 4,079,500 | |
General Motors Liquidation Co. (NR/WR)(b) |
| | 7,125,000 | | | | 7.125 | | | | 07/15/13 | | | | — | |
| | 2,000,000 | | | | 7.700 | | | | 04/15/16 | | | | — | |
| | 1,000,000 | | | | 8.800 | | | | 03/01/21 | | | | — | |
| | 14,500,000 | | | | 8.375 | | | | 07/15/33 | | | | — | |
Jaguar Land Rover PLC (B+/B1)(a) |
| | 5,200,000 | | | | 8.125 | | | | 05/15/21 | | | | 4,638,977 | |
| | | | | | | | | | | | | | | |
| | | | | | | | | | | | | | 116,072,227 | |
| |
| |
Automotive Parts – 2.2% |
| Accuride Corp. (B/B2) |
| | 2,000,000 | | | | 9.500 | | | | 08/01/18 | | | | 2,020,000 | |
Allison Transmission, Inc. (CCC+/Caa1)(a) |
| | 7,375,000 | | | | 7.125 | | | | 05/15/19 | | | | 6,785,000 | |
American Axle & Manufacturing Holdings, Inc. (BB/Ba1)(a) |
| | 9,000,000 | | | | 9.250 | | | | 01/15/17 | | | | 9,405,000 | |
| American Tire Distributors Holdings, Inc. (B-/B2) |
| | 6,625,000 | | | | 9.750 | | | | 06/01/17 | | | | 6,707,813 | |
| ArvinMeritor, Inc. (CCC+/B3) |
| | 10,750,000 | | | | 10.625 | | | | 03/15/18 | | | | 10,642,500 | |
| ATU Auto-Teile-Unger Handels GmbH & Co., KG (B-/B3) |
| EUR | 8,625,000 | | | | 11.000 | | | | 05/15/14 | | | | 9,013,167 | |
| Exide Technologies (B/B2) |
| $ | 4,000,000 | | | | 8.625 | | | | 02/01/18 | | | | 3,710,000 | |
| Navistar International Corp. (BB-/B1) |
| | 14,025,000 | | | | 8.250 | | | | 11/01/21 | | | | 14,375,625 | |
Pinafore LLC/Pinafore, Inc. (B+/B1)(a) |
| | 9,756,000 | | | | 9.000 | | | | 10/01/18 | | | | 9,951,120 | |
Pittsburgh Glass Works LLC (B+/B2)(a) |
| | 3,250,000 | | | | 8.500 | | | | 04/15/16 | | | | 2,973,750 | |
| Tenneco, Inc. (BB-/B2) |
| | 3,750,000 | | | | 7.750 | | | | 08/15/18 | | | | 3,843,750 | |
| | 7,500,000 | | | | 6.875 | | | | 12/15/20 | | | | 7,368,750 | |
| The Goodyear Tire & Rubber Co. (B+/B1) |
| | 9,250,000 | | | | 8.750 | | | | 08/15/20 | | | | 9,435,000 | |
| UCI International, Inc. (CCC+/B3) |
| | 2,250,000 | | | | 8.625 | | | | 02/15/19 | | | | 2,086,875 | |
| | | | | | | | | | | | | | | |
| | | | | | | | | | | | | | 98,318,350 | |
| |
| |
Beverages(a) – 0.0% |
| Pernod-Ricard SA (BBB-/Baa3) |
| | 350,000 | | | | 5.750 | | | | 04/07/21 | | | | 385,546 | |
| |
| |
Building Materials – 0.6% |
| Grohe Holding GmbH (CCC/B3) |
| EUR | 5,500,000 | | | | 8.625 | | | | 10/01/14 | | | | 6,189,599 | |
| Headwaters, Inc. (B+/B2) |
| $ | 4,625,000 | | | | 7.625 | | | | 04/01/19 | | | | 3,607,500 | |
| PLY Gem Industries, Inc. (B-/Caa1) |
| | 7,000,000 | | | | 8.250 | | | | 02/15/18 | | | | 5,950,000 | |
Roofing Supply Group LLC/Roofing Supply Finance, Inc. (B+/B2)(a) |
| | 6,250,000 | | | | 8.625 | | | | 12/01/17 | | | | 6,000,000 | |
USG Corp. (BB-/B2)(a) |
| | 5,250,000 | | | | 9.750 | | | | 08/01/14 | | | | 4,921,875 | |
| | | | | | | | | | | | | | | |
| | | | | | | | | | | | | | 26,668,974 | |
| |
| |
Capital Goods – 1.7% |
| Altra Holdings, Inc. (BB-/B1) |
| | 5,000,000 | | | | 8.125 | | | | 12/01/16 | | | | 5,087,500 | |
Amsted Industries, Inc. (BB-/B1)(a) |
| | 6,000,000 | | | | 8.125 | | | | 03/15/18 | | | | 6,195,000 | |
Dynacast International LLC/Dynacast Finance, Inc. (B/B2)(a) |
| | 2,750,000 | | | | 9.250 | | | | 07/15/19 | | | | 2,578,125 | |
| Mueller Water Products, Inc. (B+/B2) |
| | 530,000 | | | | 8.750 | | | | 09/01/20 | | | | 524,700 | |
| Mueller Water Products, Inc. (CCC+/Caa2) |
| | 10,000,000 | | | | 7.375 | | | | 06/01/17 | | | | 8,200,000 | |
| RBS Global, Inc./Rexnord LLC (B-/Caa1) |
| | 15,750,000 | | | | 8.500 | | | | 05/01/18 | | | | 15,041,250 | |
| RBS Global, Inc./Rexnord LLC (CCC+/Caa2) |
| | 17,500,000 | | | | 11.750 | | | | 08/01/16 | | | | 17,762,500 | |
| Terex Corp. (B/Caa1) |
| | 7,250,000 | | | | 8.000 | | | | 11/15/17 | | | | 6,398,125 | |
| Terex Corp. (BB-/B2) |
| | 12,375,000 | | | | 10.875 | | | | 06/01/16 | | | | 13,117,500 | |
| Thermadyne Holdings Corp. (B-/B3) |
| | 2,000,000 | | | | 9.000 | | | | 12/15/17 | | | | 2,030,000 | |
| | | | | | | | | | | | | | | |
| | | | | | | | | | | | | | 76,934,700 | |
| |
| |
Chemicals – 2.5% |
| Hexion U.S. Finance Corp./Hexion Nova Scotia Finance ULC (CCC+/B3) |
| | 6,750,000 | | | | 8.875 | | | | 02/01/18 | | | | 5,535,000 | |
| Huntsman International LLC (B/B3) |
| | 3,000,000 | | | | 8.625 | | | | 03/15/20 | | | | 2,842,500 | |
| | 15,750,000 | | | | 8.625 | | | | 03/15/21 | | | | 14,923,125 | |
| Kraton Polymers LLC/Kraton Polymers Capital Corp. (B+/B2) |
| | 5,000,000 | | | | 6.750 | | | | 03/01/19 | | | | 4,412,500 | |
46 The accompanying notes are an integral part of these financial statements.
GOLDMAN SACHS HIGH YIELD FUND
| | | | | | | | | | | | | | | |
Principal
| | Interest
| | Maturity
| | |
| Amount | | Rate | | Date | | Value |
| |
Corporate Obligations – (continued) |
Chemicals – (continued) |
| | | | | | | | | | | | | | | |
| Lyondell Chemical Co. (BB+/Ba1) |
| $ | 808,000 | | | | 8.000 | %(a) | | | 11/01/17 | | | $ | 870,620 | |
| EUR | 2,018,250 | | | | 8.000 | | | | 11/01/17 | | | | 2,824,727 | |
| Lyondell Chemical Co. (BB-/Ba3) |
| $ | 10,894,086 | | | | 11.000 | | | | 05/01/18 | | | | 11,738,378 | |
MacDermid, Inc. (CCC+/Caa1)(a) |
| | 7,750,000 | | | | 9.500 | | | | 04/15/17 | | | | 7,168,750 | |
| Nalco Co. (BB-/Ba2) |
| EUR | 2,375,000 | | | | 6.875 | | | | 01/15/19 | | | | 3,436,770 | |
| Omnova Solutions, Inc. (B-/B2) |
| $ | 12,625,000 | | | | 7.875 | | | | 11/01/18 | | | | 10,163,125 | |
OXEA Finance/Cy SCA (B+/B2)(a) |
| | 4,630,000 | | | | 9.500 | | | | 07/15/17 | | | | 4,479,525 | |
Polymer Group, Inc. (B/B1)(a) |
| | 5,050,000 | | | | 7.750 | | | | 02/01/19 | | | | 5,037,375 | |
| Polypore International, Inc. (B/B3) |
| | 9,375,000 | | | | 7.500 | | | | 11/15/17 | | | | 9,328,125 | |
| Rockwood Specialties Group, Inc. (B+/B1) |
| EUR | 21,810,000 | | | | 7.625 | | | | 11/15/14 | | | | 28,635,545 | |
| | | | | | | | | | | | | | | |
| | | | | | | | | | | | | | 111,396,065 | |
| |
| |
Conglomerates – 0.5% |
| Park-Ohio Industries, Inc. (CCC+/B3) |
| $ | 12,750,000 | | | | 8.125 | | | | 04/01/21 | | | | 11,921,250 | |
| TriMas Corp. (B-/B2) |
| | 9,000,000 | | | | 9.750 | | | | 12/15/17 | | | | 9,315,000 | |
| | | | | | | | | | | | | | | |
| | | | | | | | | | | | | | 21,236,250 | |
| |
| |
Construction Machinery – 0.6% |
| Case New Holland, Inc. (BB+/Ba2) |
| | 8,900,000 | | | | 7.875 | | | | 12/01/17 | | | | 9,500,750 | |
| CNH America LLC (BB+/Ba2) |
| | 953,000 | | | | 7.250 | | | | 01/15/16 | | | | 986,355 | |
Dematic SA (B/B3)(a) |
| | 12,100,000 | | | | 8.750 | | | | 05/01/16 | | | | 11,249,747 | |
| The Manitowoc Co., Inc. (B+/B3) |
| | 5,875,000 | | | | 8.500 | | | | 11/01/20 | | | | 5,493,125 | |
| | | | | | | | | | | | | | | |
| | | | | | | | | | | | | | 27,229,977 | |
| |
| |
Consumer Products – Household & Leisure – 1.6% |
| Affinion Group Holdings, Inc. (B-/Caa1) |
| | 5,375,000 | | | | 11.625 | | | | 11/15/15 | | | | 4,273,125 | |
| Affinion Group, Inc. (B-/B3) |
| | 18,750,000 | | | | 7.875 | | | | 12/15/18 | | | | 14,531,250 | |
Armored Autogroup, Inc. (CCC+/Caa1)(a) |
| | 10,875,000 | | | | 9.250 | | | | 11/01/18 | | | | 9,053,437 | |
| Easton-Bell Sports, Inc. (B-/B2) |
| | 5,500,000 | | | | 9.750 | | | | 12/01/16 | | | | 5,795,625 | |
| Elizabeth Arden, Inc. (B+/B1) |
| | 4,250,000 | | | | 7.375 | | | | 03/15/21 | | | | 4,239,375 | |
| Jarden Corp. (B/B2) |
| | 8,375,000 | | | | 7.500 | | | | 05/01/17 | | | | 8,584,375 | |
| | 1,250,000 | | | | 7.500 | | | | 01/15/20 | | | | 1,268,750 | |
| Jarden Corp. (BB-/Ba3) |
| | 2,375,000 | | | | 8.000 | | | | 05/01/16 | | | | 2,493,750 | |
| Spectrum Brands Holdings, Inc. (B/B1) |
| | 10,250,000 | | | | 9.500 | | | | 06/15/18 | | | | 10,865,000 | |
Spectrum Brands Holdings, Inc. (CCC+/B3)(c) |
| | 5,085,308 | | | | 12.000 | | | | 08/28/19 | | | | 5,492,133 | |
| Visant Corp. (B-/Caa1) |
| | 6,000,000 | | | | 10.000 | | | | 10/01/17 | | | | 5,580,000 | |
| | | | | | | | | | | | | | | |
| | | | | | | | | | | | | | 72,176,820 | |
| |
| |
Consumer Products – Industrial – 0.1% |
| Interline Brands, Inc. (BB-/B2) |
| | 2,500,000 | | | | 7.000 | | | | 11/15/18 | | | | 2,437,500 | |
| |
| |
Consumer Products – Non Durable – 0.9% |
| Constellation Brands, Inc. (BB+/Ba2) |
| | 3,875,000 | | | | 8.375 | | | | 12/15/14 | | | | 4,233,437 | |
| | 7,500,000 | | | | 7.250 | | | | 05/15/17 | | | | 7,856,250 | |
| Prestige Brands, Inc. (B/B3) |
| | 6,000,000 | | | | 8.250 | | | | 04/01/18 | | | | 6,180,000 | |
| Sally Holdings LLC (B+/B3) |
| | 16,000,000 | | | | 10.500 | | | | 11/15/16 | | | | 16,680,000 | |
| Sally Holdings LLC (BB/B2) |
| | 5,000,000 | | | | 9.250 | | | | 11/15/14 | | | | 5,100,000 | |
| | | | | | | | | | | | | | | |
| | | | | | | | | | | | | | 40,049,687 | |
| |
| |
Defense – 0.7% |
ADS Tactical, Inc. (B/B3)(a) |
| | 10,006,000 | | | | 11.000 | | | | 04/01/18 | | | | 9,780,865 | |
| DynCorp International, Inc. (B-/B2) |
| | 1,750,000 | | | | 10.375 | | | | 07/01/17 | | | | 1,522,500 | |
Huntington Ingalls Industries, Inc. (B+/Ba3)(a) |
| | 4,000,000 | | | | 6.875 | | | | 03/15/18 | | | | 3,720,000 | |
| L-3 Communications Corp. (BB+/Ba1) |
| | 14,625,000 | | | | 6.375 | | | | 10/15/15 | | | | 14,880,938 | |
| | | | | | | | | | | | | | | |
| | | | | | | | | | | | | | 29,904,303 | |
| |
| |
Emerging Markets(a) – 0.8% |
| Cemex Finance LLC (B/NR) |
| | 9,327,000 | | | | 9.500 | | | | 12/14/16 | | | | 6,804,902 | |
| Digicel Group Ltd. (NR/Caa1) |
| | 18,500,000 | | | | 8.875 | | | | 01/15/15 | | | | 17,390,000 | |
| | 5,071,000 | | | | 9.125 | | | | 01/15/15 | | | | 4,792,095 | |
| | 6,500,000 | | | | 10.500 | | | | 04/15/18 | | | | 6,370,000 | |
| | | | | | | | | | | | | | | |
| | | | | | | | | | | | | | 35,356,997 | |
| |
| |
Energy – Coal – 1.0% |
Arch Coal, Inc. (B+/B1)(a) |
| | 13,400,000 | | | | 7.000 | | | | 06/15/19 | | | | 12,730,000 | |
Foresight Energy LLC/Foresight Energy Corp. (B/Caa1)(a) |
| | 11,400,000 | | | | 9.625 | | | | 08/15/17 | | | | 11,343,000 | |
| Peabody Energy Corp. (BB+/Ba1) |
| | 2,500,000 | | | | 7.375 | | | | 11/01/16 | | | | 2,737,500 | |
| | 3,800,000 | | | | 6.500 | | | | 09/15/20 | | | | 3,971,000 | |
| Penn Virginia Resource Partners LP/Penn Virginia Resource Finance Corp. (B/B2) |
| | 6,000,000 | | | | 8.250 | | | | 04/15/18 | | | | 5,700,000 | |
SunCoke Energy, Inc. (B+/B1)(a) |
| | 6,250,000 | | | | 7.625 | | | | 08/01/19 | | | | 6,109,375 | |
| | | | | | | | | | | | | | | |
| | | | | | | | | | | | | | 42,590,875 | |
| |
| |
The accompanying notes are an integral part of these financial statements. 47
GOLDMAN SACHS HIGH YIELD FUND
Schedule of Investments (continued)
September 30, 2011 (Unaudited)
| | | | | | | | | | | | | | | |
Principal
| | Interest
| | Maturity
| | |
| Amount | | Rate | | Date | | Value |
| |
Corporate Obligations – (continued) |
| | | | | | | | | | | | | | | |
Energy – Exploration & Production – 7.0% |
Antero Resources Finance Corp. (B/B3)(a) |
| $ | 5,000,000 | | | | 7.250 | % | | | 08/01/19 | | | $ | 4,812,500 | |
| BreitBurn Energy Partners LP (B/B3) |
| | 7,650,000 | | | | 8.625 | | | | 10/15/20 | | | | 7,344,000 | |
| Brigham Exploration Co. (CCC+/Caa1) |
| | 4,500,000 | | | | 6.875 | | | | 06/01/19 | | | | 4,432,500 | |
| Chaparral Energy, Inc. (B-/Caa1) |
| | 4,250,000 | | | | 9.875 | | | | 10/01/20 | | | | 4,228,750 | |
| | 6,050,000 | | | | 8.250 | | | | 09/01/21 | | | | 5,475,250 | |
| Chesapeake Energy Corp. (BB+/Ba3) |
| | 10,250,000 | | | | 9.500 | | | | 02/15/15 | | | | 11,531,250 | |
| | 12,000,000 | | | | 7.250 | | | | 12/15/18 | | | | 12,780,000 | |
| | 2,000,000 | | | | 6.625 | | | | 08/15/20 | | | | 2,060,000 | |
| | 5,450,000 | | | | 6.875 | | | | 11/15/20 | | | | 5,695,250 | |
| | 3,750,000 | | | | 6.125 | | | | 02/15/21 | | | | 3,778,125 | |
| | 10,000,000 | | | | 2.500 | (d) | | | 05/15/37 | | | | 9,550,250 | |
| Concho Resources, Inc. (BB/B3) |
| | 1,700,000 | | | | 8.625 | | | | 10/01/17 | | | | 1,797,750 | |
| | 8,300,000 | | | | 6.500 | | | | 01/15/22 | | | | 8,051,000 | |
| CONSOL Energy, Inc. (BB/B1) |
| | 7,750,000 | | | | 8.000 | | | | 04/01/17 | | | | 8,137,500 | |
| | 6,875,000 | | | | 8.250 | | | | 04/01/20 | | | | 7,253,125 | |
| | 2,500,000 | | | | 6.375 | (a) | | | 03/01/21 | | | | 2,412,500 | |
| Continental Resources, Inc. (BB/B1) |
| | 3,625,000 | | | | 7.375 | | | | 10/01/20 | | | | 3,751,875 | |
| Copano Energy LLC/Copano Energy Finance Corp. (B+/B1) |
| | 4,875,000 | | | | 7.125 | | | | 04/01/21 | | | | 4,826,250 | |
| Denbury Resources, Inc. (BB-/B1) |
| | 1,375,000 | | | | 9.750 | | | | 03/01/16 | | | | 1,485,000 | |
| | 3,500,000 | | | | 6.375 | | | | 08/15/21 | | | | 3,377,500 | |
Eagle Rock Energy Partners LP/Eagle Rock Energy Finance Corp. (B-/B3)(a) |
| | 9,500,000 | | | | 8.375 | | | | 06/01/19 | | | | 9,025,000 | |
| Encore Acquisition Co. (NR/B1) |
| | 3,250,000 | | | | 9.500 | | | | 05/01/16 | | | | 3,518,125 | |
| Energy Partners Ltd. (B-/Caa1) |
| | 5,858,000 | | | | 8.250 | | | | 02/15/18 | | | | 5,316,135 | |
EV Energy Partners LP (B-/B3)(a) |
| | 5,700,000 | | | | 8.000 | | | | 04/15/19 | | | | 5,557,500 | |
| Forest Oil Corp. (B/B1) |
| | 5,000,000 | | | | 7.250 | | | | 06/15/19 | | | | 4,912,500 | |
| Key Energy Services, Inc. (BB-/B1) |
| | 4,125,000 | | | | 6.750 | | | | 03/01/21 | | | | 3,970,313 | |
Laredo Petroleum, Inc. (CCC+/Caa2)(a) |
| | 10,250,000 | | | | 9.500 | | | | 02/15/19 | | | | 10,762,500 | |
| Linn Energy LLC/Linn Energy Finance Corp. (B/B2) |
| | 6,650,000 | | | | 6.500 | (a) | | | 05/15/19 | | | | 6,267,625 | |
| | 5,000,000 | | | | 8.625 | | | | 04/15/20 | | | | 5,125,000 | |
| | 16,300,000 | | | | 7.750 | | | | 02/01/21 | | | | 16,137,000 | |
| Newfield Exploration Co. (BB+/Ba2) |
| | 6,500,000 | | | | 6.875 | | | | 02/01/20 | | | | 6,760,000 | |
| Newfield Exploration Co. (BBB-/Ba1) |
| | 7,800,000 | | | | 5.750 | | | | 01/30/22 | | | | 7,712,250 | |
NFR Energy LLC/NFR Energy Finance Corp. (B-/Caa1)(a) |
| | 12,500,000 | | | | 9.750 | | | | 02/15/17 | | | | 11,000,000 | |
Oasis Petroleum, Inc. (B-/Caa1)(a) |
| | 3,000,000 | | | | 7.250 | | | | 02/01/19 | | | | 2,932,500 | |
| Pioneer Drilling Co. (B/NR) |
| | 6,367,000 | | | | 9.875 | | | | 03/15/18 | | | | 6,621,680 | |
| Pioneer Natural Resources Co. (BB+/Ba1) |
| | 4,000,000 | | | | 6.650 | | | | 03/15/17 | | | | 4,280,000 | |
| | 750,000 | | | | 6.875 | | | | 05/01/18 | | | | 802,500 | |
| Plains Exploration & Production Co. (BB-/B1) |
| | 8,250,000 | | | | 7.750 | | | | 06/15/15 | | | | 8,497,500 | |
| | 2,250,000 | | | | 10.000 | | | | 03/01/16 | | | | 2,458,125 | |
| | 9,000,000 | | | | 7.000 | | | | 03/15/17 | | | | 8,977,500 | |
| | 5,000,000 | | | | 7.625 | | | | 06/01/18 | | | | 5,112,500 | |
| | 5,000,000 | | | | 8.625 | | | | 10/15/19 | | | | 5,375,000 | |
| | 7,250,000 | | | | 7.625 | | | | 04/01/20 | | | | 7,458,437 | |
| | 4,000,000 | | | | 6.625 | | | | 05/01/21 | | | | 3,880,000 | |
Precision Drilling Corp. (BB+/Ba1)(a) |
| | 2,150,000 | | | | 6.500 | | | | 12/15/21 | | | | 2,112,375 | |
| Range Resources Corp. (BB/Ba3) |
| | 8,625,000 | | | | 8.000 | | | | 05/15/19 | | | | 9,422,812 | |
| SandRidge Energy, Inc. (B-/B3) |
| | 2,886,000 | | | | 9.875 | (a) | | | 05/15/16 | | | | 3,030,300 | |
| | 6,925,000 | | | | 8.000 | (a) | | | 06/01/18 | | | | 6,613,375 | |
| | 3,250,000 | | | | 8.750 | | | | 01/15/20 | | | | 3,217,500 | |
| | 6,875,000 | | | | 7.500 | (a) | | | 03/15/21 | | | | 6,153,125 | |
| Stone Energy Corp. (B/Caa1) |
| | 8,750,000 | | | | 8.625 | | | | 02/01/17 | | | | 8,006,250 | |
| Unit Corp. (BB-/B3) |
| | 5,800,000 | | | | 6.625 | | | | 05/15/21 | | | | 5,777,417 | |
| Whiting Petroleum Corp. (BB/Ba3) |
| | 4,000,000 | | | | 7.000 | | | | 02/01/14 | | | | 4,260,000 | |
| | | | | | | | | | | | | | | |
| | | | | | | | | | | | | | 313,833,219 | |
| |
| |
Energy – Services – 1.1% |
Basic Energy Services, Inc. (B/B3)(a) |
| | 7,250,000 | | | | 7.750 | | | | 02/15/19 | | | | 7,105,000 | |
| Cie Generale de Geophysique – Veritas (BB-/Ba3) |
| | 1,250,000 | | | | 9.500 | | | | 05/15/16 | | | | 1,290,706 | |
| | 17,600,000 | | | | 6.500 | (a) | | | 06/01/21 | | | | 15,829,122 | |
Frac Tech Services LLC/Frac Tech Finance, Inc. (BB/Ba3)(a) |
| | 4,645,000 | | | | 7.625 | | | | 11/15/18 | | | | 4,598,550 | |
OGX Petroleo e Gas Participacoes SA (B/B1)(a) |
| | 14,850,000 | | | | 8.500 | | | | 06/01/18 | | | | 13,355,175 | |
Trinidad Drilling Ltd. (BB-/B2)(a) |
| | 8,200,000 | | | | 7.875 | | | | 01/15/19 | | | | 8,155,005 | |
| | | | | | | | | | | | | | | |
| | | | | | | | | | | | | | 50,333,558 | |
| |
| |
Entertainment & Leisure – 0.9% |
| Cedar Fair LP/Canada’s Wonderland Co./Magnum Management Corp. (B-/B2) |
| | 6,625,000 | | | | 9.125 | | | | 08/01/18 | | | | 7,055,625 | |
| GWR Operating Partnership LLP (BB-/B3) |
| | 8,000,000 | | | | 10.875 | | | | 04/01/17 | | | | 8,240,000 | |
MU Finance PLC (NR/NR)(a) |
| | 13,250,000 | | | | 8.375 | | | | 02/01/17 | | | | 13,846,250 | |
Palace Entertainment Holdings LLC/Palace Entertainment Holdings Corp. (B-/B2)(a) |
| | 7,975,000 | | | | 8.875 | | | | 04/15/17 | | | | 7,307,094 | |
48 The accompanying notes are an integral part of these financial statements.
GOLDMAN SACHS HIGH YIELD FUND
| | | | | | | | | | | | | | | |
Principal
| | Interest
| | Maturity
| | |
| Amount | | Rate | | Date | | Value |
| |
Corporate Obligations – (continued) |
Entertainment & Leisure – (continued) |
| | | | | | | | | | | | | | | |
| Regal Entertainment Group (B-/B3) |
| $ | 1,100,000 | | | | 9.125 | % | | | 08/15/18 | | | $ | 1,075,250 | |
| Universal City Development Partners Ltd. (B/Baa2) |
| | 3,088,000 | | | | 10.875 | | | | 11/15/16 | | | | 3,605,240 | |
| | | | | | | | | | | | | | | |
| | | | | | | | | | | | | | 41,129,459 | |
| |
| |
Finance – 6.5% |
ACE Cash Express, Inc. (B/B3)(a) |
| | 12,925,000 | | | | 11.000 | | | | 02/01/19 | | | | 11,503,250 | |
| Ally Financial, Inc. (B+/B1) |
| | 7,000,000 | | | | 6.750 | | | | 12/01/14 | | | | 6,650,000 | |
| | 8,500,000 | | | | 8.300 | | | | 02/12/15 | | | | 8,245,000 | |
| | 34,080,000 | | | | 6.250 | | | | 12/01/17 | | | | 29,479,200 | |
| | 10,050,000 | | | | 8.000 | | | | 03/15/20 | | | | 9,095,250 | |
| | 1,875,000 | | | | 7.500 | | | | 09/15/20 | | | | 1,678,125 | |
| | 13,000,000 | | | | 8.000 | | | | 11/01/31 | | | | 11,375,000 | |
| American General Finance Corp. (B/B3) |
| | 12,164,000 | | | | 6.900 | | | | 12/15/17 | | | | 8,545,210 | |
| CIT Group, Inc. (B+/B2) |
| | 31,325,000 | | | | 5.250 | (a) | | | 04/01/14 | | | | 29,602,125 | |
| | 6,300,733 | | | | 7.000 | | | | 05/01/16 | | | | 6,080,207 | |
| | 21,749,000 | | | | 7.000 | (a) | | | 05/02/16 | | | | 20,770,295 | |
| | 34,300,000 | | | | 7.000 | (a) | | | 05/02/17 | | | | 33,185,250 | |
Citigroup Capital XXI (BB+/Baa3)(e) |
| | 12,450,000 | | | | 8.300 | | | | 12/21/57 | | | | 12,169,875 | |
General Motors Financial Co., Inc. (B/B1)(a) |
| | 8,250,000 | | | | 6.750 | | | | 06/01/18 | | | | 7,837,500 | |
| International Lease Finance Corp. (BBB-/B1) |
| | 13,635,000 | | | | 6.625 | | | | 11/15/13 | | | | 13,089,600 | |
| | 12,125,000 | | | | 8.625 | | | | 09/15/15 | | | | 11,943,125 | |
| | 12,500,000 | | | | 5.750 | | | | 05/15/16 | | | | 11,125,000 | |
| | 10,500,000 | | | | 8.750 | | | | 03/15/17 | | | | 10,473,750 | |
| | 2,250,000 | | | | 8.875 | | | | 09/01/17 | | | | 2,255,625 | |
| | 9,500,000 | | | | 8.250 | | | | 12/15/20 | | | | 9,262,500 | |
International Lease Finance Corp. (BBB-/Ba3)(a) |
| | 1,000,000 | | | | 6.750 | | | | 09/01/16 | | | | 985,000 | |
Lloyds Banking Group PLC (C/B3)(a)(b)(e) |
| | 4,242,000 | | | | 5.920 | | | | 10/29/49 | | | | 2,014,653 | |
| National Money Mart Co. (B+/B2) |
| | 8,250,000 | | | | 10.375 | | | | 12/15/16 | | | | 8,415,000 | |
| Oppenheimer Holdings, Inc. (B+/B2) |
| | 5,625,000 | | | | 8.750 | | | | 04/15/18 | | | | 5,428,125 | |
Provident Funding Associates (B/B2)(a) |
| | 6,125,000 | | | | 10.125 | | | | 02/15/19 | | | | 5,451,250 | |
| RBS Capital Trust I (C/B3) |
| | 6,375,000 | | | | 4.709 | | | | 12/29/49 | | | | 2,932,500 | |
| RBS Capital Trust III (C/B3) |
| | 7,750,000 | | | | 5.512 | | | | 09/29/49 | | | | 3,526,250 | |
| Regions Bank (BB+/Ba3) |
| | 1,100,000 | | | | 7.500 | | | | 05/15/18 | | | | 1,078,000 | |
Royal Bank of Scotland Group PLC (C/Ba3)(a) |
| | 2,000,000 | | | | 6.990 | | | | 10/29/49 | | | | 1,280,808 | |
Speedy Cash, Inc. (B/B3)(a) |
| | 5,700,000 | | | | 10.750 | | | | 05/15/18 | | | | 5,757,000 | |
| | | | | | | | | | | | | | | |
| | | | | | | | | | | | | | 291,234,473 | |
| |
| |
Finance Insurance – 0.9% |
AXA SA (BBB/Baa1)(a)(e) |
| | 22,525,000 | | | | 6.463 | | | | 12/14/49 | | | | 14,303,375 | |
HUB International Holdings, Inc. (CCC+/B3)(a) |
| | 6,750,000 | | | | 9.000 | | | | 12/15/14 | | | | 6,530,625 | |
Liberty Mutual Group, Inc. (BB/Baa3)(a) |
| | 14,625,000 | | | | 7.800 | | | | 03/15/37 | | | | 12,431,250 | |
| Towergate Finance PLC (NR/B1) |
| GBP | 6,250,000 | | | | 8.500 | | | | 02/15/18 | | | | 8,284,316 | |
| | | | | | | | | | | | | | | |
| | | | | | | | | | | | | | 41,549,566 | |
| |
| |
Food – 1.6% |
Bakkavor Group HF (B/B2)(a) |
| | 2,125,000 | | | | 8.250 | | | | 02/15/18 | | | | 2,286,181 | |
Bumble Bee Acquisition Corp. (B/B2)(a) |
| $ | 7,750,000 | | | | 9.000 | | | | 12/15/17 | | | | 7,440,000 | |
Bumble Bee Holdco SCA (CCC+/Caa1)(a)(c) |
| | 10,375,000 | | | | 9.625 | | | | 03/15/18 | | | | 8,611,250 | |
| Dean Foods Co. (B-/B2) |
| | 4,500,000 | | | | 7.000 | | | | 06/01/16 | | | | 4,275,000 | |
Del Monte Foods Co. (CCC+/B3)(a) |
| | 15,750,000 | | | | 7.625 | | | | 02/15/19 | | | | 13,387,500 | |
| Foodcorp Pty Ltd. (B-/B2) |
| EUR | 5,250,000 | | | | 8.750 | | | | 03/01/18 | | | | 5,908,297 | |
| Pinnacle Foods Finance LLC (CCC+/B3) |
| $ | 15,242,000 | | | | 9.250 | | | | 04/01/15 | | | | 15,089,580 | |
| Pinnacle Foods Finance LLC (CCC+/Caa1) |
| | 13,000,000 | | | | 10.625 | | | | 04/01/17 | | | | 13,000,000 | |
| | | | | | | | | | | | | | | |
| | | | | | | | | | | | | | 69,997,808 | |
| |
| |
Gaming – 5.6% |
| Caesars Entertainment Operating Co., Inc. (B/B3) |
| | 16,000,000 | | | | 11.250 | | | | 06/01/17 | | | | 16,100,000 | |
| Caesars Entertainment Operating Co., Inc. (CCC/Caa3) |
| | 10,000,000 | | | | 12.750 | | | | 04/15/18 | | | | 6,775,000 | |
| Caesars Entertainment Operating Co., Inc. (CCC/NR) |
| | 23,419,000 | | | | 10.000 | | | | 12/15/18 | | | | 13,665,774 | |
Chukchansi Economic Development Authority (B-/Caa2)(a) |
| | 5,345,000 | | | | 8.000 | | | | 11/15/13 | | | | 3,688,050 | |
CityCenter Holdings LLC (CCC/Caa2)(a)(c) |
| | 11,500,000 | | | | 10.750 | | | | 01/15/17 | | | | 10,157,056 | |
CityCenter Holdings LLC/CityCenter Finance Corp. (B/B2)(a) |
| | 7,125,000 | | | | 7.625 | | | | 01/15/16 | | | | 6,715,312 | |
Downstream Development Authority of the Quapaw Tribe of Oklahoma (B/B3)(a) |
| | 4,100,000 | | | | 10.500 | | | | 07/01/19 | | | | 3,854,000 | |
Gala Group Finance PLC (B+/B2)(a) |
| GBP | 2,000,000 | | | | 8.875 | | | | 09/01/18 | | | | 2,454,757 | |
Gateway Casinos & Entertainment Ltd. (BB-/B3)(a) |
| CAD | 6,375,000 | | | | 8.875 | | | | 11/15/17 | | | | 6,144,432 | |
| Isle of Capri Casinos, Inc. (B-/B3) |
| $ | 6,250,000 | | | | 7.750 | | | | 03/15/19 | | | | 5,812,500 | |
| Isle of Capri Casinos, Inc. (CCC+/Caa1) |
| | 2,118,000 | | | | 7.000 | | | | 03/01/14 | | | | 1,922,085 | |
| Las Vegas Sands Corp. (BB/Ba3) |
| | 1,500,000 | | | | 6.375 | | | | 02/15/15 | | | | 1,515,000 | |
The accompanying notes are an integral part of these financial statements. 49
GOLDMAN SACHS HIGH YIELD FUND
Schedule of Investments (continued)
September 30, 2011 (Unaudited)
| | | | | | | | | | | | | | | |
Principal
| | Interest
| | Maturity
| | |
| Amount | | Rate | | Date | | Value |
| |
Corporate Obligations – (continued) |
Gaming – (continued) |
| | | | | | | | | | | | | | | |
| Marina District Finance Co., Inc. (BB-/B2) |
| $ | 4,900,000 | | | | 9.500 | % | | | 10/15/15 | | | $ | 4,385,500 | |
| | 5,350,000 | | | | 9.875 | | | | 08/15/18 | | | | 4,574,250 | |
| MCE Finance Ltd. (B+/B1) |
| | 10,875,000 | | | | 10.250 | | | | 05/15/18 | | | | 11,527,500 | |
| MGM Resorts International (B/Ba3) |
| | 11,500,000 | | | | 13.000 | | | | 11/15/13 | | | | 13,052,500 | |
| | 4,750,000 | | | | 11.125 | | | | 11/15/17 | | | | 5,201,250 | |
| | 1,250,000 | | | | 9.000 | | | | 03/15/20 | | | | 1,287,500 | |
| MGM Resorts International (CCC+/Caa1) |
| | 21,500,000 | | | | 6.625 | | | | 07/15/15 | | | | 18,221,250 | |
| | 15,000,000 | | | | 7.500 | | | | 06/01/16 | | | | 12,900,000 | |
| | 12,500,000 | | | | 10.000 | (a) | | | 11/01/16 | | | | 11,812,500 | |
| | 4,000,000 | | | | 11.375 | | | | 03/01/18 | | | | 4,070,000 | |
| Mohegan Tribal Gaming Authority (CC/Ca) |
| | 1,555,000 | | | | 7.125 | | | | 08/15/14 | | | | 808,600 | |
| Mohegan Tribal Gaming Authority (CC/Caa2) |
| | 8,750,000 | | | | 6.125 | | | | 02/15/13 | | | | 5,425,000 | |
| Peermont Proprietary Global Ltd. (B-/B3) |
| EUR | 11,250,000 | | | | 7.750 | | | | 04/30/14 | | | | 11,605,583 | |
| Peninsula Gaming LLC (B/Caa1) |
| $ | 11,065,000 | | | | 10.750 | | | | 08/15/17 | | | | 10,677,725 | |
| Pinnacle Entertainment, Inc. (B/Caa1) |
| | 8,475,000 | | | | 7.500 | | | | 06/15/15 | | | | 8,241,937 | |
| | 5,375,000 | | | | 8.750 | | | | 05/15/20 | | | | 5,186,875 | |
| Pinnacle Entertainment, Inc. (BB/B1) |
| | 6,000,000 | | | | 8.625 | | | | 08/01/17 | | | | 6,090,000 | |
| Scientific Games International, Inc. (BB-/B1) |
| | 4,500,000 | | | | 9.250 | | | | 06/15/19 | | | | 4,567,500 | |
Shingle Springs Tribal Gaming Authority (CCC/Caa2)(a) |
| | 10,000,000 | | | | 9.375 | | | | 06/15/15 | | | | 5,800,000 | |
Snoqualmie Entertainment Authority (B-/Caa1)(a) |
| | 11,750,000 | | | | 9.125 | | | | 02/01/15 | | | | 11,162,500 | |
Sugarhouse HSP Gaming Prop Mezz LP/Sugarhouse HSP Gaming Finance Corp. (B-/B3)(a) |
| | 1,850,000 | | | | 8.625 | | | | 04/15/16 | | | | 1,859,250 | |
Wynn Las Vegas LLC/Wynn Las Vegas Capital Corp. (BBB-/Ba3) |
| | 5,000,000 | | | | 7.750 | | | | 08/15/20 | | | | 5,325,000 | |
| Wynn Las Vegas LLC/Wynn Las Vegas Capital Corp. (BBB-/NR) |
| | 2,125,000 | | | | 7.875 | | | | 11/01/17 | | | | 2,295,000 | |
Yonkers Racing Corp. (B+/B1)(a) |
| | 4,500,000 | | | | 11.375 | | | | 07/15/16 | | | | 4,680,000 | |
| | | | | | | | | | | | | | | |
| | | | | | | | | | | | | | 249,561,186 | |
| |
| |
Health Care – Medical Products – 1.5% |
| Accellent, Inc. (B+/B1) |
| | 5,500,000 | | | | 8.375 | | | | 02/01/17 | | | | 5,335,000 | |
| Alere, Inc. (B/B2) |
| | 5,000,000 | | | | 7.875 | | | | 02/01/16 | | | | 4,725,000 | |
| Alere, Inc. (B-/B3) |
| | 6,750,000 | | | | 9.000 | | | | 05/15/16 | | | | 6,446,250 | |
| | 1,500,000 | | | | 8.625 | | | | 10/01/18 | | | | 1,368,750 | |
Catalent Pharma Solutions, Inc. (B/Caa1)(c) |
| | 12,875,118 | | | | 9.500 | | | | 04/15/15 | | | | 11,845,109 | |
| Catalent Pharma Solutions, Inc. (B-/Caa1) |
| EUR | 2,625,000 | | | | 9.750 | | | | 04/15/17 | | | | 2,567,296 | |
| ConvaTec Healthcare E SA (B/Caa1) |
| | 6,733,000 | | | | 10.500 | (a) | | | 12/15/18 | | | | 5,958,705 | |
| EUR | 2,000,000 | | | | 10.875 | | | | 12/15/18 | | | | 2,183,792 | |
| ConvaTec Healthcare E SA (B+/Ba3) |
| | 750,000 | | | | 7.375 | | | | 12/15/17 | | | | 911,134 | |
DJO Finance LLC/DJO Finance Corp. (B-/B3)(a) |
| $ | 5,750,000 | | | | 7.750 | | | | 04/15/18 | | | | 5,016,875 | |
DJO Finance LLC/DJO Finance Corp. (CCC+/Caa1)(a) |
| | 2,250,000 | | | | 9.750 | | | | 10/15/17 | | | | 1,940,625 | |
| Fresenius Medical Care US Finance, Inc. (BB/Ba2) |
| | 6,625,000 | | | | 6.875 | | | | 07/15/17 | | | | 6,926,948 | |
| | 8,414,000 | | | | 5.750 | (a) | | | 02/15/21 | | | | 8,077,440 | |
VWR Funding, Inc. (B-/Caa1)(c) |
| | 3,751,562 | | | | 10.250 | | | | 07/15/15 | | | | 3,709,357 | |
| | | | | | | | | | | | | | | |
| | | | | | | | | | | | | | 67,012,281 | |
| |
| |
Health Care – Pharmaceutical – 1.2% |
Capsugel FinanceCo. SCA (B/Caa1)(a) |
| EUR | 7,900,000 | | | | 9.875 | | | | 08/01/19 | | | | 9,816,682 | |
Endo Pharmaceuticals Holdings, Inc. (BB-/Ba3)(a) |
| $ | 12,250,000 | | | | 7.250 | | | | 01/15/22 | | | | 12,357,188 | |
| Mylan, Inc. (BB/NR) |
| | 12,030,000 | | | | 1.250 | | | | 03/15/12 | | | | 11,990,903 | |
Valeant Pharmaceuticals International (BB/B1)(a) |
| | 5,000,000 | | | | 6.500 | | | | 07/15/16 | | | | 4,662,500 | |
| | 14,625,000 | | | | 6.875 | | | | 12/01/18 | | | | 13,345,312 | |
| | | | | | | | | | | | | | | |
| | | | | | | | | | | | | | 52,172,585 | |
| |
| |
Health Care – Services – 5.4% |
| American Renal Holdings Co., Inc. (B/B2) |
| | 2,255,000 | | | | 8.375 | | | | 05/15/18 | | | | 2,266,275 | |
| American Renal Holdings Co., Inc. (CCC+/Caa2) |
| | 12,114,078 | | | | 9.750 | | | | 03/01/16 | | | | 11,992,937 | |
CDRT Merger Sub, Inc. (B-/Caa1)(a) |
| | 14,000,000 | | | | 8.125 | | | | 06/01/19 | | | | 13,020,000 | |
| Community Health Systems, Inc. (B/B3) |
| | 27,000,000 | | | | 8.875 | | | | 07/15/15 | | | | 26,460,000 | |
| DaVita, Inc. (B/B2) |
| | 9,434,000 | | | | 6.375 | | | | 11/01/18 | | | | 9,056,640 | |
| | 4,650,000 | | | | 6.625 | | | | 11/01/20 | | | | 4,464,000 | |
| Gentiva Health Services, Inc. (CCC+/B3) |
| | 4,850,000 | | | | 11.500 | | | | 09/01/18 | | | | 3,855,750 | |
| HCA, Inc. (B-/B3) |
| | 4,750,000 | | | | 6.500 | | | | 02/15/16 | | | | 4,560,000 | |
| | 25,400,000 | | | | 7.500 | | | | 02/15/22 | | | | 23,241,000 | |
| HCA, Inc. (BB/Ba3) |
| | 12,625,000 | | | | 8.500 | | | | 04/15/19 | | | | 13,319,375 | |
| | 28,950,000 | | | | 6.500 | | | | 02/15/20 | | | | 28,153,875 | |
| | 8,150,000 | | | | 7.875 | | | | 02/15/20 | | | | 8,394,500 | |
| | 21,250,000 | | | | 7.250 | | | | 09/15/20 | | | | 21,356,250 | |
| HCA, Inc. (BB-/B2) |
| | 1,625,000 | | | | 9.875 | | | | 02/15/17 | | | | 1,755,000 | |
| HEALTHSOUTH Corp. (B+/B2) |
| | 2,300,000 | | | | 7.250 | | | | 10/01/18 | | | | 2,179,250 | |
| | 8,725,000 | | | | 7.750 | | | | 09/15/22 | | | | 7,917,938 | |
50 The accompanying notes are an integral part of these financial statements.
GOLDMAN SACHS HIGH YIELD FUND
| | | | | | | | | | | | | | | |
Principal
| | Interest
| | Maturity
| | |
| Amount | | Rate | | Date | | Value |
| |
Corporate Obligations – (continued) |
Health Care – Services – (continued) |
| | | | | | | | | | | | | | | |
MPT Operating Partnership LP/MPT Finance Corp. (BB/Ba2)(a) |
| $ | 18,261,000 | | | | 6.875 | % | | | 05/01/21 | | | $ | 17,576,212 | |
| OnCure Holdings, Inc. (B/B3) |
| | 6,250,000 | | | | 11.750 | | | | 05/15/17 | | | | 5,531,250 | |
Patheon, Inc. (B+/B1)(a) |
| | 3,875,000 | | | | 8.625 | | | | 04/15/17 | | | | 3,293,750 | |
| Radiation Therapy Services, Inc. (CCC+/B3) |
| | 4,375,000 | | | | 9.875 | | | | 04/15/17 | | | | 3,762,500 | |
STHI Holding Corp. (B/B2)(a) |
| | 3,250,000 | | | | 8.000 | | | | 03/15/18 | | | | 3,144,375 | |
| Tenet Healthcare Corp. (BB-/B1) |
| | 5,500,000 | | | | 10.000 | | | | 05/01/18 | | | | 5,967,500 | |
| | 12,563,000 | | | | 8.875 | | | | 07/01/19 | | | | 13,253,965 | |
| Tenet Healthcare Corp. (CCC+/Caa1) |
| | 9,750,000 | | | | 8.000 | | | | 08/01/20 | | | | 8,970,000 | |
| US Oncology, Inc. (NR/NR) |
| | 32,250,000 | | | | 9.125 | | | | 08/15/17 | | | | 241,875 | |
| | | | | | | | | | | | | | | |
| | | | | | | | | | | | | | 243,734,217 | |
| |
| |
Home Construction – 0.1% |
| KB HOME (B+/B2) |
| | 1,500,000 | | | | 6.250 | | | | 06/15/15 | | | | 1,237,500 | |
| Meritage Homes Corp. (B+/NR) |
| | 2,122,000 | | | | 7.150 | | | | 04/15/20 | | | | 1,984,070 | |
| | | | | | | | | | | | | | | |
| | | | | | | | | | | | | | 3,221,570 | |
| |
| |
Lodging – 0.4% |
| Felcor Lodging LP (NR/B2) |
| | 5,802,000 | | | | 10.000 | | | | 10/01/14 | | | | 6,034,080 | |
| Host Hotels & Resorts LP (BB+/Ba1) |
| | 6,700,000 | | | | 6.750 | | | | 06/01/16 | | | | 6,783,750 | |
| | 6,300,000 | | | | 6.000 | | | | 11/01/20 | | | | 6,079,500 | |
| | | | | | | | | | | | | | | |
| | | | | | | | | | | | | | 18,897,330 | |
| |
| |
Machinery(a) – 0.3% |
| Constellation Enterprises LLC (B/B2) |
| | 5,125,000 | | | | 10.625 | | | | 02/01/16 | | | | 5,022,500 | |
| Dresser-Rand Group, Inc. (B+/B1) |
| | 11,500,000 | | | | 6.500 | | | | 05/01/21 | | | | 10,580,000 | |
| | | | | | | | | | | | | | | |
| | | | | | | | | | | | | | 15,602,500 | |
| |
| |
Media – 1.1% |
| Allbritton Communications Co. (B/B2) |
| | 5,650,000 | | | | 8.000 | | | | 05/15/18 | | | | 5,296,875 | |
| DISH DBS Corp. (BB-/Ba3) |
| | 6,525,000 | | | | 7.125 | | | | 02/01/16 | | | | 6,573,937 | |
| | 29,850,000 | | | | 6.750 | (a) | | | 06/01/21 | | | | 28,506,750 | |
| Gray Television, Inc. (CCC/Caa2) |
| | 11,375,000 | | | | 10.500 | | | | 06/29/15 | | | | 10,123,750 | |
| | | | | | | | | | | | | | | |
| | | | | | | | | | | | | | 50,501,312 | |
| |
| |
Media – Broadcasting & Radio – 1.4% |
Bonten Media Acquisition Co. (CCC-/Caa3)(a)(c) |
| | 4,440,457 | | | | 9.000 | | | | 06/01/15 | | | | 3,163,826 | |
| Clear Channel Communications, Inc. (CCC+/Caa1) |
| | 9,500,000 | | | | 9.000 | | | | 03/01/21 | | | | 7,030,000 | |
Cumulus Media, Inc. (CCC+/B3)(a) |
| | 9,450,000 | | | | 7.750 | | | | 05/01/19 | | | | 7,701,750 | |
| Entravision Communications Corp. (B/B1) |
| | 2,000,000 | | | | 8.750 | | | | 08/01/17 | | | | 1,880,000 | |
Fox Acquisition Sub LLC (CCC+/Caa2)(a) |
| | 1,250,000 | | | | 13.375 | | | | 07/15/16 | | | | 1,315,625 | |
| LIN Television Corp. (B-/B3) |
| | 4,000,000 | | | | 6.500 | | | | 05/15/13 | | | | 3,860,000 | |
| LIN Television Corp. (BB-/Ba3) |
| | 2,875,000 | | | | 8.375 | | | | 04/15/18 | | | | 2,889,375 | |
Local TV Finance LLC (CCC+/Caa2)(a)(c) |
| | 4,443,459 | | | | 9.250 | | | | 06/15/15 | | | | 4,087,982 | |
| Nexstar Broadcasting, Inc./Mission Broadcasting, Inc. (B/B3) |
| | 3,250,000 | | | | 8.875 | | | | 04/15/17 | | | | 3,209,375 | |
Sinclair Television Group, Inc. (BB-/Ba3)(a) |
| | 8,750,000 | | | | 9.250 | | | | 11/01/17 | | | | 9,100,000 | |
Univision Communications, Inc. (B+/B2)(a) |
| | 5,500,000 | | | | 6.875 | | | | 05/15/19 | | | | 4,867,500 | |
| | 1,500,000 | | | | 7.875 | | | | 11/01/20 | | | | 1,380,000 | |
Univision Communications, Inc. (CCC+/Caa2)(a) |
| | 6,000,000 | | | | 8.500 | | | | 05/15/21 | | | | 4,500,000 | |
XM Satellite Radio, Inc. (BB-/B2)(a) |
| | 8,850,000 | | | | 7.625 | | | | 11/01/18 | | | | 8,761,500 | |
| | | | | | | | | | | | | | | |
| | | | | | | | | | | | | | 63,746,933 | |
| |
| |
Media – Cable – 2.7% |
| Adelphia Communications Corp. (NR/NR) |
| | 2,000,000 | | | | 10.250 | | | | 06/15/49 | | | | 3,200 | |
| CCO Holdings LLC/CCO Holdings Capital Corp. (BB-/B1) |
| | 1,000,000 | | | | 7.250 | | | | 10/30/17 | | | | 1,000,000 | |
| | 3,125,000 | | | | 7.875 | | | | 04/30/18 | | | | 3,203,125 | |
| | 15,000,000 | | | | 7.000 | | | | 01/15/19 | | | | 14,550,000 | |
| | 1,750,000 | | | | 8.125 | | | | 04/30/20 | | | | 1,828,750 | |
| | 10,000,000 | | | | 6.500 | | | | 04/30/21 | | | | 9,400,000 | |
Charter Communications Operating LLC (BB+/Ba2)(a) |
| | 10,000,000 | | | | 10.875 | | | | 09/15/14 | | | | 10,750,000 | |
| CSC Holdings LLC (BB/Ba3) |
| | 9,125,000 | | | | 8.500 | | | | 04/15/14 | | | | 9,809,375 | |
| | 4,600,000 | | | | 8.500 | | | | 06/15/15 | | | | 4,853,000 | |
| | 1,550,000 | | | | 7.875 | | | | 02/15/18 | | | | 1,627,500 | |
| | 1,750,000 | | | | 7.625 | | | | 07/15/18 | | | | 1,820,000 | |
| | 11,000,000 | | | | 8.625 | | | | 02/15/19 | | | | 12,045,000 | |
Kabel Baden-Wurttemberg GmbH & Co. (B+/B1)(a) |
| | 3,750,000 | | | | 7.500 | | | | 03/15/19 | | | | 3,675,000 | |
| Unitymedia GmbH (B-/B3) |
| EUR | 750,000 | | | | 9.625 | | | | 12/01/19 | | | | 967,614 | |
| UPC Holding BV (B-/B2) |
| | 5,000,000 | | | | 8.000 | | | | 11/01/16 | | | | 6,271,487 | |
| | 23,375,000 | | | | 8.375 | | | | 08/15/20 | | | | 27,025,529 | |
| Virgin Media Finance PLC (BB-/Ba2) |
| $ | 11,000,000 | | | | 8.375 | | | | 10/15/19 | | | | 11,715,000 | |
| Virgin Media Investment Holdings Ltd. (BBB-/Baa3) |
| | 125,000 | | | | 6.500 | | | | 01/15/18 | | | | 133,057 | |
| Ziggo Bond Co. BV (B/B1) |
| EUR | 1,375,000 | | | | 8.000 | | | | 05/15/18 | | | | 1,770,882 | |
| | | | | | | | | | | | | | | |
| | | | | | | | | | | | | | 122,448,519 | |
| |
| |
The accompanying notes are an integral part of these financial statements. 51
GOLDMAN SACHS HIGH YIELD FUND
Schedule of Investments (continued)
September 30, 2011 (Unaudited)
| | | | | | | | | | | | | | | |
Principal
| | Interest
| | Maturity
| | |
| Amount | | Rate | | Date | | Value |
| |
Corporate Obligations – (continued) |
| | | | | | | | | | | | | | | |
Media – Diversified – 0.4% |
Quebecor Media, Inc. (B+/B1)(a) |
| CAD | 12,875,000 | | | | 7.375 | % | | | 01/15/21 | | | $ | 12,198,908 | |
| Videotron Ltee (BB/Ba1) |
| $ | 5,625,000 | | | | 9.125 | | | | 04/15/18 | | | | 6,145,313 | |
| | | | | | | | | | | | | | | |
| | | | | | | | | | | | | | 18,344,221 | |
| |
| |
Metals – 2.0% |
| AK Steel Corp. (BB/Ba3) |
| | 5,625,000 | | | | 7.625 | | | | 05/15/20 | | | | 4,907,812 | |
Aleris International, Inc. (B+/B1)(a) |
| | 2,252,000 | | | | 7.625 | | | | 02/15/18 | | | | 2,021,170 | |
| Calcipar SA (BB-/B1) |
| EUR | 8,121,000 | | | | 2.737 | (e) | | | 07/01/14 | | | | 9,520,095 | |
| $ | 12,900,000 | | | | 6.875 | (a) | | | 05/01/18 | | | | 11,158,500 | |
FMG Resources (August 2006) Pty Ltd. (B+/B1)(a) |
| | 6,150,000 | | | | 6.375 | | | | 02/01/16 | | | | 5,535,000 | |
| | 12,060,000 | | | | 6.875 | | | | 02/01/18 | | | | 10,733,400 | |
JMC Steel Group (B/B3)(a) |
| | 4,550,000 | | | | 8.250 | | | | 03/15/18 | | | | 4,231,500 | |
| Novelis, Inc. (B/B2) |
| | 8,625,000 | | | | 8.375 | | | | 12/15/17 | | | | 8,452,500 | |
| | 11,000,000 | | | | 8.750 | | | | 12/15/20 | | | | 10,890,000 | |
| Steel Dynamics, Inc. (BB+/Ba2) |
| | 7,750,000 | | | | 7.375 | | | | 11/01/12 | | | | 7,943,750 | |
| | 5,500,000 | | | | 7.750 | | | | 04/15/16 | | | | 5,472,500 | |
Thompson Creek Metals Co., Inc. (B/B3)(a) |
| | 8,000,000 | | | | 7.375 | | | | 06/01/18 | | | | 7,320,000 | |
| Tube City IMS Corp. (B-/Caa1) |
| | 3,500,000 | | | | 9.750 | | | | 02/01/15 | | | | 3,342,500 | |
| | | | | | | | | | | | | | | |
| | | | | | | | | | | | | | 91,528,727 | |
| |
| |
Packaging – 3.7% |
| AEP Industries, Inc. (B-/B2) |
| | 690,000 | | | | 8.250 | | | | 04/15/19 | | | | 650,325 | |
| Ardagh Glass Finance PLC (B-/B3) |
| EUR | 6,000,000 | | | | 8.750 | | | | 02/01/20 | | | | 6,229,837 | |
| Ardagh Packaging Finance PLC (B-/B3) |
| $ | 1,875,000 | | | | 9.125 | (a) | | | 10/15/20 | | | | 1,725,000 | |
| EUR | 5,250,000 | | | | 9.250 | | | | 10/15/20 | | | | 5,521,444 | |
| Ardagh Packaging Finance PLC (BB-/Ba3) |
| | 8,250,000 | | | | 7.375 | | | | 10/15/17 | | | | 10,278,465 | |
| Ball Corp. (BB+/Ba1) |
| $ | 13,221,000 | | | | 5.750 | | | | 05/15/21 | | | | 12,824,370 | |
Berry Plastics Corp. (B/B1)(e) |
| | 8,550,000 | | | | 4.999 | | | | 02/15/15 | | | | 7,833,938 | |
| Crown Americas LLC (BB/Ba3) |
| | 7,500,000 | | | | 7.625 | | | | 05/15/17 | | | | 7,931,250 | |
| | 1,250,000 | | | | 6.250 | (a) | | | 02/01/21 | | | | 1,256,250 | |
| Crown Cork & Seal Co., Inc. (BB-/B1) |
| | 1,000,000 | | | | 7.375 | | | | 12/15/26 | | | | 992,500 | |
| Crown European Holdings SA (BB/Ba1) |
| EUR | 1,625,000 | | | | 7.125 | | | | 08/15/18 | | | | 2,106,394 | |
| Graham Packaging Co. LP (B-/Caa1) |
| $ | 22,250,000 | | | | 9.875 | | | | 10/15/14 | | | | 22,583,750 | |
| Graphic Packaging International, Inc. (BB-/B2) |
| | 5,300,000 | | | | 9.500 | | | | 06/15/17 | | | | 5,697,500 | |
Greif Luxembourg Finance SCA (BB/Ba2)(a) |
| EUR | 6,400,000 | | | | 7.375 | | | | 07/15/21 | | | | 8,059,935 | |
Reynolds Group Holdings Ltd. (B-/Caa1)(a) |
| | 8,750,000 | | | | 8.250 | | | | 02/15/21 | | | | 6,868,750 | |
| Reynolds Group Issuer, Inc. (B-/Caa1) |
| EUR | 9,500,000 | | | | 8.000 | | | | 12/15/16 | | | | 9,800,270 | |
| | 22,375,000 | | | | 9.500 | | | | 06/15/17 | | | | 19,937,550 | |
| $ | 6,250,000 | | | | 9.000 | (a) | | | 05/15/18 | | | | 5,250,000 | |
| | 5,000,000 | | | | 9.000 | (a) | | | 04/15/19 | | | | 4,200,000 | |
Reynolds Group Issuer, Inc. (BB-/Ba3)(a) |
| | 2,375,000 | | | | 8.750 | | | | 10/15/16 | | | | 2,363,125 | |
| | 1,125,000 | | | | 7.125 | | | | 04/15/19 | | | | 1,046,250 | |
| | 10,200,000 | | | | 7.875 | | | | 08/15/19 | | | | 9,843,000 | |
Sealed Air Corp. (BB/B1)(a) |
| | 10,000,000 | | | | 8.125 | | | | 09/15/19 | | | | 10,075,000 | |
| | 1,600,000 | | | | 8.375 | | | | 09/15/21 | | | | 1,612,000 | |
| | | | | | | | | | | | | | | |
| | | | | | | | | | | | | | 164,686,903 | |
| |
| |
Paper – 1.0% |
Ainsworth Lumber Co., Ltd. (B-/Caa1)(a)(c) |
| | 9,096,875 | | | | 11.000 | | | | 07/29/15 | | | | 6,185,875 | |
Longview Fibre Paper & Packaging, Inc. (B+/B2)(a) |
| | 8,400,000 | | | | 8.000 | | | | 06/01/16 | | | | 8,169,000 | |
PE Paper Escrow GmbH (BB/Ba2)(a) |
| | 6,875,000 | | | | 12.000 | | | | 08/01/14 | | | | 7,218,750 | |
Sappi Papier Holding GmbH (B/B2)(a) |
| | 3,875,000 | | | | 7.500 | | | | 06/15/32 | | | | 3,061,250 | |
Sappi Papier Holding GmbH (BB/Ba2)(a) |
| | 6,500,000 | | | | 6.625 | | | | 04/15/21 | | | | 5,525,000 | |
Stone Container Finance Co. of Canada II (NR/WR)(b) |
| | 2,250,000 | | | | 7.375 | | | | 07/15/14 | | | | 45,000 | |
Stora Enso Oyj (BB/Ba2)(a) |
| | 8,085,000 | | | | 7.250 | | | | 04/15/36 | | | | 6,867,606 | |
| Verso Paper Holdings LLC/Verso Paper, Inc. (B/B2) |
| | 5,000,000 | | | | 8.750 | | | | 02/01/19 | | | | 3,425,000 | |
| Weyerhaeuser Co. (BBB-/Ba1) |
| | 4,375,000 | | | | 7.375 | | | | 03/15/32 | | | | 4,362,834 | |
| | | | | | | | | | | | | | | |
| | | | | | | | | | | | | | 44,860,315 | |
| |
| |
Printing – 0.3% |
| American Reprographics Co. (B+/B1) |
| | 5,750,000 | | | | 10.500 | | | | 12/15/16 | | | | 5,261,250 | |
Checkout Holding Corp. (B-/B3)(a)(f) |
| | 6,375,000 | | | | 0.000 | | | | 11/15/15 | | | | 3,490,313 | |
| SGS International, Inc. (B/B2) |
| | 5,750,000 | | | | 12.000 | | | | 12/15/13 | | | | 5,735,625 | |
| | | | | | | | | | | | | | | |
| | | | | | | | | | | | | | 14,487,188 | |
| |
| |
Publishing – 0.4% |
Houghton Mifflin Harcourt Publishing Co. (NR/Caa1)(a) |
| | 14,050,000 | | �� | | 10.500 | | | | 06/01/19 | | | | 9,835,000 | |
| Morris Publishing Group LLC (NR/NR) |
| | 1,197,445 | | | | 10.000 | | | | 09/01/14 | | | | 916,046 | |
| Nielsen Finance LLC (B+/B2) |
| | 3,250,000 | | | | 11.500 | | | | 05/01/16 | | | | 3,713,125 | |
| | 4,500,000 | | | | 7.750 | | | | 10/15/18 | | | | 4,612,500 | |
52 The accompanying notes are an integral part of these financial statements.
GOLDMAN SACHS HIGH YIELD FUND
| | | | | | | | | | | | | | | |
Principal
| | Interest
| | Maturity
| | |
| Amount | | Rate | | Date | | Value |
| |
Corporate Obligations – (continued) |
Publishing – (continued) |
| | | | | | | | | | | | | | | |
Truvo Subsidiary Corp. (NR/WR)(b) |
| EUR | 16,750,000 | | | | 8.500 | % | | | 12/01/14 | | | $ | – | |
| | | | | | | | | | | | | | | |
| | | | | | | | | | | | | | 19,076,671 | |
| |
| |
Real Estate – 0.4% |
| CB Richard Ellis Services, Inc. (B+/Ba1) |
| $ | 5,250,000 | | | | 6.625 | | | | 10/15/20 | | | | 5,040,000 | |
| CB Richard Ellis Services, Inc. (B+/Ba2) |
| | 5,000,000 | | | | 11.625 | | | | 06/15/17 | | | | 5,612,500 | |
Realogy Corp. (CC/Caa1)(a) |
| | 7,925,000 | | | | 7.875 | | | | 02/15/19 | | | | 5,943,750 | |
| | | | | | | | | | | | | | | |
| | | | | | | | | | | | | | 16,596,250 | |
| |
| |
Restaurants – 0.7% |
CKE Holdings, Inc. (CCC/Caa1)(a)(c) |
| | 9,509,062 | | | | 10.500 | | | | 03/14/16 | | | | 8,367,975 | |
| DineEquity, Inc. (CCC+/B3) |
| | 18,000,000 | | | | 9.500 | | | | 10/30/18 | | | | 17,640,000 | |
Seminole Hard Rock Entertainment, Inc. (BB/B2)(a)(e) |
| | 7,000,000 | | | | 2.847 | | | | 03/15/14 | | | | 6,230,000 | |
| | | | | | | | | | | | | | | |
| | | | | | | | | | | | | | 32,237,975 | |
| |
| |
Retailers – 1.4% |
Burlington Coat Factory Warehouse Corp. (CCC/Caa1)(a) |
| | 7,250,000 | | | | 10.000 | | | | 02/15/19 | | | | 6,325,625 | |
| Claire’s Stores, Inc. (CCC/Caa3) |
| | 20,750,000 | | | | 8.875 | | | | 03/15/19 | | | | 15,043,750 | |
| Levi Strauss & Co. (B+/B2) |
| EUR | 3,900,000 | | | | 7.750 | | | | 05/15/18 | | | | 4,545,771 | |
| Limited Brands, Inc. (BB+/Ba1) |
| $ | 11,000,000 | | | | 6.625 | | | | 04/01/21 | | | | 11,123,750 | |
| Michaels Stores, Inc. (CCC/Caa1) |
| | 7,250,000 | | | | 7.750 | | | | 11/01/18 | | | | 6,796,875 | |
RadioShack Corp. (BB/Ba2)(a) |
| | 4,250,000 | | | | 6.750 | | | | 05/15/19 | | | | 3,973,750 | |
| The Jones Group, Inc. (B+/Ba3) |
| | 17,000,000 | | | | 6.875 | | | | 03/15/19 | | | | 15,385,000 | |
| | | | | | | | | | | | | | | |
| | | | | | | | | | | | | | 63,194,521 | |
| |
| |
Retailers – Food & Drug – 0.9% |
| Ingles Markets, Inc. (BB-/B1) |
| | 6,000,000 | | | | 8.875 | | | | 05/15/17 | | | | 6,270,000 | |
| Rite Aid Corp. (B-/Caa2) |
| | 10,000,000 | | | | 7.500 | | | | 03/01/17 | | | | 9,575,000 | |
| Rite Aid Corp. (CCC/Caa3) |
| | 5,400,000 | | | | 9.375 | | | | 12/15/15 | | | | 4,711,500 | |
| | 10,500,000 | | | | 9.500 | | | | 06/15/17 | | | | 8,531,250 | |
| Supervalu, Inc. (B/B2) |
| | 5,375,000 | | | | 7.500 | | | | 11/15/14 | | | | 5,280,938 | |
| | 5,500,000 | | | | 8.000 | | | | 05/01/16 | | | | 5,197,500 | |
| | | | | | | | | | | | | | | |
| | | | | | | | | | | | | | 39,566,188 | |
| |
| |
Services Cyclical – Business Services – 2.1% |
| ACCO Brands Corp. (B-/Caa1) |
| | 6,875,000 | | | | 7.625 | | | | 08/15/15 | | | | 6,600,000 | |
Carlson Wagonlit BV (CCC+/Caa1)(e) |
| EUR | 10,500,000 | | | | 7.360 | | | | 05/01/15 | | | | 10,620,093 | |
CoreLogic, Inc. (B+/Ba3)(a) |
| | 21,250,000 | | | | 7.250 | | | | 06/01/21 | | | | 19,018,750 | |
Garda World Security Corp. (B/B2)(a) |
| | 3,000,000 | | | | 9.750 | | | | 03/15/17 | | | | 3,045,000 | |
| Good Sam Enterprises LLC (NR/B3) |
| | 3,570,000 | | | | 11.500 | | | | 12/01/16 | | | | 3,355,800 | |
iPayment, Inc. (CCC+/B3)(a) |
| | 4,250,000 | | | | 10.250 | | | | 05/15/18 | | | | 3,995,000 | |
| ISS Holdings A/S (B/Caa1) |
| EUR | 3,736,000 | | | | 8.875 | | | | 05/15/16 | | | | 4,404,669 | |
| Sitel LLC/Sitel Finance Corp. (B-/Caa2) |
| $ | 14,575,000 | | | | 11.500 | | | | 04/01/18 | | | | 11,587,125 | |
| The Geo Group, Inc. (B+/B1) |
| | 11,425,000 | | | | 6.625 | | | | 02/15/21 | | | | 10,968,000 | |
| TransUnion LLC/TransUnion Financing Corp. (B-/B3) |
| | 10,500,000 | | | | 11.375 | | | | 06/15/18 | | | | 11,418,750 | |
| West Corp. (B/B3) |
| | 4,875,000 | | | | 8.625 | | | | 10/01/18 | | | | 4,753,125 | |
| West Corp. (B-/Caa1) |
| | 4,560,000 | | | | 11.000 | | | | 10/15/16 | | | | 4,696,800 | |
| | | | | | | | | | | | | | | |
| | | | | | | | | | | | | | 94,463,112 | |
| |
| |
Services Cyclical – Consumer Services – 0.0% |
| Service Corp. International (BB-/Ba3) |
| | 1,750,000 | | | | 6.750 | | | | 04/01/16 | | | | 1,793,750 | |
| |
| |
Services Cyclical – Rental Equipment – 1.0% |
B-Corp Merger Sub, Inc. (CCC+/Caa1)(a) |
| | 8,400,000 | | | | 8.250 | | | | 06/01/19 | | | | 7,602,000 | |
| EC Finance PLC (B+/B2) |
| EUR | 2,200,000 | | | | 9.750 | | | | 08/01/17 | | | | 2,151,638 | |
| Hertz Corp. (B-/B2) |
| $ | 2,708,000 | | | | 7.375 | | | | 01/15/21 | | | | 2,464,280 | |
Maxim Crane Works LP (B/Caa1)(a) |
| | 5,000,000 | | | | 12.250 | | | | 04/15/15 | | | | 4,250,000 | |
| RSC Equipment Rental, Inc. (B-/Caa1) |
| | 16,834,000 | | | | 9.500 | | | | 12/01/14 | | | | 16,665,660 | |
| RSC Equipment Rental/RSC Holdings Inc. (B-/Caa1) |
| | 7,500,000 | | | | 8.250 | | | | 02/01/21 | | | | 6,525,000 | |
| United Rentals North America, Inc. (B/B2) |
| | 6,500,000 | | | | 10.875 | | | | 06/15/16 | | | | 7,052,500 | |
| | | | | | | | | | | | | | | |
| | | | | | | | | | | | | | 46,711,078 | |
| |
| |
Technology – Hardware – 2.5% |
| Alcatel-Lucent (B/B1) |
| EUR | 4,250,000 | | | | 8.500 | | | | 01/15/16 | | | | 5,285,871 | |
| Alcatel-Lucent USA, Inc. (B/B1) |
| $ | 11,000,000 | | | | 6.450 | | | | 03/15/29 | | | | 9,020,000 | |
Brightstar Corp. (BB-/B1)(a) |
| | 10,750,000 | | | | 9.500 | | | | 12/01/16 | | | | 10,965,000 | |
CDW LLC/CDW Finance Corp. (CCC+/Caa1)(a) |
| | 13,125,000 | | | | 8.500 | | | | 04/01/19 | | | | 11,353,125 | |
| CDW LLC/CDW Finance Corp. (CCC+/NR) |
| | 6,250,000 | | | | 12.535 | | | | 10/12/17 | | | | 6,000,000 | |
The accompanying notes are an integral part of these financial statements. 53
GOLDMAN SACHS HIGH YIELD FUND
Schedule of Investments (continued)
September 30, 2011 (Unaudited)
| | | | | | | | | | | | | | | |
Principal
| | Interest
| | Maturity
| | |
| Amount | | Rate | | Date | | Value |
| |
Corporate Obligations – (continued) |
Technology – Hardware – (continued) |
| | | | | | | | | | | | | | | |
CommScope, Inc. (B/B3)(a) |
| $ | 23,000,000 | | | | 8.250 | % | | | 01/15/19 | | | $ | 22,310,000 | |
| EN Germany Holdings BV (B-/B3) |
| EUR | 10,500,000 | | | | 10.750 | | | | 11/15/15 | | | | 12,380,646 | |
| Freescale Semiconductor, Inc. (CCC+/Caa1) |
| $ | 9,250,000 | | | | 8.050 | | | | 02/01/20 | | | | 8,325,000 | |
| | 13,076,000 | | | | 10.750 | | | | 08/01/20 | | | | 13,076,000 | |
| MEMC Electronic Materials, Inc. (BB/B1) |
| | 12,125,000 | | | | 7.750 | | | | 04/01/19 | | | | 10,306,250 | |
Seagate HDD Cayman (BB+/Ba1)(a) |
| | 1,950,000 | | | | 7.000 | | | | 11/01/21 | | | | 1,823,250 | |
| | | | | | | | | | | | | | | |
| | | | | | | | | | | | | | 110,845,142 | |
| |
| |
Technology – Software/Services – 2.7% |
| Aspect Software, Inc. (B-/Caa1) |
| | 5,585,000 | | | | 10.625 | | | | 05/15/17 | | | | 5,668,775 | |
Eagle Parent, Inc. (CCC+/Caa1)(a) |
| | 5,750,000 | | | | 8.625 | | | | 05/01/19 | | | | 4,887,500 | |
| Equinix, Inc. (BB-/Ba2) |
| | 5,750,000 | | | | 7.000 | | | | 07/15/21 | | | | 5,721,250 | |
| Fidelity National Information Services, Inc. (BB-/Ba2) |
| | 6,100,000 | | | | 7.625 | | | | 07/15/17 | | | | 6,374,500 | |
| | 400,000 | | | | 7.875 | | | | 07/15/20 | | | | 418,000 | |
| First Data Corp. (B-/Caa1) |
| | 2,247,000 | | | | 9.875 | | | | 09/24/15 | | | | 1,876,245 | |
| | 18,950,000 | | | | 8.250 | (a) | | | 01/15/21 | | | | 14,970,500 | |
| | 18,237,000 | | | | 12.625 | (a) | | | 01/15/21 | | | | 13,495,380 | |
| | 27,320,000 | | | | 8.750 | (a)(c) | | | 01/15/22 | | | | 21,582,800 | |
iGate Corp. (B+/B2)(a) |
| | 6,529,000 | | | | 9.000 | | | | 05/01/16 | | | | 6,137,260 | |
| Sabre Holdings Corp. (CCC+/Caa1) |
| | 8,250,000 | | | | 8.350 | | | | 03/15/16 | | | | 6,785,625 | |
| Serena Software, Inc. (CCC+/Caa1) |
| | 6,076,000 | | | | 10.375 | | | | 03/15/16 | | | | 6,197,520 | |
| SunGard Data Systems, Inc. (B/Caa1) |
| | 11,000,000 | | | | 10.625 | | | | 05/15/15 | | | | 11,632,500 | |
| | 15,000,000 | | | | 7.375 | | | | 11/15/18 | | | | 13,950,000 | |
| Travelport, Inc. (C/Caa3) |
| | 4,500,000 | | | | 11.875 | | | | 09/01/16 | | | | 1,777,500 | |
| | | | | | | | | | | | | | | |
| | | | | | | | | | | | | | 121,475,355 | |
| |
| |
Telecommunications – 2.3% |
| Cincinnati Bell, Inc. (B/B2) |
| | 2,500,000 | | | | 8.375 | | | | 10/15/20 | | | | 2,306,250 | |
| Cincinnati Bell, Inc. (CCC+/B3) |
| | 2,750,000 | | | | 8.750 | | | | 03/15/18 | | | | 2,420,000 | |
| Frontier Communications Corp. (BB/Ba2) |
| | 6,750,000 | | | | 7.875 | | | | 04/15/15 | | | | 6,817,500 | |
| | 26,500,000 | | | | 8.250 | | | | 04/15/17 | | | | 25,705,000 | |
| | 10,000,000 | | | | 8.125 | | | | 10/01/18 | | | | 9,625,000 | |
Level 3 Escrow, Inc. (CCC/B3)(a) |
| | 4,875,000 | | | | 8.125 | | | | 07/01/19 | | | | 4,326,562 | |
| Level 3 Financing, Inc. (CCC/B3) |
| | 10,000 | | | | 9.250 | | | | 11/01/14 | | | | 9,900 | |
| | 4,250,000 | | | | 8.750 | | | | 02/15/17 | | | | 3,888,750 | |
| | 10,000,000 | | | | 10.000 | | | | 02/01/18 | | | | 9,600,000 | |
| Qwest Communications International, Inc. (BB/Baa3) |
| | 9,750,000 | | | | 7.125 | | | | 04/01/18 | | | | 9,530,625 | |
| Sunrise Communications Holdings SA (B/B3) |
| EUR | 2,500,000 | | | | 8.500 | | | | 12/31/18 | | | | 3,064,556 | |
| Sunrise Communications International SA (BB/Ba3) |
| | 500,000 | | | | 7.000 | | | | 12/31/17 | | | | 644,515 | |
| CHF | 2,625,000 | | | | 7.000 | | | | 12/31/17 | | | | 2,875,800 | |
| Windstream Corp. (B+/Ba3) |
| $ | 5,000,000 | | | | 7.875 | | | | 11/01/17 | | | | 5,075,000 | |
| | 8,000,000 | | | | 7.750 | | | | 10/15/20 | | | | 7,720,000 | |
| | 9,500,000 | | | | 7.750 | | | | 10/01/21 | | | | 9,428,750 | |
| | | | | | | | | | | | | | | |
| | | | | | | | | | | | | | 103,038,208 | |
| |
| |
Telecommunications – Cellular – 3.5% |
CC Holdings GS V LLC/Crown Castle GS III Corp. (BB/Baa3)(a) |
| | 5,125,000 | | | | 7.750 | | | | 05/01/17 | | | | 5,496,563 | |
| Crown Castle International Corp. (B-/B1) |
| | 1,125,000 | | | | 9.000 | | | | 01/15/15 | | | | 1,203,750 | |
| | 4,300,000 | | | | 7.125 | | | | 11/01/19 | | | | 4,434,375 | |
| Nextel Communications, Inc. (BB-/Ba3) |
| | 11,568,000 | | | | 7.375 | | | | 08/01/15 | | | | 10,873,920 | |
| Sprint Capital Corp. (BB-/B1) |
| | 50,250,000 | | | | 6.900 | | | | 05/01/19 | | | | 42,963,750 | |
| | 15,382,000 | | | | 6.875 | | | | 11/15/28 | | | | 11,421,135 | |
| | 46,625,000 | | | | 8.750 | | | | 03/15/32 | | | | 40,330,625 | |
| Sprint Nextel Corp. (BB-/B1) |
| | 10,250,000 | | | | 6.000 | | | | 12/01/16 | | | | 8,712,500 | |
| | 8,175,000 | | | | 8.375 | | | | 08/15/17 | | | | 7,592,531 | |
| Wind Acquisition Finance SA (BB/Ba2) |
| | 1,025,000 | | | | 7.250 | (a) | | | 02/15/18 | | | | 871,250 | |
| EUR | 19,900,000 | | | | 7.375 | | | | 02/15/18 | | | | 22,395,258 | |
| | | | | | | | | | | | | | | |
| | | | | | | | | | | | | | 156,295,657 | |
| |
| |
Telecommunications – Satellites – 2.4% |
| Intelsat Jackson Holdings Ltd. (B/B3) |
| $ | 10,125,000 | | | | 9.500 | | | | 06/15/16 | | | | 10,251,563 | |
Intelsat Jackson Holdings SA (B/B3)(a) |
| | 15,125,000 | | | | 7.250 | | | | 04/01/19 | | | | 14,066,250 | |
| | 8,500,000 | | | | 7.250 | | | | 10/15/20 | | | | 7,862,500 | |
| | 13,000,000 | | | | 7.500 | | | | 04/01/21 | | | | 12,122,500 | |
| Intelsat Jackson Holdings SA (CCC+/Caa2) |
| | 15,250,000 | | | | 11.250 | | | | 06/15/16 | | | | 15,449,775 | |
| Intelsat Luxembourg SA (CCC+/Caa3) |
| | 12,000,000 | | | | 11.250 | | | | 02/04/17 | | | | 10,380,000 | |
| | 37,253,906 | | | | 11.500 | (c) | | | 02/04/17 | | | | 31,665,820 | |
| | 6,500,000 | | | | 11.500 | (a)(c) | | | 02/04/17 | | | | 5,476,250 | |
| | | | | | | | | | | | | | | |
| | | | | | | | | | | | | | 107,274,658 | |
| |
| |
Textiles & Apparel – 0.6% |
| Hanesbrands, Inc. (BB-/B1) |
| | 11,525,000 | | | | 6.375 | | | | 12/15/20 | | | | 11,150,437 | |
| Quiksilver, Inc. (B/Ba3) |
| EUR | 2,825,000 | | | | 8.875 | | | | 12/15/17 | | | | 3,444,162 | |
| Quiksilver, Inc. (CCC+/Caa1) |
| $ | 11,500,000 | | | | 6.875 | | | | 04/15/15 | | | | 10,120,000 | |
| | | | | | | | | | | | | | | |
| | | | | | | | | | | | | | 24,714,599 | |
| |
| |
54 The accompanying notes are an integral part of these financial statements.
GOLDMAN SACHS HIGH YIELD FUND
| | | | | | | | | | | | | | | |
Principal
| | Interest
| | Maturity
| | |
| Amount | | Rate | | Date | | Value |
| |
Corporate Obligations – (continued) |
| | | | | | | | | | | | | | | |
Transportation – 0.7% |
Aguila 3 SA (B/B2)(a) |
| $ | 13,875,000 | | | | 7.875 | % | | | 01/31/18 | | | $ | 12,452,812 | |
| Commercial Barge Line Co. (B+/B2) |
| | 3,475,000 | | | | 12.500 | | | | 07/15/17 | | | | 3,692,188 | |
| Florida East Coast Railway Corp. (B-/B3) |
| | 4,625,000 | | | | 8.125 | | | | 02/01/17 | | | | 4,497,812 | |
Platinum Equity LLC (CCC+/Caa1)(a)(c) |
| | 9,115,546 | | | | 10.625 | | | | 02/15/16 | | | | 7,110,126 | |
Western Express, Inc. (CCC+/Caa2)(a) |
| | 5,100,000 | | | | 12.500 | | | | 04/15/15 | | | | 3,315,000 | |
| | | | | | | | | | | | | | | |
| | | | | | | | | | | | | | 31,067,938 | |
| |
| |
Utilities – Distribution – 0.4% |
| AmeriGas Partners LP/AmeriGas Finance Corp. (NR/Ba3) |
| | 2,150,000 | | | | 6.250 | | | | 08/20/19 | | | | 2,058,625 | |
| Ferrellgas LP/Ferrellgas Finance Corp. (B+/Ba3) |
| | 800,000 | | | | 9.125 | | | | 10/01/17 | | | | 805,000 | |
| | 3,900,000 | | | | 6.500 | | | | 05/01/21 | | | | 3,354,000 | |
| Ferrellgas Partners LP/Ferellgas Partners Finance Corp. (B-/B2) |
| | 3,006,000 | | | | 8.625 | | | | 06/15/20 | | | | 2,945,880 | |
| Inergy LP/Inergy Finance Corp. (B+/Ba3) |
| | 3,500,000 | | | | 7.000 | | | | 10/01/18 | | | | 3,290,000 | |
| | 7,875,000 | | | | 6.875 | | | | 08/01/21 | | | | 7,402,500 | |
| | | | | | | | | | | | | | | |
| | | | | | | | | | | | | | 19,856,005 | |
| |
| |
Utilities – Electric – 4.3% |
Calpine Corp. (BB-/B1)(a) |
| | 33,200,000 | | | | 7.250 | | | | 10/15/17 | | | | 32,038,000 | |
| | 6,650,000 | | | | 7.500 | | | | 02/15/21 | | | | 6,417,250 | |
| Covanta Holding Corp. (B/Ba3) |
| | 6,054,000 | | | | 7.250 | | | | 12/01/20 | | | | 6,023,730 | |
Dolphin Subsidiary II, Inc. (BB+/Ba1)(a) |
| | 24,900,000 | | | | 7.250 | | | | 10/15/21 | | | | 24,962,250 | |
| Dynegy Holdings, Inc. (CC/Ca) |
| | 7,000,000 | | | | 7.500 | | | | 06/01/15 | | | | 4,585,000 | |
| Edison Mission Energy (B-/Caa1) |
| | 26,121,000 | | | | 7.000 | | | | 05/15/17 | | | | 15,933,810 | |
| | 8,857,000 | | | | 7.200 | | | | 05/15/19 | | | | 5,048,490 | |
| GenOn Energy, Inc. (B/B3) |
| | 11,500,000 | | | | 9.875 | | | | 10/15/20 | | | | 10,810,000 | |
NRG Energy, Inc. (BB-/B1)(a) |
| | 19,315,000 | | | | 7.625 | | | | 01/15/18 | | | | 17,914,662 | |
| | 18,000,000 | | | | 7.875 | | | | 05/15/21 | | | | 16,380,000 | |
| NV Energy, Inc. (BB+/Ba2) |
| | 11,000,000 | | | | 6.250 | | | | 11/15/20 | | | | 11,330,000 | |
| Puget Energy, Inc. (BB+/Ba1) |
| | 8,045,000 | | | | 6.000 | | | | 09/01/21 | | | | 7,909,610 | |
| The AES Corp. (BB-/B1) |
| | 4,500,000 | | | | 7.750 | | | | 10/15/15 | | | | 4,612,500 | |
| | 14,300,000 | | | | 8.000 | | | | 10/15/17 | | | | 14,300,000 | |
| | 6,000,000 | | | | 8.000 | | | | 06/01/20 | | | | 6,000,000 | |
| | 9,250,000 | | | | 7.375 | (a) | | | 07/01/21 | | | | 8,787,500 | |
| | | | | | | | | | | | | | | |
| | | | | | | | | | | | | | 193,052,802 | |
| |
| |
Utilities – Pipelines – 1.7% |
| Crosstex Energy LP/Crosstex Energy Finance Corp. (B+/B2) |
| | 6,045,000 | | | | 8.875 | | | | 02/15/18 | | | | 6,196,125 | |
| El Paso Corp. (BB-/Ba3) |
| | 10,500,000 | | | | 7.000 | | | | 06/15/17 | | | | 11,812,500 | |
| | 2,555,000 | | | | 7.250 | | | | 06/01/18 | | | | 2,855,213 | |
| | 4,000,000 | | | | 6.500 | | | | 09/15/20 | | | | 4,310,000 | |
| | 2,000,000 | | | | 7.800 | | | | 08/01/31 | | | | 2,275,000 | |
| El Paso Natural Gas Co. (BB/Baa3) |
| | 2,750,000 | | | | 8.375 | | | | 06/15/32 | | | | 3,536,919 | |
| El Paso Pipeline Partners Operating Co. LLC (BB/Ba1) |
| | 4,750,000 | | | | 5.000 | | | | 10/01/21 | | | | 4,750,069 | |
| Energy Transfer Equity LP (BB-/Ba2) |
| | 5,475,000 | | | | 7.500 | | | | 10/15/20 | | | | 5,625,563 | |
Enterprise Products Operating LLC (BB/Ba1)(e) |
| | 3,750,000 | | | | 8.375 | | | | 08/01/66 | | | | 3,890,625 | |
| | 3,285,000 | | | | 7.034 | | | | 01/15/68 | | | | 3,317,850 | |
| MarkWest Energy Partners LP/MarkWest Energy Finance Corp. (BB/Ba3) |
| | 2,500,000 | | | | 6.750 | | | | 11/01/20 | | | | 2,525,000 | |
| Regency Energy Partners LP (BB-/B1) |
| | 9,000,000 | | | | 9.375 | | | | 06/01/16 | | | | 9,630,000 | |
| | 8,250,000 | | | | 6.500 | | | | 07/15/21 | | | | 8,126,250 | |
| Targa Resources Partners LP (NR/B1) |
| | 5,625,000 | | | | 11.250 | | | | 07/15/17 | | | | 6,173,437 | |
| | | | | | | | | | | | | | | |
| | | | | | | | | | | | | | 75,024,551 | |
| |
| |
TOTAL CORPORATE OBLIGATIONS |
(Cost $4,284,171,005) | | $ | 4,027,631,226 | |
| |
| |
| | | | | | | | | | | | | | | |
| | | | | | | | | | | | | | | |
Senior Term Loans(g) – 0.7% |
Automotive Parts – 0.0% |
| Allison Transmission, Inc. (B/B2) |
| $ | 971,990 | | | | 2.980 | % | | | 08/07/14 | | | $ | 914,584 | |
| |
| |
Finance – 0.1% |
| Nuveen Investments, Inc. (B/B3) |
| | 5,150,717 | | | | 3.319 | | | | 11/13/14 | | | | 4,700,029 | |
| |
| |
Gaming – 0.1% |
| Caesars Entertainment Operating Co. (B/Caa1) |
| | 3,750,000 | | | | 3.247 | | | | 01/28/15 | | | | 3,114,863 | |
| |
| |
Media – Broadcasting & Radio – 0.3% |
| Clear Channel Communications, Inc. (CCC+/Caa1) |
| | 23,136,608 | | | | 3.889 | | | | 01/28/16 | | | | 16,144,957 | |
| |
| |
Services Cyclical – Rental Equipment – 0.2% |
| Ahern Rentals, Inc. (CCC+/Ca) |
| | 3,746,539 | | | | 18.000 | | | | 12/15/12 | | | | 3,371,885 | |
| Avis Budget Car Rental LLC (BB/Ba1) |
| | 4,300,000 | | | | 5.000 | | | | 09/21/18 | | | | 4,271,319 | |
| | | | | | | | | | | | | | | |
| | | | | | | | | | | | | | 7,643,204 | |
| |
| |
TOTAL SENIOR TERM LOANS |
(Cost $37,803,679) | | $ | 32,517,637 | |
| |
| |
| | | | | | | | | | | | | | | |
The accompanying notes are an integral part of these financial statements. 55
GOLDMAN SACHS HIGH YIELD FUND
Schedule of Investments (continued)
September 30, 2011 (Unaudited)
| | | | | | | | | | | |
| Shares | | Rate | | Value |
| |
Preferred Stocks – 0.3% |
Ally Financial, Inc.(a) |
| | 5,000 | | | | 7.000 | % | | $ | 3,348,282 | |
| Las Vegas Sands Corp. |
| | 46,250 | | | | 10.000 | | | | 5,168,178 | |
| Lucent Technologies Capital Trust I |
| | 1,175 | | | | 7.750 | | | | 969,375 | |
Spanish Broadcasting Systems, Inc.(b)(c)(d) |
| | 3,074 | | | | 10.750 | | | | 2,121,060 | |
| |
| |
TOTAL PREFERRED STOCKS |
(Cost $13,014,840) | | $ | 11,606,895 | |
| |
| |
| | | | | | | | | | | |
| | | | | | | | | |
| Shares | | Description | | Value |
| |
Common Stocks – 0.1% |
| | 377,456 | | | Accuride Corp.(b) | | $ | 1,932,575 | |
| | 109,952 | | | General Motors Co.(b) | | | 2,218,831 | |
| | 1,035 | | | Leucadia National Corp. | | | 23,474 | |
| | 6,252 | | | Masonite Worldwide Holdings(b) | | | 178,182 | |
| | 90,000 | | | Nortek, Inc.(b) | | | 1,980,000 | |
| | 1,656 | | | Nycomed(b) | | | 22 | |
| | 3,874 | | | Panolam Holdings Co.(b) | | | 39 | |
| | 2,500 | | | Port Townsend Holdings Co., Inc.(b) | | | — | |
| | 250 | | | Simmons Bedding Co.(b) | | | — | |
| |
| |
TOTAL COMMON STOCKS |
(Cost $23,557,937) | | $ | 6,333,123 | |
| |
| |
| | | | | | | | | |
| | | | | | | | | | | |
| | | Expiration
| | |
| Units | | Date | | Value |
| |
Warrants(b) – 0.1% |
| General Motors Co. |
| | 99,955 | | | | 07/10/16 | | | $ | 1,163,476 | |
| | 99,955 | | | | 07/10/19 | | | | 792,643 | |
| Masonite Worldwide Holdings |
| | 30,311 | | | | 06/09/14 | | | | 36,373 | |
| | 22,734 | | | | 05/20/16 | | | | 28,418 | |
| Nortek, Inc. |
| | 11,520 | | | | 12/07/14 | | | | 23,040 | |
| |
| |
TOTAL WARRANTS |
(Cost $8,012,696) | | $ | 2,043,950 | |
| |
| |
TOTAL INVESTMENTS BEFORE SHORT-TERM INVESTMENT |
(Cost $4,366,560,157) | | $ | 4,080,132,831 | |
| |
| |
| | | | | | | | | | | |
| | | | | | | | | | | | | | | |
Principal
| | Interest
| | Maturity
| | |
| Amount | | Rate | | Date | | Value |
| |
Short-term Investment(h) – 5.8% |
Repurchase Agreement – 5.8% |
| Joint Repurchase Agreement Account II |
| $ | 259,600,000 | | | | 0.095 | % | | | 10/03/11 | | | $ | 259,600,000 | |
(Cost $259,600,000) | | | | |
| |
| |
TOTAL INVESTMENTS – 96.9% |
(Cost $4,626,160,157) | | $ | 4,339,732,831 | |
| |
| |
OTHER ASSETS IN EXCESS OF LIABILITIES – 3.1% | | | 138,823,503 | |
| |
| |
NET ASSETS – 100.0% | | $ | 4,478,556,334 | |
| |
| |
The percentage shown for each investment category reflects the value of investments in that category as a percentage of net assets.
| | |
| (a) | | Exempt from registration under Rule 144A of the Securities Act of 1933. Under procedures approved by the Board of Trustees, such securities have been determined to be liquid by the investment adviser and may be resold, normally to qualified institutional buyers in transactions exempt from registration. Total market value of Rule 144A securities amounts to $1,319,527,475, which represents approximately 29.5% of net assets as of September 30, 2011. |
| |
| (b) | | Security is currently in default and/or non-income producing. |
| |
| (c) | | Pay-in-kind securities. |
| |
| (d) | | Security with “Put” features with resetting interest rates. Maturity dates disclosed are the final maturity dates. |
| |
| (e) | | Variable rate security. Interest rate disclosed is that which is in effect at September 30, 2011. |
| |
| (f) | | Issued with a zero coupon. Income is recognized through the accretion of discount. |
| |
| (g) | | Senior Term Loans often require prepayments from excess cash flows or permit the borrower to repay at its election. The degree to which borrowers repay, whether as a contractual requirement or at their election, cannot be predicted with accuracy. As a result, the actual remaining maturity may be substantially less than the stated maturities shown. The stated interest rate represents the weighted average interest rate of all contracts within the senior loan facility at September 30, 2011. Senior Term Loans typically have rates of interest which are redetermined either daily, monthly, quarterly or semi-annually by reference to a base lending rate, plus a premium. These base lending rates are primarily the London-interbank Offered Rate (“LIBOR”), and secondarily the prime rate offered by one or more major United States banks (the “Prime Rate”) and the certificate of deposit (“CD”) rate or other base lending rates used by commercial lenders. |
| |
| (h) | | Joint repurchase agreement was entered into on September 30, 2011. Additional information appears on pages 88-89. |
56 The accompanying notes are an integral part of these financial statements.
GOLDMAN SACHS HIGH YIELD FUND
Security ratings disclosed, if any, are obtained from Standard & Poor’s/Moody’s Investors Service. A brief description of the ratings is available in the Fund’s Statement of Additional Information.
| | | | | |
| |
| |
Currency Abbreviations: |
| CAD | | — | | Canadian Dollar |
| CHF | | — | | Swiss Franc |
| EUR | | — | | Euro |
| GBP | | — | | British Pound |
| |
Investment Abbreviations: |
| NR | | — | | Not Rated |
| WR | | — | | Withdrawn Rating |
| |
| |
| | | | | |
| | | As a % of
|
| | | Net Assets |
| |
| Investments Industry Classifications† |
| Aerospace | | | 0.6 | % |
| Airlines | | | 0.4 | |
| Automotive | | | 2.7 | |
| Automotive Parts | | | 2.2 | |
| Building Materials | | | 0.6 | |
| Capital Goods | | | 1.7 | |
| Chemicals | | | 2.5 | |
| Conglomerates | | | 0.5 | |
| Construction Machinery | | | 0.9 | |
| Consumer Products | | | 2.6 | |
| Defense | | | 0.7 | |
| Emerging Markets | | | 0.8 | |
| Energy | | | 9.1 | |
| Entertainment & Leisure | | | 0.9 | |
| Finance | | | 7.6 | |
| Food | | | 1.6 | |
| Gaming | | | 5.8 | |
| Health Care | | | 8.1 | |
| Home Construction | | | 0.1 | |
| Lodging | | | 0.4 | |
| Media | | | 6.1 | |
| Metals | | | 2.0 | |
| Packaging | | | 3.7 | |
| Paper | | | 1.0 | |
| Printing | | | 0.3 | |
| Publishing | | | 0.4 | |
| Real Estate | | | 0.4 | |
| Restaurants | | | 0.7 | |
| Retailers | | | 2.3 | |
| Services Cyclical | | | 3.3 | |
| Short-term Investments# | | | 8.9 | |
| Technology | | | 5.2 | |
| Telecommunications | | | 8.2 | |
| Textiles & Apparel | | | 0.6 | |
| Transportation | | | 0.7 | |
| Utilities | | | 6.4 | |
| |
| |
| TOTAL INVESTMENTS | | | 100.0 | % |
| |
| |
| | |
| † | | Industry concentrations greater than one-tenth of one percent are disclosed. |
| |
| # | | Short-term Investments include repurchase agreements and other assets/liabilities. |
The accompanying notes are an integral part of these financial statements. 57
GOLDMAN SACHS HIGH YIELD FUND
Schedule of Investments (continued)
September 30, 2011 (Unaudited)
| |
| ADDITIONAL INVESTMENT INFORMATION | |
FORWARD FOREIGN CURRENCY EXCHANGE CONTRACTS — At September 30, 2011, the Fund had outstanding forward foreign currency exchange contracts, both to purchase and sell foreign currencies:
FORWARD FOREIGN CURRENCY EXCHANGE CONTRACTS WITH UNREALIZED GAIN
| | | | | | | | | | | | | |
| | | Contracts to
| | Expiration
| | Current
| | Unrealized
|
| Counterparty | | Buy/Sell | | Date | | Value | | Gain |
| |
| Barclays Bank PLC | | USD/GBP | | 10/05/11 | | $ | 29,260,428 | | | $ | 1,176,169 | |
| Citibank NA | | USD/EUR | | 10/05/11 | | | 292,711,954 | | | | 18,637,681 | |
| Deutsche Bank AG (London) | | USD/CAD | | 10/05/11 | | | 12,282,634 | | | | 883,717 | |
| |
| |
TOTAL | | | | | | | | | | $ | 20,697,567 | |
| |
| |
FORWARD FOREIGN CURRENCY EXCHANGE CONTRACTS WITH UNREALIZED LOSS
| | | | | | | | | | | | | |
| | | Contracts to
| | Expiration
| | Current
| | Unrealized
|
| Counterparty | | Buy/Sell | | Date | | Value | | Loss |
| |
| Royal Bank of Canada | | GBP/USD | | 10/05/11 | | $ | 15,372,578 | | | $ | (185,333 | ) |
| UBS AG (London) | | EUR/USD | | 10/05/11 | | | 23,807,776 | | | | (420,317 | ) |
| |
| |
TOTAL | | | | | | | | | | $ | (605,650 | ) |
| |
| |
58 The accompanying notes are an integral part of these financial statements.
GOLDMAN SACHS HIGH YIELD FLOATING RATE FUND
Schedule of Investments
September 30, 2011 (Unaudited)
| | | | | | | | | | | | | | | |
Principal
| | Interest
| | Maturity
| | |
| Amount | | Rate | | Date | | Value |
| |
Corporate Obligations – 6.4% |
Airlines(a)(b) – 0.2% |
| Delta Air Lines, Inc. (BB-/Ba2) |
| $ | 1,000,000 | | | | 9.500 | % | | | 09/15/14 | | | $ | 1,040,000 | |
| |
| |
Chemicals(a) – 0.6% |
Lyondell Chemical Co. (BB+/Ba1)(b) |
| | 2,000,000 | | | | 8.000 | | | | 11/01/17 | | | | 2,155,000 | |
| Lyondell Chemical Co. (BB-/Ba3) |
| | 1,500,000 | | | | 11.000 | | | | 05/01/18 | | | | 1,616,250 | |
| | | | | | | | | | | | | | | |
| | | | | | | | | | | | | | 3,771,250 | |
| |
| |
Commercial Services(a)(b) – 0.3% |
| Altegrity, Inc. (CCC+/Caa2) |
| | 2,000,000 | | | | 10.500 | | | | 11/01/15 | | | | 1,865,000 | |
| |
| |
Consumer Products – Household & Leisure(a) – 0.1% |
| Spectrum Brands Holdings, Inc. (B/B1) |
| | 750,000 | | | | 9.500 | | | | 06/15/18 | | | | 795,000 | |
| |
| |
Energy – Coal(a)(b) – 0.4% |
| Arch Coal, Inc. (B+/B1) |
| | 2,600,000 | | | | 7.000 | | | | 06/15/19 | | | | 2,470,000 | |
| |
| |
Environmental(a) – 0.7% |
| Clean Harbors, Inc. (BB+/Ba3) |
| | 4,000,000 | | | | 7.625 | | | | 08/15/16 | | | | 4,180,000 | |
| |
| |
Finance(a)(b) – 0.3% |
| International Lease Finance Corp. (BBB-/Ba3) |
| | 2,000,000 | | | | 7.125 | | | | 09/01/18 | | | | 1,960,000 | |
| |
| |
Gaming(a) – 0.2% |
| MGM Resorts International (B/Ba3) |
| | 1,000,000 | | | | 11.125 | | | | 11/15/17 | | | | 1,095,000 | |
| |
| |
Health Care(a) – 0.3% |
| Community Health Systems, Inc. (B/B3) |
| | 2,000,000 | | | | 8.875 | | | | 07/15/15 | | | | 1,960,000 | |
| |
| |
Health Care – Services(a) – 0.4% |
| American Renal Holdings Co., Inc. (B/B2) |
| | 1,000,000 | | | | 8.375 | | | | 05/15/18 | | | | 1,005,000 | |
| OnCure Holdings, Inc. (B/B3) |
| | 1,500,000 | | | | 11.750 | | | | 05/15/17 | | | | 1,327,500 | |
| | | | | | | | | | | | | | | |
| | | | | | | | | | | | | | 2,332,500 | |
| |
| |
Packaging(a) – 0.7% |
Berry Plastics Corp. (B/B1)(c) |
| | 2,000,000 | | | | 4.999 | | | | 02/15/15 | | | | 1,832,500 | |
Reynolds Group Issuer, Inc. (BB-/Ba3)(b) |
| | 2,000,000 | | | | 8.750 | | | | 10/15/16 | | | | 1,990,000 | |
| | | | | | | | | | | | | | | |
| | | | | | | | | | | | | | 3,822,500 | |
| |
| |
Paper(a)(b) – 0.1% |
| Longview Fibre Paper & Packaging, Inc. (B+/B2) |
| | 750,000 | | | | 8.000 | | | | 06/01/16 | | | | 729,375 | |
| |
| |
Technology – Software/Services – 0.3% |
| Network Solutions, Inc. (B/B1) |
| | 1,769,666 | | | | 2.490 | | | | 03/07/14 | | | | 1,743,121 | |
| |
| |
Telecommunications – Cellular(a) – 1.1% |
| Nextel Communications, Inc. (BB-/Ba3) |
| | 1,500,000 | | | | 6.875 | | | | 10/31/13 | | | | 1,466,250 | |
| | 3,250,000 | | | | 5.950 | | | | 03/15/14 | | | | 3,038,750 | |
Wind Acquisition Finance SA (BB/Ba2)(b) |
| | 2,000,000 | | | | 7.250 | | | | 02/15/18 | | | | 1,700,000 | |
| | | | | | | | | | | | | | | |
| | | | | | | | | | | | | | 6,205,000 | |
| |
| |
Textiles & Apparel(a)(c) – 0.4% |
| Hanesbrands, Inc. (BB-/B1) |
| | 2,500,000 | | | | 3.770 | | | | 12/15/14 | | | | 2,393,750 | |
| |
| |
Utilities – Pipelines(a) – 0.3% |
| MarkWest Energy Partners LP/MarkWest Energy Finance Corp. (BB/Ba3) |
| | 1,500,000 | | | | 8.750 | | | | 04/15/18 | | | | 1,590,000 | |
| |
| |
TOTAL CORPORATE OBLIGATIONS |
(Cost $39,987,266) | | $ | 37,952,496 | |
| |
| |
| | | | | | | | | | | | | | | |
| | | | | | | | | | | | | | | |
Senior Term Loans(d) – 83.5% |
Aerospace – 1.1% |
| Transdigm, Inc. (BB-/Ba2) |
| $ | 6,967,412 | | | | 4.000 | % | | | 02/14/17 | | | $ | 6,798,661 | |
| |
| |
Airlines – 1.4% |
| Delta Air Lines, Inc. (BB-/Ba2) |
| | 1,743,744 | | | | 4.250 | | | | 03/07/16 | | | | 1,593,346 | |
| | 7,431,375 | | | | 5.500 | | | | 04/20/17 | | | | 6,994,782 | |
| | | | | | | | | | | | | | | |
| | | | | | | | | | | | | | 8,588,128 | |
| |
| |
Automotive – 0.9% |
| Autoparts Holdings Ltd. (B-/Caa1) |
| | 1,000,000 | | | | 10.500 | | | | 01/29/18 | | | | 980,000 | |
| Chrysler Group LLC (B+/B2) |
| | 4,987,500 | | | | 6.000 | | | | 05/24/17 | | | | 4,335,584 | |
| | | | | | | | | | | | | | | |
| | | | | | | | | | | | | | 5,315,584 | |
| |
| |
Automotive – Parts – 5.1% |
| Allison Transmission, Inc. (B/B2) |
| | 5,826,420 | | | | 2.980 | | | | 08/07/14 | | | | 5,482,312 | |
| Delphi Corp. (BBB/Baa3) |
| | 10,276,316 | | | | 3.500 | | | | 03/31/17 | | | | 10,135,017 | |
| Remy International, Inc. (B+/B1) |
| | 3,974,045 | | | | 6.250 | | | | 12/16/16 | | | | 3,820,051 | |
| Tomkins LLC (BB/NR) |
| | 11,241,508 | | | | 4.250 | | | | 09/21/16 | | | | 11,009,708 | |
| | | | | | | | | | | | | | | |
| | | | | | | | | | | | | | 30,447,088 | |
| |
| |
Brokerage – 0.7% |
| MSCI, Inc. (BB+/Ba2) |
| | 3,980,000 | | | | 3.750 | | | | 03/14/17 | | | | 3,948,160 | |
| |
| |
Chemicals – 4.0% |
| Ashland, Inc. (BB/Baa3) |
| | 5,500,000 | | | | 3.750 | | | | 08/23/18 | | | | 5,451,875 | |
| Nalco Co. (BB+/Ba1) |
| | 6,818,711 | | | | 4.500 | | | | 10/05/17 | | | | 6,773,571 | |
| Rockwood Specialties Group, Inc. (BBB-/Ba1) |
| | 4,477,500 | | | | 3.750 | | | | 02/09/18 | | | | 4,453,501 | |
| Solutia, Inc.(BB+/Ba1) |
| | 7,228,752 | | | | 3.500 | | | | 08/01/17 | | | | 7,058,876 | |
| | | | | | | | | | | | | | | |
| | | | | | | | | | | | | | 23,737,823 | |
| |
| |
The accompanying notes are an integral part of these financial statements. 59
GOLDMAN SACHS HIGH YIELD FLOATING RATE FUND
Schedule of Investments (continued)
September 30, 2011 (Unaudited)
| | | | | | | | | | | | | | | |
Principal
| | Interest
| | Maturity
| | |
| Amount | | Rate | | Date | | Value |
| |
Senior Term Loans(d) – (continued) |
| | | | | | | | | | | | | | | |
Consumer Products – Household & Leisure – 2.2% |
| Armored Autogroup, Inc. (B+/Ba3) |
| $ | 1,989,975 | | | | 6.000 | % | | | 11/04/16 | | | $ | 1,838,239 | |
| BJ’s Wholesale Club, Inc. (NR/NR) |
| | 3,500,000 | | | | 0.000 | | | | 09/28/18 | | | | 3,381,875 | |
| | 1,500,000 | | | | 0.000 | | | | 03/15/19 | | | | 1,448,445 | |
| Huish Detergents, Inc. (BB/B2) |
| | 1,000,000 | | | | 4.490 | | | | 10/26/14 | | | | 843,750 | |
| Renfro Corp. (B/B2) |
| | 2,487,437 | | | | 5.500 | | | | 05/23/17 | | | | 2,387,939 | |
| Spectrum Brands, Inc. (B/B1) |
| | 1,769,060 | | | | 5.000 | | | | 06/17/16 | | | | 1,745,178 | |
| Visant Holding Corp. (BB-/B1) |
| | 1,492,481 | | | | 5.250 | | | | 12/22/16 | | | | 1,358,994 | |
| | | | | | | | | | | | | | | |
| | | | | | | | | | | | | | 13,004,420 | |
| |
| |
Diversified Manufacturing – 0.3% |
| Manitowoc Co., Inc. (BB/Ba2) |
| | 1,995,000 | | | | 4.250 | | | | 11/13/17 | | | | 1,928,926 | |
| |
| |
Energy – 1.7% |
| AES Corp.(BB+/Ba1) |
| | 7,467,487 | | | | 4.250 | | | | 06/01/18 | | | | 7,291,479 | |
| Frac Tech International LLC (NR/B2) |
| | 3,000,000 | | | | 6.250 | | | | 05/06/16 | | | | 2,933,850 | |
| | | | | | | | | | | | | | | |
| | | | | | | | | | | | | | 10,225,329 | |
| |
| |
Energy – Coal – 1.9% |
| Walter Energy, Inc. (BB-/NR) |
| | 11,476,250 | | | | 4.000 | | | | 04/02/18 | | | | 11,060,236 | |
| |
| |
Entertainment – 0.5% |
| Rovi Solutions Corp. (BB+/Ba1) |
| | 2,879,253 | | | | 4.000 | | | | 02/07/18 | | | | 2,828,866 | |
| |
| |
Environmental – 0.5% |
| EnergySolutions LLC (BB+/Ba2) |
| | 2,925,513 | | | | 6.250 | | | | 08/12/16 | | | | 2,867,002 | |
| |
| |
Finance – 0.5% |
| iPayment, Inc.(B+/Ba2) |
| | 1,634,267 | | | | 5.750 | | | | 05/08/17 | | | | 1,585,239 | |
| Springleaf Finance Corp. (B+/B2) |
| | 1,500,000 | | | | 5.500 | | | | 05/10/17 | | | | 1,296,000 | |
| | | | | | | | | | | | | | | |
| | | | | | | | | | | | | | 2,881,239 | |
| |
| |
Food & Beverages – 6.0% |
| Burger King Corp. (BB-/Ba3) |
| | 4,974,937 | | | | 4.500 | | | | 10/19/16 | | | | 4,792,755 | |
| Del Monte Foods Co. (B+/Ba3) |
| | 6,982,500 | | | | 4.500 | | | | 03/08/18 | | | | 6,476,269 | |
| Dole Food Co. Inc. (BB-/Ba2) |
| | 956,235 | | | | 5.045 | | | | 07/06/18 | | | | 940,104 | |
| | 1,775,865 | | | | 5.057 | | | | 07/06/18 | | | | 1,745,906 | |
| Michael Foods Group, Inc. (BB-/B1) |
| | 9,201,256 | | | | 4.250 | | | | 02/23/18 | | | | 8,879,212 | |
| NBTY, Inc. (BB-/Ba3) |
| | 9,949,875 | | | | 4.250 | | | | 10/02/17 | | | | 9,622,026 | |
| U.S. Foodservice, Inc. (NR/B3) |
| | 3,233,117 | | | | 2.737 | | | | 07/03/14 | | | | 2,944,173 | |
| | | | | | | | | | | | | | | |
| | | | | | | | | | | | | | 35,400,445 | |
| |
| |
Gaming – 2.1% |
| Caesars Entertainment Operating Co. (B/Caa1) |
| | 3,500,000 | | | | 3.247 | | | | 01/28/15 | | | | 2,907,205 | |
| Chester Downs and Marina LLC (B+/B3) |
| | 3,988,515 | | | | 12.375 | | | | 07/29/16 | | | | 3,968,572 | |
| Isle of Capri Casinos, Inc. (NR/Ba3) |
| | 3,775,037 | | | | 4.750 | | | | 11/01/13 | | | | 3,689,118 | |
| MGM Mirage, Inc. (CCC+/B3) |
| | 2,000,000 | | | | 7.000 | | | | 02/21/14 | | | | 1,881,000 | |
| | | | | | | | | | | | | | | |
| | | | | | | | | | | | | | 12,445,895 | |
| |
| |
Health Care – 8.1% |
| Community Health Systems, Inc. (BB/Ba3) |
| | 316,131 | | | | 2.569 | | | | 07/25/14 | | | | 295,108 | |
| | 6,161,554 | | | | 2.569 | | | | 07/25/14 | | | | 5,751,811 | |
| Convatec, Inc. (B+/Ba3) |
| | 6,467,419 | | | | 5.750 | | | | 12/22/16 | | | | 6,160,216 | |
| HCA, Inc. (BB-/Ba3) |
| | 9,000,000 | | | | 3.619 | | | | 03/31/17 | | | | 8,453,250 | |
| HCA, Inc. (BB/Ba3) |
| | 7,650,000 | | | | 3.250 | | | | 02/15/20 | | | | 7,439,625 | |
| Health Management Associates, Inc. (BB-/B1) |
| | 1,818,034 | | | | 1.750 | | | | 02/28/14 | | | | 1,707,189 | |
| MedAssets, Inc. (BB-/Ba3) |
| | 3,777,123 | | | | 5.250 | | | | 11/16/16 | | | | 3,687,416 | |
| Multiplan, Inc. (B/Ba3) |
| | 11,497,972 | | | | 4.750 | | | | 08/26/17 | | | | 10,856,041 | |
| Renal Advantage Holdings, Inc. (B/Ba3) |
| | 3,989,950 | | | | 5.750 | | | | 12/16/16 | | | | 3,963,337 | |
| | | | | | | | | | | | | | | |
| | | | | | | | | | | | | | 48,313,993 | |
| |
| |
Health Care – Medical Products – 0.5% |
| Biomet, Inc. (BB-/B1) |
| | 2,987,040 | | | | 3.314 | | | | 03/25/15 | | | | 2,846,858 | |
| |
| |
Health Care – Pharmaceutical – 1.2% |
| Aptalis Pharma, Inc. (NR/B1) |
| | 1,238,734 | | | | 5.500 | | | | 02/10/17 | | | | 1,094,422 | |
| Endo Pharmaceuticals Holdings, Inc. (BBB-/Ba1) |
| | 3,218,571 | | | | 4.000 | | | | 06/18/18 | | | | 3,201,320 | |
| Warner Chilcott Corp.(BBB-/Ba3) |
| | 1,364,571 | | | | 4.250 | | | | 03/15/18 | | | | 1,325,476 | |
| | 938,143 | | | | 4.250 | | | | 03/15/18 | | | | 911,265 | |
| Warner Chilcott Corp. LLC (BBB-/Ba3) |
| | 682,286 | | | | 4.250 | | | | 03/15/18 | | | | 662,738 | |
| | | | | | | | | | | | | | | |
| | | | | | | | | | | | | | 7,195,221 | |
| |
| |
Health Care – Services – 4.9% |
| DaVita, Inc. (BB/Ba2) |
| | 15,429,181 | | | | 4.500 | | | | 10/20/16 | | | | 15,217,029 | |
| Emdeon Business Services LLC (BB/Ba3) |
| | 2,650,314 | | | | 2.240 | | | | 11/18/13 | | | | 2,625,480 | |
| Emergency Medical Services Corp. (B+/B1) |
| | 2,238,750 | | | | 5.250 | | | | 05/25/18 | | | | 2,126,186 | |
| Universal Health Services, Inc. (BB+/NR) |
| | 6,216,010 | | | | 4.000 | | | | 11/15/16 | | | | 6,018,403 | |
| Valitas Health Services, Inc. (NR/Ba3) |
| | 2,992,500 | | | | 5.750 | | | | 05/18/17 | | | | 2,887,762 | |
| | | | | | | | | | | | | | | |
| | | | | | | | | | | | | | 28,874,860 | |
| |
| |
Lodging – 0.5% |
| Ameristar Casinos, Inc. (NR/Ba3) |
| | 995,000 | | | | 4.000 | | | | 04/13/18 | | | | 960,076 | |
| Las Vegas Sands LLC (BB-/Ba3) |
| | 1,238,371 | | | | 1.740 | | | | 05/23/14 | | | | 1,180,019 | |
60 The accompanying notes are an integral part of these financial statements.
GOLDMAN SACHS HIGH YIELD FLOATING RATE FUND
| | | | | | | | | | | | | | | |
Principal
| | Interest
| | Maturity
| | |
| Amount | | Rate | | Date | | Value |
| |
Senior Term Loans(d) – (continued) |
Lodging – (continued) |
| | | | | | | | | | | | | | | |
| Las Vegas Sands LLC (BB/Ba3) |
| $ | 254,057 | | | | 1.740 | % | | | 05/23/14 | | | $ | 242,086 | |
| Las Vegas Sands LLC (B+/B3) |
| | 414,227 | | | | 2.740 | | | | 11/23/16 | | | | 384,830 | |
| Las Vegas Sands LLC (B-/B3) |
| | 83,254 | | | | 2.740 | | | | 11/23/16 | | | | 77,345 | |
| | | | | | | | | | | | | | | |
| | | | | | | | | | | | | | 2,844,356 | |
| |
| |
Media – Broadcasting & Radio – 2.8% |
| Cumulus Media, Inc. (B/Ba2) |
| | 3,850,000 | | | | 5.750 | | | | 09/17/18 | | | | 3,620,193 | |
| | 1,000,000 | | | | 7.500 | | | | 02/11/19 | | | | 942,500 | |
| Hubbard Radio LLC (NR/Caa1) |
| | 4,239,375 | | | | 5.250 | | | | 04/28/17 | | | | 4,069,800 | |
| | 2,750,000 | | | | 8.750 | | | | 04/30/18 | | | | 2,677,813 | |
| Univision Communications, Inc. (B-/B2) |
| | 6,000,000 | | | | 4.489 | | | | 03/31/17 | | | | 5,035,020 | |
| | | | | | | | | | | | | | | |
| | | | | | | | | | | | | | 16,345,326 | |
| |
| |
Media – Cable – 1.9% |
| Charter Communications Operating LLC (BB+/Ba2) |
| | 6,959,532 | | | | 3.500 | | | | 09/06/16 | | | | 6,715,949 | |
| CSC Holdings, Inc. (BBB-/Baa3) |
| | 2,984,211 | | | | 1.985 | | | | 03/29/16 | | | | 2,897,161 | |
| | 1,989,899 | | | | 1.985 | | | | 03/29/16 | | | | 1,925,227 | |
| | | | | | | | | | | | | | | |
| | | | | | | | | | | | | | 11,538,337 | |
| |
| |
Media – Non Cable – 2.3% |
| Lamar Media Corp. (BB/Baa3) |
| | 947,778 | | | | 4.000 | | | | 12/30/16 | | | | 934,746 | |
| Nielsen Finance LLC (NR/Ba2) |
| | 6,462,255 | | | | 3.476 | | | | 05/02/16 | | | | 6,195,686 | |
| Weather Channel (BB-/Ba3) |
| | 6,982,456 | | | | 4.250 | | | | 02/13/17 | | | | 6,882,118 | |
| | | | | | | | | | | | | | | |
| | | | | | | | | | | | | | 14,012,550 | |
| |
| |
Metals – 2.3% |
| Metaldyne Co. LLC (B+/B1) |
| | 2,985,000 | | | | 5.250 | | | | 05/18/17 | | | | 2,887,988 | |
| Novelis, Inc. (BB-/Ba2) |
| | 8,949,887 | | | | 3.750 | | | | 03/10/17 | | | | 8,692,578 | |
| Potters Industries (NR/Ba3) |
| | 997,500 | | | | 6.000 | | | | 05/05/17 | | | | 957,600 | |
| Potters Industries (NR/Caa1) |
| | 1,000,000 | | | | 10.250 | | | | 11/13/17 | | | | 970,000 | |
| | | | | | | | | | | | | | | |
| | | | | | | | | | | | | | 13,508,166 | |
| |
| |
Metals & Mining – 0.4% |
| SunCoke Energy, Inc (BB+/Ba1) |
| | 2,493,750 | | | | 4.000 | | | | 07/26/18 | | | | 2,456,344 | |
| |
| |
Packaging – 1.4% |
| LabelCorp Holdings, Inc. (B+/B1) |
| | 3,491,250 | | | | 7.000 | | | | 05/31/17 | | | | 3,438,881 | |
| Reynolds Group Holdings, Inc. (NR/Ba3) |
| | 3,976,259 | | | | 5.250 | | | | 02/09/18 | | | | 3,851,564 | |
| Reynolds Group Holdings, Inc. (NR/Ba3) |
| | 1,000,000 | | | | 5.250 | | | | 08/09/18 | | | | 968,890 | |
| | | | | | | | | | | | | | | |
| | | | | | | | | | | | | | 8,259,335 | |
| |
| |
Restaurants – 1.9% |
| DineEquity, Inc. (BB-/Ba2) |
| | 4,750,000 | | | | 4.250 | | | | 10/19/17 | | | | 4,589,165 | |
| Dunkin’ Brands, Inc. (B/B3) |
| | 5,974,987 | | | | 4.000 | | | | 11/23/17 | | | | 5,773,929 | |
| OSI Restaurant Partners LLC (BB-/B1) |
| | 88,361 | | | | 2.413 | | | | 06/14/13 | | | | 82,021 | |
| OSI Restaurant Partners LLC (B+/B3) |
| | 905,852 | | | | 2.563 | | | | 06/14/14 | | | | 840,857 | |
| | | | | | | | | | | | | | | |
| | | | | | | | | | | | | | 11,285,972 | |
| |
| |
Retailers – 6.8% |
| Academy Ltd. (B/B2) |
| | 2,500,000 | | | | 4.500 | | | | 08/03/18 | | | | 2,386,450 | |
| Bass Pro Group LLC (BB-/Ba3) |
| | 3,491,250 | | | | 5.254 | | | | 06/13/17 | | | | 3,352,333 | |
| CDWC LLC (B/B2) |
| | 3,500,000 | | | | 4.250 | | | | 07/14/17 | | | | 3,106,250 | |
| Dollar General Corp.(BB-/Ba3) |
| | 4,000,000 | | | | 2.991 | | | | 07/07/14 | | | | 3,960,400 | |
| General Nutrition Centers, Inc. (B+/B1) |
| | 2,062,500 | | | | 4.250 | | | | 03/02/18 | | | | 2,002,089 | |
| Gymboree Corp. (B+/B1) |
| | 746,241 | | | | 5.000 | | | | 02/23/18 | | | | 663,736 | |
| Michaels Stores, Inc. (B/B2) |
| | 8,239,496 | | | | 4.802 | | | | 07/31/16 | | | | 7,853,311 | |
| Neiman-Marcus Group, Inc. (BB-/B3) |
| | 2,125,000 | | | | 4.750 | | | | 05/16/18 | | | | 1,960,908 | |
| Petco Animal Supplies, Inc. (B/B1) |
| | 5,500,000 | | | | 4.500 | | | | 11/24/17 | | | | 5,193,375 | |
| Pilot Travel Centers LLC (BB+/Ba2) |
| | 4,387,500 | | | | 4.250 | | | | 03/30/18 | | | | 4,319,845 | |
| Savers, Inc. (BB-/Ba3) |
| | 2,985,000 | | | | 4.250 | | | | 03/03/17 | | | | 2,930,285 | |
| Supervalu, Inc. (BB-/Ba3) |
| | 2,985,000 | | | | 4.500 | | | | 04/28/18 | | | | 2,746,588 | |
| | | | | | | | | | | | | | | |
| | | | | | | | | | | | | | 40,475,570 | |
| |
| |
Services Cyclical – Business Services – 5.5% |
| Fifth Third Processing Solutions LLC (BB-/Ba3) |
| | 6,222,491 | | | | 4.500 | | | | 11/03/16 | | | | 6,009,121 | |
| First Data Corp. (B+/B1) |
| | 3,907,890 | | | | 2.985 | | | | 09/24/14 | | | | 3,387,672 | |
| | 3,785,076 | | | | 4.235 | | | | 03/23/18 | | | | 3,058,039 | |
| ServiceMaster Co. (B+/B1) |
| | 382,906 | | | | 2.740 | | | | 07/24/14 | | | | 356,941 | |
| | 3,845,016 | | | | 2.744 | | | | 07/24/14 | | | | 3,584,285 | |
| Trans Union LLC (NR/Ba3) |
| | 8,955,000 | | | | 4.750 | | | | 02/12/18 | | | | 8,719,931 | |
| Waste Industries USA, Inc. (B+/B1) |
| | 2,985,000 | | | | 4.750 | | | | 03/17/17 | | | | 2,798,438 | |
| West Corp. (BB-/Ba3) |
| | 1,000,000 | | | | 4.567 | | | | 07/15/16 | | | | 965,420 | |
| | 3,585,538 | | | | 4.570 | | | | 07/15/16 | | | | 3,461,550 | |
| | | | | | | | | | | | | | | |
| | | | | | | | | | | | | | 32,341,397 | |
| |
| |
Services Cyclical – Consumer Services – 0.7% |
| Acosta, Inc. (B+/NR) |
| | 4,518,675 | | | | 4.750 | | | | 03/01/18 | | | $ | 4,304,038 | |
| |
| |
The accompanying notes are an integral part of these financial statements. 61
GOLDMAN SACHS HIGH YIELD FLOATING RATE FUND
Schedule of Investments (continued)
September 30, 2011 (Unaudited)
| | | | | | | | | | | | | | | |
Principal
| | Interest
| | Maturity
| | |
| Amount | | Rate | | Date | | Value |
| |
Senior Term Loans(d) – (continued) |
| | | | | | | | | | | | | | | |
Services Cyclical – Rental Equipment – 0.5% |
| Avis Budget Car Rental LLC (BB/Ba1) |
| $ | 750,000 | | | | 5.000 | % | | | 09/21/18 | | | $ | 744,997 | |
| BakerCorp International, Inc. (B/Ba3) |
| | 2,000,000 | | | | 5.000 | | | | 06/01/18 | | | | 1,920,000 | |
| | | | | | | | | | | | | | | |
| | | | | | | | | | | | | | 2,664,997 | |
| |
| |
Technology – 0.5% |
| Sensata Technologies Finance Co. LLC (BB+/Ba3) |
| | 2,992,500 | | | | 4.000 | | | | 05/11/18 | | | | 2,904,610 | |
| |
| |
Technology – Software/Services – 4.2% |
| Aspect Software, Inc. (B+/Ba3) |
| | 2,840,256 | | | | 6.250 | | | | 05/06/16 | | | | 2,795,891 | |
| Autotrader.com, Inc. (BB+/Ba3) |
| | 6,969,987 | | | | 4.000 | | | | 12/15/16 | | | | 6,795,738 | |
| CCC Information Services, Inc.(B+/B1) |
| | 2,000,000 | | | | 5.500 | | | | 11/11/15 | | | | 1,954,000 | |
| Dealer Computer Services, Inc. (BB+/Ba2) |
| | 3,990,000 | | | | 3.750 | | | | 04/20/18 | | | | 3,900,225 | |
| Sungard Data Systems, Inc. (BB/Ba3) |
| | 10,000,000 | | | | 3.892 | | | | 02/26/16 | | | | 9,618,800 | |
| | | | | | | | | | | | | | | |
| | | | | | | | | | | | | | 25,064,654 | |
| |
| |
Telecommunications – Internet & Data – 1.4% |
| Level 3 Financing, Inc. (B+/Ba3) |
| | 5,000,000 | | | | 8.500 | | | | 03/13/14 | | | | 5,200,000 | |
| Level 3 Financing, Inc. (B+/Ba3) |
| | 3,000,000 | | | | 4.250 | | | | 09/03/18 | | | | 2,840,010 | |
| | | | | | | | | | | | | | | |
| | | | | | | | | | | | | | 8,040,010 | |
| |
| |
Telecommunications – Wirelines – 1.2% |
| CommScope, Inc. (BB/Ba3) |
| | 7,289,940 | | | | 5.000 | | | | 01/14/18 | | | | 7,139,622 | |
| |
| |
Utilities – Electric – 1.7% |
| Calpine Corp. (B+/B1) |
| | 10,696,250 | | | | 4.500 | | | | 04/02/18 | | | | 10,047,095 | |
| |
| |
Wireless Telecommunications – 3.9% |
| BBHI Acquisition LLC (BB+/Ba3) |
| | 7,917,899 | | | | 4.500 | | | | 12/14/17 | | | | 7,620,977 | |
| Intelsat Jackson Holdings SA (BB-/B1) |
| | 12,967,500 | | | | 5.250 | | | | 04/02/18 | | | | 12,351,544 | |
| Telx Group, Inc. (B+/B1) |
| | 3,500,000 | | | | 6.500 | | | | 10/06/17 | | | | 3,330,845 | |
| | | | | | | | | | | | | | | |
| | | | | | | | | | | | | | 23,303,366 | |
| |
| |
TOTAL SENIOR TERM LOANS |
(Cost $514,045,710) | | $ | 495,244,479 | |
| |
| |
TOTAL INVESTMENTS BEFORE SHORT-TERM INVESTMENT |
(Cost $554,032,976) | | $ | 533,196,975 | |
| |
| |
| | | | | | | | | | | | | | | |
| | | | | | | | | | | | | | | |
Short-term Investment(e) – 14.5% |
Repurchase Agreement – 14.5% |
| Joint Repurchase Agreement Account II |
| $ | 86,000,000 | | | | 0.095 | % | | | 10/03/11 | | | $ | 86,000,000 | |
(Cost $86,000,000) | | | | |
| |
| |
TOTAL INVESTMENTS – 104.4% |
(Cost $640,032,976) | | $ | 619,196,975 | |
| |
| |
LIABILITIES IN EXCESS OF OTHER ASSETS – (4.4)% | | | (26,145,512 | ) |
| |
| |
NET ASSETS – 100.0% | | $ | 593,051,463 | |
| |
| |
The percentage shown for each investment category reflects the value of investments in that category as a percentage of net assets.
| | |
| (a) | | Security with “Call” features with resetting interest rates. Maturity dates disclosed are the final maturity dates. |
| |
| (b) | | Exempt from registration under Rule 144A of the Securities Act of 1933. Under procedures approved by the Board of Trustees, such securities have been determined to be liquid by the investment adviser and may be resold, normally to qualified institutional buyers in transactions exempt from registration. Total market value of Rule 144A securities amounts to $13,909,375, which represents approximately 2.4% of net assets as of September 30, 2011. |
| |
| (c) | | Variable rate security. Interest rate disclosed is that which is in effect at September 30, 2011. |
| |
| (d) | | Senior Term Loans often require prepayments from excess cash flows or permit the borrower to repay at its election. The degree to which borrowers repay, whether as a contractual requirement or at their election, cannot be predicted with accuracy. As a result, the actual remaining maturity may be substantially less than the stated maturities shown. The stated interest rate represents the weighted average interest rate of all contracts within the senior loan facility at September 30, 2011. Senior Term Loans typically have rates of interest which are redetermined either daily, monthly, quarterly or semi-annually by reference to a base lending rate, plus a premium. These base lending rates are primarily the London-interbank Offered Rate (“LIBOR”), and secondarily the prime rate offered by one or more major United States banks (the “Prime Rate”) and the certificate of deposit (“CD”) rate or other base lending rates used by commercial lenders. |
| |
| (e) | | Joint repurchase agreement was entered into on September 30, 2011. Additional information appears on pages 88-89. |
Security ratings disclosed, if any, are obtained from Standard & Poor’s /Moody’s Investors Service. A brief description of the ratings is available in the Fund’s Statement of Additional Information.
| | | | | |
| |
| |
Investment Abbreviations: |
| NR | | — | | Not Rated |
| |
| |
62 The accompanying notes are an integral part of these financial statements.
GOLDMAN SACHS INVESTMENT GRADE CREDIT FUND
Schedule of Investments
September 30, 2011 (Unaudited)
| | | | | | | | | | | | | | | |
Principal
| | Interest
| | Maturity
| | |
| Amount | | Rate | | Date | | Value |
| |
Corporate Obligations – 79.5% |
Banks – 17.3% |
| Abbey National Treasury Services PLC |
| $ | 2,700,000 | | | | 2.875 | % | | | 04/25/14 | | | $ | 2,521,821 | |
| | 3,875,000 | | | | 4.000 | | | | 04/27/16 | | �� | | 3,532,725 | |
ANZ Capital Trust II(a)(b) |
| | 2,800,000 | | | | 5.360 | | | | 12/15/49 | | | | 2,740,500 | |
Astoria Financial Corp.(b) |
| | 2,900,000 | | | | 5.750 | | | | 10/15/12 | | | | 3,002,091 | |
| Bank of America Corp. |
| | 7,950,000 | | | | 5.625 | | | | 07/01/20 | | | | 7,400,599 | |
Bank of Scotland PLC(a) |
| | 1,000,000 | | | | 5.250 | | | | 02/21/17 | | | | 1,080,461 | |
Capital One Capital IV(b)(c) |
| | 6,400,000 | | | | 6.745 | | | | 02/17/37 | | | | 6,112,000 | |
Citigroup Capital XXI(b)(c) |
| | 5,277,000 | | | | 8.300 | | | | 12/21/57 | | | | 5,158,267 | |
| Citigroup, Inc. |
| | 3,975,000 | | | | 5.500 | | | | 10/15/14 | | | | 4,141,282 | |
| | 2,220,000 | | | | 6.125 | | | | 11/21/17 | | | | 2,374,665 | |
| | 2,600,000 | | | | 5.375 | | | | 08/09/20 | | | | 2,691,682 | |
| Discover Bank |
| | 3,700,000 | | | | 8.700 | | | | 11/18/19 | | | | 4,249,829 | |
Fifth Third Bank(c) |
| | 2,950,000 | | | | 0.402 | | | | 05/17/13 | | | | 2,888,634 | |
HSBC Capital Funding LP(a)(b)(c) |
| | 1,050,000 | | | | 4.610 | | | | 12/29/49 | | | | 928,216 | |
ING Bank NV(a) |
| | 5,400,000 | | | | 2.375 | | | | 06/09/14 | | | | 5,236,731 | |
| | 2,700,000 | | | | 2.500 | | | | 01/14/16 | | | | 2,705,616 | |
JPMorgan Chase Capital XX(b) |
| | 3,100,000 | | | | 6.550 | | | | 09/29/36 | | | | 3,084,500 | |
| JPMorgan Chase Capital XXV |
| | 1,300,000 | | | | 6.800 | | | | 10/01/37 | | | | 1,293,500 | |
Manufacturers & Traders Trust Co.(b)(c) |
| | 3,525,000 | | | | 1.872 | | | | 04/01/13 | | | | 3,521,394 | |
| | 2,003,000 | | | | 5.585 | | | | 12/28/20 | | | | 1,877,812 | |
| Merrill Lynch & Co., Inc. |
| | 1,250,000 | | | | 6.400 | | | | 08/28/17 | | | | 1,188,078 | |
MUFG Capital Finance 1 Ltd.(b)(c) |
| | 3,025,000 | | | | 6.346 | | | | 07/25/49 | | | | 3,040,125 | |
National City Preferred Capital Trust I(b)(c) |
| | 2,400,000 | | | | 12.000 | | | | 12/10/49 | | | | 2,485,968 | |
Nordea Eiendomskreditt AS(a) |
| | 2,800,000 | | | | 1.875 | | | | 04/07/14 | | | | 2,862,773 | |
| Regions Financial Corp. |
| | 3,600,000 | | | | 5.750 | | | | 06/15/15 | | | | 3,384,000 | |
Resona Bank Ltd.(a)(b)(c) |
| | 1,475,000 | | | | 5.850 | | | | 04/15/49 | | | | 1,453,052 | |
Royal Bank of Scotland PLC(a) |
| | 3,825,000 | | | | 4.875 | | | | 08/25/14 | | | | 3,851,121 | |
| Santander Holdings USA, Inc. |
| | 855,000 | | | | 4.625 | | | | 04/19/16 | | | | 802,293 | |
Sumitomo Mitsui Banking Corp.(a) |
| | 5,325,000 | | | | 2.900 | | | | 07/22/16 | | | | 5,372,973 | |
| | | | | | | | | | | | | | | |
| | | | | | | | | | | | | | 90,982,708 | |
| |
| |
Brokerage – 2.5% |
| Morgan Stanley & Co. |
| | 4,250,000 | | | | 4.750 | | | | 04/01/14 | | | | 4,041,274 | |
| | 7,100,000 | | | | 6.625 | (b) | | | 04/01/18 | | | | 7,061,667 | |
| | 1,725,000 | | | | 7.300 | (b) | | | 05/13/19 | | | | 1,772,454 | |
| | | | | | | | | | | | | | | |
| | | | | | | | | | | | | | 12,875,395 | |
| |
| |
Chemicals(b) – 2.2% |
Incitec Pivot Ltd.(a) |
| | 3,700,000 | | | | 4.000 | | | | 12/07/15 | | | | 3,771,380 | |
| The Dow Chemical Co. |
| | 6,823,000 | | | | 7.600 | | | | 05/15/14 | | | | 7,761,596 | |
| | | | | | | | | | | | | | | |
| | | | | | | | | | | | | | 11,532,976 | |
| |
| |
Distributors(a)(b) – 0.8% |
| Ras Laffan Liquefied Natural Gas Co. Ltd. III |
| | 2,300,000 | | | | 6.750 | | | | 09/30/19 | | | | 2,740,450 | |
| Southern Star Central Gas Pipeline, Inc. |
| | 1,100,000 | | | | 6.000 | | | | 06/01/16 | | | | 1,235,514 | |
| | | | | | | | | | | | | | | |
| | | | | | | | | | | | | | 3,975,964 | |
| |
| |
Diversified Manufacturing(a)(b) – 1.7% |
| Illinois Tool Works, Inc. |
| | 4,900,000 | | | | 4.875 | | | | 09/15/41 | | | | 5,455,611 | |
| Xylem, Inc. |
| | 3,650,000 | | | | 3.550 | | | | 09/20/16 | | | | 3,649,989 | |
| | | | | | | | | | | | | | | |
| | | | | | | | | | | | | | 9,105,600 | |
| |
| |
Electric(b) – 4.5% |
| Arizona Public Service Co. |
| | 6,115,000 | | | | 8.750 | | | | 03/01/19 | | | | 7,836,518 | |
Enel Finance International SA(a) |
| | 1,275,000 | | | | 3.875 | | | | 10/07/14 | | | | 1,244,159 | |
Ipalco Enterprises, Inc.(a) |
| | 4,025,000 | | | | 5.000 | | | | 05/01/18 | | | | 3,793,562 | |
| Nevada Power Co. |
| | 2,675,000 | | | | 7.125 | | | | 03/15/19 | | | | 3,340,510 | |
PPL WEM Holdings PLC(a) |
| | 3,700,000 | | | | 5.375 | | | | 05/01/21 | | | | 3,900,022 | |
| Progress Energy, Inc. |
| | 1,000,000 | | | | 7.000 | | | | 10/30/31 | | | | 1,281,696 | |
Puget Sound Energy, Inc.(c) |
| | 2,000,000 | | | | 6.974 | | | | 06/01/67 | | | | 1,990,000 | |
| | | | | | | | | | | | | | | |
| | | | | | | | | | | | | | 23,386,467 | |
| |
| |
Energy – 9.2% |
Anadarko Petroleum Corp.(b) |
| | 7,428,000 | | | | 6.375 | | | | 09/15/17 | | | | 8,309,517 | |
| | 1,825,000 | | | | 8.700 | | | | 03/15/19 | | | | 2,288,259 | |
BP Capital Markets PLC(b) |
| | 8,600,000 | | | | 4.500 | | | | 10/01/20 | | | | 9,308,136 | |
Dolphin Energy Ltd.(a)(b) |
| | 485,980 | | | | 5.888 | | | | 06/15/19 | | | | 520,728 | |
Gaz Capital SA for Gazprom(d) |
| | 990,000 | | | | 9.250 | | | | 04/23/19 | | | | 1,148,400 | |
Nexen, Inc.(b) |
| | 535,000 | | | | 6.400 | | | | 05/15/37 | | | | 544,385 | |
| | 2,525,000 | | | | 7.500 | | | | 07/30/39 | | | | 2,901,250 | |
The accompanying notes are an integral part of these financial statements. 63
GOLDMAN SACHS INVESTMENT GRADE CREDIT FUND
Schedule of Investments (continued)
September 30, 2011 (Unaudited)
| | | | | | | | | | | | | | | |
Principal
| | Interest
| | Maturity
| | |
| Amount | | Rate | | Date | | Value |
| |
Corporate Obligations – (continued) |
Energy – (continued) |
| | | | | | | | | | | | | | | |
Pemex Project Funding Master Trust(b) |
| $ | 900,000 | | | | 6.625 | % | | | 06/15/35 | | | $ | 963,000 | |
Petrobras International Finance Co.(b) |
| | 430,000 | | | | 5.750 | | | | 01/20/20 | | | | 441,090 | |
| | 2,440,000 | | | | 5.375 | | | | 01/27/21 | | | | 2,426,986 | |
Petroleos Mexicanos(a)(b) |
| | 1,130,000 | | | | 5.500 | | | | 01/21/21 | | | | 1,186,500 | |
PTT Exploration and Production Public Co. Ltd.(a) |
| | 820,000 | | | | 5.692 | | | | 04/05/21 | | | | 828,610 | |
Schlumberger Investment SA(a)(b) |
| | 1,800,000 | | | | 3.300 | | | | 09/14/21 | | | | 1,801,795 | |
TNK-BP Finance SA |
| | 470,000 | | | | 7.500 | | | | 07/18/16 | | | | 486,450 | |
Transocean, Inc.(b) |
| | 7,825,000 | | | | 6.000 | | | | 03/15/18 | | | | 8,305,601 | |
Valero Logistics(b) |
| | 2,000,000 | | | | 6.050 | | | | 03/15/13 | | | | 2,111,361 | |
Weatherford International Ltd.(b) |
| | 3,775,000 | | | | 9.625 | | | | 03/01/19 | | | | 4,824,305 | |
| | | | | | | | | | | | | | | |
| | | | | | | | | | | | | | 48,396,373 | |
| |
| |
Financial(a) – 1.0% |
| FUEL Trust |
| | 5,350,000 | | | | 3.984 | | | | 06/15/16 | | | | 5,199,885 | |
| |
| |
Food & Beverage – 4.3% |
Anheuser-Busch InBev Worldwide, Inc.(b) |
| | 6,281,000 | | | | 4.125 | | | | 01/15/15 | | | | 6,808,084 | |
Cargill, Inc.(a)(b) |
| | 5,700,000 | | | | 4.307 | | | | 05/14/21 | | | | 6,179,934 | |
| Kraft Foods, Inc. |
| | 7,900,000 | | | | 6.500 | | | | 02/09/40 | | | | 9,683,421 | |
| | | | | | | | | | | | | | | |
| | | | | | | | | | | | | | 22,671,439 | |
| |
| |
Health Care – Medical Products(b) – 3.1% |
| Boston Scientific Corp. |
| | 5,100,000 | | | | 4.500 | | | | 01/15/15 | | | | 5,332,978 | |
| DENTSPLY International, Inc. |
| | 650,000 | | | | 2.750 | | | | 08/15/16 | | | | 649,996 | |
| Humana, Inc. |
| | 2,765,000 | | | | 7.200 | | | | 06/15/18 | | | | 3,320,488 | |
| Life Technologies Corp. |
| | 2,675,000 | | | | 4.400 | | | | 03/01/15 | | | | 2,835,906 | |
| Thermo Fisher Scientific, Inc. |
| | 3,975,000 | | | | 2.250 | | | | 08/15/16 | | | | 3,974,978 | |
| | | | | | | | | | | | | | | |
| | | | | | | | | | | | | | 16,114,346 | |
| |
| |
Health Care – Services(b) – 0.8% |
| Express Scripts, Inc. |
| | 3,975,000 | | | | 3.125 | | | | 05/15/16 | | | | 4,004,775 | |
| |
| |
Life Insurance – 2.7% |
American International Group, Inc.(b) |
| | 1,175,000 | | | | 6.400 | | | | 12/15/20 | | | | 1,184,693 | |
Lincoln National Corp.(b) |
| | 1,200,000 | | | | 4.300 | | | | 06/15/15 | | | | 1,243,610 | |
MetLife Capital Trust X(a)(b) |
| | 1,500,000 | | | | 9.250 | | | | 04/08/38 | | | | 1,687,500 | |
Nationwide Financial Services, Inc.(a)(b) |
| | 2,450,000 | | | | 5.375 | | | | 03/25/21 | | | | 2,396,139 | |
| Prudential Financial, Inc. |
| | 3,650,000 | | | | 6.000 | | | | 12/01/17 | | | | 3,951,951 | |
Reinsurance Group of America, Inc.(b) |
| | 1,650,000 | | | | 5.000 | | | | 06/01/21 | | | | 1,703,671 | |
| | 2,100,000 | | | | 6.750 | | | | 12/15/65 | | | | 1,827,000 | |
| | | | | | | | | | | | | | | |
| | | | | | | | | | | | | | 13,994,564 | |
| |
| |
Media – Cable – 1.0% |
| Comcast Cable Communications Holdings, Inc. |
| | 2,200,000 | | | | 8.375 | | | | 03/15/13 | | | | 2,421,846 | |
Cox Communications, Inc.(a)(b) |
| | 2,025,000 | | | | 8.375 | | | | 03/01/39 | | | | 2,789,351 | |
| | | | | | | | | | | | | | | |
| | | | | | | | | | | | | | 5,211,197 | |
| |
| |
Media – Non Cable(b) – 3.1% |
| NBCUniversal Media LLC |
| | 7,325,000 | | | | 2.875 | | | | 04/01/16 | | | | 7,457,187 | |
| News America, Inc. |
| | 5,350,000 | | | | 6.150 | | | | 02/15/41 | | | | 5,659,134 | |
| WPP Finance UK |
| | 2,875,000 | | | | 8.000 | | | | 09/15/14 | | | | 3,259,152 | |
| | | | | | | | | | | | | | | |
| | | | | | | | | | | | | | 16,375,473 | |
| |
| |
Metals & Mining(b) – 1.0% |
| Freeport-McMoRan Copper & Gold, Inc. |
| | 5,075,000 | | | | 8.375 | | | | 04/01/17 | | | | 5,442,937 | |
| |
| |
Noncaptive – Financial – 2.8% |
GE Capital Trust I(b)(c) |
| | 3,280,000 | | | | 6.375 | | | | 11/15/67 | | | | 3,132,400 | |
| General Electric Capital Corp. |
| | 2,325,000 | | | | 5.625 | | | | 05/01/18 | | | | 2,530,623 | |
| | 2,150,000 | | | | 6.375 | (b)(c) | | | 11/15/67 | | | | 2,053,250 | |
| International Lease Finance Corp. |
| | 3,225,000 | | | | 5.750 | | | | 05/15/16 | | | | 2,870,250 | |
SLM Corp.(b) |
| | 4,100,000 | | | | 6.250 | | | | 01/25/16 | | | | 4,021,864 | |
| | | | | | | | | | | | | | | |
| | | | | | | | | | | | | | 14,608,387 | |
| |
| |
Pipelines(b) – 3.3% |
| Energy Transfer Partners LP |
| | 3,727,000 | | | | 5.950 | | | | 02/01/15 | | | | 4,005,467 | |
| Enterprise Products Operating LLC |
| | 3,973,000 | | | | 7.550 | | | | 04/15/38 | | | | 4,971,407 | |
| Tennessee Gas Pipeline Co. |
| | 1,460,000 | | | | 7.000 | | | | 10/15/28 | | | | 1,739,575 | |
| | 2,125,000 | | | | 8.375 | | | | 06/15/32 | | | | 2,794,362 | |
TransCanada PipeLines Ltd.(c) |
| | 3,875,000 | | | | 6.350 | | | | 05/15/67 | | | | 3,845,937 | |
| | | | | | | | | | | | | | | |
| | | | | | | | | | | | | | 17,356,748 | |
| |
| |
Property/Casualty Insurance(b) – 2.2% |
| Arch Capital Group Ltd. |
| | 1,245,000 | | | | 7.350 | | | | 05/01/34 | | | | 1,426,234 | |
QBE Capital Funding III Ltd.(a)(c) |
| | 3,175,000 | | | | 7.250 | | | | 05/24/41 | | | | 2,869,911 | |
64 The accompanying notes are an integral part of these financial statements.
GOLDMAN SACHS INVESTMENT GRADE CREDIT FUND
| | | | | | | | | | | | | | | |
Principal
| | Interest
| | Maturity
| | |
| Amount | | Rate | | Date | | Value |
| |
Corporate Obligations – (continued) |
Property/Casualty Insurance (b) – (continued) |
| | | | | | | | | | | | | | | |
QBE Insurance Group Ltd.(a)(c) |
| $ | 855,000 | | | | 5.647 | % | | | 07/01/23 | | | $ | 803,117 | |
| Transatlantic Holdings, Inc. |
| | 3,725,000 | | | | 8.000 | | | | 11/30/39 | | | | 4,361,690 | |
| XL Group Ltd. |
| | 2,125,000 | | | | 5.750 | | | | 10/01/21 | | | | 2,112,417 | |
| | | | | | | | | | | | | | | |
| | | | | | | | | | | | | | 11,573,369 | |
| |
| |
Real Estate Investment Trusts – 5.7% |
Brandywine Operating Partnership LP(b) |
| | 1,000,000 | | | | 4.950 | | | | 04/15/18 | | | | 964,609 | |
| Developers Diversified Realty Corp. |
| | 590,000 | | | | 9.625 | | | | 03/15/16 | | | | 668,175 | |
| | 3,750,000 | | | | 7.500 | (b) | | | 04/01/17 | | | | 3,956,250 | |
Duke Realty LP(b) |
| | 2,875,000 | | | | 8.250 | | | | 08/15/19 | | | | 3,308,588 | |
HCP, Inc.(b) |
| | 2,975,000 | | | | 6.300 | | | | 09/15/16 | | | | 3,176,425 | |
Kilroy Realty LP(b) |
| | 2,300,000 | | | | 5.000 | | | | 11/03/15 | | | | 2,380,928 | |
| | 1,125,000 | | | | 6.625 | | | | 06/01/20 | | | | 1,220,865 | |
Pan Pacific Retail Properties, Inc.(b) |
| | 1,350,000 | | | | 5.950 | | | | 06/01/14 | | | | 1,436,708 | |
Post Apartment Homes LP(b) |
| | 3,000,000 | | | | 6.300 | | | | 06/01/13 | | | | 3,172,853 | |
ProLogis(d) |
| | 8,000,000 | | | | 2.250 | | | | 04/01/37 | | | | 7,980,000 | |
UDR, Inc.(b) |
| | 1,900,000 | | | | 4.250 | | | | 06/01/18 | | | | 1,894,392 | |
| | | | | | | | | | | | | | | |
| | | | | | | | | | | | | | 30,159,793 | |
| |
| |
Retailers – 3.2% |
CVS Caremark Corp.(b) |
| | 8,125,000 | | | | 6.302 | (c) | | | 06/01/37 | | | | 7,860,937 | |
| Macy’s Retail Holdings, Inc. |
| | 4,125,000 | | | | 7.450 | | | | 07/15/17 | | | | 4,874,665 | |
O’Reilly Automotive, Inc.(b) |
| | 4,050,000 | | | | 4.625 | | | | 09/15/21 | | | | 4,097,062 | |
| | | | | | | | | | | | | | | |
| | | | | | | | | | | | | | 16,832,664 | |
| |
| |
Technology – Hardware(b) – 1.0% |
| Hewlett-Packard Co. |
| | 1,400,000 | | | | 3.000 | | | | 09/15/16 | | | | 1,411,581 | |
| Intel Corp. |
| | 3,950,000 | | | | 1.950 | | | | 10/01/16 | | | | 3,978,499 | |
| | | | | | | | | | | | | | | |
| | | | | | | | | | | | | | 5,390,080 | |
| |
| |
Tobacco – 0.5% |
| Altria Group, Inc. |
| | 2,075,000 | | | | 9.700 | | | | 11/10/18 | | | | 2,743,046 | |
| |
| |
Transportation(a) – 0.3% |
| Transnet Ltd. |
| | 1,550,000 | | | | 4.500 | | | | 02/10/16 | | | | 1,588,750 | |
| |
| |
Wireless Telecommunications(b) – 2.2% |
| America Movil SAB de C.V. |
| | 3,925,000 | | | | 2.375 | | | | 09/08/16 | | | | 3,807,072 | |
| AT&T, Inc. |
| | 2,300,000 | | | | 3.875 | | | | 08/15/21 | | | | 2,361,939 | |
| | 2,300,000 | | | | 6.400 | | | | 05/15/38 | | | | 2,659,157 | |
| Telecom Italia Capital SA |
| | 2,665,000 | | | | 5.250 | | | | 10/01/15 | | | | 2,544,811 | |
| | | | | | | | | | | | | | | |
| | | | | | | | | | | | | | 11,372,979 | |
| |
| |
Wirelines Telecommunications(b) – 3.1% |
| AT&T, Inc. |
| | 6,375,000 | | | | 2.950 | | | | 05/15/16 | | | | 6,569,781 | |
| Qwest Communications International, Inc. |
| | 1,725,000 | | | | 8.000 | | | | 10/01/15 | | | | 1,811,250 | |
| Qwest Corp. |
| | 4,150,000 | | | | 8.375 | | | | 05/01/16 | | | | 4,550,152 | |
| Telecom Italia Capital SA |
| | 3,550,000 | | | | 4.950 | | | | 09/30/14 | | | | 3,409,452 | |
| | | | | | | | | | | | | | | |
| | | | | | | | | | | | | | 16,340,635 | |
| |
| |
TOTAL CORPORATE OBLIGATIONS |
(Cost $410,838,254) | | $ | 417,236,550 | |
| |
| |
| | | | | | | | | | | | | | | |
| | | | | | | | | | | | | | | |
Mortgage-Backed Obligations – 2.9% |
Collateralized Mortgage Obligations – 2.9% |
Countrywide Alternative Loan Trust Series 2007-06, Class A4 |
| $ | 1,195,707 | | | | 5.750 | % | | | 04/25/47 | | | $ | 710,507 | |
Countrywide Alternative Loan Trust Series 2007-15CB, Class A5 |
| | 1,922,955 | | | | 5.750 | | | | 07/25/37 | | | | 1,303,830 | |
Countrywide Alternative Loan Trust Series 2007-16CB, Class 4A7 |
| | 1,464,094 | | | | 6.000 | | | | 08/25/37 | | | | 1,085,568 | |
| FHLMC Multifamily Structured-Pass Through Certificates Series K703, Class A2 |
| | 1,500,000 | | | | 2.699 | | | | 05/25/18 | | | | 1,530,064 | |
NCUA Guaranteed Notes Series 2010-C1, Class A2 |
| | 2,500,000 | | | | 2.900 | | | | 10/29/20 | | | | 2,623,047 | |
Permanent Master Issuer PLC Series 2011-1A, Class 1A3(a)(c) |
| EUR | 3,000,000 | | | | 2.905 | | | | 07/15/42 | | | | 4,004,008 | |
Residential Asset Securitization Trust Series 2007-A2, Class 1A3 |
| $ | 907,763 | | | | 6.000 | | | | 04/25/37 | | | | 655,047 | |
Structured Adjustable Rate Mortgage Loan Trust Series 2005-21, Class 7A1(c) |
| | 1,548,648 | | | | 5.485 | | | | 11/25/35 | | | | 1,250,223 | |
Washington Mutual Mortgage Pass-Through Certificates Series 2005-AR15, Class A1A1(c) |
| | 1,290,503 | | | | 0.495 | | | | 11/25/45 | | | | 952,964 | |
Wells Fargo Alternative Loan Trust Series 2007-PA2, Class 1A1 |
| | 1,222,535 | | | | 6.000 | | | | 06/25/37 | | | | 959,345 | |
| |
| |
TOTAL MORTGAGE-BACKED OBLIGATIONS |
(Cost $15,486,887) | | $ | 15,074,603 | |
| |
| |
The accompanying notes are an integral part of these financial statements. 65
GOLDMAN SACHS INVESTMENT GRADE CREDIT FUND
Schedule of Investments (continued)
September 30, 2011 (Unaudited)
| | | | | | | | | | | | | | | |
Principal
| | Interest
| | Maturity
| | |
| Amount | | Rate | | Date | | Value |
| |
| | | | | | | | | | | | | | | |
| | | | | | | | | | | | | | | |
Agency Debentures – 0.1% |
| Tennessee Valley Authority |
| $ | 500,000 | | | | 4.625 | % | | | 09/15/60 | | | $ | 602,168 | |
(Cost $493,500) | | | | |
| |
| |
| | | | | | | | | | | | | | | |
| | | | | | | | | | | | | | | |
Asset-Backed Securities(c) – 0.7% |
Student Loan – 0.7% |
Brazos Higher Education Authority, Inc. Series 2011-2, Class A3 |
| $ | 2,300,000 | | | | 1.247 | % | | | 10/27/36 | | | $ | 2,093,668 | |
Louisiana Public Facilities Authority Series 2011-A, Class A3 |
| | 1,500,000 | | | | 1.203 | | | | 04/25/35 | | | | 1,433,310 | |
| |
| |
TOTAL ASSET-BACKED SECURITIES |
(Cost $3,625,078) | | $ | 3,526,978 | |
| |
| |
| | | | | | | | | | | | | | | |
| | | | | | | | | | | | | | | |
Foreign Debt Obligations – 3.5% |
Sovereign – 3.1% |
| Federal Republic of Brazil |
| $ | 820,000 | | | | 8.250 | % | | | 01/20/34 | | | $ | 1,152,100 | |
| | 4,250,000 | | | | 7.125 | | | | 01/20/37 | | | | 5,418,750 | |
| Republic of Colombia |
| | 1,810,000 | | | | 4.375 | | | | 07/12/21 | | | | 1,837,132 | |
| | 230,000 | | | | 7.375 | | | | 09/18/37 | | | | 299,000 | |
| | 930,000 | | | | 6.125 | | | | 01/18/41 | | | | 1,050,900 | |
Russian Federation(e) |
| | 1,118,900 | | | | 7.500 | | | | 03/31/30 | | | | 1,257,643 | |
| State of Qatar |
| | 600,000 | | | | 5.150 | | | | 04/09/14 | | | | 648,900 | |
| United Mexican States |
| | 3,800,000 | | | | 6.050 | | | | 01/11/40 | | | | 4,313,000 | |
| | | | | | | | | | | | | | | |
| | | | | | | | | | | | | | 15,977,425 | |
| |
| |
Supranational – 0.4% |
| North American Development Bank |
| | 2,000,000 | | | | 4.375 | | | | 02/11/20 | | | | 2,220,880 | |
| |
| |
TOTAL FOREIGN DEBT OBLIGATIONS |
(Cost $16,424,284) | | $ | 18,198,305 | |
| |
| |
| | | | | | | | | | | | | | | |
| | | | | | | | | | | | | | | |
Municipal Debt Obligations – 2.9% |
California – 1.6% |
| California State GO Bonds Build America Taxable Series 2009 |
| $ | 1,450,000 | | | | 7.500 | % | | | 04/01/34 | | | $ | 1,745,684 | |
| | 455,000 | | | | 7.300 | | | | 10/01/39 | | | | 541,050 | |
| California State GO Bonds Build America Taxable Series 2010 |
| | 2,645,000 | | | | 7.625 | | | | 03/01/40 | | | | 3,260,544 | |
| California State University RB Build America Bonds Series 2010 |
| | 2,825,000 | | | | 6.484 | | | | 11/01/41 | | | | 3,219,483 | |
| | | | | | | | | | | | | | | |
| | | | | | | | | | | | | | 8,766,761 | |
| |
| |
Illinois – 1.2% |
| Chicago Illinois Metropolitan Water Reclamation District GO Bonds Build America Bonds Taxable Direct Payment Series 2009 |
| | 1,775,000 | | | | 5.720 | | | | 12/01/38 | | | | 2,157,246 | |
| Illinois State GO Bonds Build America Series 2010 |
| | 3,875,000 | | | | 6.630 | | | | 02/01/35 | | | | 4,067,200 | |
| | | | | | | | | | | | | | | |
| | | | | | | | | | | | | | 6,224,446 | |
| |
| |
New Jersey – 0.1% |
| New Jersey State Turnpike Authority RB Build America Taxable Series 2009 F |
| | 350,000 | | | | 7.414 | | | | 01/01/40 | | | | 482,157 | |
| |
| |
TOTAL MUNICIPAL DEBT OBLIGATIONS |
(Cost $13,541,680) | | $ | 15,473,364 | |
| |
| |
| | | | | | | | | | | | | | | |
| | | | | | | | | | | | | | | |
U.S. Treasury Obligations – 3.8% |
| United States Treasury Inflation Protected Securities |
| $ | 1,002,360 | | | | 0.625 | % | | | 07/15/21 | | | $ | 1,047,306 | |
| United States Treasury Notes |
| | 9,600,000 | | | | 0.375 | (f) | | | 07/31/13 | | | | 9,620,833 | |
| | 9,200,000 | | | | 0.625 | | | | 07/15/14 | | | | 9,255,108 | |
| |
| |
TOTAL U.S. TREASURY OBLIGATIONS |
(Cost $19,888,329) | | $ | 19,923,247 | |
| |
| |
| | | | | | | | | | | | | | | |
| | | | | | | | | | | |
| Shares | | Rate | | Value |
| |
Preferred Stock(b)(c) – 0.3% |
| JPMorgan Chase & Co. |
| | 1,575,000 | | | | 7.900 | % | | $ | 1,622,266 | |
(Cost $1,598,068) | | | | |
| |
| |
TOTAL INVESTMENTS BEFORE SHORT-TERM INVESTMENT |
(Cost $481,896,080) | | $ | 491,657,481 | |
| |
| |
| | | | | | | | | | | |
| | | | | | | | | | | | | | | |
Principal
| | Interest
| | Maturity
| | |
| Amount | | Rate | | Date | | Value |
| |
Short-term Investment – 0.2%(g) |
Repurchase Agreement – 0.2% |
| Joint Repurchase Agreement Account II |
| $ | 1,100,000 | | | | 0.095 | % | | | 10/03/11 | | | $ | 1,100,000 | |
(Cost $1,100,000) | | | | |
| |
| |
TOTAL INVESTMENTS – 93.9% |
(Cost $482,996,080) | | $ | 492,757,481 | |
| |
| |
OTHER ASSETS IN EXCESS OF LIABILITIES – 6.1% | | | 32,193,707 | |
| |
| |
NET ASSETS – 100.0% | | $ | 524,951,188 | |
| |
| |
66 The accompanying notes are an integral part of these financial statements.
GOLDMAN SACHS INVESTMENT GRADE CREDIT FUND
The percentage shown for each investment category reflects the value of investments in that category as a percentage of net assets.
| | |
| (a) | | Exempt from registration under Rule 144A of the Securities Act of 1933. Under procedures approved by the Board of Trustees, such securities have been determined to be liquid by the investment adviser and may be resold, normally to qualified institutional buyers in transactions exempt from registration. Total market value of Rule 144A securities amounts to $83,878,358, which represents approximately 16.0% of net assets as of September 30, 2011. |
| |
| (b) | | Security with “Call” features with resetting interest rates. Maturity dates disclosed are the final maturity dates. |
| |
| (c) | | Variable rate security. Interest rate disclosed is that which is in effect at September 30, 2011. |
| |
| (d) | | Security with “Put” features with resetting interest rates. Maturity dates disclosed are the final maturity dates. |
| |
| (e) | | Coupon increases periodically based upon a predetermined schedule. Stated interest rate in effect at September 30, 2011. |
| |
| (f) | | All or a portion of security is segregated as collateral for initial margin requirements on futures transactions. |
| |
| (g) | | Joint repurchase agreement was entered into on September 30, 2011. Additional information appears on pages 88-89. |
| | | | | |
| |
| |
Currency Abbreviation: |
| EUR | | — | | Euro |
| |
Investment Abbreviations: |
| FHLMC | | — | | Federal Home Loan Mortgage Corp. |
| GO | | — | | General Obligation |
| LIBOR | | — | | London Interbank Offered Rate |
| NCUA | | — | | National Credit Union Administration |
| OTC | | — | | Over the Counter |
| RB | | — | | Revenue Bond |
| |
| |
The accompanying notes are an integral part of these financial statements. 67
GOLDMAN SACHS INVESTMENT GRADE CREDIT FUND
Schedule of Investments (continued)
September 30, 2011 (Unaudited)
| |
| ADDITIONAL INVESTMENT INFORMATION | |
FORWARD FOREIGN CURRENCY EXCHANGE CONTRACTS — At September 30, 2011, the Fund had outstanding forward foreign currency exchange contracts to sell foreign currencies:
FORWARD FOREIGN CURRENCY EXCHANGE CONTRACTS WITH UNREALIZED GAIN
| | | | | | | | | | | | | | | |
| | | Contracts
| | Expiration
| | Current
| | Unrealized
|
| Counterparty | | To Buy/Sell | | Date | | Value | | Gain |
| |
| JPMorgan Securities, Inc. | | | USD/EUR | | | 10/13/11 | | $ | 3,993,722 | | | $ | 298,302 | |
| |
| |
FUTURES CONTRACTS — At September 30, 2011, the following futures contracts were open:
| | | | | | | | | | | | | | | |
| | | Number of
| | | | | | |
| | | Contracts
| | Expiration
| | Current
| | Unrealized
|
| Type | | Long | | Date | | Value | | Gain (Loss) |
| |
| Ultra Long U.S. Treasury Bonds | | | 102 | | | December 2011 | | $ | 16,179,750 | | | $ | 1,217,019 | |
| 2 Year U.S. Treasury Notes | | | 203 | | | December 2011 | | | 44,701,235 | | | | (55,136 | ) |
| 5 Year U.S. Treasury Notes | | | 410 | | | December 2011 | | | 50,218,594 | | | | 6,158 | |
| 10 Year U.S. Treasury Notes | | | 204 | | | December 2011 | | | 26,539,125 | | | | (96,555 | ) |
| 30 Year U.S. Treasury Bonds | | | 341 | | | December 2011 | | | 48,635,125 | | | | 660,222 | |
| |
| |
TOTAL | | | | | | | | | | | | $ | 1,731,708 | |
| |
| |
SWAP CONTRACTS — At September 30, 2011, the Fund had outstanding swap contracts with the following terms:
INTEREST RATE SWAP CONTRACTS
| | | | | | | | | | | | | | | | | | | | | | | | | |
| | | | | | | Rates Exchanged | | | | | | |
| | | Notional
| | | | Payments
| | Payments
| | | | Upfront Payments
| | |
| | | Amount
| | Termination
| | Received by
| | Made by
| | Market
| | Made (Received)
| | Unrealized
|
| Counterparty | | (000s)(a) | | Date | | the Fund | | the Fund | | Value | | by the Fund | | Gain (Loss) |
| |
| Deutsche Bank Securities, Inc. | | $ | 1,700 | | | | 12/21/16 | | | 2.500% | | 3 month LIBOR | | $ | 94,259 | | | $ | 93,961 | | | $ | 298 | |
| | | | 2,000 | | | | 12/21/26 | | | 3 month LIBOR | | 4.000% | | | (379,489 | ) | | | (302,352 | ) | | | (77,137 | ) |
| | | | 2,600 | | | | 12/21/41 | | | 3 month LIBOR | | 4.250 | | | (830,801 | ) | | | (848,348 | ) | | | 17,547 | |
| Morgan Stanley Capital Services, Inc. | | | 8,400 | | | | 12/21/16 | | | 2.500 | | 3 month LIBOR | | | 465,751 | | | | 480,085 | | | | (14,334 | ) |
| | | | 9,900 | | | | 12/21/21 | | | 3 month LIBOR | | 3.500 | | | (1,201,758 | ) | | | (871,142 | ) | | | (330,616 | ) |
| |
| |
TOTAL | | | | | | | | | | | | | | $ | (1,852,038 | ) | | $ | (1,447,796 | ) | | $ | (404,242 | ) |
| |
| |
| | |
| (a) | | Represents forward starting interest rate swaps whose effective dates of commencement of accruals and cash flows occur subsequent to September 30, 2011. |
68 The accompanying notes are an integral part of these financial statements.
GOLDMAN SACHS INVESTMENT GRADE CREDIT FUND
| |
| ADDITIONAL INVESTMENT INFORMATION (continued) | |
CREDIT DEFAULT SWAP CONTRACTS
| | | | | | | | | | | | | | | | | | | | | | | | | | | | | |
| | | | | | | | | | | Credit
| | | | | | |
| | | | | | | Rates
| | | | Spread at
| | | | Upfront
| | |
| | | | | Notional
| | Received
| | | | September 30,
| | | | Payments
| | |
| | | Referenced
| | Amount
| | (Paid) by
| | Termination
| | 2011
| | Market
| | Made (Received)
| | Unrealized
|
| Counterparty | | Obligation | | (000s) | | Fund | | Date | | (Basis Points)(b) | | Value | | by the Fund | | Gain (Loss) |
| |
Protection Purchased: | | | | | | | | | | | | | | | | | | | | | | | | | | |
Bank of America
Securities LLC | | CDX North America
Investment Grade
Index 16 | | $ | 12,400 | | | | (1.000 | )% | | 06/20/14 | | | 106 | | | $ | 16,927 | | | $ | (124,102 | ) | | $ | 141,029 | |
| Deutsche Bank Securities, Inc. | | CDX North America
Investment Grade
Index 16 | | | 3,900 | | | | (1.000 | ) | | 06/20/14 | | | 106 | | | | 5,324 | | | | (41,297 | ) | | | 46,621 | |
| JPMorgan Securities, Inc. | | CDX North America
Investment Grade
Index 16 | | | 10,400 | | | | (1.000 | ) | | 06/20/14 | | | 106 | | | | 14,196 | | | | (114,360 | ) | | | 128,556 | |
Morgan Stanley
Capital Services, Inc. | | CDX North America
Investment Grade
Index 16 | | | 24,200 | | | | (1.000 | ) | | 06/20/14 | | | 106 | | | | 33,034 | | | | (225,737 | ) | | | 258,771 | |
Protection Sold: | | | | | | | | | | | | | | | | | | | | | | | | | | | | |
| Bank of America Securities LLC | | CDX North America
Investment Grade
Index 16 | | | 12,400 | | | | 1.000 | | | 06/20/16 | | | 135 | | | | (190,839 | ) | | | 16,711 | | | | (207,550 | ) |
| Credit Suisse International (London) | | Prudential Financial, Inc.
4.50% 07/15/13 | | | 2,350 | | | | 1.000 | | | 06/20/15 | | | 280 | | | | (145,595 | ) | | | (88,829 | ) | | | (56,766 | ) |
| Deutsche Bank Securities, Inc. | | MetLife, Inc.
5.00% 06/15/15 | | | 1,825 | | | | 1.000 | | | 03/20/15 | | | 322 | | | | (129,416 | ) | | | (67,588 | ) | | | (61,828 | ) |
| | | MetLife, Inc.
5.00% 06/15/15 | | | 5,200 | | | | 1.000 | | | 09/20/15 | | | 330 | | | | (430,596 | ) | | | (244,325 | ) | | | (186,271 | ) |
| | | Markit MCDX Index 16 | | | 32,500 | | | | 1.000 | | | 06/20/21 | | | 233 | | | | (2,386,774 | ) | | | (974,653 | ) | | | (1,412,121 | ) |
Morgan Stanley
Capital Services, Inc. | | CDX North America
Investment Grade
Index 16 | | | 19,200 | | | | 1.000 | | | 06/20/16 | | | 135 | | | | (295,493 | ) | | | 24,734 | | | | (320,227 | ) |
| | | Markit MCDX Index 16 | | | 2,500 | | | | 1.000 | | | 06/20/21 | | | 233 | | | | (183,598 | ) | | | (68,379 | ) | | | (115,219 | ) |
| |
| |
TOTAL | | | | | | | | | | | | | | | | | | $ | (3,692,830 | ) | | $ | (1,907,825 | ) | | $ | (1,785,005 | ) |
| |
| |
| | |
| (b) | | Credit spread on the Referenced Obligation, together with the term of the swap contract, are indicators of payment/performance risk. The likelihood of a credit event occurring which would require a fund to make a payment or otherwise be required to perform under the swap contract is generally greater as the credit spread and the term of the swap contract increase. |
The accompanying notes are an integral part of these financial statements. 69
GOLDMAN SACHS INVESTMENT GRADE CREDIT FUND
Schedule of Investments (continued)
September 30, 2011 (Unaudited)
| |
| ADDITIONAL INVESTMENT INFORMATION (continued) | |
WRITTEN OPTIONS CONTRACTS
INTEREST RATE SWAPTION CONTRACTS — At September 30, 2011, the Fund had outstanding written swaptions as follows:
| | | | | | | | | | | | | | | | | | | | | | | | | |
| | | | | Notional
| | | | | | | | | | |
| | | | | Amount
| | Expiration
| | Strike
| | Market
| | Premiums
| | Unrealized
|
| Counterparty | | Description | | (000s) | | Date | | Price | | Value | | Received | | Gain (Loss) |
| |
| Bank of America N.A. | | Put – OTC – 10 year Interest Rate Swap for the obligation to pay a fixed rate of 2.440% versus the 3 month LIBOR maturing on November 21, 2021 | | $ | 14,600 | | | 11/17/11 | | | 2.440 | % | | $ | (474,228 | ) | | $ | (277,400 | ) | | $ | (196,828 | ) |
| | | Call – OTC – 10 year Interest Rate Swap for the obligation to receive a fixed rate of 2.440% versus the 3 month LIBOR maturing on November 21, 2021 | | | 14,600 | | | 11/17/11 | | | 2.440 | | | | (86,755 | ) | | | (277,400 | ) | | | 190,645 | |
| Morgan Stanley Capital Services, Inc. | | Put – OTC – 10 year Interest Rate Swap for the obligation to pay a fixed rate of 2.450% versus the 3 month LIBOR maturing on November 21, 2021 | | | 12,000 | | | 11/17/11 | | | 2.450 | | | | (398,288 | ) | | | (226,800 | ) | | | (171,488 | ) |
| | | Call – OTC – 10 year Interest Rate Swap for the obligation to receive a fixed rate of 2.450% versus the 3 month LIBOR maturing on November 21, 2021 | | | 12,000 | | | 11/17/11 | | | 2.450 | | | | (68,798 | ) | | | (226,800 | ) | | | 158,002 | |
| |
| |
TOTAL | | | | $ | 53,200 | | | | | | | | | $ | (1,028,069 | ) | | $ | (1,008,400 | ) | | $ | (19,669 | ) |
| |
| |
For the six months ended September 30, 2011, the Fund had the following written swaptions activity:
| | | | | | | | | |
| | | Notional
| | |
| | | Amount
| | Premiums
|
| | | (000s) | | Received |
| |
| Contracts Outstanding March 31, 2011 | | $ | 13,000 | | | $ | (141,665 | ) |
| |
| |
| Contracts Written | | | 279,400 | | | | (6,496,100 | ) |
| Contracts Bought to Close | | | (208,900 | ) | | | 5,349,820 | |
| Contracts Expired | | | (30,300 | ) | | | 279,545 | |
| |
| |
| Contracts Outstanding September 30, 2011 | | $ | 53,200 | | | $ | (1,008,400 | ) |
| |
| |
70 The accompanying notes are an integral part of these financial statements.
GOLDMAN SACHS LOCAL EMERGING MARKETS DEBT FUND
Schedule of Investments
September 30, 2011 (Unaudited)
| | | | | | | | | | | | | | | |
Principal
| | Interest
| | Maturity
| | |
| Amount | | Rate | | Date | | Value |
| |
Sovereign Debt Obligations – 57.1% |
Argentina(a) – 0.8% |
| Republic of Argentina (NR/NR) |
| $ | 10,680,000 | | | | 0.000 | % | | | 12/15/35 | | | $ | 1,473,840 | |
| ARS | 340,750,000 | | | | 0.000 | | | | 12/15/35 | | | | 11,658,836 | |
| EUR | 7,340,000 | | | | 0.000 | | | | 12/15/35 | | | | 1,194,803 | |
| | | | | | | | | | | | | | | |
| | | | | | | | | | | | | | 14,327,479 | |
| |
| |
Brazil – 7.8% |
| Brazil Letras do Tesouro Nacional (NR/NR) |
| BRL | 73,267,093 | | | | 6.000 | | | | 08/15/40 | | | | 40,121,419 | |
| Brazil Notas do Tesouro Nacional (NR/Baa2) |
| | 8,169,000 | | | | 10.000 | | | | 01/01/12 | | | | 4,331,183 | |
| | 35,791,000 | | | | 10.000 | | | | 01/01/17 | | | | 17,963,693 | |
| | 142,201,000 | | | | 10.000 | | | | 01/01/21 | | | | 69,310,218 | |
| | | | | | | | | | | | | | | |
| | | | | | | | | | | | | | 131,726,513 | |
| |
| |
Chile – 0.2% |
| Republic of Chile (A+/Aa3) |
| CLP | 1,537,000,000 | | | | 5.500 | | | | 08/05/20 | | | | 3,093,741 | |
| |
| |
Colombia – 2.0% |
| Republic of Colombia (BBB-/Baa3) |
| COP | 27,890,000,000 | | | | 7.750 | | | | 04/14/21 | | | | 15,799,179 | |
| | 27,937,000,000 | | | | 9.850 | | | | 06/28/27 | | | | 18,734,292 | |
| | | | | | | | | | | | | | | |
| | | | | | | | | | | | | | 34,533,471 | |
| |
| |
Hungary – 4.3% |
| Hungary Government Bond (BBB-/Baa3) |
| HUF | 9,084,320,000 | | | | 5.500 | | | | 02/12/16 | | | | 38,645,083 | |
| | 2,523,000,000 | | | | 6.750 | | | | 02/24/17 | | | | 11,081,526 | |
| | 5,305,000,000 | | | | 6.750 | | | | 11/24/17 | | | | 23,136,625 | |
| | | | | | | | | | | | | | | |
| | | | | | | | | | | | | | 72,863,234 | |
| |
| |
Indonesia – 6.2% |
| Republic of Indonesia (BB+/Ba1) |
| IDR | 69,557,000,000 | | | | 10.000 | | | | 07/15/17 | | | | 9,278,223 | |
| | 47,086,000,000 | | | | 15.000 | | | | 07/15/18 | | | | 7,654,823 | |
| | 63,600,000,000 | | | | 11.000 | | | | 11/15/20 | | | | 9,225,256 | |
| | 23,544,000,000 | | | | 12.800 | | | | 06/15/21 | | | | 3,763,290 | |
| Republic of Indonesia (NR/Ba1) |
| | 121,486,000,000 | | | | 8.250 | | | | 07/15/21 | | | | 15,272,131 | |
| | 401,300,000,000 | | | | 10.500 | | | | 08/15/30 | | | | 59,350,398 | |
| | | | | | | | | | | | | | | |
| | | | | | | | | | | | | | 104,544,121 | |
| |
| |
Ivory Coast(b) – 0.0% |
| Republic of Ivory Coast (NR/NR) |
| $ | 1,226,000 | | | | 2.500 | | | | 12/31/32 | | | | 594,610 | |
| |
| |
Malaysia – 6.6% |
| Malaysia Government Bond (NR/A3) |
| MYR | 500,000 | | | | 3.741 | | | | 02/27/15 | | | | 158,575 | |
| | 92,325,000 | | | | 4.262 | | | | 09/15/16 | | | | 30,076,116 | |
| | 131,025,000 | | | | 4.378 | | | | 11/29/19 | | | | 43,032,016 | |
| | 120,175,000 | | | | 4.160 | | | | 07/15/21 | | | | 39,110,987 | |
| | | | | | | | | | | | | | | |
| | | | | | | | | | | | | | 112,377,694 | |
| |
| |
Mexico – 4.7% |
| Mexican Bonos (A-/Baa1) |
| MXN | 235,779,100 | | | | 10.000 | | | | 11/20/36 | | | $ | 21,110,284 | |
| | 744,728,800 | | | | 8.500 | | | | 11/18/38 | | | | 58,570,042 | |
| | | | | | | | | | | | | | | |
| | | | | | | | | | | | | | 79,680,326 | |
| |
| |
Peru – 1.4% |
| Peru Government Bond (BBB+/Baa3) |
| PEN | 1,971,000 | | | | 9.910 | | | | 05/05/15 | | | | 839,878 | |
| | 11,400,000 | | | | 7.840 | | | | 08/12/20 | | | | 4,655,798 | |
| | 14,750,000 | | | | 8.200 | | | | 08/12/26 | | | | 6,197,097 | |
| | 24,180,000 | | | | 6.900 | | | | 08/12/37 | | | | 8,788,881 | |
| Peru Government Bond (NR/NR) |
| | 9,790,000 | | | | 6.850 | | | | 02/12/42 | | | | 3,508,657 | |
| | | | | | | | | | | | | | | |
| | | | | | | | | | | | | | 23,990,311 | |
| |
| |
Poland – 2.8% |
| Poland Government Bond (A/A2) |
| PLN | 102,843,932 | | | | 3.000 | | | | 08/24/16 | | | | 31,429,322 | |
| | 8,825,000 | | | | 5.250 | | | | 10/25/20 | | | | 2,548,529 | |
| | 45,375,000 | | | | 5.750 | | | | 10/25/21 | | | | 13,533,111 | |
| | | | | | | | | | | | | | | |
| | | | | | | | | | | | | | 47,510,962 | |
| |
| |
Russia – 0.4% |
| Russian Federation (BBB+/Baa1) |
| RUB | 250,000,000 | | | | 7.850 | | | | 03/10/18 | | | | 7,628,343 | |
| |
| |
South Africa – 4.2% |
| Republic of South Africa (A/A3) |
| ZAR | 501,350,000 | | | | 10.500 | | | | 12/21/26 | | | | 71,975,127 | |
| | 1,345,000 | | | | 10.500 | | | | 12/21/26 | | | | 193,092 | |
| | | | | | | | | | | | | | | |
| | | | | | | | | | | | | | 72,168,219 | |
| |
| |
Thailand – 8.5% |
| Thailand Government Bond (A-/Baa1) |
| THB | 2,302,475,000 | | | | 3.625 | | | | 05/22/15 | | | | 74,345,232 | |
| | 166,325,000 | | | | 3.125 | | | | 12/11/15 | | | | 5,273,772 | |
| | 895,425,000 | | | | 4.125 | | | | 11/18/16 | | | | 29,528,763 | |
| | 505,500,000 | | | | 2.800 | | | | 10/10/17 | | | | 15,593,615 | |
| | 123,500,000 | | | | 3.875 | | | | 06/13/19 | | | | 4,005,515 | |
| | 478,025,000 | | | | 3.650 | | | | 12/17/21 | | | | 15,324,703 | |
| | | | | | | | | | | | | | | |
| | | | | | | | | | | | | | 144,071,600 | |
| |
| |
Turkey – 6.7% |
| Turkey Government Bond (BBB-/NR) |
| TRY | 111,850,684 | | | | 9.000 | | | | 05/21/14 | | | | 70,267,797 | |
| Turkey Government Bond (NR/NR) |
| | 8,000,000 | | | | 0.000 | (c) | | | 04/25/12 | | | | 4,123,665 | |
| | 56,775,000 | | | | 0.000 | (c) | | | 02/20/13 | | | | 27,302,935 | |
| | 20,025,000 | | | | 11.000 | | | | 08/06/14 | | | | 11,465,024 | |
| | | | | | | | | | | | | | | |
| | | | | | | | | | | | | | 113,159,421 | |
| |
| |
The accompanying notes are an integral part of these financial statements. 71
GOLDMAN SACHS LOCAL EMERGING MARKETS DEBT FUND
Schedule of Investments (continued)
September 30, 2011 (Unaudited)
| | | | | | | | | | | | | | | |
Principal
| | Interest
| | Maturity
| | |
| Amount | | Rate | | Date | | Value |
| |
Sovereign Debt Obligations – (continued) |
| | | | | | | | | | | | | | | |
Venezuela – 0.5% |
| Republic of Venezuela (B+/B2) |
| $ | 4,590,000 | | | | 7.750 | % | | | 10/13/19 | | | $ | 2,926,125 | |
| | 4,780,000 | | | | 9.000 | | | | 05/07/23 | | | | 2,987,500 | |
| | 3,050,000 | | | | 8.250 | | | | 10/13/24 | | | | 1,784,250 | |
| | 500,000 | | | | 9.250 | | | | 05/07/28 | | | | 307,500 | |
| | | | | | | | | | | | | | | |
| | | | | | | | | | | | | | 8,005,375 | |
| |
| |
TOTAL SOVEREIGN DEBT OBLIGATIONS |
(Cost $1,032,135,093) | | $ | 970,275,420 | |
| |
| |
| | | | | | | | | | | | | | | |
| | | | | | | | | | | | | | | |
Structured Notes – 12.7% |
Brazil – 3.1% |
Letras Financieras DoTe (Issuer Barclays Bank PLC) (NR/NR)(c) |
| BRL | 12,213,000 | | | | 0.000 | % | | | 11/09/11 | | | $ | 31,745,720 | |
| Notas do Tesouro Nacional (Issuer Credit Suisse AG) (NR/NR) |
| | 32,333,776 | | | | 6.000 | | | | 08/19/40 | | | | 17,706,134 | |
Notas do Tesouro Nacional Series B (Issuer HSBC Corp.) (NR/NR)(a) |
| | 6,508,209 | | | | 0.000 | | | | 08/15/40 | | | | 3,563,927 | |
| | | | | | | | | | | | | | | |
| | | | | | | | | | | | | | 53,015,781 | |
| |
| |
Colombia(d) – 2.5% |
| Republic of Columbia (Issuer Citigroup Funding, Inc.) (NR/NR) |
| COP | 26,491,000,000 | | | | 11.000 | | | | 10/25/18 | | | | 16,897,964 | |
| | 24,174,000,000 | | | | 11.250 | (a) | | | 10/25/18 | | | | 15,420,006 | |
| | 11,545,000,000 | | | | 11.000 | | | | 07/27/20 | | | | 7,317,736 | |
| | 4,226,000,000 | | | | 11.000 | | | | 07/25/24 | | | | 2,612,631 | |
| | | | | | | | | | | | | | | |
| | | | | | | | | | | | | | 42,248,337 | |
| |
| |
Indonesia – 2.8% |
| Republic of Indonesia (Issuer Barclays Bank PLC) (NR/NR) |
| IDR | 140,000,000,000 | | | | 10.000 | | | | 07/17/17 | | | | 18,395,904 | |
| Republic of Indonesia (Issuer HSBC Corp.) (NR/NR) |
| | 46,000,000,000 | | | | 10.000 | | | | 07/15/17 | | | | 6,099,684 | |
| Republic of Indonesia (Issuer JPMorgan Chase Bank NA) (A+/NR) |
| | 89,100,000,000 | | | | 10.000 | | | | 07/17/17 | | | | 11,802,962 | |
| Republic of Indonesia (Issuer JPMorgan Chase Bank NA) (NR/NR) |
| | 80,000,000,000 | | | | 11.000 | | | | 11/17/20 | | | | 11,575,882 | |
| | | | | | | | | | | | | | | |
| | | | | | | | | | | | | | 47,874,432 | |
| |
| |
Russia – 4.3% |
| Russian Federation (Issuer Deutsche Bank AG (London)) (NR/NR) |
| RUB | 85,000,000 | | | | 7.350 | | | | 01/22/16 | | | | 2,587,037 | |
| Russian Federation (Issuer JPMorgan Chase Bank NA) (NR/NR) |
| | 2,315,400,000 | | | | 7.350 | | | | 01/22/16 | | | | 70,470,884 | |
| | | | | | | | | | | | | | | |
| | | | | | | | | | | | | | 73,057,921 | |
| |
| |
TOTAL STRUCTURED NOTES |
(Cost $231,189,330) | | $ | 216,196,471 | |
| |
| |
| | | | | | | | | | | | | | | |
| | | | | | | | | | | | | | | |
Corporate Obligations – 5.8% |
Brazil(d) – 0.3% |
| Banco Safra SA (NR/Baa1) |
| BRL | 5,580,000 | | | | 10.250 | % | | | 08/08/16 | | | $ | 2,819,276 | |
| Banco Votorantim SA (BB+/Baa1) |
| | 3,793,868 | | | | 6.250 | | | | 05/16/16 | | | | 1,978,857 | |
| | | | | | | | | | | | | | | |
| | | | | | | | | | | | | | 4,798,133 | |
| |
| |
Hong Kong – 0.5% |
| Evergrande Real Estate Group Ltd. (BB-/B2) |
| CNY | 51,700,000 | | | | 7.500 | | | | 01/19/14 | | | | 5,868,438 | |
| Melco Crown Entertainment, Ltd. (NR/NR) |
| CNY | 21,750,000 | | | | 3.750 | | | | 05/09/13 | | | | 3,197,334 | |
| | | | | | | | | | | | | | | |
| | | | | | | | | | | | | | 9,065,772 | |
| |
| |
Ireland – 0.0% |
| MTS International Funding Ltd. (BB/Ba2) |
| $ | 320,000 | | | | 8.625 | | | | 06/22/20 | | | | 315,200 | |
| |
| |
Luxembourg(e) – 0.8% |
| Gaz Capital SA for Gazprom (BBB/Baa1) |
| | 12,050,000 | | | | 9.250 | | | | 04/23/19 | | | | 13,978,000 | |
| |
| |
Mexico(a)(d) – 0.4% |
| Cemex SAB de CV (B/NR) |
| | 10,660,000 | | | | 5.369 | | | | 09/30/15 | | | | 6,929,103 | |
| |
| |
Netherlands(d) – 0.3% |
| VimpelCom Holdings BV (BB/Ba3) |
| | 6,010,000 | | | | 7.504 | | | | 03/01/22 | | | | 4,898,150 | |
| |
| |
Russia – 1.2% |
| Red Arrow International Leasing PLC (BBB/Baa2) |
| RUB | 21,653,401 | | | | 8.375 | | | | 06/30/12 | | | | 665,762 | |
| RSHB Capital SA for OJSC Russian Agricultural Bank (NR/Baa1) |
| | 632,800,000 | | | | 7.500 | | | | 03/25/13 | | | | 19,603,872 | |
| | | | | | | | | | | | | | | |
| | | | | | | | | | | | | | 20,269,634 | |
| |
| |
South Africa – 1.9% |
| Transnet Ltd. (NR/NR) |
| ZAR | 8,000,000 | | | | 9.250 | | | | 11/14/17 | | | | 1,015,422 | |
| | 46,000,000 | | | | 10.500 | | | | 09/17/20 | | | | 6,129,177 | |
| | 18,000,000 | | | | 10.800 | | | | 11/06/23 | | | | 2,430,503 | |
| | 7,000,000 | | | | 9.500 | | | | 08/19/25 | | | | 866,564 | |
| | 181,000,000 | | | | 8.900 | | | | 11/14/27 | | | | 21,231,261 | |
| | | | | | | | | | | | | | | |
| | | | | | | | | | | | | | 31,672,927 | |
| |
| |
United Kingdom(d) – 0.1% |
| Arcos Dorados Holdings, Inc. (NR/Ba2) |
| BRL | 2,900,000 | | | | 10.250 | | | | 07/13/16 | | | | 1,511,486 | |
| |
| |
United States – 0.1% |
| JPMorgan Chase & Co. (A+/Aa3) |
| PHP | 52,000,000 | | | | 6.000 | | | | 10/10/12 | | | | 1,227,902 | |
| |
| |
Venezuela – 0.2% |
| Petroleos de Venezuela SA (NR/NR) |
| $ | 2,490,000 | | | | 4.900 | | | | 10/28/14 | | | | 1,693,200 | |
72 The accompanying notes are an integral part of these financial statements.
GOLDMAN SACHS LOCAL EMERGING MARKETS DEBT FUND
| | | | | | | | | | | | | | | |
Principal
| | Interest
| | Maturity
| | |
| Amount | | Rate | | Date | | Value |
| |
Corporate Obligations – (continued) |
Venezuela – (continued) |
| | | | | | | | | | | | | | | |
Petroleos de Venezuela SA (B+/NR)(f) |
| $ | 3,600,000 | | | | 8.500 | % | | | 11/02/17 | | | $ | 2,358,000 | |
| | | | | | | | | | | | | | | |
| | | | | | | | | | | | | | 4,051,200 | |
| |
| |
TOTAL CORPORATE OBLIGATIONS |
(Cost $114,356,510) | | $ | 98,717,507 | |
| |
| |
TOTAL INVESTMENTS BEFORE SHORT-TERM INVESTMENT |
(Cost $1,377,680,933) | | $ | 1,285,189,398 | |
| |
| |
| | | | | | | | | | | | | | | |
| | | | | | | | | | | | | | | |
Short-term Investment(g) – 19.7% |
Repurchase Agreement – 19.7% |
| Joint Repurchase Agreement Account II |
| $ | 333,700,000 | | | | 0.095 | % | | | 10/03/11 | | | $ | 333,700,000 | |
(Cost $333,700,000) | | | | |
| |
| |
TOTAL INVESTMENTS – 95.3% |
(Cost $1,711,380,933) | | $ | 1,618,889,398 | |
| |
| |
OTHER ASSETS IN EXCESS OF LIABILITIES – 4.7% | | | 79,462,090 | |
| |
| |
NET ASSETS – 100.0% | | $ | 1,698,351,488 | |
| |
| |
The percentage shown for each investment category reflects the value of investments in that category as a percentage of net assets.
| | |
| (a) | | Variable rate security. Interest rate disclosed is that which is in effect at September 30, 2011. |
| |
| (b) | | Security is currently in default and/or non-income producing. |
| |
| (c) | | Issued with a zero coupon. Income is recognized through the accretion of discount. |
| |
| (d) | | Exempt from registration under Rule 144A of the Securities Act of 1933. Under procedures approved by the Board of Trustees, such securities have been determined to be liquid by the investment adviser and may be resold, normally to qualified institutional buyers in transactions exempt from registration. Total market value of Rule 144A securities amounts to $60,385,209, which represents approximately 3.6% of net assets as of September 30, 2011. |
| |
| (e) | | Security with “Put” features with resetting interest rates. Maturity dates disclosed are the final maturity dates. |
| |
| (f) | | Security with “Call” features with resetting interest rates. Maturity dates disclosed are the final maturity dates. |
| |
| (g) | | Joint repurchase agreement was entered into on September 30, 2011. Additional information appears on pages 88-89. |
Security ratings disclosed, if any, are obtained from Standard & Poor’s /Moody’s Investor Service. A brief description of the ratings is available in the Fund’s Statement of Additional Information.
| | | | | |
| |
| |
Currency Abbreviations: |
| ARS | | — | | Argentine Peso |
| BRL | | — | | Brazilian Real |
| CLP | | — | | Chilean Peso |
| CNY | | — | | Chinese Yuan |
| COP | | — | | Colombian Peso |
| EUR | | — | | Euro |
| HUF | | — | | Hungarian Forint |
| IDR | | — | | Indonesian Rupiah |
| INR | | — | | Indian Rupee |
| KRW | | — | | South Korean Won |
| MXN | | — | | Mexican Peso |
| MYR | | — | | Malaysian Ringgit |
| PEN | | — | | Peruvian Nuevo Sol |
| PHP | | — | | Philippine Peso |
| PLN | | — | | Polish Zloty |
| RUB | | — | | Russian Ruble |
| THB | | — | | Thai Baht |
| TRY | | — | | Turkish Lira |
| TWD | | — | | Taiwan Dollar |
| ZAR | | — | | South African Rand |
| |
Investment Abbreviations: |
| BUBOR | | — | | Budapest Interbank Offered Rate |
| JIBAR | | — | | Johannesburg Interbank Agreed Rate |
| LIBOR | | — | | London Interbank Offered Rate |
| NR | | — | | Not Rated |
| TIIE | | — | | La Tasa de Interbank Equilibrium Interest Rate |
| |
| |
The accompanying notes are an integral part of these financial statements. 73
GOLDMAN SACHS LOCAL EMERGING MARKETS DEBT FUND
Schedule of Investments (continued)
September 30, 2011 (Unaudited)
| |
| ADDITIONAL INVESTMENT INFORMATION | |
FORWARD FOREIGN CURRENCY EXCHANGE CONTRACTS — At September 30, 2011, the Fund had outstanding forward foreign currency exchange contracts, both to purchase and sell foreign currencies:
FORWARD FOREIGN CURRENCY EXCHANGE CONTRACTS WITH UNREALIZED GAIN
| | | | | | | | | | | | | | | |
| | | Contracts to
| | Expiration
| | Current
| | Unrealized
|
| Counterparty | | Buy/Sell | | Date | | Value | | Gain |
| |
| Bank of America NA | | EUR/PLN | | | 12/21/11 | | | $ | 8,461,955 | | | $ | 29,269 | |
| | | USD/TWD | | | 10/25/11 | | | | 35,135,446 | | | | 314,554 | |
| Barclays Bank PLC | | EUR/HUF | | | 12/21/11 | | | | 14,128,173 | | | | 800,133 | |
| | | EUR/PLN | | | 12/21/11 | | | | 8,840,604 | | | | 191,702 | |
| | | USD/BRL | | | 10/18/11 | | | | 8,294,911 | | | | 362,089 | |
| | | USD/CNY | | | 03/01/12 | | | | 18,338,177 | | | | 81,823 | |
| | | USD/CNY | | | 05/09/12 | | | | 108,925,368 | | | | 315,632 | |
| | | USD/COP | | | 10/18/11 | | | | 16,100,289 | | | | 1,514,303 | |
| | | USD/EUR | | | 12/21/11 | | | | 23,062,348 | | | | 1,133,568 | |
| | | USD/HUF | | | 12/21/11 | | | | 27,614,216 | | | | 2,184,708 | |
| | | USD/IDR | | | 10/18/11 | | | | 6,238,566 | | | | 437,434 | |
| | | USD/INR | | | 10/18/11 | | | | 4,504,084 | | | | 308,916 | |
| | | USD/KRW | | | 10/18/11 | | | | 10,800,685 | | | | 1,052,635 | |
| | | USD/KRW | | | 10/31/11 | | | | 5,159,515 | | | | 28,567 | |
| | | USD/MXN | | | 12/21/11 | | | | 2,052,288 | | | | 117,392 | |
| | | USD/MYR | | | 10/18/11 | | | | 11,442,562 | | | | 784,938 | |
| | | USD/PHP | | | 10/18/11 | | | | 21,287,399 | | | | 535,047 | |
| | | USD/RUB | | | 10/18/11 | | | | 4,313,814 | | | | 474,186 | |
| | | USD/ZAR | | | 12/21/11 | | | | 19,644,952 | | | | 1,002,048 | |
| | | ZAR/USD | | | 12/21/11 | | | | 4,222,138 | | | | 14,624 | |
| Citibank NA | | EUR/PLN | | | 12/21/11 | | | | 4,257,988 | | | | 7,714 | |
| | | USD/CLP | | | 10/18/11 | | | | 11,037,324 | | | | 1,369,676 | |
| | | USD/CNY | | | 03/01/12 | | | | 18,335,302 | | | | 84,698 | |
| | | USD/EUR | | | 12/21/11 | | | | 18,769,088 | | | | 842,947 | |
| | | USD/INR | | | 10/21/11 | | | | 8,859,813 | | | | 260,187 | |
| | | USD/KRW | | | 10/18/11 | | | | 14,056,855 | | | | 1,573,145 | |
| | | USD/MXN | | | 12/21/11 | | | | 8,577,564 | | | | 311,436 | |
| | | USD/MYR | | | 10/11/11 | | | | 22,130,334 | | | | 154,666 | |
| | | USD/MYR | | | 10/18/11 | | | | 22,727,081 | | | | 1,861,919 | |
| Credit Suisse International (London) | | USD/BRL | | | 10/18/11 | | | | 16,350,265 | | | | 2,656,390 | |
| | | USD/COP | | | 10/18/11 | | | | 16,208,400 | | | | 1,291,600 | |
| | | USD/RUB | | | 10/18/11 | | | | 66,647,372 | | | | 7,183,628 | |
| | | USD/TWD | | | 10/18/11 | | | | 18,041,821 | | | | 1,133,179 | |
| Deutsche Bank AG (London) | | USD/CLP | | | 10/18/11 | | | | 4,296,631 | | | | 513,369 | |
| | | USD/CNY | | | 03/01/12 | | | | 18,707,497 | | | | 111,503 | |
| | | USD/COP | | | 10/18/11 | | | | 4,561,659 | | | | 329,341 | |
| | | USD/INR | | | 10/18/11 | | | | 22,344,345 | | | | 2,319,655 | |
| | | USD/INR | | | 10/28/11 | | | | 25,853,539 | | | | 279,461 | |
| | | USD/KRW | | | 10/18/11 | | | | 34,302,822 | | | | 3,595,178 | |
| | | USD/MYR | | | 10/18/11 | | | | 34,975,450 | | | | 2,339,050 | |
| | | USD/PEN | | | 10/18/11 | | | | 7,731,153 | | | | 98,847 | |
| | | USD/PHP | | | 10/18/11 | | | | 6,992,396 | | | | 197,604 | |
| HSBC Bank PLC | | EUR/PLN | | | 12/21/11 | | | | 18,596,987 | | | | 963,633 | |
| | | USD/BRL | | | 10/18/11 | | | | 46,454,916 | | | | 6,827,440 | |
| | | USD/COP | | | 10/18/11 | | | | 4,829,564 | | | | 354,436 | |
| | | USD/EUR | | | 12/21/11 | | | | 4,517,492 | | | | 82,791 | |
| | | USD/IDR | | | 10/06/11 | | | | 9,296,472 | | | | 271,147 | |
| | | USD/IDR | | | 10/18/11 | | | | 24,577,946 | | | | 1,422,054 | |
| | | USD/INR | | | 10/18/11 | | | | 8,963,108 | | | | 644,892 | |
| | | USD/MXN | | | 12/21/11 | | | | 4,900,217 | | | | 186,783 | |
74 The accompanying notes are an integral part of these financial statements.
GOLDMAN SACHS LOCAL EMERGING MARKETS DEBT FUND
| |
| ADDITIONAL INVESTMENT INFORMATION (continued) | |
FORWARD FOREIGN CURRENCY EXCHANGE CONTRACTS WITH UNREALIZED GAIN (continued)
| | | | | | | | | | | | | | | |
| | | Contracts to
| | Expiration
| | Current
| | Unrealized
|
| Counterparty | | Buy/Sell | | Date | | Value | | Gain |
| |
| HSBC Bank PLC (continued) | | USD/MYR | | | 10/18/11 | | | $ | 39,008,039 | | | $ | 2,280,961 | |
| | | USD/PEN | | | 10/18/11 | | | | 9,361,991 | | | | 83,081 | |
| | | USD/PLN | | | 12/21/11 | | | | 11,298,318 | | | | 1,035,682 | |
| | | USD/TRY | | | 12/21/11 | | | | 18,635,701 | | | | 499,538 | |
| | | USD/ZAR | | | 12/21/11 | | | | 19,959,387 | | | | 1,173,657 | |
| | | ZAR/USD | | | 12/21/11 | | | | 4,314,970 | | | | 20,970 | |
| JPMorgan Securities, Inc. | | EUR/HUF | | | 12/21/11 | | | | 4,210,252 | | | | 538 | �� |
| | | USD/BRL | | | 10/18/11 | | | | 3,755,369 | | | | 693,631 | |
| | | USD/CNY | | | 10/25/11 | | | | 48,578,625 | | | | 209,154 | |
| | | USD/KRW | | | 10/31/11 | | | | 5,150,575 | | | | 28,169 | |
| | | USD/MXN | | | 12/21/11 | | | | 13,331,059 | | | | 1,941 | |
| | | USD/MYR | | | 10/11/11 | | | | 4,476,444 | | | | 83,556 | |
| | | USD/MYR | | | 10/18/11 | | | | 7,150,419 | | | | 536,581 | |
| | | USD/RUB | | | 10/18/11 | | | | 52,187,537 | | | | 6,201,463 | |
| | | USD/TRY | | | 12/21/11 | | | | 6,517,440 | | | | 8,560 | |
| | | USD/TWD | | | 10/25/11 | | | | 8,875,244 | | | | 244,756 | |
| | | USD/ZAR | | | 12/21/11 | | | | 4,277,125 | | | | 16,875 | |
| | | ZAR/USD | | | 10/28/11 | | | | 7,881,470 | | | | 259,981 | |
| Merrill Lynch & Co., Inc. | | CNY/USD | | | 10/25/11 | | | | 48,578,625 | | | | 351,625 | |
| | | USD/MYR | | | 10/18/11 | | | | 13,135,412 | | | | 803,588 | |
| Morgan Stanley & Co. | | USD/CLP | | | 10/18/11 | | | | 8,597,288 | | | | 1,062,712 | |
| | | USD/COP | | | 10/18/11 | | | | 17,758,984 | | | | 1,626,401 | |
| | | USD/EUR | | | 12/21/11 | | | | 9,164,897 | | | | 352,621 | |
| | | USD/IDR | | | 10/18/11 | | | | 39,961,365 | | | | 2,626,635 | |
| | | USD/MYR | | | 10/18/11 | | | | 6,693,010 | | | | 451,990 | |
| | | USD/ZAR | | | 12/21/11 | | | | 10,814,577 | | | | 944,865 | |
| Royal Bank of Canada | | USD/BRL | | | 10/18/11 | | | | 23,269,051 | | | | 3,485,949 | |
| | | USD/MYR | | | 10/18/11 | | | | 11,502,169 | | | | 859,831 | |
| | | USD/RUB | | | 10/18/11 | | | | 12,978,002 | | | | 1,433,998 | |
| Royal Bank of Scotland PLC | | USD/CNY | | | 05/09/12 | | | | 65,474,468 | | | | 279,595 | |
| | | USD/IDR | | | 10/18/11 | | | | 11,554,492 | | | | 673,508 | |
| | | USD/INR | | | 10/18/11 | | | | 11,082,542 | | | | 901,458 | |
| | | USD/PEN | | | 10/18/11 | | | | 8,020,058 | | | | 73,942 | |
| | | USD/RUB | | | 10/18/11 | | | | 7,294,484 | | | | 775,516 | |
| State Street Bank | | USD/KRW | | | 10/18/11 | | | | 10,937,914 | | | | 1,046,086 | |
| UBS AG (London) | | USD/BRL | | | 10/18/11 | | | | 12,665,197 | | | | 1,007,803 | |
| | | USD/RUB | | | 10/18/11 | | | | 69,920,746 | | | | 6,789,643 | |
| |
| |
TOTAL | | | | | | | | | | | | $ | 89,878,797 | |
| |
| |
FORWARD FOREIGN CURRENCY EXCHANGE CONTRACTS WITH UNREALIZED LOSS
| | | | | | | | | | | | | | | |
| | | Contracts to
| | Expiration
| | Current
| | Unrealized
|
| Counterparty | | Buy/Sell | | Date | | Value | | Loss |
| |
| Bank of America NA | | PLN/EUR | | | 12/21/11 | | | $ | 4,518,831 | | | $ | (59,328 | ) |
| | | PLN/USD | | | 12/21/11 | | | | 10,039,998 | | | | (375,209 | ) |
| Barclays Bank PLC | | CLP/USD | | | 10/18/11 | | | | 1,634,668 | | | | (173,709 | ) |
| | | CNY/USD | | | 03/01/12 | | | | 22,960,445 | | | | (297,555 | ) |
| | | EUR/HUF | | | 12/21/11 | | | | 4,417,830 | | | | (2,125 | ) |
| | | EUR/USD | | | 12/21/11 | | | | 8,380,062 | | | | (95,420 | ) |
| | | HUF/EUR | | | 12/21/11 | | | | 9,238,559 | | | | (387,393 | ) |
| | | HUF/EUR | | | 12/21/11 | | | | 3,084,005 | | | | (52,935 | ) |
The accompanying notes are an integral part of these financial statements. 75
GOLDMAN SACHS LOCAL EMERGING MARKETS DEBT FUND
Schedule of Investments (continued)
September 30, 2011 (Unaudited)
| |
| ADDITIONAL INVESTMENT INFORMATION (continued) | |
FORWARD FOREIGN CURRENCY EXCHANGE CONTRACTS WITH UNREALIZED LOSS (continued)
| | | | | | | | | | | | | | | |
| | | Contracts to
| | Expiration
| | Current
| | Unrealized
|
| Counterparty | | Buy/Sell | | Date | | Value | | Loss |
| |
| Barclays Bank PLC (continued) | | INR/USD | | | 10/18/11 | | | $ | 30,758,044 | | | $ | (2,388,627 | ) |
| | | KRW/USD | | | 10/18/11 | | | | 26,365,660 | | | | (2,142,400 | ) |
| | | MXN/EUR | | | 12/21/11 | | | | 8,964,001 | | | | (343,644 | ) |
| | | MXN/USD | | | 12/21/11 | | | | 17,230,450 | | | | (1,549,550 | ) |
| | | MYR/USD | | | 10/18/11 | | | | 87,367,285 | | | | (6,382,716 | ) |
| | | PLN/EUR | | | 12/21/11 | | | | 4,559,011 | | | | (188,233 | ) |
| | | PLN/USD | | | 12/21/11 | | | | 19,022,732 | | | | (1,204,306 | ) |
| | | RUB/USD | | | 10/18/11 | | | | 4,514,116 | | | | (451,043 | ) |
| | | TWD/USD | | | 10/18/11 | | | | 58,250,990 | | | | (3,706,559 | ) |
| Citibank NA | | CNY/USD | | | 05/09/12 | | | | 58,390,374 | | | | (470,556 | ) |
| | | IDR/USD | | | 10/06/11 | | | | 9,296,472 | | | | (394,528 | ) |
| | | IDR/USD | | | 10/18/11 | | | | 41,799,623 | | | | (2,425,377 | ) |
| | | IDR/USD | | | 12/15/11 | | | | 12,010,953 | | | | (974,047 | ) |
| | | INR/USD | | | 10/18/11 | | | | 4,225,521 | | | | (13,479 | ) |
| | | KRW/USD | | | 10/18/11 | | | | 43,315,551 | | | | (4,721,449 | ) |
| | | MYR/USD | | | 10/18/11 | | | | 81,291,079 | | | | (5,290,824 | ) |
| | | RUB/USD | | | 10/18/11 | | | | 49,346,791 | | | | (5,244,209 | ) |
| | | USD/CNY | | | 10/25/11 | | | | 18,248,119 | | | | (8,119 | ) |
| | | USD/KRW | | | 10/18/11 | | | | 13,348,765 | | | | (15,765 | ) |
| Credit Suisse International (London) | | COP/USD | | | 10/18/11 | | | | 31,067,622 | | | | (2,891,278 | ) |
| | | MXN/USD | | | 12/21/11 | | | | 8,538,739 | | | | (1,105,261 | ) |
| | | RUB/USD | | | 10/18/11 | | | | 33,429,682 | | | | (4,925,318 | ) |
| Deutsche Bank AG (London) | | CLP/USD | | | 10/18/11 | | | | 10,621,730 | | | | (1,287,270 | ) |
| | | EUR/USD | | | 10/13/11 | | | | 8,919,160 | | | | (186,987 | ) |
| | | INR/USD | | | 10/18/11 | | | | 45,660,800 | | | | (4,282,337 | ) |
| | | MXN/USD | | | 12/21/11 | | | | 88,949,177 | | | | (9,603,102 | ) |
| | | MYR/USD | | | 10/18/11 | | | | 82,636,181 | | | | (4,723,318 | ) |
| | | PEN/USD | | | 10/18/11 | | | | 25,113,202 | | | | (179,484 | ) |
| | | PLN/EUR | | | 12/21/11 | | | | 4,601,869 | | | | (148,337 | ) |
| | | TWD/USD | | | 10/18/11 | | | | 6,695,345 | | | | (361,655 | ) |
| | | USD/MXN | | | 12/21/11 | | | | 13,388,330 | | | | (55,330 | ) |
| HSBC Bank PLC | | BRL/USD | | | 10/18/11 | | | | 12,509,403 | | | | (1,484,597 | ) |
| | | CNY/USD | | | 03/01/12 | | | | 42,874,461 | | | | (538,468 | ) |
| | | CNY/USD | | | 05/09/12 | | | | 58,004,731 | | | | (352,787 | ) |
| | | EUR/PLN | | | 12/21/11 | | | | 4,450,019 | | | | (34,314 | ) |
| | | HUF/EUR | | | 12/21/11 | | | | 4,521,510 | | | | (75,313 | ) |
| | | HUF/USD | | | 12/21/11 | | | | 16,929,042 | | | | (282,186 | ) |
| | | IDR/USD | | | 10/18/11 | | | | 19,995,674 | | | | (499,812 | ) |
| | | MXN/USD | | | 12/21/11 | | | | 17,921,852 | | | | (1,896,593 | ) |
| | | MYR/USD | | | 10/18/11 | | | | 13,218,781 | | | | (499,219 | ) |
| | | PHP/USD | | | 10/18/11 | | | | 34,778,885 | | | | (539,707 | ) |
| | | PLN/USD | | | 12/21/11 | | | | 86,518,311 | | | | (8,483,457 | ) |
| | | RUB/USD | | | 10/18/11 | | | | 69,258,817 | | | | (10,310,023 | ) |
| | | TRY/USD | | | 12/21/11 | | | | 57,580,319 | | | | (2,006,428 | ) |
| | | TWD/USD | | | 10/31/11 | | | | 10,832,134 | | | | (98,085 | ) |
| | | USD/IDR | | | 10/18/11 | | | | 3,238,058 | | | | (12,058 | ) |
| | | ZAR/USD | | | 12/21/11 | | | | 30,206,897 | | | | (571,169 | ) |
| JPMorgan Securities, Inc. | | CNY/USD | | | 03/01/12 | | | | 48,468,245 | | | | (628,122 | ) |
| | | EUR/USD | | | 12/21/11 | | | | 8,840,784 | | | | (46,908 | ) |
| | | HUF/USD | | | 12/21/11 | | | | 9,485,483 | | | | (1,114,852 | ) |
| | | KRW/USD | | | 10/18/11 | | | | 24,088,347 | | | | (2,788,733 | ) |
| | | PLN/EUR | | | 12/21/11 | | | | 9,077,842 | | | | (451,923 | ) |
| | | TRY/USD | | | 12/21/11 | | | | 8,755,236 | | | | (106,764 | ) |
76 The accompanying notes are an integral part of these financial statements.
GOLDMAN SACHS LOCAL EMERGING MARKETS DEBT FUND
| |
| ADDITIONAL INVESTMENT INFORMATION (continued) | |
FORWARD FOREIGN CURRENCY EXCHANGE CONTRACTS WITH UNREALIZED LOSS (continued)
| | | | | | | | | | | | | | | |
| | | Contracts to
| | Expiration
| | Current
| | Unrealized
|
| Counterparty | | Buy/Sell | | Date | | Value | | Loss |
| |
| JPMorgan Securities, Inc. (continued) | | ZAR/USD | | | 12/21/11 | | | $ | 8,361,851 | | | $ | (1,282,149 | ) |
| Morgan Stanley & Co. | | BRL/USD | | | 10/18/11 | | | | 4,994,705 | | | | (969,295 | ) |
| | | CLP/USD | | | 10/18/11 | | | | 10,387,005 | | | | (708,467 | ) |
| | | CNY/USD | | | 05/09/12 | | | | 58,004,731 | | | | (444,479 | ) |
| | | COP/USD | | | 10/18/11 | | | | 14,755,991 | | | | (1,306,009 | ) |
| | | IDR/USD | | | 10/18/11 | | | | 49,041,046 | | | | (2,512,327 | ) |
| | | PLN/EUR | | | 12/21/11 | | | | 4,601,869 | | | | (137,227 | ) |
| | | TRY/USD | | | 12/21/11 | | | | 1,550,873 | | | | (45,447 | ) |
| | | ZAR/USD | | | 12/21/11 | | | | 33,151,517 | | | | (864,004 | ) |
| Royal Bank of Canada | | BRL/USD | | | 10/18/11 | | | | 8,478,765 | | | | (108,235 | ) |
| | | INR/USD | | | 10/18/11 | | | | 8,820,254 | | | | (939,746 | ) |
| | | RUB/USD | | | 10/18/11 | | | | 6,842,748 | | | | (704,252 | ) |
| Royal Bank of Scotland PLC | | KRW/USD | | | 10/18/11 | | | | 33,533,987 | | | | (3,701,556 | ) |
| | | KRW/USD | | | 10/31/11 | | | | 8,343,203 | | | | (134,797 | ) |
| | | RUB/USD | | | 10/18/11 | | | | 72,399,473 | | | | (10,743,115 | ) |
| State Street Bank | | MXN/USD | | | 12/21/11 | | | | 22,306,237 | | | | (303,431 | ) |
| | | ZAR/USD | | | 12/21/11 | | | | 6,951,696 | | | | (313,860 | ) |
| UBS AG (London) | | BRL/USD | | | 10/18/11 | | | | 42,006,522 | | | | (6,459,388 | ) |
| | | BRL/USD | | | 10/27/11 | | | | 4,409,727 | | | | (21,273 | ) |
| | | RUB/USD | | | 10/18/11 | | | | 23,035,510 | | | | (2,995,490 | ) |
| Westpac Banking Corp. | | EUR/USD | | | 12/21/11 | | | | 1,671,459 | | | | (24,074 | ) |
| |
| |
TOTAL | | | | | | | | | | | | $ | (136,648,921 | ) |
| |
| |
SWAP CONTRACTS — At September 30, 2011, the Fund had outstanding swap contracts with the following terms:
INTEREST RATE SWAP CONTRACTS
| | | | | | | | | | | | | | | | | | | | | | | | | | | |
| | | | | | | | | Rates Exchanged | | | | | | |
| | | | | Notional
| | | | Payments
| | Payments
| | | | Upfront Payments
| | |
| | | | | Amount
| | Termination
| | Received
| | Made by
| | Market
| | Made (Received)
| | Unrealized
|
| Counterparty | | | | (000s) | | Date | | by the Fund | | the Fund | | Value | | by the Fund | | Gain (Loss) |
| |
| | | | | | | | | | | | | | | Mexico
Interbank TIIE | | | | | | | | | | | | |
| Bank of America Securities LLC | | MXN | | | 697,520 | | | | 09/16/13 | | | 4.700% | | 28 Days | | $ | (202,213 | ) | | $ | — | | | $ | (202,213 | ) |
| | | | | | | | | | | | | | | Mexico
Interbank TIIE | | | | | | | | | | | | |
| | | | | | 302,500 | | | | 09/08/21 | | | 6.729 | | 28 Days | | | (174,156 | ) | | | — | | | | (174,156 | ) |
| | | | | | | | | | | | | | | Mexico
Interbank TIIE | | | | | | | | | | | | |
| | | | | | 279,500 | | | | 09/17/21 | | | 6.720 | | 28 Days | | | (238,891 | ) | | | (3,290 | ) | | | (235,601 | ) |
| | | HUF | | | 6,390,000 | | | | 09/29/13 | | | 6.420 | | 6 month BUBOR | | | (166,392 | ) | | | — | | | | (166,392 | ) |
| Barclays Bank PLC | | TWD | | | 546,000 | | | | 06/03/16 | | | 3 month TWD | | 1.460% | | | (327,456 | ) | | | — | | | | (327,456 | ) |
| | | HUF | | | 351,610 | (a) | | | 10/04/16 | | | 7.020 | | 6 month BUBOR | | | 2,800 | | | | — | | | | 2,800 | |
| Deutsche Bank Securities, Inc. | | | | | | | | | | | | | | Mexico
Interbank TIIE | | | | | | | | | | | | |
| | | MXN | | | 521,100 | | | | 09/09/13 | | | 4.570 | | 28 Days | | | (243,160 | ) | | | — | | | | (243,160 | ) |
| | | TWD | | | 670,000 | | | | 01/28/16 | | | 3 month TWD | | 1.630 | | | (572,922 | ) | | | — | | | | (572,922 | ) |
| HSBC Bank PLC | | ZAR | | | 273,000 | | | | 09/28/21 | | | 7.670 | | 3 month JIBAR | | | (480,137 | ) | | | — | | | | (480,137 | ) |
The accompanying notes are an integral part of these financial statements. 77
GOLDMAN SACHS LOCAL EMERGING MARKETS DEBT FUND
Schedule of Investments (continued)
September 30, 2011 (Unaudited)
| |
| ADDITIONAL INVESTMENT INFORMATION (continued) | |
INTEREST RATE SWAP CONTRACTS (continued)
| | | | | | | | | | | | | | | | | | | | | | | | | | | |
| | | | | | | | | Rates Exchanged | | | | | | |
| | | | | Notional
| | | | Payments
| | Payments
| | | | Upfront Payments
| | |
| | | | | Amount
| | Termination
| | Received
| | Made by
| | Market
| | Made (Received)
| | Unrealized
|
| Counterparty | | | | (000s) | | Date | | by the Fund | | the Fund | | Value | | by the Fund | | Gain (Loss) |
| |
| JPMorgan Securities, Inc. | | TWD | | | 393,000 | | | | 01/26/21 | | | 3 month TWD | | 2.070% | | $ | (844,472 | ) | | $ | — | | | $ | (844,472 | ) |
| | | | | | | | | | | | | | | Mexico
Interbank TIIE | | | | | | | | | | | | |
| | | MXN | | | 325,000 | | | | 06/15/21 | | | 7.160% | | 28 Days | | | 610,490 | | | | — | | | | 610,490 | |
| | | ZAR | | | 460,000 | | | | 06/27/21 | | | 8.060 | | 3 month JIBAR | | | 831,354 | | | | — | | | | 831,354 | |
| | | | | | 70,250 | | | | 09/13/21 | | | 7.660 | | 3 month JIBAR | | | (121,036 | ) | | | — | | | | (121,036 | ) |
| |
| |
TOTAL | | | | | | | | | | | | | | | | $ | (1,926,191 | ) | | $ | (3,290 | ) | | $ | (1,922,901 | ) |
| |
| |
| | |
| (a) | | Represents forward starting interest rate swaps whose effective dates of commencement of accruals and cash flows occur subsequent to September 30, 2011. |
NON-DELIVERABLE BOND FORWARD CONTRACTS*
| | | | | | | | | | | | | | | |
| | | | | Notional
| | | | | | |
| | | | | Amount
| | Referenced
| | Settlement
| | Unrealized
|
| Counterparty | | | | (000s) | | Obligation | | Date | | Gain (Loss) |
| |
| Deutsche Bank Securities, Inc. | | COP | | | 35,183,000 | | | Titulos de Tesoreria
10.000% 7/24/24 | | 10/28/11 | | $ | 168,259 | |
| | | | | | 10,972,000 | | | Titulos de Tesoreria
10.000% 7/24/24 | | 10/31/11 | | | 53,154 | |
| |
| |
TOTAL | | | | | | | | | | | | $ | 221,413 | |
| |
| |
| | |
| * | | Represents a short term forward contract to purchase the referenced obligation denominated in a non-deliverable foreign currency. |
78 The accompanying notes are an integral part of these financial statements.
GOLDMAN SACHS U.S. MORTGAGES FUND
Schedule of Investments
September 30, 2011 (Unaudited)
| | | | | | | | | | | | | | | |
Principal
| | Interest
| | Maturity
| | |
| Amount | | Rate | | Date | | Value |
| |
Mortgage-Backed Obligations – 100.3% |
Collateralized Mortgage Obligations – 8.0% |
Adjustable Rate Non-Agency(a) – 2.0% |
Adjustable Rate Mortgage Trust Series 2004-5, Class 2A1 |
| $ | 256,899 | | | | 2.811 | % | | | 04/25/35 | | | $ | 234,060 | |
American Home Mortgage Investment Trust Series 2004-3, Class 1A |
| | 7,636 | | | | 0.605 | | | | 10/25/34 | | | | 6,966 | |
Bear Stearns Adjustable Rate Mortgage Trust Series 2004-1, Class 21A1 |
| | 267,041 | | | | 2.473 | | | | 04/25/34 | | | | 230,456 | |
Bear Stearns Alt-A Trust Series 2004-3, Class A1 |
| | 91,928 | | | | 0.875 | | | | 04/25/34 | | | | 66,550 | |
Bear Stearns Alt-A Trust Series 2005-5, Class 21A1 |
| | 1,271,518 | | | | 2.554 | | | | 07/25/35 | | | | 818,603 | |
Countrywide Alternative Loan Trust Series 2005-16, Class A1 |
| | 948,188 | | | | 1.887 | | | | 06/25/35 | | | | 558,095 | |
Countrywide Alternative Loan Trust Series 2005-38, Class A1 |
| | 264,777 | | | | 1.742 | | | | 09/25/35 | | | | 159,629 | |
Countrywide Home Loan Mortgage Pass-Through Trust Series 2003-52, Class A1 |
| | 305,592 | | | | 2.762 | | | | 02/19/34 | | | | 257,308 | |
Countrywide Home Loan Mortgage Pass-Through Trust Series 2004-HYB6, Class A2 |
| | 355,725 | | | | 2.846 | | | | 11/20/34 | | | | 277,252 | |
Harborview Mortgage Loan Trust Series 2005-15, Class 2A11 |
| | 635,421 | | | | 0.501 | | | | 10/20/45 | | | | 390,593 | |
Harborview Mortgage Loan Trust Series 2005-16, Class 2A1A |
| | 391,706 | | | | 0.470 | | | | 01/19/36 | | | | 217,266 | |
Impac CMB Trust Series 2004-08, Class 1A |
| | 100,753 | | | | 0.955 | | | | 10/25/34 | | | | 60,858 | |
JPMorgan Mortgage Trust Series 2005-A4, Class 2A1 |
| | 1,118,587 | | | | 2.796 | | | | 07/25/35 | | | | 930,441 | |
Master Adjustable Rate Mortgages Trust Series 2007-1, Class I2A3 |
| | 1,244,290 | | | | 0.982 | | | | 01/25/47 | | | | 497,330 | |
Morgan Stanley Mortgage Loan Trust Series 2004-8AR, Class 4A1 |
| | 1,161,408 | | | | 2.512 | | | | 10/25/34 | | | | 951,425 | |
Mortgage IT Trust Series 2005-5, Class A1 |
| | 877,467 | | | | 0.495 | | | | 12/25/35 | | | | 552,123 | |
Sequoia Mortgage Trust Series 2004-09, Class A2 |
| | 397,357 | | | | 0.820 | | | | 10/20/34 | | | | 304,455 | |
Structured Adjustable Rate Mortgage Loan Trust Series 2004-5, Class 3A1 |
| | 515,593 | | | | 2.539 | | | | 05/25/34 | | | | 460,424 | |
Structured Adjustable Rate Mortgage Loan Trust Series 2004-12, Class 3A2 |
| | 227,892 | | | | 2.444 | | | | 09/25/34 | | | | 188,968 | |
Structured Adjustable Rate Mortgage Loan Trust Series 2004-19, Class 2A2 |
| | 128,553 | | | | 2.573 | | | | 01/25/35 | | | | 84,018 | |
| | | | | | | | | | | | | | | |
| | | | | | | | | | | | | | 7,246,820 | |
| |
| |
Interest Only(b) – 0.6% |
ABN AMRO Mortgage Corp. Series 2003-8, Class A2 |
| | 12,814 | | | | 5.500 | | | | 06/25/33 | | | | 849 | |
CS First Boston Mortgage Securities Corp. Series 2002-AR31, Class 5X(a)(c) |
| | 58,813 | | | | 0.000 | | | | 11/25/32 | | | | — | |
CS First Boston Mortgage Securities Corp. Series 2003-19, Class 1A2 |
| | 31,920 | | | | 5.250 | | | | 07/25/33 | | | | 1,970 | |
FHLMC REMIC Series 3673, Class SA(a) |
| | 7,167,224 | | | | 6.191 | | | | 05/15/40 | | | | 934,085 | |
FHLMC REMIC Series 3743, Class SA(a) |
| | 4,586,453 | | | | 5.171 | | | | 10/15/40 | | | | 568,060 | |
| FHLMC STRIPS Series 256, Class 56 |
| | 5,832,967 | | | | 4.500 | | | | 05/15/23 | | | | 490,229 | |
FNMA REMIC Series 2004-47, Class EI(a)(c) |
| | 597,782 | | | | 0.000 | | | | 06/25/34 | | | | 2,577 | |
FNMA REMIC Series 2004-62, Class DI(a)(c) |
| | 239,523 | | | | 0.000 | | | | 07/25/33 | | | | 717 | |
Master Adjustable Rate Mortgages Trust Series 2003-2, Class 3AX(a) |
| | 26,213 | | | | 0.123 | | | | 08/25/33 | | | | 115 | |
Master Adjustable Rate Mortgages Trust Series 2003-2, Class 4AX(a) |
| | 7,842 | | | | 0.320 | | | | 07/25/33 | | | | 89 | |
| | | | | | | | | | | | | | | |
| | | | | | | | | | | | | | 1,998,691 | |
| |
| |
Inverse Floaters(a) – 0.0% |
GNMA Series 2001-48, Class SA |
| | 13,615 | | | | 25.742 | | | | 10/16/31 | | | | 22,030 | |
GNMA Series 2001-51, Class SB |
| | 13,291 | | | | 25.742 | | | | 10/16/31 | | | | 22,162 | |
| | | | | | | | | | | | | | | |
| | | | | | | | | | | | | | 44,192 | |
| |
| |
Planned Amortization Class – 1.7% |
| FHLMC REMIC Series 3748 |
| | 1,000,000 | | | | 4.000 | | | | 11/15/39 | | | | 1,069,849 | |
FNMA REMIC Series 2003-88, Class TH |
| | 5,000,000 | | | | 4.500 | | | | 09/25/18 | | | | 5,344,875 | |
| | | | | | | | | | | | | | | |
| | | | | | | | | | | | | | 6,414,724 | |
| |
| |
Regular Floater(a)(c) – 0.0% |
| FHLMC REMIC Series 3038, Class XA |
| | 5,371 | | | | 0.000 | | | | 09/15/35 | | | | 5,343 | |
| |
| |
Sequential Fixed Rate – 3.7% |
| FHLMC Multifamily Structured Pass Through Certificates, Series K702, Class A2 |
| | 2,200,000 | | | | 3.154 | | | | 02/25/18 | | | | 2,303,620 | |
| FHLMC Multifamily Structured-Pass Through Certificates Series K703, Class A2 |
| | 1,300,000 | | | | 2.699 | | | | 05/25/18 | | | | 1,326,055 | |
| FHLMC REMIC Series 2042, Class N |
| | 353,437 | | | | 6.500 | | | | 03/15/28 | �� | | | 400,926 | |
| FHLMC REMIC Series 2590, Class NV |
| | 1,000,000 | | | | 5.000 | | | | 03/15/18 | | | | 1,081,084 | |
| FHLMC REMIC Series 2770, Class TW |
| | 7,300,000 | | | | 4.500 | | | | 03/15/19 | | | | 7,972,981 | |
| FHLMC REMIC Series 2844, Class BY |
| | 149,312 | | | | 4.000 | | | | 06/15/18 | | | | 151,392 | |
The accompanying notes are an integral part of these financial statements. 79
GOLDMAN SACHS U.S. MORTGAGES FUND
Schedule of Investments (continued)
September 30, 2011 (Unaudited)
| | | | | | | | | | | | | | | |
Principal
| | Interest
| | Maturity
| | |
| Amount | | Rate | | Date | | Value |
| |
Mortgage-Backed Obligations – (continued) |
Sequential Fixed Rate – (continued) |
| | | | | | | | | | | | | | | |
FNMA REMIC Series 2000-16, Class ZG |
| $ | 530,648 | | | | 8.500 | % | | | 06/25/30 | | | $ | 612,902 | |
| | | | | | | | | | | | | | | |
| | | | | | | | | | | | | | 13,848,960 | |
| |
| |
TOTAL COLLATERALIZED MORTGAGE OBLIGATIONS | | $ | 29,558,730 | |
| |
| |
Commercial Mortgage-Backed Securities – 9.9% |
Sequential Fixed Rate – 2.7% |
Bear Stearns Commercial Mortgage Securities, Inc. Series 2002-TOP6, Class A2 |
| $ | 3,488,794 | | | | 6.460 | % | | | 10/15/36 | | | $ | 3,518,955 | |
Citigroup Commercial Mortgage Trust Series 2006-C5, Class A4 |
| | 1,750,000 | | | | 5.431 | | | | 10/15/49 | | | | 1,877,210 | |
Credit Suisse Mortgage Capital Certificates Trust Series 2006-C4, Class A3 |
| | 825,000 | | | | 5.467 | | | | 09/15/39 | | | | 860,822 | |
LB-UBS Commercial Mortgage Trust Series 2006-C1, Class A4 |
| | 3,640,000 | | | | 5.156 | | | | 02/15/31 | | | | 3,946,352 | |
| | | | | | | | | | | | | | | |
| | | | | | | | | | | | | | 10,203,339 | |
| |
| |
Sequential Floating Rate(a) – 7.2% |
Banc of America Commercial Mortgage, Inc. Series 2005-6, Class A4 |
| | 5,000,000 | | | | 5.367 | | | | 09/10/47 | | | | 5,494,440 | |
Banc of America Commercial Mortgage, Inc. Series 2006-2, Class A4 |
| | 2,000,000 | | | | 5.921 | | | | 05/10/45 | | | | 2,200,357 | |
JPMorgan Chase Commercial Mortgage Securities Corp. Series 2005-CB11, Class A4 |
| | 7,500,000 | | | | 5.335 | | | | 08/12/37 | | | | 8,186,402 | |
JPMorgan Chase Commercial Mortgage Securities Corp. Series 2005-LDP1, Class A4 |
| | 2,000,000 | | | | 5.038 | | | | 03/15/46 | | | | 2,157,711 | |
Merrill Lynch/Countrywide Commercial Mortgage Trust Series 2006-1, Class A4 |
| | 3,000,000 | | | | 5.607 | | | | 02/12/39 | | | | 3,211,945 | |
Morgan Stanley Capital I Series 2006-HQ9, Class A4 |
| | 2,769,000 | | | | 5.731 | | | | 07/12/44 | | | | 2,998,506 | |
Wachovia Bank Commercial Mortgage Trust Series 2006-C25, Class A4 |
| | 2,250,000 | | | | 5.923 | | | | 05/15/43 | | | | 2,422,211 | |
| | | | | | | | | | | | | | | |
| | | | | | | | | | | | | | 26,671,572 | |
| |
| |
TOTAL COMMERCIAL MORTGAGE-BACKED SECURITIES | | $ | 36,874,911 | |
| |
| |
Federal Agencies – 82.4% |
Adjustable Rate FHLMC(a) – 0.3% |
| $ | 226,763 | | | | 2.500 | % | | | 04/01/33 | | | $ | 237,251 | |
| | 96,693 | | | | 2.570 | | | | 09/01/33 | | | | 101,100 | |
| | 42,757 | | | | 2.365 | | | | 10/01/34 | | | | 44,477 | |
| | 81,703 | | | | 2.500 | | | | 11/01/34 | | | | 85,479 | |
| | 81,278 | | | | 2.494 | | | | 02/01/35 | | | | 85,666 | |
| | 294,980 | | | | 2.511 | | | | 06/01/35 | | | | 308,680 | |
| | 299,178 | | | | 2.516 | | | | 08/01/35 | | | | 313,098 | |
| | | | | | | | | | | | | | | |
| | | | | | | | | | | | | | 1,175,751 | |
| |
| |
Adjustable Rate FNMA(a) – 0.7% |
| | 8,913 | | | | 2.609 | | | | 07/01/22 | | | | 9,165 | |
| | 23,503 | | | | 2.588 | | | | 07/01/27 | | | | 24,333 | |
| | 39,875 | | | | 2.588 | | | | 11/01/27 | | | | 41,275 | |
| | 7,883 | | | | 2.588 | | | | 01/01/31 | | | | 8,198 | |
| | 9,332 | | | | 2.588 | | | | 06/01/32 | | | | 9,709 | |
| | 27,605 | | | | 2.609 | | | | 08/01/32 | | | | 28,680 | |
| | 65,672 | | | | 2.609 | | | | 05/01/33 | | | | 68,266 | |
| | 31,466 | | | | 1.861 | | | | 06/01/33 | | | | 32,272 | |
| | 365,124 | | | | 2.526 | | | | 06/01/33 | | | | 382,682 | |
| | 25,547 | | | | 2.451 | | | | 07/01/33 | | | | 26,719 | |
| | 359,237 | | | | 2.610 | | | | 08/01/33 | | | | 372,304 | |
| | 3,298 | | | | 2.717 | | | | 09/01/33 | | | | 3,482 | |
| | 1,381 | | | | 2.324 | | | | 12/01/33 | | | | 1,416 | |
| | 196,287 | | | | 2.431 | | | | 12/01/33 | | | | 205,962 | |
| | 8,067 | | | | 2.522 | | | | 04/01/34 | | | | 8,459 | |
| | 475,903 | | | | 2.730 | | | | 08/01/34 | | | | 503,874 | |
| | 99,219 | | | | 2.681 | | | | 11/01/34 | | | | 104,113 | |
| | 143,026 | | | | 2.444 | | | | 02/01/35 | | | | 149,431 | |
| | 239,288 | | | | 2.370 | | | | 03/01/35 | | | | 249,165 | |
| | 92,336 | | | | 2.685 | | | | 04/01/35 | | | | 97,477 | |
| | 144,212 | | | | 2.617 | | | | 05/01/35 | | | | 152,226 | |
| | 20,103 | | | | 2.588 | | | | 11/01/35 | | | | 20,816 | |
| | 106,355 | | | | 2.588 | | | | 12/01/37 | | | | 110,162 | |
| | 49,298 | | | | 2.588 | | | | 01/01/38 | | | | 51,069 | |
| | 45,583 | | | | 2.588 | | | | 11/01/40 | | | | 47,398 | |
| | | | | | | | | | | | | | | |
| | | | | | | | | | | | | | 2,708,653 | |
| |
| |
Adjustable Rate GNMA(a) – 0.7% |
| | 51,928 | | | | 2.375 | | | | 06/20/23 | | | | 53,311 | |
| | 25,319 | | | | 2.625 | | | | 07/20/23 | | | | 25,887 | |
| | 26,308 | | | | 2.625 | | | | 08/20/23 | | | | 26,902 | |
| | 67,857 | | | | 2.625 | | | | 09/20/23 | | | | 69,395 | |
| | 19,604 | | | | 2.375 | | | | 03/20/24 | | | | 20,112 | |
| | 169,624 | | | | 2.375 | | | | 04/20/24 | | | | 174,385 | |
| | 20,557 | | | | 2.375 | | | | 05/20/24 | | | | 21,128 | |
| | 177,951 | | | | 2.375 | | | | 06/20/24 | | | | 183,462 | |
| | 99,195 | | | | 2.625 | | | | 07/20/24 | | | | 102,309 | |
| | 135,507 | | | | 2.625 | | | | 08/20/24 | | | | 139,408 | |
| | 42,997 | | | | 2.625 | | | | 09/20/24 | | | | 44,024 | |
| | 50,443 | | | | 2.125 | | | | 11/20/24 | | | | 52,433 | |
| | 19,158 | | | | 2.125 | | | | 12/20/24 | | | | 19,916 | |
| | 26,718 | | | | 2.500 | | | | 12/20/24 | | | | 28,262 | |
| | 33,890 | | | | 2.375 | | | | 01/20/25 | | | | 35,225 | |
| | 17,153 | | | | 2.375 | | | | 02/20/25 | | | | 17,859 | |
| | 60,184 | | | | 2.375 | | | | 05/20/25 | | | | 62,739 | |
| | 47,571 | | | | 2.625 | | | | 07/20/25 | | | | 49,504 | |
| | 23,041 | | | | 2.375 | | | | 02/20/26 | | | | 23,691 | |
| | 1,273 | | | | 2.625 | | | | 07/20/26 | | | | 1,306 | |
| | 63,229 | | | | 2.375 | | | | 01/20/27 | | | | 65,587 | |
| | 22,907 | | | | 2.375 | | | | 02/20/27 | | | | 23,575 | |
| | 176,017 | | | | 2.375 | | | | 04/20/27 | | | | 181,483 | |
| | 20,120 | | | | 2.375 | | | | 05/20/27 | | | | 20,747 | |
| | 18,728 | | | | 2.375 | | | | 06/20/27 | | | | 19,335 | |
| | 6,979 | | | | 2.125 | | | | 11/20/27 | | | | 7,176 | |
| | 28,726 | | | | 2.125 | | | | 12/20/27 | | | | 29,540 | |
| | 56,129 | | | | 2.375 | | | | 01/20/28 | | | | 57,815 | |
80 The accompanying notes are an integral part of these financial statements.
GOLDMAN SACHS U.S. MORTGAGES FUND
| | | | | | | | | | | | | | | |
Principal
| | Interest
| | Maturity
| | |
| Amount | | Rate | | Date | | Value |
| |
Mortgage-Backed Obligations – (continued) |
Adjustable Rate GNMA(a) – (continued) |
| | | | | | | | | | | | | | | |
| $ | 19,649 | | | | 2.250 | % | | | 02/20/28 | | | $ | 20,242 | |
| | 20,418 | | | | 2.375 | | | | 03/20/28 | | | | 21,034 | |
| | 108,309 | | | | 2.625 | | | | 07/20/29 | | | | 111,423 | |
| | 46,044 | | | | 2.625 | | | | 08/20/29 | | | | 47,371 | |
| | 13,365 | | | | 2.625 | | | | 09/20/29 | | | | 13,770 | |
| | 55,016 | | | | 2.125 | | | | 10/20/29 | | | | 56,661 | |
| | 64,774 | | | | 2.125 | | | | 11/20/29 | | | | 66,687 | |
| | 15,867 | | | | 2.125 | | | | 12/20/29 | | | | 16,331 | |
| | 20,308 | | | | 2.250 | | | | 01/20/30 | | | | 20,944 | |
| | 11,742 | | | | 2.250 | | | | 02/20/30 | | | | 12,112 | |
| | 50,225 | | | | 2.250 | | | | 03/20/30 | | | | 51,875 | |
| | 62,435 | | | | 2.375 | | | | 04/20/30 | | | | 64,537 | |
| | 164,375 | | | | 2.375 | | | | 05/20/30 | | | | 171,011 | |
| | 13,968 | | | | 2.375 | | | | 06/20/30 | | | | 14,440 | |
| | 135,632 | | | | 2.625 | | | | 07/20/30 | | | | 142,164 | |
| | 25,491 | | | | 2.625 | | | | 09/20/30 | | | | 26,786 | |
| | 48,933 | | | | 1.875 | | | | 10/20/30 | | | | 50,475 | |
| | 210,851 | | | | 1.750 | | | | 12/20/34 | | | | 217,195 | |
| | | | | | | | | | | | | | | |
| | | | | | | | | | | | | | 2,681,574 | |
| |
| |
FHLMC – 18.5% |
| | 12,440 | | | | 6.000 | | | | 12/01/14 | | | | 12,811 | |
| | 15,709 | | | | 6.000 | | | | 03/01/16 | | | | 17,075 | |
| | 1,371 | | | | 5.000 | | | | 09/01/16 | | | | 1,469 | |
| | 14,901 | | | | 5.000 | | | | 11/01/16 | | | | 15,992 | |
| | 1,009 | | | | 5.000 | | | | 12/01/16 | | | | 1,085 | |
| | 44,442 | | | | 5.000 | | | | 01/01/17 | | | | 47,724 | |
| | 81,330 | | | | 5.000 | | | | 02/01/17 | | | | 87,286 | |
| | 67,552 | | | | 5.000 | | | | 03/01/17 | | | | 72,501 | |
| | 127,956 | | | | 5.000 | | | | 04/01/17 | | | | 137,331 | |
| | 2,988 | | | | 5.000 | | | | 05/01/17 | | | | 3,207 | |
| | 3,296 | | | | 5.000 | | | | 08/01/17 | | | | 3,537 | |
| | 338,372 | | | | 5.000 | | | | 09/01/17 | | | | 363,161 | |
| | 385,138 | | | | 5.000 | | | | 10/01/17 | | | | 413,355 | |
| | 216,241 | | | | 5.000 | | | | 11/01/17 | | | | 232,082 | |
| | 222,185 | | | | 5.000 | | | | 12/01/17 | | | | 238,461 | |
| | 271,145 | | | | 5.000 | | | | 01/01/18 | | | | 291,371 | |
| | 648,511 | | | | 5.000 | | | | 02/01/18 | | | | 696,825 | |
| | 627,605 | | | | 5.000 | | | | 03/01/18 | | | | 674,666 | |
| | 533,718 | | | | 5.000 | | | | 04/01/18 | | | | 573,919 | |
| | 60,051 | | | | 4.500 | | | | 05/01/18 | | | | 64,174 | |
| | 377,573 | | | | 5.000 | | | | 05/01/18 | | | | 406,041 | |
| | 96,198 | | | | 5.000 | | | | 06/01/18 | | | | 103,361 | |
| | 91,875 | | | | 5.000 | | | | 07/01/18 | | | | 98,678 | |
| | 51,902 | | | | 5.000 | | | | 08/01/18 | | | | 55,751 | |
| | 33,593 | | | | 5.000 | | | | 09/01/18 | | | | 36,144 | |
| | 117,022 | | | | 5.000 | | | | 10/01/18 | | | | 125,913 | |
| | 134,618 | | | | 5.000 | | | | 11/01/18 | | | | 144,849 | |
| | 64,259 | | | | 5.000 | | | | 12/01/18 | | | | 69,140 | |
| | 12,690 | | | | 5.000 | | | | 01/01/19 | | | | 13,654 | |
| | 4,103 | | | | 5.000 | | | | 02/01/19 | | | | 4,425 | |
| | 373,440 | | | | 5.500 | | | | 04/01/20 | | | | 405,356 | |
| | 1,430,775 | | | | 4.500 | | | | 08/01/23 | | | | 1,544,401 | |
| | 120,624 | | | | 7.000 | | | | 04/01/31 | | | | 135,829 | |
| | 1,622,620 | | | | 7.000 | | | | 09/01/31 | | | | 1,827,110 | |
| | 545,804 | | | | 7.000 | | | | 04/01/32 | | | | 612,804 | |
| | 1,532,292 | | | | 7.000 | | | | 05/01/32 | | | | 1,720,387 | |
| | 687,928 | | | | 6.000 | | | | 05/01/33 | | | | 761,827 | |
| | 38,281 | | | | 5.500 | | | | 12/01/33 | | | | 41,639 | |
| | 592,740 | | | | 5.000 | | | | 12/01/35 | | | | 637,265 | |
| | 529,222 | | | | 5.500 | | | | 01/01/36 | | | | 574,969 | |
| | 1,246 | | | | 5.500 | | | | 02/01/36 | | | | 1,354 | |
| | 24,027 | | | | 5.000 | | | | 02/01/37 | | | | 26,012 | |
| | 12,842 | | | | 6.000 | | | | 04/01/37 | | | | 14,238 | |
| | 3,531 | | | | 6.000 | | | | 07/01/37 | | | | 3,915 | |
| | 156,088 | | | | 6.000 | | | | 09/01/37 | | | | 173,099 | |
| | 250,659 | | | | 5.500 | | | | 02/01/38 | | | | 271,582 | |
| | 59,370 | | | | 6.000 | | | | 07/01/38 | | | | 65,970 | |
| | 1,461,348 | | | | 5.500 | | | | 10/01/38 | | | | 1,582,254 | |
| | 774,272 | | | | 5.500 | | | | 12/01/38 | | | | 838,332 | |
| | 161,088 | | | | 6.000 | | | | 12/01/38 | | | | 178,996 | |
| | 83,337 | | | | 6.000 | | | | 01/01/39 | | | | 92,707 | |
| | 173,069 | | | | 5.500 | | | | 02/01/39 | | | | 187,388 | |
| | 3,230,028 | | | | 4.500 | | | | 05/01/39 | | | | 3,468,243 | |
| | 7,000,706 | | | | 4.500 | | | | 09/01/39 | | | | 7,516,029 | |
| | 1,943,181 | | | | 4.500 | | | | 10/01/39 | | | | 2,086,981 | |
| | 2,954,578 | | | | 5.500 | | | | 01/01/40 | | | | 3,199,028 | |
| | 32,039 | | | | 4.000 | | | | 08/01/40 | | | | 33,553 | |
| | 87,852 | | | | 4.000 | | | | 09/01/40 | | | | 92,004 | |
| | 31,587 | | | | 3.500 | | | | 10/01/40 | | | | 32,465 | |
| | 349,253 | | | | 3.500 | | | | 11/01/40 | | | | 358,967 | |
| | 127,211 | | | | 4.000 | | | | 11/01/40 | | | | 133,222 | |
| | 133,262 | | | | 3.500 | | | | 12/01/40 | | | | 136,967 | |
| | 1,897,102 | | | | 4.000 | | | | 12/01/40 | | | | 1,986,750 | |
| | 1,190,880 | | | | 4.500 | | | | 12/01/40 | | | | 1,260,474 | |
| | 201,753 | | | | 4.500 | | | | 01/01/41 | | | | 213,695 | |
| | 70,572 | | | | 3.500 | | | | 02/01/41 | | | | 72,534 | |
| | 961,622 | | | | 4.000 | | | | 02/01/41 | | | | 1,014,999 | |
| | 678,561 | | | | 4.000 | | | | 03/01/41 | | | | 716,227 | |
| | 1,106,282 | | | | 4.500 | | | | 03/01/41 | | | | 1,171,636 | |
| | 1,776,491 | | | | 4.500 | | | | 04/01/41 | | | | 1,885,494 | |
| | 271,633 | | | | 4.500 | | | | 05/01/41 | | | | 288,390 | |
| | 831,239 | | | | 4.500 | | | | 07/01/41 | | | | 885,791 | |
| | 12,982,268 | | | | 4.500 | | | | 08/01/41 | | | | 13,740,919 | |
| | 264,321 | | | | 4.500 | | | | 08/01/41 | | | | 281,274 | |
| | 11,000,000 | | | | 4.000 | | | | TBA-30yr | (d) | | | 11,477,813 | |
| | | | | | | | | | | | | | | |
| | | | | | | | | | | | | | 68,756,877 | |
| |
| |
FNMA – 57.2% |
| | 2,049 | | | | 5.500 | | | | 04/01/16 | | | | 2,222 | |
| | 2,540 | | | | 5.500 | | | | 08/01/16 | | | | 2,754 | |
| | 30,802 | | | | 5.500 | | | | 11/01/16 | | | | 33,399 | |
| | 24,448 | | | | 5.500 | | | | 12/01/16 | | | | 26,509 | |
| | 34,761 | | | | 5.500 | | | | 01/01/17 | | | | 37,692 | |
| | 2,677 | | | | 5.500 | | | | 05/01/17 | | | | 2,907 | |
| | 12,445 | | | | 5.500 | | | | 07/01/17 | | | | 13,512 | |
| | 1,937 | | | | 5.500 | | | | 09/01/17 | | | | 2,103 | |
| | 25,285 | | | | 5.500 | | | | 01/01/18 | | | | 27,453 | |
| | 20,491 | | | | 5.500 | | | | 02/01/18 | | | | 22,249 | |
| | 2,629 | | | | 6.000 | | | | 02/01/18 | | | | 2,885 | |
| | 891,528 | | | | 2.800 | | | | 03/01/18 | | | | 926,233 | |
| | 580,841 | | | | 5.000 | | | | 03/01/18 | | | | 624,018 | |
The accompanying notes are an integral part of these financial statements. 81
GOLDMAN SACHS U.S. MORTGAGES FUND
Schedule of Investments (continued)
September 30, 2011 (Unaudited)
| | | | | | | | | | | | | | | |
Principal
| | Interest
| | Maturity
| | |
| Amount | | Rate | | Date | | Value |
| |
Mortgage-Backed Obligations – (continued) |
FNMA – (continued) |
| | | | | | | | | | | | | | | |
| $ | 37,214 | | | | 5.500 | % | | | 04/01/18 | | | $ | 40,351 | |
| | 2,530,000 | | | | 3.840 | | | | 05/01/18 | | | | 2,719,062 | |
| | 8,899 | | | | 5.500 | | | | 05/01/18 | | | | 9,649 | |
| | 28,578 | | | | 6.000 | | | | 05/01/18 | | | | 31,366 | |
| | 773,262 | | | | 5.000 | | | | 06/01/18 | | | | 830,743 | |
| | 1,608,349 | | | | 4.000 | | | | 08/01/18 | | | | 1,711,861 | |
| | 38,407 | | | | 5.000 | | | | 09/01/18 | | | | 41,262 | |
| | 156,026 | | | | 6.000 | | | | 11/01/18 | | | | 171,250 | |
| | 162,260 | | | | 7.000 | | | | 11/01/18 | | | | 177,148 | |
| | 1,473,602 | | | | 4.500 | | | | 12/01/18 | | | | 1,576,093 | |
| | 287,152 | | | | 6.000 | | | | 12/01/18 | | | | 315,167 | |
| | 241,108 | | | | 6.000 | | | | 01/01/19 | | | | 264,631 | |
| | 6,051 | | | | 5.500 | | | | 02/01/19 | | | | 6,589 | |
| | 27,649 | | | | 5.500 | | | | 04/01/19 | | | | 30,106 | |
| | 77,578 | | | | 6.000 | | | | 04/01/19 | | | | 85,147 | |
| | 6,272 | | | | 5.500 | | | | 05/01/19 | | | | 6,823 | |
| | 17,143 | | | | 6.000 | | | | 05/01/19 | | | | 18,815 | |
| | 38,024 | | | | 5.500 | | | | 07/01/19 | | | | 41,402 | |
| | 95,633 | | | | 5.500 | | | | 08/01/19 | | | | 104,131 | |
| | 42,715 | | | | 5.500 | | | | 09/01/19 | | | | 46,509 | |
| | 98,767 | | | | 5.500 | | | | 10/01/19 | | | | 107,543 | |
| | 37,156 | | | | 5.500 | | | | 11/01/19 | | | | 40,457 | |
| | 26,586 | | | | 5.500 | | | | 12/01/19 | | | | 28,949 | |
| | 163,124 | | | | 5.500 | | | | 02/01/20 | | | | 177,617 | |
| | 763,922 | | | | 4.500 | | | | 03/01/20 | | | | 817,054 | |
| | 893,362 | | | | 3.416 | | | | 10/01/20 | | | | 931,530 | |
| | 1,290,142 | | | | 3.375 | | | | 11/01/20 | | | | 1,341,712 | |
| | 44,284 | | | | 5.500 | | | | 01/01/21 | | | | 48,218 | |
| | 3,681,085 | | | | 4.377 | | | | 04/01/21 | | | | 4,108,677 | |
| | 65,501 | | | | 7.000 | | | | 09/01/21 | | | | 75,348 | |
| | 195,572 | | | | 7.000 | | | | 06/01/22 | | | | 225,171 | |
| | 84,541 | | | | 7.000 | | | | 07/01/22 | | | | 97,293 | |
| | 25,155 | | | | 4.500 | | | | 04/01/23 | | | | 26,795 | |
| | 1,991 | | | | 7.000 | | | | 01/01/29 | | | | 2,282 | |
| | 3,682 | | | | 7.000 | | | | 09/01/29 | | | | 4,198 | |
| | 1,866 | | | | 7.000 | | | | 02/01/30 | | | | 2,139 | |
| | 35,926 | | | | 7.000 | | | | 08/01/31 | | | | 40,829 | |
| | 2,252 | | | | 7.000 | | | | 03/01/32 | | | | 2,572 | |
| | 2,519 | | | | 7.000 | | | | 04/01/32 | | | | 2,876 | |
| | 3,113 | | | | 7.000 | | | | 05/01/32 | | | | 3,555 | |
| | 7,974 | | | | 7.000 | | | | 06/01/32 | | | | 9,106 | |
| | 6,716 | | | | 4.000 | | | | 07/01/32 | | | | 7,042 | |
| | 2,822 | | | | 7.000 | | | | 07/01/32 | | | | 3,223 | |
| | 112,514 | | | | 6.000 | | | | 01/01/33 | | | | 124,487 | |
| | 4,926 | | | | 6.000 | | | | 02/01/33 | | | | 5,450 | |
| | 595,456 | | | | 5.500 | | | | 04/01/33 | | | | 649,396 | |
| | 93,642 | | | | 6.000 | | | | 06/01/33 | | | | 103,935 | |
| | 30,192 | | | | 6.000 | | | | 07/01/33 | | | | 33,511 | |
| | 128,455 | | | | 5.000 | | | | 08/01/33 | | | | 138,555 | |
| | 6,888 | | | | 5.000 | | | | 09/01/33 | | | | 7,418 | |
| | 14,883 | | | | 5.500 | | | | 09/01/33 | | | | 16,232 | |
| | 70,621 | | | | 6.000 | | | | 09/01/33 | | | | 78,384 | |
| | 15,286 | | | | 6.000 | | | | 10/01/33 | | | | 16,951 | |
| | 7,578 | | | | 5.000 | | | | 11/01/33 | | | | 8,161 | |
| | 7,784 | | | | 5.000 | | | | 01/01/34 | | | | 8,383 | |
| | 109,550 | | | | 5.500 | | | | 02/01/34 | | | | 119,456 | |
| | 22,386 | | | | 5.500 | | | | 03/01/34 | | | | 24,410 | |
| | 30,493 | | | | 5.500 | | | | 04/01/34 | | | | 33,246 | |
| | 121,423 | | | | 5.500 | | | | 07/01/34 | | | | 132,384 | |
| | 23,033 | | | | 5.500 | | | | 08/01/34 | | | | 25,116 | |
| | 58,918 | | | | 5.500 | | | | 10/01/34 | | | | 64,228 | |
| | 56,361 | | | | 6.000 | | | | 11/01/34 | | | | 62,310 | |
| | 684,861 | | | | 5.500 | | | | 12/01/34 | | | | 746,580 | |
| | 1,177,884 | | | | 6.000 | | | | 12/01/34 | | | | 1,302,206 | |
| | 7,994 | | | | 5.000 | | | | 03/01/35 | | | | 8,609 | |
| | 16,646 | | | | 5.000 | | | | 04/01/35 | | | | 17,927 | |
| | 700,473 | | | | 6.000 | | | | 04/01/35 | | | | 775,256 | |
| | 19,274 | | | | 5.500 | | | | 06/01/35 | | | | 21,002 | |
| | 130,137 | | | | 5.000 | | | | 07/01/35 | | | | 140,218 | |
| | 44,682 | | | | 5.500 | | | | 07/01/35 | | | | 48,687 | |
| | 57,161 | | | | 5.000 | | | | 08/01/35 | | | | 61,564 | |
| | 31,597 | | | | 5.500 | | | | 08/01/35 | | | | 34,431 | |
| | 98,500 | | | | 5.000 | | | | 09/01/35 | | | | 106,086 | |
| | 26,180 | | | | 5.500 | | | | 09/01/35 | | | | 28,527 | |
| | 34,736 | | | | 5.000 | | | | 10/01/35 | | | | 37,411 | |
| | 395,408 | | | | 6.000 | | | | 10/01/35 | | | | 436,030 | |
| | 31,054 | | | | 5.000 | | | | 11/01/35 | | | | 33,446 | |
| | 11,508 | | | | 5.500 | | | | 12/01/35 | | | | 12,543 | |
| | 10,154 | | | | 6.000 | | | | 12/01/35 | | | | 11,188 | |
| | 26,236 | | | | 5.500 | | | | 04/01/36 | | | | 28,579 | |
| | 14,125 | | | | 6.000 | | | | 04/01/36 | | | | 15,563 | |
| | 77,441 | | | | 6.000 | | | | 05/01/36 | | | | 85,109 | |
| | 19,636 | | | | 5.000 | | | | 07/01/36 | | | | 21,149 | |
| | 289,744 | | | | 6.000 | | | | 11/01/36 | | | | 318,432 | |
| | 238,741 | | | | 6.000 | | | | 01/01/37 | | | | 262,380 | |
| | 20,856 | | | | 5.500 | | | | 02/01/37 | | | | 22,771 | |
| | 1,681,231 | | | | 6.000 | | | | 03/01/37 | | | | 1,847,697 | |
| | 70,007 | | | | 5.500 | | | | 04/01/37 | | | | 76,516 | |
| | 4,615 | | | | 5.500 | | | | 05/01/37 | | | | 5,039 | |
| | 177,377 | | | | 5.000 | | | | 06/01/37 | | | | 192,176 | |
| | 1,957 | | | | 5.500 | | | | 06/01/37 | | | | 2,137 | |
| | 32,799 | | | | 5.500 | | | | 07/01/37 | | | | 35,822 | |
| | 6,973 | | | | 5.500 | | | | 08/01/37 | | | | 7,616 | |
| | 351,784 | | | | 6.500 | | | | 10/01/37 | | | | 389,051 | |
| | 2,993 | | | | 5.500 | | | | 02/01/38 | | | | 3,272 | |
| | 28,308 | | | | 5.500 | | | | 03/01/38 | | | | 30,938 | |
| | 113,804 | | | | 5.500 | | | | 04/01/38 | | | | 124,366 | |
| | 27,471 | | | | 5.500 | | | | 05/01/38 | | | | 30,034 | |
| | 97,138 | | | | 6.000 | | | | 05/01/38 | | | | 106,640 | |
| | 4,123,591 | | | | 5.500 | | | | 06/01/38 | | | | 4,478,268 | |
| | 8,041 | | | | 5.500 | | | | 07/01/38 | | | | 8,795 | |
| | 7,596 | | | | 5.500 | | | | 08/01/38 | | | | 8,309 | |
| | 5,250 | | | | 5.500 | | | | 09/01/38 | | | | 5,742 | |
| | 1,706,015 | | | | 6.000 | | | | 11/01/38 | | | | 1,872,890 | |
| | 2,716 | | | | 5.500 | | | | 12/01/38 | | | | 2,971 | |
| | 12,068 | | | | 4.000 | | | | 01/01/39 | | | | 12,653 | |
| | 1,715,422 | | | | 5.000 | | | | 01/01/39 | | | | 1,849,975 | |
| | 1,196,448 | | | | 6.500 | | | | 01/01/39 | | | | 1,326,645 | |
| | 188,777 | | | | 4.000 | | | | 02/01/39 | | | | 197,941 | |
| | 33,411 | | | | 5.500 | | | | 02/01/39 | | | | 36,573 | |
| | 64,485 | | | | 4.000 | | | | 03/01/39 | | | | 67,615 | |
| | 35,924 | | | | 4.000 | | | | 04/01/39 | | | | 37,667 | |
82 The accompanying notes are an integral part of these financial statements.
GOLDMAN SACHS U.S. MORTGAGES FUND
| | | | | | | | | | | | | | | |
Principal
| | Interest
| | Maturity
| | |
| Amount | | Rate | | Date | | Value |
| |
Mortgage-Backed Obligations – (continued) |
FNMA – (continued) |
| | | | | | | | | | | | | | | |
| $ | 28,489 | | | | 4.000 | % | | | 05/01/39 | | | $ | 29,872 | |
| | 1,949 | | | | 4.000 | | | | 06/01/39 | | | | 2,045 | |
| | 71,928 | | | | 4.000 | | | | 07/01/39 | | | | 75,419 | |
| | 65,258 | | | | 4.500 | | | | 07/01/39 | | | | 70,247 | |
| | 388,365 | | | | 4.000 | | | | 08/01/39 | | | | 407,217 | |
| | 27,068 | | | | 4.500 | | | | 08/01/39 | | | | 29,138 | |
| | 270,232 | | | | 5.500 | | | | 08/01/39 | | | | 294,404 | |
| | 27,333 | | | | 4.000 | | | | 09/01/39 | | | | 28,660 | |
| | 89,322 | | | | 4.500 | | | | 09/01/39 | | | | 96,206 | |
| | 693,324 | | | | 4.500 | | | | 10/01/39 | | | | 746,758 | |
| | 446,513 | | | | 4.500 | | | | 11/01/39 | | | | 480,925 | |
| | 26,233 | | | | 4.000 | | | | 12/01/39 | | | | 27,506 | |
| | 27,266 | | | | 4.500 | | | | 12/01/39 | | | | 29,367 | |
| | 57,833 | | | | 4.500 | | | | 01/01/40 | | | | 62,290 | |
| | 37,754 | | | | 4.000 | | | | 02/01/40 | | | | 39,594 | |
| | 57,931 | | | | 4.000 | | | | 07/01/40 | | | | 60,743 | |
| | 94,441 | | | | 4.500 | | | | 09/01/40 | | | | 100,244 | |
| | 574,024 | | | | 4.500 | | | | 10/01/40 | | | | 609,295 | |
| | 6,915,904 | | | | 3.500 | | | | 01/01/41 | | | | 7,109,355 | |
| | 680,964 | | | | 4.500 | | | | 01/01/41 | | | | 722,806 | |
| | 7,009,076 | | | | 3.500 | | | | 02/01/41 | | | | 7,205,133 | |
| | 482,010 | | | | 4.500 | | | | 02/01/41 | | | | 511,627 | |
| | 3,927,709 | | | | 4.000 | | | | 04/01/41 | | | | 4,119,100 | |
| | 967,873 | | | | 5.000 | | | | 04/01/41 | | | | 1,047,180 | |
| | 14,969,215 | | | | 4.500 | | | | 08/01/41 | | | | 15,893,681 | |
| | 78,000,000 | | | | 3.000 | | | | TBA-15yr | (d) | | | 80,048,908 | |
| | 6,000,000 | | | | 3.500 | | | | TBA-30yr | (d) | | | 6,162,187 | |
| | 27,000,000 | | | | 4.000 | | | | TBA-30yr | (d) | | | 28,251,250 | |
| | 13,000,000 | | | | 5.000 | | | | TBA-30yr | (d) | | | 13,983,125 | |
| | 7,000,000 | | | | 5.500 | | | | TBA-30yr | (d) | | | 7,597,734 | |
| | | | | | | | | | | | | | | |
| | | | | | | | | | | | | | 212,883,298 | |
| |
| |
GNMA – 5.0% |
| | 267,273 | | | | 5.500 | | | | 07/15/20 | | | | 288,980 | |
| | 380,508 | | | | 3.950 | | | | 07/15/25 | | | | 415,274 | |
| | 3,313 | | | | 6.000 | | | | 03/15/26 | | | | 3,716 | |
| | 21,207 | | | | 6.000 | | | | 04/15/26 | | | | 23,789 | |
| | 845,448 | | | | 5.500 | | | | 01/15/39 | | | | 935,608 | |
| | 857,329 | | | | 4.500 | | | | 05/15/39 | | | | 937,502 | |
| | 1,858,006 | | | | 4.500 | | | | 06/15/39 | | | | 2,031,758 | |
| | 876,741 | | | | 4.500 | | | | 07/15/39 | | | | 958,730 | |
| | 89,367 | | | | 4.500 | | | | 10/15/39 | | | | 97,780 | |
| | 2,019,558 | | | | 3.500 | | | | 11/15/40 | | | | 2,111,967 | |
| | 10,000,000 | | | | 4.000 | | | | TBA-30yr | (d) | | | 10,693,750 | |
| | | | | | | | | | | | | | | |
| | | | | | | | | | | | | | 18,498,854 | |
| |
| |
TOTAL FEDERAL AGENCIES | | $ | 306,705,007 | |
| |
| |
TOTAL MORTGAGE-BACKED OBLIGATIONS |
(Cost $367,814,833) | | $ | 373,138,648 | |
| |
| |
| | | | | | | | | | | | | | | |
| | | | | | | | | | | | | | | |
Asset-Backed Securities – 6.7% |
Home Equity – 0.7% |
CIT Mortgage Loan Trust Series 2007-1, Class 2A2(a)(e) |
| $ | 570,000 | | | | 1.485 | % | | | 10/25/37 | | | $ | 424,797 | |
CIT Mortgage Loan Trust Series 2007-1, Class 2A3(a)(e) |
| | 1,100,000 | | | | 1.685 | | | | 10/25/37 | | | | 454,494 | |
Countrywide Home Equity Loan Trust Series 2002-E, Class A(a) |
| | 15,823 | | | | 0.489 | | | | 10/15/28 | | | | 15,142 | |
Countrywide Home Equity Loan Trust Series 2003-D, Class A(a) |
| | 82,709 | | | | 0.489 | | | | 06/15/29 | | | | 74,395 | |
Countrywide Home Equity Loan Trust Series 2004-G, Class 2A(a) |
| | 51,173 | | | | 0.449 | | | | 12/15/29 | | | | 39,072 | |
Countrywide Home Equity Loan Trust Series 2004-I, Class A(a) |
| | 494,166 | | | | 0.519 | | | | 02/15/34 | | | | 323,842 | |
Countrywide Home Equity Loan Trust Series 2004-J, Class 2A(a) |
| | 51,511 | | | | 0.519 | | | | 12/15/33 | | | | 37,001 | |
Countrywide Home Equity Loan Trust Series 2004-O, Class 1A(a) |
| | 196,574 | | | | 0.509 | | | | 02/15/34 | | | | 120,229 | |
Countrywide Home Equity Loan Trust Series 2005-A, Class 2A(a) |
| | 313,279 | | | | 0.469 | | | | 04/15/35 | | | | 194,897 | |
GMAC Mortgage Corp. Loan Trust Series 2007-HE3, Class 1A1 |
| | 357,120 | | | | 7.000 | | | | 09/25/37 | | | | 270,128 | |
GMAC Mortgage Corp. Loan Trust Series 2007-HE3, Class 2A1 |
| | 461,773 | | | | 7.000 | | | | 09/25/37 | | | | 334,415 | |
Residential Asset Mortgage Products, Inc. Series 2004-RZ1, Class AII(a) |
| | 201,860 | | | | 0.715 | | | | 03/25/34 | | | | 123,779 | |
| | | | | | | | | | | | | | | |
| | | | | | | | | | | | | | 2,412,191 | |
| |
| |
Student Loan(a) – 6.0% |
Access Group, Inc. Series 2005-2, Class A1 |
| | 31,074 | | | | 0.398 | | | | 08/22/17 | | | | 31,041 | |
Brazos Higher Education Authority, Inc. Series 2005-3, Class A14 |
| | 1,428,578 | | | | 0.468 | | | | 09/25/23 | | | | 1,409,266 | |
Brazos Higher Education Authority, Inc. Series 2010-1, Class A1 |
| | 1,995,646 | | | | 1.212 | | | | 05/25/29 | | | | 1,974,098 | |
Brazos Higher Education Authority, Inc. Series 2011-1, Class A2 |
| | 2,000,000 | | | | 1.112 | | | | 02/25/30 | | | | 1,953,106 | |
Brazos Higher Education Authority, Inc. Series 2011-2, Class A3 |
| | 1,800,000 | | | | 1.247 | | | | 10/27/36 | | | | 1,638,523 | |
| Brazos Higher Education Authority, Inc. Student Loan Revenue Series 2004 I-A-2 |
| | 2,936,904 | | | | 0.518 | | | | 06/27/22 | | | | 2,905,573 | |
| Brazos Higher Education Authority, Inc. Student Loan Revenue Series 2005 I-A-2 |
| | 1,451,250 | | | | 0.438 | | | | 12/26/18 | | | | 1,440,206 | |
College Loan Corp. Trust Series 2004-1, Class A3 |
| | 1,430,186 | | | | 0.413 | | | | 04/25/21 | | | | 1,422,625 | |
Education Funding Capital Trust I Series 2004-1, Class A2 |
| | 606,534 | | | | 0.507 | | | | 12/15/22 | | | | 598,767 | |
Educational Services of America, Inc. Series 2010-1, Class A1(e) |
| | 180,439 | | | | 1.103 | | | | 07/25/23 | | | | 180,328 | |
GCO Education Loan Funding Trust Series 2006-1, Class A10L |
| | 100,000 | | | | 0.502 | | | | 02/27/28 | | | | 84,979 | |
GCO Education Loan Funding Trust Series 2006-1, Class A11L |
| | 300,000 | | | | 0.542 | | | | 05/25/36 | | | | 245,227 | |
Goal Capital Funding Trust Series 2010-1, Class A(e) |
| | 709,997 | | | | 1.012 | | | | 08/25/48 | | | | 685,027 | |
The accompanying notes are an integral part of these financial statements. 83
GOLDMAN SACHS U.S. MORTGAGES FUND
Schedule of Investments (continued)
September 30, 2011 (Unaudited)
| | | | | | | | | | | | | | | |
Principal
| | Interest
| | Maturity
| | |
| Amount | | Rate | | Date | | Value |
| |
Asset-Backed Securities – (continued) |
Student Loan(a) – (continued) |
| | | | | | | | | | | | | | | |
Knowledgeworks Foundation Student Loan Series 2010-1, Class A |
| $ | 555,961 | | | | 1.262 | % | | | 02/25/42 | | | $ | 548,323 | |
Louisiana Public Facilities Authority Series 2011-A, Class A3(f) |
| | 1,200,000 | | | | 1.203 | | | | 04/25/35 | | | | 1,146,648 | |
Nelnet Student Loan Trust Series 2010-3A, Class A(e) |
| | 703,031 | | | | 1.033 | | | | 07/27/48 | | | | 698,816 | |
Northstar Education Finance, Inc. Series 2004-1, Class A4 |
| | 2,000,000 | | | | 0.443 | | | | 04/29/19 | | | | 1,981,776 | |
Northstar Education Finance, Inc. Series 2005-1, Class A1 |
| | 229,622 | | | | 0.353 | | | | 10/28/26 | | | | 227,173 | |
SLC Student Loan Center Series 2011-1, Class A(e) |
| | 951,293 | | | | 1.455 | | | | 10/25/27 | | | | 947,716 | |
SLM Student Loan Trust Series 2003-10A, Class A1D(c)(e) |
| | 300,000 | | | | 0.000 | | | �� | 12/15/16 | | | | 299,906 | |
SLM Student Loan Trust Series 2003-10A, Class A1E(c)(e) |
| | 318,600 | | | | 0.000 | | | | 12/15/16 | | | | 318,500 | |
| South Carolina Student Loan Corp. Series 2005, Class A2 |
| | 1,500,000 | | | | 0.446 | | | | 12/01/20 | | | | 1,415,074 | |
US Education Loan Trust LLC Series 2006-1, Class A2(e) |
| | 263,310 | | | | 0.456 | | | | 03/01/25 | | | | 258,867 | |
| | | | | | | | | | | | | | | |
| | | | | | | | | | | | | | 22,411,565 | |
| |
| |
TOTAL ASSET-BACKED SECURITIES |
(Cost $26,474,165) | | $ | 24,823,756 | |
| |
| |
TOTAL INVESTMENTS BEFORE SHORT-TERM INVESTMENT |
(Cost $394,288,998) | | $ | 397,962,404 | |
| |
| |
| | | | | | | | | | | | | | | |
| | | | | | | | | | | | | | | |
Short-term Investment(g) – 32.9% |
Repurchase Agreement – 32.9% |
| Joint Repurchase Agreement Account II |
| $ | 122,400,000 | | | | 0.095 | % | | | 10/03/11 | | | $ | 122,400,000 | |
(Cost $122,400,000) | | | | |
| |
| |
TOTAL INVESTMENTS – 139.9% |
(Cost $516,688,998) | | $ | 520,362,404 | |
| |
| |
LIABILITIES IN EXCESS OF OTHER ASSETS – (39.9)% | | | (148,278,176 | ) |
| |
| |
NET ASSETS – 100.0% | | $ | 372,084,228 | |
| |
| |
The percentage shown for each investment category reflects the value of investments in that category as a percentage of net assets.
| | |
| (a) | | Variable rate security. Interest rate disclosed is that which is in effect at September 30, 2011. |
| |
| (b) | | Security with a notional or nominal principal amount. The actual effective yield of this security is different than the stated interest rate. |
| |
| (c) | | Issued with zero coupon and interest rate is contingent upon LIBOR reaching a predetermined level. |
| |
| (d) | | TBA (To Be Announced) Securities are purchased on a forward commitment basis with an approximate principal amount and no defined maturity date. The actual principal and maturity date will be determined upon settlement when the specific mortgage pools are assigned. Total market value of TBA securities (excluding forward sales contracts, if any) amounts to $158,214,767 which represents approximately 42.5% of net assets as of September 30, 2011. |
| |
| (e) | | Exempt from registration under rule 144A of the Securities Act of 1933. Under procedures approved by the Board of Trustees, such securities have been determined to be liquid by the Investment Adviser and may be resold, normally to qualified institutional buyers in transactions exempt from registration. Total market value of Rule 144A securities amounted to $4,268,451, which represents approximately 1.1% of net assets as of September 30, 2011. |
| |
| (f) | | All or a portion of security is segregated as collateral for initial margin requirement on futures transactions. |
| |
| (g) | | Joint repurchase agreement was entered into on September 30, 2011. Additional information appears on pages 88-89. |
| | | | | |
| |
| |
Investment Abbreviations: |
| FHLMC | | — | | Federal Home Loan Mortgage Corp. |
| FNMA | | — | | Federal National Mortgage Association |
| GNMA | | — | | Government National Mortgage Association |
| LIBOR | | — | | London Interbank Offered Rate |
| OTC | | — | | Over the Counter |
| REMIC | | — | | Real Estate Mortgage Investment Conduit |
| STRIPS | | — | | Separate Trading of Registered Interest and Principal of Securities |
| |
| |
84 The accompanying notes are an integral part of these financial statements.
GOLDMAN SACHS U.S. MORTGAGES FUND
| |
| ADDITIONAL INVESTMENT INFORMATION | |
FORWARD SALES CONTRACTS — At September 30, 2011, the Fund had the following forward sales contracts:
| | | | | | | | | | | | | | | | | | | |
| | | Interest
| | Maturity
| | Settlement
| | Principal
| | |
| Description | | Rate | | Date(d) | | Date | | Amount | | Value |
| |
| FHLMC | | | 4.500 | % | | TBA-30yr | | | 10/13/2011 | | | $ | (13,000,000 | ) | | $ | (13,753,086 | ) |
| FHLMC | | | 5.000 | | | TBA-15yr | | | 10/18/2011 | | | | (3,000,000 | ) | | | (3,215,859 | ) |
| FHLMC | | | 5.500 | | | TBA-30yr | | | 10/13/2011 | | | | (6,000,000 | ) | | | (6,489,844 | ) |
| FNMA | | | 4.500 | | | TBA-30yr | | | 10/13/2011 | | | | (2,000,000 | ) | | | (2,121,562 | ) |
| |
| |
TOTAL (Proceeds Receivable: $25,645,625) | | | | | | | | | | | | | | | | $ | (25,580,351 | ) |
| |
| |
FUTURES CONTRACTS — At September 30, 2011, the following futures contracts were open:
| | | | | | | | | | | | | | | |
| | | Number of
| | | | | | |
| | | Contracts
| | Expiration
| | Current
| | Unrealized
|
| Type | | Long (Short) | | Date | | Value | | Gain (Loss) |
| |
| Eurodollars | | | 8 | | | December 2011 | | $ | 1,989,400 | | | $ | (618 | ) |
| Eurodollars | | | 8 | | | March 2012 | | | 1,988,200 | | | | (1,316 | ) |
| Eurodollars | | | 8 | | | June 2012 | | | 1,988,200 | | | | (882 | ) |
| Eurodollars | | | 8 | | | September 2012 | | | 1,988,400 | | | | 182 | |
| Eurodollars | | | 8 | | | December 2012 | | | 1,988,300 | | | | 1,882 | |
| Eurodollars | | | 8 | | | March 2013 | | | 1,988,000 | | | | 3,582 | |
| Eurodollars | | | (9 | ) | | June 2013 | | | (2,234,925 | ) | | | 2,005 | |
| Ultra Long U.S. Treasury Bonds | | | (21 | ) | | December 2011 | | | (3,331,125 | ) | | | (326,035 | ) |
| 2 Year U.S. Treasury Notes | | | (8 | ) | | December 2011 | | | (1,761,625 | ) | | | 2,112 | |
| 5 Year U.S. Treasury Notes | | | 15 | | | December 2011 | | | 1,837,266 | | | | 2,619 | |
| 10 Year U.S. Treasury Notes | | | 19 | | | December 2011 | | | 2,471,781 | | | | (13,688 | ) |
| 30 Year U.S. Treasury Bonds | | | 19 | | | December 2011 | | | 2,709,875 | | | | 21,466 | |
| |
| |
TOTAL | | | | | | | | | | | | $ | (308,691 | ) |
| |
| |
SWAP CONTRACTS — At September 30, 2011, the Fund had outstanding swap contracts with the following terms:
INTEREST RATE SWAP CONTRACTS
| | | | | | | | | | | | | | | | | | | | | | | | | |
| | | | | | | Rates Exchanged | | | | | | |
| | | Notional
| | | | Payments
| | Payments
| | | | Upfront Payments
| | |
| | | Amount
| | Termination
| | Received by
| | Made by
| | Market
| | Made (Received)
| | Unrealized
|
| Counterparty | | (000s)(a) | | Date | | the Fund | | the Fund | | Value | | by the Fund | | Gain (Loss) |
| |
| Deutsche Bank Securities, Inc. | | $ | 2,700 | | | | 12/21/16 | | | 3 month LIBOR | | 2.500% | | $ | (149,706 | ) | | $ | (51,104 | ) | | $ | (98,602 | ) |
| | | | 1,600 | | | | 12/21/21 | | | 3.500% | | 3 month LIBOR | | | 194,224 | | | | 190,000 | | | | 4,224 | |
| | | | 3,300 | | | | 12/21/21 | | | 3 month LIBOR | | 3.500 | | | (400,586 | ) | | | (235,190 | ) | | | (165,396 | ) |
| | | | 1,200 | | | | 12/21/26 | | | 3 month LIBOR | | 4.000 | | | (227,693 | ) | | | (181,411 | ) | | | (46,282 | ) |
| | | | 1,700 | | | | 12/21/41 | | | 4.2500 | | 3 month LIBOR | | | 543,216 | | | | 630,789 | | | | (87,573 | ) |
| | | | 1,700 | | | | 12/21/41 | | | 3 month LIBOR | | 4.250 | | | (543,216 | ) | | | (554,689 | ) | | | 11,473 | |
| JPMorgan Securities, Inc. | | | 5,000 | | | | 12/21/21 | | | 3.500 | | 3 month LIBOR | | | 606,949 | | | | 720,342 | | | | (113,393 | ) |
| | | | 2,100 | | | | 12/21/31 | | | 3 month LIBOR | | 4.250 | | | (538,361 | ) | | | (574,149 | ) | | | 35,788 | |
| | | | 3,200 | | | | 05/15/37 | | | 3 month LIBOR | | 3.250 | | | (330,985 | ) | | | (129,838 | ) | | | (201,147 | ) |
| Morgan Stanley Capital Services, Inc. | | | 18,000 | | | | 12/21/18 | | | 3 month LIBOR | | 3.250 | | | (1,754,918 | ) | | | (1,660,483 | ) | | | (94,435 | ) |
| |
| |
TOTAL | | | | | | | | | | | | | | $ | (2,601,076 | ) | | $ | (1,845,733 | ) | | $ | (755,343 | ) |
| |
| |
| | |
| (a) | | Represents forward starting interest rate swaps whose effective dates of commencement of accruals and cash flows occur subsequent to September 30, 2011. |
The accompanying notes are an integral part of these financial statements. 85
GOLDMAN SACHS U.S. MORTGAGES FUND
Schedule of Investments (continued)
September 30, 2011 (Unaudited)
| |
| ADDITIONAL INVESTMENT INFORMATION (continued) | |
WRITTEN OPTIONS CONTRACTS
INTEREST RATE SWAPTION CONTRACTS — At September 30, 2011, the Fund had outstanding written swaptions as follows:
| | | | | | | | | | | | | | | | | | | | | | | | | |
| | | | | Notional
| | | | | | | | | | |
| | | | | Amount
| | Expiration
| | Strike
| | Market
| | Premiums
| | Unrealized
|
| Counterparty | | Description | | (000s) | | Date | | Price | | Value | | Received | | Gain (Loss) |
| |
| Bank of America N.A. | | Put – OTC – 10 year Interest Rate Swap for the obligation to pay a fixed rate of 2.440% versus the 3 month LIBOR maturing on November 21, 2021 | | $ | 8,300 | | | 11/17/11 | | | 2.440 | % | | $ | (269,596 | ) | | $ | (157,700 | ) | | $ | (111,896 | ) |
| | | Call – OTC – 10 year Interest Rate Swap for the obligation to receive a fixed rate of 2.440% versus the 3 month LIBOR maturing on November 21, 2021 | | | 8,300 | | | 11/17/11 | | | 2.440 | | | | (49,319 | ) | | | (157,700 | ) | | | 108,381 | |
| Morgan Stanley Capital Services, Inc. | | Put – OTC – 10 year Interest Rate Swap for the obligation to pay a fixed rate of 2.450% versus the 3 month LIBOR maturing on November 21, 2021 | | | 6,800 | | | 11/17/11 | | | 2.450 | | | | (225,697 | ) | | | (128,520 | ) | | | (97,177 | ) |
| | | Call – OTC – 10 year Interest Rate Swap for the obligation to receive a fixed rate of 2.450% versus the 3 month LIBOR maturing on November 21, 2021 | | | 6,800 | | | 11/17/11 | | | 2.450 | | | | (38,985 | ) | | | (128,520 | ) | | | 89,535 | |
| |
| |
TOTAL | | | | $ | 30,200 | | | | | | | | | $ | (583,597 | ) | | $ | (572,440 | ) | | $ | (11,157 | ) |
| |
| |
86 The accompanying notes are an integral part of these financial statements.
GOLDMAN SACHS U.S. MORTGAGES FUND
| |
| ADDITIONAL INVESTMENT INFORMATION (continued) | |
WRITTEN OPTIONS CONTRACTS — For the six months ended September 30, 2011, the Fund had the following written swaptions activity:
| | | | | | | | | |
| | | Notional
| | |
| | | Amount
| | Premiums
|
| | | (000s) | | Received |
| |
| Contracts Outstanding March 31, 2011 | | $ | 10,000 | | | $ | (108,875 | ) |
| |
| |
| Contracts Written | | | 257,800 | | | | (5,035,341 | ) |
| Contracts Bought to Close | | | (213,600 | ) | | | 4,366,331 | |
| Contracts Expired | | | (24,000 | ) | | | 205,445 | |
| |
| |
| Contracts Outstanding September 30, 2011 | | $ | 30,200 | | | $ | (572,440 | ) |
| |
| |
The accompanying notes are an integral part of these financial statements. 87
GOLDMAN SACHS SINGLE SECTOR FIXED INCOME FUNDS
Schedule of Investments
September 30, 2011 (Unaudited)
| |
| ADDITIONAL INVESTMENT INFORMATION | |
JOINT REPURCHASE AGREEMENT ACCOUNT II — At September 30, 2011, the Funds had undivided interests in the Joint Repurchase Agreement Account II, with a maturity date of October 3, 2011, as follows:
| | | | | | | | | | | | | |
| | | | | | | Collateral
|
| | | Principal
| | Maturity
| | Value
|
| Fund | | Amount | | Value | | Allocation |
| |
| Emerging Markets Debt | | $ | 46,100,000 | | | $ | 46,100,367 | | | $ | 47,198,251 | |
| |
| |
| High Yield | | | 259,600,000 | | | | 259,602,064 | | | | 265,784,513 | |
| |
| |
| High Yield Floating Rate | | | 86,000,000 | | | | 86,000,684 | | | | 88,048,799 | |
| |
| |
| Investment Grade Credit | | | 1,100,000 | | | | 1,100,009 | | | | 1,126,206 | |
| |
| |
| Local Emerging Markets Debt | | | 333,700,000 | | | | 333,702,653 | | | | 341,649,815 | |
| |
| |
| U.S. Mortgages | | | 122,400,000 | | | | 122,400,973 | | | | 125,315,965 | |
| |
| |
88 The accompanying notes are an integral part of these financial statements.
GOLDMAN SACHS SINGLE SECTOR FIXED INCOME FUNDS
| |
| ADDITIONAL INVESTMENT INFORMATION (continued) | |
REPURCHASE AGREEMENTS — At September 30, 2011, the Principal Amounts of the Funds’ interest in the Joint Repurchase Agreement Account II were as follows:
| | | | | | | | | | | | | | | | | | | | | | | | | | | | | |
| | | | | | | | | High
| | | | Local
| | |
| | | | | Emerging
| | | | Yield
| | Investment
| | Emerging
| | |
| | | Interest
| | Markets
| | High
| | Floating
| | Grade
| | Markets
| | U.S.
|
| Counterparty | | Rate | | Debt | | Yield | | Rate | | Credit | | Debt | | Mortgages |
| |
| Barclays Capital, Inc. | | | 0.050 | % | | $ | 4,662,443 | | | $ | 26,255,318 | | | $ | 8,697,833 | | | $ | 111,251 | | | $ | 33,749,614 | | | $ | 12,379,241 | |
| |
| |
| Barclays Capital, Inc. | | | 0.100 | | | | 1,531,180 | | | | 8,622,436 | | | | 2,856,431 | | | | 36,536 | | | | 11,083,617 | | | | 4,065,432 | |
| |
| |
| BNP Paribas Securities Co. | | | 0.120 | | | | 9,282,778 | | | | 52,273,520 | | | | 17,317,114 | | | | 221,498 | | | | 67,194,428 | | | | 24,646,683 | |
| |
| |
| Credit Suisse Securities LLC | | | 0.040 | | | | 1,722,577 | | | | 9,700,241 | | | | 3,213,485 | | | | 41,103 | | | | 12,469,069 | | | | 4,573,611 | |
| |
| |
| JPMorgan Securities | | | 0.090 | | | | 17,608,570 | | | | 99,158,018 | | | | 32,848,957 | | | | 420,161 | | | | 127,461,596 | | | | 46,752,471 | |
| |
| |
| Wells Fargo Securities LLC | | | 0.110 | | | | 11,292,452 | | | | 63,590,467 | | | | 21,066,180 | | | | 269,451 | | | | 81,741,676 | | | | 29,982,562 | |
| |
| |
TOTAL | | | | | | $ | 46,100,000 | | | $ | 259,600,000 | | | $ | 86,000,000 | | | $ | 1,100,000 | | | $ | 333,700,000 | | | $ | 122,400,000 | |
| |
| |
At September 30, 2011, the Joint Repurchase Agreement Account II was fully collateralized by:
| | | | | | | | | |
| Issuer | | Interest Rates | | Maturity Dates |
| |
| Federal Farm Credit Bank | | | 1.375 to 5.410 | % | | | 04/12/12 to 04/17/36 | |
| |
| |
| Federal Home Loan Bank | | | 0.150 to 0.250 | | | | 05/25/12 to 08/17/12 | |
| |
| |
| Federal Home Loan Mortgage Corp. | | | 0.000 to 6.250 | | | | 04/25/12 to 09/01/41 | |
| |
| |
| Federal National Mortgage Association | | | 1.250 to 8.500 | | | | 05/01/12 to 10/01/41 | |
| |
| |
| U.S. Treasury Notes | | | 1.375 to 4.000 | | | | 01/31/14 to 08/15/21 | |
| |
| |
The accompanying notes are an integral part of these financial statements. 89
GOLDMAN SACHS SINGLE SECTOR FIXED INCOME FUNDS
Statements of Assets and Liabilities
September 30, 2011 (Unaudited)
| | | | | | | |
| | | Emerging Markets
| | |
| | | Debt Fund | | |
Assets: |
| | | | | | | |
| Investments in securities, at value (identified cost $572,799,722, $4,366,560,157, $554,032,976, $481,896,080, $1,377,680,933 and $394,288,998, respectively) | | $ | 556,875,795 | | | |
| Repurchase agreement, at value which equals cost | | | 46,100,000 | | | |
| Cash | | | 2,269,050 | | | |
| Foreign currencies, at value (identified cost $128,607 and $2,759,162 for Emerging Markets Debt and Local Emerging Markets Debt, respectively) | | | 126,651 | | | |
| Receivables: | | | | | | |
| Investment securities sold on an extended-delivery basis | | | — | | | |
| Investment securities sold, at value | | | 3,633,092 | | | |
| Forward foreign currency exchange contracts, at value | | | 14,397,578 | | | |
| Interest, at value | | | 8,408,245 | | | |
| Fund shares sold | | | 5,618,479 | | | |
| Collateral on certain derivative contracts | | | 680,000 | | | |
| Non-deliverable bond forward contracts, at value | | | 38,258 | | | |
| Reimbursement from investment adviser | | | 32,251 | | | |
| Swap contracts, at value (includes upfront payments made of $68,550 and $1,541,131 for Investment Grade Credit and U.S. Mortgages, respectively) | | | — | | | |
| Due from broker — variation margin, at value | | | — | | | |
| Deferred offering costs | | | — | | | |
| Foreign tax reclaims, at value | | | — | | | |
| Other assets, at value | | | 1,819 | | | |
| |
| |
Total assets | | | 638,181,218 | | | |
| |
| |
| | | | | | | |
| | | | | | | |
Liabilities: |
| | | | | | | |
| Payables: | | | | | | |
| Investment securities purchased on an extended-delivery basis | | | — | | | |
| Investment securities purchased, at value | | | 2,090,160 | | | |
| Forward foreign currency exchange contracts, at value | | | 11,079,297 | | | |
| Fund shares redeemed | | | 4,104,458 | | | |
| Swap contracts, at value (includes upfront payments received of $45,309, $0, $0, $3,424,171, $3,290 and $3,386,864, respectively) | | | 877,399 | | | |
| Amounts owed to affiliates | | | 507,028 | | | |
| Income distributions | | | 342,374 | | | |
| Due to broker — variation margin, at value | | | 224,259 | | | |
| Collateral on certain derivative contracts | | | — | | | |
| Forward sale contracts, at value (proceeds received $25,645,625 for U.S. Mortgages Fund) | | | — | | | |
| Written Options Contracts, at value (premium received of $1,008,400 and $572,440 for Investment Grade Credit and U.S. Mortgages, respectively) | | | — | | | |
| Deferred foreign capital gains tax | | | — | | | |
| Accrued expenses and other liabilities | | | 169,665 | | | |
| |
| |
Total liabilities | | | 19,394,640 | | | |
| |
| |
| | | | | | | |
| | | | | | | |
Net Assets: |
| | | | | | | |
| Paid-in capital | | | 628,205,615 | | | |
| Accumulated undistributed (distributions in excess of) net investment income | | | (6,483,654 | ) | | |
| Accumulated net realized gain (loss) from investment, futures, options, swap and foreign currency related transactions | | | 11,772,159 | | | |
| Net unrealized gain (loss) on investments, futures, options, swaps and translation of assets and liabilities denominated in foreign currencies | | | (14,707,542 | ) | | |
| |
| |
NET ASSETS | | $ | 618,786,578 | | | |
| | | | | | | |
| Net Assets: | | | | | | |
| Class A | | $ | 144,772,437 | | | |
| Class B | | | — | | | |
| Class C | | | 29,255,959 | | | |
| Institutional | | | 441,958,934 | | | |
| Service | | | — | | | |
| Separate Account Institutional Shares | | | — | | | |
| Class IR | | | 2,799,248 | | | |
| Class R | | | — | | | |
| | | | | | | |
| | | | | | | |
| Total Net Assets | | $ | 618,786,578 | | | |
| | | | | | | |
| Shares Outstanding $0.001 par value (unlimited shares authorized): | | | | | | |
| Class A | | | 12,016,141 | | | |
| Class B | | | — | | | |
| Class C | | | 2,430,121 | | | |
| Institutional | | | 36,647,923 | | | |
| Service | | | — | | | |
| Separate Account Institutional Shares | | | — | | | |
| Class IR | | | 232,213 | | | |
| Class R | | | — | | | |
| | | | | | | |
Net asset value, offering and redemption price per share:(a) | | | | | | |
| Class A | | | $12.05 | | | |
| Class B | | | — | | | |
| Class C | | | 12.04 | | | |
| Institutional | | | 12.06 | | | |
| Service | | | — | | | |
| Separate Account Institutional Shares | | | — | | | |
| Class IR | | | 12.05 | | | |
| Class R | | | — | | | |
| | | | | | | |
| | |
| (a) | | Maximum public offering price per share for Class A shares of Emerging Markets Debt, High Yield, and Local Emerging Markets Debt Funds (NAV per share multiplied by 1.0471), High Yield Floating Rate Fund (NAV per share multiplied by 1.0230), Investment Grade Credit and U.S. Mortgages Funds (NAV per share multiplied by 1.0390) is $12.62, $6.92, $9.09, $9.74, $10.14 and $10.90, respectively. At redemption, Class B and Class C Shares may be subject to a contingent deferred sales charge, assessed on the amount equal to the lesser of the current net asset value or the original purchase price of the shares. |
90 The accompanying notes are an integral part of these financial statements.
GOLDMAN SACHS SINGLE SECTOR FIXED INCOME FUNDS
| | | | | | | | | | | | | | | | | | | | | |
High Yield
| | High Yield Floating
| | Investment Grade
| | Local Emerging
| | U.S. Mortgages
| | |
| Fund | | Rate Fund | | Credit Fund | | Markets Debt Fund | | Fund | | |
| |
| | | | | | | | | | | | | | | | | | | | | |
| $ | 4,080,132,831 | | | $ | 533,196,975 | | | $ | 491,657,481 | | | $ | 1,285,189,398 | | | $ | 397,962,404 | | | |
| | 259,600,000 | | | | 86,000,000 | | | | 1,100,000 | | | | 333,700,000 | | | | 122,400,000 | | | |
| | 2,585,925 | | | | 742,652 | | | | 902,278 | | | | 307,661 | | | | 8,500 | | | |
| | — | | | | — | | | | — | | | | 2,495,018 | | | | — | | | |
| | | | | | | | | | | | | | | | | | | | | |
| | 2,894 | | | | 5,236,315 | | | | — | | | | — | | | | 180,050,840 | | | |
| | 4,526,979 | | | | — | | | | 28,244,351 | | | | 83,854,127 | | | | 9,876,633 | | | |
| | 20,697,567 | | | | — | | | | 298,302 | | | | 89,878,797 | | | | — | | | |
| | 101,883,376 | | | | 2,983,608 | | | | 6,564,714 | | | | 25,774,959 | | | | 853,761 | | | |
| | 100,585,266 | | | | 5,574,640 | | | | 1,344,810 | | | | 17,498,352 | | | | 17,649 | | | |
| | — | | | | — | | | | 5,620,325 | | | | 11,682,662 | | | | 2,570,128 | | | |
| | — | | | | — | | | | — | | | | 221,413 | | | | — | | | |
| | — | | | | 48,032 | | | | 40,813 | | | | 138,537 | | | | 49,597 | | | |
| | — | | | | — | | | | 629,491 | | | | 1,444,644 | | | | 1,344,389 | | | |
| | — | | | | — | | | | 322,318 | | | | — | | | | — | | | |
| | — | | | | 188,931 | | | | — | | | | — | | | | — | | | |
| | 23,278 | | | | — | | | | — | | | | 74,723 | | | | — | | | |
| | 21,601 | | | | — | | | | 1,647 | | | | 5,405 | | | | 1,183 | | | |
| |
| |
| | 4,570,059,717 | | | | 633,971,153 | | | | 536,726,530 | | | | 1,852,265,696 | | | | 715,135,084 | | | |
| |
| |
| | | | | | | | | | | | | | | | | | | | | |
| | | | | | | | | | | | | | | | | | | | | |
| |
| | | | | | | | | | | | | | | | | | | | | |
| | | | | | | | | | | | | | | | | | | | | |
| | 4,214,000 | | | | 34,824,307 | | | | — | | | | — | | | | 301,383,594 | | | |
| | 66,061,956 | | | | — | | | | 2,993,083 | | | | 50,750 | | | | 10,631,250 | | | |
| | 605,650 | | | | — | | | | — | | | | 136,648,921 | | | | — | | | |
| | 13,211,638 | | | | 5,610,561 | | | | 1,015,084 | | | | 7,049,760 | | | | 513,097 | | | |
| | — | | | | — | | | | 6,174,359 | | | | 3,370,835 | | | | 3,945,465 | | | |
| | 2,912,533 | | | | 316,216 | | | | 199,905 | | | | 1,496,988 | | | | 115,098 | | | |
| | 2,467,468 | | | | 12,570 | | | | 141,148 | | | | 349,429 | | | | 127,927 | | | |
| | — | | | | — | | | | — | | | | — | | | | 31,297 | | | |
| | 740,000 | | | | — | | | | 100,000 | | | | 2,490,000 | | | | — | | | |
| | — | | | | — | | | | — | | | | — | | | | 25,580,351 | | | |
| | — | | | | — | | | | 1,028,069 | | | | — | | | | 583,597 | | | |
| | — | | | | — | | | | — | | | | 2,006,572 | | | | — | | | |
| | 1,290,138 | | | | 156,036 | | | | 123,694 | | | | 450,953 | | | | 139,180 | | | |
| |
| |
| | 91,503,383 | | | | 40,919,690 | | | | 11,775,342 | | | | 153,914,208 | | | | 343,050,856 | | | |
| |
| |
| | | | | | | | | | | | | | | | | | | | | |
| | | | | | | | | | | | | | | | | | | | | |
| |
| | | | | | | | | | | | | | | | | | | | | |
| | 4,688,499,050 | | | | 621,155,586 | | | | 486,127,156 | | | | 1,834,844,536 | | | | 376,387,409 | | | |
| | 7,276,723 | | | | (148,219 | ) | | | (156,319 | ) | | | (25,140,495 | ) | | | (457,313 | ) | | |
| | 49,617,443 | | | | (7,119,903 | ) | | | 29,399,219 | | | | 34,413,895 | | | | (6,509,357 | ) | | |
| | (266,836,882 | ) | | | (20,836,001 | ) | | | 9,581,132 | | | | (145,766,448 | ) | | | 2,663,489 | | | |
| |
| |
| $ | 4,478,556,334 | | | $ | 593,051,463 | | | $ | 524,951,188 | | | $ | 1,698,351,488 | | | $ | 372,084,228 | | | |
| | | | | | | | | | | | | | | | | | | | | |
| | | | | | | | | | | | | | | | | | | | | |
| $ | 661,733,297 | | | $ | 928,998 | | | $ | 140,389,884 | | | $ | 751,883,103 | | | $ | 5,100,664 | | | |
| | 33,596,865 | | | | — | | | | — | | | | — | | | | — | | | |
| | 99,580,215 | | | | 194,530 | | | | — | | | | 19,196,252 | | | | — | | | |
| | 3,619,317,786 | | | | 591,716,654 | | | | 149,847,282 | | | | 913,040,135 | | | | 12,121,215 | | | |
| | 19,087,848 | | | | — | | | | — | | | | — | | | | — | | | |
| | — | | | | — | | | | 234,713,026 | | | | — | | | | 354,861,339 | | | |
| | 31,072,908 | | | | 201,638 | | | | 996 | | | | 14,231,998 | | | | 1,010 | | | |
| | 14,167,415 | | | | 9,643 | | | | — | | | | — | | | | — | | | |
| | | | | | | | | | | | | | | | | | | | | |
| | | | | | | | | | | | | | | | | | | | | |
| $ | 4,478,556,334 | | | $ | 593,051,463 | | | $ | 524,951,188 | | | $ | 1,698,351,488 | | | $ | 372,084,228 | | | |
| | | | | | | | | | | | | | | | | | | | | |
| | | | | | | | | | | | | | | | | | | | | |
| | 100,043,471 | | | | 97,543 | | | | 14,391,134 | | | | 86,577,332 | | | | 486,271 | | | |
| | 5,068,246 | | | | — | | | | — | | | | — | | | | — | | | |
| | 15,035,268 | | | | 20,431 | | | | — | | | | 2,206,847 | | | | — | | | |
| | 545,590,001 | | | | 62,098,982 | | | | 15,357,522 | | | | 105,122,968 | | | | 1,153,225 | | | |
| | 2,887,332 | | | | — | | | | — | | | | — | | | | — | | | |
| | — | | | | — | | | | 24,049,700 | | | | — | | | | 33,824,390 | | | |
| | 4,687,411 | | | | 21,167 | | | | 102 | | | | 1,639,568 | | | | 96 | | | |
| | 2,141,886 | | | | 1,012 | | | | — | | | | — | | | | — | | | |
| | | | | | | | | | | | | | | | | | | | | |
| | | | | | | | | | | | | | | | | | | | | |
| | $6.61 | | | | $9.52 | | | | $9.76 | | | | $8.68 | | | | $10.49 | | | |
| | 6.63 | | | | — | | | | — | | | | — | | | | — | | | |
| | 6.62 | | | | 9.52 | | | | — | | | | 8.70 | | | | — | | | |
| | 6.63 | | | | 9.53 | | | | 9.76 | | | | 8.69 | | | | 10.51 | | | |
| | 6.61 | | | | — | | | | — | | | | — | | | | — | | | |
| | — | | | | — | | | | 9.76 | | | | — | | | | 10.49 | | | |
| | 6.63 | | | | 9.53 | | | | 9.76 | | | | 8.68 | | | | 10.51 | | | |
| | 6.61 | | | | 9.53 | | | | — | | | | — | | | | — | | | |
| | | | | | | | | | | | | | | | | | | | | |
The accompanying notes are an integral part of these financial statements. 91
GOLDMAN SACHS SINGLE SECTOR FIXED INCOME FUNDS
Statements of Operations
For the Six Months Ended September 30, 2011 (Unaudited)
| | | | | |
| | | Emerging Markets
|
| | | Debt Fund |
| |
Investment income: |
| | | | | |
| Interest (net of foreign withholding taxes of $996,745 for Local Emerging Markets Debt) | | $ | 18,827,929 | |
| Dividends (net of foreign withholding taxes of $2,724 for High Yield) | | | — | |
| |
| |
Total investment income | | | 18,827,929 | |
| |
| |
| | | | | |
| | | | | |
Expenses: |
| | | | | |
| Management fees | | | 2,550,240 | |
Distribution and Service fees(a) | | | 347,831 | |
Transfer Agent fees(a) | | | 211,069 | |
| Custody and accounting fees | | | 126,417 | |
| Printing and mailing costs | | | 59,321 | |
| Professional fees | | | 54,836 | |
| Registration fees | | | 46,198 | |
| Trustee fees | | | 8,861 | |
| Amortization of offering costs | | | — | |
| Service Share fees — Shareholder Administration Plan | | | — | |
| Service Share fees — Service Plan | | | — | |
| Other | | | 11,826 | |
| |
| |
Total expenses | | | 3,416,599 | |
| |
| |
| | | | | |
| Less — expense reductions | | | (168,044 | ) |
| |
| |
Net expenses | | | 3,248,555 | |
| |
| |
NET INVESTMENT INCOME | | | 15,579,374 | |
| |
| |
| | | | | |
| | | | | |
Realized and unrealized gain (loss) from investment, futures, options, swap and foreign currency related transactions: |
| | | | | |
| Net realized gain (loss) from: | | | | |
| Investment transactions (net of foreign tax of $1,126,293 for Local Emerging Markets Debt) | | | 9,527,047 | |
| Futures transactions | | | 4,724,793 | |
| Written options | | | — | |
| Swap contracts | | | 1,130,264 | |
| Foreign currency related transactions (includes $(2,067,038), $(6,206,897), $22,852 and $32,503,033 of realized gains (losses) on forward foreign currency exchange contracts for Emerging Markets Debt, High Yield, Investment Grade Credit and Local Emerging Markets Debt) | | | (3,484,349 | ) |
| Net change in unrealized gain (loss) on: | | | | |
| Investments (net of deferred foreign taxes of $2,006,572 for Local Emerging Markets Debt) | | | (25,612,531 | ) |
| Futures | | | (845,459 | ) |
| Written options | | | — | |
| Swap contracts | | | (687,772 | ) |
| Non-deliverable bond forward contracts | | | 38,258 | |
| Translation of assets and liabilities denominated in foreign currencies (includes $3,423,543, $35,968,109, $298,302 and $(75,392,375) of net unrealized gains (losses) on forward foreign currency exchange contracts for Emerging Markets Debt, High Yield, Investment Grade Credit and Local Emerging Markets Debt) | | | 3,213,634 | |
| |
| |
Net realized and unrealized gain (loss) from investment, futures, options, swap, non-deliverable bond forward and foreign currency related transactions | | | (11,996,115 | ) |
| |
| |
NET INCREASE (DECREASE) IN NET ASSETS RESULTING FROM OPERATIONS | | $ | 3,583,259 | |
| |
| |
| | |
| (a) | | Class specific Distribution and Service, Transfer Agent and Account Service fees were as follows: |
| | | | | | | | | | | | | | | | | | | | | | | | | | | | | | | | | | | | | | | | | | | | | | | | | |
| | | Distribution and Service Fees | | Transfer Agent Fees |
| | | | | | | | | | | | | | | | | | | | | Separate
| | | | |
| | | | | | | | | | | | | | | | | | | | | Account
| | | | |
| | | | | | | | | | | | | | | | | | | | | Institutional
| | | | |
Fund | | Class A | | Class B | | Class C | | Class R | | Class A | | Class B | | Class C | | Institutional | | Service | | Shares | | Class IR(b) | | Class R |
| Emerging Markets Debt | | $ | 189,854 | | | $ | — | | | $ | 157,977 | | | $ | — | | | $ | 98,724 | | | $ | — | | | $ | 20,537 | | | $ | 90,376 | | | $ | — | | | $ | — | | | $ | 1,432 | | | $ | — | |
| High Yield | | | 987,236 | | | | 206,028 | | | | 553,471 | | | | 34,980 | | | | 513,363 | | | | 26,784 | | | | 71,951 | | | | 780,782 | | | | 4,469 | | | | — | | | | 10,372 | | | | 9,095 | |
| High Yield Floating Rate | | | 1,197 | | | | — | | | | 594 | | | | 25 | | | | 622 | | | | — | | | | 78 | | | | 100,974 | | | | — | | | | — | | | | 222 | | | | 7 | |
| Investment Grade Credit | | | 181,592 | | | | — | | | | — | | | | — | | | | 94,428 | | | | — | | | | — | | | | 28,804 | | | | — | | | | 49,537 | | | | — | | | | — | |
| Local Emerging Markets Debt | | | 1,292,619 | | | | — | | | | 97,988 | | | | — | | | | 672,162 | | | | — | | | | 12,738 | | | | 226,742 | | | | — | | | | — | | | | 8,243 | | | | — | |
| U.S. Mortgages | | | 6,477 | | | | — | | | | — | | | | — | | | | 3,368 | | | | — | | | | — | | | | 7,146 | | | | — | | | | 69,105 | | | | — | | | | — | |
| | |
| (b) | | Commenced operations on July 29, 2011 for Investment Grade Credit and U.S. Mortgages Funds. |
92 The accompanying notes are an integral part of these financial statements.
GOLDMAN SACHS SINGLE SECTOR FIXED INCOME FUNDS
| | | | | | | | | | | | | | | | | | | | | |
High Yield
| | High Yield Floating
| | Investment Grade
| | Local Emerging
| | U.S. Mortgages
| | |
| Fund | | Rate Fund | | Credit Fund | | Markets Debt Fund | | Fund | | |
| |
| |
| | | | | | | | | | | | | | | | | | | | | |
| $ | 202,450,274 | | | $ | 9,980,558 | | | $ | 12,446,153 | | | $ | 59,644,449 | | | $ | 4,247,614 | | | |
| | 793,900 | | | | — | | | | — | | | | — | | | | — | | | |
| |
| |
| | 203,244,174 | | | | 9,980,558 | | | | 12,446,153 | | | | 59,644,449 | | | | 4,247,614 | | | |
| |
| |
| | | | | | | | | | | | | | | | | | | | | |
| | | | | | | | | | | | | | | | | | | | | |
| |
| | | | | | | | | | | | | | | | | | | | | |
| | 16,116,449 | | | | 1,518,897 | | | | 1,073,966 | | | | 9,810,347 | | | | 772,877 | | | |
| | 1,781,715 | | | | 1,816 | | | | 181,592 | | | | 1,390,607 | | | | 6,477 | | | |
| | 1,416,816 | | | | 101,903 | | | | 172,769 | | | | 919,885 | | | | 79,619 | | | |
| | 167,280 | | | | 101,838 | | | | 73,454 | | | | 1,034,616 | | | | 132,556 | | | |
| | 72,481 | | | | 41,743 | | | | 26,209 | | | | 64,602 | | | | 21,167 | | | |
| | 80,602 | | | | 101,002 | | | | 59,966 | | | | 57,272 | | | | 64,161 | | | |
| | 79,387 | | | | 5,862 | | | | 28,546 | | | | 47,091 | | | | 29,885 | | | |
| | 16,609 | | | | 8,539 | | | | 8,441 | | | | 11,700 | | | | 8,359 | | | |
| | — | | | | 152,452 | | | | — | | | | — | | | | — | | | |
| | 27,930 | | | | — | | | | — | | | | — | | | | — | | | |
| | 27,930 | | | | — | | | | — | | | | — | | | | — | | | |
| | 45,947 | | | | 4,522 | | | | 10,137 | | | | 33,340 | | | | 9,444 | | | |
| |
| |
| | 19,833,146 | | | | 2,038,574 | | | | 1,635,080 | | | | 13,369,460 | | | | 1,124,545 | | | |
| |
| |
| | | | | | | | | | | | | | | | | | | | | |
| | — | | | | (159,563 | ) | | | (384,312 | ) | | | (947,389 | ) | | | (393,346 | ) | | |
| |
| |
| | 19,833,146 | | | | 1,879,011 | | | | 1,250,768 | | | | 12,422,071 | | | | 731,199 | | | |
| |
| |
| | 183,411,028 | | | | 8,101,547 | | | | 11,195,385 | | | | 47,222,378 | | | | 3,516,415 | | | |
| |
| |
| | | | | | | | | | | | | | | | | | | | | |
| | | | | | | | | | | | | | | | | | | | | |
| |
| | | | | | | | | | | | | | | | | | | | | |
| | | | | | | | | | | | | | | | | | | | | |
| | 108,120,916 | | | | (6,317,263 | ) | | | 13,302,102 | | | | 29,851,316 | | | | 12,518,205 | | | |
| | — | | | | — | | | | 7,286,162 | | | | — | | | | (1,820,425 | ) | | |
| | — | | | | — | | | | (1,249,161 | ) | | | — | | | | (778,915 | ) | | |
| | 144,097 | | | | (797,431 | ) | | | 144,402 | | | | 9,442,553 | | | | (1,128,678 | ) | | |
| | | | | | | | | | | | | | | | | | | | | |
| | (14,169,156 | ) | | | — | | | | 11,368 | | | | 1,351,377 | | | | — | | | |
| | | | | | | | | | | | | | | | | | | | | |
| | (634,454,629 | ) | | | (20,780,661 | ) | | | (4,853,454 | ) | | | (145,760,448 | ) | | | 2,793,207 | | | |
| | — | | | | — | | | | 1,929,289 | | | | — | | | | (75,138 | ) | | |
| | — | | | | — | | | | (31,631 | ) | | | — | | | | (20,234 | ) | | |
| | — | | | | (850 | ) | | | (2,493,312 | ) | | | 1,593,729 | | | | (550,955 | ) | | |
| | — | | | | — | | | | — | | | | 221,413 | | | | — | | | |
| | | | | | | | | | | | | | | | | | | | | |
| | 34,916,127 | | | | — | | | | 296,936 | | | | (78,859,685 | ) | | | — | | | |
| |
| |
| | | | | | | | | | | | | | | | | | | | | |
| | (505,442,645 | ) | | | (27,896,205 | ) | | | 14,342,701 | | | | (182,159,745 | ) | | | 10,937,067 | | | |
| |
| |
| $ | (322,031,617 | ) | | $ | (19,794,658 | ) | | $ | 25,538,086 | | | $ | (134,937,367 | ) | | $ | 14,453,482 | | | |
| |
| |
The accompanying notes are an integral part of these financial statements. 93
GOLDMAN SACHS SINGLE SECTOR FIXED INCOME FUNDS
Statements of Changes in Net Assets
| | | | | | | | | |
| | | Emerging Markets Debt Fund |
| | | For the
| | |
| | | Six Months Ended
| | For the Fiscal
|
| | | September 30, 2011 | | Year Ended |
| | | (Unaudited) | | March 31, 2011 |
| |
From operations: |
| | | | | | | | | |
| Net investment income (loss) | | $ | 15,579,374 | | | $ | 27,307,148 | |
| Net realized gain (loss) from investment, futures, options, swap and foreign currency related transactions | | | 11,897,755 | | | | 18,223,597 | |
| Net change in unrealized gain (loss) on investments, futures, options, swaps, non-deliverable bond forwards and translation of assets and liabilities denominated in foreign currencies | | | (23,893,870 | ) | | | (9,560,087 | ) |
| |
| |
Net increase (decrease) in net assets resulting from operations | | | 3,583,259 | | | | 35,970,658 | |
| |
| |
| | | | | | | | | |
| | | | | | | | | |
Distributions to shareholders: |
| | | | | | | | | |
| From net investment income | | | | | | | | |
| Class A Shares | | | (3,595,623 | ) | | | (9,205,130 | ) |
| Class B Shares | | | — | | | | — | |
| Class C Shares | | | (629,439 | ) | | | (1,144,433 | ) |
| Institutional Shares | | | (11,447,535 | ) | | | (22,394,332 | ) |
| Service Shares | | | — | | | | — | |
Class IR Shares(b) | | | (54,208 | ) | | | (44,727 | ) |
| Class R Shares | | | — | | | | — | |
| From net realized gains | | | | | | | | |
| Class A Shares | | | — | | | | (193,475 | ) |
| Class C Shares | | | — | | | | (30,420 | ) |
| Institutional Shares | | | — | | | | (434,675 | ) |
Class IR Shares(b) | | | — | | | | (1,313 | ) |
| Class R Shares | | | — | | | | — | |
| |
| |
Total distributions to shareholders | | | (15,726,805 | ) | | | (33,448,505 | ) |
| |
| |
| | | | | | | | | |
| | | | | | | | | |
From share transactions: |
| | | | | | | | | |
| Proceeds from sales of shares | | | 143,778,781 | | | | 491,014,666 | |
| Proceeds received in connection with in-kind subscriptions | | | — | | | | 12,379,470 | |
| Reinvestment of distributions | | | 13,739,443 | | | | 29,056,269 | |
| Cost of shares redeemed | | | (152,154,787 | )(c) | | | (303,416,681 | )(c) |
| |
| |
Net increase (decrease) in net assets resulting from share transactions | | | 5,363,437 | | | | 229,033,724 | |
| |
| |
TOTAL INCREASE (DECREASE) | | | (6,780,109 | ) | | | 231,555,877 | |
| |
| |
| | | | | | | | | |
| | | | | | | | | |
Net assets: |
| | | | | | | | | |
| Beginning of period | | | 625,566,687 | | | | 394,010,810 | |
| |
| |
| End of period | | $ | 618,786,578 | | | $ | 625,566,687 | |
| |
| |
Accumulated undistributed (distribution in excess of) net investment income (loss) | | $ | (6,483,654 | ) | | $ | (6,336,223 | ) |
| |
| |
| | |
| (a) | | Commenced operations on March 31, 2011. |
| (b) | | Commenced operations on July 30, 2010 for Emerging Markets Debt Fund. |
| (c) | | Net of $29,949 and $91,546, and $243,136 and $335,607 of redemption fees for Emerging Markets Debt Fund and High Yield Fund, respectively, for the six months ended September 30, 2011 and the fiscal year ended March 31, 2011, respectively. |
94 The accompanying notes are an integral part of these financial statements.
GOLDMAN SACHS SINGLE SECTOR FIXED INCOME FUNDS
| | | | | | | | | | | | | | | | | |
| High Yield Fund | | High Yield Floating Rate Fund | | |
For the
| | | | For the
| | | | |
Six Months Ended
| | For the Fiscal
| | Six Months Ended
| | For the
| | |
September 30, 2011
| | Year Ended
| | September 30, 2011
| | Period Ended
| | |
| (Unaudited) | | March 31, 2011 | | (Unaudited) | | March 31, 2011(a) | | |
| |
| |
| | | | | | | | | | | | | | | | | |
| $ | 183,411,028 | | | $ | 461,312,350 | | | $ | 8,101,547 | | | $ | (2,280 | ) | | |
| | 94,095,857 | | | | 183,936,907 | | | | (7,114,694 | ) | | | (5,209 | ) | | |
| | | | | | | | | | | | | | | | | |
| | (599,538,502 | ) | | | 59,723,657 | | | | (20,781,511 | ) | | | (54,490 | ) | | |
| |
| |
| | (322,031,617 | ) | | | 704,972,914 | | | | (19,794,658 | ) | | | (61,979 | ) | | |
| |
| |
| | | | | | | | | | | | | | | | | |
| | | | | | | | | | | | | | | | | |
| |
| | | | | | | | | | | | | | | | | |
| | (28,711,531 | ) | | | (80,169,957 | ) | | | (14,450 | ) | | | — | | | |
| | (1,343,754 | ) | | | (3,635,779 | ) | | | — | | | | — | | | |
| | (3,613,306 | ) | | | (7,548,453 | ) | | | (1,351 | ) | | | — | | | |
| | (148,421,977 | ) | | | (365,686,554 | ) | | | (8,225,727 | ) | | | — | | | |
| | (794,994 | ) | | | (1,596,021 | ) | | | — | | | | — | | | |
| | (610,122 | ) | | | (124,551 | ) | | | (5,900 | ) | | | — | | | |
| | (492,605 | ) | | | (704,866 | ) | | | (120 | ) | | | — | | | |
| | | | | | | | | | | | | | | | | |
| | — | | | | — | | | | — | | | | — | | | |
| | — | | | | — | | | | — | | | | — | | | |
| | — | | | | — | | | | — | | | | — | | | |
| | — | | | | — | | | | — | | | | — | | | |
| | — | | | | — | | | | — | | | | — | | | |
| | — | | | | — | | | | — | | | | — | | | |
| |
| |
| | (183,988,289 | ) | | | (459,466,181 | ) | | | (8,247,548 | ) | | | — | | | |
| |
| |
| | | | | | | | | | | | | | | | | |
| | | | | | | | | | | | | | | | | |
| |
| | | | | | | | | | | | | | | | | |
| | 752,001,610 | | | | 1,990,564,571 | | | | 616,103,973 | | | | 118,918,916 | | | |
| | — | | | | — | | | | — | | | | — | | | |
| | 164,609,284 | | | | 310,058,551 | | | | 8,200,654 | | | | — | | | |
| | (1,487,165,745 | )(c) | | | (3,188,107,981 | )(c) | | | (122,067,895 | ) | | | — | | | |
| |
| |
| | (570,554,851 | ) | | | (887,484,859 | ) | | | 502,236,732 | | | | 118,918,916 | | | |
| |
| |
| | (1,076,574,757 | ) | | | (641,978,126 | ) | | | 474,194,526 | | | | 118,856,937 | | | |
| |
| |
| | | | | | | | | | | | | | | | | |
| | | | | | | | | | | | | | | | | |
| |
| | | | | | | | | | | | | | | | | |
| | 5,555,131,091 | | | | 6,197,109,217 | | | | 118,856,937 | | | | — | | | |
| |
| |
| $ | 4,478,556,334 | | | $ | 5,555,131,091 | | | $ | 593,051,463 | | | $ | 118,856,937 | | | |
| |
| |
| $ | 7,276,723 | | | $ | 7,853,984 | | | $ | (148,219 | ) | | $ | (2,218 | ) | | |
| |
| |
The accompanying notes are an integral part of these financial statements. 95
GOLDMAN SACHS SINGLE SECTOR FIXED INCOME FUNDS
Statements of Changes in Net Assets
| | | | | | | | | |
| | | Investment Grade Credit Fund |
| | | For the
| | |
| | | Six Months Ended
| | For the Fiscal
|
| | | September 30, 2011
| | Year Ended
|
| | | (Unaudited) | | March 31, 2011 |
| |
From operations: |
| | | | | | | | | |
| Net investment income | | $ | 11,195,385 | | | $ | 27,840,577 | |
| Net realized gain from investment, futures, options, swap and foreign currency related transactions | | | 19,494,873 | | | | 35,685,331 | |
| Net change in unrealized gain (loss) on investments, futures, options, swaps, non-deliverable bond forwards and translation of assets and liabilities denominated in foreign currencies | | | (5,152,172 | ) | | | (9,659,236 | ) |
| |
| |
Net increase (decrease) in net assets resulting from operations | | | 25,538,086 | | | | 53,866,672 | |
| |
| |
| | | | | | | | | |
| | | | | | | | | |
Distributions to shareholders: |
| | | | | | | | | |
| From net investment income | | | | | | | | |
| Class A Shares | | | (2,894,741 | ) | | | (7,319,482 | ) |
| Class C Shares | | | — | | | | — | |
Institutional Shares(a) | | | (3,114,765 | ) | | | (8,457,290 | ) |
| Class IR Shares | | | (7 | ) | | | — | |
| Separate Account Institutional Shares | | | (5,351,142 | ) | | | (12,260,657 | ) |
| From net realized gains | | | | | | | | |
| Class A Shares | | | — | | | | (114,182 | ) |
| Class C Shares | | | — | | | | — | |
| Institutional Shares | | | — | | | | (133,535 | ) |
Class IR Shares(a)(b) | | | — | | | | — | |
| Separate Account Institutional Shares | | | — | | | | (167,990 | ) |
| |
| |
Total distributions to shareholders | | | (11,360,655 | ) | | | (28,453,136 | ) |
| |
| |
| | | | | | | | | |
| | | | | | | | | |
From share transactions: |
| | | | | | | | | |
| Proceeds from sales of shares | | | 51,856,734 | | | | 170,905,568 | |
| Proceeds received in connection with in-kind subscriptions | | | — | | | | 18,159,598 | |
| Reinvestment of distributions | | | 10,408,259 | | | | 21,548,532 | |
| Cost of shares redeemed | | | (105,274,608 | ) | | | (313,307,611 | ) |
| |
| |
Net increase (decrease) in net assets resulting from share transactions | | | (43,009,615 | ) | | | (102,693,913 | ) |
| |
| |
TOTAL INCREASE (DECREASE) | | | (28,832,184 | ) | | | (77,280,377 | ) |
| |
| |
| | | | | | | | | |
| | | | | | | | | |
Net assets: |
| | | | | | | | | |
| Beginning of period | | | 553,783,372 | | | | 631,063,749 | |
| |
| |
| End of period | | $ | 524,951,188 | | | $ | 553,783,372 | |
| |
| |
Accumulated undistributed (distribution in excess of) net investment income | | $ | (156,319 | ) | | $ | 8,951 | |
| |
| |
| | |
| (a) | | Commenced operations on July 30, 2010 for Local Emerging Markets Debt Fund. |
| (b) | | Commenced operations on July 29, 2011 for Investment Grade Credit and U.S. Mortgages Funds. |
| (c) | | Net of $14,299 and $65,153 of redemption fees for Local Emerging Markets Debt Fund for the six months ended September 30, 2011 and the fiscal year ended March 31, 2011, respectively. |
96 The accompanying notes are an integral part of these financial statements.
GOLDMAN SACHS SINGLE SECTOR FIXED INCOME FUNDS
| | | | | | | | | | | | | | | |
| Local Emerging Markets Debt Fund | | U.S. Mortgages Fund |
For the
| | | | For the
| | |
Six Months Ended
| | For the Fiscal
| | Six Months Ended
| | For the Fiscal
|
September 30, 2011
| | Year Ended
| | September 30, 2011
| | Year Ended
|
| (Unaudited) | | March 31, 2011 | | (Unaudited) | | March 31, 2011 |
| |
| |
| | | | | | | | | | | | | | | |
| $ | 47,222,378 | | | $ | 71,074,504 | | | $ | 3,516,415 | | | $ | 10,822,593 | |
| | 40,645,246 | | | | 39,778,871 | | | | 8,790,187 | | | | 10,889,341 | |
| |
(222,804,991 | ) | | | 54,827,604 | | | | 2,146,880 | | | | (848,096 | ) |
| |
| |
| | (134,937,367 | ) | | | 165,680,979 | | | | 14,453,482 | | | | 20,863,838 | |
| |
| |
| | | | | | | | | | | | | | | |
| | | | | | | | | | | | | | | |
| |
| | | | | | | | | | | | | | | |
| | | | | | | | | | | | | | | |
| | (21,388,552 | ) | | | (58,138,747 | ) | | | (45,759 | ) | | | (199,066 | ) |
| | (329,399 | ) | | | (473,184 | ) | | | — | | | | — | |
| | (25,380,345 | ) | | | (55,623,403 | ) | | | (364,416 | ) | | | (1,511,392 | ) |
| | (275,044 | ) | | | (233,499 | ) | | | (4 | ) | | | — | |
| | — | | | | — | | | | (3,645,278 | ) | | | (10,155,559 | ) |
| | | | | | | | | | | | | | | |
| | — | | | | (8,809,208 | ) | | | — | | | | — | |
| | — | | | | (102,339 | ) | | | — | | | | — | |
| | — | | | | (8,487,066 | ) | | | — | | | | — | |
| | — | | | | (50,009 | ) | | | — | | | | — | |
| | — | | | | — | | | | — | | | | — | |
| |
| |
| | (47,373,340 | ) | | | (131,917,455 | ) | | | (4,055,457 | ) | | | (11,866,017 | ) |
| |
| |
| | | | | | | | | | | | | | | |
| | | | | | | | | | | | | | | |
| |
| | | | | | | | | | | | | | | |
| | 605,217,305 | | | | 1,680,267,280 | | | | 64,032,802 | | | | 242,039,882 | |
| | — | | | | — | | | | — | | | | 5,870,871 | |
| | 45,211,841 | | | | 108,927,820 | | | | 3,238,377 | | | | 9,620,680 | |
| | (898,564,780 | )(c) | | | (492,243,393 | )(c) | | | (113,638,771 | ) | | | (303,467,890 | ) |
| |
| |
| | (248,135,634 | ) | | | 1,296,951,707 | | | | (46,367,592 | ) | | | (45,936,457 | ) |
| |
| |
| | (430,446,341 | ) | | | 1,330,715,231 | | | | (35,969,567 | ) | | | (36,938,636 | ) |
| |
| |
| | | | | | | | | | | | | | | |
| | | | | | | | | | | | | | | |
| |
| | | | | | | | | | | | | | | |
| | 2,128,797,829 | | | | 798,082,598 | | | | 408,053,795 | | | | 444,992,431 | |
| |
| |
| $ | 1,698,351,488 | | | $ | 2,128,797,829 | | | $ | 372,084,228 | | | $ | 408,053,795 | |
| |
| |
| $ | (25,140,495 | ) | | $ | (24,989,533 | ) | | $ | (457,313 | ) | | $ | 81,729 | |
| |
| |
The accompanying notes are an integral part of these financial statements. 97
GOLDMAN SACHS EMERGING MARKETS DEBT FUND
Financial Highlights
Selected Data for a Share Outstanding Throughout Each Period
| | | | | | | | | | | | | | | | | | | | | | | | | | | | | | | |
| | | | | Income (loss) from
| | Distributions
| | |
| | | | | investment operations | | to shareholders | | |
| | | | |
| | | | | |
| | | | | | |
| | | Net asset
| |
| | | | | |
| | | | | | |
| | | value,
| | Net
| | Net realized
| | Total from
| | From net
| | From net
| | | | |
| | | beginning
| | investment
| | and unrealized
| | investment
| | investment
| | realized
| | Total
| | |
| Year - Share Class | | of period | | income(a) | | gain (loss) | | operations | | income | | gains | | distributions | | |
| |
FOR THE SIX MONTHS ENDED SEPTEMBER 30, (UNAUDITED) |
| 2011 - A | | $ | 12.28 | | | $ | 0.29 | | | $ | (0.22 | ) | | $ | 0.07 | | | $ | (0.30 | ) | | $ | — | | | $ | (0.30 | ) | | |
| 2011 - C | | | 12.27 | | | | 0.25 | | | | (0.23 | ) | | | 0.02 | | | | (0.25 | ) | | | — | | | | (0.25 | ) | | |
| 2011 - Institutional | | | 12.29 | | | | 0.32 | | | | (0.23 | ) | | | 0.09 | | | | (0.32 | ) | | | — | | | | (0.32 | ) | | |
| 2011 - IR | | | 12.29 | | | | 0.31 | | | | (0.24 | ) | | | 0.07 | | | | (0.31 | ) | | | — | | | | (0.31 | ) | | |
| | | | | | | | | | | | | | | | | | | | | | | | | | | | | | | |
| | | | | | | | | | | | | | | | | | | | | | | | | | | | | | | |
FOR THE FISCAL YEARS ENDED MARCH 31, |
| 2011 - A | | | 11.99 | | | | 0.59 | | | | 0.42 | | | | 1.01 | | | | (0.71 | ) | | | (0.01 | ) | | | (0.72 | ) | | |
| 2011 - C | | | 11.98 | | | | 0.49 | | | | 0.43 | | | | 0.92 | | | | (0.62 | ) | | | (0.01 | ) | | | (0.63 | ) | | |
| 2011 - Institutional | | | 12.00 | | | | 0.63 | | | | 0.42 | | | | 1.05 | | | | (0.75 | ) | | | (0.01 | ) | | | (0.76 | ) | | |
| 2011 - IR (Commenced July 30, 2010) | | | 12.44 | | | | 0.41 | | | | (0.04 | ) | | | 0.37 | | | | (0.51 | ) | | | (0.01 | ) | | | (0.52 | ) | | |
| |
|
| 2010 - A | | | 9.19 | | | | 0.70 | | | | 2.96 | | | | 3.66 | | | | (0.86 | ) | | | — | | | | (0.86 | ) | | |
| 2010 - C | | | 9.16 | | | | 0.61 | | | | 2.99 | | | | 3.60 | | | | (0.78 | ) | | | — | | | | (0.78 | ) | | |
| 2010 - Institutional | | | 9.20 | | | | 0.74 | | | | 2.96 | | | | 3.70 | | | | (0.90 | ) | | | — | | | | (0.90 | ) | | |
| |
|
| 2009 - A | | | 11.63 | | | | 0.68 | | | | (2.50 | ) | | | (1.82 | ) | | | (0.57 | ) | | | (0.05 | ) | | | (0.62 | ) | | |
| 2009 - C | | | 11.60 | | | | 0.60 | | | | (2.50 | ) | | | (1.90 | ) | | | (0.49 | ) | | | (0.05 | ) | | | (0.54 | ) | | |
| 2009 - Institutional | | | 11.63 | | | | 0.72 | | | | (2.50 | ) | | | (1.78 | ) | | | (0.60 | ) | | | (0.05 | ) | | | (0.65 | ) | | |
| | | | | | | | | | | | | | | | | | | | | | | | | | | | | | | |
| | | | | | | | | | | | | | | | | | | | | | | | | | | | | | | |
FOR THE PERIOD NOVEMBER 1, 2007 TO MARCH 31, 2008* |
| 2008 - A | | | 12.16 | | | | 0.30 | | | | (0.37 | ) | | | (0.07 | ) | | | (0.31 | ) | | | (0.15 | ) | | | (0.46 | ) | | |
| 2008 - C | | | 12.14 | | | | 0.25 | | | | (0.36 | ) | | | (0.11 | ) | | | (0.28 | ) | | | (0.15 | ) | | | (0.43 | ) | | |
| 2008 - Institutional | | | 12.17 | | | | 0.32 | | | | (0.38 | ) | | | (0.06 | ) | | | (0.33 | ) | | | (0.15 | ) | | | (0.48 | ) | | |
| | | | | | | | | | | | | | | | | | | | | | | | | | | | | | | |
| | | | | | | | | | | | | | | | | | | | | | | | | | | | | | | |
FOR THE FISCAL YEARS ENDED OCTOBER 31, |
| 2007 - A | | | 11.98 | | | | 0.63 | | | | 0.38 | | | | 1.01 | | | | (0.62 | ) | | | (0.21 | ) | | | (0.83 | ) | | |
| 2007 - C | | | 11.97 | | | | 0.53 | | | | 0.38 | | | | 0.91 | | | | (0.53 | ) | | | (0.21 | ) | | | (0.74 | ) | | |
| 2007 - Institutional | | | 11.99 | | | | 0.67 | | | | 0.39 | | | | 1.06 | | | | (0.67 | ) | | | (0.21 | ) | | | (0.88 | ) | | |
| |
|
| 2006 - A | | | 11.75 | | | | 0.60 | | | | 0.69 | | | | 1.29 | | | | (0.65 | ) | | | (0.41 | ) | | | (1.06 | ) | | |
| 2006 - C (Commenced September 6, 2006) | | | 11.78 | | | | 0.01 | | | | 0.22 | | | | 0.23 | | | | (0.04 | ) | | | — | | | | (0.04 | ) | | |
| 2006 - Institutional | | | 11.76 | | | | 0.64 | | | | 0.69 | | | | 1.33 | | | | (0.69 | ) | | | (0.41 | ) | | | (1.10 | ) | | |
| |
|
| | |
| * | | The Fund changed its fiscal year end from October 31 to March 31. |
| (a) | | Calculated based on the average shares outstanding methodology. |
| (b) | | Assumes investment at the net asset value at the beginning of the period, reinvestment of all dividends and distributions, a complete redemption of the investment at the net asset value at the end of the period and no sales or redemption charges. Total returns would be reduced if a sales or redemption charge was taken into account. Returns do not reflect the deduction of taxes that a shareholder would pay on Fund distributions or the redemption of Fund shares. Total returns for periods less than one full year are not annualized. |
| (c) | | Annualized. |
| (d) | | Portfolio turnover rates exclude portfolio securities received as a result of in-kind subscriptions. |
98 The accompanying notes are an integral part of these financial statements.
GOLDMAN SACHS EMERGING MARKETS DEBT FUND
| | | | | | | | | | | | | | | | | | | | | | | | | | | | | |
| | | | | | | | | | |
| | | | |
| | | | | | | | | | | | | | | |
| | | | | | | | | | | Ratio of
| | | | |
| | | | | Net assets,
| | Ratio of
| | Ratio of
| | net investment
| | | | |
Net asset
| | | | end of
| | net expenses
| | total expenses
| | income
| | Portfolio
| | |
value, end
| | Total
| | period
| | to average
| | to average
| | to average
| | turnover
| | |
| of period | | return(b) | | (in 000s) | | net assets | | net assets | | net assets | | rate | | |
| |
| |
| $ | 12.05 | | | | 0.48 | % | | $ | 144,772 | | | | 1.22 | %(c) | | | 1.27 | %(c) | | | 4.69 | %(c) | | | 44 | % | | |
| | 12.04 | | | | 0.10 | | | | 29,256 | | | | 1.97 | (c) | | | 2.02 | (c) | | | 3.94 | (c) | | | 44 | | | |
| | 12.06 | | | | 0.65 | | | | 441,959 | | | | 0.88 | (c) | | | 0.93 | (c) | | | 5.00 | (c) | | | 44 | | | |
| | 12.05 | | | | 0.52 | | | | 2,799 | | | | 0.97 | (c) | | | 1.02 | (c) | | | 4.93 | (c) | | | 44 | | | |
| | | | | | | | | | | | | | | | | | | | | | | | | | | | | |
| | | | | | | | | | | | | | | | | | | | | | | | | | | | | |
| |
| | 12.28 | | | | 8.46 | | | | 156,901 | | | | 1.22 | | | | 1.29 | | | | 4.75 | | | | 116 | (d) | | |
| | 12.27 | | | | 7.65 | | | | 31,205 | | | | 1.97 | | | | 2.04 | | | | 4.00 | | | | 116 | (d) | | |
| | 12.29 | | | | 8.82 | | | | 436,068 | | | | 0.88 | | | | 0.95 | | | | 5.12 | | | | 116 | (d) | | |
| | 12.29 | | | | 2.96 | | | | 1,392 | | | | 0.97 | (c) | | | 1.05 | (c) | | | 4.96 | (c) | | | 116 | (d) | | |
| |
|
| | 11.99 | | | | 40.98 | | | | 105,352 | | | | 1.22 | | | | 1.31 | | | | 6.27 | | | | 121 | | | |
| | 11.98 | | | | 40.28 | | | | 10,629 | | | | 1.97 | | | | 2.06 | | | | 5.41 | | | | 121 | | | |
| | 12.00 | | | | 41.42 | | | | 278,030 | | | | 0.88 | | | | 0.97 | | | | 6.63 | | | | 121 | | | |
| |
|
| | 9.19 | | | | (15.89 | ) | | | 40,814 | | | | 1.22 | | | | 1.44 | | | | 6.58 | | | | 132 | | | |
| | 9.16 | | | | (16.57 | ) | | | 1,661 | | | | 1.97 | | | | 2.19 | | | | 5.97 | | | | 132 | | | |
| | 9.20 | | | | (15.59 | ) | | | 109,375 | | | | 0.88 | | | | 1.10 | | | | 7.03 | | | | 132 | | | |
| | | | | | | | | | | | | | | | | | | | | | | | | | | | | |
| | | | | | | | | | | | | | | | | | | | | | | | | | | | | |
| |
| | 11.63 | | | | (0.51 | ) | | | 87,818 | | | | 1.21 | (c) | | | 1.36 | (c) | | | 6.03 | (c) | | | 41 | | | |
| | 11.60 | | | | (0.82 | ) | | | 1,890 | | | | 1.96 | (c) | | | 2.11 | (c) | | | 5.20 | (c) | | | 41 | | | |
| | 11.63 | | | | (0.37 | ) | | | 145,067 | | | | 0.87 | (c) | | | 1.02 | (c) | | | 6.51 | (c) | | | 41 | | | |
| | | | | | | | | | | | | | | | | | | | | | | | | | | | | |
| | | | | | | | | | | | | | | | | | | | | | | | | | | | | |
| |
| | 12.16 | | | | 8.86 | | | | 84,661 | | | | 1.23 | | | | 1.38 | | | | 5.23 | | | | 81 | | | |
| | 12.14 | | | | 7.80 | | | | 995 | | | | 1.98 | | | | 2.13 | | | | 4.64 | | | | 81 | | | |
| | 12.17 | | | | 9.25 | | | | 188,311 | | | | 0.87 | | | | 1.02 | | | | 5.68 | | | | 81 | | | |
| |
|
| | 11.98 | | | | 11.63 | | | | 69,302 | | | | 1.23 | | | | 1.53 | | | | 5.17 | | | | 167 | | | |
| | 11.97 | | | | 1.98 | | | | 1 | | | | 1.71 | (c) | | | 1.75 | (c) | | | 1.36 | (c) | | | 167 | | | |
| | 11.99 | | | | 11.93 | | | | 85,073 | | | | 0.86 | | | | 1.16 | | | | 5.51 | | | | 167 | | | |
| |
|
The accompanying notes are an integral part of these financial statements. 99
GOLDMAN SACHS HIGH YIELD FUND
Financial Highlights
Selected Data for a Share Outstanding Throughout Each Period
| | | | | | | | | | | | | | | | | | | | | | | |
| | | | | Income (loss) from
| | | | |
| | | | | investment operations | | | | |
| | | | | | | | | | | Distributions
| | |
| | | Net asset
| | | | | | | | to shareholders
| | |
| | | value,
| | Net
| | Net realized
| | Total from
| | from net
| | |
| | | beginning
| | investment
| | and unrealized
| | investment
| | investment
| | |
| Year - Share Class | | of period | | income(a) | | gain (loss) | | operations | | income | | |
| |
FOR THE SIX MONTHS ENDED SEPTEMBER 30, (UNAUDITED) |
| 2011 - A | | $ | 7.38 | | | $ | 0.26 | | | $ | (0.77 | ) | | $ | (0.51 | ) | | $ | (0.26 | ) | | |
| 2011 - B | | | 7.40 | | | | 0.24 | | | | (0.77 | ) | | | (0.53 | ) | | | (0.24 | ) | | |
| 2011 - C | | | 7.39 | | | | 0.24 | | | | (0.77 | ) | | | (0.53 | ) | | | (0.24 | ) | | |
| 2011 - Institutional | | | 7.40 | | | | 0.28 | | | | (0.77 | ) | | | (0.49 | ) | | | (0.28 | ) | | |
| 2011 - Service | | | 7.38 | | | | 0.26 | | | | (0.77 | ) | | | (0.51 | ) | | | (0.26 | ) | | |
| 2011 - IR | | | 7.39 | | | | 0.27 | | | | (0.76 | ) | | | (0.49 | ) | | | (0.27 | ) | | |
| 2011 - R | | | 7.38 | | | | 0.25 | | | | (0.77 | ) | | | (0.52 | ) | | | (0.25 | ) | | |
| | | | | | | | | | | | | | | | | | | | | | | |
| | | | | | | | | | | | | | | | | | | | | | | |
FOR THE FISCAL YEARS ENDED MARCH 31, |
| 2011 - A | | | 7.07 | | | | 0.55 | | | | 0.30 | | | | 0.85 | | | | (0.54 | ) | | |
| 2011 - B | | | 7.08 | | | | 0.49 | | | | 0.32 | | | | 0.81 | | | | (0.49 | ) | | |
| 2011 - C | | | 7.08 | | | | 0.49 | | | | 0.31 | | | | 0.80 | | | | (0.49 | ) | | |
| 2011 - Institutional | | | 7.09 | | | | 0.57 | | | | 0.31 | | | | 0.88 | | | | (0.57 | ) | | |
| 2011 - Service | | | 7.06 | | | | 0.53 | | | �� | 0.32 | | | | 0.85 | | | | (0.53 | ) | | |
| 2011 - IR | | | 7.07 | | | | 0.56 | | | | 0.32 | | | | 0.88 | | | | (0.56 | ) | | |
| 2011 - R | | | 7.07 | | | | 0.53 | | | | 0.31 | | | | 0.84 | | | | (0.53 | ) | | |
| |
|
| 2010 - A | | | 5.18 | | | | 0.53 | | | | 1.90 | | | | 2.43 | | | | (0.54 | ) | | |
| 2010 - B | | | 5.18 | | | | 0.49 | | | | 1.90 | | | | 2.39 | | | | (0.49 | ) | | |
| 2010 - C | | | 5.18 | | | | 0.49 | | | | 1.90 | | | | 2.39 | | | | (0.49 | ) | | |
| 2010 - Institutional | | | 5.19 | | | | 0.56 | | | | 1.91 | | | | 2.47 | | | | (0.57 | ) | | |
| 2010 - Service | | | 5.17 | | | | 0.53 | | | | 1.89 | | | | 2.42 | | | | (0.53 | ) | | |
| 2010 - IR | | | 5.18 | | | | 0.55 | | | | 1.90 | | | | 2.45 | | | | (0.56 | ) | | |
| 2010 - R | | | 5.17 | | | | 0.52 | | | | 1.91 | | | | 2.43 | | | | (0.53 | ) | | |
| |
|
| 2009 - A | | | 7.12 | | | | 0.55 | | | | (1.92 | ) | | | (1.37 | ) | | | (0.57 | ) | | |
| 2009 - B | | | 7.13 | | | | 0.51 | | | | (1.94 | ) | | | (1.43 | ) | | | (0.52 | ) | | |
| 2009 - C | | | 7.12 | | | | 0.51 | | | | (1.93 | ) | | | (1.42 | ) | | | (0.52 | ) | | |
| 2009 - Institutional | | | 7.13 | | | | 0.57 | | | | (1.92 | ) | | | (1.35 | ) | | | (0.59 | ) | | |
| 2009 - Service | | | 7.12 | | | | 0.54 | | | | (1.93 | ) | | | (1.39 | ) | | | (0.56 | ) | | |
| 2009 - IR | | | 7.12 | | | | 0.57 | | | | (1.93 | ) | | | (1.36 | ) | | | (0.58 | ) | | |
| 2009 - R | | | 7.12 | | | | 0.53 | | | | (1.93 | ) | | | (1.40 | ) | | | (0.55 | ) | | |
| | | | | | | | | | | | | | | | | | | | | | | |
| | | | | | | | | | | | | | | | | | | | | | | |
FOR THE PERIOD NOVEMBER 1, 2007 TO MARCH 31, 2008* |
| 2008 - A | | | 7.93 | | | | 0.24 | | | | (0.78 | ) | | | (0.54 | ) | | | (0.27 | ) | | |
| 2008 - B | | | 7.94 | | | | 0.22 | | | | (0.79 | ) | | | (0.57 | ) | | | (0.24 | ) | | |
| 2008 - C | | | 7.93 | | | | 0.22 | | | | (0.79 | ) | | | (0.57 | ) | | | (0.24 | ) | | |
| 2008 - Institutional | | | 7.94 | | | | 0.25 | | | | (0.78 | ) | | | (0.53 | ) | | | (0.28 | ) | | |
| 2008 - Service | | | 7.92 | | | | 0.24 | | | | (0.78 | ) | | | (0.54 | ) | | | (0.26 | ) | | |
| 2008 - IR (Commenced November 30, 2007) | | | 7.68 | | | | 0.20 | | | | (0.54 | ) | | | (0.34 | ) | | | (0.22 | ) | | |
| 2008 - R (Commenced November 30, 2007) | | | 7.68 | | | | 0.19 | | | | (0.54 | ) | | | (0.35 | ) | | | (0.21 | ) | | |
| | | | | | | | | | | | | | | | | | | | | | | |
| | | | | | | | | | | | | | | | | | | | | | | |
FOR THE FISCAL YEARS ENDED OCTOBER 31, |
| 2007 - A | | | 8.04 | | | | 0.60 | | | | (0.10 | ) | | | 0.50 | | | | (0.61 | ) | | |
| 2007 - B | | | 8.05 | | | | 0.54 | | | | (0.10 | ) | | | 0.44 | | | | (0.55 | ) | | |
| 2007 - C | | | 8.04 | | | | 0.54 | | | | (0.10 | ) | | | 0.44 | | | | (0.55 | ) | | |
| 2007 - Institutional | | | 8.05 | | | | 0.63 | | | | (0.10 | ) | | | 0.53 | | | | (0.64 | ) | | |
| 2007 - Service | | | 8.03 | | | | 0.59 | | | | (0.10 | ) | | | 0.49 | | | | (0.60 | ) | | |
| |
|
| 2006 - A | | | 7.81 | | | | 0.58 | | | | 0.23 | | | | 0.81 | | | | (0.58 | ) | | |
| 2006 - B | | | 7.82 | | | | 0.53 | | | | 0.22 | | | | 0.75 | | | | (0.52 | ) | | |
| 2006 - C | | | 7.81 | | | | 0.53 | | | | 0.22 | | | | 0.75 | | | | (0.52 | ) | | |
| 2006 - Institutional | | | 7.82 | | | | 0.61 | | | | 0.23 | | | | 0.84 | | | | (0.61 | ) | | |
| 2006 - Service | | | 7.80 | | | | 0.57 | | | | 0.23 | | | | 0.80 | | | | (0.57 | ) | | |
| |
|
| | |
| * | | The Fund changed its fiscal year end from October 31 to March 31. |
| (a) | | Calculated based on the average shares outstanding methodology. |
| (b) | | Assumes investment at the net asset value at the beginning of the period, reinvestment of all dividends and distributions, a complete redemption of the investment at the net asset value at the end of the period and no sales or redemption charges. Total returns would be reduced if a sales or redemption charge was taken into account. Returns do not reflect the deduction of taxes that a shareholder would pay on Fund distributions or the redemption of Fund shares. Total returns for periods less than one full year are not annualized. |
| (c) | | Annualized. |
100 The accompanying notes are an integral part of these financial statements.
GOLDMAN SACHS HIGH YIELD FUND
| | | | | | | | | | | | | | | | | | | | | | | | | | | | | |
| | | | | | | | | | | Ratio of
| | | | |
| | | | | Net assets,
| | Ratio of
| | Ratio of
| | net investment
| | | | |
Net asset
| | | | end of
| | net expenses
| | total expenses
| | income
| | Portfolio
| | |
value, end
| | Total
| | period
| | to average
| | to average
| | to average
| | turnover
| | |
| of period | | return(b) | | (in 000s) | | net assets | | net assets | | net assets | | rate | | |
| |
| |
| $ | 6.61 | | | | (7.10 | )% | | $ | 661,733 | | | | 1.06 | %(c) | | | 1.06 | %(c) | | | 7.25 | %(c) | | | 29 | % | | |
| | 6.63 | | | | (7.42 | ) | | | 33,597 | | | | 1.81 | (c) | | | 1.81 | (c) | | | 6.50 | (c) | | | 29 | | | |
| | 6.62 | | | | (7.43 | ) | | | 99,580 | | | | 1.81 | (c) | | | 1.81 | (c) | | | 6.51 | (c) | | | 29 | | | |
| | 6.63 | | | | (6.91 | ) | | | 3,619,318 | | | | 0.72 | (c) | | | 0.72 | (c) | | | 7.58 | (c) | | | 29 | | | |
| | 6.61 | | | | (7.17 | ) | | | 19,088 | | | | 1.22 | (c) | | | 1.22 | (c) | | | 7.09 | (c) | | | 29 | | | |
| | 6.63 | | | | (6.83 | ) | | | 31,073 | | | | 0.81 | (c) | | | 0.81 | (c) | | | 7.63 | (c) | | | 29 | | | |
| | 6.61 | | | | (7.21 | ) | | | 14,167 | | | | 1.31 | (c) | | | 1.31 | (c) | | | 7.02 | (c) | | | 29 | | | |
| | | | | | | | | | | | | | | | | | | | | | | | | | | | | |
| | | | | | | | | | | | | | | | | | | | | | | | | | | | | |
| |
| | 7.38 | | | | 12.56 | | | | 862,655 | | | | 1.05 | | | | 1.06 | | | | 7.63 | | | | 46 | | | |
| | 7.40 | | | | 11.87 | | | | 45,430 | | | | 1.80 | | | | 1.81 | | | | 6.86 | | | | 46 | | | |
| | 7.39 | | | | 11.72 | | | | 114,921 | | | | 1.80 | | | | 1.81 | | | | 6.85 | | | | 46 | | | |
| | 7.40 | | | | 12.93 | | | | 4,492,556 | | | | 0.71 | | | | 0.72 | | | | 7.94 | | | | 46 | | | |
| | 7.38 | | | | 12.54 | | | | 23,208 | | | | 1.21 | | | | 1.22 | | | | 7.44 | | | | 46 | | | |
| | 7.39 | | | | 12.99 | | | | 3,081 | | | | 0.80 | | | | 0.81 | | | | 7.79 | | | | 46 | | | |
| | 7.38 | | | | 12.29 | | | | 13,279 | | | | 1.30 | | | | 1.31 | | | | 7.36 | | | | 46 | | | |
| |
|
| | 7.07 | | | | 48.28 | | | | 1,339,958 | | | | 1.05 | | | | 1.06 | | | | 8.38 | | | | 35 | | | |
| | 7.08 | | | | 47.38 | | | | 60,649 | | | | 1.80 | | | | 1.81 | | | | 7.61 | | | | 35 | | | |
| | 7.08 | | | | 47.38 | | | | 111,997 | | | | 1.80 | | | | 1.81 | | | | 7.56 | | | | 35 | | | |
| | 7.09 | | | | 48.88 | | | | 4,655,677 | | | | 0.71 | | | | 0.72 | | | | 8.64 | | | | 35 | | | |
| | 7.06 | | | | 48.13 | | | | 22,639 | | | | 1.21 | | | | 1.22 | | | | 8.14 | | | | 35 | | | |
| | 7.07 | | | | 48.63 | | | | 786 | | | | 0.80 | | | | 0.81 | | | | 8.01 | | | | 35 | | | |
| | 7.07 | | | | 48.20 | | | | 5,404 | | | | 1.30 | | | | 1.31 | | | | 7.78 | | | | 35 | | | |
| |
|
| | 5.18 | | | | (20.12 | ) | | | 1,636,406 | | | | 1.07 | | | | 1.08 | | | | 9.10 | | | | 14 | | | |
| | 5.18 | | | | (20.73 | ) | | | 53,589 | | | | 1.82 | | | | 1.83 | | | | 8.20 | | | | 14 | | | |
| | 5.18 | | | | (20.72 | ) | | | 74,325 | | | | 1.82 | | | | 1.83 | | | | 8.25 | | | | 14 | | | |
| | 5.19 | | | | (19.81 | ) | | | 1,986,033 | | | | 0.73 | | | | 0.74 | | | | 9.49 | | | | 14 | | | |
| | 5.17 | | | | (20.28 | ) | | | 12,582 | | | | 1.23 | | | | 1.24 | | | | 8.98 | | | | 14 | | | |
| | 5.18 | | | | (19.91 | ) | | | 8 | | | | 0.82 | | | | 0.83 | | | | 9.31 | | | | 14 | | | |
| | 5.17 | | | | (20.47 | ) | | | 183 | | | | 1.32 | | | | 1.33 | | | | 9.95 | | | | 14 | | | |
| | | | | | | | | | | | | | | | | | | | | | | | | | | | | |
| | | | | | | | | | | | | | | | | | | | | | | | | | | | | |
| |
| | 7.12 | | | | (6.82 | ) | | | 1,650,027 | | | | 1.07 | (c) | | | 1.09 | (c) | | | 7.87 | (c) | | | 11 | | | |
| | 7.13 | | | | (7.23 | ) | | | 92,953 | | | | 1.82 | (c) | | | 1.84 | (c) | | | 7.12 | (c) | | | 11 | | | |
| | 7.12 | | | | (7.11 | ) | | | 101,138 | | | | 1.82 | (c) | | | 1.84 | (c) | | | 7.12 | (c) | | | 11 | | | |
| | 7.13 | | | | (6.68 | ) | | | 1,628,668 | | | | 0.73 | (c) | | | 0.75 | (c) | | | 8.22 | (c) | | | 11 | | | |
| | 7.12 | | | | (6.89 | ) | | | 10,573 | | | | 1.23 | (c) | | | 1.25 | (c) | | | 7.72 | (c) | | | 11 | | | |
| | 7.12 | | | | (4.35 | ) | | | 10 | | | | 0.82 | (c) | | | 0.84 | (c) | | | 8.20 | (c) | | | 11 | | | |
| | 7.12 | | | | (4.51 | ) | | | 9 | | | | 1.32 | (c) | | | 1.34 | (c) | | | 7.73 | (c) | | | 11 | | | |
| | | | | | | | | | | | | | | | | | | | | | | | | | | | | |
| | | | | | | | | | | | | | | | | | | | | | | | | | | | | |
| |
| | 7.93 | | | | 6.41 | | | | 1,777,150 | | | | 1.09 | | | | 1.11 | | | | 7.46 | | | | 50 | | | |
| | 7.94 | | | | 5.61 | | | | 115,817 | | | | 1.84 | | | | 1.86 | | | | 6.72 | | | | 50 | | | |
| | 7.93 | | | | 5.61 | | | | 119,073 | | | | 1.84 | | | | 1.86 | | | | 6.71 | | | | 50 | | | |
| | 7.94 | | | | 6.79 | | | | 1,646,138 | | | | 0.73 | | | | 0.75 | | | | 7.82 | | | | 50 | | | |
| | 7.92 | | | | 6.28 | | | | 8,399 | | | | 1.24 | | | | 1.26 | | | | 7.34 | | | | 50 | | | |
| |
|
| | 8.04 | | | | 10.76 | | | | 1,395,265 | | | | 1.12 | | | | 1.14 | | | | 7.38 | | | | 41 | | | |
| | 8.05 | | | | 9.93 | | | | 96,743 | | | | 1.87 | | | | 1.89 | | | | 6.64 | | | | 41 | | | |
| | 8.04 | | | | 9.94 | | | | 90,528 | | | | 1.87 | | | | 1.89 | | | | 6.64 | | | | 41 | | | |
| | 8.05 | | | | 11.16 | | | | 1,296,429 | | | | 0.75 | | | | 0.77 | | | | 7.76 | | | | 41 | | | |
| | 8.03 | | | | 10.63 | | | | 2,980 | | | | 1.25 | | | | 1.27 | | | | 7.26 | | | | 41 | | | |
| |
|
The accompanying notes are an integral part of these financial statements. 101
GOLDMAN SACHS HIGH YIELD FLOATING RATE FUND
Financial Highlights
Selected Data for a Share Outstanding Throughout Each Period
| | | | | | | | | | | | | | | | | | | | | | | |
| | | | | Income (loss) from
| | | | |
| | | | | investment operations | | | | |
| | | | |
| | | | | | Distributions
| | |
| | | Net asset
| |
| | | | | | to shareholders
| | |
| | | value,
| | Net
| | Net realized
| | Total from
| | from net
| | |
| | | beginning
| | investment
| | and unrealized
| | investment
| | investment
| | |
| Year - Share Class | | of period | | income (loss)(a) | | gain (loss) | | operations | | income | | |
| |
FOR THE SIX MONTHS ENDED SEPTEMBER 30, (UNAUDITED) |
| 2011 - A | | $ | 10.00 | | | $ | 0.14 | | | $ | (0.49 | ) | | $ | (0.35 | ) | | $ | (0.13 | ) | | |
| 2011 - C | | | 9.99 | | | | 0.11 | | | | (0.48 | ) | | | (0.37 | ) | | | (0.10 | ) | | |
| 2011 - Institutional | | | 9.99 | | | | 0.16 | | | | (0.47 | ) | | | (0.31 | ) | | | (0.15 | ) | | |
| 2011 - IR | | | 10.00 | | | | 0.16 | | | | (0.30 | ) | | | (0.14 | ) | | | (0.33 | ) | | |
| 2011 - R | | | 10.00 | | | | 0.12 | | | | (0.47 | ) | | | (0.35 | ) | | | (0.12 | ) | | |
| | | | | | | | | | | | | | | | | | | | | | | |
| | | | | | | | | | | | | | | | | | | | | | | |
FOR THE PERIOD ENDED MARCH 31, |
| 2011 - A (Commenced March 31, 2011) | | | 10.00 | | | | — | (d) | | | — | (d) | | | — | (d) | | | — | | | |
| 2011 - C (Commenced March 31, 2011) | | | 10.00 | | | | — | (d) | | | (0.01 | ) | | | (0.01 | ) | | | — | | | |
| 2011 - Institutional (Commenced March 31, 2011) | | | 10.00 | | | | — | (d) | | | (0.01 | ) | | | (0.01 | ) | | | — | | | |
| 2011 - IR (Commenced March 31, 2011) | | | 10.00 | | | | — | (d) | | | — | (d) | | | — | (d) | | | — | | | |
| 2011 - R (Commenced March 31, 2011) | | | 10.00 | | | | — | (d) | | | — | (d) | | | — | (d) | | | — | | | |
| |
|
| | |
| (a) | | Calculated based on the average shares outstanding methodology. |
| (b) | | Assumes investment at the net asset value at the beginning of the period, reinvestment of all dividends and distributions, a complete redemption of the investment at the net asset value at the end of the period and no sales or redemption charges. Total returns would be reduced if a sales or redemption charge was taken into account. Returns do not reflect the deduction of taxes that a shareholder would pay on Fund distributions or the redemption of Fund shares. Total returns for periods less than one full year are not annualized. |
| (c) | | Annualized. |
| (d) | | Amount is less than $0.005 per share. |
102 The accompanying notes are an integral part of these financial statements.
GOLDMAN SACHS HIGH YIELD FLOATING RATE FUND
| | | | | | | | | | | | | | | | | | | | | | | | | | | | | |
| | | | | | | | | | |
| | | | |
| | | | | | | | | | |
| | | | |
| | | | | | | | | | | Ratio of
| | | | |
| | | | | Net assets,
| | Ratio of
| | Ratio of
| | net investment
| | | | |
Net asset
| | | | end of
| | net expenses
| | total expenses
| | income (loss)
| | Portfolio
| | |
value, end
| | Total
| | period
| | to average
| | to average
| | to average
| | turnover
| | |
| of period | | return(b) | | (in 000s) | | net assets(c) | | net assets(c) | | net assets(c) | | rate | | |
| |
| |
| $ | 9.52 | | | | (3.52 | )% | | $ | 929 | | | | 1.08 | % | | | 1.14 | % | | | 2.95 | % | | | 37 | % | | |
| | 9.52 | | | | (3.86 | ) | | | 195 | | | | 1.83 | | | | 1.89 | | | | 2.21 | | | | 37 | | | |
| | 9.53 | | | | (3.26 | ) | | | 591,717 | | | | 0.74 | | | | 0.80 | | | | 3.20 | | | | 37 | | | |
| | 9.53 | | | | (3.31 | ) | | | 202 | | | | 0.83 | | | | 0.89 | | | | 3.41 | | | | 37 | | | |
| | 9.53 | | | | (3.52 | ) | | | 10 | | | | 1.33 | | | | 1.39 | | | | 2.32 | | | | 37 | | | |
| | | | | | | | | | | | | | | | | | | | | | | | | | | | | |
| | | | | | | | | | | | | | | | | | | | | | | | | | | | | |
| |
| | 10.00 | | | | — | | | | 10 | | | | 1.08 | | | | 1.47 | | | | (1.08 | ) | | | — | | | |
| | 9.99 | | | | — | | | | 10 | | | | 1.83 | | | | 2.22 | | | | (1.83 | ) | | | — | | | |
| | 9.99 | | | | — | | | | 118,817 | | | | 0.74 | | | | 1.13 | | | | (0.74 | ) | | | — | | | |
| | 10.00 | | | | — | | | | 10 | | | | 0.83 | | | | 1.22 | | | | (0.83 | ) | | | — | | | |
| | 10.00 | | | | — | | | | 10 | | | | 1.33 | | | | 1.72 | | | | (1.33 | ) | | | — | | | |
| |
|
The accompanying notes are an integral part of these financial statements. 103
GOLDMAN SACHS INVESTMENT GRADE CREDIT FUND
Financial Highlights
Selected Data for a Share Outstanding Throughout Each Period
| | | | | | | | | | | | | | | | | | | | | | | | | | | | | | | |
| | | | | Income (loss) from
| | Distributions
| | |
| | | | | investment operations | | to shareholders | | |
| | | Net asset
| |
| | | | | |
| | | | | | |
| | | value,
| | Net
| | Net realized
| | Total from
| | From net
| | From net
| | | | |
| | | beginning
| | investment
| | and unrealized
| | investment
| | investment
| | realized
| | Total
| | |
| Year - Share Class | | of period | | income(a) | | gain (loss) | | operations | | income | | gains | | distributions | | |
| |
FOR THE SIX MONTHS ENDED SEPTEMBER 30, (UNAUDITED) |
| 2011 - A | | $ | 9.50 | | | $ | 0.19 | | | $ | 0.26 | | | $ | 0.45 | | | $ | (0.19 | ) | | $ | — | | | $ | (0.19 | ) | | |
| 2011 - Institutional | | | 9.51 | | | | 0.21 | | | | 0.25 | | | | 0.46 | | | | (0.21 | ) | | | — | | | | (0.21 | ) | | |
| 2011 - Separate Account Institutional | | | 9.51 | | | | 0.21 | | | | 0.25 | | | | 0.46 | | | | (0.21 | ) | | | — | | | | (0.21 | ) | | |
| 2011 - IR (Commenced July 29, 2011) | | | 9.86 | | | | 0.07 | | | | (0.10 | ) | | | (0.03 | ) | | | (0.07 | ) | | | — | | | | (0.07 | ) | | |
| | | | | | | | | | | | | | | | | | | | | | | | | | | | | | | |
| | | | | | | | | | | | | | | | | | | | | | | | | | | | | | | |
FOR THE FISCAL YEARS ENDED MARCH 31, |
| 2011 - A | | | 9.14 | | | | 0.38 | | | | 0.37 | | | | 0.75 | | | | (0.38 | ) | | | (0.01 | ) | | | (0.39 | ) | | |
| 2011 - Institutional | | | 9.14 | | | | 0.41 | | | | 0.38 | | | | 0.79 | | | | (0.41 | ) | | | (0.01 | ) | | | (0.42 | ) | | |
| 2011 - Separate Account Institutional | | | 9.14 | | | | 0.41 | | | | 0.38 | | | | 0.79 | | | | (0.41 | ) | | | (0.01 | ) | | | (0.42 | ) | | |
| |
|
| 2010 - A | | | 7.75 | | | | 0.43 | | | | 1.40 | | | | 1.83 | | | | (0.44 | ) | | | — | | | | (0.44 | ) | | |
| 2010 - Institutional | | | 7.75 | | | | 0.46 | | | | 1.40 | | | | 1.86 | | | | (0.47 | ) | | | — | | | | (0.47 | ) | | |
| 2010 - Separate Account Institutional | | | 7.75 | | | | 0.47 | | | | 1.39 | | | | 1.86 | | | | (0.47 | ) | | | — | | | | (0.47 | ) | | |
| |
|
| 2009 - A | | | 9.64 | | | | 0.51 | | | | (1.83 | ) | | | (1.32 | ) | | | (0.57 | ) | | | — | | | | (0.57 | ) | | |
| 2009 - Institutional | | | 9.66 | | | | 0.55 | | | | (1.85 | ) | | | (1.30 | ) | | | (0.61 | ) | | | — | | | | (0.61 | ) | | |
| 2009 - Separate Account Institutional | | | 9.65 | | | | 0.57 | | | | (1.86 | ) | | | (1.29 | ) | | | (0.61 | ) | | | — | | | | (0.61 | ) | | |
| | | | | | | | | | | | | | | | | | | | | | | | | | | | | | | |
| | | | | | | | | | | | | | | | | | | | | | | | | | | | | | | |
FOR THE PERIOD NOVEMBER 1, 2007 TO MARCH 31, 2008* |
| 2008 - A | | | 9.90 | | | | 0.22 | | | | (0.27 | ) | | | (0.05 | ) | | | (0.21 | ) | | | — | | | | (0.21 | ) | | |
| 2008 - Institutional | | | 9.92 | | | | 0.23 | | | | (0.27 | ) | | | (0.04 | ) | | | (0.22 | ) | | | — | | | | (0.22 | ) | | |
| 2008 - Separate Account Institutional | | | 9.91 | | | | 0.23 | | | | (0.26 | ) | | | (0.03 | ) | | | (0.23 | ) | | | — | | | | (0.23 | ) | | |
| | | | | | | | | | | | | | | | | | | | | | | | | | | | | | | |
| | | | | | | | | | | | | | | | | | | | | | | | | | | | | | | |
FOR THE FISCAL YEARS ENDED OCTOBER 31, |
| 2007 - A | | | 9.95 | | | | 0.51 | | | | (0.08 | ) | | | 0.43 | | | | (0.48 | ) | | | — | | | | (0.48 | ) | | |
| 2007 - Institutional | | | 9.97 | | | | 0.55 | | | | (0.08 | ) | | | 0.47 | | | | (0.52 | ) | | | — | | | | (0.52 | ) | | |
| 2007 - Separate Account Institutional | | | 9.96 | | | | 0.56 | | | | (0.08 | ) | | | 0.48 | | | | (0.53 | ) | | | — | | | | (0.53 | ) | | |
| |
|
| 2006 - A | | | 9.93 | | | | 0.47 | | | | — | | | | 0.47 | | | | (0.45 | ) | | | — | | | | (0.45 | ) | | |
| 2006 - Institutional | | | 9.95 | | | | 0.51 | | | | — | | | | 0.51 | | | | (0.49 | ) | | | — | | | | (0.49 | ) | | |
| 2006 - Separate Account Institutional | | | 9.94 | | | | 0.52 | | | | (0.01 | ) | | | 0.51 | | | | (0.49 | ) | | | — | | | | (0.49 | ) | | |
| |
|
| | |
| * | | The Fund changed its fiscal year end from October 31 to March 31. |
| (a) | | Calculated based on the average shares outstanding methodology. |
| (b) | | Assumes investment at the net asset value at the beginning of the period, reinvestment of all dividends and distributions, a complete redemption of the investment at the net asset value at the end of the period and no sales or redemption charges. Total returns would be reduced if a sales or redemption charge was taken into account. Returns do not reflect the deduction of taxes that a shareholder would pay on Fund distributions or the redemption of Fund shares. Total returns for periods less than one full year are not annualized. |
| (c) | | Annualized. |
| (d) | | Portfolio turnover rates exclude portfolio securities received as a result of in-kind subscriptions. |
104 The accompanying notes are an integral part of these financial statements.
GOLDMAN SACHS INVESTMENT GRADE CREDIT FUND
| | | | | | | | | | | | | | | | | | | | | | | | | | | | | |
| | | | | | | | | | | Ratio of
| | | | |
| | | | | Net assets,
| | Ratio of
| | Ratio of
| | net investment
| | | | |
Net asset
| | | | end of
| | net expenses
| | total expenses
| | income
| | Portfolio
| | |
value, end
| | Total
| | period
| | to average
| | to average
| | to average
| | turnover
| | |
| of period | | return(b) | | (in 000s) | | net assets | | net assets | | net assets | | rate | | |
| |
| |
| $ | 9.76 | | | | 4.69 | % | | $ | 140,390 | | | | 0.71 | %(c) | | | 0.85 | %(c) | | | 3.92 | %(c) | | | 56 | % | | |
| | 9.76 | | | | 4.87 | | | | 149,847 | | | | 0.37 | (c) | | | 0.51 | (c) | | | 4.26 | (c) | | | 56 | | | |
| | 9.76 | | | | 4.87 | | | | 234,713 | | | | 0.37 | (c) | | | 0.51 | (c) | | | 4.26 | (c) | | | 56 | | | |
| | 9.76 | | | | (0.34 | ) | | | 1 | | | | 0.46 | (c) | | | 0.60 | (c) | | | 4.12 | (c) | | | 56 | | | |
| | | | | | | | | | | | | | | | | | | | | | | | | | | | | |
| | | | | | | | | | | | | | | | | | | | | | | | | | | | | |
| |
| | 9.50 | | | | 8.37 | | | | 147,820 | | | | 0.74 | | | | 0.87 | | | | 3.98 | | | | 100 | (d) | | |
| | 9.51 | | | | 8.73 | | | | 143,057 | | | | 0.40 | | | | 0.53 | | | | 4.33 | | | | 100 | (d) | | |
| | 9.51 | | | | 8.77 | | | | 262,907 | | | | 0.37 | | | | 0.50 | | | | 4.36 | | | | 100 | (d) | | |
| |
|
| | 9.14 | | | | 23.96 | | | | 167,774 | | | | 0.76 | | | | 0.89 | | | | 4.90 | | | | 90 | | | |
| | 9.14 | | | | 24.39 | | | | 190,478 | | | | 0.41 | | | | 0.55 | | | | 5.17 | | | | 90 | | | |
| | 9.14 | | | | 24.45 | | | | 272,812 | | | | 0.36 | | | | 0.50 | | | | 5.39 | | | | 90 | | | |
| |
|
| | 7.75 | | | | (14.00 | ) | | | 53,185 | | | | 0.76 | | | | 0.97 | | | | 6.22 | | | | 135 | | | |
| | 7.75 | | | | (13.83 | ) | | | 22,809 | | | | 0.40 | | | | 0.63 | | | | 6.52 | | | | 135 | | | |
| | 7.75 | | | | (13.72 | ) | | | 171,003 | | | | 0.35 | | | | 0.58 | | | | 6.52 | | | | 135 | | | |
| | | | | | | | | | | | | | | | | | | | | | | | | | | | | |
| | | | | | | | | | | | | | | | | | | | | | | | | | | | | |
| |
| | 9.64 | | | | (0.54 | ) | | | 9,455 | | | | 0.76 | (c) | | | 0.95 | (c) | | | 5.31 | (c) | | | 15 | | | |
| | 9.66 | | | | (0.39 | ) | | | 10,504 | | | | 0.40 | (c) | | | 0.61 | (c) | | | 5.67 | (c) | | | 15 | | | |
| | 9.65 | | | | (0.37 | ) | | | 226,207 | | | | 0.35 | (c) | | | 0.56 | (c) | | | 5.72 | (c) | | | 15 | | | |
| | | | | | | | | | | | | | | | | | | | | | | | | | | | | |
| | | | | | | | | | | | | | | | | | | | | | | | | | | | | |
| |
| | 9.90 | | | | 4.44 | | | | 8,615 | | | | 0.79 | | | | 0.97 | | | | 5.17 | | | | 74 | | | |
| | 9.92 | | | | 4.83 | | | | 10,893 | | | | 0.40 | | | | 0.60 | | | | 5.59 | | | | 74 | | | |
| | 9.91 | | | | 4.89 | | | | 239,358 | | | | 0.35 | | | | 0.55 | | | | 5.61 | | | | 74 | | | |
| |
|
| | 9.95 | | | | 4.84 | | | | 3,420 | | | | 0.79 | | | | 1.04 | | | | 4.82 | | | | 74 | | | |
| | 9.97 | | | | 5.35 | | | | 3,317 | | | | 0.40 | | | | 0.65 | | | | 5.21 | | | | 74 | | | |
| | 9.96 | | | | 5.30 | | | | 206,122 | | | | 0.35 | | | | 0.60 | | | | 5.26 | | | | 74 | | | |
| |
|
The accompanying notes are an integral part of these financial statements. 105
GOLDMAN SACHS LOCAL EMERGING MARKETS DEBT FUND
Financial Highlights
Selected Data for a Share Outstanding Throughout Each Period
| | | | | | | | | | | | | | | | | | | | | | | | | | | | | | | | | | | |
| | | | | Income (loss) from
| | Distributions
| | |
| | | | | investment operations | | to shareholders | | |
| | | | |
| | | | | | | |
| | | | | | |
| | | Net asset
| |
| | | | | | | |
| | | | | | |
| | | value,
| | Net
| | Net realized
| | Total from
| | From net
| | From net
| | | | | | |
| | | beginning
| | investment
| | and unrealized
| | investment
| | investment
| | realized
| | From
| | Total
| | |
| Year - Share Class | | of period | | income(a) | | gain (loss) | | operations | | income | | gains | | capital | | distributions | | |
| |
FOR THE SIX MONTHS ENDED SEPTEMBER 30, (UNAUDITED) |
| 2011 - A | | $ | 9.59 | | | $ | 0.20 | | | $ | (0.91 | ) | | $ | (0.71 | ) | | $ | (0.20 | ) | | $ | — | | | $ | — | | | $ | (0.20 | ) | | |
| 2011 - C | | | 9.61 | | | | 0.16 | | | | (0.91 | ) | | | (0.75 | ) | | | (0.16 | ) | | | — | | | | — | | | | (0.16 | ) | | |
| 2011 - Institutional | | | 9.59 | | | | 0.22 | | | | (0.90 | ) | | | (0.68 | ) | | | (0.22 | ) | | | — | | | | — | | | | (0.22 | ) | | |
| 2011 - IR | | | 9.59 | | | | 0.21 | | | | (0.91 | ) | | | (0.70 | ) | | | (0.21 | ) | | | — | | | | — | | | | (0.21 | ) | | |
| | | | | | | | | | | | | | | | | | | | | | | | | | | | | | | | | | | |
| | | | | | | | | | | | | | | | | | | | | | | | | | | | | | | | | | | |
FOR THE FISCAL YEARS ENDED MARCH 31, |
| 2011 - A | | | 9.31 | | | | 0.41 | | | | 0.60 | | | | 1.01 | | | | (0.64 | ) | | | (0.09 | ) | | | — | | | | (0.73 | ) | | |
| 2011 - C | | | 9.33 | | | | 0.32 | | | | 0.61 | | | | 0.93 | | | | (0.56 | ) | | | (0.09 | ) | | | — | | | | (0.65 | ) | | |
| 2011 - Institutional | | | 9.31 | | | | 0.44 | | | | 0.60 | | | | 1.04 | | | | (0.67 | ) | | | (0.09 | ) | | | — | | | | (0.76 | ) | | |
| 2011 - IR (Commenced July 30, 2010) | | | 9.43 | | | | 0.28 | | | | 0.46 | | | | 0.74 | | | | (0.49 | ) | | | (0.09 | ) | | | — | | | | (0.58 | ) | | |
| |
|
| 2010 - A | | | 7.23 | | | | 0.42 | | | | 2.10 | | | | 2.52 | | | | (0.44 | ) | | | — | | | | — | | | | (0.44 | ) | | |
| 2010 - C | | | 7.24 | | | | 0.36 | | | | 2.10 | | | | 2.46 | | | | (0.37 | ) | | | — | | | | — | | | | (0.37 | ) | | |
| 2010 - Institutional | | | 7.23 | | | | 0.45 | | | | 2.10 | | | | 2.55 | | | | (0.47 | ) | | | — | | | | — | | | | (0.47 | ) | | |
| |
|
| 2009 - A | | | 9.85 | | | | 0.50 | | | | (2.64 | ) | | | (2.14 | ) | | | (0.20 | ) | | | — | | | | (0.28 | ) | | | (0.48 | ) | | |
| 2009 - C | | | 9.85 | | | | 0.48 | | | | (2.67 | ) | | | (2.19 | ) | | | (0.18 | ) | | | — | | | | (0.24 | ) | | | (0.42 | ) | | |
| 2009 - Institutional | | | 9.85 | | | | 0.53 | | | | (2.64 | ) | | | (2.11 | ) | | | (0.22 | ) | | | — | | | | (0.29 | ) | | | (0.51 | ) | | |
| | | | | | | | | | | | | | | | | | | | | | | | | | | | | | | | | | | |
| | | | | | | | | | | | | | | | | | | | | | | | | | | | | | | | | | | |
FOR THE PERIOD ENDED MARCH 31, |
| 2008 - A (Commenced February 15, 2008) | | | 10.00 | | | | 0.04 | | | | (0.14 | ) | | | (0.10 | ) | | | (0.05 | ) | | | — | | | | — | | | | (0.05 | ) | | |
| 2008 - C (Commenced February 15, 2008) | | | 10.00 | | | | 0.04 | | | | (0.14 | ) | | | (0.10 | ) | | | (0.05 | ) | | | — | | | | — | | | | (0.05 | ) | | |
| 2008 - Institutional (Commenced February 15, 2008) | | | 10.00 | | | | 0.06 | | | | (0.15 | ) | | | (0.09 | ) | | | (0.06 | ) | | | — | | | | — | | | | (0.06 | ) | | |
| |
|
| | |
| (a) | | Calculated based on the average shares outstanding methodology. |
| (b) | | Assumes investment at the net asset value at the beginning of the period, reinvestment of all dividends and distributions, a complete redemption of the investment at the net asset value at the end of the period and no sales or redemption charges. Total returns would be reduced if a sales or redemption charge was taken into account. Returns do not reflect the deduction of taxes that a shareholder would pay on Fund distributions or the redemption of Fund shares. Total returns for periods less than one full year are not annualized. |
| (c) | | Annualized. |
106 The accompanying notes are an integral part of these financial statements.
GOLDMAN SACHS LOCAL EMERGING MARKETS DEBT FUND
| | | | | | | | | | | | | | | | | | | | | | | | | | | | | |
| | | | | | | | | | |
| | | | |
| | | | | | | | | | |
| | | | |
| | | | | | | | | | | Ratio of
| | | | |
| | | | | Net assets,
| | Ratio of
| | Ratio of
| | net investment
| | | | |
Net asset
| | | | end of
| | net expenses
| | total expenses
| | income
| | Portfolio
| | |
value, end
| | Total
| | period
| | to average
| | to average
| | to average
| | turnover
| | |
| of period | | return(b) | | (in 000s) | | net assets | | net assets | | net assets | | rate | | |
| |
| |
| $ | 8.68 | | | | (7.69 | )% | | $ | 751,883 | | | | 1.29 | %(c) | | | 1.38 | %(c) | | | 4.12 | %(c) | | | 112 | % | | |
| | 8.70 | | | | (8.02 | ) | | | 19,196 | | | | 2.04 | (c) | | | 2.13 | (c) | | | 3.35 | (c) | | | 112 | | | |
| | 8.69 | | | | (7.43 | ) | | | 913,040 | | | | 0.95 | (c) | | | 1.04 | (c) | | | 4.46 | (c) | | | 112 | | | |
| | 8.68 | | | | (7.58 | ) | | | 14,232 | | | | 1.04 | (c) | | | 1.13 | (c) | | | 4.32 | (c) | | | 112 | | | |
| | | | | | | | | | | | | | | | | | | | | | | | | | | | | |
| | | | | | | | | | | | | | | | | | | | | | | | | | | | | |
| |
| | 9.59 | | | | 11.30 | | | | 1,055,640 | | | | 1.35 | | | | 1.43 | | | | 4.30 | | | | 154 | | | |
| | 9.61 | | | | 10.45 | | | | 16,724 | | | | 2.10 | | | | 2.18 | | | | 3.37 | | | | 154 | | | |
| | 9.59 | | | | 11.68 | | | | 1,048,186 | | | | 1.01 | | | | 1.09 | | | | 4.63 | | | | 154 | | | |
| | 9.59 | | | | 8.13 | | | | 8,247 | | | | 1.10 | (c) | | | 1.16 | (c) | | | 4.40 | (c) | | | 154 | | | |
| |
|
| | 9.31 | | | | 35.39 | | | | 419,456 | | | | 1.35 | | | | 1.49 | | | | 4.74 | | | | 134 | | | |
| | 9.33 | | | | 34.47 | | | | 936 | | | | 2.10 | | | | 2.24 | | | | 4.09 | | | | 134 | | | |
| | 9.31 | | | | 35.84 | | | | 377,691 | | | | 1.01 | | | | 1.15 | | | | 5.16 | | | | 134 | | | |
| |
|
| | 7.23 | | | | (22.32 | ) | | | 20,385 | | | | 1.33 | | | | 1.65 | | | | 5.99 | | | | 92 | | | |
| | 7.24 | | | | (22.79 | ) | | | 30 | | | | 2.08 | | | | 2.40 | | | | 5.17 | | | | 92 | | | |
| | 7.23 | | | | (22.05 | ) | | | 97,877 | | | | 0.99 | | | | 1.31 | | | | 6.30 | | | | 92 | | | |
| | | | | | | | | | | | | | | | | | | | | | | | | | | | | |
| | | | | | | | | | | | | | | | | | | | | | | | | | | | | |
| |
| | 9.85 | | | | (0.93 | ) | | | 1,482 | | | | 1.35 | (c) | | | 2.98 | (c) | | | 4.29 | (c) | | | 3 | | | |
| | 9.85 | | | | (1.01 | ) | | | 127 | | | | 2.10 | (c) | | | 3.73 | (c) | | | 4.30 | (c) | | | 3 | | | |
| | 9.85 | | | | (0.89 | ) | | | 60,432 | | | | 1.01 | (c) | | | 2.64 | (c) | | | 5.52 | (c) | | | 3 | | | |
| |
|
The accompanying notes are an integral part of these financial statements. 107
GOLDMAN SACHS U.S. MORTGAGES FUND
Financial Highlights
Selected Data for a Share Outstanding Throughout Each Period
| | | | | | | | | | | | | | | | | | | | | | | | | | | | | | | |
| | | | | Income (loss) from
| | Distributions
| | |
| | | | | investment operations | | to shareholders | | |
| | | Net asset
| | | | | | | | | | | | | | |
| | | value,
| | Net
| | Net realized
| | Total from
| | From net
| | From net
| | | | |
| | | beginning
| | investment
| | and unrealized
| | investment
| | investment
| | realized
| | Total
| | |
| Year - Share Class | | of period | | income(a) | | gain (loss) | | operations | | income | | gains | | distributions | | |
| |
FOR THE SIX MONTHS ENDED SEPTEMBER 30, (UNAUDITED) |
| 2011 - A | | $ | 10.20 | | | $ | 0.08 | | | $ | 0.30 | | | $ | 0.38 | | | $ | (0.09 | ) | | $ | — | | | $ | (0.09 | ) | | |
| 2011 - Institutional | | | 10.21 | | | | 0.10 | | | | 0.31 | | | | 0.41 | | | | (0.11 | ) | | | — | | | | (0.11 | ) | | |
| 2011 - Separate Account Institutional | | | 10.20 | | | | 0.09 | | | | 0.31 | | | | 0.40 | | | | (0.11 | ) | | | — | | | | (0.11 | ) | | |
| 2011 - IR (Commenced July 29, 2011) | | | 10.45 | | | | 0.04 | | | | 0.06 | | | | 0.10 | | | | (0.04 | ) | | | — | | | | (0.04 | ) | | |
| | | | | | | | | | | | | | | | | | | | | | | | | | | | | | | |
| | | | | | | | | | | | | | | | | | | | | | | | | | | | | | | |
FOR THE FISCAL YEARS ENDED MARCH 31, |
| 2011 - A | | | 9.99 | | | | 0.22 | | | | 0.22 | | | | 0.44 | | | | (0.23 | ) | | | — | | | | (0.23 | ) | | |
| 2011 - Institutional | | | 10.00 | | | | 0.25 | | | | 0.23 | | | | 0.48 | | | | (0.27 | ) | | | — | | | | (0.27 | ) | | |
| 2011 - Separate Account Institutional | | | 9.99 | | | | 0.25 | | | | 0.23 | | | | 0.48 | | | | (0.27 | ) | | | — | | | | (0.27 | ) | | |
| |
|
| 2010 - A | | | 9.27 | | | | 0.32 | | | | 0.76 | | | | 1.08 | | | | (0.36 | ) | | | — | | | | (0.36 | ) | | |
| 2010 - Institutional | | | 9.29 | | | | 0.38 | | | | 0.73 | | | | 1.11 | | | | (0.40 | ) | | | — | | | | (0.40 | ) | | |
| 2010 - Separate Account Institutional | | | 9.28 | | | | 0.38 | | | | 0.73 | | | | 1.11 | | | | (0.40 | ) | | | — | | | | (0.40 | ) | | |
| |
|
| 2009 - A | | | 9.62 | | | | 0.37 | | | | (0.27 | ) | | | 0.10 | | | | (0.38 | ) | | | (0.07 | ) | | | (0.45 | ) | | |
| 2009 - Institutional | | | 9.64 | | | | 0.39 | | | | (0.26 | ) | | | 0.13 | | | | (0.41 | ) | | | (0.07 | ) | | | (0.48 | ) | | |
| 2009 - Separate Account Institutional | | | 9.64 | | | | 0.41 | | | | (0.29 | ) | | | 0.12 | | | | (0.41 | ) | | | (0.07 | ) | | | (0.48 | ) | | |
| | | | | | | | | | | | | | | | | | | | | | | | | | | | | | | |
| | | | | | | | | | | | | | | | | | | | | | | | | | | | | | | |
FOR THE PERIOD NOVEMBER 1, 2007 TO MARCH 31, 2008* |
| 2008 - A | | | 9.91 | | | | 0.19 | | | | (0.29 | ) | | | (0.10 | ) | | | (0.19 | ) | | | — | | | | (0.19 | ) | | |
| 2008 - Institutional | | | 9.93 | | | | 0.20 | | | | (0.28 | ) | | | (0.08 | ) | | | (0.21 | ) | | | — | | | | (0.21 | ) | | |
| 2008 - Separate Account Institutional | | | 9.93 | | | | 0.21 | | | | (0.29 | ) | | | (0.08 | ) | | | (0.21 | ) | | | — | | | | (0.21 | ) | | |
| | | | | | | | | | | | | | | | | | | | | | | | | | | | | | | |
| | | | | | | | | | | | | | | | | | | | | | | | | | | | | | | |
FOR THE FISCAL YEARS ENDED OCTOBER 31, |
| 2007 - A | | | 9.90 | | | | 0.44 | | | | 0.04 | | | | 0.48 | | | | (0.47 | ) | | | — | | | | (0.47 | ) | | |
| 2007 - Institutional | | | 9.91 | | | | 0.47 | | | | 0.05 | | | | 0.52 | | | | (0.50 | ) | | | — | | | | (0.50 | ) | | |
| 2007 - Separate Account Institutional | | | 9.91 | | | | 0.48 | | | | 0.05 | | | | 0.53 | | | | (0.51 | ) | | | — | | | | (0.51 | ) | | |
| |
|
| 2006 - A | | | 9.82 | | | | 0.41 | | | | 0.08 | | | | 0.49 | | | | (0.41 | ) | | | — | | | | (0.41 | ) | | |
| 2006 - Institutional | | | 9.82 | | | | 0.45 | | | | 0.08 | | | | 0.53 | | | | (0.44 | ) | | | — | | | | (0.44 | ) | | |
| 2006 - Separate Account Institutional | | | 9.82 | | | | 0.45 | | | | 0.09 | | | | 0.54 | | | | (0.45 | ) | | | — | | | | (0.45 | ) | | |
| |
|
| | |
| * | | The Fund changed its fiscal year end from October 31 to March 31. |
| (a) | | Calculated based on the average shares outstanding methodology. |
| (b) | | Assumes investment at the net asset value at the beginning of the period, reinvestment of all dividends and distributions, a complete redemption of the investment at the net asset value at the end of the period and no sales or redemption charges. Total returns would be reduced if a sales or redemption charge was taken into account. Returns do not reflect the deduction of taxes that a shareholder would pay on Fund distributions or the redemption of Fund shares. Total returns for periods less than one full year are not annualized. |
| (c) | | Annualized. |
| (d) | | Portfolio turnover rates exclude portfolio securities received as a result of in-kind subscriptions. |
108 The accompanying notes are an integral part of these financial statements.
GOLDMAN SACHS U.S. MORTGAGES FUND
| | | | | | | | | | | | | | | | | | | | | | | | | | | | | | | | | |
|
| | | | | | | | | | | Ratio of
| | Portfolio
| | Portfolio
| | |
| | | | | Net assets,
| | Ratio of
| | Ratio of
| | net investment
| | turnover rate
| | turnover rate
| | |
Net asset
| | | | end of
| | net expenses
| | total expenses
| | income
| | (including the
| | (excluding the
| | |
value, end
| | Total
| | period
| | to average
| | to average
| | to average
| | effect of mortgage
| | effect of mortgage
| | |
| of period | | return(b) | | (in 000s) | | net assets | | net assets | | net assets | | dollar rolls) | | dollar rolls) | | |
| |
| |
| $ | 10.49 | | | | 3.75 | % | | $ | 5,101 | | | | 0.71 | %(c) | | | 0.91 | %(c) | | | 1.49 | %(c) | | | 661 | % | | | 410 | % | | |
| | 10.51 | | | | 4.02 | | | | 12,121 | | | | 0.37 | (c) | | | 0.57 | (c) | | | 1.83 | (c) | | | 661 | | | | 410 | | | |
| | 10.49 | | | | 3.93 | | | | 354,861 | | | | 0.37 | (c) | | | 0.57 | (c) | | | 1.82 | (c) | | | 661 | | | | 410 | | | |
| | 10.51 | | | | 0.95 | | | | 1 | | | | 0.46 | (c) | | | 0.66 | (c) | | | 2.09 | (c) | | | 661 | | | | 410 | | | |
| | | | | | | | | | | | | | | | | | | | | | | | | | | | | | | | | |
| | | | | | | | | | | | | | | | | | | | | | | | | | | | | | | | | |
| |
| | 10.20 | | | | 4.46 | | | | 5,511 | | | | 0.74 | | | | 0.92 | | | | 2.14 | | | | 905 | (d) | | | 609 | (d) | | |
| | 10.21 | | | | 4.81 | | | | 54,096 | | | | 0.40 | | | | 0.58 | | | | 2.41 | | | | 905 | (d) | | | 609 | (d) | | |
| | 10.20 | | | | 4.84 | | | | 348,447 | | | | 0.37 | | | | 0.55 | | | | 2.42 | | | | 905 | (d) | | | 609 | (d) | | |
| |
|
| | 9.99 | | | | 11.84 | | | | 12,791 | | | | 0.76 | | | | 0.94 | | | | 3.29 | | | | 628 | | | | 464 | | | |
| | 10.00 | | | | 12.11 | | | | 62,950 | | | | 0.41 | | | | 0.60 | | | | 3.88 | | | | 628 | | | | 464 | | | |
| | 9.99 | | | | 12.17 | | | | 369,251 | | | | 0.36 | | | | 0.55 | | | | 3.91 | | | | 628 | | | | 464 | | | |
| |
|
| | 9.27 | | | | 0.90 | | | | 3,637 | | | | 0.76 | | | | 0.91 | | | | 3.93 | | | | 560 | | | | 511 | | | |
| | 9.29 | | | | 1.38 | | | | 89,617 | | | | 0.40 | | | | 0.57 | | | | 4.22 | | | | 560 | | | | 511 | | | |
| | 9.28 | | | | 1.32 | | | | 431,500 | | | | 0.35 | | | | 0.52 | | | | 4.39 | | | | 560 | | | | 511 | | | |
| | | | | | | | | | | | | | | | | | | | | | | | | | | | | | | | | |
| | | | | | | | | | | | | | | | | | | | | | | | | | | | | | | | | |
| |
| | 9.62 | | | | (0.80 | ) | | | 7,021 | | | | 0.76 | (c) | | | 0.91 | (c) | | | 4.58 | (c) | | | 483 | | | | 295 | | | |
| | 9.64 | | | | (0.75 | ) | | | 164,236 | | | | 0.40 | (c) | | | 0.57 | (c) | | | 4.94 | (c) | | | 483 | | | | 295 | | | |
| | 9.64 | | | | (0.73 | ) | | | 507,194 | | | | 0.35 | (c) | | | 0.52 | (c) | | | 4.98 | (c) | | | 483 | | | | 295 | | | |
| | | | | | | | | | | | | | | | | | | | | | | | | | | | | | | | | |
| | | | | | | | | | | | | | | | | | | | | | | | | | | | | | | | | |
| |
| | 9.91 | | | | 4.96 | | | | 7,044 | | | | 0.78 | | | | 0.94 | | | | 4.43 | | | | 610 | | | | 380 | | | |
| | 9.93 | | | | 5.43 | | | | 153,795 | | | | 0.40 | | | | 0.58 | | | | 4.81 | | | | 610 | | | | 380 | | | |
| | 9.93 | | | | 5.48 | | | | 532,819 | | | | 0.35 | | | | 0.53 | | | | 4.84 | | | | 610 | | | | 380 | | | |
| |
|
| | 9.90 | | | | 5.21 | | | | 6,973 | | | | 0.79 | | | | 0.98 | | | | 4.24 | | | | 1,665 | | | | 1,442 | | | |
| | 9.91 | | | | 5.56 | | | | 117,497 | | | | 0.40 | | | | 0.61 | | | | 4.64 | | | | 1,665 | | | | 1,442 | | | |
| | 9.91 | | | | 5.73 | | | | 307,935 | | | | 0.35 | | | | 0.56 | | | | 4.62 | | | | 1,665 | | | | 1,442 | | | |
| |
|
The accompanying notes are an integral part of these financial statements. 109
GOLDMAN SACHS SINGLE SECTOR FIXED INCOME FUNDS
Notes to Financial Statements
September 30, 2011 (Unaudited)
Goldman Sachs Trust (the “Trust”) is a Delaware statutory trust registered under the Investment Company Act of 1940, as amended (the “Act”), as an open-end management investment company. The following table lists those series of the Trust that are included in this report (collectively, the “Funds” or individually a “Fund”), along with their corresponding share classes and respective diversification status under the Act:
| | | | | |
| | | | | Diversified/
|
| Fund | | Share Classes Offered* | | Non-diversified |
| |
Emerging Markets Debt,
Local Emerging Markets Debt | | A, C, Institutional and IR | | Non-diversified |
| |
| |
| High Yield | | A, B, C, Institutional, Service, IR and R | | Diversified |
| |
| |
High Yield Floating Rate (Commenced operations
March 31, 2011) | | A, C, Institutional, IR and R | | Diversified |
| |
| |
Investment Grade Credit,
U.S. Mortgages | | A, Institutional, IR and Separate Account Institutional | | Diversified |
| |
| |
| | |
| * | | The High Yield Fund’s Class B Shares are generally no longer available for purchase by current or prospective investors. |
Class A Shares of the Emerging Markets Debt, High Yield, High Yield Floating Rate, Investment Grade Credit, Local Emerging Markets Debt and U.S. Mortgages Funds are sold with a front-end sales charge of up to 4.50%, 4.50%, 2.25%, 3.75%, 4.50% and 3.75%, respectively. Class B Shares were sold with a contingent deferred sales charge (“CDSC”) that declines from 5.00% to zero, depending upon the period of time the shares are held. Class C Shares are sold with a CDSC of 1.00%, which is imposed on redemptions made within 12 months of purchase. Institutional, Service, Separate Account Institutional, Class IR and Class R Shares are not subject to a sales charge. Class IR Shares of the Investment Grade Credit and U.S. Mortgages Funds commenced operations on July 29, 2011.
Goldman Sachs Asset Management, L.P. (“GSAM”), an affiliate of Goldman, Sachs & Co. (“Goldman Sachs”), serves as investment adviser to the Funds pursuant to a management agreement (the “Agreement”) with the Trust.
| |
| 2. SIGNIFICANT ACCOUNTING POLICIES | |
The following is a summary of the significant accounting policies consistently followed by the Funds. The preparation of financial statements in conformity with accounting principles generally accepted in the United States of America (“GAAP”) requires management to make estimates and assumptions that may affect the amounts and disclosures in the financial statements. Actual results could differ from those estimates and assumptions.
A. Investment Valuation — The investment valuation policy of the Funds is to value investments at market value. Debt securities for which market quotations are readily available are valued on the basis of quotations furnished by an independent pricing service approved by the trustees or provided by securities dealers. The pricing services may use valuation models or matrix pricing, which consider: (i) yield or price with respect to bonds that are considered comparable in characteristics such as rating, interest rate and maturity date or (ii) quotations from securities dealers to determine current value. If accurate quotations are not readily available, or if GSAM believes that such quotations do not accurately reflect fair value, the fair value of the Funds’ investments may be determined under valuation procedures approved by the trustees. Short-term debt obligations that mature in sixty days or less and that do not exhibit signs of credit deterioration are valued at amortized cost, which approximates market value.
Investments in equity securities and investment companies traded on a United States (“U.S.”) securities exchange or the NASDAQ system are valued daily at their last sale price or official closing price on the principal exchange or system on which they are traded. If no sale occurs, such securities and investment companies are valued at the last bid price for long positions and at the last ask price for short positions. Unlisted equity securities for which market quotations are available are valued at the last
GOLDMAN SACHS SINGLE SECTOR FIXED INCOME FUNDS
| |
| 2. SIGNIFICANT ACCOUNTING POLICIES (continued) | |
sale price on the valuation date, or if no sale occurs, at the last bid price. In the absence of market quotations, broker quotes will be utilized or the security will be fair valued. Investments in investment companies (other than those that are exchange traded) are valued at the net asset value per share (“NAV”) of the investment company on the valuation date.
GSAM, consistent with its procedures and applicable regulatory guidance, may make an adjustment to the previous closing prices of either domestic or foreign securities in light of significant events to reflect what it believes to be the fair value of the securities at the time of determining the Funds’ NAV. Significant events that could affect a large number of securities in a particular market may include, but are not limited to: situations relating to one or more single issuers in a market sector; significant fluctuations in U.S. or foreign markets; market dislocations; market disruptions or market closings; equipment failures; natural or man-made disasters or acts of God; armed conflicts; government actions or other developments; as well as the same or similar events which may affect specific issuers or the securities markets even though not tied directly to the securities markets. Other significant events that could relate to a single issuer may include, but are not limited to: corporate actions such as reorganizations, mergers and buy-outs; corporate announcements, including those relating to earnings, products and regulatory news; significant litigation; and trading halts or suspensions.
B. Investment Transactions and Investment Income — For financial reporting purposes, investment transactions are reflected on trade date. For daily NAV calculation purposes, investment transactions are accounted for on the following business day. Realized gains and losses on sales of portfolio securities are calculated using the identified cost basis. Dividend income is recognized on the ex-dividend date. Certain dividends from foreign securities will be recorded when the Funds are informed of the dividend, if such information is obtained subsequent to the ex-dividend date. Interest income is recorded on the basis of interest accrued, premium amortized and discount accreted. Realized gains and losses resulting from principal paydowns on mortgage-backed and asset-backed securities are included in interest income. Market discounts, original issue discount and market premiums on debt securities are accreted/amortized to interest income over the life of the security with a corresponding adjustment in the cost basis of that security. In addition, it is the Funds’ policy to accrue for foreign capital gains taxes, if applicable, on certain foreign securities held by the Funds. An estimated foreign capital gains tax is recorded daily on net unrealized gains on these securities and is payable upon the sale of such securities when a gain is realized.
Investment income and unrealized and realized gains or losses are allocated daily to each class of shares of the respective Fund based upon the relative proportion of net assets of each class.
C. Expenses — Expenses incurred by the Funds, which may not specifically relate to the Funds, may be shared with other registered investment companies having management agreements with GSAM or its affiliates, as appropriate. These expenses are allocated to the Funds on a straight-line and/or pro-rata basis depending upon the nature of the expenses and are accrued daily. Non-class specific expenses are allocated daily to each share class of the respective Fund based upon the relative proportion of net assets of each class. Class specific expenses, where applicable, are borne by the respective share classes and include Distribution and Service, Transfer Agent, and Service fees.
D. In-Kind Transactions — The Funds may allow investors, under certain circumstances, to purchase shares with securities instead of cash. In addition, the Trust reserves the right to redeem an investor’s shares by distributing securities instead of cash. These are known as in-kind transactions. Securities included as part of in-kind purchases and redemptions of Fund shares are valued in the same manner as they are valued for purposes of computing the Fund’s NAV, in accordance with the Funds’ valuation procedures, and such valuations are as of the date the trade is submitted pursuant to the procedures specified in the Funds’ prospectus.
E. Offering Costs — Offering costs paid in connection with the offering of shares of the High Yield Floating Rate Fund are being amortized on a straight-line basis over 12 months from the date of commencement of operations.
F. Redemption Fees — A 2% redemption fee will be imposed on the redemption of shares (including by exchange) held for 60 calendar days or less with respect to the High Yield Fund and 30 calendar days or less with respect to the Emerging Markets Debt and Local Emerging Markets Debt Funds. For this purpose, the Funds use a first-in first-out method so that shares held longest will be treated as being redeemed first and shares held shortest will be treated as being redeemed last. Redemption fees are
GOLDMAN SACHS SINGLE SECTOR FIXED INCOME FUNDS
Notes to Financial Statements (continued)
September 30, 2011 (Unaudited)
| |
| 2. SIGNIFICANT ACCOUNTING POLICIES (continued) | |
reimbursed to a Fund and are reflected as a reduction in share redemptions. Redemption fees are credited to Paid-in Capital and are allocated to each share class of a Fund on a pro-rata basis.
G. Federal Taxes and Distributions to Shareholders — It is each Fund’s policy to comply with the requirements of the Internal Revenue Code of 1986, as amended (the “Code”), applicable to regulated investment companies (mutual funds) and to distribute each year substantially all of its investment company taxable income and capital gains to its shareholders. Accordingly, the Funds are not required to make any provisions for the payment of federal income tax. Distributions to shareholders are recorded on the ex-dividend date. Income distributions, if any, are declared daily and paid monthly, and capital gains distributions, if any, are declared and paid annually.
Net capital losses are carried forward to future fiscal years and may be used to the extent allowed by the Code to offset any future capital gains. Utilization of capital loss carryforwards will reduce the requirement of future capital gains distributions.
The characterization of distributions to shareholders for financial reporting purposes is determined in accordance with federal income tax rules, which may differ from GAAP. The source of each Fund’s distributions may be shown in the accompanying financial statements as either from net investment income, net realized gain or capital. Certain components of the Funds’ net assets on the Statements of Assets and Liabilities reflect permanent GAAP/tax differences based on the appropriate tax character.
H. Foreign Currency Translations — The books and records of the Funds are maintained in U.S. dollars. Amounts denominated in foreign currencies are translated into U.S. dollars on the following basis: (i) investment valuations, foreign currency and other assets and liabilities initially expressed in foreign currencies are converted into U.S. dollars based upon 4:00 p.m. Eastern Time exchange rates; and (ii) purchases and sales of foreign investments, income and expenses are converted into U.S. dollars based upon currency exchange rates prevailing on the respective dates of such transactions as of 4:00 p.m. Eastern Time.
Net realized and unrealized gain (loss) on foreign currency transactions represents: (i) foreign exchange gains and losses from the sale and holdings of foreign currencies; (ii) currency gains and losses between trade date and settlement date on investment security transactions and forward foreign currency exchange contracts; and (iii) gains and losses from the difference between amounts of dividends, interest and foreign withholding taxes recorded and the amounts actually received. The effect of changes in foreign currency exchange rates on securities and derivative instruments is included with the net realized and change in unrealized gain (loss) on investments on the Statements of Operations, however, the effect of changes in foreign currency exchange rates on fixed income securities sold during the period is included with the net realized gain (loss) on foreign currency related transactions. Changes in the value of other assets and liabilities as a result of fluctuations in foreign exchange rates are included as an increase or decrease to net change in unrealized gain (loss) on translation of assets and liabilities denominated in foreign currencies.
I. Forward Foreign Currency Exchange Contracts — All forward foreign currency exchange contracts are marked to market daily at the applicable forward rate. Unrealized gains or losses on forward foreign currency exchange contracts are recorded by the Funds on a daily basis, and realized gains or losses are recorded on the settlement date of a contract.
Risks may arise upon entering into these contracts from the potential inability of counterparties to meet the terms of their contracts and from unanticipated movements in the value of a foreign currency relative to the U.S. dollar.
The contractual amounts of forward foreign currency exchange contracts do not necessarily represent the amounts potentially subject to risk, and the overall risk at the portfolio level may be mitigated by any applicable related and offsetting transactions. The Funds must set aside liquid assets, or engage in other appropriate measures to cover their obligations under these contracts.
J. Futures Contracts — Futures contracts are valued at the last settlement price, or in the absence of a sale, the last bid price, at the end of each day on the board of trade or exchange upon which they are traded. Upon entering into a futures contract, the Funds deposit cash or securities in an account on behalf of the broker in an amount sufficient to meet the initial margin requirement. Subsequent payments are made or received by the Funds equal to the daily change in the contract value and are recorded as variation margin receivable or payable with a corresponding offset in unrealized gains or losses. The Funds recognize a realized gain or loss when a contract is closed or expires.
GOLDMAN SACHS SINGLE SECTOR FIXED INCOME FUNDS
| |
| 2. SIGNIFICANT ACCOUNTING POLICIES (continued) | |
The use of futures contracts involves, to varying degrees, elements of market and counterparty risk which may exceed the amounts recognized in the Statements of Assets and Liabilities. Futures contracts may be illiquid, and exchanges may limit fluctuations in futures contract prices during a single day. Changes in the value of a futures contract may not directly correlate with changes in the value of the underlying securities. These risks may decrease the effectiveness of the Funds’ strategies and potentially result in a loss. The Funds must set aside liquid assets, or engage in other appropriate measures to cover their obligations under these contracts.
K. Mortgage-Backed and Asset-Backed Securities — The High Yield, Investment Grade Credit and U.S. Mortgages Funds may invest in mortgage-backed securities, and each Fund, except the High Yield Floating Rate Fund, may invest in asset-backed securities. Mortgage-backed securities represent direct or indirect participations in, or are collateralized by and payable from, mortgage loans secured by residential and/or commercial real property. These securities may include mortgage pass-through securities, collateralized mortgage obligations, real estate mortgage investment conduit pass-through or participation certificates and stripped mortgage-backed securities. Asset-backed securities include securities whose principal and interest payments are collateralized by pools of assets such as auto loans, credit card receivables, leases, installment contracts and personal property. Asset-backed securities also include home equity line of credit loans and other second-lien mortgages.
The value of certain mortgage-backed and asset-backed securities (including adjustable rate mortgage loans) may be particularly sensitive to changes in prevailing interest rates. The value of these securities may also fluctuate in response to the market’s perception of the creditworthiness of the issuers. Early repayment of principal on mortgage-backed or asset-backed securities may expose a Fund to the risk of earning a lower rate of return upon reinvestment of principal. Asset-backed securities may present credit risks that are not presented by mortgage-backed securities because they generally do not have the benefit of a security interest in collateral that is comparable to mortgage assets. Some asset-backed securities may only have a subordinated claim on collateral. In addition, while mortgage-backed and asset-backed securities may be supported by some form of government or private guarantee and/or insurance, there is no assurance that private guarantors or insurers, if any, will meet their obligations.
Stripped mortgage-backed securities are usually structured with two different classes: one that receives substantially all of the interest payments (the interest-only, or “IO” and/or the high coupon rate with relatively low principal amount, or “IOette”), and the other that receives substantially all of the principal payments (the principal-only, or “PO”) from a pool of mortgage loans. Little to no principal will be received at the maturity of an IO; as a result, periodic adjustments are recorded to reduce the cost of the security through maturity. These adjustments are included in interest income. Payments received for PO’s are treated as a proportionate reduction to the cost basis of the securities and excess amounts are recorded as gains.
L. Mortgage Dollar Rolls — The Investment Grade Credit and U.S. Mortgages Funds may enter into mortgage dollar rolls (“dollar rolls”) in which the Funds sell securities in the current month for delivery and simultaneously contracts with the same counterparty to repurchase similar (same type, coupon and maturity) but not identical securities on a specified future date. The Funds treat dollar rolls as two separate transactions: one involving the purchase of a security and a separate transaction involving a sale.
During the settlement period between sale and repurchase, the Funds will not be entitled to accrue interest and principal payments on the securities sold. Dollar roll transactions involve the risk that the market value of the securities sold by the Funds may decline below the repurchase price of those securities. In the event the buyer of the securities in a dollar roll transaction files for bankruptcy or becomes insolvent, the Funds’ use of proceeds from the transaction may be restricted pending a determination by, or with respect to, the other counterparty.
M. Non-Deliverable Bond Forwards Disclosure — The Emerging Markets Debt and Local Emerging Markets Debt Funds may invest in non-deliverable bond forwards. A non-deliverable bond forward is a short term forward contract between two parties to buy or sell a bond denominated in a non-deliverable foreign currency at a specified future time and price. Non-deliverable bond forwards are marked to market daily using market quotations. Unrealized gains or losses on non-deliverable bond forwards are recorded by the Funds on a daily basis, and realized gains or losses are recorded on the termination date of a contract. The use of these instruments involves market risk, currency risk and counterparty risk. These instruments may be illiquid, and changes in their values may not directly correlate with changes in the value of the underlying bonds. These risks may decrease the
GOLDMAN SACHS SINGLE SECTOR FIXED INCOME FUNDS
Notes to Financial Statements (continued)
September 30, 2011 (Unaudited)
| |
| 2. SIGNIFICANT ACCOUNTING POLICIES (continued) | |
effectiveness of the Funds’ strategies and result in losses. The Funds must set aside liquid assets or engage in other appropriate measures to cover their obligations under these contracts.
N. Options — When the Funds write call or put options, an amount equal to the premium received is recorded as a liability and is subsequently marked-to-market to reflect the current market value of the option written. Swaptions are options on interest rate swap contracts. Options on a futures contract may be written with premiums to be determined on a future date. The premiums for these options are based upon implied volatility parameters at specified terms. When a written option expires on its stipulated expiration date or the Funds enter into a closing purchase transaction, the Funds realize a gain or loss without regard to any unrealized gain or loss on the underlying future, swap, security or currency transaction, and the liability related to such option is extinguished. When a written call option is exercised, the Funds realize a gain or loss from the sale of the underlying future, swap, security or currency transaction, and the proceeds of the sale are increased by the premium originally received. When a written put option is exercised, the amount of the premium originally received will reduce the cost of the future, swap, security or currency transaction that the Funds purchase upon exercise. There is a risk of loss from a change in value of such options which may exceed the related premiums received. The Funds must set aside liquid assets, or engage in other appropriate measures to cover their obligations under written option contracts.
Upon the purchase of a call option or a put option by the Funds, the premium paid is recorded as an investment and subsequently marked-to-market to reflect the current market value of the option. Certain options may be purchased with premiums to be determined on a future date. The premiums for these options are based upon implied voluntary parameters at specified terms. If an option which the Funds have purchased expires on the stipulated expiration date, the Funds will realize a loss in the amount of the cost of the option. If the Funds enter into a closing sale transaction, the Funds will realize a gain or loss, depending on whether the sale proceeds for the closing sale transaction are greater or less than the cost of the option. If the Funds exercise a purchased put option, the Funds will realize a gain or loss from the sale of the underlying future, swap, security or currency transaction, and the proceeds from such sale will be decreased by the premium originally paid. If the Funds exercise a purchased call option, the cost of the future, swap, security or currency transaction which the Funds purchase upon exercise will be increased by the premium originally paid. Purchased over the counter options are subject to the risk that the counterparty may default on its obligations, which could result in a loss to the Funds.
O. Repurchase Agreements — The Funds may enter into repurchase agreements which involve the purchase of securities subject to the seller’s agreement to repurchase the securities at a mutually agreed upon date and price. During the term of a repurchase agreement, the value of the underlying securities held as collateral on behalf of the Funds, including accrued interest, is required to exceed the value of the repurchase agreement, including accrued interest. If the seller defaults or becomes insolvent, realization of the collateral by the Funds may be delayed or limited and there may be a decline in the value of the collateral during the period while the Funds seek to assert their rights. The underlying securities for all repurchase agreements are held at the Funds’ custodian or designated sub-custodians under tri-party repurchase agreements.
Pursuant to exemptive relief granted by the Securities and Exchange Commission and terms and conditions contained therein, the Funds, together with other registered investment companies having management agreements with GSAM, or its affiliates, may transfer uninvested cash into joint accounts, the daily aggregate balance of which is invested in one or more repurchase agreements. Under these joint accounts, the Funds maintain pro rata credit exposure to the underlying repurchase agreements’ counterparties. With the exception of certain transaction fees, the Funds are not subject to any expenses in relation to these investments.
P. Senior Term Loans — All Funds (except U.S. Mortgages Fund) may invest in Senior Term Loans, which are not registered securities under the Securities Act of 1933, as amended (the “1933 Act”), contain certain restrictions on resale and cannot be sold publicly. Senior Term Loans are portions of loans originated by banks and sold in pieces to investors, typically on an extended delivery basis. These floating rate loans (“Loans”) in which a Fund invests are arranged through private negotiations between the borrower and one or more financial institutions (“Lenders”). A Fund invests in such Loans in the form of participations in Loans (“Participations”) or assignments of all or a portion of loans from third parties (“Assignments”). Participations typically result in a Fund having a contractual relationship only with the Lender, not with the borrower. A Fund has the right to receive payments of
GOLDMAN SACHS SINGLE SECTOR FIXED INCOME FUNDS
| |
| 2. SIGNIFICANT ACCOUNTING POLICIES (continued) | |
principal, interest and any fees to which it is entitled from the Lender selling the Participations and only upon receipt by the Lender of the payments from the borrower. In connection with purchasing Participations, a Fund generally has no right to enforce compliance by the borrower with the terms of the loan agreement relating to the Loan, nor any rights of set-off against the borrower, and the Fund will not benefit directly from any collateral supporting the Loan in which they have purchased the Participation. As a result, a Fund assumes the credit risk of both the borrower and the Lender that is selling the Participation. Assignments typically result in a Fund having a direct contractual relationship with the borrower, and the Fund may enforce compliance by the borrower with the terms of the loan agreement. All Senior Term Loans involve interest rate risk, liquidity risk and credit risk, including the potential default or insolvency of the borrower. Senior Term Loans are marked to market daily using pricing vendor quotations and the change in value, if any, is recorded as an unrealized gain or loss.
Q. Structured Notes — The Funds may invest in structured notes, the values of which are based on the price movements of a reference security or index. Fluctuations in value are recorded as unrealized gain or loss. Interest income is recorded on the basis of interest accrued, premium amortized and discount accreted. On the termination date, the Funds will receive a payment from the issuer based on the value of the referenced security (notional amount multiplied by price of the referenced security) and record a realized gain or loss. Structured notes are subject to various risks including credit, issuer, liquidity and interest rate risks.
R. Swap Contracts — Swaps are marked to market daily using either pricing vendor quotations, counterparty prices or model prices, and the change in value, if any, is recorded as an unrealized gain or loss. Upfront payments made and/or received by the Funds, are recorded as an asset and/or liability, and realized gains or losses are recognized ratably over the contract’s term/event, with the exception of forward starting interest rate swaps, whose realized gains or losses are recognized ratably from the effective start date. Periodic payments received or made on swap contracts are recorded as realized gains or losses. Gains or losses are realized upon termination of a swap contract and are recorded on the Statements of Operations.
Risks may arise as a result of the failure of the counterparty to the swap contract to comply with the terms of the swap contract. The loss incurred by the failure of a counterparty is generally limited to the net payment to be received by the Funds and/or the termination value at the end of the contract. Therefore, GSAM considers the creditworthiness of each counterparty to a contract in evaluating potential credit risk. Additionally, risks may arise from unanticipated movements in interest rates or in the value of the underlying reference asset or index. Entering into these agreements involves, to varying degrees, market risk, liquidity risk and elements of credit, legal and documentation risk in excess of amounts recognized in the Statements of Assets and Liabilities. The Funds may pay or receive cash as collateral on these contracts which is recorded as an asset and/or liability. The Funds must set aside liquid assets, or engage in other appropriate measures to cover their obligations under these contracts.
The Funds may invest in the following types of swaps:
An interest rate swap is an agreement that obligates two parties to exchange a series of cash flows at specified intervals, based upon or calculated by reference to changes in specified prices, rates or indices for a specified amount of an underlying asset or notional principal amount. The payment flows are usually netted against each other, with the difference being paid by one party to the other.
A credit default swap is an agreement that involves one party making a stream of payments to another party in exchange for the right to receive protection on a reference security or obligation. A Fund may use credit default swaps to provide a measure of protection against defaults of the reference security or obligation or to take a short position with respect to the likelihood of default. A Fund’s investment in credit default swaps may involve greater risks than if the Fund had invested in the referenced obligation directly. Credit events are contract specific but may include bankruptcy, failure to pay, restructuring and obligation acceleration. If a Fund buys protection through a credit default swap and no credit event occurs, its payments are limited to the periodic payments previously made to the counterparty. Upon the occurrence of a specified credit event, a Fund, as a buyer of credit protection, is entitled to receive an amount equal to the notional amount of the swap and deliver to the seller the defaulted reference obligation in a physically settled trade. A Fund may also receive a net settlement amount in the form of cash or securities equal to the notional amount of the swap reduced by the recovery value of the reference obligation in a cash settled trade.
As a seller of protection, a Fund generally receives a payment stream throughout the term of the swap, provided that there is no credit event. In addition, if the Fund sells protection through a credit default swap, the Fund could suffer a loss because the value of the referenced obligation may be less than the premium payments received. Upon the occurrence of a specified credit
GOLDMAN SACHS SINGLE SECTOR FIXED INCOME FUNDS
Notes to Financial Statements (continued)
September 30, 2011 (Unaudited)
| |
| 2. SIGNIFICANT ACCOUNTING POLICIES (continued) | |
event, a Fund, as a seller of credit protection, may be required to take possession of the defaulted reference obligation and pay the buyer an amount equal to the notional amount of the swap in a physically settled trade. A Fund may also pay a net settlement amount in the form of cash or securities equal to the notional amount of the swap reduced by the recovery value of the reference obligation in a cash settled trade. Recovery values are at times established through the credit event auction process in which market participants are ensured that a transparent price has been set for the defaulted security or obligation. In addition, a Fund is entitled to a return of any assets, which have been pledged as collateral to the counterparty.
The maximum potential amount of future payments (undiscounted) that the Funds as sellers of protection could be required to make under a credit default swap would be an amount equal to the notional amount of the agreement. These potential amounts would be partially offset by any recovery values of the respective referenced obligations or net amounts received from a settlement of a credit default swap for the same reference security or obligation where the Funds bought credit protection.
S. Treasury Inflation Protected Securities — The Funds may invest in treasury inflation protected securities (“TIPS”), including structured bonds in which the principal amount is adjusted daily to keep pace with inflation, as measured by the U.S. Consumer Pricing Index for Urban Consumers. The adjustments to principal due to inflation/deflation are reflected as increases/decreases to interest income with a corresponding adjustment to cost. Such adjustments may have a significant impact on the Funds’ distributions and may result in a return of capital to shareholders. The repayment of the original bond principal upon maturity is guaranteed by the full faith and credit of the U.S. Government.
T. When-Issued Securities and Forward Commitments — The Funds may purchase when-issued securities, including TBA (“To Be Announced”) securities that have been authorized, but not yet issued in the market. When-issued securities are purchased in order to secure what is considered to be an advantageous price or yield to the Fund at the time of entering into the transaction. A forward commitment involves entering into a contract to purchase or sell securities, typically on an extended delivery basis, for a fixed price at a future date. The purchase of securities on a when-issued or forward commitment basis involves a risk of loss if the value of the security to be purchased declines before the settlement date. Conversely, the sale of securities on a forward commitment basis involves the risk that the value of the securities sold may increase before the settlement date. Although the Funds will generally purchase securities on a when-issued or forward commitment basis with the intention of acquiring the securities for their portfolios, the Funds may dispose of when-issued securities or forward commitments prior to settlement which may result in a realized gain or loss. When purchasing a security on a when-issued basis or entering into a forward commitment, the Funds must “set aside” liquid assets, or engage in other appropriate measures to “cover” their obligations under these contracts.
| |
| 3. FAIR VALUE OF INVESTMENTS | |
The fair value of a financial instrument is the amount that would be received to sell an asset or paid to transfer a liability in an orderly transaction between market participants at the measurement date (i.e., the exit price). GAAP establishes a fair value hierarchy that prioritizes the inputs to valuation techniques used to measure fair value. The hierarchy gives the highest priority to unadjusted quoted prices in active markets for identical assets or liabilities (Level 1 measurements) and the lowest priority to unobservable inputs (Level 3 measurements). The three levels of the fair value hierarchy are described below:
Level 1 — Unadjusted quoted prices in active markets that are accessible at the measurement date for identical, unrestricted assets or liabilities;
Level 2 — Quoted prices in markets that are not active or financial instruments for which significant inputs are observable (including, but not limited to, quoted prices for similar investments, interest rates, foreign exchange rates, volatility and credit spreads), either directly or indirectly;
Level 3 — Prices or valuations that require significant unobservable inputs (including GSAM’s assumptions in determining fair value measurement).
The levels used for classifying investments are not necessarily an indication of the risk associated with investing in those investments.
GOLDMAN SACHS SINGLE SECTOR FIXED INCOME FUNDS
| |
| 3. FAIR VALUE OF INVESTMENTS (continued) | |
The following is a summary of the Funds’ investments and derivatives categorized in the fair value hierarchy as of September 30, 2011:
| | | | | | | | | | | | | |
| EMERGING MARKETS DEBT |
| Investment Type | | Level 1 | | Level 2 | | Level 3 |
| |
Assets | | | | | | | | | | | | |
| Fixed Income | | | | | | | | | | | | |
| Sovereign Debt Obligations | | $ | — | | | $ | 405,503,755 | | | $ | — | |
| Foreign Debt Obligation | | | — | | | | 8,092,083 | | | | — | |
| Corporate Obligations | | | — | | | | 133,053,529 | | | | — | |
| Structured Notes | | | — | | | | 10,226,428 | | | | — | |
| Short-term Investments | | | — | | | | 46,100,000 | | | | — | |
| |
| |
Total | | $ | — | | | $ | 602,975,795 | | | $ | — | |
| |
| |
| | | | | | | | | | | | | |
| Derivative Type | | | | | | |
| |
Assets | | | | | | | | | | | | |
| Forward Foreign Currency Exchange Contracts* | | $ | — | | | $ | 14,397,578 | | | $ | — | |
| Futures Contracts* | | | 238,676 | | | | — | | | | — | |
| Non-Deliverable Bond Forward Contracts* | | | — | | | | 38,258 | | | | — | |
| |
| |
Total | | $ | 238,676 | | | $ | 14,435,836 | | | $ | — | |
| |
| |
Liabilities | | | | | | | | | | | | |
| Forward Foreign Currency Exchange Contracts* | | $ | — | | | $ | (11,079,297 | ) | | $ | — | |
| Futures Contracts* | | | (1,466,527 | ) | | | — | | | | — | |
| Interest Rate Swap Contracts | | | — | | | | (230,325 | ) | | | — | |
| Credit Default Swap Contracts | | | — | | | | (647,074 | ) | | | — | |
| |
| |
Total | | $ | (1,466,527 | ) | | $ | (11,956,696 | ) | | $ | — | |
| |
| |
| | | | | | | | | | | | | |
| | | | | | | | | | | | | |
| HIGH YIELD |
| Investment Type | | Level 1 | | Level 2 | | Level 3 |
| |
Assets | | | | | | | | | | | | |
| Fixed Income | | | | | | | | | | | | |
| Corporate Obligations | | $ | — | | | $ | 4,027,631,226 | | | $ | — | |
| Senior Term Loans | | | — | | | | 32,517,637 | | | | — | |
Common Stock and/or Other Equity Investments | | | 4,174,880 | | | | 15,809,088 | | | | — | |
| Short-term Investments | | | — | | | | 259,600,000 | | | | — | |
| |
| |
Total | | $ | 4,174,880 | | | $ | 4,335,557,951 | | | $ | — | |
| |
| |
| | | | | | | | | | | | | |
| | | | | | | | | | | | | |
GOLDMAN SACHS SINGLE SECTOR FIXED INCOME FUNDS
Notes to Financial Statements (continued)
September 30, 2011 (Unaudited)
| |
| 3. FAIR VALUE OF INVESTMENTS (continued) | |
| | | | | | | | | | | | | |
| HIGH YIELD (continued) |
| Derivative Type | | Level 1 | | Level 2 | | Level 3 |
| |
Assets | | | | | | | | | | | | |
| Forward Foreign Currency Exchange Contracts* | | $ | — | | | $ | 20,697,567 | | | $ | — | |
| |
| |
Liabilities | | | | | | | | | | | | |
| Forward Foreign Currency Exchange Contracts* | | $ | — | | | $ | (605,650 | ) | | $ | — | |
| |
| |
| | | | | | | | | | | | | |
| HIGH YIELD FLOATING RATE |
| Investment Type | | Level 1 | | Level 2 | | Level 3 |
| |
Assets | | | | | | | | | | | | |
| Fixed Income | | | | | | | | | | | | |
| Corporate Obligations | | $ | — | | | $ | 37,952,496 | | | $ | — | |
| Senior Term Loans | | | — | | | | 495,244,479 | | | | — | |
| Short-term Investments | | | — | | | | 86,000,000 | | | | — | |
| |
| |
Total | | $ | — | | | $ | 619,196,975 | | | $ | — | |
| |
| |
| | | | | | | | | | | | | |
| | | | | | | | | | | | | |
| INVESTMENT GRADE CREDIT |
| Investment Type | | Level 1 | | Level 2 | | Level 3 |
| |
Assets | | | | | | | | | | | | |
| Fixed Income | | | | | | | | | | | | |
| Corporate Obligations | | $ | — | | | $ | 417,236,550 | | | $ | — | |
| Mortgage-Backed Obligations | | | — | | | | 15,074,603 | | | | — | |
| Asset-Backed Securities | | | — | | | | 3,526,978 | | | | — | |
| Foreign Debt Obligations | | | — | | | | 18,198,305 | | | | — | |
| Municipal Debt Obligations | | | — | | | | 15,473,364 | | | | — | |
U.S. Treasury Obligations and/or Other U.S. Government Agencies | | | 19,923,247 | | | | 602,168 | | | | — | |
Common Stock and/or Other Equity Investments | | | — | | | | 1,622,266 | | | | — | |
| Short-term Investments | | | — | | | | 1,100,000 | | | | — | |
| |
| |
Total | | $ | 19,923,247 | | | $ | 472,834,234 | | | $ | — | |
| |
| |
| | | | | | | | | | | | | |
GOLDMAN SACHS SINGLE SECTOR FIXED INCOME FUNDS
| |
| 3. FAIR VALUE OF INVESTMENTS (continued) | |
| | | | | | | | | | | | | |
| INVESTMENT GRADE CREDIT (continued) |
| Derivative Type | | Level 1 | | Level 2 | | Level 3 |
| |
Assets | | | | | | | | | | | | |
| Forward Foreign Currency Exchange Contracts* | | $ | — | | | $ | 298,302 | | | $ | — | |
| Futures Contracts* | | | 1,883,399 | | | | — | | | | — | |
| Interest Rate Swap Contracts | | | — | | | | 560,010 | | | | — | |
| Credit Default Swap Contracts | | | — | | | | 69,481 | | | | — | |
| |
| |
Total | | $ | 1,883,399 | | | $ | 927,793 | | | $ | — | |
| |
| |
Liabilities | | | | | | | | | | | | |
| Futures Contracts* | | $ | (151,691 | ) | | $ | — | | | $ | — | |
| Interest Rate Swap Contracts | | | — | | | | (2,412,048 | ) | | | — | |
| Credit Default Swap Contracts | | | — | | | | (3,762,311 | ) | | | — | |
| Written Options Contracts | | | — | | | | (1,028,069 | ) | | | — | |
| |
| |
Total | | $ | (151,691 | ) | | $ | (7,202,428 | ) | | $ | — | |
| |
| |
| | | | | | | | | | | | | |
| | | | | | | | | | | | | |
| LOCAL EMERGING MARKETS DEBT |
| Investment Type | | Level 1 | | Level 2 | | Level 3 |
| |
Assets | | | | | | | | | | | | |
| Fixed Income | | | | | | | | | | | | |
| Sovereign Debt Obligations | | $ | — | | | $ | 970,275,420 | | | $ | — | |
| Structured Notes | | | — | | | | 216,196,471 | | | | — | |
| Corporate Obligations | | | — | | | | 98,717,507 | | | | — | |
| Short-term Investments | | | — | | | | 333,700,000 | | | | — | |
| |
| |
Total | | $ | — | | | $ | 1,618,889,398 | | | $ | — | |
| |
| |
| | | | | | | | | | | | | |
| Derivative Type | | | | | | |
| |
Assets | | | | | | | | | | | | |
| Forward Foreign Currency Exchange Contracts* | | $ | — | | | $ | 89,878,797 | | | $ | — | |
| Interest Rate Swap Contracts | | | — | | | | 1,444,644 | | | | — | |
| Non-Deliverable Bond Forward Contracts* | | | — | | | | 221,413 | | | | — | |
| |
| |
Total | | $ | — | | | $ | 91,544,854 | | | $ | — | |
| |
| |
Liabilities | | | | | | | | | | | | |
| Forward Foreign Currency Exchange Contracts* | | $ | — | | | $ | (136,648,921 | ) | | $ | — | |
| Interest Rate Swap Contracts | | | — | | | | (3,370,835 | ) | | | — | |
| |
| |
Total | | $ | — | | | $ | (140,019,756 | ) | | $ | — | |
| |
| |
| | | | | | | | | | | | | |
| | | | | | | | | | | | | |
GOLDMAN SACHS SINGLE SECTOR FIXED INCOME FUNDS
Notes to Financial Statements (continued)
September 30, 2011 (Unaudited)
| |
| 3. FAIR VALUE OF INVESTMENTS (continued) | |
| | | | | | | | | | | | | |
| U.S. MORTGAGES |
| Investment Type | | Level 1 | | Level 2 | | Level 3 |
| |
Assets | | | | | | | | | | | | |
| Fixed Income | | | | | | | | | | | | |
| Mortgage-Backed Obligations | | $ | — | | | $ | 373,138,648 | | | $ | — | |
| Asset-Backed Securities | | | — | | | | 24,823,756 | | | | — | |
| Short-term Investments | | | — | | | | 122,400,000 | | | | — | |
| |
| |
Total | | $ | — | | | $ | 520,362,404 | | | $ | — | |
| |
| |
Liabilities | | | | | | | | | | | | |
| Fixed Income | | | | | | | | | | | | |
| Mortgage-Backed Obligations — Forward Sales Contracts | | $ | — | | | $ | (25,580,351 | ) | | $ | — | |
| |
| |
| Derivative Type | | | | | | |
| |
Assets | | | | | | | | | | | | |
| Futures Contracts* | | $ | 33,848 | | | $ | — | | | $ | — | |
| Interest Rate Swap Contracts | | | — | | | | 1,344,389 | | | | — | |
| |
| |
Total | | $ | 33,848 | | | $ | 1,344,389 | | | $ | — | |
| |
| |
Liabilities | | | | | | | | | | | | |
| Futures Contracts* | | $ | (342,539 | ) | | $ | — | | | $ | — | |
| Interest Rate Swap Contracts | | | — | | | | (3,945,465 | ) | | | — | |
| Written Options Contracts | | | — | | | | (583,597 | ) | | | — | |
| |
| |
Total | | $ | (342,539 | ) | | $ | (4,529,062 | ) | | $ | — | |
| |
| |
| | |
| * | | Amount shown represents unrealized gain (loss) at period end. |
| |
| 4. INVESTMENTS IN DERIVATIVES | |
The Funds may make investments in derivative instruments, including, but not limited to options, futures, swaps, swaptions and other derivatives relating to foreign currency transactions. A derivative is an instrument whose value is derived from underlying assets, indices, reference rates or a combination of these factors. Derivative instruments may be privately negotiated contracts (often referred to as over the counter (“OTC”) derivatives) or they may be listed and traded on an exchange. Derivative contracts may involve future commitments to purchase or sell financial instruments or commodities at specified terms on a specified date, or to exchange interest payment streams or currencies based on a notional or contractual amount. Derivative instruments may involve a high degree of financial risk. The use of derivatives also involves the risk of loss if the investment adviser is incorrect in its expectation of the timing or level of fluctuations in securities prices, interest rates or currency prices. Investments in derivative instruments also include the risk of default by the counterparty, the risk that the investment may not be liquid and the risk that a small movement in the price of the underlying security or benchmark may result in a disproportionately large movement, unfavorable or favorable, in the price of the derivative instrument.
During the six months ended September 30, 2011, the Funds entered into certain derivative contract types. These instruments were used to meet the Funds’ investment objectives and to obtain and/or manage exposure related to the risks below. The following tables set forth, by certain risk types, the gross value of these derivative contracts for trading activities as of September 30, 2011. The values in the tables below exclude the effects of cash collateral received or posted pursuant to these derivative contracts, and therefore are not representative of the Funds’ net exposure.
GOLDMAN SACHS SINGLE SECTOR FIXED INCOME FUNDS
| |
| 4. INVESTMENTS IN DERIVATIVES (continued) | |
| | | | | | | | | | | | | | | | |
| Emerging Markets Debt |
| |
| | | Statements of Assets
| | | | | Statements of Assets
| | | | |
| | | and Liabilities
| | | | | and Liabilities
| | | | |
| Risk | | Location | | Assets | | | Location | | Liabilities | | |
| Interest rate | | Receivables for swap contracts, at value; Due from broker — variation margin, at value; Receivables for non-deliverable bond forward contracts, at value | | $ | 276,934 | (a) | | | Payables for swap contracts, at value; Due to broker — variation margin, at value | | $ | (1,696,852 | )(a)(b) | | |
| | | | | | | | | | | | | | | | |
| Credit | | — | | | — | | | | Payables for swap contracts, at value | | | (647,074 | )(b) | | |
| | | | | | | | | | | | | | | | |
| Currency | | Receivables for forward foreign currency exchange contracts, at value | | $ | 14,397,578 | | | | Payables for forward foreign currency exchange contracts, at value | | | (11,079,297 | ) | | |
| | | | | | | | | | | | | | | | |
Total | | | | $ | 14,674,512 | | | | | | $ | (13,423,223 | ) | | |
| | | | | | | | | | | | | | | | |
| | | | | | | | | | | | | | | | |
| | | | | | | | | | | | | | | | |
| High Yield |
| |
| | | Statements of Assets
| | | | | Statements of Assets
| | | | |
| | | and Liabilities
| | | | | and Liabilities
| | | | |
| Risk | | Location | | Assets | | | Location | | Liabilities | | |
| Currency | | Receivables for forward foreign currency exchange contracts, at value | | $ | 20,697,567 | | | | Payables for forward foreign currency exchange contracts, at value | | $ | (605,650 | ) | | |
| | | | | | | | | | | | | | | | |
| | | | | | | | | | | | | | | | |
| Investment Grade Credit |
| |
| | | Statements of Assets
| | | | | Statements of Assets
| | | | |
| | | and Liabilities
| | | | | and Liabilities
| | | | |
| Risk | | Location | | Assets | | | Location | | Liabilities | | |
| Interest rate | | Receivables for swap contracts, at value; Due from broker — variation margin, at value | | $ | 2,443,409 | (a) | | | Payables for swap contracts, at value; Due to broker — variation margin, at value; Options written, at value | | $ | (3,591,808 | )(a)(b) | | |
| | | | | | | | | | | | | | | | |
| Credit | | Receivables for swap contracts, at value | | | 69,481 | | | | Payables for swap contracts, at value | | | (3,762,311 | )(b) | | |
| | | | | | | | | | | | | | | | |
| Currency | | Receivables for forward foreign currency exchange contracts, at value | | | 298,302 | | | |
— | | | — | | | |
| | | | | | | | | | | | | | | | |
Total | | | | $ | 2,811,192 | | | | | | $ | (7,354,119 | ) | | |
| | | | | | | | | | | | | | | | |
| | | | | | | | | | | | | | | | |
| | | | | | | | | | | | | | | | |
| Local Emerging Markets Debt |
| |
| | | Statements of Assets
| | | | | Statements of Assets
| | | | |
| | | and Liabilities
| | | | | and Liabilities
| | | | |
| Risk | | Location | | Assets | | | Location | | Liabilities | | |
| Interest rate | | Receivables for swap contracts, at value; Receivables for non-deliverable bond forward contracts, at value | | $ | 1,666,057 | | | | Payables for swap contracts, at value | | $ | (3,370,835 | )(b) | | |
| | | | | | | | | | | | | | | | |
| Currency | | Receivables for forward foreign currency exchange contracts, at value | | | 89,878,797 | | | | Payables for forward foreign currency exchange contracts, at value | | | (136,648,921 | ) | | |
| | | | | | | | | | | | | | | | |
Total | | | | $ | 91,544,854 | | | | | | $ | (140,019,756 | ) | | |
| | | | | | | | | | | | | | | | |
| | | | | | | | | | | | | | | | |
| | | | | | | | | | | | | | | | |
GOLDMAN SACHS SINGLE SECTOR FIXED INCOME FUNDS
Notes to Financial Statements (continued)
September 30, 2011 (Unaudited)
| |
| 4. INVESTMENTS IN DERIVATIVES (continued) | |
| | | | | | | | | | | | | | | | |
| U.S. Mortgages |
| |
| | | Statements of Assets
| | | | | Statements of Assets
| | | | |
| | | and Liabilities
| | | | | and Liabilities
| | | | |
| Risk | | Location | | Assets | | | Location | | Liabilities | | |
| Interest rate | | Receivables for swap contracts, at value; Due to broker — variation margin; | | $ | 1,378,237 | (a) | | | Payables for swap contracts, at value; Due from broker — variation margin; Options written, at value | | $ | (4,871,601 | )(a)(b) | | |
| | | | | | | | | | | | | | | | |
| | |
| (a) | | Includes unrealized gain (loss) on futures contracts described in the Additional Investment Information sections of the Schedules of Investments. Only current day’s variation margin is reported within the Statements of Assets and Liabilities. |
| (b) | | Aggregate of amounts include $877,399, $6,174,359, $3,370,835 and $3,945,465 for Emerging Markets Debt, Investment Grade Credit, Local Emerging Markets Debt and U.S. Mortgages Funds, respectively, which represent the payments to be made pursuant to bilateral agreements should counterparties exercise their “right to terminate” provisions based on, among others, the Funds’ performance, their failure to pay on their obligations or failure to pledge collateral. Such amounts do not include incremental charges directly associated with the close-out of the agreements. They also do not reflect the fair value of any assets pledged as collateral which, through the daily margining process, substantially offsets the aforementioned amounts and for which the Funds are entitled to a full return. |
The following tables set forth, by certain risk types, the Funds’ gains (losses) related to these derivatives and their indicative volumes for the six months ended September 30, 2011. These gains (losses) should be considered in the context that these derivative contracts may have been executed to economically hedge certain securities, and accordingly, certain gains (losses) on such derivative contracts may offset certain (losses) gains attributable to securities. These gains (losses) are included in “Net realized gain (loss)” or “Net change in unrealized gain (loss)” on the Statements of Operations:
| | | | | | | | | | | | | | | | |
| Emerging Markets Debt |
| |
| | | | | Net
| | Net Change in
| | | Average
|
| | | | | Realized
| | Unrealized
| | | Number of
|
| Risk | | Statements of Operations Location | | Gain (Loss) | | Gain (Loss) | | | Contracts(a) |
| Interest rate | | Net realized gain (loss) from futures transactions and swap contracts/Net change in unrealized gain (loss) on futures non-deliverable bond forward and swap contracts | | $ | 6,097,118 | | | $ | (811,828 | ) | | | | 813 | |
| | | | | | | | | | | | | | | | |
| Credit | | Net realized gain (loss) from swap contracts/Net change in unrealized gain (loss) on swap contracts | | | (242,061 | ) | | | (683,145 | ) | | | | 2 | |
| | | | | | | | | | | | | | | | |
| Currency | | Net realized gain (loss) from foreign currency related transactions/Net change in unrealized gain (loss) on translation of assets and liabilities denominated in foreign currencies | | | (2,067,038 | ) | | | 3,423,543 | | | | | 119 | |
| | | | | | | | | | | | | | | | |
Total | | | | $ | 3,788,019 | | | $ | 1,928,570 | | | | | 934 | |
| | | | | | | | | | | | | | | | |
| | | | | | | | | | | | | | | | |
| | | | | | | | | | | | | | | | |
| High Yield |
| |
| | | | | Net
| | Net Change in
| | | Average
|
| | | | | Realized
| | Unrealized
| | | Number of
|
| Risk | | Statements of Operations Location | | Gain (Loss) | | Gain (Loss) | | | Contracts(a) |
| Credit | | Net realized gain (loss) from swap contracts/Net change in unrealized gain (loss) on swap contracts | | $ | 144,097 | | | $ | — | | | | | — | |
| | | | | | | | | | | | | | | | |
| Currency | | Net realized gain (loss) from foreign currency related transactions/Net change in unrealized gain (loss) on translation of assets and liabilities denominated in foreign currencies | | | (6,206,897 | ) | | | 35,968,109 | | | | | 6 | |
| | | | | | | | | | | | | | | | |
Total | | | | $ | (6,062,800 | ) | | $ | 35,968,109 | | | | | 6 | |
| | | | | | | | | | | | | | | | |
| | | | | | | | | | | | | | | | |
| | | | | | | | | | | | | | | | |
GOLDMAN SACHS SINGLE SECTOR FIXED INCOME FUNDS
| |
| 4. INVESTMENTS IN DERIVATIVES (continued) | |
| | | | | | | | | | | | | | | | |
| High Yield Floating Rate |
| |
| | | | | Net
| | Net Change in
| | | Average
|
| | | | | Realized
| | Unrealized
| | | Number of
|
| Risk | | Statements of Operations Location | | Gain (Loss) | | Gain (Loss) | | | Contracts(a) |
| Credit | | Net realized gain (loss) from swap contracts/Net change in unrealized gain (loss) on swap contracts | | $ | (797,431 | ) | | $ | (850 | ) | | | | 3 | |
| | | | | | | | | | | | | | | | |
| | | | | | | | | | | | | | | | |
| | | | | | | | | | | | | | | | |
| Investment Grade Credit |
| |
| | | | | Net
| | Net Change in
| | | Average
|
| | | | | Realized
| | Unrealized
| | | Number of
|
| Risk | | Statements of Operations Location | | Gain (Loss) | | Gain (Loss) | | | Contracts(a) |
| Interest rate | | Net realized gain (loss) from futures transactions, swap contracts and written options /Net change in unrealized gain (loss) on futures, swap contracts and written options | | $ | 7,313,710 | | | $ | 1,549,972 | | | | | 1,228 | |
| | | | | | | | | | | | | | | | |
| Credit | | Net realized gain (loss) from swap contracts/Net change in unrealized gain (loss) on swap contracts | | | 372,794 | | | | (2,145,629 | ) | | | | 21 | |
| | | | | | | | | | | | | | | | |
| Currency | | Net realized gain (loss) from foreign currency related transactions/Net change in unrealized gain (loss) on translation of assets and liabilities denominated in foreign currencies | | | 22,852 | | | | 298,302 | | | | | 1 | |
| | | | | | | | | | | | | | | | |
Total | | | | $ | 7,709,356 | | | $ | (297,355 | ) | | | | 1,250 | |
| | | | | | | | | | | | | | | | |
| | | | | | | | | | | | | | | | |
| | | | | | | | | | | | | | | | |
| Local Emerging Markets Debt |
| |
| | | | | Net
| | Net Change in
| | | Average
|
| | | | | Realized
| | Unrealized
| | | Number of
|
| Risk | | Statements of Operations Location | | Gain (Loss) | | Gain (Loss) | | | Contracts(a) |
| Interest rate | | Net realized gain (loss) from swap contracts/Net change in unrealized gain (loss) on non-deliverable bond forward and swap contracts | | $ | 9,442,553 | | | $ | 1,815,142 | | | | | 16 | |
| | | | | | | | | | | | | | | | |
| Currency | | Net realized gain (loss) from foreign currency related transactions/Net change in unrealized gain (loss) on translation of assets and liabilities denominated in foreign currencies | | | 32,503,033 | | | | (75,392,375 | ) | | | | 203 | |
| | | | | | | | | | | | | | | | |
Total | | | | $ | 41,945,586 | | | $ | (73,577,233 | ) | | | | 219 | |
| | | | | | | | | | | | | | | | |
| | | | | | | | | | | | | | | | |
| | | | | | | | | | | | | | | | |
| U.S. Mortgages |
| |
| | | | | Net
| | Net Change in
| | | Average
|
| | | | | Realized
| | Unrealized
| | | Number of
|
| Risk | | Statements of Operations Location | | Gain (Loss) | | Gain (Loss) | | | Contracts(a) |
| Interest rate | | Net realized gain (loss) from futures transactions, swap contracts and written options/Net change in unrealized gain (loss) on futures, swap contracts and written options | | $ | (2,804,254 | ) | | $ | (646,327 | ) | | | | 606 | |
| | | | | | | | | | | | | | | | |
| | |
| (a) | | Average number of contracts is based on the average of month end balances for the six months ended September 30, 2011. |
GOLDMAN SACHS SINGLE SECTOR FIXED INCOME FUNDS
Notes to Financial Statements (continued)
September 30, 2011 (Unaudited)
| |
| 5. AGREEMENTS AND AFFILIATED TRANSACTIONS | |
A. Management Agreement — Under the Agreement, GSAM manages the Funds, subject to the general supervision of the trustees.
As compensation for the services rendered pursuant to the Agreement, the assumption of the expenses related thereto and administration of the Funds’ business affairs, including providing facilities, GSAM is entitled to a management fee accrued daily and paid monthly, equal to an annual percentage rate of each Fund’s average daily net assets.
For the six months ended September 30, 2011, contractual and effective net management fees with GSAM were at the following rates:
| | | | | | | | | | | | | | | | | | | | | | | | | | | | | |
| | | Contractual Management Rate | | Effective Net
|
| | | First
| | Next
| | Next
| | Next
| | Over
| | Effective
| | Management
|
| Fund | | $1 billion | | $1 billion | | $3 billion | | $3 billion | | $8 billion | | Rate | | Rate |
| |
| Emerging Markets Debt | | | 0.80 | % | | | 0.80 | % | | | 0.72 | % | | | 0.68 | % | | | 0.67 | % | | | 0.80 | % | | | 0.80 | % |
| |
| |
| High Yield | | | 0.70 | | | | 0.70 | | | | 0.63 | | | | 0.60 | | | | 0.59 | | | | 0.66 | | | | 0.66 | |
| |
| |
| High Yield Floating Rate | | | 0.60 | | | | 0.54 | | | | 0.51 | | | | 0.50 | | | | 0.49 | | | | 0.60 | | | | 0.60 | |
| |
| |
| Investment Grade Credit | | | 0.40 | | | | 0.36 | | | | 0.34 | | | | 0.33 | | | | 0.32 | | | | 0.40 | | | | 0.33 | * |
| |
| |
| Local Emerging Markets Debt | | | 0.90 | | | | 0.90 | | | | 0.81 | | | | 0.77 | | | | 0.75 | | | | 0.89 | | | | 0.84 | # |
| |
| |
| U.S. Mortgages | | | 0.40 | | | | 0.36 | | | | 0.34 | | | | 0.33 | | | | 0.32 | | | | 0.40 | | | | 0.33 | * |
| |
| |
| | |
| * | | GSAM has agreed to waive a portion of its management fee in order to achieve an effective net management rate of 0.33% as an annual percentage rate of the average daily net assets of the Investment Grade Credit and U.S. Mortgages Funds through at least July 29, 2012. Prior to such date GSAM may not terminate the arrangement without the approval of the trustees. |
| # | | Effective June 30, 2011, GSAM has agreed to waive a portion of its management fee in order to achieve an effective net management fee rate of 0.80% as an annual percentage rate of the average daily net assets of the Local Emerging Markets Debt Fund through at least July 29, 2012. Prior to such date GSAM may not terminate the arrangement without the approval of the trustees. |
B. Distribution and Service Plans — The Trust, on behalf of each Fund, has adopted Distribution and Service Plans (the “Plans”). Under the Plans, Goldman Sachs, which serves as distributor (the “Distributor”), is entitled to a fee, accrued daily and paid monthly for distribution services and personal and account maintenance services, which may then be paid by Goldman Sachs to authorized dealers, at the following annual rates calculated on a Fund’s average daily net assets of each respective share class:
| | | | | | | | | | | | | | | | | | | |
| | | Distribution and Service Plan Rates | | |
| | | Class A* | | Class B | | Class C | | Class R* | | |
| |
| Distribution Plan | | | 0.25 | % | | | 0.75 | % | | | 0.75 | % | | | 0.50 | % | | |
| |
| |
| Service Plan | | | — | | | | 0.25 | | | | 0.25 | | | | — | | | |
| |
| |
| | |
| * | | With respect to Class A and Class R Shares, the Distributor at its discretion may use compensation for distribution services paid under the Distribution Plan to compensate service organizations for personal and account maintenance services and expenses as long as such total compensation does not exceed the maximum cap on “service fees” imposed by the Financial Industry Regulatory Authority. |
C. Distribution Agreement — Goldman Sachs, as Distributor of the shares of the Funds pursuant to a Distribution Agreement, may retain a portion of the Class A front end sales charge and Class B and Class C CDSC. During the six months ended September 30, 2011, Goldman Sachs advised that it retained front end sales charges of $7,300, $50,200, $800 and $13,000 for the Emerging Markets Debt, High Yield, Investment Grade Credit and Local Emerging Markets Debt Funds, respectively. Goldman Sachs retained no contingent deferred sales charges.
D. Service Plan and Shareholder Administration Plan — The Trust, on behalf of each Fund that offers Service Shares, has adopted a Service Plan and a Shareholder Administration Plan. These plans allow service organizations to provide varying levels of personal and account maintenance and shareholder administration services to their customers who are beneficial owners of such
GOLDMAN SACHS SINGLE SECTOR FIXED INCOME FUNDS
| |
| 5. AGREEMENTS AND AFFILIATED TRANSACTIONS (continued) | |
shares. The Service Plan and Shareholder Administration Plan each provide for compensation to the service organizations which is accrued daily and paid monthly at an annual rate of 0.25% (0.50% in aggregate) of the average daily net assets of the Service Shares.
E. Transfer Agency Agreement — Goldman Sachs also serves as the transfer agent of the Funds for a fee pursuant to a Transfer Agency Agreement. The fees charged for such transfer agency services are accrued daily and paid monthly at an annual rate as follows: 0.13% of the average daily net assets for Class A, Class B, Class C, Class IR and Class R Shares and 0.04% of the average daily net assets for Institutional, Separate Account Institutional and Service Shares.
F. Other Expense Agreements and Affiliated Transactions — GSAM has agreed to limit certain “Other Expense” of the Funds (excluding management fees, distribution and service fees, transfer agent fees and expenses, service fees and shareholder administration fees (as applicable), account service fees, taxes, interest, brokerage fees and litigation, indemnification, shareholder meetings and other extraordinary expenses, exclusive of any custody and transfer agent fee credit reductions) to the extent such expenses exceed, on an annual basis, a percentage rate of the average daily net assets of each Fund. Such Other Expense reimbursements, if any, are accrued daily and paid monthly. In addition, the Funds are not obligated to reimburse GSAM for prior fiscal year expense reimbursements, if any. The Other Expense limitations for the Emerging Markets Debt, High Yield, High Yield Floating Rate, Investment Grade Credit, Local Emerging Markets Debt and U.S. Mortgages Funds, as an annual percentage rate of average daily net assets, are 0.044%, 0.024%, 0.104%, 0.004%, 0.074% and 0.004%, respectively. These Other Expense reimbursements will remain in place through at least July 29, 2012 and prior to such date GSAM may not terminate the arrangements without the approval of the trustees. In addition, the Funds have entered into certain offset arrangements with the custodian and the transfer agent, which may result in a reduction of the Funds’ expenses.
For the six months ended September 30, 2011, these expense reductions, including any fee waivers and Other Expense reimbursements, were as follows (in thousands):
| | | | | | | | | | | | | | | | | |
| | | | | | | Other
| | Total
|
| | | Management
| | Custody Fee
| | Expense
| | Expense
|
| Fund | | Fee Waivers | | Credits | | Reimbursements | | Reductions |
| |
| Emerging Markets Debt | | $ | — | | | $ | 1 | | | $ | 167 | | | $ | 168 | |
| |
| |
| High Yield Floating Rate | | | — | | | | 7 | | | | 153 | | | | 160 | |
| |
| |
| Investment Grade Credit | | | 188 | | | | 1 | | | | 195 | | | | 384 | |
| |
| |
| Local Emerging Markets Debt | | | 511 | | | | 2 | | | | 434 | | | | 947 | |
| |
| |
| U.S. Mortgages | | | 135 | | | | 1 | | | | 257 | | | | 393 | |
| |
| |
GOLDMAN SACHS SINGLE SECTOR FIXED INCOME FUNDS
Notes to Financial Statements (continued)
September 30, 2011 (Unaudited)
| |
| 5. AGREEMENTS AND AFFILIATED TRANSACTIONS (continued) | |
As of September 30, 2011, the amounts owed to affiliates of the Funds were as follows (in thousands):
| | | | | | | | | | | | | | | | | |
| | | Management
| | Distribution and
| | Transfer
| | |
| Fund | | Fees | | Service Fees | | Agent Fees | | Total |
| |
| Emerging Markets Debt | | $ | 417 | | | $ | 56 | | | $ | 34 | | | $ | 507 | |
| |
| |
| High Yield | | | 2,440 | | | | 261 | | | | 212 | | | | 2,913 | |
| |
| |
| High Yield Floating Rate | | | 296 | | | | — | | | | 20 | | | | 316 | |
| |
| |
| Investment Grade Credit | | | 143 | | | | 29 | | | | 28 | | | | 200 | |
| |
| |
| Local Emerging Markets Debt | | | 1,190 | | | | 184 | | | | 123 | | | | 1,497 | |
| |
| |
| U.S. Mortgages | | | 101 | | | | 1 | | | | 13 | | | | 115 | |
| |
| |
G. Line of Credit Facility — As of September 30, 2011, the Funds participated in a $580,000,000 committed, unsecured revolving line of credit facility (the “facility”) together with other funds of the Trust and registered investment companies having management agreements with GSAM or its affiliates. Pursuant to the terms of the facility, the Funds and other borrowers could increase the credit amount by an additional $340,000,000, for a total of up to $920,000,000. This facility is to be used solely for temporary or emergency purposes. The interest rate on borrowings is based on the federal funds rate. The facility also requires a fee to be paid by the Funds based on the amount of the commitment that has not been utilized. For the six months ended September 30, 2011, the Funds did not have any borrowings under the facility.
H. Other Transactions with Affiliates — For the six months ended September 30, 2011, Goldman Sachs earned approximately $13,000, $21,800, and $15,600 in brokerage commissions from portfolio transactions, including futures transactions executed with Goldman Sachs as the Futures Commission Merchant, executed on behalf of Emerging Markets Debt, Investment Grade Credit and U.S. Mortgages Funds, respectively.
As of September 30, 2011, the Goldman Sachs Satellite Strategies Portfolio was the beneficial owner of 24%, 20% and 8% of total outstanding shares of the Emerging Markets Debt, High Yield Floating Rate and Local Emerging Markets Debt Funds, respectively.
As of September 30, 2011, Goldman Sachs Group, Inc. was the beneficial owner of approximately 5%, 5% and 100% of the Class C, Class IR and Class R Shares, respectively, of the High Yield Floating Rate Fund, 100% of the Class IR Shares of the Investment Grade Credit Fund, and 100% of the Class IR Shares of the U.S. Mortgages Fund.
GOLDMAN SACHS SINGLE SECTOR FIXED INCOME FUNDS
| |
| 6. PORTFOLIO SECURITIES TRANSACTIONS | |
The cost of purchases and proceeds from sales and maturities of long-term securities for the six months ended September 30, 2011, were as follows:
| | | | | | | | | | | | | | | | | |
| | | | | | | Sales and
| | Sales and
|
| | | Purchases of
| | Purchases (Excluding
| | Maturities of
| | Maturities (Excluding
|
| | | U.S. Government and
| | U.S. Government and
| | U.S. Government and
| | U.S. Government and
|
| Fund | | Agency Obligations | | Agency Obligations) | | Agency Obligations | | Agency Obligations) |
| |
| Emerging Markets Debt | | $ | — | | | $ | 304,627,596 | | | $ | — | | | $ | 253,946,017 | |
| |
| |
| High Yield | | | — | | | | 1,357,809,208 | | | | — | | | | 2,139,476,766 | |
| |
| |
| High Yield Floating Rate | | | — | | | | 692,551,635 | | | | — | | | | 148,424,163 | |
| |
| |
| Investment Grade Credit | | | 33,477,344 | | | | 251,795,359 | | | | 21,026,554 | | | | 293,287,457 | |
| |
| |
| Local Emerging Markets Debt | | | — | | | | 1,954,395,628 | | | | — | | | | 2,034,855,901 | |
| |
| |
| U.S. Mortgages | | | 2,952,839,445 | | | | 14,050,180 | | | | 2,989,489,023 | | | | 28,712,904 | |
| |
| |
As of the Funds’ most recent fiscal year end, March 31, 2011, the Funds’ capital loss carryforwards and certain timing differences, on a tax basis were as follows:
| | | | | | | | | | | | | | | | | | | | | | | | | |
| | | | | | | | | | | Local
| | |
| | | Emerging
| | | | High Yield
| | Investment
| | Emerging
| | |
| | | Markets Debt | | High Yield | | Floating Rate | | Grade Credit | | Markets Debt | | U.S. Mortgages |
| |
Capital loss carryforward(1)
Expiring 2018 | | $ | — | | | $ | (56,060,643 | ) | | $ | — | | | $ | — | | | $ | — | | | $ | (15,533,099 | ) |
| |
| |
| Timing differences (Post-October Losses, Income Distribution Payable and Straddle Losses) | | $ | (8,115,944 | ) | | $ | (6,290,438 | ) | | $ | (2,218 | ) | | $ | (677,474 | ) | | $ | (32,911,486 | ) | | $ | (115,453 | ) |
| |
| |
| | |
| (1) | | Expiration occurs on March 31 of the year indicated. |
As of September 30, 2011, the Funds’ aggregate security unrealized gains and losses based on cost for U.S. federal income tax purposes were as follows:
| | | | | | | | | | | | | | | | | | | | | | | | | |
| | | | | | | | | | | Local
| | |
| | | Emerging
| | | | High Yield
| | Investment
| | Emerging
| | |
| | | Markets Debt | | High Yield | | Floating Rate | | Grade Credit | | Markets Debt | | U.S. Mortgages |
| |
| Tax Cost | | $ | 620,270,041 | | | $ | 4,630,454,121 | | | $ | 640,032,976 | | | $ | 483,024,982 | | | $ | 1,714,242,380 | | | $ | 516,688,996 | |
| |
| |
| Gross unrealized gain | | | 11,494,469 | | | | 72,013,559 | | | | 372,050 | | | | 18,625,681 | | | | 26,878,915 | | | | 9,375,111 | |
| |
| |
| Gross unrealized loss | | | (28,788,715 | ) | | | (362,734,849 | ) | | | (21,208,051 | ) | | | (8,893,182 | ) | | | (122,231,897 | ) | | | (5,701,703 | ) |
| |
| |
| Net unrealized security gain (loss) | | $ | (17,294,246 | ) | | $ | (290,721,290 | ) | | $ | (20,836,001 | ) | | $ | 9,732,499 | | | $ | (95,352,982 | ) | | $ | 3,673,408 | |
| |
| |
The difference between GAAP-basis and tax-basis unrealized gains (losses), as of the most recent fiscal year end, is attributable primarily to net mark-to-market gains (losses) on regulated futures contracts and foreign currency exchange contracts, wash sales, and differences related to the tax treatment of swap transactions.
GOLDMAN SACHS SINGLE SECTOR FIXED INCOME FUNDS
Notes to Financial Statements (continued)
September 30, 2011 (Unaudited)
| |
| 7. TAX INFORMATION (continued) | |
GSAM has reviewed the Funds’ tax positions for all open tax years (the current and prior three years, as applicable) and has concluded that no provision for income tax is required in the Funds’ financial statements. Such open tax years remain subject to examination and adjustment by tax authorities.
Under the recently enacted Regulated Investment Company Modernization Act of 2010, the Funds will be permitted to carry forward capital losses incurred in taxable years beginning after December 22, 2010 for an unlimited period. However, any losses incurred during those future taxable years will be required to be utilized prior to the losses incurred in pre-enactment taxable years. As a result of this ordering rule, pre-enactment capital loss carryforwards may be more likely to expire unused. Additionally, post-enactment capital losses that are carried forward will retain their character as either short-term or long-term capital losses rather than being considered all short-term as under previous law.
The Fund’s risks include, but are not limited to, the following:
Foreign Custody Risk — A Fund that invests in foreign securities may hold such securities and foreign currency with foreign banks, agents, and securities depositories appointed by the Fund’s custodian (each a “Foreign Custodian”). In some countries, Foreign Custodians may be subject to little or no regulatory oversight or independent evaluation of their operations. Further, the laws of certain countries may place limitations on the Fund’s ability to recover its assets if a Foreign Custodian enters into bankruptcy. Investments in emerging markets may be subject to greater custody risks than investments in more developed markets. Custody services in emerging market countries are often undeveloped and may be less regulated than in more developed countries, and thus may not afford the same level of investor protection as would apply in developed countries.
Funds’ Shareholder Concentration Risk — Certain funds, accounts, individuals or Goldman Sachs affiliates may from time to time own (beneficially or of record) or control a significant percentage of the Funds’ shares. Redemptions by these entities of their holdings in the Funds may impact the Funds’ liquidity and NAV. These redemptions may also force the Funds to sell securities.
Liquidity Risk — The Funds may make investments that may be illiquid or that may become less liquid in response to market developments or adverse investor perceptions. Liquidity risk may also refer to the risk that a Fund will not be able to pay redemption proceeds within the allowable time period because of unusual market conditions, an unusually high volume of redemption requests, or other reasons. To meet redemption requests, a Fund may be forced to sell investments at an unfavorable time and/or under unfavorable conditions.
Market and Credit Risks — In the normal course of business, the Funds trade financial instruments and enter into financial transactions where risk of potential loss exists due to changes in the market (market risk). Additionally, the Funds may also be exposed to credit risk in the event that an issuer fails to perform or that an institution or entity with which the Funds have unsettled or open transaction defaults.
Investing in foreign markets may involve special risks and considerations not typically associated with investing in the U.S. These risks include revaluation of currencies, high rates of inflation, repatriation restrictions on income and capital, and adverse political and economic developments. Moreover, securities issued in these markets may be less liquid, be subject to government ownership controls, have delayed settlements and their prices may be more volatile than those of comparable securities in the U.S.
Portfolio Concentration Risk — As a result of certain of the Funds’ ability to invest a large percentage of their assets in obligations of issuers within the same country, state, region, currency or economic sector, an adverse economic, business or political development may affect the value of the Funds’ investments more than if their investments were not so concentrated.
Redemption Proceeds Risk — The High Yield Floating Rate Fund may at times purchase securities with settlement periods that are longer than the time period required to pay redemption proceeds. In unusual circumstances, the High Yield Floating Rate Fund may pay redemption proceeds up to seven calendar days following receipt of a properly executed redemption request.
GOLDMAN SACHS SINGLE SECTOR FIXED INCOME FUNDS
Under the Trust’s organizational documents, its trustees, officers, employees and agents are indemnified, to the extent permitted by the Act, against certain liabilities that may arise out of performance of their duties to the Funds. Additionally, in the course of business, the Funds enter into contracts that contain a variety of indemnification clauses. The Funds’ maximum exposure under these arrangements is unknown, as this would involve future claims that may be made against the Funds that have not yet occurred. However, GSAM believes the risk of loss under these arrangements to be remote.
Subsequent events after the balance sheet date have been evaluated through the date the financial statements were issued. GSAM has concluded that there is no impact requiring adjustment or disclosure in the financial statements.
GOLDMAN SACHS SINGLE SECTOR FIXED INCOME FUNDS
Notes to Financial Statements (continued)
September 30, 2011 (Unaudited)
| |
| 11. SUMMARY OF SHARE TRANSACTIONS | |
Share activity is as follows:
| | | | | | | | | | | | | | | | | |
| | | Emerging Markets Debt Fund |
| | | |
| | | For the Six Months Ended
| | | | |
| | | September 30, 2011
| | For the Fiscal Year Ended
|
| | | (Unaudited) | | March 31, 2011 |
| | | |
| | | Shares | | Dollars | | Shares | | Dollars |
| | | |
Class A Shares | | | | | | | | | | | | | | | | |
| Shares sold | | | 3,101,062 | | | $ | 39,002,963 | | | | 14,815,845 | | | $ | 184,630,940 | |
| Reinvestment of distributions | | | 264,851 | | | | 3,319,667 | | | | 672,290 | | | | 8,315,102 | |
Shares converted from Class B(a) | | | — | | | | — | | | | — | | | | — | |
| Shares redeemed | | | (4,124,584 | ) | | | (51,701,591 | ) | | | (11,496,565 | ) | | | (142,153,661 | ) |
| |
| |
| | | | (758,671 | ) | | | (9,378,961 | ) | | | 3,991,570 | | | | 50,792,381 | |
| |
| |
Class B Shares | | | | | | | | | | | | | | | | |
| Shares sold | | | — | | | | — | | | | — | | | | — | |
| Reinvestment of distributions | | | — | | | | — | | | | — | | | | — | |
Shares converted to Class A(a) | | | — | | | | — | | | | — | | | | — | |
| Shares redeemed | | | — | | | | — | | | | — | | | | — | |
| |
| |
| | | | — | | | | — | | | | — | | | | — | |
| |
| |
Class C Shares | | | | | | | | | | | | | | | | |
| Shares sold | | | 329,132 | | | | 4,133,345 | | | | 2,068,578 | | | | 26,021,001 | |
| Reinvestment of distributions | | | 31,295 | | | | 391,948 | | | | 58,170 | | | | 718,020 | |
| Shares redeemed | | | (472,880 | ) | | | (5,923,241 | ) | | | (471,041 | ) | | | (5,791,011 | ) |
| |
| |
| | | | (112,453 | ) | | | (1,397,948 | ) | | | 1,655,707 | | | | 20,948,010 | |
| |
| |
Institutional Shares | | | | | | | | | | | | | | | | |
| Shares sold | | | 7,708,260 | | | | 96,657,288 | | | | 22,334,454 | | | | 278,628,263 | |
| Shares sold in connection with in-kind | | | — | | | | — | | | | 960,393 | | | | 12,379,470 | |
| Reinvestment of distributions | | | 795,092 | | | | 9,973,659 | | | | 1,615,428 | | | | 19,977,113 | |
| Shares redeemed | | | (7,325,709 | ) | | | (92,101,816 | ) | | | (12,599,787 | ) | | | (155,147,029 | ) |
| |
| |
| | | | 1,177,643 | | | | 14,529,131 | | | | 12,310,488 | | | | 155,837,817 | |
| |
| |
Service Shares | | | | | | | | | | | | | | | | |
| Shares sold | | | — | | | | — | | | | — | | | | — | |
| Reinvestment of distributions | | | — | | | | — | | | | — | | | | — | |
| Shares redeemed | | | — | | | | — | | | | — | | | | — | |
| |
| |
| | | | — | | | | — | | | | — | | | | — | |
| |
| |
Class IR Shares(b) | | | | | | | | | | | | | | | | |
| Shares sold | | | 311,939 | | | | 3,985,185 | | | | 135,835 | | | | 1,734,462 | |
| Reinvestment of distributions | | | 4,343 | | | | 54,169 | | | | 3,711 | | | | 46,034 | |
| Shares redeemed | | | (197,326 | ) | | | (2,428,139 | ) | | | (26,289 | ) | | | (324,980 | ) |
| |
| |
| | | | 118,956 | | | | 1,611,215 | | | | 113,257 | | | | 1,455,516 | |
| |
| |
Class R Shares | | | | | | | | | | | | | | | | |
| Shares sold | | | — | | | | — | | | | — | | | | — | |
| Reinvestment of distributions | | | — | | | | — | | | | — | | | | — | |
| Shares redeemed | | | — | | | | — | | | | — | | | | — | |
| |
| |
| | | | — | | | | — | | | | — | | | | — | |
| |
| |
NET INCREASE (DECREASE) | | | 425,475 | | | $ | 5,363,437 | | | | 18,071,022 | | | $ | 229,033,724 | |
| |
| |
| | |
| * | | Commenced operations on March 31, 2011. |
| (a) | | Class B Shares automatically convert into Class A Shares on or about the fifteenth day of the last month of the calendar quarter that is eight years after the initial purchase date of either the Fund or another Goldman Sachs Fund. |
| (b) | | Commenced operations on July 30, 2010 for Emerging Markets Debt Fund. |
GOLDMAN SACHS SINGLE SECTOR FIXED INCOME FUNDS
| | | | | | | | | | | | | | | | | | | | | | | | | | | | | | | |
| High Yield Fund | | High Yield Floating Rate Fund |
| |
For the Six Months Ended
| | | | For the Six Months Ended
| | |
September 30, 2011
| | For the Fiscal Year Ended
| | September 30, 2011
| | For the Period Ended
|
| (Unaudited) | | March 31, 2011 | | (Unaudited) | | March 31, 2011* |
| |
| Shares | | Dollars | | Shares | | Dollars | | Shares | | Dollars | | Shares | | Dollars |
| |
| | | | | | | | | | | | | | | | | | | | | | | | | | | | | | | |
| | 10,079,648 | | | $ | 72,866,616 | | | | 41,219,550 | | | $ | 294,253,360 | | | | 185,451 | | | $ | 1,836,193 | | | | 1,000 | | | $ | 10,000 | |
| | 3,615,306 | | | | 25,941,774 | | | | 10,105,443 | | | | 72,189,098 | | | | 1,219 | | | | 11,897 | | | | — | | | | — | |
| | 229,546 | | | | 1,637,561 | | | | 454,133 | | | | 3,240,387 | | | | — | | | | — | | | | — | | | | — | |
| | (30,722,592 | ) | | | (220,510,391 | ) | | | (124,552,903 | ) | | | (886,384,349 | ) | | | (90,127 | ) | | | (877,689 | ) | | | — | | | | — | |
| |
| |
| | (16,798,092 | ) | | | (120,064,440 | ) | | | (72,773,777 | ) | | | (516,701,504 | ) | | | 96,543 | | | | 970,401 | | | | 1,000 | | | | 10,000 | |
| |
| |
| | | | | | | | | | | | | | | | | | | | | | | | | | | | | | | |
| | 95,551 | | | | 695,626 | | | | 345,573 | | | | 2,495,184 | | | | — | | | | — | | | | — | | | | — | |
| | 154,812 | | | | 1,113,512 | | | | 416,369 | | | | 2,988,900 | | | | — | | | | — | | | | — | | | | — | |
| | (229,097 | ) | | | (1,637,561 | ) | | | (453,073 | ) | | | (3,240,387 | ) | | | — | | | | — | | | | — | | | | — | |
| | (1,093,129 | ) | | | (7,847,999 | ) | | | (2,732,073 | ) | | | (19,604,025 | ) | | | — | | | | — | | | | — | | | | — | |
| |
| |
| | (1,071,863 | ) | | | (7,676,422 | ) | | | (2,423,204 | ) | | | (17,360,328 | ) | | | — | | | | — | | | | — | | | | — | |
| |
| |
| | | | | | | | | | | | | | | | | | | | | | | | | | | | | | | |
| | 1,259,726 | | | | 9,152,025 | | | | 3,391,626 | | | | 24,471,194 | | | | 19,383 | | | | 190,896 | | | | 1,000 | | | | 10,000 | |
| | 356,789 | | | | 2,558,463 | | | | 748,416 | | | | 5,376,107 | | | | 132 | | | | 1,279 | | | | — | | | | — | |
| | (2,126,389 | ) | | | (15,364,758 | ) | | | (4,422,132 | ) | | | (31,748,230 | ) | | | (84 | ) | | | (812 | ) | | | — | | | | — | |
| |
| |
| | (509,874 | ) | | | (3,654,270 | ) | | | (282,090 | ) | | | (1,900,929 | ) | | | 19,431 | | | | 191,363 | | | | 1,000 | | | | 10,000 | |
| |
| |
| | | | | | | | | | | | | | | | | | | | | | | | | | | | | | | |
| | 89,468,268 | | | | 629,945,318 | | | | 229,369,841 | | | | 1,648,964,273 | | | | 61,861,127 | | | | 613,065,476 | | | | 11,887,892 | | | | 118,878,916 | |
| | — | | | | — | | | | — | | | | — | | | | — | | | | — | | | | — | | | | — | |
| | 18,526,963 | | | | 133,174,462 | | | | 31,509,914 | | | | 227,309,234 | | | | 842,024 | | | | 8,181,458 | | | | — | | | | — | |
| | (169,130,979 | ) | | | (1,233,859,232 | ) | | | (311,140,858 | ) | | | (2,237,104,992 | ) | | | (12,492,061 | ) | | | (120,387,148 | ) | | | — | | | | — | |
| |
| |
| | (61,135,748 | ) | | | (470,739,452 | ) | | | (50,261,103 | ) | | | (360,831,485 | ) | | | 50,211,090 | | | | 500,859,786 | | | | 11,887,892 | | | | 118,878,916 | |
| |
| |
| | | | | | | | | | | | | | | | | | | | | | | | | | | | | | | |
| | 354,246 | | | | 2,566,976 | | | | 1,225,575 | | | | 8,905,028 | | | | — | | | | — | | | | — | | | | — | |
| | 100,362 | | | | 719,184 | | | | 190,344 | | | | 1,365,282 | | | | — | | | | — | | | | — | | | | — | |
| | (712,357 | ) | | | (5,065,981 | ) | | | (1,475,831 | ) | | | (10,560,807 | ) | | | — | | | | — | | | | — | | | | — | |
| |
| |
| | (257,749 | ) | | | (1,779,821 | ) | | | (59,912 | ) | | | (290,497 | ) | | | — | | | | — | | | | — | | | | — | |
| |
| |
| | | | | | | | | | | | | | | | | | | | | | | | | | | | | | | |
| | 4,636,046 | | | | 33,482,146 | | | | 348,924 | | | | 2,532,450 | | | | 103,469 | | | | 1,011,408 | | | | 1,000 | | | | 10,000 | |
| | 87,519 | | | | 610,112 | | | | 17,187 | | | | 124,552 | | | | 615 | | | | 5,900 | | | | — | | | | — | |
| | (453,086 | ) | | | (3,175,574 | ) | | | (60,258 | ) | | | (438,997 | ) | | | (83,917 | ) | | | (802,246 | ) | | | — | | | | — | |
| |
| |
| | 4,270,479 | | | | 30,916,684 | | | | 305,853 | | | | 2,218,005 | | | | 20,167 | | | | 215,062 | | | | 1,000 | | | | 10,000 | |
| |
| |
| | | | | | | | | | | | | | | | | | | | | | | | | | | | | | | |
| | 457,576 | | | | 3,292,903 | | | | 1,250,401 | | | | 8,943,082 | | | | — | | | | — | | | | 1,000 | | | | 10,000 | |
| | 68,812 | | | | 491,777 | | | | 97,882 | | | | 705,378 | | | | 12 | | | | 120 | | | | — | | | | — | |
| | (183,113 | ) | | | (1,341,810 | ) | | | (314,449 | ) | | | (2,266,581 | ) | | | — | | | | — | | | | — | | | | — | |
| |
| |
| | 343,275 | | | | 2,442,870 | | | | 1,033,834 | | | | 7,381,879 | | | | 12 | | | | 120 | | | | 1,000 | | | | 10,000 | |
| |
| |
| | (75,159,572 | ) | | $ | (570,554,851 | ) | | | (124,460,399 | ) | | $ | (887,484,859 | ) | | | 50,347,243 | | | $ | 502,236,732 | | | | 11,891,892 | | | $ | 118,918,916 | |
| |
| |
GOLDMAN SACHS SINGLE SECTOR FIXED INCOME FUNDS
Notes to Financial Statements (continued)
September 30, 2011 (Unaudited)
| |
| 11. SUMMARY OF SHARE TRANSACTIONS (continued) | |
Share activity is as follows:
| | | | | | | | | | | | | | | | | |
| | | Investment Grade Credit Fund |
| | | |
| | | For the Six Months Ended
| | |
| | | September 30, 2011
| | For the Fiscal Year Ended
|
| | | (Unaudited) | | March 31, 2011 |
| | | |
| | | Shares | | Dollars | | Shares | | Dollars |
| | | |
Class A Shares | | | | | | | | | | | | | | | | |
| Shares sold | | | 1,453,165 | | | $ | 14,162,282 | | | | 7,098,036 | | | $ | 66,870,284 | |
| Reinvestment of distributions | | | 295,168 | | | | 2,878,678 | | | | 582,258 | | | | 5,521,285 | |
| Shares redeemed | | | (2,909,429 | ) | | | (28,344,742 | ) | | | (10,482,204 | ) | | | (99,407,482 | ) |
| |
| |
| | | | (1,161,096 | ) | | | (11,303,782 | ) | | | (2,801,910 | ) | | | (27,015,913 | ) |
| |
| |
Class C Shares | | | | | | | | | | | | | | | | |
| Shares sold | | | — | | | | — | | | | — | | | | — | |
| Reinvestment of distributions | | | — | | | | — | | | | — | | | | — | |
| Shares redeemed | | | — | | | | — | | | | — | | | | — | |
| |
| |
| | | | — | | | | — | | | | — | | | | — | |
| |
| |
Institutional Shares | | | | | | | | | | | | | | | | |
| Shares sold | | | 2,997,595 | | | | 29,112,868 | | | | 6,907,225 | | | | 65,644,703 | |
| Reinvestment of distributions | | | 313,255 | | | | 3,056,957 | | | | 604,610 | | | | 5,733,908 | |
| Shares redeemed | | | (3,001,282 | ) | | | (29,086,268 | ) | | | (13,301,131 | ) | | | (125,565,455 | ) |
| |
| |
| | | | 309,568 | | | | 3,083,557 | | | | (5,789,296 | ) | | | (54,186,844 | ) |
| |
| |
Separate Account Institutional Shares | | | | | | | | | | | | | | | | |
| Shares sold | | | 880,231 | | | | 8,580,584 | | | | 4,111,626 | | | | 38,390,581 | |
| Shares sold in connection with in-kind | | | — | | | | — | | | | 1,874,056 | | | | 18,159,598 | |
| Reinvestment of distributions | | | 458,353 | | | | 4,472,617 | | | | 1,086,032 | | | | 10,293,339 | |
| Shares redeemed | | | (4,938,613 | ) | | | (47,843,598 | ) | | | (9,255,799 | ) | | | (88,334,674 | ) |
| |
| |
| | | | (3,600,029 | ) | | | (34,790,397 | ) | | | (2,184,085 | ) | | | (21,491,156 | ) |
| |
| |
Class IR Shares(a) | | | | | | | | | | | | | | | | |
| Shares sold | | | 101 | | | | 1,000 | | | | — | | | | — | |
| Reinvestment of distributions | | | 1 | | | | 7 | | | | — | | | | — | |
| Shares redeemed | | | — | | | | — | | | | — | | | | — | |
| |
| |
| | | | 102 | | | | 1,007 | | | | — | | | | — | |
| |
| |
NET INCREASE (DECREASE) | | | (4,451,455 | ) | | $ | (43,009,615 | ) | | | (10,775,291 | ) | | $ | (102,693,913 | ) |
| |
| |
| | |
| (a) | | Commenced operations on July 29, 2011 for Investment Grade Credit Fund and U.S. Mortgages Fund, and on July 30, 2010 for Local Emerging Markets Debt Fund. |
GOLDMAN SACHS SINGLE SECTOR FIXED INCOME FUNDS
| | | | | | | | | | | | | | | | | | | | | | | | | | | | | | | |
| Local Emerging Markets Debt Fund | | U.S. Mortgages Fund |
| |
For the Six Months Ended
| | | | For the Six Months Ended
| | |
September 30, 2011
| | For the Fiscal Year Ended
| | September 30, 2011
| | For the Fiscal Year Ended
|
| (Unaudited) | | March 31, 2011 | | (Unaudited) | | March 31, 2011 |
| |
| Shares | | Dollars | | Shares | | Dollars | | Shares | | Dollars | | Shares | | Dollars |
| |
| | | | | | | | | | | | | | | | | | | | | | | | | | | | | | | |
| | 23,215,584 | | | $ | 227,815,860 | | | | 91,215,090 | | | $ | 866,253,565 | | | | 18,565 | | | $ | 193,932 | | | | 80,973 | | | $ | 828,319 | |
| | 2,170,979 | | | | 21,163,404 | | | | 5,967,917 | | | | 56,509,291 | | | | 4,353 | | | | 45,321 | | | | 17,296 | | | | 175,948 | |
| | (48,868,945 | ) | | | (472,815,909 | ) | | | (32,162,288 | ) | | | (307,547,367 | ) | | | (76,854 | ) | | | (793,291 | ) | | | (838,530 | ) | | | (8,533,503 | ) |
| |
| |
| | (23,482,382 | ) | | | (223,836,645 | ) | | | 65,020,719 | | | | 615,215,489 | | | | (53,936 | ) | | | (554,038 | ) | | | (740,261 | ) | | | (7,529,236 | ) |
| |
| |
| | | | | | | | | | | | | | | | | | | | | | | | | | | | | | | |
| | 633,620 | | | | 6,225,788 | | | | 1,688,565 | | | | 16,232,456 | | | | — | | | | — | | | | — | | | | — | |
| | 28,894 | | | | 280,274 | | | | 52,037 | | | | 495,055 | | | | — | | | | — | | | | — | | | | — | |
| | (196,026 | ) | | | (1,896,088 | ) | | | (100,596 | ) | | | (953,946 | ) | | | — | | | | — | | | | — | | | | — | |
| |
| |
| | 466,488 | | | | 4,609,974 | | | | 1,640,006 | | | | 15,773,565 | | | | — | | | | — | | | | — | | | | — | |
| |
| |
| | | | | | | | | | | | | | | | | | | | | | | | | | | | | | | |
| | 36,614,627 | | | | 356,351,934 | | | | 82,559,582 | | | | 788,163,926 | | | | 67,091 | | | | 700,192 | | | | 684,191 | | | | 6,969,149 | |
| | 2,413,086 | | | | 23,493,173 | | | | 5,452,357 | | | | 51,639,964 | | | | 29,075 | | | | 301,849 | | | | 131,840 | | | | 1,345,199 | |
| | (43,180,959 | ) | | | (416,916,168 | ) | | | (19,290,664 | ) | | | (182,204,972 | ) | | | (4,240,923 | ) | | | (44,053,281 | ) | | | (1,812,993 | ) | | | (18,471,172 | ) |
| |
| |
| | (4,153,246 | ) | | | (37,071,061 | ) | | | 68,721,275 | | | | 657,598,918 | | | | (4,144,757 | ) | | | (43,051,240 | ) | | | (996,962 | ) | | | (10,156,824 | ) |
| |
| |
| | | | | | | | | | | | | | | | | | | | | | | | | | | | | | | |
| | — | | | | — | | | | — | | | | — | | | | 6,077,832 | | | | 63,137,674 | | | | 22,958,991 | | | | 234,242,414 | |
| | — | | | | — | | | | — | | | | — | | | | — | | | | — | | | | 569,435 | | | | 5,870,871 | |
| | — | | | | — | | | | — | | | | — | | | | 277,590 | | | | 2,891,207 | | | | 794,358 | | | | 8,099,533 | |
| | — | | | | — | | | | — | | | | — | | | | (6,684,280 | ) | | | (68,792,199 | ) | | | (27,116,097 | ) | | | (276,463,215 | ) |
| |
| |
| | — | | | | — | | | | — | | | | — | | | | (328,858 | ) | | | (2,763,318 | ) | | | (2,793,313 | ) | | | (28,250,397 | ) |
| |
| |
| | | | | | | | | | | | | | | | | | | | | | | | | | | | | | | |
| | 1,514,359 | | | | 14,823,723 | | | | 990,493 | | | | 9,617,333 | | | | 96 | | | | 1,004 | | | | — | | | | — | |
| | 28,698 | | | | 274,990 | | | | 29,846 | | | | 283,510 | | | | — | | | | — | | | | — | | | | — | |
| | (763,128 | ) | | | (6,936,615 | ) | | | (160,700 | ) | | | (1,537,108 | ) | | | — | | | | — | | | | — | | | | — | |
| |
| |
| | 779,929 | | | | 8,162,098 | | | | 859,639 | | | | 8,363,735 | | | | 96 | | | | 1,004 | | | | — | | | | — | |
| |
| |
| | (26,389,211 | ) | | $ | (248,135,634 | ) | | | 136,241,639 | | | $ | 1,296,951,707 | | | | (4,527,455 | ) | | $ | (46,367,592 | ) | | | (4,530,536 | ) | | $ | (45,936,457 | ) |
| |
| |
GOLDMAN SACHS SINGLE SECTOR FIXED INCOME FUNDS
Fund Expenses — Six Month Period Ended September 30, 2011 (Unaudited)
As a shareholder of Class A, Class B, Class C, Institutional, Service, Separate Account Institutional, Class IR or Class R Shares of a Fund, you incur two types of costs: (1) transaction costs, including sales charges on purchase payments (with respect to Class A Shares), contingent deferred sales charges on redemptions (with respect to Class B and Class C Shares), and redemption fees (if any); and (2) ongoing costs, including management fees; distribution and service (12b-1) fees (with respect to Class A, Class B, Class C and Class R Shares); and other Fund expenses. This Example is intended to help you understand your ongoing costs (in dollars) of investing in Class A, Class B, Class C, Institutional, Service, Separate Account Institutional, Class IR or Class R Shares of the Funds and to compare these costs with the ongoing costs of investing in other mutual funds.
The Example is based on an investment of $1,000 invested at the beginning of the period and held for the entire period from April 1, 2011 through September 30, 2011.
Actual Expenses — The first line under each share class in the table below provides information about actual account values and actual expenses. You may use the information in this line, together with the amount you invested, to estimate the expenses that you paid over the period. Simply divide your account value by $1,000 (for example, an $8,600 account value divided by $1,000=8.6), then multiply the result by the number in the first line under the heading entitled “Expenses Paid” to estimate the expenses you paid on your account during this period.
Hypothetical Example for Comparison Purposes — The second line under each share class in the table below provides information about hypothetical account values and hypothetical expenses based on the Funds’ actual net expense ratios and an assumed rate of return of 5% per year before expenses, which is not the Funds’ actual return. The hypothetical account values and expenses may not be used to estimate the actual ending account balance or expenses you paid for the period. You may use this information to compare the ongoing costs of investing in the Funds and other funds. To do so, compare this 5% hypothetical example with the 5% hypothetical examples that appear in the shareholder reports of the other funds.
Please note that the expenses shown in the table are meant to highlight your ongoing costs only and do not reflect any transactional costs, such as sales charges, redemption fees, or exchange fees. Therefore, the second line of the table is useful in comparing ongoing costs only, and will not help you determine the relative total costs of owning different funds. In addition, if these transactional costs were included, your costs would have been higher.
| | | | | | | | | | | | | | | | | | | | | | | | | | | | | | | | | | | | | | | | | | | | | | |
| | | | Emerging Markets Debt Fund | | | High Yield Fund | | | High Yield Floating Rate Fund |
| | | | | | | | | | Expenses
| | | | | | | | | Expenses
| | | | | | | | | Expenses
|
| | | | Beginning
| | | Ending
| | | Paid for the
| | | Beginning
| | | Ending
| | | Paid for the
| | | Beginning
| | | Ending
| | | Paid for the
|
| | | | Account Value
| | | Account Value
| | | 6 months ended
| | | Account Value
| | | Account Value
| | | 6 months ended
| | | Account Value
| | | Account Value
| | | 6 months ended
|
| Share Class | | | 4/1/11 | | | 9/30/11 | | | 9/30/11* | | | 4/1/11 | | | 9/30/11 | | | 9/30/11* | | | 4/1/11 | | | 9/30/11 | | | 9/30/11* |
Class A | | | | | | | | | | | | | | | | | | | | | | | | | | | | | | | | | | | | | | | | | | | | | |
| Actual | | | $ | 1,000.00 | | | | $ | 1,004.80 | | | | $ | 6.11 | | | | $ | 1,000.00 | | | | $ | 929.00 | | | | $ | 5.11 | | | | $ | 1,000.00 | | | | $ | 964.80 | | | | $ | 5.30 | |
| Hypothetical 5% return | | | | 1,000.00 | | | | | 1,018.90 | + | | | | 6.16 | | | | | 1,000.00 | | | | | 1,019.70 | + | | | | 5.35 | | | | | 1,000.00 | | | | | 1,019.60 | + | | | | 5.45 | |
| |
Class B | | | | | | | | | | | | | | | | | | | | | | | | | | | | | | | | | | | | | | | | | | | | | |
| Actual | | | | N/A | | | | | N/A | | | | | N/A | | | | | 1,000.00 | | | | | 925.80 | | | | | 8.71 | | | | | N/A | | | | | N/A | | | | | N/A | |
| Hypothetical 5% return | | | | N/A | | | | | N/A | | | | | N/A | | | | | 1,000.00 | | | | | 1,015.95 | + | | | | 9.12 | | | | | N/A | | | | | N/A | | | | | N/A | |
| |
Class C | | | | | | | | | | | | | | | | | | | | | | | | | | | | | | | | | | | | | | | | | | | | | |
| Actual | | | | 1,000.00 | | | | | 1,001.00 | | | | | 9.85 | | | | | 1,000.00 | | | | | 925.70 | | | | | 8.71 | | | | | 1,000.00 | | | | | 961.40 | | | | | 8.97 | |
| Hypothetical 5% return | | | | 1,000.00 | | | | | 1,015.15 | + | | | | 9.92 | | | | | 1,000.00 | | | | | 1,015.95 | + | | | | 9.12 | | | | | 1,000.00 | | | | | 1,015.85 | + | | | | 9.22 | |
| |
Institutional | | | | | | | | | | | | | | | | | | | | | | | | | | | | | | | | | | | | | | | | | | | | | |
| Actual | | | | 1,000.00 | | | | | 1,006.50 | | | | | 4.41 | | | | | 1,000.00 | | | | | 930.90 | | | | | 3.48 | | | | | 1,000.00 | | | | | 967.40 | | | | | 3.64 | |
| Hypothetical 5% return | | | | 1,000.00 | | | | | 1,020.60 | + | | | | 4.45 | | | | | 1,000.00 | | | | | 1,021.40 | + | | | | 3.64 | | | | | 1,000.00 | | | | | 1,021.30 | + | | | | 3.74 | |
| |
Service | | | | | | | | | | | | | | | | | | | | | | | | | | | | | | | | | | | | | | | | | | | | | |
| Actual | | | | N/A | | | | | N/A | | | | | N/A | | | | | 1,000.00 | | | | | 928.30 | | | | | 5.88 | | | | | N/A | | | | | N/A | | | | | N/A | |
| Hypothetical 5% return | | | | N/A | | | | | N/A | | | | | N/A | | | | | 1,000.00 | | | | | 1,018.90 | + | | | | 6.16 | | | | | N/A | | | | | N/A | | | | | N/A | |
| |
Separate Account Institutional | | | | | | | | | | | | | | | | | | | | | | | | | | | | | | | | | | | | | | | | | | | | | |
| Actual | | | | N/A | | | | | N/A | | | | | N/A | | | | | N/A | | | | | N/A | | | | | N/A | | | | | N/A | | | | | N/A | | | | | N/A | |
| Hypothetical 5% return | | | | N/A | | | | | N/A | | | | | N/A | | | | | N/A | | | | | N/A | | | | | N/A | | | | | N/A | | | | | N/A | | | | | N/A | |
| |
Class IR | | | | | | | | | | | | | | | | | | | | | | | | | | | | | | | | | | | | | | | | | | | | | |
| Actual | | | | 1,000.00 | | | | | 1,005.20 | | | | | 4.86 | | | | | 1,000.00 | | | | | 931.70 | | | | | 3.91 | | | | | 1,000.00 | | | | | 966.90 | | | | | 4.08 | |
| Hypothetical 5% return | | | | 1,000.00 | | | | | 1,020.15 | + | | | | 4.90 | | | | | 1,000.00 | | | | | 1,020.95 | + | | | | 4.09 | | | | | 1,000.00 | | | | | 1,020.85 | + | | | | 4.19 | |
| |
Class R | | | | | | | | | | | | | | | | | | | | | | | | | | | | | | | | | | | | | | | | | | | | | |
| Actual | | | | N/A | | | | | N/A | | | | | N/A | | | | | 1,000.00 | | | | | 927.90 | | | | | 6.31 | | | | | 1,000.00 | | | | | 964.80 | | | | | 6.53 | |
| Hypothetical 5% return | | | | N/A | | | | | N/A | | | | | N/A | | | | | 1,000.00 | | | | | 1,018.45 | + | | | | 6.61 | | | | | 1,000.00 | | | | | 1,018.35 | + | | | | 6.71 | |
| |
134
GOLDMAN SACHS SINGLE SECTOR FIXED INCOME FUNDS
Fund Expenses — Six Month Period Ended September 30, 2011 (Unaudited) (continued)
| | | | | | | | | | | | | | | | | | | | | | | | | | | | | | | | | | | | | | | | | | | | | | |
| | | | Investment Grade Credit Fund | | | Local Emerging Markets Debt Fund | | | U.S. Mortgages Fund |
| | | | | | | | | | Expenses
| | | | | | | | | Expenses
| | | | | | | | | Expenses
|
| | | | Beginning
| | | Ending
| | | Paid for the
| | | Beginning
| | | Ending
| | | Paid for the
| | | Beginning
| | | Ending
| | | Paid for the
|
| | | | Account Value
| | | Account Value
| | | 6 months ended
| | | Account Value
| | | Account Value
| | | 6 months ended
| | | Account Value
| | | Account Value
| | | 6 months ended
|
| Share Class | | | 4/1/11 | | | 9/30/11 | | | 9/30/11* | | | 4/1/11 | | | 9/30/11 | | | 9/30/11* | | | 4/1/11 | | | 9/30/11 | | | 9/30/11* |
Class A | | | | | | | | | | | | | | | | | | | | | | | | | | | | | | | | | | | | | | | | | | | | | |
| Actual | | | $ | 1,000.00 | | | | $ | 1,046.90 | | | | $ | 3.63 | | | | $ | 1,000.00 | | | | $ | 923.10 | | | | $ | 6.20 | | | | $ | 1,000.00 | | | | $ | 1,037.50 | | | | $ | 3.62 | |
| Hypothetical 5% return | | | | 1,000.00 | | | | | 1,021.45 | + | | | | 3.59 | | | | | 1,000.00 | | | | | 1,018.55 | + | | | | 6.51 | | | | | 1,000.00 | | | | | 1,021.45 | + | | | | 3.59 | |
| |
Class B | | | | | | | | | | | | | | | | | | | | | | | | | | | | | | | | | | | | | | | | | | | | | |
| Actual | | | | N/A | | | | | N/A | | | | | N/A | | | | | N/A | | | | | N/A | | | | | N/A | | | | | N/A | | | | | N/A | | | | | N/A | |
| Hypothetical 5% return | | | | N/A | | | | | N/A | | | | | N/A | | | | | N/A | | | | | N/A | | | | | N/A | | | | | N/A | | | | | N/A | | | | | N/A | |
| |
Class C | | | | | | | | | | | | | | | | | | | | | | | | | | | | | | | | | | | | | | | | | | | | | |
| Actual | | | | N/A | | | | | N/A | | | | | N/A | | | | | 1,000.00 | | | | | 919.80 | | | | | 9.79 | | | | | N/A | | | | | N/A | | | | | N/A | |
| Hypothetical 5% return | | | | N/A | | | | | N/A | | | | | N/A | | | | | 1,000.00 | | | | | 1,014.80 | + | | | | 10.28 | | | | | N/A | | | | | N/A | | | | | N/A | |
| |
Institutional | | | | | | | | | | | | | | | | | | | | | | | | | | | | | | | | | | | | | | | | | | | | | |
| Actual | | | | 1,000.00 | | | | | 1,048.70 | | | | | 1.90 | | | | | 1,000.00 | | | | | 925.70 | | | | | 4.57 | | | | | 1,000.00 | | | | | 1,040.20 | | | | | 1.89 | |
| Hypothetical 5% return | | | | 1,000.00 | | | | | 1,023.15 | + | | | | 1.87 | | | | | 1,000.00 | | | | | 1,020.25 | + | | | | 4.80 | | | | | 1,000.00 | | | | | 1,023.15 | + | | | | 1.87 | |
| |
Separate Account Institutional | | | | | | | | | | | | | | | | | | | | | | | | | | | | | | | | | | | | | | | | | | | | | |
| Actual | | | | 1,000.00 | | | | | 1,048.70 | | | | | 1.90 | | | | | N/A | | | | | N/A | | | | | N/A | | | | | 1,000.00 | | | | | 1,039.30 | | | | | 1.89 | |
| Hypothetical 5% return | | | | 1,000.00 | | | | | 1,023.15 | + | | | | 1.87 | | | | | N/A | | | | | N/A | | | | | N/A | | | | | 1,000.00 | | | | | 1,023.15 | + | | | | 1.87 | |
| |
Service | | | | | | | | | | | | | | | | | | | | | | | | | | | | | | | | | | | | | | | | | | | | | |
| Actual | | | | N/A | | | | | N/A | | | | | N/A | | | | | N/A | | | | | N/A | | | | | N/A | | | | | N/A | | | | | N/A | | | | | N/A | |
| Hypothetical 5% return | | | | N/A | | | | | N/A | | | | | N/A | | | | | N/A | | | | | N/A | | | | | N/A | | | | | N/A | | | | | N/A | | | | | N/A | |
| |
Class IR(a) | | | | | | | | | | | | | | | | | | | | | | | | | | | | | | | | | | | | | | | | | | | | | |
| Actual | | | | 1,000.00 | | | | | 996.60 | | | | | 0.77 | | | | | 1,000.00 | | | | | 924.20 | | | | | 5.00 | | | | | 1,000.00 | | | | | 1,009.50 | | | | | 0.77 | |
| Hypothetical 5% return | | | | 1,000.00 | | | | | 1,007.57 | | | | | 0.77 | | | | | 1,000.00 | | | | | 1,019.80 | + | | | | 5.25 | | | | | 1,000.00 | | | | | 1,007.57 | + | | | | 0.77 | |
| |
Class R | | | | | | | | | | | | | | | | | | | | | | | | | | | | | | | | | | | | | | | | | | | | | |
| Actual | | | | N/A | | | | | N/A | | | | | N/A | | | | | N/A | | | | | N/A | | | | | N/A | | | | | N/A | | | | | N/A | | | | | N/A | |
| Hypothetical 5% return | | | | N/A | | | | | N/A | | | | | N/A | | | | | N/A | | | | | N/A | | | | | N/A | | | | | N/A | | | | | N/A | | | | | N/A | |
| |
| | |
| (a) | | Commenced operations on July 29, 2011 for the Investment Grade Credit and U.S. Mortgages Funds. |
| |
| * | | Expenses for each share class are calculated using each Fund’s annualized net expense ratio for each class, which represents the ongoing expenses as a percentage of net assets for the six months ended September 30, 2011. Expenses are calculated by multiplying the annualized net expense ratio by the average account value for the period; then multiplying the result by the number of days in the most recent fiscal half year; and then dividing that result by the number of days in the fiscal year. The annualized net expense ratios for the period were as follows: |
| | | | | | | | | | | | | | | | | | | | | | | | | | | | | | | | | |
| Fund | | Class A | | Class B | | Class C | | Institutional | | Service | | Separate Account Institutional | | Class IR | | Class R |
| |
| |
| Emerging Markets Debt | | | 1.22 | % | | | N/A | | | | 1.97 | % | | | 0.88 | % | | | N/A | | | | N/A | | | | 0.97 | % | | | N/A | |
| High Yield | | | 1.06 | | | | 1.81 | % | | | 1.81 | | | | 0.72 | | | | 1.22 | % | | | N/A | | | | 0.81 | | | | 1.31 | % |
| High Yield Floating Rate | | | 1.08 | | | | N/A | | | | 1.83 | | | | 0.74 | | | | N/A | | | | N/A | | | | 0.83 | | | | 1.33 | |
| Investment Grade Credit | | | 0.71 | | | | N/A | | | | N/A | | | | 0.37 | | | | N/A | | | | 0.37 | % | | | 0.46 | | | | N/A | |
| Local Emerging Markets Debt | | | 1.29 | | | | N/A | | | | 2.04 | | | | 0.95 | | | | N/A | | | | N/A | | | | 1.04 | | | | N/A | |
| U.S. Mortgages | | | 0.71 | | | | N/A | | | | N/A | | | | 0.37 | | | | N/A | | | | 0.37 | | | | 0.46 | | | | N/A | |
| |
| |
| | |
| + | | Hypothetical expenses are based on each Fund’s actual annualized net expense ratios and an assumed rate of return of 5% per year before expenses. |
135
GOLDMAN SACHS SINGLE SECTOR FIXED INCOME FUNDS
Statement Regarding Basis for Approval of Management Agreement (Unaudited)
Background
The Goldman Sachs Emerging Markets Debt, Goldman Sachs High Yield, Goldman Sachs High Yield Floating Rate, Goldman Sachs Investment Grade Credit, Goldman Sachs Local Emerging Markets Debt and Goldman Sachs U.S. Mortgages Funds (the “Funds”) are investment portfolios of Goldman Sachs Trust (the “Trust”). The Board of Trustees oversees the management of the Trust and reviews the investment performance and expenses of the Funds at regularly scheduled meetings held during the year. In addition, the Board of Trustees determines annually whether to approve the continuance of the Trust’s investment management agreement (the “Management Agreement”) with Goldman Sachs Asset Management, L.P. (the “Investment Adviser”) on behalf of the Funds.
The Management Agreement was most recently approved for continuation until June 30, 2012 by the Board of Trustees, including those Trustees who are not parties to the Management Agreement or “interested persons” (as defined in the Investment Company Act of 1940, as amended) of any party thereto (the “Independent Trustees”), at a meeting held on June 15-16, 2011 (the “Annual Meeting”).
The review process undertaken by the Trustees spans the course of the year and culminates with the Annual Meeting. To assist the Trustees in their deliberations, the Trustees have established a Contract Review Committee (the “Committee”), comprised of the Independent Trustees. The Committee held three meetings over the course of the year since the Management Agreement was last approved. At those Committee meetings, regularly scheduled Board meetings and/or the Annual Meeting, the Board, or the Independent Trustees, as applicable, considered matters relating to the Management Agreement, including:
| | |
| | (a) | the nature and quality of the advisory, administrative and other services provided to the Funds by the Investment Adviser and its affiliates, including information about: |
| | |
| | (i) | the structure, staff and capabilities of the Investment Adviser and its portfolio management teams; |
| | (ii) | the groups within the Investment Adviser and its affiliates that support the portfolio management teams or provide other types of necessary services, including fund services groups (e.g., accounting and financial reporting, tax, shareholder services and operations), controls and risk management groups (e.g., legal, compliance, valuation oversight, credit risk management, internal audit, market risk analysis, finance and strategy and central funding), sales and distribution support groups and others (e.g., information technology and training); |
| | (iii) | trends in headcount; |
| | (iv) | the Investment Adviser’s financial resources and ability to hire and retain talented personnel and strengthen its operations; and |
| | (v) | the parent company’s support of the Investment Adviser and its mutual fund business, as expressed by the firm’s senior management; |
| | |
| | (b) | information on the investment performance of the Funds (except for High Yield Floating Rate Fund, which commenced operations in 2011), including comparisons to the performance of similar mutual funds, as provided by a third party mutual fund data provider engaged as part of the contract review process (the “Outside Data Provider”), benchmark performance indices, comparable institutional composites managed by the Investment Adviser (in the case of High Yield and U.S. Mortgages Funds), and general investment outlooks in the markets in which the Funds invest; |
| | (c) | the terms of the Management Agreement and agreements with affiliated service providers entered into by the Trust on behalf of the Funds; |
| | (d) | expense information for the Funds, including: |
| | |
| | (i) | the relative management fee and expense levels of the Funds (except for High Yield Floating Rate Fund, which commenced operations in 2011) as compared to those of comparable funds managed by other advisers, as provided by the Outside Data Provider; |
| | (ii) | each Fund’s (except for High Yield Floating Rate Fund) expense trends over time; and |
| | (iii) | to the extent the Investment Adviser manages institutional accounts or collective investment vehicles having investment objectives and policies similar to those of the Funds, comparative information on the advisory fees charged and services provided to those accounts by the Investment Adviser; |
| | |
| | (e) | with respect to the extensive investment performance and expense comparison data provided by the Outside Data Provider, its processes in producing that data for the Funds; |
| | (f) | the undertakings of the Investment Adviser to waive certain management fees (with respect to the Investment Grade Credit, Local Emerging Markets Debt and U.S. Mortgages Funds) and reimburse certain expenses of the Funds that exceed specified levels, and a summary of contractual fee reductions made by the Investment Adviser and its affiliates over the past several years with respect to the Funds; |
GOLDMAN SACHS SINGLE SECTOR FIXED INCOME FUNDS
Statement Regarding Basis for Approval of Management Agreement (Unaudited) (continued)
| | |
| | (g) | information relating to the profitability of the Management Agreement and the transfer agency and distribution and service arrangements of each of the Funds (with the exception of High Yield Floating Rate Fund, which commenced operations in 2011) and the Trust as a whole to the Investment Adviser and its affiliates; |
| | (h) | whether each Fund’s existing management fee schedule adequately addressed any economies of scale; |
| | (i) | a summary of the “fall-out” benefits derived by the Investment Adviser and its affiliates from their relationships with the Funds, including the fees received by the Investment Adviser’s affiliates from the Funds for transfer agency, distribution and other services; |
| | (j) | a summary of potential benefits derived by the Funds as a result of their relationship with the Investment Adviser; |
| | (k) | information regarding portfolio trading and how the Investment Adviser carries out its duty to seek best execution; |
| | (l) | portfolio manager ownership of Fund shares; the manner in which portfolio manager compensation is determined; and the number and types of accounts managed by the portfolio managers; |
| | (m) | the nature and quality of the services provided to the Funds by their unaffiliated service providers, and the Investment Adviser’s general oversight and evaluation (including reports on due diligence) of those service providers as part of the administration services provided under the Management Agreement; and |
| | (n) | the Investment Adviser’s processes and policies addressing various types of potential conflicts of interest; its approach to risk management; the annual review of the effectiveness of the Funds’ compliance program; and compliance reports. |
The Trustees also received an overview of the Funds’ distribution arrangements. They received information regarding the Funds’ assets, share purchase and redemption activity and the payment of Rule 12b-1 distribution and service fees by the Funds and the payment of non-Rule 12b-1 shareholder service and/or administration fees by the High Yield Fund’s Service Shares. Information was also provided to the Trustees relating to revenue sharing payments made by and services provided by the Investment Adviser and its affiliates to intermediaries that promote the sale, distribution and/or servicing of Fund shares.
The presentations made at the Board and Committee meetings and at the Annual Meeting encompassed the Funds and other mutual fund portfolios for which the Board of Trustees has responsibility. In evaluating the Management Agreement at the Annual Meeting, the Trustees relied upon their knowledge, resulting from their meetings and other interactions throughout the year, of the Investment Adviser, its affiliates, their services and the Funds. In conjunction with these meetings, the Trustees received written materials and oral presentations on the topics covered, and were advised by their independent legal counsel regarding their responsibilities and other regulatory requirements related to the approval and continuation of mutual fund investment management agreements under applicable law. In addition, the Investment Adviser and its affiliates provided the Independent Trustees with a written response to a formal request for information sent on behalf of the Independent Trustees by their independent legal counsel. During the course of their deliberations, the Independent Trustees met in executive sessions with their independent legal counsel, without representatives of the Investment Adviser or its affiliates present. The Independent Trustees also discussed the broad range of other investment choices that are available to Fund investors, including the availability of comparable funds managed by other advisers.
Nature, Extent and Quality of the Services Provided Under the Management Agreement
As part of their review, the Trustees considered the nature, extent and quality of the services provided by the Investment Adviser. In this regard, the Trustees considered both the investment advisory services, and the other, non-advisory services, that are provided to the Funds by the Investment Adviser and its affiliates. The Trustees noted the transition in the leadership and changes in personnel of various portfolio management teams, that had occurred in recent periods, the potential benefit to the Funds of recent increases in headcount at the Investment Adviser and the ongoing recruitment efforts aimed at bringing high quality investment talent to the Investment Adviser. The Independent Trustees concluded that the Investment Adviser had committed substantial financial and operational resources to the Funds and expressed confidence that the Investment Adviser would continue to do so in the future. The Trustees also observed that the Investment Adviser had made significant commitments to address regulatory compliance requirements applicable to the Funds and the Investment Adviser.
Investment Performance
The Trustees also considered the investment performance of the Funds and the Investment Adviser. In this regard, they compared the investment performance of each Fund (with the exception of High Yield Floating Rate Fund, which commenced operations in 2011) to the performance of other comparable SEC-registered funds using rankings and ratings (rankings only for Local Emerging Markets Debt Fund) compiled by the Outside Data Provider as of December 31, 2010, and updated performance information prepared by the Investment Adviser using the peer groups identified by the Outside Data Provider (for each of the Funds). The information on each Fund’s (except for High Yield Floating Rate Fund) investment performance was provided for the one-, three-, five- and ten-year periods ending on the applicable dates, to the extent that each Fund had been in existence for those
GOLDMAN SACHS SINGLE SECTOR FIXED INCOME FUNDS
Statement Regarding Basis for Approval of Management Agreement (Unaudited) (continued)
periods. The Trustees also reviewed each Fund’s (except for High Yield Floating Rate Fund) investment performance over time on a year-by-year basis relative to its performance benchmark. In addition, they considered the investment performance trends of the Funds (except for High Yield Floating Rate Fund) over time, and reviewed the investment performance of each Fund in light of its investment objective and policies, market conditions and credit and duration parameters. The Trustees also received information comparing the High Yield and U.S. Mortgages Funds’ performance to that of comparable institutional composites managed by the Investment Adviser. The Trustees considered whether each Fund had operated within its investment policies and had complied with its investment limitations.
In addition, the Trustees considered materials prepared and presentations made by the Investment Adviser’s senior management and portfolio management personnel, in which Fund performance was assessed. The Trustees also considered the Investment Adviser’s periodic reports with respect to the Funds’ risk profiles, and how the Investment Adviser’s approach to risk monitoring and management influences portfolio management.
The Independent Trustees noted that for the one-year period ended May 31, 2011, the Investment Grade Credit, U.S. Mortgages and Local Emerging Markets Debt Funds had each ranked in the top half of its respective peer group, and each (with the exception of U.S. Mortgages Fund) had outperformed its respective benchmark index. They also noted that the Emerging Markets Debt and High Yield Funds had each ranked in the bottom half of its respective peer group. The Independent Trustees observed that the Investment Grade Credit and High Yield Funds had performance for multiple time periods that was in the bottom half of their peer groups and that they had communicated their concerns to the Investment Adviser’s senior management. The Independent Trustees also noted that they had received assurances from the Investment Adviser’s senior management that measures would continue to be taken to address the Funds’ performance. The Independent Trustees noted that the High Yield Floating Rate Fund had commenced operations in 2011 and concluded that the Fund had provided a reasonable level of performance to investors in light of its investment policies and given prevailing conditions in the markets in which it invests.
Costs of Services Provided and Competitive Information
The Trustees considered the contractual fee rates payable by each Fund under the Management Agreement. In this regard, the Trustees considered information on the services rendered by the Investment Adviser to the Funds, which included both advisory and administrative services that were directed to the needs and operations of the Funds as registered mutual funds.
In particular, the Trustees reviewed analyses prepared by the Outside Data Provider regarding the expense rankings of the Funds (except High Yield Floating Rate Fund, which commenced operations in 2011). The analyses provided a comparison of the Funds’ management fees and breakpoints to those of relevant peer groups and category universes; an expense analysis which compared the Funds’ expenses to those of applicable peer groups and category universes; and a five-year (three-year in the case of Local Emerging Markets Debt Fund) history comparing the Funds’ expenses to those of applicable peer and category medians. The analyses also compared the Funds’ transfer agency fees, custody and accounting fees, distribution fees, other expenses and fee waivers/reimbursements to those of other funds in the applicable peer groups and the peer group medians. The Trustees concluded that the comparisons provided by the Outside Data Provider were useful in evaluating the reasonableness of the management fees and total expenses paid by the Funds.
In addition, the Trustees considered the Investment Adviser’s undertakings to limit the Funds’ “other expenses” ratios (excluding certain expenses) to certain specified levels and to waive a portion of the contractual management fees paid by the Investment Grade Credit, Local Emerging Markets Debt and U.S. Mortgages Funds. They also considered, to the extent that the Investment Adviser manages institutional accounts or collective investment vehicles having investment objectives and policies similar to those of the Funds, comparative fee information for services provided by the Investment Adviser to those accounts, and information that indicated that services provided to the Funds differed in various significant respects from the services provided to institutional accounts, which generally operated under less stringent legal and regulatory structures, required fewer services from the Investment Adviser to a smaller number of client contact points, were less time-intensive and paid lower fees. By contrast, the Trustees noted that the Investment Adviser provides substantial administrative services to the Funds under the terms of the Management Agreement.
In addition, the Trustees noted that shareholders are able to redeem their Fund shares at any time if they believe that the Fund fees and expenses are too high or if they are dissatisfied with the performance of the Fund.
Profitability
The Trustees reviewed the Investment Adviser’s revenues and pre-tax profit margins with respect to the Trust and each of the Funds (with the exception of High Yield Floating Rate Fund, which commenced operations in 2011). In this regard the Trustees noted that they had received, among other things, profitability analyses and summaries, revenue and expense schedules by Fund and by function (i.e., investment management, transfer agency and distribution and service) and the Investment Adviser’s expense
GOLDMAN SACHS SINGLE SECTOR FIXED INCOME FUNDS
Statement Regarding Basis for Approval of Management Agreement (Unaudited) (continued)
allocation methodology. They observed that the profitability and expense figures are substantially similar to those used by the Investment Adviser for many internal purposes, including compensation decisions among various business groups, and are thus subject to a vigorous internal debate about how certain revenue and expenses should be allocated. The Trustees also reviewed the report of the internal audit group within the Goldman Sachs organization, which included an assessment of the reasonableness and consistency of the Investment Adviser’s expense allocation methodology and an evaluation of the accuracy of the Investment Adviser’s profitability analysis calculations. Profitability data for the Trust and each Fund (with the exception of High Yield Floating Rate Fund) were provided for 2010 and 2009, and the Trustees considered this information in relation to the Investment Adviser’s overall profitability. The Trustees considered the Investment Adviser’s revenues and pre-tax profit margins both in absolute terms and in comparison to information on the reported pre-tax profit margins earned by certain other asset management firms.
Economies of Scale
The Trustees considered the information that had been provided regarding the Investment Adviser’s profitability and the rationale for the Funds’ breakpoint structure. The Trustees also considered the breakpoints in the fee rate payable under the Management Agreement for each of the Funds at the following annual percentage rates of the average daily net assets of the Funds:
| | | | | | | | | | | | | | | | | | | | | | | | | |
| | | | | | | | | | | Local
| | |
| | | Emerging
| | | | High Yield
| | Investment
| | Emerging
| | U.S.
|
Average Daily
| | Markets
| | High Yield
| | Floating Rate
| | Grade
| | Markets
| | Mortgages
|
| Net Assets | | Debt Fund | | Fund | | Fund | | Credit Fund | | Debt Fund | | Fund |
| |
| First $1 billion | | | 0.80 | % | | | 0.70 | % | | | 0.60 | % | | | 0.40 | % | | | 0.90 | % | | | 0.40 | % |
| Next $1 billion | | | 0.80 | | | | 0.70 | | | | 0.54 | | | | 0.36 | | | | 0.90 | | | | 0.36 | |
| Next $3 billion | | | 0.72 | | | | 0.63 | | | | 0.51 | | | | 0.34 | | | | 0.81 | | | | 0.34 | |
| Next $3 billion | | | 0.68 | | | | 0.60 | | | | 0.50 | | | | 0.33 | | | | 0.77 | | | | 0.33 | |
| Over $8 billion | | | 0.67 | | | | 0.59 | | | | 0.49 | | | | 0.32 | | | | 0.75 | | | | 0.32 | |
The Trustees noted that the breakpoints at the $5 and $8 billion asset levels had been proposed by the Investment Adviser and approved by the Trustees in 2008 to further share potential economies of scale, if any, with the Funds and their shareholders as assets under management reach those asset levels. The Trustees considered the amounts of assets in the Funds; the Funds’ recent share purchase and redemption activity; the information provided by the Investment Adviser relating to the costs of the services provided by the Investment Adviser and its affiliates and their realized profits; information comparing fee rates charged by the Investment Adviser with fee rates charged to other funds in the peer group; and the Investment Adviser’s undertakings to limit management fees (with respect to the Investment Grade Credit, Local Emerging Markets Debt and U.S. Mortgages Funds) and “other expenses” ratios (excluding certain expenses) (with respect to all of the Funds) to certain amounts. Upon reviewing these matters at the Annual Meeting, the Trustees concluded that the fee breakpoints represented a means of assuring that benefits of scalability would be passed along to shareholders at the specified asset levels. They also noted that the Investment Adviser was passing along savings to shareholders of the High Yield Fund, which had asset levels above at least the first breakpoint during the prior fiscal year.
Other Benefits to the Investment Adviser and Its Affiliates
The Trustees also considered the other benefits derived by the Investment Adviser and its affiliates from their relationship with the Funds as stated above, including: (a) transfer agency fees received by Goldman, Sachs & Co. (“Goldman Sachs”); (b) futures commissions earned by Goldman Sachs for executing futures transactions on behalf of the Funds; (c) trading efficiencies resulting from aggregation of orders of the Funds with those for other funds or accounts managed by the Investment Adviser; (d) the Investment Adviser’s ability to leverage the infrastructure designed to service the Funds on behalf of its other clients; (e) the Investment Adviser’s ability to cross-market other products and services to Fund shareholders; (f) Goldman Sachs’ retention of certain fees as Fund Distributor; (g) the Investment Adviser’s ability to negotiate better pricing with custodians on behalf of its other clients, as a result of the relationship with the Funds; and (h) the possibility that the working relationship between the Investment Adviser and the Funds’ third party service providers may cause those service providers to be open to doing business with other areas of Goldman Sachs. In the course of considering the foregoing, the Independent Trustees requested and received further information quantifying certain of these fall-out benefits.
GOLDMAN SACHS SINGLE SECTOR FIXED INCOME FUNDS
Statement Regarding Basis for Approval of Management Agreement (Unaudited) (continued)
Other Benefits to the Funds and Their Shareholders
The Trustees also noted that the Funds receive certain potential benefits as a result of their relationship with the Investment Adviser, including: (a) trading efficiencies resulting from aggregation of orders of the Funds with those of other funds or accounts managed by the Investment Adviser; (b) improved servicing and pricing from vendors because of the volume of business generated by the Investment Adviser and its affiliates; (c) improved servicing from broker-dealers because of the volume of business generated by the Investment Adviser and its affiliates; (d) the Investment Adviser’s ability to negotiate favorable terms with derivatives counterparties as a result of the size and reputation of the Goldman Sachs organization; (e) the advantages gained from the Investment Adviser’s knowledge and experience gained from managing other accounts and products; (f) the Investment Adviser’s ability to hire and retain qualified personnel to provide services to the Funds because of the reputation of the Goldman Sachs organization; (g) the Funds’ access, through the Investment Adviser, to certain firmwide resources (e.g., proprietary databases); and (h) the Funds’ access to certain affiliated distribution channels. The Trustees noted the competitive nature of the mutual fund marketplace, and noted further that many of the Funds’ shareholders invested in the Funds in part because of the Funds’ relationship with the Investment Adviser and that those shareholders have a general expectation that the relationship will continue.
Conclusion
In connection with their consideration of the Management Agreement, the Trustees gave weight to each of the factors described above, but did not identify any particular factor as controlling their decision. After deliberation and consideration of all of the information provided, including the factors described above, the Trustees concluded, in the exercise of their business judgment, that the management fees paid by each of the Funds were reasonable in light of the services provided to it by the Investment Adviser, the Investment Adviser’s costs and each Fund’s current and reasonably foreseeable asset levels. The Trustees unanimously concluded that the Investment Adviser’s continued management likely would benefit each Fund and its shareholders and that the Management Agreement should be approved and continued with respect to each Fund until June 30, 2012.
FUNDS PROFILE
Goldman Sachs Funds
Goldman Sachs is a premier financial services firm, known since 1869 for creating thoughtful and customized investment solutions in complex global markets.
Today, the Investment Management Division of Goldman Sachs serves a diverse set of clients worldwide, including private institutions, public entities and individuals. With $699.7 billion in assets under management as of September 30, 2011, Goldman Sachs Asset Management (“GSAM”) has portfolio management teams located around the world and our investment professionals bring firsthand knowledge of local markets to every investment decision. GSAM’s assets under management includes assets managed by Goldman Sachs Asset Management, LP and its Investment Advisory Affiliates. Additionally, GSAM ranks in the top 10 asset management firms worldwide, based on assets under management.1
| |
| OVERVIEW OF GOLDMAN SACHS FUNDS | |

| | | | | |
Money Market2
Financial Square Fundssm
n Financial Square Tax-Exempt Funds
n Financial Square Federal Fund
n Financial Square Government Fund
n Financial Square Money Market Fund
n Financial Square Prime Obligations Fund
n Financial Square Treasury Instruments Fund
n Financial Square Treasury Obligations Fund
Fixed Income
Short Duration and Government
n Enhanced Income Fund
n Ultra-Short Duration Govt. Fund
n Short Duration Government Fund
n Government Income Fund
n Inflation Protected Securities Fund
Multi-Sector
n Core Fixed Income Fund
n Core Plus Fixed Income Fund
n Global Income Fund
n Strategic Income Fund
Municipal and Tax-Free
n High Yield Municipal Fund
n Municipal Income Fund
n Short Duration Tax-Free Fund
Single Sector
n Investment Grade Credit Fund
n U.S. Mortgages Fund
n High Yield Fund
n High Yield Floating Rate Fund | | n Emerging Markets Debt Fund
n Local Emerging Markets Debt Fund
Corporate Credit
n Credit Strategies Fund
Fundamental Equity
n Growth and Income Fund
n Small Cap Value Fund
n Mid Cap Value Fund
n Large Cap Value Fund
n Capital Growth Fund
n Strategic Growth Fund
n Small/Mid Cap Growth Fund
n Flexible Cap Growth Fund3
n Concentrated Growth Fund
n Technology Tollkeeper Fund
n Growth Opportunities Fund
n U.S. Equity Fund
Structured Equity
n Balanced Fund
n Structured Small Cap Equity Fund
n Structured U.S. Equity Fund
n Structured Small Cap Growth Fund
n Structured Large Cap Growth Fund
n Structured Large Cap Value Fund
n Structured Small Cap Value Fund
n Structured Tax-Managed Equity Fund
n Structured International Tax-Managed Equity Fund
n U.S. Equity Dividend and Premium Fund
n International Equity Dividend and Premium Fund | | n Structured International Small Cap Fund
n Structured International Equity Fund
n Structured Emerging Markets Equity Fund
Fundamental Equity International
n Strategic International Equity Fund
n Concentrated International Equity Fund
n International Small Cap Fund
n Asia Equity Fund
n Emerging Markets Equity Fund
n BRIC Fund (Brazil, Russia, India, China)
n N-11 Equity Fund
n Brazil Equity Fund
n China Equity Fund
n Korea Equity Fund
n India Equity Fund
Select Satellite4
n Real Estate Securities Fund
n International Real Estate Securities Fund
n Commodity Strategy Fund
n Dynamic Allocation Fund
n Absolute Return Tracker Fund
Total Portfolio Solutions4
n Balanced Strategy Portfolio
n Growth and Income Strategy Portfolio
n Growth Strategy Portfolio
n Equity Growth Strategy Portfolio
n Income Strategies Portfolio
n Satellite Strategies Portfolio
n Retirement Strategies Portfolios
n Enhanced Dividend Global Equity Portfolio
n Tax Advantaged Global Equity Portfolio |
Firmwide assets under management includes assets managed by GSAM and its Investment Advisory Affiliates.
| |
| 1 | Ranking for Goldman Sachs Group, Inc., includes Goldman Sachs Asset Management, Private Wealth Management and Merchant Banking 2010 year-end assets. Ranked 10th in total assets worldwide. Pensions & Investments, June 2011. |
| 2 | An investment in a money market fund is neither insured nor guaranteed by the Federal Deposit Insurance Corporation (“FDIC”) or any other government agency. Although the Funds seek to preserve the value of your investment at $1.00 per share, it is possible to lose money by investing in the Funds. |
| 3 | Effective March 31, 2011, the Goldman Sachs All Cap Growth Fund was renamed the Goldman Sachs Flexible Cap Growth Fund. |
| 4 | Individual Funds within the Total Portfolio Solutions and Select Satellite categories will have various placement on the risk/return spectrum and may have greater or lesser risk than that indicated by the placement of the general Total Portfolio Solutions or Select Satellite category. |
Financial Square Fundssm are registered service marks of Goldman, Sachs & Co.
| | | |
TRUSTEES
Ashok N. Bakhru, Chairman
Donald C. Burke
John P. Coblentz, Jr.
Diana M. Daniels
Joseph P. LoRusso
James A. McNamara
Jessica Palmer
Alan A. Shuch
Richard P. Strubel | | OFFICERS
James A. McNamara, President
George F. Travers, Principal Financial Officer
Peter V. Bonanno, Secretary
Scott M. McHugh, Treasurer
|
| | | |
GOLDMAN, SACHS & CO.
Distributor and Transfer Agent | | GOLDMAN SACHS ASSET MANAGEMENT, L.P.
Investment Adviser |
Visit our Web site at www.goldmansachsfunds.com to obtain the most recent month-end returns.
Goldman Sachs Asset Management, L.P. 200 West Street, New York, New York 10282
The reports concerning the Funds included in this shareholder report may contain certain forward-looking statements about the factors that may affect the performance of the Funds in the future. These statements are based on Fund management’s predictions and expectations concerning certain future events and their expected impact on the Funds, such as performance of the economy as a whole and of specific industry sectors, changes in the levels of interest rates, the impact of developing world events, and other factors that may influence the future performance of the Funds. Management believes these forward-looking statements to be reasonable, although they are inherently uncertain and difficult to predict. Actual events may cause adjustments in portfolio management strategies from those currently expected to be employed.
A description of the policies and procedures that the Funds use to determine how to vote proxies relating to portfolio securities and information regarding how the Funds voted proxies relating to portfolio securities for the 12-month period ending June 30, 2011 are available (I) without charge, upon request by calling 1-800-526-7384 (for Retail Shareholders) or 1-800-621-2550 (for Institutional Shareholders); and (II) on the Securities and Exchange Commission (“SEC”) Web site at http://www.sec.gov.
The Funds file their complete schedule of portfolio holdings with the SEC for the first and third quarters of each fiscal year on Form N-Q. The Funds’ Form N-Q will be available on the SEC’s website at http://www.sec.gov within 60 days after the Funds’ first and third fiscal quarters. The Funds’ Form N-Q, when available, may be reviewed and copied at the SEC’s Public Reference Room in Washington, D.C., and information on the operation of the Public Reference Room may also be obtained by calling 1-800-SEC-0330. Forms N-Q may be obtained upon request and without charge by calling 1-800-526-7384 (for Retail Shareholders) or 1-800-621-2550 (for Institutional Shareholders).
Holdings and allocations shown are as of September 30, 2011 and may not be representative of future investments. Fund holdings should not be relied on in making investment decisions and should not be construed as research or investment advice regarding particular securities.
Economic and market forecasts presented herein reflect our judgment as of the date of this presentation and are subject to change without notice. These forecasts do not take into account the specific investment objectives, restrictions, tax and financial situation or other needs of any specific client. Actual data will vary and may not be reflected here. These forecasts are subject to high levels of uncertainty that may affect actual performance. Accordingly, these forecasts should be viewed as merely representative of a broad range of possible outcomes. These forecasts are estimated, based on assumptions, and are subject to significant revision and may change materially as economic and market conditions change. Goldman Sachs has no obligation to provide updates or changes to these forecasts. Case studies and examples are for illustrative purposes only.
This material is not authorized for distribution to prospective investors unless preceded or accompanied by a current Prospectus or summary prospectus, if applicable. Investors should consider a Fund’s objective, risks, and charges and expenses, and read the summary prospectus, if available, and/or the Prospectus carefully before investing or sending money. The summary prospectus, if available, and the Prospectus contain this and other information about a Fund and may be obtained from your authorized dealer or from Goldman, Sachs & Co. by calling (retail – 1-800-526-7384) (institutional – 1-800-621-2550).
© 2011 Goldman Sachs. All rights reserved. 63401.MF.MED/TMPL/11/2011 SSFISAR11/85.1K
| | | |
| | | The information required by this Item is only required in an annual report on this Form N-CSR. |
| | | |
| ITEM 3. | | AUDIT COMMITTEE FINANCIAL EXPERT. |
| | | |
| | | The information required by this Item is only required in an annual report on this Form N-CSR. |
| | | |
| ITEM 4. | | PRINCIPAL ACCOUNTANT FEES AND SERVICES. |
| | | |
| | | The information required by this Item is only required in an annual report on this Form N-CSR. |
| | | |
| ITEM 5. | | AUDIT COMMITTEE OF LISTED REGISTRANTS. |
| | | |
| | | Not applicable. |
| | | |
| ITEM 6. | | SCHEDULE OF INVESTMENTS. |
| | | |
| | | Schedule of Investments is included as part of the Report to Stockholders filed under Item 1. |
| | | |
| ITEM 7. | | DISCLOSURE OF PROXY VOTING POLICIES AND PROCEDURES FOR CLOSED-END MANAGEMENT INVESTMENT COMPANIES. |
| | | |
| | | Not applicable. |
| | | |
| ITEM 8. | | PORTFOLIO MANAGERS OF CLOSED-END MANAGEMENT INVESTMENT COMPANIES. |
| | | |
| | | Not applicable. |
| | | |
| ITEM 9. | | PURCHASES OF EQUITY SECURITIES BY CLOSED-END MANAGEMENT INVESTMENT COMPANY AND AFFILIATED PURCHASERS. |
| | | |
| | | Not applicable. |
| | | |
| ITEM 10. | | SUBMISSION OF MATTERS TO A VOTE OF SECURITY HOLDERS.
There have been no material changes to the procedures by which shareholders may recommend nominees to the registrant’s board of trustees. |
| | | |
| | | |
| ITEM 11. | | CONTROLS AND PROCEDURES. |
| | | |
| | (a) | | The registrant’s principal executive and principal financial officers, or persons performing similar functions have concluded that the registrant’s disclosure controls and procedures (as defined in Rule 30a-3(c) under the Investment Company Act of 1940, as amended (the “1940 Act”)) are effective as of a date within 90 days of the filing of this report that includes the disclosure required by this paragraph, based on the evaluation of these controls and procedures required by Rule 30a-3(b) under the 1940 Act and 15d-15(b) under the Securities Exchange Act of 1934, as amended. |
| | | |
| | (b) | | There were no changes in the registrant’s internal control over financial reporting (as defined in Rule 30a-3(d) under the 1940 Act) that occurred during the registrant’s second fiscal quarter of the period covered by this report that have materially affected, or are reasonably likely to materially affect, the registrant’s internal control over financial reporting. |
| | | |
| | (a)(1) | | The information required by this Item is only required in connection with an annual report on this Form N-CSR. |
| |
| | (a)(2) | | Exhibit 99.CERT | Certifications pursuant to Section 302 of the Sarbanes-Oxley Act of 2002 filed herewith. |
| | | |
| | (b) | | Exhibit 99.906CERT | Certifications pursuant to Section 906 of the Sarbanes-Oxley Act of 2002 filed herewith. |
SIGNATURES
| | | | Pursuant to the requirements of the Securities Exchange Act of 1934 and the Investment Company Act of 1940, the registrant has duly caused this report to be signed on its behalf by the undersigned, thereunto duly authorized. |
| | | | | | | |
| | | | | Goldman Sachs Trust | | |
| | | | | | | |
| By: | | | | /s/ James A. McNamara | | |
| | | | |
| | |
| | | | | James A. McNamara | | |
| | | | | President/Principal Executive Officer | | |
| | | | | Goldman Sachs Trust | | |
| | | | | | | |
| Date: | | | | December 7, 2011 | | |
| | | | Pursuant to the requirements of the Securities Exchange Act of 1934 and the Investment Company Act of 1940, this report has been signed below by the following persons on behalf of the registrant and in the capacities and on the dates indicated. |
| | | | | | | |
| By: | | | | /s/ James A. McNamara | | |
| | | | |
| | |
| | | | | James A. McNamara | | |
| | | | | President/Principal Executive Officer | | |
| | | | | Goldman Sachs Trust | | |
| | | | | | | |
| Date: | | | | December 7, 2011 | | |
| | | | | | | |
| By: | | | | /s/ George F. Travers | | |
| | | | |
| | |
| | | | | George F. Travers | | |
| | | | | Principal Financial Officer | | |
| | | | | Goldman Sachs Trust | | |
| | | | | | | |
| Date: | | | | December 7, 2011 | | |