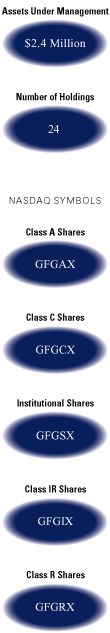
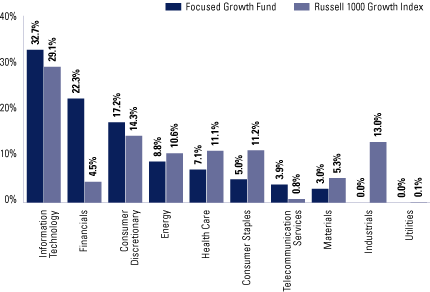
UNITED STATES
SECURITIES AND EXCHANGE COMMISSION
Washington, D.C. 20549
FORM N-CSR
CERTIFIED SHAREHOLDER REPORT OF REGISTERED
MANAGEMENT INVESTMENT COMPANIES
Investment Company Act file number 811-05349
Goldman Sachs Trust
(Exact name of registrant as specified in charter)71 South Wacker Drive, Chicago, Illinois 60606
(Address of principal executive offices) (Zip code)| | | |
| Peter V. Bonanno, Esq. | | Copies to: |
| Goldman, Sachs & Co. | | Geoffrey R.T. Kenyon, Esq. |
| 200 West Street | | Dechert LLP |
| New York, New York 10282 | | 200 Clarendon Street |
| | | 27th Floor
Boston, MA 02116-5021 |
|
(Name and address of agents for service)
|
Registrant’s telephone number, including area code: (312) 655-4400
Date of fiscal year end: August 31
Date of reporting period: February 29, 2012
| | | |
| ITEM 1. | | REPORTS TO STOCKHOLDERS. |
| | | |
| | | The Semi-Annual Report to Stockholders is filed herewith. |
Goldman Sachs Funds
| | | | |
| | | | |
Semi-Annual Report | | | February 29, 2012 |
| | | | |
| | | | |
| | | | |
| | | | |
| | | | Fundamental Equity Growth Funds |
| | | | Capital Growth |
| | | | Concentrated Growth |
| | | | Flexible Cap Growth |
| | | | Focused Growth |
| | | | Growth Opportunities |
| | | | Small/Mid Cap Growth |
| | | | Strategic Growth |
| | | | Technology Tollkeeper |
| | | | U.S. Equity |
| | | | |
Goldman Sachs Fundamental Equity Growth Funds
| |
| n | CAPITAL GROWTH |
| |
| n | CONCENTRATED GROWTH |
| |
| n | FLEXIBLE CAP GROWTH |
| |
| n | FOCUSED GROWTH |
| |
| n | GROWTH OPPORTUNITIES |
| |
| n | SMALL/MID CAP GROWTH |
| |
| n | STRATEGIC GROWTH |
| |
| n | TECHNOLOGY TOLLKEEPER |
| |
| n | U.S. EQUITY |
| | | |
| TABLE OF CONTENTS | | |
| |
| | | |
| Principal Investment Strategies and Risks | | 1 |
| | | |
| Investment Process | | 3 |
| | | |
| Market Review | | 4 |
| | | |
Portfolio Management Discussions and
Performance Summaries | | 7 |
| | | |
| Schedules of Investments | | 58 |
| | | |
| Financial Statements | | 74 |
| | | |
| Financial Highlights | | 84 |
| | | |
| Notes to Financial Statements | | 102 |
| | | |
| Other Information | | 119 |
| | | | | | | |
NOT FDIC-INSURED | | | May Lose Value | | | No Bank Guarantee |
| | | | | | | |
GOLDMAN SACHS FUNDAMENTAL EQUITY GROWTH FUNDS
Principal Investment Strategies and Risks
This is not a complete list of risks that may affect the Funds. For additional information concerning the risks applicable to the Funds, please see the Funds’ Prospectuses.
The Goldman Sachs Capital Growth Fund invests primarily in U.S. equity investments. The Fund’s equity investments are subject to market risk, which means that the value of the securities in which it invests may go up or down in response to the prospects of individual companies, particular industry sectors and/or general economic conditions. Different investment styles (e.g., “growth”) tend to shift in and out of favor, and at times the Fund may underperform other funds that invest in similar asset classes.
The Goldman Sachs Concentrated Growth Fund invests primarily in U.S. equity investments. The Fund’s equity investments are subject to market risk, which means that the value of the securities in which it invests may go up or down in response to the prospects of individual companies, particular industry sectors and/or general economic conditions. The securities of small- and mid-capitalization companies involve greater risks than those associated with larger, more established companies and may be subject to more abrupt or erratic price movements. Different investment styles (e.g., “growth”) tend to shift in and out of favor, and at times the Fund may underperform other funds that invest in similar asset classes. The Fund is “non-diversified” and may invest more of its assets in fewer issuers than “diversified” funds. Accordingly, the Fund may be more susceptible to adverse developments affecting any single issuer held in its portfolio and to greater losses resulting from these developments.
The Goldman Sachs Flexible Cap Growth Fund invests primarily in U.S. equity investments in small-, mid- and large-capitalization issuers. The Fund’s equity investments are subject to market risk, which means that the value of the securities in which it invests may go up or down in response to the prospects of individual companies, particular industry sectors and/or general economic conditions. The securities of small- and mid-capitalization companies involve greater risks than those associated with larger, more established companies and may be subject to more abrupt or erratic price movements. Different investment styles (e.g., “growth”) tend to shift in and out of favor, and at times the Fund may underperform other funds that invest in similar asset classes.
The Goldman Sachs Focused Growth Fund invests primarily in U.S. equity investments. The Fund’s equity investments are subject to market risk, which means that the value of the securities in which it invests may go up or down in response to the prospects of individual companies, particular industry sectors and/or general economic conditions. The securities of small- and mid-capitalization companies involve greater risks than those associated with larger, more established companies and may be subject to more abrupt or erratic price movements. Different investment styles (e.g., “growth”) tend to shift in and out of favor, and at times the Fund may underperform other funds that invest in similar asset classes. The Fund is “non-diversified” and may invest more of its assets in fewer issuers than “diversified” funds. Accordingly, the Fund may be more susceptible to adverse developments affecting any single issuer held in its portfolio and to greater losses resulting from these developments.
The Goldman Sachs Growth Opportunities Fund invests primarily in U.S. equity investments with a primary focus on mid-capitalization companies. The Fund’s equity investments are subject to market risk, which means that the value of the securities in which it invests may go up or down in response to the prospects of individual companies, particular industry sectors and/or general economic conditions. The securities of small- and mid-capitalization companies involve greater risks than those associated with larger, more established companies and may be subject to more abrupt or erratic price movements. Different investment styles (e.g., “growth”) tend to shift in and out of favor, and at times the Fund may underperform other funds that invest in similar asset classes.
GOLDMAN SACHS FUNDAMENTAL EQUITY GROWTH FUNDS
The Goldman Sachs Small/Mid Cap Growth Fund invests primarily in U.S. equity investments with a primary focus on small- and mid-capitalization companies. The Fund’s equity investments are subject to market risk, which means that the value of the securities in which it invests may go up or down in response to the prospects of individual companies, particular industry sectors and/or general economic conditions. The securities of small- and mid-capitalization companies involve greater risks than those associated with larger, more established companies and may be subject to more abrupt or erratic price movements. Different investment styles (e.g., “growth”) tend to shift in and out of favor, and at times the Fund may underperform other funds that invest in similar asset classes.
The Goldman Sachs Strategic Growth Fund invests primarily in U.S. equity investments. The Fund’s equity investments are subject to market risk, which means that the value of the securities in which it invests may go up or down in response to the prospects of individual companies, particular industry sectors and/or general economic conditions. Different investment styles (e.g., “growth”) tend to shift in and out of favor, and at times the Fund may underperform other funds that invest in similar asset classes.
The Goldman Sachs Technology Tollkeeper Fund invests primarily in equity securities of high quality technology, media or service companies that adopt or use technology to improve their cost structure, revenue opportunities or competitive advantage (”Technology Tollkeeper” companies). Because the Fund concentrates its investments in certain specific industries, the Fund is subject to greater risk of loss as a result of adverse economic, business or other developments affecting those industries than if its investments were more diversified across different industries. Stock prices of internet and internet-related companies in particular may be especially volatile. The securities of small- and mid-capitalization companies involve greater risks than those associated with larger, more established companies and may be subject to more abrupt or erratic price movements. Different investment styles (e.g., “growth”) tend to shift in and out of favor, and at times the Fund may underperform other funds that invest in similar asset classes.
The Goldman Sachs U.S. Equity Fund invests primarily in large-capitalization U.S. equity investments. The Fund’s equity investments are subject to market risk, which means that the value of the securities in which it invests may go up or down in response to the prospects of individual companies, particular industry sectors and/or general economic conditions. Different investment styles (e.g., “growth”) tend to shift in and out of favor, and at times the Fund may underperform other funds that invest in similar asset classes.
GOLDMAN SACHS FUNDAMENTAL EQUITY GROWTH FUNDS
What Differentiates the Goldman Sachs Growth Team’s Investment Process?
For over 30 years, the Goldman Sachs Growth Team has consistently applied a three-step investment process based on our belief that wealth is created through the long-term ownership of growing businesses.
| | | |
n Make decisions as long-term business owners rather than as stock traders
n Perform in-depth, fundamental research
n Focus on long-term structural and competitive advantages | | Result
Performance driven by the compounding growth of businesses over time — not short-term market movements
Long-term participation in growing businesses — less reliance on macroeconomic predictions, market timing, sector rotation or momentum |
| | | |
Identify high quality growth businesses. Some required investment criteria include:
n Established brand names
n Dominant market shares
n Pricing power
n Recurring revenue streams
n Free cash flow
n Long product life cycles
n Favorable long-term growth prospects
n Excellent management | | Result
Investments in businesses that we believe are strategically positioned for consistent, sustainable long-term growth |
| | | |
n Perform rigorous valuation analysis of every potential investment
n Use valuation tools and analytics to ensure that the high-quality business franchises we have identified also represent sound investments | | Result
Good investment decisions based on solid understanding of what each business is worth
Attractive buying opportunities as the stock prices of quality growth businesses fluctuate over time |
MARKET REVIEW
Goldman Sachs Fundamental Equity Growth Funds
Market Review
After a weak start, U.S. equities overall reflected optimistic sentiment for most of the six months ended February 29, 2012 (the “Reporting Period”). The Standard & Poor’s 500® Index (the “S&P 500 Index”) ended the Reporting Period with a double-digit gain of 13.31% and the Russell 3000® Index generated a return of 13.24%.
The Reporting Period began with a U.S. equity market decline in September, which capped an extraordinarily volatile third quarter. During the month of September, U.S. equity markets were shaken by the Federal Reserve Board’s (the “Fed”) announcement of a plan for additional monetary easing by attempting to “twist” the yield curve, or spectrum of U.S. Treasury maturities, on the grounds of general weakness in the labor market and lackluster consumer spending growth. Through its Operation Twist program, the Fed said it would extend the maturity structure of its holdings through the sale of short-term securities and the purchase of long-term securities in an effort to support the economic recovery. In addition, the prospect of contagion from a Greek sovereign debt default and the lack of agreement on a solution amongst European leaders weighed on global equity markets, including the U.S. equity market, early in the Reporting Period.
U.S. equities overall then surged in October following a preliminary plan to resolve the European sovereign debt crisis and news that the U.S. economy had grown at a 2.5% annualized rate in the third quarter of 2011, according to the advance estimate released by the Bureau of Economic Analysis. The U.S. equity market was virtually flat for the remainder of 2011, as some improving economic indicators were offset by other challenges. These challenges included the ratings downgrade of several large banks by Standard & Poor’s and the Congressional budget deficit supercommittee failing to come to agreement on spending cuts. In addition, Europe’s sovereign debt crisis deteriorated as credit conditions tightened for banks and yields on Italian and Spanish government debt hovered near unsustainable levels.
The U.S. equity market rallied broadly in January 2012, led by many of the worst performing sectors from 2011. Gains then extended into February on continued improvements in macroeconomic data, particularly in the labor market. News that the Fed reduced its outlook for near-term economic growth was offset by its commitment to low interest rates until late 2014. Also in February, fourth quarter 2011 Gross Domestic Product (“GDP”) growth was revised up from 2.8% to 3%. The Dow Jones Industrial Average closed above 13,000 in February for the first time since May 2008, and the NASDAQ reached a new 11-year high.
For the Reporting Period overall, large-cap companies performed best, followed rather closely by small-cap stocks and then mid-cap stocks. Growth stocks modestly outpaced value stocks in the large-cap and small-cap segments of the U.S. equity market; growth stocks and value stocks performed in line with each other in the mid-cap segment of the U.S. equity market. (All as measured by Russell Investments indices.) While all sectors made gains during the Reporting Period, the information technology sector dominated returns, as a number of technology companies reported strong earnings results. Other cyclical, economically-sensitive sectors, such as consumer discretionary and industrials, also posted strong returns. More defensive sectors, including utilities, telecommunication services, consumer staples and health care, lagged during the Reporting Period.
MARKET REVIEW
Looking Ahead
We remain cautiously optimistic on the U.S. equity market going forward. While we expect challenges in the overall economic environment to persist, stemming from slowing growth in some parts of the world, budgetary headwinds, ongoing regulation, political uncertainty and geopolitical tensions, we believe the U.S. economy will continue to grow. Risks also remain over strains in Europe and emerging market inflation. However, with the extreme macroeconomic concerns seemingly less likely to materialize, stock level correlations meaningfully declined by the end of the Reporting Period, dropping approximately 30% from the peak in 2011, an indication, in our view, that the market appears to be re-focusing on company level fundamentals. This seemed to be the case given the number of companies that experienced significant price moves after reporting fourth quarter earnings results.
In our view, company fundamentals at the end of the Reporting Period were stronger than ever, as well-capitalized corporations had over $1 trillion on their balance sheets and were beginning to redeploy cash, signaling confidence in the economy. We believe corporate earnings should remain resilient over the months ahead given companies’ exposures to secular and global growth as well as their increased financial and operational flexibility. We further believe equity valuations appeared attractive on a relative basis at the end of the Reporting Period. Finally, in our view, fundamentals should be rewarded more going forward as there is likely to be more dispersion at the stock level than during the prior fiscal year, which should bode well for a fundamentals-focused, active management approach.
While we anticipate continued economic recovery — albeit below trend — over the next year or two, we intend to continue to invest in companies that we believe are participating in secular growth trends, gaining market share, demonstrating pricing power to mitigate, in some cases, weaker end demand, and/or benefiting from exposure to faster growing emerging market economies. In addition, we intend to analyze businesses’ flexibility to rationalize costs in a slower economic growth climate, to help defend margins and earnings power. Our team continues to seek to identify businesses with sustainable business models, led by quality management teams, that have strong fundamental characteristics, enduring competitive advantages and the ability to preserve or increase their earnings power, generate strong free cash flow and maintain healthy balance sheets. While there will no doubt continue to be surprises over the remainder of 2012, we remain encouraged regarding the opportunities for the growth companies in our Funds’ portfolios. We intend to stay true to our long-term perspective and our investment discipline of seeking to buy high quality growth businesses trading at attractive valuations, an approach that has served our Funds well historically. At the same time, we are increasingly cognizant of risk management at the portfolio level, particularly in a market environment wherein periods of extreme volatility and correlations persist. As always, deep research resources, a forward-looking investment process and truly actively managed portfolios are keys, in our view, to both preserving capital and outperforming the market over the long term.
MARKET REVIEW
Changes to the Team’s Management
On January 1, 2012, Steven Barry became the sole Chief Investment Officer (CIO) of the Goldman Sachs Growth Equity Investment Team. David Shell, who was co-CIO along with Steven, retired from the firm at the end of 2011. During his tenure, David played a significant role in developing the growth business, creating new strategies and leading our investment team. We wish David all the best in his retirement.
To enhance our ability to execute our investment process, we closed our Tampa office effective December 31, 2011 and consolidated the investment team in New York. We believe this close proximity will enable more frequent and robust debate among our investment team and result in more predictability in our investment returns.
Alongside Steven Barry, the lead portfolio managers for our Growth strategies, effective October 6, 2011, are:
| | | |
| | n | Large cap strategies (Capital Growth, Concentrated Growth, Focused Growth and Strategic Growth): Joseph Hudepohl and Timothy Leahy | |
| |
| | n | Non-large cap strategies (Flexible Cap Growth, Growth Opportunities, Small/Mid Cap Growth and Technology Tollkeeper): Scott Kolar and Jeffrey Rabinowitz. | |
Our investment philosophy remains unchanged. We seek to buy high quality growth businesses at attractive valuations and drive investment performance through stock selection.
PORTFOLIO RESULTS
Goldman Sachs Capital Growth Fund
Portfolio Composition
The Fund invests primarily in U.S. equity investments. Since the Fund’s inception, the Goldman Sachs Growth Equity Investment Team has focused on several key investment criteria that it believes can drive a company’s growth over the long term. These characteristics are: dominant market share, established brand name, pricing power, recurring revenue stream, free cash flow, high returns on invested capital, predictable growth, sustainable growth, long product life cycle, enduring competitive advantage, favorable demographic trends and excellent management. The Team strives to purchase these companies at reasonable valuations in order to capture the full benefits of their growth.
Portfolio Management Discussion and Analysis
Below, the Goldman Sachs Growth Equity Investment Team discusses the Goldman Sachs Capital Growth Fund’s (the “Fund”) performance and positioning for the six-month period ended February 29, 2012 (the “Reporting Period”).
| |
| Q | How did the Fund perform during the Reporting Period? |
| |
| A | During the Reporting Period, the Fund’s Class A, B, C, Institutional, Service, IR and R Shares generated cumulative total returns, without sales charges, of 15.09%, 14.62%, 14.64%, 15.27%, 15.01%, 15.20% and 14.93%, respectively. These returns compare to the 13.76% cumulative total return of the Fund’s benchmark, the Russell 1000® Growth Index (with dividends reinvested) (the “Russell Index”), during the same period. |
| |
| Q | What key factors were responsible for the Fund’s performance during the Reporting Period? |
| |
| A | Stock selection overall contributed most to the Fund’s performance relative to the Russell Index during the Reporting Period. |
| |
| Q | Which equity market sectors most significantly affected Fund performance? |
| |
| A | Effective stock selection in the information technology and consumer discretionary sectors helped the Fund’s performance most relative to the Russell Index. Having an underweighted allocation to materials, which though considered an economically-sensitive sector lagged the Russell Index during the Reporting Period, also boosted Fund results. Detracting from the Fund’s relative results most was stock selection in the health care and energy sectors. Having an overweighted allocation to energy, which lagged the Russell Index, and an underweighted exposure to industrials, which outpaced the Russell Index, also hurt. |
| |
| Q | What were some of the Fund’s best-performing individual stocks? |
| |
| A | The Fund benefited most relative to the Russell Index from positions in data center solutions company Equinix, home improvement retailer Lowe’s and personal computer and mobile communications device giant Apple. |
Equinix contributed to the Fund’s performance during the Reporting Period. Its shares rose as the company reported strong fourth quarter results and issued a solid outlook for 2012. As the company continued to evaluate its potential for real estate investment trust (REIT) status, the market began to recognize that Equinix’s shares were trading at a discount to other publicly traded data center REITs. Should the market continue to appreciate the growth and stability of the company’s revenue stream, we believe the valuation gap between Equinix and its peers could narrow. At the end of the Reporting Period, we remained attracted to Equinix’s leading position in operating data centers, which has several secular growth drivers, including cloud computing and online and mobile video demand. (Cloud computing is Internet-based computing, whereby shared resources, software and information are provided to computers and other devices on demand, like the electricity grid.)
Lowe’s was a top contributor to the Fund’s relative performance during the Reporting Period as the company beat earnings expectations driven by improved traffic trends and incrementally positive housing market data. Further, Lowe’s management announced a decision to take on more debt in order to fund upcoming share buybacks. We believe this showed a clear commitment by company management to increase return on invested capital. Lowe’s management also
PORTFOLIO RESULTS
took important steps to differentiate Lowe’s from competitors by improving its operational efficiency and implementation of technology. Further, Lowe’s management, in our view, remained focused on more effective marketing techniques and improving in-store format, which we believe will further differentiate Lowe’s in the duopolistic home improvement market going forward.
Shares of Apple rose during the Reporting Period as sales and earnings continued to exceed analyst expectations driven by strong iPhone and iPad sales. We believe the iPad has joined the iPhone as a key Apple product that has helped the company increase market share and build brand awareness as new customers are exposed to the company’s product offerings. In August 2011, Steve Jobs resigned as Chief Executive Officer of the firm and was succeeded by Chief Operating Officer Tim Cook. While Mr. Jobs’ passing in October was certainly a loss not only to Apple but to U.S. innovation, we believe Apple’s platform is now stronger than ever and can be successfully managed by Mr. Cook and Apple’s seasoned management team.
| |
| Q | Which stocks detracted significantly from the Fund’s performance during the Reporting Period? |
| |
| A | Detracting most from the Fund’s results relative to its benchmark index were positions in oilfield services companies Halliburton and Schlumberger and medical device company St. Jude Medical. |
After being a top contributor during the prior fiscal year, leading oil services firm Halliburton detracted most from the Fund’s returns during the Reporting Period. Despite posting solid second quarter earnings, Halliburton underperformed the broader equity market as expectations of a global economic slowdown and weaker oil prices pressured its shares and contributed to the energy sector’s relative underperformance of the broad U.S. equity market. We acknowledge the economic slowdown and Halliburton’s sensitivity to oil prices, but at the end of the Reporting Period, we continued to believe the company’s risk/reward profile was attractive at then-current valuations. Indeed, we believe Halliburton is gaining share in key markets and can demonstrate pricing power and margin improvement in its North America-based pressure pumping business. We also expect the shift in U.S. drilling activity toward oil/shale plays, or operations, could mitigate volatility.
In health care, St. Jude Medical detracted from the Fund’s relative performance. Medical device company shares broadly came under pressure during the Reporting Period on news that Medicare payment process changes could potentially lead to greater scrutiny of payment for specific high-cost medical device procedures. While fears abated after the Center for Medicare and Medicaid Services announced the program would be limited in scope and breadth, shares of St. Jude Medical were hit once again when the Food and Drug Administration (FDA) issued a recall of its Riata defibrillator, which is no longer one of its marketed products. At the end of the Reporting Period, it was our understanding that concerns regarding the defibrillator were confined to a small subset of the product line and that there was no evidence of any impact to St. Jude Medical’s current product lineup. While we continue to believe that St. Jude Medical has innovative products and attractive end markets and is competitively well positioned in a growing industry over the long term, we decided to trim the Fund’s position in the company and allocate capital to higher conviction ideas.
Schlumberger, another leading oil services company, faced similar circumstances as did Halliburton. Like Halliburton, Schlumberger was a top contributor to the Fund’s results during the prior fiscal year and reported strong second quarter earnings, but faced oil pricing pressures brought about by global macroeconomic uncertainty and broad energy sector weakness. At the end of the Reporting Period, we continued to believe that Schlumberger was well positioned given its extensive and diversified global footprint. In addition, Schlumberger holds dominant market share in most of its product lines and offers a technological advantage over many of its competitors. Finally, we believe Schlumberger should likely benefit from stronger international pricing anticipated going forward. Given the recent market correction, we believe shares of Schlumberger were attractive at valuations seen at the end of the Reporting Period.
| |
| Q | How did the Fund use derivatives and similar instruments during the Reporting Period? |
| |
| A | During the Reporting Period, we did not use derivatives as part of an active management strategy. |
PORTFOLIO RESULTS
| |
| Q | Did the Fund make any significant purchases or sales during the Reporting Period? |
| |
| A | We initiated a Fund position in Abbott Laboratories after management announced it would split the company into a branded pharmaceutical company and a diversified medical products company, which is anticipated to result in a tax-free distribution to shareholders by the end of 2012. Abbott Laboratories is a leading global health care company that develops, manufactures and sells a diversified line of health care products. We believe its management’s decision to spin out its branded pharmaceutical business could unlock shareholder value by alleviating the overhang on the stock caused by competitive threats to its Humira arthritis drug. In our view, the patent issues associated with Humira have caused investors to overlook the value of Abbott Laboratories’ line of high growth businesses, namely, medical devices and diagnostics. Shares should benefit going forward, we believe, from increased visibility into underlying businesses, an updated product mix and increased exposure to emerging markets, which at the end of the Reporting Period contributed approximately 40% of the company’s revenues. |
We established a Fund position in T. Rowe Price, a company that provides investment advisory services to individual and institutional investors through its T. Rowe Price mutual funds and other investment portfolios. We viewed this as an attractive entry point into what we consider a high quality asset management franchise with an established brand name, healthy balance sheet and strong operating cash flow. In our view, T. Rowe Price also has a track record of strong, consistent organic growth and of expanding operating margins. Moreover, the company has, we feel, an attractive asset mix and generates a large portion of its revenue from a rather stable retirement distribution channel. The company has also proven to be less sensitive to interest rates relative to several other financials firms, which we view positively given current market conditions.
Conversely, we exited the Fund’s position in home goods retailer Bed Bath and Beyond during the Reporting Period. While its business fundamentals remained solid and management continued to improve margins and grow its store base, we see limited earnings upside from levels seen toward the end of the Reporting Period. Thus, we viewed this as an appropriate time to take profits and reinvest the sales proceeds in businesses we believed to have more attractive risk/reward profiles.
We sold the Fund’s position in Amgen, a biotechnology company that manufactures and markets medicines, during the Reporting Period. While we still believed that Amgen has a strong oncology franchise that has not been reflected in the company’s valuation, the company continued to face challenges in its base business. We decided to sell out of the Fund’s position and reallocate the sales proceeds to higher conviction names.
| |
| Q | Were there any notable changes in the Fund’s weightings during the Reporting Period? |
| |
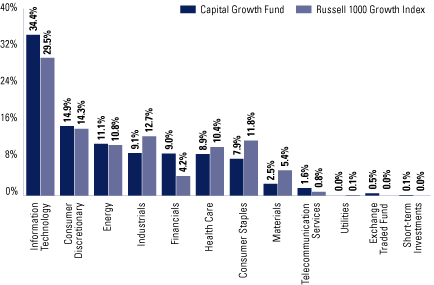
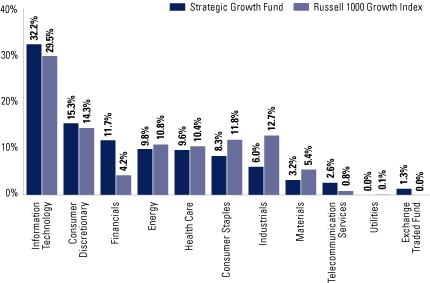
| A | In constructing the Fund’s portfolio, we focus on picking stocks rather than on making industry or sector bets. We seek to outpace the benchmark index by overweighting stocks that we expect to outperform and underweighting those that we think may lag. Consequently, changes in its sector weights are generally the direct result of individual stock selection or of stock appreciation or depreciation. That said, during the Reporting Period, the Fund’s exposure to energy and telecommunication services decreased and its allocation to financials increased relative to the Russell Index. |
| |
| Q | How was the Fund positioned relative to its benchmark index at the end of February 2012? |
| |
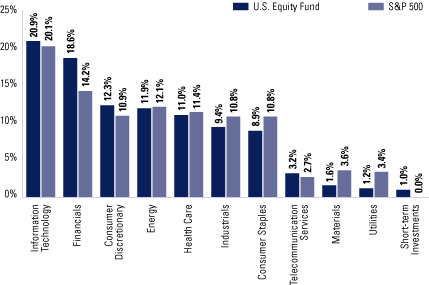
| A | At the end of February 2012, the Fund had overweighted positions relative to the Russell Index in the financials and information technology sectors. On the same date, the Fund had underweighted positions compared to the Russell Index in consumer staples, industrials, materials and health care. The Fund was rather neutrally weighted to the Russell Index in consumer discretionary, energy and telecommunication services and had no position at all in utilities on February 29, 2012. |
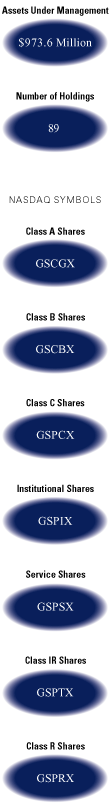
FUND BASICS
Capital Growth Fund
as of February 29, 2012
| | | | | | | | | | | |
| | | Fund Total Return
| | Russell 1000
| | |
| September 1, 2011–February 29, 2012 | | (based on NAV)1 | | Growth Index2 | | |
|
| |
| Class A | | | 15.09 | % | | | 13.76 | % | | |
| Class B | | | 14.62 | | | | 13.76 | | | |
| Class C | | | 14.64 | | | | 13.76 | | | |
| Institutional | | | 15.27 | | | | 13.76 | | | |
| Service | | | 15.01 | | | | 13.76 | | | |
| Class IR | | | 15.20 | | | | 13.76 | | | |
| Class R | | | 14.93 | | | | 13.76 | | | |
|
| | |
| 1 | | The net asset value (“NAV”) represents the net assets of the class of the Fund (ex-dividend) divided by the total number of shares of the class outstanding. The Fund’s performance reflects the reinvestment of dividends and other distributions. The Fund’s performance does not reflect the deduction of any applicable sales charges. |
| |
| 2 | | The Russell 1000 Growth Index is an unmanaged index that measures the performance of those Russell 1000 companies with higher price-to-book ratios and higher forecasted growth values. The Index figures do not reflect any deduction for fees, expenses or taxes. It is not possible to invest directly in an index. |
| |
| STANDARDIZED TOTAL RETURNS3 | |
| | | | | | | | | | | | | | | | | | | | | |
| For the period ended 12/31/11 | | One Year | | Five Years | | Ten Years | | Since Inception | | Inception Date | | |
|
| |
| Class A | | | -6.88 | % | | | -0.84 | % | | | 0.69 | % | | | 7.82 | % | | 4/20/90 | | |
| Class B | | | -7.13 | | | | -0.86 | | | | 0.64 | | | | 5.05 | | | 5/01/96 | | |
| Class C | | | -3.17 | | | | -0.45 | | | | 0.51 | | | | 2.62 | | | 8/15/97 | | |
| Institutional | | | -1.07 | | | | 0.69 | | | | 1.67 | | | | 3.79 | | | 8/15/97 | | |
| Service | | | -1.59 | | | | 0.19 | | | | 1.16 | | | | 3.28 | | | 8/15/97 | | |
| Class IR | | | -1.21 | | | | N/A | | | | N/A | | | | -1.47 | | | 11/30/07 | | |
| Class R | | | -1.76 | | | | N/A | | | | N/A | | | | -1.96 | | | 11/30/07 | | |
|
| | |
| 3 | | The Standardized Total Returns are average annual total returns as of the most recent calendar quarter-end. They assume reinvestment of all distributions at NAV. These returns reflect a maximum initial sales charge of 5.5% for Class A Shares and the assumed contingent deferred sales charge for Class B Shares (5% maximum declining to 0% after six years) and the assumed contingent deferred sales charge for Class C Shares (1% if redeemed within 12 months of purchase). Class B Shares automatically convert to Class A Shares on or about the fifteenth day of the last month of the calendar year that is eight years after purchase. Returns for Class B Shares for the period after the conversion reflect the performance of Class A Shares. Because Institutional, Service, Class IR and Class R Shares do not involve a sales charge, such a charge is not applied to their Standardized Total Returns. The Fund’s Class B Shares are no longer available for purchase by new or existing shareholders (although current Class B shareholders may continue to reinvest income and capital gains distributions into Class B Shares, and Class B shareholders may continue to exchange their shares for Class B Shares of certain other Goldman Sachs Funds). |
| |
| | The returns represent past performance. Past performance does not guarantee future results. The Fund’s investment return and principal value will fluctuate so that an investor’s shares, when redeemed, may be worth more or less than their original cost. Current performance may be lower or higher than the performance quoted above. Please visit our website at www.goldmansachsfunds.com to obtain the most recent month-end returns. Performance reflects fee waivers and/or expense limitations in effect. In their absence, performance would be reduced. Returns do not reflect the deduction of taxes that a shareholder would pay on Fund distributions or the redemption of Fund shares. |
FUND BASICS
| | | | | | | | | | | |
| | | Net Expense Ratio (Current) | | Gross Expense Ratio (Before Waivers) | | |
|
| |
| Class A | | | 1.14 | % | | | 1.47 | % | | |
| Class B | | | 1.89 | | | | 2.22 | | | |
| Class C | | | 1.89 | | | | 2.22 | | | |
| Institutional | | | 0.74 | | | | 1.07 | | | |
| Service | | | 1.24 | | | | 1.57 | | | |
| Class IR | | | 0.89 | | | | 1.22 | | | |
| Class R | | | 1.39 | | | | 1.72 | | | |
|
| | |
| 4 | | The expense ratios of the Fund, both current (net of applicable fee waivers and/or expense limitations) and before waivers (gross of applicable fee waivers and/or expense limitations) are as set forth above according to the most recent publicly available Prospectus for the Fund and may differ from the expense ratios disclosed in the Financial Highlights in this report. The Fund’s waivers and/or expense limitations will remain in place through at least December 29, 2012, and prior to such date the investment adviser may not terminate the arrangements without the approval of the Fund’s Board of Trustees. If these arrangements are discontinued in the future, the expense ratios may change without shareholder approval. |
| |
| TOP TEN HOLDINGS AS OF 2/29/125 | |
| | | | | | | | | |
| Holding | | % of Net Assets | | Line of Business | | |
|
| |
| Apple, Inc. | | | 7.9 | % | | Computers & Peripherals | | |
| Google, Inc. Class A | | | 3.2 | | | Internet Software & Services | | |
| QUALCOMM, Inc. | | | 2.9 | | | Communications Equipment | | |
| Microsoft Corp. | | | 2.9 | | | Software | | |
| Schlumberger Ltd. | | | 2.5 | | | Energy Equipment & Services | | |
| Oracle Corp. | | | 2.3 | | | Software | | |
| American Tower Corp. | | | 2.3 | | | Real Estate Investment Trusts | | |
| International Business Machines Corp. | | | 2.3 | | | IT Services | | |
| Amazon.com, Inc. | | | 2.2 | | | Internet & Catalog Retail | | |
| Honeywell International, Inc. | | | 1.9 | | | Aerospace & Defense | | |
|
| | |
| 5 | | The top 10 holdings may not be representative of the Fund’s future investments. |
FUND BASICS
| |
| FUND VS. BENCHMARK SECTOR ALLOCATION6 | |
As of February 29, 2012
| | |
| 6 | | The Fund is actively managed and, as such, its composition may differ over time. Consequently, the Fund’s overall sector allocations may differ from the percentages contained in the graph above. The graph categorizes investments using Global Industry Classification Standard (“GICS”), however, the sector classifications used by the portfolio management team may differ from GICS. Underlying sector allocations of Exchange Traded Funds held by the Fund are not reflected in the graph above. The percentage shown for each investment category reflects the value of investments in that category as a percentage of market value. Short-term investments represent repurchase agreements. The graph depicts the Fund’s investments but may not represent the Fund’s market exposure due to the exclusion of certain derivatives, if any, as listed in the Additional Investment Information section of the Schedule of Investments. |
PORTFOLIO RESULTS
Goldman Sachs Concentrated Growth Fund
Portfolio Composition
The Fund invests primarily in U.S. equity investments. The Fund typically holds 30-45 high quality growth companies and tends to be more concentrated in individual holdings, industries and sectors than the typical broadly diversified large-cap growth fund. Since the Fund’s inception, the Goldman Sachs Growth Equity Investment Team has focused on several key investment criteria that it believes can drive a company’s growth over the long term. These characteristics are: dominant market share, established brand name, pricing power, recurring revenue stream, free cash flow, high returns on invested capital, predictable growth, sustainable growth, long product life cycle, enduring competitive advantage, favorable demographic trends and excellent management. The Team strives to purchase these companies at reasonable valuations in order to capture the full benefits of their growth.
Portfolio Management Discussion and Analysis
Below, the Goldman Sachs Growth Equity Investment Team discusses the Goldman Sachs Concentrated Growth Fund’s (the “Fund”) performance and positioning for the six-month period ended February 29, 2012 (the “Reporting Period”).
| |
| Q | How did the Fund perform during the Reporting Period? |
| |
| A | During the Reporting Period, the Fund’s Class A, B, C, Institutional, IR and R Shares generated cumulative total returns, without sales charges, of 14.16%, 13.79%, 13.81%, 14.33%, 14.33% and 14.06%, respectively. These returns compare to the 13.76% cumulative total return of the Fund’s benchmark, the Russell 1000® Growth Index (with dividends reinvested) (the “Russell Index”), during the same period. |
| |
| Q | What key factors were responsible for the Fund’s performance during the Reporting Period? |
| |
| A | Stock selection overall contributed most to the Fund’s performance relative to the Russell Index during the Reporting Period. |
| |
| Q | Which equity market sectors most significantly affected Fund performance? |
| |
| A | Effective stock selection in the consumer discretionary, information technology and telecommunication services sectors helped the Fund’s performance most relative to the Russell Index. Detracting from the Fund’s relative results most was stock selection in the energy and health care sectors. Having an underweighted allocation to industrials, which was one of the stronger performing sectors in the Russell Index during the Reporting Period, also hurt. |
| |
| Q | What were some of the Fund’s best-performing individual stocks? |
| |
| A | The Fund benefited most relative to the Russell Index from positions in home improvement retailer Lowe’s, data center solutions company Equinix and personal computer and mobile communications device giant Apple. |
Lowe’s was a top contributor to the Fund’s relative performance during the Reporting Period as the company beat earnings expectations driven by improved traffic trends and incrementally positive housing market data. Further, Lowe’s management announced a decision to take on more debt in order to fund upcoming share buybacks. We believe this showed a clear commitment by company management to increase return on invested capital. Lowe’s management also took important steps to differentiate Lowe’s from competitors by improving its operational efficiency and implementation of technology. Further, Lowe’s management, in our view, remained focused on more effective marketing techniques and improving in-store format, which we believe will further differentiate Lowe’s in the duopolistic home improvement market going forward.
PORTFOLIO RESULTS
Equinix contributed to the Fund’s performance during the Reporting Period. Its shares rose as the company reported strong fourth quarter results and issued a solid outlook for 2012. As the company continued to evaluate its potential for real estate investment trust (REIT) status, the market began to recognize that Equinix’s shares were trading at a discount to other publicly traded data center REITs. Should the market continue to appreciate the growth and stability of the company’s revenue stream, we believe the valuation gap between Equinix and its peers could narrow. At the end of the Reporting Period, we remained attracted to Equinix’s leading position in operating data centers, which has several secular growth drivers, including cloud computing and online and mobile video demand. (Cloud computing is Internet-based computing, whereby shared resources, software and information are provided to computers and other devices on demand, like the electricity grid.)
Shares of Apple rose during the Reporting Period as sales and earnings continued to exceed analyst expectations driven by strong iPhone and iPad sales. We believe the iPad has joined the iPhone as a key Apple product that has helped the company increase market share and build brand awareness as new customers are exposed to the company’s product offerings. In August 2011, Steve Jobs resigned as Chief Executive Officer of the firm and was succeeded by Chief Operating Officer Tim Cook. While Mr. Jobs’ passing in October was certainly a loss not only to Apple but to U.S. innovation, we believe Apple’s platform is now stronger than ever and can be successfully managed by Mr. Cook and Apple’s seasoned management team.
| |
| Q | Which stocks detracted significantly from the Fund’s performance during the Reporting Period? |
| |
| A | Detracting most from the Fund’s results relative to its benchmark index were positions in medical device company St. Jude Medical, beauty and related products manufacturer Avon Products and oilfield services company Halliburton. |
St. Jude Medical detracted from the Fund’s relative performance most. Medical device company shares broadly came under pressure during the Reporting Period on news that Medicare payment process changes could potentially lead to greater scrutiny of payment for specific high-cost medical device procedures. While fears abated after the Center for Medicare and Medicaid Services announced the program would be limited in scope and breadth, shares of St. Jude Medical were hit once again when the Food and Drug Administration (FDA) issued a recall of its Riata defibrillator, which is no longer one of its marketed products. At the end of the Reporting Period, it was our understanding that concerns regarding the defibrillator were confined to a small subset of the product line and that there was no evidence of any impact to St. Jude Medical’s current product lineup. While we continue to believe that St. Jude Medical has innovative products and attractive end markets and is competitively well positioned in a growing industry over the long term, we decided to trim the Fund’s position in the company and allocate capital to higher conviction ideas.
Within consumer staples, Avon Products detracted from the Fund’s performance during the Reporting Period. Its shares declined after the company announced lower than expected third quarter earnings and lowered its fiscal year 2011 revenue guidance. Avon Products’ earnings were impacted by disappointing sales in select markets and softer margins due to higher input costs. While Avon Products may be poised to deliver higher operating margins over the next few years as its geographic footprint broadens, particularly in Latin America, we decided to trim the Fund’s position and allocate the capital to higher conviction ideas.
After being a top contributor during the prior fiscal year, leading oil services firm Halliburton detracted significantly from the Fund’s returns during the Reporting Period. Despite posting solid second quarter earnings, Halliburton underperformed the broader equity market as expectations of a global economic slowdown and weaker oil prices pressured its shares and contributed to the energy sector’s relative underperformance of the broad U.S. equity market. We acknowledge the economic slowdown and Halliburton’s sensitivity to oil prices, but at the end of the Reporting Period, we continued to believe the company’s risk/reward profile was attractive at then-current valuations. Indeed, we believe Halliburton is gaining share in key markets and can demonstrate pricing power and margin improvement in its North America-based pressure pumping business. We also expect the shift in U.S. drilling activity toward oil/shale plays, or operations, could mitigate volatility.
| |
| Q | How did the Fund use derivatives and similar instruments during the Reporting Period? |
| |
| A | During the Reporting Period, we did not use derivatives as part of an active management strategy. |
PORTFOLIO RESULTS
| |
| Q | Did the Fund make any significant purchases or sales during the Reporting Period? |
| |
| A | We initiated a Fund position in Abbott Laboratories after management announced it would split the company into a branded pharmaceutical company and a diversified medical products company, which is anticipated to result in a tax-free distribution to shareholders by the end of 2012. Abbott Laboratories is a leading global health care company that develops, manufactures and sells a diversified line of health care products. We believe its management’s decision to spin out its branded pharmaceutical business could unlock shareholder value by alleviating the overhang on the stock caused by competitive threats to its Humira arthritis drug. In our view, the patent issues associated with Humira have caused investors to overlook the value of Abbott Laboratories’ line of high growth businesses, namely, medical devices and diagnostics. Shares should benefit going forward, we believe, from increased visibility into underlying businesses, an updated product mix and increased exposure to emerging markets, which at the end of the Reporting Period contributed approximately 40% of the company’s revenues. |
We established a Fund position in T. Rowe Price, a company that provides investment advisory services to individual and institutional investors through its T. Rowe Price mutual funds and other investment portfolios. We viewed this as an attractive entry point into what we consider a high quality asset management franchise with an established brand name, healthy balance sheet and strong operating cash flow. In our view, T. Rowe Price also has a track record of strong, consistent organic growth and of expanding operating margins. Moreover, the company has, we feel, an attractive asset mix and generates a large portion of its revenue from a rather stable retirement distribution channel. The company has also proven to be less sensitive to interest rates relative to several other financials firms, which we view positively given current market conditions.
Conversely, we exited the Fund’s position in home goods retailer Bed Bath and Beyond during the Reporting Period. While its business fundamentals remained solid and management continued to improve margins and grow its store base, we see limited earnings upside from levels seen toward the end of the Reporting Period. Thus, we viewed this as an appropriate time to take profits and reinvest the sales proceeds in businesses we believed to have more attractive risk/reward profiles.
We sold the Fund’s position in Amgen, a biotechnology company that manufactures and markets medicines, during the Reporting Period. While we still believed that Amgen has a strong oncology franchise that has not been reflected in the company’s valuation, the company continued to face challenges in its base business. We decided to sell out of the Fund’s position and reallocate the sales proceeds to higher conviction names.
| |
| Q | Were there any notable changes in the Fund’s weightings during the Reporting Period? |
| |
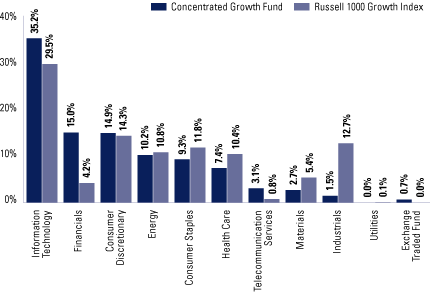
| A | In constructing the Fund’s portfolio, we focus on picking stocks rather than on making industry or sector bets. We seek to outpace the benchmark index by overweighting stocks that we expect to outperform and underweighting those that we think may lag. Consequently, changes in its sector weights are generally the direct result of individual stock selection or of stock appreciation or depreciation. That said, during the Reporting Period, the Fund’s exposure to energy, health care, industrials and telecommunication services decreased and its allocations to consumer discretionary, financials and information technology increased relative to the Russell Index. |
| |
| Q | How was the Fund positioned relative to its benchmark index at the end of February 2012? |
| |
| A | At the end of February 2012, the Fund had overweighted positions relative to the Russell Index in the financials, information technology and telecommunication services sectors. On the same date, the Fund had underweighted positions compared to the Russell Index in industrials, health care, materials and consumer staples and was rather neutrally weighted to the Russell Index in consumer discretionary and energy. The Fund had no position at all in the utilities sector on February 29, 2012. |
FUND BASICS
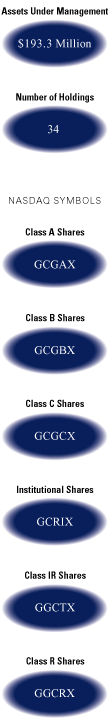
Concentrated Growth Fund
as of February 29, 2012
| | | | | | | | | | | |
| | | Fund Total Return
| | Russell 1000
| | |
| September 1, 2011–February 29, 2012 | | (based on NAV)1 | | Growth Index2 | | |
|
| |
| Class A | | | 14.16 | % | | | 13.76 | % | | |
| Class B | | | 13.79 | | | | 13.76 | | | |
| Class C | | | 13.81 | | | | 13.76 | | | |
| Institutional | | | 14.33 | | | | 13.76 | | | |
| Class IR | | | 14.33 | | | | 13.76 | | | |
| Class R | | | 14.06 | | | | 13.76 | | | |
|
| | |
| 1 | | The net asset value (“NAV”) represents the net assets of the class of the Fund (ex-dividend) divided by the total number of shares of the class outstanding. The Fund’s performance reflects the reinvestment of dividends and other distributions. The Fund’s performance does not reflect the deduction of any applicable sales charges. |
| |
| 2 | | The Russell 1000 Growth Index is an unmanaged index that measures the performance of those Russell 1000 companies with higher price-to-book ratios and higher forecasted growth values. The Index figures do not reflect any deduction for fees, expenses or taxes. It is not possible to invest directly in an index. |
| |
| STANDARDIZED TOTAL RETURNS3 | |
| | | | | | | | | | | | | | | | | |
| For the period ended 12/31/11 | | One Year | | Five Years | | Since Inception | | Inception Date | | |
|
| |
| Class A | | | -8.60 | % | | | -0.98 | % | | | 3.65 | % | | 9/03/02 | | |
| Class B | | | -8.78 | | | | -1.02 | | | | 3.61 | | | 9/03/02 | | |
| Class C | | | -4.87 | | | | -0.60 | | | | 3.48 | | | 9/03/02 | | |
| Institutional | | | -2.90 | | | | 0.54 | | | | 4.68 | | | 9/03/02 | | |
| Class IR | | | -3.02 | | | | N/A | | | | -2.59 | | | 11/30/07 | | |
| Class R | | | -3.52 | | | | N/A | | | | -3.03 | | | 11/30/07 | | |
|
| | |
| 3 | | The Standardized Total Returns are average annual total returns as of the most recent calendar quarter-end. They assume reinvestment of all distributions at NAV. These returns reflect a maximum initial sales charge of 5.5% for Class A Shares and the assumed contingent deferred sales charge for Class B Shares (5% maximum declining to 0% after six years) and the assumed contingent deferred sales charge for Class C Shares (1% if redeemed within 12 months of purchase). Class B Shares automatically convert to Class A Shares on or about the fifteenth day of the last month of the calendar year that is eight years after purchase. Returns for Class B Shares for the period after the conversion reflect the performance of Class A Shares. Because Institutional, Class IR and Class R Shares do not involve a sales charge, such a charge is not applied to their Standardized Total Returns. The Fund’s Class B Shares are no longer available for purchase by new or existing shareholders (although current Class B shareholders may continue to reinvest income and capital gains distributions into Class B Shares, and Class B shareholders may continue to exchange their shares for Class B Shares of certain other Goldman Sachs Funds). |
| |
| | The returns represent past performance. Past performance does not guarantee future results. The Fund’s investment return and principal value will fluctuate so that an investor’s shares, when redeemed, may be worth more or less than their original cost. Current performance may be lower or higher than the performance quoted above. Please visit our website at www.goldmansachsfunds.com to obtain the most recent month-end returns. Performance reflects fee waivers and/or expense limitations in effect. In their absence, performance would be reduced. Returns do not reflect the deduction of taxes that a shareholder would pay on Fund distributions or the redemption of Fund shares. |
FUND BASICS
| | | | | | | | | | | |
| | | Net Expense Ratio (Current) | | Gross Expense Ratio (Before Waivers) | | |
|
| |
| Class A | | | 1.26 | % | | | 1.56 | % | | |
| Class B | | | 2.01 | | | | 2.31 | | | |
| Class C | | | 2.01 | | | | 2.31 | | | |
| Institutional | | | 0.86 | | | | 1.16 | | | |
| Class IR | | | 1.01 | | | | 1.31 | | | |
| Class R | | | 1.51 | | | | 1.81 | | | |
|
| | |
| 4 | | The expense ratios of the Fund, both current (net of applicable fee waivers and/or expense limitations) and before waivers (gross of applicable fee waivers and/or expense limitations) are as set forth above according to the most recent publicly available Prospectus for the Fund and may differ from the expense ratios disclosed in the Financial Highlights in this report. The Fund’s waivers and/or expense limitations will remain in place through at least December 29, 2012, and prior to such date the investment adviser may not terminate the arrangements without the approval of the Fund’s Board of Trustees. If these arrangements are discontinued in the future, the expense ratios may change without shareholder approval. |
| |
| TOP TEN HOLDINGS AS OF 2/29/125 | |
| | | | | | | | | |
| Holding | | % of Net Assets | | Line of Business | | |
|
| |
| Apple, Inc. | | | 9.1 | % | | Computers & Peripherals | | |
| QUALCOMM, Inc. | | | 6.1 | | | Communications Equipment | | |
| American Tower Corp. | | | 5.3 | | | Real Estate Investment Trusts | | |
| Schlumberger Ltd. | | | 4.5 | | | Energy Equipment & Services | | |
| Google, Inc. Class A | | | 4.5 | | | Internet Software & Services | | |
| Lowe’s Cos., Inc. | | | 3.6 | | | Specialty Retail | | |
| MasterCard, Inc. Class A | | | 3.6 | | | IT Services | | |
| NIKE, Inc. Class B | | | 3.6 | | | Textiles, Apparel & Luxury Goods | | |
| Costco Wholesale Corp. | | | 3.3 | | | Food & Staples Retailing | | |
| Oracle Corp. | | | 3.1 | | | Software | | |
|
| | |
| 5 | | The top 10 holdings may not be representative of the Fund’s future investments. |
FUND BASICS
| |
| FUND VS. BENCHMARK SECTOR ALLOCATION6 | |
As of February 29, 2012
| | |
| 6 | | The Fund is actively managed and, as such, its composition may differ over time. Consequently, the Fund’s overall sector allocations may differ from the percentages contained in the graph above. The graph categorizes investments using Global Industry Classification Standard (“GICS”), however, the sector classifications used by the portfolio management team may differ from GICS. Underlying sector allocations of Exchange Traded Funds held by the Fund are not reflected in the graph above. The percentage shown for each investment category reflects the value of investments in that category as a percentage of market value. The graph depicts the Fund’s investments but may not represent the Fund’s market exposure due to the exclusion of certain derivatives, if any, as listed in the Additional Investment Information section of the Schedule of Investments. |
PORTFOLIO RESULTS
Goldman Sachs Flexible Cap Growth Fund
Portfolio Composition
The Fund invests primarily in U.S. equity investments in small-, mid- and large-capitalization issuers. Since the Fund’s inception, the Goldman Sachs Growth Equity Investment Team has focused on several key investment criteria that it believes can drive a company’s growth over the long term. These characteristics are: dominant market share, established brand name, pricing power, recurring revenue stream, free cash flow, high returns on invested capital, predictable growth, sustainable growth, long product life cycle, enduring competitive advantage, favorable demographic trends and excellent management. The Team strives to purchase these companies at reasonable valuations in order to capture the full benefits of their growth.
Portfolio Management Discussion and Analysis
Below, the Goldman Sachs Growth Equity Investment Team discusses the Goldman Sachs Flexible Cap Growth Fund’s (the “Fund”) performance and positioning for the six-month period ended February 29, 2012 (the “Reporting Period”).
| |
| Q | How did the Fund perform during the Reporting Period? |
| |
| A | During the Reporting Period, the Fund’s Class A, C, Institutional, IR and R Shares generated cumulative total returns, without sales charges, of 13.69%, 13.35%, 13.95%, 13.93% and 13.60%, respectively. These returns compare to the 13.71% cumulative total return of the Fund’s benchmark, the Russell 3000® Growth Index (with dividends reinvested) (the “Russell Index”), during the same period. |
| |
| Q | What key factors were responsible for the Fund’s performance during the Reporting Period? |
| |
| A | Stock selection overall contributed most to the Fund’s performance relative to the Russell Index during the Reporting Period. |
| |
| Q | Which equity market sectors most significantly affected Fund performance? |
| |
| A | Effective stock selection in the consumer discretionary and information technology sectors helped the Fund’s performance most relative to the Russell Index. Having an underweighted allocation to materials, which though considered an economically-sensitive sector lagged the Russell Index during the Reporting Period, also boosted Fund results. Overall positioning in only two sectors detracted from the Fund’s results during the Reporting Period. Detracting from the Fund’s relative results was stock selection in the health care sector and having an underweighted exposure to industrials, which outpaced the Russell Index. |
| |
| Q | What were some of the Fund’s best-performing individual stocks? |
| |
| A | The Fund benefited most relative to the Russell Index from positions in personal computer and mobile communications device giant Apple, home improvement retailer Lowe’s and data center solutions company Equinix. |
Shares of Apple rose during the Reporting Period as sales and earnings continued to exceed analyst expectations driven by strong iPhone and iPad sales. We believe the iPad has joined the iPhone as a key Apple product that has helped the company increase market share and build brand awareness as new customers are exposed to the company’s product offerings. In August 2011, Steve Jobs resigned as Chief Executive Officer of the firm and was succeeded by Chief Operating Officer Tim Cook. While Mr. Jobs’ passing in October was certainly a loss not only to Apple but to U.S. innovation, we believe Apple’s platform is now stronger than ever and can be successfully managed by Mr. Cook and Apple’s seasoned management team.
Lowe’s was a top contributor to the Fund’s relative performance during the Reporting Period as the company beat earnings expectations driven by improved traffic trends and incrementally positive housing market data. Further, Lowe’s management announced a decision to take on more debt in order to fund upcoming share buybacks. We believe this showed a clear commitment by company management to increase return invested capital. Lowe’s management also took important steps to differentiate Lowe’s from competitors by improving its operational efficiency and
PORTFOLIO RESULTS
implementation of technology. Further, Lowe’s management, in our view, remained focused on more effective marketing techniques and improving in-store format, which we believe will further differentiate Lowe’s in the duopolistic home improvement market going forward.
Equinix contributed to the Fund’s performance during the Reporting Period. Its shares rose as the company reported strong fourth quarter results and issued a solid outlook for 2012. As the company continued to evaluate its potential for real estate investment trust (REIT) status, the market began to recognize that Equinix’s shares were trading at a discount to other publicly traded data center REITs. Should the market continue to appreciate the growth and stability of the company’s revenue stream, we believe the valuation gap between Equinix and its peers could narrow. At the end of the Reporting Period, we remained attracted to Equinix’s leading position in operating data centers, which has several secular growth drivers, including cloud computing and online and mobile video demand. (Cloud computing is Internet-based computing, whereby shared resources, software and information are provided to computers and other devices on demand, like the electricity grid.)
| |
| Q | Which stocks detracted significantly from the Fund’s performance during the Reporting Period? |
| |
| A | Detracting most from the Fund’s results relative to its benchmark index were positions in medical device company St. Jude Medical, oilfield services company Halliburton and beauty and related products manufacturer Avon Products. |
St. Jude Medical detracted from the Fund’s relative performance most. Medical device company shares broadly came under pressure during the Reporting Period on news that Medicare payment process changes could potentially lead to greater scrutiny of payment for specific high-cost medical device procedures. While fears abated after the Center for Medicare and Medicaid Services announced the program would be limited in scope and breadth, shares of St. Jude Medical were hit once again when the Food and Drug Administration (FDA) issued a recall of its Riata defibrillator, which is no longer one of its marketed products. At the end of the Reporting Period, it was our understanding that concerns regarding the defibrillator were confined to a small subset of the product line and that there was no evidence of any impact to St. Jude Medical’s current product lineup. While we continue to believe that St. Jude Medical has innovative products and attractive end markets and is competitively well positioned in a growing industry over the long term, we decided to trim the Fund’s position in the company and allocate capital to higher conviction ideas.
Leading oil services firm Halliburton detracted significantly from the Fund’s returns during the Reporting Period. Despite posting solid second quarter earnings, Halliburton underperformed the broader equity market as expectations of a global economic slowdown and weaker oil prices pressured its shares and contributed to the energy sector’s relative underperformance of the broad U.S. equity market. We acknowledge the economic slowdown and Halliburton’s sensitivity to oil prices, but at the end of the Reporting Period, we continued to believe the company’s risk/reward profile was attractive at then-current valuations. Indeed, we believe Halliburton is gaining share in key markets and can demonstrate pricing power and margin improvement in its North America-based pressure pumping business. We also expect the shift in U.S. drilling activity toward oil/shale plays, or operations, could mitigate volatility.
Within consumer staples, Avon Products detracted from the Fund’s performance during the Reporting Period. Its shares declined after the company announced lower than expected third quarter earnings and lowered its fiscal year 2011 revenue guidance. Avon Products’ earnings were impacted by disappointing sales in select markets and softer margins due to higher input costs. While Avon Products may be poised to deliver higher operating margins over the next few years as its geographic footprint broadens, particularly in Latin America, we decided to trim the Fund’s position and allocate the capital to higher conviction ideas.
| |
| Q | How did the Fund use derivatives and similar instruments during the Reporting Period? |
| |
| A | During the Reporting Period, we did not use derivatives as part of an active management strategy. |
PORTFOLIO RESULTS
| |
| Q | Did the Fund make any significant purchases or sales during the Reporting Period? |
| |
| A | We initiated a Fund position in Abbott Laboratories after management announced it would split the company into a branded pharmaceutical company and a diversified medical products company, which is anticipated to result in a tax-free distribution to shareholders by the end of 2012. Abbott Laboratories is a leading global health care company that develops, manufactures and sells a diversified line of health care products. We believe its management’s decision to spin out its branded pharmaceutical business could unlock shareholder value by alleviating the overhang on the stock caused by competitive threats to its Humira arthritis drug. In our view, the patent issues associated with Humira have caused investors to overlook the value of Abbott Laboratories’ line of high growth businesses, namely, medical devices and diagnostics. Shares should benefit going forward, we believe, from increased visibility into underlying businesses, an updated product mix and increased exposure to emerging markets, which at the end of the Reporting Period contributed approximately 40% of the company’s revenues. |
We established a Fund position in e-commerce company Priceline.com. We believe Priceline.com is well positioned in the online travel business given its exposure to North America through booking.com, to Europe through its TravelJigsaw business, and to Asia through its Agoda business. In addition, we believe Priceline.com’s competitive advantage is its technology, which offers travelers and both hotels and car rental companies a more efficient method by which to connect. In our view, Priceline.com has strong self-reinforcing barriers to entry that should enable the company to establish its dominance in the online travel industry.
Conversely, we exited the Fund’s position in home goods retailer Bed Bath and Beyond during the Reporting Period. While its business fundamentals remained solid and management continued to improve margins and grow its store base, we see limited earnings upside from levels seen toward the end of the Reporting Period. Thus, we viewed this as an appropriate time to take profits and reinvest the sales proceeds in businesses we believed to have more attractive risk/reward profiles.
We sold the Fund’s position in Amgen, a biotechnology company that manufactures and markets medicines, during the Reporting Period. While we still believed that Amgen has a strong oncology franchise that has not been reflected in the company’s valuation, the company continued to face challenges in its base business. We decided to sell out of the Fund’s position and reallocate the sales proceeds to higher conviction names.
| |
| Q | Were there any notable changes in the Fund’s weightings during the Reporting Period? |
| |
| A | In constructing the Fund’s portfolio, we focus on picking stocks rather than on making industry or sector bets. We seek to outpace the benchmark index by overweighting stocks that we expect to outperform and underweighting those that we think may lag. Consequently, changes in its sector weights are generally the direct result of individual stock selection or of stock appreciation or depreciation. That said, during the Reporting Period, the Fund’s exposure to health care decreased and its allocations to consumer discretionary, consumer staples and financials increased relative to the Russell Index. |
| |
| Q | How was the Fund positioned relative to its benchmark index at the end of February 2012? |
| |
| A | At the end of February 2012, the Fund had overweighted positions relative to the Russell Index in the financials, information technology, consumer discretionary and telecommunication services sectors. On the same date, the Fund had underweighted positions compared to the Russell Index in industrials, consumer staples and materials and was rather neutrally weighted to the Russell Index in energy and health care. The Fund had no position at all in the utilities sector on February 29, 2012. |
FUND BASICS
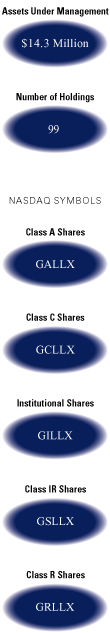
Flexible Cap Growth Fund
as of February 29, 2012
| | | | | | | | | | | |
| | | Fund Total Return
| | Russell 3000
| | |
| September 1, 2011–February 29, 2012 | | (based on NAV)1 | | Growth Index2 | | |
|
| |
| Class A | | | 13.69 | % | | | 13.71 | % | | |
| Class C | | | 13.35 | | | | 13.71 | | | |
| Institutional | | | 13.95 | | | | 13.71 | | | |
| Class IR | | | 13.93 | | | | 13.71 | | | |
| Class R | | | 13.60 | | | | 13.71 | | | |
|
| | |
| 1 | | The net asset value (“NAV”) represents the net assets of the class of the Fund (ex-dividend) divided by the total number of shares of the class outstanding. The Fund’s performance reflects the reinvestment of dividends and other distributions. The Fund’s performance does not reflect the deduction of any applicable sales charges. |
| |
| 2 | | The unmanaged Russell 3000 Growth Index measures the performance of the 3,000 largest U.S. companies based on total market capitalization. The Index figures do not reflect any deduction for fees, expenses or taxes. It is not possible to invest directly in an index. |
| |
| STANDARDIZED TOTAL RETURNS3 | |
| | | | | | | | | | | | | |
| For the period ended 12/31/11 | | One Year | | Since Inception | | Inception Date | | |
|
| |
| Class A | | | -10.45 | % | | | 1.11 | % | | 1/31/08 | | |
| Class C | | | -6.85 | | | | 1.86 | | | 1/31/08 | | |
| Institutional | | | -4.90 | | | | 3.00 | | | 1/31/08 | | |
| Class IR | | | -5.01 | | | | 2.86 | | | 1/31/08 | | |
| Class R | | | -5.46 | | | | 2.35 | | | 1/31/08 | | |
|
| | |
| 3 | | The Standardized Total Returns are average annual total returns as of the most recent calendar quarter-end. They assume reinvestment of all distributions at NAV. These returns reflect a maximum initial sales charge of 5.5% for Class A Shares and the assumed contingent deferred sales charge for Class C Shares (1% if redeemed within 12 months of purchase). Because Institutional, Class IR and Class R Shares do not involve a sales charge, such a charge is not applied to their Standardized Total Returns. |
| |
| | The returns represent past performance. Past performance does not guarantee future results. The Fund’s investment return and principal value will fluctuate so that an investor’s shares, when redeemed, may be worth more or less than their original cost. Current performance may be lower or higher than the performance quoted above. Please visit our website at www.goldmansachsfunds.com to obtain the most recent month-end returns. Performance reflects fee waivers and/or expense limitations in effect. In their absence, performance would be reduced. Returns do not reflect the deduction of taxes that a shareholder would pay on Fund distributions or the redemption of Fund shares. |
FUND BASICS
| | | | | | | | | | | |
| | | Net Expense Ratio (Current) | | Gross Expense Ratio (Before Waivers) | | |
|
| |
| Class A | | | 1.26 | % | | | 2.59 | % | | |
| Class C | | | 2.01 | | | | 3.34 | | | |
| Institutional | | | 0.86 | | | | 2.19 | | | |
| Class IR | | | 1.01 | | | | 2.34 | | | |
| Class R | | | 1.51 | | | | 2.84 | | | |
|
| | |
| 4 | | The expense ratios of the Fund, both current (net of applicable fee waivers and/or expense limitations) and before waivers (gross of applicable fee waivers and/or expense limitations) are as set forth above according to the most recent publicly available Prospectus for the Fund and may differ from the expense ratios disclosed in the Financial Highlights in this report. The Fund’s waivers and/or expense limitations will remain in place through at least December 29, 2012, and prior to such date the investment adviser may not terminate the arrangements without the approval of the Fund’s Board of Trustees. If these arrangements are discontinued in the future, the expense ratios may change without shareholder approval. |
| |
| TOP TEN HOLDINGS AS OF 2/29/125 | |
| | | | | | | | | |
| Holding | | % of Net Assets | | Line of Business | | |
|
| |
| Apple, Inc. | | | 7.5 | % | | Computers & Peripherals | | |
| QUALCOMM, Inc. | | | 3.3 | | | Communications Equipment | | |
| Google, Inc. Class A | | | 3.0 | | | Internet Software & Services | | |
| Schlumberger Ltd. | | | 2.9 | | | Energy Equipment & Services | | |
| Microsoft Corp. | | | 2.1 | | | Software | | |
| Oracle Corp. | | | 1.9 | | | Software | | |
| Amazon.com, Inc. | | | 1.9 | | | Internet & Catalog Retail | | |
| Costco Wholesale Corp. | | | 1.8 | | | Food & Staples Retailing | | |
| Kennametal, Inc. | | | 1.7 | | | Machinery | | |
| Honeywell International, Inc. | | | 1.6 | | | Aerospace & Defense | | |
|
| | |
| 5 | | The top 10 holdings may not be representative of the Fund’s future investments. |
FUND BASICS
| |
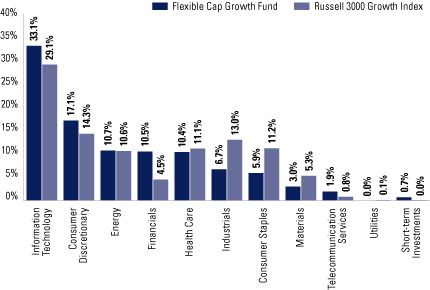
| FUND VS. BENCHMARK SECTOR ALLOCATION6 | |
As of February 29, 2012
| | |
| 6 | | The Fund is actively managed and, as such, its composition may differ over time. Consequently, the Fund’s overall sector allocations may differ from the percentages contained in the graph above. The graph categorizes investments using Global Industry Classification Standard (“GICS”), however, the sector classifications used by the portfolio management team may differ from GICS. The percentage shown for each investment category reflects the value of investments in that category as a percentage of market value. Short-term investments represent repurchase agreements. The graph depicts the Fund’s investments but may not represent the Fund’s market exposure due to the exclusion of certain derivatives, if any, as listed in the Additional Investment Information section of the Schedule of Investments. |
PORTFOLIO RESULTS
Goldman Sachs Focused Growth Fund
Portfolio Composition
The Fund invests primarily in U.S. equity investments. Since the Fund’s inception, the Goldman Sachs Growth Equity Investment Team has focused on several key investment criteria that it believes can drive a company’s growth over the long term. These characteristics are: dominant market share, established brand name, pricing power, recurring revenue stream, free cash flow, high returns on invested capital, predictable growth, sustainable growth, long product life cycle, enduring competitive advantage, favorable demographic trends and excellent management. The Team strives to purchase these companies at reasonable valuations in order to capture the full benefits of their growth.
Portfolio Management Discussion and Analysis
The Goldman Sachs Focused Growth Fund (the “Fund”) launched on January 31, 2012. Below is the Fund’s performance for the one-month period from the Fund’s inception on January 31, 2012 through February 29, 2012 (the “Reporting Period”).
| |
| Q | How did the Fund perform during the Reporting Period? |
| |
| A | During the Reporting Period, the Fund’s Class A, C, Institutional, IR and R Shares generated cumulative total returns, without sales charges, of 6.50%, 6.50%, 6.50%, 6.50% and 6.50%, respectively. These returns compare to the 4.78% cumulative total return of the Fund’s benchmark, the Russell 1000® Growth Index (with dividends reinvested) (the “Russell Index”), during the same period. |
A discussion by the Goldman Sachs Growth Equity Investment Team of the Fund’s performance and positioning will be presented in the Fund’s annual report to be dated August 31, 2012.
FUND BASICS
Focused Growth Fund
as of February 29, 2012
| | | | | | | | | | | |
| | | Fund Total Return
| | Russell 1000
| | |
| January 31, 2012–February 29, 2012 | | (based on NAV)1 | | Growth Index2 | | |
|
| |
| Class A | | | 6.50 | % | | | 4.78 | % | | |
| Class C | | | 6.50 | | | | 4.78 | | | |
| Institutional | | | 6.50 | | | | 4.78 | | | |
| Class IR | | | 6.50 | | | | 4.78 | | | |
| Class R | | | 6.50 | | | | 4.78 | | | |
|
| | |
| 1 | | The net asset value (“NAV”) represents the net assets of the class of the Fund (ex-dividend) divided by the total number of shares of the class outstanding. The Fund’s performance reflects the reinvestment of dividends and other distributions. The Fund’s performance does not reflect the deduction of any applicable sales charges. |
| |
| 2 | | The unmanaged Russell 3000 Growth Index measures the performance of the 3,000 largest U.S. companies based on total market capitalization. The Index figures do not reflect any deduction for fees, expenses or taxes. It is not possible to invest directly in an index. |
| | | | | | | | | | | |
| | | Net Expense Ratio (Current) | | Gross Expense Ratio (Before Waivers) | | |
|
| |
| Class A | | | 1.24 | % | | | 2.79 | % | | |
| Class C | | | 1.99 | | | | 3.54 | | | |
| Institutional | | | 0.84 | | | | 2.39 | | | |
| Class IR | | | 0.99 | | | | 2.54 | | | |
| Class R | | | 1.49 | | | | 3.04 | | | |
|
| | |
| 3 | | The expense ratios of the Fund, both current (net of applicable fee waivers and/or expense limitations) and before waivers (gross of applicable fee waivers and/or expense limitations) are as set forth above according to the most recent publicly available Prospectus for the Fund and may differ from the expense ratios disclosed in the Financial Highlights in this report. The Fund’s waivers and/or expense limitations will remain in place through at least January 31, 2013, and prior to such date the investment adviser may not terminate the arrangements without the approval of the Fund’s Board of Trustees. If these arrangements are discontinued in the future, the expense ratios may change without shareholder approval. |
| |
| TOP TEN HOLDINGS AS OF 2/29/124 | |
| | | | | | | |
| Holding | | % of Net Assets | | Line of Business |
|
| |
| Apple, Inc. | | | 8.9 | % | | Computers & Peripherals |
| American Tower Corp. | | | 6.4 | | | Real Estate Investment Trusts |
| QUALCOMM, Inc. | | | 6.3 | | | Communications Equipment |
| Google, Inc. Class A | | | 5.9 | | | Internet Software & Services |
| Costco Wholesale Corp. | | | 4.9 | | | Food & Staples Retailing |
| PVH Corp. | | | 4.6 | | | Textiles, Apparel & Luxury Goods |
| CME Group, Inc. | | | 4.5 | | | Diversified Financial Services |
| Equinix, Inc. | | | 4.3 | | | Internet Software & Services |
| CBRE Group, Inc. Class A | | | 4.2 | | | Real Estate Management & Development |
| St. Jude Medical, Inc. | | | 4.0 | | | Health Care Equipment & Supplies |
|
| | |
| 4 | | The top 10 holdings may not be representative of the Fund’s future investments. |
FUND BASICS
| |
| FUND VS. BENCHMARK SECTOR ALLOCATION5 | |
As of February 29, 2012
| | |
| 5 | | The Fund is actively managed and, as such, its composition may differ over time. Consequently, the Fund’s overall sector allocations may differ from the percentages contained in the graph above. The graph categorizes investments using Global Industry Classification Standard (“GICS”), however, the sector classifications used by the portfolio management team may differ from GICS. The percentage shown for each investment category reflects the value of investments in that category as a percentage of market value. The graph depicts the Fund’s investments but may not represent the Fund’s market exposure due to the exclusion of certain derivatives, if any, as listed in the Additional Investment Information section of the Schedule of Investments. |
PORTFOLIO RESULTS
Goldman Sachs Growth Opportunities Fund
Portfolio Composition
The Fund invests primarily in medium-sized growth companies with a market capitalization between $1 and $10 billion. Since the Fund’s inception, the Goldman Sachs Growth Equity Investment Team has focused on several key investment criteria that it believes can drive a company’s growth over the long term. These characteristics are: dominant market share, established brand name, pricing power, recurring revenue stream, free cash flow, high returns on invested capital, predictable growth, sustainable growth, long product life cycle, enduring competitive advantage, favorable demographic trends and excellent management. The Team strives to purchase these companies at reasonable valuations in order to capture the full benefits of their growth.
Portfolio Management Discussion and Analysis
Below, the Goldman Sachs Growth Equity Investment Team discusses the Goldman Sachs Growth Opportunities Fund’s (the “Fund”) performance and positioning for the six-month period ended February 29, 2012 (the “Reporting Period”).
| |
| Q | How did the Fund perform during the Reporting Period? |
| |
| A | During the Reporting Period, the Fund’s Class A, B, C, Institutional, Service, IR and R Shares generated cumulative total returns, without sales charges, of 17.01%, 16.60%, 16.59%, 17.28%, 16.96%, 17.17% and 16.87%, respectively. These returns compare to the 12.10% cumulative total return of the Fund’s benchmark, the Russell Midcap® Growth Index (with dividends reinvested) (the “Russell Index”), during the same period. |
| |
| Q | What key factors were responsible for the Fund’s performance during the Reporting Period? |
| |
| A | Stock selection overall contributed most to the Fund’s performance relative to the Russell Index during the Reporting Period. |
| |
| Q | Which equity market sectors most significantly affected Fund performance? |
| |
| A | Effective stock selection in the consumer discretionary, information technology and energy sectors helped the Fund’s performance most relative to the Russell Index. Overall positioning in only one sector detracted from the Fund’s results during the Reporting Period. Detracting from the Fund’s relative results was stock selection in the industrials sector and having an underweighted exposure to industrials, which outpaced the Russell Index. |
| |
| Q | What were some of the Fund’s best-performing individual stocks? |
| |
| A | The Fund benefited most relative to the Russell Index from positions in business execution software provider SuccessFactors, pharmaceuticals company Pharmasset and data center solutions company Equinix. |
SuccessFactors was the greatest contributor to the Fund’s relative results during the Reporting Period. Its shares rose after the company agreed to be acquired by SAP at a significant premium to the previous close. We subsequently exited the Fund’s position in SuccessFactors, taking profits. Similarly, Pharmasset was a top contributor to the Fund’s performance, with its shares rising after the company agreed to be acquired by Gilead Sciences at a significant premium to the previous close. We believe that acquisitions demonstrate one method by which the valuation gap between a company’s stock price and the intrinsic worth of the franchise can close quickly when other business buyers recognize the company’s long-term growth potential.
Equinix contributed to the Fund’s performance during the Reporting Period. Its shares rose as the company reported strong fourth quarter results and issued a solid outlook for 2012. As the company continued to evaluate its potential for real estate investment trust (REIT) status, the market began to recognize that Equinix’s shares were trading at a discount to other publicly traded data center REITs. Should the market continue to appreciate the growth and stability of the company’s revenue stream, we believe the valuation gap between Equinix and its peers could narrow. At the end of the Reporting Period, we remained attracted to Equinix’s
PORTFOLIO RESULTS
leading position in operating data centers, which has several secular growth drivers, including cloud computing and online and mobile video demand. (Cloud computing is Internet-based computing, whereby shared resources, software and information are provided to computers and other devices on demand, like the electricity grid.)
| |
| Q | Which stocks detracted significantly from the Fund’s performance during the Reporting Period? |
| |
| A | Detracting most from the Fund’s results relative to its benchmark index were positions in medical device company St. Jude Medical, virtual reality products company RealD and satellite telecommunications company DigitalGlobe. |
St. Jude Medical detracted from the Fund’s relative performance most. Medical device company shares broadly came under pressure during the Reporting Period on news that Medicare payment process changes could potentially lead to greater scrutiny of payment for specific high-cost medical device procedures. While fears abated after the Center for Medicare and Medicaid Services announced the program would be limited in scope and breadth, shares of St. Jude Medical were hit once again when the Food and Drug Administration (FDA) issued a recall of its Riata defibrillator, which is no longer one of its marketed products. At the end of the Reporting Period, it was our understanding that concerns regarding the defibrillator were confined to a small subset of the product line and that there was no evidence of any impact to St. Jude Medical’s current product lineup. While we continue to believe that St. Jude Medical has innovative products and attractive end markets and is competitively well positioned in a growing industry over the long term, we decided to trim the Fund’s position in the company and allocate capital to higher conviction ideas.
RealD, a company that designs, manufactures and licenses 3D (three-dimension) technology, detracted from the Fund’s relative performance. The company reported disappointing earnings results as the revenues from recently released 3D blockbuster movies lagged those of 3D films that were released over the prior year. Despite these challenging comparisons year-over-year, we continued, at the end of the Reporting Period, to believe RealD is a market leader in 3D technology that should benefit from continued 3D movie adoption. In our view, RealD was well positioned for long-term growth, as 3D movies begin to gain share of total box office revenues.
DigitalGlobe, a leading provider of high quality satellite and aerial imagery to government and consumer services, detracted from the Fund’s relative returns. Its shares fell due to concerns over the impact government budget cuts might have on DigitalGlobe’s U.S. defense business. At the end of the Reporting Period, we continued to view the company as a market leader in a growing industry with high barriers to entry. The company operates a cash flow generating business with high margins, facilitating the delivery of current, high resolution imagery to desktop applications, portals, intranets and mobile devices. Over the long term, we believe DigitalGlobe is well positioned to benefit from the secular growth trends in satellite and aerial imagery.
| |
| Q | How did the Fund use derivatives and similar instruments during the Reporting Period? |
| |
| A | During the Reporting Period, we did not use derivatives as part of an active management strategy. |
| |
| Q | Did the Fund make any significant purchases or sales during the Reporting Period? |
| |
| A | During the Reporting Period, we initiated a Fund position in luxury retailer Tiffany & Co., a company that we believe has one of the strongest brands in the retail industry. Tiffany & Co. has demonstrated the power of its brand by successfully entering and expanding into new markets. Given its strong brand name, we believe the company may well grow its store base and should have the ability to pass on price increases to its consumers. |
We established a Fund position in Vertex Pharmaceuticals, a company that manufactures and markets medicines. We believe Vertex Pharmaceuticals is well positioned due to its strong pipeline of drugs coupled with its cystic fibrosis franchise. In addition, we believe the company could benefit from long-term growth opportunities as its virology and immunology franchises mature.
Conversely, in addition to the sale of SuccessFactors, already mentioned, we exited the Fund’s position in home goods retailer Bed Bath and Beyond during the Reporting Period. While its business fundamentals remained solid and management continued to improve margins and grow its store base, we see limited earnings upside from levels seen toward the end of the Reporting Period. Thus, we viewed this as an appropriate time to take profits and reinvest the sales proceeds in businesses we believed to have more attractive risk/reward profiles.
PORTFOLIO RESULTS
| |
| Q | Were there any notable changes in the Fund’s weightings during the Reporting Period? |
| |
| A | In constructing the Fund’s portfolio, we focus on picking stocks rather than on making industry or sector bets. We seek to outpace the benchmark index by overweighting stocks that we expect to outperform and underweighting those that we think may lag. Consequently, changes in its sector weights are generally the direct result of individual stock selection or of stock appreciation or depreciation. That said, during the Reporting Period, the Fund’s exposure to information technology and industrials decreased and its allocations to consumer discretionary, consumer staples, energy, financials and health care increased relative to the Russell Index. |
| |
| Q | How was the Fund positioned relative to its benchmark index at the end of February 2012? |
| |
| A | At the end of February 2012, the Fund had overweighted positions relative to the Russell Index in the financials, telecommunication services, information technology and energy sectors. On the same date, the Fund had underweighted positions compared to the Russell Index in industrials, materials and consumer staples. The Fund was rather neutrally weighted to the Russell Index in consumer discretionary and health care and had no position at all in utilities on February 29, 2012. |
FUND BASICS
Growth Opportunities Fund
as of February 29, 2012
| | | | | | | | | | | |
| | | Fund Total Return
| | Russell Midcap
| | |
| September 1, 2011–February 29, 2012 | | (based on NAV)1 | | Growth Index2 | | |
|
| |
| Class A | | | 17.01 | % | | | 12.10 | % | | |
| Class B | | | 16.60 | | | | 12.10 | | | |
| Class C | | | 16.59 | | | | 12.10 | | | |
| Institutional | | | 17.28 | | | | 12.10 | | | |
| Service | | | 16.96 | | | | 12.10 | | | |
| Class IR | | | 17.17 | | | | 12.10 | | | |
| Class R | | | 16.87 | | | | 12.10 | | | |
|
| | |
| 1 | | The net asset value (“NAV”) represents the net assets of the class of the Fund (ex-dividend) divided by the total number of shares of the class outstanding. The Fund’s performance reflects the reinvestment of dividends and other distributions. The Fund’s performance does not reflect the deduction of any applicable sales charges. |
| |
| 2 | | The Russell Midcap Growth Index is an unmanaged market capitalization weighted index that measures the performance of those Russell Midcap companies with higher price-to-book ratios and higher forecasted growth values. The Index figures do not reflect any deduction for fees, expenses or taxes. It is not possible to invest directly in an index. |
| |
| STANDARDIZED TOTAL RETURNS3 | |
| | | | | | | | | | | | | | | | | | | | | |
| For the period ended 12/31/11 | | One Year | | Five Years | | Ten Years | | Since Inception | | Inception Date | | |
|
| |
| Class A | | | -9.35 | % | | | 3.88 | % | | | 4.12 | % | | | 9.25 | % | | 5/24/99 | | |
| Class B | | | -9.60 | | | | 3.85 | | | | 4.07 | | | | 9.27 | | | 5/24/99 | | |
| Class C | | | -5.74 | | | | 4.28 | | | | 3.93 | | | | 8.92 | | | 5/24/99 | | |
| Institutional | | | -3.70 | | | | 5.48 | | | | 5.13 | | | | 10.17 | | | 5/24/99 | | |
| Service | | | -4.17 | | | | 4.96 | | | | 4.61 | | | | 9.62 | | | 5/24/99 | | |
| Class IR | | | -3.81 | | | | N/A | | | | N/A | | | | 2.46 | | | 11/30/07 | | |
| Class R | | | -4.30 | | | | N/A | | | | N/A | | | | 1.97 | | | 11/30/07 | | |
|
| | |
| 3 | | The Standardized Total Returns are average annual total returns as of the most recent calendar quarter-end. They assume reinvestment of all distributions at NAV. These returns reflect a maximum initial sales charge of 5.5% for Class A Shares and the assumed contingent deferred sales charge for Class B Shares (5% maximum declining to 0% after six years) and the assumed contingent deferred sales charge for Class C Shares (1% if redeemed within 12 months of purchase). Class B Shares automatically convert to Class A Shares on or about the fifteenth day of the last month of the calendar year that is eight years after purchase. Returns for Class B Shares for the period after the conversion reflect the performance of Class A Shares. Because Institutional, Service, Class IR and Class R Shares do not involve a sales charge, such a charge is not applied to their Standardized Total Returns. The Fund’s Class B Shares are no longer available for purchase by new or existing shareholders (although current Class B shareholders may continue to reinvest income and capital gains distributions into Class B Shares, and Class B shareholders may continue to exchange their shares for Class B Shares of certain other Goldman Sachs Funds). |
| |
| | The returns represent past performance. Past performance does not guarantee future results. The Fund’s investment return and principal value will fluctuate so that an investor’s shares, when redeemed, may be worth more or less than their original cost. Current performance may be lower or higher than the performance quoted above. Please visit our website at www.goldmansachsfunds.com to obtain the most recent month-end returns. Performance reflects fee waivers and/or expense limitations in effect. In their absence, performance would be reduced. Returns do not reflect the deduction of taxes that a shareholder would pay on Fund distributions or the redemption of Fund shares. |
FUND BASICS
| | | | | | | | | | | |
| | | Net Expense Ratio (Current) | | Gross Expense Ratio (Before Waivers) | | |
|
| |
| Class A | | | 1.35 | % | | | 1.41 | % | | |
| Class B | | | 2.10 | | | | 2.16 | | | |
| Class C | | | 2.10 | | | | 2.16 | | | |
| Institutional | | | 0.95 | | | | 1.01 | | | |
| Service | | | 1.45 | | | | 1.51 | | | |
| Class IR | | | 1.10 | | | | 1.16 | | | |
| Class R | | | 1.60 | | | | 1.66 | | | |
|
| | |
| 4 | | The expense ratios of the Fund, both current (net of applicable fee waivers and/or expense limitations) and before waivers (gross of applicable fee waivers and/or expense limitations) are as set forth above according to the most recent publicly available Prospectus for the Fund and may differ from the expense ratios disclosed in the Financial Highlights in this report. The Fund’s waivers and/or expense limitations will remain in place through at least December 29, 2012, and prior to such date the investment adviser may not terminate the arrangements without the approval of the Fund’s Board of Trustees. If these arrangements are discontinued in the future, the expense ratios may change without shareholder approval. |
| |
| TOP TEN HOLDINGS AS OF 2/29/125 | |
| | | | | | | |
| | | % of Net
| | |
| Holding | | Assets | | Line of Business |
|
| |
| SBA Communications Corp. Class A | | | 2.8 | % | | Wireless Telecommunication Services |
| PVH Corp. | | | 2.8 | | | Textiles, Apparel & Luxury Goods |
| Cameron International Corp. | | | 2.3 | | | Energy Equipment & Services |
| Whiting Petroleum Corp. | | | 2.3 | | | Oil, Gas & Consumable Fuels |
| St. Jude Medical, Inc. | | | 2.3 | | | Health Care Equipment & Supplies |
| C.R. Bard, Inc. | | | 2.3 | | | Health Care Equipment & Supplies |
| PetSmart, Inc. | | | 2.2 | | | Specialty Retail |
| Urban Outfitters, Inc. | | | 2.2 | | | Specialty Retail |
| Kennametal, Inc. | | | 2.1 | | | Machinery |
| Equinix, Inc. | | | 2.1 | | | Internet Software & Services |
|
| | |
| 5 | | The top 10 holdings may not be representative of the Fund’s future investments. |
FUND BASICS
| |
| FUND VS. BENCHMARK SECTOR ALLOCATION6 | |
As of February 29, 2012
| | |
| 6 | | The Fund is actively managed and, as such, its composition may differ over time. Consequently, the Fund’s overall sector allocations may differ from the percentages contained in the graph above. The graph categorizes investments using Global Industry Classification Standard (“GICS”), however, the sector classifications used by the portfolio management team may differ from GICS. Underlying sector allocations of Exchange Traded Funds held by the Fund are not reflected in the graph above. The percentage shown for each investment category reflects the value of investments in that category as a percentage of market value. Short-term investments represent repurchase agreements. The graph depicts the Fund’s investments but may not represent the Fund’s market exposure due to the exclusion of certain derivatives, if any, as listed in the Additional Investment Information section of the Schedule of Investments. |
PORTFOLIO RESULTS
Goldman Sachs Small/Mid Cap Growth Fund
Portfolio Composition
The Fund invests primarily in small and medium-sized growth companies with a market capitalization between $200 million and $10 billion. Since the Fund’s inception, the Goldman Sachs Growth Equity Investment Team has focused on several key investment criteria that it believes can drive a company’s growth over the long term. These characteristics are: dominant market share, established brand name, pricing power, recurring revenue stream, free cash flow, high returns on invested capital, predictable growth, sustainable growth, long product life cycle, enduring competitive advantage, favorable demographic trends and excellent management. The Team strives to purchase these companies at reasonable valuations in order to capture the full benefits of their growth.
Portfolio Management Discussion and Analysis
Below, the Goldman Sachs Growth Equity Investment Team discusses the Goldman Sachs Small/Mid Cap Growth Fund’s (the “Fund”) performance and positioning for the six-month period ended February 29, 2012 (the “Reporting Period”).
| |
| Q | How did the Fund perform during the Reporting Period? |
| |
| A | During the Reporting Period, the Fund’s Class A, B, C, Institutional, Service, IR and R Shares generated cumulative total returns, without sales charges, of 16.57%, 16.13%, 16.06%, 16.79%, 16.53%, 16.70% and 16.42%, respectively. These returns compare to the 13.97% cumulative total return of the Fund’s benchmark, the Russell 2500® Growth Index (with dividends reinvested) (the “Russell Index”), during the same period. |
| |
| Q | What key factors were responsible for the Fund’s performance during the Reporting Period? |
| |
| A | Stock selection overall contributed most to the Fund’s performance relative to the Russell Index during the Reporting Period. |
| |
| Q | Which equity market sectors most significantly affected Fund performance? |
| |
| A | Effective stock selection in the consumer discretionary, energy and health care sectors helped the Fund’s performance most relative to the Russell Index. Overall positioning in only two sectors detracted from the Fund’s results during the Reporting Period. Detracting from the Fund’s relative results was stock selection in the industrials and information technology sectors. |
| |
| Q | What were some of the Fund’s best-performing individual stocks? |
| |
| A | The Fund benefited most relative to the Russell Index from positions in business execution software provider SuccessFactors, pharmaceuticals company Pharmasset and specialty clothing provider Carter’s. |
SuccessFactors was the greatest contributor to the Fund’s relative results during the Reporting Period. Its shares rose after the company agreed to be acquired by SAP at a significant premium to the previous close. We subsequently exited the Fund’s position in SuccessFactors, taking profits. Similarly, Pharmasset was a top contributor to the Fund’s performance, with its shares rising after the company agreed to be acquired by Gilead Sciences at a significant premium to the previous close. We believe that acquisitions demonstrate one method by which the valuation gap between a company’s stock price and the intrinsic worth of the franchise can close quickly when other business buyers recognize the company’s long-term growth potential.
PORTFOLIO RESULTS
Children’s clothing maker Carter’s was a top contributor to the Fund’s performance during the Reporting Period, as its shares rose on the strength of the company’s fourth quarter earnings, which beat consensus earnings estimates. The company exhibited strong same-store sales growth across its clothing lines, highlighted by greater than expected sales growth in its Osh Kosh clothing line. Going forward, we believe that lower commodity prices and declining inventories, which were previous overhangs on the stock, should drive gross margin expansion. At the end of the Reporting Period, we continued to have conviction in Carter’s given its dominant share in a resilient segment of the apparel market. Furthermore, we believe the company is uniquely positioned to expand its retail store presence and has significant opportunities for sales growth and margin expansion through further penetration internationally and in the online retail space.
| |
| Q | Which stocks detracted significantly from the Fund’s performance during the Reporting Period? |
| |
| A | Detracting most from the Fund’s results relative to its benchmark index were positions in satellite telecommunications company DigitalGlobe, medical legal services company ExamWorks Group and solar power modules encapsulant manufacturer STR Holdings. |
DigitalGlobe, a leading provider of high quality satellite and aerial imagery to government and consumer services, detracted from the Fund’s relative returns. Its shares fell due to concerns over the impact government budget cuts might have on DigitalGlobe’s U.S. defense business. At the end of the Reporting Period, we continued to view the company as a market leader in a growing industry with high barriers to entry. The company operates a cash flow generating business with high margins, facilitating the delivery of current, high resolution imagery to desktop applications, portals, intranets and mobile devices. Over the long term, we believe DigitalGlobe is well positioned to benefit from the secular growth trends in satellite and aerial imagery.
ExamWorks Group, a leading provider of independent medical examination services to the legal and insurance industries, was a top detractor from the Fund’s results during the Reporting Period. Its shares fell after the company reported disappointing third quarter earnings results driven by the company’s inability to quickly integrate a number of its recently acquired businesses. Despite these headwinds, we maintained conviction in ExamWorks Group at the end of the Reporting Period, and we believe its portfolio of acquired assets should allow the company to grow and expand its menu of services going forward.
STR Holdings, a company that engineers a material used in the production of solar panels, detracted from the Fund’s relative performance during the Reporting Period. Its shares fell as the demand for alternative energy declined somewhat in response to various governments’ reducing their alternative energy subsidy programs.
| |
| Q | How did the Fund use derivatives and similar instruments during the Reporting Period? |
| |
| A | During the Reporting Period, we did not use derivatives as part of an active management strategy. |
| |
| Q | Did the Fund make any significant purchases or sales during the Reporting Period? |
| |
| A | During the Reporting Period, we established a Fund position in Vertex Pharmaceuticals, a company that manufactures and markets medicines. We believe Vertex Pharmaceuticals is well positioned due to its strong pipeline of drugs coupled with its cystic fibrosis franchise. In addition, we believe the company could benefit from long-term growth opportunities as its virology and immunology franchises mature. |
We initiated a Fund position in health care manufacturing company Mettler-Toledo International. The company is the world’s leading manufacturer and supplier of precision weighting instruments for laboratory, industrial and food retailing applications. Mettler-Toledo International has a market-leading franchise and what we consider to be a disciplined management team with a history of solid execution. We believe the company will continue to grow its margins and deliver strong organic growth through its global business franchise, particularly in China and select emerging markets where it has already seen high margins and robust organic growth.
PORTFOLIO RESULTS
Conversely, in addition to the sale of SuccessFactors, already mentioned, we exited the Fund’s position in Emdeon, a leading provider of revenue and payment cycle management and clinical information exchange solutions, connecting payers, providers and patients in the U.S. healthcare system. In August 2011, Blackstone Group LP announced it had entered into an agreement to take Emdeon private for approximately $3 billion. The transaction was approved by Emdeon shareholders in November 2011. The buyout validates our long-term strategic view and valuation assessment on Emdeon and represents another situation whereby the gap between a company’s market value and economic value can close quickly.
| |
| Q | Were there any notable changes in the Fund’s weightings during the Reporting Period? |
| |
| A | In constructing the Fund’s portfolio, we focus on picking stocks rather than on making industry or sector bets. We seek to outpace the benchmark index by overweighting stocks that we expect to outperform and underweighting those that we think may lag. Consequently, changes in its sector weights are generally the direct result of individual stock selection or of stock appreciation or depreciation. That said, during the Reporting Period, the Fund’s exposure to consumer discretionary, consumer staples, energy and information technology increased and its allocation to industrials decreased relative to the Russell Index. |
| |
| Q | How was the Fund positioned relative to its benchmark index at the end of February 2012? |
| |
| A | At the end of February 2012, the Fund had overweighted positions relative to the Russell Index in the consumer discretionary, telecommunication services, information technology and financials sectors. On the same date, the Fund had underweighted positions compared to the Russell Index in materials, industrials, consumer staples and health care. The Fund was rather neutrally weighted to the Russell Index in energy and had no position at all in utilities on February 29, 2012. |
FUND BASICS
Small/Mid Cap Growth Fund
as of February 29, 2012
| | | | | | | | | | | |
| | | Fund Total Return
| | Russell 2500
| | |
| September 1, 2011–February 29, 2012 | | (based on NAV)1 | | Growth Index2 | | |
|
| |
| Class A | | | 16.57 | % | | | 13.97 | % | | |
| Class B | | | 16.13 | | | | 13.97 | | | |
| Class C | | | 16.06 | | | | 13.97 | | | |
| Institutional | | | 16.79 | | | | 13.97 | | | |
| Service | | | 16.53 | | | | 13.97 | | | |
| Class IR | | | 16.70 | | | | 13.97 | | | |
| Class R | | | 16.42 | | | | 13.97 | | | |
|
| | |
| 1 | | The net asset value (“NAV”) represents the net assets of the class of the Fund (ex-dividend) divided by the total number of shares of the class outstanding. The Fund’s performance reflects the reinvestment of dividends and other distributions. The Fund’s performance does not reflect the deduction of any applicable sales charges. |
| |
| 2 | | The Russell 2500 Growth Index is an unmanaged index that measures the performance of the small- to mid-cap growth segment of the US equity universe. The Russell 2500 Growth Index is constructed to provide a comprehensive and unbiased barometer of the small- to mid-cap growth market. Based on ongoing empirical research of investment manager behavior, the methodology used to determine growth probability approximates the aggregate small- to mid-cap growth manager’s opportunity set. The Index figures do not reflect any deduction for fees, expenses or taxes. It is not possible to invest directly in an index. |
| |
| STANDARDIZED TOTAL RETURNS3 | |
| | | | | | | | | | | | | | | | | |
| For the period ended 12/31/11 | | One Year | | Five Years | | Since Inception | | Inception Date | | |
|
| |
| Class A | | | -9.54 | % | | | 4.31 | % | | | 6.11 | % | | 6/30/05 | | |
| Class B | | | -9.72 | | | | 4.33 | | | | 6.17 | | | 6/30/05 | | |
| Class C | | | -5.92 | | | | 4.71 | | | | 6.17 | | | 6/30/05 | | |
| Institutional | | | -3.92 | | | | 5.92 | | | | 7.40 | | | 6/30/05 | | |
| Service | | | -4.37 | | | | 5.40 | | | | 6.86 | | | 6/30/05 | | |
| Class IR | | | -4.03 | | | | N/A | | | | 3.00 | | | 11/30/07 | | |
| Class R | | | -4.50 | | | | N/A | | | | 2.49 | | | 11/30/07 | | |
|
| | |
| 3 | | The Standardized Total Returns are average annual total returns as of the most recent calendar quarter-end. They assume reinvestment of all distributions at NAV. These returns reflect a maximum initial sales charge of 5.5% for Class A Shares and the assumed contingent deferred sales charge for Class B Shares (5% maximum declining to 0% after six years) and the assumed contingent deferred sales charge for Class C Shares (1% if redeemed within 12 months of purchase). Class B Shares automatically convert to Class A Shares on or about the fifteenth day of the last month of the calendar year that is eight years after purchase. Returns for Class B Shares for the period after the conversion reflect the performance of Class A Shares. Because Institutional, Service, Class IR and Class R Shares do not involve a sales charge, such a charge is not applied to their Standardized Total Returns. The Fund’s Class B Shares are no longer available for purchase by new or existing shareholders (although current Class B shareholders may continue to reinvest income and capital gains distributions into Class B Shares, and Class B shareholders may continue to exchange their shares for Class B Shares of certain other Goldman Sachs Funds). |
| |
| | The returns represent past performance. Past performance does not guarantee future results. The Fund’s investment return and principal value will fluctuate so that an investor’s shares, when redeemed, may be worth more or less than their original cost. Current performance may be lower or higher than the performance quoted above. Please visit our website at www.goldmansachsfunds.com to obtain the most recent month-end returns. Performance reflects fee waivers and/or expense limitations in effect. In their absence, performance would be reduced. Returns do not reflect the deduction of taxes that a shareholder would pay on Fund distributions or the redemption of Fund shares. |
FUND BASICS
| | | | | | | | | | | |
| | | Net Expense Ratio (Current) | | Gross Expense Ratio (Before Waivers) | | |
|
| |
| Class A | | | 1.35 | % | | | 1.50 | % | | |
| Class B | | | 2.10 | | | | 2.25 | | | |
| Class C | | | 2.10 | | | | 2.25 | | | |
| Institutional | | | 0.95 | | | | 1.10 | | | |
| Service | | | 1.45 | | | | 1.60 | | | |
| Class IR | | | 1.10 | | | | 1.25 | | | |
| Class R | | | 1.60 | | | | 1.75 | | | |
|
| | |
| 4 | | The expense ratios of the Fund, both current (net of applicable fee waivers and/or expense limitations) and before waivers (gross of applicable fee waivers and/or expense limitations) are as set forth above according to the most recent publicly available Prospectus for the Fund and may differ from the expense ratios disclosed in the Financial Highlights in this report. The Fund’s waivers and/or expense limitations will remain in place through at least December 29, 2012, and prior to such date the investment adviser may not terminate the arrangements without the approval of the Fund’s Board of Trustees. If these arrangements are discontinued in the future, the expense ratios may change without shareholder approval. |
| |
| TOP TEN HOLDINGS AS OF 2/29/125 | |
| | | | | | | |
| | | % of Net
| | |
| Holding | | Assets | | Line of Business |
|
| |
| SBA Communications Corp. Class A | | | 3.0 | % | | Wireless Telecommunication Services |
| PVH Corp. | | | 2.7 | | | Textiles, Apparel & Luxury Goods |
| Equinix, Inc. | | | 2.3 | | | Internet Software & Services |
| Whiting Petroleum Corp. | | | 2.3 | | | Oil, Gas & Consumable Fuels |
| Kennametal, Inc. | | | 2.2 | | | Machinery |
| Rackspace Hosting, Inc. | | | 2.1 | | | Internet Software & Services |
| Urban Outfitters, Inc. | | | 1.9 | | | Specialty Retail |
| Henry Schein, Inc. | | | 1.9 | | | Health Care Providers & Services |
| Evercore Partners, Inc. Class A | | | 1.9 | | | Capital Markets |
| PetSmart, Inc. | | | 1.8 | | | Specialty Retail |
|
| | |
| 5 | | The top 10 holdings may not be representative of the Fund’s future investments. |
FUND BASICS
| |
| FUND VS. BENCHMARK SECTOR ALLOCATION6 | |
As of February 29, 2012
| | |
| 6 | | The Fund is actively managed and, as such, its composition may differ over time. Consequently, the Fund’s overall sector allocations may differ from the percentages contained in the graph above. The graph categorizes investments using Global Industry Classification Standard (“GICS”), however, the sector classifications used by the portfolio management team may differ from GICS. The percentage shown for each investment category reflects the value of investments in that category as a percentage of market value. Short-term investments represent repurchase agreements. The graph depicts the Fund’s investments but may not represent the Fund’s market exposure due to the exclusion of certain derivatives, if any, as listed in the Additional Investment Information section of the Schedule of Investments. |
PORTFOLIO RESULTS
Goldman Sachs Strategic Growth Fund
Portfolio Composition
The Fund invests primarily in U.S. equity investments. The Fund is more selective and focused than many mutual funds and there are typically 50 to 70 holdings in the portfolio. Since the Fund’s inception, the Goldman Sachs Growth Equity Investment Team has focused on several key investment criteria that it believes can drive a company’s growth over the long term. These characteristics are: dominant market share, established brand name, pricing power, recurring revenue stream, free cash flow, high returns on invested capital, predictable growth, sustainable growth, long product life cycle, enduring competitive advantage, favorable demographic trends and excellent management. The Team strives to purchase these companies at reasonable valuations in order to capture the full benefits of their growth.
Portfolio Management Discussion and Analysis
Below, the Goldman Sachs Growth Equity Investment Team discusses the Goldman Sachs Strategic Growth Fund’s (the “Fund”) performance and positioning for the six-month period ended February 29, 2012 (the “Reporting Period”).
| |
| Q | How did the Fund perform during the Reporting Period? |
| |
| A | During the Reporting Period, the Fund’s Class A, B, C, Institutional, Service, IR and R Shares generated cumulative total returns, without sales charges, of 13.48%, 13.09%, 13.18%, 13.77%, 13.55%, 13.66% and 13.45%, respectively. These returns compare to the 13.76% cumulative total return of the Fund’s benchmark, the Russell 1000® Growth Index (with dividends reinvested) (the “Russell Index”), during the same period. |
| |
| Q | What key factors were responsible for the Fund’s performance during the Reporting Period? |
| |
| A | The Fund generated double-digit absolute gains, but stock selection overall detracted most from its performance relative to the Russell Index during the Reporting Period. |
| |
| Q | Which equity market sectors most significantly affected Fund performance? |
| |
| A | Detracting from the Fund’s performance most relative to the Russell Index was stock selection in the energy and health care sectors. Having an underweighted allocation to industrials, which was one of the stronger performing sectors in the Russell Index during the Reporting Period, also hurt. Effective stock selection in the information technology and consumer discretionary sectors helped the Fund’s relative results most. Having an underweighted allocation to materials, which though considered an economically- sensitive sector lagged the Russell Index during the Reporting Period, also boosted Fund results. |
| |
| Q | Which stocks detracted significantly from the Fund’s performance during the Reporting Period? |
| |
| A | Detracting most from the Fund’s results relative to its benchmark index were positions in beauty and related products manufacturer Avon Products, medical device company St. Jude Medical and oilfield services company Halliburton. |
Avon Products detracted from the Fund’s performance most during the Reporting Period. Its shares declined after the company announced lower than expected third quarter earnings and lowered its fiscal year 2011 revenue guidance. Avon Products’ earnings were impacted by disappointing sales in select markets and softer margins due to higher input costs. While Avon Products may be poised to deliver higher operating margins over the next few years as its geographic footprint broadens, particularly in Latin America, we decided to trim the Fund’s position and allocate the capital to higher conviction ideas.
St. Jude Medical detracted from the Fund’s relative performance. Medical device company shares broadly came under pressure during the Reporting Period on news that Medicare payment process changes could potentially lead to greater scrutiny of payment for specific high-cost medical device procedures. While fears abated after the Center for Medicare and Medicaid Services announced the program would be limited in scope and breadth, shares of St. Jude Medical were hit once again when the Food and Drug Administration (FDA) issued a recall of its Riata defibrillator, which is no longer one of its marketed products. At the end of the Reporting Period, it was our
PORTFOLIO RESULTS
understanding that concerns regarding the defibrillator were confined to a small subset of the product line and that there was no evidence of any impact to St. Jude Medical’s current product lineup. While we continue to believe that St. Jude Medical has innovative products and attractive end markets and is competitively well positioned in a growing industry over the long term, we decided to trim the Fund’s position in the company and allocate capital to higher conviction ideas.
Leading oil services firm Halliburton detracted significantly from the Fund’s returns during the Reporting Period. Despite posting solid second quarter earnings, Halliburton underperformed the broader equity market as expectations of a global economic slowdown and weaker oil prices pressured its shares and contributed to the energy sector’s relative underperformance of the broad U.S. equity market. We acknowledge the economic slowdown and Halliburton’s sensitivity to oil prices, but at the end of the Reporting Period, we continued to believe the company’s risk/reward profile was attractive at then-current valuations. Indeed, we believe Halliburton is gaining share in key markets and can demonstrate pricing power and margin improvement in its North America-based pressure pumping business. We also expect the shift in U.S. drilling activity toward oil/shale plays, or operations, could mitigate volatility.
| |
| Q | What were some of the Fund’s best-performing individual stocks? |
| |
| A | The Fund benefited most relative to the Russell Index from positions in home improvement retailer Lowe’s, data center solutions company Equinix and personal computer and mobile communications device giant Apple. |
Lowe’s was the top contributor to the Fund’s relative performance during the Reporting Period as the company beat earnings expectations driven by improved traffic trends and incrementally positive housing market data. Further, Lowe’s management announced a decision to take on more debt in order to fund upcoming share buybacks. We believe this showed a clear commitment by company management to increase return invested capital. Lowe’s management also took important steps to differentiate Lowe’s from competitors by improving its operational efficiency and implementation of technology. Further, Lowe’s management, in our view, remained focused on more effective marketing techniques and improving in-store format, which we believe will further differentiate Lowe’s in the duopolistic home improvement market going forward.
Equinix contributed to the Fund’s performance during the Reporting Period. Its shares rose as the company reported strong fourth quarter results and issued a solid outlook for 2012. As the company continued to evaluate its potential for real estate investment trust (REIT) status, the market began to recognize that Equinix’s shares were trading at a discount to other publicly traded data center REITs. Should the market continue to appreciate the growth and stability of the company’s revenue stream, we believe the valuation gap between Equinix and its peers could narrow. At the end of the Reporting Period, we remained attracted to Equinix’s leading position in operating data centers, which has several secular growth drivers, including cloud computing and online and mobile video demand. (Cloud computing is Internet-based computing, whereby shared resources, software and information are provided to computers and other devices on demand, like the electricity grid.)
Shares of Apple rose during the Reporting Period as sales and earnings continued to exceed analyst expectations driven by strong iPhone and iPad sales. We believe the iPad has joined the iPhone as a key Apple product that has helped the company increase market share and build brand awareness as new customers are exposed to the company’s product offerings. In August 2011, Steve Jobs resigned as Chief Executive Officer of the firm and was succeeded by Chief Operating Officer Tim Cook. While Mr. Jobs’ passing in October was certainly a loss not only to Apple but to U.S. innovation, we believe Apple’s platform is now stronger than ever and can be successfully managed by Mr. Cook and Apple’s seasoned management team.
| |
| Q | How did the Fund use derivatives and similar instruments during the Reporting Period? |
| |
| A | During the Reporting Period, we did not use derivatives as part of an active management strategy. |
PORTFOLIO RESULTS
| |
| Q | Did the Fund make any significant purchases or sales during the Reporting Period? |
| |
| A | We initiated a Fund position in Abbott Laboratories after management announced it would split the company into a branded pharmaceutical company and a diversified medical products company, which is anticipated to result in a tax- free distribution to shareholders by the end of 2012. Abbott Laboratories is a leading global health care company that develops, manufactures and sells a diversified line of health care products. We believe its management’s decision to spin out its branded pharmaceutical business could unlock shareholder value by alleviating the overhang on the stock caused by competitive threats to its Humira arthritis drug. In our view, the patent issues associated with Humira have caused investors to overlook the value of Abbott Laboratories’ line of high growth businesses, namely, medical devices and diagnostics. Shares should benefit going forward, we believe, from increased visibility into underlying businesses, an updated product mix and increased exposure to emerging markets, which at the end of the Reporting Period contributed approximately 40% of the company’s revenues. |
We established a Fund position in T. Rowe Price, a company that provides investment advisory services to individual and institutional investors through its T. Rowe Price mutual funds and other investment portfolios. We viewed this as an attractive entry point into what we consider a high quality asset management franchise with an established brand name, healthy balance sheet and strong operating cash flow. In our view, T. Rowe Price also has a track record of strong, consistent organic growth and of expanding operating margins. Moreover, the company has, we feel, an attractive asset mix and generates a large portion of its revenue from a rather stable retirement distribution channel. The company has also proven to be less sensitive to interest rates relative to several other financials firms, which we view positively given current market conditions.
Conversely, we exited the Fund’s position in home goods retailer Bed Bath and Beyond during the Reporting Period. While its business fundamentals remained solid and management continued to improve margins and grow its store base, we see limited earnings upside from levels seen toward the end of the Reporting Period. Thus, we viewed this as an appropriate time to take profits and reinvest the sales proceeds in businesses we believed to have more attractive risk/reward profiles.
We sold the Fund’s position in Amgen, a biotechnology company that manufactures and markets medicines, during the Reporting Period. While we still believed that Amgen has a strong oncology franchise that has not been reflected in the company’s valuation, the company continued to face challenges in its base business. We decided to sell out of the Fund’s position and reallocate the sales proceeds to higher conviction names.
| |
| Q | Were there any notable changes in the Fund’s weightings during the Reporting Period? |
| |
| A | In constructing the Fund’s portfolio, we focus on picking stocks rather than on making industry or sector bets. We seek to outpace the benchmark index by overweighting stocks that we expect to outperform and underweighting those that we think may lag. Consequently, changes in its sector weights are generally the direct result of individual stock selection or of stock appreciation or depreciation. That said, during the Reporting Period, the Fund’s exposure to consumer discretionary, health care, information technology and telecommunication services decreased and its allocations to financials and industrials increased relative to the Russell Index. |
| |
| Q | How was the Fund positioned relative to its benchmark index at the end of February 2012? |
| |
| A | At the end of February 2012, the Fund had overweighted positions relative to the Russell Index in the financials, information technology and telecommunication services sectors. On the same date, the Fund had underweighted positions compared to the Russell Index in industrials, consumer staples, materials and energy. The Fund was rather neutrally weighted to the Russell Index in consumer discretionary and health care and had no position at all in utilities on February 29, 2012. |
FUND BASICS
Strategic Growth Fund
as of February 29, 2012
| | | | | | | | | | | |
| | | Fund Total Return
| | Russell 1000
| | |
| September 1, 2011–February 29, 2012 | | (based on NAV)1 | | Growth Index2 | | |
|
| |
| Class A | | | 13.48 | % | | | 13.76 | % | | |
| Class B | | | 13.09 | | | | 13.76 | | | |
| Class C | | | 13.18 | | | | 13.76 | | | |
| Institutional | | | 13.77 | | | | 13.76 | | | |
| Service | | | 13.55 | | | | 13.76 | | | |
| Class IR | | | 13.66 | | | | 13.76 | | | |
| Class R | | | 13.45 | | | | 13.76 | | | |
|
| | |
| 1 | | The net asset value (“NAV”) represents the net assets of the class of the Fund (ex-dividend) divided by the total number of shares of the class outstanding. The Fund’s performance reflects the reinvestment of dividends and other distributions. The Fund’s performance does not reflect the deduction of any applicable sales charges. |
| |
| 2 | | The Russell 1000 Growth Index is an unmanaged market capitalization weighted index that measures the performance of those Russell 1000 companies with higher price-to-book ratios and higher forecasted growth values. The Index figures do not reflect any deduction for fees, expenses or taxes. It is not possible to invest directly in an index. |
| |
| STANDARDIZED TOTAL RETURNS3 | |
| | | | | | | | | | | | | | | | | | | | | |
| For the period ended 12/31/11 | | One Year | | Five Years | | Ten Years | | Since Inception | | Inception Date | | |
|
| |
| Class A | | | -8.32 | % | | | -0.71 | % | | | 0.03 | % | | | -0.53 | % | | 5/24/99 | | |
| Class B | | | -8.56 | | | | -0.78 | | | | -0.02 | | | | -0.55 | | | 5/24/99 | | |
| Class C | | | -4.70 | | | | -0.35 | | | | -0.16 | | | | -0.82 | | | 5/24/99 | | |
| Institutional | | | -2.67 | | | | 0.78 | | | | 0.99 | | | | 0.31 | | | 5/24/99 | | |
| Service | | | -3.00 | | | | 0.38 | | | | 0.59 | | | | -0.07 | | | 5/24/99 | | |
| Class IR | | | -2.86 | | | | N/A | | | | N/A | | | | 13.44 | | | 01/06/09 | | |
| Class R | | | -3.25 | | | | N/A | | | | N/A | | | | 12.95 | | | 01/06/09 | | |
|
| | |
| 3 | | The Standardized Total Returns are average annual total returns as of the most recent calendar quarter-end. They assume reinvestment of all distributions at NAV. These returns reflect a maximum initial sales charge of 5.5% for Class A Shares and the assumed contingent deferred sales charge for Class B Shares (5% maximum declining to 0% after six years) and the assumed contingent deferred sales charge for Class C Shares (1% if redeemed within 12 months of purchase). Class B Shares automatically convert to Class A Shares on or about the fifteenth day of the last month of the calendar year that is eight years after purchase. Returns for Class B Shares for the period after the conversion reflect the performance of Class A Shares. Because Institutional, Service, Class IR and Class R Shares do not involve a sales charge, such a charge is not applied to their Standardized Total Returns. The Fund’s Class B Shares are no longer available for purchase by new or existing shareholders (although current Class B shareholders may continue to reinvest income and capital gains distributions into Class B Shares, and Class B shareholders may continue to exchange their shares for Class B Shares of certain other Goldman Sachs Funds). |
| |
| | The returns represent past performance. Past performance does not guarantee future results. The Fund’s investment return and principal value will fluctuate so that an investor’s shares, when redeemed, may be worth more or less than their original cost. Current performance may be lower or higher than the performance quoted above. Please visit our website at www.goldmansachsfunds.com to obtain the most recent month-end returns. Performance reflects fee waivers and/or expense limitations in effect. In their absence, performance would be reduced. Returns do not reflect the deduction of taxes that a shareholder would pay on Fund distributions or the redemption of Fund shares. |
FUND BASICS
| | | | | | | | | | | |
| | | Net Expense Ratio (Current) | | Gross Expense Ratio (Before Waivers) | | |
|
| |
| Class A | | | 1.15 | % | | | 1.51 | % | | |
| Class B | | | 1.90 | | | | 2.26 | | | |
| Class C | | | 1.90 | | | | 2.26 | | | |
| Institutional | | | 0.75 | | | | 1.11 | | | |
| Service | | | 1.25 | | | | 1.61 | | | |
| Class IR | | | 0.90 | | | | 1.26 | | | |
| Class R | | | 1.40 | | | | 1.76 | | | |
|
| | |
| 4 | | The expense ratios of the Fund, both current (net of applicable fee waivers and/or expense limitations) and before waivers (gross of applicable fee waivers and/or expense limitations) are as set forth above according to the most recent publicly available Prospectus for the Fund and may differ from the expense ratios disclosed in the Financial Highlights in this report. The Fund’s waivers and/or expense limitations will remain in place through at least December 29, 2012, and prior to such date the investment adviser may not terminate the arrangements without the approval of the Fund’s Board of Trustees. If these arrangements are discontinued in the future, the expense ratios may change without shareholder approval. |
| |
| TOP TEN HOLDINGS AS OF 2/29/125 | |
| | | | | | | |
| Holding | | % of Net Assets | | Line of Business |
|
| |
| Apple, Inc. | | | 7.6 | % | | Computers & Peripherals |
| QUALCOMM, Inc. | | | 4.1 | | | Communications Equipment |
| Schlumberger Ltd. | | | 3.6 | | | Energy Equipment & Services |
| Google, Inc. Class A | | | 3.5 | | | Internet Software & Services |
| American Tower Corp. | | | 3.3 | | | Real Estate Investment Trusts |
| Costco Wholesale Corp. | | | 2.6 | | | Food & Staples Retailing |
| Crown Castle International Corp. | | | 2.6 | | | Wireless Telecommunication Services |
| Lowe’s Cos., Inc. | | | 2.5 | | | Specialty Retail |
| Praxair, Inc. | | | 2.4 | | | Chemicals |
| Amazon.com, Inc. | | | 2.3 | | | Internet & Catalog Retail |
|
| | |
| 5 | | The top 10 holdings may not be representative of the Fund’s future investments. |
FUND BASICS
| |
| FUND VS. BENCHMARK SECTOR ALLOCATION6 | |
As of February 29, 2012
| | |
| 6 | | The Fund is actively managed and, as such, its composition may differ over time. Consequently, the Fund’s overall sector allocations may differ from the percentages contained in the graph above. The graph categorizes investments using Global Industry Classification Standard (“GICS”), however, the sector classifications used by the portfolio management team may differ from GICS. Underlying sector allocations of Exchange Traded Funds held by the Fund are not reflected in the graph above. The percentage shown for each investment category reflects the value of investments in that category as a percentage of market value. The graph depicts the Fund’s investments but may not represent the Fund’s market exposure due to the exclusion of certain derivatives, if any, as listed in the Additional Investment Information section of the Schedule of Investments. |
PORTFOLIO RESULTS
Goldman Sachs Technology Tollkeeper Fund
Portfolio Composition
The Fund invests primarily in equity securities of high quality technology, media or service companies that adopt or use technology to improve their cost structure, revenue opportunities or competitive advantage (“Technology Tollkeeper” companies). The Goldman Sachs Growth Equity Investment Team believes Technology Tollkeeper connotes a promising growth business. Like a toll collector for a highway or bridge, Technology Tollkeeper companies may grow revenue by increasing “traffic,” or customers and sales, and raising “tolls,” or prices, and margins. The Team believes that the characteristics of recurring revenue or the ability to generate free cash flow should enable them to consistently grow their business.
Portfolio Management Discussion and Analysis
Below, the Goldman Sachs Growth Equity Investment Team discusses the Goldman Sachs Technology Tollkeeper Fund’s (the “Fund”) performance and positioning for the six-month period ended February 29, 2012 (the “Reporting Period”).
| |
| Q | How did the Fund perform during the Reporting Period? |
| |
| A | During the Reporting Period, the Fund’s Class A, B, C, Institutional, Service and IR Shares generated cumulative total returns, without sales charges, of 16.85%, 16.35%, 16.37%, 17.05%, 16.83% and 17.00%, respectively. These returns compare to the 15.02% cumulative total return of the Fund’s benchmark, the NASDAQ Composite Index (the “NASDAQ Index”), during the same period. |
| |
| Q | What key factors were responsible for the Fund’s performance during the Reporting Period? |
| |
| A | Stock selection overall contributed most to the Fund’s performance relative to the NASDAQ Index during the Reporting Period. |
| |
| Q | Which equity market sectors most significantly affected Fund performance? |
| |
| A | As both the Fund and the NASDAQ Index have the majority of their respective assets allocated to the information technology sector and our Team’s focus is on picking stocks that fit our definition of a Technology Tollkeeper company, broad equity market sector performance generally does not have a meaningful impact on relative performance. That said, having an overweighted allocation to information technology relative to the NASDAQ Index contributed most positively to the Fund’s relative results. Effective stock selection in telecommunication services and having an underweighted exposure to consumer discretionary also helped. Detracting from the Fund’s relative results was stock selection in the industrials and materials sectors and having no position in health care, which outpaced the NASDAQ Index during the Reporting Period. |
| |
| Q | What were some of the Fund’s best-performing individual stocks? |
| |
| A | The Fund benefited most relative to the NASDAQ Index from positions in business execution software provider SuccessFactors, web hosting and design services provider Rackspace Hosting and data center solutions company Equinix. |
SuccessFactors was the greatest contributor to the Fund’s relative results during the Reporting Period. Its shares rose after the company agreed to be acquired by SAP at a significant premium to the previous close. We subsequently exited the Fund’s position in SuccessFactors, taking profits. We believe that acquisitions demonstrate one method by which the valuation gap between a company’s stock price and the intrinsic worth of the franchise can close quickly when other business buyers recognize the company’s long-term growth potential.
PORTFOLIO RESULTS
Rackspace Hosting, a leading provider of hosting and cloud computing services, contributed to the Fund’s relative performance during the Reporting Period. (Cloud computing is Internet-based computing, whereby shared resources, software and information are provided to computers and other devices on demand, like the electricity grid.) Its shares rose after the company reported strong third and fourth quarter results driven by installed base growth and margin expansion. In addition, Rackspace Hosting issued a solid 2012 outlook, and the company expects revenue to continue to grow at a similar pace in 2012 as in 2011. We believe Rackspace Hosting differentiates itself through its intense focus on client service, an advantage that we feel should lead to increased adoption, subscriber growth and recurring revenue. Furthermore, in our view, Rackspace Hosting is well positioned to gain market share as the architecture of computing continues to shift towards the cloud.
Equinix contributed to the Fund’s performance during the Reporting Period. Its shares rose as the company reported strong fourth quarter results and issued a solid outlook for 2012. As the company continued to evaluate its potential for real estate investment trust (REIT) status, the market began to recognize that Equinix’s shares were trading at a discount to other publicly traded data center REITs. Should the market continue to appreciate the growth and stability of the company’s revenue stream, we believe the valuation gap between Equinix and its peers could narrow. At the end of the Reporting Period, we remained attracted to Equinix’s leading position in operating data centers, which has several secular growth drivers, including cloud computing and online and mobile video demand.
| |
| Q | Which stocks detracted significantly from the Fund’s performance during the Reporting Period? |
| |
| A | Detracting most from the Fund’s results relative to its benchmark index were positions in semiconductor company Rovi, satellite telecommunications company DigitalGlobe and virtual reality products company RealD. |
Rovi was the top detractor from the Fund’s relative results during the Reporting Period. The company holds patents on interactive program guides (IPGs) for video delivery services and devices. The IPGs are used in both Internet-capable televisions and cable/satellite providers’ set-top boxes, and Rovi receives a monthly royalty for each subscriber. Its shares fell after Rovi revised 2011 earnings guidance to the low end of its prior projection due to faster declines than anticipated for both Analog Copy Protection (ACP) and Roxio software and to a softer macroeconomic environment. Despite these recent headwinds, we continued to believe at the end of the Reporting Period that Rovi has significant growth opportunities as demand for interactive media management systems increases and the company’s patents provide a barrier to entry.
DigitalGlobe, a leading provider of high quality satellite and aerial imagery to government and consumer services, detracted from the Fund’s relative returns. Its shares fell due to concerns over the impact government budget cuts might have on DigitalGlobe’s U.S. defense business. At the end of the Reporting Period, we continued to view the company as a market leader in a growing industry with high barriers to entry. The company operates a cash flow generating business with high margins, facilitating the delivery of current, high resolution imagery to desktop applications, portals, intranets and mobile devices. Over the long term, we believe DigitalGlobe is well positioned to benefit from the secular growth trends in satellite and aerial imagery.
RealD, a company that designs, manufactures and licenses 3D (three-dimension) technology, detracted from the Fund’s relative performance. The company reported disappointing earnings results as the revenues from recently released 3D blockbuster movies lagged those of 3D films that were released over the prior year. Despite these challenging comparisons year-over-year, we continued, at the end of the Reporting Period, to believe RealD is a market leader in 3D technology that should benefit from continued 3D movie adoption. In our view, RealD was well positioned for long-term growth, as 3D movies begin to gain share of total box office revenues.
| |
| Q | How did the Fund use derivatives and similar instruments during the Reporting Period? |
| |
| A | During the Reporting Period, we did not use derivatives as part of an active management strategy. |
PORTFOLIO RESULTS
| |
| Q | Did the Fund make any significant purchases or sales during the Reporting Period? |
| |
| A | We established a Fund position in e-commerce company Priceline.com. We believe Priceline.com is well positioned in the online travel business given its exposure to North America through booking.com, to Europe through its TravelJigsaw business, and to Asia through its Agoda business. In addition, we believe Priceline.com’s competitive advantage is its technology, which offers travelers and both hotels and car rental companies a more efficient method by which to connect. In our view, Priceline.com has strong self- reinforcing barriers to entry that should enable the company to establish its dominance in the online travel industry. |
We initiated a Fund position in Groupon during the Reporting Period as part of the company’s initial public offering (IPO). Groupon is a global e-commerce marketplace that connects merchants to consumers by offering local goods and services through pre-purchased discounts. We were attracted to the company’s leading market share in 35 of the 45 countries in which it operates as well as what we consider to be its international growth prospects, favorable cash flow profile and positive subscriber activation trends. We believe the company’s brand recognition has the potential to translate well into a larger addressable market that includes travel, goods and events in addition to the $500 billion global advertising market. In our view, Groupon’s favorable long-term growth prospects are further bolstered by incremental opportunities including mobile applications and the potential for partnerships.
In addition to the sale of SuccessFactors, already mentioned, we exited the Fund’s position Dolby Laboratories during the Reporting Period. Dolby Laboratories is a company that collects royalties from companies that employ its audio technology designed to enhance the entertainment experience. During the Reporting Period, Dolby Laboratories announced that Microsoft’s next-generation operating system, Windows 8, would not incorporate its technologies at this point. As Dolby gets paid royalties on most copies of Windows 7, we believe there could be a significant decline in the company’s earnings as the personal computer market begins transitioning to Windows 8 later in 2012. As a result, we decided to eliminate the Fund’s position in the company and allocate sales proceeds to holdings we believe to have more favorable growth opportunities.
| |
| Q | Were there any notable changes in the Fund’s weightings during the Reporting Period? |
| |
| A | In constructing the Fund’s portfolio, we focus on picking stocks rather than on making industry or sector bets. We seek to outpace the benchmark index by overweighting stocks that we expect to outperform and underweighting those that we think may lag. Consequently, changes in its sector weights are generally the direct result of individual stock selection or of stock appreciation or depreciation. That said, during the Reporting Period, the Fund’s exposure to information technology, materials and telecommunication services decreased and its allocations to consumer discretionary and financials increased relative to the NASDAQ Index. |
| |
| Q | How was the Fund positioned relative to its benchmark index at the end of February 2012? |
| |
| A | At the end of February 2012, the Fund’s most significant overweighting relative to the NASDAQ Index continued to be in the information technology sector. The Fund also had an overweighted position relative to the NASDAQ Index, albeit more modest, in telecommunication services. On the same date, the Fund had underweighted positions compared to the NASDAQ Index in consumer discretionary, industrials and financials. The Fund had no exposure to the consumer staples, energy, health care, materials and utilities sectors on February 29, 2012. |
FUND BASICS
Technology Tollkeeper Fund
as of February 29, 2012
| | | | | | | | | | | |
| | | Fund Total Return
| | NASDAQ
| | |
| September 1, 2011–February 29, 2012 | | (based on NAV)1 | | Composite Index2 | | |
|
| |
| Class A | | | 16.85 | % | | | 15.02 | % | | |
| Class B | | | 16.35 | | | | 15.02 | | | |
| Class C | | | 16.37 | | | | 15.02 | | | |
| Institutional | | | 17.05 | | | | 15.02 | | | |
| Service | | | 16.83 | | | | 15.02 | | | |
| Class IR | | | 17.00 | | | | 15.02 | | | |
|
| | |
| 1 | | The net asset value (“NAV”) represents the net assets of the class of the Fund (ex-dividend) divided by the total number of shares of the class outstanding. The Fund’s performance reflects the reinvestment of dividends and other distributions. The Fund’s performance does not reflect the deduction of any applicable sales charges. |
| |
| 2 | | The NASDAQ Composite Index is a broad-based capitalization-weighted index of all NASDAQ National Market and small-cap stocks. The Index figures do not reflect any deduction for fees, expenses or taxes. It is not possible to invest directly in an index. |
| |
| STANDARDIZED TOTAL RETURNS3 | |
| | | | | | | | | | | | | | | | | | | | | |
| For the period ended 12/31/11 | | One Year | | Five Years | | Ten Years | | Since Inception | | Inception Date | | |
|
| |
| Class A | | | -18.03 | % | | | 3.67 | % | | | 3.19 | % | | | 0.78 | % | | 10/1/99 | | |
| Class B | | | -18.24 | | | | 3.73 | | | | 3.15 | | | | 0.73 | | | 10/1/99 | | |
| Class C | | | -14.72 | | | | 4.07 | | | | 3.00 | | | | 0.48 | | | 10/1/99 | | |
| Institutional | | | -12.88 | | | | 5.27 | | | | 4.20 | | | | 1.65 | | | 10/1/99 | | |
| Service | | | -13.28 | | | | 4.79 | | | | 3.71 | | | | 1.17 | | | 10/1/99 | | |
| Class IR | | | -13.02 | | | | N/A | | | | N/A | | | | -1.82 | | | 9/30/10 | | |
|
| | |
| 3 | | The Standardized Total Returns are average annual total returns as of the most recent calendar quarter-end. They assume reinvestment of all distributions at NAV. These returns reflect a maximum initial sales charge of 5.5% for Class A Shares and the assumed contingent deferred sales charge for Class B Shares (5% maximum declining to 0% after six years) and the assumed contingent deferred sales charge for Class C Shares (1% if redeemed within 12 months of purchase). Class B Shares automatically convert to Class A Shares on or about the fifteenth day of the last month of the calendar year that is eight years after purchase. Returns for Class B Shares for the period after the conversion reflect the performance of Class A Shares. Because Institutional, Service, and Class IR Shares do not involve a sales charge, such a charge is not applied to their Standardized Total Returns. The Fund’s Class B Shares are no longer available for purchase by new or existing shareholders (although current Class B shareholders may continue to reinvest income and capital gains distributions into Class B Shares, and Class B shareholders may continue to exchange their shares for Class B Shares of certain other Goldman Sachs Funds). |
| |
| | The returns represent past performance. Past performance does not guarantee future results. The Fund’s investment return and principal value will fluctuate so that an investor’s shares, when redeemed, may be worth more or less than their original cost. Current performance may be lower or higher than the performance quoted above. Please visit our website at www.goldmansachsfunds.com to obtain the most recent month-end returns. Performance reflects fee waivers and/or expense limitations in effect. In their absence, performance would be reduced. Returns do not reflect the deduction of taxes that a shareholder would pay on Fund distributions or the redemption of Fund shares. |
FUND BASICS
| | | | | | | | | | | |
| | | Net Expense Ratio (Current) | | Gross Expense Ratio (Before Waivers) | | |
|
| |
| Class A | | | 1.50 | % | | | 1.52 | % | | |
| Class B | | | 2.25 | | | | 2.27 | | | |
| Class C | | | 2.25 | | | | 2.27 | | | |
| Institutional | | | 1.10 | | | | 1.12 | | | |
| Service | | | 1.60 | | | | 1.62 | | | |
| Class IR | | | 1.25 | | | | 1.27 | | | |
|
| | |
| 4 | | The expense ratios of the Fund, both current (net of applicable fee waivers and/or expense limitations) and before waivers (gross of applicable fee waivers and/or expense limitations) are as set forth above according to the most recent publicly available Prospectus for the Fund and may differ from the expense ratios disclosed in the Financial Highlights in this report. The Fund’s waivers and/or expense limitations will remain in place through at least December 29, 2012, and prior to such date the investment adviser may not terminate the arrangements without the approval of the Fund’s Board of Trustees. If these arrangements are discontinued in the future, the expense ratios may change without shareholder approval. |
| |
| TOP TEN HOLDINGS AS OF 2/29/125 | |
| | | | | | | | | |
| Holding | | % of Net Assets | | Line of Business | | |
|
| |
| Apple, Inc. | | | 11.4 | % | | Computers & Peripherals | | |
| QUALCOMM, Inc. | | | 6.3 | | | Communications Equipment | | |
| Google, Inc. Class A | | | 6.3 | | | Internet Software & Services | | |
| Rackspace Hosting, Inc. | | | 4.7 | | | Internet Software & Services | | |
| NetApp, Inc. | | | 4.6 | | | Computers & Peripherals | | |
| Oracle Corp. | | | 4.2 | | | Software | | |
| Microsoft Corp. | | | 3.5 | | | Software | | |
| Salesforce.com, Inc. | | | 3.4 | | | Software | | |
| Amazon.com, Inc. | | | 3.3 | | | Internet & Catalog Retail | | |
| Amphenol Corp. Class A | | | 3.3 | | | Electronic Equipment,
Instruments & Components | | |
|
| | |
| 5 | | The top 10 holdings may not be representative of the Fund’s future investments. |
FUND BASICS
| |
| FUND VS. BENCHMARK SECTOR ALLOCATION6 | |
As of February 29, 2012
| | |
| 6 | | The Fund is actively managed and, as such, its composition may differ over time. Consequently, the Fund’s overall sector allocations may differ from the percentages contained in the graph above. The graph categorizes investments using Global Industry Classification Standard (“GICS”), however, the sector classifications used by the portfolio management team may differ from GICS. The percentage shown for each investment category reflects the value of investments in that category as a percentage of market value. Short-term investments represent repurchase agreements. The graph depicts the Fund’s investments but may not represent the Fund’s market exposure due to the exclusion of certain derivatives, if any, as listed in the Additional Investment Information section of the Schedule of Investments. |
PORTFOLIO RESULTS
Goldman Sachs U.S. Equity Fund
Portfolio Composition
The Fund invests primarily in large-capitalization U.S. equity investments. Since the Fund’s inception, the Goldman Sachs Growth Equity Investment Team has focused on several key investment criteria that it believes can drive a company’s growth over the long term. These characteristics are: dominant market share, established brand name, pricing power, recurring revenue stream, free cash flow, high returns on invested capital, predictable growth, sustainable growth, long product life cycle, enduring competitive advantage, favorable demographic trends and excellent management. The Team strives to purchase these companies at reasonable valuations in order to capture the full benefits of their growth.
Portfolio Management Discussion and Analysis
Below, the Goldman Sachs Growth Equity Investment Team and the Goldman Sachs Fundamental Equity Value Investment Team discuss the Goldman Sachs U.S. Equity Fund’s (the “Fund”) performance and positioning for the six-month period ended February 29, 2012 (the “Reporting Period”).
| |
| Q | How did the Fund perform during the Reporting Period? |
| |
| A | During the Reporting Period, the Fund’s Class A, C, Institutional, IR and R Shares generated cumulative total returns, without sales charges, of 12.53%, 12.06%, 12.69%, 12.60% and 12.39%, respectively. These returns compare to the 13.31% cumulative total return of the Fund’s benchmark, the Standard & Poor’s 500® Index (the “S&P 500 Index”), during the same period. |
| |
| Q | What key factors were responsible for the Fund’s performance during the Reporting Period? |
| |
| A | The Fund generated double-digit absolute gains, but stock selection overall detracted most from its performance relative to the S&P 500 Index during the Reporting Period. |
| |
| Q | Which equity market sectors most significantly affected Fund performance? |
| |
| A | Detracting from the Fund’s performance most relative to the S&P 500 Index was stock selection in the consumer staples, telecommunication services and health care sectors. Effective stock selection in the materials, industrials and information technology sectors helped the Fund’s relative results most. |
| |
| Q | Which stocks detracted significantly from the Fund’s performance during the Reporting Period? |
| |
| A | Detracting most from the Fund’s results relative to its benchmark index were positions in wireless and wireline telecommunication services company Sprint Nextel, diversified banking institution Bank of America and medical device company St. Jude Medical. |
Sprint Nextel was the biggest detractor from the Fund’s relative results during the Reporting Period. Shares of Sprint Nextel declined primarily as a result of the near-term controversy around whether Sprint Nextel has sufficient liquidity to fund two large investments — the iPhone and Network Vision, each of which are believed by the company to potentially create value. In our view, several recent debt deals, including the raising of $4 billion in November 2011, should provide more than an ample amount of funds to complete the transition. We also continued to believe at the end of the Reporting Period that Sprint Nextel’s improved competitive positioning from the iPhone and new handsets, better pricing and improved network quality driven by shutting down iDEN and eliminating a significant portion of roaming charges should drive significant cost savings and margin expansion as the company completes its upgrade to Network Vision. iDEN (Integrated Digital Enhanced Network) is a wireless technology combining the capabilities of a digital cellular telephone, two-way radio, alphanumeric pager and data/fax modem in a single network. Network Vision, originally announced in December 2010, is Sprint Nextel’s plan to consolidate multiple network technologies into one seamless network with the goal of increasing
PORTFOLIO RESULTS
efficiency and enhancing network coverage, call quality and data speeds for customers across the United States.
Bank of America hurt the Fund’s relative results as well. Shares of Bank of America declined during the Reporting Period for two primary reasons. First, the federal bank stress tests announced in late November 2011, which assumed an 8% decline in U.S. GDP and a 13% unemployment rate, proved to be more stringent than expected. Secondly, previously unknown information surfaced that Bank of America has been operating under a memorandum of understanding (MOU) with the U.S. government since May 2009. Thus, the company may face enforcement action from regulators, a negative overhang on the stock.
In health care, St. Jude Medical detracted from the Fund’s relative performance. Medical device company shares broadly came under pressure during the Reporting Period on news that Medicare payment process changes could potentially lead to greater scrutiny of payment for specific high-cost medical device procedures. While fears abated after the Center for Medicare and Medicaid Services announced the program would be limited in scope and breadth, shares of St. Jude Medical were hit once again when the Food and Drug Administration (FDA) issued a recall of its Riata defibrillator, which is no longer one of its marketed products. At the end of the Reporting Period, it was our understanding that concerns regarding the defibrillator were confined to a small subset of the product line and that there was no evidence of any impact to St. Jude Medical’s current product lineup.
| |
| Q | What were some of the Fund’s best-performing individual stocks? |
| |
| A | The Fund benefited most relative to the S&P 500 Index from positions in home improvement retailer Lowe’s, personal computer and mobile communications device giant Apple and diversified technology company Honeywell International. |
Lowe’s was a top contributor to the Fund’s relative performance during the Reporting Period as the company beat earnings expectations driven by improved traffic trends and incrementally positive housing market data. Further, Lowe’s management announced a decision to take on more debt in order to fund upcoming share buybacks. We believe this showed a clear commitment by company management to increase return invested capital. Lowe’s management also took important steps to differentiate Lowe’s from competitors by improving its operational efficiency and implementation of technology. Further, Lowe’s management, in our view, remained focused on more effective marketing techniques and improving in-store format, which we believe will further differentiate Lowe’s in the duopolistic home improvement market going forward.
Shares of Apple rose during the Reporting Period as sales and earnings continued to exceed analyst expectations driven by strong iPhone and iPad sales. We believe the iPad has joined the iPhone as a key Apple product that has helped the company increase market share and build brand awareness as new customers are exposed to the company’s product offerings. In August 2011, Steve Jobs resigned as Chief Executive Officer of the firm and was succeeded by Chief Operating Officer Tim Cook. While Mr. Jobs’ passing in October was certainly a loss not only to Apple but to U.S. innovation, we believe Apple’s platform is now stronger than ever and can be successfully managed by Mr. Cook and Apple’s seasoned management team.
Honeywell International, which manufactures aerospace, building control and automotive products, was another strong contributor to the Fund’s relative results during the Reporting Period. The company provided an upbeat earnings announcement in October 2011, driven primarily by strong revenue and margin growth in its specialty materials and transport segments. We also believe that Honeywell International benefited from the fact that its late-cycle portfolio provided defensive cash flow in a challenging macroeconomic environment. The company further benefited during the Reporting Period from growth in air traffic, share gains in emerging markets, a number of new productivity initiatives and potential margin expansion in its automation and controls segments.
| |
| Q | How did the Fund use derivatives and similar instruments during the Reporting Period? |
| |
| A | During the Reporting Period, we did not use derivatives as part of an active management strategy. |
| |
| Q | Did the Fund make any significant purchases or sales during the Reporting Period? |
| |
| A | We initiated a Fund position in Abbott Laboratories after management announced it would split the company into a branded pharmaceutical company and a diversified medical products company, which is anticipated to result in a tax-free distribution to shareholders by the end of 2012. Abbott Laboratories is a leading global health care company that develops, manufactures and sells a diversified line of health care products. We believe its management’s decision to spin |
PORTFOLIO RESULTS
| |
| out its branded pharmaceutical business could unlock shareholder value by alleviating the overhang on the stock caused by competitive threats to its Humira arthritis drug. In our view, the patent issues associated with Humira have caused investors to overlook the value of Abbott Laboratories’ line of high growth businesses, namely, medical devices and diagnostics. Shares should benefit going forward, we believe, from increased visibility into underlying businesses, an updated product mix and increased exposure to emerging markets, which at the end of the Reporting Period contributed approximately 40% of the company’s revenues. |
We added to the Fund’s position in Procter & Gamble. Included in its 2011 year-end earnings report, management announced that the company is anticipated to achieve $10 billion in gross savings through 2016. We believe management’s ongoing focus on savings should improve margin flexibility over the next few years. In our view, this is particularly important in light of potential demand headwinds from the developed markets as cost savings initiatives may provide a cushion to earnings. We also believe that Procter & Gamble is well positioned given its diversified product portfolio that includes both low-end value brands that have performed well in a recessionary environment as well as higher quality, luxury brands that may benefit in a recovery. Furthermore, we are encouraged by Procter & Gamble’s ongoing efforts to achieve scale in the emerging markets where it continues to introduce incremental innovation to its product pipeline.
We also added to the Fund’s position in Exxon Mobil, an industry leader in exploration and production of natural gas and crude oil. In an environment of increasing uncertainty regarding global economic activity, we believe Exxon Mobil provides strong defensive attributes to the Fund’s energy positioning. In our view, the company has a strong balance sheet and superior free cash flow generation. We also believe that its management has already positioned the company for declining oil prices by repositioning its business mix to take advantage of increasing global demand for natural gas. The company remains the industry leader in distributions to shareholders when considering the combined impact of dividends and share repurchases.
Conversely, we sold the Fund’s position in Amgen, a biotechnology company that manufactures and markets medicines, during the Reporting Period. While we still believed that Amgen has a strong oncology franchise that has not been reflected in the company’s valuation, the company continued to face challenges in its base business. We decided to sell out of the Fund’s position and reallocate the sales proceeds to higher conviction names.
We eliminated the Fund’s position in medical benefits provider WellPoint in order to reduce the Fund’s exposure to the individual and small group insurance markets, which we believe may be at a margin and pricing disadvantage under the new health care reform laws.
We sold the Fund’s position in beauty and related products manufacturer Avon Products. Its shares declined after the company announced lower than expected third quarter earnings and lowered its fiscal year 2011 revenue guidance. Avon Products’ earnings were impacted by disappointing sales in select markets and softer margins due to higher input costs. While Avon Products may be poised to deliver higher operating margins over the next few years as its geographic footprint broadens, particularly in Latin America, we decided to allocate the capital to higher conviction ideas.
| |
| Q | Were there any notable changes in the Fund’s weightings during the Reporting Period? |
| |
| A | In constructing the Fund’s portfolio, we focus on picking stocks rather than on making industry or sector bets. We seek to outpace the benchmark index by overweighting stocks that we expect to outperform and underweighting those that we think may lag. Consequently, changes in its sector weights are generally the direct result of individual stock selection or of stock appreciation or depreciation. That said, during the Reporting Period, the Fund’s exposure to energy increased and its allocation to information technology decreased compared to the S&P 500 Index. |
| |
| Q | How was the Fund positioned relative to its benchmark index at the end of February 2012? |
| |
| A | At the end of February 2012, the Fund had overweighted positions relative to the S&P 500 Index in financials and consumer discretionary. On the same date, the Fund had underweighted positions compared to the S&P 500 Index in utilities, materials, industrials and consumer staples and was rather neutrally weighted to the S&P 500 Index in energy, health care, information technology and telecommunication services. |
FUND BASICS
U.S. Equity Fund
as of February 29, 2012
| | | | | | | | | | | |
| | | Fund Total Return
| | | | |
| September 1, 2011–February 29, 2012 | | (based on NAV)1 | | S&P 500 Index2 | | |
|
| |
| Class A | | | 12.53 | % | | | 13.31 | % | | |
| Class C | | | 12.06 | | | | 13.31 | | | |
| Institutional | | | 12.69 | | | | 13.31 | | | |
| Class IR | | | 12.60 | | | | 13.31 | | | |
| Class R | | | 12.39 | | | | 13.31 | | | |
|
| | |
| 1 | | The net asset value (“NAV”) represents the net assets of the class of the Fund (ex-dividend) divided by the total number of shares of the class outstanding. The Fund’s performance reflects the reinvestment of dividends and other distributions. The Fund’s performance does not reflect the deduction of any applicable sales charges. |
| |
| 2 | | The S&P 500 Index is the Standard & Poor’s 500 Composite Index of 500 stocks, an unmanaged index of common stock prices. The Index figures do not reflect any deduction for fees, expenses or taxes. It is not possible to invest directly in an index. |
| |
| STANDARDIZED TOTAL RETURNS3 | |
| | | | | | | | | | | | | |
| For the period ended 12/31/11 | | One Year | | Since Inception | | Inception Date | | |
|
| |
| Class A | | | -10.30 | % | | | 1.85 | % | | 11/30/09 | | |
| Class C | | | -6.72 | | | | 3.83 | | | 11/30/09 | | |
| Institutional | | | -4.73 | | | | 5.06 | | | 11/30/09 | | |
| Class IR | | | -4.90 | | | | 4.86 | | | 11/30/09 | | |
| Class R | | | -5.36 | | | | 4.35 | | | 11/30/09 | | |
|
| | |
| 3 | | The Standardized Total Returns are average annual total returns as of the most recent calendar quarter-end. They assume reinvestment of all distributions at NAV. These returns reflect a maximum initial sales charge of 5.5% for Class A Shares and the assumed contingent deferred sales charge for Class C Shares (1% if redeemed within 12 months of purchase). Because Institutional, Class IR and Class R Shares do not involve a sales charge, such a charge is not applied to their Standardized Total Returns. |
| |
| | The returns represent past performance. Past performance does not guarantee future results. The Fund’s investment return and principal value will fluctuate so that an investor’s shares, when redeemed, may be worth more or less than their original cost. Current performance may be lower or higher than the performance quoted above. Please visit our website at www.goldmansachsfunds.com to obtain the most recent month-end returns. Performance reflects fee waivers and/or expense limitations in effect. In their absence, performance would be reduced. Returns do not reflect the deduction of taxes that a shareholder would pay on Fund distributions or the redemption of Fund shares. |
FUND BASICS
| | | | | | | | | | | |
| | | Net Expense Ratio (Current) | | Gross Expense Ratio (Before Waivers) | | |
|
| |
| Class A | | | 1.18 | % | | | 4.88 | % | | |
| Class C | | | 1.93 | | | | 5.63 | | | |
| Institutional | | | 0.78 | | | | 4.48 | | | |
| Class IR | | | 0.93 | | | | 4.63 | | | |
| Class R | | | 1.43 | | | | 5.13 | | | |
|
| | |
| 4 | | The expense ratios of the Fund, both current (net of applicable fee waivers and/or expense limitations) and before waivers (gross of applicable fee waivers and/or expense limitations) are as set forth above according to the most recent publicly available Prospectus for the Fund and may differ from the expense ratios disclosed in the Financial Highlights in this report. The Fund’s waivers and/or expense limitations will remain in place through at least December 29, 2012, and prior to such date the investment adviser may not terminate the arrangements without the approval of the Fund’s Board of Trustees. If these arrangements are discontinued in the future, the expense ratios may change without shareholder approval. |
| |
| TOP TEN HOLDINGS AS OF 2/29/125 | |
| | | | | | | | | |
| Holding | | % of Net Assets | | Line of Business | | |
|
| |
| Apple, Inc. | | | 4.4 | % | | Computers & Peripherals | | |
| Exxon Mobil Corp. | | | 3.8 | | | Oil, Gas & Consumable Fuels | | |
| General Electric Co. | | | 3.7 | | | Industrial Conglomerates | | |
| JPMorgan Chase & Co. | | | 2.9 | | | Diversified Financial Services | | |
| QUALCOMM, Inc. | | | 2.8 | | | Communications Equipment | | |
| The Procter & Gamble Co. | | | 2.6 | | | Household Products | | |
| Merck & Co., Inc. | | | 2.2 | | | Pharmaceuticals | | |
| Google, Inc. Class A | | | 2.2 | | | Internet Software & Services | | |
| Devon Energy Corp. | | | 2.1 | | | Oil, Gas & Consumable Fuels | | |
| The Boeing Co. | | | 2.1 | | | Aerospace & Defense | | |
|
| | |
| 5 | | The top 10 holdings may not be representative of the Fund’s future investments. |
FUND BASICS
| |
| FUND VS. BENCHMARK SECTOR ALLOCATION6 | |
As of February 29, 2012
| | |
| 6 | | The Fund is actively managed and, as such, its composition may differ over time. Consequently, the Fund’s overall sector allocations may differ from the percentages contained in the graph above. The graph categorizes investments using Global Industry Classification Standard (“GICS”), however, the sector classifications used by the portfolio management team may differ from GICS. The percentage shown for each investment category reflects the value of investments in that category as a percentage of market value. Short-term investments represent repurchase agreements. The graph depicts the Fund’s investments but may not represent the Fund’s market exposure due to the exclusion of certain derivatives, if any, as listed in the Additional Investment Information section of the Schedule of Investments. |
GOLDMAN SACHS CAPITAL GROWTH FUND
Schedule of Investments
February 29, 2012 (Unaudited)
| | | | | | | | | |
| Shares | | Description | | Value |
| |
Common Stocks – 99.3% |
Aerospace & Defense – 2.4% |
| | 317,958 | | | Honeywell International, Inc. | | $ | 18,940,758 | |
| | 59,950 | | | The Boeing Co. | | | 4,493,253 | |
| | | | | | | | | |
| | | | | | | | 23,434,011 | |
| |
| |
Beverages – 2.2% |
| | 77,214 | | | Diageo PLC ADR | | | 7,378,570 | |
| | 222,612 | | | PepsiCo., Inc. | | | 14,011,199 | |
| | | | | | | | | |
| | | | | | | | 21,389,769 | |
| |
| |
Biotechnology* – 1.8% |
| | 258,847 | | | Gilead Sciences, Inc. | | | 11,777,539 | |
| | 148,133 | | | Vertex Pharmaceuticals, Inc. | | | 5,765,336 | |
| | | | | | | | | |
| | | | | | | | 17,542,875 | |
| |
| |
Capital Markets – 1.3% |
| | 108,956 | | | Northern Trust Corp. | | | 4,838,736 | |
| | 122,900 | | | T. Rowe Price Group, Inc. | | | 7,569,411 | |
| | | | | | | | | |
| | | | | | | | 12,408,147 | |
| |
| |
Chemicals – 2.5% |
| | 118,146 | | | Ecolab, Inc. | | | 7,088,760 | |
| | 154,587 | | | Praxair, Inc. | | | 16,849,983 | |
| | | | | | | | | |
| | | | | | | | 23,938,743 | |
| |
| |
Communications Equipment – 3.3% |
| | 142,996 | | | Juniper Networks, Inc.* | | | 3,254,589 | |
| | 459,696 | | | QUALCOMM, Inc. | | | 28,583,897 | |
| | | | | | | | | |
| | | | | | | | 31,838,486 | |
| |
| |
Computers & Peripherals* – 9.1% |
| | 141,495 | | | Apple, Inc. | | | 76,752,548 | |
| | 285,239 | | | NetApp, Inc. | | | 12,265,277 | |
| | | | | | | | | |
| | | | | | | | 89,017,825 | |
| |
| |
Construction & Engineering* – 0.3% |
| | 127,227 | | | Quanta Services, Inc. | | | 2,659,044 | |
| |
| |
Consumer Finance – 1.5% |
| | 273,304 | | | American Express Co. | | | 14,455,049 | |
| |
| |
Diversified Financial Services – 2.7% |
| | 48,524 | | | CME Group, Inc. | | | 14,047,213 | |
| | 55,208 | | | IntercontinentalExchange, Inc.* | | | 7,616,495 | |
| | 138,781 | | | MSCI, Inc. Class A* | | | 4,910,072 | |
| | | | | | | | | |
| | | | | | | | 26,573,780 | |
| |
| |
Electrical Equipment – 1.6% |
| | 92,893 | | | Emerson Electric Co. | | | 4,673,447 | |
| | 57,160 | | | Rockwell Automation, Inc. | | | 4,571,656 | |
| | 69,417 | | | Roper Industries, Inc. | | | 6,353,044 | |
| | | | | | | | | |
| | | | | | | | 15,598,147 | |
| |
| |
Electronic Equipment, Instruments & Components – 1.2% |
| | 210,994 | | | Amphenol Corp. Class A | | | 11,807,224 | |
| |
| |
Energy Equipment & Services – 5.7% |
| | 179,409 | | | Cameron International Corp.* | | | 9,994,875 | |
| | 397,260 | | | Halliburton Co. | | | 14,535,743 | |
| | 75,526 | | | National-Oilwell Varco, Inc. | | | 6,233,161 | |
| | 318,060 | | | Schlumberger Ltd. | | | 24,684,637 | |
| | | | | | | | | |
| | | | | | | | 55,448,416 | |
| |
| |
Food & Staples Retailing – 1.8% |
| | 198,901 | | | Costco Wholesale Corp. | | | 17,117,420 | |
| |
| |
Health Care Equipment & Supplies – 2.4% |
| | 71,920 | | | Baxter International, Inc. | | | 4,180,710 | |
| | 45,639 | | | C.R. Bard, Inc. | | | 4,272,723 | |
| | 165,036 | | | CareFusion Corp.* | | | 4,259,579 | |
| | 260,096 | | | St. Jude Medical, Inc. | | | 10,955,243 | |
| | | | | | | | | |
| | | | | | | | 23,668,255 | |
| |
| |
Health Care Providers & Services* – 1.2% |
| | 105,739 | | | Express Scripts, Inc. | | | 5,639,061 | |
| | 79,609 | | | Henry Schein, Inc. | | | 5,892,658 | |
| | | | | | | | | |
| | | | | | | | 11,531,719 | |
| |
| |
Hotels, Restaurants & Leisure – 2.1% |
| | 265,092 | | | Marriott International, Inc. Class A | | | 9,352,446 | |
| | 56,755 | | | McDonald’s Corp. | | | 5,634,636 | |
| | 86,742 | | | Yum! Brands, Inc. | | | 5,745,790 | |
| | | | | | | | | |
| | | | | | | | 20,732,872 | |
| |
| |
Household Durables – 0.5% |
| | 257,280 | | | Newell Rubbermaid, Inc. | | | 4,708,224 | |
| |
| |
Household Products – 1.9% |
| | 98,099 | | | Colgate-Palmolive Co. | | | 9,140,865 | |
| | 145,590 | | | The Procter & Gamble Co. | | | 9,830,237 | |
| | | | | | | | | |
| | | | | | | | 18,971,102 | |
| |
| |
Industrial Conglomerates – 0.9% |
| | 168,053 | | | Danaher Corp. | | | 8,878,240 | |
| |
| |
Internet & Catalog Retail* – 2.6% |
| | 116,845 | | | Amazon.com, Inc. | | | 20,995,878 | |
| | 6,304 | | | Priceline.com, Inc. | | | 3,952,734 | |
| | | | | | | | | |
| | | | | | | | 24,948,612 | |
| |
| |
Internet Software & Services* – 5.7% |
| | 212,093 | | | eBay, Inc. | | | 7,580,204 | |
| | 117,850 | | | Equinix, Inc. | | | 16,520,213 | |
| | 50,668 | | | Google, Inc. Class A | | | 31,325,491 | |
| | | | | | | | | |
| | | | | | | | 55,425,908 | |
| |
| |
IT Services – 5.8% |
| | 96,033 | | | Cognizant Technology Solutions Corp. Class A* | | | 6,813,541 | |
| | 94,320 | | | Global Payments, Inc. | | | 4,868,798 | |
| | 111,760 | | | International Business Machines Corp. | | | 21,986,545 | |
| | 32,811 | | | MasterCard, Inc. Class A | | | 13,780,620 | |
| | 112,858 | | | VeriFone Systems, Inc.* | | | 5,404,770 | |
| | 208,006 | | | Western Union Co. | | | 3,633,865 | |
| | | | | | | | | |
| | | | | | | | 56,488,139 | |
| |
| |
Life Sciences Tools & Services* – 1.0% |
| | 170,137 | | | Thermo Fisher Scientific, Inc. | | | 9,633,157 | |
| |
| |
58 The accompanying notes are an integral part of these financial statements.
GOLDMAN SACHS CAPITAL GROWTH FUND
| | | | | | | | | |
| Shares | | Description | | Value |
| |
Common Stocks – (continued) |
| | | | | | | | | |
Machinery – 3.8% |
| | 127,186 | | | Caterpillar, Inc. | | $ | 14,525,913 | |
| | 52,883 | | | Deere & Co. | | | 4,385,587 | |
| | 189,629 | | | Eaton Corp. | | | 9,896,738 | |
| | 190,044 | | | Kennametal, Inc. | | | 8,755,327 | |
| | | | | | | | | |
| | | | | | | | 37,563,565 | |
| |
| |
Media – 2.6% |
| | 105,759 | | | Discovery Communications, Inc. Class A* | | | 4,933,657 | |
| | 198,279 | | | Scripps Networks Interactive Class A | | | 8,962,211 | |
| | 232,839 | | | Viacom, Inc. Class B | | | 11,087,793 | |
| | | | | | | | | |
| | | | | | | | 24,983,661 | |
| |
| |
Oil, Gas & Consumable Fuels – 5.4% |
| | 94,070 | | | Devon Energy Corp. | | | 6,896,272 | |
| | 175,520 | | | Exxon Mobil Corp. | | | 15,182,480 | |
| | 116,797 | | | Occidental Petroleum Corp. | | | 12,190,103 | |
| | 79,922 | | | Pioneer Natural Resources Co. | | | 8,762,648 | |
| | 141,902 | | | Southwestern Energy Co.* | | | 4,691,280 | |
| | 86,964 | | | Whiting Petroleum Corp.* | | | 5,099,569 | |
| | | | | | | | | |
| | | | | | | | 52,822,352 | |
| |
| |
Personal Products – 1.0% |
| | 267,988 | | | Avon Products, Inc. | | | 5,008,696 | |
| | 82,748 | | | The Estee Lauder Cos., Inc. Class A | | | 4,844,068 | |
| | | | | | | | | |
| | | | | | | | 9,852,764 | |
| |
| |
Pharmaceuticals – 2.5% |
| | 240,709 | | | Abbott Laboratories | | | 13,626,536 | |
| | 231,834 | | | Teva Pharmaceutical Industries Ltd. ADR | | | 10,388,482 | |
| | | | | | | | | |
| | | | | | | | 24,015,018 | |
| |
| |
Real Estate Investment Trusts – 2.3% |
| | 352,722 | | | American Tower Corp. | | | 22,073,343 | |
| |
| |
Real Estate Management & Development* – 1.3% |
| | 677,194 | | | CBRE Group, Inc. Class A | | | 12,412,966 | |
| |
| |
Semiconductors & Semiconductor Equipment – 2.3% |
| | 431,311 | | | NVIDIA Corp.* | | | 6,534,361 | |
| | 138,034 | | | Texas Instruments, Inc. | | | 4,603,434 | |
| | 319,502 | | | Xilinx, Inc. | | | 11,799,209 | |
| | | | | | | | | |
| | | | | | | | 22,937,004 | |
| |
| |
Software – 6.8% |
| | 71,289 | | | Citrix Systems, Inc.* | | | 5,328,140 | |
| | 877,975 | | | Microsoft Corp. | | | 27,866,926 | |
| | 756,466 | | | Oracle Corp. | | | 22,141,760 | |
| | 78,331 | | | Salesforce.com, Inc.* | | | 11,213,866 | |
| | | | | | | | | |
| | | | | | | | 66,550,692 | |
| |
| |
Specialty Retail – 3.4% |
| | 578,072 | | | Lowe’s Cos., Inc. | | | 16,405,684 | |
| | 105,915 | | | PetSmart, Inc. | | | 5,903,702 | |
| | 375,590 | | | Urban Outfitters, Inc.* | | | 10,663,000 | |
| | | | | | | | | |
| | | | | | | | 32,972,386 | |
| |
| |
Textiles, Apparel & Luxury Goods – 3.8% |
| | 93,176 | | | Lululemon Athletica, Inc.* | | | 6,244,656 | |
| | 166,841 | | | NIKE, Inc. Class B | | | 18,005,481 | |
| | 148,548 | | | PVH Corp. | | | 12,628,065 | |
| | | | | | | | | |
| | | | | | | | 36,878,202 | |
| |
| |
Tobacco – 1.0% |
| | 118,962 | | | Philip Morris International, Inc. | | | 9,935,706 | |
| |
| |
Wireless Telecommunication Services* – 1.6% |
| | 339,390 | | | SBA Communications Corp. Class A | | | 15,927,573 | |
| |
| |
TOTAL COMMON STOCKS |
(Cost $689,521,685) | | $ | 967,140,396 | |
| |
| |
| | | | | | | | | |
| | | | | | | | | |
Exchange Traded Fund – 0.5% |
| | 76,498 | | | iShares Russell 1000 Growth Index Fund | | | | |
(Cost $4,324,212) | | $ | 4,908,877 | |
| |
| |
| | | | | | | | | |
| | | | | | | | | | | | | |
Principal
| | Interest
| | Maturity
| | |
| Amount | | Rate | | Date | | Value |
| |
Short-term Investment(a) – 0.1% |
Repurchase Agreement – 0.1% |
| Joint Repurchase Agreement Account II |
| $ | 600,000 | | | 0.193% | | | 03/01/12 | | | $ | 600,000 | |
(Cost $600,000) | | | | | | | | |
| |
| |
TOTAL INVESTMENTS – 99.9% |
(Cost $694,445,897) | | | | | | $ | 972,649,273 | |
| |
| |
OTHER ASSETS IN EXCESS OF LIABILITIES – 0.1% | | | | | | | 973,701 | |
| |
| |
NET ASSETS – 100.0% | | | | | | $ | 973,622,974 | |
| |
| |
The percentage shown for each investment category reflects the value of investments in that category as a percentage of net assets.
| | |
| * | | Non-income producing security. |
| |
| (a) | | Joint repurchase agreement was entered into on February 29, 2012. Additional information appears on page 73. |
| | | | | |
| |
| |
Investment Abbreviation: |
| ADR | | — | | American Depositary Receipt |
| |
| |
The accompanying notes are an integral part of these financial statements. 59
GOLDMAN SACHS CONCENTRATED GROWTH FUND
Schedule of Investments
February 29, 2012 (Unaudited)
| | | | | | | | | |
| Shares | | Description | | Value |
| |
Common Stocks – 98.8% |
Aerospace & Defense* – 1.5% |
| | 48,220 | | | Honeywell International, Inc. | | $ | 2,872,465 | |
| |
| |
Beverages – 2.2% |
| | 67,930 | | | PepsiCo., Inc. | | | 4,275,514 | |
| |
| |
Capital Markets – 1.5% |
| | 66,942 | | | Northern Trust Corp. | | | 2,972,894 | |
| |
| |
Chemicals – 2.7% |
| | 48,494 | | | Praxair, Inc. | | | 5,285,846 | |
| |
| |
Communications Equipment – 6.1% |
| | 189,737 | | | QUALCOMM, Inc. | | | 11,797,847 | |
| |
| |
Computers & Peripherals* – 11.9% |
| | 32,381 | | | Apple, Inc. | | | 17,564,750 | |
| | 124,049 | | | NetApp, Inc. | | | 5,334,107 | |
| | | | | | | | | |
| | | | | | | | 22,898,857 | |
| |
| |
Consumer Finance – 2.5% |
| | 90,870 | | | American Express Co. | | | 4,806,114 | |
| |
| |
Diversified Financial Services – 3.0% |
| | 19,971 | | | CME Group, Inc. | | | 5,781,405 | |
| |
| |
Energy Equipment & Services – 8.3% |
| | 53,087 | | | Cameron International Corp.* | | | 2,957,477 | |
| | 115,388 | | | Halliburton Co. | | | 4,222,047 | |
| | 112,776 | | | Schlumberger Ltd. | | | 8,752,545 | |
| | | | | | | | | |
| | | | | | | | 15,932,069 | |
| |
| |
Food & Staples Retailing – 3.3% |
| | 74,336 | | | Costco Wholesale Corp. | | | 6,397,356 | |
| |
| |
Health Care Equipment & Supplies – 2.9% |
| | 132,584 | | | St. Jude Medical, Inc. | | | 5,584,438 | |
| |
| |
Hotels, Restaurants & Leisure – 2.4% |
| | 131,631 | | | Marriott International, Inc. Class A | | | 4,643,942 | |
| |
| |
Household Products – 2.3% |
| | 66,677 | | | The Procter & Gamble Co. | | | 4,502,031 | |
| |
| |
Internet & Catalog Retail* – 1.4% |
| | 15,050 | | | Amazon.com, Inc. | | | 2,704,335 | |
| |
| |
Internet Software & Services* – 7.4% |
| | 40,416 | | | Equinix, Inc. | | | 5,665,515 | |
| | 14,100 | | | Google, Inc. Class A | | | 8,717,325 | |
| | | | | | | | | |
| | | | | | | | 14,382,840 | |
| |
| |
IT Services – 3.6% |
| | 16,625 | | | MasterCard, Inc. Class A | | | 6,982,500 | |
| |
| |
Life Sciences Tools & Services* – 2.4% |
| | 81,160 | | | Thermo Fisher Scientific, Inc. | | | 4,595,279 | |
| |
| |
Oil, Gas & Consumable Fuels – 1.9% |
| | 49,382 | | | Devon Energy Corp. | | | 3,620,194 | |
| |
| |
Personal Products – 1.4% |
| | 146,633 | | | Avon Products, Inc. | | | 2,740,571 | |
| |
| |
Pharmaceuticals – 2.1% |
| | 89,692 | | | Teva Pharmaceutical Industries Ltd. ADR | | | 4,019,099 | |
| |
| |
Real Estate Investment Trusts – 5.3% |
| | 163,137 | | | American Tower Corp. | | | 10,209,113 | |
| |
| |
Real Estate Management & Development* – 2.6% |
| | 275,577 | | | CBRE Group, Inc. Class A | | | 5,051,326 | |
| |
| |
Semiconductors & Semiconductor Equipment – 2.9% |
| | 152,690 | | | Xilinx, Inc. | | | 5,638,842 | |
| |
| |
Software – 3.1% |
| | 207,086 | | | Oracle Corp. | | | 6,061,407 | |
| |
| |
Specialty Retail – 5.8% |
| | 247,716 | | | Lowe’s Cos., Inc. | | | 7,030,180 | |
| | 148,913 | | | Urban Outfitters, Inc.* | | | 4,227,640 | |
| | | | | | | | | |
| | | | | | | | 11,257,820 | |
| |
| |
Textiles, Apparel & Luxury Goods – 5.2% |
| | 64,482 | | | NIKE, Inc. Class B | | | 6,958,898 | |
| | 37,239 | | | PVH Corp. | | | 3,165,687 | |
| | | | | | | | | |
| | | | | | | | 10,124,585 | |
| |
| |
Wireless Telecommunication Services* – 3.1% |
| | 114,390 | | | Crown Castle International Corp. | | | 5,926,546 | |
| |
| |
TOTAL COMMON STOCKS |
(Cost $131,272,963) | | $ | 191,065,235 | |
| |
| |
| | | | | | | | | |
| | | | | | | | | |
Exchange Traded Fund – 0.7% |
| | 20,950 | | | iShares Russell 1000 Growth Index Fund | | | | |
(Cost $1,306,385) | | $ | 1,344,362 | |
| |
| |
TOTAL INVESTMENTS – 99.5% |
(Cost $132,579,348) | | $ | 192,409,597 | |
| |
| |
OTHER ASSETS IN EXCESS OF LIABILITIES – 0.5% | | | 884,396 | |
| |
| |
NET ASSETS – 100.0% | | $ | 193,293,993 | |
| |
| |
The percentage shown for each investment category reflects the value of investments in that category as a percentage of net assets.
| | |
| * | | Non-income producing security. |
| | | | | |
| |
| |
Investment Abbreviation: |
| ADR | | — | | American Depositary Receipt |
| |
| |
60 The accompanying notes are an integral part of these financial statements.
GOLDMAN SACHS FLEXIBLE CAP GROWTH FUND
Schedule of Investments
February 29, 2012 (Unaudited)
| | | | | | | | | |
| Shares | | Description | | Value |
| |
Common Stocks – 99.3% |
Aerospace & Defense* – 1.9% |
| | 2,404 | | | DigitalGlobe, Inc. | | $ | 36,974 | |
| | 3,943 | | | Honeywell International, Inc. | | | 234,884 | |
| | | | | | | | | |
| | | | | | | | 271,858 | |
| |
| |
Auto Components* – 0.4% |
| | 3,628 | | | Amerigon, Inc. | | | 53,404 | |
| |
| |
Beverages – 1.8% |
| | 749 | | | Diageo PLC ADR | | | 71,574 | |
| | 2,926 | | | PepsiCo., Inc. | | | 184,163 | |
| | | | | | | | | |
| | | | | | | | 255,737 | |
| |
| |
Biotechnology* – 1.1% |
| | 3,915 | | | Amylin Pharmaceuticals, Inc. | | | 66,907 | |
| | 1,880 | | | Gilead Sciences, Inc. | | | 85,540 | |
| | | | | | | | | |
| | | | | | | | 152,447 | |
| |
| |
Capital Markets – 2.8% |
| | 4,469 | | | Evercore Partners, Inc. Class A | | | 121,512 | |
| | 4,226 | | | Lazard Ltd. Class A | | | 128,724 | |
| | 3,370 | | | Northern Trust Corp. | | | 149,662 | |
| | | | | | | | | |
| | | | | | | | 399,898 | |
| |
| |
Chemicals – 3.0% |
| | 890 | | | Airgas, Inc. | | | 73,274 | |
| | 1,123 | | | Ecolab, Inc. | | | 67,380 | |
| | 1,251 | | | International Flavors & Fragrances, Inc. | | | 71,344 | |
| | 1,932 | | | Praxair, Inc. | | | 210,588 | |
| | | | | | | | | |
| | | | | | | | 422,586 | |
| |
| |
Commercial Banks* – 1.6% |
| | 6,789 | | | Eagle Bancorp, Inc. | | | 105,297 | |
| | 4,235 | | | First Republic Bank | | | 127,008 | |
| | | | | | | | | |
| | | | | | | | 232,305 | |
| |
| |
Communications Equipment – 3.3% |
| | 7,654 | | | QUALCOMM, Inc. | | | 475,926 | |
| |
| |
Computers & Peripherals* – 8.7% |
| | 1,983 | | | Apple, Inc. | | | 1,075,659 | |
| | 3,769 | | | NetApp, Inc. | | | 162,067 | |
| | | | | | | | | |
| | | | | | | | 1,237,726 | |
| |
| |
Construction & Engineering* – 0.4% |
| | 2,986 | | | Quanta Services, Inc. | | | 62,407 | |
| |
| |
Consumer Finance – 1.3% |
| | 3,509 | | | American Express Co. | | | 185,591 | |
| |
| |
Diversified Consumer Services* – 1.2% |
| | 3,047 | | | Coinstar, Inc. | | | 177,427 | |
| |
| |
Diversified Financial Services – 2.2% |
| | 493 | | | CME Group, Inc. | | | 142,719 | |
| | 796 | | | IntercontinentalExchange, Inc.* | | | 109,816 | |
| | 1,933 | | | MSCI, Inc. Class A* | | | 68,389 | |
| | | | | | | | | |
| | | | | | | | 320,924 | |
| |
| |
Diversified Telecommunication Services* – 0.5% |
| | 3,497 | | | TW telecom, Inc. | | | 75,535 | |
| |
| |
Electrical Equipment – 1.5% |
| | 1,256 | | | Emerson Electric Co. | | | 63,189 | |
| | 675 | | | Rockwell Automation, Inc. | | | 53,987 | |
| | 1,003 | | | Roper Industries, Inc. | | | 91,795 | |
| | | | | | | | | |
| | | | | | | | 208,971 | |
| |
| |
Electronic Equipment, Instruments & Components – 2.3% |
| | 3,480 | | | Amphenol Corp. Class A | | | 194,741 | |
| | 3,238 | | | FLIR Systems, Inc. | | | 84,739 | |
| | 4,578 | | | RealD, Inc.* | | | 54,020 | |
| | | | | | | | | |
| | | | | | | | 333,500 | |
| |
| |
Energy Equipment & Services – 5.7% |
| | 3,073 | | | Cameron International Corp.* | | | 171,197 | |
| | 745 | | | Dril-Quip, Inc.* | | | 52,142 | |
| | 5,147 | | | Halliburton Co. | | | 188,329 | |
| | 5,275 | | | Schlumberger Ltd. | | | 409,393 | |
| | | | | | | | | |
| | | | | | | | 821,061 | |
| |
| |
Food & Staples Retailing – 1.8% |
| | 2,956 | | | Costco Wholesale Corp. | | | 254,393 | |
| |
| |
Food Products* – 0.7% |
| | 1,774 | | | TreeHouse Foods, Inc. | | | 102,182 | |
| |
| |
Health Care Equipment & Supplies – 3.7% |
| | 2,173 | | | Baxter International, Inc. | | | 126,316 | |
| | 978 | | | C.R. Bard, Inc. | | | 91,560 | |
| | 4,175 | | | CareFusion Corp.* | | | 107,757 | |
| | 4,765 | | | St. Jude Medical, Inc. | | | 200,702 | |
| | | | | | | | | |
| | | | | | | | 526,335 | |
| |
| |
Health Care Providers & Services* – 1.2% |
| | 3,789 | | | ExamWorks Group, Inc. | | | 39,102 | |
| | 1,824 | | | Henry Schein, Inc. | | | 135,013 | |
| | | | | | | | | |
| | | | | | | | 174,115 | |
| |
| |
Health Care Technology* – 0.4% |
| | 4,101 | | | MedAssets, Inc. | | | 58,562 | |
| |
| |
Hotels, Restaurants & Leisure – 1.9% |
| | 3,381 | | | Marriott International, Inc. Class A | | | 119,282 | |
| | 751 | | | McDonald’s Corp. | | | 74,559 | |
| | 1,271 | | | Yum! Brands, Inc. | | | 84,191 | |
| | | | | | | | | |
| | | | | | | | 278,032 | |
| |
| |
Household Durables – 1.1% |
| | 8,190 | | | Newell Rubbermaid, Inc. | | | 149,877 | |
| |
| |
Household Products – 1.1% |
| | 2,243 | | | The Procter & Gamble Co. | | | 151,447 | |
| |
| |
Industrial Conglomerates – 0.8% |
| | 2,037 | | | Danaher Corp. | | | 107,615 | |
| |
| |
Internet & Catalog Retail* – 3.0% |
| | 1,500 | | | Amazon.com, Inc. | | | 269,535 | |
| | 3,839 | | | Groupon, Inc. | | | 75,686 | |
| | 127 | | | Priceline.com, Inc. | | | 79,632 | |
| | | | | | | | | |
| | | | | | | | 424,853 | |
| |
| |
The accompanying notes are an integral part of these financial statements. 61
GOLDMAN SACHS FLEXIBLE CAP GROWTH FUND
Schedule of Investments (continued)
February 29, 2012 (Unaudited)
| | | | | | | | | |
| Shares | | Description | | Value |
| |
Common Stocks – (continued) |
| | | | | | | | | |
Internet Software & Services* – 5.3% |
| | 3,606 | | | 21Vianet Group, Inc. ADR | | $ | 43,813 | |
| | 1,176 | | | Equinix, Inc. | | | 164,852 | |
| | 685 | | | Google, Inc. Class A | | | 423,501 | |
| | 2,467 | | | Rackspace Hosting, Inc. | | | 128,876 | |
| | | | | | | | | |
| | | | | | | | 761,042 | |
| |
| |
IT Services – 3.9% |
| | 5,167 | | | Genpact Ltd.* | | | 82,775 | |
| | 1,614 | | | Global Payments, Inc. | | | 83,315 | |
| | 5,529 | | | InterXion Holding NV* | | | 87,248 | |
| | 524 | | | MasterCard, Inc. Class A | | | 220,080 | |
| | 1,854 | | | VeriFone Systems, Inc.* | | | 88,788 | |
| | | | | | | | | |
| | | | | | | | 562,206 | |
| |
| |
Life Sciences Tools & Services* – 1.3% |
| | 3,157 | | | Thermo Fisher Scientific, Inc. | | | 178,749 | |
| |
| |
Machinery – 2.1% |
| | 1,329 | | | IDEX Corp. | | | 55,552 | |
| | 5,376 | | | Kennametal, Inc. | | | 247,673 | |
| | | | | | | | | |
| | | | | | | | 303,225 | |
| |
| |
Media – 2.1% |
| | 1,535 | | | Discovery Communications, Inc. Class A* | | | 71,608 | |
| | 3,200 | | | Scripps Networks Interactive Class A | | | 144,640 | |
| | 1,715 | | | Viacom, Inc. Class B | | | 81,668 | |
| | | | | | | | | |
| | | | | | | | 297,916 | |
| |
| |
Oil, Gas & Consumable Fuels – 4.9% |
| | 1,802 | | | Devon Energy Corp. | | | 132,105 | |
| | 1,356 | | | Occidental Petroleum Corp. | | | 141,526 | |
| | 1,340 | | | Pioneer Natural Resources Co. | | | 146,917 | |
| | 2,030 | | | Southwestern Energy Co.* | | | 67,112 | |
| | 3,660 | | | Whiting Petroleum Corp.* | | | 214,622 | |
| | | | | | | | | |
| | | | | | | | 702,282 | |
| |
| |
Personal Products – 0.6% |
| | 4,318 | | | Avon Products, Inc. | | | 80,703 | |
| |
| |
Pharmaceuticals – 2.8% |
| | 3,750 | | | Abbott Laboratories | | | 212,287 | |
| | 2,453 | | | Sagent Pharmaceuticals, Inc.* | | | 53,206 | |
| | 3,030 | | | Teva Pharmaceutical Industries Ltd. ADR | | | 135,774 | |
| | | | | | | | | |
| | | | | | | | 401,267 | |
| |
| |
Real Estate Investment Trusts – 1.6% |
| | 3,715 | | | American Tower Corp. | | | 232,485 | |
| |
| |
Real Estate Management & Development* – 0.9% |
| | 7,037 | | | CBRE Group, Inc. Class A | | | 128,988 | |
| |
| |
Semiconductors & Semiconductor Equipment – 3.4% |
| | 845 | | | Hittite Microwave Corp.* | | | 48,317 | |
| | 1,945 | | | Linear Technology Corp. | | | 65,119 | |
| | 6,667 | | | NVIDIA Corp.* | | | 101,005 | |
| | 2,040 | | | Texas Instruments, Inc. | | | 68,034 | |
| | 5,547 | | | Xilinx, Inc. | | | 204,851 | |
| | | | | | | | | |
| | | | | | | | 487,326 | |
| |
| |
Software – 6.1% |
| | 996 | | | Citrix Systems, Inc.* | | | 74,441 | |
| | 1,010 | | | MICROS Systems, Inc.* | | | 52,449 | |
| | 9,249 | | | Microsoft Corp. | | | 293,563 | |
| | 9,294 | | | Oracle Corp. | | | 272,036 | |
| | 1,293 | | | Salesforce.com, Inc.* | | | 185,106 | |
| | | | | | | | | |
| | | | | | | | 877,595 | |
| |
| |
Specialty Retail – 4.3% |
| | 2,060 | | | Dick’s Sporting Goods, Inc. | | | 92,206 | |
| | 6,473 | | | Lowe’s Cos., Inc. | | | 183,704 | |
| | 1,883 | | | PetSmart, Inc. | | | 104,958 | |
| | 8,196 | | | Urban Outfitters, Inc.* | | | 232,684 | |
| | | | | | | | | |
| | | | | | | | 613,552 | |
| |
| |
Textiles, Apparel & Luxury Goods – 3.2% |
| | 1,404 | | | Deckers Outdoor Corp.* | | | 104,963 | |
| | 1,547 | | | NIKE, Inc. Class B | | | 166,952 | |
| | 2,100 | | | PVH Corp. | | | 178,521 | |
| | | | | | | | | |
| | | | | | | | 450,436 | |
| |
| |
Wireless Telecommunication Services* – 1.4% |
| | 4,316 | | | SBA Communications Corp. Class A | | | 202,550 | |
| |
| |
TOTAL COMMON STOCKS |
(Cost $11,068,704) | | $ | 14,195,036 | |
| |
| |
| | | | | | | | | |
| | | | | | | | | | | | | |
Principal
| | Interest
| | Maturity
| | |
| Amount | | Rate | | Date | | Value |
| |
Short-term Investment(a) – 0.7% |
Repurchase Agreement – 0.7% |
| Joint Repurchase Agreement Account II |
| $ | 100,000 | | | 0.193% | | | 03/01/12 | | | $ | 100,000 | |
(Cost $100,000) | | | | | | | | |
| |
| |
TOTAL INVESTMENTS – 100.0% |
(Cost $11,168,704) | | | | | | $ | 14,295,036 | |
| |
| |
LIABILITIES IN EXCESS OF OTHER ASSETS – (0.0)% | | | | | | | (1,992 | ) |
| |
| |
NET ASSETS – 100.0% | | | | | | $ | 14,293,044 | |
| |
| |
The percentage shown for each investment category reflects the value of investments in that category as a percentage of net assets.
| | |
| * | | Non-income producing security. |
| |
| (a) | | Joint repurchase agreement was entered into on February 29, 2012. Additional information appears on page 73. |
| | | | | |
| |
| |
Investment Abbreviation: |
| ADR | | — | | American Depositary Receipt |
| |
| |
62 The accompanying notes are an integral part of these financial statements.
GOLDMAN SACHS FOCUSED GROWTH FUND
Schedule of Investments
February 29, 2012 (Unaudited)
| | | | | | | | | |
| Shares | | Description | | Value |
| |
Common Stocks – 97.0% |
Capital Markets – 3.0% |
| | 1,645 | | | Northern Trust Corp. | | $ | 73,055 | |
| |
| |
Chemicals – 2.9% |
| | 641 | | | Praxair, Inc. | | | 69,869 | |
| |
| |
Communications Equipment – 6.3% |
| | 2,493 | | | QUALCOMM, Inc. | | | 155,015 | |
| |
| |
Computers & Peripherals* – 8.9% |
| | 400 | | | Apple, Inc. | | | 216,976 | |
| |
| |
Consumer Finance – 3.4% |
| | 1,586 | | | American Express Co. | | | 83,884 | |
| |
| |
Diversified Financial Services – 4.5% |
| | 378 | | | CME Group, Inc. | | | 109,427 | |
| |
| |
Energy Equipment & Services – 8.5% |
| | 849 | | | Cameron International Corp.* | | | 47,298 | |
| | 1,824 | | | Halliburton Co. | | | 66,740 | |
| | 1,195 | | | Schlumberger Ltd. | | | 92,744 | |
| | | | | | | | | |
| | | | | | | | 206,782 | |
| |
| |
Food & Staples Retailing – 4.9% |
| | 1,385 | | | Costco Wholesale Corp. | | | 119,193 | |
| |
| |
Health Care Equipment & Supplies – 4.0% |
| | 2,294 | | | St. Jude Medical, Inc. | | | 96,623 | |
| |
| |
Hotels, Restaurants & Leisure – 2.4% |
| | 1,644 | | | Marriott International, Inc. Class A | | | 58,000 | |
| |
| |
Internet Software & Services* – 10.3% |
| | 752 | | | Equinix, Inc. | | | 105,415 | |
| | 234 | | | Google, Inc. Class A | | | 144,671 | |
| | | | | | | | | |
| | | | | | | | 250,086 | |
| |
| |
IT Services – 3.3% |
| | 190 | | | MasterCard, Inc. Class A | | | 79,800 | |
| |
| |
Life Sciences Tools & Services* – 3.0% |
| | 1,277 | | | Thermo Fisher Scientific, Inc. | | | 72,304 | |
| |
| |
Real Estate Investment Trusts – 6.4% |
| | 2,492 | | | American Tower Corp. | | | 155,949 | |
| |
| |
Real Estate Management & Development* – 4.2% |
| | 5,658 | | | CBRE Group, Inc. Class A | | | 103,711 | |
| |
| |
Semiconductors & Semiconductor Equipment – 2.9% |
| | 1,894 | | | Xilinx, Inc. | | | 69,945 | |
| |
| |
Specialty Retail – 5.9% |
| | 2,517 | | | Lowe’s Cos., Inc. | | | 71,433 | |
| | 2,570 | | | Urban Outfitters, Inc.* | | | 72,962 | |
| | | | | | | | | |
| | | | | | | | 144,395 | |
| |
| |
Textiles, Apparel & Luxury Goods – 8.4% |
| | 863 | | | NIKE, Inc. Class B | | | 93,135 | |
| | 1,319 | | | PVH Corp. | | | 112,128 | |
| | | | | | | | | |
| | | | | | | | 205,263 | |
| |
| |
Wireless Telecommunication Services* – 3.8% |
| | 1,986 | | | SBA Communications Corp. Class A | | | 93,203 | |
| |
| |
TOTAL INVESTMENTS – 97.0% |
(Cost $2,226,986) | | $ | 2,363,480 | |
| |
| |
OTHER ASSETS IN EXCESS OF LIABILITIES – 3.0% | | | 73,501 | |
| |
| |
NET ASSETS – 100.0% | | $ | 2,436,981 | |
| |
| |
The percentage shown for each investment category reflects the value of investments in that category as a percentage of net assets.
| | |
| * | | Non-income producing security. |
The accompanying notes are an integral part of these financial statements. 63
GOLDMAN SACHS GROWTH OPPORTUNITIES FUND
Schedule of Investments
February 29, 2012 (Unaudited)
| | | | | | | | | |
| Shares | | Description | | Value |
| |
Common Stocks – 99.2% |
Aerospace & Defense* – 0.4% |
| | 1,290,345 | | | DigitalGlobe, Inc. | | $ | 19,845,506 | |
| |
| |
Air Freight & Logistics – 0.7% |
| | 473,137 | | | C.H. Robinson Worldwide, Inc. | | | 31,307,475 | |
| |
| |
Biotechnology* – 2.8% |
| | 534,312 | | | Alexion Pharmaceuticals, Inc. | | | 44,737,944 | |
| | 1,739,009 | | | Amylin Pharmaceuticals, Inc. | | | 29,719,664 | |
| | 245,288 | | | BioMarin Pharmaceutical, Inc. | | | 8,769,046 | |
| | 1,093,222 | | | Vertex Pharmaceuticals, Inc. | | | 42,548,200 | |
| | | | | | | | | |
| | | | | | | | 125,774,854 | |
| |
| |
Capital Markets – 4.1% |
| | 1,768,912 | | | Lazard Ltd. Class A | | | 53,881,060 | |
| | 1,585,008 | | | Northern Trust Corp. | | | 70,390,205 | |
| | 928,985 | | | T. Rowe Price Group, Inc. | | | 57,216,186 | |
| | | | | | | | | |
| | | | | | | | 181,487,451 | |
| |
| |
Chemicals – 3.6% |
| | 724,512 | | | Airgas, Inc. | | | 59,649,073 | |
| | 1,338,391 | | | Ecolab, Inc. | | | 80,303,460 | |
| | 391,823 | | | International Flavors & Fragrances, Inc. | | | 22,345,666 | |
| | | | | | | | | |
| | | | | | | | 162,298,199 | |
| |
| |
Commercial Banks* – 1.5% |
| | 2,221,417 | | | First Republic Bank | | | 66,620,296 | |
| |
| |
Commercial Services & Supplies – 1.3% |
| | 2,373,064 | | | Ritchie Bros. Auctioneers, Inc. | | | 57,950,223 | |
| |
| |
Communications Equipment* – 0.7% |
| | 1,382,137 | | | Juniper Networks, Inc. | | | 31,457,438 | |
| |
| |
Computers & Peripherals* – 1.7% |
| | 1,784,592 | | | NetApp, Inc. | | | 76,737,456 | |
| |
| |
Construction & Engineering* – 1.4% |
| | 2,917,112 | | | Quanta Services, Inc. | | | 60,967,641 | |
| |
| |
Consumer Finance – 0.5% |
| | 1,508,389 | | | SLM Corp. | | | 23,772,211 | |
| |
| |
Diversified Consumer Services* – 1.7% |
| | 1,333,368 | | | Coinstar, Inc. | | | 77,642,019 | |
| |
| |
Diversified Financial Services* – 3.2% |
| | 627,945 | | | IntercontinentalExchange, Inc. | | | 86,631,292 | |
| | 1,641,239 | | | MSCI, Inc. Class A | | | 58,067,036 | |
| | | | | | | | | |
| | | | | | | | 144,698,328 | |
| |
| |
Diversified Telecommunication Services* – 1.4% |
| | 2,828,682 | | | TW telecom, Inc. | | | 61,099,531 | |
| |
| |
Electrical Equipment – 2.5% |
| | 423,296 | | | Rockwell Automation, Inc. | | | 33,855,214 | |
| | 824,149 | | | Roper Industries, Inc. | | | 75,426,117 | |
| | | | | | | | | |
| | | | | | | | 109,281,331 | |
| |
| |
Electronic Equipment, Instruments & Components – 3.7% |
| | 1,524,867 | | | Amphenol Corp. Class A | | | 85,331,557 | |
| | 1,807,648 | | | FLIR Systems, Inc. | | | 47,306,148 | |
| | 2,881,480 | | | RealD, Inc.*(a) | | | 34,001,464 | |
| | | | | | | | | |
| | | | | | | | 166,639,169 | |
| |
| |
Energy Equipment & Services – 5.4% |
| | 1,874,098 | | | Cameron International Corp.* | | | 104,405,999 | |
| | 485,251 | | | Core Laboratories NV | | | 59,035,637 | |
| | 1,092,885 | | | Dril-Quip, Inc.* | | | 76,491,021 | |
| | | | | | | | | |
| | | | | | | | 239,932,657 | |
| |
| |
Food Products* – 1.4% |
| | 461,246 | | | The Hain Celestial Group, Inc. | | | 18,837,287 | |
| | 747,726 | | | TreeHouse Foods, Inc. | | | 43,069,017 | |
| | | | | | | | | |
| | | | | | | | 61,906,304 | |
| |
| |
Health Care Equipment & Supplies – 7.5% |
| | 1,077,531 | | | C.R. Bard, Inc. | | | 100,878,452 | |
| | 2,464,032 | | | CareFusion Corp.* | | | 63,596,666 | |
| | 602,879 | | | Edwards Lifesciences Corp.* | | | 44,088,541 | |
| | 44,237 | | | Intuitive Surgical, Inc.* | | | 22,632,534 | |
| | 2,440,797 | | | St. Jude Medical, Inc. | | | 102,806,370 | |
| | | | | | | | | |
| | | | | | | | 334,002,563 | |
| |
| |
Health Care Providers & Services* – 1.8% |
| | 1,083,014 | | | Henry Schein, Inc. | | | 80,164,696 | |
| |
| |
Hotels, Restaurants & Leisure – 1.6% |
| | 2,038,281 | | | Marriott International, Inc. Class A | | | 71,910,554 | |
| |
| |
Household Durables – 1.7% |
| | 4,254,934 | | | Newell Rubbermaid, Inc. | | | 77,865,292 | |
| |
| |
Insurance – 1.0% |
| | 1,545,419 | | | Principal Financial Group, Inc. | | | 42,746,290 | |
| |
| |
Internet & Catalog Retail* – 0.5% |
| | 1,128,462 | | | Groupon, Inc. | | | 22,247,628 | |
| |
| |
Internet Software & Services* – 3.4% |
| | 681,929 | | | Equinix, Inc. | | | 95,592,807 | |
| | 1,090,027 | | | Rackspace Hosting, Inc. | | | 56,943,011 | |
| | | | | | | | | |
| | | | | | | | 152,535,818 | |
| |
| |
IT Services – 4.5% |
| | 602,606 | | | FleetCor Technologies, Inc.* | | | 22,314,500 | |
| | 2,850,220 | | | Genpact Ltd.* | | | 45,660,524 | |
| | 1,293,896 | | | Global Payments, Inc. | | | 66,790,912 | |
| | 1,404,788 | | | VeriFone Systems, Inc.* | | | 67,275,297 | |
| | | | | | | | | |
| | | | | | | | 202,041,233 | |
| |
| |
Life Sciences Tools & Services* – 1.6% |
| | 893,356 | | | Agilent Technologies, Inc. | | | 38,968,189 | |
| | 178,423 | | | Mettler-Toledo International, Inc. | | | 32,166,098 | |
| | | | | | | | | |
| | | | | | | | 71,134,287 | |
| |
| |
Machinery – 2.1% |
| | 2,077,858 | | | Kennametal, Inc. | | | 95,726,918 | |
| |
| |
64 The accompanying notes are an integral part of these financial statements.
GOLDMAN SACHS GROWTH OPPORTUNITIES FUND
| | | | | | | | | |
| Shares | | Description | | Value |
| |
Common Stocks – (continued) |
| | | | | | | | | |
Media – 2.6% |
| | 729,401 | | | Discovery Communications, Inc. Class A* | | $ | 34,026,557 | |
| | 1,778,743 | | | Scripps Networks Interactive Class A | | | 80,399,183 | |
| | | | | | | | | |
| | | | | | | | 114,425,740 | |
| |
| |
Oil, Gas & Consumable Fuels – 6.1% |
| | 713,231 | | | Pioneer Natural Resources Co. | | | 78,198,647 | |
| | 1,152,975 | | | Rosetta Resources, Inc.* | | | 58,847,844 | |
| | 900,795 | | | Southwestern Energy Co.* | | | 29,780,283 | |
| | 1,765,365 | | | Whiting Petroleum Corp.* | | | 103,521,003 | |
| | | | | | | | | |
| | | | | | | | 270,347,777 | |
| |
| |
Personal Products – 1.0% |
| | 2,475,069 | | | Avon Products, Inc. | | | 46,259,040 | |
| |
| |
Real Estate Management & Development* – 1.7% |
| | 4,236,817 | | | CBRE Group, Inc. Class A | | | 77,660,856 | |
| |
| |
Semiconductors & Semiconductor Equipment – 4.1% |
| | 615,206 | | | Altera Corp. | | | 23,654,671 | |
| | 715,946 | | | Linear Technology Corp. | | | 23,969,872 | |
| | 3,399,185 | | | NVIDIA Corp.* | | | 51,497,653 | |
| | 2,240,091 | | | Xilinx, Inc. | | | 82,726,560 | |
| | | | | | | | | |
| | | | | | | | 181,848,756 | |
| |
| |
Software* – 4.0% |
| | 640,495 | | | Citrix Systems, Inc. | | | 47,870,596 | |
| | 620,554 | | | MICROS Systems, Inc. | | | 32,225,369 | |
| | 959,167 | | | Rovi Corp. | | | 34,031,245 | |
| | 460,723 | | | Salesforce.com, Inc. | | | 65,957,105 | |
| | | | | | | | | |
| | | | | | | | 180,084,315 | |
| |
| |
Specialty Retail – 6.9% |
| | 537,133 | | | Bed Bath & Beyond, Inc.* | | | 32,088,325 | |
| | 939,916 | | | Dick’s Sporting Goods, Inc. | | | 42,070,640 | |
| | 1,759,690 | | | PetSmart, Inc. | | | 98,085,121 | |
| | 592,958 | | | Tiffany & Co. | | | 38,548,200 | |
| | 3,396,026 | | | Urban Outfitters, Inc.* | | | 96,413,178 | |
| | | | | | | | | |
| | | | | | | | 307,205,464 | |
| |
| |
Textiles, Apparel & Luxury Goods – 4.8% |
| | 500,313 | | | Deckers Outdoor Corp.* | | | 37,403,400 | |
| | 359,109 | | | Lululemon Athletica, Inc.* | | | 24,067,485 | |
| | 1,449,924 | | | PVH Corp. | | | 123,258,039 | |
| | 176,624 | | | Ralph Lauren Corp. | | | 30,684,888 | |
| | | | | | | | | |
| | | | | | | | 215,413,812 | |
| |
| |
Wireless Telecommunication Services* – 4.3% |
| | 1,247,144 | | | Crown Castle International Corp. | | | 64,614,531 | |
| | 2,671,996 | | | SBA Communications Corp. Class A | | | 125,396,772 | |
| | | | | | | | | |
| | | | | | | | 190,011,303 | |
| |
| |
TOTAL COMMON STOCKS |
(Cost $3,655,592,042) | | $ | 4,433,050,431 | |
| |
| |
| | | | | | | | | |
| | | | | | | | | |
Exchange Traded Fund – 0.5% |
| | 371,000 | | | iShares Russell Midcap Growth Index Fund | | | | |
(Cost $22,533,070) | | $ | 22,875,860 | |
| |
| |
| | | | | | | | | |
| | | | | | | | | | | | | |
Principal
| | Interest
| | Maturity
| | |
| Amount | | Rate | | Date | | Value |
| |
Short-term Investment(b) – 0.5% |
Repurchase Agreement – 0.5% |
| Joint Repurchase Agreement Account II |
| $ | 24,100,000 | | | 0.193% | | | 03/01/12 | | | $ | 24,100,000 | |
(Cost $24,100,000) | | | | | | | | |
| |
| |
TOTAL INVESTMENTS – 100.2% |
(Cost $3,702,225,112) | | | | | | $ | 4,480,026,291 | |
| |
| |
LIABILITIES IN EXCESS OF OTHER ASSETS – (0.2)% | | | | | | | (8,980,175 | ) |
| |
| |
NET ASSETS – 100.0% | | | | | | $ | 4,471,046,116 | |
| |
| |
The percentage shown for each investment category reflects the value of investments in that category as a percentage of net assets.
| | |
| * | | Non-income producing security. |
| |
| (a) | | Represents an affiliated issuer. |
| |
| (b) | | Joint repurchase agreement was entered into on February 29, 2012. Additional information appears on page 73. |
The accompanying notes are an integral part of these financial statements. 65
GOLDMAN SACHS SMALL/MID CAP GROWTH FUND
Schedule of Investments
February 29, 2012 (Unaudited)
| | | | | | | | | |
| Shares | | Description | | Value |
| |
Common Stocks – 99.4% |
Aerospace & Defense* – 1.7% |
| | 247,903 | | | Aerovironment, Inc. | | $ | 7,060,277 | |
| | 433,568 | | | DigitalGlobe, Inc. | | | 6,668,276 | |
| | | | | | | | | |
| | | | | | | | 13,728,553 | |
| |
| |
Auto Components* – 0.9% |
| | 488,285 | | | Amerigon, Inc. | | | 7,187,555 | |
| |
| |
Biotechnology* – 5.6% |
| | 99,387 | | | Alexion Pharmaceuticals, Inc. | | | 8,321,673 | |
| | 322,695 | | | Amylin Pharmaceuticals, Inc. | | | 5,514,858 | |
| | 204,729 | | | BioMarin Pharmaceutical, Inc. | | | 7,319,062 | |
| | 85,874 | | | Cepheid, Inc. | | | 3,468,451 | |
| | 423,784 | | | Halozyme Therapeutics, Inc. | | | 4,877,754 | |
| | 429,951 | | | Incyte Corp. | | | 7,291,969 | |
| | 565,010 | | | NPS Pharmaceuticals, Inc. | | | 3,853,368 | |
| | 151,164 | | | Vertex Pharmaceuticals, Inc. | | | 5,883,303 | |
| | | | | | | | | |
| | | | | | | | 46,530,438 | |
| |
| |
Capital Markets – 3.1% |
| | 568,180 | | | Evercore Partners, Inc. Class A | | | 15,448,814 | |
| | 325,536 | | | Lazard Ltd. Class A | | | 9,915,827 | |
| | | | | | | | | |
| | | | | | | | 25,364,641 | |
| |
| |
Chemicals – 1.8% |
| | 135,196 | | | Airgas, Inc. | | | 11,130,687 | |
| | 72,300 | | | International Flavors & Fragrances, Inc. | | | 4,123,269 | |
| | | | | | | | | |
| | | | | | | | 15,253,956 | |
| |
| |
Commercial Banks – 3.4% |
| | 497,066 | | | Eagle Bancorp, Inc.* | | | 7,709,494 | |
| | 243,526 | | | East West Bancorp, Inc. | | | 5,386,795 | |
| | 289,599 | | | First Republic Bank* | | | 8,685,074 | |
| | 3,238,521 | | | Popular, Inc.* | | | 6,153,190 | |
| | | | | | | | | |
| | | | | | | | 27,934,553 | |
| |
| |
Commercial Services & Supplies – 3.5% |
| | 628,633 | | | Healthcare Services Group, Inc. | | | 12,245,771 | |
| | 532,599 | | | Ritchie Bros. Auctioneers, Inc. | | | 13,006,067 | |
| | 40,766 | | | Stericycle, Inc.* | | | 3,537,266 | |
| | | | | | | | | |
| | | | | | | | 28,789,104 | |
| |
| |
Communications Equipment* – 0.7% |
| | 598,502 | | | Calix, Inc. | | | 5,410,458 | |
| |
| |
Construction & Engineering* – 1.4% |
| | 568,156 | | | Quanta Services, Inc. | | | 11,874,460 | |
| |
| |
Diversified Consumer Services* – 1.8% |
| | 249,404 | | | Coinstar, Inc. | | | 14,522,795 | |
| |
| |
Diversified Financial Services* – 1.6% |
| | 375,840 | | | MSCI, Inc. Class A | | | 13,297,219 | |
| |
| |
Diversified Telecommunication Services* – 1.5% |
| | 559,876 | | | TW telecom, Inc. | | | 12,093,322 | |
| |
| |
Electrical Equipment – 1.7% |
| | 157,922 | | | Roper Industries, Inc. | | | 14,453,021 | |
| |
| |
Electronic Equipment, Instruments & Components – 5.3% |
| | 242,249 | | | Amphenol Corp. Class A | | | 13,556,254 | |
| | 126,103 | | | DTS, Inc.* | | | 3,540,972 | |
| | 409,325 | | | FLIR Systems, Inc. | | | 10,712,036 | |
| | 150,021 | | | IPG Photonics Corp.* | | | 7,895,605 | |
| | 691,214 | | | RealD, Inc.* | | | 8,156,325 | |
| | | | | | | | | |
| | | | | | | | 43,861,192 | |
| |
| |
Energy Equipment & Services – 3.3% |
| | 103,750 | | | Core Laboratories NV | | | 12,622,225 | |
| | 206,788 | | | Dril-Quip, Inc.* | | | 14,473,092 | |
| | | | | | | | | |
| | | | | | | | 27,095,317 | |
| |
| |
Food Products* – 2.0% |
| | 578,321 | | | Smart Balance, Inc. | | | 3,464,143 | |
| | 128,231 | | | The Hain Celestial Group, Inc. | | | 5,236,954 | |
| | 138,788 | | | TreeHouse Foods, Inc. | | | 7,994,189 | |
| | | | | | | | | |
| | | | | | | | 16,695,286 | |
| |
| |
Health Care Equipment & Supplies* – 2.0% |
| | 371,411 | | | CareFusion Corp. | | | 9,586,118 | |
| | 76,960 | | | Given Imaging Ltd. | | | 1,499,181 | |
| | 225,891 | | | Tornier NV | | | 5,308,438 | |
| | | | | | | | | |
| | | | | | | | 16,393,737 | |
| |
| |
Health Care Providers & Services* – 3.4% |
| | 676,350 | | | ExamWorks Group, Inc. | | | 6,979,932 | |
| | 210,680 | | | Henry Schein, Inc. | | | 15,594,534 | |
| | 77,788 | | | Mednax, Inc. | | | 5,786,649 | |
| | | | | | | | | |
| | | | | | | | 28,361,115 | |
| |
| |
Health Care Technology* – 1.0% |
| | 565,175 | | | MedAssets, Inc. | | | 8,070,699 | |
| |
| |
Hotels, Restaurants & Leisure – 2.2% |
| | 148,441 | | | Choice Hotels International, Inc. | | | 5,576,929 | |
| | 215,873 | | | Dunkin’ Brands Group, Inc.* | | | 6,268,952 | |
| | 389,058 | | | Texas Roadhouse, Inc. | | | 6,508,940 | |
| | | | | | | | | |
| | | | | | | | 18,354,821 | |
| |
| |
Household Durables – 1.6% |
| | 709,986 | | | Newell Rubbermaid, Inc. | | | 12,992,744 | |
| |
| |
Internet Software & Services* – 4.9% |
| | 278,155 | | | 21Vianet Group, Inc. ADR | | | 3,379,583 | |
| | 137,757 | | | Equinix, Inc. | | | 19,310,776 | |
| | 338,879 | | | Rackspace Hosting, Inc. | | | 17,703,039 | |
| | | | | | | | | |
| | | | | | | | 40,393,398 | |
| |
| |
IT Services – 5.3% |
| | 150,233 | | | FleetCor Technologies, Inc.* | | | 5,563,128 | |
| | 591,673 | | | Genpact Ltd.* | | | 9,478,602 | |
| | 201,456 | | | Global Payments, Inc. | | | 10,399,159 | |
| | 437,830 | | | InterXion Holding NV* | | | 6,908,957 | |
| | 236,088 | | | VeriFone Systems, Inc.* | | | 11,306,254 | |
| | | | | | | | | |
| | | | | | | | 43,656,100 | |
| |
| |
66 The accompanying notes are an integral part of these financial statements.
GOLDMAN SACHS SMALL/MID CAP GROWTH FUND
| | | | | | | | | |
| Shares | | Description | | Value |
| |
Common Stocks – (continued) |
| | | | | | | | | |
Life Sciences Tools & Services* – 1.3% |
| | 23,800 | | | Mettler-Toledo International, Inc. | | $ | 4,290,664 | |
| | 274,290 | | | PAREXEL International Corp. | | | 6,714,619 | |
| | | | | | | | | |
| | | | | | | | 11,005,283 | |
| |
| |
Machinery – 4.6% |
| | 177,376 | | | IDEX Corp. | | | 7,414,317 | |
| | 393,842 | | | Kennametal, Inc. | | | 18,144,301 | |
| | 256,417 | | | Robbins & Myers, Inc. | | | 12,515,714 | |
| | | | | | | | | |
| | | | | | | | 38,074,332 | |
| |
| |
Media* – 0.4% |
| | 284,670 | | | Pandora Media, Inc. | | | 3,717,790 | |
| |
| |
Oil, Gas & Consumable Fuels* – 6.2% |
| | 213,908 | | | Approach Resources, Inc. | | | 7,392,660 | |
| | 993,338 | | | Rex Energy Corp. | | | 11,423,387 | |
| | 261,863 | | | Rosetta Resources, Inc. | | | 13,365,488 | |
| | 319,583 | | | Whiting Petroleum Corp. | | | 18,740,347 | |
| | | | | | | | | |
| | | | | | | | 50,921,882 | |
| |
| |
Pharmaceuticals* – 0.7% |
| | 259,739 | | | Sagent Pharmaceuticals, Inc. | | | 5,633,739 | |
| |
| |
Real Estate Management & Development* – 1.5% |
| | 696,316 | | | CBRE Group, Inc. Class A | | | 12,763,472 | |
| |
| |
Road & Rail* – 0.8% |
| | 364,025 | | | Roadrunner Transportation Systems, Inc. | | | 6,497,846 | |
| |
| |
Semiconductors & Semiconductor Equipment – 6.1% |
| | 262,826 | | | Cavium, Inc.* | | | 9,390,773 | |
| | 204,170 | | | Hittite Microwave Corp.* | | | 11,674,441 | |
| | 459,612 | | | Intermolecular, Inc.* | | | 2,886,363 | |
| | 153,082 | | | Linear Technology Corp. | | | 5,125,186 | |
| | 333,506 | | | NVIDIA Corp.* | | | 5,052,616 | |
| | 473,392 | | | STR Holdings, Inc.* | | | 3,361,083 | |
| | 358,424 | | | Xilinx, Inc. | | | 13,236,598 | |
| | | | | | | | | |
| | | | | | | | 50,727,060 | |
| |
| |
Software – 2.7% |
| | 160,952 | | | MICROS Systems, Inc.* | | | 8,358,237 | |
| | 147,298 | | | OPNET Technologies, Inc. | | | 4,205,358 | |
| | 265,802 | | | Rovi Corp.* | | | 9,430,655 | |
| | | | | | | | | |
| | | | | | | | 21,994,250 | |
| |
| |
Specialty Retail – 6.4% |
| | 217,535 | | | Dick’s Sporting Goods, Inc. | | | 9,736,867 | |
| | 487,133 | | | OfficeMax, Inc.* | | | 2,727,945 | |
| | 273,117 | | | PetSmart, Inc. | | | 15,223,541 | |
| | 345,541 | | | Rue21, Inc.* | | | 9,219,034 | |
| | 555,199 | | | Urban Outfitters, Inc.* | | | 15,762,100 | |
| | | | | | | | | |
| | | | | | | | 52,669,487 | |
| |
| |
Textiles, Apparel & Luxury Goods – 6.0% |
| | 267,736 | | | Carter’s, Inc.* | | | 13,003,938 | |
| | 92,894 | | | Deckers Outdoor Corp.* | | | 6,944,755 | |
| | 263,728 | | | PVH Corp. | | | 22,419,517 | |
| | 80,084 | | | Under Armour, Inc. Class A* | | | 7,146,696 | |
| | | | | | | | | |
| | | | | | | | 49,514,906 | |
| |
| |
Wireless Telecommunication Services* – 3.0% |
| | 528,081 | | | SBA Communications Corp. Class A | | | 24,782,841 | |
| |
| |
TOTAL COMMON STOCKS |
(Cost $684,849,658) | | $ | 820,617,372 | |
| |
| |
| | | | | | | | | |
| | | | | | | | | | | | | | | |
Principal
| | Interest
| | Maturity
| | |
| Amount | | Rate | | Date | | Value |
| |
Short-term Investment(a) – 0.7% |
Repurchase Agreement – 0.7% |
| Joint Repurchase Agreement Account II |
| $ | 5,500,000 | | | | 0.193 | % | | | 03/01/12 | | | $ | 5,500,000 | |
(Cost $5,500,000) | | | | | | | | |
| |
| |
TOTAL INVESTMENTS – 100.1% |
(Cost $690,349,658) | | | | | | $ | 826,117,372 | |
| |
| |
LIABILITIES IN EXCESS OF OTHER
ASSETS – (0.1)% | | | (1,007,824 | ) |
| |
| |
NET ASSETS – 100.0% | | $ | 825,109,548 | |
| |
| |
The percentage shown for each investment category reflects the value of investments in that category as a percentage of net assets.
| | |
| * | | Non-income producing security. |
| |
| (a) | | Joint repurchase agreement was entered into on February 29, 2012. Additional information appears on page 73. |
| | | | | |
| |
| |
Investment Abbreviation: |
| ADR | | — | | American Depositary Receipt |
| |
| |
The accompanying notes are an integral part of these financial statements. 67
GOLDMAN SACHS STRATEGIC GROWTH FUND
Schedule of Investments
February 29, 2012 (Unaudited)
| | | | | | | | | |
| Shares | | Description | | Value |
| |
Common Stocks – 98.0% |
Aerospace & Defense – 1.9% |
| | 159,859 | | | Honeywell International, Inc. | | $ | 9,522,801 | |
| |
| |
Beverages – 3.0% |
| | 51,243 | | | Diageo PLC ADR | | | 4,896,781 | |
| | 157,139 | | | PepsiCo., Inc. | | | 9,890,329 | |
| | | | | | | | | |
| | | | | | | | 14,787,110 | |
| |
| |
Biotechnology* – 1.9% |
| | 151,428 | | | Gilead Sciences, Inc. | | | 6,889,974 | |
| | 66,585 | | | Vertex Pharmaceuticals, Inc. | | | 2,591,488 | |
| | | | | | | | | |
| | | | | | | | 9,481,462 | |
| |
| |
Capital Markets – 2.4% |
| | 181,633 | | | Northern Trust Corp. | | | 8,066,321 | |
| | 62,291 | | | T. Rowe Price Group, Inc. | | | 3,836,503 | |
| | | | | | | | | |
| | | | | | | | 11,902,824 | |
| |
| |
Chemicals – 3.2% |
| | 66,781 | | | Ecolab, Inc. | | | 4,006,860 | |
| | 107,570 | | | Praxair, Inc. | | | 11,725,130 | |
| | | | | | | | | |
| | | | | | | | 15,731,990 | |
| |
| |
Communications Equipment – 4.1% |
| | 327,082 | | | QUALCOMM, Inc. | | | 20,337,959 | |
| |
| |
Computers & Peripherals* – 9.6% |
| | 69,613 | | | Apple, Inc. | | | 37,760,876 | |
| | 221,020 | | | NetApp, Inc. | | | 9,503,860 | |
| | | | | | | | | |
| | | | | | | | 47,264,736 | |
| |
| |
Consumer Finance – 2.2% |
| | 207,251 | | | American Express Co. | | | 10,961,505 | |
| |
| |
Diversified Financial Services – 2.3% |
| | 31,188 | | | CME Group, Inc. | | | 9,028,614 | |
| | 18,176 | | | IntercontinentalExchange, Inc.* | | | 2,507,561 | |
| | | | | | | | | |
| | | | | | | | 11,536,175 | |
| |
| |
Electrical Equipment – 1.7% |
| | 116,982 | | | Emerson Electric Co. | | | 5,885,364 | |
| | 33,351 | | | Rockwell Automation, Inc. | | | 2,667,413 | |
| | | | | | | | | |
| | | | | | | | 8,552,777 | |
| |
| |
Electronic Equipment, Instruments & Components – 1.4% |
| | 126,133 | | | Amphenol Corp. Class A | | | 7,058,403 | |
| |
| |
Energy Equipment & Services – 7.0% |
| | 97,887 | | | Cameron International Corp.* | | | 5,453,285 | |
| | 224,267 | | | Halliburton Co. | | | 8,205,930 | |
| | 35,808 | | | National-Oilwell Varco, Inc. | | | 2,955,234 | |
| | 228,458 | | | Schlumberger Ltd. | | | 17,730,625 | |
| | | | | | | | | |
| | | | | | | | 34,345,074 | |
| |
| |
Food & Staples Retailing – 2.6% |
| | 150,422 | | | Costco Wholesale Corp. | | | 12,945,317 | |
| |
| |
Health Care Equipment & Supplies – 3.2% |
| | 86,276 | | | Baxter International, Inc. | | | 5,015,224 | |
| | 251,441 | | | St. Jude Medical, Inc. | | | 10,590,695 | |
| | | | | | | | | |
| | | | | | | | 15,605,919 | |
| |
| |
Hotels, Restaurants & Leisure – 2.8% |
| | 215,908 | | | Marriott International, Inc. Class A | | | 7,617,234 | |
| | 32,598 | | | McDonald’s Corp. | | | 3,236,330 | |
| | 45,372 | | | Yum! Brands, Inc. | | | 3,005,441 | |
| | | | | | | | | |
| | | | | | | | 13,859,005 | |
| |
| |
Household Products – 1.5% |
| | 112,053 | | | The Procter & Gamble Co. | | | 7,565,819 | |
| |
| |
Industrial Conglomerates – 1.6% |
| | 147,920 | | | Danaher Corp. | | | 7,814,614 | |
| |
| |
Internet & Catalog Retail* – 2.9% |
| | 64,318 | | | Amazon.com, Inc. | | | 11,557,301 | |
| | 4,699 | | | Priceline.com, Inc. | | | 2,946,367 | |
| | | | | | | | | |
| | | | | | | | 14,503,668 | |
| |
| |
Internet Software & Services* – 5.4% |
| | 64,497 | | | Equinix, Inc. | | | 9,041,189 | |
| | 28,294 | | | Google, Inc. Class A | | | 17,492,766 | |
| | | | | | | | | |
| | | | | | | | 26,533,955 | |
| |
| |
IT Services – 2.2% |
| | 26,216 | | | MasterCard, Inc. Class A | | | 11,010,720 | |
| |
| |
Life Sciences Tools & Services* – 1.3% |
| | 111,086 | | | Thermo Fisher Scientific, Inc. | | | 6,289,689 | |
| |
| |
Machinery – 0.7% |
| | 31,939 | | | Caterpillar, Inc. | | | 3,647,753 | |
| |
| |
Media – 2.0% |
| | 55,647 | | | Discovery Communications, Inc. Class A* | | | 2,595,932 | |
| | 151,590 | | | Viacom, Inc. Class B | | | 7,218,716 | |
| | | | | | | | | |
| | | | | | | | 9,814,648 | |
| |
| |
Oil, Gas & Consumable Fuels – 2.8% |
| | 103,008 | | | Devon Energy Corp. | | | 7,551,517 | |
| | 36,160 | | | Occidental Petroleum Corp. | | | 3,774,019 | |
| | 72,283 | | | Southwestern Energy Co.* | | | 2,389,676 | |
| | | | | | | | | |
| | | | | | | | 13,715,212 | |
| |
| |
Personal Products – 1.1% |
| | 294,447 | | | Avon Products, Inc. | | | 5,503,215 | |
| |
| |
Pharmaceuticals – 3.2% |
| | 167,329 | | | Abbott Laboratories | | | 9,472,495 | |
| | 142,002 | | | Teva Pharmaceutical Industries Ltd. ADR | | | 6,363,109 | |
| | | | | | | | | |
| | | | | | | | 15,835,604 | |
| |
| |
Real Estate Investment Trusts – 3.3% |
| | 259,423 | | | American Tower Corp. | | | 16,234,691 | |
| |
| |
Real Estate Management & Development* – 1.4% |
| | 378,286 | | | CBRE Group, Inc. Class A | | | 6,933,982 | |
| |
| |
68 The accompanying notes are an integral part of these financial statements.
GOLDMAN SACHS STRATEGIC GROWTH FUND
| | | | | | | | | |
| Shares | | Description | | Value |
| |
Common Stocks – (continued) |
| | | | | | | | | |
Semiconductors & Semiconductor Equipment – 3.4% |
| | 242,229 | | | NVIDIA Corp.* | | $ | 3,669,769 | |
| | 73,027 | | | Texas Instruments, Inc. | | | 2,435,451 | |
| | 293,580 | | | Xilinx, Inc. | | | 10,841,909 | |
| | | | | | | | | |
| | | | | | | | 16,947,129 | |
| |
| |
Software – 5.8% |
| | 318,803 | | | Microsoft Corp. | | | 10,118,807 | |
| | 389,335 | | | Oracle Corp. | | | 11,395,836 | |
| | 49,344 | | | Salesforce.com, Inc.* | | | 7,064,087 | |
| | | | | | | | | |
| | | | | | | | 28,578,730 | |
| |
| |
Specialty Retail – 4.2% |
| | 437,116 | | | Lowe’s Cos., Inc. | | | 12,405,352 | |
| | 288,831 | | | Urban Outfitters, Inc.* | | | 8,199,912 | |
| | | | | | | | | |
| | | | | | | | 20,605,264 | |
| |
| |
Textiles, Apparel & Luxury Goods – 3.3% |
| | 84,894 | | | NIKE, Inc. Class B | | | 9,161,760 | |
| | 81,259 | | | PVH Corp. | | | 6,907,828 | |
| | | | | | | | | |
| | | | | | | | 16,069,588 | |
| |
| |
Wireless Telecommunication Services* – 2.6% |
| | 246,118 | | | Crown Castle International Corp. | | | 12,751,374 | |
| |
| |
TOTAL COMMON STOCKS |
(Cost $417,896,884) | | $ | 484,248,712 | |
| |
| |
| | | | | | | | | |
| | | | | | | | | |
Exchange Traded Fund – 1.2% |
| | 96,000 | | | iShares Russell 1000 Growth Index
Fund | | | | |
(Cost $6,123,677) | | $ | 6,160,320 | |
| |
| |
TOTAL INVESTMENTS – 99.2% |
(Cost $424,020,561) | | $ | 490,409,032 | |
| |
| |
OTHER ASSETS IN EXCESS OF LIABILITIES – 0.8% | | | 3,864,761 | |
| |
| |
NET ASSETS – 100.0% | | $ | 494,273,793 | |
| |
| |
The percentage shown for each investment category reflects the value of investments in that category as a percentage of net assets.
| | |
| * | | Non-income producing security. |
| | | | | |
| |
| |
Investment Abbreviation: |
| ADR | | — | | American Depositary Receipt |
| |
| |
The accompanying notes are an integral part of these financial statements. 69
GOLDMAN SACHS TECHNOLOGY TOLLKEEPER FUND
Schedule of Investments
February 29, 2012 (Unaudited)
| | | | | | | | | |
| Shares | | Description | | Value |
| |
Common Stocks – 97.8% |
Aerospace & Defense* – 0.9% |
| | 236,049 | | | DigitalGlobe, Inc. | | $ | 3,630,434 | |
| |
| |
Communications Equipment – 8.1% |
| | 294,049 | | | Juniper Networks, Inc.* | | | 6,692,555 | |
| | 385,353 | | | QUALCOMM, Inc. | | | 23,961,250 | |
| | | | | | | | | |
| | | | | | | | 30,653,805 | |
| |
| |
Computers & Peripherals* – 16.0% |
| | 79,546 | | | Apple, Inc. | | | 43,148,932 | |
| | 408,120 | | | NetApp, Inc. | | | 17,549,160 | |
| | | | | | | | | |
| | | | | | | | 60,698,092 | |
| |
| |
Diversified Consumer Services* – 2.8% |
| | 182,821 | | | Coinstar, Inc. | | | 10,645,667 | |
| |
| |
Diversified Financial Services* – 2.7% |
| | 74,562 | | | IntercontinentalExchange, Inc. | | | 10,286,573 | |
| |
| |
Electronic Equipment, Instruments & Components – 6.0% |
| | 219,868 | | | Amphenol Corp. Class A | | | 12,303,813 | |
| | 120,383 | | | DTS, Inc.* | | | 3,380,355 | |
| | 585,309 | | | RealD, Inc.* | | | 6,906,646 | |
| | | | | | | | | |
| | | | | | | | 22,590,814 | |
| |
| |
Internet & Catalog Retail* – 6.7% |
| | 69,074 | | | Amazon.com, Inc. | | | 12,411,907 | |
| | 205,517 | | | Groupon, Inc. | | | 4,051,768 | |
| | 14,150 | | | Priceline.com, Inc. | | | 8,872,333 | |
| | | | | | | | | |
| | | | | | | | 25,336,008 | |
| |
| |
Internet Software & Services* – 15.4% |
| | 270,794 | | | 21Vianet Group, Inc. ADR | | | 3,290,147 | |
| | 73,917 | | | Equinix, Inc. | | | 10,361,685 | |
| | 38,713 | | | Google, Inc. Class A | | | 23,934,312 | |
| | 340,634 | | | Rackspace Hosting, Inc. | | | 17,794,720 | |
| | 129,269 | | | Yandex NV Class A | | | 2,753,430 | |
| | | | | | | | | |
| | | | | | | | 58,134,294 | |
| |
| |
IT Services – 5.1% |
| | 99,340 | | | Global Payments, Inc. | | | 5,127,931 | |
| | 441,362 | | | InterXion Holding NV* | | | 6,964,692 | |
| | 154,353 | | | VeriFone Systems, Inc.* | | | 7,391,965 | |
| | | | | | | | | |
| | | | | | | | 19,484,588 | |
| |
| |
Media* – 0.9% |
| | 250,343 | | | Pandora Media, Inc. | | | 3,269,480 | |
| |
| |
Real Estate Investment Trusts – 2.6% |
| | 157,674 | | | American Tower Corp. | | | 9,867,239 | |
| |
| |
Semiconductors & Semiconductor Equipment – 10.0% |
| | 169,906 | | | Altera Corp. | | | 6,532,886 | |
| | 101,038 | | | Cavium, Inc.* | | | 3,610,088 | |
| | 281,553 | | | Intermolecular, Inc.* | | | 1,768,153 | |
| | 454,257 | | | NVIDIA Corp.* | | | 6,881,993 | |
| | 199,752 | | | Texas Instruments, Inc. | | | 6,661,729 | |
| | 331,505 | | | Xilinx, Inc. | | | 12,242,480 | |
| | | | | | | | | |
| | | | | | | | 37,697,329 | |
| |
| |
Software – 17.6% |
| | 106,091 | | | Citrix Systems, Inc.* | | | 7,929,241 | |
| | 104,548 | | | MICROS Systems, Inc.* | | | 5,429,178 | |
| | 417,806 | | | Microsoft Corp. | | | 13,261,162 | |
| | 92,248 | | | OPNET Technologies, Inc. | | | 2,633,680 | |
| | 546,096 | | | Oracle Corp. | | | 15,984,230 | |
| | 244,931 | | | Rovi Corp.* | | | 8,690,152 | |
| | 89,968 | | | Salesforce.com, Inc.* | | | 12,879,819 | |
| | | | | | | | | |
| | | | | | | | 66,807,462 | |
| |
| |
Wireless Telecommunication Services* – 3.0% |
| | 239,739 | | | SBA Communications Corp. Class A | | | 11,250,951 | |
| |
| |
TOTAL COMMON STOCKS |
(Cost $331,481,162) | | $ | 370,352,736 | |
| |
| |
| | | | | | | | | |
| | | | | | | | | | | | | |
Principal
| | Interest
| | Maturity
| | |
| Amount | | Rate | | Date | | Value |
| |
Short-term Investment(a) – 2.3% |
Repurchase Agreement – 2.3% |
| Joint Repurchase Agreement Account II |
| $ | 8,600,000 | | | 0.193% | | | 03/01/12 | | | $ | 8,600,000 | |
(Cost $8,600,000) | | | | | | | | |
| |
| |
TOTAL INVESTMENTS – 100.1% |
(Cost $340,081,162) | | | | | | $ | 378,952,736 | |
| |
| |
LIABILITIES IN EXCESS OF OTHER ASSETS – (0.1)% | | | | | | | (492,509 | ) |
| |
| |
NET ASSETS – 100.0% | | | | | | $ | 378,460,227 | |
| |
| |
The percentage shown for each investment category reflects the value of investments in that category as a percentage of net assets.
| | |
| * | | Non-income producing security. |
| |
| (a) | | Joint repurchase agreement was entered into on February 29, 2012. Additional information appears on page 73. |
| | | | | |
| |
| |
Investment Abbreviation: |
| ADR | | — | | American Depositary Receipt |
| |
| |
70 The accompanying notes are an integral part of these financial statements.
GOLDMAN SACHS U.S. EQUITY FUND
Schedule of Investments
February 29, 2012 (Unaudited)
| | | | | | | | | |
| Shares | | Description | | Value |
| |
Common Stocks – 99.5% |
Aerospace & Defense – 4.5% |
| | 3,460 | | | Honeywell International, Inc. | | $ | 206,112 | |
| | 1,073 | | | Textron, Inc. | | | 29,519 | |
| | 2,798 | | | The Boeing Co. | | | 209,710 | |
| | | | | | | | | |
| | | | | | | | 445,341 | |
| |
| |
Automobiles* – 1.1% |
| | 4,234 | | | General Motors Co. | | | 110,169 | |
| |
| |
Beverages – 2.0% |
| | 3,187 | | | PepsiCo., Inc. | | | 200,590 | |
| |
| |
Biotechnology* – 0.9% |
| | 2,296 | | | Vertex Pharmaceuticals, Inc. | | | 89,360 | |
| |
| |
Building Products – 1.2% |
| | 9,984 | | | Masco Corp. | | | 118,610 | |
| |
| |
Capital Markets – 2.0% |
| | 3,540 | | | Morgan Stanley | | | 65,632 | |
| | 1,235 | | | Northern Trust Corp. | | | 54,846 | |
| | 1,305 | | | T. Rowe Price Group, Inc. | | | 80,375 | |
| | | | | | | | | |
| | | | | | | | 200,853 | |
| |
| |
Chemicals – 1.6% |
| | 1,438 | | | Praxair, Inc. | | | 156,742 | |
| |
| |
Commercial Banks – 1.6% |
| | 6,777 | | | SunTrust Banks, Inc. | | | 155,600 | |
| |
| |
Communications Equipment – 4.2% |
| | 3,802 | | | Cisco Systems, Inc. | | | 75,584 | |
| | 2,823 | | | Juniper Networks, Inc.* | | | 64,251 | |
| | 4,388 | | | QUALCOMM, Inc. | | | 272,846 | |
| | | | | | | | | |
| | | | | | | | 412,681 | |
| |
| |
Computers & Peripherals* – 6.6% |
| | 799 | | | Apple, Inc. | | | 433,409 | |
| | 4,091 | | | EMC Corp. | | | 113,280 | |
| | 2,506 | | | NetApp, Inc. | | | 107,758 | |
| | | | | | | | | |
| | | | | | | | 654,447 | |
| |
| |
Consumer Finance – 1.6% |
| | 3,091 | | | American Express Co. | | | 163,483 | |
| |
| |
Diversified Financial Services – 5.8% |
| | 11,675 | | | Bank of America Corp. | | | 93,050 | |
| | 2,078 | | | Citigroup, Inc. | | | 69,239 | |
| | 409 | | | CME Group, Inc. | | | 118,401 | |
| | 7,423 | | | JPMorgan Chase & Co. | | | 291,279 | |
| | | | | | | | | |
| | | | | | | | 571,969 | |
| |
| |
Diversified Telecommunication Services – 0.7% |
| | 2,177 | | | AT&T, Inc. | | | 66,594 | |
| |
| |
Electric Utilities – 0.8% |
| | 2,891 | | | PPL Corp. | | | 82,538 | |
| |
| |
Energy Equipment & Services – 4.1% |
| | 3,940 | | | Halliburton Co. | | | 144,165 | |
| | 2,321 | | | Schlumberger Ltd. | | | 180,133 | |
| | 1,457 | | | Transocean Ltd. | | | 77,716 | |
| | | | | | | | | |
| | | | | | | | 402,014 | |
| |
| |
Food & Staples Retailing – 2.7% |
| | 2,263 | | | Costco Wholesale Corp. | | | 194,754 | |
| | 2,067 | | | Walgreen Co. | | | 68,541 | |
| | | | | | | | | |
| | | | | | | | 263,295 | |
| |
| |
Food Products – 1.7% |
| | 4,371 | | | General Mills, Inc. | | | 167,453 | |
| |
| |
Health Care Equipment & Supplies – 1.8% |
| | 10,209 | | | Boston Scientific Corp.* | | | 63,500 | |
| | 2,793 | | | St. Jude Medical, Inc. | | | 117,641 | |
| | | | | | | | | |
| | | | | | | | 181,141 | |
| |
| |
Health Care Providers & Services – 1.1% |
| | 1,887 | | | UnitedHealth Group, Inc. | | | 105,200 | |
| |
| |
Hotels, Restaurants & Leisure – 1.9% |
| | 1,845 | | | Marriott International, Inc. Class A | | | 65,091 | |
| | 1,811 | | | Yum! Brands, Inc. | | | 119,961 | |
| | | | | | | | | |
| | | | | | | | 185,052 | |
| |
| |
Household Products – 2.6% |
| | 3,775 | | | The Procter & Gamble Co. | | | 254,888 | |
| |
| |
Industrial Conglomerates – 3.7% |
| | 19,434 | | | General Electric Co. | | | 370,218 | |
| |
| |
Insurance – 5.4% |
| | 1,109 | | | Everest Re Group Ltd. | | | 97,426 | |
| | 2,804 | | | MetLife, Inc. | | | 108,094 | |
| | 2,608 | | | Prudential Financial, Inc. | | | 159,505 | |
| | 3,463 | | | The Hartford Financial Services Group, Inc. | | | 71,719 | |
| | 1,606 | | | The Travelers Cos., Inc. | | | 93,100 | |
| | | | | | | | | |
| | | | | | | | 529,844 | |
| |
| |
Internet & Catalog Retail* – 1.8% |
| | 981 | | | Amazon.com, Inc. | | | 176,276 | |
| |
| |
Internet Software & Services* – 2.2% |
| | 346 | | | Google, Inc. Class A | | | 213,914 | |
| |
| |
IT Services – 1.5% |
| | 346 | | | MasterCard, Inc. Class A | | | 145,320 | |
| |
| |
Life Sciences Tools & Services* – 1.1% |
| | 1,931 | | | Thermo Fisher Scientific, Inc. | | | 109,333 | |
| |
| |
Media – 2.1% |
| | 3,769 | | | The Walt Disney Co. | | | 158,260 | |
| | 1,009 | | | Viacom, Inc. Class B | | | 48,049 | |
| | | | | | | | | |
| | | | | | | | 206,309 | |
| |
| |
Multi-Utilities – 0.4% |
| | 917 | | | PG&E Corp. | | | 38,221 | |
| |
| |
Oil, Gas & Consumable Fuels – 7.9% |
| | 2,874 | | | Devon Energy Corp. | | | 210,693 | |
The accompanying notes are an integral part of these financial statements. 71
GOLDMAN SACHS U.S. EQUITY FUND
Schedule of Investments (continued)
February 29, 2012 (Unaudited)
| | | | | | | | | |
| Shares | | Description | | Value |
| |
Common Stocks – (continued) |
Oil, Gas & Consumable Fuels – (continued) |
| | | | | | | | | |
| | 4,387 | | | Exxon Mobil Corp. | | $ | 379,475 | |
| | 2,530 | | | Newfield Exploration Co.* | | | 91,080 | |
| | 988 | | | Occidental Petroleum Corp. | | | 103,118 | |
| | | | | | | | | |
| | | | | | | | 784,366 | |
| |
| |
Pharmaceuticals – 6.1% |
| | 2,752 | | | Abbott Laboratories | | | 155,791 | |
| | 1,849 | | | Johnson & Johnson | | | 120,333 | |
| | 5,739 | | | Merck & Co., Inc. | | | 219,058 | |
| | 2,890 | | | Mylan, Inc.* | | | 67,741 | |
| | 2,160 | | | Pfizer, Inc. | | | 45,576 | |
| | | | | | | | | |
| | | | | | | | 608,499 | |
| |
| |
Real Estate Investment Trusts – 1.7% |
| | 2,762 | | | American Tower Corp. | | | 172,846 | |
| |
| |
Real Estate Management & Development* – 0.5% |
| | 2,878 | | | CBRE Group, Inc. Class A | | | 52,754 | |
| |
| |
Semiconductors & Semiconductor Equipment – 2.4% |
| | 645 | | | Lam Research Corp.* | | | 26,897 | |
| | 3,295 | | | NVIDIA Corp.* | | | 49,919 | |
| | 4,368 | | | Xilinx, Inc. | | | 161,310 | |
| | | | | | | | | |
| | | | | | | | 238,126 | |
| |
| |
Software – 4.2% |
| | 2,422 | | | Adobe Systems, Inc.* | | | 79,660 | |
| | 3,230 | | | Microsoft Corp. | | | 102,520 | |
| | 4,398 | | | Oracle Corp. | | | 128,729 | |
| | 726 | | | Salesforce.com, Inc.* | | | 103,934 | |
| | | | | | | | | |
| | | | | | | | 414,843 | |
| |
| |
Specialty Retail – 3.2% |
| | 7,046 | | | Lowe’s Cos., Inc. | | | 199,965 | |
| | 3,981 | | | Urban Outfitters, Inc.* | | | 113,021 | |
| | | | | | | | | |
| | | | | | | | 312,986 | |
| |
| |
Textiles, Apparel & Luxury Goods – 2.3% |
| | 1,691 | | | NIKE, Inc. Class B | | | 182,493 | |
| | 510 | | | PVH Corp. | | | 43,355 | |
| | | | | | | | | |
| | | | | | | | 225,848 | |
| |
| |
Wireless Telecommunication Services* – 2.5% |
| | 3,853 | | | SBA Communications Corp. Class A | | | 180,821 | |
| | 27,450 | | | Sprint Nextel Corp. | | | 67,802 | |
| | | | | | | | | |
| | | | | | | | 248,623 | |
| |
| |
TOTAL COMMON STOCKS |
(Cost $8,798,233) | | $ | 9,836,346 | |
| |
| |
| | | | | | | | | |
| | | | | | | | | | | | | |
Principal
| | Interest
| | Maturity
| | |
| Amount | | Rate | | Date | | Value |
| |
Short-term Investment(a) – 1.0% |
Repurchase Agreement – 1.0% |
| Joint Repurchase Agreement Account II |
| $ | 100,000 | | | 0.193% | | | 03/01/12 | | | $ | 100,000 | |
(Cost $100,000) | | | | | | | | |
| |
| |
TOTAL INVESTMENTS – 100.5% |
(Cost $8,898,233) | | | | | | $ | 9,936,346 | |
| |
| |
LIABILITIES IN EXCESS OF OTHER ASSETS – (0.5)% | | | | | | | (50,951 | ) |
| |
| |
NET ASSETS – 100.0% | | | | | | $ | 9,885,395 | |
| |
| |
The percentage shown for each investment category reflects the value of investments in that category as a percentage of net assets.
| | |
| * | | Non-income producing security. |
| |
| (a) | | Joint repurchase agreement was entered into on February 29, 2012. Additional information appears on page 73. |
72 The accompanying notes are an integral part of these financial statements.
GOLDMAN SACHS FUNDAMENTAL EQUITY GROWTH FUNDS
Schedule of Investments
February 29, 2012 (Unaudited)
| |
| ADDITIONAL INVESTMENT INFORMATION | |
JOINT REPURCHASE AGREEMENT ACCOUNT II — At February 29, 2012, certain Funds had undivided interests in the Joint Repurchase Agreement Account II, with a maturity date of March 1, 2012, as follows:
| | | | | | | | | | | | | |
| | | | | | | Collateral
|
| | | Principal
| | Maturity
| | Allocation
|
| Fund | | Amount | | Value | | Value |
| |
| Capital Growth | | $ | 600,000 | | | $ | 600,003 | | | $ | 613,807 | |
| |
| |
| Flexible Cap Growth | | | 100,000 | | | | 100,001 | | | | 102,301 | |
| |
| |
| Growth Opportunities | | | 24,100,000 | | | | 24,100,129 | | | | 24,654,574 | |
| |
| �� |
| Small/Mid Cap Growth | | | 5,500,000 | | | | 5,500,029 | | | | 5,626,562 | |
| |
| |
| Technology Tollkeeper | | | 8,600,000 | | | | 8,600,046 | | | | 8,797,898 | |
| |
| |
| U.S. Equity | | | 100,000 | | | | 100,001 | | | | 102,301 | |
| |
| |
REPURCHASE AGREEMENTS — At February 29, 2012, the Principal Amounts of certain Funds’ interest in the Joint Repurchase Agreement Account II were as follows:
| | | | | | | | | | | | | | | | | | | | | | | | | | | | | |
| | | | | | | Flexible
| | | | Small/Mid
| | | | |
| | | Interest
| | Capital
| | Cap
| | Growth
| | Cap
| | Technology
| | U.S.
|
| Counterparty | | Rate | | Growth | | Growth | | Opportunities | | Growth | | Tollkeeper | | Equity |
| |
| Barclays Capital, Inc. | | | 0.190 | % | | $ | 30,215 | | | $ | 5,036 | | | $ | 1,213,623 | | | $ | 276,968 | | | $ | 433,077 | | | $ | 5,036 | |
| |
| |
| BNP Paribas Securities Co. | | | 0.190 | | | | 120,377 | | | | 20,063 | | | | 4,835,150 | | | | 1,103,458 | | | | 1,725,406 | | | | 20,063 | |
| |
| |
| Credit Suisse Securities LLC | | | 0.150 | | | | 48,151 | | | | 8,025 | | | | 1,934,060 | | | | 441,383 | | | | 690,163 | | | | 8,025 | |
| |
| |
| JPMorgan Securities LLC | | | 0.210 | | | | 180,566 | | | | 30,094 | | | | 7,252,725 | | | | 1,655,186 | | | | 2,588,109 | | | | 30,094 | |
| |
| |
| Wells Fargo Securities LLC | | | 0.190 | | | | 220,691 | | | | 36,782 | | | | 8,864,442 | | | | 2,023,005 | | | | 3,163,245 | | | | 36,782 | |
| |
| |
TOTAL | | | | | | $ | 600,000 | | | $ | 100,000 | | | $ | 24,100,000 | | | $ | 5,500,000 | | | $ | 8,600,000 | | | $ | 100,000 | |
| |
| |
At February 29, 2012, the Joint Repurchase Agreement Account II was fully collateralized by:
| | | | | | | | | |
| Issuer | | Interest Rates | | Maturity Dates |
| |
| Federal Home Loan Mortgage Corp. | | | 4.000 | % | | | 07/01/25 to 05/01/30 | |
| |
| |
| Federal National Mortgage Association | | | 2.500 to 7.500 | | | | 05/01/12 to 10/01/51 | |
| |
| |
| U.S. Treasury Notes | | | 0.625 to 4.875 | | | | 03/31/12 to 11/15/20 | |
| |
| |
The accompanying notes are an integral part of these financial statements. 73
GOLDMAN SACHS FUNDAMENTAL EQUITY GROWTH FUNDS
Statements of Assets and Liabilities
February 29, 2012 (Unaudited)
| | | | | | | | | | | |
| | | Capital Growth
| | Concentrated
| | |
| | | Fund | | Growth Fund | | |
Assets: |
| | | | | | | | | | | |
| Investments of unaffiliated issuers, at value (cost $694,445,897, $132,579,348, $11,168,704, $2,226,986, $3,629,099,554, $690,349,658, $424,020,561, $340,081,162 and $8,898,233) | | $ | 972,649,273 | | | $ | 192,409,597 | | | |
| Investments of affiliated issuers, at value (cost $73,125,558 for Growth Opportunities Fund) | | | — | | | | — | | | |
| Cash | | | 37,324 | | | | 63,012 | | | |
| Receivables: | | | | | | | | | | |
| Fund shares sold | | | 2,439,246 | | | | 7,831 | | | |
| Dividends and interest | | | 1,109,219 | | | | 206,115 | | | |
| Investments sold | | | — | | | | 1,225,858 | | | |
| Reimbursement from investment adviser | | | — | | | | 14,050 | | | |
| Deferred offering costs | | | — | | | | — | | | |
| Other assets | | | 6,946 | | | | 1,494 | | | |
| |
| |
Total assets | | | 976,242,008 | | | | 193,927,957 | | | |
| |
| |
| | | | | | | | | | | |
| | | | | | | | | | | |
Liabilities: |
| | | | | | | | | | | |
| Payables: | | | | | | | | | | |
| Fund shares redeemed | | | 1,427,145 | | | | 388,354 | | | |
| Amounts owed to affiliates | | | 968,296 | | | | 165,267 | | | |
| Investments purchased | | | — | | | | — | | | |
| Accrued expenses and other liabilities | | | 223,593 | | | | 80,343 | | | |
| |
| |
Total liabilities | | | 2,619,034 | | | | 633,964 | | | |
| |
| |
| | | | | | | | | | | |
| | | | | | | | | | | |
Net Assets: |
| | | | | | | | | | | |
| Paid-in capital | | | 758,119,601 | | | | 166,812,468 | | | |
| Undistributed (distributions in excess of) net investment income (loss) | | | 405,433 | | | | (59,581 | ) | | |
| Accumulated net realized gain (loss) | | | (63,105,436 | ) | | | (33,289,143 | ) | | |
| Net unrealized gain | | | 278,203,376 | | | | 59,830,249 | | | |
| |
| |
NET ASSETS | | $ | 973,622,974 | | | $ | 193,293,993 | | | |
| | | | | | | | | | | |
| Net Assets: | | | | | | | | | | |
| Class A | | $ | 693,292,437 | | | $ | 103,692,350 | | | |
| Class B | | | 34,428,140 | | | | 495,727 | | | |
| Class C | | | 76,120,961 | | | | 2,972,686 | | | |
| Institutional | | | 164,769,199 | | | | 85,598,013 | | | |
| Service | | | 1,089,520 | | | | — | | | |
| Class IR | | | 3,235,290 | | | | 525,240 | | | |
| Class R | | | 687,427 | | | | 9,977 | | | |
| | | | | | | | | | | |
| | | | | | | | | | | |
| Total Net Assets | | $ | 973,622,974 | | | $ | 193,293,993 | | | |
| | | | | | | | | | | |
| Shares Outstanding $0.001 par value (unlimited shares authorized): | | | | | | | | | | |
| Class A | | | 29,453,374 | | | | 7,186,544 | | | |
| Class B | | | 1,663,356 | | | | 37,084 | | | |
| Class C | | | 3,682,081 | | | | 222,716 | | | |
| Institutional | | | 6,673,450 | | | | 5,746,670 | | | |
| Service | | | 47,108 | | | | — | | | |
| Class IR | | | 136,875 | | | | 36,204 | | | |
| Class R | | | 29,483 | | | | 699 | | | |
| | | | | | | | | | | |
Net asset value, offering and redemption price per share:(b) | | | | | | | | | | |
| Class A | | | $23.54 | | | | $14.43 | | | |
| Class B | | | 20.70 | | | | 13.37 | | | |
| Class C | | | 20.67 | | | | 13.35 | | | |
| Institutional | | | 24.69 | | | | 14.90 | | | |
| Service | | | 23.13 | | | | — | | | |
| Class IR | | | 23.64 | | | | 14.51 | | | |
| Class R | | | 23.32 | | | | 14.28 | | | |
| | | | | | | | | | | |
| | |
| (a) | | Commenced operations on January 31, 2012. |
| (b) | | Maximum public offering price per share for Class A Shares of the Capital Growth, Concentrated Growth, Flexible Cap Growth, Focused Growth, Growth Opportunities, Small/Mid Cap Growth, Strategic Growth, Technology Tollkeeper and U.S. Equity Funds is $24.91, $15.27, $11.79, $11.27, $24.80, $16.08, $11.71, $14.23 and $12.58, respectively. At redemption, Class B and Class C Shares may be subject to a contingent deferred sales charge, assessed on the amount equal to the lesser of the current net asset value or the original purchase price of the shares. |
74 The accompanying notes are an integral part of these financial statements.
GOLDMAN SACHS FUNDAMENTAL EQUITY GROWTH FUNDS
| | | | | | | | | | | | | | | | | | | | | | | | | | | | | |
Flexible Cap
| �� | Focused Growth
| | Growth
| | Small/Mid Cap
| | Strategic Growth
| | Technology
| | U.S. Equity
| | |
| Growth Fund | | Fund(a) | | Opportunities Fund | | Growth Fund | | Fund | | Tollkeeper Fund | | Fund | | |
| |
| | | | | | | | | | | | | | | | | | | | | | | | | | | | | |
$ | 14,295,036 | | | $ | 2,363,480 | | | $ | 4,446,024,827 | | | $ | 826,117,372 | | | $ | 490,409,032 | | | $ | 378,952,736 | | | $ | 9,936,346 | | | |
| | — | | | | — | | | | 34,001,464 | | | | — | | | | — | | | | — | | | | — | | | |
| | 75,611 | | | | 23,964 | | | | 71,647 | | | | 81,027 | | | | 4,165,438 | | | | 80,345 | | | | 36,827 | | | |
| | | | | | | | | | | | | | | | | | | | | | | | | | | | | |
| | 40,535 | | | | 50,000 | | | | 7,456,766 | | | | 1,630,620 | | | | 244,113 | | | | 301,404 | | | | 11,831 | | | |
| | 14,377 | | | | 1,029 | | | | 2,315,135 | | | | 378,606 | | | | 599,610 | | | | 166,612 | | | | 16,452 | | | |
| | — | | | | — | | | | 23,485,984 | | | | 4,913,198 | | | | — | | | | 436,709 | | | | 156,762 | | | |
| | 16,831 | | | | 52,599 | | | | 41,950 | | | | 15,775 | | | | 12,163 | | | | 17,096 | | | | 18,799 | | | |
| | — | | | | 174,945 | | | | — | | | | — | | | | — | | | | — | | | | — | | | |
| | 167 | | | | — | | | | 34,022 | | | | 7,157 | | | | 3,864 | | | | 2,910 | | | | 145 | | | |
| |
| |
| | 14,442,557 | | | | 2,666,017 | | | | 4,513,431,795 | | | | 833,143,755 | | | | 495,434,220 | | | | 379,957,812 | | | | 10,177,162 | | | |
| |
| |
| | | | | | | | | | | | | | | | | | | | | | | | | | | | | |
| | | | | | | | | | | | | | | | | | | | | | | | | | | | | |
| |
| | | | | | | | | | | | | | | | | | | | | | | | | | | | | |
| | | | | | | | | | | | | | | | | | | | | | | | | | | | | |
| | 14,723 | | | | — | | | | 11,704,118 | | | | 1,703,172 | | | | 691,939 | | | | 903,454 | | | | 34,146 | | | |
| | 12,990 | | | | 1,467 | | | | 3,834,585 | | | | 797,552 | | | | 365,506 | | | | 435,643 | | | | 6,768 | | | |
| | 75,682 | | | | — | | | | 26,454,129 | | | | 5,391,596 | | | | — | | | | — | | | | 202,789 | | | |
| | 46,118 | | | | 227,569 | | | | 392,847 | | | | 141,887 | | | | 102,982 | | | | 158,488 | | | | 48,064 | | | |
| |
| |
| | 149,513 | | | | 229,036 | | | | 42,385,679 | | | | 8,034,207 | | | | 1,160,427 | | | | 1,497,585 | | | | 291,767 | | | |
| |
| |
| | | | | | | | | | | | | | | | | | | | | | | | | | | | | |
| | | | | | | | | | | | | | | | | | | | | | | | | | | | | |
| |
| | | | | | | | | | | | | | | | | | | | | | | | | | | | | |
| | 10,610,497 | | | | 2,300,000 | | | | 3,601,730,945 | | | | 673,613,186 | | | | 427,472,103 | | | | 345,769,077 | | | | 9,107,877 | | | |
| | (11,134 | ) | | | 167 | | | | (7,696,100 | ) | | | (2,925,820 | ) | | | 422,248 | | | | (2,048,843 | ) | | | 14,182 | | | |
| | 567,349 | | | | 320 | | | | 99,210,092 | | | | 18,654,468 | | | | (9,029 | ) | | | (4,131,581 | ) | | | (274,777 | ) | | |
| | 3,126,332 | | | | 136,494 | | | | 777,801,179 | | | | 135,767,714 | | | | 66,388,471 | | | | 38,871,574 | | | | 1,038,113 | | | |
| |
| |
| $ | 14,293,044 | | | $ | 2,436,981 | | | $ | 4,471,046,116 | | | $ | 825,109,548 | | | $ | 494,273,793 | | | $ | 378,460,227 | | | $ | 9,885,395 | | | |
| | | | | | | | | | | | | | | | | | | | | | | | | | | | | |
| | | | | | | | | | | | | | | | | | | | | | | | | | | | | |
| $ | 8,200,682 | | | $ | 10,652 | | | $ | 1,079,133,612 | | | $ | 382,056,836 | | | $ | 194,124,910 | | | $ | 249,770,294 | | | $ | 3,334,461 | | | |
| | — | | | | — | | | | 15,087,884 | | | | 5,356,403 | | | | 1,533,063 | | | | 10,033,711 | | | | — | | | |
| | 1,077,128 | | | | 10,645 | | | | 163,810,512 | | | | 85,985,282 | | | | 8,837,710 | | | | 54,739,501 | | | | 170,472 | | | |
| | 4,699,966 | | | | 2,394,380 | | | | 3,038,403,409 | | | | 283,456,907 | | | | 289,451,281 | | | | 51,213,102 | | | | 6,306,526 | | | |
| | — | | | | — | | | | 60,775,414 | | | | 6,151,770 | | | | 2,592 | | | | 10,164,922 | | | | — | | | |
| | 131,662 | | | | 10,654 | | | | 65,484,054 | | | | 42,382,179 | | | | 320,189 | | | | 2,538,697 | | | | 61,861 | | | |
| | 183,606 | | | | 10,650 | | | | 48,351,231 | | | | 19,720,171 | | | | 4,048 | | | | — | | | | 12,075 | | | |
| | | | | | | | | | | | | | | | | | | | | | | | | | | | | |
| | | | | | | | | | | | | | | | | | | | | | | | | | | | | |
| $ | 14,293,044 | | | $ | 2,436,981 | | | $ | 4,471,046,116 | | | $ | 825,109,548 | | | $ | 494,273,793 | | | $ | 378,460,227 | | | $ | 9,885,395 | | | |
| | | | | | | | | | | | | | | | | | | | | | | | | | | | | |
| | | | | | | | | | | | | | | | | | | | | | | | | | | | | |
| | 735,855 | | | | 1,000 | | | | 46,032,601 | | | | 25,133,777 | | | | 17,533,195 | | | | 18,574,153 | | | | 280,488 | | | |
| | — | | | | — | | | | 725,718 | | | | 373,517 | | | | 151,635 | | | | 819,813 | | | | — | | | |
| | 99,673 | | | | 1,000 | | | | 7,957,442 | | | | 5,998,703 | | | | 872,637 | | | | 4,474,027 | | | | 14,481 | | | |
| | 413,557 | | | | 224,729 | | | | 121,160,576 | | | | 18,183,853 | | | | 25,241,964 | | | | 3,622,134 | | | | 529,144 | | | |
| | — | | | | — | | | | 2,639,932 | | | | 409,379 | | | | 234 | | | | 762,593 | | | | — | | | |
| | 11,660 | | | | 1,000 | | | | 2,760,308 | | | | 2,756,189 | | | | 27,891 | | | | 179,960 | | | | 5,190 | | | |
| | 16,626 | | | | 1,000 | | | | 2,084,696 | | | | 1,311,280 | | | | 367 | | | | — | | | | 1,015 | | | |
| | | | | | | | | | | | | | | | | | | | | | | | | | | | | |
| | | | | | | | | | | | | | | | | | | | | | | | | | | | | |
| | $11.14 | | | | $10.65 | | | | $23.44 | | | | $15.20 | | | | $11.07 | | | | $13.45 | | | | $11.89 | | | |
| | — | | | | — | | | | 20.79 | | | | 14.34 | | | | 10.11 | | | | 12.24 | | | | — | | | |
| | 10.81 | | | | 10.65 | | | | 20.59 | | | | 14.33 | | | | 10.13 | | | | 12.23 | | | | 11.77 | | | |
| | 11.36 | | | | 10.65 | | | | 25.08 | | | | 15.59 | | | | 11.47 | | | | 14.14 | | | | 11.92 | | | |
| | — | | | | — | | | | 23.02 | | | | 15.03 | | | | 11.10 | | | | 13.33 | | | | — | | | |
| | 11.29 | | | | 10.65 | | | | 23.72 | | | | 15.38 | | | | 11.48 | | | | 14.11 | | | | 11.92 | | | |
| | 11.04 | | | | 10.65 | | | | 23.19 | | | | 15.04 | | | | 11.05 | | | | — | | | | 11.90 | | | |
| | | | | | | | | | | | | | | | | | | | | | | | | | | | | |
The accompanying notes are an integral part of these financial statements. 75
GOLDMAN SACHS FUNDAMENTAL EQUITY GROWTH FUNDS
Statements of Operations
For the Six Months Ended February 29, 2012 (Unaudited)
| | | | | | | | | |
| | | Capital Growth
| | Concentrated
|
| | | Fund | | Growth Fund |
| |
Investment income: |
| | | | | | | | | |
| Dividends (net of foreign withholding taxes of $26,732, $11,317, $378, $0, $98,224, $27,466, $16,610, $0 and $1,207) | | $ | 5,811,991 | | | $ | 1,239,912 | |
| Interest | | | 2,398 | | | | 355 | |
| |
| |
Total investment income | | | 5,814,389 | | | | 1,240,267 | |
| |
| |
| | | | | | | | | |
| | | | | | | | | |
Expenses: |
| | | | | | | | | |
| Management fees | | | 4,811,043 | | | | 1,031,428 | |
Distribution and Service fees(b) | | | 1,334,609 | | | | 142,103 | |
Transfer Agent fees(b) | | | 757,364 | | | | 120,152 | |
| Printing and mailing costs | | | 73,344 | | | | 36,750 | |
| Custody and accounting fees | | | 62,615 | | | | 27,154 | |
| Registration fees | | | 41,799 | | | | 30,551 | |
| Professional fees | | | 40,086 | | | | 38,314 | |
| Trustee fees | | | 8,899 | | | | 7,954 | |
| Service Share fees — Shareholder Administration Plan | | | 1,208 | | | | — | |
| Service Share fees — Service Plan | | | 1,208 | | | | — | |
| Amortization of offering costs | | | — | | | | — | |
| Other | | | 14,929 | | | | 4,576 | |
| |
| |
Total expenses | | | 7,147,104 | | | | 1,438,982 | |
| |
| |
| Less — expense reductions | | | (1,665,775 | ) | | | (326,843 | ) |
| |
| |
Net expenses | | | 5,481,329 | | | | 1,112,139 | |
| |
| |
NET INVESTMENT INCOME (LOSS) | | | 333,060 | | | | 128,128 | |
| |
| |
| | | | | | | | | |
| | | | | | | | | |
Realized and unrealized gain (loss): |
| | | | | | | | | |
| Net realized gain (loss) from: | | | | | | | | |
| Investment transactions — unaffiliated issuers (including commissions recaptured of $41,305, $8,590, $0, $0, $191,384, $0, $24,727, $20,139 and $0, respectively) | | | 50,601,450 | | | | 5,547,546 | |
| Investment transactions — affiliated issuers | | | — | | | | — | |
| Net change in unrealized gain (loss) on: | | | | | | | | |
| Investments — unaffiliated issuers | | | 80,567,576 | | | | 17,237,454 | |
| Investments — affiliated issuers | | | — | | | | — | |
| |
| |
Net realized and unrealized gain | | | 131,169,026 | | | | 22,785,000 | |
| |
| |
NET INCREASE IN NET ASSETS RESULTING FROM OPERATIONS | | $ | 131,502,086 | | | $ | 22,913,128 | |
| |
| |
| | |
| (a) | | Commenced operations on January 31, 2012. |
| (b) | | Class specific Distribution and Service, and Transfer Agent fees were as follows: |
| | | | | | | | | | | | | | | | | | | | | | | | | | | | | | | | | | | | | | | | | | | | | |
| | | Distribution and Service Fees | | Transfer Agent Fees |
Fund | | Class A | | Class B | | Class C | | Class R | | Class A | | Class B | | Class C | | Institutional | | Service | | Class IR | | Class R |
| Capital Growth | | $ | 807,673 | | | $ | 170,616 | | | $ | 354,833 | | | $ | 1,487 | | | $ | 613,831 | | | $ | 32,417 | | | $ | 67,418 | | | $ | 41,603 | | | $ | 193 | | | $ | 1,337 | | | $ | 565 | |
| Concentrated Growth | | | 127,174 | | | | 2,376 | | | | 12,531 | | | | 22 | | | | 96,653 | | | | 451 | | | | 2,381 | | | | 20,219 | | | | — | | | | 439 | | | | 9 | |
| Flexible Cap Growth | | | 13,306 | | | | — | | | | 4,911 | | | | 339 | | | | 10,112 | | | | — | | | | 933 | | | | 837 | | | | — | | | | 117 | | | | 129 | |
| Focused Growth | | | 2 | | | | — | | | | 8 | | | | 4 | | | | 2 | | | | — | | | | 2 | | | | 68 | | | | — | | | | 2 | | | | 1 | |
| Growth Opportunities | | | 1,282,676 | | | | 73,563 | | | | 763,305 | | | | 98,336 | | | | 974,834 | | | | 13,977 | | | | 145,028 | | | | 560,007 | | | | 11,127 | | | | 54,465 | | | | 37,368 | |
| Small/Mid Cap Growth | | | 467,540 | | | | 25,201 | | | | 389,382 | | | | 41,237 | | | | 355,330 | | | | 4,788 | | | | 73,983 | | | | 62,208 | | | | 1,046 | | | | 31,774 | | | | 15,670 | |
| Strategic Growth | | | 245,146 | | | | 7,591 | | | | 42,535 | | | | 9 | | | | 186,311 | | | | 1,442 | | | | 8,082 | | | | 54,365 | | | | — | | | | 216 | | | | 3 | |
| Technology Tollkeeper | | | 284,808 | | | | 47,143 | | | | 249,777 | | | | — | | | | 216,454 | | | | 8,957 | | | | 47,457 | | | | 9,885 | | | | 3,148 | | | | 2,240 | | | | — | |
| U.S. Equity | | | 3,896 | | | | — | | | | 710 | | | | 27 | | | | 2,961 | | | | — | | | | 135 | | | | 1,145 | | | | — | | | | 117 | | | | 10 | |
76 The accompanying notes are an integral part of these financial statements.
GOLDMAN SACHS FUNDAMENTAL EQUITY GROWTH FUNDS
| | | | | | | | | | | | | | | | | | | | | | | | | | | |
Flexible Cap
| | Focused Growth
| | Growth
| | Small/Mid Cap
| | Strategic Growth
| | Technology
| | U.S. Equity
|
| Growth Fund | | Fund(a) | | Opportunities Fund | | Growth Fund | | Fund | | Tollkeeper Fund | | Fund |
| |
| |
| | | | | | | | | | | | | | | | | | | | | | | | | | | |
| | | | | | | | | | | | | | | | | | | | | | | | | | | |
| $ | 82,735 | | | $ | 1,641 | | | $ | 14,545,537 | | | $ | 2,204,693 | | | $ | 3,058,805 | | | $ | 745,058 | | | $ | 97,036 | |
| | 52 | | | | 18 | | | | 16,935 | | | | 4,264 | | | | 1,484 | | | | 2,576 | | | | 64 | |
| |
| |
| | 82,787 | | | | 1,659 | | | | 14,562,472 | | | | 2,208,957 | | | | 3,060,289 | | | | 747,634 | | | | 97,100 | |
| |
| |
| | | | | | | | | | | | | | | | | | | | | | | | | | | |
| | | | | | | | | | | | | | | | | | | | | | | | | | | |
| |
| | | | | | | | | | | | | | | | | | | | | | | | | | | |
| | 80,349 | | | | 1,745 | | | | 19,650,870 | | | | 4,115,783 | | | | 2,390,995 | | | | 1,773,756 | | | | 31,921 | |
| | 18,556 | | | | 14 | | | | 2,217,880 | | | | 923,360 | | | | 295,281 | | | | 581,728 | | | | 4,633 | |
| | 12,128 | | | | 75 | | | | 1,796,806 | | | | 544,799 | | | | 250,419 | | | | 288,141 | | | | 4,368 | |
| | 18,221 | | | | 6,127 | | | | 273,905 | | | | 93,751 | | | | 48,699 | | | | 77,202 | | | | 19,617 | |
| | 31,709 | | | | 14,739 | | | | 173,864 | | | | 59,107 | | | | 43,369 | | | | 53,726 | | | | 26,994 | |
| | 29,891 | | | | 6,127 | | | | 99,856 | | | | 67,162 | | | | 47,841 | | | | 57,761 | | | | 29,906 | |
| | 41,376 | | | | 8,125 | | | | 40,349 | | | | 39,385 | | | | 36,451 | | | | 38,946 | | | | 40,338 | |
| | 7,737 | | | | 1,089 | | | | 12,524 | | | | 8,697 | | | | 8,261 | | | | 8,134 | | | | 7,722 | |
| | — | | | | — | | | | 69,542 | | | | 6,534 | | | | 2 | | | | 19,675 | | | | — | |
| | — | | | | — | | | | 69,542 | | | | 6,534 | | | | 2 | | | | 19,675 | | | | — | |
| | — | | | | 15,055 | | | | — | | | | — | | | | — | | | | — | | | | — | |
| | 2,789 | | | | 1,361 | | | | 49,921 | | | | 13,948 | | | | 183 | | | | 8,373 | | | | 3,321 | |
| |
| |
| | 242,756 | | | | 54,457 | | | | 24,455,059 | | | | 5,879,060 | | | | 3,121,503 | | | | 2,927,117 | | | | 168,820 | |
| |
| |
| | (145,879 | ) | | | (52,965 | ) | | | (1,355,454 | ) | | | (636,126 | ) | | | (868,640 | ) | | | (130,640 | ) | | | (125,908 | ) |
| |
| |
| | 96,877 | | | | 1,492 | | | | 23,099,605 | | | | 5,242,934 | | | | 2,252,863 | | | | 2,796,477 | | | | 42,912 | |
| |
| |
| | (14,090 | ) | | | 167 | | | | (8,537,133 | ) | | | (3,033,977 | ) | | | 807,426 | | | | (2,048,843 | ) | | | 54,188 | |
| |
| |
| | | | | | | | | | | | | | | | | | | | | | | | | | | |
| | | | | | | | | | | | | | | | | | | | | | | | | | | |
| |
| | | | | | | | | | | | | | | | | | | | | | | | | | | |
| | | | | | | | | | | | | | | | | | | | | | | | | | | |
| | | | | | | | | | | | | | | | | | | | | | | | | | | |
| | 871,034 | | | | 320 | | | | 155,808,809 | | | | 37,880,006 | | | | 24,593,139 | | | | (2,680,700 | ) | | | (166,485 | ) |
| | — | | | | — | | | | (4,746,590 | ) | | | — | | | | — | | | | — | | | | — | |
| | | | | | | | | | | | | | | | | | | | | | | | | | | |
| | 620,843 | | | | 136,494 | | | | 533,733,685 | | | | 85,664,902 | | | | 39,701,756 | | | | 58,324,227 | | | | 1,164,442 | |
| | — | | | | — | | | | (4,910,563 | ) | | | — | | | | — | | | | — | | | | — | |
| |
| |
| | 1,491,877 | | | | 136,814 | | | | 679,885,341 | | | | 123,544,908 | | | | 64,294,895 | | | | 55,643,527 | | | | 997,957 | |
| |
| |
| $ | 1,477,787 | | | $ | 136,981 | | | $ | 671,348,208 | | | $ | 120,510,931 | | | $ | 65,102,321 | | | $ | 53,594,684 | | | $ | 1,052,145 | |
| |
| |
The accompanying notes are an integral part of these financial statements. 77
GOLDMAN SACHS FUNDAMENTAL EQUITY GROWTH FUNDS
Statements of Changes in Net Assets
| | | | | | | | | |
| | | Capital Growth Fund |
| | | For the
| | |
| | | Six Months Ended
| | For the Fiscal
|
| | | February 29, 2012
| | Year Ended
|
| | | (Unaudited) | | August 31, 2011 |
| |
From operations: |
| | | | | | | | | |
| Net investment income (loss) | | $ | 333,060 | | | $ | 2,179,223 | |
| Net realized gain | | | 50,601,450 | | | | 169,947,435 | |
| Net change in unrealized gain | | | 80,567,576 | | | | 29,608,159 | |
| |
| |
Net increase in net assets resulting from operations | | | 131,502,086 | | | | 201,734,817 | |
| |
| |
| | | | | | | | | |
| | | | | | | | | |
Distributions to shareholders: |
| | | | | | | | | |
| From net investment income | | | | | | | | |
| Class A Shares | | | (1,176,923 | ) | | | — | |
| Institutional Shares | | | (843,182 | ) | | | (1,157,965 | ) |
| Service Shares | | | (883 | ) | | | — | |
| Class IR Shares | | | (9,608 | ) | | | — | |
| Class R Shares | | | (579 | ) | | | — | |
| From net realized gains | | | | | | | | |
| Class A Shares | | | — | | | | — | |
| Class C Shares | | | — | | | | — | |
| Institutional Shares | | | — | | | | — | |
| Class IR Shares | | | — | | | | — | |
| Class R Shares | | | — | | | | — | |
| |
| |
Total distributions to shareholders | | | (2,031,175 | ) | | | (1,157,965 | ) |
| |
| |
| | | | | | | | | |
| | | | | | | | | |
From share transactions: |
| | | | | | | | | |
| Proceeds from sales of shares | | | 26,519,883 | | | | 102,112,586 | |
| Reinvestment of distributions | | | 1,885,861 | | | | 1,093,150 | |
| Cost of shares redeemed | | | (259,861,155 | ) | | | (412,259,502 | ) |
| |
| |
Net increase (decrease) in net assets resulting from share transactions | | | (231,455,411 | ) | | | (309,053,766 | ) |
| |
| |
TOTAL INCREASE (DECREASE) | | | (101,984,500 | ) | | | (108,476,914 | ) |
| |
| |
| | | | | | | | | |
| | | | | | | | | |
Net assets: |
| | | | | | | | | |
| Beginning of period | | | 1,075,607,474 | | | | 1,184,084,388 | |
| |
| |
| End of period | | $ | 973,622,974 | | | $ | 1,075,607,474 | |
| |
| |
Undistributed (distribution in excess of) net investment income (loss) | | $ | 405,433 | | | $ | 2,103,548 | |
| |
| |
78 The accompanying notes are an integral part of these financial statements.
GOLDMAN SACHS FUNDAMENTAL EQUITY GROWTH FUNDS
| | | | | | | | | | | | | | | |
| Concentrated Growth Fund | | Flexible Cap Growth Fund |
For the
| | | | For the
| | |
Six Months Ended
| | For the Fiscal
| | Six Months Ended
| | For the Fiscal
|
| February 29, 2012 | | Year Ended | | February 29, 2012 | | Year Ended |
| (Unaudited) | | August 31, 2011 | | (Unaudited) | | August 31, 2011 |
| |
| |
| | | | | | | | | | | | | | | |
| $ | 128,128 | | | $ | 329,814 | | | $ | (14,090 | ) | | $ | (74,199 | ) |
| | 5,547,546 | | | | 11,335,434 | | | | 871,034 | | | | 1,201,993 | |
| | 17,237,454 | | | | 27,939,459 | | | | 620,843 | | | | 1,693,368 | |
| |
| |
| | 22,913,128 | | | | 39,604,707 | | | | 1,477,787 | | | | 2,821,162 | |
| |
| |
| | | | | | | | | | | | | | | |
| | | | | | | | | | | | | | | |
| |
| | | | | | | | | | | | | | | |
| | | | | | | | | | | | | | | |
| | — | | | | — | | | | — | | | | — | |
| | (298,715 | ) | | | (210,114 | ) | | | — | | | | — | |
| | — | | | | — | | | | — | | | | — | |
| | (1,459 | ) | | | (128 | ) | | | — | | | | — | |
| | — | | | | — | | | | — | | | | — | |
| | | | | | | | | | | | | | | |
| | — | | | | — | | | | (622,301 | ) | | | (772,755 | ) |
| | — | | | | — | | | | (57,805 | ) | | | (34,763 | ) |
| | — | | | | — | | | | (233,496 | ) | | | (160,716 | ) |
| | — | | | | — | | | | (6,825 | ) | | | (2,276 | ) |
| | — | | | | — | | | | (9,321 | ) | | | (510 | ) |
| |
| |
| | (300,174 | ) | | | (210,242 | ) | | | (929,748 | ) | | | (971,020 | ) |
| |
| |
| | | | | | | | | | | | | | | |
| | | | | | | | | | | | | | | |
| |
| | | | | | | | | | | | | | | |
| | 4,284,071 | | | | 43,599,606 | | | | 1,139,196 | | | | 5,939,378 | |
| | 268,022 | | | | 175,955 | | | | 901,192 | | | | 901,104 | |
| | (72,751,534 | ) | | | (79,188,732 | ) | | | (9,391,575 | ) | | | (6,394,409 | ) |
| |
| |
| | (68,199,441 | ) | | | (35,413,171 | ) | | | (7,351,187 | ) | | | 446,073 | |
| |
| |
| | (45,586,487 | ) | | | 3,981,294 | | | | (6,803,148 | ) | | | 2,296,215 | |
| |
| |
| | | | | | | | | | | | | | | |
| | | | | | | | | | | | | | | |
| |
| | | | | | | | | | | | | | | |
| | 238,880,480 | | | | 234,899,186 | | | | 21,096,192 | | | | 18,799,977 | |
| |
| |
| $ | 193,293,993 | | | $ | 238,880,480 | | | $ | 14,293,044 | | | $ | 21,096,192 | |
| |
| |
| $ | (59,581 | ) | | $ | 112,465 | | | $ | (11,134 | ) | | $ | 2,956 | |
| |
| |
The accompanying notes are an integral part of these financial statements. 79
GOLDMAN SACHS FUNDAMENTAL EQUITY GROWTH FUNDS
Statements of Changes in Net Assets (continued)
| | | | | |
| | | Focused Growth Fund(a) |
| | | For the
|
| | | Period Ended
|
| | | February 29, 2012
|
| | | (Unaudited) |
| |
From operations: |
| | | | | |
| Net investment income (loss) | | $ | 167 | |
| Net realized gain | | | 320 | |
| Net change in unrealized gain | | | 136,494 | |
| |
| |
Net increase in net assets resulting from operations | | | 136,981 | |
| |
| |
| | | | | |
| | | | | |
Distributions to shareholders: |
| | | | | |
| From net realized gains | | | | |
| Class A Shares | | | — | |
| Class B Shares | | | — | |
| Class C Shares | | | — | |
| Institutional Shares | | | — | |
| Service Shares | | | — | |
| Class IR Shares | | | — | |
| Class R Shares | | | — | |
| |
| |
Total distributions to shareholders | | | — | |
| |
| |
| | | | | |
| | | | | |
From share transactions: |
| | | | | |
| Proceeds from sales of shares | | | 2,300,000 | |
| Reinvestment of distributions | | | — | |
| Cost of shares redeemed in connection with in-kind transactions | | | — | |
| Cost of shares redeemed | | | — | |
| |
| |
Net increase (decrease) in net assets resulting from share transactions | | | 2,300,000 | |
| |
| |
TOTAL INCREASE (DECREASE) | | | 2,436,981 | |
| |
| |
| | | | | |
| | | | | |
Net assets: |
| | | | | |
| Beginning of period | | | — | |
| |
| |
| End of period | | $ | 2,436,981 | |
| |
| |
Undistributed (distribution in excess of) net investment income (loss) | | $ | 167 | |
| |
| |
| | |
| (a) | | Commenced operations on January 31, 2012. |
80 The accompanying notes are an integral part of these financial statements.
GOLDMAN SACHS FUNDAMENTAL EQUITY GROWTH FUNDS
| | | | | | | | | | | | | | | |
| Growth Opportunities Fund | | Small/Mid Cap Growth Fund |
For the
| | | | For the
| | |
Six Months Ended
| | For the Fiscal
| | Six Months Ended
| | For the Fiscal
|
| February 29, 2012 | | Year Ended | | February 29, 2012 | | Year Ended |
| (Unaudited) | | August 31, 2011 | | (Unaudited) | | August 31, 2011 |
| |
| |
| | | | | | | | | | | | | | | |
| $ | (8,537,133 | ) | | $ | (20,642,672 | ) | | $ | (3,033,977 | ) | | $ | (7,992,521 | ) |
| | 151,062,219 | | | | 358,254,607 | | | | 37,880,006 | | | | 47,207,165 | |
| | 528,823,122 | | | | 49,655,770 | | | | 85,664,902 | | | | 32,422,352 | |
| |
| |
| | 671,348,208 | | | | 387,267,705 | | | | 120,510,931 | | | | 71,636,996 | |
| |
| |
| | | | | | | | | | | | | | | |
| | | | | | | | | | | | | | | |
| |
| | | | | | | | | | | | | | | |
| | | | | | | | | | | | | | | |
| | (64,632,112 | ) | | | (10,102,700 | ) | | | (17,429,835 | ) | | | (6,826,430 | ) |
| | (1,049,756 | ) | | | (244,405 | ) | | | (250,616 | ) | | | (138,992 | ) |
| | (10,893,691 | ) | | | (1,721,243 | ) | | | (3,846,385 | ) | | | (1,255,728 | ) |
| | (165,671,437 | ) | | | (25,299,102 | ) | | | (15,419,415 | ) | | | (5,831,558 | ) |
| | (3,596,434 | ) | | | (699,985 | ) | | | (249,049 | ) | | | (82,680 | ) |
| | (3,529,948 | ) | | | (181,396 | ) | | | (1,510,883 | ) | | | (280,657 | ) |
| | (2,560,779 | ) | | | (156,695 | ) | | | (790,187 | ) | | | (246,367 | ) |
| |
| |
| | (251,934,157 | ) | | | (38,405,526 | ) | | | (39,496,370 | ) | | | (14,662,412 | ) |
| |
| |
| | | | | | | | | | | | | | | |
| | | | | | | | | | | | | | | |
| |
| | | | | | | | | | | | | | | |
| | 619,587,054 | | | | 2,201,840,040 | | | | 136,430,267 | | | | 594,941,439 | |
| | 177,970,171 | | | | 27,126,115 | | | | 32,384,156 | | | | 11,016,116 | |
| | — | | | | (27,101,361 | ) | | | — | | | | — | |
| | (970,425,286 | ) | | | (1,574,121,533 | ) | | | (306,717,784 | ) | | | (353,223,620 | ) |
| |
| |
| | (172,868,061 | ) | | | 627,743,261 | | | | (137,903,361 | ) | | | 252,733,935 | |
| |
| |
| | 246,545,990 | | | | 976,605,440 | | | | (56,888,800 | ) | | | 309,708,519 | |
| |
| |
| | | | | | | | | | | | | | | |
| | | | | | | | | | | | | | | |
| |
| | | | | | | | | | | | | | | |
| | 4,224,500,126 | | | | 3,247,894,686 | | | | 881,998,348 | | | | 572,289,829 | |
| |
| |
| $ | 4,471,046,116 | | | $ | 4,224,500,126 | | | $ | 825,109,548 | | | $ | 881,998,348 | |
| |
| |
| $ | (7,696,100 | ) | | $ | 841,033 | | | $ | (2,925,820 | ) | | $ | 108,157 | |
| |
| |
The accompanying notes are an integral part of these financial statements. 81
GOLDMAN SACHS FUNDAMENTAL EQUITY GROWTH FUNDS
Statements of Changes in Net Assets (continued)
| | | | | | | | | |
| | | Strategic Growth Fund |
| | | For the
| | |
| | | Six Months Ended
| | For the Fiscal
|
| | | February 29, 2012 | | Year Ended |
| | | (Unaudited) | | August 31, 2011 |
| |
From operations: |
| | | | | | | | | |
| Net investment income (loss) | | $ | 807,426 | | | $ | 2,196,996 | |
| Net realized gain (loss) | | | 24,593,139 | | | | 29,013,473 | |
| Net change in unrealized gain | | | 39,701,756 | | | | 40,421,253 | |
| |
| |
Net increase in net assets resulting from operations | | | 65,102,321 | | | | 71,631,722 | |
| |
| |
| | | | | | | | | |
| | | | | | | | | |
Distributions to shareholders: |
| | | | | | | | | |
| From net investment income | | | | | | | | |
| Class A Shares | | | (301,353 | ) | | | (661,394 | ) |
| Class C Shares | | | — | | | | — | |
| Institutional Shares | | | (1,575,792 | ) | | | (1,929,021 | ) |
| Service Shares | | | (5 | ) | | | (4 | ) |
| Class IR Shares | | | — | | | | (740 | ) |
| Class R Shares | | | — | | | | (2 | ) |
| From net realized gains | | | | | | | | |
| Class A Shares | | | — | | | | — | |
| Class C Shares | | | — | | | | — | |
| Institutional Shares | | | — | | | | — | |
| Class IR Shares | | | — | | | | — | |
| Class R Shares | | | — | | | | — | |
| |
| |
Total distributions to shareholders | | | (1,877,150 | ) | | | (2,591,161 | ) |
| |
| |
| | | | | | | | | |
| | | | | | | | | |
From share transactions: |
| | | | | | | | | |
| Proceeds from sales of shares | | | 105,304,064 | | | | 161,562,913 | |
| Reinvestment of distributions | | | 1,800,227 | | | | 2,304,290 | |
| Cost of shares redeemed | | | (146,513,650 | ) | | | (232,048,853 | ) |
| |
| |
Net increase (decrease) in net assets resulting from share transactions | | | (39,409,359 | ) | | | (68,181,650 | ) |
| |
| |
TOTAL INCREASE | | | 23,815,812 | | | | 858,911 | |
| |
| |
| | | | | | | | | |
| | | | | | | | | |
Net assets: |
| | | | | | | | | |
| Beginning of period | | | 470,457,981 | | | | 469,599,070 | |
| |
| |
| End of period | | $ | 494,273,793 | | | $ | 470,457,981 | |
| |
| |
Undistributed (distribution in excess of) net investment income (loss) | | $ | 422,248 | | | $ | 1,491,972 | |
| |
| |
82 The accompanying notes are an integral part of these financial statements.
GOLDMAN SACHS FUNDAMENTAL EQUITY GROWTH FUNDS
| | | | | | | | | | | | | | | |
| Technology Tollkeeper Fund | | U.S. Equity Fund |
For the
| | | | For the
| | |
Six Months Ended
| | For the Fiscal
| | Six Months Ended
| | For the Fiscal
|
| February 29, 2012 | | Year Ended | | February 29, 2012 | | Year Ended |
| (Unaudited) | | August 31, 2011 | | (Unaudited) | | August 31, 2011 |
| |
| |
| | | | | | | | | | | | | | | |
| $ | (2,048,843 | ) | | $ | (5,007,875 | ) | | $ | 54,188 | | | $ | 48,632 | |
| | (2,680,700 | ) | | | 33,359,265 | | | | (166,485 | ) | | | 126,527 | |
| | 58,324,227 | | | | 1,074,018 | | | | 1,164,442 | | | | 222,609 | |
| |
| |
| | 53,594,684 | | | | 29,425,408 | | | | 1,052,145 | | | | 397,768 | |
| |
| |
| | | | | | | | | | | | | | | |
| | | | | | | | | | | | | | | |
| |
| | | | | | | | | | | | | | | |
| | | | | | | | | | | | | | | |
| | — | | | | — | | | | (10,984 | ) | | | (1,829 | ) |
| | — | | | | — | | | | — | | | | (24 | ) |
| | — | | | | — | | | | (43,957 | ) | | | (35,036 | ) |
| | — | | | | — | | | | — | | | | — | |
| | — | | | | — | | | | (317 | ) | | | (943 | ) |
| | — | | | | — | | | | (5 | ) | | | (8 | ) |
| | | | | | | | | | | | | | | |
| | — | | | | — | | | | (31,407 | ) | | | (1,374 | ) |
| | — | | | | — | | | | (1,397 | ) | | | (169 | ) |
| | — | | | | — | | | | (61,958 | ) | | | (15,679 | ) |
| | — | | | | — | | | | (905 | ) | | | (433 | ) |
| | — | | | | — | | | | (110 | ) | | | (34 | ) |
| |
| |
| | — | | | | — | | | | (151,040 | ) | | | (55,529 | ) |
| |
| |
| | | | | | | | | | | | | | | |
| | | | | | | | | | | | | | | |
| |
| | | | | | | | | | | | | | | |
| | 58,382,041 | | | | 206,418,133 | | | | 1,515,653 | | | | 5,252,104 | |
| | — | | | | — | | | | 97,808 | | | | 31,917 | |
| | (106,267,868 | ) | | | (193,375,188 | ) | | | (2,075,621 | ) | | | (1,352,678 | ) |
| |
| |
| | (47,885,827 | ) | | | 13,042,945 | | | | (462,160 | ) | | | 3,931,343 | |
| |
| |
| | 5,708,857 | | | | 42,468,353 | | | | 438,945 | | | | 4,273,582 | |
| |
| |
| | | | | | | | | | | | | | | |
| | | | | | | | | | | | | | | |
| |
| | | | | | | | | | | | | | | |
| | 372,751,370 | | | | 330,283,017 | | | | 9,446,450 | | | | 5,172,868 | |
| |
| |
| $ | 378,460,227 | | | $ | 372,751,370 | | | $ | 9,885,395 | | | $ | 9,446,450 | |
| |
| |
| $ | (2,048,843 | ) | | $ | — | | | $ | 14,182 | | | $ | 15,257 | |
| |
| |
The accompanying notes are an integral part of these financial statements. 83
GOLDMAN SACHS CAPITAL GROWTH FUND
Financial Highlights
Selected Data for a Share Outstanding Throughout Each Period
| | | | | | | | | | | | | | | | | | | | | | | | | | | | | | | |
| | | | | Income (loss) from
| | Distributions
| | |
| | | | | investment operations | | to shareholders | | |
| | | | |
| | | | | |
| | | | | | |
| | | Net asset
| |
| | | | | |
| | | | | | |
| | | value,
| | Net
| | Net realized
| | Total from
| | From net
| | From net
| | | | |
| | | beginning
| | investment
| | and unrealized
| | investment
| | investment
| | realized
| | Total
| | |
| Year - Share Class | | of period | | income (loss)(a) | | gain (loss) | | operations | | income | | gains | | distributions | | |
| |
FOR THE SIX MONTHS ENDED FEBRUARY 29, (UNAUDITED) |
| 2012 - A | | $ | 20.49 | | | $ | 0.01 | | | $ | 3.08 | | | $ | 3.09 | | | $ | (0.04 | ) | | $ | — | | | $ | (0.04 | ) | | |
| 2012 - B | | | 18.06 | | | | (0.06 | ) | | | 2.70 | | | | 2.64 | | | | — | | | | — | | | | — | | | |
| 2012 - C | | | 18.03 | | | | (0.06 | ) | | | 2.70 | | | | 2.64 | | | | — | | | | — | | | | — | | | |
| 2012 - Institutional | | | 21.54 | | | | 0.04 | | | | 3.23 | | | | 3.27 | | | | (0.12 | ) | | | — | | | | (0.12 | ) | | |
| 2012 - Service | | | 20.13 | | | | — | (d) | | | 3.02 | | | | 3.02 | | | | (0.02 | ) | | | — | | | | (0.02 | ) | | |
| 2012 - IR | | | 20.66 | | | | 0.04 | | | | 3.08 | | | | 3.12 | | | | (0.14 | ) | | | — | | | | (0.14 | ) | | |
| 2012 - R | | | 20.31 | | | | (0.02 | ) | | | 3.05 | | | | 3.03 | | | | (0.02 | ) | | | — | | | | (0.02 | ) | | |
| | | | | | | | | | | | | | | | | | | | | | | | | | | | | | | |
| | | | | | | | | | | | | | | | | | | | | | | | | | | | | | | |
FOR THE FISCAL YEARS ENDED AUGUST 31, |
| 2011 - A | | | 17.68 | | | | 0.03 | | | | 2.78 | | | | 2.81 | | | | — | | | | — | | | | — | | | |
| 2011 - B | | | 15.70 | | | | (0.11 | ) | | | 2.47 | | | | 2.36 | | | | — | | | | — | | | | — | | | |
| 2011 - C | | | 15.68 | | | | (0.12 | ) | | | 2.47 | | | | 2.35 | | | | — | | | | — | | | | — | | | |
| 2011 - Institutional | | | 18.57 | | | | 0.12 | | | | 2.91 | | | | 3.03 | | | | (0.06 | ) | | | — | | | | (0.06 | ) | | |
| 2011 - Service | | | 17.39 | | | | 0.01 | | | | 2.73 | | | | 2.74 | | | | — | | | | — | | | | — | | | |
| 2011 - IR | | | 17.81 | | | | 0.31 | | | | 2.58 | | | | 2.89 | | | | (0.04 | ) | | | — | | | | (0.04 | ) | | |
| 2011 - R | | | 17.57 | | | | (0.03 | ) | | | 2.77 | | | | 2.74 | | | | — | | | | — | | | | — | | | |
| |
|
| 2010 - A | | | 16.95 | | | | 0.01 | | | | 0.72 | | | | 0.73 | | | | — | | | | — | | | | — | | | |
| 2010 - B | | | 15.15 | | | | (0.11 | ) | | | 0.66 | | | | 0.55 | | | | — | | | | — | | | | — | | | |
| 2010 - C | | | 15.14 | | | | (0.11 | ) | | | 0.65 | | | | 0.54 | | | | — | | | | — | | | | — | | | |
| 2010 - Institutional | | | 17.72 | | | | 0.10 | | | | 0.75 | | | | 0.85 | | | | — | | | | — | | | | — | | | |
| 2010 - Service | | | 16.68 | | | | (0.01 | ) | | | 0.72 | | | | 0.71 | | | | — | | | | — | | | | — | | | |
| 2010 - IR | | | 17.02 | | | | 0.07 | | | | 0.72 | | | | 0.79 | | | | — | | | | — | | | | — | | | |
| 2010 - R | | | 16.88 | | | | (0.01 | ) | | | 0.70 | | | | 0.69 | | | | — | | | | — | | | | — | | | |
| |
|
| 2009 - A | | | 22.40 | | | | — | (d) | | | (4.58 | ) | | | (4.58 | ) | | | — | | | | (0.87 | ) | | | (0.87 | ) | | |
| 2009 - B | | | 20.33 | | | | (0.10 | ) | | | (4.21 | ) | | | (4.31 | ) | | | — | | | | (0.87 | ) | | | (0.87 | ) | | |
| 2009 - C | | | 20.31 | | | | (0.10 | ) | | | (4.20 | ) | | | (4.30 | ) | | | — | | | | (0.87 | ) | | | (0.87 | ) | | |
| 2009 - Institutional | | | 23.26 | | | | 0.06 | | | | (4.73 | ) | | | (4.67 | ) | | | — | | | | (0.87 | ) | | | (0.87 | ) | | |
| 2009 - Service | | | 22.09 | | | | (0.02 | ) | | | (4.52 | ) | | | (4.54 | ) | | | — | | | | (0.87 | ) | | | (0.87 | ) | | |
| 2009 - IR | | | 22.44 | | | | 0.03 | | | | (4.58 | ) | | | (4.55 | ) | | | — | | | | (0.87 | ) | | | (0.87 | ) | | |
| 2009 - R | | | 22.37 | | | | (0.03 | ) | | | (4.59 | ) | | | (4.62 | ) | | | — | | | | (0.87 | ) | | | (0.87 | ) | | |
| |
|
| 2008 - A | | | 23.73 | | | | (0.10 | ) | | | (0.97 | ) | | | (1.07 | ) | | | — | | | | (0.26 | ) | | | (0.26 | ) | | |
| 2008 - B | | | 21.73 | | | | (0.25 | ) | | | (0.89 | ) | | | (1.14 | ) | | | — | | | | (0.26 | ) | | | (0.26 | ) | | |
| 2008 - C | | | 21.70 | | | | (0.25 | ) | | | (0.88 | ) | | | (1.13 | ) | | | — | | | | (0.26 | ) | | | (0.26 | ) | | |
| 2008 - Institutional | | | 24.54 | | | | — | (d) | | | (1.02 | ) | | | (1.02 | ) | | | — | | | | (0.26 | ) | | | (0.26 | ) | | |
| 2008 - Service | | | 23.43 | | | | (0.12 | ) | | | (0.96 | ) | | | (1.08 | ) | | | — | | | | (0.26 | ) | | | (0.26 | ) | | |
| 2008 - IR (Commenced November 30, 2007) | | | 24.22 | | | | (0.03 | ) | | | (1.49 | ) | | | (1.52 | ) | | | — | | | | (0.26 | ) | | | (0.26 | ) | | |
| 2008 - R (Commenced November 30, 2007) | | | 24.22 | | | | (0.10 | ) | | | (1.49 | ) | | | (1.59 | ) | | | — | | | | (0.26 | ) | | | (0.26 | ) | | |
| |
|
| 2007 - A | | | 20.62 | | | | (0.08 | ) | | | 3.19 | | | | 3.11 | | | | — | | | | — | | | | — | | | |
| 2007 - B | | | 19.03 | | | | (0.23 | ) | | | 2.93 | | | | 2.70 | | | | — | | | | — | | | | — | | | |
| 2007 - C | | | 18.99 | | | | (0.23 | ) | | | 2.94 | | | | 2.71 | | | | — | | | | — | | | | — | | | |
| 2007 - Institutional | | | 21.24 | | | | 0.01 | | | | 3.29 | | | | 3.30 | | | | — | | | | — | | | | — | | | |
| 2007 - Service | | | 20.38 | | | | (0.10 | ) | | | 3.15 | | | | 3.05 | | | | — | | | | — | | | | — | | | |
| |
|
| | |
| (a) | | Calculated based on the average shares outstanding methodology. |
| (b) | | Assumes investment at the net asset value at the beginning of the period, reinvestment of all dividends and distributions, a complete redemption of the investment at the net asset value at the end of the period and no sales or redemption charges. Total returns would be reduced if a sales or redemption charge was taken into account. Returns do not reflect the deduction of taxes that a shareholder would pay on Fund distributions or the redemption of Fund shares. Total returns for periods less than one full year are not annualized. |
| (c) | | Annualized. |
| (d) | | Amount is less than $0.005 per share. |
| (e) | | Amount is less than 0.005% of average net assets. |
84 The accompanying notes are an integral part of these financial statements.
GOLDMAN SACHS CAPITAL GROWTH FUND
| | | | | | | | | | | | | | | | | | | | | | | | | | | | | |
| | | | | | | | | | |
| | | | |
| | | | | | | | | | |
| | | | |
| | | | | | | | | | | Ratio of
| | | | |
| | | | | Net assets,
| | Ratio of
| | Ratio of
| | net investment
| | | | |
Net asset
| | | | end of
| | net expenses
| | total expenses
| | income (loss)
| | Portfolio
| | |
value, end
| | Total
| | period
| | to average
| | to average
| | to average
| | turnover
| | |
| of period | | return(b) | | (in 000s) | | net assets | | net assets | | net assets | | rate | | |
| |
| |
| $ | 23.54 | | | | 15.09 | % | | $ | 693,292 | | | | 1.14 | %(c) | | | 1.49 | %(c) | | | 0.08 | %(c) | | | 33 | % | | |
| | 20.70 | | | | 14.62 | | | | 34,428 | | | | 1.89 | (c) | | | 2.24 | (c) | | | (0.67 | )(c) | | | 33 | | | |
| | 20.67 | | | | 14.64 | | | | 76,121 | | | | 1.89 | (c) | | | 2.24 | (c) | | | (0.67 | )(c) | | | 33 | | | |
| | 24.69 | | | | 15.27 | | | | 164,769 | | | | 0.74 | (c) | | | 1.09 | (c) | | | 0.41 | (c) | | | 33 | | | |
| | 23.13 | | | | 15.01 | | | | 1,090 | | | | 1.24 | (c) | | | 1.59 | (c) | | | (0.02 | )(c) | | | 33 | | | |
| | 23.64 | | | | 15.20 | | | | 3,235 | | | | 0.89 | (c) | | | 1.24 | (c) | | | 0.40 | (c) | | | 33 | | | |
| | 23.32 | | | | 14.93 | | | | 687 | | | | 1.39 | (c) | | | 1.74 | (c) | | | (0.17 | )(c) | | | 33 | | | |
| | | | | | | | | | | | | | | | | | | | | | | | | | | | | |
| | | | | | | | | | | | | | | | | | | | | | | | | | | | | |
| |
| | 20.49 | | | | 15.89 | | | | 662,256 | | | | 1.14 | | | | 1.47 | | | | 0.13 | | | | 58 | | | |
| | 18.06 | | | | 15.03 | | | | 38,824 | | | | 1.89 | | | | 2.22 | | | | (0.61 | ) | | | 58 | | | |
| | 18.03 | | | | 14.99 | | | | 72,314 | | | | 1.89 | | | | 2.22 | | | | (0.62 | ) | | | 58 | | | |
| | 21.54 | | | | 16.33 | | | | 299,223 | | | | 0.74 | | | | 1.07 | | | | 0.53 | | | | 58 | | | |
| | 20.13 | | | | 15.76 | | | | 953 | | | | 1.24 | | | | 1.57 | | | | 0.03 | | | | 58 | | | |
| | 20.66 | | | | 16.20 | | | | 1,472 | | | | 0.89 | | | | 1.22 | | | | 1.64 | | | | 58 | | | |
| | 20.31 | | | | 15.59 | | | | 567 | | | | 1.39 | | | | 1.72 | | | | (0.12 | ) | | | 58 | | | |
| |
|
| | 17.68 | | | | 4.31 | | | | 707,444 | | | | 1.14 | | | | 1.47 | | | | 0.07 | | | | 31 | | | |
| | 15.70 | | | | 3.63 | | | | 55,429 | | | | 1.89 | | | | 2.22 | | | | (0.66 | ) | | | 31 | | | |
| | 15.68 | | | | 3.57 | | | | 75,203 | | | | 1.89 | | | | 2.22 | | | | (0.67 | ) | | | 31 | | | |
| | 18.57 | | | | 4.80 | | | | 344,601 | | | | 0.74 | | | | 1.07 | | | | 0.52 | | | | 31 | | | |
| | 17.39 | | | | 4.26 | | | | 988 | | | | 1.24 | | | | 1.57 | | | | (0.03 | ) | | | 31 | | | |
| | 17.81 | | | | 4.64 | | | | 8 | | | | 0.89 | | | | 1.22 | | | | 0.36 | | | | 31 | | | |
| | 17.57 | | | | 4.09 | | | | 412 | | | | 1.39 | | | | 1.72 | | | | (0.08 | ) | | | 31 | | | |
| |
|
| | 16.95 | | | | (19.11 | ) | | | 966,913 | | | | 1.25 | | | | 1.48 | | | | — | (e) | | | 49 | | | |
| | 15.15 | | | | (19.73 | ) | | | 83,648 | | | | 2.00 | | | | 2.23 | | | | (0.75 | ) | | | 49 | | | |
| | 15.14 | | | | (19.69 | ) | | | 84,936 | | | | 2.00 | | | | 2.23 | | | | (0.75 | ) | | | 49 | | | |
| | 17.72 | | | | (18.78 | ) | | | 212,977 | | | | 0.85 | | | | 1.08 | | | | 0.40 | | | | 49 | | | |
| | 16.68 | | | | (19.17 | ) | | | 1,462 | | | | 1.35 | | | | 1.58 | | | | (0.13 | ) | | | 49 | | | |
| | 17.02 | | | | (18.90 | ) | | | 8 | | | | 1.00 | | | | 1.23 | | | | 0.23 | | | | 49 | | | |
| | 16.88 | | | | (19.29 | ) | | | 106 | | | | 1.50 | | | | 1.73 | | | | (0.19 | ) | | | 49 | | | |
| |
|
| | 22.40 | | | | (4.57 | ) | | | 1,505,237 | | | | 1.36 | | | | 1.40 | | | | (0.42 | ) | | | 69 | | | |
| | 20.33 | | | | (5.37 | ) | | | 154,511 | | | | 2.11 | | | | 2.15 | | | | (1.19 | ) | | | 69 | | | |
| | 20.31 | | | | (5.33 | ) | | | 126,865 | | | | 2.11 | | | | 2.15 | | | | (1.19 | ) | | | 69 | | | |
| | 23.26 | | | | (4.22 | ) | | | 288,404 | | | | 0.96 | | | | 1.00 | | | | (0.01 | ) | | | 69 | | | |
| | 22.09 | | | | (4.72 | ) | | | 3,135 | | | | 1.46 | | | | 1.50 | | | | (0.52 | ) | | | 69 | | | |
| | 22.44 | | | | (6.39 | ) | | | 9 | | | | 1.11 | (c) | | | 1.15 | (c) | | | (0.19 | )(c) | | | 69 | | | |
| | 22.37 | | | | (6.68 | ) | | | 9 | | | | 1.61 | (c) | | | 1.65 | (c) | | | (0.62 | )(c) | | | 69 | | | |
| |
|
| | 23.73 | | | | 15.08 | | | | 1,365,143 | | | | 1.40 | | | | 1.43 | | | | (0.35 | ) | | | 41 | | | |
| | 21.73 | | | | 14.19 | | | | 90,307 | | | | 2.15 | | | | 2.18 | | | | (1.09 | ) | | | 41 | | | |
| | 21.70 | | | | 14.27 | | | | 75,933 | | | | 2.15 | | | | 2.18 | | | | (1.09 | ) | | | 41 | | | |
| | 24.54 | | | | 15.54 | | | | 303,283 | | | | 1.00 | | | | 1.03 | | | | 0.05 | | | | 41 | | | |
| | 23.43 | | | | 14.97 | | | | 10,598 | | | | 1.50 | | | | 1.53 | | | | (0.44 | ) | | | 41 | | | |
| |
|
The accompanying notes are an integral part of these financial statements. 85
GOLDMAN SACHS CONCENTRATED GROWTH FUND
Financial Highlights
Selected Data for a Share Outstanding Throughout Each Period
| | | | | | | | | | | | | | | | | | | | | | | | | | | | | | | |
| | | | | Income (loss) from
| | Distributions
| | |
| | | | | investment operations | | to shareholders | | |
| | | | |
| | | | | |
| | | | | | |
| | | Net asset
| |
| | | | | |
| | | | | | |
| | | value,
| | Net
| | Net realized
| | Total from
| | From net
| | From net
| | | | |
| | | beginning
| | investment
| | and unrealized
| | investment
| | investment
| | realized
| | Total
| | |
| Year - Share Class | | of period | | income (loss)(a) | | gain (loss) | | operations | | income | | gains | | distributions | | |
| |
FOR THE SIX MONTHS ENDED FEBRUARY 29, (UNAUDITED) |
| 2012 - A | | $ | 12.64 | | | $ | — | (c) | | $ | 1.79 | | | $ | 1.79 | | | $ | — | | | $ | — | | | $ | — | | | |
| 2012 - B | | | 11.75 | | | | (0.05 | ) | | | 1.67 | | | | 1.62 | | | | — | | | | — | | | | — | | | |
| 2012 - C | | | 11.73 | | | | (0.05 | ) | | | 1.67 | | | | 1.62 | | | | — | | | | — | | | | — | | | |
| 2012 - Institutional | | | 13.07 | | | | 0.02 | | | | 1.86 | | | | 1.88 | | | | (0.05 | ) | | | — | | | | (0.05 | ) | | |
| 2012 - IR | | | 12.73 | | | | 0.01 | | | | 1.81 | | | | 1.82 | | | | (0.04 | ) | | | — | | | | (0.04 | ) | | |
| 2012 - R | | | 12.52 | | | | (0.02 | ) | | | 1.78 | | | | 1.76 | | | | — | | | | — | | | | — | | | |
| | | | | | | | | | | | | | | | | | | | | | | | | | | | | | | |
| | | | | | | | | | | | | | | | | | | | | | | | | | | | | | | |
FOR THE FISCAL YEARS ENDED AUGUST 31, |
| 2011 - A | | | 10.91 | | | | (0.01 | ) | | | 1.74 | | | | 1.73 | | | | — | | | | — | | | | — | | | |
| 2011 - B | | | 10.22 | | | | (0.10 | ) | | | 1.63 | | | | 1.53 | | | | — | | | | — | | | | — | | | |
| 2011 - C | | | 10.20 | | | | (0.10 | ) | | | 1.63 | | | | 1.53 | | | | — | | | | — | | | | — | | | |
| 2011 - Institutional | | | 11.25 | | | | 0.04 | | | | 1.80 | | | | 1.84 | | | | (0.02 | ) | | | — | | | | (0.02 | ) | | |
| 2011 - IR | | | 10.97 | | | | 0.04 | | | | 1.73 | | | | 1.77 | | | | (0.01 | ) | | | — | | | | (0.01 | ) | | |
| 2011 - R | | | 10.83 | | | | (0.04 | ) | | | 1.73 | | | | 1.69 | | | | — | | | | — | | | | — | | | |
| |
|
| 2010 - A | | | 10.51 | | | | (0.02 | ) | | | 0.42 | | | | 0.40 | | | | — | | | | — | | | | — | | | |
| 2010 - B | | | 9.92 | | | | (0.11 | ) | | | 0.41 | | | | 0.30 | | | | — | | | | — | | | | — | | | |
| 2010 - C | | | 9.90 | | | | (0.11 | ) | | | 0.41 | | | | 0.30 | | | | — | | | | — | | | | — | | | |
| 2010 - Institutional | | | 10.79 | | | | 0.02 | | | | 0.44 | | | | 0.46 | | | | — | | | | — | | | | — | | | |
| 2010 - IR | | | 10.54 | | | | 0.03 | | | | 0.40 | | | | 0.43 | | | | — | | | | — | | | | — | | | |
| 2010 - R | | | 10.46 | | | | (0.05 | ) | | | 0.42 | | | | 0.37 | | | | — | | | | — | | | | — | | | |
| |
|
| 2009 - A | | | 13.54 | | | | (0.02 | ) | | | (3.01 | ) | | | (3.03 | ) | | | — | | | | — | | | | — | | | |
| 2009 - B | | | 12.88 | | | | (0.09 | ) | | | (2.87 | ) | | | (2.96 | ) | | | — | | | | — | | | | — | | | |
| 2009 - C | | | 12.85 | | | | (0.09 | ) | | | (2.86 | ) | | | (2.95 | ) | | | — | | | | — | | | | — | | | |
| 2009 - Institutional | | | 13.85 | | | | 0.01 | | | | (3.07 | ) | | | (3.06 | ) | | | — | | | | — | | | | — | | | |
| 2009 - IR | | | 13.55 | | | | (0.01 | ) | | | (3.00 | ) | | | (3.01 | ) | | | — | | | | — | | | | — | | | |
| 2009 - R | | | 13.51 | | | | (0.05 | ) | | | (3.00 | ) | | | (3.05 | ) | | | — | | | | — | | | | — | | | |
| |
|
| 2008 - A | | | 15.01 | | | | (0.10 | ) | | | (0.29 | ) | | | (0.39 | ) | | | — | | | | (1.08 | )(e) | | | (1.08 | ) | | |
| 2008 - B | | | 14.43 | | | | (0.19 | ) | | | (0.28 | ) | | | (0.47 | ) | | | — | | | | (1.08 | )(e) | | | (1.08 | ) | | |
| 2008 - C | | | 14.41 | | | | (0.19 | ) | | | (0.29 | ) | | | (0.48 | ) | | | — | | | | (1.08 | )(e) | | | (1.08 | ) | | |
| 2008 - Institutional | | | 15.27 | | | | (0.04 | ) | | | (0.30 | ) | | | (0.34 | ) | | | — | | | | (1.08 | )(e) | | | (1.08 | ) | | |
| 2008 - IR (Commenced November 30, 2007) | | | 15.38 | | | | (0.05 | ) | | | (0.70 | ) | | | (0.75 | ) | | | — | | | | (1.08 | )(e) | | | (1.08 | ) | | |
| 2008 - R (Commenced November 30, 2007) | | | 15.38 | | | | (0.09 | ) | | | (0.70 | ) | | | (0.79 | ) | | | — | | | | (1.08 | )(e) | | | (1.08 | ) | | |
| |
|
| 2007 - A | | | 12.98 | | | | (0.06 | ) | | | 2.57 | | | | 2.51 | | | | — | | | | (0.48 | ) | | | (0.48 | ) | | |
| 2007 - B | | | 12.59 | | | | (0.16 | ) | | | 2.48 | | | | 2.32 | | | | — | | | | (0.48 | ) | | | (0.48 | ) | | |
| 2007 - C | | | 12.57 | | | | (0.16 | ) | | | 2.48 | | | | 2.32 | | | | — | | | | (0.48 | ) | | | (0.48 | ) | | |
| 2007 - Institutional | | | 13.15 | | | | — | (c) | | | 2.60 | | | | 2.60 | | | | — | | | | (0.48 | ) | | | (0.48 | ) | | |
| |
|
| | |
| (a) | | Calculated based on the average shares outstanding methodology. |
| (b) | | Assumes investment at the net asset value at the beginning of the period, reinvestment of all dividends and distributions, a complete redemption of the investment at the net asset value at the end of the period and no sales or redemption charges. Total returns would be reduced if a sales or redemption charge was taken into account. Returns do not reflect the deduction of taxes that a shareholder would pay on Fund distributions or the redemption of Fund shares. Total returns for periods less than one full year are not annualized. |
| (c) | | Amount is less than $0.005 per share. |
| (d) | | Annualized. |
| (e) | | Includes a distribution from capital of approximately $0.006 per share. |
| (f) | | Amount is less than 0.005% of average net assets. |
86 The accompanying notes are an integral part of these financial statements.
GOLDMAN SACHS CONCENTRATED GROWTH FUND
| | | | | | | | | | | | | | | | | | | | | | | | | | | | | |
| | | | | | | | | | |
| | | | |
| | | | | | | | | | |
| | | | |
| | | | | | | | | | | Ratio of
| | | | |
| | | | | Net assets,
| | Ratio of
| | Ratio of
| | net investment
| | | | |
Net asset
| | | | end of
| | net expenses
| | total expenses
| | income (loss)
| | Portfolio
| | |
value, end
| | Total
| | period
| | to average
| | to average
| | to average
| | turnover
| | |
| of period | | return(b) | | (in 000s) | | net assets | | net assets | | net assets | | rate | | |
| |
| |
| $ | 14.43 | | | | 14.16 | % | | $ | 103,692 | | | | 1.26 | %(d) | | | 1.58 | %(d) | | | (0.05 | )%(d) | | | 16 | % | | |
| | 13.37 | | | | 13.79 | | | | 496 | | | | 2.01 | (d) | | | 2.33 | (d) | | | (0.80 | )(d) | | | 16 | | | |
| | 13.35 | | | | 13.81 | | | | 2,973 | | | | 2.01 | (d) | | | 2.33 | (d) | | | (0.78 | )(d) | | | 16 | | | |
| | 14.90 | | | | 14.33 | | | | 85,598 | | | | 0.86 | (d) | | | 1.18 | (d) | | | 0.33 | (d) | | | 16 | | | |
| | 14.51 | | | | 14.33 | | | | 525 | | | | 1.01 | (d) | | | 1.33 | (d) | | | 0.21 | (d) | | | 16 | | | |
| | 14.28 | | | | 14.06 | | | | 10 | | | | 1.51 | (d) | | | 1.83 | (d) | | | (0.25 | )(d) | | | 16 | | | |
| | | | | | | | | | | | | | | | | | | | | | | | | | | | | |
| | | | | | | | | | | | | | | | | | | | | | | | | | | | | |
| |
| | 12.64 | | | | 15.86 | | | | 109,826 | | | | 1.30 | | | | 1.56 | | | | (0.08 | ) | | | 35 | | | |
| | 11.75 | | | | 14.97 | | | | 496 | | | | 2.05 | | | | 2.31 | | | | (0.83 | ) | | | 35 | | | |
| | 11.73 | | | | 15.00 | | | | 2,000 | | | | 2.05 | | | | 2.31 | | | | (0.82 | ) | | | 35 | | | |
| | 13.07 | | | | 16.35 | | | | 126,113 | | | | 0.90 | | | | 1.16 | | | | 0.33 | | | | 35 | | | |
| | 12.73 | | | | 16.13 | | | | 437 | | | | 1.05 | | | | 1.31 | | | | 0.28 | | | | 35 | | | |
| | 12.52 | | | | 15.60 | | | | 9 | | | | 1.55 | | | | 1.81 | | | | (0.29 | ) | | | 35 | | | |
| |
|
| | 10.91 | | | | 3.81 | | | | 108,338 | | | | 1.30 | | | | 1.56 | | | | (0.22 | ) | | | 45 | | | |
| | 10.22 | | | | 3.02 | | | | 793 | | | | 2.05 | | | | 2.31 | | | | (0.98 | ) | | | 45 | | | |
| | 10.20 | | | | 3.03 | | | | 1,356 | | | | 2.05 | | | | 2.31 | | | | (0.97 | ) | | | 45 | | | |
| | 11.25 | | | | 4.26 | | | | 124,258 | | | | 0.90 | | | | 1.16 | | | | 0.18 | | | | 45 | | | |
| | 10.97 | | | | 4.08 | | | | 147 | | | | 1.05 | | | | 1.31 | | | | 0.27 | | | | 45 | | | |
| | 10.83 | | | | 3.54 | | | | 8 | | | | 1.55 | | | | 1.81 | | | | (0.45 | ) | | | 45 | | | |
| |
|
| | 10.51 | | | | (22.38 | ) | | | 101,233 | | | | 1.37 | | | | 1.61 | | | | (0.27 | ) | | | 65 | | | |
| | 9.92 | | | | (22.98 | ) | | | 1,084 | | | | 2.12 | | | | 2.36 | | | | (1.03 | ) | | | 65 | | | |
| | 9.90 | | | | (22.96 | ) | | | 1,461 | | | | 2.12 | | | | 2.36 | | | | (1.03 | ) | | | 65 | | | |
| | 10.79 | | | | (22.09 | ) | | | 151,504 | | | | 0.97 | | | | 1.21 | | | | 0.13 | | | | 65 | | | |
| | 10.54 | | | | (22.21 | ) | | | 7 | | | | 1.12 | | | | 1.36 | | | | (0.07 | ) | | | 65 | | | |
| | 10.46 | | | | (22.58 | ) | | | 7 | | | | 1.62 | | | | 1.86 | | | | (0.51 | ) | | | 65 | | | |
| |
|
| | 13.54 | | | | (3.07 | ) | | | 115,431 | | | | 1.48 | | | | 1.51 | | | | (0.70 | ) | | | 71 | | | |
| | 12.88 | | | | (3.79 | ) | | | 1,457 | | | | 2.23 | | | | 2.26 | | | | (1.46 | ) | | | 71 | | | |
| | 12.85 | | | | (3.86 | ) | | | 2,300 | | | | 2.23 | | | | 2.26 | | | | (1.46 | ) | | | 71 | | | |
| | 13.85 | | | | (2.68 | ) | | | 183,809 | | | | 1.08 | | | | 1.11 | | | | (0.30 | ) | | | 71 | | | |
| | 13.55 | | | | (5.34 | ) | | | 9 | | | | 1.23 | (d) | | | 1.26 | (d) | | | (0.49 | )(d) | | | 71 | | | |
| | 13.51 | | | | (5.62 | ) | | | 9 | | | | 1.73 | (d) | | | 1.76 | (d) | | | (0.93 | )(d) | | | 71 | | | |
| |
|
| | 15.01 | | | | 19.66 | | | | 92,015 | | | | 1.48 | | | | 1.54 | | | | (0.43 | ) | | | 50 | | | |
| | 14.43 | | | | 18.74 | | | | 997 | | | | 2.23 | | | | 2.29 | | | | (1.14 | ) | | | 50 | | | |
| | 14.41 | | | | 18.77 | | | | 797 | | | | 2.23 | | | | 2.29 | | | | (1.19 | ) | | | 50 | | | |
| | 15.27 | | | | 20.10 | | | | 190,603 | | | | 1.08 | | | | 1.14 | | | | — | (f) | | | 50 | | | |
| |
|
The accompanying notes are an integral part of these financial statements. 87
GOLDMAN SACHS FLEXIBLE CAP GROWTH FUND
Financial Highlights
Selected Data for a Share Outstanding Throughout Each Period
| | | | | | | | | | | | | | | | | | | | | | | |
| | | | | Income (loss) from
| | | | |
| | | | | investment operations | | | | |
| | | | |
| | | | | | Distributions
| | |
| | | Net asset
| |
| | | | | | to shareholders
| | |
| | | value,
| | Net
| | Net realized
| | Total from
| | from net
| | |
| | | beginning
| | investment
| | and unrealized
| | investment
| | realized
| | |
| Year - Share Class | | of period | | income (loss)(a) | | gain (loss) | | operations | | gains | | |
| |
FOR THE SIX MONTHS ENDED FEBRUARY 29, (UNAUDITED) |
| 2012 - A | | $ | 10.38 | | | $ | (0.01 | ) | | $ | 1.36 | | | $ | 1.35 | | | $ | (0.59 | ) | | |
| 2012 - C | | | 10.12 | | | | (0.05 | ) | | | 1.33 | | | | 1.28 | | | | (0.59 | ) | | |
| 2012 - Institutional | | | 10.55 | | | | 0.01 | | | | 1.39 | | | | 1.40 | | | | (0.59 | ) | | |
| 2012 - IR | | | 10.49 | | | | — | (d) | | | 1.39 | | | | 1.39 | | | | (0.59 | ) | | |
| 2012 - R | | | 10.30 | | | | (0.02 | ) | | | 1.35 | | | | 1.33 | | | | (0.59 | ) | | |
| | | | | | | | | | | | | | | | | | | | | | | |
| | | | | | | | | | | | | | | | | | | | | | | |
FOR THE FISCAL YEARS ENDED AUGUST 31, |
| 2011 - A | | | 9.41 | | | | (0.04 | ) | | | 1.51 | | | | 1.47 | | | | (0.50 | ) | | |
| 2011 - C | | | 9.25 | | | | (0.12 | ) | | | 1.49 | | | | 1.37 | | | | (0.50 | ) | | |
| 2011 - Institutional | | | 9.53 | | | | — | (d) | | | 1.52 | | | | 1.52 | | | | (0.50 | ) | | |
| 2011 - IR | | | 9.49 | | | | — | (d) | | | 1.50 | | | | 1.50 | | | | (0.50 | ) | | |
| 2011 - R | | | 9.37 | | | | (0.07 | ) | | | 1.50 | | | | 1.43 | | | | (0.50 | ) | | |
| |
|
| 2010 - A | | | 8.83 | | | | (0.03 | ) | | | 0.61 | | | | 0.58 | | | | — | | | |
| 2010 - C | | | 8.75 | | | | (0.11 | ) | | | 0.61 | | | | 0.50 | | | | — | | | |
| 2010 - Institutional | | | 8.90 | | | | — | (d) | | | 0.63 | | | | 0.63 | | | | — | | | |
| 2010 - IR | | | 8.88 | | | | (0.01 | ) | | | 0.62 | | | | 0.61 | | | | — | | | |
| 2010 - R | | | 8.81 | | | | (0.06 | ) | | | 0.62 | | | | 0.56 | | | | — | | | |
| |
|
| 2009 - A | | | 10.64 | | | | (0.02 | ) | | | (1.71 | ) | | | (1.73 | ) | | | (0.08 | ) | | |
| 2009 - C | | | 10.60 | | | | (0.08 | ) | | | (1.69 | ) | | | (1.77 | ) | | | (0.08 | ) | | |
| 2009 - Institutional | | | 10.67 | | | | 0.01 | | | | (1.70 | ) | | | (1.69 | ) | | | (0.08 | ) | | |
| 2009 - IR | | | 10.66 | | | | (0.01 | ) | | | (1.69 | ) | | | (1.70 | ) | | | (0.08 | ) | | |
| 2009 - R | | | 10.62 | | | | (0.04 | ) | | | (1.69 | ) | | | (1.73 | ) | | | (0.08 | ) | | |
| | | | | | | | | | | | | | | | | | | | | | | |
| | | | | | | | | | | | | | | | | | | | | | | |
FOR THE PERIOD ENDED AUGUST 31, |
| 2008 - A (Commenced January 31, 2008) | | | 10.00 | | | | (0.03 | ) | | | 0.67 | | | | 0.64 | | | | — | | | |
| 2008 - C (Commenced January 31, 2008) | | | 10.00 | | | | (0.08 | ) | | | 0.68 | | | | 0.60 | | | | — | | | |
| 2008 - Institutional (Commenced January 31, 2008) | | | 10.00 | | | | (0.01 | ) | | | 0.68 | | | | 0.67 | | | | — | | | |
| 2008 - IR (Commenced January 31, 2008) | | | 10.00 | | | | (0.02 | ) | | | 0.68 | | | | 0.66 | | | | — | | | |
| 2008 - R (Commenced January 31, 2008) | | | 10.00 | | | | (0.05 | ) | | | 0.67 | | | | 0.62 | | | | — | | | |
| |
|
| | |
| (a) | | Calculated based on the average shares outstanding methodology. |
| (b) | | Assumes investment at the net asset value at the beginning of the period, reinvestment of all dividends and distributions, a complete redemption of the investment at the net asset value at the end of the period and no sales or redemption charges. Total returns would be reduced if a sales or redemption charge was taken into account. Returns do not reflect the deduction of taxes that a shareholder would pay on Fund distributions or the redemption of Fund shares. Total returns for periods less than one full year are not annualized. |
| (c) | | Annualized. |
| (d) | | Amount is less than $0.005 per share. |
88 The accompanying notes are an integral part of these financial statements.
GOLDMAN SACHS FLEXIBLE CAP GROWTH FUND
| | | | | | | | | | | | | | | | | | | | | | | | | | | | | |
| | | | | | | | | | |
| | | | |
| | | | | | | | | | |
| | | | |
| | | | | | | | | | | Ratio of
| | | | |
| | | | | Net assets,
| | Ratio of
| | Ratio of
| | net investment
| | | | |
Net asset
| | | | end of
| | net expenses
| | total expenses
| | income (loss)
| | Portfolio
| | |
value, end
| | Total
| | period
| | to average
| | to average
| | to average
| | turnover
| | |
| of period | | return(b) | | (in 000s) | | net assets | | net assets | | net assets | | rate | | |
| |
| |
| $ | 11.14 | | | | 13.69 | % | | $ | 8,201 | | | | 1.26 | %(c) | | | 3.08 | %(c) | | | (0.24 | )%(c) | | | 17 | % | | |
| | 10.81 | | | | 13.35 | | | | 1,077 | | | | 2.01 | (c) | | | 3.83 | (c) | | | (0.96 | )(c) | | | 17 | | | |
| | 11.36 | | | | 13.95 | | | | 4,700 | | | | 0.86 | (c) | | | 2.68 | (c) | | | 0.18 | (c) | | | 17 | | | |
| | 11.29 | | | | 13.93 | | | | 132 | | | | 1.01 | (c) | | | 2.83 | (c) | | | 0.03 | (c) | | | 17 | | | |
| | 11.04 | | | | 13.60 | | | | 184 | | | | 1.51 | (c) | | | 3.33 | (c) | | | (0.41 | )(c) | | | 17 | | | |
| | | | | | | | | | | | | | | | | | | | | | | | | | | | | |
| | | | | | | | | | | | | | | | | | | | | | | | | | | | | |
| |
| | 10.38 | | | | 15.42 | | | | 15,853 | | | | 1.34 | | | | 2.59 | | | | (0.37 | ) | | | 51 | | | |
| | 10.12 | | | | 14.58 | | | | 974 | | | | 2.09 | | | | 3.34 | | | | (1.10 | ) | | | 51 | | | |
| | 10.55 | | | | 15.77 | | | | 4,142 | | | | 0.94 | | | | 2.19 | | | | 0.04 | | | | 51 | | | |
| | 10.49 | | | | 15.62 | | | | 116 | | | | 1.09 | | | | 2.34 | | | | (0.04 | ) | | | 51 | | | |
| | 10.30 | | | | 15.05 | | | | 11 | | | | 1.59 | | | | 2.84 | | | | (0.61 | ) | | | 51 | | | |
| |
|
| | 9.41 | | | | 6.57 | | | | 14,952 | | | | 1.35 | | | | 2.91 | | | | (0.35 | ) | | | 61 | | | |
| | 9.25 | | | | 5.71 | | | | 650 | | | | 2.10 | | | | 3.66 | | | | (1.10 | ) | | | 61 | | | |
| | 9.53 | | | | 7.08 | | | | 3,145 | | | | 0.95 | | | | 2.51 | | | | 0.04 | | | | 61 | | | |
| | 9.49 | | | | 6.87 | | | | 43 | | | | 1.10 | | | | 2.66 | | | | (0.10 | ) | | | 61 | | | |
| | 9.37 | | | | 6.36 | | | | 10 | | | | 1.60 | | | | 3.16 | | | | (0.59 | ) | | | 61 | | | |
| |
|
| | 8.83 | | | | (16.03 | ) | | | 11,162 | | | | 1.38 | | | | 7.98 | | | | (0.25 | ) | | | 56 | | | |
| | 8.75 | | | | (16.47 | ) | | | 392 | | | | 2.13 | | | | 8.73 | | | | (1.02 | ) | | | 56 | | | |
| | 8.90 | | | | (15.60 | ) | | | 4,256 | | | | 0.98 | | | | 7.58 | | | | 0.11 | | | | 56 | | | |
| | 8.88 | | | | (15.71 | ) | | | 9 | | | | 1.13 | | | | 7.73 | | | | (0.08 | ) | | | 56 | | | |
| | 8.81 | | | | (16.14 | ) | | | 9 | | | | 1.63 | | | | 8.23 | | | | (0.57 | ) | | | 56 | | | |
| | | | | | | | | | | | | | | | | | | | | | | | | | | | | |
| | | | | | | | | | | | | | | | | | | | | | | | | | | | | |
| |
| | 10.64 | | | | 6.50 | | | | 2,262 | | | | 1.45 | (c) | | | 20.95 | (c) | | | (0.54 | )(c) | | | 41 | | | |
| | 10.60 | | | | 6.10 | | | | 62 | | | | 2.20 | (c) | | | 21.70 | (c) | | | (1.37 | )(c) | | | 41 | | | |
| | 10.67 | | | | 6.80 | | | | 2,322 | | | | 1.05 | (c) | | | 20.55 | (c) | | | (0.22 | )(c) | | | 41 | | | |
| | 10.66 | | | | 6.70 | | | | 11 | | | | 1.20 | (c) | | | 20.70 | (c) | | | (0.36 | )(c) | | | 41 | | | |
| | 10.62 | | | | 6.40 | | | | 11 | | | | 1.70 | (c) | | | 21.20 | (c) | | | (0.87 | )(c) | | | 41 | | | |
| |
|
The accompanying notes are an integral part of these financial statements. 89
GOLDMAN SACHS FOCUSED GROWTH FUND
Financial Highlights
Selected Data for a Share Outstanding Throughout the Period
| | | | | | | | | | | | | | | | | | | |
| | | | | Income (loss) from
| | |
| | | | | investment operations | | |
| | | | |
| | | | | | |
| | | Net asset
| |
| | | | | | |
| | | value,
| | Net
| | Net realized
| | Total from
| | |
| | | beginning
| | investment
| | and unrealized
| | investment
| | |
| Year - Share Class | | of period | | income (loss)(a) | | gain | | operations | | |
| |
FOR THE PERIOD ENDED FEBRUARY 29, (UNAUDITED) |
| 2012 - A (Commenced January 31, 2012) | | $ | 10.00 | | | $ | — | (d) | | $ | 0.65 | | | $ | 0.65 | | | |
| 2012 - C (Commenced January 31, 2012) | | | 10.00 | | | | (0.01 | ) | | | 0.66 | | | | 0.65 | | | |
| 2012 - Institutional (Commenced January 31, 2012) | | | 10.00 | | | | — | (d) | | | 0.65 | | | | 0.65 | | | |
| 2012 - IR (Commenced January 31, 2012) | | | 10.00 | | | | — | (d) | | | 0.65 | | | | 0.65 | | | |
| 2012 - R (Commenced January 31, 2012) | | | 10.00 | | | | — | (d) | | | 0.65 | | | | 0.65 | | | |
| |
|
| | |
| (a) | | Calculated based on the average shares outstanding methodology. |
| (b) | | Assumes investment at the net asset value at the beginning of the period, reinvestment of all dividends and distributions, a complete redemption of the investment at the net asset value at the end of the period and no sales or redemption charges. Total returns would be reduced if a sales or redemption charge was taken into account. Returns do not reflect the deduction of taxes that a shareholder would pay on Fund distributions or the redemption of Fund shares. Total returns for periods less than one full year are not annualized. |
| (c) | | Annualized. |
| (d) | | Amount is less than $0.005 per share. |
90 The accompanying notes are an integral part of these financial statements.
GOLDMAN SACHS FOCUSED GROWTH FUND
| | | | | | | | | | | | | | | | | | | | | | | | | | | | | |
| | | | | | | | | | |
| | | | |
| | | | | | | | | | |
| | | | |
| | | | | | | | | | | Ratio of
| | | | |
| | | | | Net assets,
| | Ratio of
| | Ratio of
| | net investment
| | | | |
Net asset
| | | | end of
| | net expenses
| | total expenses
| | income (loss)
| | Portfolio
| | |
value, end
| | Total
| | period
| | to average
| | to average
| | to average
| | turnover
| | |
| of period | | return(b) | | (in 000s) | | net assets(c) | | net assets(c) | | net assets(c) | | rate | | |
| |
| |
| $ | 10.65 | | | | 6.50 | % | | $ | 11 | | | | 1.24 | % | | | 30.16 | % | | | (0.30 | )% | | | 1 | % | | |
| | 10.65 | | | | 6.50 | | | | 11 | | | | 1.99 | | | | 30.91 | | | | (1.07 | ) | | | 1 | | | |
| | 10.65 | | | | 6.50 | | | | 2,394 | | | | 0.84 | | | | 29.76 | | | | 0.11 | | | | 1 | | | |
| | 10.65 | | | | 6.50 | | | | 11 | | | | 0.99 | | | | 29.91 | | | | (0.02 | ) | | | 1 | | | |
| | 10.65 | | | | 6.50 | | | | 11 | | | | 1.49 | | | | 30.41 | | | | (0.55 | ) | | | 1 | | | |
| |
|
The accompanying notes are an integral part of these financial statements. 91
GOLDMAN SACHS GROWTH OPPORTUNITIES FUND
Financial Highlights
Selected Data for a Share Outstanding Throughout Each Period
| | | | | | | | | | | | | | | | | | | | | | | |
| | | | | Income (loss) from
| | | | |
| | | | | investment operations | | | | |
| | | | |
| | | | | | Distribution
| | |
| | | Net asset
| |
| | | | | | to shareholders
| | |
| | | value,
| | Net
| | Net realized
| | Total from
| | from net
| | |
| | | beginning
| | investment
| | and unrealized
| | investment
| | realized
| | |
| Year - Share Class | | of period | | loss(a) | | gain (loss) | | operations | | gains | | |
| |
FOR THE SIX MONTHS ENDED FEBRUARY 29, (UNAUDITED) |
| 2012 - A | | $ | 21.36 | | | $ | (0.07 | ) | | $ | 3.54 | | | $ | 3.47 | | | $ | (1.39 | ) | | |
| 2012 - B | | | 19.16 | | | | (0.13 | ) | | | 3.15 | | | | 3.02 | | | | (1.39 | ) | | |
| 2012 - C | | | 18.99 | | | | (0.13 | ) | | | 3.12 | | | | 2.99 | | | | (1.39 | ) | | |
| 2012 - Institutional | | | 22.71 | | | | (0.03 | ) | | | 3.79 | | | | 3.76 | | | | (1.39 | ) | | |
| 2012 - Service | | | 21.01 | | | | (0.08 | ) | | | 3.48 | | | | 3.40 | | | | (1.39 | ) | | |
| 2012 - IR | | | 21.57 | | | | (0.04 | ) | | | 3.58 | | | | 3.54 | | | | (1.39 | ) | | |
| 2012 - R | | | 21.17 | | | | (0.09 | ) | | | 3.50 | | | | 3.41 | | | | (1.39 | ) | | |
| | | | | | | | | | | | | | | | | | | | | | | |
| | | | | | | | | | | | | | | | | | | | | | | |
FOR THE FISCAL YEARS ENDED AUGUST 31, |
| 2011 - A | | | 19.09 | | | | (0.16 | ) | | | 2.65 | | | | 2.49 | | | | (0.22 | ) | | |
| 2011 - B | | | 17.27 | | | | (0.30 | ) | | | 2.41 | | | | 2.11 | | | | (0.22 | ) | | |
| 2011 - C | | | 17.11 | | | | (0.30 | ) | | | 2.40 | | | | 2.10 | | | | (0.22 | ) | | |
| 2011 - Institutional | | | 20.21 | | | | (0.07 | ) | | | 2.79 | | | | 2.72 | | | | (0.22 | ) | | |
| 2011 - Service | | | 18.80 | | | | (0.18 | ) | | | 2.61 | | | | 2.43 | | | | (0.22 | ) | | |
| 2011 - IR | | | 19.23 | | | | (0.10 | ) | | | 2.66 | | | | 2.56 | | | | (0.22 | ) | | |
| 2011 - R | | | 18.97 | | | | (0.22 | ) | | | 2.64 | | | | 2.42 | | | | (0.22 | ) | | |
| |
|
| 2010 - A | | | 16.91 | | | | (0.15 | ) | | | 2.33 | | | | 2.18 | | | | — | | | |
| 2010 - B | | | 15.42 | | | | (0.26 | ) | | | 2.11 | | | | 1.85 | | | | — | | | |
| 2010 - C | | | 15.28 | | | | (0.26 | ) | | | 2.09 | | | | 1.83 | | | | — | | | |
| 2010 - Institutional | | | 17.83 | | | | (0.07 | ) | | | 2.45 | | | | 2.38 | | | | — | | | |
| 2010 - Service | | | 16.67 | | | | (0.16 | ) | | | 2.29 | | | | 2.13 | | | | — | | | |
| 2010 - IR | | | 16.99 | | | | (0.10 | ) | | | 2.34 | | | | 2.24 | | | | — | | | |
| 2010 - R | | | 16.85 | | | | (0.19 | ) | | | 2.31 | | | | 2.12 | | | | — | | | |
| |
|
| 2009 - A | | | 21.68 | | | | (0.08 | ) | | | (3.65 | ) | | | (3.73 | ) | | | (1.04 | ) | | |
| 2009 - B | | | 20.06 | | | | (0.18 | ) | | | (3.42 | ) | | | (3.60 | ) | | | (1.04 | ) | | |
| 2009 - C | | | 19.89 | | | | (0.17 | ) | | | (3.40 | ) | | | (3.57 | ) | | | (1.04 | ) | | |
| 2009 - Institutional | | | 22.67 | | | | (0.03 | ) | | | (3.77 | ) | | | (3.80 | ) | | | (1.04 | ) | | |
| 2009 - Service | | | 21.41 | | | | (0.11 | ) | | | (3.59 | ) | | | (3.70 | ) | | | (1.04 | ) | | |
| 2009 - IR | | | 21.72 | | | | (0.07 | ) | | | (3.62 | ) | | | (3.69 | ) | | | (1.04 | ) | | |
| 2009 - R | | | 21.65 | | | | (0.14 | ) | | | (3.62 | ) | | | (3.76 | ) | | | (1.04 | ) | | |
| |
|
| 2008 - A | | | 25.20 | | | | (0.12 | ) | | | (0.02 | ) | | | (0.14 | ) | | | (3.38 | ) | | |
| 2008 - B | | | 23.72 | | | | (0.27 | ) | | | (0.01 | ) | | | (0.28 | ) | | | (3.38 | ) | | |
| 2008 - C | | | 23.55 | | | | (0.27 | ) | | | (0.01 | ) | | | (0.28 | ) | | | (3.38 | ) | | |
| 2008 - Institutional | | | 26.11 | | | | (0.03 | ) | | | (0.03 | ) | | | (0.06 | ) | | | (3.38 | ) | | |
| 2008 - Service | | | 24.95 | | | | (0.14 | ) | | | (0.02 | ) | | | (0.16 | ) | | | (3.38 | ) | | |
| 2008 - IR (Commenced November 30, 2007) | | | 25.44 | | | | (0.06 | ) | | | (0.28 | ) | | | (0.34 | ) | | | (3.38 | ) | | |
| 2008 - R (Commenced November 30, 2007) | | | 25.44 | | | | (0.13 | ) | | | (0.28 | ) | | | (0.41 | ) | | | (3.38 | ) | | |
| |
|
| 2007 - A | | | 20.81 | | | | (0.21 | ) | | | 5.77 | | | | 5.56 | | | | (1.17 | ) | | |
| 2007 - B | | | 19.80 | | | | (0.36 | ) | | | 5.45 | | | | 5.09 | | | | (1.17 | ) | | |
| 2007 - C | | | 19.66 | | | | (0.36 | ) | | | 5.42 | | | | 5.06 | | | | (1.17 | ) | | |
| 2007 - Institutional | | | 21.45 | | | | (0.12 | ) | | | 5.95 | | | | 5.83 | | | | (1.17 | ) | | |
| 2007 - Service | | | 20.63 | | | | (0.23 | ) | | | 5.72 | | | | 5.49 | | | | (1.17 | ) | | |
| |
|
| | |
| (a) | | Calculated based on the average shares outstanding methodology. |
| (b) | | Assumes investment at the net asset value at the beginning of the period, reinvestment of all dividends and distributions, a complete redemption of the investment at the net asset value at the end of the period and no sales or redemption charges. Total returns would be reduced if a sales or redemption charge was taken into account. Returns do not reflect the deduction of taxes that a shareholder would pay on Fund distributions or the redemption of Fund shares. Total returns for periods less than one full year are not annualized. |
| (c) | | Annualized. |
| (d) | | Portfolio turnover rates exclude portfolio securities received as a result of in-kind redemptions. |
92 The accompanying notes are an integral part of these financial statements.
GOLDMAN SACHS GROWTH OPPORTUNITIES FUND
| | | | | | | | | | | | | | | | | | | | | | | | | | | | | |
| | | | | | | | | | |
| | | | |
| | | | | | | | | | |
| | | | |
| | | | | | | | | | | Ratio of
| | | | |
| | | | | Net assets,
| | Ratio of
| | Ratio of
| | net investment
| | | | |
Net asset
| | | | end of
| | net expenses
| | total expenses
| | loss
| | Portfolio
| | |
value, end
| | Total
| | period
| | to average
| | to average
| | to average
| | turnover
| | |
| of period | | return(b) | | (in 000s) | | net assets | | net assets | | net assets | | rate | | |
| |
| |
| $ | 23.44 | | | | 17.01 | % | | $ | 1,079,134 | | | | 1.35 | %(c) | | | 1.42 | %(c) | | | (0.65 | )%(c) | | | 29 | % | | |
| | 20.79 | | | | 16.60 | | | | 15,088 | | | | 2.10 | (c) | | | 2.17 | (c) | | | (1.40 | )(c) | | | 29 | | | |
| | 20.59 | | | | 16.59 | | | | 163,811 | | | | 2.10 | (c) | | | 2.17 | (c) | | | (1.40 | )(c) | | | 29 | | | |
| | 25.08 | | | | 17.28 | | | | 3,038,403 | | | | 0.95 | (c) | | | 1.02 | (c) | | | (0.25 | )(c) | | | 29 | | | |
| | 23.02 | | | | 16.96 | | | | 60,775 | | | | 1.45 | (c) | | | 1.52 | (c) | | | (0.75 | )(c) | | | 29 | | | |
| | 23.72 | | | | 17.17 | | | | 65,484 | | | | 1.10 | (c) | | | 1.17 | (c) | | | (0.40 | )(c) | | | 29 | | | |
| | 23.19 | | | | 16.87 | | | | 48,351 | | | | 1.60 | (c) | | | 1.67 | (c) | | | (0.89 | )(c) | | | 29 | | | |
| | | | | | | | | | | | | | | | | | | | | | | | | | | | | |
| | | | | | | | | | | | | | | | | | | | | | | | | | | | | |
| |
| | 21.36 | | | | 12.97 | | | | 1,060,320 | | | | 1.36 | | | | 1.41 | | | | (0.70 | ) | | | 71 | (d) | | |
| | 19.16 | | | | 12.13 | | | | 16,380 | | | | 2.11 | | | | 2.16 | | | | (1.46 | ) | | | 71 | (d) | | |
| | 18.99 | | | | 12.18 | | | | 158,371 | | | | 2.11 | | | | 2.16 | | | | (1.46 | ) | | | 71 | (d) | | |
| | 22.71 | | | | 13.39 | | | | 2,843,584 | | | | 0.96 | | | | 1.01 | | | | (0.30 | ) | | | 71 | (d) | | |
| | 21.01 | | | | 12.85 | | | | 57,002 | | | | 1.46 | | | | 1.51 | | | | (0.81 | ) | | | 71 | (d) | | |
| | 21.57 | | | | 13.24 | | | | 54,912 | | | | 1.11 | | | | 1.16 | | | | (0.43 | ) | | | 71 | (d) | | |
| | 21.17 | | | | 12.68 | | | | 33,931 | | | | 1.61 | | | | 1.66 | | | | (0.94 | ) | | | 71 | (d) | | |
| |
|
| | 19.09 | | | | 12.89 | | | | 799,256 | | | | 1.37 | | | | 1.44 | | | | (0.76 | ) | | | 57 | (d) | | |
| | 17.27 | | | | 12.00 | | | | 21,174 | | | | 2.12 | | | | 2.19 | | | | (1.51 | ) | | | 57 | (d) | | |
| | 17.11 | | | | 11.98 | | | | 129,009 | | | | 2.12 | | | | 2.19 | | | | (1.51 | ) | | | 57 | (d) | | |
| | 20.21 | | | | 13.35 | | | | 2,216,786 | | | | 0.97 | | | | 1.04 | | | | (0.35 | ) | | | 57 | (d) | | |
| | 18.80 | | | | 12.78 | | | | 60,893 | | | | 1.47 | | | | 1.54 | | | | (0.86 | ) | | | 57 | (d) | | |
| | 19.23 | | | | 13.18 | | | | 12,823 | | | | 1.12 | | | | 1.19 | | | | (0.49 | ) | | | 57 | (d) | | |
| | 18.97 | | | | 12.58 | | | | 7,954 | | | | 1.62 | | | | 1.69 | | | | (0.97 | ) | | | 57 | (d) | | |
| |
|
| | 16.91 | | | | (15.03 | ) | | | 641,989 | | | | 1.45 | | | | 1.50 | | | | (0.58 | ) | | | 78 | | | |
| | 15.42 | | | | (15.64 | ) | | | 27,191 | | | | 2.20 | | | | 2.25 | | | | (1.33 | ) | | | 78 | | | |
| | 15.28 | | | | (15.62 | ) | | | 85,240 | | | | 2.20 | | | | 2.25 | | | | (1.33 | ) | | | 78 | | | |
| | 17.83 | | | | (14.66 | ) | | | 1,257,148 | | | | 1.05 | | | | 1.10 | | | | (0.19 | ) | | | 78 | | | |
| | 16.67 | | | | (15.08 | ) | | | 30,614 | | | | 1.55 | | | | 1.60 | | | | (0.74 | ) | | | 78 | | | |
| | 16.99 | | | | (14.81 | ) | | | 1,382 | | | | 1.20 | | | | 1.25 | | | | (0.46 | ) | | | 78 | | | |
| | 16.85 | | | | (15.20 | ) | | | 934 | | | | 1.70 | | | | 1.75 | | | | (0.94 | ) | | | 78 | | | |
| |
|
| | 21.68 | | | | (1.25 | ) | | | 851,222 | | | | 1.47 | | | | 1.47 | | | | (0.54 | ) | | | 81 | | | |
| | 20.06 | | | | (1.99 | ) | | | 48,770 | | | | 2.22 | | | | 2.22 | | | | (1.28 | ) | | | 81 | | | |
| | 19.89 | | | | (2.00 | ) | | | 116,837 | | | | 2.22 | | | | 2.22 | | | | (1.29 | ) | | | 81 | | | |
| | 22.67 | | | | (0.87 | ) | | | 938,726 | | | | 1.07 | | | | 1.07 | | | | (0.14 | ) | | | 81 | | | |
| | 21.41 | | | | (1.35 | ) | | | 10,601 | | | | 1.57 | | | | 1.57 | | | | (0.64 | ) | | | 81 | | | |
| | 21.72 | | | | (2.01 | ) | | | 10 | | | | 1.22 | (c) | | | 1.22 | (c) | | | (0.35 | )(c) | | | 81 | | | |
| | 21.65 | | | | (2.32 | ) | | | 10 | | | | 1.72 | (c) | | | 1.72 | (c) | | | (0.81 | )(c) | | | 81 | | | |
| |
|
| | 25.20 | | | | 27.46 | | | | 954,089 | | | | 1.47 | | | | 1.48 | | | | (0.90 | ) | | | 67 | | | |
| | 23.72 | | | | 26.45 | | | | 64,011 | | | | 2.22 | | | | 2.23 | | | | (1.66 | ) | | | 67 | | | |
| | 23.55 | | | | 26.49 | | | | 126,425 | | | | 2.22 | | | | 2.23 | | | | (1.65 | ) | | | 67 | | | |
| | 26.11 | | | | 27.92 | | | | 853,836 | | | | 1.07 | | | | 1.08 | | | | (0.50 | ) | | | 67 | | | |
| | 24.95 | | | | 27.36 | | | | 11,597 | | | | 1.57 | | | | 1.58 | | | | (1.00 | ) | | | 67 | | | |
| |
|
The accompanying notes are an integral part of these financial statements. 93
GOLDMAN SACHS SMALL/MID CAP GROWTH FUND
Financial Highlights
Selected Data for a Share Outstanding Throughout Each Period
| | | | | | | | | | | | | | | | | | | | | | | |
| | | | | Income (loss) from
| | | | |
| | | | | investment operations | | | | |
| | | | |
| | | | | | Distributions to
| | |
| | | Net asset
| |
| | | | | | shareholders
| | |
| | | value,
| | Net
| | Net realized
| | Total from
| | from net
| | |
| | | beginning
| | investment
| | and unrealized
| | investment
| | realized
| | |
| Year - Share Class | | of period | | loss(a) | | gain (loss) | | operations | | gains | | |
| |
FOR THE SIX MONTHS ENDED FEBRUARY 29, (UNAUDITED) |
| 2012 - A | | $ | 13.67 | | | $ | (0.06 | ) | | $ | 2.25 | | | $ | 2.19 | | | $ | (0.66 | ) | | |
| 2012 - B | | | 12.98 | | | | (0.10 | ) | | | 2.12 | | | | 2.02 | | | | (0.66 | ) | | |
| 2012 - C | | | 12.98 | | | | (0.10 | ) | | | 2.11 | | | | 2.01 | | | | (0.66 | ) | | |
| 2012 - Institutional | | | 13.98 | | | | (0.03 | ) | | | 2.30 | | | | 2.27 | | | | (0.66 | ) | | |
| 2012 - Service | | | 13.53 | | | | (0.06 | ) | | | 2.22 | | | | 2.16 | | | | (0.66 | ) | | |
| 2012 - IR | | | 13.81 | | | | (0.04 | ) | | | 2.27 | | | | 2.23 | | | | (0.66 | ) | | |
| 2012 - R | | | 13.55 | | | | (0.07 | ) | | | 2.22 | | | | 2.15 | | | | (0.66 | ) | | |
| | | | | | | | | | | | | | | | | | | | | | | |
| | | | | | | | | | | | | | | | | | | | | | | |
FOR THE FISCAL YEARS ENDED AUGUST 31, |
| 2011 - A | | | 12.08 | | | | (0.15 | ) | | | 2.01 | | | | 1.86 | | | | (0.27 | ) | | |
| 2011 - B | | | 11.57 | | | | (0.24 | ) | | | 1.92 | | | | 1.68 | | | | (0.27 | ) | | |
| 2011 - C | | | 11.56 | | | | (0.24 | ) | | | 1.93 | | | | 1.69 | | | | (0.27 | ) | | |
| 2011 - Institutional | | | 12.30 | | | | (0.09 | ) | | | 2.04 | | | | 1.95 | | | | (0.27 | ) | | |
| 2011 - Service | | | 11.97 | | | | (0.16 | ) | | | 1.99 | | | | 1.83 | | | | (0.27 | ) | | |
| 2011 - IR | | | 12.17 | | | | (0.10 | ) | | | 2.01 | | | | 1.91 | | | | (0.27 | ) | | |
| 2011 - R | | | 12.01 | | | | (0.18 | ) | | | 1.99 | | | | 1.81 | | | | (0.27 | ) | | |
| |
|
| 2010 - A | | | 10.63 | | | | (0.12 | ) | | | 1.57 | | | | 1.45 | | | | — | | | |
| 2010 - B | | | 10.25 | | | | (0.20 | ) | | | 1.52 | | | | 1.32 | | | | — | | | |
| 2010 - C | | | 10.25 | | | | (0.21 | ) | | | 1.52 | | | | 1.31 | | | | — | | | |
| 2010 - Institutional | | | 10.78 | | | | (0.07 | ) | | | 1.59 | | | | 1.52 | | | | — | | | |
| 2010 - Service | | | 10.54 | | | | (0.13 | ) | | | 1.56 | | | | 1.43 | | | | — | | | |
| 2010 - IR | | | 10.68 | | | | (0.09 | ) | | | 1.58 | | | | 1.49 | | | | — | | | |
| 2010 - R | | | 10.59 | | | | (0.15 | ) | | | 1.57 | | | | 1.42 | | | | — | | | |
| |
|
| 2009 - A | | | 12.25 | | | | (0.05 | ) | | | (1.57 | ) | | | (1.62 | ) | | | — | | | |
| 2009 - B | | | 11.90 | | | | (0.11 | ) | | | (1.54 | ) | | | (1.65 | ) | | | — | | | |
| 2009 - C | | | 11.90 | | | | (0.11 | ) | | | (1.54 | ) | | | (1.65 | ) | | | — | | | |
| 2009 - Institutional | | | 12.37 | | | | (0.02 | ) | | | (1.57 | ) | | | (1.59 | ) | | | — | | | |
| 2009 - Service | | | 12.16 | | | | (0.06 | ) | | | (1.56 | ) | | | (1.62 | ) | | | — | | | |
| 2009 - IR | | | 12.27 | | | | (0.04 | ) | | | (1.55 | ) | | | (1.59 | ) | | | — | | | |
| 2009 - R | | | 12.22 | | | | (0.08 | ) | | | (1.55 | ) | | | (1.63 | ) | | | — | | | |
| |
|
| 2008 - A | | | 13.48 | | | | (0.09 | ) | | | (0.20 | ) | | | (0.29 | ) | | | (0.94 | )(d) | | |
| 2008 - B | | | 13.22 | | | | (0.18 | ) | | | (0.20 | ) | | | (0.38 | ) | | | (0.94 | )(d) | | |
| 2008 - C | | | 13.21 | | | | (0.18 | ) | | | (0.19 | ) | | | (0.37 | ) | | | (0.94 | )(d) | | |
| 2008 - Institutional | | | 13.55 | | | | (0.04 | ) | | | (0.20 | ) | | | (0.24 | ) | | | (0.94 | )(d) | | |
| 2008 - Service | | | 13.40 | | | | (0.10 | ) | | | (0.20 | ) | | | (0.30 | ) | | | (0.94 | )(d) | | |
| 2008 - IR (Commenced November 30, 2007) | | | 13.79 | | | | (0.04 | ) | | | (0.54 | ) | | | (0.58 | ) | | | (0.94 | )(d) | | |
| 2008 - R (Commenced November 30, 2007) | | | 13.79 | | | | (0.09 | ) | | | (0.54 | ) | | | (0.63 | ) | | | (0.94 | )(d) | | |
| |
|
| 2007 - A | | | 10.42 | | | | (0.11 | ) | | | 3.17 | | | | 3.06 | | | | — | | | |
| 2007 - B | | | 10.30 | | | | (0.20 | ) | | | 3.12 | | | | 2.92 | | | | — | | | |
| 2007 - C | | | 10.30 | | | | (0.20 | ) | | | 3.11 | | | | 2.91 | | | | — | | | |
| 2007 - Institutional | | | 10.44 | | | | (0.06 | ) | | | 3.17 | | | | 3.11 | | | | — | | | |
| 2007 - Service | | | 10.37 | | | | (0.12 | ) | | | 3.15 | | | | 3.03 | | | | — | | | |
| |
|
| | |
| (a) | | Calculated based on the average shares outstanding methodology. |
| (b) | | Assumes investment at the net asset value at the beginning of the period, reinvestment of all dividends and distributions, a complete redemption of the investment at the net asset value at the end of the period and no sales or redemption charges. Total returns would be reduced if a sales or redemption charge was taken into account. Returns do not reflect the deduction of taxes that a shareholder would pay on Fund distributions or the redemption of Fund shares. Total returns for periods less than one full year are not annualized. |
| (c) | | Annualized. |
| (d) | | Includes a distribution from capital of $0.01 per share. |
94 The accompanying notes are an integral part of these financial statements.
GOLDMAN SACHS SMALL/MID CAP GROWTH FUND
| | | | | | | | | | | | | | | | | | | | | | | | | | | | | |
| | | | | | | | | | |
| | | | |
| | | | | | | | | | |
| | | | |
| | | | | | | | | | | Ratio of
| | | | |
| | | | | Net assets,
| | Ratio of
| | Ratio of
| | net investment
| | | | |
Net asset
| | | | end of
| | net expenses
| | total expenses
| | loss
| | Portfolio
| | |
value, end
| | Total
| | period
| | to average
| | to average
| | to average
| | turnover
| | |
| of period | | return(b) | | (in 000s) | | net assets | | net assets | | net assets | | rate | | |
| |
| |
| $ | 15.20 | | | | 16.57 | % | | $ | 382,057 | | | | 1.35 | %(c) | | | 1.50 | %(c) | | | (0.82 | )%(c) | | | 29 | % | | |
| | 14.34 | | | | 16.13 | | | | 5,356 | | | | 2.10 | (c) | | | 2.25 | (c) | | | (1.57 | )(c) | | | 29 | | | |
| | 14.33 | | | | 16.06 | | | | 85,985 | | | | 2.10 | (c) | | | 2.25 | (c) | | | (1.57 | )(c) | | | 29 | | | |
| | 15.59 | | | | 16.79 | | | | 283,457 | | | | 0.95 | (c) | | | 1.10 | (c) | | | (0.42 | )(c) | | | 29 | | | |
| | 15.03 | | | | 16.53 | | | | 6,152 | | | | 1.45 | (c) | | | 1.60 | (c) | | | (0.91 | )(c) | | | 29 | | | |
| | 15.38 | | | | 16.70 | | | | 42,382 | | | | 1.10 | (c) | | | 1.25 | (c) | | | (0.55 | )(c) | | | 29 | | | |
| | 15.04 | | | | 16.42 | | | | 19,720 | | | | 1.60 | (c) | | | 1.75 | (c) | | | (1.06 | )(c) | | | 29 | | | |
| | | | | | | | | | | | | | | | | | | | | | | | | | | | | |
| | | | | | | | | | | | | | | | | | | | | | | | | | | | | |
| |
| | 13.67 | | | | 15.30 | | | | 403,960 | | | | 1.47 | | | | 1.50 | | | | (0.99 | ) | | | 53 | | | |
| | 12.98 | | | | 14.41 | | | | 5,343 | | | | 2.22 | | | | 2.25 | | | | (1.75 | ) | | | 53 | | | |
| | 12.98 | | | | 14.51 | | | | 79,875 | | | | 2.22 | | | | 2.25 | | | | (1.74 | ) | | | 53 | | | |
| | 13.98 | | | | 15.77 | | | | 340,712 | | | | 1.07 | | | | 1.10 | | | | (0.59 | ) | | | 53 | | | |
| | 13.53 | | | | 15.19 | | | | 5,879 | | | | 1.57 | | | | 1.60 | | | | (1.08 | ) | | | 53 | | | |
| | 13.81 | | | | 15.60 | | | | 30,858 | | | | 1.22 | | | | 1.25 | | | | (0.71 | ) | | | 53 | | | |
| | 13.55 | | | | 14.97 | | | | 15,370 | | | | 1.72 | | | | 1.75 | | | | (1.24 | ) | | | 53 | | | |
| |
|
| | 12.08 | | | | 13.64 | | | | 267,826 | | | | 1.50 | | | | 1.54 | | | | (0.98 | ) | | | 48 | | | |
| | 11.57 | | | | 12.88 | | | | 6,024 | | | | 2.25 | | | | 2.29 | | | | (1.73 | ) | | | 48 | | | |
| | 11.56 | | | | 12.78 | | | | 47,685 | | | | 2.25 | | | | 2.29 | | | | (1.73 | ) | | | 48 | | | |
| | 12.30 | | | | 14.10 | | | | 222,616 | | | | 1.10 | | | | 1.14 | | | | (0.58 | ) | | | 48 | | | |
| | 11.97 | | | | 13.57 | | | | 2,762 | | | | 1.60 | | | | 1.64 | | | | (1.07 | ) | | | 48 | | | |
| | 12.17 | | | | 13.95 | | | | 15,059 | | | | 1.25 | | | | 1.29 | | | | (0.72 | ) | | | 48 | | | |
| | 12.01 | | | | 13.41 | | | | 10,318 | | | | 1.75 | | | | 1.79 | | | | (1.23 | ) | | | 48 | | | |
| |
|
| | 10.63 | | | | (13.22 | ) | | | 122,262 | | | | 1.50 | | | | 1.68 | | | | (0.59 | ) | | | 55 | | | |
| | 10.25 | | | | (13.87 | ) | | | 4,882 | | | | 2.25 | | | | 2.43 | | | | (1.32 | ) | | | 55 | | | |
| | 10.25 | | | | (13.87 | ) | | | 18,220 | | | | 2.25 | | | | 2.43 | | | | (1.34 | ) | | | 55 | | | |
| | 10.78 | | | | (12.85 | ) | | | 103,383 | | | | 1.10 | | | | 1.28 | | | | (0.17 | ) | | | 55 | | | |
| | 10.54 | | | | (13.32 | ) | | | 1,196 | | | | 1.60 | | | | 1.78 | | | | (0.71 | ) | | | 55 | | | |
| | 10.68 | | | | (12.96 | ) | | | 131 | | | | 1.25 | | | | 1.43 | | | | (0.44 | ) | | | 55 | | | |
| | 10.59 | | | | (13.34 | ) | | | 533 | | | | 1.75 | | | | 1.93 | | | | (0.90 | ) | | | 55 | | | |
| |
|
| | 12.25 | | | | (2.65 | ) | | | 59,269 | | | | 1.50 | | | | 1.68 | | | | (0.73 | ) | | | 63 | | | |
| | 11.90 | | | | (3.42 | ) | | | 3,768 | | | | 2.25 | | | | 2.43 | | | | (1.49 | ) | | | 63 | | | |
| | 11.90 | | | | (3.34 | ) | | | 10,295 | | | | 2.25 | | | | 2.43 | | | | (1.50 | ) | | | 63 | | | |
| | 12.37 | | | | (2.25 | ) | | | 86,275 | | | | 1.10 | | | | 1.28 | | | | (0.35 | ) | | | 63 | | | |
| | 12.16 | | | | (2.75 | ) | | | 245 | | | | 1.60 | | | | 1.78 | | | | (0.84 | ) | | | 63 | | | |
| | 12.27 | | | | (4.69 | ) | | | 10 | | | | 1.25 | (c) | | | 1.43 | (c) | | | (0.48 | )(c) | | | 63 | | | |
| | 12.22 | | | | (5.08 | ) | | | 10 | | | | 1.75 | (c) | | | 1.93 | (c) | | | (0.98 | )(c) | | | 63 | | | |
| |
|
| | 13.48 | | | | 29.37 | | | | 26,423 | | | | 1.50 | | | | 1.64 | | | | (0.89 | ) | | | 68 | | | |
| | 13.22 | | | | 28.35 | | | | 2,477 | | | | 2.25 | | | | 2.39 | | | | (1.64 | ) | | | 68 | | | |
| | 13.21 | | | | 28.25 | | | | 6,472 | | | | 2.25 | | | | 2.39 | | | | (1.64 | ) | | | 68 | | | |
| | 13.55 | | | | 29.79 | | | | 76,637 | | | | 1.10 | | | | 1.24 | | | | (0.49 | ) | | | 68 | | | |
| | 13.40 | | | | 29.22 | | | | 129 | | | | 1.60 | | | | 1.74 | | | | (0.99 | ) | | | 68 | | | |
| |
|
The accompanying notes are an integral part of these financial statements. 95
GOLDMAN SACHS STRATEGIC GROWTH FUND
Financial Highlights
Selected Data for a Share Outstanding Throughout Each Period
| | | | | | | | | | | | | | | | | | | | | | | |
| | | | | Income (loss) from
| | | | |
| | | | | investment operations | | | | |
| | | | |
| | | | | | Distributions to
| | |
| | | Net asset
| |
| | | | | | shareholders
| | |
| | | value,
| | Net
| | Net realized
| | Total from
| | from net
| | |
| | | beginning
| | investment
| | and unrealized
| | investment
| | investment
| | |
| Year - Share Class | | of period | | income (loss)(a) | | gain (loss) | | operations | | income | | |
| |
FOR THE SIX MONTHS ENDED FEBRUARY 29, (UNAUDITED) |
| 2012 - A | | $ | 9.77 | | | $ | 0.01 | | | $ | 1.31 | | | $ | 1.32 | | | $ | (0.02 | ) | | |
| 2012 - B | | | 8.94 | | | | (0.03 | ) | | | 1.20 | | | | 1.17 | | | | — | | | |
| 2012 - C | | | 8.95 | | | | (0.03 | ) | | | 1.21 | | | | 1.18 | | | | — | | | |
| 2012 - Institutional | | | 10.14 | | | | 0.03 | | | | 1.36 | | | | 1.39 | | | | (0.06 | ) | | |
| 2012 - Service | | | 9.80 | | | | 0.01 | | | | 1.31 | | | | 1.32 | | | | (0.02 | ) | | |
| 2012 - IR | | | 10.10 | | | | 0.02 | | | | 1.36 | | | | 1.38 | | | | — | | | |
| 2012 - R | | | 9.74 | | | | — | (d) | | | 1.31 | | | | 1.31 | | | | — | | | |
| | | | | | | | | | | | | | | | | | | | | | | |
| | | | | | | | | | | | | | | | | | | | | | | |
FOR THE FISCAL YEARS ENDED AUGUST 31, |
| 2011 - A | | | 8.53 | | | | 0.02 | | | | 1.25 | | | | 1.27 | | | | (0.03 | ) | | |
| 2011 - B | | | 7.84 | | | | (0.05 | ) | | | 1.15 | | | | 1.10 | | | | — | | | |
| 2011 - C | | | 7.86 | | | | (0.05 | ) | | | 1.14 | | | | 1.09 | | | | — | | | |
| 2011 - Institutional | | | 8.85 | | | | 0.06 | | | | 1.30 | | | | 1.36 | | | | (0.07 | ) | | |
| 2011 - Service | | | 8.55 | | | | 0.02 | | | | 1.25 | | | | 1.27 | | | | (0.02 | ) | | |
| 2011 - IR | | | 8.84 | | | | 0.04 | | | | 1.29 | | | | 1.33 | | | | (0.07 | ) | | |
| 2011 - R | | | 8.51 | | | | — | (d) | | | 1.24 | | | | 1.24 | | | | (0.01 | ) | | |
| |
|
| 2010 - A | | | 8.22 | | | | 0.02 | | | | 0.30 | | | | 0.32 | | | | (0.01 | ) | | |
| 2010 - B | | | 7.61 | | | | (0.05 | ) | | | 0.28 | | | | 0.23 | | | | — | | | |
| 2010 - C | | | 7.62 | | | | (0.05 | ) | | | 0.29 | | | | 0.24 | | | | — | | | |
| 2010 - Institutional | | | 8.52 | | | | 0.06 | | | | 0.30 | | | | 0.36 | | | | (0.03 | ) | | |
| 2010 - Service | | | 8.24 | | | | 0.01 | | | | 0.30 | | | | 0.31 | | | | — | | | |
| 2010 - IR | | | 8.51 | | | | 0.04 | | | | 0.32 | | | | 0.36 | | | | (0.03 | ) | | |
| 2010 - R | | | 8.21 | | | | — | (d) | | | 0.30 | | | | 0.30 | | | | — | | | |
| |
|
| 2009 - A | | | 10.34 | | | | 0.01 | | | | (2.13 | ) | | | (2.12 | ) | | | — | | | |
| 2009 - B | | | 9.65 | | | | (0.04 | ) | | | (2.00 | ) | | | (2.04 | ) | | | — | | | |
| 2009 - C | | | 9.67 | | | | (0.04 | ) | | | (2.01 | ) | | | (2.05 | ) | | | — | | | |
| 2009 - Institutional | | | 10.68 | | | | 0.04 | | | | (2.20 | ) | | | (2.16 | ) | | | — | | | |
| 2009 - Service | | | 10.40 | | | | 0.01 | | | | (2.17 | ) | | | (2.16 | ) | | | — | | | |
| 2009 - IR (Commenced January 6, 2009) | | | 7.07 | | | | 0.02 | | | | 1.42 | | | | 1.44 | | | | — | | | |
| 2009 - R (Commenced January 6, 2009) | | | 6.83 | | | | — | (d) | | | 1.38 | | | | 1.38 | | | | — | | | |
| |
|
| 2008 - A | | | 10.49 | | | | (0.05 | ) | | | (0.10 | ) | | | (0.15 | ) | | | — | | | |
| 2008 - B | | | 9.86 | | | | (0.12 | ) | | | (0.09 | ) | | | (0.21 | ) | | | — | | | |
| 2008 - C | | | 9.88 | | | | (0.12 | ) | | | (0.09 | ) | | | (0.21 | ) | | | — | | | |
| 2008 - Institutional | | | 10.79 | | | | (0.01 | ) | | | (0.10 | ) | | | (0.11 | ) | | | — | | | |
| 2008 - Service | | | 10.52 | | | | (0.02 | ) | | | (0.10 | ) | | | (0.12 | ) | | | — | | | |
| |
|
| 2007 - A | | | 9.03 | | | | (0.04 | ) | | | 1.50 | | | | 1.46 | | | | — | | | |
| 2007 - B | | | 8.55 | | | | (0.11 | ) | | | 1.42 | | | | 1.31 | | | | — | | | |
| 2007 - C | | | 8.57 | | | | (0.11 | ) | | | 1.42 | | | | 1.31 | | | | — | | | |
| 2007 - Institutional | | | 9.25 | | | | — | (d) | | | 1.54 | | | | 1.54 | | | | — | | | |
| 2007 - Service | | | 9.06 | | | | (0.05 | ) | | | 1.51 | | | | 1.46 | | | | — | | | |
| |
|
| | |
| (a) | | Calculated based on the average shares outstanding methodology. |
| (b) | | Assumes investment at the net asset value at the beginning of the period, reinvestment of all dividends and distributions, a complete redemption of the investment at the net asset value at the end of the period and no sales or redemption charges. Total returns would be reduced if a sales or redemption charge was taken into account. Returns do not reflect the deduction of taxes that a shareholder would pay on Fund distributions or the redemption of Fund shares. Total returns for periods less than one full year are not annualized. |
| (c) | | Annualized. |
| (d) | | Amount is less than $0.005 per share. |
| (e) | | Amount is less than 0.005% of average net assets. |
96 The accompanying notes are an integral part of these financial statements.
GOLDMAN SACHS STRATEGIC GROWTH FUND
| | | | | | | | | | | | | | | | | | | | | | | | | | | | | |
| | | | | | | | | | |
| | | | |
| | | | | | | | | | |
| | | | |
| | | | | | | | | | | Ratio of
| | | | |
| | | | | Net assets,
| | Ratio of
| | Ratio of
| | net investment
| | | | |
Net asset
| | | | end of
| | net expenses
| | total expenses
| | income (loss)
| | Portfolio
| | |
value, end
| | Total
| | period
| | to average
| | to average
| | to average
| | turnover
| | |
| of period | | return(b) | | (in 000s) | | net assets | | net assets | | net assets | | rate | | |
| |
| |
| $ | 11.07 | | | | 13.48 | % | | $ | 194,125 | | | | 1.15 | %(c) | | | 1.51 | %(c) | | | 0.13 | %(c) | | | 32 | % | | |
| | 10.11 | | | | 13.09 | | | | 1,533 | | | | 1.90 | (c) | | | 2.26 | (c) | | | (0.61 | )(c) | | | 32 | | | |
| | 10.13 | | | | 13.18 | | | | 8,838 | | | | 1.90 | (c) | | | 2.26 | (c) | | | (0.62 | )(c) | | | 32 | | | |
| | 11.47 | | | | 13.77 | | | | 289,451 | | | | 0.75 | (c) | | | 1.11 | (c) | | | 0.53 | (c) | | | 32 | | | |
| | 11.10 | | | | 13.55 | | | | 3 | | | | 1.25 | (c) | | | 1.61 | (c) | | | 0.16 | (c) | | | 32 | | | |
| | 11.48 | | | | 13.66 | | | | 320 | | | | 0.90 | (c) | | | 1.26 | (c) | | | 0.33 | (c) | | | 32 | | | |
| | 11.05 | | | | 13.45 | | | | 4 | | | | 1.40 | (c) | | | 1.76 | (c) | | | (0.06 | )(c) | | | 32 | | | |
| | | | | | | | | | | | | | | | | | | | | | | | | | | | | |
| | | | | | | | | | | | | | | | | | | | | | | | | | | | | |
| |
| | 9.77 | | | | 14.89 | | | | 199,185 | | | | 1.15 | | | | 1.51 | | | | 0.19 | | | | 40 | | | |
| | 8.94 | | | | 14.03 | | | | 1,834 | | | | 1.90 | | | | 2.26 | | | | (0.56 | ) | | | 40 | | | |
| | 8.95 | | | | 13.87 | | | | 8,828 | | | | 1.90 | | | | 2.26 | | | | (0.56 | ) | | | 40 | | | |
| | 10.14 | | | | 15.33 | | | | 260,481 | | | | 0.75 | | | | 1.11 | | | | 0.58 | | | | 40 | | | |
| | 9.80 | | | | 14.90 | | | | 2 | | | | 1.25 | | | | 1.61 | | | | 0.21 | | | | 40 | | | |
| | 10.10 | | | | 14.99 | | | | 125 | | | | 0.90 | | | | 1.26 | | | | 0.42 | | | | 40 | | | |
| | 9.74 | | | | 14.52 | | | | 4 | | | | 1.40 | | | | 1.76 | | | | — | (e) | | | 40 | | | |
| |
|
| | 8.53 | | | | 3.83 | | | | 192,744 | | | | 1.15 | | | | 1.53 | | | | 0.22 | | | | 60 | | | |
| | 7.84 | | | | 3.02 | | | | 2,716 | | | | 1.90 | | | | 2.28 | | | | (0.55 | ) | | | 60 | | | |
| | 7.86 | | | | 3.15 | | | | 9,224 | | | | 1.90 | | | | 2.28 | | | | (0.55 | ) | | | 60 | | | |
| | 8.85 | | | | 4.26 | | | | 264,902 | | | | 0.75 | | | | 1.13 | | | | 0.60 | | | | 60 | | | |
| | 8.55 | | | | 3.76 | | | | 1 | | | | 1.25 | | | | 1.63 | | | | 0.11 | | | | 60 | | | |
| | 8.84 | | | | 4.25 | | | | 10 | | | | 0.90 | | | | 1.28 | | | | 0.39 | | | | 60 | | | |
| | 8.51 | | | | 3.65 | | | | 3 | | | | 1.40 | | | | 1.78 | | | | 0.01 | | | | 60 | | | |
| |
|
| | 8.22 | | | | (20.50 | ) | | | 141,371 | | | | 1.28 | | | | 1.62 | | | | 0.12 | | | | 62 | | | |
| | 7.61 | | | | (21.14 | ) | | | 3,729 | | | | 2.03 | | | | 2.37 | | | | (0.63 | ) | | | 62 | | | |
| | 7.62 | | | | (21.20 | ) | | | 8,447 | | | | 2.03 | | | | 2.37 | | | | (0.63 | ) | | | 62 | | | |
| | 8.52 | | | | (20.22 | ) | | | 114,641 | | | | 0.88 | | | | 1.22 | | | | 0.52 | | | | 62 | | | |
| | 8.24 | | | | (20.77 | ) | | | 1 | | | | 1.38 | | | | 1.72 | | | | 0.10 | | | | 62 | | | |
| | 8.51 | | | | 20.37 | | | | 3 | | | | 1.03 | (c) | | | 1.37 | (c) | | | 0.32 | (c) | | | 62 | | | |
| | 8.21 | | | | 20.20 | | | | 3 | | | | 1.53 | (c) | | | 1.87 | (c) | | | 0.05 | (c) | | | 62 | | | |
| |
|
| | 10.34 | | | | (1.43 | ) | | | 177,810 | | | | 1.44 | | | | 1.52 | | | | (0.44 | ) | | | 59 | | | |
| | 9.65 | | | | (2.12 | ) | | | 6,015 | | | | 2.19 | | | | 2.27 | | | | (1.19 | ) | | | 59 | | | |
| | 9.67 | | | | (2.12 | ) | | | 11,374 | | | | 2.19 | | | | 2.27 | | | | (1.19 | ) | | | 59 | | | |
| | 10.68 | | | | (1.02 | ) | | | 154,711 | | | | 1.04 | | | | 1.12 | | | | (0.05 | ) | | | 59 | | | |
| | 10.40 | | | | (1.14 | ) | | | 3 | | | | 1.54 | | | | 1.62 | | | | (0.20 | ) | | | 59 | | | |
| |
|
| | 10.49 | | | | 16.17 | | | | 138,613 | | | | 1.45 | | | | 1.51 | | | | (0.41 | ) | | | 50 | | | |
| | 9.86 | | | | 15.32 | | | | 6,574 | | | | 2.20 | | | | 2.26 | | | | (1.17 | ) | | | 50 | | | |
| | 9.88 | | | | 15.29 | | | | 10,878 | | | | 2.20 | | | | 2.26 | | | | (1.16 | ) | | | 50 | | | |
| | 10.79 | | | | 16.65 | | | | 152,059 | | | | 1.05 | | | | 1.11 | | | | (0.02 | ) | | | 50 | | | |
| | 10.52 | | | | 16.11 | | | | 3 | | | | 1.55 | | | | 1.61 | | | | (0.55 | ) | | | 50 | | | |
| |
|
The accompanying notes are an integral part of these financial statements. 97
GOLDMAN SACHS TECHNOLOGY TOLLKEEPER FUND
Financial Highlights
Selected Data for a Share Outstanding Throughout Each Period
| | | | | | | | | | | | | | | | | | | |
| | | | | Income (loss) from
| | |
| | | | | investment operations | | |
| | | | |
| | | | | | |
| | | Net asset
| |
| | | | | | |
| | | value,
| | Net
| | Net realized
| | Total from
| | |
| | | beginning
| | investment
| | and unrealized
| | investment
| | |
| Year - Share Class | | of period | | loss(a) | | gain (loss) | | operations | | |
| |
FOR THE SIX MONTHS ENDED FEBRUARY 29, (UNAUDITED) |
| 2012 - A | | $ | 11.51 | | | $ | (0.06 | ) | | $ | 2.00 | | | $ | 1.94 | | | |
| 2012 - B | | | 10.52 | | | | (0.10 | ) | | | 1.82 | | | | 1.72 | | | |
| 2012 - C | | | 10.51 | | | | (0.10 | ) | | | 1.82 | | | | 1.72 | | | |
| 2012 - Institutional | | | 12.08 | | | | (0.04 | ) | | | 2.10 | | | | 2.06 | | | |
| 2012 - Service | | | 11.41 | | | | (0.07 | ) | | | 1.99 | | | | 1.92 | | | |
| 2012 - IR | | | 12.06 | | | | (0.05 | ) | | | 2.10 | | | | 2.05 | | | |
| | | | | | | | | | | | | | | | | | | |
| | | | | | | | | | | | | | | | | | | |
FOR THE FISCAL YEARS ENDED AUGUST 31, |
| 2011 - A | | | 10.43 | | | | (0.14 | ) | | | 1.22 | | | | 1.08 | | | |
| 2011 - B | | | 9.60 | | | | (0.21 | ) | | | 1.13 | | | | 0.92 | | | |
| 2011 - C | | | 9.59 | | | | (0.21 | ) | | | 1.13 | | | | 0.92 | | | |
| 2011 - Institutional | | | 10.90 | | | | (0.09 | ) | | | 1.27 | | | | 1.18 | | | |
| 2011 - Service | | | 10.34 | | | | (0.15 | ) | | | 1.22 | | | | 1.07 | | | |
| 2011 - IR (Commenced September 30, 2010) | | | 12.30 | | | | (0.07 | ) | | | (0.17 | ) | | | (0.24 | ) | | |
| |
|
| 2010 - A | | | 9.14 | | | | (0.11 | ) | | | 1.40 | | | | 1.29 | | | |
| 2010 - B | | | 8.48 | | | | (0.17 | ) | | | 1.29 | | | | 1.12 | | | |
| 2010 - C | | | 8.47 | | | | (0.17 | ) | | | 1.29 | | | | 1.12 | | | |
| 2010 - Institutional | | | 9.52 | | | | (0.07 | ) | | | 1.45 | | | | 1.38 | | | |
| 2010 - Service | | | 9.08 | | | | (0.12 | ) | | | 1.38 | | | | 1.26 | | | |
| |
|
| 2009 - A | | | 10.19 | | | | (0.06 | ) | | | (0.99 | ) | | | (1.05 | ) | | |
| 2009 - B | | | 9.52 | | | | (0.10 | ) | | | (0.94 | ) | | | (1.04 | ) | | |
| 2009 - C | | | 9.52 | | | | (0.11 | ) | | | (0.94 | ) | | | (1.05 | ) | | |
| 2009 - Institutional | | | 10.56 | | | | (0.03 | ) | | | (1.01 | ) | | | (1.04 | ) | | |
| 2009 - Service | | | 10.12 | | | | (0.07 | ) | | | (0.97 | ) | | | (1.04 | ) | | |
| | | | | | | | | | | | | | | | | | | |
| | | | | | | | | | | | | | | | | | | |
FOR THE PERIOD JANUARY 1, 2008 TO AUGUST 31, 2008* |
| 2008 - A | | | 11.52 | | | | (0.06 | ) | | | (1.27 | ) | | | (1.33 | ) | | |
| 2008 - B | | | 10.82 | | | | (0.10 | ) | | | (1.20 | ) | | | (1.30 | ) | | |
| 2008 - C | | | 10.81 | | | | (0.10 | ) | | | (1.19 | ) | | | (1.29 | ) | | |
| 2008 - Institutional | | | 11.91 | | | | (0.03 | ) | | | (1.32 | ) | | | (1.35 | ) | | |
| 2008 - Service | | | 11.45 | | | | (0.06 | ) | | | (1.27 | ) | | | (1.33 | ) | | |
| | | | | | | | | | | | | | | | | | | |
| | | | | | | | | | | | | | | | | | | |
FOR THE FISCAL YEAR ENDED DECEMBER 31, |
| 2007 - A | | | 9.04 | | | | (0.10 | )(d)(e) | | | 2.58 | (f) | | | 2.48 | | | |
| 2007 - B | | | 8.55 | | | | (0.16 | )(d)(e) | | | 2.43 | (f) | | | 2.27 | | | |
| 2007 - C | | | 8.55 | | | | (0.17 | )(d)(e) | | | 2.43 | (f) | | | 2.26 | | | |
| 2007 - Institutional | | | 9.31 | | | | (0.06 | )(d)(e) | | | 2.66 | (f) | | | 2.60 | | | |
| 2007 - Service | | | 8.99 | | | | (0.11 | )(d)(e) | | | 2.57 | (f) | | | 2.46 | | | |
| |
|
| | |
| * | | The Fund changed its fiscal year end from December 31, 2011. |
| (a) | | Calculated based on the average shares outstanding methodology. |
| (b) | | Assumes investment at the net asset value at the beginning of the period, reinvestment of all dividends and distributions, a complete redemption of the investment at the net asset value at the end of the period and no sales or redemption charges. Total returns would be reduced if a sales or redemption charge was taken into account. Returns do not reflect the deduction of taxes that a shareholder would pay on Fund distributions or the redemption of Fund shares. Total returns for periods less than one full year are not annualized. |
| (c) | | Annualized. |
| (d) | | Includes non-recurring expense for a special shareholder meeting which amounted to approximately $0.01 per share and approximately 0.05% of average net assets. |
| (e) | | Reflects income recognized from non-recurring special dividends which amounted to $0.01 per share and 0.12% of average net assets. |
| (f) | | Reflects an increase of $0.07 per share and 0.67% of average net assets due to payments received for class action settlements received during the year. |
| (g) | | Total return reflects the impact of payments received for class action settlements received during the year. Excluding such payments, the total return would have been 27.32%, 26.43%, 26.32%, 27.82% and 27.25%, respectively. |
98 The accompanying notes are an integral part of these financial statements.
GOLDMAN SACHS TECHNOLOGY TOLLKEEPER FUND
| | | | | | | | | | | | | | | | | | | | | | | | | | | | | |
| | | | | | | | | | |
| | | | |
| | | | | | | | | | |
| | | | |
| | | | | | | | | | | Ratio of
| | | | |
| | | | | Net assets,
| | Ratio of
| | Ratio of
| | net investment
| | | | |
Net asset
| | | | end of
| | net expenses
| | total expenses
| | loss
| | Portfolio
| | |
value, end
| | Total
| | period
| | to average
| | to average
| | to average
| | turnover
| | |
| of period | | return(b) | | (in 000s) | | net assets | | net assets | | net assets | | rate | | |
| |
| |
| $ | 13.45 | | | | 16.85 | % | | $ | 249,770 | | | | 1.50 | %(c) | | | 1.57 | %(c) | | | (1.08 | )%(c) | | | 17 | % | | |
| | 12.24 | | | | 16.35 | | | | 10,034 | | | | 2.25 | (c) | | | 2.32 | (c) | | | (1.83 | )(c) | | | 17 | | | |
| | 12.23 | | | | 16.37 | | | | 54,740 | | | | 2.25 | (c) | | | 2.32 | (c) | | | (1.83 | )(c) | | | 17 | | | |
| | 14.14 | | | | 17.05 | | | | 51,213 | | | | 1.10 | (c) | | | 1.17 | (c) | | | (0.68 | )(c) | | | 17 | | | |
| | 13.33 | | | | 16.83 | | | | 10,165 | | | | 1.60 | (c) | | | 1.67 | (c) | | | (1.17 | )(c) | | | 17 | | | |
| | 14.11 | | | | 17.00 | | | | 2,539 | | | | 1.25 | (c) | | | 1.32 | (c) | | | (0.83 | )(c) | | | 17 | | | |
| | | | | | | | | | | | | | | | | | | | | | | | | | | | | |
| | | | | | | | | | | | | | | | | | | | | | | | | | | | | |
| |
| | 11.51 | | | | 10.35 | | | | 244,288 | | | | 1.50 | | | | 1.52 | | | | (1.07 | ) | | | 64 | | | |
| | 10.52 | | | | 9.58 | | | | 10,408 | | | | 2.25 | | | | 2.27 | | | | (1.82 | ) | | | 64 | | | |
| | 10.51 | | | | 9.59 | | | | 50,424 | | | | 2.25 | | | | 2.27 | | | | (1.82 | ) | | | 64 | | | |
| | 12.08 | | | | 10.83 | | | | 54,356 | | | | 1.10 | | | | 1.12 | | | | (0.66 | ) | | | 64 | | | |
| | 11.41 | | | | 10.35 | | | | 10,826 | | | | 1.60 | | | | 1.62 | | | | (1.18 | ) | | | 64 | | | |
| | 12.06 | | | | (1.95 | ) | | | 2,449 | | | | 1.25 | (c) | | | 1.27 | (c) | | | (0.59 | )(c) | | | 64 | | | |
| |
|
| | 10.43 | | | | 14.11 | | | | 225,873 | | | | 1.50 | | | | 1.63 | | | | (1.03 | ) | | | 97 | | | |
| | 9.60 | | | | 13.21 | | | | 13,547 | | | | 2.25 | | | | 2.38 | | | | (1.78 | ) | | | 97 | | | |
| | 9.59 | | | | 13.22 | | | | 47,001 | | | | 2.25 | | | | 2.38 | | | | (1.78 | ) | | | 97 | | | |
| | 10.90 | | | | 14.50 | | | | 32,538 | | | | 1.10 | | | | 1.23 | | | | (0.63 | ) | | | 97 | | | |
| | 10.34 | | | | 13.88 | | | | 11,324 | | | | 1.60 | | | | 1.73 | | | | (1.12 | ) | | | 97 | | | |
| |
|
| | 9.14 | | | | (10.22 | ) | | | 196,405 | | | | 1.50 | | | | 1.67 | | | | (0.76 | ) | | | 52 | | | |
| | 8.48 | | | | (10.92 | ) | | | 17,643 | | | | 2.25 | | | | 2.42 | | | | (1.49 | ) | | | 52 | | | |
| | 8.47 | | | | (10.94 | ) | | | 44,420 | | | | 2.25 | | | | 2.42 | | | | (1.51 | ) | | | 52 | | | |
| | 9.52 | | | | (9.85 | ) | | | 21,790 | | | | 1.10 | | | | 1.27 | | | | (0.37 | ) | | | 52 | | | |
| | 9.08 | | | | (10.28 | ) | | | 6,111 | | | | 1.60 | | | | 1.77 | | | | (0.88 | ) | | | 52 | | | |
| | | | | | | | | | | | | | | | | | | | | | | | | | | | | |
| | | | | | | | | | | | | | | | | | | | | | | | | | | | | |
| |
| | 10.19 | | | | (11.63 | ) | | | 184,063 | | | | 1.44 | (c) | | | 1.51 | (c) | | | (0.86 | )(c) | | | 29 | | | |
| | 9.52 | | | | (12.01 | ) | | | 33,787 | | | | 2.19 | (c) | | | 2.26 | (c) | | | (1.60 | )(c) | | | 29 | | | |
| | 9.52 | | | | (12.03 | ) | | | 49,880 | | | | 2.19 | (c) | | | 2.26 | (c) | | | (1.60 | )(c) | | | 29 | | | |
| | 10.56 | | | | (11.34 | ) | | | 17,717 | | | | 1.04 | (c) | | | 1.11 | (c) | | | (0.45 | )(c) | | | 29 | | | |
| | 10.12 | | | | (11.62 | ) | | | 3,185 | | | | 1.54 | (c) | | | 1.61 | (c) | | | (0.89 | )(c) | | | 29 | | | |
| | | | | | | | | | | | | | | | | | | | | | | | | | | | | |
| | | | | | | | | | | | | | | | | | | | | | | | | | | | | |
| |
| | 11.52 | | | | 27.43 | (g) | | | 194,604 | | | | 1.56 | (d) | | | 1.64 | (d) | | | (0.99 | )(d)(e) | | | 70 | | | |
| | 10.82 | | | | 26.55 | (g) | | | 78,493 | | | | 2.31 | (d) | | | 2.39 | (d) | | | (1.73 | )(d)(e) | | | 70 | | | |
| | 10.81 | | | | 26.43 | (g) | | | 61,641 | | | | 2.31 | (d) | | | 2.39 | (d) | | | (1.74 | )(d)(e) | | | 70 | | | |
| | 11.91 | | | | 27.93 | (g) | | | 23,679 | | | | 1.16 | (d) | | | 1.24 | (d) | | | (0.56 | )(d)(e) | | | 70 | | | |
| | 11.45 | | | | 27.36 | (g) | | | 1,441 | | | | 1.66 | (d) | | | 1.74 | (d) | | | (1.07 | )(d)(e) | | | 70 | | | |
| |
|
The accompanying notes are an integral part of these financial statements. 99
GOLDMAN SACHS U.S. EQUITY FUND
Financial Highlights
Selected Data for a Share Outstanding Throughout Each Period
| | | | | | | | | | | | | | | | | | | | | | | | | | | | | | | |
| | | | | Income (loss) from
| | Distributions
| | |
| | | | | investment operations | | to shareholders | | |
| | | | |
| | | | | |
| | | | | | |
| | | Net asset
| |
| | | | | |
| | | | | | |
| | | value,
| | Net
| | Net realized
| | Total from
| | From net
| | From net
| | | | |
| | | beginning
| | investment
| | and unrealized
| | investment
| | investment
| | realized
| | Total
| | |
| Year - Share Class | | of period | | income (loss)(a) | | gain (loss) | | operations | | income | | gains | | distributions | | |
| |
FOR THE SIX MONTHS ENDED FEBRUARY 29, (UNAUDITED) |
| 2012 - A | | $ | 10.71 | | | $ | 0.05 | | | $ | 1.28 | | | $ | 1.33 | | | $ | (0.04 | ) | | $ | (0.11 | ) | | $ | (0.15 | ) | | |
| 2012 - C | | | 10.61 | | | | 0.01 | | | | 1.26 | | | | 1.27 | | | | — | | | | (0.11 | ) | | | (0.11 | ) | | |
| 2012 - Institutional | | | 10.76 | | | | 0.07 | | | | 1.28 | | | | 1.35 | | | | (0.08 | ) | | | (0.11 | ) | | | (0.19 | ) | | |
| 2012 - IR | | | 10.73 | | | | 0.06 | | | | 1.28 | | | | 1.34 | | | | (0.04 | ) | | | (0.11 | ) | | | (0.15 | ) | | |
| 2012 - R | | | 10.70 | | | | 0.04 | | | | 1.27 | | | | 1.31 | | | | — | (d) | | | (0.11 | ) | | | (0.11 | ) | | |
| | | | | | | | | | | | | | | | | | | | | | | | | | | | | | | |
| | | | | | | | | | | | | | | | | | | | | | | | | | | | | | | |
FOR THE FISCAL YEAR ENDED AUGUST 31, |
| 2011 - A | | | 9.55 | | | | 0.03 | | | | 1.21 | | | | 1.24 | | | | (0.05 | ) | | | (0.03 | ) | | | (0.08 | ) | | |
| 2011 - C | | | 9.49 | | | | (0.05 | ) | | | 1.21 | | | | 1.16 | | | | (0.01 | ) | | | (0.03 | ) | | | (0.04 | ) | | |
| 2011 - Institutional | | | 9.57 | | | | 0.08 | | | | 1.22 | | | | 1.30 | | | | (0.08 | ) | | | (0.03 | ) | | | (0.11 | ) | | |
| 2011 - IR | | | 9.56 | | | | 0.06 | | | | 1.22 | | | | 1.28 | | | | (0.08 | ) | | | (0.03 | ) | | | (0.11 | ) | | |
| 2011 - R | | | 9.53 | | | | 0.01 | | | | 1.20 | | | | 1.21 | | | | (0.01 | ) | | | (0.03 | ) | | | (0.04 | ) | | |
| | | | | | | | | | | | | | | | | | | | | | | | | | | | | | | |
| | | | | | | | | | | | | | | | | | | | | | | | | | | | | | | |
FOR THE PERIOD ENDED AUGUST 31, |
| 2010 - A (Commenced November 30, 2009) | | | 10.00 | | | | 0.03 | | | | (0.47 | ) | | | (0.44 | ) | | | (0.01 | ) | | | — | | | | (0.01 | ) | | |
| 2010 - C (Commenced November 30, 2009) | | | 10.00 | | | | (0.02 | ) | | | (0.49 | ) | | | (0.51 | ) | | | — | (d) | | | — | | | | — | (d) | | |
| 2010 - Institutional (Commenced November 30, 2009) | | | 10.00 | | | | 0.06 | | | | (0.48 | ) | | | (0.42 | ) | | | (0.01 | ) | | | — | | | | (0.01 | ) | | |
| 2010 - IR (Commenced November 30, 2009) | | | 10.00 | | | | 0.05 | | | | (0.48 | ) | | | (0.43 | ) | | | (0.01 | ) | | | — | | | | (0.01 | ) | | |
| 2010 - R (Commenced November 30, 2009) | | | 10.00 | | | | 0.01 | | | | (0.47 | ) | | | (0.46 | ) | | | (0.01 | ) | | | — | | | | (0.01 | ) | | |
| |
|
| | |
| (a) | | Calculated based on the average shares outstanding methodology. |
| (b) | | Assumes investment at the net asset value at the beginning of the period, reinvestment of all dividends and distributions, a complete redemption of the investment at the net asset value at the end of the period and no sales or redemption charges. Total returns would be reduced if a sales or redemption charge was taken into account. Returns do not reflect the deduction of taxes that a shareholder would pay on Fund distributions or the redemption of Fund shares. Total returns for periods less than one full year are not annualized. |
| (c) | | Annualized. |
| (d) | | Amount is less than $0.005 per share. |
100 The accompanying notes are an integral part of these financial statements.
GOLDMAN SACHS U.S. EQUITY FUND
| | | | | | | | | | | | | | | | | | | | | | | | | | | | | |
| | | | | | | | | | |
| | | | |
| | | | | | | | | | |
| | | | |
| | | | | | | | | | | Ratio of
| | | | |
| | | | | Net assets,
| | Ratio of
| | Ratio of
| | net investment
| | | | |
Net asset
| | | | end of
| | net expenses
| | total expenses
| | income (loss)
| | Portfolio
| | |
value, end
| | Total
| | period
| | to average
| | to average
| | to average
| | turnover
| | |
| of period | | return(b) | | (in 000s) | | net assets | | net assets | | net assets | | rate | | |
| |
| |
| $ | 11.89 | | | | 12.53 | % | | $ | 3,334 | | | | 1.18 | %(c) | | | 3.94 | %(c) | | | 0.91 | %(c) | | | 46 | % | | |
| | 11.77 | | | | 12.06 | | | | 170 | | | | 1.93 | (c) | | | 4.69 | (c) | | | 0.17 | (c) | | | 46 | | | |
| | 11.92 | | | | 12.69 | | | | 6,307 | | | | 0.78 | (c) | | | 3.54 | (c) | | | 1.37 | (c) | | | 46 | | | |
| | 11.92 | | | | 12.60 | | | | 62 | | | | 0.93 | (c) | | | 3.69 | (c) | | | 1.10 | (c) | | | 46 | | | |
| | 11.90 | | | | 12.39 | | | | 12 | | | | 1.43 | (c) | | | 4.19 | (c) | | | 0.68 | (c) | | | 46 | | | |
| | | | | | | | | | | | | | | | | | | | | | | | | | | | | |
| | | | | | | | | | | | | | | | | | | | | | | | | | | | | |
| |
| | 10.71 | | | | 12.94 | | | | 3,110 | | | | 1.18 | | | | 4.88 | | | | 0.29 | | | | 51 | | | |
| | 10.61 | | | | 12.19 | | | | 139 | | | | 1.93 | | | | 5.63 | | | | (0.42 | ) | | | 51 | | | |
| | 10.76 | | | | 13.54 | | | | 5,945 | | | | 0.78 | | | | 4.48 | | | | 0.72 | | | | 51 | | | |
| | 10.73 | | | | 13.32 | | | | 241 | | | | 0.93 | | | | 4.63 | | | | 0.56 | | | | 51 | | | |
| | 10.70 | | | | 12.70 | | | | 11 | | | | 1.43 | | | | 5.13 | | | | 0.08 | | | | 51 | | | |
| | | | | | | | | | | | | | | | | | | | | | | | | | | | | |
| | | | | | | | | | | | | | | | | | | | | | | | | | | | | |
| |
| | 9.55 | | | | (4.44 | ) | | | 777 | | | | 1.18 | (c) | | | 11.67 | (c) | | | 0.37 | (c) | | | 63 | | | |
| | 9.49 | | | | (5.10 | ) | | | 14 | | | | 1.93 | (c) | | | 12.42 | (c) | | | (0.29 | )(c) | | | 63 | | | |
| | 9.57 | | | | (4.20 | ) | | | 4,351 | | | | 0.78 | (c) | | | 11.27 | (c) | | | 0.74 | (c) | | | 63 | | | |
| | 9.56 | | | | (4.31 | ) | | | 20 | | | | 0.93 | (c) | | | 11.42 | (c) | | | 0.62 | (c) | | | 63 | | | |
| | 9.53 | | | | (4.65 | ) | | | 10 | | | | 1.43 | (c) | | | 11.92 | (c) | | | 0.10 | (c) | | | 63 | | | |
| |
|
The accompanying notes are an integral part of these financial statements. 101
GOLDMAN SACHS FUNDAMENTAL EQUITY GROWTH FUNDS
Notes to Financial Statements
February 29, 2012 (Unaudited)
Goldman Sachs Trust (the “Trust”) is a Delaware statutory trust registered under the Investment Company Act of 1940, as amended (the “Act”), as an open-end management investment company. The following table lists those series of the Trust that are included in this report (collectively, the “Funds” or individually a “Fund”), along with their corresponding share classes and respective diversification status under the Act:
| | | | | |
| | | | | Diversified/
|
| Fund | | Share Classes Offered* | | Non-diversified |
| |
Capital Growth,
Growth Opportunities,
Small/Mid Cap Growth and
Strategic Growth | | A, B, C, Institutional, Service, IR and R | | Diversified |
| |
| |
| Concentrated Growth | | A, B, C, Institutional, IR and R | | Non-diversified |
| |
| |
| Flexible Cap Growth, | | | | Diversified |
| Focused Growth (Commenced operations January 31, 2012) and | | | | Non-diversified |
| U.S. Equity | | A, C, Institutional, IR and R | | Diversified |
| |
| |
| Technology Tollkeeper | | A, B, C, Institutional, Service and IR | | Diversified |
| |
| |
| | |
| * | | Class B Shares are generally no longer available for purchase by current or prospective investors. |
Class A Shares are sold with a front-end sales charge of up to 5.50%. Class B Shares were sold with a contingent deferred sales charge (“CDSC”) that declines from 5.00% to zero, depending upon the period of time the shares are held. Class C Shares are sold with a CDSC of 1.00%, which is imposed on redemptions made within 12 months of purchase. Institutional, Service, Class IR and Class R Shares are not subject to a sales charge.
Goldman Sachs Asset Management, L.P. (“GSAM”), an affiliate of Goldman, Sachs & Co. (“Goldman Sachs”), serves as investment adviser to the Funds pursuant to a management agreement (the “Agreement”) with the Trust.
| |
| 2. SIGNIFICANT ACCOUNTING POLICIES | |
The preparation of financial statements in conformity with accounting principles generally accepted in the United States of America (“GAAP”) requires management to make estimates and assumptions that may affect the amounts and disclosures in the financial statements. Actual results could differ from those estimates and assumptions.
A. Investment Valuation — The investment valuation policy of the Funds is to value investments at market value. Investments in equity securities and investment companies traded on a United States (“U.S.”) securities exchange or the NASDAQ system are valued daily at their last sale price or official closing price on the principal exchange or system on which they are traded. If no sale occurs, such securities and investment companies are valued at the last bid price for long positions and at the last ask price for short positions. Debt securities for which market quotations are readily available are valued on the basis of quotations furnished by an independent pricing service approved by the trustees or provided by securities dealers. The pricing services may use valuation models or matrix pricing, which consider: (i) yield or price with respect to bonds that are considered comparable in characteristics such as rating, interest rate and maturity date or (ii) quotations from securities dealers to determine current value. If accurate quotations are not readily available, or if GSAM believes that such quotations do not accurately reflect fair value, the fair value of the Funds’ investments may be determined under valuation procedures approved by the trustees. Unlisted equity securities for which market quotations are available are valued at the last sale price on the valuation date, or if no sale occurs, at the last bid price. In the absence of market quotations, broker quotes will be utilized or the security will be fair valued. Investments in investment companies (other than those that are exchange traded) are valued at the net asset value per share (“NAV”) of the investment company on the valuation date. Short-term debt obligations that mature in sixty days or less and that do not exhibit signs of credit deterioration are valued at amortized cost, which approximates market value.
GOLDMAN SACHS FUNDAMENTAL EQUITY GROWTH FUNDS
| |
| 2. SIGNIFICANT ACCOUNTING POLICIES (continued) | |
GSAM, consistent with its procedures and applicable regulatory guidance, may make an adjustment to the previous closing prices of either domestic or foreign securities in light of significant events to reflect what it believes to be the fair value of the securities at the time of determining a Fund’s NAV. Significant events that could affect a large number of securities in a particular market may include, but are not limited to: situations relating to one or more single issuers in a market sector; significant fluctuations in U.S. or foreign markets; market dislocations; market disruptions or market closings; equipment failures; natural or man-made disasters or acts of God; armed conflicts; government actions or other developments; as well as the same or similar events which may affect specific issuers or the securities markets even though not tied directly to the securities markets. Other significant events that could relate to a single issuer may include, but are not limited to: corporate actions such as reorganizations, mergers and buy-outs; corporate announcements, including those relating to earnings, products and regulatory news; significant litigation; and trading halts or suspensions.
B. Investment Income and Investments — Investment income is comprised of interest income and dividend income, and is recorded net of any foreign withholding taxes, less any amounts reclaimable. Interest income is accrued daily and adjusted for amortization of premiums and accretion of discounts. Dividend income is recognized on ex-dividend date or, for certain foreign securities, as soon as such information is obtained subsequent to the ex-dividend date. Investment transactions are reflected on trade date with realized gains and losses on sales calculated using identified cost. Investment transactions are recorded on the following business day for daily NAV calculations. Any foreign capital gains tax is accrued daily based upon net unrealized gains, and is payable upon sale of such investments.
C. Commission Recapture — Certain Funds may direct portfolio trades, subject to obtaining best execution, to various brokers who have agreed to rebate a portion of the commissions generated. Such rebates are made directly to the Funds as cash payments and are included in the net realized gain (loss) from investments.
D. In-Kind Transactions — The Funds may allow investors, under certain circumstances, to purchase shares with securities instead of cash. In addition, the Trust reserves the right to redeem an investor’s shares by distributing securities instead of cash. These are known as in-kind transactions. Securities included as part of in-kind purchases and redemptions of Fund shares are valued in the same manner as they are valued for purposes of computing the Fund’s NAV, in accordance with the Funds’ valuation procedures, and such valuations are as of the date the trade is submitted pursuant to the procedures specified in the Funds’ prospectus.
E. Class Allocations and Expenses — Investment income, realized and unrealized gain (loss), and non-class specific expenses of each Fund are allocated daily based upon the proportion of net assets of each class. Class specific expenses, where applicable, are borne by the respective share classes and include Distribution and Service, Transfer Agent and Service and Shareholder Administration fees. Non-class specific expenses directly incurred by a Fund are charged to that Fund, while such expenses incurred by the Trust are allocated across the respective Funds on a straight-line and/or pro-rata basis depending upon the nature of the expenses.
F. Offering Costs — Offering costs paid in connection with the offering of shares of the Focused Growth Fund are being amortized on a straight-line basis over 12 months from the date of commencement of operations.
G. Federal Taxes and Distributions to Shareholders — It is each Fund’s policy to comply with the requirements of the Internal Revenue Code of 1986, as amended (the “Code”), applicable to regulated investment companies (mutual funds) and to distribute each year substantially all of its investment company taxable income and capital gains to its shareholders. Accordingly, the Funds are not required to make any provisions for the payment of federal income tax. Distributions to shareholders are recorded on the ex-dividend date. Income and capital gains distributions, if any, are declared and paid annually.
Net capital losses are carried forward to future fiscal years and may be used to the extent allowed by the Code to offset any future capital gains. Utilization of capital loss carryforwards will reduce the requirement of future capital gains distributions.
The characterization of distributions to shareholders for financial reporting purposes is determined in accordance with federal income tax rules, which may differ from GAAP. The source of each Fund’s distributions may be shown in the accompanying
GOLDMAN SACHS FUNDAMENTAL EQUITY GROWTH FUNDS
Notes to Financial Statements (continued)
February 29, 2012 (Unaudited)
| |
| 2. SIGNIFICANT ACCOUNTING POLICIES (continued) | |
financial statements as either from net investment income, net realized gain or capital. Certain components of the Funds’ net assets on the Statements of Assets and Liabilities reflect permanent GAAP/tax differences based on the appropriate tax character.
H. Repurchase Agreements — The Funds may enter into repurchase agreements which involve the purchase of securities subject to the seller’s agreement to repurchase the securities at a mutually agreed upon date and price. During the term of a repurchase agreement, the value of the underlying securities held as collateral on behalf of the Funds, including accrued interest, is required to exceed the value of the repurchase agreement, including accrued interest. If the seller defaults or becomes insolvent, realization of the collateral by the Funds may be delayed or limited and there may be a decline in the value of the collateral during the period while the Funds seek to assert their rights. The underlying securities for all repurchase agreements are held at the Funds’ custodian or designated sub-custodians under tri-party repurchase agreements.
Pursuant to exemptive relief granted by the Securities and Exchange Commission and terms and conditions contained therein, the Funds, together with other registered investment companies having management agreements with GSAM, or its affiliates, may transfer uninvested cash into joint accounts, the daily aggregate balance of which is invested in one or more repurchase agreements. Under these joint accounts, the Funds maintain pro rata credit exposure to the underlying repurchase agreements’ counterparties. With the exception of certain transaction fees, the Funds are not subject to any expenses in relation to these investments.
| |
| 3. FAIR VALUE OF INVESTMENTS | |
The fair value of a financial instrument is the amount that would be received to sell an asset or paid to transfer a liability in an orderly transaction between market participants at the measurement date (i.e., the exit price). GAAP establishes a fair value hierarchy that prioritizes the inputs to valuation techniques used to measure fair value. The hierarchy gives the highest priority to unadjusted quoted prices in active markets for identical assets or liabilities (Level 1 measurements) and the lowest priority to unobservable inputs (Level 3 measurements). The three levels of the fair value hierarchy are described below:
Level 1 — Unadjusted quoted prices in active markets that are accessible at the measurement date for identical, unrestricted assets or liabilities;
Level 2 — Quoted prices in markets that are not active or financial instruments for which significant inputs are observable (including, but not limited to, quoted prices for similar investments, interest rates, foreign exchange rates, volatility and credit spreads), either directly or indirectly;
Level 3 — Prices or valuations that require significant unobservable inputs (including GSAM’s assumptions in determining fair value measurement).
The levels used for classifying investments are not necessarily an indication of the risk associated with investing in those investments.
The following is a summary of the Funds’ investments categorized in the fair value hierarchy as of February 29, 2012:
| | | | | | | | | | | | | |
CAPITAL GROWTH
| | | | | | |
| Investment Type | | Level 1 | | Level 2 | | Level 3 |
| |
Assets | | | | | | | | | | | | |
Common Stock and/or Other Equity Investments | | $ | 972,049,273 | | | $ | — | | | $ | — | |
| Short-term Investments | | | — | | | | 600,000 | | | | — | |
| |
| |
CONCENTRATED GROWTH
| | | | | | |
| Investment Type | | Level 1 | | Level 2 | | Level 3 |
| |
Assets | | | | | | | | | | | | |
Common Stock and/or Other Equity Investments | | $ | 192,409,597 | | | $ | — | | | $ | — | |
| |
| |
GOLDMAN SACHS FUNDAMENTAL EQUITY GROWTH FUNDS
| |
| 3. FAIR VALUE OF INVESTMENTS (continued) | |
| | | | | | | | | | | | | |
FLEXIBLE CAP GROWTH
| | | | | | |
| Investment Type | | Level 1 | | Level 2 | | Level 3 |
| |
Assets | | | | | | | | | | | | |
Common Stock and/or Other Equity Investments | | $ | 14,195,036 | | | $ | — | | | $ | — | |
| Short-term Investments | | | — | | | | 100,000 | | | | — | |
| |
| |
FOCUSED GROWTH
| | | | | | |
| Investment Type | | Level 1 | | Level 2 | | Level 3 |
| |
Assets | | | | | | | | | | | | |
Common Stock and/or Other Equity Investments | | $ | 2,363,480 | | | $ | — | | | $ | — | |
| |
| |
GROWTH OPPORTUNITIES
| | | | | | |
| Investment Type | | Level 1 | | Level 2 | | Level 3 |
| |
Assets | | | | | | | | | | | | |
Common Stock and/or Other Equity Investments | | $ | 4,455,926,291 | | | $ | — | | | $ | — | |
| Short-term Investments | | | — | | | | 24,100,000 | | | | — | |
| |
| |
SMALL/MID CAP GROWTH
| | | | | | |
| Investment Type | | Level 1 | | Level 2 | | Level 3 |
| |
Assets | | | | | | | | | | | | |
Common Stock and/or Other Equity Investments | | $ | 820,617,372 | | | $ | — | | | $ | — | |
| Short-term Investments | | | — | | | | 5,500,000 | | | | — | |
| |
| |
STRATEGIC GROWTH
| | | | | | |
| Investment Type | | Level 1 | | Level 2 | | Level 3 |
| |
Assets | | | | | | | | | | | | |
Common Stock and/or Other Equity Investments | | $ | 490,409,032 | | | $ | — | | | $ | — | |
| |
| |
TECHNOLOGY TOLLKEEPER
| | | | | | |
| Investment Type | | Level 1 | | Level 2 | | Level 3 |
| |
Assets | | | | | | | | | | | | |
Common Stock and/or Other Equity Investments | | $ | 370,352,736 | | | $ | — | | | $ | — | |
| Short-term Investments | | | — | | | | 8,600,000 | | | | — | |
| |
| |
U.S. EQUITY
| | | | | | |
| Investment Type | | Level 1 | | Level 2 | | Level 3 |
| |
Assets | | | | | | | | | | | | |
Common Stock and/or Other Equity Investments | | $ | 9,836,346 | | | $ | — | | | $ | — | |
| Short-term Investments | | | — | | | | 100,000 | | | | — | |
| |
| |
GOLDMAN SACHS FUNDAMENTAL EQUITY GROWTH FUNDS
Notes to Financial Statements (continued)
February 29, 2012 (Unaudited)
| |
| 4. AGREEMENTS AND AFFILIATED TRANSACTIONS | |
A. Management Agreement — Under the Agreement, GSAM manages the Funds, subject to the general supervision of the trustees.
As compensation for the services rendered pursuant to the Agreement, the assumption of the expenses related thereto and administration of the Funds’ business affairs, including providing facilities, GSAM is entitled to a management fee, accrued daily and paid monthly, equal to an annual percentage rate of each Fund’s average daily net assets.
For the six months ended February 29, 2012, contractual and effective net management fees with GSAM were at the following rates:
| | | | | | | | | | | | | | | | | | | | | | | | | | | | | |
| | | Contractual Management Rate | | Effective Net
|
| | | First
| | Next
| | Next
| | Next
| | Over
| | Effective
| | Management
|
| Fund | | $1 billion | | $1 billion | | $3 billion | | $3 billion | | $8 billion | | Rate | | Rate |
| |
| Capital Growth | | | 1.00 | % | | | 0.90 | % | | | 0.80 | % | | | 0.80 | % | | | 0.80 | % | | | 1.00 | % | | | 0.70 | %# |
| |
| |
| Concentrated Growth | | | 1.00 | | | | 0.90 | | | | 0.86 | | | | 0.84 | | | | 0.82 | | | | 1.00 | | | | 0.81 | # |
| |
| |
| Flexible Cap Growth | | | 1.00 | | | | 0.90 | | | | 0.86 | | | | 0.84 | | | | 0.82 | | | | 1.00 | | | | 0.81 | # |
| |
| |
| Focused Growth | | | 1.00 | | | | 0.90 | | | | 0.86 | | | | 0.84 | | | | 0.82 | | | | 1.00 | | | | 0.79 | # |
| |
| |
| Growth Opportunities | | | 1.00 | | | | 1.00 | | | | 0.90 | | | | 0.86 | | | | 0.84 | | | | 0.95 | | | | 0.90 | # |
| |
| |
| Small/Mid Cap Growth | | | 1.00 | | | | 1.00 | | | | 0.90 | | | | 0.86 | | | | 0.84 | | | | 1.00 | | | | 0.85 | # |
| |
| |
| Strategic Growth | | | 1.00 | | | | 0.90 | | | | 0.86 | | | | 0.84 | | | | 0.82 | | | | 1.00 | | | | 0.71 | # |
| |
| |
| Technology Tollkeeper | | | 1.00 | | | | 0.90 | | | | 0.86 | | | | 0.84 | | | | 0.82 | | | | 1.00 | | | | 1.00 | |
| |
| |
| U.S. Equity | | | 0.70 | | | | 0.63 | | | | 0.60 | | | | 0.59 | | | | 0.58 | | | | 0.70 | | | | 0.70 | |
| |
| |
| | |
| # | | GSAM agreed to waive a portion of its management fee, in order to achieve effective net management fee rates of 0.70%, 0.81%, 0.81%, 0.90%, 0.85% and 0.71% for the Capital Growth, Concentrated Growth, Flexible Cap Growth, Growth Opportunities, Small/Mid Cap Growth and Strategic Growth Funds, respectively, through December 29, 2012, and 0.79% for the Focused Growth Fund through January 31, 2013. Prior to such date GSAM may not terminate the arrangements without the approval of the trustees. Where the application of the above contractual management fee breakpoint schedule would result in a lower management fee rate, the breakpoint schedule will be applied to the Fund’s assets. |
B. Distribution and Service Plans — The Trust, on behalf of each Fund, has adopted Distribution and Service Plans (the “Plans”). Under the Plans, Goldman Sachs, which serves as distributor (the “Distributor”), is entitled to a fee, accrued daily and paid monthly for distribution services and personal and account maintenance services, which may then be paid by Goldman Sachs to authorized dealers, at the following annual rates calculated on a Fund’s average daily net assets of each respective share class:
| | | | | | | | | | | | | | | | | | | |
| | | Distribution and Service Plan Rates | | |
| | | Class A* | | Class B | | Class C | | Class R* | | |
| |
| Distribution Plan | | | 0.25 | % | | | 0.75 | % | | | 0.75 | % | | | 0.50 | % | | |
| |
| |
| Service Plan | | | — | | | | 0.25 | | | | 0.25 | | | | — | | | |
| |
| |
| | |
| * | | With respect to Class A and Class R Shares, the Distributor at its discretion may use compensation for distribution services paid under the Distribution Plan to compensate service organizations for personal and account maintenance services and expenses as long as such total compensation does not exceed the maximum cap on “service fees” imposed by the Financial Industry Regulatory Authority. |
GOLDMAN SACHS FUNDAMENTAL EQUITY GROWTH FUNDS
| |
| 4. AGREEMENTS AND AFFILIATED TRANSACTIONS (continued) | |
C. Distribution Agreement — Goldman Sachs, as Distributor of the shares of the Funds pursuant to a Distribution Agreement, may retain a portion of the Class A front end sales charge and Class B and Class C CDSC. During the six months ended February 29, 2012, Goldman Sachs advised that it retained the following approximate amounts:
| | | | | | | | | | | | | |
| | | Front End
| | Contingent Deferred
|
| | | Sales Charge | | Sales Charge |
| Fund | | Class A | | Class B | | Class C |
| |
| Capital Growth | | $ | 11,300 | | | $ | — | | | $ | 300 | |
| |
| |
| Concentrated Growth | | | 200 | | | | — | | | | — | |
| |
| |
| Flexible Cap Growth | | | 900 | | | | N/A | | | | — | |
| |
| |
| Focused Growth | | | — | | | | N/A | | | | — | |
| |
| |
| Growth Opportunities | | | 18,600 | | | | — | | | | 400 | |
| |
| |
| Small/Mid Cap Growth | | | 18,600 | | | | — | | | | — | |
| |
| |
| Strategic Growth | | | 1,000 | | | | — | | | | — | |
| |
| |
| Technology Tollkeeper | | | 9,500 | | | | — | | | | 200 | |
| |
| |
| U.S. Equity | | | — | | | | N/A | | | | — | |
| |
| |
D. Service Plan and Shareholder Administration Plan — The Trust, on behalf of each Fund that offers Service Shares, has adopted a Service Plan and a Shareholder Administration Plan. These plans allow service organizations to provide varying levels of personal and account maintenance and shareholder administration services to their customers who are beneficial owners of such shares. The Service Plan and Shareholder Administration Plan each provide for compensation to the service organizations which is accrued daily and paid monthly at an annual rate of 0.25% (0.50% in aggregate) of the average daily net assets of the Service Shares.
E. Transfer Agency Agreement — Goldman Sachs also serves as the transfer agent of the Funds for a fee pursuant to a Transfer Agency Agreement. The fees charged for such transfer agency services are accrued daily and paid monthly at an annual rate as follows: 0.19% of the average daily net assets for Class A, Class B, Class C, Class IR and Class R Shares and 0.04% of the average daily net assets for Institutional and Service Shares.
F. Other Expense Agreements and Affiliated Transactions — GSAM has agreed to limit certain “Other Expense” of the Funds (excluding management fees, distribution and service fees, transfer agent fees and expenses, service fees and shareholder administration fees (as applicable), taxes, interest, brokerage fees and litigation, indemnification, shareholder meetings and other extraordinary expenses, exclusive of any custody and transfer agent fee credit reductions) to the extent such expenses exceed, on an annual basis, a percentage rate of the average daily net assets of each Fund. Such Other Expense reimbursements, if any, are accrued daily and paid monthly. In addition, the Funds are not obligated to reimburse GSAM for prior fiscal year expense reimbursements, if any. The Other Expense limitations as an annual percentage rate of average daily net assets for the Capital Growth, Concentrated Growth, Flexible Cap Growth, Focused Growth, Growth Opportunities, Small/Mid Cap Growth, Strategic Growth, Technology Tollkeeper and U.S. Equity Funds are 0.004%, 0.014%, 0.014%, 0.014%, 0.014%, 0.064%, 0.004%, 0.064% and 0.044%, respectively. These Other Expense reimbursements will remain in place through December 29, 2012 (January 31, 2013 for the Focused Growth Fund), and prior to such date GSAM may not terminate the arrangements without the approval of the trustees. In addition, the Funds have entered into certain offset arrangements with the custodian and the transfer agent, which may result in a reduction in the Funds’ expenses.
GOLDMAN SACHS FUNDAMENTAL EQUITY GROWTH FUNDS
Notes to Financial Statements (continued)
February 29, 2012 (Unaudited)
| |
| 4. AGREEMENTS AND AFFILIATED TRANSACTIONS (continued) | |
For the six months ended February 29, 2012, these expense reductions, including any fee waivers and Other Expense reimbursements were as follows (in thousands):
| | | | | | | | | | | | | |
| | | | | Other
| | Total
|
| | | Management
| | Expense
| | Expense
|
| Fund | | Fee Waiver | | Reimbursements | | Reductions |
| |
| Capital Growth | | $ | 1,443 | | | $ | 223 | | | $ | 1,666 | |
| |
| |
| Concentrated Growth | | | 196 | | | | 131 | | | | 327 | |
| |
| |
| Flexible Cap Growth | | | 15 | | | | 131 | | | | 146 | |
| |
| |
| Focused Growth | | | — | * | | | 53 | | | | 53 | |
| |
| |
| Growth Opportunities | | | 995 | | | | 360 | | | | 1,355 | |
| |
| |
| Small/Mid Cap Growth | | | 617 | | | | 19 | | | | 636 | |
| |
| |
| Strategic Growth | | | 693 | | | | 176 | | | | 869 | |
| |
| |
| Technology Tollkeeper | | | — | | | | 131 | | | | 131 | |
| |
| |
| U.S. Equity | | | — | | | | 126 | | | | 126 | |
| |
| |
| | |
| * | | Amount is less than $500 |
As of February 29, 2012, the amounts owed to affiliates of the Funds were as follows (in thousands):
| | | | | | | | | | | | | | | | | |
| | | Management
| | Distribution and
| | Transfer
| | |
| Fund | | Fees | | Service Fees | | Agent Fees | | Total |
| |
| Capital Growth | | $ | 621 | | | $ | 222 | | | $ | 125 | | | $ | 968 | |
| |
| |
| Concentrated Growth | | | 123 | | | | 23 | | | | 19 | | | | 165 | |
| |
| |
| Flexible Cap Growth | | | 9 | | | | 2 | | | | 2 | | | | 13 | |
| |
| |
| Focused Growth | | | 1 | | | | — | * | | | — | * | | | 1 | |
| |
| |
| Growth Opportunities | | | 3,160 | | | | 372 | | | | 303 | | | | 3,835 | |
| |
| |
| Small/Mid Cap Growth | | | 553 | | | | 155 | | | | 90 | | | | 798 | |
| |
| |
| Strategic Growth | | | 278 | | | | 47 | | | | 41 | | | | 366 | |
| |
| |
| Technology Tollkeeper | | | 290 | | | | 98 | | | | 48 | | | | 436 | |
| |
| |
| U.S. Equity | | | 5 | | | | 1 | | | | 1 | | | | 7 | |
| |
| |
| | |
| * | | Amount is less than $500 |
G. Line of Credit Facility — As of February 29, 2012, the Funds (except for the Focused Growth Fund) participated in a $580,000,000 committed, unsecured revolving line of credit facility (the “facility”) together with other funds of the Trust and registered investment companies having management agreements with GSAM or its affiliates (“Other Borrowers”). Pursuant to the terms of the facility, the Funds and Other Borrowers could increase the credit amount by an additional $340,000,000, for a total of up to $920,000,000. This facility is to be used solely for temporary or emergency purposes. The interest rate on borrowings is based on the federal funds rate. The facility also requires a fee to be paid by the Funds based on the amount of the commitment that has not been utilized. For the six months ended February 29, 2012, the Funds did not have any borrowings under the facility.
GOLDMAN SACHS FUNDAMENTAL EQUITY GROWTH FUNDS
| |
| 4. AGREEMENTS AND AFFILIATED TRANSACTIONS (continued) | |
H. Other Transactions with Affiliates — For the six months ended February 29, 2012, Goldman Sachs did not earn brokerage commissions from the Funds.
The following table provides information about the investment by the Growth Opportunities Fund in shares of issuers of which the Trust is an affiliate for the six months ended February 29, 2012 (in thousands):
| | | | | | | | | | | | | | | | | | | | | | | | | |
| | | Number of
| | | | | | Number of
| | | | |
| | | Shares Held
| | | | | | Shares Held
| | | | |
| | | Beginning
| | Shares
| | Shares
| | End of
| | Value at End
| | Dividend
|
| Name of Affiliated Issuer | | of Period | | Bought | | Sold | | Period | | of Period | | Income |
| |
| RealD, Inc. | | | 3,140 | | | | — | | | | (259 | ) | | | 2,881 | | | $ | 34,001 | | | $ | — | |
| |
| |
As of February 29, 2012, the Goldman Sachs Profit Sharing Master Trust was the beneficial owner of approximately 7% of total outstanding shares of the Capital Growth Fund.
As of February 29, 2012, the Goldman Sachs Group, Inc. was the beneficial owner of 5% or more of outstanding Class A, Class C, Institutional, Service, Class IR and Class R Shares of the following funds:
| | | | | | | | | | | | | | | | | | | | | | | | | | | |
| Fund | | Class A | | Class C | | Institutional | | Service | | Class IR | | Class R | | |
| |
| Concentrated Growth | | | — | % | | | — | % | | | — | % | | | — | % | | | — | % | | | 100 | % | | |
| |
| |
| Flexible Cap Growth | | | — | | | | — | | | | — | | | | — | | | | 10 | | | | 7 | | | |
| |
| |
| Focused Growth | | | 100 | | | | 100 | | | | 87 | | | | — | | | | 100 | | | | 100 | | | |
| |
| |
| Strategic Growth | | | — | | | | — | | | | — | | | | 65 | | | | — | | | | 100 | | | |
| |
| |
| U.S. Equity | | | — | | | | 7 | | | | 38 | | | | — | | | | 20 | | | | 100 | | | |
| |
| |
| |
| 5. PORTFOLIO SECURITIES TRANSACTIONS | |
The cost of purchases and proceeds from sales and maturities of long-term securities for the six months ended February 29, 2012, were as follows:
| | | | | | | | | |
| Fund | | Purchases | | Sales and Maturities |
| |
| Capital Growth | | $ | 320,582,138 | | | $ | 548,650,831 | |
| |
| |
| Concentrated Growth | | | 32,798,606 | | | | 98,645,213 | |
| |
| |
| Flexible Cap Growth | | | 2,772,134 | | | | 10,973,455 | |
| |
| |
| Focused Growth | | | 2,248,300 | | | | 21,634 | |
| |
| |
| Growth Opportunities | | | 1,210,009,675 | | | | 1,514,306,245 | |
| |
| |
| Small/Mid Cap Growth | | | 237,316,046 | | | | 407,775,696 | |
| |
| |
| Strategic Growth | | | 154,360,924 | | | | 193,070,366 | |
| |
| |
| Technology Tollkeeper | | | 61,060,979 | | | | 117,961,402 | |
| |
| |
| U.S. Equity | | | 4,104,351 | | | | 4,510,745 | |
| |
| |
GOLDMAN SACHS FUNDAMENTAL EQUITY GROWTH FUNDS
Notes to Financial Statements (continued)
February 29, 2012 (Unaudited)
As of the Funds’ most recent fiscal year end, August 31, 2011, the Funds’ capital loss carryforwards and certain timing differences on a tax basis were as follows:
| | | | | | | | | | | | | | | | | | | | | | | | | | | | | | | | | |
| | | | | | | Flexible
| | | | Small/Mid
| | | | | | |
| | | Capital
| | Concentrated
| | Cap
| | Growth
| | Cap
| | Strategic
| | Technology
| | U.S.
|
| | | Growth | | Growth | | Growth | | Opportunities | | Growth | | Growth | | Tollkeeper | | Equity |
| |
Capital loss carryforward:(1) | | | | | | | | | | | | | | | | | | | | | | | | | | | | | | | | |
| Expiring 2012 | | $ | — | | | $ | — | | | $ | — | | | $ | — | | | $ | — | | | $ | — | | | $ | (1,145,651 | ) | | $ | — | |
| Expiring 2017 | | | — | | | | (5,541,279 | ) | | | — | | | | — | | | | — | | | | (3,587,539 | ) | | | — | | | | — | |
| Expiring 2018 | | | (105,084,155 | ) | | | (31,343,315 | ) | | | — | | | | — | | | | — | | | | (17,420,270 | ) | | | — | | | | — | |
| |
| |
| Total capital loss carryforward | | | (105,084,155 | ) | | | (36,884,594 | ) | | | — | | | | — | | | | — | | | | (21,007,809 | ) | | | (1,145,651 | ) | | | — | |
| |
| |
| | |
| (1) | | Expiration occurs on August 31 of the year indicated. |
As of February 29, 2012, the Funds’ aggregate security unrealized gains and losses based on cost for U.S. federal income tax purposes were as follows:
| | | | | | | | | | | | | | | | | | | | | | | | | | | | | | | | | | | | | |
| | | | | | | Flexible
| | | | | | Small/Mid
| | | | | | |
| | | Capital
| | Concentrated
| | Cap
| | Focused
| | Growth
| | Cap
| | Strategic
| | Technology
| | U.S.
|
| | | Growth | | Growth | | Growth | | Growth | | Opportunities | | Growth | | Growth | | Tollkeeper | | Equity |
| |
| Tax Cost | | $ | 703,319,827 | | | $ | 134,552,730 | | | $ | 11,364,602 | | | $ | 2,226,986 | | | $ | 3,733,236,810 | | | $ | 695,738,778 | | | $ | 427,614,921 | | | $ | 340,386,392 | | | $ | 9,006,548 | |
| |
| |
| Gross unrealized gain | | | 284,795,087 | | | | 62,435,524 | | | | 3,396,433 | | | | 142,309 | | | | 883,692,071 | | | | 169,462,502 | | | | 77,193,172 | | | | 62,378,565 | | | | 1,164,518 | |
| Gross unrealized loss | | | (15,465,641 | ) | | | (4,578,657 | ) | | | (465,999 | ) | | | (5,815 | ) | | | (136,902,590 | ) | | | (39,083,908 | ) | | | (14,399,061 | ) | | | (23,812,221 | ) | | | (234,720 | ) |
| |
| |
| Net unrealized gain | | $ | 269,329,446 | | | $ | 57,856,867 | | | $ | 2,930,434 | | | $ | 136,494 | | | $ | 746,789,481 | | | $ | 130,378,594 | | | $ | 62,794,111 | | | $ | 38,566,344 | | | $ | 929,798 | |
| |
| |
The difference between GAAP-basis and tax-basis unrealized gains (losses), as of the most recent fiscal year end, is attributable primarily to wash sales, differences related to the tax treatment of partnership investments and underlying fund investments.
GSAM has reviewed the Funds’ tax positions for all open tax years (the current and prior three years, as applicable) and has concluded that no provision for income tax is required in the Funds’ financial statements. Such open tax years remain subject to examination and adjustment by tax authorities.
The Funds’ risks include, but are not limited to, the following:
Funds’ Shareholder Concentration Risk — Certain funds, accounts, individuals or Goldman Sachs affiliates may from time to time own (beneficially or of record) or control a significant percentage of the Funds’ shares. Redemptions by these entities of their holdings in the Funds may impact the Funds’ liquidity and NAV. These redemptions may also force the Funds to sell securities.
Liquidity Risk — The Funds may make investments that may be illiquid or that may become less liquid in response to market developments or adverse investor perceptions. Liquidity risk may also refer to the risk that a Fund will not be able to pay redemption proceeds within the allowable time period because of unusual market conditions, an unusually high volume of redemption requests, or other reasons. To meet redemption requests, a Fund may be forced to sell investments at an unfavorable time and/or under unfavorable conditions.
Market and Credit Risks — In the normal course of business, the Funds trade financial instruments and enter into financial transactions where risk of potential loss exists due to changes in the market (market risk). Additionally, the Funds may also be exposed to credit risk in the event that an issuer fails to perform or that an institution or entity with which the Funds have unsettled or open transaction defaults.
GOLDMAN SACHS FUNDAMENTAL EQUITY GROWTH FUNDS
| |
| 7. OTHER RISKS (continued) | |
Portfolio Concentration Risk — The Technology Tollkeeper Fund invests primarily in equity securities of high-quality technology, media, or service companies that adopt or use technology to improve their cost structure, revenue opportunities or competitive advantage (“Technology Tollkeeper” companies). Because of its focus on technology, media and service companies, the Technology Tollkeeper Fund’s investment performance will be closely tied to many factors which affect those companies. The Technology Tollkeeper Fund may also invest in a relatively few number of issuers. As a result, the Technology Tollkeeper Fund’s net asset value is more likely to have greater fluctuations than that of a Fund which is more diversified or invests in other industries.
Under the Trust’s organizational documents, its trustees, officers, employees and agents are indemnified, to the extent permitted by the Act, against certain liabilities that may arise out of performance of their duties to the Funds. Additionally, in the course of business, the Funds enter into contracts that contain a variety of indemnification clauses. The Funds’ maximum exposure under these arrangements is unknown, as this would involve future claims that may be made against the Funds that have not yet occurred. However, GSAM believes the risk of loss under these arrangements to be remote.
New Accounting Pronouncement — In May 2011, Accounting Standards Update 2011-04 (ASU 2011-04), Amendments to Achieve Common Fair Value Measurement and Disclosure Requirements in U.S. GAAP and IFRSs, was issued and is effective for interim and annual periods beginning after December 15, 2011. ASU 2011-04 amends Financial Accounting Standards Board (FASB) Topic 820, Fair Value Measurement. The amendments are the result of the work by the FASB and the International Accounting Standards Board to develop common requirements for measuring fair value and for disclosing information about fair value measurements in accordance with GAAP. GSAM is currently evaluating the application of ASU 2011-04 and its impact, if any, on the Funds’ financial statements.
On February 8, 2012, the Commodity Futures Trading Commission (CFTC) adopted amendments to several of its rules relating to commodity pool operators, including Rule 4.5. The Funds currently rely on Rule 4.5’s exclusion from CFTC regulation for regulated investment companies. GSAM is currently evaluating the amendments and their impact, if any, on the Funds’ financial statements.
Subsequent events after the balance sheet date have been evaluated through the date the financial statements were issued. GSAM has concluded that there is no impact requiring adjustment or disclosure in the financial statements.
GOLDMAN SACHS FUNDAMENTAL EQUITY GROWTH FUNDS
Notes to Financial Statements (continued)
February 29, 2012 (Unaudited)
| |
| 11. SUMMARY OF SHARE TRANSACTIONS | |
Share activity is as follows:
| | | | | | | | | | | | | | | | | |
| | | Capital Growth Fund |
| | | |
| | | For the Six Months Ended
| | |
| | | February 29, 2012
| | For the Fiscal Year Ended
|
| | | (Unaudited) | | August 31, 2011 |
| | | |
| | | Shares | | Dollars | | Shares | | Dollars |
| | | |
Class A Shares | | | | | | | | | | | | | | | | |
| Shares sold | | | 603,750 | | | $ | 12,825,344 | | | | 1,555,635 | | | $ | 32,486,114 | |
| Reinvestment of distributions | | | 52,304 | | | | 1,108,332 | | | | — | | | | — | |
Shares converted from Class B(a) | | | 194,589 | | | | 3,966,007 | | | | 517,341 | | | | 10,669,416 | |
| Shares redeemed | | | (3,711,843 | ) | | | (77,902,901 | ) | | | (9,761,969 | ) | | | (205,815,453 | ) |
| |
| |
| | | | (2,861,200 | ) | | | (60,003,218 | ) | | | (7,688,993 | ) | | | (162,659,923 | ) |
| |
| |
Class B Shares | | | | | | | | | | | | | | | | |
| Shares sold | | | 17,641 | | | | 339,321 | | | | 37,200 | | | | 690,543 | |
Shares converted to Class A(a) | | | (220,931 | ) | | | (3,966,007 | ) | | | (584,652 | ) | | | (10,669,416 | ) |
| Shares redeemed | | | (283,473 | ) | | | (5,191,627 | ) | | | (833,291 | ) | | | (15,373,996 | ) |
| |
| |
| | | | (486,763 | ) | | | (8,818,313 | ) | | | (1,380,743 | ) | | | (25,352,869 | ) |
| |
| |
Class C Shares | | | | | | | | | | | | | | | | |
| Shares sold | | | 123,467 | | | | 2,319,704 | | | | 287,552 | | | | 5,331,690 | |
| Reinvestment of distributions | | | — | | | | — | | | | — | | | | — | |
| Shares redeemed | | | (451,288 | ) | | | (8,441,442 | ) | | | (1,074,546 | ) | | | (20,011,568 | ) |
| |
| |
| | | | (327,821 | ) | | | (6,121,738 | ) | | | (786,994 | ) | | | (14,679,878 | ) |
| |
| |
Institutional Shares | | | | | | | | | | | | | | | | |
| Shares sold | | | 400,745 | | | | 9,002,687 | | | | 2,838,681 | | | | 61,830,828 | |
| Reinvestment of distributions | | | 34,518 | | | | 766,649 | | | | 50,006 | | | | 1,093,150 | |
| Shares redeemed | | | (7,655,391 | ) | | | (167,883,948 | ) | | | (7,556,910 | ) | | | (170,626,973 | ) |
| |
| |
| | | | (7,220,128 | ) | | | (158,114,612 | ) | | | (4,668,223 | ) | | | (107,702,995 | ) |
| |
| |
Service Shares | | | | | | | | | | | | | | | | |
| Shares sold | | | 6,827 | | | | 142,941 | | | | 4,427 | | | | 91,571 | |
| Reinvestment of distributions | | | 33 | | | | 693 | | | | — | | | | — | |
| Shares redeemed | | | (7,085 | ) | | | (151,917 | ) | | | (13,929 | ) | | | (290,405 | ) |
| |
| |
| | | | (225 | ) | | | (8,283 | ) | | | (9,502 | ) | | | (198,834 | ) |
| |
| |
Class IR Shares | | | | | | | | | | | | | | | | |
| Shares sold | | | 77,489 | | | | 1,834,053 | | | | 71,697 | | | | 1,465,515 | |
| Reinvestment of distributions | | | 452 | | | | 9,608 | | | | — | | | | — | |
| Shares redeemed | | | (12,306 | ) | | | (265,807 | ) | | | (903 | ) | | | (17,390 | ) |
| |
| |
| | | | 65,635 | | | | 1,577,854 | | | | 70,794 | | | | 1,448,125 | |
| |
| |
Class R Shares | | | | | | | | | | | | | | | | |
| Shares sold | | | 2,692 | | | | 55,833 | | | | 10,512 | | | | 216,325 | |
| Reinvestment of distributions | | | 28 | | | | 579 | | | | — | | | | — | |
| Shares redeemed | | | (1,136 | ) | | | (23,513 | ) | | | (6,047 | ) | | | (123,717 | ) |
| |
| |
| | | | 1,584 | | | | 32,899 | | | | 4,465 | | | | 92,608 | |
| |
| |
NET INCREASE (DECREASE) | | | (10,828,918 | ) | | $ | (231,455,411 | ) | | | (14,459,196 | ) | | $ | (309,053,766 | ) |
| |
| |
| | |
| (a) | | Class B Shares automatically convert into Class A Shares on or about the fifteenth day of the last month of the calendar quarter that is eight years after the initial purchase date of either the Fund or another Goldman Sachs Fund. |
GOLDMAN SACHS FUNDAMENTAL EQUITY GROWTH FUNDS
| | | | | | | | | | | | | | | | | | | | | | | | | | | | | | | |
| Concentrated Growth Fund | | Flexible Cap Growth Fund |
| |
For the Six Months Ended
| | | | For the Six Months Ended
| | |
February 29, 2012
| | For the Fiscal Year Ended
| | February 29, 2012
| | For the Fiscal Year Ended
|
| (Unaudited) | | August 31, 2011 | | (Unaudited) | | August 31, 2011 |
| |
| Shares | | Dollars | | Shares | | Dollars | | Shares | | Dollars | | Shares | | Dollars |
| |
| | | | | | | | | | | | | | | | | | | | | | | | | | | | | | | |
| | 123,984 | | | $ | 1,604,073 | | | | 1,878,216 | | | $ | 24,476,239 | | | | 73,803 | | | $ | 773,526 | | | | 354,170 | | | $ | 3,926,978 | |
| | — | | | | — | | | | — | | | | — | | | | 59,683 | | | | 598,033 | | | | 64,917 | | | | 703,695 | |
| | 96 | | | | 1,198 | | | | 1,868 | | | | 24,166 | | | | — | | | | — | | | | — | | | | — | |
| | (1,627,210 | ) | | | (20,988,859 | ) | | | (3,122,385 | ) | | | (40,975,515 | ) | | | (925,383 | ) | | | (9,123,492 | ) | | | (479,662 | ) | | | (5,329,471 | ) |
| |
| |
| | (1,503,130 | ) | | | (19,383,588 | ) | | | (1,242,301 | ) | | | (16,475,110 | ) | | | (791,897 | ) | | | (7,751,933 | ) | | | (60,575 | ) | | | (698,798 | ) |
| |
| |
| | | | | | | | | | | | | | | | | | | | | | | | | | | | | | | |
| | 501 | | | | 6,127 | | | | 2,287 | | | | 28,049 | | | | — | | | | — | | | | — | | | | — | |
| | (103 | ) | | | (1,198 | ) | | | (2,003 | ) | | | (24,166 | ) | | | — | | | | — | | | | — | | | | — | |
| | (5,520 | ) | | | (67,442 | ) | | | (35,631 | ) | | | (428,889 | ) | | | — | | | | — | | | | — | | | | — | |
| |
| |
| | (5,122 | ) | | | (62,513 | ) | | | (35,347 | ) | | | (425,006 | ) | | | — | | | | — | | | | — | | | | — | |
| |
| |
| | | | | | | | | | | | | | | | | | | | | | | | | | | | | | | |
| | 78,007 | | | | 889,938 | | | | 145,038 | | | | 1,716,565 | | | | 14,587 | | | | 146,948 | | | | 51,323 | | | | 555,682 | |
| | — | | | | — | | | | — | | | | — | | | | 5,501 | | | | 53,517 | | | | 3,270 | | | | 34,763 | |
| | (25,727 | ) | | | (305,186 | ) | | | (107,534 | ) | | | (1,313,120 | ) | | | (16,738 | ) | | | (164,185 | ) | | | (28,490 | ) | | | (300,527 | ) |
| |
| |
| | 52,280 | | | | 584,752 | | | | 37,504 | | | | 403,445 | | | | 3,350 | | | | 36,280 | | | | 26,103 | | | | 289,918 | |
| |
| |
| | | | | | | | | | | | | | | | | | | | | | | | | | | | | | | |
| | 135,111 | | | | 1,740,533 | | | | 1,246,480 | | | | 17,062,901 | | | | 6,457 | | | | 67,734 | | | | 119,276 | | | | 1,365,188 | |
| | 19,907 | | | | 266,563 | | | | 13,121 | | | | 175,827 | | | | 22,870 | | | | 233,496 | | | | 14,546 | | | | 159,860 | |
| | (4,058,839 | ) | | | (51,368,092 | ) | | | (2,653,330 | ) | | | (36,420,315 | ) | | | (8,431 | ) | | | (88,220 | ) | | | (71,293 | ) | | | (740,748 | ) |
| |
| |
| | (3,903,821 | ) | | | (49,360,996 | ) | | | (1,393,729 | ) | | | (19,181,587 | ) | | | 20,896 | | | | 213,010 | | | | 62,529 | | | | 784,300 | |
| |
| |
| | | | | | | | | | | | | | | | | | | | | | | | | | | | | | | |
| | — | | | | — | | | | — | | | | — | | | | — | | | | — | | | | — | | | | — | |
| | — | | | | — | | | | — | | | | — | | | | — | | | | — | | | | — | | | | — | |
| | — | | | | — | | | | — | | | | — | | | | — | | | | — | | | | — | | | | — | |
| |
| |
| | — | | | | — | | | | — | | | | — | | | | — | | | | — | | | | — | | | | — | |
| |
| |
| | | | | | | | | | | | | | | | | | | | | | | | | | | | | | | |
| | 3,442 | | | | 43,400 | | | | 24,640 | | | | 315,852 | | | | 1,401 | | | | 14,000 | | | | 8,601 | | | | 91,517 | |
| | 112 | | | | 1,459 | | | | 10 | | | | 128 | | | | 672 | | | | 6,825 | | | | 208 | | | | 2,276 | |
| | (1,702 | ) | | | (21,955 | ) | | | (3,670 | ) | | | (50,893 | ) | | | (1,444 | ) | | | (15,634 | ) | | | (2,305 | ) | | | (23,650 | ) |
| |
| |
| | 1,852 | | | | 22,904 | | | | 20,980 | | | | 265,087 | | | | 629 | | | | 5,191 | | | | 6,504 | | | | 70,143 | |
| |
| |
| | | | | | | | | | | | | | | | | | | | | | | | | | | | | | | |
| | — | | | | — | | | | — | | | | — | | | | 14,631 | | | | 136,988 | | | | 1 | | | | 13 | |
| | — | | | | — | | | | — | | | | — | | | | 938 | | | | 9,321 | | | | 47 | | | | 510 | |
| | — | | | | — | | | | — | | | | — | | | | (4 | ) | | | (44 | ) | | | (1 | ) | | | (13 | ) |
| |
| |
| | — | | | | — | | | | — | | | | — | | | | 15,565 | | | | 146,265 | | | | 47 | | | | 510 | |
| |
| |
| | (5,357,941 | ) | | $ | (68,199,441 | ) | | | (2,612,893 | ) | | $ | (35,413,171 | ) | | | (751,457 | ) | | $ | (7,351,187 | ) | | | 34,608 | | | $ | 446,073 | |
| |
| |
GOLDMAN SACHS FUNDAMENTAL EQUITY GROWTH FUNDS
Notes to Financial Statements (continued)
February 29, 2012 (Unaudited)
| |
| 11. SUMMARY OF SHARE TRANSACTIONS (continued) | |
Share activity is as follows:
| | | | | | | | | |
| | | Focused Growth Fund(b) |
| | | |
| | | For the Period Ended
|
| | | February 29, 2012
|
| | | (Unaudited) |
| | | |
| | | Shares | | Dollars |
| | | |
Class A Shares | | | | | | | | |
| Shares sold | | | 1,000 | | | $ | 10,000 | |
| Reinvestment of distributions | | | — | | | | — | |
Shares converted from Class B(a) | | | — | | | | — | |
| Shares redeemed | | | — | | | | — | |
| |
| |
| | | | 1,000 | | | | 10,000 | |
| |
| |
Class B Shares | | | | | | | | |
| Shares sold | | | — | | | | — | |
| Reinvestment of distributions | | | — | | | | — | |
Shares converted to Class A(a) | | | — | | | | — | |
| Shares redeemed | | | — | | | | — | |
| |
| |
| | | | — | | | | — | |
| |
| |
Class C Shares | | | | | | | | |
| Shares sold | | | 1,000 | | | | 10,000 | |
| Reinvestment of distributions | | | — | | | | — | |
| Shares redeemed | | | — | | | | — | |
| |
| |
| | | | 1,000 | | | | 10,000 | |
| |
| |
Institutional Shares | | | | | | | | |
| Shares sold | | | 224,729 | | | | 2,260,000 | |
| Reinvestment of distributions | | | — | | | | — | |
| Shares redeemed in connection with in-kind transactions | | | — | | | | — | |
| Shares redeemed | | | — | | | | — | |
| |
| |
| | | | 224,729 | | | | 2,260,000 | |
| |
| |
Service Shares | | | | | | | | |
| Shares sold | | | — | | | | — | |
| Reinvestment of distributions | | | — | | | | — | |
| Shares redeemed | | | — | | | | — | |
| |
| |
| | | | — | | | | — | |
| |
| |
Class IR Shares | | | | | | | | |
| Shares sold | | | 1,000 | | | | 10,000 | |
| Reinvestment of distributions | | | — | | | | — | |
| Shares redeemed | | | — | | | | — | |
| |
| |
| | | | 1,000 | | | | 10,000 | |
| |
| |
Class R Shares | | | | | | | | |
| Shares sold | | | 1,000 | | | | 10,000 | |
| Reinvestment of distributions | | | — | | | | — | |
| Shares redeemed | | | — | | | | — | |
| |
| |
| | | | 1,000 | | | | 10,000 | |
| |
| |
NET INCREASE (DECREASE) | | | 228,729 | | | $ | 2,300,000 | |
| |
| |
| | |
| (a) | | Class B Shares automatically convert into Class A Shares on or about the fifteenth day of the last month of the calendar quarter that is eight years after the initial purchase date of either the Fund or another Goldman Sachs Fund. |
| (b) | | Commenced operations on January 31, 2012. |
GOLDMAN SACHS FUNDAMENTAL EQUITY GROWTH FUNDS
| | | | | | | | | | | | | | | | | | | | | | | | | | | | | | | |
| Growth Opportunities Fund | | Small/Mid Cap Growth Fund |
| |
For the Six Months Ended
| | | | For the Six Months Ended
| | |
February 29, 2012
| | For the Fiscal Year Ended
| | February 29, 2012
| | For the Fiscal Year Ended
|
| (Unaudited) | | August 31, 2011 | | (Unaudited) | | August 31, 2011 |
| |
| Shares | | Dollars | | Shares | | Dollars | | Shares | | Dollars | | Shares | | Dollars |
| |
| | | | | | | | | | | | | | | | | | | | | | | | | | | | | | | |
| | 6,617,854 | | | $ | 139,976,076 | | | | 28,906,119 | | | $ | 662,459,985 | | | | 3,411,805 | | | $ | 47,495,948 | | | | 17,806,338 | | | $ | 260,408,456 | |
| | 2,839,155 | | | | 59,650,646 | | | | 411,473 | | | | 9,319,866 | | | | 1,220,980 | | | | 16,666,374 | | | | 437,802 | | | | 6,339,378 | |
| | 18,516 | | | | 379,966 | | | | 43,737 | | | | 969,396 | | | | 7,410 | | | | 97,570 | | | | 17,216 | | | | 245,731 | |
| | (13,081,495 | ) | | | (278,295,699 | ) | | | (21,596,067 | ) | | | (493,785,810 | ) | | | (9,051,007 | ) | | | (123,999,644 | ) | | | (10,880,532 | ) | | | (156,089,376 | ) |
| |
| |
| | (3,605,970 | ) | | | (78,289,011 | ) | | | 7,765,262 | | | | 178,963,437 | | | | (4,410,812 | ) | | | (59,739,752 | ) | | | 7,380,824 | | | | 110,904,189 | |
| |
| |
| | | | | | | | | | | | | | | | | | | | | | | | | | | | | | | |
| | 13,392 | | | | 260,072 | | | | 55,012 | | | | 1,136,278 | | | | 19,158 | | | | 250,812 | | | | 86,654 | | | | 1,212,417 | |
| | 50,305 | | | | 938,689 | | | | 10,587 | | | | 216,297 | | | | 15,992 | | | | 206,298 | | | | 8,458 | | | | 116,888 | |
| | (20,763 | ) | | | (379,966 | ) | | | (48,496 | ) | | | (969,396 | ) | | | (7,836 | ) | | | (97,570 | ) | | | (18,064 | ) | | | (245,731 | ) |
| | (172,073 | ) | | | (3,261,769 | ) | | | (388,110 | ) | | | (7,863,037 | ) | | | (65,396 | ) | | | (848,297 | ) | | | (186,162 | ) | | | (2,571,648 | ) |
| |
| |
| | (129,139 | ) | | | (2,442,974 | ) | | | (371,007 | ) | | | (7,479,858 | ) | | | (38,082 | ) | | | (488,757 | ) | | | (109,114 | ) | | | (1,488,074 | ) |
| |
| |
| | | | | | | | | | | | | | | | | | | | | | | | | | | | | | | |
| | 671,486 | | | | 12,609,131 | | | | 2,589,720 | | | | 52,729,316 | | | | 614,943 | | | | 8,095,365 | | | | 3,432,872 | | | | 48,233,787 | |
| | 422,485 | | | | 7,807,516 | | | | 60,687 | | | | 1,228,306 | | | | 235,881 | | | | 3,040,509 | | | | 67,111 | | | | 927,466 | |
| | (1,477,655 | ) | | | (27,777,911 | ) | | | (1,847,824 | ) | | | (37,440,017 | ) | | | (1,007,638 | ) | | | (13,052,407 | ) | | | (1,467,811 | ) | | | (20,315,206 | ) |
| |
| |
| | (383,684 | ) | | | (7,361,264 | ) | | | 802,583 | | | | 16,517,605 | | | | (156,814 | ) | | | (1,916,533 | ) | | | 2,032,172 | | | | 28,846,047 | |
| |
| |
| | | | | | | | | | | | | | | | | | | | | | | | | | | | | | | |
| | 19,137,104 | | | | 433,660,690 | | | | 56,802,531 | | | | 1,376,785,326 | | | | 4,311,291 | | | | 60,523,057 | | | | 16,191,873 | | | | 241,966,283 | |
| | 4,498,136 | | | | 100,983,169 | | | | 646,278 | | | | 15,517,136 | | | | 722,281 | | | | 10,097,488 | | | | 208,987 | | | | 3,084,657 | |
| | — | | | | — | | | | (1,064,468 | ) | | | (27,101,361 | ) | | | — | | | | — | | | | — | | | | — | |
| | (27,668,760 | ) | | | (632,277,634 | ) | | | (40,904,735 | ) | | | (981,848,752 | ) | | | (11,225,229 | ) | | | (156,082,046 | ) | | | (10,124,193 | ) | | | (151,495,416 | ) |
| |
| |
| | (4,033,520 | ) | | | (97,633,775 | ) | | | 15,479,606 | | | | 383,352,349 | | | | (6,191,657 | ) | | | (85,461,501 | ) | | | 6,276,667 | | | | 93,555,524 | |
| |
| |
| | | | | | | | | | | | | | | | | | | | | | | | | | | | | | | |
| | 287,307 | | | | 6,049,536 | | | | 885,822 | | | | 19,906,308 | | | | 109,977 | | | | 1,536,312 | | | | 382,636 | | | | 5,451,942 | |
| | 121,131 | | | | 2,500,144 | | | | 22,720 | | | | 506,419 | | | | 5,394 | | | | 72,774 | | | | 1,444 | | | | 20,703 | |
| | (481,631 | ) | | | (10,088,397 | ) | | | (1,435,145 | ) | | | (32,296,457 | ) | | | (140,527 | ) | | | (1,904,044 | ) | | | (180,265 | ) | | | (2,637,933 | ) |
| |
| |
| | (73,193 | ) | | | (1,538,717 | ) | | | (526,603 | ) | | | (11,883,730 | ) | | | (25,156 | ) | | | (294,958 | ) | | | 203,815 | | | | 2,834,712 | |
| |
| |
| | | | | | | | | | | | | | | | | | | | | | | | | | | | | | | |
| | 670,462 | | | | 14,310,765 | | | | 2,510,383 | | | | 55,981,006 | | | | 1,013,941 | | | | 14,382,396 | | | | 2,112,253 | | | | 30,220,391 | |
| | 166,081 | | | | 3,529,228 | | | | 7,946 | | | | 181,396 | | | | 109,459 | | | | 1,510,526 | | | | 19,223 | | | | 280,657 | |
| | (621,559 | ) | | | (13,679,986 | ) | | | (639,883 | ) | | | (14,833,736 | ) | | | (602,141 | ) | | | (8,357,990 | ) | | | (1,134,031 | ) | | | (16,477,006 | ) |
| |
| |
| | 214,984 | | | | 4,160,007 | | | | 1,878,446 | | | | 41,328,666 | | | | 521,259 | | | | 7,534,932 | | | | 997,445 | | | | 14,024,042 | |
| |
| |
| | | | | | | | | | | | | | | | | | | | | | | | | | | | | | | |
| | 599,432 | | | | 12,720,784 | | | | 1,440,580 | | | | 32,841,821 | | | | 298,147 | | | | 4,146,377 | | | | 505,920 | | | | 7,448,163 | |
| | 123,115 | | | | 2,560,779 | | | | 6,967 | | | | 156,695 | | | | 58,489 | | | | 790,187 | | | | 17,133 | | | | 246,367 | |
| | (240,453 | ) | | | (5,043,890 | ) | | | (264,256 | ) | | | (6,053,724 | ) | | | (179,639 | ) | | | (2,473,356 | ) | | | (248,097 | ) | | | (3,637,035 | ) |
| |
| |
| | 482,094 | | | | 10,237,673 | | | | 1,183,291 | | | | 26,944,792 | | | | 176,997 | | | | 2,463,208 | | | | 274,956 | | | | 4,057,495 | |
| |
| |
| | (7,528,428 | ) | | $ | (172,868,061 | ) | | | 26,211,578 | | | $ | 627,743,261 | | | | (10,124,265 | ) | | $ | (137,903,361 | ) | | | 17,056,765 | | | $ | 252,733,935 | |
| |
| |
GOLDMAN SACHS FUNDAMENTAL EQUITY GROWTH FUNDS
Notes to Financial Statements (continued)
February 29, 2012 (Unaudited)
| |
| 11. SUMMARY OF SHARE TRANSACTIONS (continued) | |
Share activity is as follows:
| | | | | | | | | | | | | | | | | |
| | | Strategic Growth Fund |
| | | |
| | | For the Six Months Ended
| | |
| | | February 29, 2012
| | For the Fiscal Year Ended
|
| | | (Unaudited) | | August 31, 2011 |
| | | |
| | | Shares | | Dollars | | Shares | | Dollars |
| | | |
Class A Shares | | | | | | | | | | | | | | | | |
| Shares sold | | | 3,649,706 | | | $ | 35,214,237 | | | | 5,919,661 | | | $ | 59,685,127 | |
| Reinvestment of distributions | | | 29,590 | | | | 295,906 | | | | 59,355 | | | | 594,739 | |
Shares converted from Class B(a) | | | 7,452 | | | | 71,687 | | | | 9,608 | | | | 91,784 | |
| Shares redeemed | | | (6,544,090 | ) | | | (65,428,468 | ) | | | (8,187,213 | ) | | | (82,372,278 | ) |
| |
| |
| | | | (2,857,342 | ) | | | (29,846,638 | ) | | | (2,198,589 | ) | | | (22,000,628 | ) |
| |
| |
Class B Shares | | | | | | | | | | | | | | | | |
| Shares sold | | | 3,380 | | | | 31,366 | | | | 12,741 | | | | 118,166 | |
Shares converted to Class A(a) | | | (8,141 | ) | | | (71,687 | ) | | | (10,455 | ) | | | (91,784 | ) |
| Shares redeemed | | | (48,708 | ) | | | (431,989 | ) | | | (143,329 | ) | | | (1,317,333 | ) |
| |
| |
| | | | (53,469 | ) | | | (472,310 | ) | | | (141,043 | ) | | | (1,290,951 | ) |
| |
| |
Class C Shares | | | | | | | | | | | | | | | | |
| Shares sold | | | 14,408 | | | | 132,818 | | | | 147,513 | | | | 1,365,131 | |
| Reinvestment of distributions | | | — | | | | — | | | | — | | | | — | |
| Shares redeemed | | | (127,744 | ) | | | (1,173,031 | ) | | | (335,584 | ) | | | (3,086,238 | ) |
| |
| |
| | | | (113,336 | ) | | | (1,040,213 | ) | | | (188,071 | ) | | | (1,721,107 | ) |
| |
| |
Institutional Shares | | | | | | | | | | | | | | | | |
| Shares sold | | | 7,132,563 | | | | 69,674,705 | | | | 9,469,965 | | | | 98,906,315 | |
| Reinvestment of distributions | | | 145,344 | | | | 1,504,317 | | | | 164,784 | | | | 1,708,805 | |
| Shares redeemed | | | (7,727,662 | ) | | | (79,385,923 | ) | | | (13,866,852 | ) | | | (144,042,805 | ) |
| |
| |
| | | | (449,755 | ) | | | (8,206,901 | ) | | | (4,232,103 | ) | | | (43,427,685 | ) |
| |
| |
Service Shares | | | | | | | | | | | | | | | | |
| Shares sold | | | 60 | | | | 583 | | | | 21 | | | | 227 | |
| Reinvestment of distributions | | | 1 | | | | 4 | | | | 1 | | | | 4 | |
| Shares redeemed | | | — | | | | — | | | | — | | | | — | |
| |
| |
| | | | 61 | | | | 587 | | | | 22 | | | | 231 | |
| |
| |
Class IR Shares | | | | | | | | | | | | | | | | |
| Shares sold | | | 24,066 | | | | 250,355 | | | | 139,872 | | | | 1,487,947 | |
| Reinvestment of distributions | | | — | | | | — | | | | 72 | | | | 740 | |
| Shares redeemed | | | (8,560 | ) | | | (94,239 | ) | | | (128,653 | ) | | | (1,230,199 | ) |
| |
| |
| | | | 15,506 | | | | 156,116 | | | | 11,291 | | | | 258,488 | |
| |
| |
Class R Shares | | | | | | | | | | | | | | | | |
| Reinvestment of distributions | | | — | | | | — | | | | 1 | | | | 2 | |
| |
| |
NET DECREASE | | | (3,458,335 | ) | | $ | (39,409,359 | ) | | | (6,748,492 | ) | | $ | (68,181,650 | ) |
| |
| |
| | |
| (a) | | Class B Shares automatically convert into Class A Shares on or about the fifteenth day of the last month of the calendar quarter that is eight years after the initial purchase date of either the Fund or another Goldman Sachs Fund. |
GOLDMAN SACHS FUNDAMENTAL EQUITY GROWTH FUNDS
| |
| 11. SUMMARY OF SHARE TRANSACTIONS (continued) | |
Share activity is as follows:
| | | | | | | | | | | | | | | | | |
| | | Technology Tollkeeper Fund |
| | | |
| | | For the Six Months Ended
| | |
| | | February 29, 2012
| | For the Fiscal Year Ended
|
| | | (Unaudited) | | August 31, 2011 |
| | | |
| | | Shares | | Dollars | | Shares | | Dollars |
| | | |
Class A Shares | | | | | | | | | | | | | | | | |
| Shares sold | | | 2,164,284 | | | $ | 25,963,240 | | | | 9,661,103 | | | $ | 124,129,224 | |
| Reinvestment of distributions | | | — | | | | — | | | | — | | | | — | |
Shares converted from Class B(a) | | | 54,052 | | | | 620,774 | | | | 185,626 | | | | 2,295,614 | |
| Shares redeemed | | | (4,861,707 | ) | | | (55,744,179 | ) | | | (10,294,484 | ) | | | (131,156,646 | ) |
| |
| |
| | | | (2,643,371 | ) | | | (29,160,165 | ) | | | (447,755 | ) | | | (4,731,808 | ) |
| |
| |
Class B Shares | | | | | | | | | | | | | | | | |
| Shares sold | | | 9,622 | | | | 108,715 | | | | 34,490 | | | | 411,268 | |
Shares converted to Class A(a) | | | (59,186 | ) | | | (620,774 | ) | | | (202,269 | ) | | | (2,295,614 | ) |
| Shares redeemed | | | (119,792 | ) | | | (1,284,874 | ) | | | (254,401 | ) | | | (2,960,913 | ) |
| |
| |
| | | | (169,356 | ) | | | (1,796,933 | ) | | | (422,180 | ) | | | (4,845,259 | ) |
| |
| |
Class C Shares | | | | | | | | | | | | | | | | |
| Shares sold | | | 277,300 | | | | 2,996,734 | | | | 1,336,301 | | | | 15,824,448 | |
| Reinvestment of distributions | | | — | | | | — | | | | — | | | | — | |
| Shares redeemed | | | (598,873 | ) | | | (6,480,450 | ) | | | (1,439,517 | ) | | | (16,682,706 | ) |
| |
| |
| | | | (321,573 | ) | | | (3,483,716 | ) | | | (103,216 | ) | | | (858,258 | ) |
| |
| |
Institutional Shares | | | | | | | | | | | | | | | | |
| Shares sold | | | 1,206,912 | | | | 14,937,796 | | | | 3,814,658 | | | | 51,912,763 | |
| Reinvestment of distributions | | | — | | | | — | | | | — | | | | — | |
| Shares redeemed | | | (2,083,522 | ) | | | (25,176,882 | ) | | | (2,301,612 | ) | | | (29,939,796 | ) |
| |
| |
| | | | (876,610 | ) | | | (10,239,086 | ) | | | 1,513,046 | | | | 21,972,967 | |
| |
| |
Service Shares | | | | | | | | | | | | | | | | |
| Shares sold | | | 1,250,773 | | | | 14,320,427 | | | | 904,887 | | | | 11,519,099 | |
| Reinvestment of distributions | | | — | | | | — | | | | — | | | | — | |
| Shares redeemed | | | (1,436,820 | ) | | | (17,239,229 | ) | | | (1,050,906 | ) | | | (12,565,541 | ) |
| |
| |
| | | | (186,047 | ) | | | (2,918,802 | ) | | | (146,019 | ) | | | (1,046,442 | ) |
| |
| |
Class IR Shares(b) | | | | | | | | | | | | | | | | |
| Shares sold | | | 4,176 | | | | 55,129 | | | | 208,505 | | | | 2,621,331 | |
| Reinvestment of distributions | | | — | | | | — | | | | — | | | | — | |
| Shares redeemed | | | (27,235 | ) | | | (342,254 | ) | | | (5,486 | ) | | | (69,586 | ) |
| |
| |
| | | | (23,059 | ) | | | (287,125 | ) | | | 203,019 | | | | 2,551,745 | |
| |
| |
Class R Shares | | | | | | | | | | | | | | | | |
| Reinvestment of distributions | | | — | | | | — | | | | — | | | | — | |
| |
| |
NET INCREASE (DECREASE) | | | (4,220,016 | ) | | $ | (47,885,827 | ) | | | 596,895 | | | $ | 13,042,945 | |
| |
| |
| | |
| (a) | | Class B Shares automatically convert into Class A Shares on or about the fifteenth day of the last month of the calendar quarter that is eight years after the initial purchase date of either the Fund or another Goldman Sachs Fund. |
| (b) | | Commenced operations on September 30, 2010. |
GOLDMAN SACHS FUNDAMENTAL EQUITY GROWTH FUNDS
Notes to Financial Statements (continued)
February 29, 2012 (Unaudited)
| |
| 11. SUMMARY OF SHARE TRANSACTIONS (continued) | |
Share activity is as follows:
| | | | | | | | | | | | | | | | | |
| | | U.S. Equity Fund |
| | | |
| | | For the Six Months Ended
| | |
| | | February 29, 2012
| | For the Fiscal Year Ended
|
| | | (Unaudited) | | August 31, 2011 |
| | | |
| | | Shares | | Dollars | | Shares | | Dollars |
| | | |
Class A Shares | | | | | | | | | | | | | | | | |
| Shares sold | | | 30,509 | | | $ | 324,406 | | | | 305,574 | | | $ | 3,519,033 | |
| Reinvestment of distributions | | | 3,237 | | | | 35,118 | | | | 286 | | | | 3,204 | |
Shares converted from Class B(a) | | | — | | | | — | | | | — | | | | — | |
| Shares redeemed | | | (43,556 | ) | | | (474,461 | ) | | | (96,969 | ) | | | (1,066,675 | ) |
| |
| |
| | | | (9,810 | ) | | | (114,937 | ) | | | 208,891 | | | | 2,455,562 | |
| |
| |
Class B Shares | | | | | | | | | | | | | | | | |
| Shares sold | | | — | | | | — | | | | — | | | | — | |
Shares converted to Class A(a) | | | — | | | | — | | | | — | | | | — | |
| Shares redeemed | | | — | | | | — | | | | — | | | | — | |
| |
| |
| | | | — | | | | — | | | | — | | | | — | |
| |
| |
Class C Shares | | | | | | | | | | | | | | | | |
| Shares sold | | | 3,335 | | | | 37,345 | | | | 11,980 | | | | 138,657 | |
| Reinvestment of distributions | | | 129 | | | | 1,397 | | | | 17 | | | | 193 | |
| Shares redeemed | | | (2,070 | ) | | | (22,451 | ) | | | (413 | ) | | | (4,729 | ) |
| |
| |
| | | | 1,394 | | | | 16,291 | | | | 11,584 | | | | 134,121 | |
| |
| |
Institutional Shares | | | | | | | | | | | | | | | | |
| Shares sold | | | 98,918 | | | | 1,131,402 | | | | 120,058 | | | | 1,360,764 | |
| Reinvestment of distributions | | | 5,516 | | | | 59,956 | | | | 2,411 | | | | 27,103 | |
| Shares redeemed | | | (127,944 | ) | | | (1,369,194 | ) | | | (24,404 | ) | | | (274,184 | ) |
| |
| |
| | | | (23,510 | ) | | | (177,836 | ) | | | 98,065 | | | | 1,113,683 | |
| |
| |
Service Shares | | | | | | | | | | | | | | | | |
| Shares sold | | | — | | | | — | | | | — | | | | — | |
| Reinvestment of distributions | | | — | | | | — | | | | — | | | | — | |
| Shares redeemed | | | — | | | | — | | | | — | | | | — | |
| |
| |
| | | | — | | | | — | | | | — | | | | — | |
| |
| |
Class IR Shares | | | | | | | | | | | | | | | | |
| Shares sold | | | 1,997 | | | | 22,500 | | | | 20,821 | | | | 233,650 | |
| Reinvestment of distributions | | | 112 | | | | 1,222 | | | | 122 | | | | 1,375 | |
| Shares redeemed | | | (19,406 | ) | | | (209,515 | ) | | | (596 | ) | | | (7,090 | ) |
| |
| |
| | | | (17,297 | ) | | | (185,793 | ) | | | 20,347 | | | | 227,935 | |
| |
| |
Class R Shares | | | | | | | | | | | | | | | | |
| Reinvestment of distributions | | | 11 | | | | 115 | | | | 4 | | | | 42 | |
| |
| |
NET INCREASE (DECREASE) | | | (49,212 | ) | | $ | (462,160 | ) | | | 338,891 | | | $ | 3,931,343 | |
| |
| |
| | |
| (a) | | Class B Shares automatically convert into Class A Shares on or about the fifteenth day of the last month of the calendar quarter that is eight years after the initial purchase date of either the Fund or another Goldman Sachs Fund. |
GOLDMAN SACHS FUNDAMENTAL EQUITY GROWTH FUNDS
Fund Expenses — Six Month Period Ended February 29, 2012 (Unaudited)
As a shareholder of Class A, Class B, Class C, Institutional, Service, Class IR or Class R Shares of a Fund, you incur two types of costs: (1) transaction costs, including sales charges on purchase payments (with respect to Class A Shares), contingent deferred sales charges on redemptions (with respect to Class B and Class C Shares), and (2) ongoing costs, including management fees; distribution and service (12b-1) fees (with respect to Class A, Class B, Class C and Class R Shares); and other Fund expenses. This Example is intended to help you understand your ongoing costs (in dollars) of investing in Class A, Class B, Class C, Institutional, Service, Class IR or Class R Shares of the Funds and to compare these costs with the ongoing costs of investing in other mutual funds.
The Example is based on an investment of $1,000 invested at the beginning of the period and held for the entire period from September 1, 2011 through February 29, 2012.
Actual Expenses — The first line under each share class in the table below provides information about actual account values and actual expenses. You may use the information in this line, together with the amount you invested, to estimate the expenses that you paid over the period. Simply divide your account value by $1,000 (for example, an $8,600 account value divided by $1,000=8.6), then multiply the result by the number in the first line under the heading entitled “Expenses Paid” to estimate the expenses you paid on your account during this period.
Hypothetical Example for Comparison Purposes — The second line under each share class in the table below provides information about hypothetical account values and hypothetical expenses based on the Funds’ actual net expense ratios and an assumed rate of return of 5% per year before expenses, which is not the Funds’ actual return. The hypothetical account values and expenses may not be used to estimate the actual ending account balance or expenses you paid for the period. You may use this information to compare the ongoing costs of investing in the Funds and other funds. To do so, compare this 5% hypothetical example with the 5% hypothetical examples that appear in the shareholder reports of the other funds.
Please note that the expenses shown in the table are meant to highlight your ongoing costs only and do not reflect any transactional costs, such as sales charges, redemption fees, or exchange fees. Therefore, the second line of the table is useful in comparing ongoing costs only, and will not help you determine the relative total costs of owning different funds. In addition, if these transactional costs were included, your costs would have been higher.
| | | | | | | | | | | | | | | | | | | | | | | | | | | | | | | | | | | | | | | | | | | | | | | | | | | | | | | | | | | | | | | | | | | | | | | | | | | | |
| | | | Capital Growth Fund | | | Concentrated Growth Fund | | | Flexible Cap Growth Fund | | | Focused Growth Fund(a) | | | Growth Opportunities Fund |
| | | | | | | | | | Expenses
| | | | | | | | | Expenses
| | | | | | | | | Expenses
| | | | | | | | | Expenses
| | | | | | | | | Expenses
|
| | | | Beginning
| | | Ending
| | | Paid for the
| | | Beginning
| | | Ending
| | | Paid for the
| | | Beginning
| | | Ending
| | | Paid for the
| | | Beginning
| | | Ending
| | | Paid for the
| | | Beginning
| | | Ending
| | | Paid for the
|
| | | | Account
| | | Account
| | | 6 months
| | | Account
| | | Account
| | | 6 months
| | | Account
| | | Account
| | | 6 months
| | | Account
| | | Account
| | | period
| | | Account
| | | Account
| | | 6 months
|
| | | | Value
| | | Value
| | | ended
| | | Value
| | | Value
| | | ended
| | | Value
| | | Value
| | | ended
| | | Value
| | | Value
| | | ended
| | | Value
| | | Value
| | | ended
|
| Share Class | | | 9/1/11 | | | 2/29/12 | | | 2/29/12* | | | 9/1/11 | | | 2/29/12 | | | 2/29/12* | | | 9/1/11 | | | 2/29/12 | | | 2/29/12* | | | 2/1/12 | | | 2/29/12 | | | 2/29/12* | | | 9/1/11 | | | 2/29/12 | | | 2/29/12* |
Class A | | | | | | | | | | | | | | | | | | | | | | | | | | | | | | | | | | | | | | | | | | | | | | | | | | | | | | | | | | | | | | | | | | | | | | | | | | | |
| Actual | | | $ | 1,000.00 | | | | $ | 1,150.90 | | | | $ | 6.10 | | | | $ | 1,000.00 | | | | $ | 1,141.60 | | | | $ | 6.71 | | | | $ | 1,000.00 | | | | $ | 1,136.90 | | | | $ | 6.69 | | | | $ | 1,000.00 | | | | $ | 1,065.00 | | | | $ | 1.01 | | | | $ | 1,000.00 | | | | $ | 1,170.10 | | | | $ | 7.28 | |
| Hypothetical 5% return | | | | 1,000.00 | | | | | 1,019.19 | + | | | | 5.72 | | | | | 1,000.00 | | | | | 1,018.60 | + | | | | 6.32 | | | | | 1,000.00 | | | | | 1,018.60 | + | | | | 6.32 | | | | | 1,000.00 | | | | | 1,002.98 | + | | | | 0.98 | | | | | 1,000.00 | | | | | 1,018.15 | + | | | | 6.77 | |
| |
Class B | | | | | | | | | | | | | | | | | | | | | | | | | | | | | | | | | | | | | | | | | | | | | | | | | | | | | | | | | | | | | | | | | | | | | | | | | | | |
| Actual | | | | 1,000.00 | | | | | 1,146.20 | | | | | 10.09 | | | | | 1,000.00 | | | | | 1,137.90 | | | | | 10.68 | | | | | N/A | | | | | N/A | | | | | N/A | | | | | N/A | | | | | N/A | | | | | N/A | | | | | 1,000.00 | | | | | 1,166.00 | | | | | 11.31 | |
| Hypothetical 5% return | | | | 1,000.00 | | | | | 1,015.47 | + | | | | 9.47 | | | | | 1,000.00 | | | | | 1,014.87 | + | | | | 10.07 | | | | | N/A | | | | | N/A | | | | | N/A | | | | | N/A | | | | | N/A | | | | | N/A | | | | | 1,000.00 | | | | | 1,014.42 | + | | | | 10.52 | |
| |
Class C | | | | | | | | | | | | | | | | | | | | | | | | | | | | | | | | | | | | | | | | | | | | | | | | | | | | | | | | | | | | | | | | | | | | | | | | | | | |
| Actual | | | | 1,000.00 | | | | | 1,146.40 | | | | | 10.09 | | | | | 1,000.00 | | | | | 1,138.10 | | | | | 10.69 | | | | | 1,000.00 | | | | | 1,133.50 | | | | | 10.66 | | | | | 1,000.00 | | | | | 1,065.00 | | | | | 1.63 | | | | | 1,000.00 | | | | | 1,065.90 | | | | | 11.31 | |
| Hypothetical 5% return | | | | 1,000.00 | | | | | 1,015.47 | + | | | | 9.47 | | | | | 1,000.00 | | | | | 1,014.87 | + | | | | 10.07 | | | | | 1,000.00 | | | | | 1,014.87 | + | | | | 10.07 | | | | | 1,000.00 | | | | | 1,002.38 | + | | | | 1.58 | | | | | 1,000.00 | | | | | 1,014.42 | + | | | | 10.52 | |
| |
Institutional | | | | | | | | | | | | | | | | | | | | | | | | | | | | | | | | | | | | | | | | | | | | | | | | | | | | | | | | | | | | | | | | | | | | | | | | | | | |
| Actual | | | | 1,000.00 | | | | | 1,152.70 | | | | | 3.96 | | | | | 1,000.00 | | | | | 1,143.30 | | | | | 4.58 | | | | | 1,000.00 | | | | | 1,139.50 | | | | | 4.57 | | | | | 1,000.00 | | | | | 1,065.00 | | | | | 0.69 | | | | | 1,000.00 | | | | | 1,172.80 | | | | | 5.13 | |
| Hypothetical 5% return | | | | 1,000.00 | | | | | 1,021.18 | + | | | | 3.72 | | | | | 1,000.00 | | | | | 1,020.59 | + | | | | 4.32 | | | | | 1,000.00 | | | | | 1,020.59 | + | | | | 4.32 | | | | | 1,000.00 | | | | | 1,003.30 | + | | | | 0.67 | | | | | 1,000.00 | | | | | 1,020.14 | + | | | | 4.77 | |
| |
Service | | | | | | | | | | | | | | | | | | | | | | | | | | | | | | | | | | | | | | | | | | | | | | | | | | | | | | | | | | | | | | | | | | | | | | | | | | | |
| Actual | | | | 1,000.00 | | | | | 1,150.10 | | | | | 6.63 | | | | | N/A | | | | | N/A | | | | | N/A | | | | | N/A | | | | | N/A | | | | | N/A | | | | | N/A | | | | | N/A | | | | | N/A | | | | | 1,000.00 | | | | | 1,169.60 | | | | | 7.82 | |
| Hypothetical 5% return | | | | 1,000.00 | | | | | 1,018.70 | + | | | | 6.22 | | | | | N/A | | | | | N/A | | | | | N/A | | | | | N/A | | | | | N/A | | | | | N/A | | | | | N/A | | | | | N/A | | | | | N/A | | | | | 1,000.00 | | | | | 1,017.65 | + | | | | 7.27 | |
| |
Class IR | | | | | | | | | | | | | | | | | | | | | | | | | | | | | | | | | | | | | | | | | | | | | | | | | | | | | | | | | | | | | | | | | | | | | | | | | | | |
| Actual | | | | 1,000.00 | | | | | 1,152.00 | | | | | 4.76 | | | | | 1,000.00 | | | | | 1,143.30 | | | | | 5.38 | | | | | 1,000.00 | | | | | 1,139.30 | | | | | 5.37 | | | | | 1,000.00 | | | | | 1,065.00 | | | | | 0.81 | | | | | 1,000.00 | | | | | 1,171.70 | | | | | 5.94 | |
| Hypothetical 5% return | | | | 1,000.00 | | | | | 1,020.44 | + | | | | 4.47 | | | | | 1,000.00 | | | | | 1,019.84 | + | | | | 5.07 | | | | | 1,000.00 | | | | | 1,019.84 | + | | | | 5.07 | | | | | 1,000.00 | | | | | 1,003.18 | + | | | | 0.79 | | | | | 1,000.00 | | | | | 1,019.39 | + | | | | 5.52 | |
| |
Class R | | | | | | | | | | | | | | | | | | | | | | | | | | | | | | | | | | | | | | | | | | | | | | | | | | | | | | | | | | | | | | | | | | | | | | | | | | | |
| Actual | | | | 1,000.00 | | | | | 1,149.30 | | | | | 7.43 | | | | | 1,000.00 | | | | | 1,140.60 | | | | | 8.04 | | | | | 1,000.00 | | | | | 1,136.00 | | | | | 8.02 | | | | | 1,000.00 | | | | | 1,065.00 | | | | | 1.22 | | | | | 1,000.00 | | | | | 1,168.70 | | | | | 8.63 | |
| Hypothetical 5% return | | | | 1,000.00 | | | | | 1,017.95 | + | | | | 6.97 | | | | | 1,000.00 | | | | | 1,017.35 | + | | | | 7.57 | | | | | 1,000.00 | | | | | 1,017.35 | + | | | | 7.57 | | | | | 1,000.00 | | | | | 1,002.78 | + | | | | 1.18 | | | | | 1,000.00 | | | | | 1,016.91 | + | | | | 8.02 | |
| |
119
GOLDMAN SACHS FUNDAMENTAL EQUITY GROWTH FUNDS
Fund Expenses — Six Month Period Ended February 29, 2012 (Unaudited) (continued)
| | | | | | | | | | | | | | | | | | | | | | | | | | | | | | | | | | | | | | | | | | | | | | | | | | | | | | | | | | | | | |
| | | | Small/Mid Cap Growth Fund | | | Strategic Growth Fund | | | Technology Tollkeeper Fund | | | U.S. Equity Fund |
| | | | | | | | | | Expenses
| | | | | | | | | Expenses
| | | | | | | | | Expenses
| | | | | | | | | Expenses
|
| | | | Beginning
| | | Ending
| | | Paid for the
| | | Beginning
| | | Ending
| | | Paid for the
| | | Beginning
| | | Ending
| | | Paid for the
| | | | | | | | | Paid for the
|
| | | | Account
| | | Account
| | | 6 months
| | | Account
| | | Account
| | | 6 months
| | | Account
| | | Account
| | | 6 months
| | | Beginning
| | | Ending
| | | 6 months
|
| | | | Value
| | | Value
| | | ended
| | | Value
| | | Value
| | | ended
| | | Value
| | | Value
| | | ended
| | | Account Value
| | | Account Value
| | | ended
|
| Share Class | | | 9/1/11 | | | 2/29/12 | | | 2/29/12* | | | 9/1/11 | | | 2/29/12 | | | 2/29/12* | | | 9/1/11 | | | 2/29/12 | | | 2/29/12* | | | 9/1/11 | | | 2/29/12 | | | 2/29/12* |
Class A | | | | | | | | | | | | | | | | | | | | | | | | | | | | | | | | | | | | | | | | | | | | | | | | | | | | | | | | | | | | |
| Actual | | | $ | 1,000.00 | | | | $ | 1,165.70 | | | | $ | 7.27 | | | | $ | 1,000.00 | | | | $ | 1,134.80 | | | | $ | 6.10 | | | | $ | 1,000.00 | | | | $ | 1,168.50 | | | | $ | 8.09 | | | | $ | 1,000.00 | | | | $ | 1,125.30 | | | | $ | 6.24 | |
| Hypothetical 5% return | | | | 1,000.00 | | | | | 1,018.15 | + | | | | 6.77 | | | | | 1,000.00 | | | | | 1,019.14 | + | | | | 5.77 | | | | | 1,000.00 | | | | | 1,017.40 | + | | | | 7.52 | | | | | 1,000.00 | | | | | 1,019.00 | + | | | | 5.92 | |
| |
Class B | | | | | | | | | | | | | | | | | | | | | | | | | | | | | | | | | | | | | | | | | | | | | | | | | | | | | | | | | | | | |
| Actual | | | | 1,000.00 | | | | | 1,161.30 | | | | | 11.28 | | | | | 1,000.00 | | | | | 1,130.90 | | | | | 10.07 | | | | | 1,000.00 | | | | | 1,163.50 | | | | | 12.10 | | | | | N/A | | | | | N/A | | | | | N/A | |
| Hypothetical 5% return | | | | 1,000.00 | | | | | 1,014.42 | + | | | | 10.52 | | | | | 1,000.00 | | | | | 1,015.42 | + | | | | 9.52 | | | | | 1,000.00 | | | | | 1,013.67 | + | | | | 11.27 | | | | | N/A | | | | | N/A | | | | | N/A | |
| |
Class C | | | | | | | | | | | | | | | | | | | | | | | | | | | | | | | | | | | | | | | | | | | | | | | | | | | | | | | | | | | | |
| Actual | | | | 1,000.00 | | | | | 1,160.60 | | | | | 11.28 | | | | | 1,000.00 | | | | | 1,131.80 | | | | | 10.07 | | | | | 1,000.00 | | | | | 1,163.70 | | | | | 12.10 | | | | | 1,000.00 | | | | | 1,120.60 | | | | | 10.18 | |
| Hypothetical 5% return | | | | 1,000.00 | | | | | 1,014.42 | + | | | | 10.52 | | | | | 1,000.00 | | | | | 1,015.42 | + | | | | 9.52 | | | | | 1,000.00 | | | | | 1,013.67 | + | | | | 11.27 | | | | | 1,000.00 | | | | | 1,015.27 | + | | | | 9.67 | |
| |
Institutional | | | | | | | | | | | | | | | | | | | | | | | | | | | | | | | | | | | | | | | | | | | | | | | | | | | | | | | | | | | | |
| Actual | | | | 1,000.00 | | | | | 1,167.90 | | | | | 5.12 | | | | | 1,000.00 | | | | | 1,137.70 | | | | | 3.99 | | | | | 1,000.00 | | | | | 1,170.50 | | | | | 5.94 | | | | | 1,000.00 | | | | | 1,126.90 | | | | | 4.12 | |
| Hypothetical 5% return | | | | 1,000.00 | | | | | 1,020.14 | + | | | | 4.77 | | | | | 1,000.00 | | | | | 1,021.13 | + | | | | 3.77 | | | | | 1,000.00 | | | | | 1,019.39 | + | | | | 5.52 | | | | | 1,000.00 | | | | | 1,020.98 | + | | | | 3.92 | |
| |
Service | | | | | | | | | | | | | | | | | | | | | | | | | | | | | | | | | | | | | | | | | | | | | | | | | | | | | | | | | | | | |
| Actual | | | | 1,000.00 | | | | | 1,165.30 | | | | | 7.81 | | | | | 1,000.00 | | | | | 1,135.50 | | | | | 6.64 | | | | | 1,000.00 | | | | | 1,168.30 | | | | | 8.63 | | | | | N/A | | | | | N/A | | | | | N/A | |
| Hypothetical 5% return | | | | 1,000.00 | | | | | 1,017.65 | + | | | | 7.27 | | | | | 1,000.00 | | | | | 1,018.65 | + | | | | 6.27 | | | | | 1,000.00 | | | | | 1,016.91 | + | | | | 8.02 | | | | | N/A | | | | | N/A | | | | | N/A | |
| |
Class IR | | | | | | | | | | | | | | | | | | | | | | | | | | | | | | | | | | | | | | | | | | | | | | | | | | | | | | | | | | | | |
| Actual | | | | 1,000.00 | | | | | 1,167.00 | | | | | 5.93 | | | | | 1,000.00 | | | | | 1,136.60 | | | | | 4.78 | | | | | 1,000.00 | | | | | 1,170.00 | | | | | 6.74 | | | | | 1,000.00 | | | | | 1,126.00 | | | | | 4.92 | |
| Hypothetical 5% return | | | | 1,000.00 | | | | | 1,019.39 | + | | | | 5.52 | | | | | 1,000.00 | | | | | 1,020.39 | + | | | | 4.52 | | | | | 1,000.00 | | | | | 1,018.65 | + | | | | 6.27 | | | | | 1,000.00 | | | | | 1,020.24 | + | | | | 4.67 | |
| |
Class R | | | | | | | | | | | | | | | | | | | | | | | | | | | | | | | | | | | | | | | | | | | | | | | | | | | | | | | | | | | | |
| Actual | | | | 1,000.00 | | | | | 1,164.20 | | | | | 8.61 | | | | | N/A | | | | | 1,134.50 | | | | | 7.43 | | | | | N/A | | | | | N/A | | | | | N/A | | | | | 1,000.00 | | | | | 1,123.90 | | | | | 7.55 | |
| Hypothetical 5% return | | | | 1,000.00 | | | | | 1,016.91 | + | | | | 8.02 | | | | | N/A | | | | | 1,017.90 | + | | | | 7.02 | | | | | N/A | | | | | N/A | | | | | N/A | | | | | 1,000.00 | | | | | 1,017.75 | + | | | | 7.17 | |
| |
| | |
| (a) | | Commenced operations on January 31, 2012. |
| |
| * | | Expenses for each share class are calculated using each Fund’s annualized net expense ratio for each class, which represents the ongoing expenses as a percentage of net assets for the six months ended February 29, 2012. Expenses are calculated by multiplying the annualized net expense ratio by the average account value for the period; then multiplying the result by the number of days in the most recent fiscal half year; and then dividing that result by the number of days in the fiscal year. The annualized net expense ratios for the period were as follows: |
| | | | | | | | | | | | | | | | | | | | | | | | | | | | | |
| Fund | | Class A | | Class B | | Class C | | Institutional | | Service | | Class IR | | Class R |
| |
| |
| Capital Growth | | | 1.14 | % | | | 1.89 | % | | | 1.89 | % | | | 0.74 | % | | | 1.24 | % | | | 0.89 | % | | | 1.39 | % |
| Concentrated Growth | | | 1.26 | | | | 2.01 | | | | 2.01 | | | | 0.86 | | | | N/A | | | | 1.01 | | | | 1.51 | |
| Flexible Cap Growth | | | 1.26 | | | | N/A | | | | 2.01 | | | | 0.86 | | | | N/A | | | | 1.01 | | | | 1.51 | |
| Focused Growth | | | 1.24 | | | | N/A | | | | 1.99 | | | | 0.84 | | | | N/A | | | | 0.99 | | | | 1.49 | |
| Growth Opportunities | | | 1.35 | | | | 2.10 | | | | 2.10 | | | | 0.95 | | | | 1.45 | | | | 1.10 | | | | 1.60 | |
| Small Mid/Cap Growth | | | 1.35 | | | | 2.10 | | | | 2.10 | | | | 0.95 | | | | 1.45 | | | | 1.10 | | | | 1.60 | |
| Strategic Growth | | | 1.15 | | | | 1.90 | | | | 1.90 | | | | 0.75 | | | | 1.25 | | | | 0.90 | | | | 1.40 | |
| Technology Tollkeeper | | | 1.50 | | | | 2.25 | | | | 2.25 | | | | 1.10 | | | | 1.60 | | | | 1.25 | | | | N/A | |
| U.S. Equity | | | 1.18 | | | | N/A | | | | 1.93 | | | | 0.78 | | | | N/A | | | | 0.93 | | | | 1.43 | |
| |
| |
| | |
| + | | Hypothetical expenses are based on each Fund’s actual annualized net expense ratios and an assumed rate of return of 5% per year before expenses. |
120
FUNDS PROFILE
Goldman Sachs Funds
Goldman Sachs is a premier financial services firm, known since 1869 for creating thoughtful and customized investment solutions in complex global markets.
Today, the Investment Management Divisionof Goldman Sachs serves a diverse set of clients worldwide, including private institutions, public entities and individuals. With $705.8 billion in assets under management as of December 31, 2011, Goldman Sachs Asset Management (“GSAM”) has portfolio management teams located around the world and our investment professionals bring firsthand knowledge of local markets to every investment decision. GSAM’s assets under management includes assets managed by Goldman Sachs Asset Management, LP and its Investment Advisory Affiliates. Additionally, GSAM ranks in the top 10 asset management firms worldwide, based on assets under management.1
| |
| OVERVIEW OF GOLDMAN SACHS FUNDS | |

| | | | | |
Money Market2
Financial Square Fundssm
n Financial Square Tax-Exempt Funds
n Financial Square Federal Fund
n Financial Square Government Fund
n Financial Square Money Market Fund
n Financial Square Prime Obligations Fund
n Financial Square Treasury Instruments Fund
n Financial Square Treasury Obligations Fund
Fixed Income
Short Duration and Government
n Enhanced Income Fund
n Ultra-Short Duration Govt. Fund
n Short Duration Government Fund
n Short Duration Income Fund
n Government Income Fund
n Inflation Protected Securities Fund
Multi-Sector
n Core Fixed Income Fund
n Core Plus Fixed Income Fund
n Global Income Fund
n Strategic Income Fund
Municipal and Tax-Free
n High Yield Municipal Fund
n Municipal Income Fund
n Short Duration Tax-Free Fund
Single Sector
n Investment Grade Credit Fund
n U.S. Mortgages Fund
n High Yield Fund
n High Yield Floating Rate Fund | | n Emerging Markets Debt Fund
n Local Emerging Markets Debt Fund
Corporate Credit
n Credit Strategies Fund
Fundamental Equity
n Growth and Income Fund
n Small Cap Value Fund
n Mid Cap Value Fund
n Large Cap Value Fund
n Capital Growth Fund
n Strategic Growth Fund
n Focused Growth Fund
n Small/Mid Cap Growth Fund
n Flexible Cap Growth Fund
n Concentrated Growth Fund
n Technology Tollkeeper Fund
n Growth Opportunities Fund
n Rising Dividend Growth Fund
n U.S. Equity Fund
Structured Equity
n Balanced Fund
n Structured Small Cap Equity Fund
n Structured U.S. Equity Fund
n Structured Small Cap Growth Fund
n Structured Large Cap Growth Fund
n Structured Large Cap Value Fund
n Structured Small Cap Value Fund
n Structured Tax-Managed Equity Fund
n Structured International Tax-Managed Equity Fund
n U.S. Equity Dividend and Premium Fund
n International Equity Dividend and Premium Fund | | n Structured International Small Cap Fund
n Structured International Equity Fund
n Structured Emerging Markets Equity Fund
Fundamental Equity International
n Strategic International Equity Fund
n Concentrated International Equity Fund
n International Small Cap Fund
n Asia Equity Fund
n Emerging Markets Equity Fund
n BRIC Fund (Brazil, Russia, India, China)
n N-11 Equity Fund
n Brazil Equity Fund
n China Equity Fund
n Korea Equity Fund
n India Equity Fund
Select Satellite3
n Real Estate Securities Fund
n International Real Estate Securities Fund
n Commodity Strategy Fund
n Dynamic Allocation Fund
n Absolute Return Tracker Fund
n Managed Futures Strategy Fund
Total Portfolio Solutions3
n Balanced Strategy Portfolio
n Growth and Income Strategy Portfolio
n Growth Strategy Portfolio
n Equity Growth Strategy Portfolio
n Income Strategies Portfolio
n Satellite Strategies Portfolio
n Retirement Strategies Portfolios
n Enhanced Dividend Global Equity Portfolio
n Tax Advantaged Global Equity Portfolio |
| |
| 1 | Ranking for Goldman Sachs Group, Inc., includes Goldman Sachs Asset Management, Private Wealth Management and Merchant Banking 2010 year-end assets. Ranked 10th in total assets worldwide. Pensions & Investments, June 2011. |
| 2 | An investment in a money market fund is neither insured nor guaranteed by the Federal Deposit Insurance Corporation (“FDIC”) or any other government agency. Although the Funds seek to preserve the value of your investment at $1.00 per share, it is possible to lose money by investing in the Funds. |
| 3 | Individual Funds within the Total Portfolio Solutions and Select Satellite categories will have various placement on the risk/return spectrum and may have greater or lesser risk than that indicated by the placement of the general Total Portfolio Solutions or Select Satellite category. |
Financial Square Fundssm is a registered service mark of Goldman, Sachs & Co.
| | | |
TRUSTEES
Ashok N. Bakhru, Chairman
Donald C. Burke
John P. Coblentz, Jr.
Diana M. Daniels
Joseph P. LoRusso
James A. McNamara
Jessica Palmer
Alan A. Shuch
Richard P. Strubel | | OFFICERS
James A. McNamara, President
George F. Travers, Principal Financial Officer
Peter V. Bonanno, Secretary
Scott M. McHugh, Treasurer |
| | | |
GOLDMAN, SACHS & CO.
Distributor and Transfer Agent | | GOLDMAN SACHS ASSET MANAGEMENT, L.P.
Investment Adviser |
Visit our Web site at www.goldmansachsfunds.com to obtain the most recent month-end returns.
Goldman Sachs Asset Management, L.P. 200 West Street, New York, New York 10282
The reports concerning the Funds included in this shareholder report may contain certain forward-looking statements about the factors that may affect the performance of the Funds in the future. These statements are based on Fund management’s predictions and expectations concerning certain future events and their expected impact on the Funds, such as performance of the economy as a whole and of specific industry sectors, changes in the levels of interest rates, the impact of developing world events, and other factors that may influence the future performance of the Funds. Management believes these forward-looking statements to be reasonable, although they are inherently uncertain and difficult to predict. Actual events may cause adjustments in portfolio management strategies from those currently expected to be employed.
A description of the policies and procedures that the Funds use to determine how to vote proxies relating to portfolio securities and information regarding how a Fund voted proxies relating to portfolio securities during the most recent 12-month period ended June 30 is available (I) without charge, upon request by calling 1-800-526-7384 (for Retail Shareholders) or 1-800-621-2550 (for Institutional Shareholders); and (II) on the Securities and Exchange Commission Web site at http://www.sec.gov.
The Funds file their complete schedule of portfolio holdings with the Securities and Exchange Commission (“SEC”) for the first and third quarters of each fiscal year on Form N-Q. The Funds’ Form N-Q will become available on the SEC’s website at http://www.sec.gov within 60 days after the Funds’ first and third fiscal quarters. When available, the Funds’ Forms N-Q may be reviewed and copied at the SEC’s Public Reference Room in Washington, D.C. and information on the operation of the Public Reference Room may also be obtained by calling 1-800-SEC-0330. When available, Form N-Q may be obtained upon request and without charge by calling 1-800-526-7384 (for Retail Shareholders) or 1-800-621-2550 (for Institutional Shareholders).
The Global Industry Classification Standard (GICS) was developed by and is the exclusive property and a service mark of Morgan Stanley Capital International Inc. (MSCI) and Standard & Poor’s, a division of The McGraw-Hill Companies, Inc. (S&P) and is licensed for use by Goldman Sachs. Neither MSCI, S&P nor any other party involved in making or compiling the GICS or any GICS classifications makes any express or implied warranties or representations with respect to such standard or classification (or the results to be obtained by the use thereof), and all such parties hereby expressly disclaim all warranties of originality, accuracy, completeness, merchantability or fitness for a particular purpose with respect to any of such standard or classification. Without limiting any of the foregoing, in no event shall MSCI, S&P, any of their affiliates or any third party involved in making or compiling the GICS or any GICS classifications have any liability for any direct, indirect, special, punitive, consequential or any other damages (including lost profits) even if notified of the possibility of such damages.
Holdings and allocations shown are as of February 29, 2012 and may not be representative of future investments. Fund holdings should not be relied on in making investment decisions and should not be construed as research or investment advice regarding particular securities.
Goldman Sachs Technology Tollkeeper Fundsm is a registered service mark of Goldman, Sachs & Co.
This material is not authorized for distribution to prospective investors unless preceded or accompanied by a current Prospectus or summary prospectus, if applicable. Investors should consider a Fund’s objective, risks, and charges and expenses, and read the summary prospectus, if available, and/or the Prospectus carefully before investing or sending money. The summary prospectus, if available, and the Prospectus contain this and other information about a Fund and may be obtained from your authorized dealer or from Goldman, Sachs & Co. by calling (retail — 1-800-526-7384) (institutional — 1-800-621-2550).
© 2012 Goldman Sachs. All rights reserved. 71566.MF.MED.TMPL/4/2012 EQGRWSAR12/218K
| | | |
| | | The information required by this Item is only required in an annual report on this Form N-CSR. |
| | | |
| ITEM 3. | | AUDIT COMMITTEE FINANCIAL EXPERT. |
| | | |
| | | The information required by this Item is only required in an annual report on this Form N-CSR. |
| | | |
| ITEM 4. | | PRINCIPAL ACCOUNTANT FEES AND SERVICES. |
| | | |
| | | The information required by this Item is only required in an annual report on this Form N-CSR. |
| | | |
| ITEM 5. | | AUDIT COMMITTEE OF LISTED REGISTRANTS. |
| | | |
| | | Not applicable. |
| | | |
| ITEM 6. | | SCHEDULE OF INVESTMENTS. |
| | | |
| | | Schedule of Investments is included as part of the Report to Stockholders filed under Item 1. |
| | | |
| ITEM 7. | | DISCLOSURE OF PROXY VOTING POLICIES AND PROCEDURES FOR CLOSED-END MANAGEMENT INVESTMENT COMPANIES. |
| | | |
| | | Not applicable. |
| | | |
| ITEM 8. | | PORTFOLIO MANAGERS OF CLOSED-END MANAGEMENT INVESTMENT COMPANIES. |
| | | |
| | | Not applicable. |
| | | |
| ITEM 9. | | PURCHASES OF EQUITY SECURITIES BY CLOSED-END MANAGEMENT INVESTMENT COMPANY AND AFFILIATED PURCHASERS. |
| | | |
| | | Not applicable. |
| | | |
| ITEM 10. | | SUBMISSION OF MATTERS TO A VOTE OF SECURITY HOLDERS.
There have been no material changes to the procedures by which shareholders may recommend nominees to the registrant’s board of trustees. |
| | | |
| | | |
| ITEM 11. | | CONTROLS AND PROCEDURES. |
| | | |
| | (a) | | The registrant’s principal executive and principal financial officers, or persons performing similar functions have concluded that the registrant’s disclosure controls and procedures (as defined in Rule 30a-3(c) under the Investment Company Act of 1940, as amended (the “1940 Act”)) are effective as of a date within 90 days of the filing of this report that includes the disclosure required by this paragraph, based on the evaluation of these controls and procedures required by Rule 30a-3(b) under the 1940 Act and 15d-15(b) under the Securities Exchange Act of 1934, as amended. |
| | | |
| | (b) | | There were no changes in the registrant’s internal control over financial reporting (as defined in Rule 30a-3(d) under the 1940 Act) that occurred during the registrant’s second fiscal quarter of the period covered by this report that have materially affected, or are reasonably likely to materially affect, the registrant’s internal control over financial reporting. |
| | | |
| | (a)(1) | | The information required by this Item is only required in connection with an annual report on this Form N-CSR. |
| |
| | (a)(2) | | Exhibit 99.CERT | Certifications pursuant to Section 302 of the Sarbanes-Oxley Act of 2002 filed herewith. |
| | | |
| | (b) | | Exhibit 99.906CERT | Certifications pursuant to Section 906 of the Sarbanes-Oxley Act of 2002 filed herewith. |
SIGNATURES
| | | | Pursuant to the requirements of the Securities Exchange Act of 1934 and the Investment Company Act of 1940, the registrant has duly caused this report to be signed on its behalf by the undersigned, thereunto duly authorized. |
| | | | | | | |
| | | | | Goldman Sachs Trust | | |
| | | | | | | |
| By: | | | | /s/ James A. McNamara | | |
| | | | |
| | |
| | | | | James A. McNamara | | |
| | | | | President/Principal Executive Officer | | |
| | | | | Goldman Sachs Trust | | |
| | | | | | | |
| Date: | | | | April 19, 2012 | | |
| | | | Pursuant to the requirements of the Securities Exchange Act of 1934 and the Investment Company Act of 1940, this report has been signed below by the following persons on behalf of the registrant and in the capacities and on the dates indicated. |
| | | | | | | |
| By: | | | | /s/ James A. McNamara | | |
| | | | |
| | |
| | | | | James A. McNamara | | |
| | | | | President/Principal Executive Officer | | |
| | | | | Goldman Sachs Trust | | |
| | | | | | | |
| Date: | | | | April 19, 2012 | | |
| | | | | | | |
| By: | | | | /s/ George F. Travers | | |
| | | | |
| | |
| | | | | George F. Travers | | |
| | | | | Principal Financial Officer | | |
| | | | | Goldman Sachs Trust | | |
| | | | | | | |
| Date: | | | | April 19, 2012 | | |