UNITED STATES
SECURITIES AND EXCHANGE COMMISSION
Washington, D.C. 20549
FORM N-CSR
CERTIFIED SHAREHOLDER REPORT OF REGISTERED
MANAGEMENT INVESTMENT COMPANIES
Investment Company Act file number 811-05349
Goldman Sachs Trust
(Exact name of registrant as specified in charter)
71 South Wacker Drive, Chicago, Illinois 60606
(Address of principal executive offices) (Zip code)
| | |
| Caroline Kraus, Esq. | | Copies to: |
| Goldman, Sachs & Co. | | Geoffrey R.T. Kenyon, Esq. |
| 200 West Street | | Dechert LLP |
| New York, New York 10282 | | 100 Oliver Street |
| | 40th Floor |
| | Boston, MA 02110-2605 |
(Name and address of agents for service)
Registrant’s telephone number, including area code: (312) 655-4400
Date of fiscal year end: October 31
Date of reporting period: October 31, 2015
| ITEM 1. | REPORTS TO STOCKHOLDERS. |
| | The Annual Report to Shareholders is filed herewith. |
Goldman Sachs Funds

| | | | |
| | |
| Annual Report | | | | October 31, 2015 |
| | |
| | | | Domestic Equity Insights Funds |
| | | | Large Cap Growth Insights |
| | | | Large Cap Value Insights |
| | | | Small Cap Equity Insights |
| | | | Small Cap Growth Insights |
| | | | Small Cap Value Insights |
| | | | U.S. Equity Insights |

Goldman Sachs Domestic Equity Insights Funds
| n | | LARGE CAP GROWTH INSIGHTS |
| n | | LARGE CAP VALUE INSIGHTS |
| n | | SMALL CAP EQUITY INSIGHTS |
| n | | SMALL CAP GROWTH INSIGHTS |
| n | | SMALL CAP VALUE INSIGHTS |
| | | | |
TABLE OF CONTENTS | | | | |
| |
Principal Investment Strategies and Risks | | | 1 | |
| |
Market Review | | | 3 | |
| |
Investment Process | | | 5 | |
| |
Portfolio Management Discussion and Performance Summaries | | | 7 | |
| |
Schedules of Investments | | | 44 | |
| |
Financial Statements | | | 68 | |
| |
Financial Highlights | | | 76 | |
| |
Notes to Financial Statements | | | 88 | |
| |
Report of the Independent Registered Public Accounting Firm | | | 112 | |
| |
Other Information | | | 113 | |
| | | | |
| | | |
| NOT FDIC-INSURED | | May Lose Value | | No Bank Guarantee |
GOLDMAN SACHS DOMESTIC EQUITY INSIGHTS FUNDS
Principal Investment Strategies and Risks
This is not a complete list of risks that may affect the Funds. For additional information concerning the risks applicable to the Funds, please see the Funds’ Prospectus.
The Goldman Sachs Large Cap Growth Insights Fund invests primarily in a broadly diversified portfolio of equity investments in large-capitalization U.S. issuers, including foreign issuers traded in the United States. The Fund’s equity investments will be subject to market risk, which means that the value of the securities in which it invests may go up or down in response to the prospects of individual companies, particular sectors and/or general economic conditions. The Investment Adviser’s use of quantitative models to execute the Fund’s investment strategy may fail to produce the intended result. Different investment styles (e.g., “quantitative” and “growth”) tend to shift in and out of favor, and at times the Fund may underperform other funds that invest in similar asset classes. The Fund may have a high rate of portfolio turnover, which involves correspondingly greater expenses which must be borne by the Fund, and is also likely to result in short-term capital gains taxable to shareholders.
The Goldman Sachs Large Cap Value Insights Fund invests primarily in a diversified portfolio of equity investments in large-capitalization U.S. issuers, including foreign issuers traded in the United States. The Fund’s equity investments will be subject to market risk, which means that the value of the securities in which it invests may go up or down in response to the prospects of individual companies, particular sectors and/or general economic conditions. The Investment Adviser’s use of quantitative models to execute the Fund’s investment strategy may fail to produce the intended result. Different investment styles (e.g., “quantitative” and “value”) tend to shift in and out of favor, and at times the Fund may underperform other funds that invest in similar asset classes. The Fund may have a high rate of portfolio turnover, which involves correspondingly greater expenses which must be borne by the Fund, and is also likely to result in short-term capital gains taxable to shareholders.
The Goldman Sachs Small Cap Equity Insights Fund invests primarily in a broadly diversified portfolio of equity investments in small-capitalization U.S. issuers, including foreign issuers traded in the United States. The Fund’s equity investments will be subject to market risk, which means that the value of the securities in which it invests may go up or down in response to the prospects of individual companies, particular sectors and/or general economic conditions. The securities of mid- and small-capitalization companies involve greater risks than those associated with larger, more established companies and may be subject to more abrupt or erratic price movements. The Investment Adviser’s use of quantitative models to execute the Fund’s investment strategy may fail to produce the intended result. Different investment styles (e.g., “quantitative”) tend to shift in and out of favor, and at times the Fund may underperform other funds that invest in similar asset classes. The Fund may have a high rate of portfolio turnover, which involves correspondingly greater expenses which must be borne by the Fund, and is also likely to result in short-term capital gains taxable to shareholders.
1
GOLDMAN SACHS DOMESTIC EQUITY INSIGHTS FUNDS
The Goldman Sachs Small Cap Growth Insights Fund invests primarily in a broadly diversified portfolio of equity investments in small-capitalization U.S. issuers, including foreign issuers that are traded in the U.S. The Fund’s equity investments are subject to market risk, which means that the value of the securities in which it invests may go up or down in response to the prospects of individual companies, particular sectors and/or general economic conditions. The securities of mid- and small-capitalization companies involve greater risks than those associated with larger, more established companies and may be subject to more abrupt or erratic price movements. The Investment Adviser’s use of quantitative models to execute the Fund’s investment strategy may fail to produce the intended result. Different investment styles (e.g., “quantitative” and “growth”) tend to shift in and out of favor, and at times the Fund may underperform other funds that invest in similar asset classes. The Fund may have a high rate of portfolio turnover, which involves correspondingly greater expenses which must be borne by the Fund, and is also likely to result in short-term capital gains taxable to shareholders.
The Goldman Sachs Small Cap Value Insights Fund invests primarily in a broadly diversified portfolio of equity investments in small-capitalization U.S. issuers, including foreign issuers that are traded in the U.S. The Fund’s equity investments are subject to market risk, which means that the value of the securities in which it invests may go up or down in response to the prospects of individual companies, particular sectors and/or general economic conditions. The securities of mid- and small-capitalization companies involve greater risks than those associated with larger, more established companies and may be subject to more abrupt or erratic price movements. The Investment Adviser’s use of quantitative models to execute the Fund’s investment strategy may fail to produce the intended result. Different investment styles (e.g., “quantitative” and “value”) tend to shift in and out of favor, and at times the Fund may underperform other funds that invest in similar asset classes. The Fund may have a high rate of portfolio turnover, which involves correspondingly greater expenses which must be borne by the Fund, and is also likely to result in short-term capital gains taxable to shareholders.
The Goldman Sachs U.S. Equity Insights Fund invests primarily in a diversified portfolio of equity investments in U.S. issuers, including foreign issuers traded in the United States. The Fund’s equity investments will be subject to market risk, which means that the value of the securities in which it invests may go up or down in response to the prospects of individual companies, particular sectors and/ or general economic conditions. The Investment Adviser’s use of quantitative models to execute the Fund’s investment strategy may fail to produce the intended result. Different investment styles (e.g., “quantitative”) tend to shift in and out of favor, and at times the Fund may underperform other funds that invest in similar asset classes. The Fund may have a high rate of portfolio turnover, which involves correspondingly greater expenses which must be borne by the Fund, and is also likely to result in short-term capital gains taxable to shareholders.
2
MARKET REVIEW
Goldman Sachs Domestic Equity Insights Funds
Market Review
During the 12 months ended October 31, 2015 (the “Reporting Period”), U.S. equities advanced, as the U.S. economy generally withstood global economic weakness. Mergers and acquisitions activity and the drop in oil and other commodity prices were also dominant themes.
U.S. equities started the Reporting Period strongly, generating relatively robust returns into the end of 2014, benefiting from the improvement of the U.S. economy compared to those of most other developed markets countries. U.S. stock performance was also supported by significant merger and acquisition activity, which continued into 2015 and through the end of the Reporting Period, particularly in the information technology and health care sectors.
Although the U.S. economy encountered a weak patch during the first quarter of 2015, it rebounded in the second calendar quarter, expanding at a 3.7% rate. Importantly, the unemployment rate continued to fall, and the housing market improved. While consumer spending was slightly softer than expected early in the Reporting Period, it gained momentum during the spring of 2015 amid good retail sales growth, which reflected a broadening of consumer spending.
Global equity market volatility heated up during the summer of 2015 and affected U.S. equity performance. Greece teetered on the brink of financial collapse, while the domestic Chinese equity market began a dramatic correction. Further weakening of Chinese economic data and the devaluation of its renminbi weighed on stock markets around the globe. However, U.S equities rebounded in October 2015 on easing concerns about global economic growth and indications of continued monetary easing by several central banks.
Slower economic growth in China also led to worries about the demand for many commodities, including oil. The West Texas Intermediate (“WTI”) crude oil benchmark price, which had stood at a high of $107 a barrel in June 2014, fell rather steadily during the Reporting Period to a low of $43 a barrel in March 2015 before rebounding to almost $60 a barrel and stabilizing at slightly less than $45 a barrel for much of the summer and fall of 2015. Other commodity prices also weakened.
Throughout the Reporting Period, market participants speculated about the timing of a potential short-term rate hike by the Federal Reserve (the “Fed”). However, the Fed left rates unchanged during the Reporting Period.
For the Reporting Period overall, the S&P 500® Index returned 5.20%, with six of the 10 sectors in the Index generating positive returns. The consumer discretionary (+20.27%) and information technology (+10.96%) sectors performed best. The consumer discretionary sector was the largest positive contributor (measured by weight times performance) to S&P 500® Index returns. Energy was the weakest performing sector, with a return of -18.57% during the Reporting Period.
In terms of market capitalization, large-cap stocks outperformed small-cap stocks. The Russell 2000® Index, which measures the small-cap universe, returned 0.34% during the Reporting Period. In the style arena, growth stocks outperformed value stocks overall. The Russell 1000® Growth Index, representing large-cap growth stocks, climbed 9.18%, while the Russell 1000® Value Index, representing large-cap value stocks, rose 0.53% during the Reporting Period.
3
MARKET REVIEW
Looking Ahead
At the end of the Reporting Period, we continued to believe that less expensive stocks should outpace more expensive stocks. In addition, we expected stocks with good momentum to outperform those with poor momentum. We plan to focus on seeking companies about which fundamental research analysts are becoming more positive as well as profitable companies with sustainable earnings and a track record of using their capital to enhance shareholder value. As such, we anticipate remaining fully invested, with long-term performance likely to be the result of stock selection rather than sector or capitalization allocations.
We stand behind our investment philosophy that sound economic investment principles, coupled with a disciplined quantitative approach, can provide strong, uncorrelated returns over the long term. Our research agenda is robust, and we continue to enhance our existing models, add new proprietary forecasting signals and improve our trading execution as we seek to provide the most value to our shareholders.
4
GOLDMAN SACHS DOMESTIC EQUITY INSIGHTS FUNDS
What Differentiates Goldman Sachs’
Domestic Equity Insights Funds Investment Process?
At Goldman Sachs Asset Management, L.P. (“GSAM”), Equity Insights combines traditional fundamental analysis with sophisticated quantitative modeling. Our approach is not unlike that of a more traditional active manager: we look at fundamental investment themes that have been effective historically in forecasting excess returns of stocks. However, where we differ from traditional managers is that we seek to rigorously test every potential research theme or signal to verify whether they have shown consistent predictive ability across a wide variety of stocks in different time periods and under different market conditions.


| n | | Comprehensive – We calculate expected excess returns for more than 10,000 stocks on a daily basis. |
| n | | Rigorous – We evaluate stocks based on fundamental investment criteria that have outperformed historically. |
| n | | Objective – Our stock selection process is free from the emotion that may lead to biased investment decisions. |

| n | | Our computer optimization process allocates risk to our high conviction investment ideas and constructs funds that strive to neutralize systematic risks and deliver better returns. |
| n | | We use a proprietary risk model that is designed to be more precise, more focused and faster to respond because it seeks to identify, track and manage risk specific to our process, using daily data. |

Fully invested, well-diversified portfolio that seeks to:
| n | | Maintain style, sector, risk and capitalization characteristics similar to the benchmark. |
| n | | Offer broad access to a clearly defined equity universe. |
| n | | Generate excess returns that are positive, consistent and repeatable. |
5
GOLDMAN SACHS DOMESTIC EQUITY INSIGHTS FUNDS
|
| |
| Enhancements Made to Proprietary Quantitative Model during the 12-Month Period Ended October 31, 2015 |
| |
We continuously look for ways to improve our investment process. Accordingly, we introduced a number of enhancements to our proprietary quantitative model during the 12-month period ended October 31, 2015. We implemented an enhancement to our Valuation theme to evaluate energy companies’ reserves. Energy reserves are not capitalized on the balance sheet, so we believe reserve-based valuation metrics provide a more accurate picture of the intrinsic value of an energy company. We also implemented an enhancement to our Momentum theme, evaluating price pressures created through consistent trade imbalances between buyers and sellers. In certain instances, traders may push prices as they engage in end-of-day hedging, inventory management and index trading. Such activities, when persistent, can create buying and selling opportunities as stock prices revert to long-term views. |
| |
Additionally, we made three enhancements to our Sentiment theme. The first enhancement was the introduction of a signal that analyzes short selling of stocks in order to gain a more comprehensive understanding of investor views about potential future price declines. We analyze more than 9,000 stocks on a daily basis to identify companies with large, “fresh” short positions that may indicate negative return expectations. The second enhancement uses the credit default swap (“CDS”) spread of a company as an early indicator of potential stock price swings. We use data on single-name CDS spreads for more than 300 companies on a daily basis to arrive at our views. The third enhancement was a signal that uses stock options data of a company as a potential indicator of stock mispricing. Due to fewer restrictions on leverage and short-selling, options markets typically incorporate information more efficiently than equity markets. Because of the broad availability of options data on U.S. equities, we can form views on the majority of stocks in our investment universe using this signal. We also enhanced our Profitability theme by introducing a signal that analyzes web traffic data of companies to provide an insight into future revenues. We analyze this information for more than 1,700 stocks, spanning across various sectors. In addition, we expanded the scope of signals within our global linkages theme. We extended an economic linkage signal, which analyzes patent data, from the U.S. and Japan to Europe. We analyze more than 3.5 million patents globally to establish the economic linkages between companies in various industries. We believe these linkages help predict price movements across similar companies more accurately. |
6
PORTFOLIO RESULTS
Goldman Sachs Large Cap Growth Insights Fund
Investment Objective
The Fund seeks long-term growth of capital, with dividend income as a secondary consideration.
Portfolio Management Discussion and Analysis
Below, the Goldman Sachs Quantitative Investment Strategies Team discusses the Goldman Sachs Large Cap Growth Insights Fund’s (the “Fund”) performance and positioning for the 12-month period ended October 31, 2015 (the “Reporting Period”).
| Q | | How did the Fund perform during the Reporting Period? |
| A | | During the Reporting Period, the Fund’s Class A, C, Institutional, Service, IR and R Shares generated average annual total returns, without sales charges, of 7.96%, 7.12%, 8.41%, 7.88%, 8.21% and 7.73%, respectively. These returns compare to the 9.18% average annual total return of the Fund’s benchmark, the Russell 1000® Growth Index (with dividends reinvested) (the “Index”), during the same period. |
| | | During the period from their inception on July 31, 2015 through October 31, 2015, the Fund’s Class R6 Shares generated a cumulative total return, without sales charges, of -0.17% compared to the -0.51% cumulative total return of the Index. |
| Q | | What key factors were most responsible for the Fund’s performance during the Reporting Period? |
| A | | During the Reporting Period, the Fund benefited from stock selection driven by our quantitative model, with four of our quantitative model’s six investment themes contributing positively to relative returns. However, the Fund underperformed the Index, largely due to the underperformance of our Valuation investment theme. The Valuation theme attempts to capture potential mispricings of securities, typically by comparing a measure of the company’s intrinsic value to its market value. |
| Q | | What impact did the Fund’s investment themes have on performance during the Reporting Period? |
| A | | In keeping with our investment approach, we use our quantitative model and six investment themes to take a long-term view of market patterns and look for inefficiencies, selecting stocks for the Fund and overweighting or underweighting the ones chosen by the model. Over time and by design, the performance of any one of the model’s investment themes have historically had a low correlation with the model’s other themes, demonstrating the diversification benefit of the Fund’s theme-driven quantitative model. The variance in performance supports our research indicating that the diversification provided by our different investment themes is expected to provide a significant investment advantage over the long term, even though the Fund may experience underperformance in the short term. Of course, diversification does not protect an investor from market risk nor does it ensure a profit. |
| | | During the Reporting Period, four of our six investment themes contributed positively to the Fund’s relative returns. Sentiment, which reflects selected investment views and decisions of individuals and financial intermediaries, was our best performing theme. Momentum, Quality and Profitability also added to relative results. The Momentum theme seeks to predict drifts in stock prices caused by delayed investor reaction to company-specific information and information about related companies. The Quality theme seeks to assess both firm and management quality. The Profitability theme seeks to assess whether a company is earning more than its cost of capital. |
| | | Valuation detracted from relative performance. The Valuation theme attempts to capture potential mispricings of securities, typically by comparing a measure of the company’s intrinsic value to its market value. |
| | | Management had a neutral impact on relative returns during the Reporting Period. The Management theme seeks to assess the characteristics, policies and strategic decisions of company management. |
7
PORTFOLIO RESULTS
| Q | | How did the Fund’s sector and industry allocations affect relative performance? |
| A | | In constructing the Fund’s portfolio, we focus on picking stocks rather than on making sector or industry bets. Consequently, the Fund is similar to the Index in terms of its sector and industry allocations and style. Changes in its sector or industry weights generally do not have a meaningful impact on relative performance. That said, the contribution overall of the Fund’s industry exposures dampened relative performance during the Reporting Period. Though its industry weightings did not change substantially from prior periods, the Fund was hurt by its overweight positions relative to the Index in the petroleum and pharmaceutical industries, both of which declined during the Reporting Period. Its underweight positions in the semiconductor and internet retail industries, which rallied during the Reporting Period, also hurt relative returns. |
| Q | | Did stock selection help or hurt Fund performance during the Reporting Period? |
| A | | We seek to outpace the Index by overweighting stocks we expect to outperform and underweighting those we think may lag. At the same time, we strive to maintain a risk profile similar to the Index. The Fund’s investments are selected using fundamental research and a variety of quantitative techniques based on our investment themes. For example, the Fund aims to hold a basket of stocks with better Momentum characteristics than the benchmark. |
| | | During the Reporting Period, security selection overall added to the Fund’s relative performance. Investments in the energy, industrials and consumer discretionary sectors contributed positively, while stock picks in the information technology, materials and consumer staples sectors hampered relative results. |
| Q | | Which individual stock positions contributed most to the Fund’s relative returns during the Reporting Period? |
| A | | The Fund benefited from overweight positions in petroleum refiners Tesoro and Valero Energy and in airline holding company Alaskan Air Group. Our positive views on Valuation and Sentiment led to the Fund’s overweight in Tesoro. The Fund was overweight Valero Energy as a result of our positive views on Quality and Momentum. We adopted the overweight in Alaskan Air Group because of our positive views on Sentiment and Momentum. |
| Q | | Which individual stock positions detracted most from the Fund’s results during the Reporting Period? |
| A | | The Fund was hampered by its overweight positions in Rackspace Hosting and Netapp as well as by its underweight position in Amazon.com. We chose to overweight cloud computing company Rackspace Hosting and computer storage and data management company Netapp because of our positive views on Quality and Valuation. The Fund was underweight online retailer Amazon.com due to our negative views on Quality and Sentiment. |
| Q | | How did the Fund use derivatives and similar instruments during the Reporting Period? |
| A | | During the Reporting Period, we used financial futures contracts to equitize the Fund’s cash holdings. In other words, we put the Fund’s cash holdings to work by using them as collateral for the purchase of financial futures contracts. |
| Q | | What was the Fund’s sector positioning relative to the Index at the end of the Reporting Period? |
| A | | At the end of the Reporting Period, the Fund was overweight the energy, financials and health care sectors relative to the Index. Compared to the Index, the Fund was underweight the industrials, consumer discretionary and information technology sectors. The Fund was relatively neutral compared to the Index in the telecommunication services, utilities, consumer staples and materials sectors at the end of the Reporting Period. |
8
FUND BASICS
Large Cap Growth Insights Fund
as of October 31, 2015
| | | | | | | | | | |
| | PERFORMANCE REVIEW | |
| | | November 1, 2014–October 31, 2015 | | Fund Total Return
(based on NAV)1 | | | Russell 1000®
Growth Index2 | |
| | Class A | | | 7.96 | % | | | 9.18 | % |
| | Class C | | | 7.12 | | | | 9.18 | |
| | Institutional | | | 8.41 | | | | 9.18 | |
| | Service | | | 7.88 | | | | 9.18 | |
| | Class IR | | | 8.21 | | | | 9.18 | |
| | | Class R | | | 7.73 | | | | 9.18 | |
| | | |
| | | | | | | | | | | |
| | | July 31, 2015–October 31, 2015 | | Fund Total Return
(based on NAV)1 | | | Russell 1000®
Growth Index2 | |
| | | Class R6 | | | -0.17 | % | | | -0.51 | % |
| | 1 | | The net asset value (“NAV”) represents the net assets of the class of the Fund (ex-dividend) divided by the total number of shares of the class outstanding. The Fund’s performance assumes the reinvestment of dividends and other distributions. The Fund’s performance does not reflect the deduction of any applicable sales charges. |
| | 2 | | The Russell 1000® Growth Index (with dividends reinvested) is an unmanaged market capitalization weighted index of the 1000 largest U.S. companies with higher price-to-book ratios and higher forecasted growth values. The figures for the Index do not include any deduction for fees, expenses or taxes. It is not possible to invest directly in an index. |
| | | | | | | | | | | | | | | | | | | | |
| | STANDARDIZED TOTAL RETURNS3 |
| | | For the period ended 9/30/15 | | One Year | | | Five Years | | | Ten Years | | | Since Inception | | | Inception Date |
| | Class A | | | -3.94 | % | | | 13.92 | % | | | 5.47 | % | | | 4.88 | % | | 5/1/97 |
| | Class C | | | -0.08 | | | | 14.37 | | | | 5.26 | | | | 3.54 | | | 8/15/97 |
| | Institutional | | | 2.07 | | | | 15.69 | | | | 6.50 | | | | 5.62 | | | 5/1/97 |
| | Service | | | 1.58 | | | | 15.11 | | | | 5.99 | | | | 5.10 | | | 5/1/97 |
| | Class IR | | | 1.89 | | | | 15.51 | | | | N/A | | | | 6.24 | | | 11/30/07 |
| | Class R6 | | | N/A | | | | N/A | | | | N/A | | | | -8.41 | | | 7/31/15 |
| | | Class R | | | 1.38 | | | | 14.94 | | | | N/A | | | | 5.73 | | | 11/30/07 |
| | 3 | | The Standardized Total Returns are average annual or cumulative total returns (only if the performance period is one year or less) as of the most recent calendar quarter-end. They assume reinvestment of all distributions at NAV. These returns reflect a maximum initial sales charge of 5.5% for Class A Shares and the assumed contingent deferred sales charge for Class C Shares (1% if redeemed within 12 months of purchase). Because Institutional, Service, Class IR, Class R6 and Class R Shares do not involve a sales charge, such a charge is not applied to their Standardized Total Returns. |
The returns set forth in the tables above represent past performance. Past performance does not guarantee future results. The Fund’s investment return and principal value will fluctuate so that an investor’s shares, when redeemed, may be worth more or less than their original cost. Current performance may be lower or higher than the performance quoted above. Please visit our web site at www.GSAMFUNDS.com to obtain the most recent month-end returns. Performance reflects applicable fee waivers and/or expense limitations in effect during the periods shown. In their absence, performance would be reduced. Returns do not reflect the deduction of taxes that a shareholder would pay on Fund distributions or the redemption of Fund shares.
9
FUND BASICS
| | | | | | | | | | |
| | EXPENSE RATIOS4 | |
| | | | | Net Expense Ratio (Current) | | | Gross Expense Ratio (Before Waivers) | |
| | Class A | | | 0.96 | % | | | 1.20 | % |
| | Class C | | | 1.71 | | | | 1.95 | |
| | Institutional | | | 0.56 | | | | 0.80 | |
| | Service | | | 1.06 | | | | 1.30 | |
| | Class IR | | | 0.71 | | | | 0.97 | |
| | Class R6 | | | 0.54 | | | | 0.78 | |
| | | Class R | | | 1.21 | | | | 1.45 | |
| | 4 | | The expense ratios of the Fund, both current (net of applicable fee waivers and/or expense limitations) and before waivers (gross of applicable fee waivers and/or expense limitations) are as set forth above according to the most recent publicly available Prospectus for the Fund and may differ from the expense ratios disclosed in the Financial Highlights in this report. Pursuant to a contractual arrangement, the Fund’s waivers and/or expense limitations will remain in place through at least July 31, 2016, and prior to such date the Investment Adviser may not terminate the arrangements without the approval of the Fund’s Board of Trustees. If these arrangements are discontinued in the future, the expense ratios may change without shareholder approval. |
| | | | | | | | |
| | TOP TEN HOLDINGS AS OF 10/31/155 |
| | | Holding | | % of Net Assets | | | Line of Business |
| | Apple, Inc. | | | 7.3 | % | | Computers & Peripherals |
| | Verizon Communications, Inc. | | | 2.5 | | | Diversified Telecommunication
Services |
| | The Home Depot, Inc. | | | 2.4 | | | Specialty Retail |
| | PepsiCo., Inc. | | | 2.4 | | | Beverages |
| | Comcast Corp. Class A | | | 2.2 | | | Media |
| | Amazon.com, Inc. | | | 2.1 | | | Internet & Catalog Retail |
| | Amgen, Inc. | | | 2.0 | | | Biotechnology |
| | Altria Group, Inc. | | | 2.0 | | | Tobacco |
| | Facebook, Inc. Class A | | | 2.0 | | | Internet Software & Services |
| | | Alphabet, Inc. Class A | | | 1.9 | | | Internet Software & Services |
| | 5 | | The top 10 holdings may not be representative of the Fund’s future investments. |
10
FUND BASICS
| | | | |
| | FUND VS. BENCHMARK SECTOR ALLOCATIONS6 |
| | | As of October 31, 2015 | | |
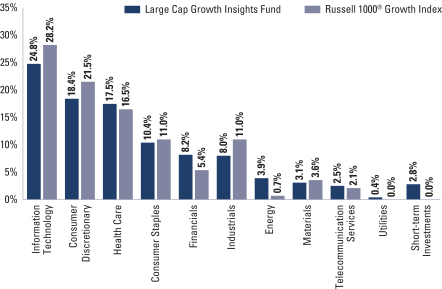
| | 6 | | The Fund is actively managed and, as such, its composition may differ over time. Consequently, the Fund’s overall sector allocations may differ from the percentages contained in the graph above. The graph categorizes investments using the Global Industry Classification Standard (“GICS”), however, the sector classifications used by the portfolio management team may differ from GICS. The percentage shown for each investment category reflects the value of investments in that category as a percentage of market value. Short-term investments represent repurchase agreements. The graph depicts the Fund’s investments but may not represent the Fund’s market exposure due to the exclusion of certain derivatives, if any, as listed in the Additional Investment Information section of the Schedule of Investments. |
11
GOLDMAN SACHS LARGE CAP GROWTH INSIGHTS FUND
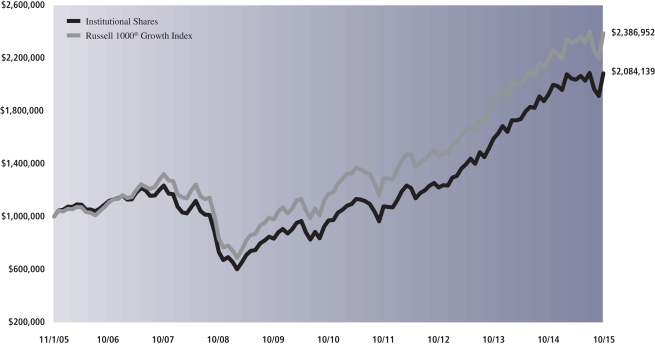
Performance Summary
October 31, 2015
The following graph shows the value, as of October 31, 2015, of a $1,000,000 investment made on November 1, 2005 in Institutional Shares at NAV. For comparative purposes, the performance of the Fund’s benchmark, the Russell 1000® Growth Index (with dividends reinvested), is shown. This performance data represents past performance and should not be considered indicative of future performance, which will fluctuate with changes in market conditions. These performance fluctuations will cause an investor’s shares, when redeemed, to be worth more or less than their original cost. Performance reflects applicable fee waivers and/or expense limitations in effect during the periods shown and in their absence, performance would be reduced. Returns do not reflect the deduction of taxes that a shareholder would pay on Fund distributions or the redemption of Fund shares. Performance of Class A, Class C, Service, Class IR, Class R and Class R6 Shares will vary from Institutional Shares due to differences in class specific fees and any applicable sales charges. In addition to the Investment Adviser’s decisions regarding issuer/industry investment selection and allocation, other factors may affect Fund performance. These factors include, but are not limited to, Fund operating fees and expenses, portfolio turnover and subscription and redemption cash flows affecting the Fund.
|
| Large Cap Growth Insights Fund’s 10 Year Performance |
Performance of a $1,000,000 Investment, including any applicable sales charges, with distributions reinvested, from November 1, 2005 through October 31, 2015.
| | | | | | | | | | | | | | |
| Average Annual Total Return through October 31, 2015 | | | One Year | | | | Five Years | | | | Ten Years | | | Since Inception |
Class A (Commenced May 1, 1997) | | | | | | | | | | | | | | |
Excluding sales charges | | | 7.96% | | | | 16.00% | | | | 7.17% | | | 8.65% |
Including sales charges | | | 2.00% | | | | 14.70% | | | | 6.57% | | | 8.39% |
|
Class C (Commenced August 15, 1997) | | | | | | | | | | | | | | |
Excluding contingent deferred sales charges | | | 7.12% | | | | 15.14% | | | | 6.36% | | | 4.01% |
Including contingent deferred sales charges | | | 6.12% | | | | 15.14% | | | | 6.36% | | | 4.01% |
|
Institutional Class (Commenced May 1, 1997) | | | 8.41% | | | | 16.47% | | | | 7.62% | | | 8.98% |
|
Service Class (Commenced May 1, 1997) | | | 7.88% | | | | 15.89% | | | | 7.07% | | | 8.57% |
|
Class IR (Commenced November 30, 2007) | | | 8.21% | | | | 16.28% | | | | N/A | | | 7.33% |
|
Class R (Commenced November 30, 2007) | | | 7.73% | | | | 15.72% | | | | N/A | | | 6.82% |
|
Class R6 (Commenced July 31, 2015) | | | N/A | | | | N/A | | | | N/A | | | -0.17%* |
|
| * | | Total return for periods of less than one year represents cumulative total return. |
12
PORTFOLIO RESULTS
Goldman Sachs Large Cap Value Insights Fund
Investment Objective
The Fund seeks long-term growth of capital and dividend income.
Portfolio Management Discussion and Analysis
Below, the Goldman Sachs Quantitative Investment Strategies Team discusses the Goldman Sachs Large Cap Value Insights Fund’s (the “Fund”) performance and positioning for the 12-month period ended October 31, 2015 (the “Reporting Period”).
| Q | | How did the Fund perform during the Reporting Period? |
| A | | During the Reporting Period, the Fund’s Class A, C, Institutional, Service, IR and R Shares generated average annual total returns, without sales charges, of 1.82%, 1.11%, 2.24%, 1.77%, 2.14% and 1.56%, respectively. These returns compare to the 0.53% average annual total return of the Fund’s benchmark, the Russell 1000® Value Index (with dividends reinvested) (the “Index”), during the same period. |
| | | During the period from their inception on July 31, 2015 through October 31, 2015, the Fund’s Class R6 Shares generated a cumulative total return, without sales charges, of -1.41% compared to the -1.91% cumulative total return of the Index. |
| Q | | What key factors were most responsible for the Fund’s performance during the Reporting Period? |
| A | | During the Reporting Period, the Fund benefited from stock selection driven by our quantitative model and four of its six investment themes. |
| Q | | What impact did the Fund’s investment themes have on performance during the Reporting Period? |
| A | | In keeping with our investment approach, we use our quantitative model and six investment themes to take a long-term view of market patterns and look for inefficiencies, selecting stocks for the Fund and overweighting or underweighting the ones chosen by the model. Over time and by design, the performance of any one of the model’s investment themes have historically had a low correlation with the model’s other themes, demonstrating the diversification benefit of the Fund’s theme-driven quantitative model. The variance in performance supports our research indicating that the diversification provided by our different investment themes is expected to provide a significant investment advantage over the long term, even though the Fund may experience underperformance in the short term. Of course, diversification does not protect an investor from market risk nor does it ensure a profit. |
| | | During the Reporting Period, four of our six investment themes contributed positively to relative performance. Momentum was our best performing theme. The Momentum theme seeks to predict drifts in stock prices caused by delayed investor reaction to company-specific information and information about related companies. Sentiment, Quality and Profitability also enhanced relative results. The Sentiment theme reflects selected investment views and decisions of individuals and financial intermediaries. The Quality theme seeks to assess both firm and management quality. The Profitability theme seeks to assess whether a company is earning more than its cost of capital. |
| | | Valuation detracted from relative results. The Valuation theme attempts to capture potential mispricings of securities, typically by comparing a measure of the company’s intrinsic value to its market value. |
| | | The impact of our Management theme on relative performance was neutral during the Reporting Period. The Management theme seeks to assess the characteristics, policies and strategic decisions of company management. |
| Q | | How did the Fund’s sector and industry allocations affect relative performance? |
| A | | In constructing the Fund’s portfolio, we focus on picking stocks rather than on making sector or industry bets. Consequently, the Fund is similar to the Index in terms of its sector and industry allocations and its style. Changes in its |
13
PORTFOLIO RESULTS
| | sector or industry weights generally do not have a meaningful impact on relative performance. |
| Q | | Did stock selection help or hurt Fund performance during the Reporting Period? |
| A | | We seek to outpace the Index by overweighting stocks we expect to outperform and underweighting those we think may lag. At the same time, we strive to maintain a risk profile similar to the Index. The Fund’s investments are selected using fundamental research and a variety of quantitative techniques based on our investment themes. For example, the Fund aims to hold a basket of stocks with better Momentum characteristics than the benchmark. |
| | | During the Reporting Period, security selection overall added to the Fund’s relative performance. Stock picks in the energy, industrials and financials sectors contributed positively. Investments in the health care, telecommunication services and utilities sectors detracted from results. |
| Q | | Which individual stock positions contributed most to the Fund’s relative returns during the Reporting Period? |
| A | | The Fund benefited from overweight positions in Cameron International, Tesoro and Valero Energy. Our positive views on Sentiment and Quality led us to overweight Cameron International, a provider of flow equipment products, systems and services to the oil, gas and process industries. The Fund was overweight petroleum refiner Tesoro due to our positive views on Valuation and Sentiment. We assumed the overweight in petroleum refiner Valero Energy because of our positive views on Quality and Momentum. |
| Q | | Which individual stock positions detracted most from the Fund’s results during the Reporting Period? |
| A | | The Fund was hurt during the Reporting Period by an overweight in telecommunications company CenturyLink as well as by underweight positions in semiconductor maker Intel and snack food company Mondelez International. We chose to overweight CenturyLink as a result of our positive views on Quality and Valuation. The Fund was underweight Intel because of our negative views on Profitability, while the underweight in Mondelez International was due to our negative views on Quality. |
| Q | | How did the Fund use derivatives and similar instruments during the Reporting Period? |
| A | | During the Reporting Period, we used financial futures contracts to equitize the Fund’s cash holdings. In other words, we put the Fund’s cash holdings to work by using them as collateral for the purchase of financial futures contracts. |
| Q | | What was the Fund’s sector positioning relative to the Index at the end of the Reporting Period? |
| A | | At the end of the Reporting Period, the Fund was overweight the consumer discretionary, health care and materials sectors relative to the Index. Compared to the Index, the Fund was underweight the utilities, information technology and industrials sectors. The Fund was relatively neutral compared to the Index in the consumer staples, energy, telecommunication services and financials sectors at the end of the Reporting Period. |
14
FUND BASICS
Large Cap Value Insights Fund
as of October 31, 2015
| | | | | | | | | | |
| | PERFORMANCE REVIEW | |
| | | November 1, 2014–October 31, 2015 | | Fund Total Return
(based on NAV)1 | | | Russell 1000® Value Index2 | |
| | Class A | | | 1.82 | % | | | 0.53 | % |
| | Class C | | | 1.11 | | | | 0.53 | |
| | Institutional | | | 2.24 | | | | 0.53 | |
| | Service | | | 1.77 | | | | 0.53 | |
| | Class IR | | | 2.14 | | | | 0.53 | |
| | | Class R | | | 1.56 | | | | 0.53 | |
| | | |
| | | | | | | | | | | |
| | | July 31, 2015–October 31, 2015 | | | | | | |
| | | Class R6 | | | -1.41 | % | | | -1.91 | % |
| | 1 | | The net asset value (“NAV”) represents the net assets of the class of the Fund (ex-dividend) divided by the total number of shares of the class outstanding. The Fund’s performance assumes the reinvestment of dividends and other distributions. The Fund’s performance does not reflect the deduction of any applicable sales charges. |
| | 2 | | The Russell 1000® Value Index (with dividends reinvested) is an unmanaged market capitalization weighted index of the 1000 largest U.S. companies with lower price-to-book ratios and lower forecasted growth values. The figures for the Index do not include any deduction for fees, expenses or taxes. It is not possible to invest directly in an index. |
| | | | | | | | | | | | | | | | | | | | |
| | STANDARDIZED TOTAL RETURNS3 | | | |
| | | For the period ended 9/30/15 | | One Year | | | Five Years | | | Ten Years | | | Since Inception | | | Inception Date |
| | Class A | | | -8.86 | % | | | 11.49 | % | | | 3.77 | % | | | 4.44 | % | | 12/31/98 |
| | Class C | | | -5.26 | | | | 11.93 | | | | 3.58 | | | | 4.01 | | | 12/31/98 |
| | Institutional | | | -3.21 | | | | 13.22 | | | | 4.78 | | | | 5.20 | | | 12/31/98 |
| | Service | | | -3.68 | | | | 12.65 | | | | 4.26 | | | | 4.69 | | | 12/31/98 |
| | Class IR | | | -3.37 | | | | 13.05 | | | | N/A | | | | 3.87 | | | 11/30/07 |
| | Class R6 | | | N/A | | | | N/A | | | | N/A | | | | -8.93 | | | 7/31/15 |
| | | Class R | | | -3.81 | | | | 12.50 | | | | N/A | | | | 3.37 | | | 11/30/07 |
| | 3 | | The Standardized Total Returns are average annual or cumulative total returns (only if the performance period is one year or less) as of the most recent calendar quarter-end. They assume reinvestment of all distributions at NAV. These returns reflect a maximum initial sales charge of 5.5% for Class A Shares and the assumed contingent deferred sales charge for Class C Shares (1% if redeemed within 12 months of purchase). Because Institutional, Service, Class IR, Class R6 and Class R Shares do not involve a sales charge, such a charge is not applied to their Standardized Total Returns. |
The returns set forth in the tables above represent past performance. Past performance does not guarantee future results. The Fund’s investment return and principal value will fluctuate so that an investor’s shares, when redeemed, may be worth more or less than their original cost. Current performance may be lower or higher than the performance quoted above. Please visit our web site at www.GSAMFUNDS.com to obtain the most recent month-end returns. Performance reflects applicable fee waivers and/or expense limitations in effect during the periods shown. In their absence, performance would be reduced. Returns do not reflect the deduction of taxes that a shareholder would pay on Fund distributions or the redemption of Fund shares.
15
FUND BASICS
| | | | | | | | | | |
| | EXPENSE RATIOS4 | |
| | | | | Net Expense Ratio (Current) | | | Gross Expense Ratio (Before Waivers) | |
| | Class A | | | 0.96 | % | | | 1.14 | % |
| | Class C | | | 1.71 | | | | 1.89 | |
| | Institutional | | | 0.56 | | | | 0.74 | |
| | Service | | | 1.06 | | | | 1.24 | |
| | Class IR | | | 0.71 | | | | 0.88 | |
| | Class R6 | | | 0.54 | | | | 0.72 | |
| | | Class R | | | 1.21 | | | | 1.39 | |
| | 4 | | The expense ratios of the Fund, both current (net of applicable fee waivers and/or expense limitations) and before waivers (gross of applicable fee waivers and/or expense limitations) are as set forth above according to the most recent publicly available Prospectus for the Fund and may differ from the expense ratios disclosed in the Financial Highlights in this report. Pursuant to a contractual arrangement, the Fund’s waivers and/or expense limitations will remain in place through at least July 31, 2016, and prior to such date the Investment Adviser may not terminate the arrangements without the approval of the Fund’s Board of Trustees. If these arrangements are discontinued in the future, the expense ratios may change without shareholder approval. |
| | | | | | |
| | TOP TEN HOLDINGS AS OF 10/31/155 |
| | | Holding | | % of Net Assets | | Line of Business |
| | Pfizer, Inc. | | 3.0% | | Pharmaceuticals |
| | Bank of America Corp. | | 2.4 | | Commercial Banks |
| | JPMorgan Chase & Co. | | 2.4 | | Commercial Banks |
| | Exxon Mobil Corp. | | 2.4 | | Oil, Gas & Consumable Fuels |
| | Citigroup, Inc. | | 2.1 | | Commercial Banks |
| | Cisco Systems, Inc. | | 2.0 | | Communications Equipment |
| | General Electric Co. | | 1.9 | | Industrial Conglomerates |
| | Johnson & Johnson | | 1.9 | | Pharmaceuticals |
| | Abbott Laboratories | | 1.7 | | Health Care Equipment & Supplies |
| | | Wells Fargo & Co. | | 1.4 | | Commercial Banks |
| | 5 | | The top 10 holdings may not be representative of the Fund’s future investments. |
16
FUND BASICS
|
| FUND VS. BENCHMARK SECTOR ALLOCATIONS6 |
| As of October 31, 2015 |
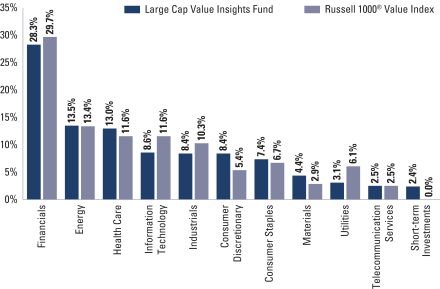
| | 6 | | The Fund is actively managed and, as such, its composition may differ over time. Consequently, the Fund’s overall sector allocations may differ from the percentages contained in the graph above. The graph categorizes investments using the Global Industry Classification Standard (“GICS”), however, the sector classifications used by the portfolio management team may differ from GICS. The percentage shown for each investment category reflects the value of investments in that category as a percentage of market value (excluding investments in the securities lending reinvestment vehicle, if any). Investments in the securities lending reinvestment vehicle represented 0.4% of the Fund’s net assets as of October 31, 2015. Short-term investments represent repurchase agreements. The graph depicts the Fund’s investments but may not represent the Fund’s market exposure due to the exclusion of certain derivatives, if any, as listed in the Additional Investment Information section of the Schedule of Investments. |
17
GOLDMAN SACHS LARGE CAP VALUE INSIGHTS FUND
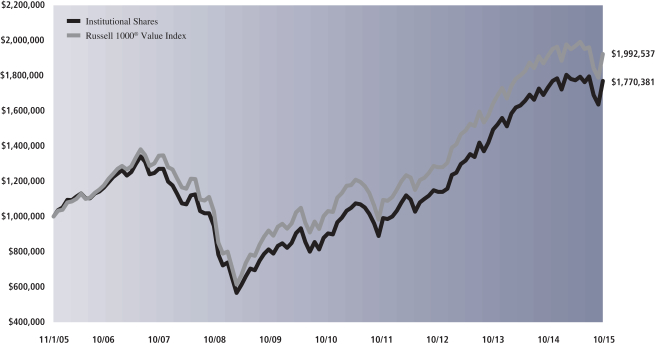
Performance Summary
October 31, 2015
The following graph shows the value, as of October 31, 2015, of a $1,000,000 investment made on November 1, 2005 in Institutional Shares at NAV. For comparative purposes, the performance of the Fund’s benchmark, the Russell 1000® Value Index (with dividends reinvested), is shown. This performance data represents past performance and should not be considered indicative of future performance, which will fluctuate with changes in market conditions. These performance fluctuations will cause an investor’s shares, when redeemed, to be worth more or less than their original cost. Performance reflects applicable fee waivers and/or expense limitations in effect during the periods shown and in their absence, performance would be reduced. Returns do not reflect the deduction of taxes that a shareholder would pay on Fund distributions or the redemption of Fund shares. Performance of Class A, Class C, Service, Class IR, Class R and Class R6 Shares will vary from Institutional Shares due to differences in class specific fees and any applicable sales charges. In addition to the Investment Adviser’s decisions regarding issuer/industry investment selection and allocation, other factors may affect Fund performance. These factors include, but are not limited to, Fund operating fees and expenses, portfolio turnover and subscription and redemption cash flows affecting the Fund.
|
| Large Cap Value Insights Fund’s 10 Year Performance |
Performance of a $1,000,000 Investment, including any applicable sales charges, with distributions reinvested, from November 1, 2005 through October 31, 2015.
| | | | | | | | | | | | | | |
| Average Annual Total Return through October 31, 2015 | | | One Year | | | | Five Years | | | | Ten Years | | | Since Inception |
Class A (Commenced December 31, 1998) | | | | | | | | | | | | | | |
Excluding sales charges | | | 1.82% | | | | 13.89% | | | | 5.44% | | | 5.26% |
Including sales charges | | | -3.77% | | | | 12.61% | | | | 4.84% | | | 4.90% |
|
Class C (Commenced December 31, 1998) | | | | | | | | | | | | | | |
Excluding contingent deferred sales charges | | | 1.11% | | | | 13.06% | | | | 4.66% | | | 4.47% |
Including contingent deferred sales charges | | | 0.11% | | | | 13.06% | | | | 4.66% | | | 4.47% |
|
Institutional Class (Commenced December 31, 1998) | | | 2.24% | | | | 14.37% | | | | 5.87% | | | 5.67% |
|
Service Class (Commenced December 31, 1998) | | | 1.77% | | | | 13.78% | | | | 5.34% | | | 5.15% |
|
Class IR (Commenced November 30, 2007) | | | 2.14% | | | | 14.20% | | | | N/A | | | 4.87% |
|
Class R (Commenced November 30, 2007) | | | 1.56% | | | | 13.61% | | | | N/A | | | 4.36% |
|
Class R6 (Commenced July 31, 2015) | | | N/A | | | | N/A | | | | N/A | | | -1.41%* |
|
| * | | Total return for periods of less than one year represents cumulative total return. |
18
PORTFOLIO RESULTS
Goldman Sachs Small Cap Equity Insights Fund
Investment Objective
The Fund seeks long-term growth of capital.
Portfolio Management Discussion and Analysis
Below, the Goldman Sachs Quantitative Investment Strategies Team discusses the Goldman Sachs Small Cap Equity Insights Fund’s (the “Fund”) performance and positioning for the 12-month period ended October 31, 2015 (the “Reporting Period”).
| Q | | How did the Fund perform during the Reporting Period? |
| A | | During the Reporting Period, the Fund’s Class A, C, Institutional, Service, IR and R Shares generated average annual total returns, without sales charges, of 4.66%, 3.89%, 5.13%, 4.56%, 4.99% and 4.45%, respectively. These returns compare to the 0.34% average annual total return of the Fund’s benchmark, the Russell 2000® Index (with dividends reinvested) (the “Index”), during the same period. |
| | | During the period from their inception on July 31, 2015 through October 31, 2015, the Fund’s Class R6 Shares generated a cumulative total return, without sales charges, of -1.88% compared to the -5.86% cumulative total return of the Index. |
| Q | | What key factors were most responsible for the Fund’s performance during the Reporting Period? |
| A | | During the Reporting Period, the Fund benefited from stock selection driven by our quantitative model and four of its six investment themes. |
| Q | | What impact did the Fund’s investment themes have on performance during the Reporting Period? |
| A | | In keeping with our investment approach, we use our quantitative model and six investment themes to take a long-term view of market patterns and look for inefficiencies, selecting stocks for the Fund and overweighting or underweighting the ones chosen by the model. Over time and by design, the performance of any one of the model’s investment themes have historically had a low correlation with the model’s other themes, demonstrating the diversification benefit of the Fund’s theme-driven quantitative model. The variance in performance supports our research indicating that the diversification provided by our different investment themes is expected to provide a significant investment advantage over the long term, even though the Fund may experience underperformance in the short term. Of course, diversification does not protect an investor from market risk nor does it ensure a profit. |
| | | During the Reporting Period, four of our six investment themes added to the Fund’s relative returns — Sentiment, Quality, Momentum and Profitability. The Sentiment theme reflects selected investment views and decisions of individuals and financial intermediaries. The Quality theme seeks to assess both firm and management quality. The Momentum theme seeks to predict drifts in stock prices caused by delayed investor reaction to company-specific information and information about related companies. The Profitability theme seeks to assess whether a company is earning more than its cost of capital. |
| | | Valuation and Management detracted from relative performance. The Valuation theme attempts to capture potential mispricings of securities, typically by comparing a measure of the company’s intrinsic value to its market value. The Management theme seeks to assess the characteristics, policies and strategic decisions of company management. |
| Q | | How did the Fund’s sector and industry allocations affect relative performance? |
| A | | In constructing the Fund’s portfolio, we focus on picking stocks rather than on making sector or industry bets. Consequently, the Fund is similar to the Index in terms of its sector and industry allocations and its style. Changes in its sector or industry weights generally do not have a meaningful impact on relative performance. |
19
PORTFOLIO RESULTS
| Q | | Did stock selection help or hurt Fund performance during the Reporting Period? |
| A | | We seek to outpace the Index by overweighting stocks we expect to outperform and underweighting those we think may lag. At the same time, we strive to maintain a risk profile similar to the Index. The Fund’s investments are selected using fundamental research and a variety of quantitative techniques based on our investment themes. For example, the Fund aims to hold a basket of stocks with better Momentum characteristics than the benchmark. |
| | | During the Reporting Period, security selection overall contributed positively to the Fund’s relative performance, with investments in the industrials, health care and energy sectors adding to results. Stock selection in only one sector — utilities — detracted from relative returns. |
| Q | | Which individual stock positions contributed most to the Fund’s relative returns during the Reporting Period? |
| A | | The Fund benefited from overweight positions in Dyax, Cash America International and NPS Pharmaceuticals. We assumed the overweight in biopharmaceutical company Dyax based on our positive views on Sentiment and Profitability. The Fund was overweight Cash America International, a pawn shop retailer that also provides check cashing services and payday loans, because of our positive views on Quality and Valuation. The overweight in drug maker NPS Pharmaceuticals was the result of our positive views on Momentum and Valuation. |
| Q | | Which individual stock positions detracted most from the Fund’s results during the Reporting Period? |
| A | | Fund performance was hampered by overweight positions in oilfield services provider Pioneer Energy Services, biopharmaceutical company Anacor Pharmaceuticals and independent power producer Talen Energy. We adopted the overweight in Pioneer Energy Services due to our positive views on Quality, Profitability and Valuation. The overweight in Anacor Pharmaceutical was the result of our positive views on Valuation and Quality, while the Fund was overweight Talen Energy because of our positive views of Momentum and Quality. |
| Q | | How did the Fund use derivatives and similar instruments during the Reporting Period? |
| A | | During the Reporting Period, we used financial futures contracts to equitize the Fund’s cash holdings. In other words, we put the Fund’s cash holdings to work by using them as collateral for the purchase of financial futures contracts. |
| Q | | What was the Fund’s sector positioning relative to the Index at the end of the Reporting Period? |
| A | | At the end of the Reporting Period, the Fund was overweight the industrials, energy, and materials relative to the Index. Compared to the Index, the Fund was underweight the utilities, information technology, financials and consumer staples sectors. The Fund was relatively neutral compared to the Index in the consumer discretionary, health care and telecommunication services sectors at the end of the Reporting Period. |
20
FUND BASICS
Small Cap Equity Insights Fund
as of October 31, 2015
| | | | | | | | | | |
| | PERFORMANCE REVIEW | |
| | | November 1, 2014–October 31, 2015 | | Fund Total Return
(based on NAV)1 | | | Russell 2000® Index2 | |
| | Class A | | | 4.66 | % | | | 0.34 | % |
| | Class C | | | 3.89 | | | | 0.34 | |
| | Institutional | | | 5.13 | | | | 0.34 | |
| | Service | | | 4.56 | | | | 0.34 | |
| | Class IR | | | 4.99 | | | | 0.34 | |
| | | Class R | | | 4.45 | | | | 0.34 | |
| | | |
| | | | | | | | | | | |
| | | July 31, 2015–October 31, 2015 | | | | | | |
| | | Class R6 | | | -1.88 | % | | | -5.86 | % |
| | 1 | | The net asset value (“NAV”) represents the net assets of the class of the Fund (ex-dividend) divided by the total number of shares of the class outstanding. The Fund’s performance assumes the reinvestment of dividends and other distributions. The Fund’s performance does not reflect the deduction of any applicable sales charges. |
| | 2 | | The Russell 2000® Index (with dividends reinvested) is an unmanaged index of common stock prices that measures the performance of the 2000 smallest companies in the Russell 3000® Index. The figures for the Index do not include any deduction for fees, expenses or taxes. It is not possible to invest directly in an index. |
| | | | | | | | | | | | | | | | | | | | |
| | STANDARDIZED TOTAL RETURNS3 |
| | | For the period ended 9/30/15 | | One Year | | | Five Years | | | Ten Years | | | Since Inception | | | Inception Date |
| | Class A | | | -1.61 | % | | | 10.79 | % | | | 3.75 | % | | | 5.72 | % | | 8/15/97 |
| | Class C | | | 2.38 | | | | 11.21 | | | | 3.56 | | | | 5.27 | | | 8/15/97 |
| | Institutional | | | 4.56 | | | | 12.50 | | | | 4.76 | | | | 6.47 | | | 8/15/97 |
| | Service | | | 3.99 | | | | 11.92 | | | | 4.23 | | | | 5.94 | | | 8/15/97 |
| | Class IR | | | 4.39 | | | | 12.34 | | | | N/A | | | | 6.49 | | | 11/30/07 |
| | Class R6 | | | N/A | | | | N/A | | | | N/A | | | | -8.90 | | | 7/31/15 |
| | | Class R | | | 3.87 | | | | 11.77 | | | | N/A | | | | 5.97 | | | 11/30/07 |
| | 3 | | The Standardized Total Returns are average annual total or cumulative total returns (only if the performance period is one year or less) as of the most recent calendar quarter-end. They assume reinvestment of all distributions at NAV. These returns reflect a maximum initial sales charge of 5.5% for Class A Shares and the assumed contingent deferred sales charge for Class C Shares (1% if redeemed within 12 months of purchase). Because Institutional, Service, Class IR, Class R6 and Class R Shares do not involve a sales charge, such a charge is not applied to their Standardized Total Returns. |
The returns set forth in the tables above represent past performance. Past performance does not guarantee future results. The Fund’s investment return and principal value will fluctuate so that an investor’s shares, when redeemed, may be worth more or less than their original cost. Current performance may be lower or higher than the performance quoted above. Please visit our web site at www.GSAMFUNDS.com to obtain the most recent month-end returns. Performance reflects applicable fee waivers and/or expense limitations in effect during the periods shown. In their absence, performance would be reduced. Returns do not reflect the deduction of taxes that a shareholder would pay on Fund distributions or the redemption of Fund shares.
21
FUND BASICS
| | | | | | | | | | |
| | EXPENSE RATIOS4 | |
| | | | | Net Expense Ratio (Current) | | | Gross Expense Ratio (Before Waivers) | |
| | Class A | | | 1.27 | % | | | 1.51 | % |
| | Class C | | | 2.02 | | | | 2.26 | |
| | Institutional | | | 0.87 | | | | 1.11 | |
| | Service | | | 1.37 | | | | 1.60 | |
| | Class IR | | | 1.02 | | | | 1.24 | |
| | Class R6 | | | 0.85 | | | | 1.09 | |
| | | Class R | | | 1.52 | | | | 1.76 | |
| | 4 | | The expense ratios of the Fund, both current (net of applicable fee waivers and/or expense limitations) and before waivers (gross of applicable fee waivers and/or expense limitations) are as set forth above according to the most recent publicly available Prospectus for the Fund and may differ from the expense ratios disclosed in the Financial Highlights in this report. Pursuant to a contractual arrangement, the Fund’s waivers and/or expense limitations will remain in place through at least July 31, 2016, and prior to such date the Investment Adviser may not terminate the arrangements without the approval of the Fund’s Board of Trustees. If these arrangements are discontinued in the future, the expense ratios may change without shareholder approval. |
| | | | | | | | |
| | TOP TEN HOLDINGS AS OF 10/31/155 |
| | | Holding | | % of Net Assets | | | Line of Business |
| | CubeSmart | | | 0.9 | % | | Real Estate Investment Trusts |
| | Berry Plastics Group, Inc. | | | 0.9 | | | Containers & Packaging |
| | Cavco Industries, Inc. | | | 0.9 | | | Household Durables |
| | Anacor Pharmaceuticals, Inc. | | | 0.8 | | | Biotechnology |
| | EMCOR Group, Inc. | | | 0.8 | | | Construction & Engineering |
| | DCT Industrial Trust, Inc. | | | 0.8 | | | Real Estate Investment Trusts |
| | Cash America International, Inc. | | | 0.8 | | | Consumer Finance |
| | Cooper Tire & Rubber Co. | | | 0.8 | | | Auto Components |
| | Korn/Ferry International | | | 0.8 | | | Professional Services |
| | | OSI Systems, Inc. | | | 0.8 | | | Electronic Equipment, Instruments
& Components |
| | 5 | | The top 10 holdings may not be representative of the Fund’s future investments. |
22
FUND BASICS
|
| FUND VS. BENCHMARK SECTOR ALLOCATIONS6 |
| As of October 31, 2015 |
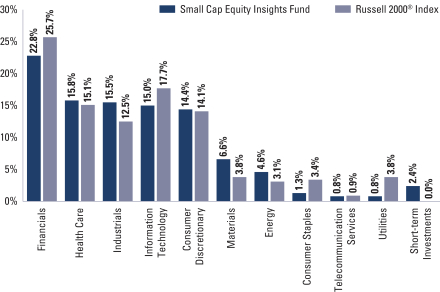
| | 6 | | The Fund is actively managed and, as such, its composition may differ over time. Consequently, the Fund’s overall sector allocations may differ from the percentages contained in the graph above. The graph categorizes investments using the Global Industry Classification Standard (“GICS”), however, the sector classifications used by the portfolio management team may differ from GICS. The percentage shown for each investment category reflects the value of investments in that category as a percentage of market value (excluding investments in the securities lending reinvestment vehicle, if any). Investments in the securities lending reinvestment vehicle represented 2.1% of the Fund’s net assets as of October 31, 2015. Short-term investments represent repurchase agreements. The graph depicts the Fund’s investments but may not represent the Fund’s market exposure due to the exclusion of certain derivatives, if any, as listed in the Additional Investment Information section of the Schedule of Investments. |
23
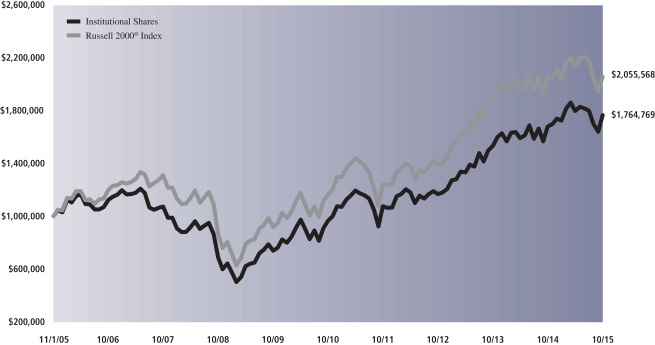
GOLDMAN SACHS SMALL CAP EQUITY INSIGHTS FUND
Performance Summary
October 31, 2015
The following graph shows the value, as of October 31, 2015, of a $1,000,000 investment made on November 1, 2005 in Institutional Shares at NAV. For comparative purposes, the performance of the Fund’s benchmark, the Russell 2000® Index (with dividends reinvested), is shown. This performance data represents past performance and should not be considered indicative of future performance, which will fluctuate with changes in market conditions. These performance fluctuations will cause an investor’s shares, when redeemed, to be worth more or less than their original cost. Performance reflects applicable fee waivers and/or expense limitations in effect during the periods shown and in their absence, performance would be reduced. Returns do not reflect the deduction of taxes that a shareholder would pay on Fund distributions or the redemption of Fund shares. Performance of Class A, Class C, Service, Class IR, Class R and Class R6 Shares will vary from Institutional Shares due to differences in class specific fees and any applicable sales charges. In addition to the Investment Adviser’s decisions regarding issuer/industry investment selection and allocation, other factors may affect Fund performance. These factors include, but are not limited to, Fund operating fees and expenses, portfolio turnover and subscription and redemption cash flows affecting the Fund.
|
| Small Cap Equity Insights Fund’s 10 Year Performance |
Performance of a $1,000,000 Investment, including any applicable sales charges, with distributions reinvested, from November 1, 2005 through October 31, 2015.
| | | | | | | | | | | | | | |
| Average Annual Total Return through October 31, 2015 | | | One Year | | | | Five Years | | | | Ten Years | | | Since Inception |
Class A (Commenced August 15, 1997) | | | | | | | | | | | | | | |
Excluding sales charges | | | 4.66% | | | | 12.35% | | | | 5.41% | | | 6.45% |
Including sales charges | | | -1.09% | | | | 11.08% | | | | 4.82% | | | 6.12% |
|
Class C (Commenced August 15, 1997) | | | | | | | | | | | | | | |
Excluding contingent deferred sales charges | | | 3.89% | | | | 11.52% | | | | 4.63% | | | 5.67% |
Including contingent deferred sales charges | | | 2.89% | | | | 11.52% | | | | 4.63% | | | 5.67% |
|
Institutional Class (Commenced August 15, 1997) | | | 5.13% | | | | 12.82% | | | | 5.84% | | | 6.87% |
|
Service Class (Commenced August 15, 1997) | | | 4.56% | | | | 12.23% | | | | 5.30% | | | 6.34% |
|
Class IR (Commenced November 30, 2007) | | | 4.99% | | | | 12.65% | | | | N/A | | | 7.41% |
|
Class R (Commenced November 30, 2007) | | | 4.45% | | | | 12.09% | | | | N/A | | | 6.90% |
|
Class R6 (Commenced July 31, 2015) | | | N/A | | | | N/A | | | | N/A | | | -1.88%* |
|
| * | | Total return for periods of less than one year represents cumulative total return. |
24
PORTFOLIO RESULTS
Goldman Sachs Small Cap Growth Insights Fund
Investment Objective
The Fund seeks long-term growth of capital.
Portfolio Management Discussion and Analysis
Below, the Goldman Sachs Quantitative Investment Strategies Team discusses the Goldman Sachs Small Cap Growth Insights Fund’s (the “Fund”) performance and positioning for the 12-month period ended October 31, 2015 (the “Reporting Period”).
| Q | | How did the Fund perform during the Reporting Period? |
| A | | During the Reporting Period, the Fund’s Class A, C, Institutional, IR and R Shares generated average annual total returns, without sales charges, of 5.95%, 5.18%, 6.39%, 6.24% and 5.67%, respectively. These returns compare to the 3.52% average annual total return of the Fund’s benchmark, the Russell 2000® Growth Index (with dividends reinvested) (the “Index”), during the same period. |
| | | During the period from their inception on July 31, 2015 through October 31, 2015, the Fund’s Class R6 Shares generated a cumulative total return, without sales charges, of -4.03% compared to the -8.50% cumulative total return of the Index. |
| Q | | What key factors were most responsible for the Fund’s performance during the Reporting Period? |
| A | | During the Reporting Period, the Fund benefited from stock selection driven by our quantitative model and four of its six investment themes. |
| Q | | What impact did the Fund’s investment themes have on performance during the Reporting Period? |
| A | | In keeping with our investment approach, we use our quantitative model and six investment themes to take a long-term view of market patterns and look for inefficiencies, selecting stocks for the Fund and overweighting or underweighting the ones chosen by the model. Over time and by design, the performance of any one of the model’s investment themes have historically had a low correlation with the model’s other themes, demonstrating the diversification benefit of the Fund’s theme-driven quantitative model. The variance in performance supports our research indicating that the diversification provided by our different investment themes is expected to provide a significant investment advantage over the long term, even though the Fund may experience underperformance in the short term. Of course, diversification does not protect an investor from market risk nor does it ensure a profit. |
| | | During the Reporting Period, four of our six investment themes contributed positively to the Fund’s relative returns. Sentiment and Quality were our best performing themes. The Sentiment theme reflects selected investment views and decisions of individuals and financial intermediaries. The Quality theme seeks to assess both firm and management quality. Momentum and Profitability also added to the Fund’s relative results. The Momentum theme seeks to predict drifts in stock prices caused by delayed investor reaction to company-specific information and information about related companies. The Profitability theme seeks to assess whether a company is earning more than its cost of capital. |
| | | Valuation detracted from relative results during the Reporting Period. The Valuation theme attempts to capture potential mispricings of securities, typically by comparing a measure of the company’s intrinsic value to its market value. |
| | | Our Management theme had a neutral impact on relative performance during the Reporting Period. The Management theme seeks to assess the characteristics, policies and strategic decisions of company management. |
| Q | | How did the Fund’s sector and industry allocations affect relative performance? |
| A | | In constructing the Fund’s portfolio, we focus on picking stocks rather than on making sector or industry bets. Consequently, the Fund is similar to the Index in terms of its sector and industry allocations and style. Changes in its sector or industry weights generally do not have a meaningful impact on relative performance. |
25
PORTFOLIO RESULTS
| Q | | Did stock selection help or hurt Fund performance during the Reporting Period? |
| A | | We seek to outpace the Index by overweighting stocks we expect to outperform and underweighting those we think may lag. At the same time, we strive to maintain a risk profile similar to the Index. The Fund’s investments are selected using fundamental research and a variety of quantitative techniques based on our investment themes. For example, the Fund aims to hold a basket of stocks with better Momentum characteristics than the benchmark. |
| | | During the Reporting Period, security selection overall contributed positively to the Fund’s relative performance. Investments in the industrials, health care and energy sectors added to relative results. Stock selection in only one sector — utilities — detracted from relative returns. |
| Q | | Which individual stock positions contributed most to the Fund’s relative returns during the Reporting Period? |
| A | | The Fund benefited from overweight positions in Dyax, Thoratec and Hawaiian Holdings. We adopted the overweight in biopharmaceutical company Dyax because of our positive views on Sentiment and Profitability. The Fund was overweight medical device manufacturer Thoratec based on our positive views on Valuation and Momentum. Our positive views on Profitability and Valuation led us to overweight Hawaiian Holdings, the holding company for Hawaiian Airlines. |
| Q | | Which individual stock positions detracted most from the Fund’s results during the Reporting Period? |
| A | | The Fund was hurt by underweight positions in biopharmaceutical companies Novavax and Synageva BioPharma during the Reporting Period. An overweight in Bill Barrett, a natural gas and oil exploration company, also detracted from relative returns. We chose to underweight Novavax because of our negative views on Momentum and Sentiment, while the underweight in Synageva BioPharma was due to our negative views on Sentiment and Quality. The Fund was overweight Bill Barrett as a result of our positive views on Quality. |
| Q | | How did the Fund use derivatives and similar instruments during the Reporting Period? |
| A | | During the Reporting Period, we used financial futures contracts to equitize the Fund’s cash holdings. In other words, we put the Fund’s cash holdings to work by using them as collateral for the purchase of financial futures contracts. |
| Q | | What was the Fund’s sector positioning relative to the Index at the end of the Reporting Period? |
| A | | At the end of the Reporting Period, the Fund was overweight the industrials, energy and materials sectors relative to the Index. Compared to the Index, the Fund was underweight the information technology, consumer staples and consumer discretionary sectors. The Fund was relatively neutral compared to the Index in the financials, utilities, telecommunication services and health care sectors at the end of the Reporting Period. |
26
FUND BASICS
Small Cap Growth Insights Fund
as of October 31, 2015
| | | | | | | | | | |
| | PERFORMANCE REVIEW | |
| | | November 1, 2014–October 31, 2015 | | Fund Total Return
(based on NAV)1 | | | Russell 2000® Growth Index2 | |
| | Class A | | | 5.95 | % | | | 3.52 | % |
| | Class C | | | 5.18 | | | | 3.52 | |
| | Institutional | | | 6.39 | | | | 3.52 | |
| | Class IR | | | 6.24 | | | | 3.52 | |
| | | Class R | | | 5.67 | | | | 3.52 | |
| | | |
| | | | | | | | | | | |
| | | July 31, 2015–October 31, 2015 | | | | | | |
| | | Class R6 | | | -4.03 | % | | | -8.50 | % |
| | 1 | | The net asset value (“NAV”) represents the net assets of the class of the Fund (ex-dividend) divided by the total number of shares of the class outstanding. The Fund’s performance assumes the reinvestment of dividends and other distributions. The Fund’s performance does not reflect the deduction of any applicable sales charges. |
| | 2 | | The Russell 2000® Growth Index (with dividends reinvested) is an unmanaged index of common stock prices that measures the performance of those Russell 2000 companies with lower price-to-book ratios and lower forecasted growth values. The Index figures do not reflect any deduction for fees, expenses or taxes. It is not possible to invest directly in an index. |
| | | | | | | | | | | | | | | | |
| | STANDARDIZED TOTAL RETURNS3 |
| | | For the period ended 9/30/15 | | One Year | | | Five Years | | | Since Inception | | | Inception Date |
| | Class A | | | -1.65 | % | | | 12.76 | % | | | 5.06 | % | | 6/25/07 |
| | Class C | | | 2.30 | | | | 13.19 | | | | 4.99 | | | 6/25/07 |
| | Institutional | | | 4.51 | | | | 14.49 | | | | 6.21 | | | 6/25/07 |
| | Class IR | | | 4.34 | | | | 14.32 | | | | 7.67 | | | 11/30/07 |
| | Class R6 | | | N/A | | | | N/A | | | | -10.77 | | | 7/31/15 |
| | | Class R | | | 3.81 | | | | 13.75 | | | | 7.12 | | | 11/30/07 |
| | 3 | | The Standardized Total Returns are average annual or cumulative total returns (only if the performance period is one year or less) as of the most recent calendar quarter-end. They assume reinvestment of all distributions at NAV. These returns reflect a maximum initial sales charge of 5.5% for Class A Shares and the assumed contingent deferred sales charge for Class C Shares (1% if redeemed within 12 months of purchase). Because Institutional, Class IR, Class R6 and Class R Shares do not involve a sales charge, such a charge is not applied to their Standardized Total Returns. |
The returns set forth in the tables above represent past performance. Past performance does not guarantee future results. The Fund’s investment return and principal value will fluctuate so that an investor’s shares, when redeemed, may be worth more or less than their original cost. Current performance may be lower or higher than the performance quoted above. Please visit our web site at www.GSAMFUNDS.com to obtain the most recent month-end returns. Performance reflects applicable fee waivers and/or expense limitations in effect during the periods shown. In their absence, performance would be reduced. Returns do not reflect the deduction of taxes that a shareholder would pay on Fund distributions or the redemption of Fund shares.
27
FUND BASICS
| | | | | | | | | | |
| | EXPENSE RATIOS4 | |
| | | | | Net Expense Ratio (Current) | | | Gross Expense Ratio (Before Waivers) | |
| | Class A | | | 1.28 | % | | | 1.87 | % |
| | Class C | | | 2.03 | | | | 2.62 | |
| | Institutional | | | 0.88 | | | | 1.48 | |
| | Class IR | | | 1.03 | | | | 1.63 | |
| | Class R6 | | | 0.86 | | | | 1.46 | |
| | | Class R | | | 1.52 | | | | 2.10 | |
| | 4 | | The expense ratios of the Fund, both current (net of applicable fee waivers and/or expense limitations) and before waivers (gross of applicable fee waivers and/or expense limitations) are as set forth above according to the most recent publicly available Prospectus for the Fund and may differ from the expense ratios disclosed in the Financial Highlights in this report. Pursuant to a contractual arrangement, the Fund’s waivers and/or expense limitations will remain in place through at least July 31, 2016, and prior to such date the Investment Adviser may not terminate the arrangements without the approval of the Fund’s Board of Trustees. If these arrangements are discontinued in the future, the expense ratios may change without shareholder approval. |
| | | | | | | | |
| | TOP TEN HOLDINGS AS OF 10/31/155 |
| | | Holding | | % of Net Assets | | | Line of Business |
| | Manhattan Associates, Inc. | | | 1.2 | % | | Software |
| | Tyler Technologies, Inc. | | | 1.2 | | | Software |
| | Anacor Pharmaceuticals, Inc. | | | 1.1 | | | Biotechnology |
| | West Pharmaceutical Services, Inc. | | | 1.0 | | | Health Care Equipment & Supplies |
| | CubeSmart | | | 1.0 | | | Real Estate Investment Trusts |
| | WellCare Health Plans, Inc. | | | 1.0 | | | Health Care Providers & Services |
| | Dyax Corp. | | | 0.9 | | | Biotechnology |
| | Berry Plastics Group, Inc. | | | 0.9 | | | Containers & Packaging |
| | Fair Isaac Corp. | | | 0.9 | | | Software |
| | | CyrusOne, Inc. | | | 0.9 | | | Real Estate Investment Trusts |
| | 5 | | The top 10 holdings may not be representative of the Fund’s future investments. |
28
FUND BASICS
|
| FUND VS. BENCHMARK SECTOR ALLOCATIONS6 |
| As of October 31, 2015 |
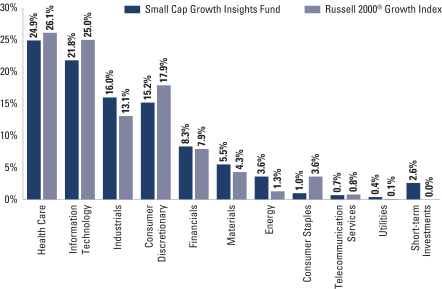
| | 6 | | The Fund is actively managed and, as such, its composition may differ over time. Consequently, the Fund’s overall sector allocations may differ from the percentages contained in the graph above. The graph categorizes investments using the Global Industry Classification Standard (“GICS”), however, the sector classifications used by the portfolio management team may differ from GICS. The percentage shown for each investment category reflects the value of investments in that category as a percentage of market value (excluding investments in the securities lending reinvestment vehicle, if any). Investments in the securities lending reinvestment vehicle represented 2.8% of the Fund’s net assets as of October 31, 2015. Short-term investments represent repurchase agreements. The graph depicts the Fund’s investments but may not represent the Fund’s market exposure due to the exclusion of certain derivatives, if any, as listed in the Additional Investment Information section of the Schedule of Investments. |
29
GOLDMAN SACHS SMALL CAP GROWTH INSIGHTS FUND
Performance Summary
October 31, 2015
The following graph shows the value, as of October 31, 2015, of a $1,000,000 investment made on June 25, 2007 (commencement of operations) in Institutional Shares at NAV. For comparative purposes, the performance of the Fund’s benchmark, the Russell 2000® Growth Index (with dividends reinvested), is shown. This performance data represents past performance and should not be considered indicative of future performance, which will fluctuate with changes in market conditions. These performance fluctuations will cause an investor’s shares, when redeemed, to be worth more or less than their original cost. Performance reflects applicable fee waivers and/or expense limitations in effect during the periods shown and in their absence, performance would be reduced. Returns do not reflect the deduction of taxes that a shareholder would pay on Fund distributions or the redemption of Fund shares. Performance of Class A, Class C, Class IR, Class R and Class R6 Shares will vary from Institutional Shares due to differences in class specific fees and any applicable sales charges. In addition to the Investment Adviser’s decisions regarding issuer/industry investment selection and allocation, other factors may affect Fund performance. These factors include, but are not limited to, Fund operating fees and expenses, portfolio turnover and subscription and redemption cash flows affecting the Fund.
|
| Small Cap Growth Insights Fund’s Lifetime Performance |
Performance of a $1,000,000 Investment, including any applicable sales charges, with distributions reinvested, from June 25, 2007, through October 31, 2015.
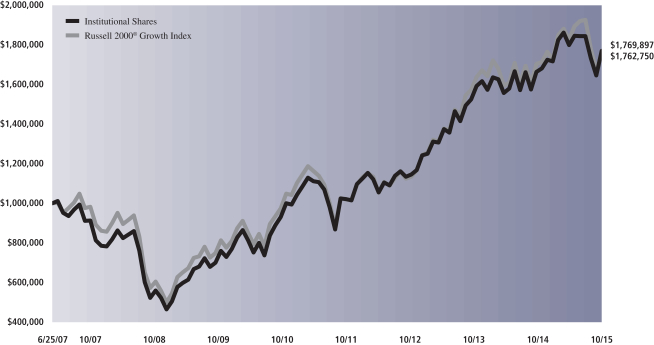
| | | | | | | | | | |
| Average Annual Total Return through October 31, 2015 | | | One Year | | | | Five Years | | | Since Inception |
Class A (Commenced June 25, 2007) | | | | | | | | | | |
Excluding sales charges | | | 5.95% | | | | 14.32% | | | 6.64% |
Including sales charges | | | 0.14% | | | | 13.03% | | | 5.92% |
|
Class C (Commenced June 25, 2007) |
Excluding contingent deferred sales charges | | | 5.18% | | | | 13.47% | | | 5.85% |
Including contingent deferred sales charges | | | 4.13% | | | | 13.47% | | | 5.85% |
|
Institutional Class (Commenced June 25, 2007) | | | 6.39% | | | | 14.78% | | | 7.07% |
|
Class IR (Commenced November 30, 2007) | | | 6.24% | | | | 14.61% | | | 8.58% |
|
Class R (Commenced November 30, 2007) | | | 5.67% | | | | 14.03% | | | 8.02% |
|
Class R6 (Commenced July 31, 2015) | | | N/A | | | | N/A | | | -4.03%* |
|
| * | | Total return for periods of less than one year represents cumulative total return. |
30
PORTFOLIO RESULTS
Goldman Sachs Small Cap Value Insights Fund
Investment Objective
The Fund seeks long-term growth of capital.
Portfolio Management Discussion and Analysis
Below, the Goldman Sachs Quantitative Investment Strategies Team discusses the Goldman Sachs Small Cap Value Insights Fund’s (the “Fund”) performance and positioning for the 12-month period ended October 31, 2015 (the “Reporting Period”).
| Q | | How did the Fund perform during the Reporting Period? |
| A | | During the Reporting Period, the Fund’s Class A, C, Institutional, IR and R Shares generated average annual total returns, without sales charges, of 0.53%, -0.21%, 0.93%, 0.76% and 0.27%, respectively. These returns compare to the -2.88% average annual total return of the Fund’s benchmark, the Russell 2000® Value Index (with dividends reinvested) (the “Index”), during the same period. |
| | During the period from their inception on July 31, 2015 through October 31, 2015, the Fund’s Class R6 Shares generated a cumulative total return, without sales charges, of -1.64% compared to the -3.06% cumulative total return of the Index. |
| Q | | What key factors were most responsible for the Fund’s performance during the Reporting Period? |
| A | | During the Reporting Period, the Fund benefited from stock selection driven by our quantitative model and four of its six investment themes. |
| Q | | What impact did the Fund’s investment themes have on performance during the Reporting Period? |
| A | | In keeping with our investment approach, we use our quantitative model and six investment themes to take a long-term view of market patterns and look for inefficiencies, selecting stocks for the Fund and overweighting or underweighting the ones chosen by the model. Over time and by design, the performance of any one of the model’s investment themes have historically had a low correlation with the model’s other themes, demonstrating the diversification benefit of the Fund’s theme-driven quantitative model. The variance in performance supports our research indicating that the diversification provided by our different investment themes is expected to provide a significant investment advantage over the long term, even though the Fund may experience underperformance in the short term. Of course, diversification does not protect an investor from market risk nor does it ensure a profit. |
| | During the Reporting Period, four of our six investment themes added to the Fund’s relative returns — Sentiment, Quality, Momentum and Profitability. The Sentiment theme reflects selected investment views and decisions of individuals and financial intermediaries. The Quality theme seeks to assess both firm and management quality. The Momentum theme seeks to predict drifts in stock prices caused by delayed investor reaction to company-specific information and information about related companies. The Profitability theme seeks to assess whether a company is earning more than its cost of capital. |
| | Valuation and Management detracted from relative performance. The Valuation theme attempts to capture potential mispricings of securities, typically by comparing a measure of the company’s intrinsic value to its market value. The Management theme seeks to assess the characteristics, policies and strategic decisions of company management. |
| Q | | How did the Fund’s sector and industry allocations affect relative performance? |
| A | | In constructing the Fund’s portfolio, we focus on picking stocks rather than on making sector or industry bets. Consequently, the Fund is similar to the Index in terms of its sector and industry allocations and style. Changes in its sector or industry weights generally do not have a meaningful impact on relative performance. |
| Q | | Did stock selection help or hurt Fund performance during the Reporting Period? |
| A | | We seek to outpace the Index by overweighting stocks we expect to outperform and underweighting those we think |
31
PORTFOLIO RESULTS
| | may lag. At the same time, we strive to maintain a risk profile similar to the Index. The Fund’s investments are selected using fundamental research and a variety of quantitative techniques based on our investment themes. For example, the Fund aims to hold a basket of stocks with better Momentum characteristics than the benchmark. |
| | During the Reporting Period, security selection overall contributed positively to the Fund’s relative performance. Investments in the industrials, consumer discretionary and materials sectors added to relative results. Stock selection in only two sectors — utilities and health care — detracted from relative returns. |
| Q | | Which individual stock positions contributed most to the Fund’s relative returns during the Reporting Period? |
| A | | The Fund benefited from overweight positions in Cash America International, Symetra Financial and Coresite Realty. We assumed the overweight in Cash America International, a pawn shop retailer that also provides check cashing services and payday loans, because of our positive views on Quality and Valuation. Our positive views on Sentiment and Valuation led to the overweight in Symetra Financial, which provides retirement services, employee benefits and life insurance products. The Fund was overweight data center company Coresite Realty due to our positive views on Momentum and Quality. |
| Q | | Which individual stock positions detracted most from the Fund’s results during the Reporting Period? |
| A | | The Fund’s performance was hampered during the Reporting Period by its overweight positions in independent oil and natural gas company Contango Oil & Gas, independent power producer Talen Energy and oilfield services provider Pioneer Energy Services. We chose to overweight Contango Oil & Gas due to our positive views on Valuation and Quality. The Fund was overweight Talen Energy as a result of our positive views on Momentum and Quality. We adopted the overweight in Pioneer Energy Services due to our positive views on Quality and Profitability. |
| Q | | How did the Fund use derivatives and similar instruments during the Reporting Period? |
| A | | During the Reporting Period, we used financial futures contracts to equitize the Fund’s cash holdings. In other words, we put the Fund’s cash holdings to work by using them as collateral for the purchase of financial futures contracts. |
| Q | | What was the Fund’s sector positioning relative to the Index at the end of the Reporting Period? |
| A | | At the end of the Reporting Period, the Fund was overweight the industrials, materials and health care sectors relative to the Index. Compared to the Index, the Fund was underweight the utilities, financials and consumer staples sectors. The Fund was relatively neutral compared to the Index in the energy, information technology, consumer discretionary and telecommunication services sectors at the end of the Reporting Period. |
32
FUND BASICS
Small Cap Value Insights Fund
as of October 31, 2015
| | | | | | | | | | |
| | PERFORMANCE REVIEW | |
| | | November 1, 2014–October 31, 2015 | | Fund Total Return
(based on NAV)1 | | | Russell 2000® Value Index2 | |
| | Class A | | | 0.53 | % | | | -2.88 | % |
| | Class C | | | -0.21 | | | | -2.88 | |
| | Institutional | | | 0.93 | | | | -2.88 | |
| | Class IR | | | 0.76 | | | | -2.88 | |
| | | Class R | | | 0.27 | | | | -2.88 | |
| | | |
| | | | | | | | | | | |
| | | July 31, 2015–October 31, 2015 | | | | | | |
| | | Class R6 | | | -1.64 | % | | | -3.06 | % |
| | 1 | | The net asset value (“NAV”) represents the net assets of the class of the Fund (ex-dividend) divided by the total number of shares of the class outstanding. The Fund’s performance assumes the reinvestment of dividends and other distributions. The Fund’s performance does not reflect the deduction of any applicable sales charges. |
| | 2 | | The Russell 2000® Value Index (with dividends reinvested) is an unmanaged index of common stock prices that measures the performance of those Russell 2000 companies with lower price-to-book ratios and lower forecasted growth values. The Index figures do not reflect any deduction for fees, expenses or taxes. It is not possible to invest directly in an index. |
| | | | | | | | | | | | | | | | |
| | STANDARDIZED TOTAL RETURNS3 |
| | | For the period ended 9/30/15 | | One Year | | | Five Years | | | Since Inception | | | Inception Date |
| | Class A | | | -3.90 | % | | | 9.24 | % | | | 2.35 | % | | 6/25/07 |
| | Class C | | | -0.06 | | | | 9.66 | | | | 2.27 | | | 6/25/07 |
| | Institutional | | | 2.12 | | | | 10.93 | | | | 3.49 | | | 6/25/07 |
| | Class IR | | | 1.96 | | | | 10.76 | | | | 5.64 | | | 11/30/07 |
| | Class R6 | | | N/A | | | | N/A | | | | -7.73 | | | 7/31/15 |
| | | Class R | | | 1.44 | | | | 10.21 | | | | 5.15 | | | 11/30/07 |
| | 3 | | The Standardized Total Returns are average annual or cumulative total returns (only if the performance period is one year or less) as of the most recent calendar quarter-end. They assume reinvestment of all distributions at NAV. These returns reflect a maximum initial sales charge of 5.5% for Class A Shares and the assumed contingent deferred sales charge for Class C Shares (1% if redeemed within 12 months of purchase). Because Institutional, Class IR, Class R6 and Class R Shares do not involve a sales charge, such a charge is not applied to their Standardized Total Returns. |
The returns set forth in the tables above represent past performance. Past performance does not guarantee future results. The Fund’s investment return and principal value will fluctuate so that an investor’s shares, when redeemed, may be worth more or less than their original cost. Current performance may be lower or higher than the performance quoted above. Please visit our web site at www.GSAMFUNDS.com to obtain the most recent month-end returns. Performance reflects applicable fee waivers and/or expense limitations in effect during the periods shown. In their absence, performance would be reduced. Returns do not reflect the deduction of taxes that a shareholder would pay on Fund distributions or the redemption of Fund shares.
33
FUND BASICS
| | | | | | | | | | |
| | EXPENSE RATIOS4 | |
| | | | | Net Expense Ratio (Current) | | | Gross Expense Ratio (Before Waivers) | |
| | Class A | | | 1.28 | % | | | 1.60 | % |
| | Class C | | | 2.02 | | | | 2.35 | |
| | Institutional | | | 0.88 | | | | 1.21 | |
| | Class IR | | | 1.03 | | | | 1.36 | |
| | Class R6 | | | 0.86 | | | | 1.19 | |
| | | Class R | | | 1.53 | | | | 1.85 | |
| | 4 | | The expense ratios of the Fund, both current (net of applicable fee waivers and/or expense limitations) and before waivers (gross of applicable fee waivers and/or expense limitations) are as set forth above according to the most recent publicly available Prospectus for the Fund and may differ from the expense ratios disclosed in the Financial Highlights in this report. Pursuant to a contractual arrangement, the Fund’s waivers and/or expense limitations will remain in place through at least July 31, 2016, and prior to such date the Investment Adviser may not terminate the arrangements without the approval of the Fund’s Board of Trustees. If these arrangements are discontinued in the future, the expense ratios may change without shareholder approval. |
| | | | | | | | |
| | TOP TEN HOLDINGS AS OF 10/31/155 |
| | | Holding | | % of Net Assets | | | Line of Business |
| | Investors Bancorp, Inc. | | | 1.0 | % | | Commercial Banks |
| | DCT Industrial Trust, Inc. | | | 0.9 | | | Real Estate Investment Trusts |
| | Umpqua Holdings Corp. | | | 0.9 | | | Commercial Banks |
| | EMCOR Group, Inc. | | | 0.9 | | | Construction & Engineering |
| | Cooper Tire & Rubber Co. | | | 0.9 | | | Auto Components |
| | Cash America International, Inc. | | | 0.9 | | | Consumer Finance |
| | New Jersey Resources Corp. | | | 0.9 | | | Gas Utilities |
| | CVB Financial Corp. | | | 0.9 | | | Commercial Banks |
| | Argo Group International Holdings Ltd. | | | 0.9 | | | Insurance |
| | | NETGEAR, Inc. | | | 0.8 | | | Communications Equipment |
| | 5 | | The top 10 holdings may not be representative of the Fund’s future investments. |
34
FUND BASICS
|
| FUND VS. BENCHMARK SECTOR ALLOCATIONS6 |
| As of October 31, 2015 |
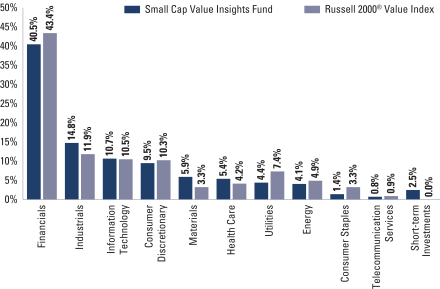
| | 6 | | The Fund is actively managed and, as such, its composition may differ over time. Consequently, the Fund’s overall sector allocations may differ from the percentages contained in the graph above. The graph categorizes investments using the Global Industry Classification Standard (“GICS”), however, the sector classifications used by the portfolio management team may differ from GICS. The percentage shown for each investment category reflects the value of investments in that category as a percentage of market value (excluding investments in the securities lending reinvestment vehicle, if any). Investments in the securities lending reinvestment vehicle represented 2.3% of the Fund’s net assets as of October 31, 2015. Short-term investments represent repurchase agreements. The graph depicts the Fund’s investments but may not represent the Fund’s market exposure due to the exclusion of certain derivatives, if any, as listed in the Additional Investment Information section of the Schedule of Investments. |
35
GOLDMAN SACHS SMALL CAP VALUE INSIGHTS FUND
Performance Summary
October 31, 2015
The following graph shows the value, as of October 31, 2015, of a $10,000 investment made on June 25, 2007 (commencement of operations) in Class A Shares (with the maximum sales charge of 5.5%). For comparative purposes, the performance of the Fund’s benchmark, the Russell 2000® Value Index (with dividends reinvested), is shown. This performance data represents past performance and should not be considered indicative of future performance, which will fluctuate with changes in market conditions. These performance fluctuations will cause an investor’s shares, when redeemed, to be worth more or less than their original cost. Performance reflects applicable fee waivers and/or expense limitations in effect during the periods shown and in their absence, performance would be reduced. Returns do not reflect the deduction of taxes that a shareholder would pay on Fund distributions or the redemption of Fund shares. Performance of Class C, Institutional, Class IR, Class R and Class R6 Shares will vary from Class A Shares due to differences in class specific fees and any applicable sales charges. In addition to the Investment Adviser’s decisions regarding issuer/industry investment selection and allocation, other factors may affect Fund performance. These factors include, but are not limited to, Fund operating fees and expenses, portfolio turnover and subscription and redemption cash flows affecting the Fund.
|
| Small Cap Value Insights Fund’s Lifetime Performance |
Performance of a $10,000 Investment, including any applicable sales charges, with distributions reinvested, from June 25, 2007 through October 31, 2015.
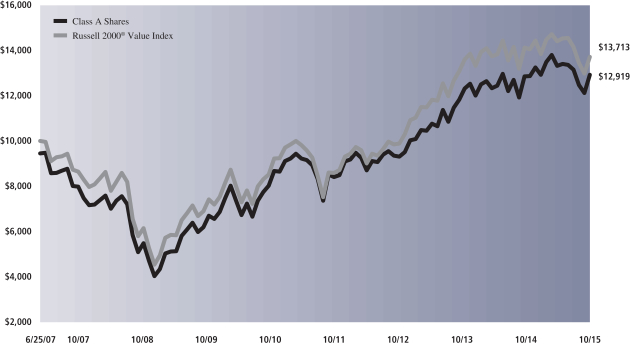
| | | | | | | | | | |
| Average Annual Total Return through October 31, 2015 | | | One Year | | | | Five Years | | | Since Inception |
Class A (Commenced June 25, 2007) | | | | | | | | | | |
Excluding sales charges | | | 0.53% | | | | 10.76% | | | 3.81% |
Including sales charges | | | -4.99% | | | | 9.52% | | | 3.11% |
|
Class C (Commenced June 25, 2007) | | | | | | | | | | |
Excluding contingent deferred sales charges | | | -0.21% | | | | 9.94% | | | 3.02% |
Including contingent deferred sales charges | | | -1.21% | | | | 9.94% | | | 3.02% |
|
Institutional Class (Commenced June 25, 2007) | | | 0.93% | | | | 11.20% | | | 4.24% |
|
Class IR (Commenced November 30, 2007) | | | 0.76% | | | | 11.03% | | | 6.43% |
|
Class R (Commenced November 30, 2007) | | | 0.27% | | | | 10.48% | | | 5.94% |
|
Class R6 (Commenced July 31, 2015) | | | N/A | | | | N/A | | | -1.64%* |
|
| * | | Total return for periods of less than one year represents cumulative total return. |
36
PORTFOLIO RESULTS
Goldman Sachs U.S. Equity Insights Fund
Investment Objective
The Fund seeks long-term growth of capital and dividend income.
Portfolio Management Discussion and Analysis
Below, the Goldman Sachs Quantitative Investment Strategies Team discusses the Goldman Sachs U.S. Equity Insights Fund’s (the “Fund”) performance and positioning for the 12-month period ended October 31, 2015 (the “Reporting Period”).
| Q | | How did the Fund perform during the Reporting Period? |
| A | | During the Reporting Period, the Fund’s Class A, C, Institutional, Service, IR and R Shares generated average annual total returns, without sales charges, of 3.86%, 3.09%, 4.27%, 3.75%, 4.12% and 3.58%, respectively. These returns compare to the 5.20% average annual total return of the Fund’s benchmark, the S&P 500® Index (with dividends reinvested) (the “Index”), during the same period. |
| | | During the period from their inception on July 31, 2015 through October 31, 2015, the Fund’s Class R6 Shares generated a cumulative total return, without sales charges, of -1.37% compared to the -0.63% cumulative total return of the Index. |
| Q | | What key factors were most responsible for the Fund’s performance during the Reporting Period? |
| A | | During the Reporting Period, the Fund benefited from stock selection driven by our quantitative model, with four of its six investment themes contributing positively to performance. However, the Fund underperformed the Index, largely due to the underperformance of our Valuation investment theme. |
| Q | | What impact did the Fund’s investment themes have on performance during the Reporting Period? |
| A | | In keeping with our investment approach, we use our quantitative model and six investment themes to take a long-term view of market patterns and look for inefficiencies, selecting stocks for the Fund and overweighting or underweighting the ones chosen by the model. Over time and by design, the performance of any one of the model’s investment themes have historically had a low correlation with the model’s other themes, demonstrating the diversification benefit of the Fund’s theme-driven quantitative model. The variance in performance supports our research indicating that the diversification provided by our different investment themes is expected to provide a significant investment advantage over the long term, even though the Fund may experience underperformance in the short term. Of course, diversification does not protect an investor from market risk nor does it ensure a profit. |
| | | During the Reporting Period, four of our six investment themes contributed positively to relative performance. Momentum was our best performing theme. The Momentum theme seeks to predict drifts in stock prices caused by delayed investor reaction to company-specific information and information about related companies. Sentiment, Quality and Profitability also added to the Fund’s relative results. The Sentiment theme reflects selected investment views and decisions of individuals and financial intermediaries. The Quality theme seeks to assess both firm and management quality. The Profitability theme seeks to assess whether a company is earning more than its cost of capital. |
| | | Valuation detracted from relative returns. The Valuation theme attempts to capture potential mispricings of securities, typically by comparing a measure of the company’s intrinsic value to its market value. |
| | | The impact of our Management theme on relative performance was neutral during the Reporting Period. The Management theme seeks to assess the characteristics, policies and strategic decisions of company management. |
| Q | | How did the Fund’s sector and industry allocations affect relative performance? |
| A | | In constructing the Fund’s portfolio, we focus on picking stocks rather than on making sector or industry bets. Consequently, the Fund is similar to the Index in terms of its sector and industry allocations and style. Changes in its |
37
PORTFOLIO RESULTS
| | sector or industry weights generally do not have a meaningful impact on relative performance. That said, the contribution overall of the Fund’s industry exposures dampened relative performance during the Reporting Period. Though its industry weightings did not change substantially from prior periods, the Fund was hurt by its overweight positions relative to the Index in the petroleum and food staples industries, both of which declined during the Reporting Period. Its underweight positions in the internet retail industry and in Real Estate Investment Trusts (REITs), which rallied during the Reporting Period, also hurt relative returns. |
| Q | | Did stock selection help or hurt Fund performance during the Reporting Period? |
| A | | We seek to outpace the Index by overweighting stocks we expect to outperform and underweighting those we think may lag. At the same time, we strive to maintain a risk profile similar to the Index. The Fund’s investments are selected using fundamental research and a variety of quantitative techniques based on our investment themes. For example, the Fund aims to hold a basket of stocks with better Momentum characteristics than the benchmark. |
| | | During the Reporting Period, security selection overall added to the Fund’s relative performance. Investments in the energy, industrials and financials sectors contributed positively, while holdings in the information technology, health care and materials sectors detracted from relative returns. |
| Q | | Which individual stock positions contributed most to the Fund’s relative returns during the Reporting Period? |
| A | | The Fund benefited from overweight positions in Tesoro, a petroleum refiner; Lowe’s Companies, a home improvement retailer; and Cameron International, a provider of flow equipment products, systems and services to the oil, gas and process industries. We adopted the overweight in Tesoro as a result of our positive views on Sentiment and Valuation. The overweight positions in Lowe’s Companies and Cameron International were due to our positive views on Quality and Sentiment. |
| Q | | Which individual stock positions detracted most from the Fund’s results during the Reporting Period? |
| A | | The Fund was hampered by overweight positions in telecommunications company CenturyLink and cloud computing company Rackspace Hosting as well as its underweight position in semiconductor maker Intel. Our positive views on Quality and Valuation led us to overweight CenturyLink and Rackspace Hosting. We chose to underweight Intel because of our negative views on Momentum and Quality. |
| Q | | How did the Fund use derivatives and similar instruments during the Reporting Period? |
| A | | During the Reporting Period, we used financial futures contracts to equitize the Fund’s cash holdings. In other words, we put the Fund’s cash holdings to work by using them as collateral for the purchase of financial futures contracts. |
| Q | | What was the Fund’s sector positioning relative to the Index at the end of the Reporting Period? |
| A | | At the end of the Reporting Period, the Fund was overweight the consumer discretionary, consumer staples, energy and telecommunication services sectors relative to the Index. Compared to the Index, the Fund was underweight the information technology, industrials, utilities and financials sectors. The Fund was relatively neutral compared to the Index in the health care and materials sectors at the end of the Reporting Period. |
38
FUND BASICS
U.S. Equity Insights Fund
as of October 31, 2015
| | | | | | | | | | |
| | PERFORMANCE REVIEW | |
| | | November 1, 2014–October 31, 2015 | | Fund Total Return
(based on NAV)1 | | | S&P 500® Index2 | |
| | Class A | | | 3.86 | % | | | 5.20 | % |
| | Class C | | | 3.09 | | | | 5.20 | |
| | Institutional | | | 4.27 | | | | 5.20 | |
| | Service | | | 3.75 | | | | 5.20 | |
| | Class IR | | | 4.12 | | | | 5.20 | |
| | | Class R | | | 3.58 | | | | 5.20 | |
| | | |
| | | | | | | | | | | |
| | | July 31, 2015–October 31, 2015 | | | | | | |
| | | Class R6 | | | -1.37 | % | | | -0.63 | % |
| | 1 | | The net asset value (“NAV”) represents the net assets of the class of the Fund (ex-dividend) divided by the total number of shares of the class outstanding. The Fund’s performance assumes the reinvestment of dividends and other distributions. The Fund’s performance does not reflect the deduction of any applicable sales charges. |
| | 2 | | The S&P 500® Index (with dividends reinvested) is the Standard & Poor’s 500 Composite Index of 500 stocks, an unmanaged index of common stock prices. The figures for the Index do not include any deduction for fees, expenses or taxes. It is not possible to invest directly in an index. |
| | | | | | | | | | | | | | | | | | | | |
| | STANDARDIZED TOTAL RETURNS3 |
| | | For the period ended 9/30/15 | | One Year | | | Five Years | | | Ten Years | | | Since Inception | | | Inception Date |
| | Class A | | | -6.98 | % | | | 12.55 | % | | | 4.84 | % | | | 7.80 | | | 5/24/91 |
| | Class C | | | -3.28 | | | | 12.98 | | | | 4.65 | | | | 4.52 | | | 8/15/97 |
| | Institutional | | | -1.17 | | | | 14.28 | | | | 5.85 | | | | 8.14 | | | 6/15/95 |
| | Service | | | -1.67 | | | | 13.72 | | | | 5.33 | | | | 6.63 | | | 6/07/96 |
| | Class IR | | | -1.32 | | | | 14.11 | | | | N/A | | | | 5.15 | | | 11/30/07 |
| | Class R6 | | | N/A | | | | N/A | | | | N/A | | | | -8.71 | | | 7/31/15 |
| | | Class R | | | -1.82 | | | | 13.54 | | | | N/A | | | | 4.63 | | | 11/30/07 |
| | 3 | | The Standardized Total Returns are average annual or cumulative total returns (only if the performance period is one year or less) as of the most recent calendar quarter-end. They assume reinvestment of all distributions at NAV. These returns reflect a maximum initial sales charge of 5.5% for Class A Shares and the assumed contingent deferred sales charge for Class C Shares (1% if redeemed within 12 months of purchase). Because Institutional, Service, Class IR, Class R6 and Class R Shares do not involve a sales charge, such a charge is not applied to their Standardized Total Returns. |
The returns set forth in the tables above represent past performance. Past performance does not guarantee future results. The Fund’s investment return and principal value will fluctuate so that an investor’s shares, when redeemed, may be worth more or less than their original cost. Current performance may be lower or higher than the performance quoted above. Please visit our web site at www.GSAMFUNDS.com to obtain the most recent month-end returns. Performance reflects applicable fee waivers and/or expense limitations in effect during the periods shown. In their absence, performance would be reduced. Returns do not reflect the deduction of taxes that a shareholder would pay on Fund distributions or the redemption of Fund shares.
39
FUND BASICS
| | | | | | | | | | |
| | EXPENSE RATIOS4 | |
| | | | | Net Expense Ratio (Current) | | | Gross Expense Ratio (Before Waivers) | |
| | Class A | | | 0.97 | % | | | 1.21 | % |
| | Class C | | | 1.72 | | | | 1.96 | |
| | Institutional | | | 0.57 | | | | 0.81 | |
| | Service | | | 1.07 | | | | 1.31 | |
| | Class IR | | | 0.72 | | | | 0.96 | |
| | Class R6 | | | 0.55 | | | | 0.79 | |
| | | Class R | | | 1.22 | | | | 1.46 | |
| | 4 | | The expense ratios of the Fund, both current (net of applicable fee waivers and/or expense limitations) and before waivers (gross of applicable fee waivers and/or expense limitations) are as set forth above according to the most recent publicly available Prospectus for the Fund and may differ from the expense ratios disclosed in the Financial Highlights in this report. Pursuant to a contractual arrangement, the Fund’s waivers and/or expense limitations will remain in place through at least July 31, 2016, and prior to such date the Investment Adviser may not terminate the arrangements without the approval of the Fund’s Board of Trustees. If these arrangements are discontinued in the future, the expense ratios may change without shareholder approval. |
| | | | | | | | |
| | TOP TEN HOLDINGS AS OF 10/31/155 |
| | | Holding | | % of Net Assets | | | Line of Business |
| | Apple, Inc. | | | 3.0 | % | | Computers & Peripherals |
| | Johnson & Johnson | | | 2.3 | | | Pharmaceuticals |
| | JPMorgan Chase & Co. | | | 2.1 | | | Commercial Banks |
| | Pfizer, Inc. | | | 2.1 | | | Pharmaceuticals |
| | Verizon Communications, Inc. | | | 2.0 | | | Diversified Telecommunication
Services |
| | The Home Depot, Inc. | | | 1.8 | | | Specialty Retail |
| | Comcast Corp. Class A | | | 1.8 | | | Media |
| | PepsiCo., Inc. | | | 1.8 | | | Beverages |
| | Cisco Systems, Inc. | | | 1.8 | | | Communications Equipment |
| | | Altria Group, Inc. | | | 1.6 | | | Tobacco |
| | 5 | | The top 10 holdings may not be representative of the Fund’s future investments. |
40
FUND BASICS
|
| FUND VS. BENCHMARK SECTOR ALLOCATIONS6 |
| As of October 31, 2015 |
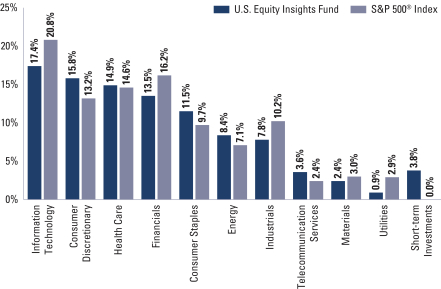
| | 6 | | The Fund is actively managed and, as such, its composition may differ over time. Consequently, the Fund’s overall sector allocations may differ from the percentages contained in the graph above. The graph categorizes investments using the Global Industry Classification Standard (“GICS”), however, the sector classifications used by the portfolio management team may differ from GICS. The percentage shown for each investment category reflects the value of investments in that category as a percentage of market value (excluding investments in the securities lending reinvestment vehicle, if any). Investments in the securities lending reinvestment vehicle represented 0.1% of the Fund’s net assets as of October 31, 2015. Short-term investments represent repurchase agreements. The graph depicts the Fund’s investments but may not represent the Fund’s market exposure due to the exclusion of certain derivatives, if any, as listed in the Additional Investment Information section of the Schedule of Investments. |
41
GOLDMAN SACHS U.S. EQUITY INSIGHTS FUND
Performance Summary
October 31, 2015
The following graph shows the value, as of October 31, 2015, of a $10,000 investment made on November 1, 2005 in Class A Shares (with the maximum sales charge of 5.5%). For comparative purposes, the performance of the Fund’s benchmark, the Standard and Poor’s 500 Index (with dividends reinvested) (“S&P 500® Index”), is shown. This performance data represents past performance and should not be considered indicative of future performance, which will fluctuate with changes in market conditions. These performance fluctuations will cause an investor’s shares, when redeemed, to be worth more or less than their original cost. Performance reflects applicable fee waivers and/or expense limitations in effect during the periods shown and in their absence, performance would be reduced. Returns do not reflect the deduction of taxes that a shareholder would pay on Fund distributions or the redemption of Fund shares. Performance of Class C, Institutional, Service, Class IR, Class R and Class R6 Shares will vary from Class A Shares due to differences in class specific fees and any applicable sales charges. In addition to the Investment Adviser’s decisions regarding issuer/industry investment selection and allocation, other factors may affect Fund performance. These factors include, but are not limited to, Fund operating fees and expenses, portfolio turnover and subscription and redemption cash flows affecting the Fund.
|
| U.S. Equity Insights Fund’s 10 Year Performance |
Performance of a $10,000 Investment, including any applicable sales charges, with distributions reinvested, from November 1, 2005 through October 31, 2015.
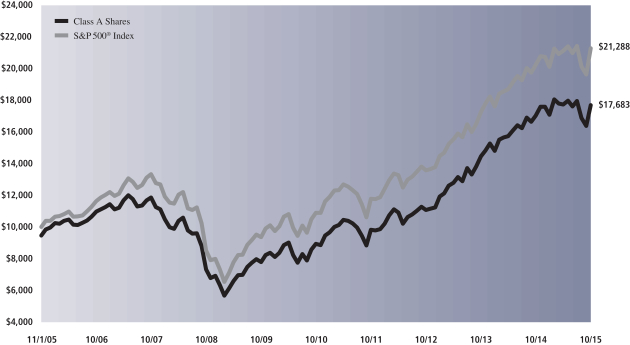
| | | | | | | | | | | | | | |
| Average Annual Total Return through October 31, 2015 | | | One Year | | | | Five Years | | | | Ten Years | | | Since Inception |
Class A (Commenced May 24, 1991) | | | | | | | | | | | | | | |
Excluding sales charges | | | 3.86% | | | | 14.61% | | | | 6.46% | | | 8.36% |
Including sales charges | | | -1.86% | | | | 13.32% | | | | 5.86% | | | 8.11% |
|
Class C (Commenced August 15, 1997) | | | | | | | | | | | | | | |
Excluding contingent deferred sales charges | | | 3.09% | | | | 13.75% | | | | 5.67% | | | 4.94% |
Including contingent deferred sales charges | | | 2.09% | | | | 13.75% | | | | 5.67% | | | 4.94% |
|
Institutional Class (Commenced June 15, 1995) | | | 4.27% | | | | 15.06% | | | | 6.88% | | | 8.52% |
|
Service (Commenced June 7, 1996) | | | 3.75% | | | | 14.50% | | | | 6.36% | | | 7.02% |
|
Class IR (Commenced November 30, 2007) | | | 4.12% | | | | 14.89% | | | | N/A | | | 6.12% |
|
Class R (Commenced November 30, 2007) | | | 3.58% | | | | 14.33% | | | | N/A | | | 5.60% |
|
Class R6 (Commenced July 31, 2015) | | | N/A | | | | N/A | | | | N/A | | | -1.37%* |
|
| * | | Total return for periods of less than one year represents cumulative total return. |
42
MARKET REVIEW
Index Definitions
|
| |
The S&P 500® Index is a U.S. stock market index based on the market capitalizations of 500 large companies having common stock listed on the New York Stock Exchange or NASDAQ. The S&P 500® Index components and their weightings are determined by S&P Dow Jones Indices. The Russell 1000® Index measures the performance of the large-cap segment of the U.S. equity universe. It is a subset of the Russell 3000® Index and includes approximately 1000 of the largest securities based on a combination of their market cap and current index membership. The Russell 1000® Index represents approximately 92% of the U.S. market. It is constructed to provide a comprehensive and unbiased barometer for the large-cap segment. The Russell 1000® Value Index measures the performance of the large-cap value segment of the U.S. equity universe. It includes those Russell 1000® Index companies with lower price-to-book ratios and lower forecasted growth values. The Russell 1000® Value Index is constructed to provide a comprehensive and unbiased barometer for the large-cap value segment. The Russell 1000® Growth Index measures the performance of the large-cap growth segment of the U.S. equity universe. It includes those Russell 1000® Index companies with higher price-to-book ratios and higher forecasted growth values. The Russell 1000® Growth Index is constructed to provide a comprehensive and unbiased barometer for the large-cap growth segment. The Russell 2000® Index is a subset of the Russell 3000® Index representing approximately 10% of the total market capitalization of that index. It includes approximately 2000 of the smallest securities based on a combination of their market cap and current index membership. The Russell 2000® Index is constructed to provide a comprehensive and unbiased small-cap barometer. The Russell 2000® Growth Index measures the performance of the small-cap growth segment of the U.S. equity universe. It includes those Russell 2000® Index companies with higher price-to-book ratios and higher forecasted growth values. The Russell 2000® Growth Index is constructed to provide a comprehensive and unbiased barometer for the small-cap growth segment. The Russell 2000® Value Index measures the performance of the small-cap value segment of the U.S. equity universe. It includes those Russell 2000® Index companies with lower price-to-book ratios and lower forecasted growth values. The Russell 2000® Value Index is constructed to provide a comprehensive and unbiased barometer for the small-cap value segment. |
43
GOLDMAN SACHS LARGE CAP GROWTH INSIGHTS FUND
Schedule of Investments
October 31, 2015
| | | | | | | | |
Shares | | | Description | | Value | |
| | | | | | | | |
| | Common Stocks – 97.0% | |
| | Aerospace & Defense – 1.1% | |
| | 72,567 | | | BE Aerospace, Inc. | | $ | 3,407,020 | |
| | 23,005 | | | Huntington Ingalls Industries, Inc. | | | 2,759,220 | |
| | 55,338 | | | Spirit AeroSystems Holdings, Inc. Class A* | | | 2,918,526 | |
| | | | | | | | |
| | | | | | | 9,084,766 | |
| | |
| | Airlines – 2.0% | |
| | 89,930 | | | Alaska Air Group, Inc. | | | 6,857,162 | |
| | 122,365 | | | Delta Air Lines, Inc. | | | 6,221,037 | |
| | 107,402 | | | JetBlue Airways Corp.* | | | 2,667,866 | |
| | | | | | | | |
| | | | | | | 15,746,065 | |
| | |
| | Auto Components – 0.8% | |
| | 23,461 | | | Delphi Automotive PLC | | | 1,951,720 | |
| | 32,847 | | | Lear Corp. | | | 4,107,846 | |
| | | | | | | | |
| | | | | | | 6,059,566 | |
| | |
| | Beverages – 3.7% | |
| | 79,192 | | | Coca-Cola Enterprises, Inc. | | | 4,065,717 | |
| | 12,194 | | | Constellation Brands, Inc. Class A | | | 1,643,751 | |
| | 4,662 | | | Dr. Pepper Snapple Group, Inc. | | | 416,643 | |
| | 183,147 | | | PepsiCo., Inc. | | | 18,715,792 | |
| | 101,682 | | | The Coca-Cola Co. | | | 4,306,233 | |
| | | | | | | | |
| | | | | | | 29,148,136 | |
| | |
| | Biotechnology – 9.1% | |
| | 117,608 | | | AbbVie, Inc. | | | 7,003,556 | |
| | 59,343 | | | Alkermes PLC* | | | 4,267,949 | |
| | 101,308 | | | Amgen, Inc. | | | 16,024,899 | |
| | 22,417 | | | Biogen, Inc.* | | | 6,512,363 | |
| | 78,415 | | | Celgene Corp.* | | | 9,622,305 | |
| | 131,418 | | | Gilead Sciences, Inc. | | | 14,210,228 | |
| | 19,879 | | | Incyte Corp.* | | | 2,336,379 | |
| | 83,950 | | | Isis Pharmaceuticals, Inc.* | | | 4,042,192 | |
| | 32,069 | | | Medivation, Inc.* | | | 1,348,822 | |
| | 45,836 | | | United Therapeutics Corp.* | | | 6,720,933 | |
| | | | | | | | |
| | | | | | | 72,089,626 | |
| | |
| | Capital Markets – 2.1% | |
| | 3,217 | | | Affiliated Managers Group, Inc.* | | | 579,897 | |
| | 78,837 | | | Ameriprise Financial, Inc. | | | 9,094,636 | |
| | 30,005 | | | NorthStar Asset Management Group, Inc. | | | 438,973 | |
| | 121,535 | | | SEI Investments Co. | | | 6,297,944 | |
| | | | | | | | |
| | | | | | | 16,411,450 | |
| | |
| | Chemicals – 1.4% | |
| | 2,524 | | | Ecolab, Inc. | | | 303,763 | |
| | 10,449 | | | LyondellBasell Industries NV Class A | | | 970,817 | |
| | 37,647 | | | The Sherwin-Williams Co. | | | 10,045,349 | |
| | | | | | | | |
| | | | | | | 11,319,929 | |
| | |
| | Commercial Banks – 0.3% | |
| | 13,314 | | | SVB Financial Group* | | | 1,625,240 | |
| | 28,089 | | | Synovus Financial Corp. | | | 888,455 | |
| | | | | | | | |
| | | | | | | 2,513,695 | |
| | |
| | | | | | | | |
| | Common Stocks – (continued) | |
| | Communications Equipment – 1.0% | |
| | 21,461 | | | F5 Networks, Inc.* | | $ | 2,365,002 | |
| | 82,385 | | | Juniper Networks, Inc. | | | 2,586,065 | |
| | 17,437 | | | Palo Alto Networks, Inc.* | | | 2,807,357 | |
| | | | | | | | |
| | | | | | | 7,758,424 | |
| | |
| | Computers & Peripherals – 7.3% | |
| | 486,785 | | | Apple, Inc. | | | 58,170,807 | |
| | |
| | Consumer Finance* – 0.1% | |
| | 26,705 | | | Ally Financial, Inc. | | | 531,964 | |
| | 69,689 | | | SLM Corp. | | | 492,004 | |
| | | | | | | | |
| | | | | | | 1,023,968 | |
| | |
| | Containers & Packaging – 0.4% | |
| | 61,961 | | | WestRock Co. | | | 3,331,023 | |
| | |
| | Distributors* – 0.3% | |
| | 68,989 | | | LKQ Corp. | | | 2,042,764 | |
| | |
| | Diversified Financial Services – 0.7% | |
| | 10,398 | | | FactSet Research Systems, Inc. | | | 1,820,898 | |
| | 60,337 | | | MSCI, Inc. | | | 4,042,579 | |
| | | | | | | | |
| | | | | | | 5,863,477 | |
| | |
| | Diversified Telecommunication Services – 2.5% | |
| | 425,312 | | | Verizon Communications, Inc. | | | 19,938,627 | |
| | |
| | Electrical Equipment – 1.2% | |
| | 39,333 | | | Acuity Brands, Inc. | | | 8,598,194 | |
| | 10,475 | | | Hubbell, Inc. Class B | | | 1,014,504 | |
| | | | | | | | |
| | | | | | | 9,612,698 | |
| | |
| | Electronic Equipment, Instruments & Components – 1.6% | |
| | 17,267 | | | Avnet, Inc. | | | 784,440 | |
| | 55,095 | | | CDW Corp. | | | 2,462,196 | |
| | 226,109 | | | Flextronics International Ltd.* | | | 2,575,381 | |
| | 225,275 | | | Ingram Micro, Inc. Class A | | | 6,708,689 | |
| | | | | | | | |
| | | | | | | 12,530,706 | |
| | |
| | Food & Staples Retailing – 2.2% | |
| | 146,196 | | | CVS Health Corp. | | | 14,441,241 | |
| | 77,939 | | | The Kroger Co. | | | 2,946,094 | |
| | | | | | | | |
| | | | | | | 17,387,335 | |
| | |
| | Food Products – 2.5% | |
| | 186,332 | | | ConAgra Foods, Inc. | | | 7,555,763 | |
| | 123,064 | | | Flowers Foods, Inc. | | | 3,322,728 | |
| | 114,962 | | | General Mills, Inc. | | | 6,680,442 | |
| | 6,702 | | | Kellogg Co. | | | 472,625 | |
| | 21,624 | | | McCormick & Co., Inc. | | | 1,815,983 | |
| | | | | | | | |
| | | | | | | 19,847,541 | |
| | |
| | Health Care Equipment & Supplies – 4.0% | |
| | 45,606 | | | C.R. Bard, Inc. | | | 8,498,678 | |
| | 11,269 | | | Hill-Rom Holdings, Inc. | | | 593,764 | |
| | 221,154 | | | Hologic, Inc.* | | | 8,594,045 | |
| | 72,733 | | | Sirona Dental Systems, Inc.* | | | 7,937,352 | |
| | |
| | |
| 44 | | The accompanying notes are an integral part of these financial statements. |
GOLDMAN SACHS LARGE CAP GROWTH INSIGHTS FUND
| | | | | | | | |
Shares | | | Description | | Value | |
| | | | | | | | |
| | Common Stocks – (continued) | |
| | Health Care Equipment & Supplies – (continued) | |
| | 63,939 | | | Stryker Corp. | | $ | 6,113,847 | |
| | | | | | | | |
| | | | | | | 31,737,686 | |
| | |
| | Health Care Providers & Services – 1.3% | |
| | 41,449 | | | Centene Corp.* | | | 2,465,387 | |
| | 14,096 | | | Express Scripts Holding Co.* | | | 1,217,612 | |
| | 2,378 | | | Humana, Inc. | | | 424,782 | |
| | 33,710 | | | McKesson Corp. | | | 6,027,348 | |
| | | | | | | | |
| | | | | | | 10,135,129 | |
| | |
| | Hotels, Restaurants & Leisure – 0.8% | |
| | 31,781 | | | Darden Restaurants, Inc. | | | 1,966,926 | |
| | 68,694 | | | Starbucks Corp. | | | 4,298,184 | |
| | | | | | | | |
| | | | | | | 6,265,110 | |
| | |
| | Household Durables – 2.2% | |
| | 29,110 | | | D.R. Horton, Inc. | | | 856,999 | |
| | 184,610 | | | Leggett & Platt, Inc. | | | 8,312,988 | |
| | 42,188 | | | Mohawk Industries, Inc.* | | | 8,247,754 | |
| | | | | | | | |
| | | | | | | 17,417,741 | |
| | |
| | Independent Power Producers & Energy Traders – 0.4% | |
| | 145,722 | | | Calpine Corp.* | | | 2,260,148 | |
| | 42,058 | | | NRG Energy, Inc. | | | 542,128 | |
| | 29,311 | | | Talen Energy Corp.* | | | 254,419 | |
| | | | | | | | |
| | | | | | | 3,056,695 | |
| | |
| | Industrial Conglomerates – 0.1% | |
| | 9,076 | | | Carlisle Cos., Inc. | | | 789,612 | |
| | |
| | Insurance – 1.3% | |
| | 107,896 | | | Lincoln National Corp. | | | 5,773,515 | |
| | 50,007 | | | Reinsurance Group of America, Inc. | | | 4,512,632 | |
| | | | | | | | |
| | | | | | | 10,286,147 | |
| | |
| | Internet & Catalog Retail – 3.6% | |
| | 26,926 | | | Amazon.com, Inc.*(a) | | | 16,852,984 | |
| | 5,751 | | | Expedia, Inc. | | | 783,861 | |
| | 76,903 | | | Liberty Interactive Corp. QVC Group Class A* | | | 2,104,835 | |
| | 28,180 | | | Netflix, Inc.* | | | 3,054,148 | |
| | 3,477 | | | The Priceline Group, Inc.* | | | 5,056,393 | |
| | 6,341 | | | TripAdvisor, Inc.* | | | 531,249 | |
| | | | | | | | |
| | | | | | | 28,383,470 | |
| | |
| | Internet Software & Services* – 8.4% | |
| | 20,048 | | | Alphabet, Inc. Class A | | | 14,783,195 | |
| | 20,428 | | | Alphabet, Inc. Class C | | | 14,520,427 | |
| | 396,124 | | | eBay, Inc. | | | 11,051,859 | |
| | 150,776 | | | Facebook, Inc. Class A | | | 15,374,629 | |
| | 7,038 | | | LinkedIn Corp. Class A | | | 1,695,243 | |
| | 316,768 | | | Rackspace Hosting, Inc. | | | 8,188,453 | |
| | 35,727 | | | Twitter, Inc. | | | 1,016,790 | |
| | | | | | | | |
| | | | | | | 66,630,596 | |
| | |
| | | | | | | | |
| | Common Stocks – (continued) | |
| | IT Services – 4.2% | |
| | 56,079 | | | Accenture PLC Class A | | $ | 6,011,669 | |
| | 91,660 | | | Automatic Data Processing, Inc. | | | 7,973,503 | |
| | 8,221 | | | Broadridge Financial Solutions, Inc. | | | 489,807 | |
| | 6,358 | | | CoreLogic, Inc.* | | | 247,835 | |
| | 9,396 | | | Fiserv, Inc.* | | | 906,808 | |
| | 3,444 | | | Gartner, Inc.* | | | 312,268 | |
| | 25,484 | | | Global Payments, Inc. | | | 3,476,272 | |
| | 10,156 | | | Leidos Holdings, Inc. | | | 533,901 | |
| | 27,439 | | | Total System Services, Inc. | | | 1,439,176 | |
| | 175,461 | | | Vantiv, Inc. Class A* | | | 8,799,369 | |
| | 42,876 | | | Visa, Inc. Class A | | | 3,326,320 | |
| | | | | | | | |
| | | | | | | 33,516,928 | |
| | |
| | Life Sciences Tools & Services* – 0.1% | |
| | 7,663 | | | Quintiles Transnational Holdings, Inc. | | | 487,750 | |
| | |
| | Machinery – 1.7% | |
| | 182,549 | | | Allison Transmission Holdings, Inc. | | | 5,239,156 | |
| | 30,316 | | | Stanley Black & Decker, Inc. | | | 3,212,890 | |
| | 68,120 | | | The Toro Co. | | | 5,127,392 | |
| | | | | | | | |
| | | | | | | 13,579,438 | |
| | |
| | Media – 3.6% | |
| | 285,783 | | | Comcast Corp. Class A | | | 17,895,731 | |
| | 20,755 | | | MSG Networks, Inc. Class A* | | | 425,893 | |
| | 55,063 | | | The Walt Disney Co. | | | 6,262,866 | |
| | 20,745 | | | Time Warner Cable, Inc. | | | 3,929,103 | |
| | | | | | | | |
| | | | | | | 28,513,593 | |
| | |
| | Metals & Mining – 1.2% | |
| | 144,396 | | | Nucor Corp. | | | 6,107,951 | |
| | 188,410 | | | Steel Dynamics, Inc. | | | 3,479,932 | |
| | | | | | | | |
| | | | | | | 9,587,883 | |
| | |
| | Multiline Retail – 0.3% | |
| | 29,229 | | | Target Corp. | | | 2,255,894 | |
| | |
| | Oil, Gas & Consumable Fuels – 3.9% | |
| | 117,516 | | | HollyFrontier Corp. | | | 5,754,759 | |
| | 164,694 | | | Marathon Petroleum Corp. | | | 8,531,149 | |
| | 44,681 | | | PBF Energy, Inc. Class A | | | 1,519,154 | |
| | 38,739 | | | Tesoro Corp. | | | 4,142,361 | |
| | 127,578 | | | Valero Energy Corp. | | | 8,409,942 | |
| | 53,470 | | | World Fuel Services Corp. | | | 2,377,276 | |
| | | | | | | | |
| | | | | | | 30,734,641 | |
| | |
| | Personal Products – 0.1% | |
| | 7,545 | | | The Estee Lauder Cos., Inc. Class A | | | 607,071 | |
| | |
| | Pharmaceuticals – 3.0% | |
| | 169,622 | | | Eli Lilly & Co. | | | 13,836,067 | |
| | 40,554 | | | Jazz Pharmaceuticals PLC* | | | 5,567,253 | |
| | 107,704 | | | Zoetis, Inc. | | | 4,632,349 | |
| | | | | | | | |
| | | | | | | 24,035,669 | |
| | |
| | |
| The accompanying notes are an integral part of these financial statements. | | 45 |
GOLDMAN SACHS LARGE CAP GROWTH INSIGHTS FUND
Schedule of Investments (continued)
October 31, 2015
| | | | | | | | |
Shares | | | Description | | Value | |
| | | | | | | | |
| | Common Stocks – (continued) | |
| | Professional Services – 0.6% | |
| | 35,247 | | | Equifax, Inc. | | $ | 3,756,273 | |
| | 25,138 | | | Robert Half International, Inc. | | | 1,323,767 | |
| | | | | | | | |
| | | | | | | 5,080,040 | |
| | |
| | Real Estate Investment Trusts – 2.4% | |
| | 24,303 | | | American Tower Corp. | | | 2,484,496 | |
| | 20,731 | | | Apartment Investment & Management Co. Class A | | | 812,448 | |
| | 93,947 | | | Empire State Realty Trust, Inc. Class A | | | 1,674,136 | |
| | 128,721 | | | Equity LifeStyle Properties, Inc. | | | 7,785,046 | |
| | 14,748 | | | Extra Space Storage, Inc. | | | 1,168,631 | |
| | 37,752 | | | Gaming and Leisure Properties, Inc. | | | 1,101,226 | |
| | 14,116 | | | Lamar Advertising Co. Class A | | | 796,566 | |
| | 50,233 | | | Post Properties, Inc. | | | 3,000,919 | |
| | | | | | | | |
| | | | | | | 18,823,468 | |
| | |
| | Real Estate Management & Development – 1.3% | |
| | 247,336 | | | CBRE Group, Inc. Class A* | | | 9,220,686 | |
| | 5,205 | | | Jones Lang LaSalle, Inc. | | | 867,726 | |
| | | | | | | | |
| | | | | | | 10,088,412 | |
| | |
| | Road & Rail – 0.1% | |
| | 11,427 | | | J.B. Hunt Transport Services, Inc. | | | 872,680 | |
| | |
| | Semiconductors & Semiconductor Equipment – 1.0% | |
| | 4,167 | | | Avago Technologies Ltd. | | | 513,083 | |
| | 36,629 | | | Freescale Semiconductor Ltd.* | | | 1,226,705 | |
| | 17,500 | | | Maxim Integrated Products, Inc. | | | 717,150 | |
| | 2,807 | | | NXP Semiconductors NV* | | | 219,928 | |
| | 4,152 | | | Skyworks Solutions, Inc. | | | 320,701 | |
| | 95,853 | | | Xilinx, Inc. | | | 4,564,520 | |
| | | | | | | | |
| | | | | | | 7,562,087 | |
| | |
| | Software – 1.2% | |
| | 24,943 | | | Fortinet, Inc.* | | | 857,041 | |
| | 171,626 | | | Microsoft Corp. | | | 9,034,393 | |
| | | | | | | | |
| | | | | | | 9,891,434 | |
| | |
| | Specialty Retail – 6.5% | |
| | 12,506 | | | AutoZone, Inc.* | | | 9,809,832 | |
| | 173,463 | | | Lowe’s Cos., Inc. | | | 12,806,773 | |
| | 37,466 | | | O’Reilly Automotive, Inc.* | | | 10,350,357 | |
| | |
| | | | | | | | |
| | Common Stocks – (continued) | |
| | Specialty Retail – (continued) | |
| | 151,608 | | | The Home Depot, Inc. | | $ | 18,744,813 | |
| | | | | | | | |
| | | | | | | 51,711,775 | |
| | |
| | Textiles, Apparel & Luxury Goods – 0.3% | |
| | 30,648 | | | Carter’s, Inc. | | | 2,785,290 | |
| | |
| | Tobacco – 2.0% | |
| | 261,428 | | | Altria Group, Inc. | | | 15,808,551 | |
| | |
| | Trading Companies & Distributors – 1.1% | |
| | 17,690 | | | AerCap Holdings NV* | | | 734,135 | |
| | 144,521 | | | HD Supply Holdings, Inc.* | | | 4,305,280 | |
| | 32,026 | | | Watsco, Inc. | | | 3,940,159 | |
| | | | | | | | |
| | | | | | | 8,979,574 | |
| | |
| | TOTAL COMMON STOCKS | |
| | (Cost $734,175,572) | | $ | 769,504,967 | |
| | |
| | | | | | | | | | | | | | |
Principal
Amount | | | Interest
Rate | | | Maturity
Date | | | Value | |
| | Short-term Investment(b) – 2.8% | |
| | Repurchase Agreements – 2.8% | | | | | |
| Joint Repurchase Agreement Account II | | | | | |
| $ | 21,900,000 | | | | 0.092 | % | | | 11/02/15 | | | $ | 21,900,000 | |
| | (Cost $21,900,000) | | | | | | | | | |
| | |
| | TOTAL INVESTMENTS – 99.8% | | | | | |
| | (Cost $756,075,572) | | | | | | | $ | 791,404,967 | |
| | |
| OTHER ASSETS IN EXCESS OF
LIABILITIES – 0.2% |
| | | 1,975,627 | |
| | |
| | NET ASSETS – 100.0% | | | $ | 793,380,594 | |
| | |
| | |
| The percentage shown for each investment category reflects the value of investments in that category as a percentage of net assets. |
* | | Non-income producing security. |
(a) | | All or a portion of security is segregated as collateral for initial margin requirements on futures transactions. |
(b) | | Joint repurchase agreement was entered into on October 30, 2015. Additional information appears on page 67. |
|
| ADDITIONAL INVESTMENT INFORMATION |
FUTURES CONTRACTS — At October 31, 2015, the Fund had the following futures contracts:
| | | | | | | | | | | | | | |
| Type | | Number of
Contracts
Long (Short) | | | Expiration Date | | Current Value | | | Unrealized
Gain (Loss) | |
S&P 500 E-Mini Index | | | 131 | | | December 2015 | | $ | 13,582,735 | | | $ | 599,055 | |
| | |
| 46 | | The accompanying notes are an integral part of these financial statements. |
GOLDMAN SACHS LARGE CAP VALUE INSIGHTS FUND
Schedule of Investments
October 31, 2015
| | | | | | | | |
Shares | | | Description | | Value | |
| | | | | | | | |
| | Common Stocks – 97.5% | |
| | Aerospace & Defense – 1.8% | |
| | 14,480 | | | General Dynamics Corp. | | $ | 2,151,439 | |
| | 17,008 | | | Northrop Grumman Corp. | | | 3,193,252 | |
| | 28,257 | | | Spirit AeroSystems Holdings, Inc. Class A* | | | 1,490,274 | |
| | | | | | | | |
| | | | | | | 6,834,965 | |
| | |
| | Airlines – 0.5% | |
| | 1,885 | | | Alaska Air Group, Inc. | | | 143,731 | |
| | 3,527 | | | Delta Air Lines, Inc. | | | 179,313 | |
| | 64,724 | | | JetBlue Airways Corp.* | | | 1,607,744 | |
| | | | | | | | |
| | | | | | | 1,930,788 | |
| | |
| | Auto Components – 1.0% | |
| | 43,608 | | | Johnson Controls, Inc. | | | 1,970,210 | |
| | 14,086 | | | Lear Corp. | | | 1,761,595 | |
| | | | | | | | |
| | | | | | | 3,731,805 | |
| | |
| | Beverages – 1.0% | |
| | 37,685 | | | PepsiCo., Inc. | | | 3,851,030 | |
| | |
| | Biotechnology – 2.2% | |
| | 27,400 | | | Alkermes PLC* | | | 1,970,608 | |
| | 22,943 | | | Amgen, Inc. | | | 3,629,124 | |
| | 18,315 | | | Baxalta, Inc. | | | 631,135 | |
| | 457 | | | Biogen, Inc.* | | | 132,763 | |
| | 21,278 | | | Isis Pharmaceuticals, Inc.* | | | 1,024,536 | |
| | 8,036 | | | United Therapeutics Corp.* | | | 1,178,318 | |
| | | | | | | | |
| | | | | | | 8,566,484 | |
| | |
| | Building Products* – 0.1% | |
| | 9,289 | | | Armstrong World Industries, Inc. | | | 460,920 | |
| | |
| | Capital Markets – 1.2% | |
| | 35,745 | | | Ameriprise Financial, Inc. | | | 4,123,543 | |
| | 22,613 | | | The Charles Schwab Corp. | | | 690,149 | |
| | | | | | | | |
| | | | | | | 4,813,692 | |
| | |
| | Chemicals – 1.0% | |
| | 13,903 | | | The Sherwin-Williams Co. | | | 3,709,738 | |
| | |
| | Commercial Banks – 10.1% | |
| | 561,338 | | | Bank of America Corp. | | | 9,419,252 | |
| | 6,128 | | | Bank of Hawaii Corp. | | | 401,261 | |
| | 151,205 | | | Citigroup, Inc. | | | 8,039,570 | |
| | 144,560 | | | JPMorgan Chase & Co. | | | 9,287,980 | |
| | 18,718 | | | SunTrust Banks, Inc. | | | 777,171 | |
| | 19,244 | | | SVB Financial Group* | | | 2,349,115 | |
| | 106,532 | | | Synovus Financial Corp. | | | 3,369,607 | |
| | 103,849 | | | Wells Fargo & Co. | | | 5,622,385 | |
| | | | | | | | |
| | | | | | | 39,266,341 | |
| | |
| | Communications Equipment – 2.5% | |
| | 100,448 | | | Brocade Communications Systems, Inc. | | | 1,046,668 | |
| | 265,440 | | | Cisco Systems, Inc. | | | 7,657,944 | |
| | 31,474 | | | Juniper Networks, Inc. | | | 987,969 | |
| | | | | | | | |
| | | | | | | 9,692,581 | |
| | |
| | | | | | | | |
| | Common Stocks – (continued) | |
| | Computers & Peripherals – 0.6% | |
| | 17,567 | | | Apple, Inc. | | $ | 2,099,256 | |
| | 4,291 | | | Western Digital Corp. | | | 286,725 | |
| | | | | | | | |
| | | | | | | 2,385,981 | |
| | |
| | Construction & Engineering* – 0.1% | |
| | 8,702 | | | Quanta Services, Inc. | | | 174,997 | |
| | |
| | Construction Materials – 0.2% | |
| | 6,680 | | | Vulcan Materials Co. | | | 645,154 | |
| | |
| | Consumer Finance – 1.5% | |
| | 61,618 | | | Ally Financial, Inc.* | | | 1,227,431 | |
| | 56,235 | | | Capital One Financial Corp. | | | 4,436,941 | |
| | 38,645 | | | SLM Corp.* | | | 272,834 | |
| | | | | | | | |
| | | | | | | 5,937,206 | |
| | |
| | Containers & Packaging – 1.0% | |
| | 73,256 | | | WestRock Co. | | | 3,938,243 | |
| | |
| | Diversified Financial Services – 2.1% | |
| | 38,413 | | | Berkshire Hathaway, Inc. Class B* | | | 5,224,936 | |
| | 70,109 | | | Voya Financial, Inc. | | | 2,844,322 | |
| | | | | | | | |
| | | | | | | 8,069,258 | |
| | |
| | Diversified Telecommunication Services – 2.4% | |
| | 154,462 | | | AT&T, Inc.(a) | | | 5,176,022 | |
| | 91,631 | | | Verizon Communications, Inc. | | | 4,295,661 | |
| | | | | | | | |
| | | | | | | 9,471,683 | |
| | |
| | Electrical Equipment – 0.3% | |
| | 3,924 | | | Acuity Brands, Inc. | | | 857,787 | |
| | 9,448 | | | Babcock & Wilcox Enterprises, Inc.* | | | 160,427 | |
| | 2,792 | | | Hubbell, Inc. Class B | | | 270,405 | |
| | | | | | | | |
| | | | | | | 1,288,619 | |
| | |
| | Electronic Equipment, Instruments & Components – 0.8% | |
| | 20,738 | | | Avnet, Inc. | | | 942,127 | |
| | 34,055 | | | Flextronics International Ltd.* | | | 387,887 | |
| | 60,083 | | | Ingram Micro, Inc. Class A | | | 1,789,272 | |
| | | | | | | | |
| | | | | | | 3,119,286 | |
| | |
| | Energy Equipment & Services – 0.4% | |
| | 25,926 | | | Baker Hughes, Inc. | | | 1,365,782 | |
| | |
| | Food & Staples Retailing – 1.1% | |
| | 39,970 | | | CVS Health Corp. | | | 3,948,236 | |
| | 3,449 | | | Wal-Mart Stores, Inc. | | | 197,421 | |
| | | | | | | | |
| | | | | | | 4,145,657 | |
| | |
| | Food Products – 3.2% | |
| | 104,930 | | | ConAgra Foods, Inc. | | | 4,254,911 | |
| | 95,016 | | | Flowers Foods, Inc. | | | 2,565,432 | |
| | 23,488 | | | General Mills, Inc. | | | 1,364,888 | |
| | 30,989 | | | Kellogg Co. | | | 2,185,344 | |
| | 20,168 | | | Pilgrim’s Pride Corp.(b) | | | 382,990 | |
| | 39,595 | | | Pinnacle Foods, Inc. | | | 1,745,348 | |
| | | | | | | | |
| | | | | | | 12,498,913 | |
| | |
| | |
| The accompanying notes are an integral part of these financial statements. | | 47 |
GOLDMAN SACHS LARGE CAP VALUE INSIGHTS FUND
Schedule of Investments (continued)
October 31, 2015
| | | | | | | | |
Shares | | | Description | | Value | |
| | | | | | | | |
| | Common Stocks – (continued) | |
| | Gas Utilities – 0.3% | |
| | 26,710 | | | UGI Corp. | | $ | 979,456 | |
| | |
| | Health Care Equipment & Supplies – 3.6% | |
| | 144,339 | | | Abbott Laboratories | | | 6,466,387 | |
| | 7,106 | | | C.R. Bard, Inc. | | | 1,324,203 | |
| | 10,520 | | | Hill-Rom Holdings, Inc. | | | 554,299 | |
| | 35,392 | | | Hologic, Inc.* | | | 1,375,333 | |
| | 1,579 | | | Medtronic PLC | | | 116,720 | |
| | 44,583 | | | Stryker Corp. | | | 4,263,026 | |
| | | | | | | | |
| | | | | | | 14,099,968 | |
| | |
| | Hotels, Restaurants & Leisure – 1.6% | |
| | 88,730 | | | Carnival Corp. | | | 4,798,518 | |
| | 19,877 | | | Darden Restaurants, Inc. | | | 1,230,188 | |
| | | | | | | | |
| | | | | | | 6,028,706 | |
| | |
| | Household Durables – 1.2% | |
| | 16,624 | | | D.R. Horton, Inc. | | | 489,410 | |
| | 7,993 | | | Leggett & Platt, Inc. | | | 359,925 | |
| | 20,216 | | | Mohawk Industries, Inc.* | | | 3,952,228 | |
| | | | | | | | |
| | | | | | | 4,801,563 | |
| | |
| | Household Products – 1.0% | |
| | 51,903 | | | The Procter & Gamble Co. | | | 3,964,351 | |
| | |
| | Independent Power Producers & Energy Traders – 2.1% | |
| | 194,455 | | | AES Corp. | | | 2,129,282 | |
| | 232,544 | | | Calpine Corp.* | | | 3,606,758 | |
| | 157,508 | | | NRG Energy, Inc. | | | 2,030,278 | |
| | 29,191 | | | Talen Energy Corp.* | | | 253,378 | |
| | | | | | | | |
| | | | | | | 8,019,696 | |
| | |
| | Industrial Conglomerates – 2.0% | |
| | 6,670 | | | Carlisle Cos., Inc. | | | 580,290 | |
| | 250,201 | | | General Electric Co. | | | 7,235,813 | |
| | | | | | | | |
| | | | | | | 7,816,103 | |
| | |
| | Insurance – 4.2% | |
| | 17,571 | | | Aspen Insurance Holdings Ltd. | | | 854,126 | |
| | 29,122 | | | Assured Guaranty Ltd. | | | 799,108 | |
| | 84,278 | | | Lincoln National Corp. | | | 4,509,716 | |
| | 43,132 | | | Reinsurance Group of America, Inc. | | | 3,892,231 | |
| | 45,984 | | | The Travelers Cos., Inc. | | | 5,191,134 | |
| | 4,490 | | | W.R. Berkley Corp. | | | 250,677 | |
| | 22,317 | | | XL Group PLC | | | 849,831 | |
| | | | | | | | |
| | | | | | | 16,346,823 | |
| | |
| | Internet Software & Services* – 1.8% | |
| | 151,769 | | | eBay, Inc. | | | 4,234,355 | |
| | 61,142 | | | Rackspace Hosting, Inc. | | | 1,580,521 | |
| | 35,694 | | | Yahoo!, Inc. | | | 1,271,420 | |
| | | | | | | | |
| | | | | | | 7,086,296 | |
| | |
| | IT Services – 1.2% | |
| | 45,565 | | | Automatic Data Processing, Inc. | | | 3,963,699 | |
| | 13,592 | | | Vantiv, Inc. Class A* | | | 681,639 | |
| | | | | | | | |
| | | | | | | 4,645,338 | |
| | |
| | | | | | | | |
| | Common Stocks – (continued) | |
| | Life Sciences Tools & Services* – 0.2% | |
| | 13,302 | | | Quintiles Transnational Holdings, Inc. | | $ | 846,672 | |
| | |
| | Machinery – 2.6% | |
| | 128,072 | | | Allison Transmission Holdings, Inc. | | | 3,675,666 | |
| | 16,569 | | | Ingersoll-Rand PLC | | | 981,879 | |
| | 15,304 | | | PACCAR, Inc. | | | 805,756 | |
| | 42,637 | | | Stanley Black & Decker, Inc. | | | 4,518,669 | |
| | | | | | | | |
| | | | | | | 9,981,970 | |
| | |
| | Media – 1.3% | |
| | 70,671 | | | Comcast Corp. Class A | | | 4,425,418 | |
| | 6,725 | | | DISH Network Corp. Class A* | | | 423,473 | |
| | 4,506 | | | Thomson Reuters Corp. | | | 184,836 | |
| | | | | | | | |
| | | | | | | 5,033,727 | |
| | |
| | Metals & Mining – 2.3% | |
| | 39,508 | | | Newmont Mining Corp. | | | 768,826 | |
| | 102,022 | | | Nucor Corp. | | | 4,315,530 | |
| | 207,312 | | | Steel Dynamics, Inc. | | | 3,829,053 | |
| | | | | | | | |
| | | | | | | 8,913,409 | |
| | |
| | Multi-Utilities – 0.7% | |
| | 69,469 | | | Public Service Enterprise Group, Inc. | | | 2,868,375 | |
| | |
| | Multiline Retail – 1.3% | |
| | 67,062 | | | Target Corp. | | | 5,175,845 | |
| | |
| | Oil, Gas & Consumable Fuels – 13.2% | |
| | 28,721 | | | Chevron Corp. | | | 2,610,165 | |
| | 30,422 | | | Columbia Pipeline Group, Inc. | | | 631,865 | |
| | 27,884 | | | CVR Energy, Inc.(b) | | | 1,239,723 | |
| | 110,659 | | | Exxon Mobil Corp. | | | 9,155,926 | |
| | 85,394 | | | HollyFrontier Corp. | | | 4,181,744 | |
| | 91,243 | | | Kinder Morgan, Inc. | | | 2,495,496 | |
| | 99,314 | | | Marathon Petroleum Corp. | | | 5,144,465 | |
| | 128,314 | | | PBF Energy, Inc. Class A | | | 4,362,676 | |
| | 62,008 | | | Phillips 66 | | | 5,521,812 | |
| | 151,133 | | | Spectra Energy Corp. | | | 4,317,870 | |
| | 26,615 | | | Tesoro Corp. | | | 2,845,942 | |
| | 82,582 | | | Valero Energy Corp. | | | 5,443,805 | |
| | 69,044 | | | World Fuel Services Corp. | | | 3,069,696 | |
| | | | | | | | |
| | | | | | | 51,021,185 | |
| | |
| | Pharmaceuticals – 7.0% | |
| | 48,802 | | | Eli Lilly & Co. | | | 3,980,779 | |
| | 8,259 | | | Jazz Pharmaceuticals PLC* | | | 1,133,796 | |
| | 71,476 | | | Johnson & Johnson | | | 7,221,220 | |
| | 9,790 | | | Mallinckrodt PLC* | | | 642,909 | |
| | 22,405 | | | Merck & Co., Inc. | | | 1,224,657 | |
| | 7,084 | | | Perrigo Co. PLC | | | 1,117,430 | |
| | 345,441 | | | Pfizer, Inc. | | | 11,682,815 | |
| | | | | | | | |
| | | | | | | 27,003,606 | |
| | |
| | Professional Services – 0.6% | |
| | 27,197 | | | ManpowerGroup, Inc. | | | 2,496,141 | |
| | |
| | |
| 48 | | The accompanying notes are an integral part of these financial statements. |
GOLDMAN SACHS LARGE CAP VALUE INSIGHTS FUND
| | | | | | | | |
Shares | | | Description | | Value | |
| | | | | | | | |
| | Common Stocks – (continued) | |
| | Real Estate Investment Trusts – 7.5% | |
| | 99,389 | | | Apartment Investment & Management Co. Class A | | $ | 3,895,055 | |
| | 16,791 | | | Boston Properties, Inc. | | | 2,113,147 | |
| | 37,052 | | | Camden Property Trust | | | 2,734,067 | |
| | 121,481 | | | CBL & Associates Properties, Inc. | | | 1,771,193 | |
| | 94,103 | | | Empire State Realty Trust, Inc. Class A | | | 1,676,916 | |
| | 78,530 | | | Equity Commonwealth* | | | 2,254,596 | |
| | 60,453 | | | Equity LifeStyle Properties, Inc. | | | 3,656,198 | |
| | 18,993 | | | Equity Residential | | | 1,468,539 | |
| | 5,603 | | | Essex Property Trust, Inc. | | | 1,235,125 | |
| | 71,500 | | | Gaming and Leisure Properties, Inc. | | | 2,085,655 | |
| | 71,163 | | | Hospitality Properties Trust | | | 1,910,015 | |
| | 34,750 | | | Post Properties, Inc. | | | 2,075,965 | |
| | 34,526 | | | Weingarten Realty Investors | | | 1,234,650 | |
| | 92,497 | | | WP GLIMCHER, Inc. | | | 1,074,815 | |
| | | | | | | | |
| | | | | | | 29,185,936 | |
| | |
| | Real Estate Management & Development – 1.6% | |
| | 109,665 | | | CBRE Group, Inc. Class A* | | | 4,088,311 | |
| | 55,303 | | | Forest City Enterprises, Inc. Class A* | | | 1,222,196 | |
| | 4,870 | | | Jones Lang LaSalle, Inc. | | | 811,878 | |
| | | | | | | | |
| | | | | | | 6,122,385 | |
| | |
| | Road & Rail – 0.2% | |
| | 12,446 | | | Ryder System, Inc. | | | 893,374 | |
| | |
| | Semiconductors & Semiconductor Equipment – 0.9% | |
| | 5,734 | | | Freescale Semiconductor Ltd.* | | | 192,032 | |
| | 53,972 | | | Intel Corp. | | | 1,827,492 | |
| | 33,462 | | | Xilinx, Inc. | | | 1,593,460 | |
| | | | | | | | |
| | | | | | | 3,612,984 | |
| | |
| | Software – 0.7% | |
| | 53,523 | | | Microsoft Corp. | | | 2,817,451 | |
| | |
| | Specialty Retail – 2.0% | |
| | 5,043 | | | AutoZone, Inc.* | | | 3,955,780 | |
| | 17,435 | | | Lowe’s Cos., Inc. | | | 1,287,226 | |
| | 6,900 | | | O’Reilly Automotive, Inc.* | | | 1,906,194 | |
| | 41,224 | | | Staples, Inc. | | | 535,500 | |
| | 941 | | | The Home Depot, Inc. | | | 116,345 | |
| | | | | | | | |
| | | | | | | 7,801,045 | |
| | |
| | Tobacco – 1.1% | |
| | 69,034 | | | Altria Group, Inc. | | | 4,174,486 | |
| | |
| | Trading Companies & Distributors* – 0.2% | |
| | 6,327 | | | AerCap Holdings NV | | | 262,571 | |
| | 15,203 | | | HD Supply Holdings, Inc. | | | 452,897 | |
| | | | | | | | |
| | | | | | | 715,468 | |
| | |
| | TOTAL COMMON STOCKS | |
| | (Cost $379,675,432) | | $ | 378,351,482 | |
| | |
| | | | | | | | | | | | |
Principal
Amount | | | Interest
Rate | | Maturity
Date | | | Value | |
| | Short-term Investment(c) – 2.4% | |
| | Repurchase Agreements – 2.4% | | | | | |
| Joint Repurchase Agreement Account II | | | | | |
| $ | 9,400,000 | | | 0.092% | | | 11/02/15 | | | $ | 9,400,000 | |
| | (Cost $9,400,000) | | | | | | | | |
| | |
| TOTAL INVESTMENTS BEFORE SECURITIES
LENDING REINVESTMENT VEHICLE |
|
| | (Cost $389,075,432) | | | | | | $ | 387,751,482 | |
| | |
| | | | | | | | |
| Shares | | | Rate | | Value | |
| | Securities Lending Reinvestment Vehicle(d)(e) – 0.4% | |
| Goldman Sachs Financial Square Money Market Fund –
FST Shares |
|
| | 1,543,540 | | | 0.159% | | $ | 1,543,540 | |
| | (Cost $1,543,540) | | | | |
| | |
| | TOTAL INVESTMENTS – 100.3% | |
| | (Cost $390,618,972) | | $ | 389,295,022 | |
| | |
| LIABILITIES IN EXCESS OF
OTHER ASSETS – (0.3)% | | | (1,107,490 | ) |
| | |
| | NET ASSETS – 100.0% | | $ | 388,187,532 | |
| | |
| | |
| The percentage shown for each investment category reflects the value of investments in that category as a percentage of net assets. |
* | | Non-income producing security. |
(a) | | All or a portion of security is segregated as collateral for initial margin requirements on futures transactions. |
(b) | | All or a portion of security is on loan. |
(c) | | Joint repurchase agreement was entered into on October 30, 2015. Additional information appears on page 67. |
(d) | | Variable rate security. Interest rate or distribution rate disclosed is that which is in effect on October 31, 2015. |
(e) | | Represents an Affiliated Issuer. |
| | |
| The accompanying notes are an integral part of these financial statements. | | 49 |
GOLDMAN SACHS LARGE CAP VALUE INSIGHTS FUND
Schedule of Investments (continued)
October 31, 2015
|
| ADDITIONAL INVESTMENT INFORMATION |
FUTURES CONTRACTS — At October 31, 2015, the Fund had the following futures contracts:
| | | | | | | | | | |
| Type | | Number of
Contracts
Long (Short) | | Expiration
Date | | Current
Value | | Unrealized
Gain (Loss) | |
S&P 500 E-Mini Index | | 32 | | December 2015 | | $3,317,920 | | $ | 197,557 | |
| | |
| 50 | | The accompanying notes are an integral part of these financial statements. |
GOLDMAN SACHS SMALL CAP EQUITY INSIGHTS FUND
Schedule of Investments
October 31, 2015
| | | | | | | | |
Shares | | | Description | | Value | |
| | | | | | | | |
| | Common Stocks – 97.5% | |
| | Aerospace & Defense* – 0.4% | |
| | 42,102 | | | DigitalGlobe, Inc. | | $ | 628,583 | |
| | |
| | Air Freight & Logistics* – 0.6% | |
| | 16,112 | | | Air Transport Services Group, Inc. | | | 157,736 | |
| | 17,948 | | | Atlas Air Worldwide Holdings, Inc. | | | 740,176 | |
| | | | | | | | |
| | | | | | | 897,912 | |
| | |
| | Airlines* – 0.2% | |
| | 9,109 | | | Hawaiian Holdings, Inc. | | | 316,082 | |
| | |
| | Auto Components – 1.9% | |
| | 26,749 | | | Cooper Tire & Rubber Co. | | | 1,117,841 | |
| | 6,208 | | | Drew Industries, Inc. | | | 371,424 | |
| | 40,267 | | | Modine Manufacturing Co.* | | | 337,035 | |
| | 28,492 | | | Tower International, Inc.* | | | 782,675 | |
| | | | | | | | |
| | | | | | | 2,608,975 | |
| | |
| | Biotechnology – 6.5% | |
| | 20,814 | | | AMAG Pharmaceuticals, Inc.* | | | 832,560 | |
| | 10,578 | | | Anacor Pharmaceuticals, Inc.* | | | 1,189,073 | |
| | 125,989 | | | Array BioPharma, Inc.*(a) | | | 645,064 | |
| | 28,608 | | | Cepheid, Inc.* | | | 955,507 | |
| | 3,855 | | | Dyax Corp.* | | | 106,128 | |
| | 10,067 | | | Dynavax Technologies Corp.* | | | 228,622 | |
| | 31,216 | | | Emergent Biosolutions, Inc.* | | | 1,003,594 | |
| | 14,146 | | | Genomic Health, Inc.*(b) | | | 295,934 | |
| | 53,549 | | | Halozyme Therapeutics, Inc.* | | | 838,042 | |
| | 69,611 | | | Infinity Pharmaceuticals, Inc.* | | | 720,474 | |
| | 5,604 | | | Ligand Pharmaceuticals, Inc.* | | | 506,321 | |
| | 7,511 | | | MiMedx Group, Inc.*(b) | | | 54,680 | |
| | 4,455 | | | Momenta Pharmaceuticals, Inc.* | | | 73,106 | |
| | 4,033 | | | NewLink Genetics Corp.*(b) | | | 154,343 | |
| | 118,502 | | | Orexigen Therapeutics, Inc.*(b) | | | 360,246 | |
| | 40,317 | | | PDL BioPharma, Inc. | | | 184,652 | |
| | 30,844 | | | Repligen Corp.* | | | 1,025,255 | |
| | | | | | | | |
| | | | | | | 9,173,601 | |
| | |
| | Building Products – 2.2% | |
| | 8,856 | | | American Woodmark Corp.* | | | 643,831 | |
| | 12,363 | | | Apogee Enterprises, Inc. | | | 612,339 | |
| | 13,203 | | | Masonite International Corp.* | | | 790,464 | |
| | 14,552 | | | Universal Forest Products, Inc. | | | 1,056,912 | |
| | | | | | | | |
| | | | | | | 3,103,546 | |
| | |
| | Capital Markets – 1.7% | |
| | 18,561 | | | Evercore Partners, Inc. Class A | | | 1,002,294 | |
| | 8,554 | | | GAMCO Investors, Inc. Class A | | | 493,395 | |
| | 1,897 | | | Greenhill & Co., Inc. | | | 48,980 | |
| | 34,580 | | | Investment Technology Group, Inc. | | | 553,626 | |
| | 15,226 | | | WisdomTree Investments, Inc.(b) | | | 292,796 | |
| | | | | | | | |
| | | | | | | 2,391,091 | |
| | |
| | Chemicals – 2.4% | |
| | 22,509 | | | A. Schulman, Inc. | | | 807,848 | |
| | 23,273 | | | FutureFuel Corp. | | | 358,637 | |
| | |
| | | | | | | | |
| | Common Stocks – (continued) | |
| | Chemicals – (continued) | |
| | 18,222 | | | Innophos Holdings, Inc. | | $ | 774,253 | |
| | 2,230 | | | Kraton Performance Polymers, Inc.* | | | 45,470 | |
| | 6,691 | | | PolyOne Corp. | | | 223,747 | |
| | 14,597 | | | Sensient Technologies Corp. | | | 952,746 | |
| | 5,343 | | | Stepan Co. | | | 282,805 | |
| | | | | | | | |
| | | | | | | 3,445,506 | |
| | |
| | Commercial Banks – 5.6% | |
| | 23,729 | | | 1st Source Corp. | | | 753,633 | |
| | 38,860 | | | Central Pacific Financial Corp. | | | 868,910 | |
| | 4,323 | | | Columbia Banking System, Inc. | | | 144,042 | |
| | 59,487 | | | CVB Financial Corp. | | | 1,038,048 | |
| | 19,599 | | | FCB Financial Holdings, Inc. Class A* | | | 696,941 | |
| | 786 | | | First Citizens BancShares, Inc. Class A | | | 201,326 | |
| | 32,439 | | | First Interstate BancSystem, Inc. | | | 919,970 | |
| | 48,191 | | | First Midwest Bancorp, Inc. | | | 858,764 | |
| | 1,635 | | | Great Southern Bancorp, Inc. | | | 79,020 | |
| | 22,365 | | | Investors Bancorp, Inc. | | | 279,786 | |
| | 69,283 | | | OFG Bancorp(b) | | | 638,096 | |
| | 11,416 | | | PrivateBancorp, Inc. | | | 477,531 | |
| | 59,099 | | | Umpqua Holdings Corp. | | | 986,953 | |
| | | | | | | | |
| | | | | | | 7,943,020 | |
| | |
| | Commercial Services & Supplies – 2.2% | |
| | 29,334 | | | ABM Industries, Inc. | | | 833,086 | |
| | 2,715 | | | Essendant, Inc. | | | 93,858 | |
| | 13,143 | | | G&K Services, Inc. Class A | | | 865,072 | |
| | 54,676 | | | Kimball International, Inc. Class B | | | 597,062 | |
| | 4,517 | | | Knoll, Inc. | | | 104,975 | |
| | 47,116 | | | Quad Graphics, Inc. | | | 607,796 | |
| | | | | | | | |
| | | | | | | 3,101,849 | |
| | |
| | Communications Equipment – 2.4% | |
| | 21,970 | | | Calix, Inc.* | | | 153,570 | |
| | 12,060 | | | Ciena Corp.* | | | 291,128 | |
| | 107,160 | | | Harmonic, Inc.* | | | 617,242 | |
| | 15,752 | | | Ixia* | | | 226,986 | |
| | 25,416 | | | NETGEAR, Inc.* | | | 1,052,222 | |
| | 2,409 | | | Plantronics, Inc. | | | 129,171 | |
| | 64,497 | | | Polycom, Inc.* | | | 888,769 | |
| | | | | | | | |
| | | | | | | 3,359,088 | |
| | |
| | Computers & Peripherals* – 0.6% | |
| | 69,827 | | | QLogic Corp. | | | 865,855 | |
| | |
| | Construction & Engineering – 2.1% | |
| | 34,316 | | | Aegion Corp.* | | | 661,956 | |
| | 20,214 | | | Comfort Systems USA, Inc. | | | 645,433 | |
| | 24,193 | | | EMCOR Group, Inc. | | | 1,168,038 | |
| | 14,278 | | | Granite Construction, Inc. | | | 468,889 | |
| | | | | | | | |
| | | | | | | 2,944,316 | |
| | |
| | Construction Materials* – 0.6% | |
| | 42,897 | | | Headwaters, Inc. | | | 881,533 | |
| | |
| | |
| The accompanying notes are an integral part of these financial statements. | | 51 |
GOLDMAN SACHS SMALL CAP EQUITY INSIGHTS FUND
Schedule of Investments (continued)
October 31, 2015
| | | | | | | | |
Shares | | | Description | | Value | |
| | | | | | | | |
| | Common Stocks – (continued) | |
| | Consumer Finance – 1.2% | |
| | 32,666 | | | Cash America International, Inc. | | $ | 1,127,957 | |
| | 81,038 | | | EZCORP, Inc. Class A* | | | 539,713 | |
| | 1,629 | | | Nelnet, Inc. Class A | | | 58,286 | |
| | | | | | | | |
| | | | | | | 1,725,956 | |
| | |
| | Containers & Packaging* – 0.9% | |
| | 36,604 | | | Berry Plastics Group, Inc. | | | 1,226,234 | |
| | |
| | Diversified Consumer Services – 2.4% | |
| | 10,491 | | | Apollo Education Group, Inc.* | | | 76,165 | |
| | 23,209 | | | Bridgepoint Education, Inc.*(b) | | | 179,870 | |
| | 4,098 | | | Capella Education Co. | | | 185,025 | |
| | 43,633 | | | Houghton Mifflin Harcourt Co.* | | | 854,770 | |
| | 56,127 | | | K12, Inc.* | | | 544,993 | |
| | 59,737 | | | Regis Corp.* | | | 986,855 | |
| | 7,639 | | | Steiner Leisure Ltd.* | | | 484,007 | |
| | | | | | | | |
| | | | | | | 3,311,685 | |
| | |
| | Diversified Telecommunication Services* – 0.5% | |
| | 2,852 | | | General Communication, Inc. Class A | | | 58,081 | |
| | 113,911 | | | Vonage Holdings Corp. | | | 691,440 | |
| | | | | | | | |
| | | | | | | 749,521 | |
| | |
| | Electrical Equipment – 0.5% | |
| | 21,133 | | | General Cable Corp. | | | 325,237 | |
| | 34,160 | | | LSI Industries, Inc. | | | 366,878 | |
| | | | | | | | |
| | | | | | | 692,115 | |
| | |
| | Electronic Equipment, Instruments & Components – 4.0% | |
| | 5,258 | | | Benchmark Electronics, Inc.* | | | 104,003 | |
| | 4,851 | | | Coherent, Inc.* | | | 262,924 | |
| | 27,706 | | | Insight Enterprises, Inc.* | | | 703,733 | |
| | 32,001 | | | Kimball Electronics, Inc.* | | | 364,491 | |
| | 21,540 | | | Methode Electronics, Inc. | | | 717,928 | |
| | 12,707 | | | OSI Systems, Inc.* | | | 1,095,089 | |
| | 6,142 | | | Plexus Corp.* | | | 212,636 | |
| | 1,578 | | | ScanSource, Inc.* | | | 54,457 | |
| | 9,943 | | | SYNNEX Corp. | | | 879,359 | |
| | 12,503 | | | Tech Data Corp.* | | | 910,093 | |
| | 52,452 | | | TTM Technologies, Inc.* | | | 382,900 | |
| | | | | | | | |
| | | | | | | 5,687,613 | |
| | |
| | Energy Equipment & Services* – 1.0% | |
| | 32,400 | | | Oil States International, Inc. | | | 972,324 | |
| | 85,965 | | | Pioneer Energy Services Corp. | | | 198,579 | |
| | 5,148 | | | SEACOR Holdings, Inc. | | | 300,746 | |
| | | | | | | | |
| | | | | | | 1,471,649 | |
| | |
| | Food & Staples Retailing – 0.4% | |
| | 17,762 | | | SpartanNash Co. | | | 495,560 | |
| | |
| | Food Products – 0.9% | |
| | 7,817 | | | J&J Snack Foods Corp. | | | 959,850 | |
| | 999 | | | Lancaster Colony Corp. | | | 113,606 | |
| | 2,479 | | | Post Holdings, Inc.* | | | 159,325 | |
| | | | | | | | |
| | | | | | | 1,232,781 | |
| | |
| | | | | | | | |
| | Common Stocks – (continued) | |
| | Gas Utilities – 0.1% | |
| | 3,022 | | | New Jersey Resources Corp. | | $ | 95,737 | |
| | |
| | Health Care Equipment & Supplies – 4.9% | |
| | 2,394 | | | Atrion Corp. | | | 883,386 | |
| | 18,265 | | | Cantel Medical Corp. | | | 1,082,749 | |
| | 4,957 | | | CONMED Corp. | | | 201,056 | |
| | 7,158 | | | ICU Medical, Inc.* | | | 787,165 | |
| | 26,577 | | | Invacare Corp. | | | 459,250 | |
| | 3,500 | | | Livanova PLC* | | | 231,980 | |
| | 3,956 | | | Masimo Corp.* | | | 156,974 | |
| | 14,856 | | | Meridian Bioscience, Inc. | | | 282,413 | |
| | 23,292 | | | Merit Medical Systems, Inc.* | | | 431,834 | |
| | 22,445 | | | Natus Medical, Inc.* | | | 1,021,921 | |
| | 8,460 | | | Orthofix International NV* | | | 288,063 | |
| | 18,087 | | | West Pharmaceutical Services, Inc. | | | 1,085,401 | |
| | | | | | | | |
| | | | | | | 6,912,192 | |
| | |
| | Health Care Providers & Services* – 2.1% | |
| | 5,002 | | | Amedisys, Inc. | | | 197,979 | |
| | 24,455 | | | AMN Healthcare Services, Inc. | | | 693,789 | |
| | 14,588 | | | Magellan Health, Inc. | | | 778,999 | |
| | 13,229 | | | Triple-S Management Corp. Class B | | | 272,385 | |
| | 11,547 | | | WellCare Health Plans, Inc. | | | 1,023,064 | |
| | | | | | | | |
| | | | | | | 2,966,216 | |
| | |
| | Health Care Technology – 0.8% | |
| | 2,609 | | | Computer Programs & Systems, Inc. | | | 99,168 | |
| | 7,477 | | | Omnicell, Inc.* | | | 203,375 | |
| | 59,343 | | | Quality Systems, Inc. | | | 833,769 | |
| | | | | | | | |
| | | | | | | 1,136,312 | |
| | |
| | Hotels, Restaurants & Leisure – 5.5% | |
| | 21,917 | | | BJ’s Restaurants, Inc.* | | | 940,897 | |
| | 49,858 | | | Bloomin’ Brands, Inc. | | | 846,090 | |
| | 52,425 | | | Boyd Gaming Corp.* | | | 1,047,976 | |
| | 81,331 | | | Denny’s Corp.* | | | 891,388 | |
| | 2,394 | | | Isle of Capri Casinos, Inc.* | | | 45,797 | |
| | 13,559 | | | Jack in the Box, Inc. | | | 1,010,552 | |
| | 3,823 | | | La Quinta Holdings, Inc.* | | | 57,918 | |
| | 14,438 | | | Papa John’s International, Inc. | | | 1,013,115 | |
| | 24,317 | | | Pinnacle Entertainment, Inc.* | | | 851,338 | |
| | 1,013 | | | Red Robin Gourmet Burgers, Inc.* | | | 75,864 | |
| | 35,269 | | | Sonic Corp. | | | 1,006,577 | |
| | | | | | | | |
| | | | | | | 7,787,512 | |
| | |
| | Household Durables – 1.8% | |
| | 12,283 | | | Cavco Industries, Inc.* | | | 1,211,104 | |
| | 32,984 | | | Ethan Allen Interiors, Inc.(b) | | | 897,495 | |
| | 6,828 | | | La-Z-Boy, Inc. | | | 194,939 | |
| | 5,188 | | | Universal Electronics, Inc.* | | | 246,793 | |
| | | | | | | | |
| | | | | | | 2,550,331 | |
| | |
| | Independent Power Producers & Energy Traders – 0.6% | |
| | 3,438 | | | Ormat Technologies, Inc. | | | 129,681 | |
| | 84,701 | | | Talen Energy Corp.* | | | 735,205 | |
| | | | | | | | |
| | | | | | | 864,886 | |
| | |
| | |
| 52 | | The accompanying notes are an integral part of these financial statements. |
GOLDMAN SACHS SMALL CAP EQUITY INSIGHTS FUND
| | | | | | | | |
Shares | | | Description | | Value | |
| | | | | | | | |
| | Common Stocks – (continued) | |
| | Insurance – 2.2% | |
| | 37,537 | | | American Equity Investment Life Holding Co. | | $ | 963,950 | |
| | 16,404 | | | Argo Group International Holdings Ltd. | | | 1,025,578 | |
| | 55,676 | | | Maiden Holdings Ltd. | | | 865,762 | |
| | 4,201 | | | Selective Insurance Group, Inc. | | | 153,295 | |
| | 1,740 | | | Symetra Financial Corp. | | | 55,210 | |
| | | | | | | | |
| | | | | | | 3,063,795 | |
| | |
| | Internet & Catalog Retail – 0.6% | |
| | 2,342 | | | HSN, Inc. | | | 144,853 | |
| | 31,769 | | | Nutrisystem, Inc. | | | 734,817 | |
| | | | | | | | |
| | | | | | | 879,670 | |
| | |
| | Internet Software & Services – 2.8% | |
| | 22,605 | | | Blucora, Inc.* | | | 221,529 | |
| | 33,839 | | | Constant Contact, Inc.* | | | 883,198 | |
| | 113,414 | | | EarthLink Holdings Corp. | | | 969,690 | |
| | 8,072 | | | LogMeIn, Inc.* | | | 543,730 | |
| | 33,034 | | | Marchex, Inc. Class B | | | 142,707 | |
| | 26,489 | | | Monster Worldwide, Inc.* | | | 166,086 | |
| | 43,345 | | | Web.com Group, Inc.* | | | 1,017,307 | |
| | | | | | | | |
| | | | | | | 3,944,247 | |
| | |
| | IT Services – 1.2% | |
| | 33,470 | | | ManTech International Corp. Class A | | | 967,283 | |
| | 25,729 | | | Sykes Enterprises, Inc.* | | | 746,141 | |
| | | | | | | | |
| | | | | | | 1,713,424 | |
| | |
| | Leisure Equipment & Products – 0.0% | |
| | 5,275 | | | Callaway Golf Co. | | | 52,486 | |
| | |
| | Life Sciences Tools & Services* – 0.2% | |
| | 7,548 | | | Cambrex Corp. | | | 346,982 | |
| | |
| | Machinery – 4.7% | |
| | 2,698 | | | Altra Industrial Motion Corp. | | | 71,389 | |
| | 26,978 | | | Barnes Group, Inc. | | | 1,014,103 | |
| | 48,119 | | | Federal Signal Corp. | | | 724,672 | |
| | 29,710 | | | Hillenbrand, Inc. | | | 881,496 | |
| | 10,248 | | | Hyster-Yale Materials Handling, Inc. | | | 599,713 | |
| | 21,916 | | | John Bean Technologies Corp. | | | 983,152 | |
| | 8,671 | | | Kadant, Inc. | | | 356,552 | |
| | 17,149 | | | Miller Industries, Inc. | | | 388,939 | |
| | 23,572 | | | Mueller Industries, Inc. | | | 742,989 | |
| | 71,604 | | | Wabash National Corp.* | | | 857,100 | |
| | | | | | | | |
| | | | | | | 6,620,105 | |
| | |
| | Media – 0.2% | |
| | 13,855 | | | Entercom Communications Corp. Class A* | | | 152,959 | |
| | 44,613 | | | Harte-Hanks, Inc. | | | 189,605 | |
| | | | | | | | |
| | | | | | | 342,564 | |
| | |
| | Metals & Mining – 2.3% | |
| | 27,074 | | | Carpenter Technology Corp. | | | 901,835 | |
| | 40,772 | | | Globe Specialty Metals, Inc. | | | 514,543 | |
| | |
| | | | | | | | |
| | Common Stocks – (continued) | |
| | Metals & Mining – (continued) | |
| | 27,961 | | | Materion Corp. | | $ | 843,024 | |
| | 40,802 | | | Schnitzer Steel Industries, Inc. Class A | | | 687,922 | |
| | 7,386 | | | Worthington Industries, Inc. | | | 226,750 | |
| | | | | | | | |
| | | | | | | 3,174,074 | |
| | |
| | Oil, Gas & Consumable Fuels – 3.5% | |
| | 48,761 | | | Alon USA Energy, Inc. | | | 816,747 | |
| | 7,578 | | | Contango Oil & Gas Co.* | | | 57,971 | |
| | 30,435 | | | Delek US Holdings, Inc. | | | 827,832 | |
| | 12,612 | | | Gener8 Maritime, Inc.* | | | 131,165 | |
| | 39,035 | | | Green Plains, Inc. | | | 800,608 | |
| | 22,336 | | | Nordic American Tankers Ltd.(b) | | | 341,294 | |
| | 11,724 | | | REX American Resources Corp.* | | | 643,765 | |
| | 17,190 | | | Scorpio Tankers, Inc. | | | 156,773 | |
| | 3,785 | | | SemGroup Corp. Class A | | | 172,407 | |
| | 25,251 | | | Western Refining, Inc. | | | 1,050,946 | |
| | | | | | | | |
| | | | | | | 4,999,508 | |
| | |
| | Paper & Forest Products – 0.4% | |
| | 13,078 | | | Schweitzer-Mauduit International, Inc. | | | 507,688 | |
| | |
| | Personal Products* – 0.1% | |
| | 824 | | | USANA Health Sciences, Inc. | | | 105,966 | |
| | |
| | Pharmaceuticals – 1.2% | |
| | 23,240 | | | Phibro Animal Health Corp. Class A | | | 775,287 | |
| | 9,501 | | | Prestige Brands Holdings, Inc.* | | | 465,644 | |
| | 25,567 | | | Sagent Pharmaceuticals, Inc.* | | | 429,781 | |
| | | | | | | | |
| | | | | | | 1,670,712 | |
| | |
| | Professional Services – 2.0% | |
| | 4,414 | | | Barrett Business Services, Inc. | | | 216,198 | |
| | 19,021 | | | CDI Corp. | | | 152,168 | |
| | 18,826 | | | Insperity, Inc. | | | 874,656 | |
| | 30,247 | | | Korn/Ferry International | | | 1,100,083 | |
| | 12,599 | | | TrueBlue, Inc.* | | | 364,993 | |
| | 1,372 | | | WageWorks, Inc.* | | | 65,883 | |
| | | | | | | | |
| | | | | | | 2,773,981 | |
| | |
| | Real Estate Investment Trusts – 9.7% | |
| | 5,070 | | | American Assets Trust, Inc. | | | 213,751 | |
| | 9,650 | | | American Capital Mortgage Investment Corp. | | | 140,021 | |
| | 179,116 | | | Anworth Mortgage Asset Corp. | | | 854,383 | |
| | 17,829 | | | Coresite Realty Corp. | | | 979,704 | |
| | 96,520 | | | Cousins Properties, Inc. | | | 969,061 | |
| | 44,589 | | | CubeSmart | | | 1,240,466 | |
| | 30,392 | | | CyrusOne, Inc. | | | 1,072,230 | |
| | 30,799 | | | DCT Industrial Trust, Inc. | | | 1,143,259 | |
| | 32,828 | | | DuPont Fabros Technology, Inc. | | | 1,053,451 | |
| | 32,466 | | | FelCor Lodging Trust, Inc. | | | 261,351 | |
| | 46,709 | | | First Industrial Realty Trust, Inc. | | | 1,012,651 | |
| | 22,622 | | | Hudson Pacific Properties, Inc. | | | 646,311 | |
| | 36,314 | | | Kite Realty Group Trust | | | 959,053 | |
| | 46,170 | | | Mack-Cali Realty Corp. | | | 1,004,659 | |
| | 12,342 | | | PS Business Parks, Inc. | | | 1,058,820 | |
| | |
| | |
| The accompanying notes are an integral part of these financial statements. | | 53 |
GOLDMAN SACHS SMALL CAP EQUITY INSIGHTS FUND
Schedule of Investments (continued)
October 31, 2015
| | | | | | | | |
Shares | | | Description | | Value | |
| | | | | | | | |
| | Common Stocks – (continued) | |
| | Real Estate Investment Trusts – (continued) | |
| | 13,120 | | | QTS Realty Trust, Inc. Class A | | $ | 564,291 | |
| | 1,920 | | | Sovran Self Storage, Inc. | | | 191,750 | |
| | 25,371 | | | Western Asset Mortgage Capital Corp.(b) | | | 289,737 | |
| | | | | | | | |
| | | | | | | 13,654,949 | |
| | |
| | Real Estate Management & Development – 0.9% | |
| | 22,781 | | | Alexander & Baldwin, Inc. | | | 859,755 | |
| | 8,068 | | | Marcus & Millichap, Inc.* | | | 351,523 | |
| | | | | | | | |
| | | | | | | 1,211,278 | |
| | |
| | Road & Rail – 0.2% | |
| | 9,019 | | | ArcBest Corp. | | | 233,592 | |
| | |
| | Semiconductors & Semiconductor Equipment – 1.3% | |
| | 3,793 | | | Ambarella, Inc.*(b) | | | 187,526 | |
| | 18,893 | | | Cabot Microelectronics Corp.* | | | 796,718 | |
| | 12,725 | | | Cirrus Logic, Inc.* | | | 392,312 | |
| | 4,532 | | | Microsemi Corp.* | | | 163,197 | |
| | 4,381 | | | Power Integrations, Inc. | | | 221,722 | |
| | | | | | | | |
| | | | | | | 1,761,475 | |
| | |
| | Software – 2.7% | |
| | 11,351 | | | Fair Isaac Corp. | | | 1,048,492 | |
| | 8,359 | | | Gigamon, Inc.* | | | 219,256 | |
| | 14,749 | | | Manhattan Associates, Inc.* | | | 1,074,465 | |
| | 6,982 | | | Pegasystems, Inc. | | | 194,728 | |
| | 25,856 | | | Progress Software Corp.* | | | 627,784 | |
| | 3,102 | | | Take-Two Interactive Software, Inc.* | | | 102,986 | |
| | 2,806 | | | Tyler Technologies, Inc.* | | | 478,030 | |
| | | | | | | | |
| | | | | | | 3,745,741 | |
| | |
| | Specialty Retail – 1.5% | |
| | 1,770 | | | Lithia Motors, Inc. Class A | | | 207,780 | |
| | 12,414 | | | Pier 1 Imports, Inc.(b) | | | 92,112 | |
| | 24,684 | | | Select Comfort Corp.* | | | 523,301 | |
| | 12,627 | | | Stage Stores, Inc. | | | 122,861 | |
| | 25,936 | | | The Cato Corp. Class A | | | 979,343 | |
| | 12,870 | | | Zumiez, Inc.* | | | 224,968 | |
| | | | | | | | |
| | | | | | | 2,150,365 | |
| | |
| | Textiles, Apparel & Luxury Goods – 0.5% | |
| | 1,734 | | | G-III Apparel Group Ltd.* | | | 95,526 | |
| | 31,210 | | | Wolverine World Wide, Inc. | | | 579,570 | |
| | | | | | | | |
| | | | | | | 675,096 | |
| | |
| | Thrifts & Mortgage Finance – 1.5% | |
| | 797 | | | BofI Holding, Inc.* | | | 63,768 | |
| | 85,229 | | | Brookline Bancorp, Inc. | | | 967,349 | |
| | 42,154 | | | Dime Community Bancshares, Inc. | | | 731,372 | |
| | 17,716 | | | Oritani Financial Corp. | | | 282,039 | |
| | 4,018 | | | Washington Federal, Inc. | | | 100,209 | |
| | | | | | | | |
| | | | | | | 2,144,737 | |
| | |
| | | | | | | | |
| | Common Stocks – (continued) | |
| | Trading Companies & Distributors* – 0.4% | |
| | 3,292 | | | Beacon Roofing Supply, Inc. | | $ | 116,504 | |
| | 22,855 | | | Univar, Inc. | | | 403,619 | |
| | | | | | | | |
| | | | | | | 520,123 | |
| | |
| | Water Utilities – 0.1% | |
| | 6,134 | | | California Water Service Group | | | 137,156 | |
| | |
| | Wireless Telecommunication Services – 0.3% | |
| | 22,931 | | | Spok Holdings, Inc. | | | 413,446 | |
| | |
| | TOTAL COMMON STOCKS | |
| | (Cost $139,289,198) | | $ | 137,410,417 | |
| | |
| | | | | | | | | | | | | | |
Principal
Amount | | | Interest
Rate | | | Maturity
Date | | | Value | |
| | Short-term Investment(c) – 2.4% | |
| | Repurchase Agreements – 2.4% | | | | | |
| Joint Repurchase Agreement Account II | | | | | |
| $ | 3,400,000 | | | | 0.092 | % | | | 11/02/15 | | | $ | 3,400,000 | |
| | (Cost $3,400,000) | | | | | | | | | |
| | |
| TOTAL INVESTMENTS BEFORE SECURITIES
LENDING REINVESTMENT VEHICLE |
|
| | (Cost $142,689,198) | | | | | | | $ | 140,810,417 | |
| | |
| | | | | | | | |
| Shares | | Rate | | | Value | |
| Securities Lending Reinvestment Vehicle(d)(e) – 2.1% | |
Goldman Sachs Financial Square Money Market Fund –
FST Shares | |
| $3,040,011 | | | 0.159 | % | | $ | 3,040,011 | |
| (Cost $3,040,011) | | | | | |
| |
| TOTAL INVESTMENTS – 102.0% | |
| (Cost $145,729,209) | | | $ | 143,850,428 | |
| |
| LIABILITIES IN EXCESS OF OTHER ASSETS – (2.0)% | | | | (2,875,012 | ) |
| |
| NET ASSETS – 100.0% | | | $ | 140,975,416 | |
| |
| | |
| The percentage shown for each investment category reflects the value of investments in that category as a percentage of net assets. |
* | | Non-income producing security. |
(a) | | All or a portion of security is segregated as collateral for initial margin requirements on futures transactions. |
(b) | | All or a portion of security is on loan. |
(c) | | Joint repurchase agreement was entered into on October 30, 2015. Additional information appears on page 67. |
(d) | | Variable rate security. Interest rate or distribution rate disclosed is that which is in effect on October 31, 2015. |
(e) | | Represents an Affiliated Issuer. |
| | |
| 54 | | The accompanying notes are an integral part of these financial statements. |
GOLDMAN SACHS SMALL CAP EQUITY INSIGHTS FUND
|
| ADDITIONAL INVESTMENTS INFORMATION |
FUTURES CONTRACTS — At October 31, 2015, the Fund had the following futures contracts:
| | | | | | | | | | | | | | |
| Type | | Number of Contracts Long (Short) | | | Expiration Date | | Current Value | | | Unrealized Gain (Loss) | |
Russell 2000 Mini Index | | | 22 | | | December 2015 | | $ | 2,548,260 | | | $ | 15,939 | |
| | |
| The accompanying notes are an integral part of these financial statements. | | 55 |
GOLDMAN SACHS SMALL CAP GROWTH INSIGHTS FUND
Schedule of Investments
October 31, 2015
| | | | | | | | |
Shares | | | Description | | Value | |
| | Common Stocks – 97.3% | |
| | Aerospace & Defense* – 0.2% | |
| | 13,534 | | | DigitalGlobe, Inc. | | $ | 202,063 | |
| | |
| | Air Freight & Logistics* – 0.4% | |
| | 11,243 | | | Atlas Air Worldwide Holdings, Inc. | | | 463,661 | |
| | |
| | Airlines* – 0.8% | |
| | 29,009 | | | Hawaiian Holdings, Inc. | | | 1,006,612 | |
| | |
| | Auto Components – 1.4% | |
| | 19,609 | | | Cooper Tire & Rubber Co. | | | 819,460 | |
| | 13,563 | | | Drew Industries, Inc. | | | 811,474 | |
| | 1,717 | | | Tower International, Inc.* | | | 47,166 | |
| | | | | | | | |
| | | | | | | 1,678,100 | |
| | |
| | Biotechnology* – 13.1% | |
| | 9,392 | | | Acceleron Pharma, Inc. | | | 293,124 | |
| | 19,967 | | | AMAG Pharmaceuticals, Inc. | | | 798,680 | |
| | 12,113 | | | Anacor Pharmaceuticals, Inc. | | | 1,361,622 | |
| | 41,378 | | | ARIAD Pharmaceuticals, Inc. | | | 283,026 | |
| | 126,925 | | | Array BioPharma, Inc. | | | 649,856 | |
| | 17,034 | | | BioCryst Pharmaceuticals, Inc. | | | 153,136 | |
| | 30,001 | | | Cepheid, Inc. | | | 1,002,033 | |
| | 1,246 | | | Clovis Oncology, Inc. | | | 124,488 | |
| | 39,814 | | | Dyax Corp. | | | 1,096,079 | |
| | 32,353 | | | Dynavax Technologies Corp. | | | 734,737 | |
| | 23,700 | | | Emergent Biosolutions, Inc. | | | 761,955 | |
| | 17,614 | | | Genomic Health, Inc. | | | 368,485 | |
| | 59,652 | | | Halozyme Therapeutics, Inc.(a) | | | 933,554 | |
| | 39,151 | | | ImmunoGen, Inc. | | | 458,067 | |
| | 46,318 | | | Infinity Pharmaceuticals, Inc. | | | 479,391 | |
| | 9,535 | | | Ligand Pharmaceuticals, Inc. | | | 861,487 | |
| | 31,285 | | | MiMedx Group, Inc.(b) | | | 227,755 | |
| | 42,708 | | | Momenta Pharmaceuticals, Inc. | | | 700,838 | |
| | 20,819 | | | Neurocrine Biosciences, Inc. | | | 1,022,005 | |
| | 18,991 | | | NewLink Genetics Corp.(b) | | | 726,786 | |
| | 76,513 | | | Novavax, Inc.(b) | | | 516,463 | |
| | 12,461 | | | Ophthotech Corp. | | | 622,178 | |
| | 123,725 | | | Orexigen Therapeutics, Inc.(b) | | | 376,124 | |
| | 3,367 | | | Prothena Corp. PLC | | | 173,434 | |
| | 28,848 | | | Repligen Corp. | | | 958,907 | |
| | 20,194 | | | Retrophin, Inc. | | | 386,311 | |
| | 477 | | | Ultragenyx Pharmaceutical, Inc. | | | 47,390 | |
| | | | | | | | |
| | | | | | | 16,117,911 | |
| | |
| | Building Products – 2.4% | |
| | 5,715 | | | American Woodmark Corp.* | | | 415,480 | |
| | 17,072 | | | Apogee Enterprises, Inc. | | | 845,576 | |
| | 23,924 | | | Continental Building Products, Inc.* | | | 420,345 | |
| | 14,198 | | | Masonite International Corp.* | | | 850,034 | |
| | 6,230 | | | Universal Forest Products, Inc. | | | 452,485 | |
| | | | | | | | |
| | | | | | | 2,983,920 | |
| | |
| | Capital Markets – 1.0% | |
| | 9,684 | | | Evercore Partners, Inc. Class A | | | 522,936 | |
| | 23,457 | | | Investment Technology Group, Inc. | | | 375,547 | |
| | 17,750 | | | WisdomTree Investments, Inc.(b) | | | 341,332 | |
| | | | | | | | |
| | | | | | | 1,239,815 | |
| | |
| | Common Stocks – (continued) | |
| | Chemicals – 2.1% | |
| | 11,379 | | | A. Schulman, Inc. | | $ | 408,392 | |
| | 3,866 | | | Balchem Corp. | | | 264,048 | |
| | 20,502 | | | Ferro Corp.* | | | 256,070 | |
| | 6,366 | | | Innophos Holdings, Inc. | | | 270,491 | |
| | 8,393 | | | PolyOne Corp. | | | 280,662 | |
| | 13,547 | | | Sensient Technologies Corp. | | | 884,213 | |
| | 3,505 | | | Stepan Co. | | | 185,520 | |
| | | | | | | | |
| | | | | | | 2,549,396 | |
| | |
| | Commercial Banks(b) – 0.2% | |
| | 29,046 | | | OFG Bancorp | | | 267,514 | |
| | |
| | Commercial Services & Supplies – 2.4% | |
| | 17,882 | | | ABM Industries, Inc. | | | 507,849 | |
| | 11,266 | | | G&K Services, Inc. Class A | | | 741,528 | |
| | 19,410 | | | HNI Corp. | | | 833,465 | |
| | 7,182 | | | Interface, Inc. | | | 140,408 | |
| | 4,026 | | | Kimball International, Inc. Class B | | | 43,964 | |
| | 10,332 | | | Knoll, Inc. | | | 240,116 | |
| | 945 | | | Multi-Color Corp. | | | 73,559 | |
| | 26,791 | | | Quad Graphics, Inc. | | | 345,604 | |
| | | | | | | | |
| | | | | | | 2,926,493 | |
| | |
| | Communications Equipment – 2.9% | |
| | 42,756 | | | Ciena Corp.* | | | 1,032,130 | |
| | 82,386 | | | Harmonic, Inc.* | | | 474,543 | |
| | 16,912 | | | Infinera Corp.* | | | 334,181 | |
| | 47,441 | | | Ixia* | | | 683,625 | |
| | 13,193 | | | NETGEAR, Inc.* | | | 546,190 | |
| | 8,133 | | | Plantronics, Inc. | | | 436,092 | |
| | | | | | | | |
| | | | | | | 3,506,761 | |
| | |
| | Computers & Peripherals* – 0.5% | |
| | 47,100 | | | QLogic Corp. | | | 584,040 | |
| | |
| | Construction & Engineering – 1.6% | |
| | 28,392 | | | Aegion Corp.* | | | 547,682 | |
| | 28,010 | | | Comfort Systems USA, Inc. | | | 894,359 | |
| | 10,258 | | | EMCOR Group, Inc. | | | 495,256 | |
| | | | | | | | |
| | | | | | | 1,937,297 | |
| | |
| | Construction Materials* – 0.7% | |
| | 42,125 | | | Headwaters, Inc. | | | 865,669 | |
| | |
| | Consumer Finance – 0.8% | |
| | 25,730 | | | Cash America International, Inc. | | | 888,457 | |
| | 7,110 | | | Enova International, Inc.* | | | 92,430 | |
| | | | | | | | |
| | | | | | | 980,887 | |
| | |
| | Containers & Packaging* – 0.9% | |
| | 32,001 | | | Berry Plastics Group, Inc. | | | 1,072,033 | |
| | |
| | Diversified Consumer Services – 2.2% | |
| | 2,383 | | | Bright Horizons Family Solutions, Inc.* | | | 152,560 | |
| | 11,741 | | | Capella Education Co. | | | 530,106 | |
| | 29,895 | | | Houghton Mifflin Harcourt Co.* | | | 585,643 | |
| | 3,718 | | | K12, Inc.* | | | 36,102 | |
| | |
| | |
| 56 | | The accompanying notes are an integral part of these financial statements. |
GOLDMAN SACHS SMALL CAP GROWTH INSIGHTS FUND
| | | | | | | | |
Shares | | | Description | | Value | |
| | Common Stocks – (continued) | |
| | Diversified Consumer Services – (continued) | |
| | 43,972 | | | Regis Corp.* | | $ | 726,417 | |
| | 10,443 | | | Steiner Leisure Ltd.* | | | 661,669 | |
| | | | | | | | |
| | | | | | | 2,692,497 | |
| | |
| | Diversified Telecommunication Services* – 0.7% | |
| | 11,164 | | | General Communication, Inc. Class A | | | 227,355 | |
| | 102,528 | | | Vonage Holdings Corp. | | | 622,345 | |
| | | | | | | | |
| | | | | | | 849,700 | |
| | |
| | Electrical Equipment – 0.6% | |
| | 49,248 | | | General Cable Corp. | | | 757,927 | |
| | |
| | Electronic Equipment, Instruments & Components – 4.0% | |
| | 10,849 | | | Coherent, Inc.* | | | 588,016 | |
| | 11,526 | | | DTS, Inc.* | | | 343,014 | |
| | 18,645 | | | Insight Enterprises, Inc.* | | | 473,583 | |
| | 28,482 | | | Methode Electronics, Inc. | | | 949,305 | |
| | 5,072 | | | MTS Systems Corp. | | | 334,904 | |
| | 10,278 | | | OSI Systems, Inc.* | | | 885,758 | |
| | 18,131 | | | Plexus Corp.* | | | 627,695 | |
| | 1,005 | | | Rogers Corp.* | | | 46,753 | |
| | 1,592 | | | SYNNEX Corp. | | | 140,797 | |
| | 4,541 | | | Tech Data Corp.* | | | 330,539 | |
| | 30,111 | | | TTM Technologies, Inc.* | | | 219,810 | |
| | | | | | | | |
| | | | | | | 4,940,174 | |
| | |
| | Energy Equipment & Services* – 0.6% | |
| | 21,453 | | | Oil States International, Inc. | | | 643,805 | |
| | 31,729 | | | Pioneer Energy Services Corp. | | | 73,294 | |
| | | | | | | | |
| | | | | | | 717,099 | |
| | |
| | Food Products – 0.7% | |
| | 7,528 | | | J&J Snack Foods Corp. | | | 924,363 | |
| | |
| | Health Care Equipment & Supplies – 4.7% | |
| | 2,742 | | | ABIOMED, Inc.* | | | 201,976 | |
| | 17,445 | | | Cantel Medical Corp. | | | 1,034,139 | |
| | 2,572 | | | ICU Medical, Inc.* | | | 282,843 | |
| | 8,632 | | | Invacare Corp. | | | 149,161 | |
| | 9,006 | | | Livanova PLC* | | | 596,918 | |
| | 11,379 | | | Masimo Corp.* | | | 451,519 | |
| | 39,954 | | | Meridian Bioscience, Inc. | | | 759,525 | |
| | 8,196 | | | Merit Medical Systems, Inc.* | | | 151,954 | |
| | 19,714 | | | Natus Medical, Inc.* | | | 897,578 | |
| | 1,034 | | | NuVasive, Inc.* | | | 48,763 | |
| | 20,876 | | | West Pharmaceutical Services, Inc. | | | 1,252,769 | |
| | | | | | | | |
| | | | | | | 5,827,145 | |
| | |
| | Health Care Providers & Services* – 2.1% | |
| | 15,251 | | | Amedisys, Inc. | | | 603,635 | |
| | 29,663 | | | AMN Healthcare Services, Inc. | | | 841,539 | |
| | 13,454 | | | WellCare Health Plans, Inc. | | | 1,192,024 | |
| | | | | | | | |
| | | | | | | 2,637,198 | |
| | |
| | Health Care Technology – 1.6% | |
| | 13,333 | | | Computer Programs & Systems, Inc.(b) | | | 506,788 | |
| | 1,791 | | | Medidata Solutions, Inc.* | | | 77,013 | |
| | |
| | Common Stocks – (continued) | |
| | Health Care Technology – (continued) | |
| | 21,066 | | | Omnicell, Inc.* | | $ | 572,995 | |
| | 55,043 | | | Quality Systems, Inc. | | | 773,354 | |
| | | | | | | | |
| | | | | | | 1,930,150 | |
| | |
| | Hotels, Restaurants & Leisure – 7.0% | |
| | 16,700 | | | BJ’s Restaurants, Inc.* | | | 716,931 | |
| | 49,615 | | | Bloomin’ Brands, Inc. | | | 841,966 | |
| | 47,621 | | | Boyd Gaming Corp.* | | | 951,944 | |
| | 63,118 | | | Denny’s Corp.* | | | 691,773 | |
| | 35,479 | | | Isle of Capri Casinos, Inc.* | | | 678,713 | |
| | 13,628 | | | Jack in the Box, Inc. | | | 1,015,695 | |
| | 11,101 | | | Krispy Kreme Doughnuts, Inc.* | | | 151,973 | |
| | 18,564 | | | La Quinta Holdings, Inc.* | | | 281,245 | |
| | 3,052 | | | Marriott Vacations Worldwide Corp. | | | 196,549 | |
| | 13,204 | | | Papa John’s International, Inc. | | | 926,525 | |
| | 24,552 | | | Pinnacle Entertainment, Inc.* | | | 859,565 | |
| | 4,604 | | | Red Robin Gourmet Burgers, Inc.* | | | 344,794 | |
| | 3,530 | | | Ruth’s Hospitality Group, Inc. | | | 54,750 | |
| | 30,986 | | | Sonic Corp. | | | 884,340 | |
| | | | | | | | |
| | | | | | | 8,596,763 | |
| | |
| | Household Durables – 1.2% | |
| | 5,615 | | | Cavco Industries, Inc.* | | | 553,639 | |
| | 12,499 | | | Ethan Allen Interiors, Inc. | | | 340,098 | |
| | 12,079 | | | La-Z-Boy, Inc. | | | 344,855 | |
| | 5,057 | | | Universal Electronics, Inc.* | | | 240,562 | |
| | | | | | | | |
| | | | | | | 1,479,154 | |
| | |
| | Independent Power Producers & Energy Traders* – 0.4% | |
| | 55,275 | | | Talen Energy Corp. | | | 479,787 | |
| | |
| | Insurance – 1.2% | |
| | 25,322 | | | American Equity Investment Life Holding Co. | | | 650,269 | |
| | 4,022 | | | Argo Group International Holdings Ltd. | | | 251,455 | |
| | 34,119 | | | Maiden Holdings Ltd. | | | 530,551 | |
| | | | | | | | |
| | | | | | | 1,432,275 | |
| | |
| | Internet & Catalog Retail – 0.8% | |
| | 4,634 | | | HSN, Inc. | | | 286,613 | |
| | 28,669 | | | Nutrisystem, Inc. | | | 663,114 | |
| | | | | | | | |
| | | | | | | 949,727 | |
| | |
| | Internet Software & Services – 3.6% | |
| | 16,957 | | | Blucora, Inc.* | | | 166,179 | |
| | 31,006 | | | Constant Contact, Inc.* | | | 809,257 | |
| | 1,857 | | | Cvent, Inc.* | | | 58,700 | |
| | 99,432 | | | EarthLink Holdings Corp. | | | 850,143 | |
| | 16,065 | | | Intralinks Holdings, Inc.* | | | 140,569 | |
| | 12,745 | | | LogMeIn, Inc.* | | | 858,503 | |
| | 9,473 | | | Monster Worldwide, Inc.* | | | 59,396 | |
| | 9,414 | | | Q2 Holdings, Inc.* | | | 232,055 | |
| | 7,261 | | | RetailMeNot, Inc.* | | | 63,824 | |
| | 4,617 | | | Stamps.com, Inc.* | | | 349,091 | |
| | 35,933 | | | Web.com Group, Inc.* | | | 843,347 | |
| | | | | | | | |
| | | | | | | 4,431,064 | |
| | |
| | |
| The accompanying notes are an integral part of these financial statements. | | 57 |
GOLDMAN SACHS SMALL CAP GROWTH INSIGHTS FUND
Schedule of Investments (continued)
October 31, 2015
| | | | | | | | |
Shares | | | Description | | Value | |
| | Common Stocks – (continued) | |
| | IT Services* – 0.2% | |
| | 6,753 | | | Exlservice Holdings, Inc. | | $ | 298,888 | |
| | |
| | Leisure Equipment & Products* – 0.2% | |
| | 12,776 | | | Smith & Wesson Holding Corp. | | | 228,179 | |
| | |
| | Life Sciences Tools & Services* – 0.7% | |
| | 18,577 | | | Cambrex Corp. | | | 853,985 | |
| | |
| | Machinery – 3.9% | |
| | 10,261 | | | Altra Industrial Motion Corp. | | | 271,506 | |
| | 33,012 | | | Blount International, Inc.* | | | 200,383 | |
| | 32,877 | | | Hillenbrand, Inc. | | | 975,461 | |
| | 9,778 | | | Hyster-Yale Materials Handling, Inc. | | | 572,208 | |
| | 22,637 | | | John Bean Technologies Corp. | | | 1,015,496 | |
| | 6,336 | | | Meritor, Inc.* | | | 68,872 | |
| | 5,767 | | | Milacron Holdings Corp.* | | | 98,443 | |
| | 25,758 | | | Mueller Industries, Inc. | | | 811,892 | |
| | 67,834 | | | Wabash National Corp.* | | | 811,973 | |
| | | | | | | | |
| | | | | | | 4,826,234 | |
| | |
| | Media – 0.1% | |
| | 5,423 | | | World Wrestling Entertainment, Inc. Class A | | | 96,692 | |
| | |
| | Metals & Mining – 1.6% | |
| | 19,354 | | | Carpenter Technology Corp. | | | 644,682 | |
| | 57,650 | | | Globe Specialty Metals, Inc. | | | 727,543 | |
| | 10,227 | | | Materion Corp. | | | 308,344 | |
| | 3,229 | | | Schnitzer Steel Industries, Inc. Class A | | | 54,441 | |
| | 8,188 | | | SunCoke Energy, Inc. | | | 40,612 | |
| | 5,393 | | | Worthington Industries, Inc. | | | 165,565 | |
| | | | | | | | |
| | | | | | | 1,941,187 | |
| | |
| | Oil, Gas & Consumable Fuels – 3.0% | |
| | 36,240 | | | Alon USA Energy, Inc. | | | 607,020 | |
| | 22,801 | | | Bill Barrett Corp.*(b) | | | 111,041 | |
| | 27,582 | | | Delek US Holdings, Inc. | | | 750,230 | |
| | 11,293 | | | Gener8 Maritime, Inc.* | | | 117,447 | |
| | 21,113 | | | Green Plains, Inc. | | | 433,028 | |
| | 3,496 | | | REX American Resources Corp.* | | | 191,965 | |
| | 5,785 | | | SemGroup Corp. Class A | | | 263,507 | |
| | 39,395 | | | W&T Offshore, Inc. | | | 128,428 | |
| | 25,132 | | | Western Refining, Inc.(a) | | | 1,045,994 | |
| | | | | | | | |
| | | | | | | 3,648,660 | |
| | |
| | Paper & Forest Products – 0.2% | |
| | 6,557 | | | Schweitzer-Mauduit International, Inc. | | | 254,543 | |
| | |
| | Personal Products* – 0.3% | |
| | 2,730 | | | USANA Health Sciences, Inc. | | | 351,078 | |
| | |
| | Pharmaceuticals – 2.5% | |
| | 22,246 | | | Amphastar Pharmaceuticals, Inc.* | | | 263,393 | |
| | 21,298 | | | Phibro Animal Health Corp. Class A | | | 710,501 | |
| | 20,523 | | | Prestige Brands Holdings, Inc.* | | | 1,005,832 | |
| | 25,418 | | | Sagent Pharmaceuticals, Inc.* | | | 427,277 | |
| | 12,815 | | | SciClone Pharmaceuticals, Inc.* | | | 97,650 | |
| | |
| | Common Stocks – (continued) | |
| | Pharmaceuticals – (continued) | |
| | 23,834 | | | Sucampo Pharmaceuticals, Inc. Class A* | | $ | 461,426 | |
| | 7,641 | | | Supernus Pharmaceuticals, Inc.* | | | 126,077 | |
| | | | | | | | |
| | | | | | | 3,092,156 | |
| | |
| | Professional Services – 2.5% | |
| | 2,914 | | | Heidrick & Struggles International, Inc. | | | 77,396 | |
| | 16,740 | | | Insperity, Inc. | | | 777,740 | |
| | 21,974 | | | Korn/Ferry International | | | 799,194 | |
| | 27,001 | | | TrueBlue, Inc.* | | | 782,219 | |
| | 14,534 | | | WageWorks, Inc.* | | | 697,923 | |
| | | | | | | | |
| | | | | | | 3,134,472 | |
| | |
| | Real Estate Investment Trusts – 4.4% | |
| | 62,513 | | | Anworth Mortgage Asset Corp. | | | 298,187 | |
| | 16,739 | | | Coresite Realty Corp. | | | 919,808 | |
| | 43,049 | | | CubeSmart | | | 1,197,623 | |
| | 30,024 | | | CyrusOne, Inc. | | | 1,059,247 | |
| | 25,218 | | | DuPont Fabros Technology, Inc. | | | 809,246 | |
| | 13,071 | | | Kite Realty Group Trust | | | 345,205 | |
| | 8,651 | | | PS Business Parks, Inc. | | | 742,169 | |
| | | | | | | | |
| | | | | | | 5,371,485 | |
| | |
| | Real Estate Management & Development* – 0.2% | |
| | 4,923 | | | Marcus & Millichap, Inc. | | | 214,495 | |
| | |
| | Road & Rail – 0.3% | |
| | 13,284 | | | ArcBest Corp. | | | 344,056 | |
| | |
| | Semiconductors & Semiconductor Equipment – 3.8% | |
| | 25,546 | | | Advanced Energy Industries, Inc.* | | | 722,441 | |
| | 12,002 | | | Ambarella, Inc.*(b) | | | 593,379 | |
| | 17,630 | | | Cabot Microelectronics Corp.* | | | 743,457 | |
| | 22,789 | | | Cirrus Logic, Inc.* | | | 702,585 | |
| | 1,945 | | | Integrated Device Technology, Inc.* | | | 49,597 | |
| | 23,639 | | | Microsemi Corp.* | | | 851,240 | |
| | 29,825 | | | PMC-Sierra, Inc.* | | | 355,514 | |
| | 13,229 | | | Power Integrations, Inc. | | | 669,520 | |
| | | | | | | | |
| | | | | | | 4,687,733 | |
| | |
| | Software – 6.8% | |
| | 3,100 | | | Blackbaud, Inc. | | | 194,339 | |
| | 26,637 | | | EPIQ Systems, Inc. | | | 367,591 | |
| | 11,469 | | | Fair Isaac Corp. | | | 1,059,392 | |
| | 27,557 | | | Gigamon, Inc.* | | | 722,820 | |
| | 3,309 | | | Imperva, Inc.* | | | 233,682 | |
| | 31,981 | | | Infoblox, Inc.* | | | 521,610 | |
| | 20,845 | | | Manhattan Associates, Inc.* | | | 1,518,558 | |
| | 1,993 | | | MicroStrategy, Inc. Class A* | | | 342,935 | |
| | 22,233 | | | Pegasystems, Inc. | | | 620,078 | |
| | 3,309 | | | QAD, Inc. Class A | | | 84,512 | |
| | 14,184 | | | Qlik Technologies, Inc.* | | | 444,952 | |
| | 23,356 | | | Take-Two Interactive Software, Inc.* | | | 775,419 | |
| | 8,355 | | | Tyler Technologies, Inc.* | | | 1,423,358 | |
| | | | | | | | |
| | | | | | | 8,309,246 | |
| | |
| | |
| 58 | | The accompanying notes are an integral part of these financial statements. |
GOLDMAN SACHS SMALL CAP GROWTH INSIGHTS FUND
| | | | | | | | |
Shares | | | Description | | Value | |
| | Common Stocks – (continued) | |
| | Specialty Retail – 1.6% | |
| | 1,745 | | | Lithia Motors, Inc. Class A | | $ | 204,846 | |
| | 38,727 | | | Pier 1 Imports, Inc.(b) | | | 287,354 | |
| | 25,747 | | | Select Comfort Corp.* | | | 545,837 | |
| | 18,682 | | | The Cato Corp. Class A | | | 705,432 | |
| | 11,013 | | | Zumiez, Inc.* | | | 192,507 | |
| | | | | | | | |
| | | | | | | 1,935,976 | |
| | |
| | Textiles, Apparel & Luxury Goods – 0.8% | |
| | 7,922 | | | G-III Apparel Group Ltd.* | | | 436,423 | |
| | 30,329 | | | Wolverine World Wide, Inc. | | | 563,209 | |
| | | | | | | | |
| | | | | | | 999,632 | |
| | |
| | Thrifts & Mortgage Finance – 0.5% | |
| | 1,022 | | | BofI Holding, Inc.* | | | 81,770 | |
| | 52,149 | | | Brookline Bancorp, Inc. | | | 591,891 | |
| | | | | | | | |
| | | | | | | 673,661 | |
| | |
| | Trading Companies & Distributors* – 0.8% | |
| | 9,560 | | | Beacon Roofing Supply, Inc. | | | 338,328 | |
| | 1,893 | | | DXP Enterprises, Inc. | | | 57,282 | |
| | 36,065 | | | Univar, Inc. | | | 636,908 | |
| | | | | | | | |
| | | | | | | 1,032,518 | |
| | |
| | Wireless Telecommunication Services – 0.1% | |
| | 1,364 | | | Shenandoah Telecommunications Co. | | | 63,822 | |
| | |
| | TOTAL COMMON STOCKS | |
| | (Cost $118,687,428) | | $ | 119,385,893 | |
| | |
| | | | | | | | | | |
Principal
Amount | | Interest
Rate | | Maturity
Date | | | Value | |
| Short-term Investment(c) – 2.6% | |
| Repurchase Agreements – 2.6% | | | | | |
Joint Repurchase Agreement Account II | | | | | |
| $3,200,000 | | 0.092% | | | 11/02/15 | | | $ | 3,200,000 | |
| (Cost $3,200,000) | | | | | | | | |
| |
TOTAL INVESTMENTS BEFORE SECURITIES
LENDING REINVESTMENT VEHICLE | |
| (Cost $121,887,428) | | | | | | $ | 122,585,893 | |
| |
| | | | | | |
| Shares | | Rate | | Value | |
| Securities Lending Reinvestment Vehicle(d)(e) – 2.8% | |
Goldman Sachs Financial Square Money Market Fund – FST Shares | |
| 3,384,225 | | 0.159% | | $ | 3,384,225 | |
| (Cost $3,384,225) | | | | |
| |
| TOTAL INVESTMENTS – 102.7% | |
| (Cost $125,271,653) | | $ | 125,970,118 | |
| |
LIABILITIES IN EXCESS OF
OTHER ASSETS – (2.7)% | | | (3,343,769 | ) |
| |
| NET ASSETS – 100.0% | | $ | 122,626,349 | |
| |
| | |
| The percentage shown for each investment category reflects the value of investments in that category as a percentage of net assets. |
* | | Non-income producing security. |
(a) | | All or a portion of security is segregated as collateral for initial margin requirements on futures transactions. |
(b) | | All or a portion of security is on loan. |
(c) | | Joint repurchase agreement was entered into on October 30, 2015. Additional information appears on page 67. |
(d) | | Variable rate security. Interest rate or distribution rate disclosed is that which is in effect on October 31, 2015. |
(e) | | Represents an Affiliated Issuer. |
|
| ADDITIONAL INVESTMENT INFORMATION |
FUTURES CONTRACTS — At October 31, 2015, the Fund had the following futures contracts:
| | | | | | | | | | |
| Type | | Number of
Contracts
Long (Short) | | | Expiration
Date | | Current
Value | | Unrealized
Gain (Loss) |
Russell 2000 Mini Index | | | 15 | | | December 2015 | | $1,737,450 | | $87,551 |
| | |
| The accompanying notes are an integral part of these financial statements. | | 59 |
GOLDMAN SACHS SMALL CAP VALUE INSIGHTS FUND
Schedule of Investments
October 31, 2015
| | | | | | | | |
Shares | | | Description | | Value | |
| | | | | | | | |
| | Common Stocks – 97.7% | |
| | Aerospace & Defense – 0.8% | |
| | 47,252 | | | DigitalGlobe, Inc.* | | $ | 705,473 | |
| | 8,277 | | | Ducommun, Inc.* | | | 179,114 | |
| | 2,859 | | | National Presto Industries, Inc. | | | 251,735 | |
| | | | | | | | |
| | | | | | | 1,136,322 | |
| | |
| | Air Freight & Logistics* – 0.9% | |
| | 37,257 | | | Air Transport Services Group, Inc. | | | 364,746 | |
| | 22,682 | | | Atlas Air Worldwide Holdings, Inc. | | | 935,406 | |
| | | | | | | | |
| | | | | | | 1,300,152 | |
| | |
| | Auto Components – 1.3% | |
| | 28,886 | | | Cooper Tire & Rubber Co. | | | 1,207,146 | |
| | 32,950 | | | Modine Manufacturing Co.* | | | 275,791 | |
| | 10,765 | | | Tower International, Inc. | | | 295,715 | |
| | | | | | | | |
| | | | | | | 1,778,652 | |
| | |
| | Biotechnology – 2.3% | |
| | 3,495 | | | Anacor Pharmaceuticals, Inc.* | | | 392,873 | |
| | 72,176 | | | Array BioPharma, Inc.* | | | 369,541 | |
| | 1,348 | | | Cepheid, Inc.* | | | 45,023 | |
| | 26,857 | | | Emergent Biosolutions, Inc.* | | | 863,453 | |
| | 18,394 | | | Halozyme Therapeutics, Inc.* | | | 287,866 | |
| | 28,118 | | | Infinity Pharmaceuticals, Inc.* | | | 291,021 | |
| | 147,263 | | | PDL BioPharma, Inc.(a) | | | 674,465 | |
| | 8,242 | | | Repligen Corp.* | | | 273,964 | |
| | | | | | | | |
| | | | | | | 3,198,206 | |
| | |
| | Building Products – 0.8% | |
| | 15,220 | | | Universal Forest Products, Inc. | | | 1,105,429 | |
| | |
| | Capital Markets – 1.5% | |
| | 31,949 | | | Investment Technology Group, Inc. | | | 511,503 | |
| | 31,922 | | | Janus Capital Group, Inc. | | | 495,749 | |
| | 22,082 | | | Stifel Financial Corp.* | | | 981,103 | |
| | | | | | | | |
| | | | | | | 1,988,355 | |
| | |
| | Chemicals – 2.3% | |
| | 14,171 | | | A. Schulman, Inc. | | | 508,597 | |
| | 30,291 | | | FutureFuel Corp. | | | 466,784 | |
| | 18,693 | | | Innophos Holdings, Inc. | | | 794,266 | |
| | 7,319 | | | Intrepid Potash, Inc.* | | | 28,251 | |
| | 7,078 | | | Kraton Performance Polymers, Inc.* | | | 144,320 | |
| | 13,180 | | | Sensient Technologies Corp. | | | 860,259 | |
| | 7,150 | | | Stepan Co. | | | 378,450 | |
| | | | | | | | |
| | | | | | | 3,180,927 | |
| | |
| | Commercial Banks – 12.9% | |
| | 18,697 | | | 1st Source Corp. | | | 593,817 | |
| | 1,626 | | | Bancfirst Corp. | | | 100,210 | |
| | 6,184 | | | Banco Latinoamericano de Comercio Exterior SA Class E | | | 167,154 | |
| | 10,092 | | | Banner Corp. | | | 495,214 | |
| | 34,947 | | | Central Pacific Financial Corp. | | | 781,415 | |
| | 11,046 | | | Chemical Financial Corp. | | | 374,791 | |
| | 2,853 | | | City Holding Co.(a) | | | 136,459 | |
| | 30,316 | | | Columbia Banking System, Inc. | | | 1,010,129 | |
| | |
| | | | | | | | |
| | Common Stocks – (continued) | |
| | Commercial Banks – (continued) | |
| | 67,638 | | | CVB Financial Corp. | | $ | 1,180,283 | |
| | 24,375 | | | FCB Financial Holdings, Inc. Class A* | | | 866,775 | |
| | 4,077 | | | First Citizens BancShares, Inc. Class A | | | 1,044,283 | |
| | 7,632 | | | First Financial Bancorp | | | 147,145 | |
| | 34,108 | | | First Interstate BancSystem, Inc. | | | 967,303 | |
| | 36,675 | | | First Merchants Corp. | | | 961,985 | |
| | 50,203 | | | First Midwest Bancorp, Inc. | | | 894,617 | |
| | 18,526 | | | Flushing Financial Corp. | | | 389,787 | |
| | 9,256 | | | Great Southern Bancorp, Inc. | | | 447,342 | |
| | 2,703 | | | Heartland Financial USA, Inc. | | | 99,579 | |
| | 112,378 | | | Investors Bancorp, Inc. | | | 1,405,849 | |
| | 78,581 | | | National Penn Bancshares, Inc. | | | 946,115 | |
| | 57,321 | | | OFG Bancorp(a) | | | 527,926 | |
| | 25,088 | | | PrivateBancorp, Inc. | | | 1,049,431 | |
| | 2,004 | | | Renasant Corp. | | | 69,399 | |
| | 3,912 | | | TriCo Bancshares | | | 103,120 | |
| | 6,310 | | | Trustmark Corp. | | | 151,629 | |
| | 75,868 | | | Umpqua Holdings Corp. | | | 1,266,996 | |
| | 41,794 | | | United Community Banks, Inc. | | | 842,567 | |
| | 19,084 | | | WesBanco, Inc. | | | 623,093 | |
| | 3,125 | | | Western Alliance Bancorp* | | | 111,719 | |
| | | | | | | | |
| | | | | | | 17,756,132 | |
| | |
| | Commercial Services & Supplies – 2.2% | |
| | 32,933 | | | ABM Industries, Inc. | | | 935,297 | |
| | 3,425 | | | Essendant, Inc. | | | 118,402 | |
| | 11,705 | | | G&K Services, Inc. Class A | | | 770,423 | |
| | 47,710 | | | Kimball International, Inc. Class B | | | 520,993 | |
| | 55,693 | | | Quad Graphics, Inc. | | | 718,440 | |
| | | | | | | | |
| | | | | | | 3,063,555 | |
| | |
| | Communications Equipment – 2.2% | |
| | 19,659 | | | Calix, Inc.* | | | 137,416 | |
| | 4,846 | | | Comtech Telecommunications Corp. | | | 117,079 | |
| | 70,601 | | | Harmonic, Inc.* | | | 406,662 | |
| | 24,372 | | | Ixia* | | | 351,200 | |
| | 27,904 | | | NETGEAR, Inc.* | | | 1,155,226 | |
| | 62,602 | | | Polycom, Inc.* | | | 862,656 | |
| | | | | | | | |
| | | | | | | 3,030,239 | |
| | |
| | Computers & Peripherals* – 0.7% | |
| | 76,725 | | | QLogic Corp. | | | 951,390 | |
| | |
| | Construction & Engineering – 2.7% | |
| | 43,876 | | | Aegion Corp.* | | | 846,368 | |
| | 19,691 | | | Comfort Systems USA, Inc. | | | 628,733 | |
| | 25,913 | | | EMCOR Group, Inc. | | | 1,251,080 | |
| | 27,708 | | | Granite Construction, Inc. | | | 909,931 | |
| | | | | | | | |
| | | | | | | 3,636,112 | |
| | |
| | Construction Materials* – 0.5% | |
| | 33,282 | | | Headwaters, Inc. | | | 683,945 | |
| | |
| | Consumer Finance – 2.0% | |
| | 34,435 | | | Cash America International, Inc. | | | 1,189,041 | |
| | 21,854 | | | Enova International, Inc.* | | | 284,102 | |
| | |
| | |
| 60 | | The accompanying notes are an integral part of these financial statements. |
GOLDMAN SACHS SMALL CAP VALUE INSIGHTS FUND
| | | | | | | | |
Shares | | | Description | | Value | |
| | | | | | | | |
| | Common Stocks – (continued) | |
| | Consumer Finance – (continued) | |
| | 68,482 | | | EZCORP, Inc. Class A* | | $ | 456,090 | |
| | 22,422 | | | Nelnet, Inc. Class A | | | 802,259 | |
| | | | | | | | |
| | | | | | | 2,731,492 | |
| | |
| | Containers & Packaging* – 0.8% | |
| | 31,779 | | | Berry Plastics Group, Inc. | | | 1,064,597 | |
| | |
| | Diversified Consumer Services* – 2.1% | |
| | 41,002 | | | Apollo Education Group, Inc. | | | 297,674 | |
| | 29,421 | | | Bridgepoint Education, Inc. | | | 228,013 | |
| | 50,833 | | | Houghton Mifflin Harcourt Co. | | | 995,818 | |
| | 37,415 | | | K12, Inc. | | | 363,300 | |
| | 57,427 | | | Regis Corp. | | | 948,694 | |
| | | | | | | | |
| | | | | | | 2,833,499 | |
| | |
| | Diversified Telecommunication Services* – 0.6% | |
| | 141,115 | | | Vonage Holdings Corp. | | | 856,568 | |
| | |
| | Electric Utilities – 0.9% | |
| | 20,978 | | | Cleco Corp. | | | 1,111,834 | |
| | 2,472 | | | MGE Energy, Inc. | | | 102,019 | |
| | | | | | | | |
| | | | | | | 1,213,853 | |
| | |
| | Electrical Equipment – 0.7% | |
| | 41,938 | | | General Cable Corp. | | | 645,426 | |
| | 26,942 | | | LSI Industries, Inc. | | | 289,357 | |
| | | | | | | | |
| | | | | | | 934,783 | |
| | |
| | Electronic Equipment, Instruments & Components – 3.9% | |
| | 12,937 | | | Benchmark Electronics, Inc.* | | | 255,894 | |
| | 30,679 | | | Insight Enterprises, Inc.* | | | 779,247 | |
| | 28,883 | | | Kimball Electronics, Inc.* | | | 328,978 | |
| | 12,529 | | | OSI Systems, Inc.* | | | 1,079,749 | |
| | 5,575 | | | Plexus Corp.* | | | 193,007 | |
| | 3,081 | | | ScanSource, Inc.* | | | 106,325 | |
| | 11,937 | | | SYNNEX Corp. | | | 1,055,708 | |
| | 14,970 | | | Tech Data Corp.* | | | 1,089,666 | |
| | 59,317 | | | TTM Technologies, Inc.* | | | 433,014 | |
| | | | | | | | |
| | | | | | | 5,321,588 | |
| | |
| | Energy Equipment & Services – 0.9% | |
| | 1,971 | | | Bristow Group, Inc. | | | 68,453 | |
| | 32,396 | | | Oil States International, Inc.* | | | 972,204 | |
| | 63,563 | | | Pioneer Energy Services Corp.* | | | 146,830 | |
| | 1,680 | | | SEACOR Holdings, Inc.* | | | 98,146 | |
| | | | | | | | |
| | | | | | | 1,285,633 | |
| | |
| | Food & Staples Retailing – 0.8% | |
| | 11,294 | | | Ingles Markets, Inc. Class A | | | 564,022 | |
| | 18,171 | | | SpartanNash Co. | | | 506,971 | |
| | | | | | | | |
| | | | | | | 1,070,993 | |
| | |
| | Food Products – 0.5% | |
| | 2,811 | | | J&J Snack Foods Corp. | | | 345,163 | |
| | 2,543 | | | Lancaster Colony Corp. | | | 289,190 | |
| | | | | | | | |
| | | | | | | 634,353 | |
| | |
| | | | | | | | |
| | Common Stocks – (continued) | |
| | Gas Utilities – 2.1% | |
| | 7,781 | | | Chesapeake Utilities Corp. | | $ | 406,246 | |
| | 37,466 | | | New Jersey Resources Corp. | | | 1,186,923 | |
| | 1,651 | | | Northwest Natural Gas Co. | | | 78,868 | |
| | 14,926 | | | Southwest Gas Corp. | | | 917,352 | |
| | 5,755 | | | WGL Holdings, Inc. | | | 358,134 | |
| | | | | | | | |
| | | | | | | 2,947,523 | |
| | |
| | Health Care Equipment & Supplies – 1.5% | |
| | 2,505 | | | Cantel Medical Corp. | | | 148,497 | |
| | 6,106 | | | CONMED Corp. | | | 247,659 | |
| | 800 | | | ICU Medical, Inc.* | | | 87,976 | |
| | 5,139 | | | Meridian Bioscience, Inc. | | | 97,692 | |
| | 32,337 | | | Merit Medical Systems, Inc.* | | | 599,528 | |
| | 16,081 | | | Natus Medical, Inc.* | | | 732,168 | |
| | 1,624 | | | Orthofix International NV* | | | 55,297 | |
| | 2,632 | | | SurModics, Inc.* | | | 56,141 | |
| | | | | | | | |
| | | | | | | 2,024,958 | |
| | |
| | Health Care Providers & Services* – 1.1% | |
| | 3,895 | | | Amedisys, Inc. | | | 154,164 | |
| | 18,228 | | | Magellan Health, Inc. | | | 973,375 | |
| | 17,017 | | | Triple-S Management Corp. Class B | | | 350,380 | |
| | | | | | | | |
| | | | | | | 1,477,919 | |
| | |
| | Health Care Technology – 0.5% | |
| | 50,437 | | | Quality Systems, Inc. | | | 708,640 | |
| | |
| | Hotels, Restaurants & Leisure – 3.1% | |
| | 10,848 | | | BJ’s Restaurants, Inc.* | | | 465,705 | |
| | 19,469 | | | Boyd Gaming Corp.* | | | 389,185 | |
| | 66,348 | | | Denny’s Corp.* | | | 727,174 | |
| | 11,714 | | | Isle of Capri Casinos, Inc.* | | | 224,089 | |
| | 9,460 | | | Jack in the Box, Inc. | | | 705,054 | |
| | 11,678 | | | Papa John’s International, Inc. | | | 819,445 | |
| | 30,398 | | | Sonic Corp. | | | 867,559 | |
| | | | | | | | |
| | | | | | | 4,198,211 | |
| | |
| | Household Durables – 1.8% | |
| | 10,798 | | | Cavco Industries, Inc.* | | | 1,064,683 | |
| | 6,605 | | | CSS Industries, Inc. | | | 180,317 | |
| | 30,573 | | | Ethan Allen Interiors, Inc. | | | 831,891 | |
| | 11,557 | | | La-Z-Boy, Inc. | | | 329,952 | |
| | | | | | | | |
| | | | | | | 2,406,843 | |
| | |
| | Household Products* – 0.1% | |
| | 11,714 | | | Central Garden & Pet Co. Class A | | | 197,732 | |
| | |
| | Independent Power Producers & Energy Traders – 0.8% | |
| | 7,890 | | | Ormat Technologies, Inc. | | | 297,611 | |
| | 89,723 | | | Talen Energy Corp.* | | | 778,795 | |
| | | | | | | | |
| | | | | | | 1,076,406 | |
| | |
| | Insurance – 4.4% | |
| | 40,107 | | | American Equity Investment Life Holding Co. | | | 1,029,948 | |
| | 18,749 | | | Argo Group International Holdings Ltd. | | | 1,172,187 | |
| | 14,697 | | | Employers Holdings, Inc. | | | 389,029 | |
| | 5,998 | | | Heritage Insurance Holdings, Inc.* | | | 132,676 | |
| | |
| | |
| The accompanying notes are an integral part of these financial statements. | | 61 |
GOLDMAN SACHS SMALL CAP VALUE INSIGHTS FUND
Schedule of Investments (continued)
October 31, 2015
| | | | | | | | |
Shares | | | Description | | Value | |
| | | | | | | | |
| | Common Stocks – (continued) | |
| | Insurance – (continued) | |
| | 57,144 | | | Maiden Holdings Ltd. | | $ | 888,589 | |
| | 2,124 | | | Primerica, Inc. | | | 101,166 | |
| | 20,034 | | | Selective Insurance Group, Inc. | | | 731,041 | |
| | 8,616 | | | Stewart Information Services Corp. | | | 346,105 | |
| | 25,651 | | | Symetra Financial Corp. | | | 813,906 | |
| | 12,483 | | | United Fire Group, Inc. | | | 464,243 | |
| | | | | | | | |
| | | | | | | 6,068,890 | |
| | |
| | Internet & Catalog Retail – 0.4% | |
| | 22,871 | | | Nutrisystem, Inc. | | | 529,006 | |
| | |
| | Internet Software & Services – 1.7% | |
| | 37,306 | | | Blucora, Inc.* | | | 365,599 | |
| | 27,403 | | | Constant Contact, Inc.* | | | 715,218 | |
| | 37,503 | | | EarthLink Holdings Corp. | | | 320,651 | |
| | 25,877 | | | Marchex, Inc. Class B | | | 111,788 | |
| | 22,699 | | | Monster Worldwide, Inc.* | | | 142,323 | |
| | 29,828 | | | Web.com Group, Inc.* | | | 700,063 | |
| | | | | | | | |
| | | | | | | 2,355,642 | |
| | |
| | IT Services – 0.7% | |
| | 20,357 | | | ManTech International Corp. Class A | | | 588,317 | |
| | 14,356 | | | Sykes Enterprises, Inc.* | | | 416,324 | |
| | | | | | | | |
| | | | | | | 1,004,641 | |
| | |
| | Machinery – 3.7% | |
| | 26,911 | | | Barnes Group, Inc. | | | 1,011,585 | |
| | 3,808 | | | Briggs & Stratton Corp. | | | 67,668 | |
| | 55,998 | | | Federal Signal Corp. | | | 843,330 | |
| | 11,162 | | | Hyster-Yale Materials Handling, Inc. | | | 653,200 | |
| | 7,009 | | | John Bean Technologies Corp. | | | 314,424 | |
| | 7,378 | | | Kadant, Inc. | | | 303,383 | |
| | 6,120 | | | Milacron Holdings Corp.* | | | 104,468 | |
| | 13,414 | | | Miller Industries, Inc. | | | 304,230 | |
| | 24,505 | | | Mueller Industries, Inc. | | | 772,398 | |
| | 794 | | | Tennant Co. | | | 45,988 | |
| | 59,224 | | | Wabash National Corp.* | | | 708,911 | |
| | | | | | | | |
| | | | | | | 5,129,585 | |
| | |
| | Media* – 0.1% | |
| | 13,330 | | | Entercom Communications Corp. Class A | | | 147,163 | |
| | |
| | Metals & Mining – 2.0% | |
| | 30,662 | | | Carpenter Technology Corp. | | | 1,021,351 | |
| | 4,050 | | | Globe Specialty Metals, Inc. | | | 51,111 | |
| | 24,831 | | | Materion Corp. | | | 748,655 | |
| | 34,209 | | | Schnitzer Steel Industries, Inc. Class A | | | 576,764 | |
| | 9,585 | | | Worthington Industries, Inc. | | | 294,259 | |
| | | | | | | | |
| | | | | | | 2,692,140 | |
| | |
| | Oil, Gas & Consumable Fuels – 3.2% | |
| | 46,949 | | | Alon USA Energy, Inc.(b) | | | 786,396 | |
| | 17,296 | | | Contango Oil & Gas Co.* | | | 132,314 | |
| | 31,031 | | | Delek US Holdings, Inc. | | | 844,043 | |
| | 18,805 | | | Gener8 Maritime, Inc.* | | | 195,572 | |
| | 37,502 | | | Green Plains, Inc. | | | 769,166 | |
| | |
| | | | | | | | |
| | Common Stocks – (continued) | |
| | Oil, Gas & Consumable Fuels – (continued) | |
| | 16,026 | | | Nordic American Tankers Ltd.(a) | | $ | 244,877 | |
| | 3,299 | | | Par Pacific Holdings, Inc.* | | | 75,217 | |
| | 8,302 | | | REX American Resources Corp.* | | | 455,863 | |
| | 22,267 | | | Scorpio Tankers, Inc. | | | 203,075 | |
| | 16,248 | | | Western Refining, Inc. | | | 676,242 | |
| | | | | | | | |
| | | | | | | 4,382,765 | |
| | |
| | Paper & Forest Products – 0.4% | |
| | 13,479 | | | Schweitzer-Mauduit International, Inc. | | | 523,255 | |
| | |
| | Professional Services – 1.5% | |
| | 14,377 | | | CDI Corp. | | | 115,016 | |
| | 8,101 | | | Heidrick & Struggles International, Inc. | | | 215,163 | |
| | 1,192 | | | Huron Consulting Group, Inc.* | | | 57,574 | |
| | 14,676 | | | Insperity, Inc. | | | 681,847 | |
| | 27,939 | | | Korn/Ferry International | | | 1,016,141 | |
| | | | | | | | |
| | | | | | | 2,085,741 | |
| | |
| | Real Estate Investment Trusts – 15.1% | |
| | 21,621 | | | American Assets Trust, Inc. | | | 911,541 | |
| | 36,367 | | | American Capital Mortgage Investment Corp. | | | 527,685 | |
| | 158,457 | | | Anworth Mortgage Asset Corp. | | | 755,840 | |
| | 15,576 | | | Coresite Realty Corp. | | | 855,901 | |
| | 107,947 | | | Cousins Properties, Inc. | | | 1,083,788 | |
| | 36,610 | | | CubeSmart | | | 1,018,490 | |
| | 26,131 | | | CyrusOne, Inc. | | | 921,902 | |
| | 34,988 | | | DCT Industrial Trust, Inc. | | | 1,298,755 | |
| | 31,593 | | | DuPont Fabros Technology, Inc. | | | 1,013,819 | |
| | 99,956 | | | FelCor Lodging Trust, Inc. | | | 804,646 | |
| | 50,162 | | | First Industrial Realty Trust, Inc. | | | 1,087,512 | |
| | 22,921 | | | Getty Realty Corp. | | | 386,907 | |
| | 7,478 | | | Highwoods Properties, Inc. | | | 324,919 | |
| | 32,157 | | | Hudson Pacific Properties, Inc. | | | 918,726 | |
| | 58,019 | | | Invesco Mortgage Capital, Inc. | | | 699,129 | |
| | 40,315 | | | Kite Realty Group Trust | | | 1,064,719 | |
| | 6,434 | | | LaSalle Hotel Properties | | | 189,224 | |
| | 48,111 | | | Mack-Cali Realty Corp. | | | 1,046,895 | |
| | 35,276 | | | New Residential Investment Corp. | | | 427,898 | |
| | 136,826 | | | New York Mortgage Trust, Inc.(a) | | | 777,172 | |
| | 15,058 | | | Pebblebrook Hotel Trust | | | 514,682 | |
| | 12,260 | | | PS Business Parks, Inc. | | | 1,051,785 | |
| | 15,419 | | | QTS Realty Trust, Inc. Class A | | | 663,171 | |
| | 22,414 | | | Ramco-Gershenson Properties Trust | | | 376,555 | |
| | 36,123 | | | Rouse Properties, Inc.(a) | | | 635,404 | |
| | 7,862 | | | Sovran Self Storage, Inc. | | | 785,178 | |
| | 57,330 | | | Western Asset Mortgage Capital Corp.(a) | | | 654,709 | |
| | | | | | | | |
| | | | | | | 20,796,952 | |
| | |
| | Real Estate Management & Development – 0.8% | |
| | 27,175 | | | Alexander & Baldwin, Inc. | | | 1,025,585 | |
| | |
| | Road & Rail – 0.2% | |
| | 12,635 | | | ArcBest Corp. | | | 327,247 | |
| | |
| | |
| 62 | | The accompanying notes are an integral part of these financial statements. |
GOLDMAN SACHS SMALL CAP VALUE INSIGHTS FUND
| | | | | | | | |
Shares | | | Description | | Value | |
| | | | | | | | |
| | Common Stocks – (continued) | |
| | Semiconductors & Semiconductor Equipment – 0.8% | |
| | 9,779 | | | Advanced Energy Industries, Inc.* | | $ | 276,550 | |
| | 14,947 | | | Cabot Microelectronics Corp.* | | | 630,315 | |
| | 4,651 | | | Power Integrations, Inc. | | | 235,387 | |
| | | | | | | | |
| | | | | | | 1,142,252 | |
| | |
| | Software – 0.6% | |
| | 24,391 | | | Progress Software Corp.* | | | 592,213 | |
| | 10,255 | | | QAD, Inc. Class A | | | 261,913 | |
| | | | | | | | |
| | | | | | | 854,126 | |
| | |
| | Specialty Retail – 0.9% | |
| | 23,142 | | | Stage Stores, Inc. | | | 225,172 | |
| | 22,634 | | | The Cato Corp. Class A | | | 854,660 | |
| | 7,407 | | | Zumiez, Inc.* | | | 129,474 | |
| | | | | | | | |
| | | | | | | 1,209,306 | |
| | |
| | Thrifts & Mortgage Finance – 3.9% | |
| | 44,572 | | | Beneficial Bancorp, Inc.* | | | 618,214 | |
| | 87,328 | | | Brookline Bancorp, Inc. | | | 991,173 | |
| | 46,677 | | | Dime Community Bancshares, Inc. | | | 809,846 | |
| | 4,708 | | | Flagstar Bancorp, Inc.* | | | 104,706 | |
| | 53,214 | | | Northfield Bancorp, Inc. | | | 815,238 | |
| | 56,126 | | | Oritani Financial Corp. | | | 893,526 | |
| | 8,498 | | | TrustCo Bank Corp. NY | | | 52,942 | |
| | 43,097 | | | Washington Federal, Inc. | | | 1,074,839 | |
| | | | | | | | |
| | | | | | | 5,360,484 | |
| | |
| | Trading Companies & Distributors* – 1.2% | |
| | 25,260 | | | Beacon Roofing Supply, Inc. | | | 893,952 | |
| | 40,555 | | | Univar, Inc. | | | 716,201 | |
| | | | | | | | |
| | | | | | | 1,610,153 | |
| | |
| | Water Utilities – 0.6% | |
| | 37,095 | | | California Water Service Group | | | 829,444 | |
| | |
| | Wireless Telecommunication Services – 0.2% | |
| | 16,569 | | | Spok Holdings, Inc. | | | 298,739 | |
| | |
| | TOTAL COMMON STOCKS | |
| | (Cost $130,647,319) | | $ | 134,168,123 | |
| | |
| | | | | | | | | | |
Principal
Amount | | Interest
Rate | | Maturity
Date | | | Value | |
| Short-term Investment(c) – 2.5% | |
| Repurchase Agreements – 2.5% | | | | | |
Joint Repurchase Agreement Account II | | | | | |
| $3,500,000 | | 0.092% | | | 11/02/15 | | | $ | 3,500,000 | |
| (Cost $3,500,000) | | | | | | | | |
| |
TOTAL INVESTMENTS BEFORE SECURITIES
LENDING REINVESTMENT VEHICLE | |
| (Cost $134,147,319) | | | | | | $ | 137,668,123 | |
| |
| | | | | | |
| Shares | | Rate | | Value | |
| Securities Lending Reinvestment Vehicle(d)(e) – 2.3% | |
Goldman Sachs Financial Square Money Market Fund – FST Shares | |
| 3,158,375 | | 0.159% | | $ | 3,158,375 | |
| (Cost $3,158,375) | | | | |
| |
| TOTAL INVESTMENTS – 102.5% | |
| (Cost $137,305,694) | | $ | 140,826,498 | |
| |
LIABILITIES IN EXCESS OF
OTHER ASSETS – (2.5)% | | | (3,447,942 | ) |
| |
| NET ASSETS – 100.0% | | $ | 137,378,556 | |
| |
| | |
| The percentage shown for each investment category reflects the value of investments in that category as a percentage of net assets. |
* | | Non-income producing security. |
(a) | | All or a portion of security is on loan. |
(b) | | All or a portion of security is segregated as collateral for initial margin requirements on futures transactions. |
(c) | | Joint repurchase agreement was entered into on October 30, 2015. Additional information appears on page 67. |
(d) | | Variable rate security. Interest rate or distribution rate disclosed is that which is in effect on October 31, 2015. |
(e) | | Represents an Affiliated Issuer. |
|
| ADDITIONAL INVESTMENT INFORMATION |
FUTURES CONTRACTS — At October 31, 2015, the Fund had the following futures contracts:
| | | | | | | | | | | | | | | | |
| Type | | Number of
Contracts
Long (Short) | | | Expiration
Date | | | Current
Value | | | Unrealized
Gain (Loss) | |
Russell 2000 Mini Index | | | 20 | | | | December 2015 | | | $ | 2,316,600 | | | $ | 8,401 | |
| | |
| The accompanying notes are an integral part of these financial statements. | | 63 |
GOLDMAN SACHS U.S. EQUITY INSIGHTS FUND
Schedule of Investments
October 31, 2015
| | | | | | | | |
Shares | | | Description | | Value | |
| | | | | | | | |
| | Common Stocks – 96.2% | |
| | Aerospace & Defense – 1.0% | |
| | 44,630 | | | BE Aerospace, Inc. | | $ | 2,095,378 | |
| | 6,963 | | | General Dynamics Corp. | | | 1,034,563 | |
| | 14,568 | | | Huntington Ingalls Industries, Inc. | | | 1,747,286 | |
| | | | | | | | |
| | | | | | | 4,877,227 | |
| | |
| | Airlines – 1.8% | |
| | 38,926 | | | Alaska Air Group, Inc. | | | 2,968,108 | |
| | 108,367 | | | Delta Air Lines, Inc. | | | 5,509,378 | |
| | | | | | | | |
| | | | | | | 8,477,486 | |
| | |
| | Auto Components – 0.2% | |
| | 13,388 | | | Delphi Automotive PLC | | | 1,113,748 | |
| | |
| | Beverages – 4.3% | |
| | 47,025 | | | Coca-Cola Enterprises, Inc. | | | 2,414,263 | |
| | 27,771 | | | Constellation Brands, Inc. Class A | | | 3,743,531 | |
| | 36,234 | | | Dr. Pepper Snapple Group, Inc. | | | 3,238,233 | |
| | 17,412 | | | Monster Beverage Corp.* | | | 2,373,604 | |
| | 82,006 | | | PepsiCo., Inc. | | | 8,380,193 | |
| | | | | | | | |
| | | | | | | 20,149,824 | |
| | |
| | Biotechnology – 4.2% | |
| | 53,366 | | | AbbVie, Inc. | | | 3,177,945 | |
| | 3,297 | | | Amgen, Inc. | | | 521,520 | |
| | 13,595 | | | Biogen, Inc.* | | | 3,949,483 | |
| | 50,822 | | | Celgene Corp.* | | | 6,236,368 | |
| | 52,277 | | | Gilead Sciences, Inc. | | | 5,652,712 | |
| | | | | | | | |
| | | | | | | 19,538,028 | |
| | |
| | Capital Markets – 0.7% | |
| | 27,306 | | | Ameriprise Financial, Inc. | | | 3,150,020 | |
| | 4,256 | | | SEI Investments Co. | | | 220,546 | |
| | | | | | | | |
| | | | | | | 3,370,566 | |
| | |
| | Chemicals – 1.7% | |
| | 37,741 | | | Ecolab, Inc. | | | 4,542,130 | |
| | 35,741 | | | LyondellBasell Industries NV Class A | | | 3,320,696 | |
| | | | | | | | |
| | | | | | | 7,862,826 | |
| | |
| | Commercial Banks – 4.2% | |
| | 448,307 | | | Bank of America Corp. | | | 7,522,591 | |
| | 3,823 | | | Citigroup, Inc. | | | 203,269 | |
| | 153,854 | | | JPMorgan Chase & Co. | | | 9,885,120 | |
| | 7,686 | | | Synovus Financial Corp. | | | 243,108 | |
| | 33,638 | | | Wells Fargo & Co. | | | 1,821,161 | |
| | | | | | | | |
| | | | | | | 19,675,249 | |
| | |
| | Communications Equipment – 2.4% | |
| | 285,686 | | | Cisco Systems, Inc.(a) | | | 8,242,041 | |
| | 8,927 | | | F5 Networks, Inc.* | | | 983,755 | |
| | 20,746 | | | Juniper Networks, Inc. | | | 651,217 | |
| | 8,345 | | | Palo Alto Networks, Inc.* | | | 1,343,545 | |
| | | | | | | | |
| | | | | | | 11,220,558 | |
| | |
| | Computers & Peripherals – 3.0% | |
| | 116,808 | | | Apple, Inc. | | | 13,958,556 | |
| | |
| | | | | | | | |
| | Common Stocks – (continued) | |
| | Consumer Finance – 1.2% | |
| | 38,596 | | | American Express Co. | | $ | 2,827,543 | |
| | 35,755 | | | Capital One Financial Corp. | | | 2,821,069 | |
| | | | | | | | |
| | | | | | | 5,648,612 | |
| | |
| | Containers & Packaging – 0.5% | |
| | 43,794 | | | WestRock Co. | | | 2,354,365 | |
| | |
| | Diversified Financial Services – 1.0% | |
| | 14,878 | | | Berkshire Hathaway, Inc. Class B* | | | 2,023,706 | |
| | 43,026 | | | MSCI, Inc. | | | 2,882,742 | |
| | | | | | | | |
| | | | | | | 4,906,448 | |
| | |
| | Diversified Telecommunication Services – 3.6% | |
| | 216,201 | | | AT&T, Inc. | | | 7,244,895 | |
| | 201,642 | | | Verizon Communications, Inc. | | | 9,452,977 | |
| | | | | | | | |
| | | | | | | 16,697,872 | |
| | |
| | Electrical Equipment – 0.6% | |
| | 11,777 | | | Acuity Brands, Inc. | | | 2,574,452 | |
| | |
| | Electronic Equipment, Instruments & Components – 1.6% | |
| | 17,716 | | | Avnet, Inc. | | | 804,838 | |
| | 32,292 | | | CDW Corp. | | | 1,443,129 | |
| | 318,816 | | | Flextronics International Ltd.* | | | 3,631,314 | |
| | 59,261 | | | Ingram Micro, Inc. Class A | | | 1,764,793 | |
| | | | | | | | |
| | | | | | | 7,644,074 | |
| | |
| | Energy Equipment & Services – 0.3% | |
| | 22,829 | | | Baker Hughes, Inc. | | | 1,202,632 | |
| | |
| | Food & Staples Retailing – 1.8% | |
| | 71,527 | | | CVS Health Corp. | | | 7,065,437 | |
| | 35,111 | | | The Kroger Co. | | | 1,327,196 | |
| | | | | | | | |
| | | | | | | 8,392,633 | |
| | |
| | Food Products – 3.1% | |
| | 120,577 | | | ConAgra Foods, Inc. | | | 4,889,397 | |
| | 108,081 | | | Flowers Foods, Inc. | | | 2,918,187 | |
| | 93,390 | | | General Mills, Inc. | | | 5,426,893 | |
| | 14,260 | | | Kellogg Co. | | | 1,005,615 | |
| | 3,175 | | | Pinnacle Foods, Inc. | | | 139,954 | |
| | | | | | | | |
| | | | | | | 14,380,046 | |
| | |
| | Health Care Equipment & Supplies – 3.7% | |
| | 46,978 | | | Abbott Laboratories | | | 2,104,614 | |
| | 25,281 | | | C.R. Bard, Inc. | | | 4,711,114 | |
| | 120,600 | | | Hologic, Inc.* | | | 4,686,516 | |
| | 13,747 | | | Sirona Dental Systems, Inc.* | | | 1,500,210 | |
| | 45,404 | | | Stryker Corp. | | | 4,341,531 | |
| | | | | | | | |
| | | | | | | 17,343,985 | |
| | |
| | Health Care Providers & Services – 0.3% | |
| | 5,301 | | | Centene Corp.* | | | 315,303 | |
| | 6,311 | | | McKesson Corp. | | | 1,128,407 | |
| | | | | | | | |
| | | | | | | 1,443,710 | |
| | |
| | |
| 64 | | The accompanying notes are an integral part of these financial statements. |
GOLDMAN SACHS U.S. EQUITY INSIGHTS FUND
| | | | | | | | |
Shares | | | Description | | Value | |
| | | | | | | | |
| | Common Stocks – (continued) | |
| | Hotels, Restaurants & Leisure – 2.3% | |
| | 84,341 | | | Carnival Corp. | | $ | 4,561,161 | |
| | 100,576 | | | Starbucks Corp. | | | 6,293,041 | |
| | | | | | | | |
| | | | | | | 10,854,202 | |
| | |
| | Household Durables – 1.8% | |
| | 36,005 | | | D.R. Horton, Inc. | | | 1,059,987 | |
| | 56,104 | | | Leggett & Platt, Inc. | | | 2,526,363 | |
| | 24,433 | | | Mohawk Industries, Inc.* | | | 4,776,652 | |
| | | | | | | | |
| | | | | | | 8,363,002 | |
| | |
| | Household Products – 0.3% | |
| | 10,000 | | | Church & Dwight Co., Inc. | | | 860,900 | |
| | 9,325 | | | The Procter & Gamble Co. | | | 712,244 | |
| | | | | | | | |
| | | | | | | 1,573,144 | |
| | |
| | Independent Power Producers & Energy Traders – 0.9% | |
| | 75,855 | | | Calpine Corp.* | | | 1,176,511 | |
| | 157,713 | | | NRG Energy, Inc. | | | 2,032,921 | |
| | 103,392 | | | Talen Energy Corp.* | | | 897,442 | |
| | | | | | | | |
| | | | | | | 4,106,874 | |
| | |
| | Industrial Conglomerates – 0.6% | |
| | 97,107 | | | General Electric Co. | | | 2,808,334 | |
| | |
| | Insurance – 2.1% | |
| | 47,813 | | | Reinsurance Group of America, Inc. | | | 4,314,645 | |
| | 48,900 | | | The Travelers Cos., Inc. | | | 5,520,321 | |
| | | | | | | | |
| | | | | | | 9,834,966 | |
| | |
| | Internet & Catalog Retail – 2.1% | |
| | 10,426 | | | Amazon.com, Inc.* | | | 6,525,634 | |
| | 1,991 | | | Expedia, Inc. | | | 271,373 | |
| | 9,836 | | | Netflix, Inc.* | | | 1,066,026 | |
| | 1,334 | | | The Priceline Group, Inc.* | | | 1,939,956 | |
| | | | | | | | |
| | | | | | | 9,802,989 | |
| | |
| | Internet Software & Services* – 4.1% | |
| | 7,284 | | | Alphabet, Inc. Class A | | | 5,371,149 | |
| | 7,705 | | | Alphabet, Inc. Class C | | | 5,476,791 | |
| | 3,937 | | | CoStar Group, Inc. | | | 799,487 | |
| | 53,584 | | | Facebook, Inc. Class A | | | 5,463,960 | |
| | 44,285 | | | Rackspace Hosting, Inc. | | | 1,144,767 | |
| | 21,561 | | | Yahoo!, Inc. | | | 768,003 | |
| | | | | | | | |
| | | | | | | 19,024,157 | |
| | |
| | IT Services – 3.6% | |
| | 30,702 | | | Accenture PLC Class A | | | 3,291,254 | |
| | 44,837 | | | Automatic Data Processing, Inc. | | | 3,900,371 | |
| | 7,380 | | | Fidelity National Information Services, Inc. | | | 538,150 | |
| | 1,072 | | | Global Payments, Inc. | | | 146,231 | |
| | 40,400 | | | MasterCard, Inc. Class A | | | 3,999,196 | |
| | 96,989 | | | Vantiv, Inc. Class A* | | | 4,863,998 | |
| | | | | | | | |
| | | | | | | 16,739,200 | |
| | |
| | | | | | | | |
| | Common Stocks – (continued) | |
| | Machinery – 1.8% | |
| | 139,774 | | | Allison Transmission Holdings, Inc. | | $ | 4,011,514 | |
| | 9,808 | | | Snap-on, Inc. | | | 1,627,049 | |
| | 13,238 | | | Stanley Black & Decker, Inc. | | | 1,402,963 | |
| | 21,117 | | | The Toro Co. | | | 1,589,477 | |
| | | | | | | | |
| | | | | | | 8,631,003 | |
| | |
| | Media – 3.2% | |
| | 135,964 | | | Comcast Corp. Class A | | | 8,514,066 | |
| | 12,888 | | | Liberty Global PLC Class A* | | | 573,774 | |
| | 83,645 | | | Liberty Global PLC Series C* | | | 3,566,623 | |
| | 25,714 | | | Thomson Reuters Corp. | | | 1,054,788 | |
| | 7,328 | | | Time Warner Cable, Inc. | | | 1,387,923 | |
| | | | | | | | |
| | | | | | | 15,097,174 | |
| | |
| | Metals & Mining – 0.3% | |
| | 65,120 | | | Steel Dynamics, Inc. | | | 1,202,766 | |
| | |
| | Multiline Retail – 0.4% | |
| | 23,666 | | | Target Corp. | | | 1,826,542 | |
| | |
| | Oil, Gas & Consumable Fuels – 8.1% | |
| | 9,128 | | | Cabot Oil & Gas Corp. | | | 198,169 | |
| | 62,098 | | | Columbia Pipeline Group, Inc. | | | 1,289,775 | |
| | 22,336 | | | CVR Energy, Inc.(b) | | | 993,059 | |
| | 69,653 | | | Exxon Mobil Corp. | | | 5,763,089 | |
| | 75,786 | | | HollyFrontier Corp. | | | 3,711,240 | |
| | 84,908 | | | Kinder Morgan, Inc. | | | 2,322,234 | |
| | 109,863 | | | Marathon Petroleum Corp. | | | 5,690,903 | |
| | 79,442 | | | PBF Energy, Inc. Class A | | | 2,701,028 | |
| | 23,843 | | | Phillips 66 | | | 2,123,219 | |
| | 72,878 | | | Spectra Energy Corp. | | | 2,082,125 | |
| | 39,363 | | | Tesoro Corp. | | | 4,209,086 | |
| | 88,089 | | | Valero Energy Corp. | | | 5,806,827 | |
| | 26,394 | | | World Fuel Services Corp. | | | 1,173,477 | |
| | | | | | | | |
| | | | | | | 38,064,231 | |
| | |
| | Personal Products – 0.4% | |
| | 20,818 | | | The Estee Lauder Cos., Inc. Class A | | | 1,675,016 | |
| | |
| | Pharmaceuticals – 6.8% | |
| | 82,458 | | | Eli Lilly & Co. | | | 6,726,099 | |
| | 106,421 | | | Johnson & Johnson | | | 10,751,714 | |
| | 287,642 | | | Pfizer, Inc. | | | 9,728,053 | |
| | 102,744 | | | Zoetis, Inc. | | | 4,419,019 | |
| | | | | | | | |
| | | | | | | 31,624,885 | |
| | |
| | Professional Services – 0.4% | |
| | 4,518 | | | Equifax, Inc. | | | 481,483 | |
| | 10,379 | | | ManpowerGroup, Inc. | | | 952,585 | |
| | 9,718 | | | Robert Half International, Inc. | | | 511,750 | |
| | | | | | | | |
| | | | | | | 1,945,818 | |
| | |
| | Real Estate Investment Trusts – 2.9% | |
| | 25,579 | | | American Tower Corp. | | | 2,614,941 | |
| | 72,157 | | | Apartment Investment & Management Co. Class A | | | 2,827,833 | |
| | |
| | |
| The accompanying notes are an integral part of these financial statements. | | 65 |
GOLDMAN SACHS U.S. EQUITY INSIGHTS FUND
Schedule of Investments (continued)
October 31, 2015
| | | | | | | | |
Shares | | | Description | | Value | |
| | | | | | | | |
| | Common Stocks – (continued) | |
| | Real Estate Investment Trusts – (continued) | |
| | 3,215 | | | Boston Properties, Inc. | | $ | 404,608 | |
| | 6,323 | | | Equity Commonwealth* | | | 181,533 | |
| | 42,790 | | | Equity LifeStyle Properties, Inc. | | | 2,587,939 | |
| | 2,357 | | | Equity Residential | | | 182,243 | |
| | 5,320 | | | Extra Space Storage, Inc. | | | 421,557 | |
| | 66,322 | | | Gaming and Leisure Properties, Inc. | | | 1,934,613 | |
| | 21,581 | | | Post Properties, Inc. | | | 1,289,249 | |
| | 4,844 | | | Simon Property Group, Inc. | | | 975,872 | |
| | | | | | | | |
| | | | | | | 13,420,388 | |
| | |
| | Real Estate Management & Development – 1.4% | |
| | 134,381 | | | CBRE Group, Inc. Class A* | | | 5,009,724 | |
| | 7,455 | | | Forest City Enterprises, Inc. Class A* | | | 164,755 | |
| | 8,338 | | | Jones Lang LaSalle, Inc. | | | 1,390,028 | |
| | | | | | | | |
| | | | | | | 6,564,507 | |
| | |
| | Semiconductors & Semiconductor Equipment – 1.5% | |
| | 8,780 | | | Freescale Semiconductor Ltd.* | | | 294,042 | |
| | 35,679 | | | NXP Semiconductors NV* | | | 2,795,450 | |
| | 82,222 | | | Xilinx, Inc. | | | 3,915,411 | |
| | | | | | | | |
| | | | | | | 7,004,903 | |
| | |
| | Software – 1.2% | |
| | 107,729 | | | Microsoft Corp. | | | 5,670,855 | |
| | |
| | Specialty Retail – 5.5% | |
| | 6,821 | | | AutoZone, Inc.* | | | 5,350,461 | |
| | 84,937 | | | Lowe’s Cos., Inc. | | | 6,270,899 | |
| | 20,356 | | | O’Reilly Automotive, Inc.* | | | 5,623,548 | |
| | 69,017 | | | The Home Depot, Inc. | | | 8,533,262 | |
| | | | | | | | |
| | | | | | | 25,778,170 | |
| | |
| | Textiles, Apparel & Luxury Goods – 0.2% | |
| | 16,951 | | | VF Corp. | | | 1,144,532 | |
| | |
| | Tobacco – 1.6% | |
| | 124,906 | | | Altria Group, Inc. | | | 7,553,066 | |
| | |
| | Trading Companies & Distributors – 1.5% | |
| | 80,876 | | | AerCap Holdings NV* | | | 3,356,354 | |
| | 30,488 | | | Watsco, Inc. | | | 3,750,939 | |
| | | | | | | | |
| | | | | | | 7,107,293 | |
| | |
| | TOTAL COMMON STOCKS | |
| | (Cost $419,938,791) | | $ | 450,250,914 | |
| | |
| | | | | | | | | | | | | | |
Principal
Amount | | | Interest
Rate | | | Maturity
Date | | | Value | |
| | Short-term Investment(c) – 3.8% | |
| | Repurchase Agreements – 3.8% | | | | | |
| Joint Repurchase Agreement Account II | | | | | |
| $ | 17,700,000 | | | | 0.092 | % | | | 11/02/15 | | | $ | 17,700,000 | |
| | (Cost $17,700,000) | | | | | | | | | |
| | |
| TOTAL INVESTMENTS BEFORE SECURITIES
LENDING REINVESTMENT VEHICLE |
|
| | (Cost $437,638,791) | | | | | | | $ | 467,950,914 | |
| | |
| | | | | | | | |
Shares | | Rate | | | Value | |
| Securities Lending Reinvestment Vehicle(d)(e) – 0.1% | |
Goldman Sachs Financial Square Money Market Fund –
FST Shares | |
| 729,425 | | | 0.159 | % | | $ | 729,425 | |
| (Cost $729,425) | | | | | |
| |
| TOTAL INVESTMENTS – 100.1% | |
| (Cost $438,368,216) | | | $ | 468,680,339 | |
| |
| LIABILITIES IN EXCESS OF OTHER ASSETS – (0.1)% | | | | (613,965 | ) |
| |
| NET ASSETS – 100.0% | | | $ | 468,066,374 | |
| |
| | |
| The percentage shown for each investment category reflects the value of investments in that category as a percentage of net assets. |
* | | Non-income producing security. |
(a) | | All or a portion of security is segregated as collateral for initial margin requirements on futures transactions. |
(b) | | All or a portion of security is on loan. |
(c) | | Joint repurchase agreement was entered into on October 30, 2015. Additional information appears on page 67. |
(d) | | Variable rate security. Interest rate or distribution rate disclosed is that which is in effect on October 31, 2015. |
(e) | | Represents an Affiliated Issuer. |
|
| ADDITIONAL INVESTMENT INFORMATION |
FUTURES CONTRACTS — At October 31, 2015, the Fund had the following futures contracts:
| | | | | | | | | | | | | | |
| Type | | Number of Contracts Long (Short) | | | Expiration Date | | Current Value | | | Unrealized Gain (Loss) | |
S&P 500 E-Mini Index | | | 123 | | | December 2015 | | $ | 12,753,255 | | | $ | 423,310 | |
| | |
| 66 | | The accompanying notes are an integral part of these financial statements. |
GOLDMAN SACHS DOMESTIC EQUITY INSIGHTS FUNDS
Schedule of Investments
October 31, 2015
|
| ADDITIONAL INVESTMENT INFORMATION |
JOINT REPURCHASE AGREEMENT ACCOUNT II — At October 31, 2015, the Funds had undivided interests in the Joint Repurchase Agreement Account II, with a maturity date of November 2, 2015, as follows:
| | | | | | | | | | | | |
| Fund | | Principal
Amount | | | Maturity
Value | | | Collateral
Allocation
Value | |
Large Cap Growth Insights | | $ | 21,900,000 | | | $ | 21,900,112 | | | $ | 22,386,184 | |
Large Cap Value Insights | | | 9,400,000 | | | | 9,400,048 | | | | 9,608,682 | |
Small Cap Equity Insights | | | 3,400,000 | | | | 3,400,017 | | | | 3,475,481 | |
Small Cap Growth Insights | | | 3,200,000 | | | | 3,200,016 | | | | 3,271,041 | |
Small Cap Value Insights | | | 3,500,000 | | | | 3,500,018 | | | | 3,577,701 | |
U.S. Equity Insights | | | 17,700,000 | | | | 17,700,091 | | | | 18,092,943 | |
REPURCHASE AGREEMENTS — At October 31, 2015, the Principal Amount of the Funds’ interest in the Joint Repurchase Agreement Account II was as follows:
| | | | | | | | | | | | | | | | | | | | | | | | | | | | |
| Counterparty | | Interest
Rate | | | Large Cap
Growth Insights | | | Large Cap
Value Insights | | | Small Cap
Equity Insights | | | Small Cap
Growth Insights | | | Small Cap
Value Insights | | | U.S. Equity Insights | |
BNP Paribas Securities Co. | | | 0.090 | % | | $ | 9,363,965 | | | $ | 4,019,236 | | | $ | 1,453,766 | | | $ | 1,368,251 | | | $ | 1,496,525 | | | $ | 7,568,136 | |
Citigroup Global Markets, Inc. | | | 0.100 | | | | 4,818,335 | | | | 2,068,144 | | | | 748,052 | | | | 704,049 | | | | 770,053 | | | | 3,894,270 | |
Merrill Lynch & Co., Inc. | | | 0.090 | | | | 7,717,700 | | | | 3,312,620 | | | | 1,198,182 | | | | 1,127,700 | | | | 1,233,422 | | | | 6,237,594 | |
| TOTAL | | | | | | $ | 21,900,000 | | | $ | 9,400,000 | | | $ | 3,400,000 | | | $ | 3,200,000 | | | $ | 3,500,000 | | | $ | 17,700,000 | |
At October 31, 2015, the Joint Repurchase Agreement Account II was fully collateralized by:
| | | | | | | | |
| Issuer | | Interest Rates | | | Maturity Dates | |
Federal Home Loan Bank | | | 0.625 | % | | | 12/28/16 | |
Federal Home Loan Mortgage Corp. | | | 1.000 to 7.500 | | | | 07/28/17 to 07/01/45 | |
Federal National Mortgage Association | | | 2.000 to 7.500 | | | | 04/01/16 to 11/01/45 | |
Government National Mortgage Association | | | 3.000 to 6.000 | | | | 05/15/18 to 10/20/45 | |
United States Treasury Inflation Protected Securities | | | 1.875 | | | | 07/15/19 | |
U.S. Treasury Notes | | | 1.000 | | | | 09/30/19 | |
United States Treasury Stripped Securities | | | 0.000 | | | | 05/15/34 to 11/15/36 | |
| | |
| The accompanying notes are an integral part of these financial statements. | | 67 |
GOLDMAN SACHS DOMESTIC EQUITY INSIGHTS FUNDS
Statements of Assets and Liabilities
October 31, 2015
| | | | | | |
| | | | | Large Cap Growth Insights Fund | |
| | Assets: | | | | |
| | Investments, at value (cost $756,075,572, $389,075,432, $142,689,198, $121,887,428, $134,147,319 and $437,638,791)(a) | | $ | 791,404,967 | |
| | Investments in securities lending reinvestment vehicle — affiliated issuer, at value which equals cost | | | — | |
| | Cash | | | 78,968 | |
| | Receivables: | | | | |
| | Fund shares sold | | | 2,664,457 | |
| | Dividends and interest | | | 785,423 | |
| | Reimbursement from investment adviser | | | 84,049 | |
| | Securities lending income | | | — | |
| | Other assets | | | 2,986 | |
| | Total assets | | | 795,020,850 | |
| | | | | | |
| | Liabilities: | | | | |
| | Variation margin on certain derivative contracts | | | 60,895 | |
| | Payables: | | | | |
| | Fund shares redeemed | | | 998,320 | |
| | Management fees | | | 333,845 | |
| | Distribution and Service fees and Transfer Agency fees | | | 147,111 | |
| | Investments purchased | | | — | |
| | Payable upon return of securities loaned | | | — | |
| | Accrued expenses and other liabilities | | | 100,085 | |
| | Total liabilities | | | 1,640,256 | |
| | | | | | |
| | Net Assets: | | | | |
| | Paid-in capital | | | 1,009,698,332 | |
| | Undistributed (distributions in excess of) net investment income | | | 5,978,180 | |
| | Accumulated net realized gain (loss) | | | (258,224,368 | ) |
| | Net unrealized gain (loss) | | | 35,928,450 | |
| | | NET ASSETS | | $ | 793,380,594 | |
| | | Net Assets: | | | | |
| | | Class A | | $ | 200,633,821 | |
| | | Class C | | | 49,657,540 | |
| | | Institutional | | | 493,321,846 | |
| | | Service | | | 3,096,425 | |
| | | Class IR | | | 36,001,170 | |
| | | Class R | | | 10,659,809 | |
| | | Class R6 | | | 9,983 | |
| | | Total Net Assets | | $ | 793,380,594 | |
| | | Shares Outstanding $0.001 par value (unlimited shares authorized): | | | | |
| | | Class A | | | 8,675,058 | |
| | | Class C | | | 2,361,879 | |
| | | Institutional | | | 20,674,562 | |
| | | Service | | | 135,266 | |
| | | Class IR | | | 1,573,642 | |
| | | Class R | | | 469,478 | |
| | | Class R6 | | | 418 | |
| | | Net asset value, offering and redemption price per share:(b) | | | | |
| | | Class A | | | $23.13 | |
| | | Class C | | | 21.02 | |
| | | Institutional | | | 23.86 | |
| | | Service | | | 22.89 | |
| | | Class IR | | | 22.88 | |
| | | Class R | | | 22.71 | |
| | | Class R6 | | | 23.86 | (c) |
| | (a) | | Includes loaned securities having a market value of $1,535,693, $2,934,041, $3,228,475, $3,004,967 and $724,698 for the Large Cap Value Insights, Small Cap Equity Insights, Small Cap Growth Insights, Small Cap Value Insights and U.S. Equity Insights Funds, respectively. |
| | (b) | | Maximum public offering price per share for Class A Shares of the Large Cap Growth Insights, Large Cap Value Insights, Small Cap Equity Insights, Small Cap Growth Insights, Small Cap Value Insights and U.S. Equity Insights Funds is $24.48, $17.90, $20.21, $32.96, $40.60 and $43.87, respectively. At redemption, Class C Shares may be subject to a contingent deferred sales charge assessed on the amount equal to the lesser of the current net asset value (“NAV”) or the original purchase price of the shares. |
| | (c) | | Net asset value may not recalculate due to rounding of fractional shares. |
| | |
| 68 | | The accompanying notes are an integral part of these financial statements. |
GOLDMAN SACHS DOMESTIC EQUITY INSIGHTS FUNDS
| | | | | | | | | | | | | | | | | | | | | | | | | | | | |
| | | Large Cap Value
Insights Fund | | | | | Small Cap Equity
Insights Fund | | | | | Small Cap Growth
Insights Fund | | | | | Small Cap Value
Insights Fund | | | | | U.S. Equity Insights Fund | |
| | | | | | | | | | | | | | | | | | | | | | | | | | | | |
| | $ | 387,751,482 | | | | | $ | 140,810,417 | | | | | $ | 122,585,893 | | | | | $ | 137,668,123 | | | | | $ | 467,950,914 | |
| | | 1,543,540 | | | | | | 3,040,011 | | | | | | 3,384,225 | | | | | | 3,158,375 | | | | | | 729,425 | |
| | | 70,587 | | | | | | 53,834 | | | | | | 58,501 | | | | | | 58,174 | | | | | | 71,641 | |
| | | | | | | | | | | | | | | | | | | | | | | | | | | | |
| | | 207,296 | | | | | | 375,167 | | | | | | 181,010 | | | | | | 20,938 | | | | | | 353,210 | |
| | | 563,083 | | | | | | 56,013 | | | | | | 23,645 | | | | | | 60,685 | | | | | | 637,974 | |
| | | 45,771 | | | | | | 2,744 | | | | | | 31,239 | | | | | | 26,730 | | | | | | 16,778 | |
| | | 751 | | | | | | 1,532 | | | | | | 5,814 | | | | | | 2,432 | | | | | | 215 | |
| | | 5,104 | | | | | | 1,055 | | | | | | 1,156 | | | | | | 899 | | | | | | 2,832 | |
| | | 390,187,614 | | | | | | 144,340,773 | | | | | | 126,271,483 | | | | | | 140,996,356 | | | | | | 469,762,989 | |
| | | | | | | | | | | | | | | | | | | | | | | | | | | | |
| | | | | | | | | | | | | | | | | | | | | | | | | | | | |
| | | 14,879 | | | | | | 5,384 | | | | | | 3,673 | | | | | | 5,154 | | | | | | 57,178 | |
| | | | | | | | | | | | | | | | | | | | | | | | | | | | |
| | | 124,421 | | | | | | 70,157 | | | | | | 51,872 | | | | | | 193,549 | | | | | | 192,991 | |
| | | 166,353 | | | | | | 96,357 | | | | | | 82,097 | | | | | | 93,101 | | | | | | 201,382 | |
| | | 49,464 | | | | | | 34,707 | | | | | | 27,737 | | | | | | 54,731 | | | | | | 156,781 | |
| | | — | | | | | | — | | | | | | — | | | | | | 382 | | | | | | — | |
| | | 1,543,540 | | | | | | 3,040,011 | | | | | | 3,384,225 | | | | | | 3,158,375 | | | | | | 729,425 | |
| | | 101,425 | | | | | | 118,741 | | | | | | 95,530 | | | | | | 112,508 | | | | | | 358,858 | |
| | | 2,000,082 | | | | | | 3,365,357 | | | | | | 3,645,134 | | | | | | 3,617,800 | | | | | | 1,696,615 | |
| | | | | | | | | | | | | | | | | | | | | | | | | | | | |
| | | | | | | | | | | | | | | | | | | | | | | | | | | | |
| | | 691,601,465 | | | | | | 217,450,424 | | | | | | 111,721,126 | | | | | | 126,045,599 | | | | | | 422,140,541 | |
| | | 262,539 | | | | | | 438,381 | | | | | | 715 | | | | | | 593,980 | | | | | | 4,044,396 | |
| | | (302,550,079 | ) | | | | | (75,050,547 | ) | | | | | 10,118,492 | | | | | | 7,209,772 | | | | | | 11,146,004 | |
| | | (1,126,393 | ) | | | | | (1,862,842 | ) | | | | | 786,016 | | | | | | 3,529,205 | | | | | | 30,735,433 | |
| | | $ | 388,187,532 | | | | | $ | 140,975,416 | | | | | $ | 122,626,349 | | | | | $ | 137,378,556 | | | | | $ | 468,066,374 | |
| | | | | | | | | | | | | | | | | | | | | | | | | | | | | |
| | | $ | 62,150,163 | | | | | $ | 34,680,202 | | | | | $ | 43,647,490 | | | | | $ | 93,150,855 | | | | | $ | 272,737,754 | |
| | | | 15,658,353 | | | | | | 14,153,121 | | | | | | 7,964,202 | | | | | | 16,416,165 | | | | | | 37,811,177 | |
| | | | 296,403,079 | | | | | | 81,067,476 | | | | | | 64,023,134 | | | | | | 21,036,093 | | | | | | 121,863,405 | |
| | | | 7,270,923 | | | | | | 959,470 | | | | | | — | | | | | | — | | | | | | 3,344,175 | |
| | | | 5,424,813 | | | | | | 1,119,061 | | | | | | 4,682,927 | | | | | | 1,773,827 | | | | | | 4,615,312 | |
| | | | 1,270,339 | | | | | | 8,986,274 | | | | | | 2,298,998 | | | | | | 4,991,780 | | | | | | 27,684,687 | |
| | | | 9,862 | | | | | | 9,812 | | | | | | 9,598 | | | | | | 9,836 | | | | | | 9,864 | |
| | | $ | 388,187,532 | | | | | $ | 140,975,416 | | | | | $ | 122,626,349 | | | | | $ | 137,378,556 | | | | | $ | 468,066,374 | |
| | | | | | | | | | | | | | | | | | | | | | | | | | | | | |
| | | | 3,672,655 | | | | | | 1,815,419 | | | | | | 1,401,204 | | | | | | 2,427,686 | | | | | | 6,578,032 | |
| | | | 933,105 | | | | | | 842,104 | | | | | | 311,033 | | | | | | 551,836 | | | | | | 998,286 | |
| | | | 17,528,745 | | | | | | 4,086,739 | | | | | | 1,805,393 | | | | | | 437,690 | | | | | | 2,860,409 | |
| | | | 427,976 | | | | | | 50,980 | | | | | | — | | | | | | — | | | | | | 80,831 | |
| | | | 321,379 | | | | | | 58,845 | | | | | | 147,840 | | | | | | 46,297 | | | | | | 112,225 | |
| | | | 75,429 | | | | | | 478,592 | | | | | | 75,697 | | | | | | 131,391 | | | | | | 676,735 | |
| | | | 583 | | | | | | 495 | | | | | | 271 | | | | | | 205 | | | | | | 232 | |
| | | | | | | | | | | | | | | | | | | | | | | | | | | | | |
| | | | $16.92 | | | | | | $19.10 | | | | | | $31.15 | | | | | | $38.37 | | | | | | $41.46 | |
| | | | 16.78 | | | | | | 16.81 | | | | | | 25.61 | | | | | | 29.75 | | | | | | 37.88 | |
| | | | 16.91 | | | | | | 19.84 | | | | | | 35.46 | | | | | | 48.06 | | | | | | 42.60 | |
| | | | 16.99 | | | | | | 18.82 | | | | | | — | | | | | | — | | | | | | 41.37 | |
| | | | 16.88 | | | | | | 19.02 | | | | | | 31.68 | | | | | | 38.31 | | | | | | 41.13 | |
| | | | 16.84 | | | | | | 18.78 | | | | | | 30.37 | | | | | | 37.99 | | | | | | 40.91 | |
| | | | 16.90 | (c) | | | | | 19.84 | (c) | | | | | 35.46 | (c) | | | | | 48.07 | (c) | | | | | 42.60 | (c) |
| | |
| The accompanying notes are an integral part of these financial statements. | | 69 |
GOLDMAN SACHS DOMESTIC EQUITY INSIGHTS FUNDS
Statements of Operations
For the Fiscal Year Ended October 31, 2015
| | | | | | |
| | | | | Large Cap Growth
Insights Fund | |
| | Investment income: | | | | |
| | Dividends (net of foreign withholding taxes of $410, $426, $2,670, $1,389, $2,762 and $0) | | $ | 10,813,508 | |
| | Interest | | | 23,345 | |
| | Securities lending income — affiliated issuer | | | 22,969 | |
| | Total investment income | | | 10,859,822 | |
| | | | | | |
| | Expenses: | | | | |
| | Management fees | | | 4,171,999 | |
| | Distribution and Service fees(a) | | | 786,328 | |
| | Transfer Agency fees(a) | | | 599,778 | |
| | Registration fees | | | 151,705 | |
| | Professional fees | | | 105,411 | |
| | Custody, accounting and administrative services | | | 97,143 | |
| | Printing and mailing costs | | | 67,640 | |
| | Trustee fees | | | 23,910 | |
| | Service Share fees — Shareholder Administration Plan | | | 4,498 | |
| | Service Share fees — Service Plan | | | 4,498 | |
| | Other | | | 16,999 | |
| | Total expenses | | | 6,029,909 | |
| | Less — expense reductions | | | (1,271,535 | ) |
| | Net expenses | | | 4,758,374 | |
| | NET INVESTMENT INCOME (LOSS) | | | 6,101,448 | |
| | | | | | |
| | Realized and unrealized gain (loss): | | | | |
| | Net realized gain (loss) from: | | | | |
| | Investments | | | 30,891,910 | |
| | Futures contracts | | | 23,881 | |
| | Net change in unrealized gain (loss) on: | | | | |
| | Investments | | | 8,290,168 | |
| | Futures contracts | | | 204,228 | |
| | Net realized and unrealized gain (loss) | | | 39,410,187 | |
| | NET INCREASE IN NET ASSETS RESULTING FROM OPERATIONS | | $ | 45,511,635 | |
| | (a) | | Class specific Distribution and Service and Transfer Agency fees were as follows: |
| | | | | | | | | | | | | | | | | | | | | | | | | | | | | | | | | | | | | | | | | | | | | | | | |
| | | Distribution and Service Fees | | | Transfer Agency Fees | |
Fund | | Class A | | | Class B(b) | | | Class C | | | Class R | | | Class A | | | Class B(b) | | | Class C | | | Institutional | | | Service | | | Class IR | | | Class R | | | Class R6(c) | |
Large Cap Growth Insights | | $ | 406,108 | | | $ | 1,021 | | | $ | 356,314 | | | $ | 22,885 | | | $ | 308,641 | | | $ | 194 | | | $ | 67,700 | | | $ | 164,541 | | | $ | 720 | | | $ | 49,285 | | | $ | 8,696 | | | $ | 1 | |
Large Cap Value Insights | | | 161,256 | | | | 268 | | | | 163,599 | | | | 4,198 | | | | 122,554 | | | | 51 | | | | 31,084 | | | | 146,896 | | | | 2,802 | | | | 12,036 | | | | 1,595 | | | | 1 | |
Small Cap Equity Insights | | | 98,026 | | | | 97 | | | | 150,650 | | | | 43,740 | | | | 74,499 | | | | 18 | | | | 28,624 | | | | 40,472 | | | | 537 | | | | 1,532 | | | | 16,621 | | | | 1 | |
Small Cap Growth Insights | | | 101,249 | | | | 900 | | | | 75,202 | | | | 7,147 | | | | 76,949 | | | | 171 | | | | 14,288 | | | | 18,082 | | | | — | | | | 9,810 | | | | 2,716 | | | | 1 | |
Small Cap Value Insights | | | 248,660 | | | | 3,050 | | | | 181,500 | | | | 11,023 | | | | 188,982 | | | | 579 | | | | 34,485 | | | | 7,332 | | | | — | | | | 3,285 | | | | 4,189 | | | | 1 | |
U.S. Equity Insights | | | 701,461 | | | | 2,356 | | | | 383,420 | | | | 85,933 | | | | 533,110 | | | | 448 | | | | 72,850 | | | | 54,943 | | | | 923 | | | | 7,053 | | | | 32,655 | | | | 1 | |
| | (b) | | Class B Shares were converted into Class A Shares at the close of business on November 14, 2014. |
| | (c) | | Commenced operations on July 31, 2015. |
| | |
| 70 | | The accompanying notes are an integral part of these financial statements. |
GOLDMAN SACHS DOMESTIC EQUITY INSIGHTS FUNDS
| | | | | | | | | | | | | | | | | | | | | | | | | | | | |
| | | Large Cap Value Insights Fund | | | | | Small Cap Equity Insights Fund | | | | | Small Cap Growth Insights Fund | | | | | Small Cap Value Insights Fund | | | | | U.S. Equity Insights Fund | |
| | | | | | | | | | | | | | | | | | | | | | | | | | | | |
| | $ | 10,923,372 | | | | | $ | 2,271,193 | | | | | $ | 828,544 | | | | | $ | 2,732,071 | | | | | $ | 9,523,085 | |
| | | 11,091 | | | | | | 3,983 | | | | | | 3,704 | | | | | | 3,651 | | | | | | 12,654 | |
| | | 18,978 | | | | | | 102,855 | | | | | | 94,637 | | | | | | 78,230 | | | | | | 11,999 | |
| | | 10,953,441 | | | | | | 2,378,031 | | | | | | 926,885 | | | | | | 2,813,952 | | | | | | 9,547,738 | |
| | | | | | | | | | | | | | | | | | | | | | | | | | | | |
| | | | | | | | | | | | | | | | | | | | | | | | | | | | |
| | | 2,773,860 | | | | | | 1,414,091 | | | | | | 849,223 | | | | | | 1,191,578 | | | | | | 3,118,233 | |
| | | 329,321 | | | | | | 292,513 | | | | | | 184,498 | | | | | | 444,233 | | | | | | 1,173,170 | |
| | | 317,019 | | | | | | 162,304 | | | | | | 122,017 | | | | | | 238,853 | | | | | | 701,983 | |
| | | 65,326 | | | | | | 65,302 | | | | | | 87,631 | | | | | | 74,524 | | | | | | 98,254 | |
| | | 113,718 | | | | | | 90,516 | | | | | | 85,089 | | | | | | 88,324 | | | | | | 81,653 | |
| | | 97,991 | | | | | | 84,941 | | | | | | 72,956 | | | | | | 72,174 | | | | | | 87,960 | |
| | | 42,464 | | | | | | 27,573 | | | | | | 31,565 | | | | | | 51,623 | | | | | | 77,546 | |
| | | 23,335 | | | | | | 23,406 | | | | | | 23,188 | | | | | | 23,313 | | | | | | 23,493 | |
| | | 17,512 | | | | | | 3,355 | | | | | | — | | | | | | — | | | | | | 5,769 | |
| | | 17,512 | | | | | | 3,355 | | | | | | — | | | | | | — | | | | | | 5,769 | |
| | | 16,412 | | | | | | 12,424 | | | | | | 10,626 | | | | | | 10,616 | | | | | | 22,000 | |
| | | 3,814,470 | | | | | | 2,179,780 | | | | | | 1,466,793 | | | | | | 2,195,238 | | | | | | 5,395,830 | |
| | | (710,601 | ) | | | | | (347,416 | ) | | | | | (339,431 | ) | | | | | (371,041 | ) | | | | | (995,363 | ) |
| | | 3,103,869 | | | | | | 1,832,364 | | | | | | 1,127,362 | | | | | | 1,824,197 | | | | | | 4,400,467 | |
| | | 7,849,572 | | | | | | 545,667 | | | | | | (200,477 | ) | | | | | 989,755 | | | | | | 5,147,271 | |
| | | | | | | | | | | | | | | | | | | | | | | | | | | | |
| | | | | | | | | | | | | | | | | | | | | | | | | | | | |
| | | | | | | | | | | | | | | | | | | | | | | | | | | | |
| | | 28,203,889 | | | | | | 21,433,638 | | | | | | 11,141,512 | | | | | | 7,398,416 | | | | | | 14,132,749 | |
| | | 334,701 | | | | | | 217,119 | | | | | | (206,215 | ) | | | | | (26,362 | ) | | | | | 831,281 | |
| | | | | | | | | | | | | | | | | | | | | | | | | | | | |
| | | (25,326,036 | ) | | | | | (14,294,050 | ) | | | | | (8,476,823 | ) | | | | | (7,773,042 | ) | | | | | (2,593,517 | ) |
| | | 1,569 | | | | | | (217,964 | ) | | | | | 48,636 | | | | | | (36,501 | ) | | | | | 312,698 | |
| | | 3,214,123 | | | | | | 7,138,743 | | | | | | 2,507,110 | | | | | | (437,489 | ) | | | | | 12,683,211 | |
| | $ | 11,063,695 | | | | | $ | 7,684,410 | | | | | $ | 2,306,633 | | | | | $ | 552,266 | | | | | $ | 17,830,482 | |
| | |
| The accompanying notes are an integral part of these financial statements. | | 71 |
GOLDMAN SACHS DOMESTIC EQUITY INSIGHTS FUNDS
Statements of Changes in Net Assets
| | | | | | | | | | |
| | | | | Large Cap Growth Insights Fund | |
| | | | | For the Fiscal Year Ended October 31, 2015 | | | For the Fiscal Year Ended October 31, 2014 | |
| | From operations: | | | | | | | | |
| | Net investment income | | $ | 6,101,448 | | | $ | 3,674,352 | |
| | Net realized gain | | | 30,915,791 | | | | 75,234,625 | |
| | Net change in unrealized gain (loss) | | | 8,494,396 | | | | (2,562,245 | ) |
| | Net increase in net assets resulting from operations | | | 45,511,635 | | | | 76,346,732 | |
| | | | | | | | | | |
| | Distributions to shareholders: | | | | | | | | |
| | From net investment income | | | | | | | | |
| | Class A Shares | | | (704,224 | ) | | | (576,748 | ) |
| | Class B Shares(a) | | | — | | | | (6,640 | ) |
| | Class C Shares | | | (52,165 | ) | | | (44,591 | ) |
| | Institutional Shares | | | (2,655,012 | ) | | | (3,138,318 | ) |
| | Service Shares | | | (4,970 | ) | | | — | |
| | Class IR Shares | | | (245,804 | ) | | | (8,140 | ) |
| | Class R Shares | | | (9,043 | ) | | | (3,030 | ) |
| | Class R6 Shares(b) | | | — | | | | — | |
| | Total distributions to shareholders | | | (3,671,218 | ) | | | (3,777,467 | ) |
| | | | | | | | | | |
| | From share transactions: | | | | | | | | |
| | Proceeds from sales of shares | | | 612,742,539 | | | | 120,365,605 | |
| | Reinvestment of distributions | | | 3,567,272 | | | | 3,715,052 | |
| | Cost of shares redeemed | | | (271,948,342 | ) | | | (173,324,529 | ) |
| | Net increase (decrease) in net assets resulting from share transactions | | | 344,361,469 | | | | (49,243,872 | ) |
| | TOTAL INCREASE (DECREASE) | | | 386,201,886 | | | | 23,325,393 | |
| | | | | | | | | | |
| | Net assets: | | | | | | | | |
| | Beginning of year | | | 407,178,708 | | | | 383,853,315 | |
| | End of year | | $ | 793,380,594 | | | $ | 407,178,708 | |
| | Undistributed net investment income | | $ | 5,978,180 | | | $ | 3,620,875 | |
| | (a) | | Class B Shares were converted into Class A Shares at the close of business on November 14, 2014. |
| | (b) | | Commenced operations on July 31, 2015. |
| | |
| 72 | | The accompanying notes are an integral part of these financial statements. |
GOLDMAN SACHS DOMESTIC EQUITY INSIGHTS FUNDS
| | | | | | | | | | | | | | | | | | | | | | |
| | | Large Cap Value Insights Fund | | | | | Small Cap Equity Insights Fund | |
| | | For the Fiscal Year Ended October 31, 2015 | | | | | For the Fiscal Year Ended October 31, 2014 | | | | | For the Fiscal Year Ended October 31, 2015 | | | | | For the Fiscal Year Ended October 31, 2014 | |
| | | | | | | | | | | | | | | | | | | | | | |
| | $ | 7,849,572 | | | | | $ | 5,017,711 | | | | | $ | 545,667 | | | | | $ | 541,332 | |
| | | 28,538,590 | | | | | | 47,068,748 | | | | | | 21,650,757 | | | | | | 29,090,512 | |
| | | (25,324,467 | ) | | | | | 3,656,494 | | | | | | (14,512,014 | ) | | | | | (12,094,458 | ) |
| | | 11,063,695 | | | | | | 55,742,953 | | | | | | 7,684,410 | | | | | | 17,537,386 | |
| | | | | | | | | | | | | | | | | | | | | | |
| | | | | | | | | | | | | | | | | | | | | | |
| | | | | | | | | | | | | | | | | | | | | | |
| | | (916,581 | ) | | | | | (541,183 | ) | | | | | — | | | | | | (361,132 | ) |
| | | — | | | | | | (1,184 | ) | | | | | — | | | | | | — | |
| | | (110,236 | ) | | | | | (37,601 | ) | | | | | — | | | | | | (81,345 | ) |
| | | (6,499,235 | ) | | | | | (4,201,621 | ) | | | | | (426,236 | ) | | | | | (1,564,589 | ) |
| | | (91,882 | ) | | | | | (46,491 | ) | | | | | — | | | | | | (19,024 | ) |
| | | (107,537 | ) | | | | | (33,636 | ) | | | | | (629 | ) | | | | | (12,581 | ) |
| | | (12,248 | ) | | | | | (420 | ) | | | | | — | | | | | | (69,265 | ) |
| | | (46 | ) | | | | | — | | | | | | — | | | | | | — | |
| | | (7,737,765 | ) | | | | | (4,862,136 | ) | | | | | (426,865 | ) | | | | | (2,107,936 | ) |
| | | | | | | | | | | | | | | | | | | | | | |
| | | | | | | | | | | | | | | | | | | | | | |
| | | 111,021,958 | | | | | | 177,642,244 | | | | | | 43,084,859 | | | | | | 59,157,234 | |
| | | 7,574,820 | | | | | | 4,772,162 | | | | | | 412,488 | | | | | | 2,004,495 | |
| | | (214,777,809 | ) | | | | | (71,304,606 | ) | | | | | (95,160,861 | ) | | | | | (96,479,200 | ) |
| | | (96,181,031 | ) | | | | | 111,109,800 | | | | | | (51,663,514 | ) | | | | | (35,317,471 | ) |
| | | (92,855,101 | ) | | | | | 161,990,617 | | | | | | (44,405,969 | ) | | | | | (19,888,021 | ) |
| | | | | | | | | | | | | | | | | | | | | | |
| | | | | | | | | | | | | | | | | | | | | | |
| | | 481,042,633 | | | | | | 319,052,016 | | | | | | 185,381,385 | | | | | | 205,269,406 | |
| | $ | 388,187,532 | | | | | $ | 481,042,633 | | | | | $ | 140,975,416 | | | | | $ | 185,381,385 | |
| | $ | 262,539 | | | | | $ | 182,906 | | | | | $ | 438,381 | | | | | $ | 319,402 | |
| | |
| The accompanying notes are an integral part of these financial statements. | | 73 |
GOLDMAN SACHS DOMESTIC EQUITY INSIGHTS FUNDS
Statements of Changes in Net Assets (continued)
| | | | | | | | | | |
| | | | | Small Cap Growth Insights Fund | |
| | | | | For the Fiscal Year Ended October 31, 2015 | | | For the Fiscal Year Ended October 31, 2014 | |
| | From operations: | | | | | | | | |
| | Net investment income (loss) | | $ | (200,477 | ) | | $ | (209,687 | ) |
| | Net realized gain | | | 10,935,297 | | | | 3,830,076 | |
| | Net change in unrealized gain (loss) | | | (8,428,187 | ) | | | 1,617,785 | |
| | Net increase in net assets resulting from operations | | | 2,306,633 | | | | 5,238,174 | |
| | | | | | | | | | |
| | Distributions to shareholders: | | | | | | | | |
| | From net investment income | | | | | | | | |
| | Class A Shares | | | — | | | | — | |
| | Class B Shares(a) | | | — | | | | — | |
| | Class C Shares | | | — | | | | — | |
| | Institutional Shares | | | — | | | | — | |
| | Service Shares | | | — | | | | — | |
| | Class IR Shares | | | — | | | | — | |
| | Class R Shares | | | — | | | | — | |
| | From net realized gains | | | | | | | | |
| | Class A Shares | | | (1,954,522 | ) | | | (2,475,216 | ) |
| | Class B Shares(a) | | | — | | | | (281,204 | ) |
| | Class C Shares | | | (477,017 | ) | | | (699,423 | ) |
| | Institutional Shares | | | (1,549,403 | ) | | | (1,025,674 | ) |
| | Class IR Shares | | | (73,879 | ) | | | (50,902 | ) |
| | Class R Shares | | | (64,282 | ) | | | (17,942 | ) |
| | Total distributions to shareholders | | | (4,119,103 | ) | | | (4,550,361 | ) |
| | | | | | | | | | |
| | From share transactions: | | | | | | | | |
| | Proceeds from sales of shares | | | 72,721,872 | | | | 24,230,860 | |
| | Reinvestment of distributions | | | 4,024,778 | | | | 4,428,595 | |
| | Cost of shares redeemed | | | (26,153,981 | ) | | | (11,726,599 | ) |
| | Net increase (decrease) in net assets resulting from share transactions | | | 50,592,669 | | | | 16,932,856 | |
| | TOTAL INCREASE (DECREASE) | | | 48,780,199 | | | | 17,620,669 | |
| | | | | | | | | | |
| | Net assets: | | | | | | | | |
| | Beginning of year | | | 73,846,150 | | | | 56,225,481 | |
| | End of year | | $ | 122,626,349 | | | $ | 73,846,150 | |
| | Undistributed (distributions in excess of) net investment income (loss) | | $ | 715 | | | $ | (229,769 | ) |
| | (a) | | Class B Shares were converted into Class A Shares at the close of business on November 14, 2014. |
| | |
| 74 | | The accompanying notes are an integral part of these financial statements. |
GOLDMAN SACHS DOMESTIC EQUITY INSIGHTS FUNDS
| | | | | | | | | | | | | | | | | | | | | | |
| | | Small Cap Value Insights Fund | | | | | U.S. Equity Insights Fund | |
| | | For the Fiscal Year Ended October 31, 2015 | | | | | For the Fiscal Year Ended October 31, 2014 | | | | | For the Fiscal Year Ended October 31, 2015 | | | | | For the Fiscal Year Ended October 31, 2014 | |
| | | | | | | | | | | | | | | | | | | | | | |
| | $ | 989,755 | | | | | $ | 437,831 | | | | | $ | 5,147,271 | | | | | $ | 3,497,625 | |
| | | 7,372,054 | | | | | | 16,843,268 | | | | | | 14,964,030 | | | | | | 58,872,523 | |
| | | (7,809,543 | ) | | | | | (5,626,732 | ) | | | | | (2,280,819 | ) | | | | | 1,780,224 | |
| | | 552,266 | | | | | | 11,654,367 | | | | | | 17,830,482 | | | | | | 64,150,372 | |
| | | | | | | | | | | | | | | | | | | | | | |
| | | | | | | | | | | | | | | | | | | | | | |
| | | | | | | | | | | | | | | | | | | | | | |
| | | (362,473 | ) | | | | | (504,552 | ) | | | | | (2,013,475 | ) | | | | | (2,673,114 | ) |
| | | — | | | | | | (7,418 | ) | | | | | – | | | | | | (19,454 | ) |
| | | — | | | | | | (7,047 | ) | | | | | (35,665 | ) | | | | | (149,928 | ) |
| | | (94,110 | ) | | | | | (87,527 | ) | | | | | (1,488,787 | ) | | | | | (918,339 | ) |
| | | — | | | | | | – | | | | | | (7,403 | ) | | | | | (9,393 | ) |
| | | (10,792 | ) | | | | | (10,225 | ) | | | | | (10,626 | ) | | | | | (7,281 | ) |
| | | (666 | ) | | | | | (3,164 | ) | | | | | (6,367 | ) | | | | | (2,635 | ) |
| | | | | | | | | | | | | | | | | | | | | | |
| | | (1,537,176 | ) | | | | | — | | | | | | — | | | | | | — | |
| | | — | | | | | | — | | | | | | — | | | | | | — | |
| | | (364,017 | ) | | | | | — | | | | | | — | | | | | | — | |
| | | (192,609 | ) | | | | | — | | | | | | — | | | | | | — | |
| | | (26,978 | ) | | | | | — | | | | | | — | | | | | | — | |
| | | (15,861 | ) | | | | | — | | | | | | — | | | | | | — | |
| | | (2,604,682 | ) | | | | | (619,933 | ) | | | | | (3,562,323 | ) | | | | | (3,780,144 | ) |
| | | | | | | | | | | | | | | | | | | | | | |
| | | | | | | | | | | | | | | | | | | | | | |
| | | 20,239,128 | | | | | | 12,712,890 | | | | | | 157,816,504 | | | | | | 65,394,739 | |
| | | 2,536,171 | | | | | | 606,920 | | | | | | 3,432,073 | | | | | | 3,612,810 | |
| | | (24,313,088 | ) | | | | | (25,718,179 | ) | | | | | (132,760,111 | ) | | | | | (68,720,892 | ) |
| | | (1,537,789 | ) | | | | | (12,398,369 | ) | | | | | 28,488,466 | | | | | | 286,657 | |
| | | (3,590,205 | ) | | | | | (1,363,935 | ) | | | | | 42,756,625 | | | | | | 60,656,885 | |
| | | | | | | | | | | | | | | | | | | | | | |
| | | | | | | | | | | | | | | | | | | | | | |
| | | 140,968,761 | | | | | | 142,332,696 | | | | | | 425,309,749 | | | | | | 364,652,864 | |
| | $ | 137,378,556 | | | | | $ | 140,968,761 | | | | | $ | 468,066,374 | | | | | $ | 425,309,749 | |
| | $ | 593,980 | | | | | $ | 19,873 | | | | | $ | 4,044,396 | | | | | $ | 2,484,604 | |
| | |
| The accompanying notes are an integral part of these financial statements. | | 75 |
GOLDMAN SACHS LARGE CAP GROWTH INSIGHTS FUND
Financial Highlights
Selected Data for a Share Outstanding Throughout Each Year
| | | | | | | | | | | | | | | | | | | | | | |
| | | | | | | | From
investment operations | | | | |
| | | Year - Share Class | | Net asset
value,
beginning
of year | | | Net
investment
income (loss)(a) | | | Net realized
and unrealized
gain (loss) | | | Total from
investment
operations | | | Distributions
to shareholders
from net
investment
income | |
| | FOR THE FISCAL YEARS ENDED OCTOBER 31, | |
| | 2015 - A | | $ | 21.57 | | | $ | 0.16 | | | $ | 1.55 | | | $ | 1.71 | | | $ | (0.15 | ) |
| | 2015 - C | | | 19.67 | | | | (0.01 | ) | | | 1.41 | | | | 1.40 | | | | (0.05 | ) |
| | 2015 - Institutional | | | 22.22 | | | | 0.26 | | | | 1.60 | | | | 1.86 | | | | (0.22 | ) |
| | 2015 - Service | | | 21.41 | | | | 0.13 | | | | 1.55 | | | | 1.68 | | | | (0.20 | ) |
| | 2015 - IR | | | 21.36 | | | | 0.22 | | | | 1.52 | | | | 1.74 | | | | (0.22 | ) |
| | 2015 - R | | | 21.25 | | | | 0.09 | | | | 1.55 | | | | 1.64 | | | | (0.18 | ) |
| | 2015 - R6 (Commenced July 31, 2015) | | | 23.90 | | | | 0.06 | | | | (0.10 | ) | | | (0.04 | ) | | | — | |
| | 2014 - A | | | 18.05 | | | | 0.12 | | | | 3.54 | | | | 3.66 | | | | (0.14 | ) |
| | 2014 - C | | | 16.51 | | | | (0.02 | ) | | | 3.23 | | | | 3.21 | | | | (0.05 | ) |
| | 2014 - Institutional | | | 18.59 | | | | 0.21 | | | | 3.62 | | | | 3.83 | | | | (0.20 | ) |
| | 2014 - Service | | | 17.81 | | | | 0.18 | | | | 3.42 | | | | 3.60 | | | | — | |
| | 2014 - IR | | | 17.88 | | | | 0.14 | | | | 3.52 | | | | 3.66 | | | | (0.18 | ) |
| | 2014 - R | | | 17.85 | | | | 0.07 | | | | 3.48 | | | | 3.55 | | | | (0.15 | ) |
| | 2013 - A | | | 14.05 | | | | 0.21 | (e) | | | 3.95 | | | | 4.16 | | | | (0.16 | ) |
| | 2013 - C | | | 12.88 | | | | 0.06 | (e) | | | 3.65 | | | | 3.71 | | | | (0.08 | ) |
| | 2013 - Institutional | | | 14.48 | | | | 0.27 | (e) | | | 4.07 | | | | 4.34 | | | | (0.23 | ) |
| | 2013 - Service | | | 13.88 | | | | 0.16 | (e) | | | 3.93 | | | | 4.09 | | | | (0.16 | ) |
| | 2013 - IR | | | 13.95 | | | | 0.22 | (e) | | | 3.93 | | | | 4.15 | | | | (0.22 | ) |
| | 2013 - R | | | 13.97 | | | | 0.11 | (e) | | | 3.97 | | | | 4.08 | | | | (0.20 | ) |
| | 2012 - A | | | 12.60 | | | | 0.12 | (f) | | | 1.47 | | | | 1.59 | | | | (0.14 | ) |
| | 2012 - C | | | 11.57 | | | | 0.01 | (f) | | | 1.35 | | | | 1.36 | | | | (0.05 | ) |
| | 2012 - Institutional | | | 12.98 | | | | 0.17 | (f) | | | 1.52 | | | | 1.69 | | | | (0.19 | ) |
| | 2012 - Service | | | 12.47 | | | | 0.10 | (f) | | | 1.47 | | | | 1.57 | | | | (0.16 | ) |
| | 2012 - IR | | | 12.53 | | | | 0.13 | (f) | | | 1.48 | | | | 1.61 | | | | (0.19 | ) |
| | 2012 - R | | | 12.46 | | | | 0.06 | (f) | | | 1.50 | | | | 1.56 | | | | (0.05 | ) |
| | 2011 - A | | | 11.54 | | | | 0.10 | (g) | | | 1.09 | | | | 1.19 | | | | (0.13 | ) |
| | 2011 - C | | | 10.62 | | | | 0.01 | (g) | | | 1.01 | | | | 1.02 | | | | (0.07 | ) |
| | 2011 - Institutional | | | 11.88 | | | | 0.16 | (g) | | | 1.12 | | | | 1.28 | | | | (0.18 | ) |
| | 2011 - Service | | | 11.43 | | | | 0.06 | (g) | | | 1.10 | | | | 1.16 | | | | (0.12 | ) |
| | 2011 - IR | | | 11.48 | | | | 0.13 | (g) | | | 1.08 | | | | 1.21 | | | | (0.16 | ) |
| | 2011 - R | | | 11.42 | | | | 0.08 | (g) | | | 1.06 | | | | 1.14 | | | | (0.10 | ) |
| | (a) | | Calculated based on the average shares outstanding methodology. |
| | (b) | | Assumes investment at the NAV at the beginning of the year, reinvestment of all dividends and distributions, a complete redemption of the investment at the NAV at the end of the year and no sales or redemption charges. Total returns would be reduced if a sales or redemption charge was taken into account. Returns do not reflect the deduction of taxes that a shareholder would pay on Fund distributions or the redemption of Fund shares. Total returns for periods less than one full year are not annualized. |
| | (c) | | The Fund’s portfolio turnover rate is calculated in accordance with regulatory requirements, without regard to transactions involving short term investments and certain derivatives. If such transactions were included, the Fund’s portfolio turnover rate may be higher. |
| | (e) | | Reflects income recognized from special dividends which amounted to $0.05 per share and 0.31% of average net assets. |
| | (f) | | Reflects income recognized from special dividends which amounted to $0.03 per share and 0.22% of average net assets. |
| | (g) | | Reflects income recognized from special dividends which amounted to $0.02 per share and 0.16% of average net assets. |
| | |
| 76 | | The accompanying notes are an integral part of these financial statements. |
GOLDMAN SACHS LARGE CAP GROWTH INSIGHTS FUND
| | | | | | | | | | | | | | | | | | | | | | | | | | | | | | | | | | | | | | | | |
| | | | | | | | | | | | | | | | | | | | | | | | | | | | | | | | | | |
| | | Net asset
value, end
of year | | | | | Total
return(b) | | | | | Net assets,
end of
year
(in 000s) | | | | | Ratio of
net expenses
to average
net assets | | | | | Ratio of
total expenses
to average
net assets | | | | | Ratio of
net investment
income (loss)
to average net assets | | | | | Portfolio
turnover
rate(c) | |
| | | | |
| | $ | 23.13 | | | | | | 7.96 | % | | | | $ | 200,634 | | | | | | 0.96 | % | | | | | 1.16 | % | | | | | 0.72 | % | | | | | 222 | % |
| | | 21.02 | | | | | | 7.12 | | | | | | 49,658 | | | | | | 1.71 | | | | | | 1.91 | | | | | | (0.05 | ) | | | | | 222 | |
| | | 23.86 | | | | | | 8.41 | | | | | | 493,322 | | | | | | 0.56 | | | | | | 0.76 | | | | | | 1.13 | | | | | | 222 | |
| | | 22.89 | | | | | | 7.88 | | | | | | 3,096 | | | | | | 1.06 | | | | | | 1.26 | | | | | | 0.60 | | | | | | 222 | |
| | | 22.88 | | | | | | 8.21 | | | | | | 36,001 | | | | | | 0.71 | | | | | | 0.91 | | | | | | 0.97 | | | | | | 222 | |
| | | 22.71 | | | | | | 7.73 | | | | | | 10,660 | | | | | | 1.21 | | | | | | 1.41 | | | | | | 0.39 | | | | | | 222 | |
| | | 23.86 | | | | | | (0.17 | ) | | | | | 10 | | | | | | 0.54 | (d) | | | | | 0.74 | (d) | | | | | 1.00 | (d) | | | | | 222 | |
| | | 21.57 | | | | | | 20.41 | | | | | | 94,053 | | | | | | 0.96 | | | | | | 1.20 | | | | | | 0.63 | | | | | | 234 | |
| | | 19.67 | | | | | | 19.51 | | | | | | 19,448 | | | | | | 1.71 | | | | | | 1.95 | | | | | | (0.12 | ) | | | | | 234 | |
| | | 22.22 | | | | | | 20.88 | | | | | | 269,611 | | | | | | 0.56 | | | | | | 0.80 | | | | | | 1.05 | | | | | | 234 | |
| | | 21.41 | | | | | | 20.21 | | | | | | 408 | | | | | | 1.06 | | | | | | 1.30 | | | | | | 0.96 | | | | | | 234 | |
| | | 21.36 | | | | | | 20.69 | | | | | | 20,793 | | | | | | 0.71 | | | | | | 0.97 | | | | | | 0.68 | | | | | | 234 | |
| | | 21.25 | | | | | | 20.10 | | | | | | 535 | | | | | | 1.21 | | | | | | 1.45 | | | | | | 0.37 | | | | | | 234 | |
| | | 18.05 | | | | | | 29.90 | | | | | | 74,524 | | | | | | 0.95 | | | | | | 1.20 | | | | | | 1.34 | (e) | | | | | 232 | |
| | | 16.51 | | | | | | 28.96 | | | | | | 14,133 | | | | | | 1.70 | | | | | | 1.95 | | | | | | 0.42 | (e) | | | | | 232 | |
| | | 18.59 | | | | | | 30.40 | | | | | | 289,326 | | | | | | 0.55 | | | | | | 0.80 | | | | | | 1.65 | (e) | | | | | 232 | |
| | | 17.81 | | | | | | 29.77 | | | | | | 1,155 | | | | | | 1.05 | | | | | | 1.30 | | | | | | 1.05 | (e) | | | | | 232 | |
| | | 17.88 | | | | | | 30.26 | | | | | | 784 | | | | | | 0.70 | | | | | | 0.95 | | | | | | 1.40 | (e) | | | | | 232 | |
| | | 17.85 | | | | | | 29.53 | | | | | | 359 | | | | | | 1.20 | | | | | | 1.46 | | | | | | 0.70 | (e) | | | | | 232 | |
| | | 14.05 | | | | | | 12.69 | | | | | | 118,956 | | | | | | 0.95 | | | | | | 1.16 | | | | | | 0.83 | (f) | | | | | 146 | |
| | | 12.88 | | | | | | 11.81 | | | | | | 12,555 | | | | | | 1.70 | | | | | | 1.91 | | | | | | 0.08 | (f) | | | | | 146 | |
| | | 14.48 | | | | | | 13.18 | | | | | | 311,286 | | | | | | 0.55 | | | | | | 0.76 | | | | | | 1.23 | (f) | | | | | 146 | |
| | | 13.88 | | | | | | 12.67 | | | | | | 963 | | | | | | 1.05 | | | | | | 1.26 | | | | | | 0.73 | (f) | | | | | 146 | |
| | | 13.95 | | | | | | 12.96 | | | | | | 667 | | | | | | 0.70 | | | | | | 0.90 | | | | | | 0.95 | (f) | | | | | 146 | |
| | | 13.97 | | | | | | 12.50 | | | | | | 127 | | | | | | 1.20 | | | | | | 1.39 | | | | | | 0.39 | (f) | | | | | 146 | |
| | | 12.60 | | | | | | 10.38 | | | | | | 150,750 | | | | | | 0.95 | | | | | | 1.16 | | | | | | 0.84 | (g) | | | | | 76 | |
| | | 11.57 | | | | | | 9.63 | | | | | | 12,999 | | | | | | 1.70 | | | | | | 1.91 | | | | | | 0.10 | (g) | | | | | 76 | |
| | | 12.98 | | | | | | 10.83 | | | | | | 392,373 | | | | | | 0.55 | | | | | | 0.76 | | | | | | 1.22 | (g) | | | | | 76 | |
| | | 12.47 | | | | | | 10.23 | | | | | | 1,004 | | | | | | 1.05 | | | | | | 1.26 | | | | | | 0.49 | (g) | | | | | 76 | |
| | | 12.53 | | | | | | 10.66 | | | | | | 45 | | | | | | 0.70 | | | | | | 0.91 | | | | | | 1.07 | (g) | | | | | 76 | |
| | | 12.46 | | | | | | 10.06 | | | | | | 26 | | | | | | 1.20 | | | | | | 1.41 | | | | | | 0.63 | (g) | | | | | 76 | |
| | |
| The accompanying notes are an integral part of these financial statements. | | 77 |
GOLDMAN SACHS LARGE CAP VALUE INSIGHTS FUND
Financial Highlights
Selected Data for a Share Outstanding Throughout Each Year
| | | | | | | | | | | | | | | | | | | | | | |
| | | | | | | | From
investment operations | | | | |
| | | Year - Share Class | | Net asset
value,
beginning
of year | | | Net
investment
income(a) | | | Net realized
and unrealized
gain (loss) | | | Total from
investment
operations | | | Distributions
to shareholders
from net
investment
income | |
| FOR THE FISCAL YEARS ENDED OCTOBER 31, | |
| | 2015 - A | | $ | 16.86 | | | $ | 0.24 | | | $ | 0.06 | | | $ | 0.30 | | | $ | (0.24 | ) |
| | 2015 - C | | | 16.71 | | | | 0.11 | | | | 0.07 | | | | 0.18 | | | | (0.11 | ) |
| | 2015 - Institutional | | | 16.85 | | | | 0.31 | | | | 0.06 | | | | 0.37 | | | | (0.31 | ) |
| | 2015 - Service | | | 16.92 | | | | 0.22 | | | | 0.07 | | | | 0.29 | | | | (0.22 | ) |
| | 2015 - IR | | | 16.81 | | | | 0.27 | | | | 0.08 | | | | 0.35 | | | | (0.28 | ) |
| | 2015 - R | | | 16.81 | | | | 0.18 | | | | 0.08 | | | | 0.26 | | | | (0.23 | ) |
| | 2015 - R6 (Commenced July 31, 2015) | | | 17.23 | | | | 0.07 | | | | (0.32 | ) | | | (0.25 | ) | | | (0.08 | ) |
| | 2014 - A | | | 14.75 | | | | 0.16 | | | | 2.10 | | | | 2.26 | | | | (0.15 | ) |
| | 2014 - C | | | 14.63 | | | | 0.04 | | | | 2.08 | | | | 2.12 | | | | (0.04 | ) |
| | 2014 - Institutional | | | 14.74 | | | | 0.22 | | | | 2.11 | | | | 2.33 | | | | (0.22 | ) |
| | 2014 - Service | | | 14.81 | | | | 0.14 | | | | 2.11 | | | | 2.25 | | | | (0.14 | ) |
| | 2014 - IR | | | 14.72 | | | | 0.21 | | | | 2.08 | | | | 2.29 | | | | (0.20 | ) |
| | 2014 - R | | | 14.71 | | | | 0.08 | | | | 2.13 | | | | 2.21 | | | | (0.11 | ) |
| | 2013 - A | | | 11.49 | | | | 0.25 | (e) | | | 3.22 | | | | 3.47 | | | | (0.21 | ) |
| | 2013 - C | | | 11.40 | | | | 0.12 | (e) | | | 3.23 | | | | 3.35 | | | | (0.12 | ) |
| | 2013 - Institutional | | | 11.48 | | | | 0.28 | (e) | | | 3.25 | | | | 3.53 | | | | (0.27 | ) |
| | 2013 - Service | | | 11.54 | | | | 0.21 | (e) | | | 3.26 | | | | 3.47 | | | | (0.20 | ) |
| | 2013 - IR | | | 11.47 | | | | 0.23 | (e) | | | 3.27 | | | | 3.50 | | | | (0.25 | ) |
| | 2013 - R | | | 11.46 | | | | 0.16 | (e) | | | 3.28 | | | | 3.44 | | | | (0.19 | ) |
| | 2012 - A | | | 10.19 | | | | 0.17 | | | | 1.29 | (f) | | | 1.46 | | | | (0.16 | ) |
| | 2012 - C | | | 10.11 | | | | 0.09 | | | | 1.29 | (f) | | | 1.38 | | | | (0.09 | ) |
| | 2012 - Institutional | | | 10.18 | | | | 0.21 | | | | 1.30 | (f) | | | 1.51 | | | | (0.21 | ) |
| | 2012 - Service | | | 10.23 | | | | 0.17 | | | | 1.29 | (f) | | | 1.46 | | | | (0.15 | ) |
| | 2012 - IR | | | 10.17 | | | | 0.19 | | | | 1.30 | (f) | | | 1.49 | | | | (0.19 | ) |
| | 2012 - R | | | 10.17 | | | | 0.13 | | | | 1.30 | (f) | | | 1.43 | | | | (0.14 | ) |
| | 2011 - A | | | 9.47 | | | | 0.13 | | | | 0.74 | | | | 0.87 | | | | (0.15 | ) |
| | 2011 - C | | | 9.40 | | | | 0.06 | | | | 0.72 | | | | 0.78 | | | | (0.07 | ) |
| | 2011 - Institutional | | | 9.46 | | | | 0.17 | | | | 0.74 | | | | 0.91 | | | | (0.19 | ) |
| | 2011 - Service | | | 9.51 | | | | 0.12 | | | | 0.74 | | | | 0.86 | | | | (0.14 | ) |
| | 2011 - IR | | | 9.45 | | | | 0.15 | | | | 0.74 | | | | 0.89 | | | | (0.17 | ) |
| | 2011 - R | | | 9.45 | | | | 0.12 | | | | 0.72 | | | | 0.84 | | | | (0.12 | ) |
| | (a) | | Calculated based on the average shares outstanding methodology. |
| | (b) | | Assumes investment at the NAV at the beginning of the year, reinvestment of all dividends and distributions, a complete redemption of the investment at the NAV at the end of the year and no sales or redemption charges. Total returns would be reduced if a sales or redemption charge was taken into account. Returns do not reflect the deduction of taxes that a shareholder would pay on Fund distributions or the redemption of Fund shares. Total returns for periods less than one full year are not annualized. |
| | (c) | | The Fund’s portfolio turnover rate is calculated in accordance with regulatory requirements, without regard to transactions involving short term investments and certain derivatives. If such transactions were included, the Fund’s portfolio turnover rate may be higher. |
| | (e) | | Reflects income recognized from a special dividend which amounted to $0.04 per share and 0.32% of average net assets. |
| | (f) | | Reflects payment from affiliate relating to certain investment transactions which amounted to $0.01 per share. Excluding such payment, the total return would have been 14.34%, 13.51%, 13.55%, 14.81%, 14.28%, 14.67% and 13.98%, respectively. |
| | |
| 78 | | The accompanying notes are an integral part of these financial statements. |
GOLDMAN SACHS LARGE CAP VALUE INSIGHTS FUND
| | | | | | | | | | | | | | | | | | | | | | | | | | | | | | | | | | | | | | | | |
| | | | | | | | | | | | | | | | | | | | | | | | | | | | | | | | | | |
| | | Net asset
value, end
of year | | | | | Total
return(b) | | | | | Net assets,
end of year
(in 000s) | | | | | Ratio of
net expenses
to average
net assets | | | | | Ratio of
total expenses
to average
net assets | | | | | Ratio of
net investment
income to average net assets | | | | | Portfolio
turnover
rate(c) | |
| | | | |
| | $ | 16.92 | | | | | | 1.82 | % | | | | $ | 62,150 | | | | | | 0.96 | % | | | | | 1.12 | % | | | | | 1.39 | % | | | | | 221 | % |
| | | 16.78 | | | | | | 1.11 | | | | | | 15,658 | | | | | | 1.71 | | | | | | 1.87 | | | | | | 0.64 | | | | | | 221 | |
| | | 16.91 | | | | | | 2.24 | | | | | | 296,403 | | | | | | 0.56 | | | | | | 0.72 | | | | | | 1.81 | | | | | | 221 | |
| | | 16.99 | | | | | | 1.77 | | | | | | 7,271 | | | | | | 1.06 | | | | | | 1.22 | | | | | | 1.29 | | | | | | 221 | |
| | | 16.88 | | | | | | 2.14 | | | | | | 5,425 | | | | | | 0.71 | | | | | | 0.87 | | | | | | 1.60 | | | | | | 221 | |
| | | 16.84 | | | | | | 1.56 | | | | | | 1,270 | | | | | | 1.21 | | | | | | 1.37 | | | | | | 1.07 | | | | | | 221 | |
| | | 16.90 | | | | | | (1.41 | ) | | | | | 10 | | | | | | 0.58 | (d) | | | | | 0.74 | (d) | | | | | 1.62 | (d) | | | | | 221 | |
| | | 16.86 | | | | | | 15.42 | | | | | | 62,704 | | | | | | 0.96 | | | | | | 1.14 | | | | | | 1.00 | | | | | | 222 | |
| | | 16.71 | | | | | | 14.50 | | | | | | 16,567 | | | | | | 1.71 | | | | | | 1.89 | | | | | | 0.25 | | | | | | 222 | |
| | | 16.85 | | | | | | 15.89 | | | | | | 389,534 | | | | | | 0.56 | | | | | | 0.74 | | | | | | 1.39 | | | | | | 222 | |
| | | 16.92 | | | | | | 15.24 | | | | | | 6,062 | | | | | | 1.06 | | | | | | 1.24 | | | | | | 0.91 | | | | | | 222 | |
| | | 16.81 | | | | | | 15.62 | | | | | | 5,238 | | | | | | 0.71 | | | | | | 0.88 | | | | | | 1.27 | | | | | | 222 | |
| | | 16.81 | | | | | | 15.13 | | | | | | 332 | | | | | | 1.21 | | | | | | 1.39 | | | | | | 0.49 | | | | | | 222 | |
| | | 14.75 | | | | | | 30.54 | | | | | | 52,993 | | | | | | 0.95 | | | | | | 1.14 | | | | | | 1.95 | (e) | | | | | 221 | |
| | | 14.63 | | | | | | 29.61 | | | | | | 13,723 | | | | | | 1.70 | | | | | | 1.90 | | | | | | 0.91 | (e) | | | | | 221 | |
| | | 14.74 | | | | | | 31.13 | | | | | | 245,662 | | | | | | 0.55 | | | | | | 0.75 | | | | | | 2.21 | (e) | | | | | 221 | |
| | | 14.81 | | | | | | 30.40 | | | | | | 5,061 | | | | | | 1.05 | | | | | | 1.25 | | | | | | 1.64 | (e) | | | | | 221 | |
| | | 14.72 | | | | | | 30.88 | | | | | | 293 | | | | | | 0.71 | | | | | | 0.91 | | | | | | 1.72 | (e) | | | | | 221 | |
| | | 14.71 | | | | | | 30.25 | | | | | | 79 | | | | | | 1.20 | | | | | | 1.40 | | | | | | 1.23 | (e) | | | | | 221 | |
| | | 11.49 | | | | | | 14.44 | (f) | | | | | 107,535 | | | | | | 0.95 | | | | | | 1.11 | | | | | | 1.53 | | | | | | 135 | |
| | | 11.40 | | | | | | 13.65 | (f) | | | | | 11,018 | | | | | | 1.70 | | | | | | 1.86 | | | | | | 0.77 | | | | | | 135 | |
| | | 11.48 | | | | | | 14.91 | (f) | | | | | 337,650 | | | | | | 0.55 | | | | | | 0.71 | | | | | | 1.91 | | | | | | 135 | |
| | | 11.54 | | | | | | 14.38 | (f) | | | | | 5,117 | | | | | | 1.05 | | | | | | 1.21 | | | | | | 1.48 | | | | | | 135 | |
| | | 11.47 | | | | | | 14.77 | (f) | | | | | 128 | | | | | | 0.70 | | | | | | 0.86 | | | | | | 1.74 | | | | | | 135 | |
| | | 11.46 | | | | | | 14.08 | (f) | | | | | 33 | | | | | | 1.20 | | | | | | 1.36 | | | | | | 1.18 | | | | | | 135 | |
| | | 10.19 | | | | | | 9.15 | | | | | | 133,611 | | | | | | 0.95 | | | | | | 1.13 | | | | | | 1.31 | | | | | | 56 | |
| | | 10.11 | | | | | | 8.30 | | | | | | 11,928 | | | | | | 1.70 | | | | | | 1.88 | | | | | | 0.55 | | | | | | 56 | |
| | | 10.18 | | | | | | 9.61 | | | | | | 365,385 | | | | | | 0.55 | | | | | | 0.73 | | | | | | 1.69 | | | | | | 56 | |
| | | 10.23 | | | | | | 9.02 | | | | | | 7,699 | | | | | | 1.05 | | | | | | 1.23 | | | | | | 1.19 | | | | | | 56 | |
| | | 10.17 | | | | | | 9.48 | | | | | | 67 | | | | | | 0.70 | | | | | | 0.88 | | | | | | 1.48 | | | | | | 56 | |
| | | 10.17 | | | | | | 8.96 | | | | | | 10 | | | | | | 1.20 | | | | | | 1.38 | | | | | | 1.13 | | | | | | 56 | |
| | |
| The accompanying notes are an integral part of these financial statements. | | 79 |
GOLDMAN SACHS SMALL CAP EQUITY INSIGHTS FUND
Financial Highlights
Selected Data for a Share Outstanding Throughout Each Year
| | | | | | | | | | | | | | | | | | | | | | |
| | | | | | | | From
investment operations | | | | |
| | | Year - Share Class | | Net asset
value,
beginning
of year | | | Net
investment
income (loss)(a) | | | Net realized
and unrealized
gain (loss) | | | Total from
investment
operations | | | Distributions
to shareholders
from net
investment
income | |
| FOR THE FISCAL YEARS ENDED OCTOBER 31, | |
| | 2015 - A | | $ | 18.25 | | | $ | 0.03 | | | $ | 0.82 | | | $ | 0.85 | | | $ | — | |
| | 2015 - C | | | 16.18 | | | | (0.10 | ) | | | 0.73 | | | | 0.63 | | | | — | |
| | 2015 - Institutional | | | 18.94 | | | | 0.11 | | | | 0.86 | | | | 0.97 | | | | (0.07 | ) |
| | 2015 - Service | | | 18.00 | | | | 0.02 | | | | 0.80 | | | | 0.82 | | | | — | |
| | 2015 - IR | | | 18.14 | | | | 0.06 | | | | 0.84 | | | | 0.90 | | | | (0.02 | ) |
| | 2015 - R | | | 17.98 | | | | (0.02 | ) | | | 0.82 | | | | 0.80 | | | | — | |
| | 2015 - R6 (Commenced July 31, 2015) | | | 20.22 | | | | 0.02 | | | | (0.40 | ) | | | (0.38 | ) | | | — | |
| | 2014 - A | | | 16.86 | | | | 0.01 | | | | 1.52 | | | | 1.53 | | | | (0.14 | ) |
| | 2014 - C | | | 15.01 | | | | (0.11 | ) | | | 1.36 | | | | 1.25 | | | | (0.08 | ) |
| | 2014 - Institutional | | | 17.48 | | | | 0.09 | | | | 1.57 | | | | 1.66 | | | | (0.20 | ) |
| | 2014 - Service | | | 16.64 | | | | (0.01 | ) | | | 1.50 | | | | 1.49 | | | | (0.13 | ) |
| | 2014 - IR | | | 16.70 | | | | 0.08 | | | | 1.48 | | | | 1.56 | | | | (0.12 | ) |
| | 2014 - R | | | 16.67 | | | | (0.03 | ) | | | 1.49 | | | | 1.46 | | | | (0.15 | ) |
| | 2013 - A | | | 12.93 | | | | 0.20 | (e) | | | 3.75 | | | | 3.95 | | | | (0.02 | ) |
| | 2013 - C | | | 11.57 | | | | 0.06 | (e) | | | 3.38 | | | | 3.44 | | | | — | |
| | 2013 - Institutional | | | 13.42 | | | | 0.25 | (e) | | | 3.91 | | | | 4.16 | | | | (0.10 | ) |
| | 2013 - Service | | | 12.78 | | | | 0.17 | (e) | | | 3.72 | | | | 3.89 | | | | (0.03 | ) |
| | 2013 - IR | | | 12.83 | | | | 0.23 | (e) | | | 3.72 | | | | 3.95 | | | | (0.08 | ) |
| | 2013 - R | | | 12.81 | | | | 0.03 | (e) | | | 3.86 | | | | 3.89 | | | | (0.03 | ) |
| | 2012 - A | | | 12.06 | | | | 0.01 | (f) | | | 0.96 | (g) | | | 0.97 | | | | (0.10 | ) |
| | 2012 - C | | | 10.81 | | | | (0.07 | )(f) | | | 0.86 | (g) | | | 0.79 | | | | (0.03 | ) |
| | 2012 - Institutional | | | 12.53 | | | | 0.07 | (f) | | | 0.98 | (g) | | | 1.05 | | | | (0.16 | ) |
| | 2012 - Service | | | 11.94 | | | | 0.01 | (f) | | | 0.94 | (g) | | | 0.95 | | | | (0.11 | ) |
| | 2012 - IR | | | 12.00 | | | | 0.05 | (f) | | | 0.94 | (g) | | | 0.99 | | | | (0.16 | ) |
| | 2012 - R | | | 11.97 | | | | (0.01 | )(f) | | | 0.94 | (g) | | | 0.93 | | | | (0.09 | ) |
| | 2011 - A | | | 10.92 | | | | 0.06 | (h) | | | 1.15 | | | | 1.21 | | | | (0.07 | ) |
| | 2011 - C | | | 9.82 | | | | (0.04 | )(h) | | | 1.04 | | | | 1.00 | | | | (0.01 | ) |
| | 2011 - Institutional | | | 11.34 | | | | 0.11 | (h) | | | 1.19 | | | | 1.30 | | | | (0.11 | ) |
| | 2011 - Service | | | 10.82 | | | | 0.04 | (h) | | | 1.13 | | | | 1.17 | | | | (0.05 | ) |
| | 2011 - IR | | | 10.87 | | | | 0.08 | (h) | | | 1.15 | | | | 1.23 | | | | (0.10 | ) |
| | 2011 - R | | | 10.86 | | | | 0.02 | (h) | | | 1.15 | | | | 1.17 | | | | (0.06 | ) |
| | (a) | | Calculated based on the average shares outstanding methodology. |
| | (b) | | Assumes investment at the NAV at the beginning of the year, reinvestment of all dividends and distributions, a complete redemption of the investment at the NAV at the end of the year and no sales or redemption charges. Total returns would be reduced if a sales or redemption charge was taken into account. Returns do not reflect the deduction of taxes that a shareholder would pay on Fund distributions or the redemption of Fund shares. Total returns for periods less than one full year are not annualized. |
| | (c) | | The Fund’s portfolio turnover rate is calculated in accordance with regulatory requirements, without regard to transactions involving short term investments and certain derivatives. If such transactions were included, the Fund’s portfolio turnover rate may be higher. |
| | (e) | | Reflects income recognized from special dividends which amounted to $0.13 per share and 0.85% of average net assets. |
| | (f) | | Reflects income recognized from special dividends which amounted to $0.02 per share and 0.17% of average net assets. |
| | (g) | | Reflects payment from affiliate relating to certain investment transactions which amounted to $0.04 per share. Excluding such payment, the total return would have been 7.71%, 6.95%, 6.89%, 8.17%, 7.63%, 8.02%, and 7.44%, respectively. |
| | (h) | | Reflects income recognized from special dividends which amounted to $0.07 per share and 0.55% of average net assets. |
| | |
| 80 | | The accompanying notes are an integral part of these financial statements. |
GOLDMAN SACHS SMALL CAP EQUITY INSIGHTS FUND
| | | | | | | | | | | | | | | | | | | | | | | | | | | | | | | | | | | | | | | | |
| | | | | | | | | | | | | | | | | | | | | | | | | | | | | | | | | | |
| | | Net asset
value, end
of year | | | | | Total
return(b) | | | | | Net assets,
end of
year
(in 000s) | | | | | Ratio of
net expenses
to average
net assets | | | | | Ratio of
total expenses
to average
net assets | | | | | Ratio of
net investment
income (loss)
to average net assets | | | | | Portfolio
turnover
rate(c) | |
| | | | |
| | $ | 19.10 | | | | | | 4.66 | % | | | | $ | 34,680 | | | | | | 1.26 | % | | | | | 1.47 | % | | | | | 0.15 | % | | | | | 127 | % |
| | | 16.81 | | | | | | 3.89 | | | | | | 14,153 | | | | | | 2.01 | | | | | | 2.22 | | | | | | (0.60 | ) | | | | | 127 | |
| | | 19.84 | | | | | | 5.13 | | | | | | 81,067 | | | | | | 0.86 | | | | | | 1.07 | | | | | | 0.57 | | | | | | 127 | |
| | | 18.82 | | | | | | 4.56 | | | | | | 959 | | | | | | 1.36 | | | | | | 1.58 | | | | | | 0.12 | | | | | | 127 | |
| | | 19.02 | | | | | | 4.99 | | | | | | 1,119 | | | | | | 1.01 | | | | | | 1.23 | | | | | | 0.32 | | | | | | 127 | |
| | | 18.78 | | | | | | 4.45 | | | | | | 8,986 | | | | | | 1.51 | | | | | | 1.72 | | | | | | (0.11 | ) | | | | | 127 | |
| | | 19.84 | | | | | | (1.88 | ) | | | | | 10 | | | | | | 0.86 | (d) | | | | | 1.06 | (d) | | | | | 0.38 | (d) | | | | | 127 | |
| | | 18.25 | | | | | | 9.16 | | | | | | 40,458 | | | | | | 1.27 | | | | | | 1.51 | | | | | | 0.07 | | | | | | 130 | |
| | | 16.18 | | | | | | 8.33 | | | | | | 15,348 | | | | | | 2.02 | | | | | | 2.26 | | | | | | (0.68 | ) | | | | | 130 | |
| | | 18.94 | | | | | | 9.58 | | | | | | 119,013 | | | | | | 0.87 | | | | | | 1.11 | | | | | | 0.47 | | | | | | 130 | |
| | | 18.00 | | | | | | 9.02 | | | | | | 1,769 | | | | | | 1.37 | | | | | | 1.60 | | | | | | (0.04 | ) | | | | | 130 | |
| | | 18.14 | | | | | | 9.39 | | | | | | 448 | | | | | | 1.02 | | | | | | 1.24 | | | | | | 0.47 | | | | | | 130 | |
| | | 17.98 | | | | | | 8.83 | | | | | | 8,126 | | | | | | 1.52 | | | | | | 1.76 | | | | | | (0.18 | ) | | | | | 130 | |
| | | 16.86 | | | | | | 30.64 | | | | | | 42,607 | | | | | | 1.26 | | | | | | 1.46 | | | | | | 1.39 | (e) | | | | | 151 | |
| | | 15.01 | | | | | | 29.73 | | | | | | 16,202 | | | | | | 2.01 | | | | | | 2.21 | | | | | | 0.45 | (e) | | | | | 151 | |
| | | 17.48 | | | | | | 31.18 | | | | | | 134,276 | | | | | | 0.86 | | | | | | 1.06 | | | | | | 1.61 | (e) | | | | | 151 | |
| | | 16.64 | | | | | | 30.55 | | | | | | 2,514 | | | | | | 1.36 | | | | | | 1.56 | | | | | | 1.13 | (e) | | | | | 151 | |
| | | 16.70 | | | | | | 30.94 | | | | | | 1,767 | | | | | | 1.01 | | | | | | 1.21 | | | | | | 1.62 | (e) | | | | | 151 | |
| | | 16.67 | | | | | | 30.39 | | | | | | 7,450 | | | | | | 1.51 | | | | | | 1.73 | | | | | | 0.18 | (e) | | | | | 151 | |
| | | 12.93 | | | | | | 8.04 | (g) | | | | | 49,863 | | | | | | 1.25 | | | | | | 1.46 | | | | | | 0.15 | (f) | | | | | 125 | |
| | | 11.57 | | | | | | 7.26 | (g) | | | | | 12,487 | | | | | | 2.00 | | | | | | 2.21 | | | | | | (0.57 | )(f) | | | | | 125 | |
| | | 13.42 | | | | | | 8.49 | (g) | | | | | 123,556 | | | | | | 0.85 | | | | | | 1.06 | | | | | | 0.55 | (f) | | | | | 125 | |
| | | 12.78 | | | | | | 7.97 | (g) | | | | | 2,133 | | | | | | 1.35 | | | | | | 1.56 | | | | | | 0.10 | (f) | | | | | 125 | |
| | | 12.83 | | | | | | 8.36 | (g) | | | | | 5,389 | | | | | | 1.00 | | | | | | 1.21 | | | | | | 0.43 | (f) | | | | | 125 | |
| | | 12.81 | | | | | | 7.78 | (g) | | | | | 357 | | | | | | 1.50 | | | | | | 1.71 | | | | | | (0.05 | )(f) | | | | | 125 | |
| | | 12.06 | | | | | | 11.05 | | | | | | 65,299 | | | | | | 1.25 | | | | | | 1.42 | | | | | | 0.45 | (h) | | | | | 34 | |
| | | 10.81 | | | | | | 10.14 | | | | | | 13,338 | | | | | | 2.00 | | | | | | 2.17 | | | | | | (0.32 | )(h) | | | | | 34 | |
| | | 12.53 | | | | | | 11.49 | | | | | | 86,058 | | | | | | 0.85 | | | | | | 1.02 | | | | | | 0.87 | (h) | | | | | 34 | |
| | | 11.94 | | | | | | 10.84 | | | | | | 1,548 | | | | | | 1.35 | | | | | | 1.52 | | | | | | 0.32 | (h) | | | | | 34 | |
| | | 12.00 | | | | | | 11.32 | | | | | | 4,959 | | | | | | 1.00 | | | | | | 1.17 | | | | | | 0.70 | (h) | | | | | 34 | |
| | | 11.97 | | | | | | 10.78 | | | | | | 207 | | | | | | 1.50 | | | | | | 1.67 | | | | | | 0.14 | (h) | | | | | 34 | |
| | |
| The accompanying notes are an integral part of these financial statements. | | 81 |
GOLDMAN SACHS SMALL CAP GROWTH INSIGHTS FUND
Financial Highlights
Selected Data for a Share Outstanding Throughout Each Year
| | | | | | | | | | | | | | | | | | | | | | | | | | | | | | |
| | | | | | | | From
investment operations | | | Distributions
to shareholders | |
| | | Year - Share Class | | Net asset
value,
beginning
of year | | | Net
investment
income (loss)(a) | | | Net realized
and unrealized
gain (loss) | | | Total from
investment
operations | | | From net
investment
income | | | From net
realized
gains | | | Total
distributions | |
| | FOR THE FISCAL YEARS ENDED OCTOBER 31, | |
| | 2015 - A | | $ | 31.17 | | | $ | (0.10 | ) | | $ | 1.87 | | | $ | 1.77 | | | $ | — | | | $ | (1.79 | ) | | $ | (1.79 | ) |
| | 2015 - C | | | 26.12 | | | | (0.28 | ) | | | 1.56 | | | | 1.28 | | | | — | | | | (1.79 | ) | | | (1.79 | ) |
| | 2015 - Institutional | | | 35.10 | | | | 0.02 | | | | 2.13 | | | | 2.15 | | | | — | | | | (1.79 | ) | | | (1.79 | ) |
| | 2015 - IR | | | 31.59 | | | | (0.04 | ) | | | 1.92 | | | | 1.88 | | | | — | | | | (1.79 | ) | | | (1.79 | ) |
| | 2015 - R | | | 30.51 | | | | (0.18 | ) | | | 1.83 | | | | 1.65 | | | | — | | | | (1.79 | ) | | | (1.79 | ) |
| | 2015 - R6 (Commenced July 31, 2015) | | | 36.95 | | | | (0.01 | ) | | | (1.48 | ) | | | (1.49 | ) | | | — | | | | — | | | | — | |
| | 2014 - A | | | 31.10 | | | | (0.10 | ) | | | 2.67 | | | | 2.57 | | | | — | | | | (2.50 | ) | | | (2.50 | ) |
| | 2014 - C | | | 26.64 | | | | (0.27 | ) | | | 2.25 | | | | 1.98 | | | | — | | | | (2.50 | ) | | | (2.50 | ) |
| | 2014 - Institutional | | | 34.59 | | | | 0.01 | | | | 3.00 | | | | 3.01 | | | | — | | | | (2.50 | ) | | | (2.50 | ) |
| | 2014 - IR | | | 31.41 | | | | (0.04 | ) | | | 2.72 | | | | 2.68 | | | | — | | | | (2.50 | ) | | | (2.50 | ) |
| | 2014 - R | | | 30.56 | | | | (0.19 | ) | | | 2.64 | | | | 2.45 | | | | — | | | | (2.50 | ) | | | (2.50 | ) |
| | 2013 - A | | | 23.40 | | | | 0.18 | (e) | | | 7.70 | | | | 7.88 | | | | (0.18 | ) | | | — | | | | (0.18 | ) |
| | 2013 - C | | | 20.09 | | | | (0.03 | )(e) | | | 6.63 | | | | 6.60 | | | | (0.05 | ) | | | — | | | | (0.05 | ) |
| | 2013 - Institutional | | | 26.01 | | | | 0.29 | (e) | | | 8.57 | | | | 8.86 | | | | (0.28 | ) | | | — | | | | (0.28 | ) |
| | 2013 - IR | | | 23.64 | | | | 0.18 | (e) | | | 7.83 | | | | 8.01 | | | | (0.24 | ) | | | — | | | | (0.24 | ) |
| | 2013 - R | | | 23.08 | | | | — | (e)(f) | | | 7.68 | | | | 7.68 | | | | (0.20 | ) | | | — | | | | (0.20 | ) |
| | 2012 - A | | | 21.22 | | | | 0.04 | (g) | | | 2.14 | (h) | | | 2.18 | | | | — | | | | — | | | | — | |
| | 2012 - C | | | 18.35 | | | | (0.11 | )(g) | | | 1.85 | (h) | | | 1.74 | | | | — | | | | — | | | | — | |
| | 2012 - Institutional | | | 23.49 | | | | 0.15 | (g) | | | 2.37 | (h) | | | 2.52 | | | | — | | | | — | | | | — | |
| | 2012 - IR | | | 21.39 | | | | 0.03 | (g) | | | 2.22 | (h) | | | 2.25 | | | | — | | | | — | | | | — | |
| | 2012 - R | | | 20.98 | | | | (0.01 | )(g) | | | 2.11 | (h) | | | 2.10 | | | | — | | | | — | | | | — | |
| | 2011 - A | | | 18.49 | | | | (0.05 | )(i) | | | 2.78 | | | | 2.73 | | | | — | | | | — | | | | — | |
| | 2011 - C | | | 16.11 | | | | (0.18 | )(i) | | | 2.42 | | | | 2.24 | | | | — | | | | — | | | | — | |
| | 2011 - Institutional | | | 20.38 | | | | 0.03 | (i) | | | 3.08 | | | | 3.11 | | | | — | | | | — | | | | — | |
| | 2011 - IR | | | 18.58 | | | | (0.08 | )(i) | | | 2.89 | | | | 2.81 | | | | — | | | | — | | | | — | |
| | 2011 - R | | | 18.33 | | | | (0.11 | )(i) | | | 2.76 | | | | 2.65 | | | | — | | | | — | | | | — | |
| | (a) | | Calculated based on the average shares outstanding methodology. |
| | (b) | | Assumes investment at the NAV at the beginning of the year, reinvestment of all dividends and distributions, a complete redemption of the investment at the NAV at the end of the year and no sales or redemption charges. Total returns would be reduced if a sales or redemption charge was taken into account. Returns do not reflect the deduction of taxes that a shareholder would pay on Fund distributions or the redemption of Fund shares. Total returns for periods less than one full year are not annualized. |
| | (c) | | The Fund’s portfolio turnover rate is calculated in accordance with regulatory requirements, without regard to transactions involving short term investments and certain derivatives. If such transactions were included, the Fund’s portfolio turnover rate may be higher. |
| | (e) | | Reflects income recognized from special dividends which amounted to $0.17 per share and 0.65% of average net assets. |
| | (f) | | Amount is less than $0.005 per share. |
| | (g) | | Reflects income recognized from special dividends which amounted to $0.11 per share and 0.51% of average net assets. |
| | (h) | | Reflects payment from affiliate relating to certain investment transactions which amounted to $0.11 per share. Excluding such payment, the total return would have been 9.73%, 8.82%, 8.86%, 10.23%, 9.98% and 9.46%, respectively. |
| | (i) | | Reflects income recognized from special dividends which amounted to $0.07 per share and 0.34% of average net assets. |
| | |
| 82 | | The accompanying notes are an integral part of these financial statements. |
GOLDMAN SACHS SMALL CAP GROWTH INSIGHTS FUND
| | | | | | | | | | | | | | | | | | | | | | | | | | | | | | | | | | | | | | | | |
| | | | | | | | | | | | | | | | | | | | | | | | | | | | | | | | | | |
| | | Net asset
value, end
of year | | | | | Total
return(b) | | | | | Net assets,
end of
year
(in 000s) | | | | | Ratio of
net expenses
to average
net assets | | | | | Ratio of
total expenses
to average
net assets | | | | | Ratio of
net investment
income (loss)
to average net assets | | | | | Portfolio Turnover(c) | |
| | | | |
| | $ | 31.15 | | | | | | 5.95 | % | | | | $ | 43,647 | | | | | | 1.26 | % | | | | | 1.60 | % | | | | | (0.33 | )% | | | | | 145 | % |
| | | 25.61 | | | | | | 5.18 | | | | | | 7,964 | | | | | | 2.01 | | | | | | 2.36 | | | | | | (1.06 | ) | | | | | 145 | |
| | | 35.46 | | | | | | 6.39 | | | | | | 64,023 | | | | | | 0.86 | | | | | | 1.20 | | | | | | 0.06 | | | | | | 145 | |
| | | 31.68 | | | | | | 6.24 | | | | | | 4,683 | | | | | | 1.01 | | | | | | 1.33 | | | | | | (0.12 | ) | | | | | 145 | |
| | | 30.37 | | | | | | 5.67 | | | | | | 2,299 | | | | | | 1.51 | | | | | | 1.85 | | | | | | (0.60 | ) | | | | | 145 | |
| | | 35.46 | | | | | | (4.03 | ) | | | | | 10 | | | | | | 0.85 | (d) | | | | | 1.16 | (d) | | | | | (0.07 | )(d) | | | | | 145 | |
| | | 31.17 | | | | | | 8.74 | | | | | | 32,390 | | | | | | 1.30 | | | | | | 1.86 | | | | | | (0.33 | ) | | | | | 162 | |
| | | 26.12 | | | | | | 7.96 | | | | | | 7,124 | | | | | | 2.05 | | | | | | 2.61 | | | | | | (1.08 | ) | | | | | 162 | |
| | | 35.10 | | | | | | 9.15 | | | | | | 30,166 | | | | | | 0.90 | | | | | | 1.47 | | | | | | 0.02 | | | | | | 162 | |
| | | 31.59 | | | | | | 9.02 | | | | | | 1,269 | | | | | | 1.05 | | | | | | 1.62 | | | | | | (0.12 | ) | | | | | 162 | |
| | | 30.51 | | | | | | 8.48 | | | | | | 847 | | | | | | 1.54 | | | | | | 2.09 | | | | | | (0.63 | ) | | | | | 162 | |
| | | 31.10 | | | | | | 33.98 | | | | | | 30,803 | | | | | | 1.30 | | | | | | 1.93 | | | | | | 0.67 | (e) | | | | | 163 | |
| | | 26.64 | | | | | | 32.92 | | | | | | 7,402 | | | | | | 2.05 | | | | | | 2.68 | | | | | | (0.12 | )(e) | | | | | 163 | |
| | | 34.59 | | | | | | 34.48 | | | | | | 14,171 | | | | | | 0.90 | | | | | | 1.53 | | | | | | 0.96 | (e) | | | | | 163 | |
| | | 31.41 | | | | | | 34.25 | | | | | | 639 | | | | | | 1.05 | | | | | | 1.71 | | | | | | 0.62 | (e) | | | | | 163 | |
| | | 30.56 | | | | | | 33.60 | | | | | | 209 | | | | | | 1.55 | | | | | | 2.18 | | | | | | (0.01 | )(e) | | | | | 163 | |
| | | 23.40 | | | | | | 10.24 | (h) | | | | | 25,662 | | | | | | 1.25 | | | | | | 1.96 | | | | | | 0.16 | (g) | | | | | 116 | |
| | | 20.09 | | | | | | 9.46 | (h) | | | | | 5,247 | | | | | | 2.00 | | | | | | 2.71 | | | | | | (0.59 | )(g) | | | | | 116 | |
| | | 26.01 | | | | | | 10.70 | (h) | | | | | 7,733 | | | | | | 0.85 | | | | | | 1.55 | | | | | | 0.57 | (g) | | | | | 116 | |
| | | 23.64 | | | | | | 10.49 | (h) | | | | | 176 | | | | | | 1.00 | | | | | | 1.70 | | | | | | 0.12 | (g) | | | | | 116 | |
| | | 23.08 | | | | | | 9.98 | (h) | | | | | 30 | | | | | | 1.50 | | | | | | 2.20 | | | | | | (0.08 | )(g) | | | | | 116 | |
| | | 21.22 | | | | | | 14.76 | | | | | | 24,979 | | | | | | 1.25 | | | | | | 1.96 | | | | | | (0.26 | )(i) | | | | | 52 | |
| | | 18.35 | | | | | | 13.90 | | | | | | 5,180 | | | | | | 2.00 | | | | | | 2.71 | | | | | | (1.00 | )(i) | | | | | 52 | |
| | | 23.49 | | | | | | 15.26 | | | | | | 6,959 | | | | | | 0.85 | | | | | | 1.56 | | | | | | 0.14 | (i) | | | | | 52 | |
| | | 21.39 | | | | | | 15.12 | | | | | | 38 | | | | | | 1.00 | | | | | | 1.71 | | | | | | (0.38 | )(i) | | | | | 52 | |
| | | 20.98 | | | | | | 14.46 | | | | | | 19 | | | | | | 1.50 | | | | | | 2.21 | | | | | | (0.51 | )(i) | | | | | 52 | |
| | |
| The accompanying notes are an integral part of these financial statements. | | 83 |
GOLDMAN SACHS SMALL CAP VALUE INSIGHTS FUND
Financial Highlights
Selected Data for a Share Outstanding Throughout Each Year
| | | | | | | | | | | | | | | | | | | | | | | | | | | | | | |
| | | | | | | | From
investment operations | | | Distributions
to shareholders | |
| | | Year - Share Class | | Net asset
value,
beginning
of year | | | Net
investment
income (loss)(a) | | | Net realized
and unrealized
gain (loss) | | | Total from
investment
operations | | | Distributions
to shareholders
from net
investment
income | | | From net
realized
gains | | | Total
distributions | |
| | FOR THE FISCAL YEARS ENDED OCTOBER 31, | |
| | 2015 - A | | $ | 38.89 | | | $ | 0.30 | | | $ | (0.09 | ) | | $ | 0.21 | | | $ | (0.14 | ) | | $ | (0.59 | ) | | $ | (0.73 | ) |
| | 2015 - C | | | 30.40 | | | | — | | | | (0.06 | ) | | | (0.06 | ) | | | — | | | | (0.59 | ) | | | (0.59 | ) |
| | 2015 - Institutional | | | 48.49 | | | | 0.55 | | | | (0.10 | ) | | | 0.45 | | | | (0.29 | ) | | | (0.59 | ) | | | (0.88 | ) |
| | 2015 - IR | | | 38.84 | | | | 0.39 | | | | (0.10 | ) | | | 0.29 | | | | (0.23 | ) | | | (0.59 | ) | | | (0.82 | ) |
| | 2015 - R | | | 38.50 | | | | 0.14 | | | | (0.04 | ) | | | 0.10 | | | | (0.02 | ) | | | (0.59 | ) | | | (0.61 | ) |
| | 2015 - R6 (Commenced July 31, 2015) | | | 48.87 | | | | 0.10 | | | | (0.90 | ) | | | (0.80 | ) | | | — | | | | — | | | | — | |
| | 2014 - A | | | 35.97 | | | | 0.15 | | | | 2.95 | | | | 3.10 | | | | (0.18 | ) | | | — | | | | (0.18 | ) |
| | 2014 - C | | | 28.20 | | | | (0.10 | ) | | | 2.31 | | | | 2.21 | | | | (0.01 | ) | | | — | | | | (0.01 | ) |
| | 2014 - Institutional | | | 44.76 | | | | 0.38 | | | | 3.67 | | | | 4.05 | | | | (0.32 | ) | | | — | | | | (0.32 | ) |
| | 2014 - IR | | | 35.92 | | | | 0.25 | | | | 2.94 | | | | 3.19 | | | | (0.27 | ) | | | — | | | | (0.27 | ) |
| | 2014 - R | | | 35.62 | | | | 0.07 | | | | 2.92 | | | | 2.99 | | | | (0.11 | ) | | | — | | | | (0.11 | ) |
| | 2013 - A | | | 28.75 | | | | 0.42 | (e) | | | 7.12 | | | | 7.54 | | | | (0.32 | ) | | | — | | | | (0.32 | ) |
| | 2013 - C | | | 22.62 | | | | 0.15 | (e) | | | 5.60 | | | | 5.75 | | | | (0.17 | ) | | | — | | | | (0.17 | ) |
| | 2013 - Institutional | | | 35.67 | | | | 0.69 | (e) | | | 8.84 | | | | 9.53 | | | | (0.44 | ) | | | — | | | | (0.44 | ) |
| | 2013 - IR | | | 28.75 | | | | 0.49 | (e) | | | 7.11 | | | | 7.60 | | | | (0.43 | ) | | | — | | | | (0.43 | ) |
| | 2013 - R | | | 28.54 | | | | 0.31 | (e) | | | 7.09 | | | | 7.40 | | | | (0.32 | ) | | | — | | | | (0.32 | ) |
| | 2012 - A | | | 26.36 | | | | 0.22 | (f) | | | 2.31 | (h) | | | 2.53 | | | | (0.14 | ) | | | — | | | | (0.14 | ) |
| | 2012 - C | | | 20.79 | | | | — | (f)(g) | | | 1.83 | (h) | | | 1.83 | | | | — | | | | — | | | | — | |
| | 2012 - Institutional | | | 32.66 | | | | 0.47 | (f) | | | 2.79 | (h) | | | 3.26 | | | | (0.25 | ) | | | — | | | | (0.25 | ) |
| | 2012 - IR | | | 26.40 | | | | 0.31 | (f) | | | 2.28 | (h) | | | 2.59 | | | | (0.24 | ) | | | — | | | | (0.24 | ) |
| | 2012 - R | | | 26.21 | | | | 0.15 | (f) | | | 2.30 | (h) | | | 2.45 | | | | (0.12 | ) | | | — | | | | (0.12 | ) |
| | 2011 - A | | | 24.10 | | | | 0.15 | (i) | | | 2.27 | | | | 2.42 | | | | (0.16 | ) | | | — | | | | (0.16 | ) |
| | 2011 - C | | | 19.06 | | | | (0.04 | )(i) | | | 1.80 | | | | 1.76 | | | | (0.03 | ) | | | — | | | | (0.03 | ) |
| | 2011 - Institutional | | | 29.80 | | | | 0.32 | (i) | | | 2.79 | | | | 3.11 | | | | (0.25 | ) | | | — | | | | (0.25 | ) |
| | 2011 - IR | | | 24.15 | | | | 0.24 | (i) | | | 2.24 | | | | 2.48 | | | | (0.23 | ) | | | — | | | | (0.23 | ) |
| | 2011 - R | | | 23.99 | | | | 0.07 | (i) | | | 2.26 | | | | 2.33 | | | | (0.11 | ) | | | — | | | | (0.11 | ) |
| | (a) | | Calculated based on the average shares outstanding methodology. |
| | (b) | | Assumes investment at the NAV at the beginning of the year, reinvestment of all dividends and distributions, a complete redemption of the investment at the NAV at the end of the year and no sales or redemption charges. Total returns would be reduced if a sales or redemption charge was taken into account. Returns do not reflect the deduction of taxes that a shareholder would pay on Fund distributions or the redemption of Fund shares. Total returns for periods less than one full year are not annualized. |
| | (c) | | The Fund’s portfolio turnover rate is calculated in accordance with regulatory requirements, without regard to transactions involving short term investments and certain derivatives. If such transactions were included, the Fund’s portfolio turnover rate may be higher. |
| | (e) | | Reflects income recognized from special dividends which amounted to $0.20 per share and 0.65% of average net assets. |
| | (f) | | Reflects income recognized from special dividends which amounted to $0.09 per share and 0.33% of average net assets. |
| | (g) | | Amount is less than $0.005 per share. |
| | (h) | | Reflects payment from affiliate relating to certain investment transactions which amounted to $0.07 per share. Excluding such payment, the total return would have been 9.34%, 8.35%, 8.44%, 9.81%, 9.55% and 9.09%, respectively. |
| | (i) | | Reflects income recognized from special dividends which amounted to $0.07 per share and 0.27% of average net assets. |
| | |
| 84 | | The accompanying notes are an integral part of these financial statements. |
GOLDMAN SACHS SMALL CAP VALUE INSIGHTS FUND
| | | | | | | | | | | | | | | | | | | | | | | | | | | | | | | | | | | | | | | | |
| | | | | | | | | | | | | | | | | | | | | | | | | | | | | | | | | | |
| | | Net asset
value, end
of year | | | | | Total
return(b) | | | | | Net assets,
end of
year
(in 000s) | | | | | Ratio of
net expenses
to average
net assets | | | | | Ratio of
total expenses
to average
net assets | | | | | Ratio of
net investment
income (loss)
to average net assets | | | | | Portfolio
turnover
rate(c) | |
| | | | |
| | $ | 38.37 | | | | | | 0.53 | % | | | | $ | 93,151 | | | | | | 1.25 | % | | | | | 1.52 | % | | | | | 0.76 | % | | | | | 133 | % |
| | | 29.75 | | | | | | (0.21 | ) | | | | | 16,416 | | | | | | 2.00 | | | | | | 2.27 | | | | | | 0.01 | | | | | | 133 | |
| | | 48.06 | | | | | | 0.93 | | | | | | 21,036 | | | | | | 0.85 | | | | | | 1.12 | | | | | | 1.13 | | | | | | 133 | |
| | | 38.31 | | | | | | 0.76 | | | | | | 1,774 | | | | | | 1.00 | | | | | | 1.27 | | | | | | 1.00 | | | | | | 133 | |
| | | 37.99 | | | | | | 0.27 | | | | | | 4,992 | | | | | | 1.51 | | | | | | 1.77 | | | | | | 0.36 | | | | | | 133 | |
| | | 48.07 | | | | | | (1.64 | ) | | | | | 10 | | | | | | 0.83 | (d) | | | | | 1.09 | (d) | | | | | 0.83 | (d) | | | | | 133 | |
| | | 38.89 | | | | | | 8.66 | | | | | | 96,094 | | | | | | 1.27 | | | | | | 1.59 | | | | | | 0.41 | | | | | | 114 | |
| | | 30.40 | | | | | | 7.84 | | | | | | 18,994 | | | | | | 2.02 | | | | | | 2.34 | | | | | | (0.34 | ) | | | | | 114 | |
| | | 48.49 | | | | | | 9.12 | | | | | | 15,973 | | | | | | 0.87 | | | | | | 1.20 | | | | | | 0.81 | | | | | | 114 | |
| | | 38.84 | | | | | | 8.94 | | | | | | 1,788 | | | | | | 1.02 | | | | | | 1.35 | | | | | | 0.66 | | | | | | 114 | |
| | | 38.50 | | | | | | 8.40 | | | | | | 1,176 | | | | | | 1.52 | | | | | | 1.84 | | | | | | 0.18 | | | | | | 114 | |
| | | 35.97 | | | | | | 26.54 | | | | | | 99,381 | | | | | | 1.26 | | | | | | 1.54 | | | | | | 1.32 | (e) | | | | | 141 | |
| | | 28.20 | | | | | | 25.63 | | | | | | 19,416 | | | | | | 2.00 | | | | | | 2.29 | | | | | | 0.58 | (e) | | | | | 141 | |
| | | 44.76 | | | | | | 27.05 | | | | | | 12,204 | | | | | | 0.86 | | | | | | 1.13 | | | | | | 1.74 | (e) | | | | | 141 | |
| | | 35.92 | | | | | | 26.91 | | | | | | 1,310 | | | | | | 1.01 | | | | | | 1.29 | | | | | | 1.53 | (e) | | | | | 141 | |
| | | 35.62 | | | | | | 26.21 | | | | | | 1,154 | | | | | | 1.51 | | | | | | 1.79 | | | | | | 0.96 | (e) | | | | | 141 | |
| | | 28.75 | | | | | | 9.60 | (h) | | | | | 87,084 | | | | | | 1.25 | | | | | | 1.52 | | | | | | 0.79 | (f) | | | | | 85 | |
| | | 22.62 | | | | | | 8.78 | (h) | | | | | 17,808 | | | | | | 2.00 | | | | | | 2.27 | | | | | | 0.04 | (f) | | | | | 85 | |
| | | 35.67 | | | | | | 10.02 | (h) | | | | | 12,310 | | | | | | 0.85 | | | | | | 1.11 | | | | | | 1.30 | (f) | | | | | 85 | |
| | | 28.75 | | | | | | 9.82 | (h) | | | | | 455 | | | | | | 1.00 | | | | | | 1.26 | | | | | | 1.11 | (f) | | | | | 85 | |
| | | 28.54 | | | | | | 9.35 | (h) | | | | | 699 | | | | | | 1.50 | | | | | | 1.75 | | | | | | 0.52 | (f) | | | | | 85 | |
| | | 26.36 | | | | | | 10.03 | | | | | | 91,426 | | | | | | 1.25 | | | | | | 1.54 | | | | | | 0.58 | (i) | | | | | 33 | |
| | | 20.79 | | | | | | 9.21 | | | | | | 19,248 | | | | | | 2.00 | | | | | | 2.29 | | | | | | (0.17 | )(i) | | | | | 33 | |
| | | 32.66 | | | | | | 10.46 | | | | | | 3,479 | | | | | | 0.85 | | | | | | 1.14 | | | | | | 0.97 | (i) | | | | | 33 | |
| | | 26.40 | | | | | | 10.29 | | | | | | 223 | | | | | | 1.00 | | | | | | 1.29 | | | | | | 0.96 | (i) | | | | | 33 | |
| | | 26.21 | | | | | | 9.71 | | | | | | 214 | | | | | | 1.50 | | | | | | 1.79 | | | | | | 0.26 | (i) | | | | | 33 | |
| | |
| The accompanying notes are an integral part of these financial statements. | | 85 |
GOLDMAN SACHS U.S. EQUITY INSIGHTS FUND
Financial Highlights
Selected Data for a Share Outstanding Throughout Each Year
| | | | | | | | | | | | | | | | | | | | | | |
| | | | | | | | From
investment operations | | | | |
| | | Year - Share Class | | Net asset
value,
beginning
of year | | | Net
investment
income(a) | | | Net realized
and unrealized
gain (loss) | | | Total from
investment
operations | | | Distributions
to shareholders
from net
investment
income | |
| | FOR THE FISCAL YEARS ENDED OCTOBER 31, | |
| | 2015 - A | | $ | 40.20 | | | $ | 0.43 | | | $ | 1.12 | | | $ | 1.55 | | | $ | (0.29 | ) |
| | 2015 - C | | | 36.78 | | | | 0.11 | | | | 1.03 | | | | 1.14 | | | | (0.04 | ) |
| | 2015 - Institutional | | | 41.29 | | | | 0.60 | | | | 1.16 | | | | 1.76 | | | | (0.45 | ) |
| | 2015 - Service | | | 40.12 | | | | 0.36 | | | | 1.15 | | | | 1.51 | | | | (0.26 | ) |
| | 2015 - IR | | | 39.89 | | | | 0.51 | | | | 1.13 | | | | 1.64 | | | | (0.40 | ) |
| | 2015 - R | | | 39.80 | | | | 0.26 | | | | 1.18 | | | | 1.44 | | | | (0.33 | ) |
| | 2015 - R6 (Commenced July 31, 2015) | | | 43.19 | | | | 0.14 | | | | (0.73 | ) | | | (0.59 | ) | | | — | |
| | 2014 - A | | | 34.52 | | | | 0.33 | | | | 5.71 | | | | 6.04 | | | | (0.36 | ) |
| | 2014 - C | | | 31.63 | | | | 0.05 | | | | 5.24 | | | | 5.29 | | | | (0.14 | ) |
| | 2014 - Institutional | | | 35.44 | | | | 0.49 | | | | 5.86 | | | | 6.35 | | | | (0.50 | ) |
| | 2014 - Service | | | 34.44 | | | | 0.29 | | | | 5.71 | | | | 6.00 | | | | (0.32 | ) |
| | 2014 - IR | | | 34.26 | | | | 0.42 | | | | 5.67 | | | | 6.09 | | | | (0.46 | ) |
| | 2014 - R | | | 34.16 | | | | 0.23 | | | | 5.67 | | | | 5.90 | | | | (0.26 | ) |
| | 2013 - A | | | 26.80 | | | | 0.44 | | | | 7.68 | | | | 8.12 | | | | (0.40 | ) |
| | 2013 - C | | | 24.59 | | | | 0.19 | | | | 7.07 | | | | 7.26 | | | | (0.22 | ) |
| | 2013 - Institutional | | | 27.51 | | | | 0.53 | | | | 7.91 | | | | 8.44 | | | | (0.51 | ) |
| | 2013 - Service | | | 26.76 | | | | 0.41 | | | | 7.65 | | | | 8.06 | | | | (0.38 | ) |
| | 2013 - IR | | | 26.62 | | | | 0.45 | | | | 7.67 | | | | 8.12 | | | | (0.48 | ) |
| | 2013 - R | | | 26.58 | | | | 0.36 | | | | 7.61 | | | | 7.97 | | | | (0.39 | ) |
| | 2012 - A | | | 24.21 | | | | 0.33 | (e) | | | 2.70 | (f) | | | 3.03 | | | | (0.44 | ) |
| | 2012 - C | | | 22.25 | | | | 0.13 | (e) | | | 2.48 | (f) | | | 2.61 | | | | (0.27 | ) |
| | 2012 - Institutional | | | 24.82 | | | | 0.44 | (e) | | | 2.77 | (f) | | | 3.21 | | | | (0.52 | ) |
| | 2012 - Service | | | 24.14 | | | | 0.30 | (e) | | | 2.70 | (f) | | | 3.00 | | | | (0.38 | ) |
| | 2012 - IR | | | 24.08 | | | | 0.37 | (e) | | | 2.69 | (f) | | | 3.06 | | | | (0.52 | ) |
| | 2012 - R | | | 23.98 | | | | 0.22 | (e) | | | 2.73 | (f) | | | 2.95 | | | | (0.35 | ) |
| | 2011 - A | | | 22.32 | | | | 0.31 | (g) | | | 1.87 | | | | 2.18 | | | | (0.29 | ) |
| | 2011 - C | | | 20.54 | | | | 0.12 | (g) | | | 1.72 | | | | 1.84 | | | | (0.13 | ) |
| | 2011 - Institutional | | | 22.89 | | | | 0.44 | (g) | | | 1.87 | | | | 2.31 | | | | (0.38 | ) |
| | 2011 - Service | | | 22.25 | | | | 0.28 | (g) | | | 1.87 | | | | 2.15 | | | | (0.26 | ) |
| | 2011 - IR | | | 22.21 | | | | 0.36 | (g) | | | 1.86 | | | | 2.22 | | | | (0.35 | ) |
| | 2011 - R | | | 22.11 | | | | 0.24 | (g) | | | 1.85 | | | | 2.09 | | | | (0.22 | ) |
| | (a) | | Calculated based on the average shares outstanding methodology. |
| | (b) | | Assumes investment at the NAV at the beginning of the year, reinvestment of all dividends and distributions, a complete redemption of the investment at the NAV at the end of the year and no sales or redemption charges. Total returns would be reduced if a sales or redemption charge was taken into account. Returns do not reflect the deduction of taxes that a shareholder would pay on Fund distributions or the redemption of Fund shares. Total returns for periods less than one full year are not annualized. |
| | (c) | | The Fund’s portfolio turnover rate is calculated in accordance with regulatory requirements, without regard to transactions involving short term investments and certain derivatives. If such transactions were included, the Fund’s portfolio turnover rate may be higher. |
| | (e) | | Reflects income recognized from non-recurring special dividends which amounted to $0.06 per share and 0.23% of average net assets. |
| | (f) | | Reflects payment from affiliate relating to certain investment transactions which amounted to $0.02 per share. Excluding such payment, the total return would have been 12.61%, 11.75%, 11.75%, 13.08%, 12.50%, 12.87%, and 12.33%, respectively. |
| | (g) | | Reflects income recognized from a non-recurring special dividend which amounted to $0.03 per share and 0.13% of average net assets. |
| | |
| 86 | | The accompanying notes are an integral part of these financial statements. |
GOLDMAN SACHS U.S. EQUITY INSIGHTS FUND
| | | | | | | | | | | | | | | | | | | | | | | | | | | | | | | | | | | | | | | | |
| | | | | | | | | | | | | | | | | | | | | | | | | | | | | | | | | | |
| | | Net asset
value, end
of year | | | | | Total
return(b) | | | | | Net assets,
end of
year
(in 000s) | | | | | Ratio of
net expenses
to average
net assets | | | | | Ratio of
total expenses
to average
net assets | | | | | Ratio of
net investment
income to average net assets | | | | | Portfolio
turnover
rate(c) | |
| | | | |
| | $ | 41.46 | | | | | | 3.86 | % | | | | $ | 272,738 | | | | | | 0.96 | % | | | | | 1.17 | % | | | | | 1.04 | % | | | | | 224 | % |
| | | 37.88 | | | | | | 3.09 | | | | | | 37,811 | | | | | | 1.71 | | | | | | 1.92 | | | | | | 0.28 | | | | | | 224 | |
| | | 42.60 | | | | | | 4.27 | | | | | | 121,863 | | | | | | 0.56 | | | | | | 0.77 | | | | | | 1.42 | | | | | | 224 | |
| | | 41.37 | | | | | | 3.75 | | | | | | 3,344 | | | | | | 1.06 | | | | | | 1.27 | | | | | | 0.86 | | | | | | 224 | |
| | | 41.13 | | | | | | 4.12 | | | | | | 4,615 | | | | | | 0.71 | | | | | | 0.92 | | | | | | 1.24 | | | | | | 224 | |
| | | 40.91 | | | | | | 3.58 | | | | | | 27,685 | | | | | | 1.21 | | | | | | 1.42 | | | | | | 0.64 | | | | | | 224 | |
| | | 42.60 | | | | | | (1.37 | ) | | | | | 10 | | | | | | 0.55 | (d) | | | | | 0.74 | (d) | | | | | 1.37 | (d) | | | | | 224 | |
| | | 40.20 | | | | | | 17.67 | | | | | | 275,574 | | | | | | 0.97 | | | | | | 1.21 | | | | | | 0.88 | | | | | | 222 | |
| | | 36.78 | | | | | | 16.80 | | | | | | 36,503 | | | | | | 1.72 | | | | | | 1.96 | | | | | | 0.13 | | | | | | 222 | |
| | | 41.29 | | | | | | 18.14 | | | | | | 105,300 | | | | | | 0.57 | | | | | | 0.81 | | | | | | 1.27 | | | | | | 222 | |
| | | 40.12 | | | | | | 17.57 | | | | | | 1,132 | | | | | | 1.07 | | | | | | 1.31 | | | | | | 0.78 | | | | | | 222 | |
| | | 39.89 | | | | | | 17.98 | | | | | | 1,003 | | | | | | 0.72 | | | | | | 0.96 | | | | | | 1.13 | | | | | | 222 | |
| | | 39.80 | | | | | | 17.42 | | | | | | 457 | | | | | | 1.22 | | | | | | 1.46 | | | | | | 0.63 | | | | | | 222 | |
| | | 34.52 | | | | | | 30.75 | | | | | | 256,626 | | | | | | 0.95 | | | | | | 1.21 | | | | | | 1.46 | | | | | | 203 | |
| | | 31.63 | | | | | | 29.78 | | | | | | 34,143 | | | | | | 1.70 | | | | | | 1.96 | | | | | | 0.70 | | | | | | 203 | |
| | | 35.44 | | | | | | 31.27 | | | | | | 64,809 | | | | | | 0.56 | | | | | | 0.82 | | | | | | 1.70 | | | | | | 203 | |
| | | 34.44 | | | | | | 30.57 | | | | | | 1,020 | | | | | | 1.05 | | | | | | 1.31 | | | | | | 1.37 | | | | | | 203 | |
| | | 34.26 | | | | | | 31.06 | | | | | | 546 | | | | | | 0.71 | | | | | | 0.97 | | | | | | 1.48 | | | | | | 203 | |
| | | 34.16 | | | | | | 30.42 | | | | | | 343 | | | | | | 1.20 | | | | | | 1.46 | | | | | | 1.19 | | | | | | 203 | |
| | | 26.80 | | | | | | 12.69 | (f) | | | | | 239,796 | | | | | | 0.95 | | | | | | 1.20 | | | | | | 1.31 | (e) | | | | | 121 | |
| | | 24.59 | | | | | | 11.84 | (f) | | | | | 30,979 | | | | | | 1.70 | | | | | | 1.95 | | | | | | 0.55 | (e) | | | | | 121 | |
| | | 27.51 | | | | | | 13.16 | (f) | | | | | 33,613 | | | | | | 0.55 | | | | | | 0.80 | | | | | | 1.69 | (e) | | | | | 121 | |
| | | 26.76 | | | | | | 12.58 | (f) | | | | | 1,036 | | | | | | 1.05 | | | | | | 1.30 | | | | | | 1.18 | (e) | | | | | 121 | |
| | | 26.62 | | | | | | 12.96 | (f) | | | | | 198 | | | | | | 0.70 | | | | | | 0.95 | | | | | | 1.45 | (e) | | | | | 121 | |
| | | 26.58 | | | | | | 12.42 | (f) | | | | | 336 | | | | | | 1.20 | | | | | | 1.44 | | | | | | 0.85 | (e) | | | | | 121 | |
| | | 24.21 | | | | | | 9.83 | | | | | | 278,353 | | | | | | 0.95 | | | | | | 1.19 | | | | | | 1.28 | (g) | | | | | 46 | |
| | | 22.25 | | | | | | 9.00 | | | | | | 32,665 | | | | | | 1.70 | | | | | | 1.94 | | | | | | 0.52 | (g) | | | | | 46 | |
| | | 24.82 | | | | | | 10.20 | | | | | | 33,581 | | | | | | 0.55 | | | | | | 0.79 | | | | | | 1.76 | (g) | | | | | 46 | |
| | | 24.14 | | | | | | 9.74 | | | | | | 962 | | | | | | 1.05 | | | | | | 1.29 | | | | | | 1.19 | (g) | | | | | 46 | |
| | | 24.08 | | | | | | 10.09 | | | | | | 105 | | | | | | 0.70 | | | | | | 0.94 | | | | | | 1.57 | (g) | | | | | 46 | |
| | | 23.98 | | | | | | 9.53 | | | | | | 29 | | | | | | 1.20 | | | | | | 1.44 | | | | | | 1.03 | (g) | | | | | 46 | |
| | |
| The accompanying notes are an integral part of these financial statements. | | 87 |
GOLDMAN SACHS DOMESTIC EQUITY INSIGHTS FUNDS
Notes to Financial Statements
October 31, 2015
Goldman Sachs Trust (the “Trust”) is a Delaware statutory trust registered under the Investment Company Act of 1940, as amended (the “Act”), as an open-end management investment company. The following table lists those series of the Trust that are included in this report (collectively, the “Funds” or individually a “Fund”), along with their corresponding share classes and respective diversification status under the Act:
| | | | |
| Fund | | Share Classes Offered* | | Diversified/ Non-diversified |
Large Cap Growth Insights, Large Cap Value Insights, Small Cap Equity Insights and U.S. Equity Insights | | A, C, Institutional, Service, IR, R and R6 | | Diversified |
Small Cap Growth Insights and Small Cap Value Insights | | A, C, Institutional, IR, R and R6 | | Diversified |
| * | | Class R6 Shares commenced on July 31, 2015. |
Class A Shares are sold with a front-end sales charge of up to 5.50%. Class C Shares are sold with a contingent deferred sales charge (“CDSC”) of 1.00%, which is imposed on redemptions made within 12 months of purchase. Institutional, Service, Class IR, Class R and Class R6 Shares are not subject to a sales charge.
At the close of business on November 14, 2014, Class B Shares of each Fund were converted to Class A Shares of the Fund.
Goldman Sachs Asset Management, L.P. (“GSAM”), an affiliate of Goldman, Sachs & Co. (“Goldman Sachs”), serves as investment adviser to the Funds pursuant to a management agreement (the “Agreement”) with the Trust.
| | |
| 2. SIGNIFICANT ACCOUNTING POLICIES | | |
The financial statements have been prepared in accordance with accounting principles generally accepted in the United States of America (“GAAP”) and require management to make estimates and assumptions that may affect the reported amounts and disclosures. Actual results may differ from those estimates and assumptions.
A. Investment Valuation — The Funds’ valuation policy is to value investments at fair value.
B. Investment Income and Investments — Investment income includes interest income and dividend income, net of any foreign withholding taxes, less any amounts reclaimable. Interest income is accrued daily and adjusted for amortization of premiums and accretion of discounts. Dividend income is recognized on ex-dividend date or, for certain foreign securities, as soon as such information is obtained subsequent to the ex-dividend date. Investment transactions are reflected on trade date. Realized gains and losses are calculated using identified cost. Investment transactions are recorded on the following business day for daily net asset value (“NAV”) calculations. Any foreign capital gains tax is accrued daily based upon net unrealized gains, and is payable upon sale of such investments. Distributions received from the Funds’ investments in U.S. real estate investment trusts (“REITs”) may be characterized as ordinary income, net capital gain or a return of capital. A return of capital is recorded by the Funds as a reduction to the cost basis of the REIT.
For derivative contracts, realized gains and losses are recorded upon settlement of the contract.
88
GOLDMAN SACHS DOMESTIC EQUITY INSIGHTS FUNDS
|
| 2. SIGNIFICANT ACCOUNTING POLICIES (continued) |
C. Class Allocations and Expenses — Investment income, realized and unrealized gain (loss), and non-class specific expenses of each Fund are allocated daily based upon the proportion of net assets of each class. Non-class specific expenses directly incurred by a Fund are charged to that Fund, while such expenses incurred by the Trust are allocated across the applicable Funds on a straight-line and/or pro-rata basis depending upon the nature of the expenses. Class specific expenses, where applicable, are borne by the respective share classes and include Distribution and Service, Transfer Agency and Service and Shareholder Administration fees.
D. Federal Taxes and Distributions to Shareholders — It is each Fund’s policy to comply with the requirements of the Internal Revenue Code of 1986, as amended (the “Code”), applicable to regulated investment companies (mutual funds) and to distribute each year substantially all of its investment company taxable income and capital gains to its shareholders. Accordingly, the Funds are not required to make any provisions for the payment of federal income tax. Distributions to shareholders are recorded on the ex-dividend date. Income and capital gains distributions, if any, are declared and paid according to the following schedule:
| | | | | | |
| Fund | | | | Income Distributions Declared/Paid | | Capital Gains Distributions Declared/Paid |
Large Cap Value Insights | | | | Quarterly | | Annually |
Large Cap Growth Insights, Small Cap Equity Insights, Small Cap Growth Insights, Small Cap Value Insights and U.S. Equity Insights | | | | Annually | | Annually |
Net capital losses are carried forward to future fiscal years and may be used to the extent allowed by the Code to offset any future capital gains. Utilization of capital loss carryforwards will reduce the requirement of future capital gains distributions.
Under the Regulated Investment Company Modernization Act of 2010, the Funds are permitted to carry forward capital losses incurred in taxable years beginning after December 22, 2010 for an unlimited period. However, any losses incurred during those future taxable years will be required to be utilized prior to the losses incurred in pre-enactment taxable years. As a result of this ordering rule, pre-enactment capital loss carryforwards may be more likely to expire unused. Additionally, post enactment capital losses that are carried forward will retain their character as either short term or long term capital losses rather than being considered all short-term as under previous law.
The characterization of distributions to shareholders for financial reporting purposes is determined in accordance with federal income tax rules, which may differ from GAAP. The source of each Fund’s distributions may be shown in the accompanying financial statements as either from net investment income, net realized gain or capital. Certain components of the Funds’ net assets on the Statements of Assets and Liabilities reflect permanent GAAP/tax differences based on the appropriate tax character.
| | |
| 3. INVESTMENTS AND FAIR VALUE MEASUREMENTS | | |
The fair value of a financial instrument is the amount that would be received to sell an asset or paid to transfer a liability in an orderly transaction between market participants at the measurement date (i.e., the exit price). GAAP establishes a fair value hierarchy that prioritizes the inputs to valuation techniques used to measure fair value. The hierarchy gives the highest priority to
89
GOLDMAN SACHS DOMESTIC EQUITY INSIGHTS FUNDS
Notes to Financial Statements (continued)
October 31, 2015
|
| 3. INVESTMENTS AND FAIR VALUE MEASUREMENTS (continued) |
unadjusted quoted prices in active markets for identical assets or liabilities (Level 1 measurements) and the lowest priority to unobservable inputs (Level 3 measurements). The levels used for classifying investments are not necessarily an indication of the risk associated with investing in these investments. The three levels of the fair value hierarchy are described below:
Level 1 — Unadjusted quoted prices in active markets that are accessible at the measurement date for identical, unrestricted assets or liabilities;
Level 2 — Quoted prices in markets that are not active or financial instruments for which significant inputs are observable (including, but not limited to, quoted prices for similar investments, interest rates, foreign exchange rates, volatility and credit spreads), either directly or indirectly;
Level 3 — Prices or valuations that require significant unobservable inputs (including GSAM’s assumptions in determining fair value measurement).
Changes in valuation techniques may result in transfers into or out of an assigned level within the hierarchy. In accordance with the Funds’ policy, transfers between different levels of the fair value hierarchy resulting from such changes are deemed to have occurred as of the beginning of the reporting period.
The Board of Trustees (“Trustees”) has approved Valuation Procedures that govern the valuation of the portfolio investments held by the Funds, including investments for which market quotations are not readily available. The Trustees have delegated to GSAM day-to-day responsibility for implementing and maintaining internal controls and procedures related to the valuation of the Funds’ portfolio investments. To assess the continuing appropriateness of pricing sources and methodologies, GSAM regularly performs price verification procedures and issues challenges as necessary to third party pricing vendors or brokers, and any differences are reviewed in accordance with the Valuation Procedures.
A. Level 1 and Level 2 Fair Value Investments — The valuation techniques and significant inputs used in determining the fair values for investments classified as Level 1 and Level 2 are as follows:
Equity Securities — Equity securities and investment companies traded on a United States (“U.S.”) securities exchange or the NASDAQ system, or those located on certain foreign exchanges, including but not limited to the Americas, are valued daily at their last sale price or official closing price on the principal exchange or system on which they are traded. If there is no sale or official closing price or such price is believed by GSAM to not represent fair value, equity securities and exchange traded investment companies are valued at the last bid price for long positions and at the last ask price for short positions. Investments in investment companies (other than those that are exchange traded) are valued at the NAV on the valuation date. To the extent these investments are actively traded, they are classified as Level 1 of the fair value hierarchy, otherwise they are generally classified as Level 2.
Unlisted equity securities for which market quotations are available are valued at the last sale price on the valuation date, or if no sale occurs, at the last bid price. Securities traded on certain foreign securities exchanges are valued daily at fair value determined by an independent fair value service (if available) under Valuation Procedures approved by the Trustees and consistent with applicable regulatory guidance. The independent fair value service takes into account multiple factors including, but not limited to, movements in the securities markets, certain depositary receipts, futures contracts and foreign currency exchange rates that have occurred subsequent to the close of the foreign securities exchange. These investments are generally classified as Level 2 of the fair value hierarchy.
90
GOLDMAN SACHS DOMESTIC EQUITY INSIGHTS FUNDS
|
| 3. INVESTMENTS AND FAIR VALUE MEASUREMENTS (continued) |
Money Market Funds — Investments in the Goldman Sachs Financial Square Money Market Fund (“Underlying Fund”) are valued at the NAV of the FST Share class on the day of valuation. These investments are generally classified as Level 1 of the fair value hierarchy.
Derivative Contracts — A derivative is an instrument whose value is derived from underlying assets, indices, reference rates or a combination of these factors. The Funds enter into derivative transactions to hedge against changes in interest rates, securities prices, and/or currency exchange rates, to increase total return, or to gain access to certain markets or attain exposure to other underliers.
Exchange-traded derivatives, including futures and options contracts, are valued at the last sale or settlement price and typically fall within Level 1 of the fair value hierarchy. Over-the-counter (“OTC”) and centrally cleared derivatives are valued using market transactions and other market evidence, including market-based inputs to models, calibration to market-clearing transactions, broker or dealer quotations, or other alternative pricing sources. Where models are used, the selection of a particular model to value OTC and centrally cleared derivatives depends upon the contractual terms of, and specific risks inherent in, the instrument, as well as the availability of pricing information in the market. Valuation models require a variety of inputs, including contractual terms, market prices, yield curves, credit curves, measures of volatility, voluntary and involuntary prepayment rates, loss severity rates and correlations of such inputs. For OTC and centrally cleared derivatives that trade in liquid markets, model inputs can generally be verified and model selection does not involve significant management judgment. OTC and centrally cleared derivatives are classified within Level 2 of the fair value hierarchy when significant inputs are corroborated by market evidence.
i. Futures Contracts — Futures contracts are contracts to buy or sell a standardized quantity of a specified commodity or security and are valued based on exchanged settlement prices or independent market quotes. Futures contracts are valued at the last settlement price, or in the absence of a sale, the last bid price for long positions and at the last ask price for short positions, at the end of each day on the board of trade or exchange upon which they are traded. Upon entering into a futures contract, a Fund deposits cash or securities in an account on behalf of the broker in an amount sufficient to meet the initial margin requirement. Subsequent payments are made or received by a Fund equal to the daily change in the contract value and are recorded as variation margin receivable or payable with a corresponding offset to unrealized gains or losses.
Short Term Investments — Short-term investments having a maturity of 60 days or less are generally valued at amortized cost which approximates fair market value. These investments are classified as Level 2 of the fair value hierarchy.
i. Repurchase Agreements — Repurchase agreements involve the purchase of securities subject to the seller’s agreement to repurchase the securities at a mutually agreed upon date and price, under the terms of a Master Repurchase Agreement (“MRA”). During the term of a repurchase agreement, the value of the underlying securities held as collateral on behalf of a Fund, including accrued interest, is required to exceed the value of the repurchase agreement, including accrued interest. The gross value of repurchase agreements is included in the Statements of Assets and Liabilities for financial reporting purposes. The underlying securities for all repurchase agreements are held at the Funds’ custodian or designated sub-custodians under tri-party repurchase agreements.
91
GOLDMAN SACHS DOMESTIC EQUITY INSIGHTS FUNDS
Notes to Financial Statements (continued)
October 31, 2015
|
| 3. INVESTMENTS AND FAIR VALUE MEASUREMENTS (continued) |
An MRA governs transactions between a Fund and select counterparties. An MRA contains provisions for, among other things, initiation of the transaction, income payments, events of default and maintenance of securities for repurchase agreements. An MRA also permits offsetting with collateral to create one single net payment in the event of default or similar events, including the bankruptcy or insolvency of a counterparty.
If the seller defaults, a Fund could suffer a loss to the extent that the proceeds from the sale of the underlying securities and other collateral held by the Fund are less than the repurchase price and the Fund’s costs associated with delay and enforcement of the repurchase agreement. In addition, in the event of default or insolvency of the seller, a court could determine that a Fund’s interest in the collateral is not enforceable, resulting in additional losses to the Fund.
Pursuant to exemptive relief granted by the Securities and Exchange Commission (“SEC”) and terms and conditions contained therein, the Funds, together with other funds of the Trust and registered investment companies having management agreements with GSAM or its affiliates, may transfer uninvested cash into joint accounts, the daily aggregate balance of which is invested in one or more repurchase agreements. Under these joint accounts, the Funds maintain pro-rata credit exposure to the underlying repurchase agreements’ counterparties. With the exception of certain transaction fees, the Funds are not subject to any expenses in relation to these investments.
B. Level 3 Fair Value Investments — To the extent that significant inputs to valuation models and other alternative pricing sources are unobservable, or if quotations are not readily available, or if GSAM believes that such quotations do not accurately reflect fair value, the fair value of the Funds’ investments may be determined under Valuation Procedures approved by the Trustees. GSAM, consistent with its procedures and applicable regulatory guidance, may make an adjustment to the most recent valuation prices of either domestic or foreign securities in light of significant events to reflect what it believes to be the fair value of the securities at the time of determining a Fund’s NAV. Significant events which could affect a large number of securities in a particular market may include, but are not limited to: significant fluctuations in U.S. or foreign markets; market dislocations; market disruptions; or unscheduled market closings. Significant events which could also affect a single issuer may include, but are not limited to: corporate actions such as reorganizations, mergers and buy-outs; ratings downgrades; and bankruptcies.
C. Fair Value Hierarchy — The following is a summary of the Funds’ investments and derivatives classified in the fair value hierarchy as of October 31, 2015:
| | | | | | | | | | | | |
| | | |
| LARGE CAP GROWTH INSIGHTS | | | | | | | | | | | | |
| | | |
| Investment Type | | Level 1 | | | Level 2 | | | Level 3 | |
| Assets | |
Common Stock and/or Other Equity Investments(a) | | | | | | | | | | | | |
Asia | | $ | 513,083 | | | $ | — | | | $ | — | |
Europe | | | 18,752,654 | | | | — | | | | — | |
North America | | | 750,239,230 | | | | — | | | | — | |
Short-term Investment | | | — | | | | 21,900,000 | | | | — | |
| Total | | $ | 769,504,967 | | | $ | 21,900,000 | | | $ | — | |
92
GOLDMAN SACHS DOMESTIC EQUITY INSIGHTS FUNDS
|
| 3. INVESTMENTS AND FAIR VALUE MEASUREMENTS (continued) |
| | | | | | | | | | | | |
| | | |
| LARGE CAP GROWTH INSIGHTS (continued) | | | | | | | | | | | | |
| | | |
| Derivative Type | | Level 1 | | | Level 2 | | | Level 3 | |
| Assets(b) | | | | | | | | | | | | |
Futures Contracts | | $ | 599,055 | | | $ | — | | | $ | — | |
| | | |
| LARGE CAP VALUE INSIGHTS | | | | | | | | | | | | |
| | | |
| Investment Type | | Level 1 | | | Level 2 | | | Level 3 | |
| Assets | |
Common Stock and/or Other Equity Investments(a) | | | | | | | | | | | | |
Europe | | $ | 5,450,956 | | | $ | — | | | $ | — | |
North America | | | 372,900,526 | | | | — | | | | — | |
Short-term Investment | | | — | | | | 9,400,000 | | | | — | |
Securities Lending Reinvestment Vehicle | | | 1,543,540 | | | | — | | | | — | |
| Total | | $ | 379,895,022 | | | $ | 9,400,000 | | | $ | — | |
| | | |
| Derivative Type | | | | | | | | | |
| Assets(b) | | | | | | | | | | | | |
Futures Contracts | | $ | 197,557 | | | $ | — | | | $ | — | |
| | | |
| SMALL CAP EQUITY INSIGHTS | | | | | | | | | | | | |
| | | |
| Investment Type | | Level 1 | | | Level 2 | | | Level 3 | |
| Assets | |
Common Stock and/or Other Equity Investments(a) | | | | | | | | | | | | |
Europe | | $ | 730,047 | | | $ | — | | | $ | — | |
North America | | | 136,392,307 | | | | — | | | | — | |
South America | | | 288,063 | | | | — | | | | — | |
Short-term Investment | | | — | | | | 3,400,000 | | | | — | |
Securities Lending Reinvestment Vehicle | | | 3,040,011 | | | | — | | | | — | |
| Total | | $ | 140,450,428 | | | $ | 3,400,000 | | | $ | — | |
93
GOLDMAN SACHS DOMESTIC EQUITY INSIGHTS FUNDS
Notes to Financial Statements (continued)
October 31, 2015
|
| 3. INVESTMENTS AND FAIR VALUE MEASUREMENTS (continued) |
| | | | | | | | | | | | |
| | | |
| SMALL CAP EQUITY INSIGHTS (continued) | | | | | | | | | | | | |
| | | |
| Derivative Type | | Level 1 | | | Level 2 | | | Level 3 | |
| Assets(b) | | | | | | | | | | | | |
Futures Contracts | | $ | 15,939 | | | $ | — | | | $ | — | |
| | | |
| SMALL CAP GROWTH INSIGHTS | | | | | | | | | | | | |
| | | |
| Investment Type | | Level 1 | | | Level 2 | | | Level 3 | |
| Assets | |
Common Stock and/or Other Equity Investments(a) | | | | | | | | | | | | |
Europe | | $ | 770,352 | | | $ | — | | | $ | — | |
North America | | | 118,615,541 | | | | — | | | | — | |
Short-term Investment | | | — | | | | 3,200,000 | | | | — | |
Securities Lending Reinvestment Vehicle | | | 3,384,225 | | | | — | | | | — | |
| Total | | $ | 122,770,118 | | | $ | 3,200,000 | | | $ | — | |
| | | |
| Derivative Type | | | | | | | | | |
| Assets(b) | | | | | | | | | | | | |
Futures Contracts | | $ | 87,551 | | | $ | — | | | $ | — | |
| | | |
| SMALL CAP VALUE INSIGHTS | | | | | | | | | | | | |
| | | |
| Investment Type | | Level 1 | | | Level 2 | | | Level 3 | |
| Assets | |
Common Stock and/or Other Equity Investments(a) | | | | | | | | | | | | |
Europe | | $ | 447,952 | | | $ | — | | | $ | — | |
North America | | | 133,664,874 | | | | — | | | | — | |
South America | | | 55,297 | | | | — | | | | — | |
Short-term Investment | | | — | | | | 3,500,000 | | | | — | |
Securities Lending Reinvestment Vehicle | | | 3,158,375 | | | | — | | | | — | |
| Total | | $ | 137,326,498 | | | $ | 3,500,000 | | | $ | — | |
| | | |
| Derivative Type | | | | | | | | | |
| Assets(b) | | | | | | | | | | | | |
Futures Contracts | | $ | 8,401 | | | $ | — | | | $ | — | |
94
GOLDMAN SACHS DOMESTIC EQUITY INSIGHTS FUNDS
|
| 3. INVESTMENTS AND FAIR VALUE MEASUREMENTS (continued) |
| | | | | | | | | | | | |
| | | |
| U.S. EQUITY INSIGHTS | | | | | | | | | | | | |
| | | |
| Investment Type | | Level 1 | | | Level 2 | | | Level 3 | |
| Assets | |
Common Stock and/or Other Equity Investments(a) | | | | | | | | | | | | |
Europe | | $ | 14,697,203 | | | $ | — | | | $ | — | |
North America | | | 435,553,711 | | | | — | | | | — | |
Short-term Investment | | | — | | | | 17,700,000 | | | | — | |
Securities Lending Reinvestment Vehicle | | | 729,425 | | | | — | | | | — | |
| Total | | $ | 450,980,339 | | | $ | 17,700,000 | | | $ | — | |
| | | |
| Derivative Type | | | | | | | | | |
| Assets(b) | | | | | | | | | | | | |
Futures Contracts | | $ | 423,310 | | | $ | — | | | $ | — | |
| (a) | | Amounts are disclosed by continent to highlight the impact of time zone differences between local market close and the calculation of NAV. Security valuations are based on the principal exchange or system on which they are traded, which may differ from country of domicile. |
| (b) | | Amount shown represents unrealized gain (loss) at period end. |
For further information regarding security characteristics, see the Schedules of Investments.
| | |
| 4. INVESTMENTS IN DERIVATIVES | | |
The following tables set forth, by certain risk types, the gross value of derivative contracts as of October 31, 2015. These instruments were used as part of the Funds’ investment strategies and to obtain and/or manage exposure related to the risks below. The values in the tables below exclude the effects of cash collateral received or posted pursuant to these derivative contracts, and therefore are not representative of the Funds’ net exposure.
| | | | | | | | | | | | | | |
| Risk | | | | Fund | | | | Statements of Assets and Liabilities | | | | Assets(a) | |
Equity | | | | Large Cap Growth Insights | | | | Variation margin on certain derivative contracts | | | | | $599,055 | |
Equity | | | | Large Cap Value Insights | | | | Variation margin on certain derivative contracts | | | | | 197,557 | |
Equity | | | | Small Cap Equity Insights | | | | Variation margin on certain derivative contracts | | | | | 15,939 | |
Equity | | | | Small Cap Growth Insights | | | | Variation margin on certain derivative contracts | | | | | 87,551 | |
Equity | | | | Small Cap Value Insights | | | | Variation margin on certain derivative contracts | | | | | 8,401 | |
Equity | | | | U.S. Equity Insights | | | | Variation margin on certain derivative contracts | | | | | 423,310 | |
| (a) | | Includes unrealized gain (loss) on futures contracts described in the Additional Investment Information sections of the Schedules of Investments. Only current day’s variation margin is reported within the Statements of Assets and Liabilities. |
95
GOLDMAN SACHS DOMESTIC EQUITY INSIGHTS FUNDS
Notes to Financial Statements (continued)
October 31, 2015
|
| 4. INVESTMENTS IN DERIVATIVES (continued) |
The following tables set forth, by certain risk types, the Funds’ gains (losses) related to these derivatives and their indicative volumes for the fiscal year ended October 31, 2015. These gains (losses) should be considered in the context that these derivative contracts may have been executed to create investment opportunities and/or economically hedge certain investments, and accordingly, certain gains (losses) on such derivative contracts may offset certain (losses) gains attributable to investments. These gains (losses) are included in “Net realized gain (loss)” or “Net change in unrealized gain (loss)” on the Statements of Operations:
| | | | | | | | | | | | | | | | | | | | |
| Risk | | | | Fund | | | | Net
Realized
Gain (Loss) | | | | | Net Change in
Unrealized
Gain (Loss) | | | Average
Number of
Contracts(a) | |
Equity | | | | Large Cap Growth Insights | | | | $ | 23,881 | | | | | $ | 204,228 | | | | 110 | |
Equity | | | | Large Cap Value Insights | | | | | 334,701 | | | | | | 1,569 | | | | 45 | |
Equity | | | | Small Cap Equity Insights | | | | | 217,119 | | | | | | (217,964 | ) | | | 22 | |
Equity | | | | Small Cap Growth Insights | | | | | (206,215 | ) | | | | | 48,636 | | | | 17 | |
Equity | | | | Small Cap Value Insights | | | | | (26,362 | ) | | | | | (36,501 | ) | | | 17 | |
Equity | | | | U.S. Equity Insights | | | | | 831,281 | | | | | | 312,698 | | | | 93 | |
| (a) | | Average number of contracts is based on the average of month end balances for the fiscal year ended October 31, 2015. |
In order to better define its contractual rights and to secure rights that will help a Fund mitigate its counterparty risk, a Fund may enter into an International Swaps and Derivatives Association, Inc. Master Agreement (“ISDA Master Agreement”) or similar agreement with its derivatives counterparties. An ISDA Master Agreement is a bilateral agreement between a Fund and a counterparty that governs OTC derivatives (including forward foreign currency exchange contracts, and certain options and swaps), and typically contains, among other things, collateral posting terms and netting provisions in the event of a default and/or termination event. The provisions of the ISDA Master Agreement typically permit a single net payment in the event of a default (close-out netting) or similar event, including the bankruptcy or insolvency of the counterparty.
Collateral and margin requirements differ between exchange traded derivatives and OTC derivatives. Margin requirements are established by the broker or clearing house for exchange-traded and centrally cleared derivatives (financial futures contracts, options and centrally cleared swaps) pursuant to governing agreements for those instrument types. Brokers can ask for margin in excess of the minimum in certain circumstances. Collateral terms are contract-specific for OTC derivatives. For derivatives traded under an ISDA Master Agreement, the collateral requirements are typically calculated by netting the marked to market amount for each transaction under such agreement and comparing that amount to the value of any collateral currently pledged by a Fund and the counterparty. Additionally, a Fund may be required to post initial margin to the counterparty, the terms of which would be outlined in the confirmation of the OTC transaction.
For financial reporting purposes, cash collateral that has been pledged to cover obligations of a Fund and cash collateral received from the counterparty, if any, is reported separately on the Statements of Assets and Liabilities as receivables/payables for collateral on certain derivative contracts. Non-cash collateral pledged by a Fund, if any, is noted in the Schedules of Investments. Generally, the amount of collateral due from or to a counterparty must exceed a minimum transfer amount threshold before a transfer is required to be made. To the extent amounts due to a Fund from its counterparties are not fully collateralized,
96
GOLDMAN SACHS DOMESTIC EQUITY INSIGHTS FUNDS
|
| 4. INVESTMENTS IN DERIVATIVES (continued) |
contractually or otherwise, the Fund bears the risk of loss from counterparty nonperformance. A Fund attempts to mitigate counterparty risk by only entering into agreements with counterparties that the Investment Adviser believes to be of good standing and by monitoring the financial stability of those counterparties.
Additionally, the netting of assets and liabilities and the offsetting of collateral pledged or received are based on contractual netting/set-off provisions in the ISDA Master Agreement or similar agreements. However, in the event of a default or insolvency of a counterparty, a court could determine that such rights are not enforceable due to the restrictions or prohibitions against the right of setoff that may be imposed in accordance with a particular jurisdiction’s bankruptcy or insolvency laws.
| | |
| 5. AGREEMENTS AND AFFILIATED TRANSACTIONS | | |
A. Management Agreement — Under the Agreement, GSAM manages the Funds, subject to the general supervision of the Trustees.
As compensation for the services rendered pursuant to the Agreement, the assumption of the expenses related thereto and administration of the Funds’ business affairs, including providing facilities, GSAM is entitled to a management fee, accrued daily and paid monthly, equal to an annual percentage rate of each Fund’s average daily net assets.
For the fiscal year ended October 31, 2015, contractual and effective net management fees with GSAM were at the following rates:
| | | | | | | | | | | | | | | | | | | | | | | | | | | | | | |
| | | | | Contractual Management Rate | | | Effective Net
Management
Rate* | |
| Fund | | | | First
$1 billion | | | Next
$1 billion | | | Next
$3 billion | | | Next
$3 billion | | | Over
$8 billion | | | Effective
Rate | | |
Large Cap Growth Insights | | | | | 0.65 | % | | | 0.59 | % | | | 0.56 | % | | | 0.55 | % | | | 0.54 | % | | | 0.65 | % | | | 0.52 | % |
Large Cap Value Insights | | | | | 0.60 | | | | 0.54 | | | | 0.51 | | | | 0.50 | | | | 0.49 | | | | 0.60 | | | | 0.52 | |
Small Cap Equity Insights | | | | | 0.85 | | | | 0.85 | | | | 0.77 | | | | 0.73 | | | | 0.72 | | | | 0.85 | | | | 0.82 | |
Small Cap Growth Insights | | | | | 0.85 | | | | 0.85 | | | | 0.77 | | | | 0.73 | | | | 0.72 | | | | 0.85 | | | | 0.82 | # |
Small Cap Value Insights | | | | | 0.85 | | | | 0.85 | | | | 0.77 | | | | 0.73 | | | | 0.72 | | | | 0.85 | | | | 0.81 | |
U.S. Equity Insights | | | | | 0.65 | | | | 0.59 | | | | 0.56 | | | | 0.55 | | | | 0.54 | | | | 0.65 | | | | 0.52 | |
| * | | GSAM has agreed to waive a portion of its management fee in order to achieve net management rates, as defined in the Funds’ most recent prospectuses. These waivers will be effective through at least July 31, 2016, and prior to such date GSAM may not terminate the arrangements without the approval of the Trustees. The Effective Net Management Rates above are calculated based on management rates before and after waivers had been adjusted, if applicable. |
| # | | Effective February 27, 2015, GSAM agreed to waive a portion of its management fee in order to achieve an effective net management rate of 0.81% for the Small Cap Growth Insights Fund. Prior to February 27, 2015, the effective net management rate for the Small Cap Growth Insights Fund was 0.84%. |
B. Distribution and Service Plans —The Trust, on behalf of each Fund, has adopted Distribution and Service Plans (the “Plans”). Under the Plans, Goldman Sachs, which serves as distributor (the “Distributor”), is entitled to a fee accrued daily and
97
GOLDMAN SACHS DOMESTIC EQUITY INSIGHTS FUNDS
Notes to Financial Statements (continued)
October 31, 2015
|
| 5. AGREEMENTS AND AFFILIATED TRANSACTIONS (continued) |
paid monthly, for distribution services and personal and account maintenance services, which may then be paid by Goldman Sachs to authorized dealers, at the following annual rates calculated on a Fund’s average daily net assets of each respective share class:
| | | | | | | | | | | | |
| | | Distribution and Service Plan Rates | |
| | | Class A* | | | Class C | | | Class R* | |
Distribution Plan | | | 0.25 | % | | | 0.75 | % | | | 0.50 | % |
Service Plan | | | — | | | | 0.25 | | | | — | |
| * | | With respect to Class A and Class R Shares, the Distributor at its discretion may use compensation for distribution services paid under the Distribution Plan to compensate service organizations for personal and account maintenance services and expenses as long as such total compensation does not exceed the maximum cap on “service fees” imposed by the Financial Industry Regulatory Authority. |
C. Distribution Agreement — Goldman Sachs, as Distributor of the shares of the Funds pursuant to a Distribution Agreement, may retain a portion of the Class A Shares’ front end sales charge and Class C Shares’ CDSC. During the fiscal year ended October 31, 2015, Goldman Sachs advised that it retained the following amounts:
| | | | | | | | | | |
| | | | | Front End
Sales Charge | | | Contingent Deferred
Sales Charge | |
| Fund | | | | Class A | | | Class C | |
Large Cap Growth Insights | | | | $ | 30,709 | | | $ | 101 | |
Large Cap Value Insights | | | | | 7,687 | | | | 718 | |
Small Cap Equity Insights | | | | | 2,227 | | | | 593 | |
Small Cap Growth Insights | | | | | 6,483 | | | | — | |
Small Cap Value Insights | | | | | 3,480 | | | | — | |
U.S. Equity Insights | | | | | 9,588 | | | | 819 | |
D. Service Plan and Shareholder Administration Plan — The Trust, on behalf of each Fund that offers Service Shares, has adopted a Service Plan and a Shareholder Administration Plan. These plans allow for service organizations to provide varying levels of personal and account maintenance and shareholder administration services to their customers who are beneficial owners of such shares. The Service Plan and Shareholder Administration Plan each provide for compensation to the service organizations which is accrued daily and paid monthly at an annual rate of 0.25% (0.50% in aggregate) of the average daily net assets of the Service Shares.
E. Transfer Agency Agreement — Goldman Sachs also serves as the transfer agent of the Funds for a fee pursuant to the Transfer Agency Agreement. The fees charged for such transfer agency services are accrued daily and paid monthly at annual rates as follows: 0.19% of the average daily net assets of Class A, Class C, Class IR and Class R Shares; 0.02% of the average daily net assets of Class R6 Shares; and 0.04% of the average daily net assets of Institutional and Service Shares.
98
GOLDMAN SACHS DOMESTIC EQUITY INSIGHTS FUNDS
|
| 5. AGREEMENTS AND AFFILIATED TRANSACTIONS (continued) |
F. Other Expense Agreements and Affiliated Transactions — GSAM has agreed to limit certain “Other Expenses” of the Funds (excluding acquired fund fees and expenses, transfer agency fees and expenses, service fees, shareholder administration fees (as applicable), taxes, interest, brokerage fees, shareholder meeting, litigation, indemnification and extraordinary expenses) to the extent such expenses exceed, on an annual basis, a percentage rate of the average daily net assets of each Fund. Such Other Expense reimbursements, if any, are accrued daily and paid monthly. In addition, the Funds are not obligated to reimburse GSAM for prior fiscal year expense reimbursements, if any. The Other Expense limitations as an annual percentage rate of average daily net assets are 0.004%. These Other Expense limitations will remain in place through at least July 31, 2016, and prior to such date GSAM may not terminate the arrangements without the approval of the Trustees. In addition, the Funds have entered into certain offset arrangements with the transfer agent, which may result in a reduction of the Funds’ expenses and are received irrespective of the application of the “Other Expense” limitations described above.
For the fiscal year ended October 31, 2015, these expense reductions, including any fee waivers and Other Expense reimbursements, were as follows:
| | | | | | | | | | | | | | |
| Fund | | | | Management
Fee Waiver | | | Other Expense
Reimbursements | | | Total
Expense
Reductions | |
Large Cap Growth Insights | | | | $ | 834,400 | | | $ | 437,135 | | | $ | 1,271,535 | |
Large Cap Value Insights | | | | | 369,848 | | | | 340,753 | | | | 710,601 | |
Small Cap Equity Insights | | | | | 49,909 | | | | 297,507 | | | | 347,416 | |
Small Cap Growth Insights | | | | | 32,373 | | | | 307,058 | | | | 339,431 | |
Small Cap Value Insights | | | | | 56,074 | | | | 314,967 | | | | 371,041 | |
U.S. Equity Insights | | | | | 623,647 | | | | 371,716 | | | | 995,363 | |
G. Line of Credit Facility — As of October 31, 2015, the Funds participated in a $1,205,000,000 committed, unsecured revolving line of credit facility (the “facility”) together with other funds of the Trust and registered investment companies having management agreements with GSAM or its affiliates (“Other Borrowers”). Pursuant to the terms of the facility, the Funds and Other Borrowers could increase the credit amount by up to an additional $115,000,000, for a total of up to $1,320,000,000. This facility is to be used for temporary emergency purposes, or to allow for an orderly liquidation of securities to meet redemption requests. The interest rate on borrowings is based on the federal funds rate. The facility also requires a fee to be paid by the Funds based on the amount of the commitment that has not been utilized. For the fiscal year ended October 31, 2015, the Funds did not have any borrowings under the facility.
H. Other Transactions with Affiliates — For the fiscal year ended October 31, 2015, Goldman Sachs earned $8,798, $656, $1,189, $1,178, $280 and $3,720 in brokerage commissions from portfolio transactions, including futures transactions executed with Goldman Sachs as the Futures Commission Merchant, on behalf of the Large Cap Growth Insights, Large Cap Value Insights, Small Cap Equity Insights, Small Cap Growth Insights, Small Cap Value Insights and U.S. Equity Insights Funds, respectively.
99
GOLDMAN SACHS DOMESTIC EQUITY INSIGHTS FUNDS
Notes to Financial Statements (continued)
October 31, 2015
|
| 5. AGREEMENTS AND AFFILIATED TRANSACTIONS (continued) |
As of October 31, 2015, the following Fund of Funds Portfolios were beneficial owners of 5% or more of total outstanding shares of the following Funds:
| | | | | | | | | | | | | | | | | | | | | | |
| Fund | | | | Goldman Sachs
Balanced Strategy
Portfolio | | | Goldman Sachs
Enhanced Dividend Global
Equity Portfolio | | | Goldman Sachs
Equity Growth
Strategy Portfolio | | | Goldman Sachs
Growth and Income
Strategy Portfolio | | | Goldman Sachs
Growth Strategy
Portfolio | |
Large Cap Growth Insights | | | | | — | % | | | — | % | | | 9 | % | | | 13 | % | | | 15 | % |
Large Cap Value Insights | | | | | 6 | | | | — | | | | 16 | | | | 21 | | | | 26 | |
Small Cap Equity Insights | | | | | — | | | | 27 | | | | — | | | | — | | | | — | |
| | |
| 6. PORTFOLIO SECURITIES TRANSACTIONS | | |
The cost of purchases and proceeds from sales and maturities of long-term securities for the fiscal year ended October 31, 2015, were as follows:
| | | | | | | | | | |
| Fund | | | | Purchases | | | Sales and Maturities | |
Large Cap Growth Insights | | | | $ | 1,711,780,670 | | | $ | 1,367,312,268 | |
Large Cap Value Insights | | | | | 975,255,575 | | | | 1,068,389,308 | |
Small Cap Equity Insights | | | | | 204,133,259 | | | | 253,693,447 | |
Small Cap Growth Insights | | | | | 185,955,784 | | | | 139,133,888 | |
Small Cap Value Insights | | | | | 179,979,423 | | | | 182,504,055 | |
U.S. Equity Insights | | | | | 1,062,417,149 | | | | 1,038,218,566 | |
Pursuant to exemptive relief granted by the SEC and the terms and conditions contained therein, the Funds may lend their securities through a securities lending agent, Goldman Sachs Agency Lending (“GSAL”), a wholly-owned subsidiary of Goldman Sachs, to certain qualified borrowers including Goldman Sachs and affiliates. In accordance with the Funds’ securities lending procedures, the Funds receive cash collateral at least equal to the market value of the securities on loan. The market value of the loaned securities is determined at the close of business of the Funds, at their last sale price or official closing price on the principal exchange or system on which they are traded, and any additional required collateral is delivered to the Funds on the next business day. As with other extensions of credit, the Funds may experience delay in the recovery of their securities or incur a loss should the borrower of the securities breach its agreement with the Funds or become insolvent at a time when the collateral is insufficient to cover the cost of repurchasing securities on loan. Dividend income received from securities on loan may not be subject to withholding taxes and therefore withholding taxes paid may differ from the amounts listed in the Statement of Operations. Loans
100
GOLDMAN SACHS DOMESTIC EQUITY INSIGHTS FUNDS
|
| 7. SECURITIES LENDING (continued) |
of securities are terminable at any time and the borrower, after notice, is required to return borrowed securities within the standard time period for settlement of securities transactions. As the securities loans are subject to termination by the Funds or the borrower at any time, the remaining contractual maturities of the outstanding securities lending transactions are considered to be overnight and continuous.
The Funds invest the cash collateral received in connection with securities lending transactions in the Goldman Sachs Financial Square Money Market Fund (“Money Market Fund”), an affiliated series of the Trust. The Money Market Fund is registered under the Act as an open end investment company, is subject to Rule 2a-7 under the Act, and is managed by GSAM, for which GSAM may receive an investment advisory fee of up to 0.205% on an annualized basis of the average daily net assets of the Money Market Fund.
In the event of a default by a borrower with respect to any loan, GSAL will exercise any and all remedies provided under the applicable borrower agreement to make the Funds whole. These remedies include purchasing replacement securities by applying the collateral held from the defaulting broker against the purchase cost of the replacement securities. If, despite such efforts by GSAL to exercise these remedies, the Funds sustain losses as a result of a borrower’s default, GSAL indemnifies the Funds by purchasing replacement securities at GSAL’s expense, or paying the Funds an amount equal to the market value of the replacement securities, subject to an exclusion for any shortfalls resulting from a loss of value in the cash collateral pool due to reinvestment risk and a requirement that the Funds agree to assign rights to the collateral to GSAL for purpose of using the collateral to cover purchase of replacement securities as more fully described in the Securities Lending Agency Agreement. The Funds’ loaned securities were all subject to enforceable Securities Lending Agreements and the value of the collateral is at least equal to the value of the securities on loan. The value of loaned securities and cash collateral at period end are disclosed in the Funds’ Statements of Assets and Liabilities.
Both the Funds and GSAL received compensation relating to the lending of the Funds’ securities. The amounts earned by the Funds for the fiscal year ended October 31, 2015, are reported under Investment Income on the Statements of Operations.
The table below details securities lending activity with affiliates of Goldman Sachs:
| | | | | | | | | | | | | | |
| | | | | For the Fiscal Year Ended October 31, 2015 | | | Amounts Payable to
Goldman Sachs
Upon Return of
Securities Loaned as of
October 31, 2015 | |
| Fund | | | | Earnings of GSAL
Relating to
Securities
Loaned | | | Amounts Received
by the Funds
from Lending to
Goldman Sachs | | |
Large Cap Growth Insights | | | | $ | 2,489 | | | $ | 13,689 | | | $ | — | |
Large Cap Value Insights | | | | | 2,089 | | | | 13,595 | | | | 1,420,800 | |
Small Cap Equity Insights | | | | | 11,235 | | | | 19,783 | | | | 515,625 | |
Small Cap Growth Insights | | | | | 10,427 | | | | 24,422 | | | | 467,025 | |
Small Cap Value Insights | | | | | 8,604 | | | | 7,963 | | | | 950,250 | |
U.S. Equity Insights | | | | | 1,318 | | | | 5,354 | | | | 729,425 | |
101
GOLDMAN SACHS DOMESTIC EQUITY INSIGHTS FUNDS
Notes to Financial Statements (continued)
October 31, 2015
|
| 7. SECURITIES LENDING (continued) |
The following table provides information about the Funds’ investment in the Money Market Fund for the fiscal year ended October 31, 2015:
| | | | | | | | | | | | | | | | | | | | | | |
| Fund | | | | Number of
Shares Held
Beginning of Year | | | Shares
Bought | | | Shares Sold | | | Number of
Shares Held End of Year | | | Value at End of Year | |
Large Cap Growth Insights | | | | | 9,972,213 | | | | 48,551,417 | | | | (58,523,630 | ) | | | — | | | $ | — | |
Large Cap Value Insights | | | | | 5,490,200 | | | | 35,850,533 | | | | (39,797,193 | ) | | | 1,543,540 | | | | 1,543,540 | |
Small Cap Equity Insights | | | | | 16,225,232 | | | | 69,130,501 | | | | (82,315,722 | ) | | | 3,040,011 | | | | 3,040,011 | |
Small Cap Growth Insights | | | | | 5,813,078 | | | | 41,847,518 | | | | (44,276,371 | ) | | | 3,384,225 | | | | 3,384,225 | |
Small Cap Value Insights | | | | | 6,709,250 | | | | 41,666,050 | | | | (45,216,925 | ) | | | 3,158,375 | | | | 3,158,375 | |
U.S. Equity Insights | | | | | 7,637,400 | | | | 38,516,744 | | | | (45,424,719 | ) | | | 729,425 | | | | 729,425 | |
The tax character of distributions paid during the fiscal year ended October 31, 2015 was as follows:
| | | | | | | | | | | | | | | | | | | | | | | | |
| | | Large Cap
Growth
Insights | | | Large Cap
Value
Insights | | | Small Cap
Equity
Insights | | | Small Cap
Growth
Insights | | | Small Cap
Value
Insights | | | U.S. Equity
Insights | |
Distributions paid from: | | | | | | | | | | | | | | | | | | | | | | | | |
Ordinary income | | $ | 3,671,218 | | | $ | 7,737,765 | | | $ | 426,865 | | | $ | — | | | $ | 424,071 | | | $ | 3,562,323 | |
Net long-term capital gains | | | — | | | | — | | | | — | | | | 4,119,103 | | | | 2,180,611 | | | | — | |
Total taxable distributions | | $ | 3,671,218 | | | $ | 7,737,765 | | | $ | 426,865 | | | $ | 4,119,103 | | | $ | 2,604,682 | | | $ | 3,562,323 | |
The tax character of distributions paid during the fiscal year ended October 31, 2014 was as follows:
| | | | | | | | | | | | | | | | | | | | | | | | |
| | | Large Cap
Growth
Insights | | | Large Cap
Value
Insights | | | Small Cap
Equity
Insights | | | Small Cap
Growth
Insights | | | Small Cap
Value
Insights | | | U.S. Equity
Insights | |
Distributions paid from: | | | | | | | | | | | | | | | | | | | | | | | | |
Ordinary income | | $ | 3,777,467 | | | $ | 4,862,136 | | | $ | 2,107,936 | | | $ | — | | | $ | 619,933 | | | $ | 3,780,144 | |
Net long-term capital gains | | | — | | | | — | | | | — | | | | 4,550,361 | | | | — | | | | — | |
Total taxable distributions | | $ | 3,777,467 | | | $ | 4,862,136 | | | $ | 2,107,936 | | | $ | 4,550,361 | | | $ | 619,933 | | | $ | 3,780,144 | |
102
GOLDMAN SACHS DOMESTIC EQUITY INSIGHTS FUNDS
|
| 8. TAX INFORMATION (continued) |
As of October 31, 2015, the components of accumulated earnings (losses) on a tax basis were as follows:
| | | | | | | | | | | | | | | | | | | | | | | | |
| | | Large Cap
Growth
Insights | | | Large Cap
Value
Insights | | | Small Cap
Equity
Insights | | | Small Cap
Growth
Insights | | | Small Cap
Value
Insights | | | U.S. Equity
Insights | |
Undistributed ordinary income — net | | $ | 5,978,181 | | | $ | 262,540 | | | $ | 436,395 | | | $ | 3,241,972 | | | $ | 1,384,097 | | | $ | 4,044,396 | |
Undistributed long-term capital gains | | | — | | | | — | | | | — | | | | 7,360,257 | | | | 6,499,613 | | | | 13,425,092 | |
Total undistributed earnings | | | 5,978,181 | | | | 262,540 | | | | 436,395 | | | | 10,602,229 | | | | 7,883,710 | | | | 17,469,488 | |
Capital loss carryforwards:(1)(2) | | | | | | | | | | | | | | | | | | | | | | | | |
Expiring 2017 | | | (257,361,720 | ) | | | (302,004,878 | ) | | | (74,933,486 | ) | | | — | | | | — | | | | — | |
Expiring 2018 | | | — | | | | — | | | | — | | | | — | | | | — | | | | — | |
Total capital loss carryovers | | $ | (257,361,720 | ) | | $ | (302,004,878 | ) | | $ | (74,933,486 | ) | | $ | — | | | $ | — | | | $ | — | |
Timing differences (Qualified Late Year
Ordinary Loss Deferral) | | $ | — | | | $ | — | | | $ | — | | | $ | — | | | $ | — | | | $ | — | |
Unrealized gains — net | | | 35,065,801 | | | | (1,671,595 | ) | | | (1,977,917 | ) | | | 302,994 | | | | 3,449,247 | | | | 28,456,345 | |
Total accumulated earnings (losses) — net | | $ | (216,317,738 | ) | | $ | (303,413,933 | ) | | $ | (76,475,008 | ) | | $ | 10,905,223 | | | $ | 11,332,957 | | | $ | 45,925,833 | |
| (1) | | Expiration occurs on October 31 of the year indicated. |
| (2) | | The Large Cap Growth Insights, Large Cap Value Insights, Small Cap Equity Insights and U.S. Equity Insights Funds utilized $30,535,958, $28,137,311, $21,375,720 and $2,911,798, respectively, of capital losses in the current fiscal year. |
As of October 31, 2015, the Funds’ aggregate security unrealized gains and losses based on cost for U.S. federal income tax purposes were as follows:
| | | | | | | | | | | | | | | | | | | | | | | | |
| | | Large Cap
Growth Insights | | | Large Cap
Value Insights | | | Small Cap
Equity Insights | | | Small Cap
Growth Insights | | | Small Cap Value Insights | | | U.S. Equity Insights | |
Tax Cost | | $ | 756,339,166 | | | $ | 390,966,617 | | | $ | 145,828,345 | | | $ | 125,667,124 | | | $ | 137,377,251 | | | $ | 440,223,994 | |
Gross unrealized gain | | | 52,201,925 | | | | 14,087,175 | | | | 13,563,641 | | | | 10,732,068 | | | | 15,252,183 | | | | 35,989,990 | |
Gross unrealized loss | | | (17,136,124 | ) | | | (15,758,770 | ) | | | (15,541,558 | ) | | | (10,429,074 | ) | | | (11,802,936 | ) | | | (7,533,645 | ) |
Net unrealized gain (loss) | | $ | 35,065,801 | | | $ | (1,671,595 | ) | | $ | (1,977,917 | ) | | $ | 302,994 | | | $ | 3,449,247 | | | $ | 28,456,345 | |
The difference between GAAP-basis and tax basis unrealized gains (losses) is attributable primarily to wash sales, net mark to market gains (losses) on regulated futures contracts, and underlying fund investments.
In order to present certain components of the Funds’ capital accounts on a tax-basis, certain reclassifications have been recorded to the Funds’ accounts. These reclassifications have no impact on the net asset value of the Funds’ and result primarily
103
GOLDMAN SACHS DOMESTIC EQUITY INSIGHTS FUNDS
Notes to Financial Statements (continued)
October 31, 2015
|
| 8. TAX INFORMATION (continued) |
from net operating losses, dividend redesignations, and differences in the tax treatment of passive foreign investment company investments, real estate investment trust investments and underlying fund investments.
| | | | | | | | | | | | | | |
| Fund | | | | Paid-in-Capital | | | Accumulated Net Realized Gain (Loss) | | | Undistributed Net Investment Income (Loss) | |
Large Cap Growth Insights | | | | $ | — | | | $ | 72,925 | | | $ | (72,925 | ) |
Large Cap Value Insights | | | | | — | | | | 32,174 | | | | (32,174 | ) |
Small Cap Equity Insights | | | | | — | | | | (177 | ) | | | 177 | |
Small Cap Growth Insights | | | | | — | | | | (430,961 | ) | | | 430,961 | |
Small Cap Value Insights | | | | | — | | | | (52,393 | ) | | | 52,393 | |
U.S. Equity Insights | | | | | — | | | | 25,156 | | | | (25,156 | ) |
GSAM has reviewed the Funds’ tax positions for all open tax years (the current and prior three years, as applicable) and has concluded that no provision for income tax is required in the Funds’ financial statements. Such open tax years remain subject to examination and adjustment by tax authorities.
The Funds’ risks include, but are not limited to, the following:
Large Shareholder Transactions Risk — A Fund may experience adverse effects when certain large shareholders, such as other funds, institutional investors (including those trading by use of non-discretionary mathematical formulas), financial intermediaries (who may make investment decisions on behalf of underlying clients and/or include a Fund in their investment model), individuals, accounts and Goldman Sachs affiliates, purchase or redeem large amounts of shares of a Fund. Such large shareholder redemptions may cause the Fund to sell portfolio securities at times when it would not otherwise do so, which may negatively impact a Fund’s NAV and liquidity. These transactions may also accelerate the realization of taxable income to shareholders if such sales of investments resulted in gains, and may also increase transaction costs. In addition, a large redemption could result in a Fund’s current expenses being allocated over a smaller asset base, leading to an increase in the Fund’s expense ratio. Similarly, large Fund share purchases may adversely affect a Fund’s performance to the extent that a Fund is delayed in investing new cash and, as a result, maintains a larger cash position than it ordinarily would.
Liquidity Risk — A Fund may make investments that are illiquid or that may become less liquid in response to market developments or adverse investor perceptions. Illiquid investments may be more difficult to value. Liquidity risk may also refer to the risk that a Fund will not be able to pay redemption proceeds within the allowable time period because of unusual market conditions, an unusually high volume of redemption requests, or other reasons. To meet redemption requests, a Fund may be forced to sell investments at an unfavorable time and/or under unfavorable conditions.
104
GOLDMAN SACHS DOMESTIC EQUITY INSIGHTS FUNDS
|
| 9. OTHER RISKS (continued) |
Market and Credit Risks — In the normal course of business, the Funds trade financial instruments and enter into financial transactions where risk of potential loss exists due to changes in the market (market risk). Additionally, the Funds may also be exposed to credit risk in the event that an issuer or guarantor fails to perform or that an institution or entity with which the Funds have unsettled or open transactions defaults.
Investing in foreign markets may involve special risks and considerations not typically associated with investing in the U.S. Foreign securities may be subject to risk of loss because of more or less foreign government regulation, less public information and less economic, political and social stability in the countries in which the Funds invest. Loss may also result from the imposition of exchange controls, confiscations and other government restrictions by the U.S. or other governments, or from problems in registration, settlement or custody. Foreign risk also involves the risk of negative foreign currency rate fluctuations, which may cause the value of securities denominated in such foreign currency (or other instruments through which the Funds have exposure to foreign currencies) to decline in value. Currency exchange rates may fluctuate significantly over short periods of time. To the extent that the Funds also invest in securities of issuers located in emerging markets, these risks may be more pronounced.
Under the Trust’s organizational documents, its Trustees, officers, employees and agents are indemnified, to the extent permitted by the Act and state law, against certain liabilities that may arise out of performance of their duties to the Funds. Additionally, in the course of business, the Funds enter into contracts that contain a variety of indemnification clauses. The Funds’ maximum exposure under these arrangements is unknown, as this would involve future claims that may be made against the Funds that have not yet occurred. However, GSAM believes the risk of loss under these arrangements to be remote.
Subsequent events after the Statements of Assets and Liabilities date have been evaluated through the date the financial statements were issued. GSAM has concluded that there is no impact requiring adjustment or disclosure in the financial statements.
105
GOLDMAN SACHS DOMESTIC EQUITY INSIGHTS FUNDS
Notes to Financial Statements (continued)
October 31, 2015
|
| 12. SUMMARY OF SHARE TRANSACTIONS |
Share activity is as follows:
| | | | | | | | | | | | | | | | |
| | | Large Cap Growth Insights Fund | |
| | | | |
| | | For the Fiscal Year Ended
October 31, 2015
| | | For the Fiscal Year Ended
October 31, 2014
| |
| | | | |
| | | Shares | | | Dollars | | | Shares | | | Dollars | |
| | | | |
| Class A Shares | | | | | | | | | | | | | | | | |
Shares sold | | | 6,980,525 | | | $ | 158,182,514 | | | | 1,140,971 | | | $ | 23,041,804 | |
Reinvestment of distributions | | | 29,769 | | | | 663,856 | | | | 29,429 | | | | 536,186 | |
Shares converted from Class B(a) | | | 84,680 | | | | 1,853,649 | | | | 34,771 | | | | 682,123 | |
Shares redeemed | | | (2,780,922 | ) | | | (61,357,303 | ) | | | (972,493 | ) | | | (19,422,128 | ) |
| | | | 4,314,052 | | | | 99,342,716 | | | | 232,678 | | | | 4,837,985 | |
| Class B Shares(a) | | | | | | | | | | | | | | | | |
Shares sold | | | 1,430 | | | | 28,727 | | | | 4,202 | | | | 79,218 | |
Reinvestment of distributions | | | — | | | | — | | | | 335 | | | | 5,643 | |
Shares converted to Class A | | | (92,267 | ) | | | (1,853,649 | ) | | | (37,723 | ) | | | (682,123 | ) |
Shares redeemed | | | (26,872 | ) | | | (539,733 | ) | | | (64,301 | ) | | | (1,155,549 | ) |
| | | | (117,709 | ) | | | (2,364,655 | ) | | | (97,487 | ) | | | (1,752,811 | ) |
| Class C Shares | | | | | | | | | | | | | | | | |
Shares sold | | | 1,668,170 | | | | 34,397,515 | | | | 206,466 | | | | 3,840,197 | |
Reinvestment of distributions | | | 2,142 | | | | 43,723 | | | | 2,208 | | | | 36,935 | |
Shares redeemed | | | (297,232 | ) | | | (6,075,919 | ) | | | (75,781 | ) | | | (1,365,814 | ) |
| | | | 1,373,080 | | | | 28,365,319 | | | | 132,893 | | | | 2,511,318 | |
| Institutional Shares | | | | | | | | | | | | | | | | |
Shares sold | | | 16,236,775 | | | | 370,091,930 | | | | 3,689,139 | | | | 73,143,280 | |
Reinvestment of distributions | | | 113,490 | | | | 2,601,195 | | | | 167,029 | | | | 3,125,118 | |
Shares redeemed | | | (7,807,696 | ) | | | (179,500,970 | ) | | | (7,291,686 | ) | | | (149,714,093 | ) |
| | | | 8,542,569 | | | | 193,192,155 | | | | (3,435,518 | ) | | | (73,445,695 | ) |
| Service Shares | | | | | | | | | | | | | | | | |
Shares sold | | | 129,202 | | | | 2,926,882 | | | | 26,507 | | | | 541,116 | |
Reinvestment of distributions | | | 224 | | | | 4,945 | | | | — | | | | — | |
Shares redeemed | | | (13,229 | ) | | | (296,508 | ) | | | (72,284 | ) | | | (1,311,426 | ) |
| | | | 116,197 | | | | 2,635,319 | | | | (45,777 | ) | | | (770,310 | ) |
| Class IR Shares | | | | | | | | | | | | | | | | |
Shares sold | | | 1,604,319 | | | | 35,541,423 | | | | 939,114 | | | | 19,456,980 | |
Reinvestment of distributions | | | 11,163 | | | | 245,693 | | | | 452 | | | | 8,140 | |
Shares redeemed | | | (1,015,414 | ) | | | (22,474,490 | ) | | | (9,849 | ) | | | (195,622 | ) |
| | | | 600,068 | | | | 13,312,626 | | | | 929,717 | | | | 19,269,498 | |
| Class R Shares | | | | | | | | | | | | | | | | |
Shares sold | | | 521,668 | | | | 11,563,543 | | | | 12,928 | | | | 263,010 | |
Reinvestment of distributions | | | 358 | | | | 7,860 | | | | 169 | | | | 3,030 | |
Shares redeemed | | | (77,735 | ) | | | (1,703,414 | ) | | | (8,006 | ) | | | (159,897 | ) |
| | | | 444,291 | | | | 9,867,989 | | | | 5,091 | | | | 106,143 | |
| Class R6 Shares(b) | | | | | | | | | | | | | | | | |
Shares sold | | | 418 | | | | 10,005 | | | | — | | | | — | |
Shares redeemed | | | — | | | | (5 | ) | | | — | | | | — | |
| | | | 418 | | | | 10,000 | | | | — | | | | — | |
NET INCREASE (DECREASE) | | | 15,272,966 | | | $ | 344,361,469 | | | | (2,278,403 | ) | | $ | (49,243,872 | ) |
| (a) | | Class B Shares were converted into Class A Shares at the close of business on November 14, 2014. |
| (b) | | Commenced operations on July 31, 2015. |
106
GOLDMAN SACHS DOMESTIC EQUITY INSIGHTS FUNDS
|
| 12. SUMMARY OF SHARE TRANSACTIONS (continued) |
Share activity is as follows:
| | | | | | | | | | | | | | | | |
| | | Large Cap Value Insights Fund | |
| | | | |
| | | For the Fiscal Year Ended
October 31, 2015
| | | For the Fiscal Year Ended
October 31, 2014
| |
| | | | |
| | | Shares | | | Dollars | | | Shares | | | Dollars | |
| | | | |
| Class A Shares | | | | | | | | | | | | | | | | |
Shares sold | | | 902,296 | | | $ | 15,392,196 | | | | 1,244,957 | | | $ | 20,053,474 | |
Reinvestment of distributions | | | 49,079 | | | | 819,032 | | | | 32,033 | | | | 509,338 | |
Shares converted from Class B(a) | | | 6,658 | | | | 113,458 | | | | 1,748 | | | | 28,286 | |
Shares redeemed | | | (1,005,320 | ) | | | (17,091,804 | ) | | | (1,150,727 | ) | | | (18,291,690 | ) |
| | | | (47,287 | ) | | | (767,118 | ) | | | 128,011 | | | | 2,299,408 | |
| Class B Shares(a) | | | | | | | | | | | | | | | | |
Shares sold | | | — | | | | — | | | | 1,211 | | | | 19,707 | |
Reinvestment of distributions | | | — | | | | — | | | | 73 | | | | 1,120 | |
Shares converted to Class A | | | (6,694 | ) | | | (113,458 | ) | | | (1,759 | ) | | | (28,286 | ) |
Shares redeemed | | | (29,394 | ) | | | (498,274 | ) | | | (48,028 | ) | | | (743,920 | ) |
| | | | (36,088 | ) | | | (611,732 | ) | | | (48,503 | ) | | | (751,379 | ) |
| Class C Shares | | | | | | | | | | | | | | | | |
Shares sold | | | 235,997 | | | | 3,989,634 | | | | 260,358 | | | | 4,120,167 | |
Reinvestment of distributions | | | 6,337 | | | | 104,927 | | | | 2,277 | | | | 35,992 | |
Shares redeemed | | | (300,441 | ) | | | (5,066,530 | ) | | | (209,275 | ) | | | (3,277,855 | ) |
| | | | (58,107 | ) | | | (971,969 | ) | | | 53,360 | | | | 878,304 | |
| Institutional Shares | | | | | | | | | | | | | | | | |
Shares sold | | | 4,901,399 | | | | 82,201,640 | | | | 9,200,717 | | | | 146,961,493 | |
Reinvestment of distributions | | | 385,344 | | | | 6,445,256 | | | | 260,091 | | | | 4,145,244 | |
Shares redeemed | | | (10,882,262 | ) | | | (184,786,985 | ) | | | (2,999,668 | ) | | | (47,610,683 | ) |
| | | | (5,595,519 | ) | | | (96,140,089 | ) | | | 6,461,140 | | | | 103,496,054 | |
| Service Shares | | | | | | | | | | | | | | | | |
Shares sold | | | 183,049 | | | | 3,146,866 | | | | 83,939 | | | | 1,351,563 | |
Reinvestment of distributions | | | 5,491 | | | | 91,694 | | | | 2,905 | | | | 46,412 | |
Shares redeemed | | | (118,827 | ) | | | (2,023,233 | ) | | | (70,290 | ) | | | (1,097,018 | ) |
| | | | 69,713 | | | | 1,215,327 | | | | 16,554 | | | | 300,957 | |
| Class IR Shares | | | | | | | | | | | | | | | | |
Shares sold | | | 313,549 | | | | 5,305,827 | | | | 301,660 | | | | 4,816,810 | |
Reinvestment of distributions | | | 6,425 | | | | 107,537 | | | | 2,052 | | | | 33,636 | |
Shares redeemed | | | (310,210 | ) | | | (5,271,427 | ) | | | (12,031 | ) | | | (194,521 | ) |
| | | | 9,764 | | | | 141,937 | | | | 291,681 | | | | 4,655,925 | |
| Class R Shares | | | | | | | | | | | | | | | | |
Shares sold | | | 57,648 | | | | 975,790 | | | | 19,968 | | | | 319,030 | |
Reinvestment of distributions | | | 387 | | | | 6,328 | | | | 27 | | | | 420 | |
Shares redeemed | | | (2,338 | ) | | | (39,551 | ) | | | (5,619 | ) | | | (88,919 | ) |
| | | | 55,697 | | | | 942,567 | | | | 14,376 | | | | 230,531 | |
| Class R6 Shares(b) | | | | | | | | | | | | | | | | |
Shares sold | | | 580 | | | | 10,005 | | | | — | | | | — | |
Reinvestment of distributions | | | 3 | | | | 46 | | | | — | | | | — | |
Shares redeemed | | | — | | | | (5 | ) | | | — | | | | — | |
| | | | 583 | | | | 10,046 | | | | — | | | | — | |
NET INCREASE (DECREASE) | | | (5,601,244 | ) | | $ | (96,181,031 | ) | | | 6,916,619 | | | $ | 111,109,800 | |
| (a) | | Class B Shares were converted into Class A Shares at the close of business on November 14, 2014. |
| (b) | | Commenced operations on July 31, 2015. |
107
GOLDMAN SACHS DOMESTIC EQUITY INSIGHTS FUNDS
Notes to Financial Statements (continued)
October 31, 2015
|
| 12. SUMMARY OF SHARE TRANSACTIONS (continued) |
Share activity is as follows:
| | | | | | | | | | | | | | | | |
| | | Small Cap Equity Insights Fund | |
| | | | |
| | | For the Fiscal Year Ended
October 31, 2015
| | | For the Fiscal Year Ended
October 31, 2014
| |
| | | | |
| | | Shares | | | Dollars | | | Shares | | | Dollars | |
| | | | |
| Class A Shares | | | | | | | | | | | | | | | | |
Shares sold | | | 466,697 | | | $ | 8,958,486 | | | | 641,097 | | | $ | 11,340,505 | |
Reinvestment of distributions | | | — | | | | — | | | | 19,655 | | | | 335,904 | |
Shares converted from Class B(a) | | | 1,362 | | | | 25,015 | | | | 1,048 | | | | 18,626 | |
Shares redeemed | | | (869,634 | ) | | | (16,742,214 | ) | | | (971,627 | ) | | | (16,959,478 | ) |
| | | | (401,575 | ) | | | (7,758,713 | ) | | | (309,827 | ) | | | (5,264,443 | ) |
| Class B Shares(a) | | | | | | | | | | | | | | | | |
Shares converted to Class A | | | (1,528 | ) | | | (25,015 | ) | | | (1,171 | ) | | | (18,626 | ) |
Shares redeemed | | | (11,958 | ) | | | (195,796 | ) | | | (15,554 | ) | | | (244,030 | ) |
| | | | (13,486 | ) | | | (220,811 | ) | | | (16,725 | ) | | | (262,656 | ) |
| Class C Shares | | | | | | | | | | | | | | | | |
Shares sold | | | 135,642 | | | | 2,304,561 | | | | 164,552 | | | | 2,568,567 | |
Reinvestment of distributions | | | — | | | | — | | | | 4,716 | | | | 71,917 | |
Shares redeemed | | | (242,355 | ) | | | (4,088,653 | ) | | | (300,056 | ) | | | (4,687,663 | ) |
| | | | (106,713 | ) | | | (1,784,092 | ) | | | (130,788 | ) | | | (2,047,179 | ) |
| Institutional Shares | | | | | | | | | | | | | | | | |
Shares sold | | | 1,320,351 | | | | 26,154,847 | | | | 2,281,008 | | | | 41,635,800 | |
Reinvestment of distributions | | | 21,563 | | | | 411,859 | | | | 85,135 | | | | 1,504,345 | |
Shares redeemed | | | (3,538,107 | ) | | | (68,844,250 | ) | | | (3,763,367 | ) | | | (68,685,300 | ) |
| | | | (2,196,193 | ) | | | (42,277,544 | ) | | | (1,397,224 | ) | | | (25,545,155 | ) |
| Service Shares | | | | | | | | | | | | | | | | |
Shares sold | | | 57,853 | | | | 1,105,413 | | | | 19,056 | | | | 329,321 | |
Reinvestment of distributions | | | — | | | | — | | | | 635 | | | | 10,704 | |
Shares redeemed | | | (105,174 | ) | | | (1,938,964 | ) | | | (72,479 | ) | | | (1,252,817 | ) |
| | | | (47,321 | ) | | | (833,551 | ) | | | (52,788 | ) | | | (912,792 | ) |
| Class IR Shares | | | | | | | | | | | | | | | | |
Shares sold | | | 48,785 | | | | 949,246 | | | | 5,380 | | | | 93,695 | |
Reinvestment of distributions | | | 34 | | | | 629 | | | | 742 | | | | 12,580 | |
Shares redeemed | | | (14,659 | ) | | | (275,001 | ) | | | (87,244 | ) | | | (1,467,122 | ) |
| | | | 34,160 | | | | 674,874 | | | | (81,122 | ) | | | (1,360,847 | ) |
| Class R Shares | | | | | | | | | | | | | | | | |
Shares sold | | | 189,009 | | | | 3,602,301 | | | | 184,584 | | | | 3,189,346 | |
Reinvestment of distributions | | | — | | | | — | | | | 4,093 | | | | 69,045 | |
Shares redeemed | | | (162,322 | ) | | | (3,075,978 | ) | | | (183,729 | ) | | | (3,182,790 | ) |
| | | | 26,687 | | | | 526,323 | | | | 4,948 | | | | 75,601 | |
| Class R6 Shares(b) | | | | | | | | | | | | | | | | |
Shares sold | | | 496 | | | | 10,005 | | | | — | | | | — | |
Shares redeemed | | | (1 | ) | | | (5 | ) | | | — | | | | — | |
| | | | 495 | | | | 10,000 | | | | — | | | | — | |
NET DECREASE | | | (2,703,946 | ) | | $ | (51,663,514 | ) | | | (1,983,526 | ) | | $ | (35,317,471 | ) |
| (a) | | Class B Shares were converted into Class A Shares at the close of business on November 14, 2014. |
| (b) | | Commenced operations on July 31, 2015. |
108
GOLDMAN SACHS DOMESTIC EQUITY INSIGHTS FUNDS
|
| 12. SUMMARY OF SHARE TRANSACTIONS (continued) |
Share activity is as follows:
| | | | | | | | | | | | | | | | |
| | | Small Cap Growth Insights Fund | |
| | | | |
| | | For the Fiscal Year Ended
October 31, 2015
| | | For the Fiscal Year Ended
October 31, 2014
| |
| | | | |
| | | Shares | | | Dollars | | | Shares | | | Dollars | |
| | | | |
| Class A Shares | | | | | | | | | | | | | | | | |
Shares sold | | | 545,679 | | | $ | 17,350,391 | | | | 131,364 | | | $ | 3,958,503 | |
Reinvestment of distributions | | | 64,770 | | | | 1,925,847 | | | | 82,953 | | | | 2,433,841 | |
Shares converted from Class B(a) | | | 58,348 | | | | 1,833,293 | | | | 18,168 | | | | 550,991 | |
Shares redeemed | | | (306,789 | ) | | | (9,648,220 | ) | | | (183,697 | ) | | | (5,542,646 | ) |
| | | | 362,008 | | | | 11,461,311 | | | | 48,788 | | | | 1,400,689 | |
| Class B Shares(a) | | | | | | | | | | | | | | | | |
Shares sold | | | — | | | | — | | | | 1,244 | | | | 31,476 | |
Reinvestment of distributions | | | — | | | | — | | | | 11,441 | | | | 280,650 | |
Shares converted to Class A | | | (70,295 | ) | | | (1,833,293 | ) | | | (21,791 | ) | | | (550,991 | ) |
Shares redeemed | | | (8,938 | ) | | | (233,385 | ) | | | (25,306 | ) | | | (638,773 | ) |
| | | | (79,233 | ) | | | (2,066,678 | ) | | | (34,412 | ) | | | (877,638 | ) |
| Class C Shares | | | | | | | | | | | | | | | | |
Shares sold | | | 74,499 | | | | 1,948,046 | | | | 40,961 | | | | 1,044,852 | |
Reinvestment of distributions | | | 18,097 | | | | 445,240 | | | | 25,501 | | | | 631,416 | |
Shares redeemed | | | (54,287 | ) | | | (1,413,619 | ) | | | (71,573 | ) | | | (1,809,961 | ) |
| | | | 38,309 | | | | 979,667 | | | | (5,111 | ) | | | (133,693 | ) |
| Institutional Shares | | | | | | | | | | | | | | | | |
Shares sold | | | 1,138,272 | | | | 41,373,091 | | | | 525,893 | | | | 17,910,042 | |
Reinvestment of distributions | | | 45,703 | | | | 1,541,332 | | | | 30,824 | | | | 1,015,038 | |
Shares redeemed | | | (237,885 | ) | | | (8,362,847 | ) | | | (107,067 | ) | | | (3,604,391 | ) |
| | | | 946,090 | | | | 34,551,576 | | | | 449,650 | | | | 15,320,689 | |
| Class IR Shares | | | | | | | | | | | | | | | | |
Shares sold | | | 315,493 | | | | 10,368,520 | | | | 18,886 | | | | 576,775 | |
Reinvestment of distributions | | | 2,448 | | | | 73,879 | | | | 1,716 | | | | 50,902 | |
Shares redeemed | | | (210,284 | ) | | | (6,241,716 | ) | | | (748 | ) | | | (22,608 | ) |
| | | | 107,657 | | | | 4,200,683 | | | | 19,854 | | | | 605,069 | |
| Class R Shares | | | | | | | | | | | | | | | | |
Shares sold | | | 54,765 | | | | 1,671,819 | | | | 23,971 | | | | 709,212 | |
Reinvestment of distributions | | | 1,324 | | | | 38,480 | | | | 582 | | | | 16,748 | |
Shares redeemed | | | (8,145 | ) | | | (254,189 | ) | | | (3,626 | ) | | | (108,220 | ) |
| | | | 47,944 | | | | 1,456,110 | | | | 20,927 | | | | 617,740 | |
| Class R6 Shares(b) | | | | | | | | | | | | | | | | |
Shares sold | | | 271 | | | | 10,005 | | | | — | | | | — | |
Shares redeemed | | | — | | | | (5 | ) | | | — | | | | — | |
| | | | 271 | | | | 10,000 | | | | — | | | | — | |
NET INCREASE | | | 1,423,046 | | | $ | 50,592,669 | | | | 499,696 | | | $ | 16,932,856 | |
| (a) | | Class B Shares were converted into Class A Shares at the close of business on November 14, 2014. |
| (b) | | Commenced operations on July 31, 2015. |
109
GOLDMAN SACHS DOMESTIC EQUITY INSIGHTS FUNDS
Notes to Financial Statements (continued)
October 31, 2015
|
| 12. SUMMARY OF SHARE TRANSACTIONS (continued) |
Share activity is as follows:
| | | | | | | | | | | | | | | | |
| | | Small Cap Value Insights Fund | |
| | | | |
| | | For the Fiscal Year Ended
October 31, 2015
| | | For the Fiscal Year Ended
October 31, 2014
| |
| | | | |
| | | Shares | | | Dollars | | | Shares | | | Dollars | |
| | | | |
| Class A Shares | | | | | | | | | | | | | | | | |
Shares sold | | | 134,243 | | | $ | 5,261,353 | | | | 118,394 | | | $ | 4,428,576 | |
Reinvestment of distributions | | | 48,801 | | | | 1,870,547 | | | | 13,561 | | | | 495,786 | |
Shares converted from Class B(a) | | | 154,047 | | | | 6,012,436 | | | | 30,786 | | | | 1,161,766 | |
Shares redeemed | | | (380,194 | ) | | | (14,892,445 | ) | | | (454,680 | ) | | | (17,026,064 | ) |
| | | | (43,103 | ) | | | (1,748,109 | ) | | | (291,939 | ) | | | (10,939,936 | ) |
| Class B Shares(a) | | | | | | | | | | | | | | | | |
Shares sold | | | — | | | | — | | | | 2,688 | | | | 70,930 | |
Reinvestment of distributions | | | — | | | | — | | | | 286 | | | | 7,273 | |
Shares converted to Class A | | | (223,262 | ) | | | (6,012,436 | ) | | | (44,413 | ) | | | (1,161,766 | ) |
Shares redeemed | | | (35,384 | ) | | | (953,437 | ) | | | (55,810 | ) | | | (1,450,108 | ) |
| | | | (258,646 | ) | | | (6,965,873 | ) | | | (97,249 | ) | | | (2,533,671 | ) |
| Class C Shares | | | | | | | | | | | | | | | | |
Shares sold | | | 19,470 | | | | 593,064 | | | | 30,558 | | | | 896,826 | |
Reinvestment of distributions | | | 11,198 | | | | 335,036 | | | | 225 | | | | 6,477 | |
Shares redeemed | | | (103,611 | ) | | | (3,148,417 | ) | | | (94,576 | ) | | | (2,784,381 | ) |
| | | | (72,943 | ) | | | (2,220,317 | ) | | | (63,793 | ) | | | (1,881,078 | ) |
| Institutional Shares | | | | | | | | | | | | | | | | |
Shares sold | | | 166,189 | | | | 8,136,287 | | | | 131,158 | | | | 6,116,030 | |
Reinvestment of distributions | | | 5,823 | | | | 278,565 | | | | 1,849 | | | | 84,000 | |
Shares redeemed | | | (63,746 | ) | | | (3,074,349 | ) | | | (76,260 | ) | | | (3,543,942 | ) |
| | | | 108,266 | | | | 5,340,503 | | | | 56,747 | | | | 2,656,088 | |
| Class IR Shares | | | | | | | | | | | | | | | | |
Shares sold | | | 23,922 | | | | 941,810 | | | | 21,139 | | | | 792,684 | |
Reinvestment of distributions | | | 989 | | | | 37,771 | | | | 281 | | | | 10,225 | |
Shares redeemed | | | (24,651 | ) | | | (957,187 | ) | | | (11,856 | ) | | | (444,755 | ) |
| | | | 260 | | | | 22,394 | | | | 9,564 | | | | 358,154 | |
| Class R Shares | | | | | | | | | | | | | | | | |
Shares sold | | | 133,943 | | | | 5,296,609 | | | | 10,745 | | | | 407,844 | |
Reinvestment of distributions | | | 375 | | | | 14,252 | | | | 88 | | | | 3,159 | |
Shares redeemed | | | (33,476 | ) | | | (1,287,248 | ) | | | (12,678 | ) | | | (468,929 | ) |
| | | | 100,842 | | | | 4,023,613 | | | | (1,845 | ) | | | (57,926 | ) |
| Class R6 Shares(b) | | | | | | | | | | | | | | | | |
Shares sold | | | 205 | | | | 10,005 | | | | — | | | | — | |
Shares redeemed | | | — | | | | (5 | ) | | | — | | | | — | |
| | | | 205 | | | | 10,000 | | | | — | | | | — | |
NET DECREASE | | | (165,119 | ) | | $ | (1,537,789 | ) | | | (388,515 | ) | | $ | (12,398,369 | ) |
| (a) | | Class B Shares were converted into Class A Shares at the close of business on November 14, 2014. |
| (b) | | Commenced operations on July 31, 2015. |
110
GOLDMAN SACHS DOMESTIC EQUITY INSIGHTS FUNDS
|
| 12. SUMMARY OF SHARE TRANSACTIONS (continued) |
Share activity is as follows:
| | | | | | | | | | | | | | | | |
| | | U.S. Equity Insights Fund | |
| | | | |
| | | For the Fiscal Year Ended
October 31, 2015
| | | For the Fiscal Year Ended
October 31, 2014
| |
| | | | |
| | | Shares | | | Dollars | | | Shares | | | Dollars | |
| | | | |
| Class A Shares | | | | | | | | | | | | | | | | |
Shares sold | | | 489,069 | | | $ | 20,148,539 | | | | 369,977 | | | $ | 13,778,014 | |
Reinvestment of distributions | | | 45,885 | | | | 1,901,942 | | | | 73,150 | | | | 2,538,314 | |
Shares converted from Class B(a) | | | 75,598 | | | | 3,085,169 | | | | 29,712 | | | | 1,100,583 | |
Shares redeemed | | | (887,276 | ) | | | (36,595,041 | ) | | | (1,052,986 | ) | | | (39,313,513 | ) |
| | | | (276,724 | ) | | | (11,459,391 | ) | | | (580,147 | ) | | | (21,896,602 | ) |
| Class B Shares(a) | | | | | | | | | | | | | | | | |
Shares sold | | | — | | | | — | | | | 10,205 | | | | 359,336 | |
Reinvestment of distributions | | | — | | | | — | | | | 484 | | | | 15,783 | |
Shares converted to Class A | | | (80,912 | ) | | | (3,085,169 | ) | | | (31,659 | ) | | | (1,100,583 | ) |
Shares redeemed | | | (61,227 | ) | | | (2,334,656 | ) | | | (59,056 | ) | | | (2,052,126 | ) |
| | | | (142,139 | ) | | | (5,419,825 | ) | | | (80,026 | ) | | | (2,777,590 | ) |
| Class C Shares | | | | | | | | | | | | | | | | |
Shares sold | | | 183,157 | | | | 6,931,701 | | | | 98,598 | | | | 3,376,844 | |
Reinvestment of distributions | | | 834 | | | | 31,814 | | | | 4,233 | | | | 135,286 | |
Shares redeemed | | | (178,172 | ) | | | (6,731,425 | ) | | | (189,899 | ) | | | (6,450,588 | ) |
| | | | 5,819 | | | | 232,090 | | | | (87,068 | ) | | | (2,938,458 | ) |
| Institutional Shares | | | | | | | | | | | | | | | | |
Shares sold | | | 2,051,350 | | | | 84,969,389 | | | | 1,234,543 | | | | 47,132,166 | |
Reinvestment of distributions | | | 34,827 | | | | 1,478,041 | | | | 25,607 | | | | 909,325 | |
Shares redeemed | | | (1,775,794 | ) | | | (74,669,520 | ) | | | (538,939 | ) | | | (20,498,630 | ) |
| | | | 310,383 | | | | 11,777,910 | | | | 721,211 | | | | 27,542,861 | |
| Service Shares | | | | | | | | | | | | | | | | |
Shares sold | | | 68,476 | | | | 2,788,613 | | | | 2,316 | | | | 85,612 | |
Reinvestment of distributions | | | 85 | | | | 3,524 | | | | 121 | | | | 4,185 | |
Shares redeemed | | | (15,949 | ) | | | (650,758 | ) | | | (3,842 | ) | | | (143,333 | ) |
| | | | 52,612 | | | | 2,141,379 | | | | (1,405 | ) | | | (53,536 | ) |
| Class IR Shares | | | | | | | | | | | | | | | | |
Shares sold | | | 217,171 | | | | 8,858,924 | | | | 10,392 | | | | 389,426 | |
Reinvestment of distributions | | | 259 | | | | 10,626 | | | | 212 | | | | 7,281 | |
Shares redeemed | | | (130,350 | ) | | | (5,389,955 | ) | | | (1,392 | ) | | | (50,514 | ) |
| | | | 87,080 | | | | 3,479,595 | | | | 9,212 | | | | 346,193 | |
| Class R Shares | | | | | | | | | | | | | | | | |
Shares sold | | | 821,845 | | | | 34,109,333 | | | | 7,152 | | | | 273,341 | |
Reinvestment of distributions | | | 149 | | | | 6,126 | | | | 77 | | | | 2,636 | |
Shares redeemed | | | (156,732 | ) | | | (6,388,751 | ) | | | (5,809 | ) | | | (212,188 | ) |
| | | | 665,262 | | | | 27,726,708 | | | | 1,420 | | | | 63,789 | |
| Class R6 Shares(b) | | | | | | | | | | | | | | | | |
Shares sold | | | 232 | | | | 10,005 | | | | — | | | | — | |
Shares redeemed | | | — | | | | (5 | ) | | | — | | | | — | |
| | | | 232 | | | | 10,000 | | | | — | | | | — | |
NET INCREASE (DECREASE) | | | 702,525 | | | $ | 28,488,466 | | | | (16,803 | ) | | $ | 286,657 | |
| (a) | | Class B Shares were converted into Class A Shares at the close of business on November 14, 2014. |
| (b) | | Commenced operations on July 31, 2015. |
111
Report of Independent Registered Public
Accounting Firm
To the Board of Trustees of Goldman Sachs Trust
and Shareholders of Goldman Sachs Domestic Equity Insights Funds:
In our opinion, the accompanying statements of assets and liabilities, including the schedules of investments, and the related statements of operations and of changes in net assets and the financial highlights present fairly, in all material respects, the financial position of Goldman Sachs Large Cap Growth Insights Fund, Goldman Sachs Large Cap Value Insights Fund, Goldman Sachs Small Cap Equity Insights Fund, Goldman Sachs Small Cap Growth Insights Fund, Goldman Sachs Small Cap Value Insights Fund, and Goldman Sachs U.S. Equity Insights Fund (collectively the “Funds”), funds of the Goldman Sachs Trust, at October 31, 2015, and the results of each of their operations, the changes in each of their net assets and the financial highlights for each of the periods indicated, in conformity with accounting principles generally accepted in the United States of America. These financial statements and financial highlights (hereafter referred to as “financial statements”) are the responsibility of the Funds’ management. Our responsibility is to express an opinion on these financial statements based on our audits. We conducted our audits of these financial statements in accordance with the standards of the Public Company Accounting Oversight Board (United States). Those standards require that we plan and perform the audit to obtain reasonable assurance about whether the financial statements are free of material misstatement. An audit includes examining, on a test basis, evidence supporting the amounts and disclosures in the financial statements, assessing the accounting principles used and significant estimates made by management, and evaluating the overall financial statement presentation. We believe that our audits, which included confirmation of securities at October 31, 2015 by correspondence with the custodian, brokers, transfer agent of the underlying funds, and the application of alternative auditing procedures where securities purchased confirmations had not been received, provide a reasonable basis for our opinion.
PricewaterhouseCoopers LLP
Boston, Massachusetts
December 28, 2015
112
GOLDMAN SACHS DOMESTIC EQUITY INSIGHTS FUNDS
Fund Expenses — Six Month Period Ended October 31, 2015 (Unaudited)
As a shareholder of Class A, Class C, Institutional, Service, Class IR, Class R or Class R6 Shares of a Fund, you incur two types of costs: (1) transaction costs, including sales charges on purchase payments (with respect to Class A Shares), contingent deferred sales charges on redemptions (with respect to Class C Shares), and (2) ongoing costs, including management fees; distribution and service (12b-1) fees (with respect to Class A, Class C and Class R Shares); and other Fund expenses. This Example is intended to help you understand your ongoing costs (in dollars) of investing in Class A, Class C, Institutional, Service, Class IR, Class R or Class R6 Shares of the Funds and to compare these costs with the ongoing costs of investing in other mutual funds.
The Example is based on an investment of $1,000 invested at the beginning of the period and held for the entire period from May 1, 2015 through October 31, 2015, which represents a period of 184 out of 365 days. The Class R6 Example is based on the period from July 31, 2015 through October 31, 2015, which represents a period of 92 out of 365 days.
Actual Expenses — The first line under each share class in the table below provides information about actual account values and actual expenses. You may use the information in this line, together with the amount you invested, to estimate the expenses that you paid over the period. Simply divide your account value by $1,000 (for example, an $8,600 account value divided by $1,000=8.6), then multiply the result by the number in the first line under the heading entitled “Expenses Paid” to estimate the expenses you paid on your account during this period.
Hypothetical Example for Comparison Purposes — The second line under each share class in the table below provides information about hypothetical account values and hypothetical expenses based on the Funds’ actual net expense ratios and an assumed rate of return of 5% per year before expenses, which is not the Funds’ actual return. The hypothetical account values and expenses may not be used to estimate the actual ending account balance or expenses you paid for the period. You may use this information to compare the ongoing costs of investing in the Funds and other funds. To do so, compare this 5% hypothetical example with the 5% hypothetical examples that appear in the shareholder reports of the other funds.
Please note that the expenses shown in the table are meant to highlight your ongoing costs only and do not reflect any transactional costs, such as sales charges, redemption fees, or exchange fees. Therefore, the second line of the table is useful in comparing ongoing costs only, and will not help you determine the relative total costs of owning different funds. In addition, if these transactional costs were included, your costs would have been higher.
| | | | | | | | | | | | | | | | | | | | | | | | | | | | | | | | | | | | |
| | | Large Cap Growth Insights Fund | | | Large Cap Value Insights Fund | | | Small Cap Equity Insights Fund | |
| Share Class | | Beginning
Account
Value
5/1/15 | | | Ending
Account
Value
10/31/15 | | | Expenses
Paid for the
6 months ended
10/31/15* | | | Beginning
Account
Value
5/1/15 | | | Ending
Account
Value
10/31/15 | | | Expenses
Paid for the
6 months ended
10/31/15* | | | Beginning
Account
Value
5/1/15 | | | Ending
Account
Value
10/31/15 | | | Expenses
Paid for the
6 months ended
10/31/15* | |
| Class A | | | | | | | | | | | | | | | | | | | | | | | | | | | | | | | | | | | | |
Actual | | $ | 1,000.00 | | | $ | 1,022.10 | | | $ | 4.89 | | | $ | 1,000.00 | | | $ | 996.30 | | | $ | 4.83 | | | $ | 1,000.00 | | | $ | 980.50 | | | $ | 6.29 | |
Hypothetical 5% return | | | 1,000.00 | | | | 1,020.37 | + | | | 4.89 | | | | 1,000.00 | | | | 1,020.37 | + | | | 4.89 | | | | 1,000.00 | | | | 1,018.85 | + | | | 6.41 | |
| Class C | | | | | | | | | | | | | | | | | | | | | | | | | | | | | | | | | | | | |
Actual | | | 1,000.00 | | | | 1,017.90 | | | | 8.70 | | | | 1,000.00 | | | | 992.30 | | | | 8.59 | | | | 1,000.00 | | | | 976.80 | | | | 10.02 | |
Hypothetical 5% return | | | 1,000.00 | | | | 1,016.58 | + | | | 8.69 | | | | 1,000.00 | | | | 1,016.58 | + | | | 8.69 | | | | 1,000.00 | | | | 1,015.07 | + | | | 10.21 | |
| Institutional | | | | | | | | | | | | | | | | | | | | | | | | | | | | | | | | | | | | |
Actual | | | 1,000.00 | | | | 1,024.00 | | | | 2.86 | | | | 1,000.00 | | | | 998.40 | | | | 2.82 | | | | 1,000.00 | | | | 982.70 | | | | 4.30 | |
Hypothetical 5% return | | | 1,000.00 | | | | 1,022.38 | + | | | 2.85 | | | | 1,000.00 | | | | 1,022.38 | + | | | 2.85 | | | | 1,000.00 | | | | 1,020.87 | + | | | 4.38 | |
| Service | | | | | | | | | | | | | | | | | | | | | | | | | | | | | | | | | | | | |
Actual | | | 1,000.00 | | | | 1,021.40 | | | | 5.40 | | | | 1,000.00 | | | | 995.80 | | | | 5.33 | | | | 1,000.00 | | | | 980.20 | | | | 6.84 | |
Hypothetical 5% return | | | 1,000.00 | | | | 1,019.86 | + | | | 5.40 | | | | 1,000.00 | | | | 1,019.86 | + | | | 5.40 | | | | 1,000.00 | | | | 1,018.30 | + | | | 6.97 | |
| Class IR | | | | | | | | | | | | | | | | | | | | | | | | | | | | | | | | | | | | |
Actual | | | 1,000.00 | | | | 1,023.30 | | | | 3.62 | | | | 1,000.00 | | | | 997.50 | | | | 3.57 | | | | 1,000.00 | | | | 981.90 | | | | 5.05 | |
Hypothetical 5% return | | | 1,000.00 | | | | 1,021.63 | + | | | 3.62 | | | | 1,000.00 | | | | 1,021.63 | + | | | 3.62 | | | | 1,000.00 | | | | 1,020.11 | + | | | 5.14 | |
| Class R | | | | | | | | | | | | | | | | | | | | | | | | | | | | | | | | | | | | |
Actual | | | 1,000.00 | | | | 1,020.70 | | | | 6.16 | | | | 1,000.00 | | | | 994.80 | | | | 6.08 | | | | 1,000.00 | | | | 979.10 | | | | 7.53 | |
Hypothetical 5% return | | | 1,000.00 | | | | 1,019.11 | + | | | 6.16 | | | | 1,000.00 | | | | 1,019.11 | + | | | 6.16 | | | | 1,000.00 | | | | 1,017.59 | + | | | 7.68 | |
| Class R6(a) | | | | | | | | | | | | | | | | | | | | | | | | | | | | | | | | | | | | |
Actual | | | 1,000.00 | | | | 998.30 | | | | 1.36 | | | | 1,000.00 | | | | 985.90 | | | | 1.45 | | | | 1,000.00 | | | | 981.20 | | | | 2.15 | |
Hypothetical 5% return | | | 1,000.00 | | | | 1,011.24 | + | | | 1.37 | | | | 1,000.00 | | | | 1,011.14 | + | | | 1.47 | | | | 1,000.00 | | | | 1,023.04 | + | | | 2.18 | |
113
GOLDMAN SACHS DOMESTIC EQUITY INSIGHTS FUNDS
Fund Expenses — Six Month Period Ended October 31, 2015 (Unaudited) (continued)
| | | | | | | | | | | | | | | | | | | | | | | | | | | | | | | | | | | | |
| | | Small Cap Growth Insights Fund | | | Small Cap Value Insights Fund | | | U.S. Equity Insights Fund | |
| Share Class | | Beginning Account
Value 5/1/15 | | | Ending Account
Value 10/31/15 | | | Expenses Paid for the 6 month ended 10/31/15* | | | Beginning Account
Value 5/1/15 | | | Ending Account
Value 10/31/15 | | | Expenses Paid for the 6 month ended 10/31/15* | | | Beginning Account
Value 5/1/15 | | | Ending Account
Value 10/31/15 | | | Expenses Paid for the 6 month ended 10/31/15* | |
| Class A | | | | | | | | | | | | | | | | | | | | | | | | | | | | | | | | | | | | |
Actual | | $ | 1,000.00 | | | $ | 982.40 | | | $ | 6.25 | | | $ | 1,000.00 | | | $ | 969.70 | | | $ | 6.21 | | | $ | 1,000.00 | | | $ | 997.10 | | | $ | 4.83 | |
Hypothetical 5% return | | | 1,000.00 | | | | 1,018.90 | + | | | 6.36 | | | | 1,000.00 | | | | 1,018.90 | + | | | 6.36 | | | | 1,000.00 | | | | 1,020.37 | + | | | 4.89 | |
| Class C | | | | | | | | | | | | | | | | | | | | | | | | | | | | | | | | | | | | |
Actual | | | 1,000.00 | | | | 978.70 | | | | 9.97 | | | | 1,000.00 | | | | 965.90 | | | | 9.96 | | | | 1,000.00 | | | | 993.40 | | | | 8.59 | |
Hypothetical 5% return | | | 1,000.00 | | | | 1,015.12 | + | | | 10.16 | | | | 1,000.00 | | | | 1,015.07 | + | | | 10.21 | | | | 1,000.00 | | | | 1,016.58 | + | | | 8.69 | |
| Institutional | | | | | | | | | | | | | | | | | | | | | | | | | | | | | | | | | | | | |
Actual | | | 1,000.00 | | | | 984.20 | | | | 4.30 | | | | 1,000.00 | | | | 971.50 | | | | 4.22 | | | | 1,000.00 | | | | 999.10 | | | | 2.82 | |
Hypothetical 5% return | | | 1,000.00 | | | | 1,020.87 | + | | | 4.38 | | | | 1,000.00 | | | | 1,020.92 | + | | | 4.33 | | | | 1,000.00 | | | | 1,022.38 | + | | | 2.85 | |
| Service | | | | | | | | | | | | | | | | | | | | | | | | | | | | | | | | | | | | |
Actual | | | N/A | | | | N/A | | | | N/A | | | | N/A | | | | N/A | | | | N/A | | | | 1,000.00 | | | | 996.60 | | | | 5.33 | |
Hypothetical 5% return | | | N/A | | | | N/A | | | | N/A | | | | N/A | | | | N/A | | | | N/A | | | | 1,000.00 | | | | 1,019.86 | + | | | 5.40 | |
| Class IR | | | | | | | | | | | | | | | | | | | | | | | | | | | | | | | | | | | | |
Actual | | | 1,000.00 | | | | 983.90 | | | | 5.00 | | | | 1,000.00 | | | | 970.90 | | | | 4.97 | | | | 1,000.00 | | | | 998.50 | | | | 3.58 | |
Hypothetical 5% return | | | 1,000.00 | | | | 1,020.16 | + | | | 5.09 | | | | 1,000.00 | | | | 1,020.16 | + | | | 5.09 | | | | 1,000.00 | | | | 1,021.63 | + | | | 3.62 | |
| Class R | | | | | | | | | | | | | | | | | | | | | | | | | | | | | | | | | | | | |
Actual | | | 1,000.00 | | | | 981.00 | | | | 7.49 | | | | 1,000.00 | | | | 968.40 | | | | 7.49 | | | | 1,000.00 | | | | 995.90 | | | | 6.09 | |
Hypothetical 5% return | | | 1,000.00 | | | | 1,017.64 | + | | | 7.63 | | | | 1,000.00 | | | | 1,017.59 | + | | | 7.68 | | | | 1,000.00 | | | | 1,019.11 | + | | | 6.16 | |
| Class R6(a) | | | | | | | | | | | | | | | | | | | | | | | | | | | | | | | | | | | | |
Actual | | | 1,000.00 | | | | 959.70 | | | | 2.10 | | | | 1,000.00 | | | | 983.60 | | | | 2.07 | | | | 1,000.00 | | | | 986.30 | | | | 1.38 | |
Hypothetical 5% return | | | 1,000.00 | | | | 1,010.46 | + | | | 2.15 | | | | 1,000.00 | | | | 1,010.51 | + | | | 2.10 | | | | 1,000.00 | | | | 1,011.22 | + | | | 1.39 | |
| * | | Expenses for each share class are calculated using each Fund’s annualized net expense ratio for each class, which represents the ongoing expenses as a percentage of net assets for the six months ended October 31, 2015. Expenses are calculated by multiplying the annualized net expense ratio by the average account value for the period; then multiplying the result by the number of days in the most recent fiscal half year; and then dividing that result by the number of days in the fiscal year. The annualized net expense ratios for the period were as follows: |
| | | | | | | | | | | | | | | | | | | | | | | | | | | | |
| Fund | | Class A | | | Class C | | | Institutional | | | Service | | | Class IR | | | Class R | | | Class R6(a) | |
Large Cap Growth Insights | | | 0.96 | % | | | 1.71 | % | | | 0.56 | % | | | 1.06 | % | | | 0.71 | % | | | 1.21 | % | | | 0.54 | % |
Large Cap Value Insights | | | 0.96 | | | | 1.71 | | | | 0.56 | | | | 1.06 | | | | 0.71 | | | | 1.21 | | | | 0.58 | |
Small Cap Equity Insights | | | 1.26 | | | | 2.01 | | | | 0.86 | | | | 1.36 | | | | 1.01 | | | | 1.51 | | | | 0.86 | |
Small Cap Growth Insights | | | 1.26 | | | | 2.01 | | | | 0.86 | | | | N/A | | | | 1.01 | | | | 1.51 | | | | 0.85 | |
Small Cap Value Insights | | | 1.25 | | | | 2.00 | | | | 0.85 | | | | N/A | | | | 1.00 | | | | 1.51 | | | | 0.83 | |
U.S. Equity Insights | | | 0.96 | | | | 1.71 | | | | 0.56 | | | | 1.06 | | | | 0.71 | | | | 1.21 | | | | 0.55 | |
| + | | Hypothetical expenses are based on each Fund’s actual annualized net expense ratios and an assumed rate of return of 5% per year before expenses. |
| (a) | | Commenced operations on July 31, 2015. |
114
GOLDMAN SACHS DOMESTIC EQUITY INSIGHTS FUNDS
Statement Regarding Basis for Approval of Management Agreement (Unaudited)
Background
The Goldman Sachs Large Cap Growth Insights Fund, Goldman Sachs Large Cap Value Insights Fund, Goldman Sachs Small Cap Equity Insights Fund, Goldman Sachs Small Cap Growth Insights Fund, Goldman Sachs Small Cap Value Insights Fund, and Goldman Sachs U.S. Equity Insights Fund (the “Funds”) are investment portfolios of Goldman Sachs Trust (the “Trust”). The Board of Trustees oversees the management of the Trust and reviews the investment performance and expenses of the Funds at regularly scheduled meetings held throughout the year. In addition, the Board of Trustees determines annually whether to approve the continuance of the Trust’s investment management agreement (the “Management Agreement”) with Goldman Sachs Asset Management, L.P. (the “Investment Adviser”) on behalf of the Funds.
The Management Agreement was most recently approved for continuation until June 30, 2016 by the Board of Trustees, including those Trustees who are not parties to the Management Agreement or “interested persons” (as defined in the Investment Company Act of 1940, as amended) of any party thereto (the “Independent Trustees”), at a meeting held on June 10-11, 2015 (the “Annual Meeting”).
The review process undertaken by the Trustees spans the course of the year and culminates with the Annual Meeting. To assist the Trustees in their deliberations, the Trustees have established a Contract Review Committee (the “Committee”), comprised of the Independent Trustees. The Committee held three meetings over the course of the year since the Management Agreement was last approved. At those Committee meetings, regularly scheduled Board or other committee meetings, and/or the Annual Meeting, matters relevant to the renewal of the Management Agreement were considered by the Board, or the Independent Trustees, as applicable. Such matters included:
| | (a) | | the nature and quality of the advisory, administrative, and other services provided to the Funds by the Investment Adviser and its affiliates, including information about: |
| | (i) | | the structure, staff, and capabilities of the Investment Adviser and its portfolio management teams; |
| | (ii) | | the groups within the Investment Adviser and its affiliates that support the portfolio management teams or provide other types of necessary services, including fund services groups (e.g., accounting and financial reporting, tax, shareholder services and operations); controls and risk management groups (e.g., legal, compliance, valuation oversight, credit risk management, internal audit, compliance testing, market risk analysis, finance and strategy and central funding); sales and distribution support groups and others (e.g., information technology and training); |
| | (iii) | | trends in employee headcount; |
| | (iv) | | the Investment Adviser’s financial resources and ability to hire and retain talented personnel and strengthen its operations; and |
| | (v) | | the parent company’s support of the Investment Adviser and its mutual fund business, as expressed by the firm’s senior management; |
| | (b) | | information on the investment performance of each Fund, including comparisons to the performance of similar mutual funds, as provided by a third-party mutual fund data provider engaged as part of the contract review process (the “Outside Data Provider”), benchmark performance indices, and composites of accounts with comparable investment strategies managed by the Investment Adviser (in the case of the Large Cap Growth Insights and U.S. Equity Insights Funds), and general investment outlooks in the markets in which the Funds invest; |
| | (c) | | information provided by the Investment Adviser indicating the Investment Adviser’s views on whether a Fund’s peer group and/or benchmark index had high, medium, or low relevance given the Fund’s particular investment strategy; |
| | (d) | | the terms of the Management Agreement and other agreements with affiliated service providers entered into by the Trust on behalf of the Funds; |
| | (e) | | fee and expense information for the Funds, including: |
| | (i) | | the relative management fee and expense levels of each Fund as compared to those of comparable funds managed by other advisers, as provided by the Outside Data Provider; |
| | (ii) | | the expense trends over time of each Fund; and |
| | (iii) | | to the extent the Investment Adviser manages other types of accounts (such as bank collective trusts, private wealth management accounts, institutional separate accounts, sub-advised mutual funds, and non-U.S. funds) having investment objectives and policies similar to those of the Funds, comparative information on the advisory fees charged and services provided to those accounts by the Investment Adviser; |
| | (f) | | with respect to the extensive investment performance and expense comparison data provided by the Outside Data Provider, its processes in producing that data for the Funds; |
| | (g) | | the undertakings of the Investment Adviser to waive a portion of its management fees and to limit certain expenses of each Fund that exceed specified levels, and a summary of contractual fee reductions made by the Investment Adviser and/or its affiliates over the past several years with respect to the Funds; |
115
GOLDMAN SACHS DOMESTIC EQUITY INSIGHTS FUNDS
Statement Regarding Basis for Approval of Management Agreement (Unaudited) (continued)
| | (h) | | information relating to the profitability of the Management Agreement and the transfer agency and distribution and service arrangements of each Fund and the Trust as a whole to the Investment Adviser and its affiliates; |
| | (i) | | whether each Fund’s existing management fee schedule adequately addressed any economies of scale; |
| | (j) | | a summary of the “fall-out” benefits derived by the Investment Adviser and its affiliates from their relationships with the Funds, including the fees received by the Investment Adviser’s affiliates from the Funds for transfer agency, securities lending, portfolio trading, distribution and other services; |
| | (k) | | a summary of potential benefits derived by the Funds as a result of their relationship with the Investment Adviser; |
| | (l) | | information regarding commissions paid by the Funds and broker oversight, other information regarding portfolio trading, and how the Investment Adviser carries out its duty to seek best execution; |
| | (m) | | portfolio manager ownership of Fund shares; the manner in which portfolio manager compensation is determined; and the number and types of accounts managed by the portfolio managers; |
| | (n) | | the nature and quality of the services provided to the Funds by their unaffiliated service providers, and the Investment Adviser’s general oversight and evaluation (including reports on due diligence) of those service providers as part of the administration services provided under the Management Agreement; and |
| | (o) | | the Investment Adviser’s processes and policies addressing various types of potential conflicts of interest; its approach to risk management; the annual review of the effectiveness of the Funds’ compliance program; and periodic compliance reports. |
The Trustees also received an overview of the Funds’ distribution arrangements. They received information regarding the Funds’ assets, share purchase and redemption activity and the payment of Rule 12b-1 distribution and service fees and non-Rule 12b-1 shareholder service and/or administration fees with respect to the Funds. Information was also provided to the Trustees relating to revenue sharing payments made by and services provided by the Investment Adviser and its affiliates to intermediaries that promote the sale, distribution, and/or servicing of Fund shares.
The presentations made at the Board and Committee meetings and at the Annual Meeting encompassed the Funds and other mutual fund portfolios for which the Board of Trustees has responsibility. In evaluating the Management Agreement at the Annual Meeting, the Trustees relied upon their knowledge, resulting from their meetings and other interactions throughout the year, of the Investment Adviser and its affiliates, their services, and the Funds. In conjunction with these meetings, the Trustees received written materials and oral presentations on the topics covered, and were advised by their independent legal counsel regarding their responsibilities and other regulatory requirements related to the approval and continuation of mutual fund investment management agreements under applicable law. In addition, the Investment Adviser and its affiliates provided the Independent Trustees with a written response to a formal request for information sent on behalf of the Independent Trustees by their independent legal counsel. During the course of their deliberations, the Independent Trustees met in executive sessions with their independent legal counsel, without representatives of the Investment Adviser or its affiliates present. The Independent Trustees also discussed the broad range of other investment choices that are available to Fund investors, including the availability of comparable funds managed by other advisers.
Nature, Extent, and Quality of the Services Provided Under the Management Agreement
As part of their review, the Trustees considered the nature, extent, and quality of the services provided to the Funds by the Investment Adviser. In this regard, the Trustees considered both the investment advisory services and non-advisory services that are provided by the Investment Adviser and its affiliates. The Trustees noted the transition in the leadership and changes in personnel of various of the Investment Adviser’s portfolio management teams that had occurred in recent periods, and the ongoing recruitment efforts aimed at bringing high quality investment talent to the Investment Adviser. They also noted the Investment Adviser’s commitment to maintaining high quality systems. The Trustees concluded that the Investment Adviser continued to commit substantial financial and operational resources to the Funds and expressed confidence that the Investment Adviser would continue to do so in the future. The Trustees also recognized that the Investment Adviser had made significant commitments to address regulatory compliance requirements applicable to the Funds and the Investment Adviser.
Investment Performance
The Trustees also considered the investment performance of the Funds. In this regard, they compared the investment performance of each Fund to its peers using rankings and ratings compiled by the Outside Data Provider as of December 31, 2014, and updated performance information prepared by the Investment Adviser using the peer groups identified by the Outside Data Provider as of March 31, 2015. The information on each Fund’s investment performance was provided for the one-, three-, five-, and ten-year periods ending on the applicable dates, to the extent that each Fund had been in existence for those periods. The Trustees also reviewed each Fund’s investment performance over time (including on a year-by-year basis) relative to its
116
GOLDMAN SACHS DOMESTIC EQUITY INSIGHTS FUNDS
Statement Regarding Basis for Approval of Management Agreement (Unaudited) (continued)
performance benchmark. As part of this review, they considered the investment performance trends of the Funds over time, and reviewed the investment performance of each Fund in light of its investment objective and policies and market conditions. The Trustees also received information comparing the Large Cap Growth Insights and U.S. Equity Insights Funds’ performance to that of composites of accounts with comparable investment strategies managed by the Investment Adviser.
In addition, the Trustees considered materials prepared and presentations made by the Investment Adviser’s senior management and portfolio management personnel, in which Fund performance was assessed. The Trustees also considered the Investment Adviser’s periodic reports with respect to the Funds’ risk profiles, and how the Investment Adviser’s approach to risk monitoring and management influences portfolio management. They noted the efforts of the Funds’ portfolio management team to continue to enhance the investment models used in managing the Funds.
The Trustees noted that the Large Cap Growth Insights Fund’s Institutional Shares had placed in the first quartile of the Fund’s peer group for the one-, three-, and five-year periods and in the third quartile for the ten-year period, and had outperformed the Fund’s benchmark index for the one-, three-, and five-year periods and underperformed for the ten-year period ended March 31, 2015. They observed that the Large Cap Value Insights Fund’s Institutional Shares had placed in the first quartile of the Fund’s peer group for the one-, three-, and five-year periods and in the third quartile for the ten-year period, and had outperformed the Fund’s benchmark index for the one-, three-, and five-year periods and underperformed for the ten-year period ended March 31, 2015. They noted that the Small Cap Equity Insights Fund’s Institutional Shares had placed in the top half of the Fund’s peer group for the one-, three-, and five-year periods and in the fourth quartile for the ten-year period, and had outperformed the Fund’s benchmark index for the one- and five-year periods and underperformed for the three- and ten-year periods ended March 31, 2015. The Trustees observed that the Small Cap Growth Insights Fund’s Institutional Shares had placed in the first quartile of the Fund’s peer group for the one-, three-, and five-year periods, and had outperformed the Fund’s benchmark index for the one- and five-year periods and underperformed for the three-year period ended March 31, 2015. They noted that the Small Cap Value Insights Fund’s Institutional Shares had placed in the top half of the Fund’s peer group for the one- and five-year periods and in the third quartile for the three-year period, and had outperformed the Fund’s benchmark index for the one- and five-year periods and underperformed for the three-year period ended March 31, 2015. They observed that the U.S. Equity Insights Fund’s Institutional Shares had placed in the top half of the Fund’s peer group for the one-, three-, five-, and ten-year periods, and had outperformed the Fund’s benchmark index for the one-, three-, and five-year periods and underperformed for the ten-year period ended March 31, 2015.
Costs of Services Provided and Competitive Information
The Trustees considered the contractual terms of the Management Agreement and the fee rates payable by each Fund thereunder. In this regard, the Trustees considered information on the services rendered by the Investment Adviser to the Funds, which included both advisory and administrative services that were directed to the needs and operations of the Funds as registered mutual funds.
In particular, the Trustees reviewed analyses prepared by the Outside Data Provider regarding the expense rankings of the Funds. The analyses provided a comparison of the Funds’ management fees and breakpoints to those of relevant peer groups and category universes; an expense analysis which compared each Fund’s overall net and gross expenses to a peer group and a category universe; and a five-year history comparing each Fund’s net expenses to the peer and category medians. The analyses also compared each Fund’s transfer agency, custody, and distribution fees, other expenses and fee waivers/reimbursements to those of the peer group and category medians. The Trustees concluded that the comparisons provided by the Outside Data Provider were useful in evaluating the reasonableness of the management fees and total expenses paid by the Funds.
In addition, the Trustees considered the Investment Adviser’s undertakings to waive a portion of its management fees and to limit certain expenses of the Funds that exceed specified levels. The Trustees also noted that certain changes were being made to existing fee waiver or expense limitation arrangements of the Small Cap Equity Insights and Small Cap Value Insights Funds that would have the effect of lowering total Fund expenses, with such changes taking effect in connection with the Funds’ next annual registration statement update. They also considered, to the extent that the Investment Adviser manages other types of accounts having investment objectives and policies similar to those of the Funds, comparative fee information for services provided by the Investment Adviser to those accounts, and information that indicated that services provided to the Funds differed in various significant respects from the services provided to other types of accounts which, in many cases, operated under less stringent legal and regulatory structures, required fewer services from the Investment Adviser to a smaller number of client contact points, and were less time-intensive.
In addition, the Trustees noted that shareholders are able to redeem their Fund shares at any time if shareholders believe that the Fund fees and expenses are too high or if they are dissatisfied with the performance of the Fund.
117
GOLDMAN SACHS DOMESTIC EQUITY INSIGHTS FUNDS
Statement Regarding Basis for Approval of Management Agreement (Unaudited) (continued)
Profitability
The Trustees reviewed the Investment Adviser’s revenues and pre-tax profit margins with respect to the Trust and each of the Funds. In this regard the Trustees noted that they had received, among other things, profitability analyses and summaries, revenue and expense schedules by Fund and by function (i.e., investment management, transfer agency and distribution and service), and information on the Investment Adviser’s expense allocation methodology. They observed that the profitability and expense figures are substantially similar to those used by the Investment Adviser for many internal purposes, including compensation decisions among various business groups, and are thus subject to a vigorous internal debate about how certain revenue and expenses should be allocated. The Trustees also noted that the internal audit group within the Goldman Sachs organization had audited the expense allocation methodology and was satisfied with the reasonableness, consistency, and accuracy of the Investment Adviser’s expense allocation methodology and profitability analysis calculations. Profitability data for the Trust and each Fund were provided for 2014 and 2013, and the Trustees considered this information in relation to the Investment Adviser’s overall profitability. The Trustees considered the Investment Adviser’s revenues and pre-tax profit margins both in absolute terms and in comparison to information on the reported pre-tax profit margins earned by certain other asset management firms.
Economies of Scale
The Trustees considered the information that had been provided regarding the Investment Adviser’s profitability. The Trustees also considered the breakpoints in the fee rate payable under the Management Agreement for each of the Funds at the following annual percentage rates of the average daily net assets of the Funds:
| | | | | | | | | | | | | | | | | | | | | | | | |
Average Daily
Net Assets | | Large Cap
Growth
Insights
Fund | | | Large Cap
Value
Insights
Fund | | | Small Cap
Equity
Insights
Fund | | | Small Cap
Growth
Insights
Fund | | | Small Cap
Value
Insights
Fund | | | U.S. Equity
Insights
Fund | |
| First $1 billion | | | 0.65 | % | | | 0.60 | % | | | 0.85 | % | | | 0.85 | % | | | 0.85 | % | | | 0.65 | % |
| Next $1 billion | | | 0.59 | | | | 0.54 | | | | 0.85 | | | | 0.85 | | | | 0.85 | | | | 0.59 | |
| Next $3 billion | | | 0.56 | | | | 0.51 | | | | 0.77 | | | | 0.77 | | | | 0.77 | | | | 0.56 | |
| Next $3 billion | | | 0.55 | | | | 0.50 | | | | 0.73 | | | | 0.73 | | | | 0.73 | | | | 0.55 | |
| Over $8 billion | | | 0.54 | | | | 0.49 | | | | 0.72 | | | | 0.72 | | | | 0.72 | | | | 0.54 | |
The Trustees noted that the breakpoints were designed to share potential economies of scale, if any, with the Funds and their shareholders as assets under management reach those asset levels. The Trustees considered the amounts of assets in the Funds; the Funds’ recent share purchase and redemption activity; the information provided by the Investment Adviser relating to the costs of the services provided by the Investment Adviser and its affiliates and their realized profits; information comparing fee rates charged by the Investment Adviser with fee rates charged to other funds in the peer groups; and the Investment Adviser’s undertakings to waive a portion of its management fees and to limit certain expenses of the Funds that exceed specified levels. Upon reviewing these matters at the Annual Meeting, the Trustees concluded that the fee breakpoints represented a means of assuring that benefits of scalability, if any, would be passed along to shareholders at the specified asset levels.
Other Benefits to the Investment Adviser and Its Affiliates
The Trustees also considered the other benefits derived by the Investment Adviser and its affiliates from their relationships with the Funds as stated above, including: (a) transfer agency fees received by Goldman, Sachs & Co. (“Goldman Sachs”); (b) brokerage and futures commissions earned by Goldman Sachs for executing securities and futures transactions on behalf of the Funds; (c) trading efficiencies resulting from aggregation of orders of the Funds with those for other funds or accounts managed by the Investment Adviser; (d) fees earned by Goldman Sachs Agency Lending (“GSAL”), an affiliate of the Investment Adviser, as securities lending agent (and fees earned by the Investment Adviser for managing the fund in which the Funds’ cash collateral is invested); (e) the Investment Adviser’s ability to leverage the infrastructure designed to service the Funds on behalf of its other clients; (f) the Investment Adviser’s ability to cross-market other products and services to Fund shareholders; (g) Goldman Sachs’ retention of certain fees as Fund Distributor; (h) the Investment Adviser’s ability to negotiate better pricing with custodians on behalf of its other clients, as a result of the relationship with the Funds; and (i) the possibility that the working relationship between the Investment Adviser and the Funds’ third-party service providers may cause those service providers to be more likely to do business with other areas of Goldman Sachs. In the course of considering the foregoing, the Independent Trustees requested and received further information quantifying certain of these fall-out benefits.
The Trustees also considered the benefits to GSAL and the Investment Adviser from each Fund’s ability to participate in the securities lending program and observed that, although the benefits to GSAL and the Investment Adviser were meaningful, the
118
GOLDMAN SACHS DOMESTIC EQUITY INSIGHTS FUNDS
Statement Regarding Basis for Approval of Management Agreement (Unaudited) (continued)
benefits to each Fund from its participation in the program were greater, as measured by the revenue received by the Fund in connection with the program.
Other Benefits to the Funds and Their Shareholders
The Trustees also noted that the Funds receive certain potential benefits as a result of their relationship with the Investment Adviser, including: (a) trading efficiencies resulting from aggregation of orders of the Funds with those of other funds or accounts managed by the Investment Adviser; (b) enhanced servicing from vendors because of the volume of business generated by the Investment Adviser and its affiliates; (c) enhanced servicing from broker-dealers because of the volume of business generated by the Investment Adviser and its affiliates; (d) the Investment Adviser’s ability to negotiate favorable terms with derivatives counterparties on behalf of the Funds as a result of the size and reputation of the Goldman Sachs organization; (e) the Investment Adviser’s knowledge and experience gained from managing other accounts and products; (f) the Investment Adviser’s ability to hire and retain qualified personnel to provide services to the Funds because of the reputation of the Goldman Sachs organization; (g) the Funds’ access, through the Investment Adviser, to certain firmwide resources (e.g., proprietary risk management systems and databases), subject to certain restrictions; and (h) the Funds’ access to certain affiliated distribution channels. In addition, the Trustees noted the competitive nature of the mutual fund marketplace, and considered that many of the Funds’ shareholders invested in the Funds in part because of the Funds’ relationship with the Investment Adviser and that those shareholders have a general expectation that the relationship will continue.
Conclusion
In connection with their consideration of the Management Agreement, the Trustees gave weight to each of the factors described above, but did not identify any particular factor as controlling their decision. After deliberation and consideration of all of the information provided, including the factors described above, the Trustees concluded, in the exercise of their business judgment, that the management fees paid by each of the Funds were reasonable in light of the services provided to it by the Investment Adviser, the Investment Adviser’s costs and each Fund’s current and reasonably foreseeable asset levels. The Trustees unanimously concluded that the Investment Adviser’s continued management likely would benefit each Fund and its shareholders and that the Management Agreement should be approved and continued with respect to each Fund until June 30, 2016.
119
GOLDMAN SACHS DOMESTIC EQUITY INSIGHTS FUNDS
Trustees and Officers (Unaudited)
Independent Trustees
| | | | | | | | | | |
Name,
Address and Age1 | | Position(s) Held with the Trust | | Term of Office and
Length of
Time Served2 | | Principal Occupation(s) During Past 5 Years | | Number of
Portfolios in
Fund Complex
Overseen by
Trustee3 | | Other Directorships Held by Trustee4 |
Ashok N. Bakhru Age: 73 | | Chairman of the Board of Trustees | | Since 1996 (Trustee since 1991) | | Mr. Bakhru is retired. He was formerly Director, Apollo Investment Corporation (a business development company) (2008-2013); President, ABN Associates (a management and financial consulting firm) (1994-1996 and 1998-2012); Trustee, Scholarship America (1998-2005); Trustee, Institute for Higher Education Policy (2003-2008); Director, Private Equity Investors — III and IV (1998-2007), and Equity-Linked Investors II (April 2002-2007). Chairman of the Board of Trustees — Goldman Sachs Fund Complex. | | 136 | | None |
Kathryn A. Cassidy Age: 61 | | Trustee | | Since 2015 | | Ms. Cassidy is retired. Formerly, she was Advisor to the Chairman (May 2014-December 2014); and Senior Vice President and Treasurer (2008-2014), General Electric Company & General Electric Capital Corporation (technology and financial services companies). Trustee — Goldman Sachs Fund Complex. | | 112 | | None |
John P. Coblentz, Jr. Age: 74 | | Trustee | | Since 2003 | | Mr. Coblentz is retired. Formerly, he was Partner, Deloitte & Touche LLP (a professional services firm) (1975-2003); Director, Emerging Markets Group, Ltd. (2004-2006); and Director, Elderhostel, Inc. (2006-2012). Trustee — Goldman Sachs Fund Complex. | | 136 | | None |
Diana M. Daniels Age: 66 | | Trustee | | Since 2007 | | Ms. Daniels is retired. Formerly, she was Vice President, General Counsel and Secretary, The Washington Post Company (1991-2006). Ms. Daniels is a Trustee Emeritus and serves as a Presidential Councillor of Cornell University (2013-Present); Member, Advisory Board, Psychology Without Borders (international humanitarian aid organization) (2007-Present), and former Member of the Legal Advisory Board, New York Stock Exchange (2003-2006) and of the Corporate Advisory Board, Standish Mellon Management Advisors (2006-2007). Trustee — Goldman Sachs Fund Complex. | | 112 | | None |
Joseph P. LoRusso Age: 58 | | Trustee | | Since 2010 | | Mr. LoRusso is retired. Formerly, he was President, Fidelity Investments Institutional Services Co. (“FIIS”) (2002-2008); Director, FIIS (2002-2008); Director, Fidelity Investments Institutional Operations Company (2003-2007); Executive Officer, Fidelity Distributors Corporation (2007-2008). Trustee — Goldman Sachs Fund Complex. | | 112 | | None |
Herbert J. Markley Age: 65 | | Trustee | | Since 2013 | | Mr. Markley is retired. Formerly, he was Executive Vice President, Deere & Company (an agricultural and construction equipment manufacturer) (2007-2009); and President, Agricultural Division, Deere & Company (2001-2007). Trustee — Goldman Sachs Fund Complex. | | 112 | | None |
Jessica Palmer Age: 66 | | Trustee | | Since 2007 | | Ms. Palmer is retired. She is Director, Emerson Center for the Arts and Culture (2011-Present); and was formerly a Consultant, Citigroup Human Resources Department (2007-2008); Managing Director, Citigroup Corporate and Investment Banking (previously, Salomon Smith Barney/Salomon Brothers) (1984-2006). Ms. Palmer was a Member of the Board of Trustees of Indian Mountain School (private elementary and secondary school) (2004-2009). Trustee — Goldman Sachs Fund Complex. | | 112 | | None |
| | | | | | | | | | |
120
GOLDMAN SACHS DOMESTIC EQUITY INSIGHTS FUNDS
Trustees and Officers (Unaudited) (continued)
Independent Trustees
| | | | | | | | | | |
Name,
Address and Age1 | | Position(s) Held with the Trust | | Term of Office and
Length of
Time Served2 | | Principal Occupation(s) During Past 5 Years | | Number of
Portfolios in
Fund Complex
Overseen by
Trustee3 | | Other Directorships Held by Trustee4 |
Richard P. Strubel Age: 76 | | Trustee | | Since 1987 | | Mr. Strubel is retired. Formerly, he served as Chairman of the Board of Trustees, Northern Funds (a family of retail and institutional mutual funds managed by Northern Trust Investments, Inc.) (2008-2014) and Trustee (1982-2014); Director, Cardean Learning Group (provider of educational services via the internet) (2003-2008); and Director, Gildan Activewear Inc. (a clothing marketing and manufacturing company) (2000-2014). He serves as Trustee Emeritus, The University of Chicago (1987-Present). Trustee — Goldman Sachs Fund Complex. | | 136 | | None |
Roy W. Templin Age: 55 | | Trustee | | Since 2013 | | Mr. Templin is retired. He is Chairman of the Board of Directors, Con-Way Incorporated (2014-Present); and was formerly Executive Vice President and Chief Financial Officer, Whirlpool Corporation (an appliance manufacturer and marketer) (2004-2012). Trustee — Goldman Sachs Fund Complex. | | 112 | | Con-Way Incorporated (a transportation, logistics and supply-chain management services company) |
Gregory G. Weaver Age: 64 | | Trustee | | Since 2015 | | Mr. Weaver is retired. He is Director, Verizon Communications Inc. (2015-Present); and was formerly Chairman and Chief Executive Officer, Deloitte & Touche LLP (a professional services firm) (2001-2005 and 2012-2014); and Member of the Board of Directors, Deloitte & Touche LLP (2006-2012). Trustee — Goldman Sachs Fund Complex. | | 112 | | Verizon Communications Inc. |
| | | | | | | | | | |
121
GOLDMAN SACHS DOMESTIC EQUITY INSIGHTS FUNDS
Trustees and Officers (Unaudited) (continued)
Interested Trustees*
| | | | | | | | | | |
Name,
Address and Age1 | | Position(s) Held with the Trust | | Term of Office and
Length of
Time Served2 | | Principal Occupation(s) During Past 5 Years | | Number of
Portfolios in
Fund Complex
Overseen by
Trustee3 | | Other Directorships Held by Trustee4 |
James A. McNamara Age: 53 | | President and Trustee | | Since 2007 | | Managing Director, Goldman Sachs (December 1998-Present); Director of Institutional Fund Sales, GSAM (April 1998-December 2000); and Senior Vice President and Manager, Dreyfus Institutional Service Corporation (January 1993- April 1998). President — Goldman Sachs Fund Complex (November 2007-Present); Senior Vice President — Goldman Sachs Fund Complex (May 2007-November 2007); and Vice President — Goldman Sachs Fund Complex (2001-2007). Trustee — Goldman Sachs Fund Complex (November 2007-Present and December 2002-May 2004). | | 135 | | None |
Alan A. Shuch Age: 65 | | Trustee | | Since 1990 | | Advisory Director — GSAM (May 1999-Present); Consultant to GSAM (December 1994-May 1999); and Limited Partner, Goldman Sachs (December 1994-May 1999). Trustee — Goldman Sachs Fund Complex. | | 112 | | None |
| | | | | | | | | | |
| * | | These persons are considered to be “Interested Trustees” because they hold positions with Goldman Sachs and own securities issued by The Goldman Sachs Group, Inc. Each Interested Trustee holds comparable positions with certain other companies of which Goldman Sachs, GSAM or an affiliate thereof is the investment adviser, administrator and/or distributor. |
| 1 | | Each Trustee may be contacted by writing to the Trustee, c/o Goldman Sachs, 200 West Street, New York, New York, 10282, Attn: Caroline Kraus. Information is provided as of October 31, 2015. |
| 2 | | Each Trustee holds office for an indefinite term until the earliest of: (a) the election of his or her successor; (b) the date the Trustee resigns or is removed by the Board of Trustees or shareholders, in accordance with the Trust’s Declaration of Trust; (c) December 31st of the year in which the Trustee turns 74 years of age, subject to waiver by a majority of the Trustees (in accordance with the current resolutions of the Board of Trustees, which may be changed by the Trustees without shareholder vote); or (d) the termination of the Trust. By resolution of the Board of Trustees determining that an extension of service would be beneficial to the Trust, the retirement age has been extended with respect to Richard P. Strubel. |
| 3 | | The Goldman Sachs Fund Complex includes the Trust and Goldman Sachs Variable Insurance Trust (“GSVIT”). As of October 31, 2015, the Trust consisted of 98 portfolios (91 of which offered shares to the public) and GSVIT consisted of 14 portfolios. The Goldman Sachs Fund Complex also includes, with respect to Messrs. Bakhru, Coblentz and Strubel, Goldman Sachs Trust II (“GSTII”), Goldman Sachs BDC, Inc. (“GSBDC”), Goldman Sachs MLP Income Opportunities Fund (“GSMLP”), Goldman Sachs MLP and Energy Renaissance Fund (“GSMER”) and Goldman Sachs ETF Trust (“GSETF”), and with respect to Mr. McNamara, GSTII, GSMLP, GSMER and GSETF. GSTII consisted of seven portfolios (six of which offered shares to the public). GSBDC, GSMLP and GSMER each consisted of one portfolio. GSETF consisted of 14 portfolios (two of which offered shares to the public). |
| 4 | | This column includes only directorships of companies required to report to the Securities and Exchange Commission under the Securities Exchange Act of 1934 (i.e., “public companies”) or other investment companies registered under the Act. |
Additional information about the Trustees is available in the Funds’ Statement of Additional Information, which can be obtained from Goldman Sachs free of charge by calling this toll-free number (in the United States of America): 1-800-526-7384.
122
GOLDMAN SACHS DOMESTIC EQUITY INSIGHTS FUNDS
Trustees and Officers (Unaudited) (continued)
Officers of the Trust*
| | | | | | |
Name, Address and Age1 | | Position(s) Held With the Trust | | Term of
Office and
Length of
Time Served2 | | Principal Occupation(s) During Past 5 Years |
James A. McNamara 200 West Street New York, NY 10282 Age: 53 | | President and Trustee | | Since 2007 | | Managing Director, Goldman Sachs (December 1998-Present); Director of Institutional Fund Sales, GSAM (April 1998-December 2000); and Senior Vice President and Manager, Dreyfus Institutional Service Corporation (January 1993-April 1998). President — Goldman Sachs Fund Complex (November 2007-Present); Senior Vice President — Goldman Sachs Fund Complex (May 2007-November 2007); and Vice President — Goldman Sachs Fund Complex (2001-2007). Trustee — Goldman Sachs Fund Complex (November 2007-Present and December 2002-May 2004). |
Caroline L. Kraus 200 West Street New York, NY 10282 Age: 38 | | Secretary | | Since 2012 | | Vice President, Goldman Sachs (August 2006-Present); Associate General Counsel, Goldman Sachs (2012-Present); Assistant General Counsel, Goldman Sachs (August 2006-December 2011); and Associate, Weil, Gotshal & Manges, LLP (2002-2006). Secretary — Goldman Sachs Fund Complex (August 2012-Present); and Assistant Secretary — Goldman Sachs Fund Complex (June 2012-August 2012). |
Scott M. McHugh 200 West Street New York, NY 10282 Age: 44 | | Principal Financial Officer, Senior Vice President and Treasurer | | Since 2009 (Principal Financial Officer since 2013) | | Vice President, Goldman Sachs (February 2007-Present); Assistant Treasurer of certain mutual funds administered by DWS Scudder (2005-2007); and Director (2005-2007), Vice President (2000-2005), and Assistant Vice President (1998-2000), Deutsche Asset Management or its predecessor (1998-2007). Principal Financial Officer — Goldman Sachs Fund Complex (November 2013-Present); Treasurer — Goldman Sachs Fund Complex (October 2009-Present); Senior Vice President — Goldman Sachs Fund Complex (November 2009-Present); and Assistant Treasurer — Goldman Sachs Fund Complex (May 2007-October 2009). |
| | | | | | |
| * | | Represents a partial list of officers of the Trust. Additional information about all the officers is available in the Funds’ Statement of Additional Information, which can be obtained from Goldman Sachs free of charge by calling this toll-free number (in the United States): 1-800-526-7384. |
| 1 | | Information is provided as of October 31, 2015. |
| 2 | | Officers hold office at the pleasure of the Board of Trustees or until their successors are duly elected and qualified. Each officer holds comparable positions with certain other companies of which Goldman Sachs, GSAM or an affiliate thereof is the investment adviser, administrator and/or distributor. |
123
GOLDMAN SACHS DOMESTIC EQUITY INSIGHTS FUNDS
Goldman Sachs Trust — Domestic Equity Insights Funds — Tax Information (Unaudited)
For the year ended October 31, 2015, 100%, 100%, 100%, 87.57% and 100% of the dividends paid from net investment company taxable income by the Large Cap Growth Insights, Large Cap Value Insights, Small Cap Equity Insights, Small Cap Value Insights, and U.S. Equity Insights Funds, respectively, qualify for the dividends received deduction available to corporations.
For the year ended October 31, 2015, 100% of the dividends paid from net investment company taxable income by the Large Cap Growth Insights, Large Cap Value Insights, Small Cap Equity Insights, Small Cap Value Insights, and U.S. Equity Insights Funds, respectively, qualify for the reduced tax rate under the Jobs and Growth Tax Relief and Reconciliation Act of 2003.
Pursuant to Section 852 of the Internal Revenue Code, the Small Cap Growth Insights Fund designates $4,119,103 and the Small Cap Value Insights Fund designates $2,180,611, or if different, the maximum amount allowable, as capital gain dividends paid during the fiscal year ended October 31, 2015.
124
FUNDS PROFILE
Goldman Sachs Funds

Goldman Sachs is a premier financial services firm, known since 1869 for creating thoughtful and customized investment solutions in complex global markets.
Today, the Investment Management Division of Goldman Sachs serves a diverse set of clients worldwide, including private institutions, public entities and individuals. With approximately $1.02 trillion in assets under supervision as of September 30, 2015, Goldman Sachs Asset Management (“GSAM”) has portfolio management teams located around the world and our investment professionals bring firsthand knowledge of local markets to every investment decision. Assets under supervision includes assets under management and other client assets for which Goldman Sachs does not have full discretion. GSAM leverages the resources of Goldman, Sachs & Co. subject to legal, internal and regulatory restrictions.

Money Market1
Financial Square FundsSM
| n | | Financial Square Tax-Exempt Funds |
| n | | Financial Square Treasury Solutions Fund2 |
| n | | Financial Square Government Fund |
| n | | Financial Square Money Market Fund |
| n | | Financial Square Prime Obligations Fund |
| n | | Financial Square Treasury Instruments Fund |
| n | | Financial Square Treasury Obligations Fund |
| n | | Financial Square Federal Instruments Fund |
Fixed Income
Short Duration and Government
| n | | High Quality Floating Rate Fund |
| n | | Limited Maturity Obligations Fund |
| n | | Short Duration Government Fund |
| n | | Short Duration Income Fund |
| n | | Inflation Protected Securities Fund |
Multi-Sector
Municipal and Tax-Free
| n | | High Yield Municipal Fund |
| n | | Dynamic Municipal Income Fund3 |
| n | | Short Duration Tax-Free Fund |
Single Sector
| n | | Investment Grade Credit Fund |
| n | | High Yield Floating Rate Fund |
| n | | Emerging Markets Debt Fund |
| n | | Local Emerging Markets Debt Fund |
| n | | Dynamic Emerging Markets Debt Fund |
Fixed Income Alternatives
| n | | Long Short Credit Strategies Fund |
| n | | Fixed Income Macro Strategies Fund |
Fundamental Equity
| n | | Small/Mid Cap Value Fund |
| n | | Small/Mid Cap Growth Fund |
| n | | Flexible Cap Growth Fund |
| n | | Concentrated Growth Fund |
| n | | Technology Opportunities Fund4 |
| n | | Growth Opportunities Fund |
| n | | Rising Dividend Growth Fund |
| n | | Dynamic U.S. Equity Fund5 |
Tax-Advantaged Equity
| n | | U.S. Tax-Managed Equity Fund |
| n | | International Tax-Managed Equity Fund |
| n | | U.S. Equity Dividend and Premium Fund |
| n | | International Equity Dividend and Premium Fund |
Equity Insights
| n | | Small Cap Equity Insights Fund |
| n | | U.S. Equity Insights Fund |
| n | | Small Cap Growth Insights Fund |
| n | | Large Cap Growth Insights Fund |
| n | | Large Cap Value Insights Fund |
| n | | Small Cap Value Insights Fund |
| n | | International Small Cap Insights Fund |
| n | | International Equity Insights Fund |
| n | | Emerging Markets Equity Insights Fund |
Fundamental Equity International
| n | | Strategic International Equity Fund |
| n | | Focused International Equity Fund |
| n | | International Small Cap Fund |
| n | | Emerging Markets Equity Fund6 |
Select Satellite7
| n | | Real Estate Securities Fund |
| n | | International Real Estate Securities Fund |
| n | | Global Real Estate Securities Fund |
| n | | Commodity Strategy Fund |
| n | | Dynamic Commodity Strategy Fund |
| n | | Dynamic Allocation Fund |
| n | | Absolute Return Tracker Fund |
| n | | Managed Futures Strategy Fund |
| n | | MLP Energy Infrastructure Fund |
| n | | Multi-Manager Alternatives Fund |
| n | | Multi-Asset Real Return Fund |
| n | | Retirement Portfolio Completion Fund |
| n | | Absolute Return Multi-Asset Fund |
Total Portfolio Solutions7
| n | | Global Managed Beta Fund |
| n | | Multi-Manager Non-Core Fixed Income Fund |
| n | | Multi-Manager U.S. Dynamic Equity Fund |
| n | | Multi-Manager Global Equity Fund |
| n | | Multi-Manager International Equity Fund |
| n | | Tactical Tilt Implementation Fund |
| n | | Balanced Strategy Portfolio |
| n | | Multi-Manager Real Assets Strategy Fund |
| n | | Growth and Income Strategy Portfolio |
| n | | Growth Strategy Portfolio |
| n | | Equity Growth Strategy Portfolio |
| n | | Satellite Strategies Portfolio |
| n | | Enhanced Dividend Global Equity Portfolio |
| n | | Tax Advantaged Global Equity Portfolio |
| 1 | | An investment in a money market fund is neither insured nor guaranteed by the Federal Deposit Insurance Corporation (“FDIC”) or any other government agency. Although the Funds seek to preserve the value of your investment at $1.00 per share, it is possible to lose money by investing in the Funds. |
| 2 | | Effective on September 30, 2015, the Goldman Sachs Financial Square Federal Fund was renamed the Goldman Sachs Financial Square Treasury Solutions Fund. |
| 3 | | Effective on December 18, 2014, the Goldman Sachs Municipal Income Fund was renamed the Goldman Sachs Dynamic Municipal Income Fund. |
| 4 | | Effective on July 31, 2015, the Goldman Sachs Technology Tollkeeper Fund was renamed the Goldman Sachs Technology Opportunities Fund. |
| 5 | | Effective on April 30, 2015, the Goldman Sachs U.S. Equity Fund was renamed the Goldman Sachs Dynamic U.S. Equity Fund. |
| 6 | | Effective at the close of business on October 23, 2015, the Goldman Sachs BRIC Fund (Brazil, Russia, India, China) was reorganized with and into the Goldman Sachs Emerging Markets Equity Fund. |
| 7 | | Individual Funds within the Total Portfolio Solutions and Select Satellite categories will have various placement on the risk/return spectrum and may have greater or lesser risk than that indicated by the placement of the general Total Portfolio Solutions or Select Satellite category. |
Financial Square FundsSM is a registered service mark of Goldman, Sachs & Co.
*This list covers open-end funds only. Please visit our website at www.GSAMFUNDS.com to learn about our closed-end funds and exchange-traded funds.
| | |
TRUSTEES Ashok N. Bakhru, Chairman Kathryn A. Cassidy John P. Coblentz, Jr. Diana M. Daniels Joseph P. LoRusso Herbert J. Markley James A. McNamara Jessica Palmer Alan A. Shuch Richard P. Strubel Roy W. Templin Gregory G. Weaver | | OFFICERS James A. McNamara, President Scott M. McHugh, Principal Financial Officer and Treasurer Caroline L. Kraus, Secretary |
| |
GOLDMAN, SACHS & CO. Distributor and Transfer Agent | | GOLDMAN SACHS ASSET MANAGEMENT, L.P. Investment Adviser |
Visit our website at www.GSAMFUNDS.com to obtain the most recent month-end returns.
Goldman Sachs Asset Management, L.P., 200 West Street, New York, New York 10282
The reports concerning the Funds included in this shareholder report may contain certain forward-looking statements about the factors that may affect the performance of the Funds in the future. These statements are based on Fund management’s predictions and expectations concerning certain future events and their expected impact on the Funds, such as performance of the economy as a whole and of specific industry sectors, changes in the levels of interest rates, the impact of developing world events, and other factors that may influence the future performance of the Funds. Management believes these forward-looking statements to be reasonable, although they are inherently uncertain and difficult to predict. Actual events may cause adjustments in portfolio management strategies from those currently expected to be employed.
A description of the policies and procedures that the Funds use to determine how to vote proxies relating to portfolio securities and information regarding how a Fund voted proxies relating to portfolio securities during the most recent 12-month period ended June 30 is available (i) without charge, upon request by calling 1-800-526-7384 (for Retail Shareholders) or 1-800-621-2550 (for Institutional Shareholders); and (ii) on the Securities and Exchange Commission (“SEC”) web site at http://www.sec.gov.
The Funds file their complete schedule of portfolio holdings with the SEC for the first and third quarters of each fiscal year on Form N-Q. The Funds’ Forms N-Q are available on the SEC’s web site at http://www.sec.gov within 60 days after the Funds’ first and third fiscal quarters. The Funds’ Forms N-Q may be reviewed and copied at the SEC’s Public Reference Room in Washington, D.C., and information on the operation of the Public Reference Room may also be obtained by calling 1-800-SEC-0330. Forms N-Q may be obtained upon request and without charge by calling 1-800-526-7384 (for Retail Shareholders) or 1-800-621-2550 (for Institutional Shareholders).
Fund holdings and allocations shown are as of October 31, 2015 and may not be representative of future investments. Fund holdings should not be relied on in making investment decisions and should not be construed as research or investment advice regarding particular securities. Current and future holdings are subject to risk.
Economic and market forecasts presented herein reflect our judgment as of the date of this presentation and are subject to change without notice. These forecasts do not take into account the specific investment objectives, restrictions, tax and financial situation or other needs of any specific client. Actual data will vary and may not be reflected here. These forecasts are subject to high levels of uncertainty that may affect actual performance. Accordingly, these forecasts should be viewed as merely representative of a broad range of possible outcomes. These forecasts are estimated, based on assumptions, and are subject to significant revision and may change materially as economic and market conditions change. Goldman Sachs has no obligation to provide updates or changes to these forecasts. Case studies and examples are for illustrative purposes only.
The Global Industry Classification Standard (GICS) was developed by and is the exclusive property and a service mark of Morgan Stanley Capital International Inc. (MSCI) and Standard & Poor’s, a division of The McGraw-Hill Companies, Inc. (S&P) and is licensed for use by Goldman Sachs. Neither MSCI, S&P nor any other party involved in making or compiling the GICS or any GICS classifications makes any express or implied warranties or representations with respect to such standard or classification (or the results to be obtained by the use thereof), and all such parties hereby expressly disclaim all warranties of originality, accuracy, completeness, merchantability or fitness for a particular purpose with respect to any of such standard or classification. Without limiting any of the foregoing, in no event shall MSCI, S&P, any of their affiliates or any third party involved in making or compiling the GICS or any GICS classifications have any liability for any direct, indirect, special, punitive, consequential or any other damages (including lost profits) even if notified of the possibility of such damages. The portfolio risk management process includes an effort to monitor and manage risk, but does not imply low risk.
This material is not authorized for distribution to prospective investors unless preceded or accompanied by a current Prospectus or summary prospectus, if applicable. Investors should consider a Fund’s objective, risks, and charges and expenses, and read the summary prospectus, if available, and/or the Prospectus carefully before investing or sending money. The summary prospectus, if available, and the Prospectus contain this and other information about a Fund and may be obtained from your authorized dealer or from Goldman, Sachs & Co. by calling (retail – 1-800-526-7384) (institutional – 1-800-621-2550).
© 2015 Goldman Sachs. All rights reserved. 21582-TEMPL-12/2015 DOMINSAR-15 / 45K
| | (a) | As of the end of the period covered by this report, the registrant has adopted a code of ethics that applies to the registrant’s principal executive officer, principal financial officer, principal accounting officer or controller, or persons performing similar functions, regardless of whether these individuals are employed by the registrant or a third party (the “Code of Ethics”). |
| | (b) | During the period covered by this report, no amendments were made to the provisions of the Code of Ethics. |
| | (c) | During the period covered by this report, the registrant did not grant any waivers, including an implicit waiver, from any provision of the Code of Ethics. |
| | (d) | A copy of the Code of Ethics is available as provided in Item 12(a)(1) of this report. |
| ITEM 3. | AUDIT COMMITTEE FINANCIAL EXPERT. |
| | The registrant’s board of trustees has determined that the registrant has at least one “audit committee financial expert” (as defined in Item 3 of Form N-CSR) serving on its audit committee. Gregory G. Weaver is the “audit committee financial expert” and is “independent” (as each term is defined in Item 3 of Form N-CSR). |
| ITEM 4. | PRINCIPAL ACCOUNTANT FEES AND SERVICES. |
Table 1 — Items 4(a) - 4(d). The accountant fees below reflect the aggregate fees billed by all of the Funds of the Goldman Sachs Trust and includes the Goldman Sachs Funds to which this certified shareholder report relates.
| | | | | | | | | | | | |
| | | 2015 | | 2014 | | Description of Services Rendered |
| | | |
| | | | | | | | | | | | |
| | | |
Audit Fees: | | | | | | | | | | | | |
| | | |
• PricewaterhouseCoopers LLP
(“PwC”) | | | $ | 3,662,967 | | | | $ | 3,539,534 | | | Financial Statement audits. |
| | | |
Audit-Related Fees: | | | | | | | | | | | | |
| | | |
• PwC | | | $ | 138,000 | | | | $ | 0 | | | Other attest services. |
| | | |
Tax Fees: | | | | | | | | | | | | |
| | | |
• PwC | | | $ | 848,676 | | | | $ | 794,850 | | | Tax compliance services provided in connection with the preparation and review of registrant’s tax returns. |
Table 2 — Items 4(b)(c) & (d). Non-Audit Services to the Goldman Sachs Trust’s service affiliates * that were pre-approved by the Audit Committee of the Goldman Sachs Trust pursuant to Rule 2-01(c)(7)(ii) of Regulation S-X.
| | | | | | | | | | | | |
| | | 2015 | | 2014 | | Description of Services Rendered |
| | | |
| | | | | | | | | | | | |
| | | |
Audit-Related Fees: | | | | | | | | | | | | |
| | | |
• PwC | | | $ | 1,653,616 | | | | $ | 1,486,420 | | | Internal control review performed in accordance with Statement on Standards for Attestation Engagements No. 16 and semi annual updates relating to withholding tax accrual for non-US jurisdictions. These fees are borne by the Funds’ Adviser. |
| * | These include the advisor (excluding sub-advisors) and any entity controlling, controlled by or under common control with the advisor that provides ongoing services to the registrant (hereinafter referred to as “service affiliates”). |
Item 4(e)(1) — Audit Committee Pre-Approval Policies and Procedures
Pre-Approval of Audit and Non-Audit Services Provided to the Funds of the Goldman Sachs Trust. The Audit and Non-Audit Services Pre-Approval Policy (the “Policy”) adopted by the Audit Committee of Goldman Sachs Trust (“GST”) sets forth the procedures and the conditions pursuant to which services performed by an independent auditor for GST may be pre-approved. Services may be pre-approved specifically by the Audit Committee as a whole or, in certain circumstances, by the Audit Committee Chairman or the person designated as the Audit Committee Financial Expert. In addition, subject to specified cost limitations, certain services may be pre-approved under the provisions of the Policy. The Policy provides that the Audit Committee will consider whether the services provided by an independent auditor are consistent with the Securities and Exchange Commission’s rules on auditor independence. The Policy provides for periodic review and pre-approval by the Audit Committee of the services that may be provided by the independent auditor.
De Minimis Waiver. The pre-approval requirements of the Policy may be waived with respect to the provision of non-audit services that are permissible for an independent auditor to perform, provided (1) the aggregate amount of all such services provided constitutes no more than five percent of the total amount of revenues subject to pre-approval that was paid to the independent auditors during the fiscal year in which the services are provided; (2) such services were not recognized by GST at the time of the engagement to be non-audit services; and (3) such services are promptly brought to the attention of the Audit Committee and approved prior to the completion of the audit by the Audit Committee or by one or more members of the Audit Committee to whom authority to grant such approvals has been delegated by the Audit Committee, pursuant to the pre-approval provisions of the Policy.
Pre-Approval of Non-Audit Services Provided to GST’s Investment Advisers. The Policy provides that, in addition to requiring pre-approval of audit and non-audit services provided to GST, the Audit Committee will pre-approve those non-audit services provided to GST’s investment advisers (and entities controlling, controlled by or under common control with the investment advisers that provide ongoing services to GST) where the engagement relates directly to the operations or financial reporting of GST.
Item 4(e)(2) – 0% of the audit-related fees, tax fees and other fees listed in Table 1 were approved by GST’s Audit Committee pursuant to the “de minimis” exception of Rule 2-01(c)(7)(i)(C) of Regulation S-X. In addition, 0% of the non-audit services to the GST’s service affiliates listed in Table 2 were approved by GST’s Audit Committee pursuant to the “de minimis” exception of Rule 2-01(c)(7)(i)(C) of Regulation S-X.
Item 4(f) – Not applicable.
Item 4(g) Aggregate Non-Audit Fees Disclosure
The aggregate non-audit fees billed to GST by PwC for the twelve months ended October 31, 2015 and October 31, 2014 were approximately $986,676 and $794,850 respectively. The aggregate non-audit fees billed to GST’s adviser and service affiliates by PwC for non-audit services for the twelve months ended December 31, 2014 and December 31, 2013 were approximately $10.2 million and $9.8 million respectively. The figures for these entities are not yet available for the twelve months ended December 31, 2015. With regard to the aggregate non-audit fees billed to GST’s adviser and service affiliates, the 2014 and 2013 amounts include fees for non-audit services required to be pre-approved [see Table 2] and fees for non-audit services that did not require pre-approval since they did not directly relate to GST’s operations or financial reporting.
Item 4(h) — GST’s Audit Committee has considered whether the provision of non-audit services to GST’s investment adviser and service affiliates that did not require pre-approval pursuant to paragraph (c)(7)(ii) of Rule 2-01 of Regulation S-X is compatible with maintaining the auditors’ independence.
| ITEM 5. | AUDIT COMMITTEE OF LISTED REGISTRANTS. |
| ITEM 6. | SCHEDULE OF INVESTMENTS. |
| | Schedule of Investments is included as part of the Report to Stockholders filed under Item 1. |
| ITEM 7. | DISCLOSURE OF PROXY VOTING POLICIES AND PROCEDURES FOR CLOSED-END MANAGEMENT INVESTMENT COMPANIES. |
| ITEM 8. | PORTFOLIO MANAGERS OF CLOSED-END MANAGEMENT INVESTMENT COMPANIES. |
| ITEM 9. | PURCHASES OF EQUITY SECURITIES BY CLOSED-END MANAGEMENT INVESTMENT COMPANY AND AFFILIATED PURCHASERS. |
| ITEM 10. | SUBMISSION OF MATTERS TO A VOTE OF SECURITY HOLDERS. |
| | There have been no material changes to the procedures by which shareholders may recommend nominees to the registrant’s board of trustees. |
| ITEM 11. | CONTROLS AND PROCEDURES. |
| | (a) | The registrant’s principal executive and principal financial officers, or persons performing similar functions have concluded that the registrant’s disclosure controls and procedures (as defined in Rule 30a-3(c) under the Investment Company Act of 1940, as amended (the “1940 Act”)) are effective as of a date within 90 days of the filing of this report that includes the disclosure required by this paragraph, based on the evaluation of these controls and procedures required by Rule 30a-3(b) under the 1940 Act and 15d-15(b) under the Securities Exchange Act of 1934, as amended. |
| | (b) | There were no changes in the registrant’s internal control over financial reporting (as defined in Rule 30a-3(d) under the 1940 Act) that occurred during the registrant’s most recent fiscal quarter of the period covered by this report that have materially affected, or are reasonably likely to materially affect, the registrant’s internal control over financial reporting. |
| | | | |
| (a)(1) | | Goldman Sachs Trust’s Code of Ethics for Principal Executive and Senior Financial Officers is incorporated by reference to Exhibit 12(a)(1) of the registrant’s Form N-CSR filed on July 8, 2015 for its International Equity Insights Funds. |
| | |
| (a)(2) | | Exhibit 99.CERT | | Certifications pursuant to Section 302 of the Sarbanes-Oxley Act of 2002 filed herewith. |
| | |
| (b) | | Exhibit 99.906CERT | | Certifications pursuant to Section 906 of the Sarbanes-Oxley Act of 2002 filed herewith. |
SIGNATURES
Pursuant to the requirements of the Securities Exchange Act of 1934 and the Investment Company Act of 1940, the registrant has duly caused this report to be signed on its behalf by the undersigned, thereunto duly authorized.
| | |
| | | Goldman Sachs Trust |
| |
| By: | | /s/ James A. McNamara |
| |
| | |
| | James A. McNamara |
| | President/Chief Executive Officer |
| | Goldman Sachs Trust |
| |
| Date: | | January 7, 2016 |
Pursuant to the requirements of the Securities Exchange Act of 1934 and the Investment Company Act of 1940, this report has been signed below by the following persons on behalf of the registrant and in the capacities and on the dates indicated.
| | |
| By: | | /s/ James A. McNamara |
| |
| | |
| | James A. McNamara |
| | President/Chief Executive Officer |
| | Goldman Sachs Trust |
| |
| Date: | | January 7, 2016 |
| |
| By: | | /s/ Scott McHugh |
| |
| | |
| | Scott McHugh |
| | Principal Financial Officer |
| | Goldman Sachs Trust |
| |
| Date: | | January 7, 2016 |