UNITED STATES
SECURITIES AND EXCHANGE COMMISSION
Washington, D.C. 20549
FORM N-CSR
CERTIFIED SHAREHOLDER REPORT OF REGISTERED
MANAGEMENT INVESTMENT COMPANIES
Investment Company Act file number 811-05349
Goldman Sachs Trust
(Exact name of registrant as specified in charter)
71 South Wacker Drive,
Chicago, Illinois 60606
(Address of principal executive offices) (Zip code)
| | |
Copies to: |
Caroline Kraus | | Geoffrey R.T. Kenyon, Esq. |
Goldman, Sachs & Co. | | Dechert LLP |
200 West Street | | One International Place, 40th Floor |
New York, New York 10282 | | 100 Oliver Street |
| | Boston, MA 02110 |
(Name and address of agents for service)
Registrant’s telephone number, including area code: (312) 655-4400
Date of fiscal year end: November 30
Date of reporting period: November 30, 2015
| ITEM 1. | REPORTS TO STOCKHOLDERS. |
| | The Annual Report to Shareholders is filed herewith. |
Goldman Sachs Funds

| | | | |
| | |
| Annual Report | | | | November 30, 2015 |
| | |
| | | | MLP Energy Infrastructure Fund |

Goldman Sachs MLP Energy Infrastructure Fund
| | | | |
TABLE OF CONTENTS | | | | |
| |
Principal Investment Strategies and Risks | | | 1 | |
| |
Investment Process | | | 2 | |
| |
Portfolio Management Discussion and Performance Summaries | | | 3 | |
| |
Schedule of Investments | | | 12 | |
| |
Financial Statements | | | 13 | |
| |
Financial Highlights | | | 16 | |
| |
Notes to Financial Statements | | | 18 | |
| |
Report of Independent Registered Accounting Firm | | | 31 | |
| |
Other Information | | | 32 | |
| | | | |
| | | |
| NOT FDIC-INSURED | | May Lose Value | | No Bank Guarantee |
GOLDMAN SACHS MLP ENERGY INFRASTRUCTURE FUND
Principal Investment Strategies and Risks
This is not a complete list of risks that may affect the Fund. For additional information concerning the risks applicable to the Fund, please see the Fund’s Prospectus.
The Goldman Sachs MLP Energy Infrastructure Fund invests primarily in a portfolio of master limited partnership (“MLP”) investments in the energy sector. The Fund’s equity investments are subject to market risk, which means that the value of the securities in which it invests may go up or down in response to the prospects of individual companies, particular sectors and/or general economic conditions. Investments in MLPs are subject to certain risks, including risks related to limited control and limited rights to vote, potential conflicts of interest, cash flow risks, dilution risks, limited liquidity, risks related to the general partner’s right to force sales at undesirable times or prices, interest rate sensitivity and for MLPs with smaller capitalizations, lower trading volume and abrupt or erratic price movements. MLPs are also subject to risks relating to their complex tax structure, including the risk that an MLP could lose its tax status as a partnership, resulting in a reduction in the value of the Fund’s investment in the MLP and lower income to the Fund. MLPs are also subject to the risk that to the extent that a distribution received from an MLP is treated as a return of capital, the Fund’s adjusted tax basis in the MLP interests may be reduced, which may increase the Fund’s tax liability upon the sale of the MLP interests or upon subsequent distributions in respect of such interests. The Fund’s strategy of investing primarily in MLPs, resulting in its being taxed as a regular corporation, or “C” corporation, involves complicated accounting, tax and valuation issues. Many MLPs in which the Fund invests operate facilities within the energy sector and are also subject to risks affecting that sector. Because the Fund concentrates its investments in the energy sector, the Fund is subject to greater risk of loss as a result of adverse economic, business or other developments affecting industries within that sector than if its investments were more diversified across different industries. The Fund may invest in private investment in public equities (“PIPEs”) which may be deemed illiquid. The securities of mid- and small-capitalization companies involve greater risks than those associated with larger, more established companies and may be subject to more abrupt or erratic price movements. The Fund is “non-diversified”and may invest a larger percentage of its assets in fewer issuers than “diversified” funds. Accordingly, the Fund may be more susceptible to adverse developments affecting any single issuer held in its portfolio and to greater losses resulting from these developments.
1
GOLDMAN SACHS MLP ENERGY INFRASTRUCTURE FUND
What Differentiates Goldman Sachs’ MLP Energy Infrastructure Fund Investment Process?
With a quality-oriented approach, the MLP Energy Infrastructure Fund seeks total return through current income and capital appreciation. We have an experienced investment team integrated within Goldman Sachs Asset Management, L.P. (“GSAM”), allowing us to leverage franchise expertise and risk framework across multiple asset classes. We invest primarily in Master Limited Partnerships (“MLPs”), or similar structures, that own energy infrastructure assets.

| n | | To capture the full energy chain, we analyze energy production and user trends that ultimately impact energy infrastructure. |
| n | | We rigorously assess companies on both the asset and equity level. |

| n | | Macro Trend Analysis First, we analyze overall energy trends through capital spending shifts and drilling trends, in addition to regional supply and demand imbalances. |
| n | | Top-Down Sector Selection Secondly, we establish the impact of macro and regional trends on energy infrastructure. |
| n | | Bottom-Up Security Selection Finally, we select names by evaluating a company’s management, assets, expected returns and technicals. |

| n | | Our team of MLP dedicated investment professionals includes lead portfolio managers averaging 10 years of investment experience. |
| n | | Ability to leverage energy related resources across GSAM Equity, Fixed Income and Commodity groups, as well as utilize risk management resources. |
| n | | Unique investment approach stemming from a more holistic view across the extremes of the energy value chain, corporate access, broader valuation understanding, and resource advantages. |
2
PORTFOLIO RESULTS
Goldman Sachs MLP Energy Infrastructure Fund
Investment Objective And Principal Strategy
The Fund seeks total return through current income and capital appreciation. The Fund, under normal circumstances, invests at least 80% of its net assets plus any borrowings for investment purposes (measured at the time of purchase) in energy infrastructure master limited partnership (“MLP”) investments. The Fund’s MLP investments may include, but are not limited to: MLPs structured as limited partnerships or limited liability companies; MLPs that are taxed as “C” corporations; institutional units issued by MLP affiliates; “C” corporations that hold significant interests in MLPs; private investments in public equities (“PIPEs”) issued by MLPs; and other equity and fixed income securities and derivative instruments, including pooled investment vehicles and exchange-traded notes (“ETNs”), that provide exposure to MLPs. Energy infrastructure MLPs own and operate assets that are used in the energy sector, including assets used in exploring, developing, producing, generating, transporting (including marine), transmitting, terminal operation, storing, gathering, processing, refining, distributing, mining or marketing of natural gas, natural gas liquids, crude oil, refined products, coal or electricity, or that provide energy-related equipment or services. The Fund’s MLP investments may be of any capitalization size.
Portfolio Management Discussion and Analysis
Below, the Goldman Sachs Energy and Infrastructure Team discusses the Goldman Sachs MLP Energy Infrastructure Fund’s (the “Fund”) performance and positioning for the 12-month period ended November 30, 2015 (the “Reporting Period”).
| Q | | How did the Fund perform during the Reporting Period? |
| A | | During the Reporting Period, the Fund’s Class A, C, Institutional, IR and R Shares generated average annual total returns, without sales charges, of -33.27%, -33.79%, -33.05%, -33.13% and -33.50%, respectively. These returns compare to the -34.03% average annual total return of the Alerian MLP Index (the “Alerian Index”). The Alerian Index1 is a composite of the 50 most prominent energy MLPs. |
| Q | | How did energy master limited partnerships (“MLPs”) overall perform during the Reporting Period? |
| A | | During the Reporting Period, energy MLPs, as represented by the Alerian Index declined on a total return basis. In addition, the Alerian Index (-34.03%) underperformed the S&P 500® Index (+2.75%) and the AMEX Energy Select Sector Index (-12.42%).2 The Alerian Index also underperformed the utilities (-5.07%) and real estate investment trust (“REIT”) (+2.77%) sectors, as represented by the Philadelphia Stock Exchange (PHLX) Utility Sector Index and the FTSE NAREIT (National Association of |
| 2 | | The S&P 500® Index is a diverse index that includes 500 American companies that represent more than 70% of the total market capitalization of the U.S. stock market. The AMEX Energy Select Sector Index (IXE) is a modified market capitalization-based index intended to track the movements of companies that are components of the S&P 500® Index and are involved in the development or production of energy products. |
| | Real Estate Investment Trusts) U.S. Real Estate Index, respectively.3 |
| | Persistent weakness in the crude oil market, due to continued global oversupply and inventory build-up, was a headwind for energy MLPs. Despite a rally in West Texas Intermediate (“WTI”) crude prices during the second quarter of 2015, WTI prices ended the Reporting Period at $40.30 per barrel, down from $84.40 per barrel at the beginning of the Reporting Period.4 In response to the sharp drop in crude oil prices, North American energy producers significantly reduced capital expenditures and rig counts. By November 2015, the U.S. oil-focused rig count had fallen to 555, down 66% from the October 2014 high of 1,609.5 Despite these reductions, U.S. hydrocarbon production — which includes crude oil, natural gas and natural gas liquids — declined at a slower pace than many market participants had expected. In fact, U.S. production which was 9.6 million barrels per day in April 2015, fell to less than 9.1 million barrels per day through October 2015. Despite continued strong demand growth, this relatively strong production, combined with ongoing above-quota production from the Organization of |
| 3 | | The PHLX Utility Sector Index is composed of geographically diverse public U.S. utility stocks. The FTSE NAREIT U.S. Real Estate Index Series is an index that spans the commercial real estate space across the U.S. economy, offering exposure to all investment and property sectors. |
3
PORTFOLIO RESULTS
| | Petroleum Exporting Countries (“OPEC”), drove the decline of crude oil prices during the Reporting Period. |
| | Weak net investment inflows and increased short interest hindered MLP performance during the Reporting Period overall. Although net investment flows remained positive during the first half of the Reporting Period, they reversed in the third quarter of 2015 as crude oil prices fell to their lows of the Reporting Period, with energy MLPs experiencing their first net investment outflows since the inception of the Alerian Index on June 1, 2006. For the Reporting Period overall, there were $4.6 billion of inflows to exchange traded funds (“ETFs”), ETNs, closed-end mutual funds and open-end mutual funds. This compares with $20.7 billion of inflows during the same timeframe a year earlier. In addition to weak investment flows, a strong increase in short interest pressured certain names. Short interest (as measured by the Alerian MLP Index ETF) was 17.5% at the end of the Reporting Period, up from 9.6% in June 2014 when crude oil prices peaked.6 (Short interest is the quantity of shares that investors have sold short but not yet covered or closed out.) |
| Q | | What key factors were responsible for the Fund’s performance during the Reporting Period? |
| A | | Security selection drove the Fund’s relative performance during the Reporting Period. |
| | Overall, the Fund benefited from its ownership of what we consider to be quality companies with strong management teams, strong balance sheets and favorable commodity and geographical exposures (asset footprint). |
| 6 | | Source: Bloomberg, Goldman Sachs Asset Management. Data as of November 30, 2015. |
| Q | | What individual holdings added to the Fund’s relative performance during the Reporting Period? |
| A | | During the Reporting Period, the Fund’s investments in Northern Tier Energy LP, Sunoco LP and VTTI Energy Partners LP added to its relative returns. |
| | Northern Tier Energy LP (NTI), which engages in refining, retail and logistics operations, was a top contributor to the Fund during the Reporting Period. The company’s downstream7 exposure increased its operating margins, helped by low commodity prices. We also believe greater than expected demand for refined products helped boost NTI’s unit price. We feel the refiner is well positioned with feedstock from the Bakken Shale and from Canada, which should, in our opinion, enable it to generate some of the highest gross margins within its peer group. The Fund continued to hold NTI at the end of the Reporting Period. |
| | The Fund also benefited from an investment in Sunoco LP (SUN), which purchases motor fuel from a number of refiners and supplies it to retail outlets, affiliates, independently operated dealer stations and other end users. The Fund was invested in SUN through a PIPE. PIPE transactions are often issued at a discount to the currently trading public stock, which can provide an attractive entry price. SUN issued the PIPE to raise capital for the acquisition of the remaining wholesale fuel and retail marketing assets of Energy Transfer Partners (ETP). The Fund benefited from this investment during the Reporting Period because of its attractive entry point and the market’s reaction to the drop-down acquisition. (Drop-down refers to the act of a parent company selling MLP-qualified assets to the associated MLP.) At the end of the Reporting Period, the Fund maintained a position in SUN. |
| 7 | | The downstream component of the energy industry is usually defined as the oil and gas operations that take place after the production phase, through to the point of sale. Downstream operations can include refining crude oil and distributing the by-products down to the retail level. By-products can include gasoline, natural gas liquids, diesel and a variety of other energy sources. The upstream component of the energy industry is usually defined as those operations stages in the oil and gas industry that involve exploration and production. Upstream operations deal primarily with the exploration stages of the oil and gas industry, with upstream firms taking the first steps to first locate, test and drill for oil and gas. Later, once reserves are proven, upstream firms will extract any oil and gas from the reserve. The midstream component of the energy industry is usually defined as those companies providing products or services that help link the supply side, i.e. energy producers, and the demand side, i.e. energy end-users, for any type of energy commodity. Such midstream business can include, but are not limited to, those that process, store, market and transport various energy commodities. |
4
PORTFOLIO RESULTS
| | Another leading contributor to Fund performance was VTTI Energy Partners LP (VTTI), which owns, operates, develops and acquires refined petroleum products and crude oil terminalling businesses and related energy infrastructure assets. VTTI’s unit price rose after the company issued a positive third quarter 2015 earnings report that included a quarter-over-quarter increase in adjusted EBITDA (earnings before interest, taxes, depreciation and amortization). In addition, we believe VTTI’s unit price has minimal correlation with falling commodity prices due to the company’s fee-based, take-or-pay contract revenue. (Take-or-pay is a provision, written into a contract, whereby one party has the obligation of either taking delivery of goods or paying a specified amount.) Additionally, we believe reduced upstream7 spending levels have had a limited impact on VTTI because international storage requirements are driven by regional product supply/demand imbalances and global product demand growth. We consider the company well positioned for strong growth as a result of the backlog of drop-down assets that are expected from its parent. At the end of the Reporting Period, the Fund no longer maintained a position in the security. |
| Q | | What individual holdings detracted from the Fund’s relative performance during the Reporting Period? |
| A | | During the Reporting Period, the Fund was hampered relative to the Alerian Index by its positions in SemGroup Corp., Plains GP Holdings LP and Targa Resources Corp. |
| | A notable detractor from Fund performance was SemGroup Corp. (SEMG), which provides gathering, transportation, storage, distribution, marketing and other midstream7 services primarily to independent producers. The company also holds the general partner stake in Rose Rock Midstream LP. SEMG was hurt during the Reporting Period by investor fears about the company’s White Cliffs pipeline, which operates in the Denver-Julesburg Basin. Investors also had a negative reaction to management’s concerns about competing pipelines that were either online during the Reporting Period or scheduled to go online in 2017. At the end of the Reporting Period, the Fund continued to own SEMG as we viewed the name to be oversold and trading at an attractive valuation. |
| | Plains GP Holdings LP (PAGP) was another key detractor from Fund results. PAGP, which operates as a holding company, is the general partner of Plains All American Pipeline, LP (PAA). PAA is involved in the transportation, storage, terminalling and marketing of crude oil, refined products and liquefied petroleum gas as well as the development and operation of natural gas storage facilities. |
| | PAGP dampened Fund returns during the Reporting Period, largely due to fears about distributions at PAA. PAA posted conservative earnings reports and guidance during the Reporting Period and was one of the first MLPs to warn about potentially lower distributions. Also, PAA is more crude oil-focused than most of its peers, which weighed on investor sentiment as crude oil prices dominated commodity-related headlines. The Fund maintained its position in PAGP at the end of the Reporting Period because we considered the name to be oversold and trading at an attractive valuation. |
| | The Fund was hindered by its position in Targa Resources Corp. (TRGP). TRGP provides midstream natural gas and natural gas liquid services through its interests in the MLP Targa Resources Partners LP (NGLS). As a general partner with incentive distribution rights, TRGP was expected to participate in the growth at its MLP. However, price declines among commodities, including crude oil, natural gas liquids and natural gas, dampened growth at NGLS, hurting TRGP. During the Reporting Period, as a result of macroeconomic conditions in the energy industry, TRGP announced it would be rolling NGLS into its corporate structure to improve its overall cost of capital. The deal, while likely beneficial in the long term, in our view, was greeted negatively by investors. The Fund maintained its position in TRGP at the end of the Reporting Period. |
| Q | | Were there any notable purchases or sales during the Reporting Period? |
| A | | During the Reporting Period, the Fund initiated a position in Antero Midstream Partners LP (AM). AM operates natural gas and fresh water assets located in the Marcellus and Utica Shales. AM has been able to grow its distribution due to the strong natural gas production growth at its parent, Antero Resources (AR). Additionally, during the Reporting Period, AM acquired fresh water assets from its parent via a dropdown, which was well received by the market. |
| | Another notable purchase during the Reporting Period was Sunoco LP (SUN), which purchases motor fuel from a number of refiners and supplies it to retail outlets, affiliates, independently operated dealer stations and other end users. As mentioned previously, the Fund’s investment was accomplished through a PIPE. |
| | During the Reporting Period, the Fund sold its position in Plains All American Pipeline, LP (PAA). The company was negatively impacted by a leak in one of its oil pipelines in the |
5
PORTFOLIO RESULTS
| | Santa Barbara area. The total loss was approximately 2,500 barrels, with approximately 500 of those barrels making their way into the Pacific Ocean. In addition, while subsequent earnings were relatively in line with analyst expectations, PAA expressed cautious views on the MLP sector and the energy sector overall, which resulted in reduced distribution growth guidance. PAA also reported, in a defensive move, that it could consider the option to hold its distributions flat in 2016, despite its outlook for cash flow growth. As a result, we sold the Fund’s position in PAA during the Reporting Period and reallocated the proceeds to companies we believed had stronger distribution growth profiles. |
| | In addition, we eliminated the Fund’s position in Summit Midstream Partners LP (SMLP) during the Reporting Period. SMLP is an MLP that owns and operates midstream energy infrastructure located in the core producing areas of unconventional resource basins, primarily shale formations, in North America. SMLP underperformed after the company lowered its 2015 guidance when it announced its 2014 calendar year results. While almost all of SMLP’s revenues are fee-based, we perceived there were risks of lower production volumes because of the company’s geographic exposure. We therefore decided to exit the Fund’s position in the security, reallocating the proceeds to companies on which we held more favorable views. |
| Q | | How did the Fund use derivatives and similar instruments during the Reporting Period? |
| A | | During the Reporting Period, the Fund did not use derivatives or similar instruments. |
| Q | | What is the Fund’s tactical view and strategy for the months ahead? |
| A | | At the end of the Reporting Period, energy MLPs, as represented by the Alerian Index, had declined 39.6% from their all-time peak on August 29, 2014. Looking ahead, we believe the MLP sector could potentially provide an attractive yield and capital appreciation over the long term. In the short term, we believe MLPs should continue to offer distribution growth, albeit at a slower pace than the double digit growth seen in past calendar quarters as management teams strive to be more conservative in terms of distribution growth.8 While lower distribution growth trajectories will result, in our view, in smaller future payouts for investors in the near term, they will also allow MLPs to finance more of their capital expenditures with internal capital, thus reducing reliance, we believe, on external debt and the equity markets. |
| 8 | | Source: Bloomberg, Goldman Sachs Asset Management. Growth rates are market-cap weighted. Data as of November 30, 2015. |
| | During the Reporting Period, correlations between energy MLP unit prices and crude oil prices were higher than the long-term average, a pattern we expect to continue in the near term.9 Therefore, if crude oil prices continue to be volatile, we anticipate some turbulence in the MLP sector. That said, at the end of the Reporting Period, energy MLP valuations were near their cheapest levels since the 2008 financial crisis. In addition, the spread (or yield differential) between energy MLPs and 10-year U.S. Treasury securities was at 6.5%, substantially higher than the long term average of 3.8%.10 In terms of enterprise value (the market value of debt, common equity and preferred equity minus the value of cash), the MLP sector was valued at approximately 9.5 times its EBITDA as compared to the historical long term average (1999-present) of approximately 11.9 times its EBITDA.11 (The enterprise value/EBITDA multiple is a financial ratio that measures a company’s value.) As commodity prices stabilize, we believe there is the potential of capital appreciation in the MLP sector, stemming from both distribution growth and multiple expansion. |
| | Despite the decline in commodity prices during the Reporting Period, we still believe overall production volumes will likely continue to grow across oil, natural gas liquids and dry natural gas over the long term, albeit at lower levels than those expected in mid-2014 when crude oil prices were near $100 per barrel. However, if crude oil prices remain near or below $40 per barrel for the long term, we believe production could potentially be more severely curtailed, which would, in our view, be detrimental to MLP sector performance. That said crude oil accounts for only about 30% of the energy infrastructure space, with most of the rest in natural gas and natural gas liquids.12 Going forward, we see significant opportunity in the latter two areas due to numerous demand-driven positive catalysts. In terms of natural gas, these catalysts include increased U.S. and international demand drivers. In terms of U.S. demand, these catalysts include the transition from coal to natural gas power generation, as well as large-scale natural gas fed petrochemical developments. In terms of international demand, the continued buildout of the U.S.’s export capabilities should allow for exports to increase considerably over the 2016 calendar year. In terms of natural |
| 9 | | Source: Goldman Sachs Investment Strategy Group, Bloomberg. |
| 10 | | Source: Bloomberg; Goldman Sachs Asset Management. MLP yields reflect the market-cap weighted average yield of the 50 largest MLPs as represented by the Alerian Index. |
| 11 | | Source: Bloomberg; Goldman Sachs Asset Management, Credit Suisse. Data as of November 30, 2015. |
| 12 | | Source: Bloomberg, Goldman Sachs Asset Management, Securities and Exchange Commission company filings. |
6
PORTFOLIO RESULTS
| | gas liquids, recent and planned international expansion terminals should allow for continued export growth, continuing to drive overall demand. |
| | Looking ahead, we see additional tailwinds for the MLP sector, such as increased merger and acquisition activity, greater investor interest and continued U.S. government support for U.S. energy development. Indeed, after the end of the Reporting Period, the U.S. government lifted its ban on crude oil exports, allowing for greater market liquidity and more efficient pricing of crude oil across geographies. We believe this should positively impact the midstream sector, as crude oil exports will, in our view, give midstream providers more opportunities to provide services to their customers and give producers more confidence about the long-term political environment in the U.S. |
| | However, despite our positive outlook, investors should, in our view, remain mindful that the MLP sector is facing additional challenges besides lower commodity prices. For example, rising interest rates could negatively affect MLP valuations, and access to the capital markets could be limited if investors lose confidence about a rebound in the energy markets. Finally, we believe investors should recognize a growing dispersion in performance. Rising U.S. production has greatly altered the energy landscape, proving beneficial to some regions and detrimental to others. As a result, the dispersion between the energy “haves” and “have nots” has increased. Accordingly, in our opinion, rigorous fundamental analysis is essential in seeking to take advantage of the powerful energy revolution theme that we believe persists. |
7
FUND BASICS
Goldman Sachs MLP Energy Infrastructure Fund
as of November 30, 2015
| | | | | | | | | | |
| | PERFORMANCE REVIEW | |
| | | December 1, 2014–November 30, 2015 | | Fund Total Return
(based on NAV)1 | | | Alerian Index2 | |
| | Class A | | | -33.27 | % | | | -34.03 | % |
| | Class C | | | -33.79 | | | | -34.03 | |
| | Institutional | | | -33.05 | | | | -34.03 | |
| | Class IR | | | -33.13 | | | | -34.03 | |
| | | Class R | | | -33.50 | | | | -34.03 | |
| | 1 | | The net asset value (“NAV”) represents the net assets of the class of the Fund (ex-dividend) divided by the total number of shares of the class outstanding. The Fund’s performance assumes the reinvestment of dividends and other distributions. The Fund’s performance does not reflect the deduction of any applicable sales charges. |
| | 2 | | The Alerian Index is a composite of the 50 most prominent energy master limited partnerships calculated by Standard & Poor’s using a float-adjusted market capitalization methodology. The Alerian Index is disseminated by the New York Stock Exchange real-time on a price return basis (NYSE: AMZ). The corresponding total return index is calculated and disseminated daily through ticker AMZX. The Alerian Index figures do not reflect any deduction for fees, expenses or taxes. It is not possible to invest directly in an index. |
| | | | | | | | | | | | |
| | STANDARDIZED TOTAL RETURNS3 |
| | | For the period ended 9/30/15 | | One Year | | | Since Inception | | | Inception Date |
| | Class A | | | -42.44 | % | | | -8.88 | % | | 3/28/13 |
| | Class C | | | -40.13 | | | | -7.47 | | | 3/28/13 |
| | Institutional | | | -38.83 | | | | -6.44 | | | 3/28/13 |
| | Class IR | | | -38.89 | | | | -6.53 | | | 3/28/13 |
| | | Class R | | | -39.20 | | | | -7.00 | | | 3/28/13 |
| | 3 | | The Standardized Total Returns are average annual total returns as of the most recent calendar quarter-end. They assume reinvestment of all distributions at net asset value. These returns reflect a maximum initial sales charge of 5.5% for Class A Shares and the contingent deferred sales charge for Class C Shares (1% if shares are redeemed within 12 months of purchase). Because Institutional, Class IR and Class R Shares do not involve a sales charge, such a charge is not applied to their Standardized Total Returns. |
The returns set forth in the tables above represent past performance. Past performance does not guarantee future results. The Fund’s investment return and principal value will fluctuate so that an investor’s shares, when redeemed, may be worth more or less than their original cost. Current performance may be lower or higher than the performance quoted above. Please visit our web site at www.GSAMFUNDS.com to obtain the most recent month-end returns. Performance reflects applicable fee waivers and/or expense limitations in effect during the periods shown. In their absence, performance would be reduced. Returns do not reflect the deduction of taxes that a shareholder would pay on Fund distributions or the redemption of Fund shares.
8
FUND BASICS
| | | | | | | | | | |
| | EXPENSE RATIOS4 | |
| | | | | Expense Ratio
(Including Tax Benefit/ Expense)5 | | | Operating Expenses Ratio
(Excluding Tax Benefit/Expense) | |
| | Class A | | | 3.56 | % | | | 1.45 | % |
| | Class C | | | 4.31 | | | | 2.20 | |
| | Institutional | | | 3.16 | | | | 1.05 | |
| | Class IR | | | 3.31 | | | | 1.20 | |
| | | Class R | | | 3.81 | | | | 1.70 | |
| | 4 | | The expense ratios of the Fund, both current (net of applicable fee waivers and/or expense limitations) and before waivers (gross of applicable fee waivers and/or expense limitations), are as set forth above according to the most recent publicly available Prospectus and may differ from the expense ratios disclosed in the Financial Highlights in this report. |
| | 5 | | The Fund’s waivers and/or expense limitations will remain in place through at least March 30, 2016, and prior to such date the Investment Adviser may not terminate the arrangements without the approval of the Fund’s Board of Trustees. If these arrangements are discontinued in the future, the expense ratios may change without shareholder approval. |
| | | | | | | | |
| | TOP TEN HOLDINGS AS OF 11/30/156 |
| | | Holding | | % of Net Assets | | | Line of Business |
| | Enterprise Products Partners LP | | | 8.0 | % | | Diversified Midstream |
| | Magellan Midstream Partners LP | | | 7.7 | | | Liquids, Pipelines & Terminalling |
| | Shell Midstream Partners LP | | | 7.4 | | | Liquids, Pipelines & Terminalling |
| | Sunoco Logistics Partners LP | | | 6.3 | | | Liquids, Pipelines & Terminalling |
| | EQT Midstream Partners LP | | | 5.7 | | | Natural Gas and NGL Infrastructure |
| | MPLX LP | | | 5.6 | | | Liquids, Pipelines & Terminalling |
| | Tesoro Logistics LP | | | 5.5 | | | Liquids, Pipelines & Terminalling |
| | Antero Midstream Partners LP | | | 5.0 | | | Natural Gas and NGL Infrastructure |
| | Genesis Energy LP | | | 4.9 | | | Liquids, Pipelines & Terminalling |
| | | Phillips 66 Partners LP | | | 4.4 | | | Liquids, Pipelines & Terminalling |
| | 6 | | The top 10 holdings may not be representative of the Fund’s future investments. |
9
FUND BASICS
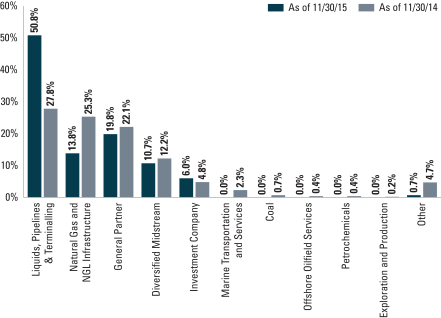
| | 7 | | The Fund is actively managed and, as such, its composition may differ over time. Consequently, the Fund’s overall sector allocations may differ from the percentages contained in the graph above. The percentage shown for each investment category reflects the value of investments in that category as a percentage of total net assets. Sector allocations are defined by GSAM and may differ from sector allocations used by the Alerian Index. |
10
GOLDMAN SACHS MLP ENERGY INFRASTRUCTURE FUND
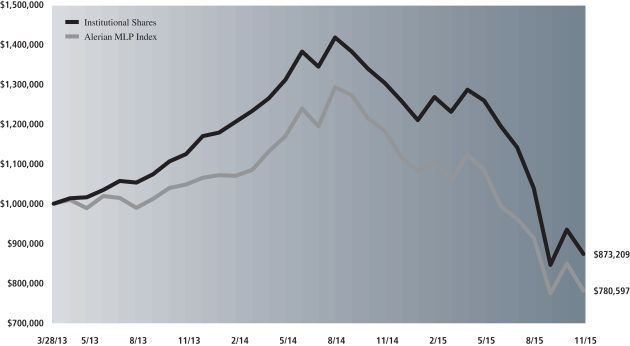
Performance Summary
November 30, 2015
The following graph shows the value, as of November 30, 2015, of a $1,000,000 investment made on March 28, 2013 (commencement of operations) in Institutional Shares at NAV. For comparative purposes, the performance of the Fund’s benchmark, the Alerian MLP Index is shown. This performance data represents past performance and should not be considered indicative of future performance, which will fluctuate with changes in market conditions. These performance fluctuations will cause an investor’s shares, when redeemed, to be worth more or less than their original cost. Performance reflects applicable fee waivers and/or expense limitations in effect during the periods shown and in their absence, performance would be reduced. Returns do not reflect the deduction of taxes that a shareholder would pay on Fund distributions or the redemption of Fund shares. Performance of Class A, Class C, Class IR and Class R Shares will vary from that of Institutional Shares due to differences in class specific fees and any applicable sales charges. In addition to the Investment Adviser’s decisions regarding issuer/industry investment selection and allocation, other factors may affect Fund performance. These factors include, but are not limited to, Fund operating fees and expenses, portfolio turnover and subscription and redemption cash flows affecting the Fund.
|
| MLP Energy Infrastructure Fund’s Lifetime Performance |
Performance of a $1,000,000 Investment, with distributions reinvested, from March 28, 2013 through November 30, 2015.
| | | | | | |
| Average Annual Total Return through November 30, 2015 | | | One Year | | | Since Inception |
Class A (Commenced March 28, 2013) | | | | | | |
Excluding sales charges | | | -33.27% | | | -5.28% |
Including sales charges | | | -36.96% | | | -7.25% |
|
Class C (Commenced March 28, 2013) | | | | | | |
Excluding contingent deferred sales charges | | | -33.79% | | | -5.98% |
Including contingent deferred sales charges | | | -34.45% | | | -5.98% |
|
Institutional (Commenced March 28, 2013) | | | -33.05% | | | -4.93% |
|
Class IR (Commenced March 28, 2013) | | | -33.13% | | | -5.06% |
|
Class R (Commenced March 28, 2013) | | | -33.50% | | | -5.54% |
|
11
GOLDMAN SACHS MLP ENERGY INFRASTRUCTURE FUND
Schedule of Investments
November 30, 2015
| | | | | | | | |
Shares | | | Description | | Value | |
| | | | | | | | |
| | Common Stocks – 95.8% | |
| | Diversified Midstream – 10.7% | |
| | 980,879 | | | Energy Transfer Partners LP | | $ | 37,479,387 | |
| | 5,606,407 | | | Enterprise Products Partners LP | | | 142,346,674 | |
| | 518,848 | | | Targa Resources Partners LP | | | 11,850,488 | |
| | | | | | | | |
| | | | | | | 191,676,549 | |
| | |
| | General Partner – 19.8% | |
| | 3,928,250 | | | Energy Transfer Equity LP | | | 74,401,055 | |
| | 2,873,013 | | | EQT GP Holdings LP | | | 65,590,887 | |
| | 1,405,811 | | | Plains GP Holdings LP Class A | | | 17,235,243 | |
| | 1,465,416 | | | SemGroup Corp. Class A | | | 50,893,898 | |
| | 2,921,748 | | | Tallgrass Energy GP LP(b) | | | 64,161,586 | |
| | 883,744 | | | Targa Resources Corp. | | | 34,731,139 | |
| | 1,184,707 | | | The Williams Cos., Inc. | | | 43,312,888 | |
| | 104,548 | | | Western Gas Equity Partners LP | | | 4,361,742 | |
| | | | | | | | |
| | | | | | | 354,688,438 | |
| | |
| | Liquids, Pipelines & Terminalling – 50.8% | |
| | 1,168,812 | | | Buckeye Partners LP | | | 79,116,884 | |
| | 2,240,121 | | | Genesis Energy LP | | | 88,148,761 | |
| | 2,192,216 | | | Magellan Midstream Partners LP | | | 137,079,267 | |
| | 2,326,928 | | | MPLX LP | | | 99,918,288 | |
| | 1,368,221 | | | Phillips 66 Partners LP | | | 79,356,818 | |
| | 71,259 | | | Rose Rock Midstream LP | | | 1,491,451 | |
| | 3,771,034 | | | Shell Midstream Partners LP | | | 131,495,956 | |
| | 4,012,138 | | | Sunoco Logistics Partners LP | | | 111,818,286 | |
| | 1,400,441 | | | Sunoco LP (PIPE)(a) | | | 45,122,209 | |
| | 1,982,671 | | | Tesoro Logistics LP | | | 99,034,416 | |
| | 770,945 | | | Valero Energy Partners LP | | | 35,717,882 | |
| | | | | | | | |
| | | | | | | 908,300,218 | |
| | |
| | Natural Gas and NGL Infrastructure – 13.8% | |
| | 3,966,190 | | | Antero Midstream Partners LP | | | 88,921,980 | |
| | 1,500,144 | | | EQT Midstream Partners LP | | | 101,484,741 | |
| | 588,657 | | | MarkWest Energy Partners LP | | | 28,255,536 | |
| | 1,303,000 | | | Rice Midstream Partners LP (PIPE)(a) | | | 17,108,390 | |
| | 254,556 | | | Tallgrass Energy Partners LP | | | 10,958,636 | |
| | | | | | | | |
| | | | | | | 246,729,283 | |
| | |
| | Other – 0.7% | |
| | 424,668 | | | Northern Tier Energy LP | | | 11,516,996 | |
| | 85,339 | | | OCI Partners LP | | | 692,100 | |
| | | | | | | | |
| | | | | | | 12,209,096 | |
| | |
| | TOTAL COMMON STOCKS | | | | |
| | (Cost $2,094,448,536) | | $ | 1,713,603,584 | |
| | |
| | | | | | |
Shares | | Distribution Rate | | Value | |
| | | | | | |
| Investment Company(b) – 6.0% | |
Goldman Sachs Financial Square Government Fund – FST Shares | |
| 106,636,227 | | 0.043% | | $ | 106,636,227 | |
| (Cost $106,636,227) | | | | |
| |
| TOTAL INVESTMENTS – 101.8% | |
| (Cost $2,201,084,763) | | $ | 1,820,239,811 | |
| |
| LIABILITIES IN EXCESS OF OTHER ASSETS – (1.8)% | | | (31,900,982 | ) |
| |
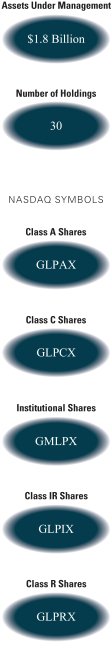
| NET ASSETS – 100.0% | | $ | 1,788,338,829 | |
| |
| | |
| The percentage shown for each investment category reflects the value of investments in that category as a percentage of net assets. |
(a) | | Restricted securities are not registered under the Securities Act of 1933, as amended, and are subject to legal restrictions on resale. These securities generally may be resold in transactions exempt from registration or to the public if the securities are subsequently registered. Disposal of these securities may involve time consuming negotiations and prompt sale at an acceptable price may be difficult. Total market value of restricted securities amounts to $62,230,599, which represents approximately 3.5% of net assets as of November 30, 2015. See additional details below: |
| | | | | | | | |
| Restricted Security | | Acquisition Date | | | Cost | |
| |
Sunoco LP (PIPE) | | | 11/24/15 | | | $ | 39,912,569 | |
Rice Midstream Partners LP (PIPE) | | | 11/4/15 | | | | 17,004,150 | |
| | |
(b) | | Represents an Affiliated Issuer/Fund. |
| | |
|
Investment Abbreviations: |
GP | | —General Partnership |
LP | | —Limited Partnership |
PIPE | | —Private Investment in Public Equity |
|
| | |
| 12 | | The accompanying notes are an integral part of these financial statements. |
GOLDMAN SACHS MLP ENERGY INFRASTRUCTURE FUND
Statement of Assets and Liabilities
November 30, 2015
| | | | | | |
| | | | | MLP Energy
Infrastructure
Fund | |
| | Assets: | |
| | Investments of unaffiliated issuers, at value (cost $2,012,371,037) | | $ | 1,649,441,998 | |
| | Investments of affiliated issuers, at value (cost $188,713,726) | | | 170,797,813 | |
| | Cash | | | 7,742,826 | |
| | Receivables: | | | | |
| | Fund shares sold | | | 12,456,867 | |
| | Investments sold | | | 10,229,225 | |
| | Current taxes | | | 6,433,648 | |
| | Dividends | | | 501,502 | |
| | Foreign tax reclaims | | | 301,151 | |
| | Other assets | | | 12,988 | |
| | Total assets | | | 1,857,918,018 | |
| | | | | | |
| | Liabilities: | |
| | Payables: | | | | |
| | Investments purchased on an extended — settlement basis | | | 39,912,569 | |
| | Fund shares redeemed | | | 19,189,582 | |
| | Investments purchased | | | 8,332,808 | |
| | Management fees | | | 1,437,751 | |
| | Distribution and service fees and transfer agent fees | | | 344,005 | |
| | Accrued expenses | | | 362,474 | |
| | Total liabilities | | | 69,579,189 | |
| | | | | | |
| | Net Assets: | |
| | Paid-in capital | | | 2,604,300,850 | |
| | Distributions in excess of net investment loss, net of taxes | | | (26,963,233 | ) |
| | Accumulated net realized loss, net of taxes | | | (408,116,533 | ) |
| | Net unrealized loss, net of taxes | | | (380,882,255 | ) |
| | | NET ASSETS | | $ | 1,788,338,829 | |
| | | Net Assets: | | | | |
| | | Class A | | $ | 292,686,007 | |
| | | Class C | | | 173,427,133 | |
| | | Institutional | | | 1,225,024,366 | |
| | | Class IR | | | 95,824,834 | |
| | | Class R | | | 1,376,489 | |
| | | Total Net Assets | | $ | 1,788,338,829 | |
| | | Shares Outstanding $0.001 par value (unlimited shares authorized): | | | | |
| | | Class A | | | 38,433,753 | |
| | | Class C | | | 23,245,192 | |
| | | Institutional | | | 159,013,157 | |
| | | Class IR | | | 12,485,627 | |
| | | Class R | | | 182,027 | |
| | | Net asset value, offering and redemption price per share:(a) | | | | |
| | | Class A | | | $7.62 | |
| | | Class C | | | 7.46 | |
| | | Institutional | | | 7.70 | |
| | | Class IR | | | 7.67 | |
| | | Class R | | | 7.56 | |
| | (a) | | Maximum public offering price per share is $8.06. At redemption, Class C Shares may be subject to a contingent deferred sales charge, assessed on the amount equal to the lesser of the current net asset value (“NAV”) or the original purchase price of the shares. |
| | |
| The accompanying notes are an integral part of these financial statements. | | 13 |
GOLDMAN SACHS MLP ENERGY INFRASTRUCTURE FUND
Statement of Operations
For the Fiscal Year Ended November 30, 2015
| | | | | | |
| | | | | MLP Energy
Infrastructure
Fund | |
| | Investment income: | |
| | Dividends — unaffiliated issuers (includes tax withheld of $598,772) | | $ | 106,967,170 | |
| | Dividends — affiliated issuers | | | 525,391 | |
| | Less: return of capital on dividends | | | (86,251,264 | ) |
| | Total investment income | | | 21,241,297 | |
| | | | | | |
| | Expenses: | |
| | Management fees | | | 21,191,374 | |
| | Distribution and Service fees(a) | | | 3,375,101 | |
| | Transfer Agency fees(a) | | | 2,095,470 | |
| | Professional fees | | | 300,506 | |
| | Printing and mailing costs | | | 257,144 | |
| | Custody, accounting and administrative services | | | 183,452 | |
| | Registration fees | | | 137,958 | |
| | Trustee fees | | | 35,180 | |
| | Other | | | 72,009 | |
| | Total operating expenses, before taxes | | | 27,648,194 | |
| | Less — expense reductions | | | (89,973 | ) |
| | Net operating expenses, before taxes | | | 27,558,221 | |
| | NET INVESTMENT LOSS, BEFORE TAXES | | | (6,316,924 | ) |
| | Current and deferred tax benefit/(expense) | | | (895,014 | ) |
| | NET INVESTMENT LOSS, NET OF TAXES | | | (7,211,938 | ) |
| | | | | | |
| | Realized and unrealized gain (loss): | |
| | Net realized gain (loss) from: | | | | |
| | Investments — unaffiliated issuers | | | (458,564,848 | ) |
| | Investments — affiliated issuers | | | (231,943 | ) |
| | Foreign currency transactions | | | (203,335 | ) |
| | Current and deferred tax benefit | | | 16,279,134 | |
| | Net change in unrealized gain (loss) on: | | | | |
| | Investments — unaffiliated issuers | | | (431,123,044 | ) |
| | Investments — affiliated issuers | | | (17,915,913 | ) |
| | Foreign currency translation | | | (40,627 | ) |
| | Deferred tax benefit | | | 25,263,423 | |
| | Net realized and unrealized loss, net of taxes | | | (866,537,153 | ) |
| | NET DECREASE IN NET ASSETS RESULTING FROM OPERATIONS | | $ | (873,749,091 | ) |
| | (a) | | Class specific Distribution and Service, and Transfer Agent fees were as follows: |
| | | | | | | | | | | | | | | | | | | | | | | | | | | | | | |
| Distribution and Service Fees | | | Transfer Agency Fees | |
Class A | | | Class C | | | Class R | | | Class A | | | Class C | | | Institutional | | | Class IR | | | Class R | |
| $ | 1,072,237 | | | $ | 2,301,175 | | | $ | 1,689 | | | $ | 814,900 | | | $ | 437,223 | | | $ | 584,267 | | | $ | 258,438 | | | $ | 642 | |
| | |
| 14 | | The accompanying notes are an integral part of these financial statements. |
GOLDMAN SACHS MLP ENERGY INFRASTRUCTURE FUND
Statements of Changes in Net Assets
| | | | | | | | | | |
| | | | | MLP Energy Infrastructure Fund | |
| | | | | For the Fiscal
Year Ended
November 30, 2015 | | | For the Fiscal
Year Ended
November 30, 2014 | |
| | From operations: | |
| | Net investment loss, net of taxes | | $ | (7,211,938 | ) | | $ | (3,786,328 | ) |
| | Net realized gain (loss), net of taxes | | | (442,720,992 | ) | | | 20,702,810 | |
| | Net change in unrealized gain (loss), net of taxes | | | (423,816,161 | ) | | | 38,981,919 | |
| | Net increase (decrease) in net assets resulting from operations | | | (873,749,091 | ) | | | 55,898,401 | |
| | | | | | | | | | |
| | Distributions to shareholders: | | | | | | | | |
| | From net investment income | | | | | | | | |
| | Class A Shares | | | — | | | | (3,342,062 | ) |
| | Class C Shares | | | — | | | | (1,324,904 | ) |
| | Institutional Shares | | | — | | | | (9,984,819 | ) |
| | Class IR Shares | | | — | | | | (962,093 | ) |
| | Class R Shares | | | — | | | | (584 | ) |
| | From capital | | | | | | | | |
| | Class A Shares | | | (20,466,377 | ) | | | (10,594,809 | ) |
| | Class C Shares | | | (11,331,574 | ) | | | (4,200,133 | ) |
| | Institutional Shares | | | (70,394,348 | ) | | | (31,653,294 | ) |
| | Class IR Shares | | | (6,431,628 | ) | | | (3,049,971 | ) |
| | Class R Shares | | | (26,341 | ) | | | (1,852 | ) |
| | Total distributions to shareholders | | | (108,650,268 | ) | | | (65,114,521 | ) |
| | | | | | | | | | |
| | From share transactions: | | | | | | | | |
| | Proceeds from sales of shares | | | 1,690,469,105 | | | | 2,722,164,931 | |
| | Reinvestment of distributions | | | 107,490,030 | | | | 64,492,126 | |
| | Cost of shares redeemed | | | (1,575,166,588 | ) | | | (520,117,010 | ) |
| | Net increase in net assets resulting from share transactions | | | 222,792,547 | | | | 2,266,540,047 | |
| | TOTAL INCREASE (DECREASE) | | | (759,606,812 | ) | | | 2,257,323,927 | |
| | | | | | | | | | |
| | Net assets: | | | | | | | | |
| | Beginning of year | | | 2,547,945,641 | | | | 290,621,714 | |
| | End of year | | $ | 1,788,338,829 | | | $ | 2,547,945,641 | |
| | Distributions in excess of net investment loss, net of taxes | | $ | (26,963,233 | ) | | $ | (19,751,295 | ) |
| | |
| The accompanying notes are an integral part of these financial statements. | | 15 |
GOLDMAN SACHS MLP ENERGY INFRASTRUCTURE FUND
Financial Highlights
Selected Data for a Share Outstanding Throughout Each Period
| | | | | | | | | | | | | | | | | | | | | | | | | | | | | | |
| | | | | | | | From
investment operations | | | Distributions
to shareholders | |
| | | Year - Share Class | | Net asset
value,
beginning
of period | | | Net
investment
income (loss)(a) | | | Net realized
and unrealized
gain (loss) | | | Total from
investment
operations | | | From net
investment
income | | | From
capital | | | Total
distributions | |
| | FOR THE FISCAL YEARS ENDED NOVEMBER 30, | |
| | 2015 - A | | $ | 11.98 | | | $ | (0.05 | ) | | $ | (3.82 | ) | | $ | (3.87 | ) | | $ | — | | | $ | (0.49 | ) | | $ | (0.49 | ) |
| | 2015 - C | | | 11.83 | | | | (0.12 | ) | | | (3.76 | ) | | | (3.88 | ) | | | — | | | | (0.49 | ) | | | (0.49 | ) |
| | 2015 - Institutional | | | 12.06 | | | | (0.01 | ) | | | (3.86 | ) | | | (3.87 | ) | | | — | | | | (0.49 | ) | | | (0.49 | ) |
| | 2015 - IR | | | 12.04 | | | | (0.03 | ) | | | (3.85 | ) | | | (3.88 | ) | | | — | | | | (0.49 | ) | | | (0.49 | ) |
| | 2015 - R | | | 11.93 | | | | 0.18 | | | | (4.06 | ) | | | (3.88 | ) | | | — | | | | (0.49 | ) | | | (0.49 | ) |
| | 2014 - A | | | 10.81 | | | | (0.08 | ) | | | 1.75 | | | | 1.67 | | | | (0.12 | ) | | | (0.38 | ) | | | (0.50 | ) |
| | 2014 - C | | | 10.76 | | | | (0.15 | ) | | | 1.72 | | | | 1.57 | | | | (0.12 | ) | | | (0.38 | ) | | | (0.50 | ) |
| | 2014 - Institutional | | | 10.84 | | | | (0.01 | ) | | | 1.73 | | | | 1.72 | | | | (0.12 | ) | | | (0.38 | ) | | | (0.50 | ) |
| | 2014 - IR | | | 10.83 | | | | (0.02 | ) | | | 1.73 | | | | 1.71 | | | | (0.12 | ) | | | (0.38 | ) | | | (0.50 | ) |
| | 2014 - R | | | 10.79 | | | | (0.11 | ) | | | 1.75 | | | | 1.64 | | | | (0.12 | ) | | | (0.38 | ) | | | (0.50 | ) |
| | | | | | | | | | | | | | | | | | | | | | | | | | | | | | |
| | FOR THE PERIOD ENDED NOVEMBER 30, | |
| | 2013 - A(f) | | | 10.00 | | | | (0.07 | ) | | | 1.27 | | | | 1.20 | | | | — | | | | (0.39 | ) | | | (0.39 | ) |
| | 2013 - C(f) | | | 10.00 | | | | (0.06 | ) | | | 1.21 | | | | 1.15 | | | | — | | | | (0.39 | ) | | | (0.39 | ) |
| | 2013 - Institutional(f) | | | 10.00 | | | | (0.01 | ) | | | 1.24 | | | | 1.23 | | | | — | | | | (0.39 | ) | | | (0.39 | ) |
| | 2013 - IR(f) | | | 10.00 | | | | (0.05 | ) | | | 1.27 | | | | 1.22 | | | | — | | | | (0.39 | ) | | | (0.39 | ) |
| | 2013 - R(f) | | | 10.00 | | | | (0.06 | ) | | | 1.24 | | | | 1.18 | | | | — | | | | (0.39 | ) | | | (0.39 | ) |
| | (a) | | Calculated based on the average shares outstanding methodology. |
| | (b) | | Assumes investment at the NAV at the beginning of the period, reinvestment of all dividends and distributions, a complete redemption of the investment at the NAV at the end of the period and no sales or redemption charges. Total returns would be reduced if a sales or redemption charge was taken into account. Returns do not reflect the deduction of taxes that a shareholder would pay on Fund distributions or the redemption of Fund shares. Total returns for periods less than one full year are not annualized. |
| | (c) | | A current and deferred tax estimate for the ratio calculation is derived from the net investment income (loss), and realized and unrealized gains (losses). |
| | (d) | | Current and deferred tax benefit for the ratio calculation is derived from net investment income (loss) only. |
| | (e) | | The Fund’s portfolio turnover rate is calculated in accordance with regulatory requirements, without regard to transactions involving short term investments and certain derivatives. If such transactions were included, the Fund’s portfolio turnover rate may be higher. |
| | (f) | | Commenced operations on March 28, 2013. |
| | (g) | | Annualized with the exception of tax expenses. |
| | |
| 16 | | The accompanying notes are an integral part of these financial statements. |
GOLDMAN SACHS MLP ENERGY INFRASTRUCTURE FUND
| | | | | | | | | | | | | | | | | | | | | | | | | | | | | | | | | | | | | | | | | | | | | | | | | | | | | | | | | | | | | | | | |
| | | | | | | | | | | | | | | | | | Ratio of Expenses
to Average Net Assets | | | | | Ratio of Investment income (loss)
to Average Net Assets | | | | | | |
| | | Net asset
value,
end of
period | | | | | Total
return(b) | | | | | Net assets,
end of period
(in 000s) | | | | | After expense
reimbursements
and tax (benefit)/ expense(c) | | | | | Before expense
reimbursements
and after tax
(benefit)/ expense(c) | | | | | Net of expense
reimbursements
and before tax
(benefit)/ expense | | | | | Before expense
reimbursements
and tax (benefit)/ expense | | | | | After expense
reimbursements
and tax benefit/
(expense)(d) | | | | | Net of expense
reimbursements
and before tax
benefit/
(expense) | | | | | Before expense
reimbursements
and tax benefit/
(expense) | | | | | Portfolio
turnover
rate(e) | |
| | | | | | | | | | | | | | | | | | | | | | | | | | | | | | | | | | | | | | | | | | | | | | | | | | | | | | | | | | | | | | | | |
| | $ | 7.62 | | | | | | (33.27 | )% | | | | $ | 292,686 | | | | | | (0.38 | )% | | | | | (0.38 | )% | | | | | 1.42 | % | | | | | 1.42 | % | | | | | (0.57 | )% | | | | | (0.53 | )% | | | | | (0.54 | )% | | | | | 96 | % |
| | | 7.46 | | | | | | (33.79 | ) | | | | | 173,427 | | | | | | 0.37 | | | | | | 0.38 | | | | | | 2.17 | | | | | | 2.18 | | | | | | (1.27 | ) | | | | | (1.23 | ) | | | | | (1.23 | ) | | | | | 96 | |
| | | 7.70 | | | | | | (33.05 | ) | | | | | 1,225,024 | | | | | | (0.78 | ) | | | | | (0.78 | ) | | | | | 1.02 | | | | | | 1.02 | | | | | | (0.10 | ) | | | | | (0.06 | ) | | | | | (0.06 | ) | | | | | 96 | |
| | | 7.67 | | | | | | (33.13 | ) | | | | | 95,825 | | | | | | (0.63 | ) | | | | | (0.63 | ) | | | | | 1.17 | | | | | | 1.17 | | | | | | (0.32 | ) | | | | | (0.28 | ) | | | | | (0.28 | ) | | | | | 96 | |
| | | 7.56 | | | | | | (33.50 | ) | | | | | 1,376 | | | | | | (0.11 | ) | | | | | (0.11 | ) | | | | | 1.69 | | | | | | 1.69 | | | | | | 1.97 | | | | | | 2.01 | | | | | | 2.01 | | | | | | 96 | |
| | | 11.98 | | | | | | 15.59 | | | | | | 513,722 | | | | | | 3.57 | | | | | | 3.57 | | | | | | 1.46 | | | | | | 1.46 | | | | | | (0.56 | ) | | | | | (0.61 | ) | | | | | (0.61 | ) | | | | | 25 | |
| | | 11.83 | | | | | | 14.61 | | | | | | 241,841 | | | | | | 4.32 | | | | | | 4.32 | | | | | | 2.21 | | | | | | 2.21 | | | | | | (1.19 | ) | | | | | (1.24 | ) | | | | | (1.24 | ) | | | | | 25 | |
| | | 12.06 | | | | | | 15.91 | | | | | | 1,613,322 | | | | | | 3.17 | | | | | | 3.17 | | | | | | 1.06 | | | | | | 1.06 | | | | | | (0.06 | ) | | | | | (0.11 | ) | | | | | (0.11 | ) | | | | | 25 | |
| | | 12.04 | | | | | | 15.73 | | | | | | 178,966 | | | | | | 3.32 | | | | | | 3.32 | | | | | | 1.21 | | | | | | 1.21 | | | | | | (0.10 | ) | | | | | (0.15 | ) | | | | | (0.15 | ) | | | | | 25 | |
| | | 11.93 | | | | | | 15.23 | | | | | | 96 | | | | | | 3.82 | | | | | | 3.84 | | | | | | 1.71 | | | | | | 1.73 | | | | | | (0.89 | ) | | | | | (0.93 | ) | | | | | (0.95 | ) | | | | | 25 | |
| | | | | | | | | | | | | | | | | | | | | | | | | | | | | | | | | | | | | | | | | | | | | | | | | | | | | | | | | | | | | | | | |
| | | | | | | | | | | | | | | | | | | | | | | | | | | | | | | | | | | | | | | | | | | | | | | | | | | | | | | | | | | | | | | | |
| | | 10.81 | | | | | | 12.12 | | | | | | 51,363 | | | | | | 9.36 | (g) | | | | | 9.71 | (g) | | | | | 1.51 | (g) | | | | | 1.86 | (g) | | | | | (1.00 | )(g) | | | | | (1.23 | )(g) | | | | | (1.63 | )(g) | | | | | 96 | |
| | | 10.76 | | | | | | 11.71 | | | | | | 20,112 | | | | | | 10.11 | (g) | | | | | 10.45 | (g) | | | | | 2.26 | (g) | | | | | 2.60 | (g) | | | | | (0.90 | )(g) | | | | | (1.14 | )(g) | | | | | (1.54 | )(g) | | | | | 96 | |
| | | 10.84 | | | | | | 12.53 | | | | | | 206,886 | | | | | | 8.95 | (g) | | | | | 9.50 | (g) | | | | | 1.11 | (g) | | | | | 1.66 | (g) | | | | | (0.17 | )(g) | | | | | (0.40 | )(g) | | | | | (1.03 | )(g) | | | | | 96 | |
| | | 10.83 | | | | | | 12.42 | | | | | | 12,229 | | | | | | 9.11 | (g) | | | | | 9.49 | (g) | | | | | 1.26 | (g) | | | | | 1.64 | (g) | | | | | (0.72 | )(g) | | | | | (0.96 | )(g) | | | | | (1.39 | )(g) | | | | | 96 | |
| | | 10.79 | | | | | | 12.02 | | | | | | 32 | | | | | | 9.59 | (g) | | | | | 10.13 | (g) | | | | | 1.75 | (g) | | | | | 2.29 | (g) | | | | | (0.86 | )(g) | | | | | (1.09 | )(g) | | | | | (1.71 | )(g) | | | | | 96 | |
| | |
| The accompanying notes are an integral part of these financial statements. | | 17 |
GOLDMAN SACHS MLP ENERGY INFRASTRUCTURE FUND
Notes to Financial Statements
November 30, 2015
Goldman Sachs Trust (the “Trust”) is a Delaware statutory trust registered under the Investment Company Act of 1940, as amended (the “Act”), as an open-end management investment company. The Trust includes the Goldman Sachs MLP Energy Infrastructure Fund (the “Fund”). The Fund is a non-diversified portfolio under the Act offering five classes of shares — Class A, Class C, Class IR, Class R and Institutional Shares. Class A Shares are sold with a front-end sales charge of up to 5.50%. Class C Shares are sold with contingent deferred sales charge (“CDSC”) of 1.00%, which is imposed on redemptions made within 12 months of purchase. Institutional, Class IR and Class R are not subject to a sales charge.
Goldman Sachs Asset Management, L.P. (“GSAM”), an affiliate of Goldman, Sachs & Co. (“Goldman Sachs”), serves as investment adviser to the Fund pursuant to a management agreement (“Agreement”) with the Trust.
|
| 2. SIGNIFICANT ACCOUNTING POLICIES |
The financial statements have been prepared in accordance with accounting principles generally accepted in the United States of America (“GAAP”) and require management to make estimates and assumptions that may affect the reported amounts and disclosures. Actual results may differ from those estimates and assumptions.
A. Investment Valuation — The Fund’s valuation policy is to value investments at fair value.
B. Investment Income and Investments — Investment income includes interest income and dividend income, net of any foreign withholding taxes, less any amounts reclaimable. Interest income is accrued daily and adjusted for amortization of premiums and accretion of discounts. Dividend income is recognized on ex-dividend date or, for certain foreign securities, as soon as such information is obtained subsequent to the ex-dividend date. Investment transactions are reflected on trade date. Realized gains and losses are calculated using identified cost. In prior reporting periods, realized gains and losses were calculated using the average cost method for partnership investments and the First In First Out Method for all other investments. As a result of the change in this policy, certain reclassifications related to prior periods were recorded in the current reporting period. Investment transactions are recorded on the following business day for daily net asset value (“NAV”) calculations. Distributions from master limited partnerships (“MLPs”) are generally recorded based on the characterization reported on the Fund’s schedule K-1 received from the MLPs. The Fund records its pro-rata share of the income/loss and capital gains/losses, allocated from the underlying partnerships and adjusts the cost basis of the underlying partnerships accordingly.
C. Class Allocations and Expenses — Investment income, realized and unrealized gain (loss), and non-class specific expenses of the Fund are allocated daily based upon the proportion of net assets of each class. Non-class specific expenses directly incurred by the Fund are charged to the Fund, while such expenses incurred by the Trust are allocated across the respective Funds on a straight-line and/or pro-rata basis depending upon the nature of the expenses. Class specific expenses, where applicable, are borne by the respective share classes and include Distribution and Service, Transfer Agency and Service and Shareholder Administration fees.
18
GOLDMAN SACHS MLP ENERGY INFRASTRUCTURE FUND
|
| 2. SIGNIFICANT ACCOUNTING POLICIES (continued) |
D. Distributions to Shareholders — Over the long term, the Fund makes distributions to its shareholders each fiscal quarter at a rate that is approximately equal to the distributions the Fund receives from the MLPs and other securities in which it invests. To permit the Fund to maintain more stable quarterly distributions, the distribution for any particular quarterly period may be more or less than the amount of total investment income actually earned by the Fund. The Fund estimates that only a portion of the distributions paid to shareholders will be treated as income. The remaining portion of the Fund’s distribution, which may be significant, is expected to be a return of capital. These estimates are based on the Fund’s operating results during the period, and their final federal income tax characterization may differ.
The characterization of distributions to shareholders for financial reporting purposes is determined in accordance with federal income tax rules, which may differ from GAAP. Certain components of the Fund’s net assets on the Statement of Assets and Liabilities reflect permanent GAAP/Tax differences based on the appropriate tax character.
E. Income Taxes — The Fund does not intend to qualify as a regulated investment company pursuant to Subchapter M of the Internal Revenue Code of 1986, as amended, but will rather be taxed as a corporation. As a result, the Fund is obligated to pay federal, state and local income tax on its taxable income. The Fund invests primarily in MLPs, which generally are treated as partnerships for federal income tax purposes. As a limited partner in the MLPs, the Fund must report its allocable share of the MLPs’ taxable income or loss in computing its own taxable income or loss. The Fund’s tax expense or benefit is included in the Statement of Operations based on the component of income or gains/losses to which such expense or benefit relates. Deferred income taxes reflect the net tax effects of temporary differences between the carrying amounts of assets and liabilities for financial reporting purposes and the amounts used for income tax purposes. Such temporary differences are principally: (i) taxes on unrealized gains/losses, which are attributable to the temporary difference between fair market value and tax basis, (ii) the net tax effects of temporary differences between the carrying amounts of assets and liabilities for financial reporting and income tax purposes, and (iii) the net tax benefit of accumulated net operating losses and capital loss carryforwards. The Fund will accrue a deferred income tax liability balance, at the currently effective statutory United States (“U.S.”) federal income tax rate (currently 35%) plus an estimated state and local income tax rate, for its future tax liability associated with the capital appreciation of its investments and the distributions received by the Fund on interests of MLPs considered to be return of capital and for any net operating gains. The Fund may also record a deferred tax asset balance, which reflects an estimate of the Fund’s future tax benefit associated with net operating losses and/or unrealized losses.
To the extent the Fund has a deferred tax asset, consideration is given to whether or not a valuation allowance, which would offset the value of some or all of the deferred tax asset balance, is required. A valuation allowance is required if based on the evaluation criterion provided by Accounting Standards Codification (“ASC”) 740, Income Taxes (ASC 740) it is more likely than not that some portion, or all, of the deferred tax asset will not be realized. The factors considered in assessing the Fund’s valuation allowance include: the nature, frequency and severity of current and cumulative losses, the duration of the statutory carryforward periods and the associated risks that operating and capital loss carryforwards may expire unutilized. From time to time, as new information becomes available, the Fund will modify its estimates or assumptions regarding the deferred tax liability or asset.
19
GOLDMAN SACHS MLP ENERGY INFRASTRUCTURE FUND
Notes to Financial Statements (continued)
November 30, 2015
|
| 2. SIGNIFICANT ACCOUNTING POLICIES (continued) |
Unexpected significant decreases in cash distributions from the Fund’s MLP investments or significant declines in the fair value of its investments may change the Fund’s assessment regarding the recoverability of their deferred tax assets and may result in a valuation allowance. If a valuation allowance is required to reduce any deferred tax asset in the future, it could have a material impact on the Fund’s NAV and results of operations in the period it is recorded. The Fund will rely to some extent on information provided by MLPs, which may not be provided to the Fund on a timely basis, to estimate operating income/loss and gains/losses and current taxes and deferred tax liabilities and/or asset balances for purposes of daily reporting of NAVs and financial statement reporting.
It is the Fund’s policy to classify interest and penalties associated with underpayment of federal and state income taxes, if any, as income tax expense on its Statement of Operations. The Fund anticipates filing income tax returns in the U.S. federal jurisdiction and various states, and such returns are subject to examination by the tax jurisdictions. The Fund has reviewed all major jurisdictions and concluded that there is no significant impact on its net assets and no tax liability resulting from unrecognized tax benefits or expenses relating to uncertain tax positions expected to be taken on its tax returns.
Return of Capital Estimates — Distributions received from the Fund’s investments in MLPs generally are comprised of income and return of capital. The Fund records investment income and return of capital based on estimates made at the time such distributions are received. Such estimates are based on historical information available from each MLP and other industry sources. These estimates may subsequently be revised based on information received from MLPs after their tax reporting periods are concluded.
F. Foreign Currency Translation — The accounting records and reporting currency of the Fund is maintained in U.S. dollars. Assets and liabilities denominated in foreign currencies are translated into U.S. dollars using the current exchange rates at the close of each business day. The effect of changes in foreign currency exchange rates on investments is included within net realized and unrealized gain (loss) on investments. Changes in the value of other assets and liabilities as a result of fluctuations in foreign exchange rates are included in the Statement of Operations within net change in unrealized gain (loss) on foreign currency translations. Transactions denominated in foreign currencies are translated into U.S. dollars on the date the transaction occurred, the effects of which are included within net realized gain (loss) on foreign currency transactions.
|
| 3. INVESTMENTS AND FAIR VALUE MEASUREMENTS |
The fair value of a financial instrument is the amount that would be received to sell an asset or paid to transfer a liability in an orderly transaction between market participants at the measurement date (i.e., the exit price). GAAP establishes a fair value hierarchy that prioritizes the inputs to valuation techniques used to measure fair value. The hierarchy gives the highest priority to unadjusted quoted prices in active markets for identical assets or liabilities (Level 1 measurements) and the lowest priority to
20
GOLDMAN SACHS MLP ENERGY INFRASTRUCTURE FUND
|
| 3. INVESTMENTS AND FAIR VALUE MEASUREMENTS (continued) |
unobservable inputs (Level 3 measurements). The levels used for classifying investments are not necessarily an indication of the risk associated with investing in these investments. The three levels of the fair value hierarchy are described below:
Level 1 — Unadjusted quoted prices in active markets that are accessible at the measurement date for identical, unrestricted assets or liabilities;
Level 2 — Quoted prices in markets that are not active or financial instruments for which significant inputs are observable (including, but not limited to, quoted prices for similar investments, interest rates, foreign exchange rates, volatility and credit spreads), either directly or indirectly;
Level 3 — Prices or valuations that require significant unobservable inputs (including GSAM’s assumptions in determining fair value measurement).
Changes in valuation techniques may result in transfers into or out of an assigned level within the hierarchy. In accordance with the Fund’s policy, transfers between different levels of the fair value hierarchy resulting from such changes are deemed to have occurred as of the beginning of the reporting period.
The Board of Trustees (“Trustees”) has approved Valuation Procedures that govern the valuation of the portfolio investments held by the Fund, including investments for which market quotations are not readily available. The Trustees have delegated to GSAM day-to-day responsibility for implementing and maintaining internal controls and procedures related to the valuation of the Fund’s portfolio investments. To assess the continuing appropriateness of pricing sources and methodologies, GSAM regularly performs price verification procedures and issues challenges as necessary to third party pricing vendors or brokers, and any differences are reviewed in accordance with the Valuation Procedures.
A. Level 1 and Level 2 Fair Value Investments — The valuation techniques and significant inputs used in determining the fair values for investments classified as Level 1 and Level 2 are as follows:
Equity Securities — Equity securities and investment companies traded on a U.S. securities exchange or the NASDAQ system, or those located on certain foreign exchanges, including but not limited to the Americas, are valued daily at their last sale price or official closing price on the principal exchange or system on which they are traded. If there is no sale or official closing price or such price is believed by the investment adviser to not represent fair value, equity securities and exchange traded investment companies are valued at the last bid price for long positions and at the last ask price for short positions. Investments in investment companies (other than those that are exchange traded) are valued at the NAV on the valuation date. To the extent these investments are actively traded, they are classified as Level 1 of the fair value hierarchy, otherwise they are generally classified as Level 2.
Unlisted equity securities for which market quotations are available are valued at the last sale price on the valuation date, or if no sale occurs, at the last bid price.
Subordinated Units and Private Investments — Subordinated units and private investments in public equities (“PIPEs”) are valued the same as other equity securities as noted above. A Liquidity Value Adjustment (LVA) may be applied to securities which are subject to transfer restrictions or which convert publicly traded securities in the future when certain conditions are met. Subordinated units and PIPEs are classified as Level 2 until such time as the transfer restriction is removed.
21
GOLDMAN SACHS MLP ENERGY INFRASTRUCTURE FUND
Notes to Financial Statements (continued)
November 30, 2015
|
| 3. INVESTMENTS AND FAIR VALUE MEASUREMENTS (continued) |
Money Market Funds — Investments in the Goldman Sachs Financial Square Government Fund (“Underlying Fund”) are valued at the NAV of the FST Share class on the day of valuation. These investments are generally classified as Level 1 of the fair value hierarchy.
B. Level 3 Fair Value Investments — To the extent that significant inputs to valuation models and other alternative pricing sources are unobservable, or if quotations are not readily available, or if GSAM believes that such quotations do not accurately reflect fair value, the fair value of the Fund’s investments may be determined under Valuation Procedures approved by the Trustees. GSAM, consistent with its procedures and applicable regulatory guidance, may make an adjustment to the most recent valuation prices of either domestic or foreign securities in light of significant events to reflect what it believes to be the fair value of the securities at the time of determining a Fund’s NAV. Significant events which could affect a large number of securities in a particular market may include, but are not limited to: significant fluctuations in U.S. or foreign markets; market dislocations; market disruptions; or unscheduled market closings. Significant events which could also affect a single issuer may include, but are not limited to: corporate actions such as reorganizations, mergers and buy-outs; ratings downgrades; and bankruptcies.
Fair Value Hierarchy — The following is a summary of the Fund’s investments classified in the fair value hierarchy as of November 30, 2015:
| | | | | | | | | | | | |
| | | |
| Investment Type | | Level 1 | | | Level 2 | | | Level 3 | |
| Assets | | | | | | | | | | | | |
Common Stocks(a) | | | | | | | | | | | | |
North America | | $ | 1,651,372,985 | | | $ | 62,230,599 | | | $ | — | |
Investment Company | | | 106,636,227 | | | | — | | | | — | |
| Total | | $ | 1,758,009,212 | | | $ | 62,230,599 | | | $ | — | |
| (a) | | Amounts are disclosed by continent to highlight the impact of time zone differences between local market close and the calculation of NAV. Security valuations are based on the principal exchange or system on which they are traded, which may differ from country of domicile. |
For further information regarding security characteristics, see the Schedule of Investments.
22
GOLDMAN SACHS MLP ENERGY INFRASTRUCTURE FUND
Currently, the highest marginal federal income tax rate for a corporation is 35%. The Fund may also be subject to a 20% alternative minimum tax to the extent that its alternative minimum tax exceeds its regular federal income tax. Total income taxes are computed by applying the federal statutory rate plus a blended state income tax rate. State taxes are estimated at a blended rate of 2.01%, net of federal tax benefit. The reconciliation between the federal statutory income tax rate of 35% and the effective tax rate on net investment income/loss and realized and unrealized gain/loss is as follows:
| | | | |
Application of statutory income tax rate | | $ | (320,024,602 | ) |
State income taxes, net of federal benefit | | $ | (18,378,556 | ) |
Effect of permanent differences | | $ | (2,642,892 | ) |
Other Adjustments | | $ | 472,675 | |
Valuation Allowance | | $ | 299,925,832 | |
| Total current and deferred income tax expense/(benefit), net | | $ | (40,647,543 | ) |
At November 30, 2015, components of the Fund’s deferred tax assets and liabilities are as follows:
| | | | |
| Deferred tax assets: | | | | |
Net unrealized losses on investment securities (tax basis) | | $ | 143,071,612 | |
Net operating loss carryforward — Expiration — November 30, 2035 | | | 16,199,869 | |
Capital loss carryforward (tax basis) — Expiration — November 30, 2020 | | | 142,474,092 | |
Other tax assets | | | 1,029,460 | |
Valuation Allowance | | $ | (299,925,832 | ) |
Total Deferred Tax Assets | | $ | 2,849,201 | |
| Deferred tax liabilities: | | | | |
Income Recognized from MLP Investments | | $ | (2,849,201 | ) |
The Fund reviews the recoverability of its deferred tax assets based upon the weight of the available evidence. When assessing, the Fund’s management considers available carrybacks, reversing temporary taxable differences, and tax planning, if any. As a result of its analysis of the recoverability of its deferred tax assets, the Fund recorded $299,925,832 of valuation allowances as of November 30, 2015.
At November 30, 2015, components of the Fund’s current and deferred tax benefit are as follows:
| | | | | | | | | | | | |
| | | Current | | | Deferred | | | Total | |
Federal | | $ | (5,541,773 | ) | | $ | (316,590,529 | ) | | $ | (322,132,302 | ) |
State | | $ | (318,256 | ) | | $ | (18,122,817 | ) | | $ | (18,441,073 | ) |
Valuation Allowance | | | — | | | $ | 299,925,832 | | | $ | 299,925,832 | |
| Total | | $ | (5,860,029 | ) | | $ | (34,787,514 | ) | | $ | (40,647,543 | ) |
For the fiscal year ended November 30, 2015, the Fund does not have any interest or penalties associated with the underpayment of any income taxes.
23
GOLDMAN SACHS MLP ENERGY INFRASTRUCTURE FUND
Notes to Financial Statements (continued)
November 30, 2015
At November 30, 2015, gross unrealized appreciation and depreciation of investments, based on cost for federal income tax purposes was as follows:
| | | | |
Tax Cost | | $ | 2,199,116,901 | |
Gross unrealized gain | | $ | 12,290,148 | |
Gross unrealized loss | | $ | (391,167,238 | ) |
Net unrealized gain (loss) | | $ | (378,877,090 | ) |
Any difference between cost amounts for financial statement and federal income tax purposes is due primarily to timing differences related to the tax treatment of partnership investments. For the fiscal year ended November 30, 2015, GSAM estimates that 100% of the MLP distributions received will be treated as a return of capital.
For the fiscal year ended November 30, 2015, the Fund’s distributions are estimated to be comprised of 100% return of capital. Shareholders will be informed of the final tax characterization of the distributions in February 2016. The Fund’s first two years are open for examination by U.S. and state tax authorities. Management of the Fund is not aware of any tax positions for which it is reasonably possible that the total amounts of unrecognized tax benefits or expenses will significantly change in the next 12 months.
|
| 5. AGREEMENTS AND AFFILIATED TRANSACTIONS |
A. Management Agreement — Under the Agreement, GSAM manages the Fund, subject to the general supervision of the Trustees.
As compensation for the services rendered pursuant to the Agreement, the assumption of the expenses related thereto and administration of the Fund’s business affairs, including providing facilities, GSAM is entitled to a management fee, accrued daily and paid monthly, equal to an annual percentage rate of the Fund’s average daily net assets.
For the fiscal year ended November 30, 2015, contractual and effective net management fee with GSAM were at the following rates:
| | | | | | | | | | | | | | | | | | | | | | |
| Contractual Management Rate | |
First
$1 billion | | | Next
$1 billion | | | Next
$3 billion | | | Next
$3 billion | | | Over
$8 billion | | | Effective Net Management Rate^ | |
| | 1.00% | | | | 0.90% | | | | 0.86% | | | | 0.84% | | | | 0.82% | | | | 0.94% | * |
| ^ | | Effective Net Management Rate includes the impact of management fee waivers of affiliated underlying funds, if any. |
| * | | GSAM has agreed to waive a portion of its management fee payable by the Fund in an amount equal to any management fees it earns as an investment adviser to any of the affiliated funds in which the Fund invests. The management fee waiver will remain in effect through at least March 30, 2016. Prior to such date, GSAM may not terminate the arrangement without the approval of the Trustees. |
The Goldman Sachs MLP Energy Infrastructure Fund invests in FST Shares of the Goldman Sachs Financial Square Government Fund, which is an affiliated Underlying Fund. GSAM has agreed to waive a portion of its management fee payable by the Fund in an amount equal to the management fee it earns as an investment adviser to any of the affiliated Underlying Funds in which the Fund invests. For the fiscal year ended November 30, 2015, GSAM waived $89,973 of the Fund’s management fee.
24
GOLDMAN SACHS MLP ENERGY INFRASTRUCTURE FUND
|
| 5. AGREEMENTS AND AFFILIATED TRANSACTIONS (continued) |
B. Distribution and Service Plans — The Trust, on behalf of the Fund, has adopted Distribution and Service Plans (the “Plans”). Under the Plans, Goldman Sachs, which serves as distributor (the “Distributor”), is entitled to a fee accrued daily and paid monthly, for distribution services and personal and account maintenance services, which may then be paid by Goldman Sachs to authorized dealers, at the following annual rates calculated on the Fund’s average daily net assets of each respective share class:
| | | | | | | | | | | | |
| | | Distribution and Service Plan Rates | |
| | | Class A* | | | Class C | | | Class R* | |
Distribution Plan | | | 0.25 | % | | | 0.75 | % | | | 0.50 | % |
Service Plan | | | — | | | | 0.25 | | | | — | |
| * | | With respect to Class A and Class R Shares, the Distributor at its discretion may use compensation for distribution services paid under the Distribution Plan to compensate service organizations for personal and account maintenance services and expenses as long as such total compensation does not exceed the maximum cap on “service fees” imposed by the Financial Industry Regulatory Authority. |
C. Distribution Agreement — Goldman Sachs, as Distributor of the shares of the Fund pursuant to a Distribution Agreement, may retain a portion of the Class A Shares’ front end sales charge and Class C Shares’ CDSC. During the fiscal year ended November 30, 2015, Goldman Sachs advised that it retained $189,973 and $303, respectively.
D. Transfer Agency Agreement — Goldman Sachs also serves as the transfer agent of the Fund for a fee pursuant to the Transfer Agency Agreement. The fees charged for such transfer agency services are accrued daily and paid monthly at annual rates as follows: 0.19% of the average daily net assets of Class A, Class C, Class IR and Class R Shares; and 0.04% of the average daily net assets of Institutional Shares.
E. Other Expense Agreements and Affiliated Transactions — GSAM has agreed to limit certain “Other Expenses” of the Fund (excluding acquired fund fees and expenses, transfer agency fees and expenses, service fees and shareholder administration fees (as applicable), taxes, interest, brokerage fees, shareholder meetings, litigation, indemnification and extraordinary expenses) to the extent such expenses exceed, on an annual basis, a percentage rate of the average daily net assets of the Fund. Such Other Expense reimbursements, if any, are accrued daily and paid monthly. In addition, the Fund is not obligated to reimburse GSAM for prior fiscal year expense reimbursements, if any. The Other Expense limitations as an annual percentage rate of average daily net assets for the Fund is 0.064%. These Other Expense limitations will remain in place through at least March 30, 2016, and prior to such date GSAM may not terminate the arrangements without the approval of the Trustees. In addition, the Fund has entered into certain offset arrangements with the transfer agent, which may result in a reduction of the Fund’s expenses and are received irrespective of the application of the “Other Expense” limitations described above. Such Other Expense reimbursements, if any, are accrued daily and paid monthly and are disclosed in the Statement of Operations for the fiscal year ended November 30, 2015.
F. Other Transactions with Affiliates — For the fiscal year ended November 30, 2015, Goldman Sachs did not earn any brokerage commissions from portfolio transactions on behalf of the Fund.
25
GOLDMAN SACHS MLP ENERGY INFRASTRUCTURE FUND
Notes to Financial Statements (continued)
November 30, 2015
|
| 5. AGREEMENTS AND AFFILIATED TRANSACTIONS (continued) |
An investment by the Fund representing greater than 5% of the voting securities of an issuer makes that issuer an affiliated person (as defined by the Act) of such Fund. The following table provides information about the investment in shares of issuers of which the Fund is an affiliate for the fiscal year ended November 30, 2015:
| | | | | | | | | | | | | | | | | | | | | | | | | | |
| Name of Affiliated Issuer | | Market Value
11/30/14 | | Purchases
at Cost | | | Proceeds
from Sales | | | Net
Realized
Gain (Loss) | | | Net Change in
Unrealized
Gain (Loss) | | | Market Value
11/30/15 | | | Dividend
Income | |
Tallgrass Energy GP LP | | $— | | $ | 83,309,477 | | | $ | (1,000,035 | ) | | $ | (231,943 | ) | | $ | (17,915,913 | ) | | $ | 64,161,586 | | | $ | 517,160 | |
The table below shows the transactions in and earnings from investments in this affiliated Fund for the fiscal year ended November 30, 2015:
| | | | | | | | | | | | | | | | | | |
| Underlying Fund | | Market Value 11/30/14 | | Purchases at Cost | | | Proceeds from Sales | | | Market Value 11/30/15 | | | Dividend Income | |
Goldman Sachs Financial Square Government Fund | | $121,214,808 | | | 979,714,598 | | | $ | (994,293,179 | ) | | $ | 106,636,227 | | | $ | 8,231 | |
G. Line of Credit Facility — As of November 30, 2015, the Fund participated in a $1,205,000,000 committed, unsecured revolving line of credit facility (the “facility”) together with other funds of the Trust and registered investment companies having management agreements with GSAM or its affiliates (“Other Borrowers”). Pursuant to the terms of the facility, the Fund and Other Borrowers could increase the credit amount by up to an additional $115,000,000, for a total of up to $1,320,000,000. This facility is to be used for temporary emergency purposes, or to allow for an orderly liquidation of securities to meet redemption requests. The interest rate on borrowings is based on the federal funds rate. The facility also requires a fee to be paid by the Fund based on the amount of the commitment that has not been utilized. For the fiscal year ended November 30, 2015, the Fund did not have any borrowings under the facility.
|
| 6. PORTFOLIO SECURITIES TRANSACTIONS |
The cost of purchases and proceeds from sales and maturities of long-term securities for the fiscal year ended November 30, 2015, were $2,349,509,228 and $2,090,214,823, respectively.
The Fund’s risks include, but are not limited to, the following:
Foreign Custody Risk — A Fund that invests in foreign securities may hold such securities and cash with foreign banks, agents, and securities depositories appointed by the Fund’s custodian (each a “Foreign Custodian”). Some foreign custodians may be recently organized or new to the foreign custody business. In some countries, Foreign Custodians may be subject to little or no regulatory oversight over, or independent evaluation of, their operations. Further, the laws of certain countries may place limitations on a Fund’s ability to recover its assets if a Foreign Custodian enters into bankruptcy. Investments in emerging markets may be subject to even greater custody risks than investments in more developed markets. Custody services in emerging market countries are very often undeveloped and may be considerably less well regulated than in more developed countries, and thus may not afford the same level of investor protection as would apply in developed countries.
26
GOLDMAN SACHS MLP ENERGY INFRASTRUCTURE FUND
|
| 7. OTHER RISKS (continued) |
Investments in Other Investment Companies — As a shareholder of another investment company, a Fund will indirectly bear its proportionate share of any net management fees and other expenses paid by such other investment companies, in addition to the fees and expenses regularly borne by the Fund.
Large Shareholder Transactions Risk — The Fund may experience adverse effects when certain large shareholders, such as other funds, institutional investors (including those trading by use of non-discretionary mathematical formulas), financial intermediaries (who may make investment decisions on behalf of underlying clients and/or include the Fund in their investment model), individuals, accounts and Goldman Sachs affiliates, purchase or redeem large amounts of shares of the Fund. Such large shareholder redemptions may cause the Fund to sell portfolio securities at times when it would not otherwise do so, which may negatively impact the Fund’s NAV and liquidity. These transactions may also accelerate the realization of taxable income to shareholders if such sales of investments resulted in gains, and may also increase transaction costs. In addition, a large redemption could result in the Fund’s current expenses being allocated over a smaller asset base, leading to an increase in the Fund’s expense ratio. Similarly, large Fund share purchases may adversely affect a Fund’s performance to the extent that a Fund is delayed in investing new cash and is required to maintain a larger cash position than it ordinarily would.
Liquidity Risk — The Fund may make investments that are illiquid or that may become less liquid in response to market developments or adverse investor perceptions. Illiquid investments may be more difficult to value. Liquidity risk may also refer to the risk that the Fund will not be able to pay redemption proceeds within the allowable time period because of unusual market conditions, an unusually high volume of redemption requests, or other reasons. To meet redemption requests, the Fund may be forced to sell investments at an unfavorable time and/or under unfavorable conditions.
Market and Credit Risks — In the normal course of business, the Fund trades financial instruments and enters into financial transactions where risk of potential loss exists due to changes in the market (market risk). Additionally, the Fund may also be exposed to credit risk in the event that an issuer or guarantor fails to perform or that an institution or entity with which the Fund has unsettled or open transactions defaults.
Investing in foreign markets may involve special risks and considerations not typically associated with investing in the U.S. Foreign securities may be subject to risk of loss because of more or less foreign government regulation, less public information and less economic, political and social stability in the countries in which the Fund invests. Loss may also result from the imposition of exchange controls, confiscations and other government restrictions by the United States or other governments, or from problems in registration, settlement or custody. Foreign risk also involves the risk of negative foreign currency rate fluctuations, which may cause the value of securities denominated in such foreign currency (or other instruments through which the Fund has exposure to foreign currencies) to decline in value. Currency exchange rates may fluctuate significantly over short periods of time. To the extent that the Fund also invests in securities of issuers located in emerging markets, these risks may be more pronounced.
Master Limited Partnership Risk — Investments in securities of MLPs involve risks that differ from investments in common stocks, including risks related to limited control and limited rights to vote on matters affecting the MLP, risks related to potential conflicts of interest between the MLP and the MLP’s general partner, cash flow risks, dilution risks, limited liquidity and risks related to the general partner’s right to require unit-holders to sell their common units at an undesirable time or price.
27
GOLDMAN SACHS MLP ENERGY INFRASTRUCTURE FUND
Notes to Financial Statements (continued)
November 30, 2015
|
| 7. OTHER RISKS (continued) |
Non-Diversification Risk — The Fund is non-diversified, meaning that it is permitted to invest a larger percentage of its assets in fewer issuers than diversified mutual funds. Thus, the Fund may be more susceptible to adverse developments affecting any single issuer held in its portfolio, and may be more susceptible to greater losses because of these developments.
Private Investment Risk — The Fund may invest in PIPE securities. PIPE transactions typically involve the purchase of securities directly from a publicly traded company or its affiliates in a private placement transaction, typically at a discount to the market price of the company’s common stock. In a PIPE transaction, the Fund may bear the price risk from the time of pricing until the time of closing. Equity issued in this manner is often subject to transfer restrictions and is therefore less liquid than equity issued through a registered public offering. The Fund may be subject to lock-up agreements that prohibit transfers for a fixed period of time. In addition, because the sale of the securities in a PIPE transaction is not registered under the Securities Act, the securities are “restricted” and cannot be immediately resold into the public markets. The ability of the Fund to freely transfer restricted shares is conditioned upon, among other things, the SEC’s preparedness to declare the resale registration statement effective and the issuer’s right to suspend the Fund’s use of the resale registration statement if the issuer is pursuing a transaction or some other material non-public event is occurring. Accordingly, PIPE securities may be subject to risks associated with illiquid securities.
Portfolio Concentration Risk — The Fund concentrates its investments in the energy sector, and will therefore be susceptible to adverse economic, environmental, business, regulatory or other occurrences affecting that sector. The energy sector has historically experienced substantial price volatility. MLPs and other companies operating in the energy sector are subject to specific risks, including, among others, fluctuations in commodity prices; reduced consumer demand for commodities such as oil, natural gas or petroleum products; reduced availability of natural gas or other commodities for transporting, processing, storing or delivering; slowdowns in new construction; extreme weather or other natural disasters; and threats of attack by terrorists on energy assets. Additionally, changes in the regulatory environment for energy companies may adversely impact their profitability. Over time, depletion of natural gas reserves and other energy reserves may also affect the profitability of energy companies.
Strategy Risk — The Fund’s strategy of investing primarily in MLPs, resulting in its being taxed as a corporation, or a “C” corporation, rather than as a regulated investment company for U.S. federal income tax purposes, is a relatively new investment strategy for funds. This strategy involves complicated accounting, tax and valuation issues. Volatility in the NAV may be experienced because of the use of estimates at various times during a given year that may result in unexpected and potentially significant consequences for the Fund and its shareholders.
Tax Risks — Tax risks associated with investments in the Fund include but are not limited to the following:
Fund Structure Risk. Unlike traditional mutual funds that are structured as regulated investment companies for U.S. federal income tax purposes, the Fund will be taxable as a regular corporation, or “C” corporation, for U.S. federal income tax purposes. This means the Fund generally will be subject to U.S. federal income tax on its taxable income at the rates applicable to corporations (currently a maximum rate of 35%), and will also be subject to state and local income taxes.
MLP Tax Risk. MLPs are generally treated as partnerships for U.S. federal income tax purposes. Partnerships do not pay U.S. federal income tax at the partnership level. Rather, each partner is allocated a share of the partnership’s income, gains, losses, deductions and expenses. A change in current tax law or a change in the underlying business mix of a given MLP could result in an MLP being treated as a corporation for U.S. federal income tax purposes, which would result in the MLP being required to pay U.S. federal income tax (as well as state and local income taxes) on its taxable income. This would have the effect of reducing the amount of cash available for distribution by the MLP and could result in a reduction in the value of the Fund’s investment in the MLP and lower income to the Fund.
28
GOLDMAN SACHS MLP ENERGY INFRASTRUCTURE FUND
|
| 7. OTHER RISKS (continued) |
To the extent a distribution received by the Fund from an MLP is treated as a return of capital, the Fund’s adjusted tax basis in the interests of the MLP will be reduced, which may increase the Fund’s tax liability upon the sale of the interests in the MLP or upon subsequent distributions in respect of such interests.
Tax Estimation/NAV Risk. In calculating the Fund’s daily NAV, the Fund will, among other things, include its current taxes and deferred tax liability and/or asset balances and related valuation balances, if any. The Fund may accrue a deferred income tax liability balance, at the currently effective statutory U.S. federal income tax rate (currently 35%) plus an estimated state and local income tax rate, for its future tax liability associated with the capital appreciation of its investments and the distributions received by the Fund on interests of MLPs considered to be return of capital and for any net operating gains. Any deferred tax liability balance will reduce the Fund’s NAV which could have an effect on the market price of the shares. The Fund may also record a deferred tax asset balance, which reflects an estimate of the Fund’s future tax benefit associated with net operating losses and/or unrealized losses. Any deferred tax asset balance will increase the Fund’s NAV to the extent it exceeds any valuation allowance which could have an effect on the market price of the shares. The Fund will rely to some extent on information provided by MLPs, which may not be provided to the Fund on a timely basis, to estimate current taxes and deferred tax liability and/or asset balances for purposes of financial statement reporting and determining its NAV to the extent it exceeds any valuation allowance. The daily estimate of the Fund’s current taxes and deferred tax liability and/or asset balances used to calculate the Fund’s NAV could vary significantly from the Fund’s actual tax liability or benefit, and, as a result, the determination of the Fund’s actual tax liability or benefit may have a material impact on the Fund’s NAV. From time to time, the Fund may modify its estimates or assumptions regarding its current taxes and deferred tax liability and/or asset balances as new information becomes available, which modifications in estimates or assumptions may have a material impact on the Fund’s NAV.
Under the Trust’s organizational documents, its Trustees, officers, employees and agents are indemnified, to the extent permitted by the Act and state law, against certain liabilities that may arise out of performance of their duties to the Fund. Additionally, in the course of business, the Fund enters into contracts that contain a variety of indemnification clauses. The Fund’s maximum exposure under these arrangements is unknown, as this would involve future claims that may be made against the Fund that have not yet occurred. However, GSAM believes the risk of loss under these arrangements to be remote.
Subsequent events after the Statement of Assets and Liabilities date have been evaluated through the date the financial statements were issued. GSAM has concluded that there is no impact requiring adjustment or disclosure in the financial statements.
29
GOLDMAN SACHS MLP ENERGY INFRASTRUCTURE FUND
Notes to Financial Statements (continued)
November 30, 2015
|
| 10. SUMMARY OF SHARE TRANSACTIONS |
Share activity is as follows:
| | | | | | | | | | | | | | | | |
| | | MLP Energy Infrastructure Fund | |
| | | | |
| | | For the Fiscal Year Ended November 30, 2015 | | | For the Fiscal Year Ended November 30, 2014 | |
| | | | |
| | | Shares | | | Dollars | | | Shares | | | Dollars | |
| | | | |
| Class A Shares | | | | | | | | | | | | | | | | |
Shares sold | | | 21,852,674 | | | $ | 221,424,946 | | | | 51,624,941 | | | $ | 632,407,858 | |
Reinvestment of distributions | | | 1,975,071 | | | | 20,364,761 | | | | 1,138,092 | | | | 13,885,854 | |
Shares redeemed | | | (28,289,890 | ) | | | (279,867,299 | ) | | | (14,620,671 | ) | | | (183,610,381 | ) |
| | | | (4,462,145 | ) | | | (38,077,592 | ) | | | 38,142,362 | | | | 462,683,331 | |
| Class C Shares | | | | | | | | | | | | | | | | |
Shares sold | | | 9,245,421 | | | | 94,117,514 | | | | 19,314,978 | | | | 236,914,029 | |
Reinvestment of distributions | | | 1,120,758 | | | | 11,284,406 | | | | 454,569 | | | | 5,496,812 | |
Shares redeemed | | | (7,562,485 | ) | | | (72,504,770 | ) | | | (1,197,380 | ) | | | (14,349,140 | ) |
| | | | 2,803,694 | | | | 32,897,150 | | | | 18,572,167 | | | | 228,061,701 | |
| Institutional Shares | | | | | | | | | | | | | | | | |
Shares sold | | | 129,931,606 | | | | 1,277,979,940 | | | | 135,026,025 | | | | 1,662,053,148 | |
Reinvestment of distributions | | | 6,749,132 | | | | 69,390,874 | | | | 3,353,487 | | | | 41,101,075 | |
Shares redeemed | | | (111,435,341 | ) | | | (1,094,922,646 | ) | | | (23,702,743 | ) | | | (297,365,208 | ) |
| | | | 25,245,397 | | | | 252,448,168 | | | | 114,676,769 | | | | 1,405,789,015 | |
| Class IR Shares | | | | | | | | | | | | | | | | |
Shares sold | | | 9,610,332 | | | | 95,366,087 | | | | 15,383,813 | | | | 190,708,488 | |
Reinvestment of distributions | | | 621,388 | | | | 6,423,648 | | | | 326,552 | | | | 4,005,949 | |
Shares redeemed | | | (12,616,247 | ) | | | (127,681,071 | ) | | | (1,969,365 | ) | | | (24,769,836 | ) |
| | | | (2,384,527 | ) | | | (25,891,336 | ) | | | 13,741,000 | | | | 169,944,601 | |
| Class R Shares | | | | | | | | | | | | | | | | |
Shares sold | | | 194,341 | | | | 1,580,618 | | | | 6,520 | | | | 81,408 | |
Reinvestment of distributions | | | 2,943 | | | | 26,341 | | | | 201 | | | | 2,436 | |
Shares redeemed | | | (23,266 | ) | | | (190,802 | ) | | | (1,709 | ) | | | (22,445 | ) |
| | | | 174,018 | | | | 1,416,157 | | | | 5,012 | | | | 61,399 | |
NET INCREASE | | | 21,376,437 | | | $ | 222,792,547 | | | | 185,137,310 | | | $ | 2,266,540,047 | |
30
Report of Independent Registered Public
Accounting Firm
To the Board of Trustees of Goldman Sachs Trust and the Shareholders of
Goldman Sachs MLP Energy Infrastructure Fund:
In our opinion, the accompanying statement of assets and liabilities, including the schedule of investments, and the related statements of operations and of changes in net assets and the financial highlights present fairly, in all material respects, the financial position of Goldman Sachs MLP Energy Infrastructure Fund, (the “Fund”), a fund of the Goldman Sachs Trust, at November 30, 2015, and the results of its operations, the changes in its net assets and the financial highlights for each of the periods indicated, in conformity with accounting principles generally accepted in the United States of America. These financial statements and financial highlights (hereafter referred to as “financial statements”) are the responsibility of the Fund’s management. Our responsibility is to express an opinion on these financial statements based on our audits. We conducted our audits of these financial statements in accordance with the standards of the Public Company Accounting Oversight Board (United States). Those standards require that we plan and perform the audit to obtain reasonable assurance about whether the financial statements are free of material misstatement. An audit includes examining, on a test basis, evidence supporting the amounts and disclosures in the financial statements, assessing the accounting principles used and significant estimates made by management, and evaluating the overall financial statement presentation. We believe that our audits, which included confirmation of securities at November 30, 2015 by correspondence with the custodian, brokers, transfer agent of the underlying fund and the application of alternative auditing procedures where securities purchased confirmations had not been received, provide a reasonable basis for our opinion.
PricewaterhouseCoopers LLP
Boston, Massachusetts
January 25, 2016
31
GOLDMAN SACHS MLP ENERGY INFRASTRUCTURE FUND
|
Fund Expenses — Six Month Period Ended November 30, 2015 (Unaudited) |
As a shareholder of Class A, Class C, Institutional, Class IR or Class R Shares of the Fund, you incur two types of costs: (1) transaction costs, including sales charges on purchase payments (with respect to Class A Shares), contingent deferred sales charges on redemptions (with respect to Class C Shares), and (2) ongoing costs, including management fees; distribution and service (12b-1) fees (with respect to Class A, Class C and Class R Shares); and other Fund expenses. This Example is intended to help you understand your ongoing costs (in dollars) of investing in Class A, Class C, Institutional, Class IR or Class R Shares of the Fund and to compare these costs with the ongoing costs of investing in other mutual funds.
The Example is based on an investment of $1,000 invested at the beginning of the period and held for the entire period from June 1, 2015 through November 30, 2015 which represents a period of 183 out of 365 days.
Actual Expenses — The first line under each share class in the table below provides information about actual account values and actual expenses. You may use the information in this line, together with the amount you invested, to estimate the expenses that you paid over the period. Simply divide your account value by $1,000 (for example, an $8,600 account value divided by $1,000=8.6), then multiply the result by the number in the first line under the heading entitled “Expenses Paid” to estimate the expenses you paid on your account during this period.
Hypothetical Example for Comparison Purposes — The second line under each share class in the table below provides information about hypothetical account values and hypothetical expenses based on the Fund’s actual net expense ratios and an assumed rate of return of 5% per year before expenses, which is not the Fund’s actual return. The hypothetical account values and expenses may not be used to estimate the actual ending account balance or expenses you paid for the period. You may use this information to compare the ongoing costs of investing in the Fund and other funds. To do so, compare this 5% hypothetical example with the 5% hypothetical examples that appear in the shareholder reports of the other funds.
Please note that the expenses shown in the table are meant to highlight your ongoing costs only and do not reflect any transactional costs, such as sales charges, redemption fees, or exchange fees. Therefore, the second line of the table is useful in comparing ongoing costs only, and will not help you determine the relative total costs of owning different funds. In addition, if these transactional costs were included, your costs would have been higher.
| | | | | | | | | | | | |
| | | MLP Energy Infrastructure Fund | |
| Share Class | | Beginning
Account Value
6/1/15 | | | Ending
Account Value
11/30/15 | | | Expenses Paid for the
6 months ended
11/30/15* | |
| Class A | | | | | | | | | | | | |
Actual | | $ | 1,000.00 | | | $ | 693.00 | | | $ | 6.07 | |
Hypothetical 5% return | | | 1,000.00 | | | | 1,017.90 | + | | | 7.23 | |
| Class C | | | | | | | | | | | | |
Actual | | | 1,000.00 | | | | 689.80 | | | | 9.23 | |
Hypothetical 5% return | | | 1,000.00 | | | | 1,014.14 | + | | | 11.01 | |
| Institutional | | | | | | | | | | | | |
Actual | | | 1,000.00 | | | | 693.30 | | | | 4.37 | |
Hypothetical 5% return | | | 1,000.00 | | | | 1,019.90 | + | | | 5.22 | |
| Class IR | | | | | | | | | | | | |
Actual | | | 1,000.00 | | | | 692.50 | | | | 5.01 | |
Hypothetical 5% return | | | 1,000.00 | | | | 1,019.15 | + | | | 5.97 | |
| Class R | | | | | | | | | | | | |
Actual | | | 1,000.00 | | | | 690.70 | | | | 7.16 | |
Hypothetical 5% return | | | 1,000.00 | | | | 1,016.59 | + | | | 8.54 | |
| | * | | Expenses for each share class are calculated using the Fund’s annualized net expense ratio for each class, which represents the ongoing expenses as a percentage of net assets for the six months ended November 30, 2015. Expenses are calculated by multiplying the annualized net expense ratio by the average account value for the period; then multiplying the result by the number of days in the most recent fiscal half year; and then dividing that result by the number of days in the fiscal year. The Fund’s current and deferred tax benefit was excluded from this example. The annualized net expense ratios for the period were as follows: | |
| | | | | | | | | | |
| Fund | | Class A | | Class C | | Institutional | | Class IR | | Class R |
MLP Energy Infrastructure | | 1.43% | | 2.18% | | 1.03% | | 1.18% | | 1.69% |
| | | | | | | | | | |
| | + | | Hypothetical expenses are based on the Fund’s actual annualized net expense ratios and an assumed rate of return of 5% per year before expenses. | |
32
GOLDMAN SACHS MLP ENERGY INFRASTRUCTURE FUND
Statement Regarding Basis for Approval of Management Agreement (Unaudited)
Background
The Goldman Sachs MLP Energy Infrastructure Fund (the “Fund”) is an investment portfolio of Goldman Sachs Trust (the “Trust”). The Board of Trustees oversees the management of the Trust and reviews the investment performance and expenses of the Fund at regularly scheduled meetings held throughout the year. In addition, the Board of Trustees determines annually whether to approve the continuance of the Trust’s investment management agreement (the “Management Agreement”) with Goldman Sachs Asset Management, L.P. (the “Investment Adviser”) on behalf of the Fund.
The Management Agreement was most recently approved for continuation until June 30, 2016 by the Board of Trustees, including those Trustees who are not parties to the Management Agreement or “interested persons” (as defined in the Investment Company Act of 1940, as amended) of any party thereto (the “Independent Trustees”), at a meeting held on June 10-11, 2015 (the “Annual Meeting”).
The review process undertaken by the Trustees spans the course of the year and culminates with the Annual Meeting. To assist the Trustees in their deliberations, the Trustees have established a Contract Review Committee (the “Committee”), comprised of the Independent Trustees. The Committee held three meetings over the course of the year since the Management Agreement was last approved. At those Committee meetings, regularly scheduled Board or other committee meetings, and/or the Annual Meeting, matters relevant to the renewal of the Management Agreement were considered by the Board, or the Independent Trustees, as applicable. Such matters included:
| | (a) | | the nature and quality of the advisory, administrative, and other services provided to the Fund by the Investment Adviser and its affiliates, including information about: |
| | (i) | | the structure, staff, and capabilities of the Investment Adviser and its portfolio management teams; |
| | (ii) | | the groups within the Investment Adviser and its affiliates that support the portfolio management teams or provide other types of necessary services, including fund services groups (e.g., accounting and financial reporting, tax, shareholder services and operations); controls and risk management groups (e.g., legal, compliance, valuation oversight, credit risk management, internal audit, compliance testing, market risk analysis, finance and strategy and central funding); sales and distribution support groups and others (e.g., information technology and training); |
| | (iii) | | trends in employee headcount; |
| | (iv) | | the Investment Adviser’s financial resources and ability to hire and retain talented personnel and strengthen its operations; and |
| | (v) | | the parent company’s support of the Investment Adviser and its mutual fund business, as expressed by the firm’s senior management; |
| | (b) | | information on the investment performance of the Fund, including comparisons to the performance of similar mutual funds, as provided by a third-party mutual fund data provider engaged as part of the contract review process (the “Outside Data Provider”), and a benchmark performance index, and general investment outlooks in the markets in which the Fund invests; |
| | (c) | | information provided by the Investment Adviser indicating the Investment Adviser’s views on whether the Fund’s peer group and/or benchmark index had high, medium, or low relevance given the Fund’s particular investment strategy; |
| | (d) | | the terms of the Management Agreement and other agreements with affiliated service providers entered into by the Trust on behalf of the Fund; |
| | (e) | | fee and expense information for the Fund, including: |
| | (i) | | the relative management fee and expense levels of the Fund as compared to those of comparable funds managed by other advisers, as provided by the Outside Data Provider; and |
| | (ii) | | the expense trends over time of the Fund; |
| | (f) | | with respect to the extensive investment performance and expense comparison data provided by the Outside Data Provider, its processes in producing that data for the Fund; |
| | (g) | | the undertaking of the Investment Adviser to limit certain expenses of the Fund that exceed a specified level; |
| | (h) | | information relating to the profitability of the Management Agreement and the transfer agency and distribution and service arrangements of the Fund and the Trust as a whole to the Investment Adviser and its affiliates; |
| | (i) | | whether the Fund’s existing management fee schedule adequately addressed any economies of scale; |
| | (j) | | a summary of the “fall-out” benefits derived by the Investment Adviser and its affiliates from their relationships with the Fund, including the fees received by the Investment Adviser’s affiliates from the Fund for transfer agency, portfolio trading, distribution and other services; |
| | (k) | | a summary of potential benefits derived by the Fund as a result of its relationship with the Investment Adviser; |
33
GOLDMAN SACHS MLP ENERGY INFRASTRUCTURE FUND
Statement Regarding Basis for Approval of Management Agreement (Unaudited) (continued)
| | (l) | | information regarding commissions paid by the Fund and broker oversight, an update on the Investment Adviser’s soft dollars practices, other information regarding portfolio trading, and how the Investment Adviser carries out its duty to seek best execution; |
| | (m) | | portfolio manager ownership of Fund shares; the manner in which portfolio manager compensation is determined; and the number and types of accounts managed by the portfolio managers; |
| | (n) | | the nature and quality of the services provided to the Fund by its unaffiliated service providers, and the Investment Adviser’s general oversight and evaluation (including reports on due diligence) of those service providers as part of the administration services provided under the Management Agreement; and |
| | (o) | | the Investment Adviser’s processes and policies addressing various types of potential conflicts of interest; its approach to risk management; the annual review of the effectiveness of the Fund’s compliance program; and periodic compliance reports. |
The Trustees also received an overview of the Fund’s distribution arrangements. They received information regarding the Fund’s assets, share purchase and redemption activity and the payment of Rule 12b-1 distribution and service fees and non-Rule 12b-1 shareholder service and/or administration fees with respect to the Fund. Information was also provided to the Trustees relating to revenue sharing payments made by and services provided by the Investment Adviser and its affiliates to intermediaries that promote the sale, distribution, and/or servicing of Fund shares.
The presentations made at the Board and Committee meetings and at the Annual Meeting encompassed the Fund and other mutual fund portfolios for which the Board of Trustees has responsibility. In evaluating the Management Agreement at the Annual Meeting, the Trustees relied upon their knowledge, resulting from their meetings and other interactions throughout the year, of the Investment Adviser and its affiliates, their services, and the Fund. In conjunction with these meetings, the Trustees received written materials and oral presentations on the topics covered, and were advised by their independent legal counsel regarding their responsibilities and other regulatory requirements related to the approval and continuation of mutual fund investment management agreements under applicable law. In addition, the Investment Adviser and its affiliates provided the Independent Trustees with a written response to a formal request for information sent on behalf of the Independent Trustees by their independent legal counsel. During the course of their deliberations, the Independent Trustees met in executive sessions with their independent legal counsel, without representatives of the Investment Adviser or its affiliates present. The Independent Trustees also discussed the broad range of other investment choices that are available to Fund investors, including the availability of comparable funds managed by other advisers.
Nature, Extent, and Quality of the Services Provided Under the Management Agreement
As part of their review, the Trustees considered the nature, extent, and quality of the services provided to the Fund by the Investment Adviser. In this regard, the Trustees considered both the investment advisory services and non-advisory services that are provided by the Investment Adviser and its affiliates. The Trustees noted the transition in the leadership and changes in personnel of various of the Investment Adviser’s portfolio management teams that had occurred in recent periods, and the ongoing recruitment efforts aimed at bringing high quality investment talent to the Investment Adviser. They also noted the Investment Adviser’s commitment to maintaining high quality systems. The Trustees concluded that the Investment Adviser continued to commit substantial financial and operational resources to the Fund and expressed confidence that the Investment Adviser would continue to do so in the future. The Trustees also recognized that the Investment Adviser had made significant commitments to address regulatory compliance requirements applicable to the Fund and the Investment Adviser.
Investment Performance
The Trustees also considered the investment performance of the Fund. In this regard, they compared the investment performance of the Fund to its peers using rankings compiled by the Outside Data Provider as of December 31, 2014, and updated performance information prepared by the Investment Adviser using the peer group identified by the Outside Data Provider for the one-year period ended March 31, 2015. The Trustees also reviewed the Fund’s investment performance relative to its performance benchmark. As part of this review, they considered the investment performance of the Fund in light of its investment objective and policies and market conditions.
In addition, the Trustees considered materials prepared and presentations made by the Investment Adviser’s senior management and portfolio management personnel, in which Fund performance was assessed. The Trustees also considered the Investment Adviser’s periodic reports with respect to the Fund’s risk profile, and how the Investment Adviser’s approach to risk monitoring and management influences portfolio management.
The Trustees observed that the Fund’s Institutional Shares had placed in the fourth quartile of the Fund’s peer group and had outperformed the Fund’s benchmark index for the one-year period ended March 31, 2015.
34
GOLDMAN SACHS MLP ENERGY INFRASTRUCTURE FUND
Statement Regarding Basis for Approval of Management Agreement (Unaudited) (continued)
Costs of Services Provided and Competitive Information
The Trustees considered the contractual terms of the Management Agreement and the fee rates payable by the Fund thereunder. In this regard, the Trustees considered information on the services rendered by the Investment Adviser to the Fund, which included both advisory and administrative services that were directed to the needs and operations of the Fund as a registered mutual fund.
In particular, the Trustees reviewed analyses prepared by the Outside Data Provider regarding the expense rankings of the Fund. The analyses provided a comparison of the Fund’s management fees and breakpoints to those of a relevant peer group and category universe; an expense analysis which compared the Fund’s overall net and gross expenses to a peer group and a category universe; and a one-year history comparing the Fund’s net expenses to the peer and category medians. The analyses also compared the Fund’s transfer agency, custody, and distribution fees, other expenses and fee waivers/reimbursements to those of the peer group and category medians. The Trustees concluded that the comparisons provided by the Outside Data Provider were useful in evaluating the reasonableness of the management fees and total expenses paid by the Fund.
In addition, the Trustees considered the Investment Adviser’s undertaking to limit certain expenses of the Fund that exceed a specified level. In addition, the Trustees noted that shareholders are able to redeem their Fund shares at any time if shareholders believe that the Fund fees and expenses are too high or if they are dissatisfied with the performance of the Fund.
Profitability
The Trustees reviewed the Investment Adviser’s revenues and pre-tax profit margins with respect to the Trust and the Fund. In this regard the Trustees noted that they had received, among other things, profitability analyses and summaries, revenue and expense schedules by Fund and by function (i.e., investment management, transfer agency and distribution and service), and information on the Investment Adviser’s expense allocation methodology. They observed that the profitability and expense figures are substantially similar to those used by the Investment Adviser for many internal purposes, including compensation decisions among various business groups, and are thus subject to a vigorous internal debate about how certain revenue and expenses should be allocated. The Trustees also noted that the internal audit group within the Goldman Sachs organization had audited the expense allocation methodology and was satisfied with the reasonableness, consistency, and accuracy of the Investment Adviser’s expense allocation methodology and profitability analysis calculations. Profitability data for the Trust and the Fund were provided for 2014 and 2013, and the Trustees considered this information in relation to the Investment Adviser’s overall profitability. The Trustees considered the Investment Adviser’s revenues and pre-tax profit margins both in absolute terms and in comparison to information on the reported pre-tax profit margins earned by certain other asset management firms.
Economies of Scale
The Trustees considered the information that had been provided regarding the Investment Adviser’s profitability. The Trustees also considered the breakpoints in the fee rate payable under the Management Agreement for the Fund at the following annual percentage rates of the average daily net assets of the Fund:
| | | | |
First $1 billion | | | 1.00 | % |
Next $1 billion | | | 0.90 | |
Next $3 billion | | | 0.86 | |
Next $3 billion | | | 0.84 | |
Over $8 billion | | | 0.82 | |
The Trustees noted that the breakpoints were designed to share potential economies of scale, if any, with the Fund and its shareholders as assets under management reach those asset levels. The Trustees considered the amount of assets in the Fund; the Fund’s recent share purchase and redemption activity; the information provided by the Investment Adviser relating to the costs of the services provided by the Investment Adviser and its affiliates and their realized profits; information comparing fee rates charged by the Investment Adviser with fee rates charged to other funds in the peer group; and the Investment Adviser’s undertaking to limit certain expenses of the Fund that exceed a specified level. Upon reviewing these matters at the Annual Meeting, the Trustees concluded that the fee breakpoints represented a means of assuring that benefits of scalability, if any, would be passed along to shareholders at the specified asset levels. They also noted that the Investment Adviser had passed along savings to shareholders of the Fund, which had asset levels above at least the first breakpoint during the prior fiscal year.
35
GOLDMAN SACHS MLP ENERGY INFRASTRUCTURE FUND
Statement Regarding Basis for Approval of Management Agreement (Unaudited) (continued)
Other Benefits to the Investment Adviser and Its Affiliates
The Trustees also considered the other benefits derived by the Investment Adviser and its affiliates from their relationships with the Fund as stated above, including: (a) transfer agency fees received by Goldman, Sachs & Co. (“Goldman Sachs”); (b) brokerage and futures commissions earned by Goldman Sachs for executing securities and futures transactions on behalf of the Fund; (c) research received by the Investment Adviser from broker-dealers in exchange for executing certain transactions on behalf of the Fund; (d) trading efficiencies resulting from aggregation of orders of the Fund with those for other funds or accounts managed by the Investment Adviser; (e) the Investment Adviser’s ability to leverage the infrastructure designed to service the Fund on behalf of its other clients; (f) the Investment Adviser’s ability to cross-market other products and services to Fund shareholders; (g) Goldman Sachs’ retention of certain fees as Fund Distributor; (h) the Investment Adviser’s ability to negotiate better pricing with custodians on behalf of its other clients, as a result of the relationship with the Fund; and (i) the possibility that the working relationship between the Investment Adviser and the Fund’s third-party service providers may cause those service providers to be more likely to do business with other areas of Goldman Sachs. In the course of considering the foregoing, the Independent Trustees requested and received further information quantifying certain of these fall-out benefits.
Other Benefits to the Fund and Its Shareholders
The Trustees also noted that the Fund receives certain potential benefits as a result of its relationship with the Investment Adviser, including: (a) trading efficiencies resulting from aggregation of orders of the Fund with those of other funds or accounts managed by the Investment Adviser; (b) enhanced servicing from vendors because of the volume of business generated by the Investment Adviser and its affiliates; (c) enhanced servicing from broker-dealers because of the volume of business generated by the Investment Adviser and its affiliates; (d) the Investment Adviser’s ability to negotiate favorable terms with derivatives counterparties on behalf of the Fund as a result of the size and reputation of the Goldman Sachs organization; (e) the Investment Adviser’s knowledge and experience gained from managing other accounts and products; (f) the Investment Adviser’s ability to hire and retain qualified personnel to provide services to the Fund because of the reputation of the Goldman Sachs organization; (g) the Fund’s access, through the Investment Adviser, to certain firmwide resources (e.g., proprietary risk management systems and databases), subject to certain restrictions; and (h) the Fund’s access to certain affiliated distribution channels. In addition, the Trustees noted the competitive nature of the mutual fund marketplace, and considered that many of the Fund’s shareholders invested in the Fund in part because of the Fund’s relationship with the Investment Adviser and that those shareholders have a general expectation that the relationship will continue.
Conclusion
In connection with their consideration of the Management Agreement, the Trustees gave weight to each of the factors described above, but did not identify any particular factor as controlling their decision. After deliberation and consideration of all of the information provided, including the factors described above, the Trustees concluded, in the exercise of their business judgment, that the management fee paid by the Fund was reasonable in light of the services provided to it by the Investment Adviser, the Investment Adviser’s costs and the Fund’s current and reasonably foreseeable asset levels. The Trustees unanimously concluded that the Investment Adviser’s continued management likely would benefit the Fund and its shareholders and that the Management Agreement should be approved and continued with respect to the Fund until June 30, 2016.
36
GOLDMAN SACHS MLP ENERGY INFRASTRUCTURE FUND
Trustees and Officers (Unaudited)
Independent Trustees
| | | | | | | | | | |
Name,
Address and Age1 | | Position(s) Held with the Trust | | Term of Office and
Length of
Time Served2 | | Principal Occupation(s) During Past 5 Years | | Number of
Portfolios in
Fund Complex
Overseen by
Trustee3 | | Other Directorships Held by Trustee4 |
Ashok N. Bakhru Age: 73 | | Chairman of the Board of Trustees | | Since 1996 (Trustee since 1991) | | Mr. Bakhru is retired. He was formerly Director, Apollo Investment Corporation (a business development company) (2008-2013); President, ABN Associates (a management and financial consulting firm) (1994-1996 and 1998-2012); Trustee, Scholarship America (1998-2005); Trustee, Institute for Higher Education Policy (2003-2008); Director, Private Equity Investors — III and IV (1998-2007), and Equity-Linked Investors II (April 2002-2007). Chairman of the Board of Trustees — Goldman Sachs Fund Complex. | | 137 | | None |
Kathryn A. Cassidy Age: 61 | | Trustee | | Since 2015 | | Ms. Cassidy is retired. Formerly, she was Advisor to the Chairman (May 2014-December 2014); and Senior Vice President and Treasurer (2008-2014), General Electric Company & General Electric Capital Corporation (technology and financial services companies). Trustee — Goldman Sachs Fund Complex. | | 112 | | None |
John P. Coblentz, Jr. Age: 74 | | Trustee | | Since 2003 retiring effective 1/1/2016, term is through 12/31/2015 | | Mr. Coblentz is retired. Formerly, he was Partner, Deloitte & Touche LLP (a professional services firm) (1975-2003); Director, Emerging Markets Group, Ltd. (2004-2006); and Director, Elderhostel, Inc. (2006-2012). Trustee — Goldman Sachs Fund Complex. | | 137 | | None |
Diana M. Daniels Age: 66 | | Trustee | | Since 2007 | | Ms. Daniels is retired. Formerly, she was Vice President, General Counsel and Secretary, The Washington Post Company (1991-2006). Ms. Daniels is a Trustee Emeritus and serves as a Presidential Councillor of Cornell University (2013-Present); Member, Advisory Board, Psychology Without Borders (international humanitarian aid organization) (2007-Present), and former Member of the Legal Advisory Board, New York Stock Exchange (2003-2006) and of the Corporate Advisory Board, Standish Mellon Management Advisors (2006-2007). Trustee — Goldman Sachs Fund Complex. | | 112 | | None |
Joseph P. LoRusso Age: 58 | | Trustee | | Since 2010 retiring effective 1/1/2016, term is through 12/31/2015 | | Mr. LoRusso is retired. Formerly, he was President, Fidelity Investments Institutional Services Co. (“FIIS”) (2002-2008); Director, FIIS (2002-2008); Director, Fidelity Investments Institutional Operations Company (2003-2007); Executive Officer, Fidelity Distributors Corporation (2007-2008). Trustee — Goldman Sachs Fund Complex. | | 112 | | None |
Herbert J. Markley Age: 65 | | Trustee | | Since 2013 | | Mr. Markley is retired. Formerly, he was Executive Vice President, Deere & Company (an agricultural and construction equipment manufacturer) (2007-2009); and President, Agricultural Division, Deere & Company (2001-2007). Trustee — Goldman Sachs Fund Complex. | | 112 | | None |
Jessica Palmer Age: 66 | | Trustee | | Since 2007 | | Ms. Palmer is retired. She is Director, Emerson Center for the Arts and Culture (2011-Present); and was formerly a Consultant, Citigroup Human Resources Department (2007-2008); Managing Director, Citigroup Corporate and Investment Banking (previously, Salomon Smith Barney/Salomon Brothers) (1984-2006). Ms. Palmer was a Member of the Board of Trustees of Indian Mountain School (private elementary and secondary school) (2004-2009). Trustee — Goldman Sachs Fund Complex. | | 112 | | None |
| | | | | | | | | | |
37
GOLDMAN SACHS MLP ENERGY INFRASTRUCTURE FUND
Trustees and Officers (Unaudited) (continued)
Independent Trustees
| | | | | | | | | | |
Name,
Address and Age1 | | Position(s) Held with the Trust | | Term of Office and
Length of
Time Served2 | | Principal Occupation(s) During Past 5 Years | | Number of
Portfolios in
Fund Complex
Overseen by
Trustee3 | | Other Directorships Held by Trustee4 |
Richard P. Strubel Age: 76 | | Trustee | | Since 1987 retiring effective 1/1/2016, term is through 12/31/2015 | | Mr. Strubel is retired. Formerly, he served as Chairman of the Board of Trustees, Northern Funds (a family of retail and institutional mutual funds managed by Northern Trust Investments, Inc.) (2008-2014) and Trustee (1982-2014); Director, Cardean Learning Group (provider of educational services via the internet) (2003-2008); and Director, Gildan Activewear Inc. (a clothing marketing and manufacturing company) (2000-2014). He serves as Trustee Emeritus, The University of Chicago (1987-Present). Trustee — Goldman Sachs Fund Complex. | | 137 | | None |
Roy W. Templin Age: 55 | | Trustee | | Since 2013 | | Mr. Templin is retired. He is Chairman of the Board of Directors, Con-Way Incorporated (2014-Present); and was formerly Executive Vice President and Chief Financial Officer, Whirlpool Corporation (an appliance manufacturer and marketer) (2004-2012). Trustee — Goldman Sachs Fund Complex. | | 112 | | Con-Way Incorporated (a transportation, logistics and supply-chain management services company) |
Gregory G. Weaver Age: 64 | | Trustee | | Since 2015 | | Mr. Weaver is retired. He is Director, Verizon Communications Inc. (2015-Present); and was formerly Chairman and Chief Executive Officer, Deloitte & Touche LLP (a professional services firm) (2001-2005 and 2012-2014); and Member of the Board of Directors, Deloitte & Touche LLP (2006-2012). Trustee — Goldman Sachs Fund Complex. | | 112 | | Verizon Communications Inc. |
| | | | | | | | | | |
38
GOLDMAN SACHS MLP ENERGY INFRASTRUCTURE FUND
Trustees and Officers (Unaudited) (continued)
Interested Trustees*
| | | | | | | | | | |
Name,
Address and Age1 | | Position(s) Held with the Trust | | Term of Office and
Length of
Time Served2 | | Principal Occupation(s) During Past 5 Years | | Number of
Portfolios in
Fund Complex
Overseen by
Trustee3 | | Other Directorships Held by Trustee4 |
James A. McNamara Age: 53 | | President and Trustee | | Since 2007 | | Managing Director, Goldman Sachs (December 1998-Present); Director of Institutional Fund Sales, GSAM (April 1998-December 2000); and Senior Vice President and Manager, Dreyfus Institutional Service Corporation (January 1993- April 1998). President — Goldman Sachs Fund Complex (November 2007-Present); Senior Vice President — Goldman Sachs Fund Complex (May 2007-November 2007); and Vice President — Goldman Sachs Fund Complex (2001-2007). Trustee — Goldman Sachs Fund Complex (November 2007-Present and December 2002-May 2004). | | 136 | | None |
Alan A. Shuch Age: 65 | | Trustee | | Since 1990 | | Advisory Director — GSAM (May 1999-Present); Consultant to GSAM (December 1994-May 1999); and Limited Partner, Goldman Sachs (December 1994-May 1999). Trustee — Goldman Sachs Fund Complex. | | 112 | | None |
| | | | | | | | | | |
| * | | These persons are considered to be “Interested Trustees” because they hold positions with Goldman Sachs and own securities issued by The Goldman Sachs Group, Inc. Each Interested Trustee holds comparable positions with certain other companies of which Goldman Sachs, GSAM or an affiliate thereof is the investment adviser, administrator and/or distributor. |
| 1 | | Each Trustee may be contacted by writing to the Trustee, c/o Goldman Sachs, 200 West Street, New York, New York, 10282, Attn: Caroline Kraus. Information is provided as of November 30, 2015. |
| 2 | | Each Trustee holds office for an indefinite term until the earliest of: (a) the election of his or her successor; (b) the date the Trustee resigns or is removed by the Board of Trustees or shareholders, in accordance with the Trust’s Declaration of Trust; (c) December 31st of the year in which the Trustee turns 74 years of age, subject to waiver by a majority of the Trustees (in accordance with the current resolutions of the Board of Trustees, which may be changed by the Trustees without shareholder vote); or (d) the termination of the Trust. By resolution of the Board of Trustees determining that an extension of service would be beneficial to the Trust, the retirement age has been extended with respect to Richard P. Strubel. |
| 3 | | The Goldman Sachs Fund Complex includes the Trust and Goldman Sachs Variable Insurance Trust (“GSVIT”). As of November 30, 2015, the Trust consisted of 98 portfolios (91 of which offered shares to the public) and GSVIT consisted of 14 portfolios. The Goldman Sachs Fund Complex also includes, with respect to Messrs. Bakhru, Coblentz and Strubel, Goldman Sachs Trust II (“GSTII”), Goldman Sachs BDC, Inc. (“GSBDC”), Goldman Sachs MLP Income Opportunities Fund (“GSMLP”), Goldman Sachs MLP and Energy Renaissance Fund (“GSMER”) and Goldman Sachs ETF Trust (“GSETF”), and with respect to Mr. McNamara, GSTII, GSMLP, GSMER and GSETF. GSTII consisted of eight portfolios (six of which offered shares to the public). GSBDC, GSMLP and GSMER each consisted of one portfolio. GSETF consisted of 14 portfolios (three of which offered shares to the public). |
| 4 | | This column includes only directorships of companies required to report to the Securities and Exchange Commission under the Securities Exchange Act of 1934 (i.e., “public companies”) or other investment companies registered under the Act. |
Additional information about the Trustees is available in the Fund’s Statement of Additional Information, which can be obtained from Goldman Sachs free of charge by calling this toll-free number (in the United States of America): 1-800-526-7384.
39
GOLDMAN SACHS MLP ENERGY INFRASTRUCTURE FUND
Trustees and Officers (Unaudited) (continued)
Officers of the Trust*
| | | | | | |
Name, Address and Age1 | | Position(s) Held With the Trust | | Term of
Office and
Length of
Time Served2 | | Principal Occupation(s) During Past 5 Years |
James A. McNamara 200 West Street New York, NY 10282 Age: 53 | | President and Trustee | | Since 2007 | | Managing Director, Goldman Sachs (December 1998-Present); Director of Institutional Fund Sales, GSAM (April 1998-December 2000); and Senior Vice President and Manager, Dreyfus Institutional Service Corporation (January 1993-April 1998). President — Goldman Sachs Fund Complex (November 2007-Present); Senior Vice President — Goldman Sachs Fund Complex (May 2007-November 2007); and Vice President — Goldman Sachs Fund Complex (2001-2007). Trustee — Goldman Sachs Fund Complex (November 2007-Present and December 2002-May 2004). |
Caroline L. Kraus 200 West Street New York, NY 10282 Age: 38 | | Secretary | | Since 2012 | | Vice President, Goldman Sachs (August 2006-Present); Associate General Counsel, Goldman Sachs (2012-Present); Assistant General Counsel, Goldman Sachs (August 2006-December 2011); and Associate, Weil, Gotshal & Manges, LLP (2002-2006). Secretary — Goldman Sachs Fund Complex (August 2012-Present); and Assistant Secretary — Goldman Sachs Fund Complex (June 2012-August 2012). |
Scott M. McHugh 200 West Street New York, NY 10282 Age: 44 | | Principal Financial Officer, Senior Vice President and Treasurer | | Since 2009 (Principal Financial Officer since 2013) | | Vice President, Goldman Sachs (February 2007-Present); Assistant Treasurer of certain mutual funds administered by DWS Scudder (2005-2007); and Director (2005-2007), Vice President (2000-2005), and Assistant Vice President (1998-2000), Deutsche Asset Management or its predecessor (1998-2007). Principal Financial Officer — Goldman Sachs Fund Complex (November 2013-Present); Treasurer — Goldman Sachs Fund Complex (October 2009-Present); Senior Vice President — Goldman Sachs Fund Complex (November 2009-Present); and Assistant Treasurer — Goldman Sachs Fund Complex (May 2007-October 2009). |
| | | | | | |
| * | | Represents a partial list of officers of the Trust. Additional information about all the officers is available in the Fund’s Statement of Additional Information, which can be obtained from Goldman Sachs free of charge by calling this toll-free number (in the United States): 1-800-526-7384. |
| 1 | | Information is provided as of November 30, 2015. |
| 2 | | Officers hold office at the pleasure of the Board of Trustees or until their successors are duly elected and qualified. Each officer holds comparable positions with certain other companies of which Goldman Sachs, GSAM or an affiliate thereof is the investment adviser, administrator and/or distributor. |
40
FUNDS PROFILE
Goldman Sachs Funds

Goldman Sachs is a premier financial services firm, known since 1869 for creating thoughtful and customized investment solutions in complex global markets.
Today, the Investment Management Division of Goldman Sachs serves a diverse set of clients worldwide, including private institutions, public entities and individuals. With approximately $1.02 trillion in assets under supervision as of September 30, 2015, Goldman Sachs Asset Management (“GSAM”) has portfolio management teams located around the world and our investment professionals bring firsthand knowledge of local markets to every investment decision. Assets under supervision includes assets under management and other client assets for which Goldman Sachs does not have full discretion. GSAM leverages the resources of Goldman, Sachs & Co. subject to legal, internal and regulatory restrictions.

Money Market1
Financial Square FundsSM
| n | | Financial Square Tax-Exempt Funds |
| n | | Financial Square Tax-Free Money Market Fund |
| n | | Financial Square Treasury Solutions Fund2 |
| n | | Financial Square Government Fund |
| n | | Financial Square Money Market Fund |
| n | | Financial Square Prime Obligations Fund |
| n | | Financial Square Treasury Instruments Fund |
| n | | Financial Square Treasury Obligations Fund |
| n | | Financial Square Federal Instruments Fund |
Fixed Income
Short Duration and Government
| n | | High Quality Floating Rate Fund |
| n | | Limited Maturity Obligations Fund |
| n | | Short Duration Government Fund |
| n | | Short Duration Income Fund |
| n | | Inflation Protected Securities Fund |
Multi-Sector
Municipal and Tax-Free
| n | | High Yield Municipal Fund |
| n | | Dynamic Municipal Income Fund3 |
| n | | Short Duration Tax-Free Fund |
Single Sector
| n | | Investment Grade Credit Fund |
| n | | High Yield Floating Rate Fund |
| n | | Emerging Markets Debt Fund |
| n | | Local Emerging Markets Debt Fund |
| n | | Dynamic Emerging Markets Debt Fund |
Fixed Income Alternatives
| n | | Long Short Credit Strategies Fund |
| n | | Fixed Income Macro Strategies Fund |
Fundamental Equity
| n | | Small/Mid Cap Value Fund |
| n | | Small/Mid Cap Growth Fund |
| n | | Flexible Cap Growth Fund |
| n | | Concentrated Growth Fund |
| n | | Technology Opportunities Fund4 |
| n | | Growth Opportunities Fund |
| n | | Rising Dividend Growth Fund |
| n | | Dynamic U.S. Equity Fund5 |
Tax-Advantaged Equity
| n | | U.S. Tax-Managed Equity Fund |
| n | | International Tax-Managed Equity Fund |
| n | | U.S. Equity Dividend and Premium Fund |
| n | | International Equity Dividend and Premium Fund |
Equity Insights
| n | | Small Cap Equity Insights Fund |
| n | | U.S. Equity Insights Fund |
| n | | Small Cap Growth Insights Fund |
| n | | Large Cap Growth Insights Fund |
| n | | Large Cap Value Insights Fund |
| n | | Small Cap Value Insights Fund |
| n | | International Small Cap Insights Fund |
| n | | International Equity Insights Fund |
| n | | Emerging Markets Equity Insights Fund |
Fundamental Equity International
| n | | Strategic International Equity Fund |
| n | | Focused International Equity Fund |
| n | | International Small Cap Fund |
| n | | Emerging Markets Equity Fund6 |
Select Satellite7
| n | | Real Estate Securities Fund |
| n | | International Real Estate Securities Fund |
| n | | Global Real Estate Securities Fund |
| n | | Commodity Strategy Fund |
| n | | Dynamic Commodity Strategy Fund |
| n | | Dynamic Allocation Fund |
| n | | Absolute Return Tracker Fund |
| n | | Managed Futures Strategy Fund |
| n | | MLP Energy Infrastructure Fund |
| n | | Multi-Manager Alternatives Fund |
| n | | Multi-Asset Real Return Fund |
| n | | Retirement Portfolio Completion Fund |
| n | | Absolute Return Multi-Asset Fund |
Total Portfolio Solutions7
| n | | Global Managed Beta Fund |
| n | | Multi-Manager Non-Core Fixed Income Fund |
| n | | Multi-Manager U.S. Dynamic Equity Fund |
| n | | Multi-Manager Global Equity Fund |
| n | | Multi-Manager International Equity Fund |
| n | | Tactical Tilt Implementation Fund |
| n | | Balanced Strategy Portfolio |
| n | | Multi-Manager Real Assets Strategy Fund |
| n | | Growth and Income Strategy Portfolio |
| n | | Growth Strategy Portfolio |
| n | | Equity Growth Strategy Portfolio |
| n | | Satellite Strategies Portfolio |
| n | | Enhanced Dividend Global Equity Portfolio |
| n | | Tax Advantaged Global Equity Portfolio |
| 1 | | An investment in a money market fund is neither insured nor guaranteed by the Federal Deposit Insurance Corporation (“FDIC”) or any other government agency. Although the Funds seek to preserve the value of your investment at $1.00 per share, it is possible to lose money by investing in the Funds. |
| 2 | | Effective on September 30, 2015, the Goldman Sachs Financial Square Federal Fund was renamed the Goldman Sachs Financial Square Treasury Solutions Fund. |
| 3 | | Effective on December 18, 2014, the Goldman Sachs Municipal Income Fund was renamed the Goldman Sachs Dynamic Municipal Income Fund. |
| 4 | | Effective on July 31, 2015, the Goldman Sachs Technology Tollkeeper Fund was renamed the Goldman Sachs Technology Opportunities Fund. |
| 5 | | Effective on April 30, 2015, the Goldman Sachs U.S. Equity Fund was renamed the Goldman Sachs Dynamic U.S. Equity Fund. |
| 6 | | Effective at the close of business on October 23, 2015, the Goldman Sachs BRIC Fund (Brazil, Russia, India, China) was reorganized with and into the Goldman Sachs Emerging Markets Equity Fund. |
| 7 | | Individual Funds within the Total Portfolio Solutions and Select Satellite categories will have various placement on the risk/return spectrum and may have greater or lesser risk than that indicated by the placement of the general Total Portfolio Solutions or Select Satellite category. |
Financial Square FundsSM is a registered service mark of Goldman, Sachs & Co.
| * | | This list covers open-end funds only. Please visit our website at www.GSAMFUNDS.com to learn about our closed-end funds and exchange-traded funds. |
| | |
TRUSTEES Ashok N. Bakhru, Chairman Kathryn A. Cassidy Diana M. Daniels Herbert J. Markley James A. McNamara Jessica Palmer Alan A. Shuch Roy W. Templin Gregory G. Weaver | | OFFICERS James A. McNamara, President Scott M. McHugh, Principal Financial Officer and Treasurer Caroline L. Kraus, Secretary |
| |
GOLDMAN, SACHS & CO. Distributor and Transfer Agent | | GOLDMAN SACHS ASSET MANAGEMENT, L.P. Investment Adviser |
Visit our Website at www.GSAMFUNDS.com to obtain the most recent month-end returns.
Goldman Sachs Asset Management, L.P., 200 West Street, New York, New York 10282
The reports concerning the Fund included in this shareholder report may contain certain forward-looking statements about the factors that may affect the performance of the Fund in the future. These statements are based on Fund management’s predictions and expectations concerning certain future events and their expected impact on the Fund, such as performance of the economy as a whole and of specific industry sectors, changes in the levels of interest rates, the impact of developing world events, and other factors that may influence the future performance of the Fund. Management believes these forward-looking statements to be reasonable, although they are inherently uncertain and difficult to predict. Actual events may cause adjustments in portfolio management strategies from those currently expected to be employed.
A description of the policies and procedures that the Fund uses to determine how to vote proxies relating to portfolio securities and information regarding how the Fund voted proxies relating to portfolio securities for the most recent 12-month period ended June 30, are available (I) without charge, upon request by calling 1-800-526-7384 (for Retail Shareholders) or 1-800-621-2550 (for Institutional Shareholders); and (II) on the Securities and Exchange Commission (“SEC’’) web site at http://www.sec.gov.
The Fund files its complete schedule of portfolio holdings with the Securities and Exchange Commission (“SEC”) for the first and third quarters of each fiscal year on Form N-Q. The Fund’s Forms N-Q are available on the SEC’s web site at http://www.sec.gov within 60 days after the Fund’s first and third fiscal quarters. The Fund’s Forms N-Q may be reviewed and copied at the SEC’s Public Reference Room in Washington, D.C., and information on the operation of the Public Reference Room may also be obtained by calling 1-800-SEC-0330. Form N-Q may be obtained upon request and without charge by calling 1-800-526-7384 (for Retail Shareholders) or 1-800-621-2550 (for Institutional Shareholders).
Fund holdings and allocations shown are as of November 30, 2015 and may not be representative of future investments. Fund holdings should not be relied on in making investment decisions and should not be construed as research or investment advice regarding particular securities. Current and future holdings are subject to risk.
Economic and market forecasts presented herein reflect our judgment as of the date of this presentation and are subject to change without notice. These forecasts do not take into account the specific investment objectives, restrictions, tax and financial situation or other needs of any specific client. Actual data will vary and may not be reflected here. These forecasts are subject to high levels of uncertainty that may affect actual performance. Accordingly, these forecasts should be viewed as merely representative of a broad range of possible outcomes. These forecasts are estimated, based on assumptions, and are subject to significant revision and may change materially as economic and market conditions change. Goldman Sachs has no obligation to provide updates or changes to these forecasts. Case studies and examples are for illustrative purposes only.
“Alerian MLP Index”, “AMZ” and “AMZX” are trademarks of Alerian and their use is granted under a license from Alerian.
The portfolio risk management process includes an effort to monitor and manage risk, but does not imply low risk.
This material is not authorized for distribution to prospective investors unless preceded or accompanied by a current Prospectus or summary prospectus, if applicable. Investors should consider the Fund’s objective, risks, and charges and expenses, and read the summary prospectus, if available, and/or the Prospectus carefully before investing or sending money. The summary prospectus, if available, and the Prospectus contain this and other information about the Fund and may be obtained from your authorized dealer or from Goldman, Sachs & Co. by calling (retail – 1-800-526-7384) (institutional – 1-800-621-2550).
© 2015 Goldman Sachs. All rights reserved. 30038-TEMPL-01/2016 MLPEIAR-16/36K
| (a) | As of the end of the period covered by this report, the registrant has adopted a code of ethics that applies to the registrant’s principal executive officer, principal financial officer, principal accounting officer or controller, or persons performing similar functions, regardless of whether these individuals are employed by the registrant or a third party (the “Code of Ethics”). |
| (b) | During the period covered by this report, no amendments were made to the provisions of the Code of Ethics. |
| (c) | During the period covered by this report, the registrant did not grant any waivers, including an implicit waiver, from any provision of the Code of Ethics. |
| (d) | A copy of the Code of Ethics is available as provided in Item 12(a)(1) of this report. |
| ITEM 3. | AUDIT COMMITTEE FINANCIAL EXPERT. |
| | The registrant’s board of trustees has determined that the registrant has at least one “audit committee financial expert” (as defined in Item 3 of Form N-CSR) serving on its audit committee. Gregory G. Weaver is the “audit committee financial expert” and is “independent” (as each term is defined in Item 3 of Form N-CSR). |
| ITEM 4. | PRINCIPAL ACCOUNTANT FEES AND SERVICES. |
Table 1 — Items 4(a) - 4(d). The accountant fees below reflect the aggregate fees billed by all of the Funds of the Goldman Sachs Trust and includes the Goldman Sachs Funds to which this certified shareholder report relates.
| | | | | | | | | | |
| | | 2015 | | | 2014 | | | Description of Services Rendered |
Audit Fees: | | | | | | | | | | |
• PricewaterhouseCoopers LLP (“PwC”) | | $ | 3,563,029 | | | $ | 3,736,317 | | | Financial Statement audits. |
Audit-Related Fees: | | | | | | | | | | |
• PwC | | $ | 138,000 | | | $ | — | | | Other attest services. |
Tax Fees: | | | | | | | | | | |
• PwC | | $ | 900,314 | | | $ | 818,750 | | | Tax compliance services provided in connection with the preparation and review of registrant’s tax returns. |
Table 2 — Items 4(b)(c) & (d). Non-Audit Services to the Goldman Sachs Trust’s service affiliates * that were pre-approved by the Audit Committee of the Goldman Sachs Trust pursuant to Rule 2-01(c)(7)(ii) of Regulation S-X.
| | | | | | | | | | |
| | | 2015 | | | 2014 | | | Description of Services Rendered |
Audit-Related Fees: | | | | | | | | | | |
• PwC | | $ | 1,568,616 | | | $ | 1,486,420 | | | Internal control review performed in accordance with Statement on Standards for Attestation Engagements No. 16. These fees are borne by the Funds’ Adviser. |
| * | These include the advisor (excluding sub-advisors) and any entity controlling, controlled by or under common control with the advisor that provides ongoing services to the registrant (hereinafter referred to as “service affiliates”). |
Item 4(e)(1) — Audit Committee Pre-Approval Policies and Procedures
Pre-Approval of Audit and Non-Audit Services Provided to the Funds of the Goldman Sachs Trust. The Audit and Non-Audit Services Pre-Approval Policy (the “Policy”) adopted by the Audit Committee of Goldman Sachs Trust (“GST”) sets forth the procedures and the conditions pursuant to which services performed by an independent auditor for GST may be pre-approved. Services may be pre-approved specifically by the Audit Committee as a whole or, in certain circumstances, by the Audit Committee Chairman or the person designated as the Audit Committee Financial Expert. In addition, subject to specified cost limitations, certain services may be pre-approved under the provisions of the Policy. The Policy provides that the Audit Committee will consider whether the services provided by an independent auditor are consistent with the Securities and Exchange Commission’s rules on auditor independence. The Policy provides for periodic review and pre-approval by the Audit Committee of the services that may be provided by the independent auditor.
De Minimis Waiver. The pre-approval requirements of the Policy may be waived with respect to the provision of non-audit services that are permissible for an independent auditor to perform, provided (1) the aggregate amount of all such services provided constitutes no more than five percent of the total amount of revenues subject to pre-approval that was paid to the independent auditors during the fiscal year in which the services are provided; (2) such services were not recognized by GST at the time of the engagement to be non-audit services; and (3) such services are promptly brought to the attention of the Audit Committee and approved prior to the completion of the audit by the Audit Committee or by one or more members of the Audit Committee to whom authority to grant such approvals has been delegated by the Audit Committee, pursuant to the pre-approval provisions of the Policy.
Pre-Approval of Non-Audit Services Provided to GST’s Investment Advisers. The Policy provides that, in addition to requiring pre-approval of audit and non-audit services provided to GST, the Audit Committee will pre-approve those non-audit services provided to GST’s investment advisers (and entities controlling, controlled by or under common control with the investment advisers that provide ongoing services to GST) where the engagement relates directly to the operations or financial reporting of GST.
Item 4(e)(2) – 0% of the audit-related fees, tax fees and other fees listed in Table 1 were approved by GST’s Audit Committee pursuant to the “de minimis” exception of Rule 2-01(c)(7)(i)(C) of Regulation S-X. In addition, 0% of the non-audit services to the GST’s service affiliates listed in Table 2 were approved by GST’s Audit Committee pursuant to the “de minimis” exception of Rule 2-01(c)(7)(i)(C) of Regulation S-X.
Item 4(f) – Not applicable.
Item 4(g) Aggregate Non-Audit Fees Disclosure
The aggregate non-audit fees billed to GST by PwC for the twelve months ended November 30, 2015 and November 30, 2014 were $818,750 and $1,038,314 respectively. The aggregate non-audit fees billed to GST’s adviser and service affiliates by PwC for non-audit services for the twelve months ended December 31, 2014 and December 31, 2013 were approximately $10.2 million and $9.8 million respectively. The figures for these entities are not yet available for the twelve months ended December 31, 2015. With regard to the aggregate non-audit fees billed to GST’s adviser and service affiliates, the 2014 and 2013 amounts include fees for non-audit services required to be pre-approved [see Table 2] and fees for non-audit services that did not require pre-approval since they did not directly relate to GST’s operations or financial reporting.
Item 4(h) — GST’s Audit Committee has considered whether the provision of non-audit services to GST’s investment adviser and service affiliates that did not require pre-approval pursuant to paragraph (c)(7)(ii) of Rule 2-01 of Regulation S-X is compatible with maintaining the auditors’ independence.
| ITEM 5. | AUDIT COMMITTEE OF LISTED REGISTRANTS. |
| ITEM 6. | SCHEDULE OF INVESTMENTS. |
| | Schedule of Investments is included as part of the Report to Stockholders filed under Item 1. |
| ITEM 7. | DISCLOSURE OF PROXY VOTING POLICIES AND PROCEDURES FOR CLOSED-END MANAGEMENT INVESTMENT COMPANIES. |
| ITEM 8. | PORTFOLIO MANAGERS OF CLOSED-END MANAGEMENT INVESTMENT COMPANIES. |
| ITEM 9. | PURCHASES OF EQUITY SECURITIES BY CLOSED-END MANAGEMENT INVESTMENT COMPANY AND AFFILIATED PURCHASERS. |
| ITEM 10. | SUBMISSION OF MATTERS TO A VOTE OF SECURITY HOLDERS. |
| | There have been no material changes to the procedures by which shareholders may recommend nominees to the registrant’s board of trustees. |
| ITEM 11. | CONTROLS AND PROCEDURES. |
| | (a) | The registrant’s principal executive and principal financial officers, or persons performing similar functions have concluded that the registrant’s disclosure controls and procedures (as defined in Rule 30a-3(c) under the Investment Company Act of 1940, as amended (the “1940 Act”)) are effective as of a date within 90 days of the filing of this report that includes the disclosure required by this paragraph, based on the evaluation of these controls and procedures required by Rule 30a-3(b) under the 1940 Act and 15d-15(b) under the Securities Exchange Act of 1934, as amended. |
| | (b) | There were no changes in the registrant’s internal control over financial reporting (as defined in Rule 30a-3(d) under the 1940 Act) that occurred during the registrant’s second fiscal quarter of the period covered by this report that have materially affected, or are reasonably likely to materially affect, the registrant’s internal control over financial reporting. |
| | | | |
| (a)(1) | | Goldman Sachs Trust’s Code of Ethics for Principal Executive and Senior Financial Officers is incorporated by reference to Exhibit 12(a)(1) of the registrant’s Form N-CSR filed on July 8, 2015 for its International Equity Insights Funds. |
| | |
| (a)(2) | | Exhibit 99.CERT | | Certifications pursuant to Section 302 of the Sarbanes-Oxley Act of 2002 filed herewith. |
| | |
| (b) | | Exhibit 99.906CERT | | Certifications pursuant to Section 906 of the Sarbanes-Oxley Act of 2002 filed herewith. |
SIGNATURES
Pursuant to the requirements of the Securities Exchange Act of 1934 and the Investment Company Act of 1940, the registrant has duly caused this report to be signed on its behalf by the undersigned, thereunto duly authorized.
| | | | |
| | | | Goldman Sachs Trust |
| | |
| By: | | | | /s/ James A. McNamara |
| | | | James A. McNamara |
| | | | President/Chief Executive Officer |
| | | | Goldman Sachs Trust |
| | |
| Date: | | | | February 5, 2016 |
Pursuant to the requirements of the Securities Exchange Act of 1934 and the Investment Company Act of 1940, this report has been signed below by the following persons on behalf of the registrant and in the capacities and on the dates indicated.
| | | | |
| By: | | | | /s/ James A. McNamara |
| | | | James A. McNamara |
| | | | President/Principal Executive Officer |
| | | | Goldman Sachs Trust |
| | |
| Date: | | | | February 5, 2016 |
| | |
| By: | | | | /s/ Scott McHugh |
| | | | Scott McHugh |
| | | | Principal Financial Officer |
| | | | Goldman Sachs Trust |
| | |
| Date: | | | | February 5, 2016 |