UNITED STATES
SECURITIES AND EXCHANGE COMMISSION
Washington, D.C. 20549
FORM N-CSR
CERTIFIED SHAREHOLDER REPORT OF REGISTERED
MANAGEMENT INVESTMENT COMPANIES
Investment Company Act file number 811-05349
Goldman Sachs Trust
(Exact name of registrant as specified in charter)
71 South Wacker Drive, Chicago, Illinois 60606
(Address of principal executive offices) (Zip code)
| | |
| Caroline Kraus, Esq. | | Copies to: |
| Goldman, Sachs & Co. | | Geoffrey R.T. Kenyon, Esq. |
| 200 West Street | | Dechert LLP |
| New York, New York 10282 | | 100 Oliver Street |
| | 40th Floor |
| | Boston, MA 02110-2605 |
(Name and address of agents for service)
Registrant’s telephone number, including area code: (312) 655-4400
Date of fiscal year end: October 31
Date of reporting period: October 31, 2015
| ITEM 1. | REPORTS TO STOCKHOLDERS. |
| | The Annual Report to Shareholders is filed herewith. |
Goldman Sachs Funds

| | | | |
| | |
| Annual Report | | | | October 31, 2015 |
| | |
| | | | Retirement Portfolio Completion Fund |

Goldman Sachs Retirement Portfolio
Completion Fund
| | | | |
TABLE OF CONTENTS | | | | |
| |
Principal Investment Strategies and Risks | | | 1 | |
| |
Investment Process | | | 2 | |
| |
Portfolio Management Discussion and Performance Summary | | | 3 | |
| |
Schedule of Investments | | | 12 | |
| |
Financial Statements | | | 17 | |
| |
Financial Highlights | | | 20 | |
| |
Notes to the Financial Statements | | | 22 | |
| |
Report of Independent Registered Public Accounting Firm | | | 35 | |
| |
Other Information | | | 36 | |
| | | | |
| | | |
| NOT FDIC-INSURED | | May Lose Value | | No Bank Guarantee |
GOLDMAN SACHS RETIREMENT PORTFOLIO COMPLETION FUND
Principal Investment Strategies and Risks
This is not a complete list of risks that may affect the Fund. For additional information concerning the risks applicable to the Fund, please see the Fund’s Prospectus.
The Goldman Sachs Retirement Portfolio Completion Fund is designed to provide retirement investors of all ages with access to the following asset classes that are typically underrepresented in retirement savings portfolios (the “Underlying Asset Classes”): U.S. inflation linked government bonds, global real estate investment trusts (“global REITs”), commodities, emerging markets equity, emerging markets sovereign credit, North American high yield corporate credit and Hedge Fund Industry Beta (i.e., the component of hedge fund returns that is attributable to market risk exposure, rather than manager skill). Derivative instruments may involve a high degree of financial risk. These risks include the risk that a small movement in the price of the underlying security or benchmark may result in a disproportionately large movement, unfavorable or favorable, in the price of the derivative instrument; risk of default by a counterparty; and liquidity risk. Over-the-counter transactions are subject to less government regulation and supervision. The Fund’s equity investments are subject to market risk, which means that the value of its investments may go up or down in response to the prospects of individual companies, particular sectors and/or general economic conditions. The securities of mid- and small-capitalization companies involve greater risks than those associated with larger, more established companies and may be subject to more abrupt or erratic price movements. Investments in fixed income securities are subject to the risks associated with debt securities generally, including credit, liquidity and interest rate risk. The market value of inflation protected securities is not guaranteed, and will fluctuate in response to changes in real interest rates. Investing in REITs involves certain unique risks in addition to those risks associated with investing in the real estate industry in general. REITs whose underlying properties are concentrated in a particular industry or geographic region are also subject to risks affecting such industries and regions. The securities of REITs involve greater risks than those associated with larger, more established companies and may be subject to more abrupt or erratic price movements because of interest rate changes, economic conditions and other factors. Exposure to the commodities markets may subject the Fund to greater volatility than investments in traditional securities. The Fund’s investments in other investment companies (including exchange-traded funds and money market funds) and publicly-traded partnerships (“PTPs”) subject it to additional expenses. Risks of PTPs may include potential lack of liquidity and limitations on voting and distribution rights. Foreign and emerging market securities may be more volatile and less liquid than investments in U.S. securities and are subject to the risks of currency fluctuations and adverse economic or political developments. At times, the Fund may be unable to sell certain of its illiquid portfolio investments without a substantial drop in price, if at all. The Fund is “non-diversified” and may be more susceptible than “diversified” funds to adverse developments affecting any single issuer held in its portfolio and to greater losses because of these developments.
1
GOLDMAN SACHS RETIREMENT PORTFOLIO COMPLETION FUND
What Differentiates Goldman Sachs Retirement Portfolio Completion Fund’s Investment Process?
The Fund is designed to provide retirement investors of all ages with access to certain asset classes that are typically underrepresented in retirement savings portfolios (the “Underlying Asset Classes”). Our investment process is driven by three main objectives: broad diversification in a single fund, lower expected volatility and inflation protection and cost efficiency through passive implementation of most asset classes.
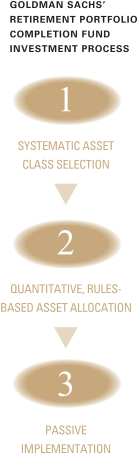

| n | | Comprehensive evaluation of a range of asset classes based on the following investment criteria — under-representation in a typical retirement investor’s portfolio, liquidity of the asset class, tax suitability, correlation with inflation, correlation with core asset classes, strong historical performance and efficient implementation. |

| n | | The Fund uses a risk parity approach for portfolio construction, targeting roughly equal contribution to overall risk from each Underlying Asset Class, and adjusting over time as market conditions evolve. |
| n | | To ensure diversification, we place minimum and maximum allocation constraints on all asset classes within the portfolio. |

| n | | Passive exposure to most of the Underlying Asset Classes means lower transaction costs, reduced manager selection risk and access to Goldman Sachs Asset Management, L.P. (“GSAM”)’s expertise in replicating index exposure for alternative asset classes. |
Diversification does not protect an investor from market risk and does not ensure a profit.
| 1 | | With the exception of the Hedge Fund Industry Beta asset class, the Fund employs a passive investment approach with respect to achieving exposure to its Underlying Asset Classes. GSAM determines the allocations to each asset class. It then employs a passive investment approach with respect to achieving exposure to those asset classes (other than Hedge Fund Industry Beta). That is, GSAM utilizes an index as a reference for making investments in the asset classes (other than Hedge Fund Industry Beta) and does not attempt to exceed the performance of these indices. |
2
PORTFOLIO RESULTS
Goldman Sachs Retirement Portfolio Completion Fund
Investment Objective and Principal Strategy
The Fund seeks long-term capital appreciation. It is designed to provide retirement investors of all ages (i.e., both those who are approaching or planning for retirement and those who are currently retired) with access to certain asset classes that are typically underrepresented in retirement savings portfolios (the “Underlying Asset Classes”). The Fund may also be used by non-retirement investors seeking exposure to the Underlying Asset Classes. The Underlying Asset Classes are U.S. inflation linked government bonds, global REITs, commodities, emerging markets equities, emerging markets sovereign credit, North American high yield corporate credit and the return and risk patterns of a diversified universe of hedge funds. The Fund’s Investment Adviser believes that the Underlying Asset Classes may provide return, risk and correlation characteristics complementary to a portfolio of more traditional investments, such as large-cap equities or investment grade fixed income. The Fund currently intends to gain exposure to the Underlying Asset Classes through the use of certain securities and derivatives, and its assets will be allocated among the Underlying Asset Classes according to a proprietary rules-based, quantitative methodology. Each Underlying Asset Class (other than the return and risk patterns of a diversified universe of hedge funds) is represented by an Underlying Index. The Investment Adviser currently intends to gain exposure to the return and risk patterns of a diversified universe of hedge funds by investing in the Goldman Sachs Absolute Return Tracker Fund, an affiliated mutual fund also managed by the Investment Adviser.
Portfolio Management Discussion and Analysis
Effective at the close of business on February 27, 2015, the components of the Retirement Portfolio Completion Composite Index changed from the S&P 500® Index (60%) and the Barclays U.S. Aggregate Bond Index (40%) to a blend of the Barclays U.S. Government Inflation-Linked Bond Index (20%), Markit CDX North American High Yield 5-Year Index (20%), Markit CDX Emerging Market 5-Year Index (Net, USD, Unhedged) (20%), HFRX™ Global Hedge Fund Index (Net, USD, Unhedged) (20%), Bloomberg Roll Select Commodity Index (10%), Dow Jones Global Select Real Estate Securities Index (Net, USD, Unhedged) (5%) and FTSE Emerging Index (Net, USD, Unhedged) (5%). There was no change to the Fund’s investment philosophy or strategy in connection with this benchmark change. Below, the Goldman Sachs Quantitative Investment Strategies Team discusses the Fund’s performance and positioning for the 12-month period ended October 31, 2015 (the “Reporting Period”).
| Q | | How did the Fund perform during the Reporting Period? |
| A | | During the Reporting Period, the Fund’s Class A, C, Institutional, IR and R Shares generated average annual total returns, without sales charges, of -5.72%, -6.52%, -5.29%, -5.55% and -5.95%, respectively. These returns compare to the -4.47% average annual total return of the Fund’s new benchmark, the Retirement Portfolio Completion Composite Index (the “RPC Composite Index after 2/27/2015”). |
| | During the period from their inception on July 31, 2015 through October 31, 2015, the Fund’s Class R6 Shares generated a cumulative total return, without sales charges, of -1.04% compared to the -1.43% cumulative total return of the RPC Composite Index. |
| | The RPC Composite Index is composed of the Barclays U.S. Government Inflation-Linked Bond Index (20%), Markit CDX North American High Yield 5-Year Index (20%), Markit CDX Emerging Market 5-Year Index (Net, USD, Unhedged) (20%), HFRX™ Global Hedge Fund Index (Net, USD, Unhedged) (20%), Bloomberg Roll Select Commodity Index (10%), Dow Jones Global Select Real Estate Securities Index (Net, USD, Unhedged) (5%) and FTSE Emerging Index (Net, USD, Unhedged) (5%). |
3
PORTFOLIO RESULTS
| | Prior to the close of business on February 27, 2015, the RPC Composite Index was composed 60% of the S&P 500® Index (with dividends reinvested) and 40% of the Barclays U.S. Aggregate Bond Index (with all income reinvested), which generated an average total return of 4.13% during the Reporting Period. The S&P 500® Index and the Barclays U.S. Aggregate Bond Index generated average total returns of 5.20% and 1.96%, respectively, during the Reporting Period. |
| Q | | What economic and market factors most influenced the Underlying Asset Classes during the Reporting Period? |
| A | | International developed markets equities lost modest ground during the Reporting Period, with central bank policy and currency movements being two of the biggest themes. Both the European Central Bank (“ECB”) and the Bank of Japan employed easy monetary policy as they sought to stimulate economic growth. With interest rates near zero in both regions, both the euro and the yen fell against the U.S. dollar, which we believe helped increase exports, an important source of revenue to companies in Europe and Japan. The euro sank to a 12-year low against the U.S. dollar in March 2015 before rebounding slightly through the remainder of the Reporting Period. The impact of depreciation was noticeable in European corporate earnings reports, many of which were better than expected, and Japanese companies also began to benefit from the weak yen. During the summer of 2015, global equity market volatility heated up, hurting international equity performance. Greece teetered on the brink of financial collapse, while the domestic Chinese equity market began a dramatic correction. In our opinion, further weakening of Chinese economic data and the devaluation of its renminbi also weighed on international developed markets equities. However, they rebounded sharply in October 2015 on further easing from China and on the potential for more easing from the ECB and Bank of Japan. |
| | In the U.S., equities advanced overall, as the U.S. economy generally withstood global economic weakness. U.S. equities started the Reporting Period strongly, generating relatively robust returns into the end of 2014, benefiting from the improvement of the U.S. economy compared to those of most other developed markets countries. U.S. stock performance was also supported by significant merger and acquisition activity, which continued into 2015 and through the end of the Reporting Period, particularly in the information technology and health care sectors. Although the U.S. economy encountered a weak patch during the first quarter of 2015, it rebounded in the second calendar quarter, expanding at a 3.7% rate. Increased global equity market volatility during the summer of 2015 drove a retreat in U.S. equity returns, but they recovered in October 2015 on easing concerns about global growth and indications of continued monetary easing by central banks. Throughout the Reporting Period, market participants speculated about the timing of a potential short-term rate hike by the Federal Reserve (the “Fed”). However, the Fed left rates unchanged during the Reporting Period. |
| | In the emerging markets, stocks declined significantly, with much of the weakness reflecting concerns about slowing economic growth, particularly in China, and the impact of weak oil and commodity prices. Indeed, the International Monetary Fund warned of slower economic growth for 2016, noting the slower growth rates in many emerging economies and the possibility of prolonged weak commodity prices. Oil and commodity prices declined significantly during the Reporting Period. For example, the international Brent crude oil benchmark price, which stood at a high of $115 per barrel in June 2014, fell rather steadily during the Reporting Period to a low of $47 per barrel in January 2015 before rebounding to more than $65 per barrel at the beginning of May 2015 and then stabilizing at slightly less than $50 per barrel for much of the summer and fall of 2015. |
| | Overall, among the other asset classes in which the Fund invests, global real estate investment trusts (“REITs”) and North American high yield corporate credit generated positive returns during the Reporting Period. Emerging markets sovereign credit, Hedge Fund Industry Beta and Treasury inflation-protected securities (“TIPS”) declined during the Reporting Period. |
| Q | | What key factors were responsible for the Fund’s performance between November 1, 2014 and February 27, 2015 (“the initial part of the Reporting Period”)? |
| A | | The Fund underperformed its blended benchmark during the initial part of the Reporting Period, largely as a result of its allocations to commodities and emerging markets sovereign credit. It was also hampered by a lack of exposure to U.S. equities in which the Fund does not invest as part of its investment process. The S&P 500® Total Return Index gained 5.05% during the initial part of the Reporting Period. |
4
PORTFOLIO RESULTS
| Q | | What key factors were responsible for the Fund’s performance between the close of business on February 27, 2015 and October 31, 2015 (“the latter part of the Reporting Period”)? |
| A | | The Fund underperformed the RPC Composite Index during the latter part of the Reporting Period, largely due to its slight overweight position in commodities (accomplished through investments in publicly traded partnerships). On the positive side, the Fund benefited from its strategic allocations to the return and risk patterns of a diversified universe of hedge funds (through an investment in the Goldman Sachs Absolute Return Tracker Fund), TIPS and global REITs. |
| Q | | How did the Fund use derivatives and similar instruments during the Reporting Period? |
| A | | The Fund may use derivatives and similar instruments, in addition to buying securities directly, to gain exposure to the Underlying Asset Classes. During the Reporting Period, the Fund employed indexed credit default swaps to gain exposure to emerging markets sovereign credit and North American high yield corporate credit as well as total return swaps to gain exposure to emerging market equities. The use of derivatives had a positive impact on the Fund’s performance within its allocation to North American high yield corporate credit. Within the Fund’s allocations to emerging markets sovereign credit and emerging market equities, the use of derivatives had a negative impact on the Fund’s performance during the Reporting Period. In addition, during the Reporting Period, the Goldman Sachs Absolute Return Tracker Fund (through which the Fund gains exposure to the return and risk patterns of a diversified universe of hedge funds) used exchange-traded index futures contracts, commodity index-linked structured notes, currency forward contracts and swap contracts to attempt to enhance portfolio return and for hedging purposes. |
| Q | | Were there any notable changes in the Fund’s weightings during the Reporting Period? |
| A | | We allocate the Fund’s assets among the Underlying Asset Classes according to a proprietary rules-based, quantitative methodology and then employ a passive investment approach with respect to achieving exposure to those Underlying Asset Classes (other than the Fund’s exposure to the return and risk patterns of a diversified universe of hedge funds). The Fund’s Underlying Asset Class allocations are rebalanced semi-annually in September and March. During the March 2015 rebalance, the Fund’s assets were allocated 19.3% to emerging markets sovereign credit, 20.0% to the return and risk patterns of a diversified universe of hedge funds (through an investment in the Goldman Sachs Absolute Return Tracker Fund), 20.0% to TIPS and 15.7% to North American high yield corporate credit. In addition, the rebalance resulted in allocations of 11.6% to commodities (accomplished through investments in publicly traded partnerships), 7.2% to global REITs and 6.2% to emerging markets equities. During the September 2015 rebalance, the Fund’s assets were allocated 19.1% to emerging markets sovereign credit, 19.8% to the return and risk patterns of a diversified universe of hedge funds (through an investment in the Goldman Sachs Absolute Return Tracker Fund), 19.8% to TIPS and 17.3% to North American high yield corporate credit. In addition, the rebalance resulted in allocations of 11.0% to commodities (accomplished through investments in publicly traded partnerships), 7.2% to global REITs and 5.8% to emerging markets equities. |
| Q | | How was the Fund positioned at the end of the Reporting Period? |
| A | | At the end of the Reporting Period, the Fund had 19.4% of its net assets in emerging markets sovereign credit and 19.6% in TIPS. It had 20.1% of its net assets in the Goldman Sachs Absolute Return Tracker Fund (through which the Fund gains exposure to the return and risk patterns of a diversified universe of hedge funds) and 16.2% in North American high yield corporate credit. The Fund also had 11.2% of its net assets invested in commodities (accomplished through investments in publicly traded partnerships). In addition, the Fund had 7.8% of its net assets invested in global REITs and 5.9% in emerging markets equities at the end of the Reporting Period. |
| | On December 17, 2015, the Board of Trustees (the “Board”) of the Goldman Sachs Trust approved a proposal to terminate and liquidate the Fund. On or after December 24, 2015, the Fund shall cease its business and may depart from its stated investment objective and policies as it prepares to liquidate and distribute its assets to shareholders. The Fund is expected to be liquidated on or about February 19, 2016. |
5
FUND BASICS
Retirement Portfolio Completion Fund
as of October 31, 2015
| | | | | | | | | | | | | | |
| | PERFORMANCE REVIEW | |
| | | November 1, 2014– October 31, 2015 | | Fund Total Return
(based on NAV)1 | | | RPC Composite Index
(After 2/27/15)2 | | | RPC Composite Index
(Prior to 2/27/15)3 | |
| | Class A | | | -5.72 | % | | | -4.47 | % | | | 4.13 | % |
| | Class C | | | -6.52 | | | | -4.47 | | | | 4.13 | |
| | Institutional | | | -5.29 | | | | -4.47 | | | | 4.13 | |
| | Class IR | | | -5.55 | | | | -4.47 | | | | 4.13 | |
| | | Class R | | | -5.95 | | | | -4.47 | | | | 4.13 | |
| | | | | | | | | | | | | | |
| | | July 31, 2015– October 31, 2015 | | | | | | | | | |
| | | Class R6 | | | -1.04 | % | | | -1.43 | % | | | -0.02 | % |
| | 1 | | The net asset value (“NAV”) represents the net assets of the class of the Fund (ex-dividend) divided by the total number of shares of the class outstanding. The Fund’s performance assumes the reinvestment of dividends and other distributions. The Fund’s performance does not reflect the deduction of any applicable sales charges. |
| | 2 | | Since the close of business on February 27, 2015, the RPC Composite Index is composed of the Barclays U.S. Government Inflation-Linked Bond Index (20%), Markit CDX North American High Yield 5-Year Index (20%), Markit CDX Emerging Market 5-Year Index (Net, USD, Unhedged) (20%), HFRXTM Global Hedge Fund Index (Net, USD, Unhedged) (20%), Bloomberg Roll Select Commodity Index (10%), Dow Jones Global Select Real Estate Securities Index (Net, USD, Unhedged) (5%) and FTSE Emerging Index (Net, USD, Unhedged) (5%). For the fiscal year ended on October 31, 2015, these underlying indices returned -1.50%, 1.75%, -5.13%, -2.05%, -24.55%, 3.48%, and -14.93%, respectively. |
| | 3 | | Prior to the close of business on February 27, 2015, the RPC Composite Index was comprised of the S&P 500 Index (60%) and the Barclays U.S. Aggregate Bond Index (40%). For the fiscal year ended on October 31, 2015, these underlying indices returned 5.20% and 1.96%, respectively. The Index figures do not reflect any deduction for fees, expenses or taxes. It is not possible to invest directly in an index. |
The returns set forth in the table above represent past performance. Past performance does not guarantee future results. The Fund’s investment return and principal value will fluctuate so that an investor’s shares, when redeemed, may be worth more or less than their original cost. Current performance may be lower or higher than the performance quoted above. Please visit our web site at www.GSAMFUNDS.com to obtain the most recent month-end returns. Performance reflects applicable fee waivers and/or expense limitations in effect during the periods shown. In their absence, performance would be reduced. Returns do not reflect the deduction of taxes that a shareholder would pay on Fund distributions or the redemption of Fund shares.
6
FUND BASICS
| | | | | | | | | | | | |
| | STANDARDIZED TOTAL RETURNS4 |
| | | For the period ended 9/30/15 | | 1 Year | | | Since Inception | | | Inception Date |
| | Class A | | | -10.39 | % | | | -3.02 | % | | 9/28/12 |
| | Class C | | | -8.56 | | | | -2.53 | | | 9/28/12 |
| | Institutional | | | -6.57 | | | | -1.40 | | | 9/28/12 |
| | Class IR | | | -6.64 | | | | -1.53 | | | 9/28/12 |
| | Class R6 | | | N/A | | | | -3.24 | | | 7/31/15 |
| | | Class R | | | -7.15 | | | | -2.03 | | | 9/28/12 |
| | 4 | | The Standardized Total Returns are average annual total returns or cumulative total returns (only if the performance period is one year or less) as of the most recent calendar quarter-end. They assume reinvestment of all distributions at NAV. These returns reflect a maximum initial sales charge of 3.75% for Class A Shares and the assumed contingent deferred sales charge for Class C Shares (1% if redeemed within 12 months of purchase). Because Institutional, Class IR, Class R6, and Class R Shares do not involve a sales charge, such a charge is not applied to their Standardized Total Returns. |
The returns set forth in the table above represent past performance. Past performance does not guarantee future results. The Fund’s investment return and principal value will fluctuate so that an investor’s shares, when redeemed, may be worth more or less than their original cost. Current performance may be lower or higher than the performance quoted above. Please visit our web site at www.GSAMFUNDS.com to obtain the most recent month-end returns. Performance reflects applicable fee waivers and/or expense limitations in effect during the periods shown. In their absence, performance would be reduced. Returns do not reflect the deduction of taxes that a shareholder would pay on Fund distributions or the redemption of Fund shares.
| | | | | | | | | | |
| | EXPENSE RATIOS5 | |
| | | | | Net Expense Ratio (Current) | | | Gross Expense Ratio (Before Waivers) | |
| | Class A | | | 0.99 | % | | | 6.09 | % |
| | Class C | | | 1.72 | | | | 6.93 | |
| | Institutional | | | 0.58 | | | | 5.71 | |
| | Class IR | | | 0.73 | | | | 5.94 | |
| | Class R6 | | | 0.56 | | | | 5.69 | |
| | | Class R | | | 1.22 | | | | 6.43 | |
| | 5 | | The expense ratios of the Fund, both current (net of applicable fee waivers and/or expense limitations) and before waivers (gross of applicable fee waivers and/or expense limitations) are as set forth above according to the most recent publicly available Prospectus for the Fund and may differ from the expense ratios disclosed in the Financial Highlights in this report. Pursuant to a contractual arrangement, the Fund’s waivers and/or expense limitations will remain in place through at least July 31, 2016, and prior to such date the investment adviser may not terminate the arrangements without the approval of the Fund’s Board of Trustees. If these arrangements are discontinued in the future, the expense ratios may change without shareholder approval. |
7
FUND BASICS
| | | | | | | | |
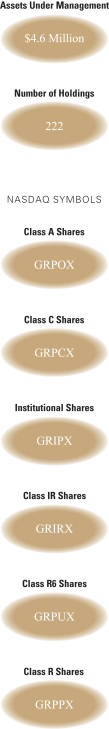
| | TOP TEN HOLDINGS AS OF 10/31/156 |
| | | Holding | | % of Total
Net Assets | | | Line of Business |
| | Goldman Sachs Absolute Return | | | 20.3 | % | | Investment Company |
| | Tracker Fund-Institutional Shares | | | | | | |
| | PowerShares DB Commodity Index | | | 11.3 | | | Exchange Traded Fund |
| | Tracking Fund – PTP | | | | | | |
| | iShares Core MSCI Emerging Markets ETF | | | 3.0 | | | Exchange Traded Fund |
| | Vanguard FTSE Emerging Markets ETF | | | 3.0 | | | Exchange Traded Fund |
| | Simon Property Group, Inc. | | | 0.5 | | | Real Estate Investment Trusts |
| | Public Storage | | | 0.3 | | | Real Estate Investment Trusts |
| | Brookfield Asset Management, Inc. Class A | | | 0.2 | | | Real Estate Management &
Development |
| | Equity Residential | | | 0.2 | | | Real Estate Investment Trusts |
| | Mitsui Fudosan Co. Ltd. | | | 0.2 | | | Real Estate Management &
Development |
| | | Welltower, Inc. | | | 0.2 | | | Real Estate Investment Trusts |
| | 6 | | The top 10 holdings may not be representative of the Fund’s future investments. |
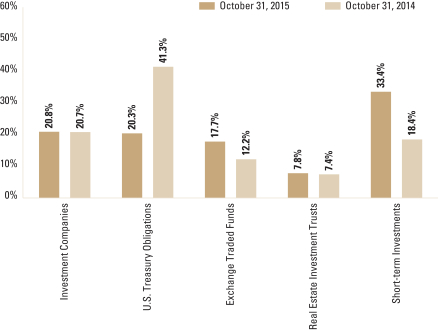
| | 7 | | The percentage shown for each investment category reflects the value of investments in that category as a percentage of Fund’s market value investments. Short-term investments represent repurchase agreements. The graph depicts the Fund’s investments but may not represent the Fund’s market exposure due to the exclusion of certain derivatives, if any, as listed in the Additional Investment Information section of the Schedule of Investments. |
8
PORTFOLIO RESULTS
Index Definitions
The S&P 500® Index is a capitalization-weighted index of 500 stocks. It is designed to measure performance of the broad U.S. economy through changes in the aggregate market value of 500 stocks representing all major industries. The index was developed with a base level of 10 for the 1941-43 base periods.
The S&P 500® Total Return Index is a capitalization-weighted index of 500 stocks. It is designed to measure performance of the broad U.S. economy through changes in the aggregate market value of 500 stocks representing all major industries, with dividends reinvested. The index was developed with a base level of 10 for the 1941-43 base periods.
The Barclays U.S. Aggregate Bond Index covers the U.S. dollar-denominated, investment grade, fixed rate, taxable bond market of SEC-registered securities. It includes bonds from the U.S. Treasury, government-related, corporate, mortgage-backed securities (agency fixed rate and hybrid adjustable-rate pass-through mortgage-backed securities), asset-backed securities and commercial mortgage-backed securities sectors. The Barclays U.S. Aggregate Bond Index is a component of the Barclays U.S. Universal Bond Index in its entirety.
The Dow Jones Global Select Real Estate Securities Index seeks to measure the performance of publicly traded real estate securities. It is designed to serve as a proxy for direct real estate investment, in part by excluding companies whose performance may be driven by factors other than the value of real estate. The Index represents equity real estate investment trusts and real estate operating companies traded globally.
The Barclays U.S. Government Inflation-linked Bond Index includes publicly issued, U.S. Treasury inflation-protected securities that have at least one year remaining to maturity on index rebalancing date, with an issue size equal to or in excess of $500 million.
The Bloomberg Roll Select Commodity Index is a version of the Bloomberg Commodity Index that aims to mitigate the effects of contango on index performance. For each commodity, the index rolls into the futures contracts for each commodity with the most backwardation or least contango.
The Markit CDX North American High Yield 5-Year Index is composed of 100 liquid North American entities with high yield credit ratings that trade in the credit default swap market. It allows market participants to take a view on the overall credit quality and direction of the underlying basket by trading one instrument.
The Markit CDX Emerging Market 5-Year Index is composed of 14 sovereign issuers from the following regions: Latin America, Middle East, Eastern Europe, Africa and Asia. This index allows market participants to take a view on the overall credit quality and direction of the underlying basket by trading one instrument.
9
PORTFOLIO RESULTS
The HFRX™ Global Hedge Fund Index is designed to be representative of the overall composition of the hedge fund universe. It is composed of all eligible hedge fund strategies, including, but not limited to, convertible arbitrage, distressed securities, equity hedge, equity market neutral, event driven, macro, merger arbitrage and relative value arbitrage. The strategies are asset weighted based on the distribution of assets in the hedge fund industry.
The FTSE Emerging Index is a market-capitalization weighted index representing the performance of 22 emerging markets. The index is derived from the FTSE Global Equity Index Series.
10
GOLDMAN SACHS RETIREMENT PORTFOLIO COMPLETION FUND
Performance Summary
October 31, 2015
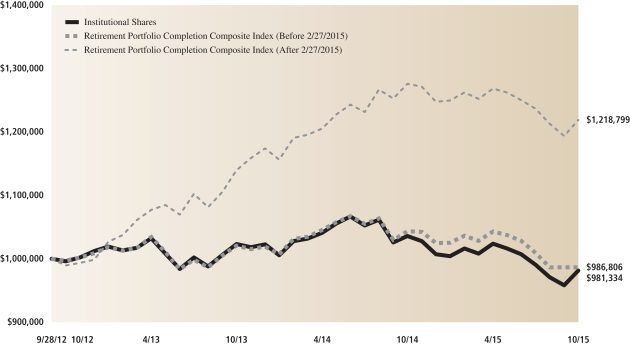
The following graph shows the value, as of October 31, 2015, of a $1,000,000 investment made on September 28, 2012 (commencement of operations) in Institutional Shares at NAV. For comparative purposes, the performance of the Fund’s benchmarks, the Retirement Portfolio Completion Composite Index (Before 2/27/2015) and Retirement Portfolio Completion Composite Index (After 2/27/2015), are shown. This performance data represents past performance and should not be considered indicative of future performance, which will fluctuate with changes in market conditions. These performance fluctuations will cause an investor’s shares, when redeemed, to be worth more or less than their original cost. Performance reflects applicable fee waivers and/or expense limitations in effect during the periods shown and in their absence, performance would be reduced. Returns do not reflect the deduction of taxes that a shareholder would pay on Fund distributions or the redemption of Fund shares. Performance of Class A, Class C, Class R, Class IR and Class R6 Shares will vary from that of Institutional Shares due to differences in class specific fees and any applicable sales charges. In addition to the Investment Adviser’s decisions regarding issuer/industry investment selection and allocation, other factors may affect Fund performance. These factors include, but are not limited to, Fund operating fees and expenses, portfolio turnover and subscription and redemption cash flows affecting the Fund.
|
| Retirement Portfolio Completion Fund’s Lifetime Performance |
Performance of a $1,000,000 Investment, with distributions reinvested, from September 28, 2012 through October 31, 2015.
| | | | | | |
| Average Annual Total Return through October 31, 2015 | | | One Year | | | Since Inception |
Class A (Commenced September 28, 2012) | | | | | | |
Excluding sales charges | | | -5.72% | | | -1.01% |
Including sales charges | | | -9.22% | | | -2.22% |
|
Class C (Commenced September 28, 2012) | | | | | | |
Excluding contingent deferred sales charges | | | -6.52% | | | -1.76% |
Including contingent deferred sales charges | | | -7.46% | | | -1.76% |
|
Institutional Shares (Commenced September 28, 2012) | | | -5.29% | | | -0.61% |
|
Class IR (Commenced September 28, 2012) | | | -5.55% | | | -0.77% |
|
Class R (Commenced September 28, 2012) | | | -5.95% | | | -1.25% |
|
Class R6 (Commenced July 31, 2015) | | | N/A | | | -1.04%* |
|
| * | | Total return for periods of less than one year represents cumulative total return. |
11
GOLDMAN SACHS RETIREMENT PORTFOLIO COMPLETION FUND
Schedule of Investments
October 31, 2015
| | | | | | | | |
Shares | | | Description | | Value | |
| | | | | | | | |
| | Common Stocks – 7.6% | |
| | Real Estate Investment Trusts – 6.5% | |
| | 21 | | | Acadia Realty Trust | | $ | 691 | |
| | 22 | | | Alexandria Real Estate Equities, Inc. | | | 1,974 | |
| | 33 | | | American Campus Communities, Inc. | | | 1,339 | |
| | 44 | | | American Homes 4 Rent Class A | | | 726 | |
| | 47 | | | Apartment Investment & Management Co. Class A | | | 1,842 | |
| | 9 | | | Artis Real Estate Investment Trust | | | 92 | |
| | 655 | | | Ascendas Real Estate Investment Trust | | | 1,115 | |
| | 14 | | | Ashford Hospitality Prime, Inc. | | | 206 | |
| | 37 | | | Ashford Hospitality Trust, Inc. | | | 255 | |
| | 47 | | | AvalonBay Communities, Inc. | | | 8,217 | |
| | 5 | | | Befimmo SA | | | 335 | |
| | 276 | | | Beni Stabili SpA | | | 227 | |
| | 64 | | | Big Yellow Group PLC | | | 739 | |
| | 61 | | | BioMed Realty Trust, Inc. | | | 1,428 | |
| | 6 | | | Boardwalk Real Estate Investment Trust | | | 246 | |
| | 55 | | | Boston Properties, Inc. | | | 6,922 | |
| | 55 | | | Brandywine Realty Trust | | | 742 | |
| | 17 | | | Brixmor Property Group, Inc. | | | 436 | |
| | 234 | | | BWP Trust | | | 535 | |
| | 34 | | | Camden Property Trust | | | 2,509 | |
| | 8 | | | Canadian Apartment Properties REIT | | | 165 | |
| | 6 | | | Canadian Real Estate Investment Trust | | | 195 | |
| | 459 | | | Capital Property Fund | | | 534 | |
| | 651 | | | CapitaLand Commercial Trust Ltd. | | | 653 | |
| | 903 | | | CapitaLand Mall Trust | | | 1,273 | |
| | 24 | | | Care Capital Properties, Inc. | | | 791 | |
| | 51 | | | CBL & Associates Properties, Inc. | | | 744 | |
| | 1,000 | | | Champion REIT | | | 523 | |
| | 167 | | | Charter Hall Retail REIT | | | 502 | |
| | 5 | | | Cofinimmo SA | | | 557 | |
| | 37 | | | Columbia Property Trust, Inc. | | | 919 | |
| | 28 | | | Corporate Office Properties Trust | | | 644 | |
| | 63 | | | Cousins Properties, Inc. | | | 633 | |
| | 51 | | | CubeSmart | | | 1,419 | |
| | 26 | | | DCT Industrial Trust, Inc. | | | 965 | |
| | 92 | | | DDR Corp. | | | 1,546 | |
| | 43 | | | Derwent London PLC | | | 2,568 | |
| | 277 | | | Dexus Property Group | | | 1,521 | |
| | 61 | | | DiamondRock Hospitality Co. | | | 712 | |
| | 49 | | | Digital Realty Trust, Inc. | | | 3,624 | |
| | 42 | | | Douglas Emmett, Inc. | | | 1,283 | |
| | 105 | | | Duke Realty Corp. | | | 2,173 | |
| | 20 | | | DuPont Fabros Technology, Inc. | | | 642 | |
| | 10 | | | EastGroup Properties, Inc. | | | 562 | |
| | 19 | | | Education Realty Trust, Inc. | | | 682 | |
| | 41 | | | Equity Commonwealth* | | | 1,177 | |
| | 24 | | | Equity LifeStyle Properties, Inc. | | | 1,451 | |
| | 25 | | | Equity One, Inc. | | | 664 | |
| | 126 | | | Equity Residential | | | 9,742 | |
| | 24 | | | Essex Property Trust, Inc. | | | 5,291 | |
| | 12 | | | Eurocommercial Properties NV | | | 572 | |
| | 45 | | | Extra Space Storage, Inc. | | | 3,566 | |
| | 26 | | | Federal Realty Investment Trust | | | 3,731 | |
| | 39 | | | FelCor Lodging Trust, Inc. | | | 314 | |
| | |
| | | | | | | | |
| | Common Stocks – (continued) | |
| | Real Estate Investment Trusts – (continued) | |
| | 34 | | | First Industrial Realty Trust, Inc. | | $ | 737 | |
| | 15 | | | Fonciere Des Regions | | | 1,412 | |
| | 49 | | | Franklin Street Properties Corp. | | | 511 | |
| | 11 | | | Gecina SA | | | 1,403 | |
| | 206 | | | General Growth Properties, Inc. | | | 5,964 | |
| | 569 | | | Goodman Group | | | 2,441 | |
| | 665 | | | Goodman Property Trust | | | 542 | |
| | 699 | | | GPT Group | | | 2,367 | |
| | 99 | | | Great Portland Estates PLC | | | 1,356 | |
| | 928 | | | Growthpoint Properties Ltd. | | | 1,700 | |
| | 40 | | | H&R Real Estate Investment Trust | | | 642 | |
| | 293 | | | Hammerson PLC | | | 2,871 | |
| | 162 | | | HCP, Inc. | | | 6,026 | |
| | 30 | | | Healthcare Realty Trust, Inc. | | | 791 | |
| | 24 | | | Hersha Hospitality Trust | | | 576 | |
| | 28 | | | Highwoods Properties, Inc. | | | 1,217 | |
| | 44 | | | Hospitality Properties Trust | | | 1,181 | |
| | 269 | | | Host Hotels & Resorts, Inc. | | | 4,662 | |
| | 56 | | | Hyprop Investments Ltd. | | | 508 | |
| | 49 | | | Inland Real Estate Corp. | | | 434 | |
| | 289 | | | Intu Properties PLC | | | 1,538 | |
| | 172 | | | Investa Office Fund | | | 492 | |
| | 199 | | | Is Gayrimenkul Yatirim Ortakligi AS | | | 102 | |
| | 1 | | | Japan Excellent, Inc. | | | 1,095 | |
| | 1 | | | Japan Real Estate Investment Corp. | | | 4,622 | |
| | 1 | | | Japan Rental Housing Investments, Inc. | | | 669 | |
| | 1 | | | Japan Retail Fund Investment Corp. | | | 1,937 | |
| | 600 | | | Keppel REIT | | | 413 | |
| | 37 | | | Kilroy Realty Corp. | | | 2,436 | |
| | 155 | | | Kimco Realty Corp. | | | 4,149 | |
| | 25 | | | Kite Realty Group Trust | | | 660 | |
| | 210 | | | Kiwi Property Group Ltd. | | | 193 | |
| | 300 | | | KLCC Property Holdings Bhd | | | 490 | |
| | 64 | | | Klepierre | | | 3,031 | |
| | 284 | | | Land Securities Group PLC | | | 5,851 | |
| | 34 | | | LaSalle Hotel Properties | | | 1,000 | |
| | 45 | | | Liberty Property Trust | | | 1,531 | |
| | 11 | | | LTC Properties, Inc. | | | 471 | |
| | 26 | | | Mack-Cali Realty Corp. | | | 566 | |
| | 660 | | | Mapletree Logistics Trust | | | 480 | |
| | 23 | | | Mercialys SA | | | 528 | |
| | 30 | | | Mid-America Apartment Communities, Inc. | | | 2,556 | |
| | 1 | | | Mori Hills REIT Investment Corp. | | | 1,237 | |
| | 53 | | | New York REIT, Inc. | | | 604 | |
| | 1 | | | Nippon Building Fund, Inc. | | | 4,749 | |
| | 1 | | | Orix JREIT, Inc. | | | 1,346 | |
| | 25 | | | Parkway Properties, Inc. | | | 418 | |
| | 22 | | | Pebblebrook Hotel Trust | | | 752 | |
| | 35 | | | Pennsylvania Real Estate Investment Trust | | | 787 | |
| | 46 | | | Piedmont Office Realty Trust, Inc. Class A | | | 891 | |
| | 16 | | | Post Properties, Inc. | | | 956 | |
| | 443 | | | Precinct Properties New Zealand Ltd. | | | 365 | |
| | 184 | | | ProLogis, Inc. | | | 7,862 | |
| | 7 | | | PS Business Parks, Inc. | | | 601 | |
| | 51 | | | Public Storage | | | 11,702 | |
| | |
| | |
| 12 | | The accompanying notes are an integral part of these financial statements. |
GOLDMAN SACHS RETIREMENT PORTFOLIO COMPLETION FUND
| | | | | | | | |
Shares | | | Description | | Value | |
| | | | | | | | |
| | Common Stocks – (continued) | |
| | Real Estate Investment Trusts – (continued) | |
| | 36 | | | Ramco-Gershenson Properties Trust | | $ | 605 | |
| | 28 | | | Regency Centers Corp. | | | 1,903 | |
| | 54 | | | Retail Opportunity Investments Corp. | | | 979 | |
| | 43 | | | RioCan Real Estate Investment Trust | | | 839 | |
| | 54 | | | RLJ Lodging Trust | | | 1,355 | |
| | 1,740 | | | Scentre Group | | | 5,104 | |
| | 220 | | | Segro PLC | | | 1,524 | |
| | 71 | | | Senior Housing Properties Trust | | | 1,078 | |
| | 83 | | | Shaftesbury PLC | | | 1,201 | |
| | 107 | | | Simon Property Group, Inc. | | | 21,556 | |
| | 37 | | | SL Green Realty Corp. | | | 4,389 | |
| | 9 | | | Smart Real Estate Investment Trust | | | 214 | |
| | 11 | | | Sovran Self Storage, Inc. | | | 1,099 | |
| | 574 | | | Starhill Global REIT | | | 332 | |
| | 83 | | | Strategic Hotels & Resorts, Inc.* | | | 1,170 | |
| | 16 | | | Sun Communities, Inc. | | | 1,072 | |
| | 62 | | | Sunstone Hotel Investors, Inc. | | | 897 | |
| | 753 | | | Suntec Real Estate Investment Trust | | | 884 | |
| | 29 | | | Tanger Factory Outlet Centers, Inc. | | | 1,014 | |
| | 19 | | | Taubman Centers, Inc. | | | 1,463 | |
| | 365 | | | The British Land Co. PLC | | | 4,889 | |
| | 1,085 | | | The Link REIT | | | 6,483 | |
| | 50 | | | The Macerich Co. | | | 4,237 | |
| | 99 | | | UDR, Inc. | | | 3,412 | |
| | 34 | | | Unibail-Rodamco SE | | | 9,464 | |
| | 1 | | | United Urban Investment Corp. | | | 1,387 | |
| | 29 | | | Urban Edge Properties | | | 688 | |
| | 8 | | | Vastned Retail NV | | | 388 | |
| | 118 | | | Ventas, Inc. | | | 6,339 | |
| | 64 | | | Vornado Realty Trust | | | 6,435 | |
| | 21 | | | Washington Real Estate Investment Trust | | | 567 | |
| | 34 | | | Weingarten Realty Investors | | | 1,216 | |
| | 130 | | | Welltower, Inc. | | | 8,433 | |
| | 17 | | | Wereldhave NV | | | 1,060 | |
| | 688 | | | Westfield Corp. | | | 4,991 | |
| | 49 | | | Workspace Group PLC | | | 722 | |
| | 56 | | | WP GLIMCHER, Inc. | | | 651 | |
| | 39 | | | Xenia Hotels & Resorts, Inc. | | | 676 | |
| | | | | | | | |
| | | | | | | 298,051 | |
| | |
| | Real Estate Management & Development – 1.1% | |
| | 38 | | | Aeon Mall Co. Ltd. | | | 636 | |
| | 37 | | | Atrium European Real Estate Ltd.* | | | 153 | |
| | 1,700 | | | Ayala Land, Inc. | | | 1,298 | |
| | 200 | | | BR Malls Participacoes SA | | | 580 | |
| | 310 | | | Brookfield Asset Management, Inc. Class A | | | 10,830 | |
| | 28 | | | BUWOG AG* | | | 595 | |
| | 22 | | | CA Immobilien Anlagen AG* | | | 431 | |
| | 222 | | | Capital & Counties Properties PLC | | | 1,519 | |
| | 1,082 | | | Capitaland Ltd. | | | 2,387 | |
| | 66 | | | Castellum AB | | | 988 | |
| | 400 | | | Central Pattana PCL | | | 517 | |
| | 36 | | | Fabege AB | | | 572 | |
| | 22 | | | First Capital Realty, Inc. | | | 326 | |
| | 68 | | | Forest City Enterprises, Inc. Class A* | | | 1,503 | |
| | |
| | | | | | | | |
| | Common Stocks – (continued) | |
| | Real Estate Management & Development – (continued) | |
| | 997 | | | Global Logistic Properties Ltd. | | $ | 1,595 | |
| | 143 | | | Globe Trade Centre SA* | | | 249 | |
| | 131 | | | Grainger PLC | | | 502 | |
| | 593 | | | Hang Lung Properties Ltd. | | | 1,451 | |
| | 487 | | | Hongkong Land Holdings Ltd. | | | 3,652 | |
| | 137 | | | Hulic Co. Ltd. | | | 1,280 | |
| | 172 | | | Hysan Development Co. Ltd. | | | 763 | |
| | 279 | | | Immofinanz AG* | | | 714 | |
| | 68 | | | Kungsleden AB | | | 509 | |
| | 346 | | | Mitsui Fudosan Co. Ltd. | | | 9,416 | |
| | 38 | | | NTT Urban Development Corp. | | | 376 | |
| | 12 | | | PSP Swiss Property AG* | | | 1,044 | |
| | 500 | | | Robinsons Land Corp. | | | 326 | |
| | 4,200 | | | SM Prime Holdings, Inc. | | | 1,932 | |
| | 27 | | | Swiss Prime Site AG* | | | 2,063 | |
| | 162 | | | Tokyu Fudosan Holdings Corp. | | | 1,139 | |
| | 221 | | | Wheelock & Co. Ltd. | | | 1,030 | |
| | | | | | | | |
| | | | | | | 50,376 | |
| | |
| | TOTAL COMMON STOCKS | | | | |
| | (Cost $296,436) | | $ | 348,427 | |
| | |
| | | | | | | | | | | | | | |
Principal
Amount | | | Interest
Rate | | | Maturity
Date | | | Value | |
| | | | | | | | | | | | | | |
| | U.S. Treasury Obligations – 19.9% | |
| United States Treasury Inflation Protected Securities | |
| $ | 16,545 | | | | 2.375 | % | | | 01/15/17 | | | $ | 17,013 | |
| | 39,873 | | | | 0.125 | | | | 04/15/17 | | | | 39,842 | |
| | 13,799 | | | | 2.625 | | | | 07/15/17 | | | | 14,467 | |
| | 15,927 | | | | 1.625 | | | | 01/15/18 | | | | 16,504 | |
| | 43,302 | | | | 0.125 | | | | 04/15/18 | | | | 43,349 | |
| | 14,368 | | | | 1.375 | | | | 07/15/18 | | | | 14,954 | |
| | 13,321 | | | | 2.125 | | | | 01/15/19 | | | | 14,193 | |
| | 42,718 | | | | 0.125 | | | | 04/15/19 | | | | 42,652 | |
| | 14,510 | | | | 1.875 | | | | 07/15/19 | | | | 15,501 | |
| | 17,634 | | | | 1.375 | | | | 01/15/20 | | | | 18,480 | |
| | 29,514 | | | | 0.125 | | | | 04/15/20 | | | | 29,315 | |
| | 29,506 | | | | 1.250 | | | | 07/15/20 | | | | 30,949 | |
| | 33,774 | | | | 1.125 | | | | 01/15/21 | | | | 35,141 | |
| | 31,723 | | | | 0.625 | | | | 07/15/21 | | | | 32,238 | |
| | 36,854 | | | | 0.125 | | | | 01/15/22 | | | | 36,025 | |
| | 36,273 | | | | 0.125 | | | | 07/15/22 | | | | 35,474 | |
| | 36,138 | | | | 0.125 | | | | 01/15/23 | | | | 34,963 | |
| | 35,844 | | | | 0.375 | | | | 07/15/23 | | | | 35,351 | |
| | 35,749 | | | | 0.625 | | | | 01/15/24 | | | | 35,721 | |
| | 35,130 | | | | 0.125 | | | | 07/15/24 | | | | 33,686 | |
| | 35,218 | | | | 0.250 | | | | 01/15/25 | | | | 33,891 | |
| | 30,345 | | | | 2.375 | | | | 01/15/25 | | | | 34,963 | |
| | 13,065 | | | | 0.375 | | | | 07/15/25 | | | | 12,753 | |
| | 20,413 | | | | 2.000 | | | | 01/15/26 | | | | 22,946 | |
| | 16,545 | | | | 2.375 | | | | 01/15/27 | | | | 19,417 | |
| | 14,789 | | | | 1.750 | | | | 01/15/28 | | | | 16,446 | |
| | 20,629 | | | | 3.625 | | | | 04/15/28 | | | | 27,469 | |
| | 13,321 | | | | 2.500 | | | | 01/15/29 | | | | 16,081 | |
| | |
| | |
| The accompanying notes are an integral part of these financial statements. | | 13 |
GOLDMAN SACHS RETIREMENT PORTFOLIO COMPLETION FUND
Schedule of Investments (continued)
October 31, 2015
| | | | | | | | | | | | |
Principal
Amount | | Interest
Rate | | | Maturity
Date | | | Value | |
| | | | | | | | | | | | |
| U.S. Treasury Obligations – (continued) | |
United States Treasury Inflation Protected Securities – (continued) | |
| $23,196 | | | 3.875 | % | | | 04/15/29 | | | $ | 32,152 | |
| 5,371 | | | 3.375 | | | | 04/15/32 | | | | 7,424 | |
| 14,334 | | | 2.125 | | | | 02/15/40 | | | | 17,217 | |
| 21,766 | | | 2.125 | | | | 02/15/41 | | | | 26,296 | |
| 20,040 | | | 0.750 | | | | 02/15/42 | | | | 17,967 | |
| 19,696 | | | 0.625 | | | | 02/15/43 | | | | 17,018 | |
| 19,429 | | | 1.375 | | | | 02/15/44 | | | | 20,179 | |
| 13,157 | | | 0.750 | | | | 02/15/45 | | | | 11,695 | |
| |
| TOTAL U.S. TREASURY OBLIGATIONS | | | | | |
| (Cost $912,885) | | | $ | 909,732 | |
| |
| | | | | | | | |
Shares | | | Description | | Value | |
| | Exchange Traded Funds – 17.4% | |
| | 3,270 | | | iShares Core MSCI Emerging Markets ETF | | $ | 138,452 | |
| | 17 | | | iShares US Real Estate ETF | | | 1,281 | |
| | 34,039 | | | PowerShares DB Commodity Index Tracking Fund – PTP* | | | 517,393 | |
| | 31 | | | SPDR Dow Jones International Real Estate ETF | | | 1,285 | |
| | 3,944 | | | Vanguard FTSE Emerging Markets ETF | | | 137,409 | |
| | |
| | TOTAL EXCHANGE TRADED FUNDS | | | | |
| | (Cost $969,760) | | $ | 795,820 | |
| | |
| | | | | | | | |
| | Investment Company(a) – 20.3% | |
| Goldman Sachs Absolute Return Tracker Fund – Institutional
Shares |
|
| | 102,053 | | | | | $ | 930,725 | |
| | (Cost $932,518) | | | | |
| | |
| | | | | | | | | | | | |
Principal
Amount | | | Interest
Rate | | Maturity
Date | | | Value | |
| | Short-term Investment(b) – 32.8% | |
| | Repurchase Agreements – 32.8% | |
| Joint Repurchase Agreement Account II | |
| $ | 1,500,000 | | | 0.092% | | | 11/02/15 | | | $ | 1,500,000 | |
| | (Cost $1,500,000) | | | | | | | | |
| | |
| | TOTAL INVESTMENTS – 98.0% | | | | | |
| | (Cost $4,611,599) | | | $ | 4,484,704 | |
| | |
| OTHER ASSETS IN EXCESS OF
LIABILITIES – 2.0% |
| | | 91,425 | |
| | |
| | NET ASSETS – 100.0% | | | $ | 4,576,129 | |
| | |
| | |
| The percentage shown for each investment category reflects the value of investments in that category as a percentage of net assets. |
* | | Non-income producing security. |
(a) | | Represents an Affiliated Fund. |
(b) | | Joint repurchase agreement was entered into on October 30, 2015. Additional information appears on page 16. |
| | |
|
Investment Abbreviations: |
ETF | | —Exchange Traded Fund |
PTP | | —Publicly Traded Partnership |
REIT | | —Real Estate Investment Trust |
|
| | |
| 14 | | The accompanying notes are an integral part of these financial statements. |
GOLDMAN SACHS RETIREMENT PORTFOLIO COMPLETION FUND
|
| ADDITIONAL INVESTMENT INFORMATION |
SWAP CONTRACTS — At October 31, 2015, the Fund had the following swap contracts:
CENTRALLY CLEARED CREDIT DEFAULT SWAP CONTRACTS
| | | | | | | | | | | | | | | | | | | | | | |
| | | | | | | | | | | | | | Market Value | |
| Referenced Obligation | | Notional
Amount
(000s) | | Rates
Received
(Paid) | | | Termination
Date | | | Credit
Spread at
October 31,
2015(a) | | | Upfront
Payments
Made (Received) | | | Unrealized
Gain (Loss) | |
Protection Sold: | | | | | | | | | | | | | | | | | | | | | | |
CDX Emerging Market Index 24 | | $882 | | | 1.000 | % | | | 12/20/20 | | | | 3.246 | % | | $ | (101,951 | ) | | $ | 13,212 | |
CDX North America High Yield Index 25 | | 750 | | | 5.000 | | | | 12/20/20 | | | | 4.269 | | | | (1,988 | ) | | | 30,034 | |
| TOTAL | | | | | | | | | | | | | | | | $ | (103,939 | ) | | $ | 43,246 | |
| | (a) | | Credit spread on the Referenced Obligation, together with the term of the swap contract, are indicators of payment/performance risk. The likelihood of a credit event occurring which would require a fund to make a payment or otherwise be required to perform under the swap contract is generally greater as the credit spread and the term of the swap contract increase. |
| | |
| The accompanying notes are an integral part of these financial statements. | | 15 |
GOLDMAN SACHS RETIREMENT PORTFOLIO COMPLETION FUND
Schedule of Investments (continued)
October 31, 2015
|
| ADDITIONAL INVESTMENT INFORMATION (continued) |
JOINT REPURCHASE AGREEMENT ACCOUNT II — At October 31, 2015, the Fund had undivided interests in the Joint Repurchase Agreement Account II, with a maturity date of November 2, 2015, as follows:
| | | | |
| Principal Amount | | Maturity Value | | Collateral Allocation Value |
| $1,500,000 | | $1,500,008 | | $1,533,300 |
REPURCHASE AGREEMENTS — At October 31, 2015, the Principal Amount of the Fund’s interest in the Joint Repurchase Agreement Account II was as follows:
| | | | | | | | |
| Counterparty | | Interest Rate | | | Principal Amounts | |
BNP Paribas Securities Co. | | | 0.090 | % | | $ | 641,367 | |
Citigroup Global Markets, Inc. | | | 0.100 | | | | 330,023 | |
Merrill Lynch & Co., Inc. | | | 0.090 | | | | 528,610 | |
| TOTAL | | | | | | $ | 1,500,000 | |
At October 31, 2015, the Joint Repurchase Agreement Account II was fully collateralized by:
| | | | | | | | |
| Issuer | | Interest Rates | | | Maturity Dates | |
Federal Home Loan Bank | | | 0.625 | % | | | 12/28/16 | |
Federal Home Loan Mortgage Corp. | | | 1.000 to 7.500 | | | | 07/28/17 to 07/01/45 | |
Federal National Mortgage Association | | | 2.000 to 7.500 | | | | 04/01/16 to 11/01/45 | |
Government National Mortgage Association | | | 3.000 to 6.000 | | | | 05/15/18 to 10/20/45 | |
United States Treasury Inflation Protected Securities | | | 1.875 | | | | 07/15/19 | |
U.S. Treasury Notes | | | 1.000 | | | | 09/30/19 | |
United States Treasury Stripped Securities | | | 0.000 | | | | 05/15/34 to 11/15/36 | |
| | |
| 16 | | The accompanying notes are an integral part of these financial statements. |
GOLDMAN SACHS RETIREMENT PORTFOLIO COMPLETION FUND
Statement of Assets and Liabilities
October 31, 2015
| | | | | | |
| | | | | | |
| | Assets: | | | | |
| | Investments of unaffiliated issuers, at value (cost $2,179,081) | | $ | 2,053,979 | |
| | Investments of affiliated issuers, at value (cost $932,518) | | | 930,725 | |
| | Repurchase agreement, at value which equals cost | | | 1,500,000 | |
| | Cash | | | 37,477 | |
| | Foreign currencies, at value (cost $2,740) | | | 2,738 | |
| | Variation margin on certain derivative contracts | | | 2,059 | |
| | Receivables: | | | | |
| | Collateral on certain derivative contracts(a) | | | 186,026 | |
| | Dividends and interest | | | 2,532 | |
| | Fund shares sold | | | 538 | |
| | Reimbursement from investment adviser | | | 488 | |
| | Other assets | | | 4,801 | |
| | Total assets | | | 4,721,363 | |
| | | | | | |
| | Liabilities: | | | | |
| | Payables: | | | | |
| | Fund shares redeemed | | | 61,852 | |
| | Management fees | | | 1,231 | |
| | Distribution and Service fees and Transfer Agency fees | | | 216 | |
| | Accrued expenses | | | 81,935 | |
| | Total liabilities | | | 145,234 | |
| | | | | | |
| | Net Assets: | | | | |
| | Paid-in capital | | | 5,013,834 | |
| | Undistributed net investment income | | | 286,963 | |
| | Accumulated net realized loss | | | (640,995 | ) |
| | Net unrealized loss | | | (83,673 | ) |
| | | NET ASSETS | | $ | 4,576,129 | |
| | | Net Assets: | | | | |
| | | Class A | | $ | 118,672 | |
| | | Class C | | | 9,865 | |
| | | Institutional | | | 4,418,295 | |
| | | Class IR | | | 9,781 | |
| | | Class R | | | 9,616 | |
| | | Class R6 | | | 9,900 | |
| | | Total Net Assets | | $ | 4,576,129 | |
| | | Shares Outstanding $0.001 par value (unlimited shares authorized): | | | | |
| | | Class A | | | 12,625 | |
| | | Class C | | | 1,074 | |
| | | Institutional | | | 465,789 | |
| | | Class IR | | | 1,034 | |
| | | Class R | | | 1,031 | |
| | | Class R6 | | | 1,044 | |
| | | Net asset value, offering and redemption price per share:(b) | | | | |
| | | Class A | | | $9.40 | |
| | | Class C | | | 9.18 | |
| | | Institutional | | | 9.49 | |
| | | Class IR | | | 9.46 | |
| | | Class R | | | 9.33 | |
| | | Class R6 | | | 9.48 | |
| | (a) | | Represents initial margin on swaps transactions. |
| | (b) | | Maximum public offering price per share for Class A Shares is $9.77. At redemption, Class C Shares may be subject to a contingent deferred sales charge, assessed on the amount equal to the lesser of the current net asset value (“NAV”) or the original purchase price of the shares. |
| | |
| The accompanying notes are an integral part of these financial statements. | | 17 |
GOLDMAN SACHS RETIREMENT PORTFOLIO COMPLETION FUND
Statement of Operations
For the Fiscal Year Ended October 31, 2015
| | | | | | |
| | | | | | |
| | Investment income: | |
| | Dividends — unaffiliated issuers (net of foreign withholding taxes of $756) | | $ | 20,377 | |
| | Dividends — affiliated issuers | | | 6,784 | |
| | Interest | | | 8,193 | |
| | Total investment income | | | 35,354 | |
| | | | | | |
| | Expenses: | |
| | Professional fees | | | 83,048 | |
| | Custody, accounting and administrative services | | | 76,600 | |
| | Printing and mailing costs | | | 53,181 | |
| | Registration fees | | | 39,358 | |
| | Management fees | | | 31,269 | |
| | Trustee fees | | | 27,569 | |
| | Transfer Agency fees(a) | | | 3,042 | |
| | Distribution and Service fees(a) | | | 488 | |
| | Other | | | 8,829 | |
| | Total expenses | | | 323,384 | |
| | Less — expense reductions | | | (293,964 | ) |
| | Net expenses | | | 29,420 | |
| | NET INVESTMENT INCOME | | | 5,934 | |
| | | | | | |
| | Realized and unrealized gain (loss): | |
| | Capital gain distributions from Affiliated Underlying Funds | | | 55,299 | |
| | Net realized gain (loss) from: | | | | |
| | Investments — unaffiliated issuers | | | (306,715 | ) |
| | Investments — affiliated issuers | | | (16,474 | ) |
| | Swap contracts | | | (83,932 | ) |
| | Forward foreign currency exchange contracts | | | (128 | ) |
| | Foreign currency transactions | | | (492 | ) |
| | Net change in unrealized gain (loss) on: | | | | |
| | Investments — unaffiliated issuers (including the effects of the net change in the foreign capital gains tax liability of $24) | | | (29,300 | ) |
| | Investments — affiliated issuers | | | (22,041 | ) |
| | Swap contracts | | | 2,147 | |
| | Net realized and unrealized loss | | | (401,636 | ) |
| | NET DECREASE IN NET ASSETS RESULTING FROM OPERATIONS | | $ | (325,702 | ) |
| | (a) | | Class specific Distribution and Service and Transfer Agency fees were as follows: |
| | | | | | | | | | | | | | | | | | | | | | | | | | | | | | | | | | |
| Distribution and Service Fees | | | Transfer Agency Fees | |
Class A | | | Class C | | | Class R | | | Class A | | | Class C | | | Institutional | | | Class IR | | | Class R | | | Class R6(b) | |
| $ | 338 | | | $ | 100 | | | $ | 50 | | | $ | 257 | | | $ | 18 | | | $ | 2,708 | | | $ | 40 | | | $ | 18 | | | $ | 1 | |
| | (b) | | Commenced operations on July 31, 2015. |
| | |
| 18 | | The accompanying notes are an integral part of these financial statements. |
GOLDMAN SACHS RETIREMENT PORTFOLIO COMPLETION FUND
Statements of Changes in Net Assets
| | | | | | | | | | |
| | | | | For the Fiscal
Year Ended
October 31, 2015 | | | For the Fiscal
Year Ended
October 31, 2014 | |
| | From operations: | |
| | Net investment income | | $ | 5,934 | | | $ | 17,249 | |
| | Net realized gain (loss) | | | (352,442 | ) | | | 115,195 | |
| | Net change in unrealized loss | | | (49,194 | ) | | | (40,030 | ) |
| | Net increase (decrease) in net assets resulting from operations | | | (395,702 | ) | | | 92,414 | |
| | | | | | | | | | |
| | Distributions to shareholders: | |
| | From net investment income | | | | | | | | |
| | Institutional Shares | | | (14,679 | ) | | | (507 | ) |
| | Class IR Shares | | | (15 | ) | | | — | |
| | From net realized gains | | | | | | | | |
| | Class A Shares | | | (2,257 | ) | | | (1,583 | ) |
| | Class C Shares | | | (162 | ) | | | (144 | ) |
| | Institutional Shares | | | (112,465 | ) | | | (77,239 | ) |
| | Class IR Shares | | | (491 | ) | | | (439 | ) |
| | Class R Shares | | | (160 | ) | | | (144 | ) |
| | Total distributions to shareholders | | | (130,229 | ) | | | (80,056 | ) |
| | | | | | | | | | |
| | From share transactions: | |
| | Proceeds from sales of shares | | | 1,648,369 | | | | 3,847,729 | |
| | Reinvestment of distributions | | | 130,229 | | | | 80,056 | |
| | Cost of shares redeemed | | | (3,996,276 | ) | | | (688,518 | ) |
| | Net increase (decrease) in net assets resulting from share transactions | | | (2,217,678 | ) | | | 3,239,267 | |
| | TOTAL INCREASE (DECREASE) | | | (2,743,609 | ) | | | 3,251,625 | |
| | | | | | | | | | |
| | Net assets: | |
| | Beginning of year | | | 7,319,738 | | | | 4,068,113 | |
| | End of year | | $ | 4,576,129 | | | $ | 7,319,738 | |
| | Undistributed net investment income | | $ | 286,963 | | | $ | 15,134 | |
| | |
| The accompanying notes are an integral part of these financial statements. | | 19 |
GOLDMAN SACHS RETIREMENT PORTFOLIO COMPLETION FUND
Financial Highlights
Selected Data for a Share Outstanding Throughout Each Year
| | | | | | | | | | | | | | | | | | | | | | | | | | | | | | |
| | | | | | | | Income (loss) from
investment operations | | | Distributions
to shareholders | |
| | | Year - Share Class | |
Net asset
value,
beginning
of period | | | Net
investment
income (loss)(a) | | | Net realized
and unrealized
gain (loss) | | | Total from
investment
operations | | | From net
investment
income | | | From net
realized
gains | | | Total
distributions | |
| | FOR THE FISCAL YEARS ENDED OCTOBER 31, | |
| | 2015 - A | | $ | 10.13 | | | $ | (0.03 | ) | | $ | (0.54 | ) | | $ | (0.57 | ) | | $ | — | | | $ | (0.16 | ) | | $ | (0.16 | ) |
| | 2015 - C | | | 9.98 | | | | (0.10 | ) | | | (0.54 | ) | | | (0.64 | ) | | | — | | | | (0.16 | ) | | | (0.16 | ) |
| | 2015 - Institutional | | | 10.20 | | | | 0.01 | | | | (0.54 | ) | | | (0.53 | ) | | | (0.02 | ) | | | (0.16 | ) | | | (0.18 | ) |
| | 2015 - IR | | | 10.18 | | | | (0.02 | ) | | | (0.54 | ) | | | (0.56 | ) | | | — | (e) | | | (0.16 | ) | | | (0.16 | ) |
| | 2015 - R | | | 10.08 | | | | (0.05 | ) | | | (0.54 | ) | | | (0.59 | ) | | | — | | | | (0.16 | ) | | | (0.16 | ) |
| | 2015 - R6 (Commenced July 31, 2015) | | | 9.58 | | | | — | (e) | | | (0.10 | ) | | | (0.10 | ) | | | — | | | | — | | | | — | |
| | 2014 - A | | | 10.18 | | | | (0.01 | ) | | | 0.10 | | | | 0.09 | | | | — | | | | (0.14 | ) | | | (0.14 | ) |
| | 2014 - C | | | 10.10 | | | | (0.09 | ) | | | 0.11 | | | | 0.02 | | | | — | | | | (0.14 | ) | | | (0.14 | ) |
| | 2014 - Institutional | | | 10.21 | | | | 0.03 | | | | 0.10 | | | | 0.13 | | | | — | (e) | | | (0.14 | ) | | | (0.14 | ) |
| | 2014 - IR | | | 10.20 | | | | 0.01 | | | | 0.11 | | | | 0.12 | | | | — | | | | (0.14 | ) | | | (0.14 | ) |
| | 2014 - R | | | 10.16 | | | | (0.04 | ) | | | 0.10 | | | | 0.06 | | | | — | | | | (0.14 | ) | | | (0.14 | ) |
| | 2013 - A | | | 9.95 | | | | (0.02 | ) | | | 0.25 | | | | 0.23 | | | | — | | | | — | | | | — | |
| | 2013 - C | | | 9.95 | | | | (0.10 | ) | | | 0.25 | | | | 0.15 | | | | — | | | | — | | | | — | |
| | 2013 - Institutional | | | 9.96 | | | | 0.02 | | | | 0.24 | | | | 0.26 | | | | (0.01 | ) | | | — | | | | (0.01 | ) |
| | 2013 - IR | | | 9.96 | | | | — | (e) | | | 0.25 | | | | 0.25 | | | | (0.01 | ) | | | — | | | | (0.01 | ) |
| | 2013 - R | | | 9.95 | | | | (0.05 | ) | | | 0.26 | | | | 0.21 | | | | — | | | | — | | | | — | |
| | | | | | | | | | | | | | | | | | | | | | | | | | | | | | |
| | FOR THE PERIOD ENDED OCTOBER 31, | |
| | 2012 - A (Commenced September 28, 2012) | | | 10.00 | | | | — | (e) | | | (0.05 | ) | | | (0.05 | ) | | | — | | | | — | | | | — | |
| | 2012 - C (Commenced September 28, 2012) | | | 10.00 | | | | — | (e) | | | (0.05 | ) | | | (0.05 | ) | | | — | | | | — | | | | — | |
| | 2012 - Institutional (Commenced September 28, 2012) | | | 10.00 | | | | 0.01 | | | | (0.05 | ) | | | (0.04 | ) | | | — | | | | — | | | | — | |
| | 2012 - IR (Commenced September 28, 2012) | | | 10.00 | | | | 0.01 | | | | (0.05 | ) | | | (0.04 | ) | | | — | | | | — | | | | — | |
| | 2012 - R (Commenced September 28, 2012) | | | 10.00 | | | | — | (e) | | | (0.05 | ) | | | (0.05 | ) | | | — | | | | — | | | | — | |
| | (a) | | Calculated based on the average shares outstanding methodology. |
| | (b) | | Assumes investment at the NAV at the beginning of the year, reinvestment of all dividends and distributions, a complete redemption of the investment at the NAV at the end of the year and no sales or redemption charges. Total returns would be reduced if a sales or redemption charge was taken into account. Returns do not reflect the deduction of taxes that a shareholder would pay on Fund distributions or the redemption of Fund shares. Total returns for periods less than one full year are not annualized. |
| | (c) | | Expense ratios exclude the expenses of the Underlying Funds in which the Portfolio invests. |
| | (d) | | The Fund’s portfolio turnover rate is calculated in accordance with regulatory requirements, without regard to transactions involving short term investments and certain derivatives. If such transactions were included, the Fund’s portfolio turnover rate may be higher. |
| | (e) | | Amount is less than $0.005 per share. |
| | |
| 20 | | The accompanying notes are an integral part of these financial statements. |
GOLDMAN SACHS RETIREMENT PORTFOLIO COMPLETION FUND
| | | | | | | | | | | | | | | | | | | | | | | | | | | | | | | | | | | | | | | | |
| | | | | | | | | | | | | |
| | | Net asset
value, end
of period | | | | | Total
return(b) | | | | | Net assets,
end of
period
(in 000s) | | | | | Ratio of
net expenses
to average
net assets(c) | | | | | Ratio of
total expenses
to average
net assets(c) | | | | | Ratio of
net investment
income (loss)
to average
net assets | | | | | Portfolio
turnover
rate(d) | |
| | | | | | | | | | | | | | | | | | | | | | | | | | | | | | | | | | | | | | | | |
| | $ | 9.40 | | | | | | (5.72 | )% | | | | $ | 119 | | | | | | 0.81 | % | | | | | 5.19 | % | | | | | (0.32 | )% | | | | | 41 | % |
| | | 9.18 | | | | | | (6.52 | ) | | | | | 10 | | | | | | 1.55 | | | | | | 5.95 | | | | | | (1.04 | ) | | | | | 41 | |
| | | 9.49 | | | | | | (5.29 | ) | | | | | 4,418 | | | | | | 0.41 | | | | | | 4.63 | | | | | | 0.10 | | | | | | 41 | |
| | | 9.46 | | | | | | (5.55 | ) | | | | | 10 | | | | | | 0.58 | | | | | | 4.59 | | | | | | (0.21 | ) | | | | | 41 | |
| | | 9.33 | | | | | | (5.95 | ) | | | | | 10 | | | | | | 1.06 | | | | | | 5.46 | | | | | | (0.55 | ) | | | | | 41 | |
| | | 9.48 | | | | | | (1.04 | ) | | | | | 10 | | | | | | 0.48 | (f) | | | | | 6.92 | (f) | | | | | 0.16 | (f) | | | | | 41 | |
| | | 10.13 | | | | | | 0.95 | | | | | | 145 | | | | | | 0.81 | | | | | | 5.96 | | | | | | (0.07 | ) | | | | | 19 | |
| | | 9.98 | | | | | | 0.25 | | | | | | 10 | | | | | | 1.54 | | | | | | 6.80 | | | | | | (0.87 | ) | | | | | 19 | |
| | | 10.20 | | | | | | 1.25 | | | | | | 7,122 | | | | | | 0.40 | | | | | | 5.58 | | | | | | 0.27 | | | | | | 19 | |
| | | 10.18 | | | | | | 1.24 | | | | | | 32 | | | | | | 0.55 | | | | | | 5.81 | | | | | | 0.10 | | | | | | 19 | |
| | | 10.08 | | | | | | 0.65 | | | | | | 10 | | | | | | 1.04 | | | | | | 6.30 | | | | | | (0.37 | ) | | | | | 19 | |
| | | 10.18 | | | | | | 2.35 | | | | | | 100 | | | | | | 0.75 | | | | | | 24.14 | | | | | | (0.20 | ) | | | | | 16 | |
| | | 10.10 | | | | | | 1.51 | | | | | | 10 | | | | | | 1.49 | | | | | | 22.53 | | | | | | (0.96 | ) | | | | | 16 | |
| | | 10.21 | | | | | | 2.75 | | | | | | 3,917 | | | | | | 0.35 | | | | | | 21.63 | | | | | | 0.17 | | | | | | 16 | |
| | | 10.20 | | | | | | 2.51 | | | | | | 31 | | | | | | 0.49 | | | | | | 23.98 | | | | | | 0.01 | | | | | | 16 | |
| | | 10.16 | | | | | | 2.11 | | | | | | 10 | | | | | | 1.00 | | | | | | 22.05 | | | | | | (0.47 | ) | | | | | 16 | |
| | | | | | | | | | | | | | | | | | | | | | | | | | | | | | | | | | | | | | | | |
| | | | | | | | | | | | | | | | | | | | | | | | | | | | | | | | | | | | | | | | |
| | | 9.95 | | | | | | (0.50 | ) | | | | | 10 | | | | | | 0.73 | (f) | | | | | 22.73 | (f) | | | | | 0.37 | (f) | | | | | 1 | |
| | | 9.95 | | | | | | (0.50 | ) | | | | | 10 | | | | | | 1.47 | (f) | | | | | 23.46 | (f) | | | | | (0.37 | )(f) | | | | | 1 | |
| | | 9.96 | | | | | | (0.40 | ) | | | | | 2,948 | | | | | | 0.34 | (f) | | | | | 22.33 | (f) | | | | | 0.77 | (f) | | | | | 1 | |
| | | 9.96 | | | | | | (0.40 | ) | | | | | 10 | | | | | | 0.52 | (f) | | | | | 22.49 | (f) | | | | | 0.60 | (f) | | | | | 1 | |
| | | 9.95 | | | | | | (0.50 | ) | | | | | 10 | | | | | | 0.99 | (f) | | | | | 22.98 | (f) | | | | | 0.12 | (f) | | | | | 1 | |
| | |
| The accompanying notes are an integral part of these financial statements. | | 21 |
GOLDMAN SACHS RETIREMENT PORTFOLIO COMPLETION FUND
Notes to Financial Statements
October 31, 2015
Goldman Sachs Trust (the “Trust”) is a Delaware statutory trust registered under the Investment Company Act of 1940, as amended (the “Act”), as an open-end management investment company. Goldman Sachs Retirement Portfolio Completion Fund (the “Fund”) is a non-diversified fund and currently offers six classes of shares: Class A, Class C, Institutional, Class IR, Class R and Class R6 Shares. Class R6 Shares commenced operations on July 31, 2015.
Class A Shares are sold with a front-end sales charge of up to 3.75%. Class C Shares are sold with a contingent deferred sales charge (“CDSC”) of 1.00% which is imposed on redemptions made within 12 months of purchase. Institutional, Class IR, Class R and Class R6 Shares are not subject to a sales charge.
Goldman Sachs Asset Management, L.P. (“GSAM”), an affiliate of Goldman, Sachs & Co. (“Goldman Sachs”), serves as investment adviser to the Fund pursuant to a management agreement (the “Agreement”) with the Trust.
|
| 2. SIGNIFICANT ACCOUNTING POLICIES |
The financial statements have been prepared in accordance with accounting principles generally accepted in the United States of America (“GAAP”) and require management to make estimates and assumptions that may affect the reported amounts and disclosures. Actual results may differ from those estimates and assumptions.
A. Investment Valuation — The Fund’s valuation policy is to value investments at fair value.
B. Investment Income and Investments — Investment income includes interest income and dividend income, net of any foreign withholding taxes, less any amounts reclaimable. Interest income is accrued daily and adjusted for amortization of premiums and accretion of discounts. Dividend income is recognized on ex-dividend date or, for certain foreign securities, as soon as such information is obtained subsequent to the ex-dividend date. Investment transactions are reflected on trade date. Realized gains and losses are calculated using identified cost. Investment transactions are recorded on the following business day for daily net asset value (“NAV”) calculations. Any foreign capital gains tax is accrued daily based upon net unrealized gains, and is payable upon sale of such investments. Distributions received from the Fund’s investments in United States (“U.S.”) real estate investment trusts (“REITs”) may be characterized as ordinary income, net capital gain or a return of capital. A return of capital is recorded by the Funds as a reduction to the cost basis of the REIT.
For derivative contracts, realized gains and losses are recorded upon settlement of the contract. Upfront payments, if any, are made or received upon entering into a swap agreement and are reflected in the Statement of Assets and Liabilities. Upfront payments are recognized over the contract’s term/event as realized gains or losses, with the exception of forward starting interest rate swaps whose realized gains or losses are recognized from the effective start date. For securities with paydown provisions, principal payments received are treated as a proportionate reduction to the cost basis of the securities, and excess or shortfall amounts are recorded as income. For treasury inflation protected securities (“TIPS”), adjustments to principal due to inflation/deflation are reflected as increases/decreases to interest income with a corresponding adjustment to cost.
C. Class Allocations and Expenses — Investment income, realized and unrealized gain (loss), and non-class specific expenses of the Fund are allocated daily based upon the proportion of net assets of each class. Non-class specific expenses directly incurred by the Fund are charged to the Fund, while such expenses incurred by the Trust are allocated across the applicable Funds on a straight-line and/or pro-rata basis depending upon the nature of the expenses. Class specific expenses, where applicable, are borne by the respective share classes and include Distribution and Service, Transfer Agency and Service and Shareholder Administration fees.
D. Federal Taxes and Distributions to Shareholders — It is the Fund’s policy to comply with the requirements of the Internal Revenue Code of 1986, as amended (the “Code”), applicable to regulated investment companies (mutual funds) and to distribute each year substantially all of its investment company taxable income and capital gains to its shareholders. Accordingly, the Fund is not required to make any provisions for the payment of federal income tax. Distributions to shareholders are recorded on the ex-dividend date. Income and capital gains distributions, if any, are declared and paid annually.
22
GOLDMAN SACHS RETIREMENT PORTFOLIO COMPLETION FUND
|
| 2. SIGNIFICANT ACCOUNTING POLICIES (continued) |
Net capital losses are carried forward to future fiscal years and may be used to the extent allowed by the Code to offset any future capital gains. Losses that are carried forward will retain their character as either short-term or long-term capital losses. Utilization of capital loss carryforwards will reduce the requirement of future capital gains distributions.
The characterization of distributions to shareholders for financial reporting purposes is determined in accordance with federal income tax rules, which may differ from GAAP. The source of the Fund’s distributions may be shown in the accompanying financial statements as either from net investment income, net realized gain or capital. Certain components of the Fund’s net assets on the Statement of Assets and Liabilities reflect permanent GAAP/tax differences based on the appropriate tax character.
E. Foreign Currency Translation — The accounting records and reporting currency of the Fund is maintained in U.S. dollars. Assets and liabilities denominated in foreign currencies are translated into U.S. dollars using the current exchange rates at the close of each business day. The effect of changes in foreign currency exchange rates on investments is included within net realized and unrealized gain (loss) on investments. Changes in the value of other assets and liabilities as a result of fluctuations in foreign exchange rates are included in the Statement of Operations within net change in unrealized gain (loss) on foreign currency translations. Transactions denominated in foreign currencies are translated into U.S. dollars on the date the transaction occurred, the effects of which are included within net realized gain (loss) on foreign currency transactions.
|
| 3. INVESTMENTS AND FAIR VALUE MEASUREMENTS |
The fair value of a financial instrument is the amount that would be received to sell an asset or paid to transfer a liability in an orderly transaction between market participants at the measurement date (i.e., the exit price). GAAP establishes a fair value hierarchy that prioritizes the inputs to valuation techniques used to measure fair value. The hierarchy gives the highest priority to unadjusted quoted prices in active markets for identical assets or liabilities (Level 1 measurements) and the lowest priority to unobservable inputs (Level 3 measurements). The levels used for classifying investments are not necessarily an indication of the risk associated with investing in these investments. The three levels of the fair value hierarchy are described below:
Level 1 — Unadjusted quoted prices in active markets that are accessible at the measurement date for identical, unrestricted assets or liabilities;
Level 2 — Quoted prices in markets that are not active or financial instruments for which significant inputs are observable (including, but not limited to, quoted prices for similar investments, interest rates, foreign exchange rates, volatility and credit spreads), either directly or indirectly;
Level 3 — Prices or valuations that require significant unobservable inputs (including GSAM’s assumptions in determining fair value measurement).
Changes in valuation techniques may result in transfers into or out of an assigned level within the hierarchy. In accordance with the Fund’s policy, transfers between different levels of the fair value hierarchy are deemed to have occurred as of the beginning of the reporting period.
The Board of Trustees (“Trustees”) has approved Valuation Procedures that govern the valuation of the portfolio investments held by the Fund, including investments for which market quotations are not readily available. The Trustees have delegated to GSAM day-to-day responsibility for implementing and maintaining internal controls and procedures related to the valuation of the Fund’s portfolio investments. To assess the continuing appropriateness of pricing sources and methodologies, GSAM regularly performs price verification procedures and issues challenges as necessary to third party pricing vendors or brokers, and any differences are reviewed in accordance with the Valuation Procedures.
A. Level 1 and Level 2 Fair Value Investments — The valuation techniques and significant inputs used in determining the fair values for investments classified as Level 1 and Level 2 are as follows:
Equity Securities — Equity securities and investment companies traded on a U.S. securities exchange or the NASDAQ system, or those located on certain foreign exchanges, including but not limited to the Americas, are valued daily at their last sale price or official closing price on the principal exchange or system on which they are traded. If there is no sale or official closing price or
23
GOLDMAN SACHS RETIREMENT PORTFOLIO COMPLETION FUND
Notes to Financial Statements (continued)
October 31, 2015
|
| 3. INVESTMENTS AND FAIR VALUE MEASUREMENTS (continued) |
such price is believed by GSAM to not represent fair value, equity securities and exchange traded investment companies are valued at the last bid price for long positions and at the last ask price for short positions. Investments in investment companies (other than those that are exchange traded) are valued at the NAV on the valuation date. To the extent these investments are actively traded, they are classified as Level 1 of the fair value hierarchy, otherwise they are generally classified as Level 2.
Unlisted equity securities for which market quotations are available are valued at the last sale price on the valuation date, or if no sale occurs, at the last bid price. Securities traded on certain foreign securities exchanges are valued daily at fair value determined by an independent fair value service (if available) under Valuation Procedures approved by the Trustees and consistent with applicable regulatory guidance. The independent fair value service takes into account multiple factors including, but not limited to, movements in the securities markets, certain depositary receipts, futures contracts and foreign currency exchange rates that have occurred subsequent to the close of the foreign securities exchange. These investments are generally classified as Level 2 of the fair value hierarchy.
Underlying Funds — Underlying Funds (“Underlying Funds”) include other investment companies and exchange-traded funds (“ETFs”). Investments in the Underlying Funds (except ETFs) are valued at the NAV per share of the Institutional Share class on the day of valuation. ETFs are valued daily at the last sale price or official closing price on the principal exchange or system on which the investment is traded. Because the Fund invests in Underlying Funds that fluctuate in value, the Fund’s shares will correspondingly fluctuate in value. To the extent these investments are actively traded, they are classified as Level 1 of the fair value hierarchy, otherwise they are generally classified as Level 2.
Debt Securities — Debt securities for which market quotations are readily available are valued daily on the basis of quotations supplied by dealers or an independent pricing service approved by the Trustees. The pricing services may use valuation models or matrix pricing, which consider: (i) yield or price with respect to bonds that are considered comparable in characteristics such as rating, interest rate and maturity date or (ii) quotations from securities dealers to determine current value. Short-term debt obligations that mature in sixty days or less and that do not exhibit signs of credit deterioration are valued at amortized cost, which approximates fair value. With the exception of treasury securities of G8 countries (not held in money market funds), which are generally classified as Level 1, these investments are generally classified as Level 2 of the fair value hierarchy.
i. Treasury Inflation Protected Securities — TIPS are treasury securities in which the principal amount is adjusted daily to keep pace with inflation, as measured by the U.S. Consumer Pricing Index for Urban Consumers. The repayment of the original bond principal upon maturity is guaranteed by the full faith and credit of the U.S. Government.
Derivative Contracts — A derivative is an instrument whose value is derived from underlying assets, indices, reference rates or a combination of these factors. The Fund enters into derivative transactions to hedge against changes in interest rates, securities prices, and/or currency exchange rates, to increase total return, or to gain access to certain markets or attain exposure to other underliers.
Exchange-traded derivatives, including futures and options contracts, are valued at the last sale or settlement price and typically fall within Level 1 of the fair value hierarchy. Over-the-counter (“OTC”) and centrally cleared derivatives are valued using market transactions and other market evidence, including market-based inputs to models, calibration to market-clearing transactions, broker or dealer quotations, or other alternative pricing sources. Where models are used, the selection of a particular model to value OTC and centrally cleared derivatives depends upon the contractual terms of, and specific risks inherent in, the instrument, as well as the availability of pricing information in the market. Valuation models require a variety of inputs, including contractual terms, market prices, yield curves, credit curves, measures of volatility, voluntary and involuntary prepayment rates, loss severity rates and correlations of such inputs. For OTC and centrally cleared derivatives that trade in liquid markets, model inputs can generally be verified and model selection does not involve significant management judgment. OTC and centrally cleared derivatives are classified within Level 2 of the fair value hierarchy when significant inputs are corroborated by market evidence.
24
GOLDMAN SACHS RETIREMENT PORTFOLIO COMPLETION FUND
|
| 3. INVESTMENTS AND FAIR VALUE MEASUREMENTS (continued) |
i. Swap Contracts — Bilateral swap contracts are agreements in which the Fund and a counterparty agree to exchange periodic payments on a specified notional amount or make a net payment upon termination. Bilateral swap transactions are privately negotiated in the OTC market and payments are settled through direct payments between the Fund and the counterparty. By contrast, certain swap transactions are subject to mandatory central clearing. These swaps are executed through a derivatives clearing member (“DCM”), acting in an agency capacity, and submitted to a central counterparty (“CCP”)(“centrally cleared swaps”), in which case all payments are settled with the CCP through the DCM. Swaps are marked-to-market daily using pricing vendor quotations, counterparty or clearinghouse prices or model prices, and the change in value, if any, is recorded as an unrealized gain or loss. Upon entering into a swap contract, the Fund is required to satisfy an initial margin requirement by delivering cash or securities to the counterparty (or in some cases, segregated in a triparty account on behalf of the counterparty), which can be adjusted by any mark-to-market gains or losses pursuant to bilateral or centrally cleared arrangements. For centrally cleared swaps the daily change in valuation, if any, is recorded as a receivable or payable for variation margin.
A credit default swap is an agreement that involves one party (the buyer of protection) making a stream of payments to another party (the seller of protection) in exchange for the right to receive protection on a reference security or obligation, including a group of assets or exposure to the performance of an index. The Fund’s investment in credit default swaps may involve greater risks than if the Fund had invested in the referenced obligation directly. Credit events are contract specific but may include bankruptcy, failure to pay, restructuring and obligation acceleration. If the Fund buys protection through a credit default swap and no credit event occurs, its payments are limited to the periodic payments previously made to the counterparty. Upon the occurrence of a specified credit event, the Fund, as a buyer of credit protection, is entitled to receive an amount equal to the notional amount of the swap and deliver to the seller the defaulted reference obligation in a physically settled trade. The Fund may also receive a net settlement amount in the form of cash or securities equal to the notional amount of the swap reduced by the recovery value of the reference obligation in a cash settled trade.
As a seller of protection, the Fund generally receives a payment stream throughout the term of the swap, provided that there is no credit event. In addition, if the Fund sells protection through a credit default swap, the Fund could suffer a loss because the value of the referenced obligation and the premium payments received may be less than the notional amount of the swap paid to the buyer of protection. Upon the occurrence of a specified credit event, the Fund, as a seller of credit protection, may be required to take possession of the defaulted reference obligation and pay the buyer an amount equal to the notional amount of the swap in a physically settled trade. The Fund may also pay a net settlement amount in the form of cash or securities equal to the notional amount of the swap reduced by the recovery value of the reference obligation in a cash settled trade. Recovery values are at times established through the credit event auction process in which market participants are ensured that a transparent price has been set for the defaulted security or obligation. In addition, the Fund is entitled to a return of any assets, which have been pledged as collateral to the counterparty.
25
GOLDMAN SACHS RETIREMENT PORTFOLIO COMPLETION FUND
Notes to Financial Statements (continued)
October 31, 2015
|
| 3. INVESTMENTS AND FAIR VALUE MEASUREMENTS (continued) |
The maximum potential amount of future payments (undiscounted) that the Fund as seller of protection could be required to make under a credit default swap would be an amount equal to the notional amount of the agreement. These potential amounts would be partially offset by any recovery values of the respective referenced obligations or net amounts received from a settlement of a credit default swap for the same reference security or obligation where the Fund bought credit protection.
A total return swap is an agreement that gives the Fund the right to receive the appreciation in the value of a specified security, index or other instrument in return for a fee paid to the counterparty, which will typically be an agreed upon interest rate. If the underlying asset declines in value over the term of the swap, the Fund may also be required to pay the dollar value of that decline to the counterparty.
Short Term Investments — Short-term investments having a maturity of 60 days or less are generally valued at amortized cost which approximates fair market value. These investments are classified as Level 2 of the fair value hierarchy.
i. Repurchase Agreements — Repurchase agreements involve the purchase of securities subject to the seller’s agreement to repurchase the securities at a mutually agreed upon date and price, under the terms of a Master Repurchase Agreement (“MRA”). During the term of a repurchase agreement, the value of the underlying securities held as collateral on behalf of the Fund, including accrued interest is required to exceed the value of the repurchase agreement, including accrued interest. The gross value of repurchase agreements is included in the Statement of Assets and Liabilities for financial reporting purposes. The underlying securities for all repurchase agreements are held at the Fund’s custodian or designated sub-custodians under tri-party repurchase agreements.
An MRA governs transactions between the Fund and select counterparties. An MRA contains provisions for, among other things, initiation of the transaction, income payments, events of default and maintenance of securities for both repurchase and reverse repurchase agreements. An MRA also permits offsetting with collateral to create one single net payment in the event of default or similar events, including the bankruptcy or insolvency of a counterparty.
If the seller defaults, the Fund could suffer a loss to the extent that the proceeds from the sale of the underlying securities and other collateral held by the Fund are less than the repurchase price and the Fund’s costs associated with delay and enforcement of the repurchase agreement. In addition, in the event of default or insolvency of the seller, a court could determine that the Fund’s interest in the collateral is not enforceable, resulting in additional losses to the Fund.
Pursuant to exemptive relief granted by the Securities and Exchange Commission (“SEC”) and terms and conditions contained therein, the Fund, together with other funds of the Trust and registered investment companies having management agreements with GSAM or its affiliates, may transfer uninvested cash into joint accounts, the daily aggregate balance of which is invested in one or more repurchase agreements. Under these joint accounts, the Fund maintains pro-rata credit exposure to the underlying repurchase agreements’ counterparties. With the exception of certain transaction fees, the Fund is not subject to any expenses in relation to these investments.
B. Level 3 Fair Value Investments — To the extent that significant inputs to valuation models and other alternative pricing sources are unobservable, or if quotations are not readily available, or if GSAM believes that such quotations do not accurately reflect fair value, the fair value of the Fund’s investments may be determined under Valuation Procedures approved by the Trustees. GSAM, consistent with its procedures and applicable regulatory guidance, may make an adjustment to the most recent valuation prices of either domestic or foreign securities in light of significant events to reflect what it believes to be the fair value of the securities at the time of determining a Fund’s NAV. Significant events which could affect a large number of securities in a particular market may include, but are not limited to: significant fluctuations in U.S. or foreign markets; market dislocations; market disruptions; or unscheduled market closings. Significant events which could also affect a single issuer may include, but are not limited to: corporate actions such as reorganizations, mergers and buy-outs; ratings downgrades; and bankruptcies.
26
GOLDMAN SACHS RETIREMENT PORTFOLIO COMPLETION FUND
|
| 3. INVESTMENTS AND FAIR VALUE MEASUREMENTS (continued) |
C. Fair Value Hierarchy — The following is a summary of the Fund’s investments and derivatives classified in the fair value hierarchy as of October 31, 2015:
| | | | | | | | | | | | |
| | | |
| RETIREMENT PORTFOLIO COMPLETION | | | | | | | | | | | | |
| | | |
| Investment Type | | Level 1 | | | Level 2 | | | Level 3 | |
| Assets | | | | | | | | | | | | |
Common Stock and/or Other Equity Investments(a) | | | | | | | | | | | | |
Africa | | $ | 508 | | | $ | 2,234 | | | $ | — | |
Asia | | | — | | | | 57,588 | | | | — | |
Australia and Oceania | | | — | | | | 19,053 | | | | — | |
Europe | | | 1,794 | | | | 49,781 | | | | — | |
North America | | | 1,012,709 | | | | — | | | | — | |
South America | | | — | | | | 580 | | | | — | |
Fixed Income | | | | | | | | | | | | |
U.S. Treasury Obligations | | | 909,732 | | | | — | | | | — | |
Investment Company | | | 930,725 | | | | — | | | | — | |
Short-term Investments | | | — | | | | 1,500,000 | | | | — | |
| Total | | $ | 2,855,468 | | | $ | 1,629,236 | | | $ | — | |
| | | |
| Derivative Type | | | | | | | | | |
| Assets(b) | | | | | | | | | | | | |
Credit Default Swap Contracts | | $ | — | | | $ | 43,246 | | | $ | — | |
| (a) | | Amounts are disclosed by continent to highlight the impact of time zone differences between local market close and the calculation of NAV. Security valuations are based on the principal exchange or system on which they are traded, which may differ from country of domicile. The Fund utilizes fair value model prices provided by an independent fair value service for international equities, resulting in a Level 2 classification. |
| (b) | | Amount shown represents unrealized gain (loss) at period end. |
For further information regarding security characteristics, see the Schedule of Investments.
|
| 4. INVESTMENTS IN DERIVATIVES |
The following table sets forth, by certain risk types, the gross value of derivative contracts as of October 31, 2015. These instruments were used as part of the Fund’s investment strategies and to obtain and/or manage exposure related to the risks below. The values in the table below exclude the effects of cash collateral received or posted pursuant to these derivative contracts, and therefore are not representative of the Fund’s net exposure.
| | | | | | |
| Risk | | Statement of Assets and Liabilities | | Assets | |
Credit | | Variation margin on certain derivative contracts | | $ | 43,246 | (a) |
| (a) | | Includes unrealized gain (loss) on centrally cleared swaps described in the Additional Investment Information section of the Schedule of Investments. Only current day’s variation margin is reported within the Statement of Assets and Liabilities. |
The following table sets forth, by certain risk types, the Fund’s gains (losses) related to these derivatives and their indicative volumes for the fiscal year ended October 31, 2015. These gains (losses) should be considered in the context that these derivative contracts may have been executed to create investment opportunities and/or economically hedge certain investments, and
27
GOLDMAN SACHS RETIREMENT PORTFOLIO COMPLETION FUND
Notes to Financial Statements (continued)
October 31, 2015
|
| 4. INVESTMENTS IN DERIVATIVES (continued) |
accordingly, certain gains (losses) on such derivative contracts may offset certain (losses) gains attributable to investments. These gains (losses) are included in “Net realized gain (loss)” or “Net change in unrealized gain (loss)” on the Statement of Operations:
| | | | | | | | | | | | | | |
| Risk | | Statement of Operations | | Net Realized
Gain (Loss) | | | Net Change in
Unrealized
Gain (Loss) | | | Average
Number of
Contracts(a) | |
| Credit | | Net realized gain (loss) from swap contracts/Net change in unrealized gain (loss) on swap contracts | | $ | (42,818 | ) | | $ | 6,733 | | | | 2 | |
| Currency | | Net realized gain (loss) from forward foreign currency related transactions | | | (128 | ) | | | — | | | | 1 | |
| Equity | | Net realized gain (loss) from swap contracts/Net change in unrealized gain (loss) on swap contracts | | | (41,114 | ) | | | (4,586 | ) | | | 1 | |
| Total | | | | $ | (84,060 | ) | | $ | 2,147 | | | | 4 | |
| (a) | | Average number of contracts is based on the average of month end balances for the fiscal year ended October 31, 2015. |
In order to better define its contractual rights and to secure rights that will help the Fund mitigate its counterparty risk, the Fund may enter into an International Swaps and Derivatives Association, Inc. Master Agreement (“ISDA Master Agreement”) or similar agreement with its derivatives’ counterparties. An ISDA Master Agreement is a bilateral agreement between the Fund and a counterparty that governs OTC derivatives, including foreign exchange contracts, and typically contains, among other things, collateral posting terms and netting provisions in the event of a default and/or termination event. The provisions of the ISDA Master Agreement typically permit a single net payment in the event of a default (close-out netting) or similar event, including the bankruptcy or insolvency of the counterparty.
Collateral and margin requirements differ between exchange traded derivatives and OTC derivatives. Margin requirements are established by the broker or clearing house for exchange-traded and centrally cleared derivatives (financial futures contracts, options and centrally cleared swaps) pursuant to governing agreements for those instrument types. Brokers can ask for margin in excess of the minimum in certain circumstances. Collateral terms are contract-specific for OTC derivatives (foreign currency exchange contracts, and certain options and swaps). For derivatives traded under an ISDA Master Agreement, the collateral requirements are typically calculated by netting the marked to market amount for each transaction under such agreement and comparing that amount to the value of any collateral currently pledged by the Fund and the counterparty. Additionally, the Fund may be required to post initial margin to the counterparty, the terms of which would be outlined in the confirmation of the OTC transaction.
For financial reporting purposes, cash collateral that has been pledged to cover obligations of the Fund and cash collateral received from the counterparty, if any, is reported separately on the Statement of Assets and Liabilities as receivables/payables for collateral on certain derivative contracts. Non-cash collateral pledged by the Fund, if any, is noted in the Schedule of Investments. Generally, the amount of collateral due from or to a counterparty must exceed a minimum transfer amount threshold before a transfer is required to be made. To the extent amounts due to the Fund from its counterparties are not fully collateralized, contractually or otherwise, the Fund bears the risk of loss from counterparty nonperformance. The Fund attempts to mitigate counterparty risk by only entering into agreements with counterparties that the Investment Adviser believes to be of good standing and by monitoring the financial stability of those counterparties.
Additionally, the netting of assets and liabilities and the offsetting of collateral pledged or received are based on contractual netting/set-off provisions in the ISDA Master Agreement or similar agreements. However, in the event of a default or insolvency of a counterparty, a court could determine that such rights are not enforceable due to the restrictions or prohibitions against the right of setoff that may be imposed in accordance with a particular jurisdiction’s bankruptcy or insolvency laws.
28
GOLDMAN SACHS RETIREMENT PORTFOLIO COMPLETION FUND
|
| 5. AGREEMENTS AND AFFILIATED TRANSACTIONS |
A. Management Agreement — Under the Agreement, GSAM manages the Fund, subject to the general supervision of the Board of Trustees.
As compensation for the services rendered pursuant to the Agreement, the assumption of the expenses related thereto and administration of the Fund’s business affairs, including providing facilities, GSAM is entitled to a management fee, accrued daily and paid monthly, equal to an annual percentage rate of the Fund’s average daily net assets.
For the fiscal year ended October 31, 2015, the contractual and effective net management fee with GSAM were at the following rates:
| | | | | | | | | | | | | | | | | | | | | | | | | | |
| Contractual Management Rate | | | Effective Net Management Rate*^ | |
First $1 billion | | | Next $1 billion | | | Next $3 billion | | | Next $3 billion | | | Over $8 billion | | | Effective Rate | | |
| | 0.45% | | | | 0.41% | | | | 0.38% | | | | 0.37% | | | | 0.36% | | | | 0.45% | | | | 0.31% | |
| * | | GSAM has agreed to waive a portion of its management fee payable by the Fund in an amount equal to any management fees it earns as an investment adviser to any of the affiliated funds in which the Fund invests. The management fee waiver will remain in effect through at least July 31, 2016, and prior to such date GSAM may not terminate the arrangement without the approval of the Trustees. |
| ^ | | Effective Net Management Rate includes the impact of management fee waivers of affiliated underlying funds, if any. |
The Fund invests in Institutional Shares of the Goldman Sachs Absolute Return Tracker Fund, which is an affiliated Underlying Fund. GSAM has agreed to waive a portion of its management fee payable by the Fund in an amount equal to the management fee it earns as an investment adviser to any of the affiliated Underlying Funds in which the Fund invests. For the fiscal year ended October 31, 2015, GSAM waived $9,825 of the Fund’s management fee.
B. Distribution and Service Plans — The Trust, on behalf of the Fund, has adopted Distribution and Service Plans (the “Plans”). Under the Plans, Goldman Sachs, which serves as distributor (the “Distributor”), is entitled to a fee accrued daily and paid monthly, for distribution services and personal and account maintenance services, which may then be paid by Goldman Sachs to authorized dealers, at the following annual rates calculated on the Fund’s average daily net assets of each respective share class:
| | | | | | | | | | | | |
| | | Distribution and Service Plan Rates | |
| | | Class A* | | | Class C | | | Class R* | |
Distribution Plan | | | 0.25 | % | | | 0.75 | % | | | 0.50 | % |
Service Plan | | | — | | | | 0.25 | | | | — | |
| * | | With respect to Class A and Class R Shares, the Distributor at its discretion may use compensation for distribution services paid under the Distribution Plan to compensate service organizations for personal and account maintenance services and expenses as long as such total compensation does not exceed the maximum cap on “service fees” imposed by the Financial Industry Regulatory Authority. |
C. Distribution Agreement — Goldman Sachs, as Distributor of the shares of the Fund pursuant to a Distribution Agreement, may retain a portion of the Class A front end sales charge and Class C Shares’ CDSC. During the fiscal year ended October 31, 2015, Goldman Sachs did not retain any portion of the sales charges nor CDSC for this fund.
D. Transfer Agency Agreement — Goldman Sachs also serves as the transfer agent of the Fund for a fee pursuant to the Transfer Agency Agreement. The fees charged for such transfer agency services are accrued daily and paid monthly at annual rates as follows: 0.19% of the average daily net assets of Class A, Class C, Class IR and Class R Shares; 0.02% of the average daily net assets of Class R6 Shares; and 0.04% of the average daily net assets of Institutional Shares.
E. Other Expense Agreements and Affiliated Transactions — GSAM has agreed to limit certain “Other Expense” of the Fund (excluding acquired fund fees and expenses, transfer agency fees and expenses, service fees, shareholder administration fees (as applicable), taxes, interest, brokerage fees, shareholder meeting, litigation, indemnification, and extraordinary expenses) to the extent such expenses exceed, on an annual basis, a percentage rate of the average daily net assets of the Fund. Such Other Expense
29
GOLDMAN SACHS RETIREMENT PORTFOLIO COMPLETION FUND
Notes to Financial Statements (continued)
October 31, 2015
|
| 5. AGREEMENTS AND AFFILIATED TRANSACTIONS (continued) |
reimbursements, if any, are accrued daily and paid monthly. In addition, the Fund is not obligated to reimburse GSAM for prior fiscal year expense reimbursements, if any. The Other Expense limitations as an annual percentage rate of average daily net assets for the Fund are 0.064%. These Other Expense limitations will remain in place through at least July 31, 2016, and prior to such date GSAM may not terminate the arrangements without the approval of the Trustees. In addition, the Fund has entered into certain offset arrangements with the transfer agent, which may result in a reduction of the Fund’s expenses and are received irrespective of the application of the “Other Expense” limitations described above.
For the fiscal year ended October 31, 2015, these expense reductions, including any fee waivers and Other Expense reimbursements, were as follows:
| | | | | | | | | | |
Management
Fees Waivers | | | Other Expense Reimbursements | | | Total Expense
Reductions | |
| $ | 9,825 | | | $ | 284,139 | | | $ | 293,964 | |
F. Line of Credit Facility — As of October 31, 2015, the Fund participated in a $1,205,000,000 committed, unsecured revolving line of credit facility (the “facility”) together with other funds of the Trust and registered investment companies having management agreements with GSAM or its affiliates (“Other Borrowers”). Pursuant to the terms of the facility, the Fund and Other Borrowers could increase the credit amount by up to an additional $115,000,000, for a total of up to $1,320,000,000. This facility is to be used for temporary emergency purposes or to allow for an orderly liquidation of securities to meet redemption requests. The interest rate on borrowings is based on the federal funds rate. The facility also requires a fee to be paid by the Fund based on the amount of the commitment that has not been utilized. For the fiscal year ended October 31, 2015, the Fund did not have any borrowings under the facility.
G. Other Transactions with Affiliates — For the fiscal year ended October 31, 2015, Goldman Sachs did not earn any brokerage commissions from portfolio transactions, including futures transactions executed with Goldman Sachs as Futures Commission Merchant, on behalf of the Fund.
As of October 31, 2015, the Goldman Sachs Group, Inc. (“GSG”) was the beneficial owner of 5% or more of the following outstanding shares of the Fund:
| | | | | | | | | | | | | | | | | | | | | | |
| Class A | | | Class C | | | Institutional | | | Class R | | | Class IR | | | Class R6 | |
| | 8% | | | | 96% | | | | 64% | | | | 100% | | | | 100% | | | | 100% | |
The table below shows the transaction in and earnings from investments in the Underlying Fund for the fiscal year ended October 31, 2015:
| | | | | | | | | | | | | | | | |
| Underlying Fund | | Market
Value 10/31/14 | | Purchases
at Cost | | Proceeds
from Sales | | Net Realized
Gain (Loss) | | Net Change
in Unrealized
Gain (Loss) | | Market
Value
10/31/15 | | Dividend
Income | | Capital Gains Distributions |
Goldman Sachs Absolute Return Tracker Fund | | $1,462,734 | | $343,397 | | $(836,891) | | $(16,474) | | $(22,041) | | $930,725 | | $6,784 | | $55,299 |
|
| 6. PORTFOLIO SECURITIES TRANSACTIONS |
The cost of purchases and proceeds from sales and maturities of long-term securities for the fiscal year ended October 31, 2015, were $1,660,398 and $2,621,095, respectively. Included in these amounts are the cost of purchases and proceeds from sales and maturities of U.S. Government and agency obligations in the amount of $400,802 and $939,673, respectively.
30
GOLDMAN SACHS RETIREMENT PORTFOLIO COMPLETION FUND
The tax character of distributions paid during the fiscal year ended October 31, 2015 was as follows:
| | | | |
| | | | |
Distribution paid from: | | | | |
Ordinary income | | $ | 103,236 | |
Net long-term capital gains | | | 26,993 | |
Total taxable distributions | | $ | 130,229 | |
The tax character of distributions paid during the fiscal year ended October 31, 2014, in the amount of $80,056, was from ordinary income.
As of October 31, 2015, the components of accumulated earnings (losses) on a tax basis were as follows:
| | | | |
| | | | |
Undistributed ordinary income — net | | $ | 11,376 | |
Capital loss carryforwards: | | | | |
Perpetual Short-Term | | | (198,757 | ) |
Perpetual Long-Term | | | (428,171 | ) |
Total capital loss carryforwards | | $ | (626,928 | ) |
Unrealized gains (losses) — net | | | 177,847 | |
Total accumulated earnings (losses) net | | $ | (437,705 | ) |
As of October 31, 2015, the Fund’s aggregate security unrealized gains and losses based on cost for U.S. federal income tax purposes were as follows:
| | | | |
| | | | |
Tax Cost | | $ | 4,349,063 | |
Gross unrealized gain | | | 328,961 | |
Gross unrealized loss | | | (193,320 | ) |
Net unrealized gains (losses) on securities | | $ | 135,641 | |
Net unrealized gain (loss) on other investments | | | 42,206 | |
Net unrealized gains (losses) | | $ | 177,847 | |
The difference between GAAP-basis and tax-basis unrealized gains (losses) is attributable primarily to wash sales, differences related to the tax treatment of partnership investments, swap transactions, inflation protected securities and passive foreign investment company investments.
In order to present certain components of the Fund’s capital accounts on a tax-basis, certain reclassifications have been recorded to the Fund’s accounts. These reclassifications have no impact on the net asset value of the Fund and result primarily from differences in the tax treatment of partnership investments, swap transactions, passive foreign investment company investments, foreign currency transactions, dividend re-designations, underlying fund investments, and foreign capital gains tax.
| | | | | | | | | | |
| | | Accumulated
Net Realized
Gain (Loss) | | | Undistributed
Net Investment
Income (Loss) | | | |
| | | $ | (280,589 | ) | | $ | 280,589 | | | |
GSAM has reviewed the Fund’s tax positions for all open tax years (the current and prior three years, as applicable) and has concluded that no provision for income tax is required in the Fund’s financial statements. Such open tax years remain subject to examination and adjustment by tax authorities.
31
GOLDMAN SACHS RETIREMENT PORTFOLIO COMPLETION FUND
Notes to Financial Statements (continued)
October 31, 2015
The Fund’s risks include, but are not limited to, the following:
Foreign Custody Risk — The Fund that invests in foreign securities may hold such securities and cash with foreign banks, agents, and securities depositories appointed by the Fund’s custodian (each a “Foreign Custodian”). Some foreign custodians may be recently organized or new to the foreign custody business. In some countries, Foreign Custodians may be subject to little or no regulatory oversight over, or independent evaluation of, their operations. Further, the laws of certain countries may place limitations on the Fund’s ability to recover its assets if a Foreign Custodian enters bankruptcy.
Large Shareholder Transactions Risk — The Fund may experience adverse effects when certain large shareholders, such as other funds, institutional investors (including those trading by use of non-discretionary mathematical formulas), financial intermediaries (who may make investment decisions on behalf of underlying clients and/or include the Fund in their investment model), individuals, accounts and Goldman Sachs affiliates, purchase or redeem large amounts of shares of the Fund. Such large shareholder redemptions may cause the Fund to sell portfolio securities at times when it would not otherwise do so, which may negatively impact the Fund’s NAV and liquidity. These transactions may also accelerate the realization of taxable income to shareholders if such sales of investments resulted in gains, and may also increase transaction costs. In addition, a large redemption could result in the Fund’s current expenses being allocated over a smaller asset base, leading to an increase in the Fund’s expense ratio. Similarly, large Fund share purchases may adversely affect the Fund’s performance to the extent that the Fund is delayed in investing new cash and is required to maintain a larger cash position than it ordinarily would.
Interest Rate Risk — When interest rates increase, fixed income securities or instruments held by the Fund will generally decline in value. Long-term fixed income securities or instruments will normally have more price volatility because of this risk than short-term fixed income securities or instruments.
Investments in Other Investment Companies — As a shareholder of another investment company, including an exchange-traded fund (“ETF”), the Fund will indirectly bear its proportionate share of any net management fees and other expenses paid by such other investment companies, in addition to the fees and expenses regularly borne by the Fund. ETFs are subject to risks that do not apply to conventional mutual funds, including but not limited to the following: (i) the market price of the ETF’s shares may trade at a premium or a discount to their NAV; and (ii) an active trading market for an ETF’s shares may not develop or be maintained.
Publicly Traded Partnership Risk — In addition to the risks associated with the underlying assets and exposures within a PTP, risks of investments in PTPs may include, among others, dependence upon specialized skills of the PTP’s manager, potential lack of liquidity, and limitations on voting and distribution rights.
Liquidity Risk — The Fund may make investments that are illiquid or that may become less liquid in response to market developments or adverse investor perceptions. Illiquid investments may be more difficult to value. Liquidity risk may also refer to the risk that a Fund will not be able to pay redemption proceeds within the allowable time period because of unusual market conditions, an unusually high volume of redemption requests, or other reasons. To meet redemption requests, the Fund may be forced to sell investments at an unfavorable time and/or under unfavorable conditions. Liquidity risk may be the result of, among other things, the reduced number and capacity of traditional market participants to make a market in fixed income securities or the lack of an active market. The potential for liquidity risk may be magnified by a rising interest rate environment or other circumstances where investor redemptions from fixed income mutual funds may be higher than normal, potentially causing increased supply in the market due to selling activity.
Market and Credit Risks — In the normal course of business, the Fund trades financial instruments and enters into financial transactions where risk of potential loss exists due to changes in the market (market risk). Additionally, the Fund may also be exposed to credit risk in the event that an issuer or guarantor fails to perform or that an institution or entity with which the Fund has unsettled or open transactions defaults.
Investing in foreign markets may involve special risks and considerations not typically associated with investing in the United States. Foreign securities may be subject to risk of loss because of more or less foreign government regulation, less public
32
GOLDMAN SACHS RETIREMENT PORTFOLIO COMPLETION FUND
|
| 8. OTHER RISKS (continued) |
information and less economic, political and social stability in the countries in which the Fund invests. Loss may also result from the imposition of exchange controls, confiscations and other government restrictions by the United States or other governments, or from problems in registration, settlement or custody. Foreign risk also involves the risk of negative foreign currency rate fluctuations, which may cause the value of securities denominated in such foreign currency (or other instruments through which the Fund has exposure to foreign currencies) to decline in value. Currency exchange rates may fluctuate significantly over short periods of time. To the extent that the Fund also invests in securities of issuers located in emerging markets, these risks may be more pronounced.
Non-Diversification Risk — The Fund is non-diversified, meaning that it is permitted to invest a larger percentage of its assets in fewer issuers than diversified mutual funds. Thus, the Fund may be more susceptible to adverse developments affecting any single issuer held in its portfolio, and may be more susceptible to greater losses because of these developments.
Under the Trust’s organizational documents, its Trustees, officers, employees and agents are indemnified, to the extent permitted by the Act and state law, against certain liabilities that may arise out of performance of their duties to the Fund. Additionally, in the course of business, the Fund enters into contracts that contain a variety of indemnification clauses. The Fund’s maximum exposure under these arrangements is unknown, as this would involve future claims that may be made against the Fund that have not yet occurred. However, GSAM believes the risk of loss under these arrangements to be remote.
Subsequent events after the Statement of Assets and Liabilities date have been evaluated through the date the financial statements were issued. At a meeting held on December 17, 2015, the Board of Trustees approved a proposal to liquidate the Fund pursuant to a Board-approved Plan of Liquidation. It is expected that the Fund will be liquidated on or about February 19, 2016.
33
GOLDMAN SACHS RETIREMENT PORTFOLIO COMPLETION FUND
Notes to Financial Statements (continued)
October 31, 2015
|
| 11. SUMMARY OF SHARE TRANSACTIONS |
Share activity is as follows:
| | | | | | | | | | | | | | | | |
| | | For the Fiscal Year Ended
October 31, 2015 | | | For the Fiscal Year Ended
October 31, 2014 | |
| | | Shares | | | Dollars | | | Shares | | | Dollars | |
| | | | |
| Class A Shares | | | | | | | | | | | | | | | | |
Shares sold | | | 2 | | | $ | 15 | | | | 11,682 | | | $ | 118,596 | |
Reinvestment of distributions | | | 229 | | | | 2,257 | | | | 160 | | | | 1,583 | |
Shares redeemed | | | (1,953 | ) | | | (18,841 | ) | | | (7,292 | ) | | | (74,166 | ) |
| | | | (1,722 | ) | | | (16,569 | ) | | | 4,550 | | | | 46,013 | |
| Class C Shares | | | | | | | | | | | | | | | | |
Shares sold | | | 26 | | | | 246 | | | | 16 | | | | 167 | |
Reinvestment of distributions | | | 17 | | | | 162 | | | | 15 | | | | 144 | |
| | | | 43 | | | | 408 | | | | 31 | | | | 311 | |
| Institutional Shares | | | | | | | | | | | | | | | | |
Shares sold | | | 166,991 | | | | 1,638,085 | | | | 366,141 | | | | 3,720,966 | |
Reinvestment of distributions | | | 12,850 | | | | 127,144 | | | | 7,805 | | | | 77,746 | |
Shares redeemed | | | (412,012 | ) | | | (3,956,434 | ) | | | (59,481 | ) | | | (606,503 | ) |
| | | | (232,171 | ) | | | (2,191,205 | ) | | | 314,465 | | | | 3,192,209 | |
| Class IR Shares | | | | | | | | | | | | | | | | |
Shares sold | | | 2 | | | | 18 | | | | 781 | | | | 8,000 | |
Reinvestment of distributions | | | 51 | | | | 506 | | | | 44 | | | | 439 | |
Shares redeemed | | | (2,142 | ) | | | (20,996 | ) | | | (765 | ) | | | (7,849 | ) |
| | | | (2,089 | ) | | | (20,472 | ) | | | 60 | | | | 590 | |
| Class R Shares | | | | | | | | | | | | | | | | |
Reinvestment of distributions | | | 16 | | | | 160 | | | | 15 | | | | 144 | |
| | | | 16 | | | | 160 | | | | 15 | | | | 144 | |
| Class R6 Shares(a) | | | | | | | | | | | | | | | | |
Shares sold | | | 1,045 | | | | 10,005 | | | | — | | | | — | |
Shares redeemed | | | (1 | ) | | | (5 | ) | | | — | | | | — | |
| | | | 1,044 | | | | 10,000 | | | | — | | | | — | |
NET INCREASE (DECREASE) | | | (234,879 | ) | | $ | (2,217,678 | ) | | | 319,121 | | | $ | 3,239,267 | |
| (a) | | Commenced operations on July 31, 2015. |
34
Report of Independent Registered Public
Accounting Firm
To the Board of Trustees of Goldman Sachs Trust and the Shareholders of
Goldman Sachs Retirement Portfolio Completion Fund:
In our opinion, the accompanying statement of assets and liabilities, including the schedule of investments, and the related statements of operations and of changes in net assets and the financial highlights present fairly, in all material respects, the financial position of Goldman Sachs Retirement Portfolio Completion Fund (the “Fund”), a fund of the Goldman Sachs Trust, at October 31, 2015, and the results of its operations, the changes in its net assets and the financial highlights for each of the periods indicated, in conformity with accounting principles generally accepted in the United States of America. These financial statements and financial highlights (hereafter referred to as “financial statements”) are the responsibility of the Fund’s management. Our responsibility is to express an opinion on these financial statements based on our audits. We conducted our audits of these financial statements in accordance with the standards of the Public Company Accounting Oversight Board (United States). Those standards require that we plan and perform the audit to obtain reasonable assurance about whether the financial statements are free of material misstatement. An audit includes examining, on a test basis, evidence supporting the amounts and disclosures in the financial statements, assessing the accounting principles used and significant estimates made by management, and evaluating the overall financial statement presentation. We believe that our audits, which included confirmation of securities at October 31, 2015 by correspondence with the custodian, brokers, and transfer agent of the underlying fund, provide a reasonable basis for our opinion.
As discussed in the Note 10 to the financial statements, the Board of Trustees of the Fund approved the liquidation of the Fund effective on or about February 19, 2016.
PricewaterhouseCoopers LLP
Boston, Massachusetts
December 28, 2015
35
GOLDMAN SACHS RETIREMENT PORTFOLIO COMPLETION FUND
| | |
Fund Expenses — Six Month Period Ended October 31, 2015 (Unaudited) | | |
As a shareholder of Class A, Class C, Institutional, Class IR, Class R and Class R6 Shares of the Fund, you incur two types of costs: (1) transaction costs, including sales charges on purchase payments (with respect to Class A Shares), contingent deferred sales charges on redemptions (with respect to Class C Shares), and (2) ongoing costs, including management fees; distribution and service (12b-1) fees (with respect to Class A, Class C and Class R Shares); and other Fund expenses. This Example is intended to help you understand your ongoing costs (in dollars) of investing in Class A, Class C, Institutional, Service, Class IR, Class R or Class R6 Shares of the Fund and to compare these costs with the ongoing costs of investing in other mutual funds.
The Example is based on an investment of $1,000 invested at the beginning of the period and held for the entire period from May 1, 2015 through October 31, 2015, which represent a period of 184 out of 365 days. The Class R6 Example is based on the period from July 31, 2015 through October 31, 2015, which represents a period of 92 out of 365 days.
Actual Expenses — The first line under each share class in the table below provides information about actual account values and actual expenses. You may use the information in this line, together with the amount you invested, to estimate the expenses that you paid over the period. Simply divide your account value by $1,000 (for example, an $8,600 account value divided by $1,000=8.6), then multiply the result by the number in the first line under the heading entitled “Expenses Paid” to estimate the expenses you paid on your account during this period.
Hypothetical Example for Comparison Purposes — The second line under each share class in the table below provides information about hypothetical account values and hypothetical expenses based on the Fund’s actual net expense ratios and an assumed rate of return of 5% per year before expenses, which is not the Fund’s actual return. The hypothetical account values and expenses may not be used to estimate the actual ending account balance or expenses you paid for the period. You may use this information to compare the ongoing costs of investing in the Fund and other funds. To do so, compare this 5% hypothetical example with the 5% hypothetical examples that appear in the shareholder reports of the other funds.
Please note that the expenses shown in the table are meant to highlight your ongoing costs only and do not reflect any transactional costs, such as sales charges, redemption fees, or exchange fees. Therefore, the second line of the table is useful in comparing ongoing costs only, and will not help you determine the relative total costs of owning different funds. In addition, if these transactional costs were included, your costs would have been higher.
| | | | | | | | | | | | |
| Share Class | | Beginning
Account Value
5/1/15 | | | Ending
Account Value
10/31/15 | | | Expenses
Paid for the
6 months
ended
10/31/15* | |
| Class A | | | | | | | | | | | | |
Actual | | $ | 1,000.00 | | | $ | 956.30 | | | $ | 3.99 | |
Hypothetical 5% return | | | 1,000.00 | | | | 1,021.12 | + | | | 4.13 | |
| Class C | | | | | | | | | | | | |
Actual | | | 1,000.00 | | | | 952.30 | | | | 7.58 | |
Hypothetical 5% return | | | 1,000.00 | | | | 1,017.44 | + | | | 7.83 | |
| Institutional | | | | | | | | | | | | |
Actual | | | 1,000.00 | | | | 958.60 | | | | 2.02 | |
Hypothetical 5% return | | | 1,000.00 | | | | 1,023.14 | + | | | 2.09 | |
| Class IR | | | | | | | | | | | | |
Actual | | | 1,000.00 | | | | 957.50 | | | | 2.81 | |
Hypothetical 5% return | | | 1,000.00 | | | | 1,022.33 | + | | | 2.91 | |
| Class R | | | | | | | | | | | | |
Actual | | | 1,000.00 | | | | 955.00 | | | | 5.22 | |
Hypothetical 5% return | | | 1,000.00 | | | | 1,019.86 | + | | | 5.40 | |
| Class R6(a) | | | | | | | | | | | | |
Actual | | | 1,000.00 | | | | 989.60 | | | | 1.20 | |
Hypothetical 5% return | | | 1,000.00 | | | | 1,011.39 | + | | | 1.22 | |
| | * | | Expenses for each share class are calculated using the Fund’s annualized net expense ratio for each class, which represents the ongoing expenses as a percentage of net assets for the six months ended October 31, 2015. Expenses are calculated by multiplying the annualized net expense ratio by the average account value for the period; then multiplying the result by the number of days in the most recent fiscal half year; and then dividing that result by the number of days in the fiscal year. The annualized net expense ratios for the period were as follows: | |
| | | | | | | | | | |
| Class A | | Class C | | Institutional | | Class IR | | Class R | | Class R6(a) |
| 0.81% | | 1.54% | | 0.41% | | 0.57% | | 1.06% | | 0.48% |
| | + | | Hypothetical expenses are based on the Fund’s actual annualized net expense ratios and an assumed rate of return of 5% per year before expenses. | |
| | (a) | | Commenced operations on July 31, 2015. | |
36
GOLDMAN SACHS RETIREMENT PORTFOLIO COMPLETION FUND
Statement Regarding Basis for Approval of Management Agreement (Unaudited)
Background
The Goldman Sachs Retirement Portfolio Completion Fund (the “Fund”) is an investment portfolio of Goldman Sachs Trust (the “Trust”). The Board of Trustees oversees the management of the Trust and reviews the investment performance and expenses of the Fund at regularly scheduled meetings held throughout the year. In addition, the Board of Trustees determines annually whether to approve the continuance of the Trust’s investment management agreement (the “Management Agreement”) with Goldman Sachs Asset Management, L.P. (the “Investment Adviser”) on behalf of the Fund.
The Management Agreement was most recently approved for continuation until June 30, 2016 by the Board of Trustees, including those Trustees who are not parties to the Management Agreement or “interested persons” (as defined in the Investment Company Act of 1940, as amended) of any party thereto (the “Independent Trustees”), at a meeting held on June 10-11, 2015 (the “Annual Meeting”).
The review process undertaken by the Trustees spans the course of the year and culminates with the Annual Meeting. To assist the Trustees in their deliberations, the Trustees have established a Contract Review Committee (the “Committee”), comprised of the Independent Trustees. The Committee held three meetings over the course of the year since the Management Agreement was last approved. At those Committee meetings, regularly scheduled Board or other committee meetings, and/or the Annual Meeting, matters relevant to the renewal of the Management Agreement were considered by the Board, or the Independent Trustees, as applicable. Such matters included:
| | (a) | | the nature and quality of the advisory, administrative, and other services provided to the Fund by the Investment Adviser and its affiliates, including information about: |
| | (i) | | the structure, staff, and capabilities of the Investment Adviser and its portfolio management teams; |
| | (ii) | | the groups within the Investment Adviser and its affiliates that support the portfolio management teams or provide other types of necessary services, including fund services groups (e.g., accounting and financial reporting, tax, shareholder services and operations); controls and risk management groups (e.g., legal, compliance, valuation oversight, credit risk management, internal audit, compliance testing, market risk analysis, finance and strategy and central funding); sales and distribution support groups and others (e.g., information technology and training); |
| | (iii) | | trends in employee headcount; |
| | (iv) | | the Investment Adviser’s financial resources and ability to hire and retain talented personnel and strengthen its operations; and |
| | (v) | | the parent company’s support of the Investment Adviser and its mutual fund business, as expressed by the firm’s senior management; |
| | (b) | | information on the investment performance of the Fund, including comparisons to the performance of similar mutual funds, as provided by a third-party mutual fund data provider engaged as part of the contract review process (the “Outside Data Provider”), and a benchmark performance index, and general investment outlooks in the markets in which the Fund invests; |
| | (c) | | information provided by the Investment Adviser indicating the Investment Adviser’s views on whether the Fund’s peer group and/or benchmark index had high, medium, or low relevance given the Fund’s particular investment strategy; |
| | (d) | | the terms of the Management Agreement and other agreements with affiliated service providers entered into by the Trust on behalf of the Fund; |
| | (e) | | fee and expense information for the Fund, including: |
| | (i) | | the relative management fee and expense levels of the Fund as compared to those of comparable funds managed by other advisers, as provided by the Outside Data Provider; |
| | (ii) | | the expense trends over time of the Fund; and |
| | (iii) | | to the extent the Investment Adviser manages other types of accounts (such as bank collective trusts, private wealth management accounts, institutional separate accounts, sub-advised mutual funds, and non-U.S. funds) having investment objectives and policies similar to those of the Fund, comparative information on the advisory fees charged and services provided to those accounts by the Investment Adviser; |
| | (f) | | with respect to the investment performance and expense comparison data provided by the Outside Data Provider, its processes in producing that data for the Fund; |
| | (g) | | the undertakings of the Investment Adviser to limit certain expenses of the Fund that exceed a specified level; |
| | (h) | | information relating to the profitability of the Management Agreement and the transfer agency and distribution and service arrangements of the Fund and the Trust as a whole to the Investment Adviser and its affiliates; |
| | (i) | | whether the Fund’s existing management fee schedule adequately addressed any economies of scale; |
37
GOLDMAN SACHS RETIREMENT PORTFOLIO COMPLETION FUND
Statement Regarding Basis for Approval of Management Agreement (Unaudited) (continued)
| | (j) | | a summary of the “fall-out” benefits derived by the Investment Adviser and its affiliates from their relationships with the Fund, including the fees received by the Investment Adviser’s affiliates from the Fund for transfer agency, portfolio trading, distribution and other services; |
| | (k) | | a summary of potential benefits derived by the Fund as a result of its relationship with the Investment Adviser; |
| | (l) | | information regarding commissions paid by the Fund and broker oversight, other information regarding portfolio trading, and how the Investment Adviser carries out its duty to seek best execution; |
| | (m) | | portfolio manager ownership of Fund shares; the manner in which portfolio manager compensation is determined; and the number and types of accounts managed by the portfolio managers; |
| | (n) | | the nature and quality of the services provided to the Fund by its unaffiliated service providers, and the Investment Adviser’s general oversight and evaluation (including reports on due diligence) of those service providers as part of the administration services provided under the Management Agreement; and |
| | (o) | | the Investment Adviser’s processes and policies addressing various types of potential conflicts of interest; its approach to risk management; the annual review of the effectiveness of the Fund’s compliance program; and periodic compliance reports. |
The Trustees also received an overview of the Fund’s distribution arrangements. They received information regarding the Fund’s assets, share purchase and redemption activity and the payment of Rule 12b-1 distribution and service fees and non-Rule 12b-1 shareholder service and/or administration fees with respect to the Fund. Information was also provided to the Trustees relating to revenue sharing payments made by and services provided by the Investment Adviser and its affiliates to intermediaries that promote the sale, distribution, and/or servicing of Fund shares.
The presentations made at the Board and Committee meetings and at the Annual Meeting encompassed the Fund and other mutual fund portfolios for which the Board of Trustees has responsibility. In evaluating the Management Agreement at the Annual Meeting, the Trustees relied upon their knowledge, resulting from their meetings and other interactions throughout the year, of the Investment Adviser and its affiliates, their services, and the Fund. In conjunction with these meetings, the Trustees received written materials and oral presentations on the topics covered, and were advised by their independent legal counsel regarding their responsibilities and other regulatory requirements related to the approval and continuation of mutual fund investment management agreements under applicable law. In addition, the Investment Adviser and its affiliates provided the Independent Trustees with a written response to a formal request for information sent on behalf of the Independent Trustees by their independent legal counsel. During the course of their deliberations, the Independent Trustees met in executive sessions with their independent legal counsel, without representatives of the Investment Adviser or its affiliates present. The Independent Trustees also discussed the broad range of other investment choices that are available to Fund investors, including the availability of comparable funds managed by other advisers.
Nature, Extent, and Quality of the Services Provided Under the Management Agreement
As part of their review, the Trustees considered the nature, extent, and quality of the services provided to the Fund by the Investment Adviser. In this regard, the Trustees considered both the investment advisory services and non-advisory services that are provided by the Investment Adviser and its affiliates. The Trustees noted the transition in the leadership and changes in personnel of various of the Investment Adviser’s portfolio management teams that had occurred in recent periods, and the ongoing recruitment efforts aimed at bringing high quality investment talent to the Investment Adviser. They also noted the Investment Adviser’s commitment to maintaining high quality systems. The Trustees concluded that the Investment Adviser continued to commit substantial financial and operational resources to the Fund and expressed confidence that the Investment Adviser would continue to do so in the future. The Trustees also recognized that the Investment Adviser had made significant commitments to address regulatory compliance requirements applicable to the Fund and the Investment Adviser.
Investment Performance
The Trustees also considered the investment performance of the Fund. In this regard, they compared the investment performance of the Fund to its peers using rankings compiled by the Outside Data Provider as of December 31, 2014, and updated performance information prepared by the Investment Adviser using the peer group identified by the Outside Data Provider for the one-year period ended March 31, 2015. The Trustees also reviewed the Fund’s investment performance relative to its performance benchmark. As part of this review, they considered the investment performance of the Fund in light of its investment objective and policies and market conditions.
In addition, the Trustees considered materials prepared and presentations made by the Investment Adviser’s senior management and portfolio management personnel, in which Fund performance was assessed. The Trustees also considered the
38
GOLDMAN SACHS RETIREMENT PORTFOLIO COMPLETION FUND
Statement Regarding Basis for Approval of Management Agreement (Unaudited) (continued)
Investment Adviser’s periodic reports with respect to the Fund’s risk profile, and how the Investment Adviser’s approach to risk monitoring and management influences portfolio management.
The Trustees observed that the Fund’s Institutional Shares had placed in the fourth quartile of the Fund’s peer group and had underperformed the Fund’s former benchmark index for the one-year period ended March 31, 2015. They recalled that the Fund had certain significant differences from the Fund’s peer group and the components of its composite benchmark that had caused them to be an imperfect basis for comparison. Accordingly, the Fund’s composite benchmark had been changed in February 2015 to a composite consisting of seven indices that represent the asset classes to which the Fund seeks to gain exposure.
Costs of Services Provided and Competitive Information
The Trustees considered the contractual terms of the Management Agreement and the fee rates payable by the Fund thereunder. In this regard, the Trustees considered information on the services rendered by the Investment Adviser to the Fund, which included both advisory and administrative services that were directed to the needs and operations of the Fund as a registered mutual fund.
In particular, the Trustees reviewed analyses prepared by the Outside Data Provider regarding the expense rankings of the Fund. The analyses provided a comparison of the Fund’s management fees and breakpoints to those of a relevant peer group and category universe; an expense analysis which compared the Fund’s overall net and gross expenses to a peer group and a category universe; and a one-year history comparing the Fund’s net expenses to the peer and category medians. The analyses also compared the Fund’s transfer agency, custody and distribution fees, other expenses and fee waivers/reimbursements to those of the peer group and category medians. The Trustees concluded that the comparisons provided by the Outside Data Provider were useful in evaluating the reasonableness of the management fees and total expenses paid by the Fund.
In addition, the Trustees considered the Investment Adviser’s undertakings to limit certain expenses of the Fund that exceed a specified level. They also considered, to the extent that the Investment Adviser manages other types of accounts having investment objectives and policies similar to those of the Fund, comparative fee information for services provided by the Investment Adviser to those accounts, and information that indicated that services provided to the Fund differed in various significant respects from the services provided to other types of accounts which, in many cases, operated under less stringent legal and regulatory structures, required fewer services from the Investment Adviser to a smaller number of client contact points, and were less time-intensive.
In addition, the Trustees noted that shareholders are able to redeem their Fund shares at any time if shareholders believe that the Fund fees and expenses are too high or if they are dissatisfied with the performance of the Fund.
Profitability
The Trustees reviewed the Investment Adviser’s revenues and pre-tax profit margins with respect to the Trust and the Fund. In this regard the Trustees noted that they had received, among other things, profitability analyses and summaries, revenue and expense schedules by Fund and by function (i.e., investment management, transfer agency and distribution and service), and information on the Investment Adviser’s expense allocation methodology. They observed that the profitability and expense figures are substantially similar to those used by the Investment Adviser for many internal purposes, including compensation decisions among various business groups, and are thus subject to a vigorous internal debate about how certain revenue and expenses should be allocated. The Trustees also noted that the internal audit group within the Goldman Sachs organization had audited the expense allocation methodology and was satisfied with the reasonableness, consistency, and accuracy of the Investment Adviser’s expense allocation methodology and profitability analysis calculations. Profitability data for the Trust and the Fund were provided for 2014 and 2013, and the Trustees considered this information in relation to the Investment Adviser’s overall profitability. The Trustees considered the Investment Adviser’s revenues and pre-tax profit margins both in absolute terms and in comparison to information on the reported pre-tax profit margins earned by certain other asset management firms.
Economies of Scale
The Trustees considered the information that had been provided regarding the Investment Adviser’s profitability. The Trustees also considered the breakpoints in the fee rate payable under the Management Agreement for the Fund at the following annual percentage rates of the average daily net assets of the Fund:
| | | | |
First $1 billion | | | 0.45 | % |
Next $1 billion | | | 0.41 | |
Next $3 billion | | | 0.38 | |
Next $3 billion | | | 0.37 | |
Over $8 billion | | | 0.36 | |
39
GOLDMAN SACHS RETIREMENT PORTFOLIO COMPLETION FUND
Statement Regarding Basis for Approval of Management Agreement (Unaudited) (continued)
The Trustees noted that the breakpoints were designed to share potential economies of scale, if any, with the Fund and its shareholders as assets under management reach those asset levels. The Trustees considered the amount of assets in the Fund; the Fund’s recent share purchase and redemption activity; the information provided by the Investment Adviser relating to the costs of the services provided by the Investment Adviser and its affiliates and their realized profits; information comparing fee rates charged by the Investment Adviser with fee rates charged to other funds in the peer group; and the Investment Adviser’s undertakings to limit certain expenses of the Fund that exceed a specified level. Upon reviewing these matters at the Annual Meeting, the Trustees concluded that the fee breakpoints represented a means of assuring that benefits of scalability, if any, would be passed along to shareholders at the specified asset levels.
Other Benefits to the Investment Adviser and Its Affiliates
The Trustees also considered the other benefits derived by the Investment Adviser and its affiliates from their relationships with the Fund as stated above, including: (a) transfer agency fees received by Goldman, Sachs & Co. (“Goldman Sachs”); (b) brokerage and futures commissions earned by Goldman Sachs for executing securities and futures transactions on behalf of the Fund; (c) trading efficiencies resulting from aggregation of orders of the Fund with those for other funds or accounts managed by the Investment Adviser; (d) the Investment Adviser’s ability to leverage the infrastructure designed to service the Fund on behalf of its other clients; (e) the Investment Adviser’s ability to cross-market other products and services to Fund shareholders; (f) Goldman Sachs’ retention of certain fees as Fund Distributor; (g) the Investment Adviser’s ability to negotiate better pricing with custodians on behalf of its other clients, as a result of the relationship with the Fund; and (h) the possibility that the working relationship between the Investment Adviser and the Fund’s third-party service providers may cause those service providers to be more likely to do business with other areas of Goldman Sachs. In the course of considering the foregoing, the Independent Trustees requested and received further information quantifying certain of these fall-out benefits.
Other Benefits to the Fund and Its Shareholders
The Trustees also noted that the Fund receives certain potential benefits as a result of its relationship with the Investment Adviser, including: (a) trading efficiencies resulting from aggregation of orders of the Fund with those of other funds or accounts managed by the Investment Adviser; (b) enhanced servicing from vendors because of the volume of business generated by the Investment Adviser and its affiliates; (c) enhanced servicing from broker-dealers because of the volume of business generated by the Investment Adviser and its affiliates; (d) the Investment Adviser’s ability to negotiate favorable terms with derivatives counterparties on behalf of the Fund as a result of the size and reputation of the Goldman Sachs organization; (e) the Investment Adviser’s knowledge and experience gained from managing other accounts and products; (f) the Investment Adviser’s ability to hire and retain qualified personnel to provide services to the Fund because of the reputation of the Goldman Sachs organization; (g) the Fund’s access, through the Investment Adviser, to certain firmwide resources (e.g., proprietary risk management systems and databases), subject to certain restrictions; and (h) the Fund’s access to certain affiliated distribution channels. In addition, the Trustees noted the competitive nature of the mutual fund marketplace, and considered that many of the Fund’s shareholders invested in the Fund in part because of the Fund’s relationship with the Investment Adviser and that those shareholders have a general expectation that the relationship will continue.
Conclusion
In connection with their consideration of the Management Agreement, the Trustees gave weight to each of the factors described above, but did not identify any particular factor as controlling their decision. After deliberation and consideration of all of the information provided, including the factors described above, the Trustees concluded, in the exercise of their business judgment, that the management fees paid by the Fund were reasonable in light of the services provided to it by the Investment Adviser, the Investment Adviser’s costs and the Fund’s current and reasonably foreseeable asset levels. The Trustees unanimously concluded that the Investment Adviser’s continued management likely would benefit the Fund and its shareholders and that the Management Agreement should be approved and continued with respect to the Fund until June 30, 2016.
40
GOLDMAN SACHS RETIREMENT PORTFOLIO COMPLETION FUND
Trustees and Officers (Unaudited)
Independent Trustees
| | | | | | | | | | |
Name,
Address and Age1 | | Position(s) Held with the Trust | | Term of Office and
Length of
Time Served2 | | Principal Occupation(s) During Past 5 Years | | Number of
Portfolios in
Fund Complex
Overseen by
Trustee3 | | Other Directorships Held by Trustee4 |
Ashok N. Bakhru Age: 73 | | Chairman of the Board of Trustees | | Since 1996 (Trustee since 1991) | | Mr. Bakhru is retired. He was formerly Director, Apollo Investment Corporation (a business development company) (2008-2013); President, ABN Associates (a management and financial consulting firm) (1994-1996 and 1998-2012); Trustee, Scholarship America (1998-2005); Trustee, Institute for Higher Education Policy (2003-2008); Director, Private Equity Investors — III and IV (1998-2007), and Equity-Linked Investors II (April 2002-2007). Chairman of the Board of Trustees — Goldman Sachs Fund Complex. | | 136 | | None |
Kathryn A. Cassidy Age: 61 | | Trustee | | Since 2015 | | Ms. Cassidy is retired. Formerly, she was Advisor to the Chairman (May 2014-December 2014); and Senior Vice President and Treasurer (2008-2014), General Electric Company & General Electric Capital Corporation (technology and financial services companies). Trustee — Goldman Sachs Fund Complex. | | 112 | | None |
John P. Coblentz, Jr. Age: 74 | | Trustee | | Since 2003 | | Mr. Coblentz is retired. Formerly, he was Partner, Deloitte & Touche LLP (a professional services firm) (1975-2003); Director, Emerging Markets Group, Ltd. (2004-2006); and Director, Elderhostel, Inc. (2006-2012). Trustee — Goldman Sachs Fund Complex. | | 136 | | None |
Diana M. Daniels Age: 66 | | Trustee | | Since 2007 | | Ms. Daniels is retired. Formerly, she was Vice President, General Counsel and Secretary, The Washington Post Company (1991-2006). Ms. Daniels is a Trustee Emeritus and serves as a Presidential Councillor of Cornell University (2013-Present); Member, Advisory Board, Psychology Without Borders (international humanitarian aid organization) (2007-Present), and former Member of the Legal Advisory Board, New York Stock Exchange (2003-2006) and of the Corporate Advisory Board, Standish Mellon Management Advisors (2006-2007). Trustee — Goldman Sachs Fund Complex. | | 112 | | None |
Joseph P. LoRusso Age: 58 | | Trustee | | Since 2010 | | Mr. LoRusso is retired. Formerly, he was President, Fidelity Investments Institutional Services Co. (“FIIS”) (2002-2008); Director, FIIS (2002-2008); Director, Fidelity Investments Institutional Operations Company (2003-2007); Executive Officer, Fidelity Distributors Corporation (2007-2008). Trustee — Goldman Sachs Fund Complex. | | 112 | | None |
Herbert J. Markley Age: 65 | | Trustee | | Since 2013 | | Mr. Markley is retired. Formerly, he was Executive Vice President, Deere & Company (an agricultural and construction equipment manufacturer) (2007-2009); and President, Agricultural Division, Deere & Company (2001-2007). Trustee — Goldman Sachs Fund Complex. | | 112 | | None |
Jessica Palmer Age: 66 | | Trustee | | Since 2007 | | Ms. Palmer is retired. She is Director, Emerson Center for the Arts and Culture (2011-Present); and was formerly a Consultant, Citigroup Human Resources Department (2007-2008); Managing Director, Citigroup Corporate and Investment Banking (previously, Salomon Smith Barney/Salomon Brothers) (1984-2006). Ms. Palmer was a Member of the Board of Trustees of Indian Mountain School (private elementary and secondary school) (2004-2009). Trustee — Goldman Sachs Fund Complex. | | 112 | | None |
| | | | | | | | | | |
41
GOLDMAN SACHS RETIREMENT PORTFOLIO COMPLETION FUND
Trustees and Officers (Unaudited) (continued)
Independent Trustees
| | | | | | | | | | |
Name,
Address and Age1 | | Position(s) Held with the Trust | | Term of Office and
Length of
Time Served2 | | Principal Occupation(s) During Past 5 Years | | Number of
Portfolios in
Fund Complex
Overseen by
Trustee3 | | Other Directorships Held by Trustee4 |
Richard P. Strubel Age: 76 | | Trustee | | Since 1987 | | Mr. Strubel is retired. Formerly, he served as Chairman of the Board of Trustees, Northern Funds (a family of retail and institutional mutual funds managed by Northern Trust Investments, Inc.) (2008-2014) and Trustee (1982-2014); Director, Cardean Learning Group (provider of educational services via the internet) (2003-2008); and Director, Gildan Activewear Inc. (a clothing marketing and manufacturing company) (2000-2014). He serves as Trustee Emeritus, The University of Chicago (1987-Present). Trustee — Goldman Sachs Fund Complex. | | 136 | | None |
Roy W. Templin Age: 55 | | Trustee | | Since 2013 | | Mr. Templin is retired. He is Chairman of the Board of Directors, Con-Way Incorporated (2014-Present); and was formerly Executive Vice President and Chief Financial Officer, Whirlpool Corporation (an appliance manufacturer and marketer) (2004-2012). Trustee — Goldman Sachs Fund Complex. | | 112 | | Con-Way Incorporated (a transportation, logistics and supply-chain management services company) |
Gregory G. Weaver Age: 64 | | Trustee | | Since 2015 | | Mr. Weaver is retired. He is Director, Verizon Communications Inc. (2015-Present); and was formerly Chairman and Chief Executive Officer, Deloitte & Touche LLP (a professional services firm) (2001-2005 and 2012-2014); and Member of the Board of Directors, Deloitte & Touche LLP (2006-2012). Trustee — Goldman Sachs Fund Complex. | | 112 | | Verizon Communications Inc. |
| | | | | | | | | | |
42
GOLDMAN SACHS RETIREMENT PORTFOLIO COMPLETION FUND
Trustees and Officers (Unaudited) (continued)
Interested Trustees*
| | | | | | | | | | |
Name,
Address and Age1 | | Position(s) Held with the Trust | | Term of Office and
Length of
Time Served2 | | Principal Occupation(s) During Past 5 Years | | Number of
Portfolios in
Fund Complex
Overseen by
Trustee3 | | Other Directorships Held by Trustee4 |
James A. McNamara Age: 53 | | President and Trustee | | Since 2007 | | Managing Director, Goldman Sachs (December 1998-Present); Director of Institutional Fund Sales, GSAM (April 1998-December 2000); and Senior Vice President and Manager, Dreyfus Institutional Service Corporation (January 1993- April 1998). President — Goldman Sachs Fund Complex (November 2007-Present); Senior Vice President — Goldman Sachs Fund Complex (May 2007-November 2007); and Vice President — Goldman Sachs Fund Complex (2001-2007). Trustee — Goldman Sachs Fund Complex (November 2007-Present and December 2002-May 2004). | | 135 | | None |
Alan A. Shuch Age: 65 | | Trustee | | Since 1990 | | Advisory Director — GSAM (May 1999-Present); Consultant to GSAM (December 1994-May 1999); and Limited Partner, Goldman Sachs (December 1994-May 1999). Trustee — Goldman Sachs Fund Complex. | | 112 | | None |
| | | | | | | | | | |
| * | | These persons are considered to be “Interested Trustees” because they hold positions with Goldman Sachs and own securities issued by The Goldman Sachs Group, Inc. Each Interested Trustee holds comparable positions with certain other companies of which Goldman Sachs, GSAM or an affiliate thereof is the investment adviser, administrator and/or distributor. |
| 1 | | Each Trustee may be contacted by writing to the Trustee, c/o Goldman Sachs, 200 West Street, New York, New York, 10282, Attn: Caroline Kraus. Information is provided as of October 31, 2015. |
| 2 | | Each Trustee holds office for an indefinite term until the earliest of: (a) the election of his or her successor; (b) the date the Trustee resigns or is removed by the Board of Trustees or shareholders, in accordance with the Trust’s Declaration of Trust; (c) December 31st of the year in which the Trustee turns 74 years of age, subject to waiver by a majority of the Trustees (in accordance with the current resolutions of the Board of Trustees, which may be changed by the Trustees without shareholder vote); or (d) the termination of the Trust. By resolution of the Board of Trustees determining that an extension of service would be beneficial to the Trust, the retirement age has been extended with respect to Richard P. Strubel. |
| 3 | | The Goldman Sachs Fund Complex includes the Trust and Goldman Sachs Variable Insurance Trust (“GSVIT”). As of October 31, 2015, the Trust consisted of 98 portfolios (91 of which offered shares to the public) and GSVIT consisted of 14 portfolios. The Goldman Sachs Fund Complex also includes, with respect to Messrs. Bakhru, Coblentz and Strubel, Goldman Sachs Trust II (“GSTII”), Goldman Sachs BDC, Inc. (“GSBDC”), Goldman Sachs MLP Income Opportunities Fund (“GSMLP”), Goldman Sachs MLP and Energy Renaissance Fund (“GSMER”) and Goldman Sachs ETF Trust (“GSETF”), and with respect to Mr. McNamara, GSTII, GSMLP, GSMER and GSETF. GSTII consisted of seven portfolios (six of which offered shares to the public). GSBDC, GSMLP and GSMER each consisted of one portfolio. GSETF consisted of 14 portfolios (two of which offered shares to the public). |
| 4 | | This column includes only directorships of companies required to report to the Securities and Exchange Commission under the Securities Exchange Act of 1934 (i.e., “public companies”) or other investment companies registered under the Act. |
Additional information about the Trustees is available in the Fund’s Statement of Additional Information, which can be obtained from Goldman Sachs free of charge by calling this toll-free number (in the United States of America): 1-800-526-7384.
43
GOLDMAN SACHS RETIREMENT PORTFOLIO COMPLETION FUND
Trustees and Officers (Unaudited) (continued)
Officers of the Trust*
| | | | | | |
Name, Address and Age1 | | Position(s) Held With the Trust | | Term of
Office and
Length of
Time Served2 | | Principal Occupation(s) During Past 5 Years |
James A. McNamara 200 West Street New York, NY 10282 Age: 53 | | President and Trustee | | Since 2007 | | Managing Director, Goldman Sachs (December 1998-Present); Director of Institutional Fund Sales, GSAM (April 1998-December 2000); and Senior Vice President and Manager, Dreyfus Institutional Service Corporation (January 1993-April 1998). President — Goldman Sachs Fund Complex (November 2007-Present); Senior Vice President — Goldman Sachs Fund Complex (May 2007-November 2007); and Vice President — Goldman Sachs Fund Complex (2001-2007). Trustee — Goldman Sachs Fund Complex (November 2007-Present and December 2002-May 2004). |
Caroline L. Kraus 200 West Street New York, NY 10282 Age: 38 | | Secretary | | Since 2012 | | Vice President, Goldman Sachs (August 2006-Present); Associate General Counsel, Goldman Sachs (2012-Present); Assistant General Counsel, Goldman Sachs (August 2006-December 2011); and Associate, Weil, Gotshal & Manges, LLP (2002-2006). Secretary — Goldman Sachs Fund Complex (August 2012-Present); and Assistant Secretary — Goldman Sachs Fund Complex (June 2012-August 2012). |
Scott M. McHugh 200 West Street New York, NY 10282 Age: 44 | | Principal Financial Officer, Senior Vice President and Treasurer | | Since 2009 (Principal Financial Officer since 2013) | | Vice President, Goldman Sachs (February 2007-Present); Assistant Treasurer of certain mutual funds administered by DWS Scudder (2005-2007); and Director (2005-2007), Vice President (2000-2005), and Assistant Vice President (1998-2000), Deutsche Asset Management or its predecessor (1998-2007). Principal Financial Officer — Goldman Sachs Fund Complex (November 2013-Present); Treasurer — Goldman Sachs Fund Complex (October 2009-Present); Senior Vice President — Goldman Sachs Fund Complex (November 2009-Present); and Assistant Treasurer — Goldman Sachs Fund Complex (May 2007-October 2009). |
| | | | | | |
| * | | Represents a partial list of officers of the Trust. Additional information about all the officers is available in the Fund’s Statement of Additional Information, which can be obtained from Goldman Sachs free of charge by calling this toll-free number (in the United States): 1-800-526-7384. |
| 1 | | Information is provided as of October 31, 2015. |
| 2 | | Officers hold office at the pleasure of the Board of Trustees or until their successors are duly elected and qualified. Each officer holds comparable positions with certain other companies of which Goldman Sachs, GSAM or an affiliate thereof is the investment adviser, administrator and/or distributor. |
Goldman Sachs Trust — Retirement Portfolio Completion Fund — Tax Information (Unaudited)
For the year ended October 31, 2015, 4.18% of the dividends paid from net investment company taxable income by the Retirement Portfolio Completion Fund qualify for the reduced tax rate under the Jobs and Growth Tax Relief and Reconciliation Act of 2003.
During the year ended October 31, 2015, the Retirement Portfolio Completion Fund designates $82,776 as short-term capital gain dividends pursuant to Section 871(k) of the Internal Revenue Code.
Pursuant to Section 852 of the Internal Revenue Code, the Retirement Portfolio Completion Fund designates $26,993, or if different, the maximum amount allowable, as capital gain dividends paid during the fiscal year ended October 31, 2015.
44
FUNDS PROFILE
Goldman Sachs Funds

Goldman Sachs is a premier financial services firm, known since 1869 for creating thoughtful and customized investment solutions in complex global markets.
Today, the Investment Management Division of Goldman Sachs serves a diverse set of clients worldwide, including private institutions, public entities and individuals. With approximately $1.02 trillion in assets under supervision as of September 30, 2015, Goldman Sachs Asset Management (“GSAM”) has portfolio management teams located around the world and our investment professionals bring firsthand knowledge of local markets to every investment decision. Assets under supervision includes assets under management and other client assets for which Goldman Sachs does not have full discretion. GSAM leverages the resources of Goldman, Sachs & Co. subject to legal, internal and regulatory restrictions.
Money Market1
Financial Square FundsSM
| n | | Financial Square Tax-Exempt Funds |
| n | | Financial Square Tax-Free Money Market Fund |
| n | | Financial Square Treasury Solutions Fund2 |
| n | | Financial Square Government Fund |
| n | | Financial Square Money Market Fund |
| n | | Financial Square Prime Obligations Fund |
| n | | Financial Square Treasury Instruments Fund |
| n | | Financial Square Treasury Obligations Fund |
| n | | Financial Square Federal Instruments Fund |
Fixed Income
Short Duration and Government
| n | | High Quality Floating Rate Fund |
| n | | Limited Maturity Obligations Fund |
| n | | Short Duration Government Fund |
| n | | Short Duration Income Fund |
| n | | Inflation Protected Securities Fund |
Multi-Sector
Municipal and Tax-Free
| n | | High Yield Municipal Fund |
| n | | Dynamic Municipal Income Fund3 |
| n | | Short Duration Tax-Free Fund |
Single Sector
| n | | Investment Grade Credit Fund |
| n | | High Yield Floating Rate Fund |
| n | | Emerging Markets Debt Fund |
| n | | Local Emerging Markets Debt Fund |
| n | | Dynamic Emerging Markets Debt Fund |
Fixed Income Alternatives
| n | | Long Short Credit Strategies Fund |
| n | | Fixed Income Macro Strategies Fund |
Fundamental Equity
| n | | Small/Mid Cap Value Fund |
| n | | Small/Mid Cap Growth Fund |
| n | | Flexible Cap Growth Fund |
| n | | Concentrated Growth Fund |
| n | | Technology Opportunities Fund4 |
| n | | Growth Opportunities Fund |
| n | | Rising Dividend Growth Fund |
| n | | Dynamic U.S. Equity Fund5 |
Tax-Advantaged Equity
| n | | U.S. Tax-Managed Equity Fund |
| n | | International Tax-Managed Equity Fund |
| n | | U.S. Equity Dividend and Premium Fund |
| n | | International Equity Dividend and Premium Fund |
Equity Insights
| n | | Small Cap Equity Insights Fund |
| n | | U.S. Equity Insights Fund |
| n | | Small Cap Growth Insights Fund |
| n | | Large Cap Growth Insights Fund |
| n | | Large Cap Value Insights Fund |
| n | | Small Cap Value Insights Fund |
| n | | International Small Cap Insights Fund |
| n | | International Equity Insights Fund |
| n | | Emerging Markets Equity Insights Fund |
Fundamental Equity International
| n | | Strategic International Equity Fund |
| n | | Focused International Equity Fund |
| n | | International Small Cap Fund |
| n | | Emerging Markets Equity Fund6 |
Select Satellite7
| n | | Real Estate Securities Fund |
| n | | International Real Estate Securities Fund |
| n | | Global Real Estate Securities Fund |
| n | | Commodity Strategy Fund |
| n | | Dynamic Commodity Strategy Fund |
| n | | Dynamic Allocation Fund |
| n | | Absolute Return Tracker Fund |
| n | | Managed Futures Strategy Fund |
| n | | MLP Energy Infrastructure Fund |
| n | | Multi-Manager Alternatives Fund |
| n | | Multi-Asset Real Return Fund |
| n | | Retirement Portfolio Completion Fund |
| n | | Absolute Return Multi-Asset Fund |
Total Portfolio Solutions7
| n | | Global Managed Beta Fund |
| n | | Multi-Manager Non-Core Fixed Income Fund |
| n | | Multi-Manager U.S. Dynamic Equity Fund |
| n | | Multi-Manager Global Equity Fund |
| n | | Multi-Manager International Equity Fund |
| n | | Tactical Tilt Implementation Fund |
| n | | Balanced Strategy Portfolio |
| n | | Multi-Manager Real Assets Strategy Fund |
| n | | Growth and Income Strategy Portfolio |
| n | | Growth Strategy Portfolio |
| n | | Equity Growth Strategy Portfolio |
| n | | Satellite Strategies Portfolio |
| n | | Enhanced Dividend Global Equity Portfolio |
| n | | Tax Advantaged Global Equity Portfolio |
| 1 | | An investment in a money market fund is neither insured nor guaranteed by the Federal Deposit Insurance Corporation (“FDIC”) or any other government agency. Although the Funds seek to preserve the value of your investment at $1.00 per share, it is possible to lose money by investing in the Funds. |
| 2 | | Effective on September 30, 2015, the Goldman Sachs Financial Square Federal Fund was renamed the Goldman Sachs Financial Square Treasury Solutions Fund. |
| 3 | | Effective on December 18, 2014, the Goldman Sachs Municipal Income Fund was renamed the Goldman Sachs Dynamic Municipal Income Fund. |
| 4 | | Effective on July 31, 2015, the Goldman Sachs Technology Tollkeeper Fund was renamed the Goldman Sachs Technology Opportunities Fund. |
| 5 | | Effective on April 30, 2015, the Goldman Sachs U.S. Equity Fund was renamed the Goldman Sachs Dynamic U.S. Equity Fund. |
| 6 | | Effective at the close of business on October 23, 2015, the Goldman Sachs BRIC Fund (Brazil, Russia, India, China) was reorganized with and into the Goldman Sachs Emerging Markets Equity Fund. |
| 7 | | Individual Funds within the Total Portfolio Solutions and Select Satellite categories will have various placement on the risk/return spectrum and may have greater or lesser risk than that indicated by the placement of the general Total Portfolio Solutions or Select Satellite category. |
Financial Square FundsSM is a registered service mark of Goldman, Sachs & Co.
| *This | | list covers open-end funds only. Please visit our website at www.GSAMFUNDS.com to learn about our closed-end funds and exchange-traded funds. |
| | |
TRUSTEES Ashok N. Bakhru, Chairman Kathryn A. Cassidy John P. Coblentz, Jr. Diana M. Daniels Joseph P. LoRusso Herbert J. Markley James A. McNamara Jessica Palmer Alan A. Shuch Richard P. Strubel Roy W. Templin Gregory G. Weaver | | OFFICERS James A. McNamara, President Scott M. McHugh, Principal Financial Officer and Treasurer Caroline L. Kraus, Secretary |
| |
GOLDMAN, SACHS & CO. Distributor and Transfer Agent | | GOLDMAN SACHS ASSET MANAGEMENT, L.P. Investment Adviser |
Visit our Website at www.GSAMFUNDS.com to obtain the most recent month-end returns.
Goldman Sachs Asset Management, L.P. 200 West Street, New York, New York 10282
The reports concerning the Fund included in this shareholder report may contain certain forward-looking statements about the factors that may affect the performance of the Fund in the future. These statements are based on Fund management’s predictions and expectations concerning certain future events and their expected impact on the Fund, such as performance of the economy as a whole and of specific industry sectors, changes in the levels of interest rates, the impact of developing world events, and other factors that may influence the future performance of the Fund. Management believes these forward-looking statements to be reasonable, although they are inherently uncertain and difficult to predict. Actual events may cause adjustments in portfolio management strategies from those currently expected to be employed.
A description of the policies and procedures that the Fund uses to determine how to vote proxies relating to portfolio securities and information regarding how the Fund voted proxies relating to portfolio securities for the most recent 12-month period ended June 30, are available (I) without charge, upon request by calling 1-800-526-7384; and (II) on the Securities and Exchange Commission (“SEC’’) web site at http://www.sec.gov.
The Fund files its complete schedule of portfolio holdings with the Securities and Exchange Commission (“SEC”) for the first and third quarters of each fiscal year on Form N-Q. The Fund’s Forms N-Q are available on the SEC’s web site at http://www.sec.gov within 60 days after the Fund’s first and third fiscal quarters. The Fund’s Forms N-Q may be reviewed and copied at the SEC’s Public Reference Room in Washington, D.C. and information on the operation of the Public Reference Room may also be obtained by calling 1-800-SEC-0330. Form N-Q may be obtained upon request and without charge by calling 1-800-526-7384 (for Retail Shareholders) or 1-800-621-2550 (for Institutional Shareholders).
Fund Holdings and allocations shown are as of October 31, 2015 and may not be representative of future investments. Fund holdings should not be relied on in making investment decisions and should not be construed as research or investment advice regarding particular securities. Current and future holdings are subject to risk.
The Global Industry Classification Standard (GICS) was developed by and is the exclusive property and a service mark of Morgan Stanley Capital International Inc. (MSCI) and Standard & Poor’s, a division of The McGraw-Hill Companies, Inc. (S&P) and is licensed for use by Goldman Sachs. Neither MSCI, S&P nor any other party involved in making or compiling the GICS or any GICS classifications makes any express or implied warranties or representations with respect to such standard or classification (or the results to be obtained by the use thereof), and all such parties hereby expressly disclaim all warranties of originality, accuracy, completeness, merchantability or fitness for a particular purpose with respect to any of such standard or classification. Without limiting any of the foregoing, in no event shall MSCI, S&P, any of their affiliates or any third party involved in making or compiling the GICS or any GICS classifications have any liability for any direct, indirect, special, punitive, consequential or any other damages (including lost profits) even if notified of the possibility of such damages.
The portfolio risk management process includes an effort to monitor and manage risk, but does not imply low risk.
This material is not authorized for distribution to prospective investors unless preceded or accompanied by a current Prospectus or summary prospectus, if applicable. Investors should consider a Fund’s objective, risks, and charges and expenses, and read the summary prospectus, if available, and/or the Prospectus carefully before investing or sending money. The summary prospectus, if available, and the Prospectus contain this and other information about a Fund and may be obtained from your authorized dealer or from Goldman, Sachs & Co. by calling (retail – 1-800-526-7384) (institutional – 1-800-621-2550).
© 2015 Goldman Sachs. All rights reserved. 21882-TEMPL-12/2015 RETCOMAR-15/139
| | (a) | As of the end of the period covered by this report, the registrant has adopted a code of ethics that applies to the registrant’s principal executive officer, principal financial officer, principal accounting officer or controller, or persons performing similar functions, regardless of whether these individuals are employed by the registrant or a third party (the “Code of Ethics”). |
| | (b) | During the period covered by this report, no amendments were made to the provisions of the Code of Ethics. |
| | (c) | During the period covered by this report, the registrant did not grant any waivers, including an implicit waiver, from any provision of the Code of Ethics. |
| | (d) | A copy of the Code of Ethics is available as provided in Item 12(a)(1) of this report. |
| ITEM 3. | AUDIT COMMITTEE FINANCIAL EXPERT. |
| | The registrant’s board of trustees has determined that the registrant has at least one “audit committee financial expert” (as defined in Item 3 of Form N-CSR) serving on its audit committee. Gregory G. Weaver is the “audit committee financial expert” and is “independent” (as each term is defined in Item 3 of Form N-CSR). |
| ITEM 4. | PRINCIPAL ACCOUNTANT FEES AND SERVICES. |
Table 1 — Items 4(a) - 4(d). The accountant fees below reflect the aggregate fees billed by all of the Funds of the Goldman Sachs Trust and includes the Goldman Sachs Funds to which this certified shareholder report relates.
| | | | | | | | | | | | |
| | | 2015 | | 2014 | | Description of Services Rendered |
| | | |
| | | | | | | | | | | | |
| | | |
Audit Fees: | | | | | | | | | | | | |
| | | |
• PricewaterhouseCoopers LLP
(“PwC”) | | | $ | 3,662,967 | | | | $ | 3,539,534 | | | Financial Statement audits. |
| | | |
Audit-Related Fees: | | | | | | | | | | | | |
| | | |
• PwC | | | $ | 138,000 | | | | $ | 0 | | | Other attest services. |
| | | |
Tax Fees: | | | | | | | | | | | | |
| | | |
• PwC | | | $ | 848,676 | | | | $ | 794,850 | | | Tax compliance services provided in connection with the preparation and review of registrant’s tax returns. |
Table 2 — Items 4(b)(c) & (d). Non-Audit Services to the Goldman Sachs Trust’s service affiliates * that were pre-approved by the Audit Committee of the Goldman Sachs Trust pursuant to Rule 2-01(c)(7)(ii) of Regulation S-X.
| | | | | | | | | | | | |
| | | 2015 | | 2014 | | Description of Services Rendered |
| | | |
| | | | | | | | | | | | |
| | | |
Audit-Related Fees: | | | | | | | | | | | | |
| | | |
• PwC | | | $ | 1,653,616 | | | | $ | 1,486,420 | | | Internal control review performed in accordance with Statement on Standards for Attestation Engagements No. 16 and semi annual updates relating to withholding tax accrual for non-US jurisdictions. These fees are borne by the Funds’ Adviser. |
| * | These include the advisor (excluding sub-advisors) and any entity controlling, controlled by or under common control with the advisor that provides ongoing services to the registrant (hereinafter referred to as “service affiliates”). |
Item 4(e)(1) — Audit Committee Pre-Approval Policies and Procedures
Pre-Approval of Audit and Non-Audit Services Provided to the Funds of the Goldman Sachs Trust. The Audit and Non-Audit Services Pre-Approval Policy (the “Policy”) adopted by the Audit Committee of Goldman Sachs Trust (“GST”) sets forth the procedures and the conditions pursuant to which services performed by an independent auditor for GST may be pre-approved. Services may be pre-approved specifically by the Audit Committee as a whole or, in certain circumstances, by the Audit Committee Chairman or the person designated as the Audit Committee Financial Expert. In addition, subject to specified cost limitations, certain services may be pre-approved under the provisions of the Policy. The Policy provides that the Audit Committee will consider whether the services provided by an independent auditor are consistent with the Securities and Exchange Commission’s rules on auditor independence. The Policy provides for periodic review and pre-approval by the Audit Committee of the services that may be provided by the independent auditor.
De Minimis Waiver. The pre-approval requirements of the Policy may be waived with respect to the provision of non-audit services that are permissible for an independent auditor to perform, provided (1) the aggregate amount of all such services provided constitutes no more than five percent of the total amount of revenues subject to pre-approval that was paid to the independent auditors during the fiscal year in which the services are provided; (2) such services were not recognized by GST at the time of the engagement to be non-audit services; and (3) such services are promptly brought to the attention of the Audit Committee and approved prior to the completion of the audit by the Audit Committee or by one or more members of the Audit Committee to whom authority to grant such approvals has been delegated by the Audit Committee, pursuant to the pre-approval provisions of the Policy.
Pre-Approval of Non-Audit Services Provided to GST’s Investment Advisers. The Policy provides that, in addition to requiring pre-approval of audit and non-audit services provided to GST, the Audit Committee will pre-approve those non-audit services provided to GST’s investment advisers (and entities controlling, controlled by or under common control with the investment advisers that provide ongoing services to GST) where the engagement relates directly to the operations or financial reporting of GST.
Item 4(e)(2) – 0% of the audit-related fees, tax fees and other fees listed in Table 1 were approved by GST’s Audit Committee pursuant to the “de minimis” exception of Rule 2-01(c)(7)(i)(C) of Regulation S-X. In addition, 0% of the non-audit services to the GST’s service affiliates listed in Table 2 were approved by GST’s Audit Committee pursuant to the “de minimis” exception of Rule 2-01(c)(7)(i)(C) of Regulation S-X.
Item 4(f) – Not applicable.
Item 4(g) Aggregate Non-Audit Fees Disclosure
The aggregate non-audit fees billed to GST by PwC for the twelve months ended October 31, 2015 and October 31, 2014 were approximately $986,676 and $794,850 respectively. The aggregate non-audit fees billed to GST’s adviser and service affiliates by PwC for non-audit services for the twelve months ended December 31, 2014 and December 31, 2013 were approximately $10.2 million and $9.8 million respectively. The figures for these entities are not yet available for the twelve months ended December 31, 2015. With regard to the aggregate non-audit fees billed to GST’s adviser and service affiliates, the 2014 and 2013 amounts include fees for non-audit services required to be pre-approved [see Table 2] and fees for non-audit services that did not require pre-approval since they did not directly relate to GST’s operations or financial reporting.
Item 4(h) — GST’s Audit Committee has considered whether the provision of non-audit services to GST’s investment adviser and service affiliates that did not require pre-approval pursuant to paragraph (c)(7)(ii) of Rule 2-01 of Regulation S-X is compatible with maintaining the auditors’ independence.
| ITEM 5. | AUDIT COMMITTEE OF LISTED REGISTRANTS. |
| ITEM 6. | SCHEDULE OF INVESTMENTS. |
| | Schedule of Investments is included as part of the Report to Stockholders filed under Item 1. |
| ITEM 7. | DISCLOSURE OF PROXY VOTING POLICIES AND PROCEDURES FOR CLOSED-END MANAGEMENT INVESTMENT COMPANIES. |
| ITEM 8. | PORTFOLIO MANAGERS OF CLOSED-END MANAGEMENT INVESTMENT COMPANIES. |
| ITEM 9. | PURCHASES OF EQUITY SECURITIES BY CLOSED-END MANAGEMENT INVESTMENT COMPANY AND AFFILIATED PURCHASERS. |
| ITEM 10. | SUBMISSION OF MATTERS TO A VOTE OF SECURITY HOLDERS. |
| | There have been no material changes to the procedures by which shareholders may recommend nominees to the registrant’s board of trustees. |
| ITEM 11. | CONTROLS AND PROCEDURES. |
| | (a) | The registrant’s principal executive and principal financial officers, or persons performing similar functions have concluded that the registrant’s disclosure controls and procedures (as defined in Rule 30a-3(c) under the Investment Company Act of 1940, as amended (the “1940 Act”)) are effective as of a date within 90 days of the filing of this report that includes the disclosure required by this paragraph, based on the evaluation of these controls and procedures required by Rule 30a-3(b) under the 1940 Act and 15d-15(b) under the Securities Exchange Act of 1934, as amended. |
| | (b) | There were no changes in the registrant’s internal control over financial reporting (as defined in Rule 30a-3(d) under the 1940 Act) that occurred during the registrant’s most recent fiscal quarter of the period covered by this report that have materially affected, or are reasonably likely to materially affect, the registrant’s internal control over financial reporting. |
| | | | |
| (a)(1) | | Goldman Sachs Trust’s Code of Ethics for Principal Executive and Senior Financial Officers is incorporated by reference to Exhibit 12(a)(1) of the registrant’s Form N-CSR filed on July 8, 2015 for its International Equity Insights Funds. |
| | |
| (a)(2) | | Exhibit 99.CERT | | Certifications pursuant to Section 302 of the Sarbanes-Oxley Act of 2002 filed herewith. |
| | |
| (b) | | Exhibit 99.906CERT | | Certifications pursuant to Section 906 of the Sarbanes-Oxley Act of 2002 filed herewith. |
SIGNATURES
Pursuant to the requirements of the Securities Exchange Act of 1934 and the Investment Company Act of 1940, the registrant has duly caused this report to be signed on its behalf by the undersigned, thereunto duly authorized.
| | |
| | | Goldman Sachs Trust |
| |
| By: | | /s/ James A. McNamara |
| |
| | |
| | James A. McNamara |
| | President/Chief Executive Officer |
| | Goldman Sachs Trust |
| |
| Date: | | January 7, 2016 |
Pursuant to the requirements of the Securities Exchange Act of 1934 and the Investment Company Act of 1940, this report has been signed below by the following persons on behalf of the registrant and in the capacities and on the dates indicated.
| | |
| By: | | /s/ James A. McNamara |
| |
| | |
| | James A. McNamara |
| | President/Chief Executive Officer |
| | Goldman Sachs Trust |
| |
| Date: | | January 7, 2016 |
| |
| By: | | /s/ Scott McHugh |
| |
| | |
| | Scott McHugh |
| | Principal Financial Officer |
| | Goldman Sachs Trust |
| |
| Date: | | January 7, 2016 |