UNITED STATES
SECURITIES AND EXCHANGE COMMISSION
Washington, D.C. 20549
FORM N-CSR
CERTIFIED SHAREHOLDER REPORT OF REGISTERED
MANAGEMENT INVESTMENT COMPANIES
Investment Company Act file number 811-05349
Goldman Sachs Trust
(Exact name of registrant as specified in charter)
71 South Wacker Drive, Chicago, Illinois 60606
(Address of principal executive offices) (Zip code)
| | |
| Caroline Kraus, Esq. | | Copies to: |
| Goldman, Sachs & Co. | | Geoffrey R.T. Kenyon, Esq. |
| 200 West Street | | Dechert LLP |
| New York, New York 10282 | | 100 Oliver Street |
| | 40th Floor |
| | Boston, MA 02110-2605 |
(Name and address of agents for service)
Registrant’s telephone number, including area code: (312) 655-4400
Date of fiscal year end: December 31
Date of reporting period: December 31, 2015
| ITEM 1. | REPORTS TO STOCKHOLDERS. |
| | The Annual Report to Shareholders is filed herewith. |
Goldman Sachs Funds

| | | | |
| | |
| Annual Report | | | | December 31, 2015 |
| | |
| | | | Long Short Fund |

Goldman Sachs Long Short Fund
| | | | |
TABLE OF CONTENTS | | | | |
| |
Principal Investment Strategies and Risks | | | 1 | |
| |
Investment Process | | | 2 | |
| |
Portfolio Management Discussion and Performance Summaries | | | 3 | |
| |
Schedule of Investments | | | 13 | |
| |
Financial Statements | | | 18 | |
| |
Financial Highlights | | | 22 | |
| |
Notes to Financial Statements | | | 24 | |
| |
Report of Independent Registered Accounting Firm | | | 39 | |
| |
Other Information | | | 40 | |
| | | | |
| | | |
| NOT FDIC-INSURED | | May Lose Value | | No Bank Guarantee |
GOLDMAN SACHS LONG SHORT FUND
Principal Investment Strategies and Risks
This is not a complete list of risks that may affect the Fund. For additional information concerning the risks applicable to the Fund, please see the Fund’s Prospectus.
The Goldman Sachs Long Short Fund invests primarily in the global equity markets, with a focus on securities listed on North American and European exchanges, through the use of long and/or short positions. The Fund may also invest in global fixed income, commodity and currency instruments. The Fund’s equity investments are subject to market risk, which means that the value of the securities in which it invests may go up or down in response to the prospects of individual companies, particular sectors or governments and/or general economic conditions. The securities of mid-and small-capitalization companies involve greater risks than those associated with larger, more established companies and may be subject to more abrupt or erratic price movements. The Fund’s fixed income investments are subject to the risks associated with debt securities generally, including credit, liquidity and interest rate risk. High yield, lower rated investments involve greater price volatility and present greater risks than higher rated fixed income securities. Foreign and emerging markets investments may be more volatile and less liquid than investments in U.S. securities and are subject to the risks of currency fluctuations and adverse economic or political developments. Derivative instruments (including swaps and forward foreign currency transactions) may involve a high degree of financial risk. These risks include the risk that small movements in the price of the underlying security or benchmark may result in a disproportionately large movement, unfavorable or favorable, in the price of the derivative instrument; risk of default by a counterparty; and liquidity risk. The Fund is subject to the risks associated with short selling of securities, which involves leverage of the Fund’s assets and presents various other risks. The Fund may be obligated to cover its short position at a higher price than the short price, resulting in a loss. Losses on short sales are potentially unlimited as a loss occurs when the value of a security sold short increases. The Fund’s borrowing and use of derivatives result in leverage, which can make the Fund more volatile. The Fund’s investments in other investment companies (including exchange-traded funds) subject it to additional expenses. At times, the Fund may be unable to sell certain of its illiquid investments without a substantial drop in price, if at all. Different investment styles tend to shift in and out of favor, and at times the Fund may underperform other funds that invest in similar asset classes. Certain shareholders, including clients or affiliates of the investment adviser, may from time to time own or control a significant percentage of the Fund’s shares. Redemptions by these shareholders of their shares of the Fund may impact the Fund’s liquidity and NAV. The Fund is “non-diversified” and may invest more of its assets in fewer issuers than “diversified” funds. Accordingly, the Fund may be more susceptible to adverse developments affecting any single issuer held in its portfolio and to greater losses resulting from these developments.
The investment program of the Fund is speculative, entails substantial risks and includes alternative investment techniques not employed by traditional mutual funds. The Fund should not be relied upon as a complete investment program. The Fund’s investment techniques (if they do not perform as designed) may increase the volatility of performance and the risk of investment loss, including the loss of the entire amount that is invested, and there can be no assurance that the investment objective of the Fund will be achieved.
1
GOLDMAN SACHS LONG SHORT FUND
What Differentiates Goldman Sachs’ Long Short Fund Investment Process?
The Fund seeks long-term growth of capital. We pursue potentially attractive risk-adjusted returns through stock selection, market insights, and risk management. Investment ideas are generated from the deep industry knowledge of the Goldman Sachs Investment Strategies (“GSIS”) team and the top-down views of the team’s leadership. Deep fundamental bottom-up research is at the core of every investment in the Fund. Our team-based and opportunistic approach seeks to drive allocations to attractive investment opportunities.

| n | | The Fund pursues high conviction investments in global equity markets, focusing on North America and Europe. Investment ideas are generated through fundamental, bottom up research, and generally based on secular changes that will positively or negatively impact companies. |
| n | | We seek to identify idiosyncratic investments with asymmetric risk/return profiles and identifiable catalysts. |

| n | | The Fund actively hedges the portfolio’s long positions against security specific and sector risk. We also dynamically adjust the Fund’s exposure to the broad equity markets, seeking to be less exposed to broader equity market moves. |

| n | | Our investment team has a long history extending back four decades and has managed a global long/short strategy since 2008. The team has a global footprint with offices in New York, London, Hong Kong, Tokyo and Bangalore. |
GS Investment Strategies, LLC, the investment manager of the Funds, is a US-registered investment adviser and is a wholly-owned subsidiary of The Goldman Sachs Group, Inc.
2
PORTFOLIO RESULTS
Goldman Sachs Long Short Fund
Investment Objective And Principal Strategy
The Fund seeks long-term growth of capital.
Portfolio Management Discussion and Analysis
Below, the Goldman Sachs Investment Strategies (“GSIS”) Team (the “Team”) discusses the Goldman Sachs Long Short Fund’s (the “Fund”) performance and positioning for the 12-month period ended December 31, 2015 (the “Reporting Period”).
| Q | | How did the Fund perform during the Reporting Period? |
| A | | During the Reporting Period, the Fund’s Class A, Class C, Institutional, Class IR and Class R Shares generated average annual total returns of -9.32%, -9.99%, -8.93%, -9.06% and -9.49%, respectively. These returns compare to the 0.25% average annual total return of the Fund’s primary benchmark, the Bank of America Merrill Lynch U.S. Dollar Three-Month LIBOR Constant Maturity Index (the “Index”) during the same time period. |
| | References to the Fund’s benchmark and to other indices mentioned herein are for informational purposes only, and unless otherwise noted, are not an indication of how the Fund is managed. The use of the Index as the Fund’s benchmark does not imply the Fund is being managed like cash and does not imply low risk or low volatility. |
| Q | | What economic and market factors most influenced the financial markets as a whole during the Reporting Period? |
| A | | The Reporting Period was an uneven ride for investors. Unstable oil prices, quantitative easing in Europe, uncertain economic and political climate in Greece, decelerating economy and equity market sell-off in China, volatility in the currency markets and emerging markets, and vacillating anticipation about the timing and degree of the Federal Reserve’s (the “Fed”) first interest rate increase in more than nine years were just some of the contributing factors to the markets’ choppy returns. Overall, global equity markets generated divergent performance. The MSCI World Index (with dividends), representing global equity markets, posted a return of -0.85%. However, the MSCI Emerging Markets Index, representing emerging equity markets, returned -16.96%. European equity markets, as measured by the Stoxx Europe 600 Index, posted a 6.79% gain during the Reporting Period, despite uncertainties in Greece, buoyed by quantitative easing by the European Central Bank. Japanese equity markets rallied 9.07%, as measured by the Nikkei 225 Index, for the same period. Chinese equity markets saw an even stronger rally, as evidenced by the 9.41% return of the Shanghai Composite, as China’s slowing economy raised expectations of additional stimulus by its government. The U.S. equity market shed most of its early 2015 gains, with the S&P 500® Index (with dividends), representing the U.S. equity market, ending almost flat with a 12-month return of 1.38%. Within the U.S. equity market, however, there was similar divergence as on the global scale, with small-cap equities, as measured by the Russell 2000® Index, returning -5.71% during the Reporting Period, while large-cap equities, as measured by the Russell 1000® Index, returned 0.92%. Volatility and market swings were evident virtually throughout the Reporting Period — especially in February, June, September and December 2015, reaching the highest levels seen since 2011. (All returns are in U.S. dollar terms.) |
| Q | | What key factors were responsible for the Fund’s performance during the Reporting Period? |
| A | | In seeking to achieve its investment objective, the Fund primarily takes long and/or short positions in the global equity markets, with a focus on securities listed on North American and European exchanges. The Fund may also invest in global fixed income, commodity and currency instruments. The Team employs an opportunistic investment approach and pursues asymmetric risk-reward opportunities, which are those that the Team believes have a greater potential for gains than losses. While the Fund will not be limited to any predetermined investment strategies, the Fund |
3
PORTFOLIO RESULTS
| | will primarily employ long/short equity and event driven investment strategies. |
| | The Fund generated negative absolute returns for the Reporting Period overall. The Fund generated positive absolute returns through July 2015, but the Fund then saw a double-digit performance drawdown between August and October 2015 amidst a volatile environment for equity markets and hedge funds, characterized by a significant risk reduction by many hedge funds in the August/September 2015 span. The negative performance for the August through October 2015 period was mainly due to substantial sell-offs in several of the Fund’s largest long positions in health care, financials and cable companies. During this period, the Fund’s market hedges performed as expected and helped mitigate some of the market volatility. However, it is important to highlight that the Fund’s hedges are generally not designed to mitigate negative alpha from the Fund’s portfolio position, as this is precisely the risk we are taking in the Fund and how we typically seek to generate returns over the long term (Alpha is defined as a measure of performance on a risk-adjusted basis or the differential in the return from the Fund’s benchmark). The Fund rebounded and had positive absolute returns in November and December 2015, even though the global equity market, as measured by the MSCI World Index, declined in these months. |
| | Overall, both long positions and short positions in equities detracted from Fund results during the Reporting Period. Several of the Fund’s positions had an event-driven component to them. During the Reporting Period, the Fund made no investments in fixed income and commodity instruments. The Fund used currency instruments to manage foreign currency risk. |
| Q | | Which equity market sectors most significantly affected Fund performance? |
| A | | Detracting most from the Fund’s performance were long positions in the health care, consumer discretionary and financials sectors. The only two sectors that contributed positively to the Fund’s results during the Reporting Period were long positions in the information technology and consumer staples sectors. |
| Q | | Which stocks detracted significantly from the Fund’s performance during the Reporting Period? |
| A | | Detracting from the Fund’s results were long positions in specialty pharmaceuticals company Valeant Pharmaceuticals International, cable-based and mobile telephony services provider Altice and specialty pharmaceuticals company Mallinckrodt. |
| | Valeant Pharmaceuticals International experienced a double-digit share price decline during the Reporting Period. While the company delivered strong fundamental performance and consummated a transaction with Salix, Valeant Pharmaceuticals International’s stock came under significant pressure after a series of allegations by short sellers, including fraud and inappropriate activity by a specialty pharmacy, Philidor, with which the company was affiliated. Ultimately, Philidor was shut down and replaced by a partnership with Walgreens Boots Alliance, which we think could prove to be meaningfully more attractive than Philidor would have been. Valeant Pharmaceuticals International’s stock started to retrace after this announcement and following the issuance of slightly better than expected 2016 guidance in mid-December 2015. Toward the end of the Reporting Period, the company’s Chief Executive Officer (“CEO”) Mike Pearson was hospitalized due to severe pneumonia, and Howard Schiller, board member and former Chief Financial Officer, stepped in as interim CEO just after the close of the Reporting Period in early January 2016. We think this is a positive outcome given the circumstances and believe Howard is highly capable and shares a similar vision as Mike and the board. With its stock trading at less than 6.5x 2016 anticipated earnings at the end of the Reporting Period, we believe there is room for upside in the company’s stock. |
| | Shares of Altice also posted a double-digit decline during the Reporting Period. After strong performance in the first half of 2015, Altice, based in the Netherlands, sold off in the second half of the calendar year, as investors grew concerned with the company’s relatively levered balance sheet after announcing its acquisition of Cablevision in the U.S. Cablevision faces stiff competition from Verizon’s fiber product, FIOS, and thus a potentially challenging revenue development in the future, which, in our view, drove investors’ concerns since summer 2015. At the end of the Reporting Period, we believed Altice was in the middle of a transition. In the past 24 months, Altice made at least four transformational acquisitions, which were large for its size. The company at the end of 2015 was refocusing from a merger and acquisition-driven story to an integration and operations-focused one. In 2016, Altice is expected to be reporting the first few quarters under its management for each of these businesses. The market was critically scrutinizing Altice’s management’s bullish view on the |
4
PORTFOLIO RESULTS
| | turnaround and was taking a more skeptical view. We believe that Altice’s turnaround plan in France, Portugal and the U.S. is credible, having spoken to many industry experts familiar with its assets and with its management style. We further believe that Altice may well close the gap to fair value during the next three to four quarters should these improvements become visible in quarterly reporting. |
| | Mallinckrodt saw its shares decline in double-digits during the Reporting Period as well, with most of the downside coming during the second half of 2015. The company reported strong earnings for its fiscal third quarter ending June 30, 2015. However, its management reduced the near-term growth outlook of its key product Acthar, while re-affirming the long-term growth prospects for the drug. Mallinckrodt also re-based consensus expectations for its generics business. These events drove a reduction in forward-looking consensus estimates. Later during the quarter, ANI Pharma announced the acquisition of two products from Merck that could potentially compete with Acthar in the long term. We believe it will be difficult for ANI Pharma to bring these products to market due to high regulatory hurdles. Mallinckrodt’s shares then traded down further in September 2015, driven by weakness in the industry broadly, continued concerns about its major product Acthar and worries about high drug pricing in the U.S. dragging down the broader specialist pharmaceuticals industry. In December 2015, Mallinckrodt traded up. During the month, its management team provided more information on its clinical studies to support and expand the indications for Acthar. The company also provided more information on its recent two acquisitions of Ikaria and Therakos and announced the acquisition of three hospital drugs from The Medicines Company. At the end of the Reporting Period, we believed these acquisitions could be modestly accretive to the company’s earnings per share from 2017 forward. |
| Q | | What were some of the Fund’s best-performing individual stocks? |
| A | | The Fund benefited most from long positions in health care products and services provider Fresenius, semiconductor device manufacturer Avago Technologies and outdoor advertising structure real estate investment trust Lamar Advertising. |
| | Shares of Fresenius saw a double-digit gain during the Reporting Period. The company delivered organic earnings growth materially in excess of its management’s guidance and of market expectations. Such results were driven primarily by new intravenous drug launches at Fresenius Kabi North America (“Kabi”), one of its business units. Following the lifting of the Food and Drug Administration (“FDA”) warning letter for its main Grand Island manufacturing facility in January 2015, the FDA began to approve Fresenius’ delayed drug applications in a relatively rapid and steady fashion throughout the Reporting Period. This led to increases in Kabi’s organic sales guidance each reported quarter from the first quarter of 2015 through the third quarter of 2015. Kabi was also Fresenius’ most profitable unit, so the strong organic sales growth it experienced translated into an outsized contribution to the company’s overall earnings. Further, Fresenius benefited from the weakening euro/U.S. dollar exchange rate during the Reporting Period. Fresenius’ share price strength allowed the Fund to take profits at what we believed to be good levels, and we fully exited the position during the fourth quarter of 2015. |
| | Avago Technologies, a new purchase for the Fund during the Reporting Period, enjoyed a double-digit share price gain in 2015. The company announced a merger with Broadcom, a silicon semiconductor maker that provides solutions for a variety of connectivity and networking applications. To many observers, Broadcom has all the defining features of an ideal Avago Technologies acquisition target — high gross margins and dominant franchises across several end markets marred by loose cost management and a high-risk research and development strategy. While Broadcom will be Avago Technologies’ largest acquisition to date, we believe the company’s playbook of rationalizing spending, optimizing pricing and business development and focusing research and development on high-value initiatives should allow the company to extract greater synergies than the market was pricing in at the end of the Reporting Period. Moreover, in our view, Broadcom’s wireless and networking businesses are a good strategic complement to Avago Technologies’ existing portfolio. Even beyond the potential upside from the Broadcom acquisition, scheduled to close in February 2016, we believe Avago Technologies’ cash generative business has attractive prospects for capital deployment and further merger and acquisition, as consolidation in the semiconductor industry is likely to continue. |
| | Lamar Advertising was another strong performer for the Fund during the Reporting Period. The company delivered a year of strong operating performance in 2015, with mid-single-digit revenue growth coupled with solid cost controls, translating into low double-digit growth in adjusted funds from operations (“AFFO”) per share. While its shares were under pressure in August 2015 due to a sell-off in the broader |
5
PORTFOLIO RESULTS
| | media sector, our analysis continued to point to healthy trends in the outdoor advertising space. Lamar Advertising’s third quarter 2015 earnings release verified this research, as the company increased its 2015 AFFO guidance and highlighted accelerating trends into the fourth quarter of 2015. As a result, its shares rebounded strongly in the fourth quarter of 2015. At the end of the Reporting Period, we believed Lamar Advertising remained attractively valued given the company’s wide moat, accelerating underlying operating trends and opportunities for value-accretive capital allocation. For example, just after the close of the Reporting Period, in early January 2016, Lamar Advertising announced its acquisition of billboard assets in five markets from Clear Channel Outdoor. We view this as an attractive bolt-on acquisition that should be accretive to its free cash flow and solidify its dominant market share in regional markets. (A moat refers to a type of sustainable competitive advantage that a business possesses that makes it difficult for rivals to wear down its market share and profit. A bolt-on acquisition is a type of acquisition in which the acquiring company merges the acquired company into a division of the acquiring entity. Often, this technique is used when the acquiring company wishes to obtain a significant comparative advantage, but at a lower cost than would be required for the acquiring company to implement the changes on its own. A successful bolt-on acquisition can increase revenues and broaden the acquiring company’s capabilities and resources.) |
| Q | | How did the Fund use derivatives and similar instruments during the Reporting Period? |
| A | | During the Reporting Period, the Fund used total return swaps, currency forwards and equivalents, futures and forward contracts, and options. Total return swaps were used to gain exposure in a tax-efficient manner to specific securities or a broad market that may be difficult to access. Currency forwards and equivalents were used to gain exposure to specific currencies or to hedge against currency risk. Futures and forward contracts were used primarily for hedging purposes or to gain exposure to specific securities, indices, sectors and geographies. Options were used primarily for hedging purposes either at a strategy level or portfolio level and to gain exposure to specific securities and indices synthetically. The use of total return swaps and equivalents and options detracted from performance, while the use of futures, currency forwards and forward contracts had a positive effect on performance during the Reporting Period. |
| Q | | Did the Fund make any significant purchases or sales during the Reporting Period? |
| A | | In addition to the purchase of Avago Technologies, already mentioned, we established a Fund position in Vodafone, a pan-European telecommunications provider, during the Reporting Period. In our view, Vodafone has undergone a significant transformation during the last few years and was, during the Reporting Period, at an earnings inflection point that we believe was underappreciated by the market. More specifically, we believe Vodafone has taken significant action to address its structural issues around convergence of various European market operators selling combined fixed and mobile products by acquiring fixed assets in many of the convergent European markets over the last several years, such as Germany and Spain, while still leaving some unresolved markets, such as the Netherlands and the U.K. Vodafone is also nearing completion of a one-time large investment project focusing on improving its mobile network quality, with an emphasis on monetizing rapidly growing data usage and reducing customer turnover. We believe Vodafone offers joint best-in-class mobile networks in its main European markets and has a highly competitive fixed line offering. Further, we expect discussions regarding a merger between Vodafone and Liberty Global to be renewed in the near term, which could serve as a share price catalyst. Vodafone has also discussed a potential Initial Public Offering (“IPO”) of its Indian business during the coming year. In our view, this would likely be perceived positively by the market, as it would simplify the equity story to a predominantly European one. |
| | We initiated a Fund position in Citizens Financial Group, as we believe the bank is a compelling combination of self-help-driven earnings growth and leverage to higher short-term U.S. interest rates. During the third calendar quarter, former parent Royal Bank of Scotland (“RBS”) divested its remaining stake in Citizens Financial Group. In turn, we liked the prospects for revenue growth and operational improvement now that the bank has become fully independent of RBS. We believe its management team can execute on initiatives that can bring profitability back up to peer levels, all versus a starting point of a business that was, in our view, less than optimally run under RBS’ stewardship. In addition, with the Fed raising rates in December 2015, we think that higher short-term rates add to the upside we see in Citizens Financial Group over the coming years. That said, we see attractive upside in Citizens Financial Group even if the Fed does not hike interest rates any further. With the stock trading at what we consider to be only a modest |
6
PORTFOLIO RESULTS
| | premium to tangible book value as of year-end 2015, we think the risk-adjusted upside is attractive. |
| | We exited the Fund’s positions in Facebook and Apple during the Reporting Period, as each had reached the price target we had established for these holdings. |
| Q | | Were there any notable changes in the Fund’s allocations during the Reporting Period? |
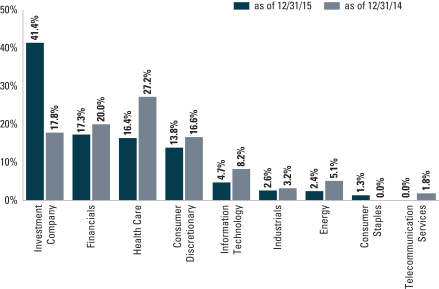
| A | | Due both to active management decisions and stock appreciation or depreciation, the Fund’s exposure to the consumer staples sector increased and its exposure to the health care, financials (including real estate), consumer discretionary, information technology, energy, and telecommunication services sectors decreased during the Reporting Period. There was also an increase in allocation to investment companies held during the Reporting Period. There were no notable shifts in allocation from a regional perspective. |
| Q | | How was the Fund positioned at the end of the Reporting Period? |
| A | | At the end of December 2015, the Fund had its greatest exposure, based on long market value, to the health care, financials (ex-real estate) and consumer discretionary sectors. (Long market value is the current market value of stocks held (i.e. having a long position) in an account, calculated on a daily basis.) The Fund had its most modest exposure, based on long market value, to the materials, utilities and consumer staples sectors. |
| | By region, the Fund had its greatest exposure, based on long market value, to the Americas, followed by the EMEA (Europe, Middle East and Africa) region and then Asia as of December 31, 2015. |
| Q | | What is the Fund’s tactical view and strategy for the months ahead? |
| A | | At the end of the Reporting Period, we maintained a cautious outlook with respect to the equity markets. We saw valuations as stretched and did not expect multiple expansion in the near term. We also saw limited upside potential for equities, along with earnings growth, but increased downside risks. Amidst this environment, we believe stock-picking for both long and short positions going forward should be of heightened importance, and thus we intend to maintain our focus on our highest conviction alpha, or value-added, ideas in the equity asset class. We also expect the Fund to continue to operate in the months ahead with relatively low net exposure and significant optionality, which could, we believe, help manage the downside in a market correction. (Net exposure is the percentage difference between a fund’s long and short exposure. Net exposure is a measure of the extent to which a fund’s trading book is exposed to market fluctuations. Optionality describes the gamma profile of the portfolio; gamma measures the rate of change of the portfolio’s net exposure (delta) given a change in equity markets.) |
| | In the investment environment seen at the end of the Reporting Period and just after its close, we believe there are a number of dislocations that offer attractive investment opportunities for patient investors with a longer-term investment horizon who are willing to provide capital when others are pulling back. In our view, the next 12 to 18 months could be highly catalytic for many companies, as we believe the market will likely gain further visibility on whether announced mergers will close, how companies’ earnings may perform and whether the global economic slowdown will bring a recession to the U.S. |
| | In our view, U.S. financials are a particularly attractive segment of the market, as many names were trading at the end of the Reporting Period at levels where the market fully prices out any further rate hikes. While this is not the main part of our investment thesis for the U.S. financials companies that the Fund owns, it does show what we believe is a severe mispricing — which may lead to attractive upside potential for these names if the Fed were to continue to raise rates. Another attractive corner of the market, in our opinion, is merger arbitrage, where we have observed a significant increase in merger arbitrage spreads, or yield differentials. We believe this is due to the significant increase in global merger and acquisition activity, which reached a record high in 2015, while, at the same time, there is less capital available to invest in these deals (Merger arbitrage is a strategy that expresses a view on the outcome of a specific merger deal between two companies). For example, the Allergan/Pfizer deal, which we expect to close in the second half of 2016, was trading at the end of the Reporting Period at a gross spread of 15%. If the deal were to break, we believe the downside risk is limited, as Allergan has what we consider to be attractive stand-alone prospects and represents a compelling investment by itself. |
| | As we look ahead to 2016, we intend to position the Fund’s portfolio to take advantage of these investment opportunities and are excited about the prospects of the companies in the Fund’s portfolio — consisting of both what we consider to be attractively valued core positions where we continue to have a differentiated view and relatively new names that we added to the portfolio during 2015. |
7
FUND BASICS
Goldman Sachs Long Short Fund
as of December 31, 2015
| | | | | | | | | | |
| | PERFORMANCE REVIEW | |
| | | January 1, 2015-December 31, 2015 | | Fund Total Return (based on NAV)1 | | | Bank of America Merrill Lynch U.S. Dollar Three- Month LIBOR Constant Maturity Index2 | |
| | Class A | | | -9.32 | % | | | 0.25 | % |
| | Class C | | | -9.99 | | | | 0.25 | |
| | Institutional | | | -8.93 | | | | 0.25 | |
| | Class IR | | | -9.06 | | | | 0.25 | |
| | | Class R | | | -9.49 | | | | 0.25 | |
| | 1 | | The net asset value (“NAV”) represents the net assets of the class of the Fund (ex-dividend) divided by the total number of shares of the class outstanding. The Fund’s performance assumes the reinvestment of dividends and other distributions. The Fund’s performance does not reflect the deduction of any applicable sales charges. |
| | 2 | | The Bank of America Merrill Lynch U.S. Dollar Three-Month LIBOR Constant Maturity Index (the “Index”) tracks the performance of a synthetic asset paying LIBOR to a stated maturity. The Index is based on the assumed purchase at par of a synthetic instrument having exactly its stated maturity and with a coupon equal to that day’s fixing rate. That issue is assumed to be sold the following business day (priced at a yield equal to the current day fixing rate) and rolled into a new instrument. |
| | | | | | | | | | | | |
| | STANDARDIZED TOTAL RETURNS3 |
| | | For the period ended 12/31/15 | | One Year | | | Since Inception | | | Inception Date |
| | Class A | | | -14.29 | % | | | -10.37 | % | | 9/30/2014 |
| | Class C | | | -10.89 | % | | | -6.95 | | | 9/30/2014 |
| | Institutional | | | -8.93 | % | | | -5.86 | | | 9/30/2014 |
| | Class IR | | | -9.06 | % | | | -5.96 | | | 9/30/2014 |
| | | Class R | | | -9.49 | % | | | -6.46 | | | 9/30/2014 |
| | 3 | | The Standardized Total Returns are average annual total returns as of the most recent calendar quarter-end. They assume reinvestment of all distributions at NAV. These returns reflect a maximum initial sales charge of 5.50% for Class A Shares and the contingent deferred sales charge for Class C Shares (1.00% if shares are redeemed within 12 months of purchase). Because Institutional, Class IR and Class R Shares do not involve a sales charge, such a charge is not applied to their Standardized Total Returns. |
The returns set forth in the tables above represent past performance. Past performance does not guarantee future results. The Fund’s investment return and principal value will fluctuate so that an investor’s shares, when redeemed, may be worth more or less than their original cost. Current performance may be lower or higher than the performance quoted above. Please visit our web site at www.GSAMFUNDS.com to obtain the most recent month-end returns. Performance reflects applicable fee waivers and/or expense limitations in effect during the periods shown. In their absence, performance would be reduced. Returns do not reflect the deduction of taxes that a shareholder would pay on Fund distributions or the redemption of Fund shares.
8
FUND BASICS
| | | | | | | | | | |
| | EXPENSE RATIOS4 | | | | | | | | |
| | | | | Expense Ratios (current) | | | Expense Ratios (before waiver) | |
| | Class A | | | 2.58 | % | | | 3.96 | % |
| | Class C | | | 3.33 | | | | 4.71 | |
| | Institutional | | | 2.20 | | | | 3.58 | |
| | Class IR | | | 2.34 | | | | 3.72 | |
| | | Class R | | | 2.85 | | | | 4.23 | |
| | 4 | | The expense ratios of the Fund, both current (net of applicable fee waivers and/or expense limitations) and before waivers (gross of applicable fee waivers and/or expense limitations) are as set forth above according to the most recent publicly available Prospectus for the Fund and may differ from the expense ratios disclosed in the Financial Highlights in this report. Pursuant to a contractual arrangement, the Fund’s waivers and/or expense limitations will remain in place through at least April 30, 2016, and prior to such date the Investment Adviser may not terminate the arrangements without the approval of the Fund’s Board of Trustees. If these arrangements are discontinued in the future, the expense ratios may change without shareholder approval. |
| | | | | | | | |
| | TOP TEN HOLDINGS AS OF 12/31/155 |
| | | Holding | | % of Net Assets | | | Line of Business |
| | Lamar Advertising Co. Class A | | | 7.0 | % | | Real Estate Investment Trusts |
| | Time Warner Cable, Inc. | | | 6.9 | | | Media |
| | Mallinckrodt PLC | | | 5.6 | | | Pharmaceuticals |
| | Liberty Global PLC Series C | | | 5.5 | | | Media |
| | The Charles Schwab Corp. | | | 4.9 | | | Capital Markets |
| | Citizens Financial Group, Inc. | | | 4.5 | | | Commercial Banks |
| | Allergan PLC | | | 4.5 | | | Pharmaceuticals |
| | UBS Group AG | | | 4.4 | | | Capital Markets |
| | Endo International PLC | | | 3.5 | | | Pharmaceuticals |
| | | Avago Technologies Ltd. | | | 3.5 | | | Semiconductors & Semiconductor
Equipment |
| | 5 | | The top 10 holdings do not include the Fund’s short positions, if any, as listed in the Schedule of Investments and certain derivatives, if any, as listed in the Additional Investment Information section of the Schedule of Investments and may not be representative of the Fund’s future investments. |
9
FUND BASICS
| | 6 | | The Fund is actively managed and, as such, its composition may differ over time. Consequently, the Fund’s overall sector allocations may differ from the percentages contained in the graph above. The graph categorizes investments using the Global Industry Classification Standard (“GICS”), however, the sector classifications used by the portfolio management team may differ from GICS. The percentage shown for each investment category reflects the value of investments in that category as a percentage of the total value of the Fund’s Equity Investments. Underlying sector allocations of Exchange Traded Funds and Investment Companies held by the Fund are not reflected in the graph above. The graph depicts the Fund’s investments but may not represent the Fund’s market exposure due to the exclusion of the Fund’s short positions, if any, as listed in the Schedule of Investments and certain derivatives, if any, as listed in the Additional Investment Information section of the Schedule of Investments. |
10
GOLDMAN SACHS LONG SHORT FUND
Performance Summary
December 31, 2015
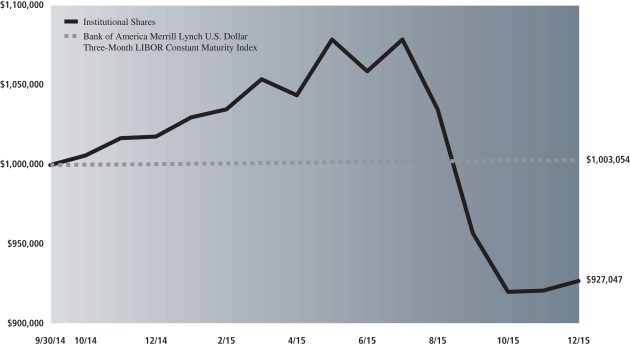
The following graph shows the value, as of December 31, 2015, of a $1,000,000 investment made on September 30, 2014 (Commencement of Operations) in Institutional Shares at NAV. For comparative purposes, the performance of the Fund’s benchmarks, the Bank of America Merrill Lynch U.S. Dollar Three-Month LIBOR Constant Maturity Index (“the Index”) is shown. This performance data represents past performance and should not be considered indicative of future performance, which will fluctuate with changes in market conditions. These performance fluctuations will cause an investor’s shares, when redeemed, to be worth more or less than their original cost. Performance reflects applicable fee waivers and/or expense limitations currently in effect during the periods shown and in their absence, performance would be reduced. Returns do not reflect the deduction of taxes that a shareholder would pay on Fund distributions or the redemption of Fund shares. Performance of Class A, Class C, Class IR and Class R Shares will vary from Institutional Shares due to differences in class specific fees and any applicable sales charges. In addition to the Investment Adviser’s decisions regarding underlying mutual fund selection and allocations among them, other factors may affect Fund performance. These factors include, but are not limited to, Fund operating fees and expenses, portfolio turnover and subscription and redemption cash flows affecting the Fund.
|
| Long Short Fund’s Lifetime Performance |
Performance of a $1,000,000 investment, with distributions reinvested, from September 30, 2014 through December 31, 2015.
| | | | | | |
| Average Annual Total Return through December 31, 2015 | | | One Year | | | Since Inception |
Class A (Commenced September 30, 2014) | | | | | | |
Excluding sales charges | | | -9.32% | | | -6.25% |
Including sales charges | | | -14.29% | | | -10.37% |
|
Class C (Commenced September 30, 2014) | | | | | | |
Excluding contingent deferred sales charges | | | -9.99% | | | -6.95% |
Including contingent deferred sales charges | | | -10.89% | | | -6.95% |
|
Institutional Class (Commenced September 30, 2014) | | | -8.93% | | | -5.86% |
|
Class IR (Commenced September 30, 2014) | | | -9.06% | | | -5.96% |
|
Class R (Commenced September 30, 2014) | | | -9.49% | | | -6.46% |
|
11
FUND BASICS
Index Definitions
The MSCI® World Index is a free float-adjusted market capitalization weighted index that is designed to measure the equity market performance of developed markets. The MSCI World Index consists of the following 23 developed market country indexes: Australia, Austria, Belgium, Canada, Denmark, Finland, France, Germany, Hong Kong, Ireland, Israel, Italy, Japan, Netherlands, New Zealand, Norway, Portugal, Singapore, Spain, Sweden, Switzerland, the United Kingdom, and the United States.
The S&P 500® Index is the Standard & Poor’s 500 Composite Index of 500 stocks, an unmanaged index of common stock prices.
The Russell 2000® Index measures the performance of the 2,000 smallest companies in the Russell 3000® Index, which represents approximately 8% of the total market capitalization of the Russell 3000 Index. It is not possible to invest directly in an index.
The Russell 1000® Index measures the performance of the 1,000 largest companies in the Russell 3000® Index, which represents approximately 92% of the total market capitalization of the Russell 3000 Index. It is not possible to invest directly in an index.
The Nikkei 225® Index is a price-weighted equity index, which consists of 225 stocks in the 1st section of the Tokyo Stock Exchange.
The STOXX® Europe 600 Index is derived from the STOXX Europe Total Market Index (TMI) and is a subset of the STOXX Global 1800 Index. With a fixed number of 600 components, the STOXX Europe 600 Index represents large, mid and small capitalization companies across 18 countries of the European region: Austria, Belgium, Czech Republic, Denmark, Finland, France, Germany, Greece, Ireland, Italy, Luxembourg, the Netherlands, Norway, Portugal, Spain, Sweden, Switzerland and the United Kingdom.
The MSCI Emerging Markets Index is a free float-adjusted market capitalization index that is designed to measure equity market performance of emerging markets. As of June 30, 2015, the MSCI Emerging Markets Index consisted of the following 23 emerging market country indices: Brazil, Chile, China, Colombia, Czech Republic, Egypt, Greece, Hungary, India, Indonesia, Korea, Malaysia, Mexico, Peru, Philippines, Poland, Qatar, Russia, South Africa, Taiwan, Thailand, Turkey and United Arab Emirates.
The Shanghai Stock Exchange Composite Index is a capitalization-weighted index. The index tracks the daily price performance of all A-shares and B-shares listed on the Shanghai Stock Exchange.
12
GOLDMAN SACHS LONG SHORT FUND
Schedule of Investments
December 31, 2015
| | | | | | | | |
| Shares | | | Description | |
Value | |
| | Common Stocks – 70.0% | |
| | Biotechnology* – 0.2% | | | | |
| | 3,855 | | | Anacor Pharmaceuticals, Inc. | | $ | 435,499 | |
| | |
| | Capital Markets – 9.3% | | | | |
| | 245,031 | | | The Charles Schwab Corp.(a) | | | 8,068,871 | |
| | 369,686 | | | UBS Group AG | | | 7,171,709 | |
| | | | | | | | |
| | | | | | | 15,240,580 | |
| | |
| | Commercial Banks(a) – 4.5% | | | | |
| | 281,473 | | | Citizens Financial Group, Inc. | | | 7,371,778 | |
| | |
| | Energy Equipment & Services – 2.9% | |
| | 102,596 | | | Baker Hughes, Inc. | | | 4,734,805 | |
| | |
| | Food Products(a) – 1.5% | | | | |
| | 34,870 | | | The Kraft Heinz Co. | | | 2,537,141 | |
| | |
| | Internet Software & Services* – 1.9% | |
| | 16,391 | | | Baidu, Inc. ADR | | | 3,098,555 | |
| | |
| | Media – 16.5% | | | | |
| | 312,974 | | | Altice NV Class A*(a) | | | 4,496,585 | |
| | 14,616 | | | Altice NV Class B* | | | 213,034 | |
| | 4,771 | | | Liberty Global PLC LiLAC Class C* | | | 205,153 | |
| | 221,083 | | | Liberty Global PLC Series C*(a) | | | 9,013,554 | |
| | 60,666 | | | Time Warner Cable, Inc.(a) | | | 11,259,003 | |
| | 74,362 | | | Twenty-First Century Fox, Inc. Class A | | | 2,019,672 | |
| | | | | | | | |
| | | | | | | 27,207,001 | |
| | |
| | Pharmaceuticals – 19.3% | | | | |
| | 23,554 | | | Allergan PLC*(a) | | | 7,360,625 | |
| | 93,022 | | | Endo International PLC*(a) | | | 5,694,807 | |
| | 124,403 | | | Mallinckrodt PLC*(a) | | | 9,284,196 | |
| | 17,177 | | | Shire PLC ADR | | | 3,521,285 | |
| | 42,705 | | | Teva Pharmaceutical Industries Ltd. ADR | | | 2,803,156 | |
| | 30,490 | | | Valeant Pharmaceuticals International, Inc.* | | | 3,099,308 | |
| | | | | | | | |
| | | | | | | 31,763,377 | |
| | |
| | Real Estate Investment Trusts(a) – 7.0% | |
| | 190,976 | | | Lamar Advertising Co. Class A | | | 11,454,741 | |
| | |
| | Road & Rail(a) – 3.1% | | | | |
| | 65,035 | | | Union Pacific Corp. | | | 5,085,737 | |
| | |
| | Semiconductors & Semiconductor Equipment – 3.8% | |
| | 39,180 | | | Avago Technologies Ltd. | | | 5,686,977 | |
| | 18,138 | | | Canadian Solar, Inc.* | | | 525,277 | |
| | | | | | | | |
| | | | | | | 6,212,254 | |
| | |
| | TOTAL COMMON STOCKS | | | | |
| | (Cost $109,608,404) | | $ | 115,141,468 | |
| | |
| | | | | | | | | | | | | | |
| Contracts | | | Exercise Price | | | Expiration Date | | | Value | |
| | | | | | | | | | | | | | |
| | Options Purchased – 1.6% | |
| | Options on Equities Contracts – 1.6% | |
| Credit Suisse International (London) Put – iShares PHLX
Semiconductor ETF |
|
| | 122 | | | $ | 87.00 | | | | 01/20/17 | | | $ | 92,939 | |
| Credit Suisse International (London) Put – iShares PHLX
Semiconductor ETF |
|
| | 676 | | | | 87.00 | | | | 01/20/17 | | | | 514,975 | |
| Deutsche Bank AG Put – The Charles Schwab Corp. | |
| | 2,334 | | | | 31.00 | | | | 01/15/16 | | | | 40,829 | |
| Morgan Stanley & Co. International PLC Call – Mallinckrodt
PLC |
|
| | 419 | | | | 80.00 | | | | 01/15/16 | | | | 48,283 | |
| Morgan Stanley & Co. International PLC Call – Valeant
Pharmaceuticals International, Inc. |
|
| | 507 | | | | 85.00 | | | | 01/15/16 | | | | 899,969 | |
| Morgan Stanley & Co. International PLC Put – iShares PHLX
Semiconductor ETF |
|
| | 142 | | | | 87.00 | | | | 01/20/17 | | | | 108,175 | |
| Morgan Stanley Capital Services, Inc. Call – Liberty Global
PLC, Class A/ Liberty Lilac Group, Class A |
|
| | 122 | | | | 55.00 | | | | 01/15/16 | | | | 1,525 | |
| Morgan Stanley Capital Services, Inc. Call – Liberty Global
PLC, Class A/ Liberty Lilac Group, Class A |
|
| | 135 | | | | 57.50 | | | | 01/15/16 | | | | 675 | |
| Morgan Stanley Capital Services, Inc. Call – Liberty Global
PLC, Class A/ Liberty Lilac Group, Class A |
|
| | 191 | | | | 62.50 | | | | 01/15/16 | | | | 649 | |
| Morgan Stanley Capital Services, Inc. Call – Liberty Global
PLC, Class A/ Liberty Lilac Group, Class A |
|
| | 328 | | | | 60.00 | | | | 01/15/16 | | | | 1,535 | |
| Morgan Stanley Capital Services, Inc. Call – Liberty Global
PLC, Class A/ Liberty Lilac Group, Class A |
|
| | 48 | | | | 52.50 | | | | 01/15/16 | | | | 720 | |
| Morgan Stanley Capital Services, Inc. Call – S&P 500 Index | |
| | 36 | | | | 2,100.00 | | | | 02/19/16 | | | | 57,960 | |
| Morgan Stanley Capital Services, Inc. Call – S&P 500 Index | |
| | 52 | | | | 2,150.00 | | | | 02/19/16 | | | | 20,800 | |
| Morgan Stanley Capital Services, Inc. Call – S&P 500 Index | |
| | 65 | | | | 2,095.00 | | | | 01/22/16 | | | | 45,825 | |
| Morgan Stanley Capital Services, Inc. Call – S&P 500 Index | |
| | 81 | | | | 2,115.00 | | | | 01/15/16 | | | | 12,150 | |
| Morgan Stanley Capital Services, Inc. Call – S&P 500 Index | |
| | 96 | | | | 2,050.00 | | | | 01/15/16 | | | | 200,160 | |
| Morgan Stanley Capital Services, Inc. Call – Time Warner
Cable, Inc. |
|
| | 122 | | | | 195.00 | | | | 01/15/16 | | | | 7,320 | |
| Morgan Stanley Capital Services, Inc. Call – Valeant
Pharmaceuticals International, Inc. |
|
| | 177 | | | | 115.00 | | | | 01/15/16 | | | | 23,453 | |
| Morgan Stanley Capital Services, Inc. Call – Valeant
Pharmaceuticals International, Inc. |
|
| | 401 | | | | 110.00 | | | | 01/15/16 | | | | 95,238 | |
| Morgan Stanley Capital Services, Inc. Put – S&P 500 Index | |
| | 162 | | | | 2,055.00 | | | | 01/08/16 | | | | 401,760 | |
| Morgan Stanley Capital Services, Inc. Put – S&P 500 Index | |
| | 58 | | | | 1,940.00 | | | | 01/29/16 | | | | 67,860 | |
| | |
| | |
| The accompanying notes are an integral part of these financial statements. | | 13 |
GOLDMAN SACHS LONG SHORT FUND
Schedule of Investments (continued)
December 31, 2015
| | | | | | | | | | | | | | |
| Contracts | | | Exercise Price | | | Expiration Date | | | Value | |
| | | | | | | | | | | | | | |
| | Options Purchased – (continued) | |
| Morgan Stanley Capital Services, Inc. Put – Valeant
Pharmaceuticals International, Inc. |
|
| | 106 | | | $ | 70.00 | | | | 01/15/16 | | | $ | 2,385 | |
| | | | | | | | | | | | | | |
| | | | | | | | | | | | | 2,645,185 | |
| | |
| | TOTAL OPTIONS PURCHASED – 1.6% | |
| | (Cost $3,980,286) | | | $ | 2,645,185 | |
| | |
| | | | | | | | |
| Shares | | | Distribution Rate | | Value | |
| | Investment Company(b) – 49.5% | |
| Goldman Sachs Financial Square Government Fund – FST Shares | |
| | 81,330,466 | | | 0.185% | | $ | 81,330,466 | |
| | (Cost $81,330,466) | | | | |
| | |
| TOTAL INVESTMENTS BEFORE
SHORT-POSITIONS – 121.1% | | | | |
| | (Cost $194,919,156) | | $ | 199,117,119 | |
| | |
| | | | | | | | |
| Shares | | | Description | | Value | |
| | Common Stocks Sold Short – (5.1)% | |
| | Commercial Banks – (2.7)% | | | | |
| | 35,614 | | | Credit Suisse Group AG* | | $ | (767,196 | ) |
| | 69,482 | | | Regions Financial Corp. | | | (667,027 | ) |
| | 30,925 | | | Royal Bank of Canada | | | (1,657,215 | ) |
| | 14,851 | | | U.S. Bancorp | | | (633,692 | ) |
| | 28,740 | | | Zions Bancorp | | | (784,602 | ) |
| | | | | | | | |
| | | | | | | (4,509,732 | ) |
| | |
| | Energy Equipment & Services – (2.4)% | |
| | 114,907 | | | Halliburton Co. | | | (3,911,434 | ) |
| | |
| | TOTAL COMMON STOCKS SOLD SHORT | | | | |
| | (Cost $9,788,655) | | $ | (8,421,166 | ) |
| | |
| | | | | | | | |
| | Exchange Traded Funds Sold Short – (19.8)% | |
| | 152,654 | | | Consumer Staples Select Sector SPDR Fund | | $ | (7,707,501 | ) |
| | 114,962 | | | Health Care Select Sector SPDR Fund | | | (8,283,012 | ) |
| | 27,460 | | | iShares Nasdaq Biotechnology ETF | | | (9,290,543 | ) |
| | 41,193 | | | iShares Russell 2000 ETF | | | (4,634,624 | ) |
| | 78,581 | | | SPDR S&P Bank ETF | | | (2,657,609 | ) |
| | |
| TOTAL EXCHANGE TRADED FUNDS
SOLD SHORT | | | | |
| | (Cost $32,231,186) | | $ | (32,573,289 | ) |
| | |
| | TOTAL SECURITIES SOLD SHORT – (24.9)% | |
| | (Cost $(42,019,841) | | $ | (40,994,455 | ) |
| | |
| OTHER ASSETS IN EXCESS OF
OTHER LIABILITIES – 3.8% | | | 6,214,617 | |
| | |
| | NET ASSETS – 100.0% | | $ | 164,337,281 | |
| | |
| | |
|
| The percentage shown for each investment category reflects the value of investments in that category as a percentage of net assets. |
* | | Non-income producing security. |
(a) | | All or portion of security is pledged as collateral for short sales. Total market value of securities pledged as collateral on short sales amounts to $49,769,080, which represents approximately 30.3% of net assets as of December 31, 2015. |
(b) | | Represents an Affiliated Fund. |
| | |
|
Currency Abbreviations: |
CAD | | —Canadian Dollar |
CHF | | —Swiss Franc |
EUR | | —Euro |
GBP | | —British Pound |
USD | | —U.S. Dollar |
| | |
Investment Abbreviations: |
ADR | | —American Depositary Receipt |
ETF | | —Exchange Traded Fund |
LIBOR | | —London Interbank Offered Rate |
PLC | | —Public Limited Company |
|
| | |
| 14 | | The accompanying notes are an integral part of these financial statements. |
GOLDMAN SACHS LONG SHORT FUND
|
| ADDITIONAL INVESTMENT INFORMATION |
FORWARD FOREIGN CURRENCY EXCHANGE CONTRACTS — At December 31, 2015, the Fund had the following forward foreign currency exchange contracts:
FORWARD FOREIGN CURRENCY EXCHANGE CONTRACTS WITH UNREALIZED GAIN
| | | | | | | | | | | | | | | | | | | | | | | | | | | | |
| Counterparty | | Currency
Purchased | | | Currency
Sold | | | Current
Value | | | Settlement
Date | | | Unrealized
Gain | |
Morgan Stanley & Co. International PLC | | | CAD | | | | 2,075,000 | | | | USD | | | | 1,487,882 | | | $ | 1,499,910 | | | | 03/16/16 | | | $ | 12,028 | |
| | | EUR | | | | 902,000 | | | | USD | | | | 980,835 | | | | 982,187 | | | | 03/16/16 | | | | 1,353 | |
| | | USD | | | | 10,772,950 | | | | CHF | | | | 10,622,284 | | | | 10,640,515 | | | | 03/16/16 | | | | 132,435 | |
| | | USD | | | | 11,393,109 | | | | EUR | | | | 10,392,802 | | | | 11,316,718 | | | | 03/16/16 | | | | 76,391 | |
| | | | USD | | | | 456,990 | | | | GBP | | | | 300,000 | | | | 442,318 | | | | 03/16/16 | | | | 14,672 | |
| TOTAL | | | | | | | | | | | | | | | | | | | | | | | | | | $ | 236,879 | |
FORWARD FOREIGN CURRENCY EXCHANGE CONTRACTS WITH UNREALIZED LOSS
| | | | | | | | | | | | | | | | | | | | | | | | | | | | |
| Counterparty | | Currency
Purchased | | | Currency
Sold | | | Current
Value | | | Settlement
Date | | | Unrealized
Loss | |
Morgan Stanley & Co. International PLC | | | CAD | | | | 2,722 | | | | USD | | | | 1,999 | | | | 1,967 | | | | 03/16/16 | | | $ | (32 | ) |
| | | CHF | | | | 3,954,000 | | | | USD | | | | 3,996,194 | | | | 3,960,786 | | | | 03/16/16 | | | | (35,408 | ) |
| | | EUR | | | | 2,300,000 | | | | USD | | | | 2,534,508 | | | | 2,504,469 | | | | 03/16/16 | | | | (30,039 | ) |
| | | GBP | | | | 1,107,806 | | | | USD | | | | 1,677,056 | | | | 1,633,340 | | | | 03/16/16 | | | | (43,715 | ) |
| | | | USD | | | | 21,733 | | | | EUR | | | | 20,000 | | | | 21,778 | | | | 03/16/16 | | | | (45 | ) |
| TOTAL | | | | | | | | | | | | | | | | | | | | | | | | | | $ | (109,239 | ) |
| | |
| The accompanying notes are an integral part of these financial statements. | | 15 |
GOLDMAN SACHS LONG SHORT FUND
Schedule of Investments (continued)
December 31, 2015
|
| ADDITIONAL INVESTMENT INFORMATION (continued) |
FUTURES CONTRACTS — At December 31, 2015, the Fund had the following futures contracts:
| | | | | | | | | | | | | | |
| Type | | Number of
Contracts
Long (Short) | | | Expiration
Date | | Current
Value | | | Unrealized
Gain (Loss) | |
S&P 500 E-Mini Index | | | (537 | ) | | March 2016 | | $ | (54,650,490 | ) | | $ | 354,254 | |
DAX Index | | | (13 | ) | | March 2016 | | | (3,804,602 | ) | | | (66,939 | ) |
| TOTAL | | | $ | 287,315 | |
SWAP CONTRACTS — At December 31, 2015, the Fund had the following swap contracts:
OVER THE COUNTER TOTAL RETURN SWAP CONTRACTS ON EQUITY ISSUERS
| | | | | | | | | | | | | | | | |
| Counterparty | | Notional
Amount
(000s) | | | Reference Security | | Termination
Date | | Rates
Received
(Paid)(a) | | Unrealized
Gain (Loss)* | |
Credit Suisse International (London) | | GBP | | | 1,769 | | | Barclays Bank PLC | | 04/26/17 | | 0.300% | | $ | 282,185 | |
| | | | | 1,455 | | | Royal Bank of Scotland Group | | 10/04/19 | | (0.400) | | | (406,186 | ) |
| | | | | 130 | | | Shire PLC | | 10/03/19 | | (0.300) | | | (382,271 | ) |
| | | | | | 2,955 | | | Vodafone Group PLC | | 11/22/16 | | (0.300) | | | 524,694 | |
| TOTAL | | $ | 18,422 | |
| | (a) | | The Fund receives quarterly coupon payments in accordance with the swap contract(s). On the termination date of the swap contract(s), the Fund will either receive from or pay to the counterparty an amount equal to the net of the accrued financing fees and the value of the reference security subtracted from the original notional cost (notional multiplied by the price change of the reference security, converted to U.S. Dollars). |
| | * | | There are no upfront payments on the swap contracts, therefore the unrealized gain (loss) of the swap contracts is equal to their market value. |
| | |
| 16 | | The accompanying notes are an integral part of these financial statements. |
GOLDMAN SACHS LONG SHORT FUND
|
| ADDITIONAL INVESTMENT INFORMATION (continued) |
WRITTEN OPTIONS CONTRACTS — At December 31, 2015 the Fund had the following written options:
OPTIONS ON EQUITIES CONTRACTS
| | | | | | | | | | | | | | | | | | |
| Counterparty | | Description | | Contracts | | | Expiration
Date | | | Strike
Price | | | Value | |
Citibank NA (London) | | Call – Time Warner Cable, Inc. | | | 244 | | | | 01/15/16 | | | $ | 210 | | | $ | (4,880 | ) |
| | Call – Shire PLC | | | 90 | | | | 01/15/16 | | | | 285 | | | | — | |
Morgan Stanley & Co. International PLC | | Call – Valeant Pharmaceuticals International, Inc. | | | 507 | | | | 06/17/16 | | | | 125 | | | | (450,280 | ) |
| TOTAL (Premium Received $363,885) | | | 841 | | | | | | | | | | | $ | (455,160 | ) |
For the fiscal year ended December 31, 2015, the Fund had the following written options activity:
OPTIONS ON EQUITIES
| | | | | | | | |
| | | Contracts | | | Premiums Received | |
Contracts Outstanding December 31, 2014 | | | 740 | | | $ | 159,987 | |
Contracts Written | | | 39,570 | | | | 5,915,502 | |
Contracts Bought to Close | | | (14,722 | ) | | | (2,836,800 | ) |
Contracts Expired | | | (22,203 | ) | | | (2,708,270 | ) |
Contracts Assigned | | | (2,544 | ) | | | (166,534 | ) |
Contracts Outstanding December 31, 2015 | | | 841 | | | $ | 363,885 | |
| | |
| The accompanying notes are an integral part of these financial statements. | | 17 |
GOLDMAN SACHS LONG SHORT FUND
Statement of Assets and Liabilities
December 31, 2015
| | | | | | |
| | Assets: | | | | |
| | Investments of unaffiliated issuers, at value (cost $113,588,690) | | $ | 117,786,653 | |
| | Investments of affiliated issuers, at value (cost $81,330,466) | | | 81,330,466 | |
| | Cash | | | 2,579,970 | |
| | Foreign currencies, at value (cost $2,068,542) | | | 2,038,684 | |
| | Unrealized gain on swap contracts | | | 806,879 | |
| | Unrealized gain on forward foreign currency exchange contracts | | | 236,879 | |
| | Variation margin on certain derivative contracts | | | 798,894 | |
| | Receivables: | | | | |
| | Collateral on certain derivative contracts(a) | | | 5,028,125 | |
| | Investments sold | | | 1,725,515 | |
| | Dividends and interest | | | 77,023 | |
| | Fund shares sold | | | 55,193 | |
| | Reimbursement from investment adviser | | | 53,893 | |
| | Foreign tax reclaims | | | 3,401 | |
| | Other assets | | | 320 | |
| | Total assets | | | 212,521,895 | |
| | | | | | |
| | Liabilities: | | | | |
| | Investments sold short, at value (proceeds received $42,019,841) | | | 40,994,455 | |
| | Unrealized loss on swap contracts | | | 788,457 | |
| | Unrealized loss on forward foreign currency exchange contracts | | | 109,239 | |
| | Written option contracts, at value (premium received $363,885) | | | 455,160 | |
| | Payables: | | | | |
| | Investments purchased | | | 3,515,962 | |
| | Fund shares redeemed | | | 1,487,403 | |
| | Collateral on certain derivative contracts | | | 420,000 | |
| | Management fees | | | 225,376 | |
| | Distribution and Service fees and Transfer Agency fees | | | 19,234 | |
| | Dividend Payable Short Position | | | 4,086 | |
| | Accrued expenses | | | 165,242 | |
| | Total liabilities | | | 48,184,614 | |
| | | | | | |
| | Net Assets: | | | | |
| | Paid-in capital | | | 187,612,837 | |
| | Net investment loss | | | (149,462 | ) |
| | Accumulated net realized loss | | | (28,691,674 | ) |
| | Net unrealized gain | | | 5,565,580 | |
| | | NET ASSETS | | $ | 164,337,281 | |
| | | Net Assets: | | | | |
| | | Class A | | $ | 20,234,831 | |
| | | Class C | | | 5,619,871 | |
| | | Institutional | | | 129,205,928 | |
| | | Class IR | | | 9,253,655 | |
| | | Class R | | | 22,996 | |
| | | Total Net Assets | | $ | 164,337,281 | |
| | | Shares Outstanding $0.001 par value (unlimited shares authorized): | | | | |
| | | Class A | | | 2,198,840 | |
| | | Class C | | | 615,922 | |
| | | Institutional | | | 13,994,073 | |
| | | Class IR | | | 1,002,412 | |
| | | Class R | | | 2,504 | |
| | | Net asset value, offering and redemption price per share:(b) | | | | |
| | | Class A | | | $9.20 | |
| | | Class C | | | 9.12 | |
| | | Institutional | | | 9.23 | |
| | | Class IR | | | 9.23 | |
| | | Class R | | | 9.18 | |
| | (a) | | Includes amounts segregated for initial margin and/or collateral on futures transactions, swaps transactions and options transactions of $2,932,231, $1,380,000 and $715,894, respectively. |
| | (b) | | Maximum public offering price per share for Class A Shares is $9.74. At redemption, Class C shares may be subject to a contingent deferred sales charge, assessed on the amount equal to the lesser of the current net asset value or the original purchase price of the shares. |
| | |
| 18 | | The accompanying notes are an integral part of these financial statements. |
GOLDMAN SACHS LONG SHORT FUND
Statement of Operations
For the Fiscal Year Ended December 31, 2015
| | | | | | |
| | Investment income: | | | | |
| | Dividends — unaffiliated issuers (net of foreign withholding taxes of $12,177) | | $ | 1,439,115 | |
| | Dividends — affiliated issuers | | | 16,250 | |
| | Total investment income | | | 1,455,365 | |
| | | | | | |
| | Expenses: | | | | |
| | Management fees | | | 2,087,632 | |
| | Dividend expense on short positions | | | 580,553 | |
| | Brokerage fees | | | 370,984 | |
| | Amortization of offering costs | | | 326,377 | |
| | Custody, accounting and administrative services | | | 116,360 | |
| | Professional fees | | | 111,693 | |
| | Transfer Agency fees(a) | | | 84,100 | |
| | Registration fees | | | 71,371 | |
| | Distribution and Service fees(a) | | | 52,701 | |
| | Printing and mailing costs | | | 45,440 | |
| | Trustee fees | | | 25,251 | |
| | Interest expense | | | 18,941 | |
| | Other | | | 4,016 | |
| | Total expenses | | | 3,895,419 | |
| | Less — expense reductions | | | (609,635 | ) |
| | Net expenses | | | 3,285,784 | |
| | NET INVESTMENT LOSS | | | (1,830,419 | ) |
| | | | | | |
| | Realized and unrealized gain (loss): | | | | |
| | Net realized gain (loss) from: | | | | |
| | Investments — unaffiliated issuers | | | (35,498,449 | ) |
| | Investments sold short | | | (2,401,803 | ) |
| | Futures contracts | | | 8,192,242 | |
| | Written options | | | 3,565,722 | |
| | Swap contracts | | | (1,540,962 | ) |
| | Forward foreign currency exchange contracts | | | 710,826 | |
| | Foreign currency transactions | | | (52,742 | ) |
| | Net change in unrealized gain (loss) on: | | | | |
| | Investments — unaffiliated issuers | | | 2,803,211 | |
| | Futures contracts | | | 680,801 | |
| | Written options | | | (131,937 | ) |
| | Investments sold short | | | 1,037,684 | |
| | Swap contracts | | | (322,755 | ) |
| | Forward foreign currency exchange contracts | | | (25,096 | ) |
| | Foreign currency translation | | | 306 | |
| | Net realized and unrealized loss | | | (22,982,952 | ) |
| | NET DECREASE IN NET ASSETS RESULTING FROM OPERATIONS | | $ | (24,813,371 | ) |
| | (a) | | Class specific Distribution and Service and Transfer Agency fees were as follows: |
| | | | | | | | | | | | | | | | | | | | | | | | | | | | | | |
| Distribution and Service Fees | | | Transfer Agency Fees | |
Class A | | | Class C | | | Class R | | | Class A | | | Class C | | | Institutional | | | Class IR | | | Class R | |
| | 26,321 | | | | 26,254 | | | | 126 | | | | 20,004 | | | | 4,988 | | | | 43,682 | | | | 15,378 | | | | 48 | |
| | |
| The accompanying notes are an integral part of these financial statements. | | 19 |
GOLDMAN SACHS LONG SHORT FUND
Statements of Changes in Net Assets
December 31, 2015
| | | | | | | | | | |
| | | | | For the Fiscal
Year Ended
December 31, 2015 | | | For the
Period Ended
December 31, 2014(a) | |
| | From operations: | | | | | | | | |
| | Net investment loss | | $ | (1,830,419 | ) | | $ | (190,585 | ) |
| | Net realized loss | | | (27,025,166 | ) | | | (414,589 | ) |
| | Net change in unrealized gain | | | 4,042,214 | | | | 1,523,366 | |
| | Net increase (decrease) in net assets resulting from operations | | | (24,813,371 | ) | | | 918,192 | |
| | | | | | | | | | |
| | Distributions to shareholders: | | | | | | | | |
| | From net investment income | | | | | | | | |
| | Class A Shares | | | (14,566 | ) | | | — | |
| | Institutional Shares | | | (344,899 | ) | | | — | |
| | Class IR Shares | | | (12,204 | ) | | | — | |
| | From net realized gains | | | | | | | | |
| | Class A Shares | | | (33,483 | ) | | | — | |
| | Class C Shares | | | (9,146 | ) | | | — | |
| | Institutional Shares | | | (235,012 | ) | | | — | |
| | Class IR Shares | | | (17,246 | ) | | | — | |
| | Class R Shares | | | (39 | ) | | | — | |
| | Total distributions to shareholders | | | (666,595 | ) | | | — | |
| | | | | | | | | | |
| | From share transactions: | | | | | | | | |
| | Proceeds from sales of shares | | | 260,024,783 | | | | 52,122,816 | |
| | Reinvestment of distributions | | | 662,945 | | | | — | |
| | Cost of shares redeemed | | | (123,911,278 | ) | | | (211 | ) |
| | Net increase in net assets resulting from share transactions | | | 136,776,450 | | | | 52,122,605 | |
| | TOTAL INCREASE | | | 111,296,484 | | | | 53,040,797 | |
| | | | | | | | | | |
| | Net assets: | | | | | | | | |
| | Beginning of period | | | 53,040,797 | | | | — | |
| | End of period | | $ | 164,337,281 | | | $ | 53,040,797 | |
| | Net investment loss | | $ | (149,462 | ) | | $ | (120,174 | ) |
| | (a) | | Fund commenced operations on September 30, 2014. |
| | |
| 20 | | The accompanying notes are an integral part of these financial statements. |
GOLDMAN SACHS LONG SHORT FUND
Statement of Cash Flows
December 31, 2015
| | | | | | |
| | Increase/(Decrease) in cash –
Cash flows used in operating activities: | | | | |
| | Net decrease in net assets from operations | | $ | (24,813,371 | ) |
| | Adjustments to reconcile net increase in net assets from operations to net cash received from/(used in) operating activities: | | | | |
| | Payments for purchases of investments in securities | | | (626,942,892 | ) |
| | Proceeds from sales of investment securities | | | 542,155,494 | |
| | Payments for closing purchases of securities sold short | | | (246,854,206 | ) |
| | Proceeds from sales of securities sold short | | | 277,242,882 | |
| | Purchases of short-term investment securities, net | | | (70,175,904 | ) |
| | Payment for options purchased | | | (18,133,966 | ) |
| | Proceeds from options written | | | 5,915,503 | |
| | Proceeds from swaps, net | | | (1,651,714 | ) |
| | Proceeds from corporate actions, net | | | 2,138,766 | |
| | (Increase) Decrease in: | | | | |
| | Variation margin on certain derivative contracts | | | 1,773,501 | |
| | Unrealized gain on swap contracts | | | (465,702 | ) |
| | Unrealized gain on forward foreign currency exchange contracts | | | (52,417 | ) |
| | Receivable for collateral on certain derivative contracts | | | (3,822,350 | ) |
| | Receivable for investments sold | | | 650,179 | |
| | Receivable for Dividends and Interest | | | (70,395 | ) |
| | Receivable for reimbursement from investment adviser | | | 181,961 | |
| | Receivable for foreign tax reclaims | | | (3,401 | ) |
| | Receivable for deferred offering costs | | | 326,375 | |
| | Other assets | | | (320 | ) |
| | Increase (Decrease) in: | | | | |
| | Unrealized loss on swaps contracts | | | 788,457 | |
| | Unrealized loss on forward foreign currency contracts | | | 77,513 | |
| | Payable for investments purchased | | | (4,854,559 | ) |
| | Payable for amounts owed to affiliates | | | 36,414 | |
| | Payable for collateral on certain derivative contracts | | | 420,000 | |
| | Payable for offering costs | | | (12,000 | ) |
| | Payable for dividends on short positions | | | (1,244 | ) |
| | Accrued expenses | | | (16,948 | ) |
| | Net realized gain (loss) on: | | | | |
| | Investments in securities and securities sold short | | | 37,900,252 | |
| | Derivatives | | | (2,024,760 | ) |
| | Net change in unrealized gain (loss) on: | | | | |
| | Investment securities and securities sold short | | | (3,841,201 | ) |
| | Derivatives | | | 454,692 | |
| | Net cash provided by (used in) operating activities | | $ | (133,675,361 | ) |
| | | | | | |
| | Cash flows provided by financing activities: | | | | |
| | Proceeds from sales of shares | | | 260,026,290 | |
| | Cash distributions paid | | | (3,650 | ) |
| | Cost of shares redeemed | | | (122,614,442 | ) |
| | Net cash provided by (used in) financing activities | | $ | 137,408,198 | |
| | NET INCREASE IN CASH | | $ | 3,732,837 | |
| | | | | | |
| | Cash: | | | | |
| | Beginning of year | | | 885,817 | |
| | End of year | | $ | 4,618,654 | |
| | Supplemental disclosure | | | | |
| | Reinvestment of distributions | | $ | 662,945 | |
| | Cash paid for interest and related fees | | $ | 18,941 | |
| | |
| The accompanying notes are an integral part of these financial statements. | | 21 |
GOLDMAN SACHS LONG SHORT FUND
Financial Highlights
Selected Data for a Share Outstanding Throughout Each Period
| | | | | | | | | | | | | | | | | | | | | | | | | | | | | | |
| | | | | | | | From
investment operations | | | Distributions
to shareholders | |
| | | Year - Share Class | | Net asset
value,
beginning
of period | | | Net
investment
loss(a) | | | Net realized
and unrealized
gain (loss) | | | Total from
investment
operations | | | From net
investment
income | | | From net
realized
gains | | | Total
distributions | |
| | FOR THE FISCAL YEAR ENDED DECEMBER 31, | |
| | 2015 - A | | $ | 10.17 | | | $ | (0.18 | ) | | $ | (0.77 | ) | | $ | (0.95 | ) | | $ | — | (d) | | $ | (0.02 | ) | | $ | (0.02 | ) |
| | 2015 - C | | | 10.15 | | | | (0.25 | ) | | | (0.76 | ) | | | (1.01 | ) | | | — | | | | (0.02 | ) | | | (0.02 | ) |
| | 2015 - Institutional | | | 10.18 | | | | (0.13 | ) | | | (0.78 | ) | | | (0.91 | ) | | | (0.02 | ) | | | (0.02 | ) | | | (0.04 | ) |
| | 2015 - IR | | | 10.18 | | | | (0.14 | ) | | | (0.78 | ) | | | (0.92 | ) | | | (0.01 | ) | | | (0.02 | ) | | | (0.03 | ) |
| | 2015 - R | | | 10.16 | | | | (0.20 | ) | | | (0.76 | ) | | | (0.96 | ) | | | — | | | | (0.02 | ) | | | (0.02 | ) |
| | | | | | | | | | | | | | | | | | | | | | | | | | | | | | |
| | FOR THE PERIOD ENDED DECEMBER 31, | |
| | 2014 - A (Commenced September 30, 2014) | | | 10.00 | | | | (0.06 | ) | | | 0.23 | | | | 0.17 | | | | — | | | | — | | | | — | |
| | 2014 - C (Commenced September 30, 2014) | | | 10.00 | | | | (0.07 | ) | | | 0.22 | | | | 0.15 | | | | — | | | | — | | | | — | |
| | 2014 - Institutional (Commenced September 30, 2014) | | | 10.00 | | | | (0.04 | ) | | | 0.22 | | | | 0.18 | | | | — | | | | — | | | | — | |
| | 2014 - IR (Commenced September 30, 2014) | | | 10.00 | | | | (0.05 | ) | | | 0.23 | | | | 0.18 | | | | — | | | | — | | | | — | |
| | 2014 - R (Commenced September 30, 2014) | | | 10.00 | | | | (0.05 | ) | | | 0.21 | | | | 0.16 | | | | — | | | | — | | | | — | |
| | (a) | | Calculated based on the average shares outstanding methodology. |
| | (b) | | Assumes investment at the NAV at the beginning of the period, reinvestment of all dividends and distributions, a complete redemption of the investment at the NAV at the end of the period and no sales or redemption charges. Total returns would be reduced if a sales or redemption charge was taken into account. Returns do not reflect the deduction of taxes that a shareholder would pay on Fund distributions or the redemption of Fund shares. Total returns for periods less than one full year are not annualized. |
| | (c) | | The Fund’s portfolio turnover rate is calculated in accordance with regulatory requirements, without regard to transactions involving short term investments and certain derivatives. If such transactions were included, the Fund’s portfolio turnover rate may be higher. |
| | (d) | | Amount is less than 0.005% per share. |
| | |
| 22 | | The accompanying notes are an integral part of these financial statements. |
GOLDMAN SACHS LONG SHORT FUND
| | | | | | | | | | | | | | | | | | | | | | | | | | | | | | | | | | | | | | | | | | | | | | | | | | | | |
| | | | | | | | | | | | | | | | | | | | | | | | | | | | | | | | | | | | | | | | | | | | |
| | | Net asset
value, end
of period | | | | | Total
return(b) | | | | | Net assets,
end of
Period
(in 000s) | | | | | Ratio of
net expenses
to average
net assets
(including
dividend
expenses for
securities
sold short) | | | | | Ratio of
net expenses
to average
net assets
(excluding
dividend
expenses for
securities
sold short) | | | | | Ratio of
total expenses
to average
net assets
(including
dividend
expenses for
securities
sold short) | | | | | Ratio of
total expenses
(excluding
dividend
expenses for
securities
sold short) | | | | | Ratio of
net investment
loss
to average
net assets | | | | | Portfolio
turnover
rate(c) | |
| | | | | | | | | | | | | | | | | | | | | | | | | | | | | | | | | | | | | | | | | | | | | | | | | | | | |
| | $ | 9.20 | | | | | | (9.32 | )% | | | | $ | 20,235 | | | | | | 2.93 | % | | | | | 2.43 | % | | | | | 3.25 | % | | | | | 2.75 | % | | | | | (1.82 | )% | | | | | 468 | % |
| | | 9.12 | | | | | | (9.99 | ) | | | | | 5,620 | | | | | | 3.70 | | | | | | 3.18 | | | | | | 4.01 | | | | | | 3.49 | | | | | | (2.58 | ) | | | | | 468 | |
| | | 9.23 | | | | | | (8.93 | ) | | | | | 129,206 | | | | | | 2.44 | | | | | | 1.99 | | | | | | 2.94 | | | | | | 2.49 | | | | | | (1.33 | ) | | | | | 468 | |
| | | 9.23 | | | | | | (9.06 | ) | | | | | 9,254 | | | | | | 2.65 | | | | | | 2.14 | | | | | | 2.99 | | | | | | 2.48 | | | | | | (1.43 | ) | | | | | 468 | |
| | | 9.18 | | | | | | (9.49 | ) | | | | | 23 | | | | | | 3.00 | | | | | | 2.61 | | | | | | 3.67 | | | | | | 3.28 | | | | | | (1.94 | ) | | | | | 468 | |
| | | | | | | | | | | | | | | | | | | | | | | | | | | | | | | | | | | | | | | | | | | | | | | | | | | | |
| | | | | | | | | | | | | | | | | | | | | | | | | | | | | | | | | | | | | | | | | | | | | | | | | | | | |
| | | 10.17 | | | | | | 1.70 | | | | | | 543 | | | | | | 3.43 | (e) | | | | | 2.80 | (e) | | | | | 5.58 | (e) | | | | | 4.95 | (e) | | | | | (2.40 | )(e) | | | | | 118 | |
| | | 10.15 | | | | | | 1.50 | | | | | | 62 | | | | | | 3.79 | (e) | | | | | 3.32 | (e) | | | | | 5.64 | (e) | | | | | 5.17 | (e) | | | | | (2.87 | )(e) | | | | | 118 | |
| | | 10.18 | | | | | | 1.80 | | | | | | 52,328 | | | | | | 2.18 | (e) | | | | | 1.94 | (e) | | | | | 3.74 | (e) | | | | | 3.51 | (e) | | | | | (1.47 | )(e) | | | | | 118 | |
| | | 10.18 | | | | | | 1.80 | | | | | | 82 | | | | | | 2.71 | (e) | | | | | 2.28 | (e) | | | | | 4.50 | (e) | | | | | 4.08 | (e) | | | | | (1.77 | )(e) | | | | | 118 | |
| | | 10.16 | | | | | | 1.60 | | | | | | 25 | | | | | | 2.82 | (e) | | | | | 2.59 | (e) | | | | | 4.38 | (e) | | | | | 4.15 | (e) | | | | | (2.11 | )(e) | | | | | 118 | |
| | |
| The accompanying notes are an integral part of these financial statements. | | 23 |
GOLDMAN SACHS LONG SHORT FUND
Notes to Financial Statements
December 31, 2015
Goldman Sachs Trust (the “Trust”) is a Delaware statutory trust registered under the Investment Company Act of 1940, as amended (the “Act”), as an open-end management investment company. The Trust includes the Goldman Sachs Long Short Fund (the “Fund”). The Fund is a non-diversified portfolio and currently offers five classes of shares: Class A, Class C, Institutional, Class IR, and Class R Shares.
Class A Shares are sold with a front-end sales charge of up to 5.50%. Class C Shares are sold with a contingent deferred sales charge (“CDSC”) of 1.00%, which is imposed on redemptions made within 12 months of purchase. Institutional, Class IR and Class R are not subject to a sales charge.
GS Investment Strategies, LLC (“GSIS”), an affiliate of Goldman, Sachs & Co. (“Goldman Sachs”), serves as investment adviser to the Fund pursuant to a management agreement (the “Agreement”) with the Trust.
|
| 2. SIGNIFICANT ACCOUNTING POLICIES |
The financial statements have been prepared in accordance with accounting principles generally accepted in the United States of America (“GAAP”) and require management to make estimates and assumptions that may affect the reported amounts and disclosures. Actual results may differ from those estimates and assumptions.
A. Investment Valuation — The Fund’s valuation policy is to value investments at fair value.
B. Investment Income and Investments — Investment income includes interest income and dividend income, net of any foreign withholding taxes, less any amounts reclaimable. Interest income is accrued daily and adjusted for amortization of premiums and accretion of discounts. Dividend income is recognized on ex-dividend date or, for certain foreign securities, as soon as such information is obtained subsequent to the ex-dividend date. Investment transactions are reflected on trade date. Realized gains and losses are calculated using identified cost. Investment transactions are recorded on the following business day for daily net asset value (“NAV”) calculations. Any foreign capital gains tax is accrued daily based upon net unrealized gains, and is payable upon sale of such investments.
For derivative contracts, realized gains and losses are recorded upon settlement of the contract. Upfront payments, if any, are made or received upon entering into a swap agreement and are reflected in the Statement of Assets and Liabilities. Upfront payments are recognized over the contract’s term/event as realized gains or losses, with the exception of forward starting interest rate swaps whose realized gains or losses are recognized from the effective start date.
C. Class Allocations and Expenses — Investment income, realized and unrealized gain (loss), and non-class specific expenses of the Fund are allocated daily based upon the proportion of net assets of each class. Non-class specific expenses directly incurred by the Fund are charged to the Fund, while such expenses incurred by the Trust are allocated across the Fund on a straight-line and/or pro-rata basis depending upon the nature of the expenses. Class specific expenses, where applicable, are borne by the respective share classes and include Distribution and Service, Transfer Agency and Service and Shareholder Administration fees.
24
GOLDMAN SACHS LONG SHORT FUND
|
| 2. SIGNIFICANT ACCOUNTING POLICIES (continued) |
D. Federal Taxes and Distributions to Shareholders — It is the Fund’s policy to comply with the requirements of the Internal Revenue Code of 1986, as amended (the “Code”), applicable to regulated investment companies (mutual funds) and to distribute each year substantially all of its investment company taxable income and capital gains to its shareholders. Accordingly, the Fund is not required to make any provisions for the payment of federal income tax. Distributions to shareholders are recorded on the ex-dividend date. Income and capital gains distributions, if any, are declared and paid annually.
Net capital losses are carried forward to future fiscal years and may be used to the extent allowed by the Code to offset any future capital gains. Losses that are carried forward will retain their character as either short-term or long-term capital losses. Utilization of capital loss carryforwards will reduce the requirement of future capital gains distributions.
The characterization of distributions to shareholders for financial reporting purposes is determined in accordance with federal income tax rules, which may differ from GAAP. The source of the Fund’s distributions may be shown in the accompanying financial statements as either from net investment income, net realized gain or capital. Certain components of the Fund’s net assets on the Statement of Assets and Liabilities reflect permanent GAAP/tax differences based on the appropriate tax character.
E. Foreign Currency Translation — The accounting records and reporting currency of the Fund is maintained in U.S. dollars. Assets and liabilities denominated in foreign currencies are translated into U.S. dollars using the current exchange rates at the close of each business day. The effect of changes in foreign currency exchange rates on investments is included within net realized and unrealized gain (loss) on investments. Changes in the value of other assets and liabilities as a result of fluctuations in foreign exchange rates are included in the Statement of Operations within net change in unrealized gain (loss) on foreign currency translations. Transactions denominated in foreign currencies are translated into U.S. dollars on the date the transaction occurred, the effects of which are included within net realized gain (loss) on foreign currency transactions.
F. Offering Costs — Offering costs paid in connection with the offering of shares of the Fund were being amortized on a straight-line basis over 12 months from the date of commencement of operations.
|
| 3. INVESTMENTS AND FAIR VALUE MEASUREMENTS |
The fair value of a financial instrument is the amount that would be received to sell an asset or paid to transfer a liability in an orderly transaction between market participants at the measurement date (i.e., the exit price). GAAP establishes a fair value hierarchy that prioritizes the inputs to valuation techniques used to measure fair value. The hierarchy gives the highest priority to unadjusted quoted prices in active markets for identical assets or liabilities (Level 1 measurements) and the lowest priority to
25
GOLDMAN SACHS LONG SHORT FUND
Notes to Financial Statements (continued)
December 31, 2015
|
| 3. INVESTMENTS AND FAIR VALUE MEASUREMENTS (continued) |
unobservable inputs (Level 3 measurements). The levels used for classifying investments are not necessarily an indication of the risk associated with investing in these investments. The three levels of the fair value hierarchy are described below:
Level 1 — Unadjusted quoted prices in active markets that are accessible at the measurement date for identical, unrestricted assets or liabilities;
Level 2 — Quoted prices in markets that are not active or financial instruments for which significant inputs are observable (including, but not limited to, quoted prices for similar investments, interest rates, foreign exchange rates, volatility and credit spreads), either directly or indirectly;
Level 3 — Prices or valuations that require significant unobservable inputs (including GSIS’s assumptions in determining fair value measurement).
Changes in valuation techniques may result in transfers into or out of an assigned level within the hierarchy. In accordance with the Fund’s policy, transfers between different levels of the fair value hierarchy resulting from such changes are deemed to have occurred as of the beginning of the reporting period.
The Board of Trustees (“Trustees”) has approved Valuation Procedures that govern the valuation of the portfolio investments held by the Fund, including investments for which market quotations are not readily available. The Trustees have delegated to GSIS day-to-day responsibility for implementing and maintaining internal controls and procedures related to the valuation of the Fund’s portfolio investments. To assess the continuing appropriateness of pricing sources and methodologies, GSIS regularly performs price verification procedures and issues challenges as necessary to third party pricing vendors or brokers, and any differences are reviewed in accordance with the Valuation Procedures.
A. Level 1 and Level 2 Fair Value Investments — The valuation techniques and significant inputs used in determining the fair values for investments classified as Level 1 and Level 2 are as follows:
Equity Securities — Equity securities traded on a United States (“U.S.”) securities exchange or the NASDAQ system, or those located on certain foreign exchanges, including but not limited to the Americas, are valued daily at their last sale price or official closing price on the principal exchange or system on which they are traded. If there is no sale or official closing price or such price is believed by GSIS to not represent fair value, equity securities are valued at the last bid price for long positions and at the last ask price for short positions. To the extent these investments are actively traded, they are classified as Level 1 of the fair value hierarchy, otherwise they are generally classified as Level 2.
26
GOLDMAN SACHS LONG SHORT FUND
|
| 3. INVESTMENTS AND FAIR VALUE MEASUREMENTS (continued) |
Unlisted equity securities for which market quotations are available are valued at the last sale price on the valuation date, or if no sale occurs, at the last bid price. Securities traded on certain foreign securities exchanges are valued daily at fair value determined by an independent fair value service (if available) under Valuation Procedures approved by the Trustees and consistent with applicable regulatory guidance. The independent fair value service takes into account multiple factors including, but not limited to, movements in the securities markets, certain depositary receipts, futures contracts and foreign currency exchange rates that have occurred subsequent to the close of the foreign securities exchange. These investments are generally classified as Level 2 of the fair value hierarchy.
Money Market Funds — Investments in the Goldman Sachs Financial Square Government Fund (“Underlying Fund”) are valued at the NAV of the FST Share class on the day of valuation. These investments are generally classified as Level 1 of the fair value hierarchy.
The Underlying Fund may invest in debt securities which are valued daily on the basis of quotations supplied by dealers, if market quotations are readily available, or an independent pricing service approved by the Trustees. The pricing services may use valuation models or matrix pricing, which consider: (i) yield or price with respect to bonds that are considered comparable in characteristics such as rating, interest rate and maturity date or (ii) quotations from securities dealers to determine current value.
For information regarding an Underlying Fund’s accounting policies and investment holdings, please see the Underlying Fund’s shareholder report.
Exchange Traded Funds — Investments in exchange traded funds are valued daily at the last sale price or official closing price on the principal exchange or system on which the investment is traded. To the extent these investments are actively traded, they are classified as Level 1 of the fair value hierarchy, otherwise they are generally classified as Level 2.
Derivative Contracts — A derivative is an instrument whose value is derived from underlying assets, indices, reference rates or a combination of these factors. The Fund enters into derivative transactions to hedge against changes in interest rates, securities prices, and/or currency exchange rates, to increase total return, or to gain access to certain markets or attain exposure to other underliers.
Exchange-traded derivatives, including futures and options contracts, are valued at the last sale or settlement price and typically fall within Level 1 of the fair value hierarchy. Over-the-counter (“OTC”) and centrally cleared derivatives are valued using market transactions and other market evidence, including market-based inputs to models, calibration to market-clearing transactions, broker or dealer quotations, or other alternative pricing sources. Where models are used, the selection of a particular model to value OTC and centrally cleared derivatives depends upon the contractual terms of, and specific risks inherent in, the instrument, as well as the availability of pricing information in the market. Valuation models require a variety of inputs, including contractual terms, market prices, yield curves, credit curves, measures of volatility, voluntary and involuntary prepayment rates, loss severity rates and correlations of such inputs. For OTC and centrally cleared derivatives that trade in liquid markets, model inputs can generally be verified and model selection does not involve significant management judgment. OTC and centrally cleared derivatives are classified within Level 2 of the fair value hierarchy when significant inputs are corroborated by market evidence.
27
GOLDMAN SACHS LONG SHORT FUND
Notes to Financial Statements (continued)
December 31, 2015
|
| 3. INVESTMENTS AND FAIR VALUE MEASUREMENTS (continued) |
i. Forward Contracts — A forward contract is a contract between two parties to buy or sell an asset at a specified price on a future date. A forward contract settlement can occur on a cash or delivery basis. Forward contracts are marked-to-market daily using independent vendor prices, and the change in value, if any, is recorded as an unrealized gain or loss. Cash and certain investments may be used to collateralize forward contracts.
A forward foreign currency contract is a forward contract in which a Fund agrees to receive or deliver a fixed quantity of one currency for another, at a pre-determined price at a future date. All forward foreign currency exchange contracts are marked-to-market daily at the applicable forward rate. Non-deliverable forward foreign currency exchange contracts are settled with the counterparty in cash without the delivery of foreign currency.
ii. Futures Contracts — Futures contracts are contracts to buy or sell a standardized quantity of a specified commodity or security and are valued based on exchanged settlement prices or independent market quotes. Futures contracts are valued at the last settlement price, or in the absence of a sale, the last bid price for long positions and at the last ask price for short positions, at the end of each day on the board of trade or exchange upon which they are traded. Upon entering into a futures contract, a Fund deposits cash or securities in an account on behalf of the broker in an amount sufficient to meet the initial margin requirement. Subsequent payments are made or received by a Fund equal to the daily change in the contract value and are recorded as variation margin receivable or payable with a corresponding offset to unrealized gains or losses.
iii. Options — When a Fund writes call or put options, an amount equal to the premium received is recorded as a liability and is subsequently marked-to-market to reflect the current value of the option written. Swaptions are options on interest rate swap contracts.
Upon the purchase of a call option or a put option by a Fund, the premium paid is recorded as an investment and subsequently marked-to-market to reflect the current value of the option. Certain options may be purchased with premiums to be determined on a future date. The premiums for these options are based upon implied volatility parameters at specified terms.
iv. Swap Contracts — Bilateral swap contracts are agreements in which the Fund and a counterparty agree to exchange periodic payments on a specified notional amount or make a net payment upon termination. Bilateral swap transactions are privately negotiated in the OTC market and payments are settled through direct payments between the Fund and the counterparty. By contrast, certain swap transactions are subject to mandatory central clearing. These swaps are executed through a derivatives clearing member (“DCM”), acting in an agency capacity, and submitted to a central counterparty (“CCP”) (“centrally cleared swaps”), in which case all payments are settled with the CCP through the DCM. Swaps are marked-to-market daily using pricing vendor quotations, counterparty or clearinghouse prices or model prices, and the change in value, if any, is recorded as an unrealized gain or loss. Upon entering into a swap contract, the Fund is required to satisfy an initial margin requirement by delivering cash or securities to the counterparty (or in some cases, segregated in a triparty account on behalf of the counterparty), which can be adjusted by any mark-to-market gains or losses pursuant to bilateral or centrally cleared arrangements. For centrally cleared swaps the daily change in valuation, if any, is recorded as a receivable or payable for variation margin.
28
GOLDMAN SACHS LONG SHORT FUND
|
| 3. INVESTMENTS AND FAIR VALUE MEASUREMENTS (continued) |
A total return swap is an agreement that gives the Fund the right to receive the appreciation in the value of a specified security, index or other instrument in return for a fee paid to the counterparty, which will typically be an agreed upon interest rate. If the underlying asset declines in value over the term of the swap, the Fund may also be required to pay the dollar value of that decline to the counterparty.
Securities Sold Short — Securities sold short are those securities which the Fund has sold but which it does not own. When the Fund sells a security it does not own, it must borrow the position that was sold and deliver it to the broker through which it made the short sale. In addition, cash and certain investments in securities may be used to collateralize the securities sold short. Each day the securities sold short transaction is open, the liability to replace the borrowed security is marked to market and an unrealized gain or loss is recorded. While the transaction remains open, the Fund may also incur expenses for any dividends or interest which will be paid to the lender of the securities as well as a fee to borrow the delivered security. During the term of the short sale, the value of the securities pledged as collateral on short sales is required to exceed the value of the securities sold short. The market value of securities pledged as collateral is included in the Schedule of Investments.
B. Level 3 Fair Value Investments — To the extent that significant inputs to valuation models and other alternative pricing sources are unobservable, or if quotations are not readily available, or if GSIS believes that such quotations do not accurately reflect fair value, the fair value of the Fund’s investments may be determined under Valuation Procedures approved by the Trustees. GSIS, consistent with its procedures and applicable regulatory guidance, may make an adjustment to the most recent valuation prices of either domestic or foreign securities in light of significant events to reflect what it believes to be the fair value of the securities at the time of determining a Fund’s NAV. Significant events which could affect a large number of securities in a particular market may include, but are not limited to: significant fluctuations in U.S. or foreign markets; market dislocations; market disruptions; or unscheduled market closings. Significant events which could also affect a single issuer may include, but are not limited to: corporate actions such as reorganizations, mergers and buy-outs; ratings downgrades; and bankruptcies.
C. Fair Value Hierarchy — The following is a summary of the Fund’s investments and derivatives classified in the fair value hierarchy as of December 31, 2015:
| | | | | | | | | | | | |
| | | |
| Investment Type | | Level 1 | | | Level 2 | | | Level 3 | |
| Assets(a) | | | | | | | | | | | | |
Common Stock and/or Other Equity Investments | | | | | | | | | | | | |
Asia | | $ | 11,588,688 | | | $ | — | | | $ | — | |
Europe | | | 18,434,799 | | | | 11,881,328 | | | | — | |
North America | | | 73,236,653 | | | | — | | | | — | |
Investment Company | | | 81,330,466 | | | | — | | | | — | |
| Total | | $ | 184,590,606 | | | $ | 11,881,328 | | | $ | — | |
| Liabilities(a) | | | | | | | | | | | | |
Common Stock and Exchange Traded Funds Sold Short | | | | | | | | | | | | |
Europe | | $ | — | | | $ | (767,196 | ) | | $ | — | |
North America | | | (40,227,259 | ) | | | — | | | | — | |
| Total | | $ | (40,227,259 | ) | | $ | (767,196 | ) | | $ | — | |
29
GOLDMAN SACHS LONG SHORT FUND
Notes to Financial Statements (continued)
December 31, 2015
|
| 3. INVESTMENTS AND FAIR VALUE MEASUREMENTS (continued) |
| | | | | | | | | | | | |
| | | |
| Derivative Type | | Level 1 | | | Level 2 | | | Level 3 | |
| Assets | | | | | | | | | | | | |
Options Purchased | | $ | 937,831 | | | $ | 1,705,170 | | | $ | 2,184 | |
Forward Foreign Currency Exchange Contracts(b) | | | — | | | | 236,879 | | | | — | |
Futures Contracts(b) | | | 354,254 | | | | — | | | | — | |
Total Return Swap Contracts(b) | | | — | | | | 806,879 | | | | — | |
| Total | | $ | 1,292,085 | | | $ | 2,748,928 | | | $ | 2,184 | |
| Liabilities | | | | | | | | | | | | |
Forward Foreign Currency Exchange Contracts(b) | | $ | — | | | $ | (109,239 | ) | | $ | — | |
Futures Contracts(b) | | | (66,939 | ) | | | — | | | | — | |
Total Return Swap Contracts(b) | | | — | | | | (788,457 | ) | | | — | |
Written Options Contracts | | | (4,880 | ) | | | (450,280 | ) | | | — | |
| Total | | $ | (71,819 | ) | | $ | (1,347,976 | ) | | $ | — | |
| (a) | | Amount are disclosed by continent to highlight the impact of time zone differences between local market close and the calculation of net asset value. Security valuations are based on the principle exchange or system on which they are traded, which may differ from country of domicile. |
| (b) | | Amount shown represents unrealized gain (loss) at period end. |
|
| 4. INVESTMENTS IN DERIVATIVES |
The following table sets forth, by certain risk types, the gross value of derivative contracts as of December 31, 2015. These instruments were used as part of the Fund’s investment strategies and to obtain and/or manage exposure related to the risks below. The values in the table below exclude the effects of cash collateral received or posted pursuant to these derivative contracts, and therefore are not representative of the Fund’s net exposure.
| | | | | | | | | | | | |
| Risk | | Statement of Assets and Liabilities | | Assets | | | Statement of Assets and Liabilities | | Liabilities | |
Equity | | Receivable for unrealized gain on swap contracts; Variation margin on certain derivative contracts; Investments, at value | | $ | 3,806,318 | (a) | | Payable for unrealized loss on swap contracts; Variation margin on certain derivative contracts; Written options, at value | | $ | (1,310,556) | (a) |
Currency | | Receivable for unrealized gain on forward foreign currency exchange contracts | | | 236,879 | | | Payable for unrealized loss on forward foreign currency exchange contracts | | | (109,239) | |
| Total | | | | $ | 4,043,197 | | | | | $ | (1,419,795) | |
| (a) | | Includes unrealized gain (loss) on futures contracts described in the Additional Investment Information sections of the Schedule of Investments. Only current day’s variation margin is reported within the Statement of Assets and Liabilities. |
30
GOLDMAN SACHS LONG SHORT FUND
|
| 4. INVESTMENTS IN DERIVATIVES (continued) |
The following table sets forth, by certain risk types, the Fund’s gains (losses) related to these derivatives and their indicative volumes for the fiscal year ended December 31, 2015. These gains (losses) should be considered in the context that these derivative contracts may have been executed to create investment opportunities and/or economically hedge certain investments, and accordingly, certain gains (losses) on such derivative contracts may offset certain (losses) gains attributable to investments. These gains (losses) are included in “Net realized gain (loss)” or “Net change in unrealized gain (loss)” on the Statement of Operations:
| | | | | | | | | | | | | | |
| Risk | | Statement of Operations | | Net Realized
Gain (Loss) | | | Net Change in
Unrealized
Gain (Loss) | | | Average
Number of
Contracts(a) | |
| Equity | | Net realized gain (loss) from investments, futures contracts, swap contracts and written options/Net change in unrealized gain (loss) on investments, futures contracts, swap contracts and written options | | $ | (1,628,863 | ) | | $ | (1,128,256 | ) | | | 472 | |
| Currency | | Net realized gain (loss) from forward foreign currency exchange contracts/Net change in unrealized gain (loss) on forward foreign currency exchange contracts | | $ | 710,826 | | | $ | (25,096 | ) | | | 36 | |
| Total | | | | $ | (918,037 | ) | | $ | (1,153,352 | ) | | | 508 | |
| (a) | | Average number of contracts is based on the average of month end balances for the period ended December 31, 2015. |
In order to better define its contractual rights and to secure rights that will help a Fund mitigate its counterparty risk, a Fund may enter into an International Swaps and Derivatives Association, Inc. Master Agreement (“ISDA Master Agreement”) or similar agreement with its derivatives counterparties. An ISDA Master Agreement is a bilateral agreement between a Fund and a counterparty that governs OTC derivatives (including forward foreign currency exchange contracts, and certain options and swaps), and typically contains, among other things, collateral posting terms and netting provisions in the event of a default and/or termination event. The provisions of the ISDA Master Agreement typically permit a single net payment in the event of a default (close-out netting) or similar event, including the bankruptcy or insolvency of the counterparty.
Collateral and margin requirements differ between exchange traded derivatives and OTC derivatives. Margin requirements are established by the broker or clearing house for exchange-traded and centrally cleared derivatives (financial futures contracts, options and centrally cleared swaps) pursuant to governing agreements for those instrument types. Brokers can ask for margin in excess of the minimum in certain circumstances. Collateral terms are contract-specific for OTC derivatives. For derivatives traded under an ISDA Master Agreement, the collateral requirements are typically calculated by netting the marked to market amount for each transaction under such agreement and comparing that amount to the value of any collateral currently pledged by a Fund and the counterparty. Additionally, a Fund may be required to post initial margin to the counterparty, the terms of which would be outlined in the confirmation of the OTC transaction.
For financial reporting purposes, cash collateral that has been pledged to cover obligations of a Fund and cash collateral received from the counterparty, if any, is reported separately on the Statement of Assets and Liabilities as receivables/payables for collateral on certain derivative contracts. Non-cash collateral pledged by a Fund, if any, is noted in the Schedule of Investments. Generally, the amount of collateral due from or to a counterparty must exceed a minimum transfer amount threshold before a transfer is required to be made. To the extent amounts due to a Fund from its counterparties are not fully collateralized, contractually or otherwise, the Fund bears the risk of loss from counterparty nonperformance. A Fund attempts to mitigate counterparty risk by only entering into agreements with counterparties that the Investment Adviser believes to be of good standing and by monitoring the financial stability of those counterparties.
31
GOLDMAN SACHS LONG SHORT FUND
Notes to Financial Statements (continued)
December 31, 2015
|
| 4. INVESTMENTS IN DERIVATIVES (continued) |
Additionally, the netting of assets and liabilities and the offsetting of collateral pledged or received are based on contractual netting/set-off provisions in the ISDA Master Agreement or similar agreements. However, in the event of a default or insolvency of a counterparty, a court could determine that such rights are not enforceable due to the restrictions or prohibitions against the right of setoff that may be imposed in accordance with a particular jurisdiction’s bankruptcy or insolvency laws.
The following tables set forth the Funds’ net exposure for derivative instruments that are subject to enforceable master netting arrangements or similar agreements as of December 31, 2015:
| | | | | | | | | | | | | | | | | | | | | | | | | | | | | | | | | | | | | | | | | | | | |
| | | Derivative Assets(1) | | | Derivative Liabilities(1) | | | Net Derivative
Asset
(Liabilities) | | | Collateral
(Received)
Pledged(1) | | | Net
Amount(2) | |
| Counterparty | | Options
Purchased | | | Swaps | | | Forward
Currency
Contracts | | | Total | | | Swaps | | | Forward
Currency
Contracts | | | Written
Options | | | Total | | | | |
Credit Suisse International (London) | | $ | 607,914 | | | $ | 806,879 | | | $ | — | | | $ | 1,414,793 | | | $ | (788,457 | ) | | $ | — | | | $ | — | | | $ | (788,457 | ) | | $ | 626,336 | | | $ | — | | | $ | 626,336 | |
Deutsche Bank AG | | | 40,829 | | | | — | | | | — | | | | 40,829 | | | | — | | | | — | | | | — | | | | — | | | | 40,829 | | | | (40,829 | ) | | | — | |
Morgan Stanley & Co. International PLC | | | 1,056,427 | | | | — | | | | 236,879 | | | | 1,293,306 | | | | — | | | | (109,239 | ) | | | (450,280 | ) | | | (559,519 | ) | | | 733,787 | | | | (250,000 | ) | | | 483,787 | |
Total | | $ | 1,705,170 | | | $ | 806,879 | | | $ | 236,879 | | | $ | 2,748,928 | | | $ | (788,457 | ) | | $ | (109,239 | ) | | $ | (450,280 | ) | | $ | (1,347,976 | ) | | $ | 1,400,952 | | | $ | (290,829 | ) | | $ | 1,110,123 | |
| (1) | | Gross amounts available for offset but not netted in the Statement of Assets and Liabilities. |
| (2) | | Net amount represents the net amount due (to) from counterparty in the event of a default based on the contractual set-off rights under the agreement. Net amount excludes any over-collateralized amounts. |
|
| 5. AGREEMENTS AND AFFILIATED TRANSACTIONS |
A. Management Agreement — Under the Agreement, GSIS manages the Fund, subject to the general supervision of the Trustees.
As compensation for the services rendered pursuant to the Agreement, the assumption of the expenses related thereto and administration of the Fund’s business affairs, including providing facilities, GSIS is entitled to a management fee, accrued daily and paid monthly, equal to an annual percentage rate of the Fund’s average daily net assets.
32
GOLDMAN SACHS LONG SHORT FUND
|
| 5. AGREEMENTS AND AFFILIATED TRANSACTIONS (continued) |
For the fiscal year ended December 31, 2015, the contractual and effective net management fee with GSIS were at the following rates:
| | | | | | | | | | | | | | | | | | | | | | |
| Contractual Management Rate | | | | |
First
$2 billion | | | Next
$3 billion | | | Next
$3 billion | | | Over
$8 billion | | | Effective
Management
Rate | | | Effective Net
Management
Rate*^ | |
| | 1.60% | | | | 1.44% | | | | 1.37% | | | | 1.34% | | | | 1.60% | | | | 1.56% | |
| * | | GSIS has agreed to waive a portion of its management fee payable by the Fund in an amount equal to any management fee it earns as an investment adviser to any of the affiliated funds in which the Fund invests through at least April 30, 2016. Prior to such date GSIS may not terminate the arrangement without the approval of the Trustees. |
| ^ | | Effective Net Management Rate includes the impact of management fee waivers of affiliated underlying funds, if any. |
The Fund invests in the FST Shares of the Goldman Sachs Financial Square Government Fund, which is an affiliated Underlying Fund. GSIS has agreed to waive a portion of its management fee payable by the Fund in an amount equal to the management fee GSIS or an affiliate earns as an investment adviser to any of the affiliated Underlying Funds in which the Fund invests. For the fiscal year ended December 31, 2015, GSIS waived $58,092 of the Fund’s management fee.
B. Distribution and Service Plans — The Trust, on behalf of the Fund, has adopted Distribution and Service Plans (the “Plans”). Under the Plans, Goldman Sachs, which serves as distributor (the “Distributor”), is entitled to a fee accrued daily and paid monthly, for distribution services and personal and account maintenance services, which may then be paid by Goldman Sachs to authorized dealers, at the following annual rates calculated on the Fund’s average daily net assets of each respective share class:
| | | | | | | | | | | | |
| | | Distribution and Service Plan Rates | |
| | | Class A* | | | Class C | | | Class R* | |
Distribution Plan | | | 0.25 | % | | | 0.75 | % | | | 0.50 | % |
Service Plan | | | — | | | | 0.25 | | | | — | |
| * | | With respect to Class A and Class R Shares, the Distributor, at its discretion may use compensation for distribution services paid under the Distribution Plan to compensate service organizations for personal and account maintenance services and expenses as long as such total compensation does not exceed the maximum cap on “service fees” imposed by the Financial Industry Regulatory Authority. |
C. Distribution Agreement — Goldman Sachs, as Distributor of the shares of the Fund pursuant to a Distribution Agreement, may retain a portion of the Class A Shares’ front end sales charge and Class C Shares’ CDSC. During the fiscal year ended December 31, 2015, Goldman Sachs advised that it retained $17,658 of Class A Shares and did not retain any portion of Class C Shares.
D. Transfer Agency Agreement — Goldman Sachs also serves as the transfer agent of the Fund for a fee pursuant to the Transfer Agency Agreement. The fees charged for such transfer agency services are accrued daily and paid monthly at annual rates as follows: 0.19% of the average daily net assets of Class A, Class C, Class IR and Class R Shares; and 0.04% of the average daily net assets of Institutional Shares.
33
GOLDMAN SACHS LONG SHORT FUND
Notes to Financial Statements (continued)
December 31, 2015
|
| 5. AGREEMENTS AND AFFILIATED TRANSACTIONS (continued) |
E. Other Expense Agreements and Affiliated Transactions — GSIS has agreed to limit certain “Other Expenses” of the Fund (excluding acquired fund fees and expenses, transfer agency fees and expenses, service fees and shareholder administration fees (as applicable), taxes, dividend and interest payments on securities sold short, interest, brokerage fees, shareholder meetings, litigation, indemnification and extraordinary expenses) to the extent such expenses exceed, on an annual basis, a percentage rate of the average daily net assets of the Fund. Such Other Expense reimbursements, if any, are accrued daily and paid monthly. In addition, the Fund is not obligated to reimburse GSIS for prior fiscal year expense reimbursements, if any. The Other Expense limitations as an annual percentage rate of average daily net assets for the Fund are 0.114%. These Other Expense limitations will remain in place through at least April 30, 2016, and prior to such date GSIS may not terminate the arrangements without the approval of the Trustees. In addition, the Fund has entered into certain offset arrangements with the custodian and the transfer agent, which may result in a reduction of the Fund’s expenses and are received irrespective of the application of the “Other Expense” limitations described above.
For the fiscal year ended December 31, 2015, these expense reductions, including any fee waivers and Other Expense reimbursements, were as follows:
| | | | | | | | | | |
Management
Fee Waiver | | | Other Expense
Reimbursements | | | Total Expense
Reductions | |
| $ | 58,092 | | | $ | 551,543 | | | $ | 609,635 | |
F. Line of Credit Facility — As of December 31, 2015, the Fund participated in a committed revolving line of credit facility with a major financial institution. Pursuant to the terms of the facility, the Fund may borrow an aggregate amount of up to $10,000,000. The interest rate on borrowings is based on market rates. The facility also requires a fee to be paid by the Fund based on the amount of the commitment that has not been utilized. For the period ended December 31, 2015, the Fund did not have any borrowings under the facility.
G. Other Transactions with Affiliates — The table below shows the transactions in and earnings from investments in these affiliated Funds for the fiscal year ended December 31, 2015:
| | | | | | | | | | | | | | | | | | | | |
| Underlying Fund | | Market Value 12/31/14 | | | Purchases at Costs | | | Proceeds from Sales | | | Market Value 12/31/15 | | | Dividend Income | |
Goldman Sachs Financial Square Government Fund — FST Shares | | $ | 11,154,562 | | | $ | 509,015,302 | | | $ | (438,839,398 | ) | | $ | 81,330,466 | | | $ | 16,250 | |
As of December 31, 2015, the Goldman Sachs Group (“GSG”), Inc. was the beneficial owner of approximately 19% and 100% of Institutional and Class R Shares, respectively of the Fund.
|
| 6. PORTFOLIO SECURITIES TRANSACTIONS |
The cost of purchases and proceeds from sales and maturities of long-term securities for the fiscal year ended December 31, 2015, were $627,855,606 and $542,155,494, respectively.
The tax character of distributions paid during the fiscal year ended December 31, 2015 was $666,595 from ordinary income.
There were no distributions paid during the period ended December 31, 2014.
34
GOLDMAN SACHS LONG SHORT FUND
|
| 7. TAX INFORMATION (continued) |
As of December 31, 2015, the components of accumulated earnings (losses) on a tax basis were as follows:
| | | | |
Capital loss carryforwards: | | | | |
Perpetual Short-Term | | $ | (2,525,339 | ) |
Timing differences (Straddles/Post October Loss Deferral) | | | (8,775,892 | ) |
Unrealized gains (losses) — net | | | (11,974,325 | ) |
Total accumulated losses, net | | $ | (23,275,556 | ) |
As of December 31, 2015, the Funds’ aggregate security unrealized gains and losses based on cost for U.S. federal income tax purposes were as follows:
| | | | |
Tax Cost | | $ | 212,813,183 | |
Gross unrealized gain | | | 8,311,282 | |
Gross unrealized loss | | | (22,007,346 | ) |
Net unrealized loss on securities | | $ | (13,696,064 | ) |
Net unrealized gain on other investments | | | 1,721,739 | |
Net unrealized loss | | $ | (11,974,325 | ) |
The difference between GAAP-basis and tax-basis unrealized gains (losses) is attributable primarily to wash sales, net mark to market gains (losses) on regulated futures and options contracts, net mark to market on foreign currency contracts and differences in the tax treatment of swap transactions.
In order to present certain components of the Fund’s capital accounts on a tax-basis, certain reclassifications have been recorded to the Fund’s accounts. These reclassifications have no impact on the net asset value of the Fund and result primarily from dividend redesignations, net operating losses, certain capitalized and non-deductible expenses and differences in the tax treatment of foreign currency transactions, and swap transactions.
| | | | | | | | | | |
| Paid-in-Capital | | | Accumulated Net Realized Gain (Loss) | | | Undistributed Net Investment Income (Loss) | |
| $ | (1,258,091 | ) | | $ | (914,709 | ) | | $ | 2,172,800 | |
GSIS has reviewed the Fund’s tax positions for all open tax years, as applicable and has concluded that no provision for income tax is required in the Fund’s financial statements. Such open tax years remain subject to examination and adjustment by tax authorities.
The Fund’s risks include, but are not limited to, the following:
Foreign Custody Risk — A Fund that invests in foreign securities may hold such securities and cash with foreign banks, agents, and securities depositories appointed by the Fund’s custodian (each a “Foreign Custodian”). Some foreign custodians may be recently organized or new to the foreign custody business. In some countries, Foreign Custodians may be subject to little or no regulatory oversight over, or independent evaluation of, their operations. Further, the laws of certain countries may place limitations on a Fund’s ability to recover its assets if a Foreign Custodian enters bankruptcy.
35
GOLDMAN SACHS LONG SHORT FUND
Notes to Financial Statements (continued)
December 31, 2015
|
| 8. OTHER RISKS (continued) |
Investments in Other Investment Companies — As a shareholder of another investment company, including an exchange-traded fund (“ETF”), a Fund will indirectly bear its proportionate share of any net management fees and other expenses paid by such other investment companies, in addition to the fees and expenses regularly borne by the Fund. ETFs are subject to risks that do not apply to conventional mutual funds, including but not limited to the following: (i) the market price of the ETF’s shares may trade at a premium or a discount to their NAV; and (ii) an active trading market for an ETF’s shares may not develop or be maintained.
Large Shareholder Transactions Risk — The Fund may experience adverse effects when certain large shareholders, such as other funds, institutional investors (including those trading by use of non-discretionary mathematical formulas), financial intermediaries (who may make investment decisions on behalf of underlying clients and/or include the Fund in their investment model), individuals, accounts and Goldman Sachs affiliates, purchase or redeem large amounts of shares of the Fund. Such large shareholder redemptions may cause the Fund to sell portfolio securities at times when it would not otherwise do so, which may negatively impact the Fund’s NAV and liquidity. These transactions may also accelerate the realization of taxable income to shareholders if such sales of investments resulted in gains, and may also increase transaction costs. In addition, a large redemption could result in the Fund’s current expenses being allocated over a smaller asset base, leading to an increase in the Fund’s expense ratio. Similarly, large Fund share purchases may adversely affect the Fund’s performance to the extent that the Fund is delayed in investing new cash and is required to maintain a larger cash position than it ordinarily would.
Liquidity Risk — The Fund may make investments that are illiquid or that may become less liquid in response to market developments or adverse investor perceptions. Illiquid investments may be more difficult to value. Liquidity risk may also refer to the risk that the Fund will not be able to pay redemption proceeds within the allowable time period because of unusual market conditions, an unusually high volume of redemption requests, or other reasons. To meet redemption requests, the Fund may be forced to sell investments at an unfavorable time and/or under unfavorable conditions.
Market and Credit Risks — In the normal course of business, the Fund trades financial instruments and enters into financial transactions where risk of potential loss exists due to changes in the market (market risk). Additionally, the Fund may also be exposed to credit risk in the event that an issuer or guarantor fails to perform or that an institution or entity with which the Fund has unsettled or open transactions defaults.
Investing in foreign markets may involve special risks and considerations not typically associated with investing in the United States. Foreign securities may be subject to risk of loss because of more or less foreign government regulation, less public information and less economic, political and social stability in the countries in which the Fund invests. Loss may also result from the imposition of exchange controls, confiscations and other government restrictions by the United States or other governments, or from problems in registration, settlement or custody. Foreign risk also involves the risk of negative foreign currency rate fluctuations, which may cause the value of securities denominated in such foreign currency (or other instruments through which the Fund has exposure to foreign currencies) to decline in value. Currency exchange rates may fluctuate significantly over short periods of time. To the extent that the Fund also invests in securities of issuers located in emerging markets, these risks may be more pronounced.
Non-Diversification Risk — The Fund is non-diversified, meaning that it is permitted to invest a larger percentage of its assets in fewer issuers than diversified mutual funds. Thus, the Fund may be more susceptible to adverse developments affecting any single issuer held in its portfolio, and may be more susceptible to greater losses because of these developments.
Portfolio Concentration Risk — As a result of the Fund’s ability to invest a large percentage of its assets in obligations of issuers within the same country, state, region, currency or economic sector, an adverse economic, business or political development may affect the value of the Fund’s investments more than if its investments were not so concentrated.
36
GOLDMAN SACHS LONG SHORT FUND
|
| 8. OTHER RISKS (continued) |
Short Position Risk — The Fund may enter into a short position through a futures contract, an option or swap agreement or through short sales of any instrument that the Fund may purchase for investment. Taking short positions involves leverage of the Fund’s assets and presents various risks. If the value of the underlying instrument or market in which the Fund has taken a short position increases, then the Fund will incur a loss equal to the increase in value from the time that the short position was entered into plus any related interest payments or other fees. Taking short positions involves the risk that losses may be disproportionate, may exceed the amount invested, and may be unlimited.
Under the Trust’s organizational documents, its Trustees, officers, employees and agents are indemnified, to the extent permitted by the Act and state law, against certain liabilities that may arise out of performance of their duties to the Fund. Additionally, in the course of business, the Fund enters into contracts that contain a variety of indemnification clauses. The Fund’s maximum exposure under these arrangements is unknown, as this would involve future claims that may be made against the Fund that have not yet occurred. However, GSIS believes the risk of loss under these arrangements to be remote.
Subsequent events after the Statement of Assets and Liabilities date have been evaluated through the date the financial statements were issued. GSIS has concluded that there is no impact requiring adjustment or disclosure in the financial statements.
37
GOLDMAN SACHS LONG SHORT FUND
Notes to Financial Statements (continued)
December 31, 2015
|
| 11. SUMMARY OF SHARE TRANSACTIONS |
Share activity is as follows:
| | | | | | | | | | | | | | | | |
| | | For the Period Ended
December 31, 2015 | | | For the Period Ended
December 31, 2014(a) | |
| | | Shares | | | Dollars | | | Shares | | | Dollars | |
| | | | |
| Class A Shares | | | | | | | | | | | | | | | | |
Shares sold | | | 3,093,006 | | | $ | 31,041,694 | | | | 53,422 | | | $ | 539,145 | |
Reinvestment of distributions | | | 5,248 | | | | 47,671 | | | | — | | | | — | |
Shares redeemed | | | (952,835 | ) | | | (8,873,843 | ) | | | (1 | ) | | | (15 | ) |
| | | | 2,145,419 | | | | 22,215,522 | | | | 53,421 | | | | 539,130 | |
| Class C Shares | | | | | | | | | | | | | | | | |
Shares sold | | | 732,249 | | | | 7,413,168 | | | | 6,104 | | | | 61,131 | |
Reinvestment of distributions | | | 1,020 | | | | 9,146 | | | | — | | | | — | |
Shares redeemed | | | (123,450 | ) | | | (1,138,389 | ) | | | (1 | ) | | | (10 | ) |
| | | | 609,819 | | | | 6,283,925 | | | | 6,103 | | | | 61,121 | |
| Institutional Shares | | | | | | | | | | | | | | | | |
Shares sold | | | 19,243,095 | | | | 197,141,958 | | | | 5,140,792 | | | | 51,416,520 | |
Reinvestment of distributions | | | 62,998 | | | | 576,639 | | | | — | | | | — | |
Shares redeemed | | | (10,452,796 | ) | | | (101,054,018 | ) | | | (16 | ) | | | (166 | ) |
| | | | 8,853,297 | | | | 96,664,579 | | | | 5,140,776 | | | | 51,416,354 | |
| Class IR Shares | | | | | | | | | | | | | | | | |
Shares sold | | | 2,360,467 | | | | 24,427,963 | | | | 8,058 | | | | 81,010 | |
Reinvestment of distributions | | | 3,229 | | | | 29,450 | | | | — | | | | — | |
Shares redeemed | | | (1,369,341 | ) | | | (12,845,028 | ) | | | (1 | ) | | | (10 | ) |
| | | | 994,355 | | | | 11,612,385 | | | | 8,057 | | | | 81,000 | |
| Class R Shares | | | | | | | | | | | | | | | | |
Shares sold | | | — | | | | — | | | | 2,501 | | | | 25,010 | |
Reinvestment of distributions | | | 4 | | | | 39 | | | | — | | | | — | |
Shares redeemed | | | — | | | | — | | | | (1 | ) | | | (10 | ) |
| | | | 4 | | | | 39 | | | | 2,500 | | | | 25,000 | |
NET INCREASE | | | 12,602,894 | | | $ | 136,776,450 | | | | 5,210,857 | | | $ | 52,122,605 | |
| (a) | | Fund commenced operations on September 30, 2014. |
38
Report of Independent Registered Public
Accounting Firm
To the Board of Trustees of Goldman Sachs Trust and Shareholders of
Goldman Sachs Long Short Fund:
In our opinion, the accompanying statement of assets and liabilities, including the schedule of investments, and the related statements of operations, of changes in net assets, and of cash flows and the financial highlights present fairly, in all material respects, the financial position of the Goldman Sachs Long Short Fund (the “Fund”), a fund of Goldman Sachs Trust, at December 31, 2015, and the results of its operations, the changes in its net assets, cash flows and the financial highlights for each of the periods indicated, in conformity with accounting principles generally accepted in the United States of America. These financial statements and financial highlights (hereafter referred to as “financial statements”) are the responsibility of the Fund’s management. Our responsibility is to express an opinion on these financial statements based on our audits. We conducted our audits of these financial statements in accordance with the standards of the Public Company Accounting Oversight Board (United States). Those standards require that we plan and perform the audit to obtain reasonable assurance about whether the financial statements are free of material misstatement. An audit includes examining, on a test basis, evidence supporting the amounts and disclosures in the financial statements, assessing the accounting principles used and significant estimates made by management, and evaluating the overall financial statement presentation. We believe that our audits, which included confirmation of securities at December 31, 2015 by correspondence with the custodian, brokers, transfer agent of the underlying fund and the application of alternative auditing procedures where confirmation of securities purchased had not been received, provide a reasonable basis for the opinion expressed above.
PricewaterhouseCoopers LLP
Boston, Massachusetts
February 26, 2016
39
GOLDMAN SACHS LONG SHORT FUND
Fund Expenses — Six Month Period Ended December 31, 2015 (Unaudited)
As a shareholder of Class A, Class C, Institutional, Class IR, and Class R Shares of the Fund, you incur two types of costs: (1) transaction costs, including sales charges on purchase payments (with respect to Class A Shares), contingent deferred sales charges on redemptions (with respect to Class C Shares), and (2) ongoing costs, including management fees; distribution and service (12b-1) fees (with respect to Class A, Class C and Class R Shares); and other Fund expenses. This Example is intended to help you understand your ongoing costs (in dollars) of investing in Class A, Class C, Institutional, Class IR, and Class R Shares of the Funds and to compare these costs with the ongoing costs of investing in other mutual funds.
The Example is based on an investment of $1,000 invested at the beginning of the period and held for the entire period from July 1, 2015 through December 31, 2015, which represents a period of 184 out of 365 days.
Actual Expenses — The first line under each share class in the table below provides information about actual account values and actual expenses. You may use the information in this line, together with the amount you invested, to estimate the expenses that you paid over the period. Simply divide your account value by $1,000 (for example, an $8,600 account value divided by $1,000=8.6), then multiply the result by the number in the first line under the heading entitled “Expenses Paid” to estimate the expenses you paid on your account during this period.
Hypothetical Example for Comparison Purposes — The second line under each share class in the table below provides information about hypothetical account values and hypothetical expenses based on the Fund’s actual net expense ratios and an assumed rate of return of 5% per year before expenses, which is not the Fund’s actual return. The hypothetical account values and expenses may not be used to estimate the actual ending account balance or expenses you paid for the period. You may use this information to compare the ongoing costs of investing in the Funds and other funds. To do so, compare this 5% hypothetical example with the 5% hypothetical examples that appear in the shareholder reports of the other funds.
Please note that the expenses shown in the table are meant to highlight your ongoing costs only and do not reflect any transactional costs, such as sales charges, redemption fees, or exchange fees. Therefore, the second line of the table is useful in comparing ongoing costs only, and will not help you determine the relative total costs of owning different funds. In addition, if these transactional costs were included, your costs would have been higher.
| | | | | | | | | | | | |
| | | Long Short Fund | |
| Share Class | | Beginning
Account
Value
7/1/15 | | | Ending
Account
Value
12/31/15 | | | Expenses
Paid for the
6 months ended
12/31/15* | |
| Class A | | | | | | | | | | | | |
Actual | | $ | 1,000.00 | | | $ | 874.20 | | | $ | 14.12 | |
Hypothetical 5% return | | | 1,000.00 | | | | 1,010.13 | + | | | 15.15 | |
| Class C | | | | | | | | | | | | |
Actual | | | 1,000.00 | | | | 870.10 | | | | 17.68 | |
Hypothetical 5% return | | | 1,000.00 | | | | 1,006.30 | + | | | 18.96 | |
| Institutional | | | | | | | | | | | | |
Actual | | | 1,000.00 | | | | 875.40 | | | | 12.20 | |
Hypothetical 5% return | | | 1,000.00 | | | | 1,012.20 | + | | | 13.09 | |
| Class IR | | | | | | | | | | | | |
Actual | | | 1,000.00 | | | | 875.10 | | | | 12.86 | |
Hypothetical 5% return | | | 1,000.00 | | | | 1,011.49 | + | | | 13.79 | |
| Class R | | | | | | | | | | | | |
Actual | | | 1,000.00 | | | | 872.50 | | | | 15.10 | |
Hypothetical 5% return | | | 1,000.00 | | | | 1,009.07 | + | | | 16.20 | |
| * | | Expenses for each share class are calculated using each Fund’s annualized net expense ratio for each class, which represents the ongoing expenses as a percentage of net assets for the six months ended December 31, 2015. Expenses are calculated by multiplying the annualized net expense ratio by the average account value for the period; then multiplying the result by the number of days in the most recent fiscal half year; and then dividing that result by the number of days in the fiscal year. The annualized net expense ratios for the period were as follows: |
| | | | | | | | | | | | | | | | | | | | |
| Fund | | Class A | | | Class C | | | Institutional | | | Class IR | | | Class R | |
Long Short | | | 2.99 | % | | | 3.75 | % | | | 2.58 | % | | | 2.72 | % | | | 3.20 | % |
| + | | Hypothetical expenses are based on the Fund’s actual annualized net expense ratios and an assumed rate of return of 5% per year before expenses. |
40
GOLDMAN SACHS LONG SHORT FUND
Trustees and Officers (Unaudited)
Independent Trustees
| | | | | | | | | | |
Name,
Address and Age1 | | Position(s) Held with the Trust | | Term of Office and
Length of
Time Served2 | | Principal Occupation(s) During Past 5 Years | | Number of
Portfolios in
Fund Complex
Overseen by
Trustee3 | | Other Directorships Held by Trustee4 |
Ashok N. Bakhru Age: 73 | | Chairman of the Board of Trustees | | Since 1996 (Trustee since 1991) | | Mr. Bakhru is retired. He was formerly Director, Apollo Investment Corporation (a business development company) (2008-2013); President, ABN Associates (a management and financial consulting firm) (1994-1996 and 1998-2012); Trustee, Scholarship America (1998-2005); Trustee, Institute for Higher Education Policy (2003-2008); Director, Private Equity Investors — III and IV (1998-2007), and Equity-Linked Investors II (April 2002-2007). Chairman of the Board of Trustees — Goldman Sachs Fund Complex. | | 139 | | None |
Kathryn A. Cassidy Age: 61 | | Trustee | | Since 2015 | | Ms. Cassidy is retired. Formerly, she was Advisor to the Chairman (May 2014-December 2014); and Senior Vice President and Treasurer (2008-2014), General Electric Company & General Electric Capital Corporation (technology and financial services companies). Trustee — Goldman Sachs Fund Complex. | | 114 | | None |
John P. Coblentz, Jr. Age: 74 | | Trustee | | Since 2003 retiring effective 1/1/2016, term is through 12/31/2015 | | Mr. Coblentz is retired. Formerly, he was Partner, Deloitte & Touche LLP (a professional services firm) (1975-2003); Director, Emerging Markets Group, Ltd. (2004-2006); and Director, Elderhostel, Inc. (2006-2012). Trustee — Goldman Sachs Fund Complex. | | 139 | | None |
Diana M. Daniels Age: 66 | | Trustee | | Since 2007 | | Ms. Daniels is retired. Formerly, she was Vice President, General Counsel and Secretary, The Washington Post Company (1991-2006). Ms. Daniels is a Trustee Emeritus and serves as a Presidential Councillor of Cornell University (2013-Present); Member, Advisory Board, Psychology Without Borders (international humanitarian aid organization) (2007-Present), and former Member of the Legal Advisory Board, New York Stock Exchange (2003-2006) and of the Corporate Advisory Board, Standish Mellon Management Advisors (2006-2007). Trustee — Goldman Sachs Fund Complex. | | 114 | | None |
Joseph P. LoRusso Age: 58 | | Trustee | | Since 2010 retiring effective 1/1/2016, term is through 12/31/2015 | | Mr. LoRusso is retired. Formerly, he was President, Fidelity Investments Institutional Services Co. (“FIIS”) (2002-2008); Director, FIIS (2002-2008); Director, Fidelity Investments Institutional Operations Company (2003-2007); Executive Officer, Fidelity Distributors Corporation (2007-2008). Trustee — Goldman Sachs Fund Complex. | | 114 | | None |
Herbert J. Markley Age: 65 | | Trustee | | Since 2013 | | Mr. Markley is retired. Formerly, he was Executive Vice President, Deere & Company (an agricultural and construction equipment manufacturer) (2007-2009); and President, Agricultural Division, Deere & Company (2001-2007). Trustee — Goldman Sachs Fund Complex. | | 114 | | None |
Jessica Palmer Age: 66 | | Trustee | | Since 2007 | | Ms. Palmer is retired. She is Director, Emerson Center for the Arts and Culture (2011-Present); and was formerly a Consultant, Citigroup Human Resources Department (2007-2008); Managing Director, Citigroup Corporate and Investment Banking (previously, Salomon Smith Barney/Salomon Brothers) (1984-2006). Ms. Palmer was a Member of the Board of Trustees of Indian Mountain School (private elementary and secondary school) (2004-2009). Trustee — Goldman Sachs Fund Complex. | | 114 | | None |
| | | | | | | | | | |
41
GOLDMAN SACHS LONG SHORT FUND
Trustees and Officers (Unaudited) (continued)
Independent Trustees
| | | | | | | | | | |
Name,
Address and Age1 | | Position(s) Held with the Trust | | Term of Office and
Length of
Time Served2 | | Principal Occupation(s) During Past 5 Years | | Number of
Portfolios in
Fund Complex
Overseen by
Trustee3 | | Other Directorships Held by Trustee4 |
Richard P. Strubel Age: 76 | | Trustee | | Since 1987 retiring effective 1/1/2016, term is through 12/31/2015 | | Mr. Strubel is retired. Formerly, he served as Chairman of the Board of Trustees, Northern Funds (a family of retail and institutional mutual funds managed by Northern Trust Investments, Inc.) (2008-2014) and Trustee (1982-2014); Director, Cardean Learning Group (provider of educational services via the internet) (2003-2008); and Director, Gildan Activewear Inc. (a clothing marketing and manufacturing company) (2000-2014). He serves as Trustee Emeritus, The University of Chicago (1987-Present). Trustee — Goldman Sachs Fund Complex. | | 139 | | None |
Roy W. Templin Age: 55 | | Trustee | | Since 2013 | | Mr. Templin is retired. He is Chairman of the Board of Directors, Con-Way Incorporated (2014-Present); and was formerly Executive Vice President and Chief Financial Officer, Whirlpool Corporation (an appliance manufacturer and marketer) (2004-2012). Trustee — Goldman Sachs Fund Complex. | | 114 | | Con-Way Incorporated (a transportation, logistics and supply-chain management services company) |
Gregory G. Weaver Age: 64 | | Trustee | | Since 2015 | | Mr. Weaver is retired. He is Director, Verizon Communications Inc. (2015-Present); and was formerly Chairman and Chief Executive Officer, Deloitte & Touche LLP (a professional services firm) (2001-2005 and 2012-2014); and Member of the Board of Directors, Deloitte & Touche LLP (2006-2012). Trustee — Goldman Sachs Fund Complex. | | 114 | | Verizon Communications Inc. |
| | | | | | | | | | |
42
GOLDMAN SACHS LONG SHORT FUND
Trustees and Officers (Unaudited) (continued)
Interested Trustees*
| | | | | | | | | | |
Name,
Address and Age1 | | Position(s) Held with the Trust | | Term of Office and
Length of
Time Served2 | | Principal Occupation(s) During Past 5 Years | | Number of
Portfolios in
Fund Complex
Overseen by
Trustee3 | | Other Directorships Held by Trustee4 |
James A. McNamara Age: 53 | | President and Trustee | | Since 2007 | | Managing Director, Goldman Sachs (December 1998-Present); Director of Institutional Fund Sales, GSAM (April 1998-December 2000); and Senior Vice President and Manager, Dreyfus Institutional Service Corporation (January 1993- April 1998). President — Goldman Sachs Fund Complex (November 2007-Present); Senior Vice President — Goldman Sachs Fund Complex (May 2007-November 2007); and Vice President — Goldman Sachs Fund Complex (2001-2007). Trustee — Goldman Sachs Fund Complex (November 2007-Present and December 2002-May 2004). | | 138 | | None |
Alan A. Shuch Age: 66 | | Trustee | | Since 1990 | | Advisory Director — GSAM (May 1999-Present); Consultant to GSAM (December 1994-May 1999); and Limited Partner, Goldman Sachs (December 1994-May 1999). Trustee — Goldman Sachs Fund Complex. | | 114 | | None |
| | | | | | | | | | |
| * | | These persons are considered to be “Interested Trustees” because they hold positions with Goldman Sachs and own securities issued by The Goldman Sachs Group, Inc. Each Interested Trustee holds comparable positions with certain other companies of which Goldman Sachs, GSAM or an affiliate thereof is the investment adviser, administrator and/or distributor. |
| 1 | | Each Trustee may be contacted by writing to the Trustee, c/o Goldman Sachs, 200 West Street, New York, New York, 10282, Attn: Caroline Kraus. Information is provided as of December 31, 2015. |
| 2 | | Each Trustee holds office for an indefinite term until the earliest of: (a) the election of his or her successor; (b) the date the Trustee resigns or is removed by the Board of Trustees or shareholders, in accordance with the Trust’s Declaration of Trust; (c) December 31st of the year in which the Trustee turns 74 years of age, subject to waiver by a majority of the Trustees (in accordance with the current resolutions of the Board of Trustees, which may be changed by the Trustees without shareholder vote); or (d) the termination of the Trust. By resolution of the Board of Trustees determining that an extension of service would be beneficial to the Trust, the retirement age has been extended with respect to Richard P. Strubel. |
| 3 | | The Goldman Sachs Fund Complex includes the Trust and Goldman Sachs Variable Insurance Trust (“GSVIT”). As of December 31, 2015, the Trust consisted of 100 portfolios (91 of which offered shares to the public) and GSVIT consisted of 14 portfolios. The Goldman Sachs Fund Complex also includes, with respect to Messrs. Bakhru, Coblentz and Strubel, Goldman Sachs Trust II (“GSTII”), Goldman Sachs BDC, Inc. (“GSBDC”), Goldman Sachs MLP Income Opportunities Fund (“GSMLP”), Goldman Sachs MLP and Energy Renaissance Fund (“GSMER”) and Goldman Sachs ETF Trust (“GSETF”), and with respect to Mr. McNamara, GSTII, GSMLP, GSMER and GSETF. GSTII consisted of eight portfolios (six of which offered shares to the public). GSBDC, GSMLP and GSMER each consisted of one portfolio. GSETF consisted of 14 portfolios (three of which offered shares to the public). |
| 4 | | This column includes only directorships of companies required to report to the Securities and Exchange Commission under the Securities Exchange Act of 1934 (i.e., “public companies”) or other investment companies registered under the Act. |
Additional information about the Trustees is available in the Fund’s Statement of Additional Information, which can be obtained from Goldman Sachs free of charge by calling this toll-free number (in the United States of America): 1-800-526-7384.
43
GOLDMAN SACHS LONG SHORT FUND
Trustees and Officers (Unaudited) (continued)
Officers of the Trust*
| | | | | | |
Name, Address and Age1 | | Position(s) Held With the Trust | | Term of
Office and
Length of
Time Served2 | | Principal Occupation(s) During Past 5 Years |
James A. McNamara 200 West Street New York, NY 10282 Age: 53 | | President and Trustee | | Since 2007 | | Managing Director, Goldman Sachs (December 1998-Present); Director of Institutional Fund Sales, GSAM (April 1998-December 2000); and Senior Vice President and Manager, Dreyfus Institutional Service Corporation (January 1993-April 1998). President — Goldman Sachs Fund Complex (November 2007-Present); Senior Vice President — Goldman Sachs Fund Complex (May 2007-November 2007); and Vice President — Goldman Sachs Fund Complex (2001-2007). Trustee — Goldman Sachs Fund Complex (November 2007-Present and December 2002-May 2004). |
Caroline L. Kraus 200 West Street New York, NY 10282 Age: 38 | | Secretary | | Since 2012 | | Vice President, Goldman Sachs (August 2006-Present); Associate General Counsel, Goldman Sachs (2012-Present); Assistant General Counsel, Goldman Sachs (August 2006-December 2011); and Associate, Weil, Gotshal & Manges, LLP (2002-2006). Secretary — Goldman Sachs Fund Complex (August 2012-Present); and Assistant Secretary — Goldman Sachs Fund Complex (June 2012-August 2012). |
Scott M. McHugh 200 West Street New York, NY 10282 Age: 44 | | Principal Financial Officer, Senior Vice President and Treasurer | | Since 2009 (Principal Financial Officer since 2013) | | Vice President, Goldman Sachs (February 2007-Present); Assistant Treasurer of certain mutual funds administered by DWS Scudder (2005-2007); and Director (2005-2007), Vice President (2000-2005), and Assistant Vice President (1998-2000), Deutsche Asset Management or its predecessor (1998-2007). Principal Financial Officer — Goldman Sachs Fund Complex (November 2013-Present); Treasurer — Goldman Sachs Fund Complex (October 2009-Present); Senior Vice President — Goldman Sachs Fund Complex (November 2009-Present); and Assistant Treasurer — Goldman Sachs Fund Complex (May 2007-October 2009). |
| | | | | | |
| * | | Represents a partial list of officers of the Trust. Additional information about all the officers is available in the Fund’s Statement of Additional Information, which can be obtained from Goldman Sachs free of charge by calling this toll-free number (in the United States): 1-800-526-7384. |
| 1 | | Information is provided as of December 31, 2015. |
| 2 | | Officers hold office at the pleasure of the Board of Trustees or until their successors are duly elected and qualified. Each officer holds comparable positions with certain other companies of which Goldman Sachs, GSAM or an affiliate thereof is the investment adviser, administrator and/or distributor. |
Goldman Sachs Trust — Goldman Sachs Long Short Fund — Tax Information (Unaudited)
For the fiscal year ended December 31, 2015, 79.17% of the dividends paid from net investment company taxable income by Goldman Sachs Long Short Fund qualified for the dividends received deduction available to corporations.
For the fiscal year ended December 31, 2015, 100% of the dividends paid from net investment company taxable income by the Goldman Sachs Long Short Fund qualify for the reduced tax rate under the Jobs and Growth Tax Relief and Reconciliation Act of 2003.
During the fiscal year ended December 31, 2015, the Goldman Sachs Long Short Fund designates $294,735 as short-term capital gain dividends pursuant to Section 871(k) of the Internal Revenue Code.
44
FUNDS PROFILE
Goldman Sachs Funds

Goldman Sachs is a premier financial services firm, known since 1869 for creating thoughtful and customized investment solutions in complex global markets.
Today, the Investment Management Division of Goldman Sachs serves a diverse set of clients worldwide, including private institutions, public entities and individuals. With approximately $1.02 trillion in assets under supervision as of December 31, 2015, Goldman Sachs Asset Management (“GSAM”) has portfolio management teams located around the world and our investment professionals bring firsthand knowledge of local markets to every investment decision. Assets under supervision includes assets under management and other client assets for which Goldman Sachs does not have full discretion. GSAM leverages the resources of Goldman, Sachs & Co. subject to legal, internal and regulatory restrictions.

Money Market1
Financial Square FundsSM
| n | | Financial Square Tax-Exempt Funds |
| n | | Financial Square Treasury Solutions Fund2 |
| n | | Financial Square Government Fund |
| n | | Financial Square Money Market Fund |
| n | | Financial Square Prime Obligations Fund |
| n | | Financial Square Treasury Instruments Fund |
| n | | Financial Square Treasury Obligations Fund |
| n | | Financial Square Federal Instruments Fund |
Fixed Income
Short Duration and Government
| n | | High Quality Floating Rate Fund |
| n | | Limited Maturity Obligations Fund |
| n | | Short Duration Government Fund |
| n | | Short Duration Income Fund |
| n | | Inflation Protected Securities Fund |
Multi-Sector
Municipal and Tax-Free
| n | | High Yield Municipal Fund |
| n | | Dynamic Municipal Income Fund |
| n | | Short Duration Tax-Free Fund |
Single Sector
| n | | Investment Grade Credit Fund |
| n | | High Yield Floating Rate Fund |
| n | | Emerging Markets Debt Fund |
| n | | Local Emerging Markets Debt Fund |
| n | | Dynamic Emerging Markets Debt Fund |
Fixed Income Alternatives
| n | | Long Short Credit Strategies Fund |
| n | | Fixed Income Macro Strategies Fund |
Fundamental Equity
| n | | Small/Mid Cap Value Fund |
| n | | Small/Mid Cap Growth Fund |
| n | | Flexible Cap Growth Fund |
| n | | Concentrated Growth Fund |
| n | | Technology Opportunities Fund3 |
| n | | Growth Opportunities Fund |
| n | | Rising Dividend Growth Fund |
| n | | Dynamic U.S. Equity Fund4 |
Tax-Advantaged Equity
| n | | U.S. Tax-Managed Equity Fund |
| n | | International Tax-Managed Equity Fund |
| n | | U.S. Equity Dividend and Premium Fund |
| n | | International Equity Dividend and Premium Fund |
Equity Insights
| n | | Small Cap Equity Insights Fund |
| n | | U.S. Equity Insights Fund |
| n | | Small Cap Growth Insights Fund |
| n | | Large Cap Growth Insights Fund |
| n | | Large Cap Value Insights Fund |
| n | | Small Cap Value Insights Fund |
| n | | International Small Cap Insights Fund |
| n | | International Equity Insights Fund |
| n | | Emerging Markets Equity Insights Fund |
Fundamental Equity International
| n | | Strategic International Equity Fund |
| n | | Focused International Equity Fund |
| n | | International Small Cap Fund |
| n | | Emerging Markets Equity Fund5 |
Select Satellite6
| n | | Real Estate Securities Fund |
| n | | International Real Estate Securities Fund |
| n | | Commodity Strategy Fund |
| n | | Global Real Estate Securities Fund |
| n | | Dynamic Commodity Strategy Fund |
| n | | Dynamic Allocation Fund |
| n | | Absolute Return Tracker Fund |
| n | | Managed Futures Strategy Fund |
| n | | MLP Energy Infrastructure Fund |
| n | | Multi-Manager Alternatives Fund |
| n | | Multi-Asset Real Return Fund |
| n | | Retirement Portfolio Completion Fund |
| n | | Tactical Tilt Implementation Fund |
Total Portfolio Solutions6
| n | | Global Managed Beta Fund |
| n | | Multi-Manager Non-Core Fixed Income Fund |
| n | | Multi-Manager U.S. Dynamic Equity Fund |
| n | | Multi-Manager Global Equity Fund |
| n | | Multi-Manager International Equity Fund |
| n | | Tactical Tilt Implementation Fund |
| n | | Balanced Strategy Portfolio |
| n | | Multi-Manager Real Assets Strategy Fund |
| n | | Growth and Income Strategy Portfolio |
| n | | Growth Strategy Portfolio |
| n | | Equity Growth Strategy Portfolio |
| n | | Satellite Strategies Portfolio |
| n | | Enhanced Global Equity Portfolio |
| n | | Tax-Advantaged Global Equity Portfolio |
| 1 | | An investment in a money market fund is neither insured nor guaranteed by the Federal Deposit Insurance Corporation (“FDIC”) or any other government agency. Although the Funds seek to preserve the value of your investment at $1.00 per share, it is possible to lose money by investing in the Funds. |
| 2 | | Effective on September 30, 2015, the Goldman Sachs Financial Square Federal Fund was renamed the Goldman Sachs Financial Square Treasury Solutions Fund. |
| 3 | | Effective on July 31, 2015, the Goldman Sachs Technology Tollkeeper Fund was renamed the Goldman Sachs Technology Opportunities Fund. |
| 4 | | Effective on April 30, 2015, the Goldman Sachs U.S. Equity Fund was renamed the Goldman Sachs Dynamic U.S. Equity Fund. |
| 5 | | Effective at the close of business on October 23, 2015, the Goldman Sachs BRIC Fund (Brazil, Russia, India, China) was reorganized with and into the Goldman Sachs Emerging Markets Equity Fund. |
| 6 | | Individual Funds within the Total Portfolio Solutions and Select Satellite categories will have various placement on the risk/return spectrum and may have greater or lesser risk than that indicated by the placement of the general Total Portfolio Solutions or Select Satellite category. |
| * | | This list covers open-end funds only. Please visit our website at www.GSAMFUNDS.com to learn about our closed-end funds. |
| | |
TRUSTEES Ashok N. Bakhru, Chairman Kathryn A. Cassidy Diana M. Daniels Herbert J. Markley James A. McNamara Jessica Palmer Alan A. Shuch Roy W. Templin Gregory G. Weaver | | OFFICERS James A. McNamara, President Scott M. McHugh, Principal Financial Officer and Treasurer Caroline L. Kraus, Secretary |
| |
GOLDMAN, SACHS & CO. Distributor and Transfer Agent | | GOLDMAN SACHS INVESTMENT STRATEGIES, LLC Investment Adviser |
Visit our Website at www.GSAMFUNDS.com to obtain the most recent month-end returns.
Goldman Sachs Asset Management, L.P., 200 West Street, New York, New York 10282
The reports concerning the Fund included in this shareholder report may contain certain forward-looking statements about the factors that may affect the performance of the Fund in the future. These statements are based on Fund management’s predictions and expectations concerning certain future events and their expected impact on the Fund, such as performance of the economy as a whole and of specific industry sectors, changes in the levels of interest rates, the impact of developing world events, and other factors that may influence the future performance of the Fund. Management believes these forward-looking statements to be reasonable, although they are inherently uncertain and difficult to predict. Actual events may cause adjustments in portfolio management strategies from those currently expected to be employed.
A description of the policies and procedures that the Fund uses to determine how to vote proxies relating to portfolio securities and information regarding how the Fund voted proxies relating to portfolio securities for the most recent 12-month period ended June 30, are available (I) without charge, upon request by calling 1-800-526-7384; and (II) on the Securities and Exchange Commission (“SEC’’) web site at http://www.sec.gov.
The Fund files its complete schedule of portfolio holdings with the Securities and Exchange Commission (“SEC”) for the first and third quarters of each fiscal year on Form N-Q. The Fund’s Forms N-Q are available on the SEC’s web site at http://www.sec.gov within 60 days after the Fund’s first and third fiscal quarters. The Fund’s Forms N-Q may be reviewed and copied at the SEC’s Public Reference Room in Washington, D.C., and information on the operation of the Public Reference Room may also be obtained by calling 1-800-SEC-0330. Forms N-Q may be obtained upon request and without charge by calling 1-800-526-7384 (for Retail Shareholders) or 1-800-621-2550 (for Institutional Shareholders).
Fund holdings and allocations shown are as of December 31, 2015 and may not be representative of future investments. Fund holdings should not be relied on in making investment decisions and should not be construed as research or investment advice regarding particular securities. Current and future holdings are subject to risk.
The Global Industry Classification Standard (GICS) was developed by and is the exclusive property and a service mark of Morgan Stanley Capital International Inc. (MSCI) and Standard & Poor’s, a division of The McGraw-Hill Companies, Inc. (S&P) and is licensed for use by Goldman Sachs. Neither MSCI, S&P nor any other party involved in making or compiling the GICS or any GICS classifications makes any express or implied warranties or representations with respect to such standard or classification (or the results to be obtained by the use thereof), and all such parties hereby expressly disclaim all warranties of originality, accuracy, completeness, merchantability or fitness for a particular purpose with respect to any of such standard or classification. Without limiting any of the foregoing, in no event shall MSCI, S&P, any of their affiliates or any third party involved in making or compiling the GICS or any GICS classifications have any liability for any direct, indirect, special, punitive, consequential or any other damages (including lost profits) even if notified of the possibility of such damages.
Economic and market forecasts presented herein reflect our judgment as of the date of this presentation and are subject to change without notice. These forecasts do not take into account the specific investment objectives, restrictions, tax and financial situation or other needs of any specific client. Actual data will vary and may not be reflected here. These forecasts are subject to high levels of uncertainty that may affect actual performance. Accordingly, these forecasts should be viewed as merely representative of a broad range of possible outcomes. These forecasts are estimated, based on assumptions, and are subject to significant revision and may change materially as economic and market conditions change. Goldman Sachs has no obligation to provide updates or changes to these forecasts. Case studies and examples are for illustrative purposes only.
The portfolio risk management process includes an effort to monitor and manage risk, but does not imply low risk.
This material is not authorized for distribution to prospective investors unless preceded or accompanied by a current Prospectus or summary prospectus, if applicable. Investors should consider a Fund’s objective, risks, and charges and expenses, and read the summary prospectus, if available, and/or the Prospectus carefully before investing or sending money. The summary prospectus, if available, and the Prospectus contain this and other information about a Fund and may be obtained from your authorized dealer or from Goldman, Sachs & Co. by calling (retail—1-800-526-7384) (institutional—1-800-621-2550).
© 2016 Goldman Sachs. All rights reserved. 30195-TEMPL-02/2016 LONGSHAR-16/2.1K
(a) As of the end of the period covered by this report, the registrant has adopted a code of ethics that applies to the registrant’s principal executive officer, principal financial officer, principal accounting officer or controller, or persons performing similar functions, regardless of whether these individuals are employed by the registrant or a third party (the “Code of Ethics”).
(b) During the period covered by this report, no amendments were made to the provisions of the Code of Ethics.
(c) During the period covered by this report, the registrant did not grant any waivers, including an implicit waiver, from any provision of the Code of Ethics.
(d) A copy of the Code of Ethics is available as provided in Item 12(a)(1) of this report.
| ITEM 3. | AUDIT COMMITTEE FINANCIAL EXPERT. |
The registrant’s board of trustees has determined that the registrant has at least one “audit committee financial expert” (as defined in Item 3 of Form N-CSR) serving on its audit committee. Gregory G. Weaver is the “audit committee financial expert” and is “independent” (as each term is defined in Item 3 of Form N-CSR).
| ITEM 4. | PRINCIPAL ACCOUNTANT FEES AND SERVICES. |
Table 1 — Items 4(a) - 4(d). The accountant fees below reflect the aggregate fees billed by all of the Funds of the Goldman Sachs Trust and includes the Goldman Sachs Funds to which this certified shareholder report relates.
| | | | | | | | | | | | |
| | | 2015 | | 2014 | | Description of Services Rendered |
| | | |
| | | | | | | | | | | | |
| | | |
Audit Fees: | | | | | | | | | | | | |
| | | |
• PricewaterhouseCoopers LLP
(“PwC”) | | | $ | 3,800,334 | | | | $ | 3,563,029 | | | Financial Statement audits. |
| | | |
Audit-Related Fees: | | | | | | | | | | | | |
| | | |
• PwC | | | $ | 158,000 | | | | $ | 0 | | | Other attest services. |
| | | |
Tax Fees: | | | | | | | | | | | | |
| | | |
• PwC | | | $ | 1,058,976 | | | | $ | 672,155 | | | Tax compliance services provided in connection with the preparation and review of registrant’s tax returns. |
Table 2 — Items 4(b)(c) & (d). Non-Audit Services to the Goldman Sachs Trust’s service affiliates * that were pre-approved by the Audit Committee of the Goldman Sachs Trust pursuant to Rule 2-01(c)(7)(ii) of Regulation S-X.
| | | | | | | | | | | | |
| | | 2015 | | 2014 | | Description of Services Rendered |
| | | |
| | | | | | | | | | | | |
| | | |
Audit-Related Fees: | | | | | | | | | | | | |
| | | |
• PwC | | | $ | 1,653,616 | | | | $ | 1,486,420 | | | Internal control review performed in accordance with Statement on Standards for Attestation Engagements No. 16 and Semi-Annual Updates related to withholding tax accrual for non-US Jurisdictions. These fees are borne by the Funds’ Adviser. |
| * | These include the advisor (excluding sub-advisors) and any entity controlling, controlled by or under common control with the advisor that provides ongoing services to the registrant (hereinafter referred to as “service affiliates”). |
Item 4(e)(1) — Audit Committee Pre-Approval Policies and Procedures
Pre-Approval of Audit and Non-Audit Services Provided to the Funds of the Goldman Sachs Trust. The Audit and Non-Audit Services Pre-Approval Policy (the “Policy”) adopted by the Audit Committee of Goldman Sachs Trust (“GST”) sets forth the procedures and the conditions pursuant to which services performed by an independent auditor for GST may be pre-approved. Services may be pre-approved specifically by the Audit Committee as a whole or, in certain circumstances, by the Audit Committee Chairman or the person designated as the Audit Committee Financial Expert. In addition, subject to specified cost limitations, certain services may be pre-approved under the provisions of the Policy. The Policy provides that the Audit Committee will consider whether the services provided by an independent auditor are consistent with the Securities and Exchange Commission’s rules on auditor independence. The Policy provides for periodic review and pre-approval by the Audit Committee of the services that may be provided by the independent auditor.
De Minimis Waiver. The pre-approval requirements of the Policy may be waived with respect to the provision of non-audit services that are permissible for an independent auditor to perform, provided (1) the aggregate amount of all such services provided constitutes no more than five percent of the total amount of revenues subject to pre-approval that was paid to the independent auditors during the fiscal year in which the services are provided; (2) such services were not recognized by GST at the time of the engagement to be non-audit services; and (3) such services are promptly brought to the attention of the Audit Committee and approved prior to the completion of the audit by the Audit Committee or by one or more members of the Audit Committee to whom authority to grant such approvals has been delegated by the Audit Committee, pursuant to the pre-approval provisions of the Policy.
Pre-Approval of Non-Audit Services Provided to GST’s Investment Advisers. The Policy provides that, in addition to requiring pre-approval of audit and non-audit services provided to GST, the Audit Committee will pre-approve those non-audit services provided to GST’s investment advisers (and entities controlling, controlled by or under common control with the investment advisers that provide ongoing services to GST) where the engagement relates directly to the operations or financial reporting of GST.
Item 4(e)(2) – 0% of the audit-related fees, tax fees and other fees listed in Table 1 were approved by GST’s Audit Committee pursuant to the “de minimis” exception of Rule 2-01(c)(7)(i)(C) of Regulation S-X. In addition, 0% of the non-audit services to the GST’s service affiliates listed in Table 2 were approved by GST’s Audit Committee pursuant to the “de minimis” exception of Rule 2-01(c)(7)(i)(C) of Regulation S-X.
Item 4(f) – Not applicable.
Item 4(g) Aggregate Non-Audit Fees Disclosure
The aggregate non-audit fees billed to GST by PwC for the twelve months ended December 31, 2015 and December 31, 2014 were $1,216,976 and $672,155 respectively.
The aggregate non-audit fees billed to GST’s adviser and service affiliates by PwC for non-audit services for the twelve months ended December 31, 2014 and December 31, 2013 were approximately $10.2 million and $9.8 million respectively. The figures for these entities are not yet available for twelve months ended December 31, 2015. With regard to the aggregate non-audit fees billed to GST’s adviser and service affiliates, the 2014 and 2013 amounts include fees for non-audit services required to be pre-approved [see Table 2] and fees for non-audit services that did not require pre-approval since they did not directly relate to GST’s operations or financial reporting.
Item 4(h) — GST’s Audit Committee has considered whether the provision of non-audit services to GST’s investment adviser and service affiliates that did not require pre-approval pursuant to paragraph (c)(7)(ii) of Rule 2-01 of Regulation S-X is compatible with maintaining the auditors’ independence.
| ITEM 5. | AUDIT COMMITTEE OF LISTED REGISTRANTS. |
| ITEM 6. | SCHEDULE OF INVESTMENTS. |
| | Schedule of Investments is included as part of the Report to Stockholders filed under Item 1. |
| ITEM 7. | DISCLOSURE OF PROXY VOTING POLICIES AND PROCEDURES FOR CLOSED-END MANAGEMENT INVESTMENT COMPANIES. |
| ITEM 8. | PORTFOLIO MANAGERS OF CLOSED-END MANAGEMENT INVESTMENT COMPANIES. |
| ITEM 9. | PURCHASES OF EQUITY SECURITIES BY CLOSED-END MANAGEMENT INVESTMENT COMPANY AND AFFILIATED PURCHASERS. |
| ITEM 10. | SUBMISSION OF MATTERS TO A VOTE OF SECURITY HOLDERS. |
| | There have been no material changes to the procedures by which shareholders may recommend nominees to the registrant’s board of trustees. |
| ITEM 11. | CONTROLS AND PROCEDURES. |
| | (a) | The registrant’s principal executive and principal financial officers, or persons performing similar functions have concluded that the registrant’s disclosure controls and procedures (as defined in Rule 30a-3(c) under the Investment Company Act of 1940, as amended (the “1940 Act”)) are effective as of a date within 90 days of the filing of this report that includes the disclosure required by this paragraph, based on the evaluation of these controls and procedures required by Rule 30a-3(b) under the 1940 Act and 15d-15(b) under the Securities Exchange Act of 1934, as amended. |
| | (b) | There were no changes in the registrant’s internal control over financial reporting (as defined in Rule 30a-3(d) under the 1940 Act) that occurred during the registrant’s second fiscal quarter of the period covered by this report that have materially affected, or are reasonably likely to materially affect, the registrant’s internal control over financial reporting. |
| | | | |
| (a)(1) | | Goldman Sachs Trust’s Code of Ethics for Principal Executive and Senior Financial Officers is incorporated by reference to Exhibit 12(a)(1) of the registrant’s Form N-CSR filed on July 8, 2015 for its International Equity Insights Funds. |
| | |
| (a)(2) | | Exhibit 99.CERT | | Certifications pursuant to Section 302 of the Sarbanes-Oxley Act of 2002 filed herewith. |
| | |
| (b) | | Exhibit 99.906CERT | | Certifications pursuant to Section 906 of the Sarbanes-Oxley Act of 2002 filed herewith. |
SIGNATURES
Pursuant to the requirements of the Securities Exchange Act of 1934 and the Investment Company Act of 1940, the registrant has duly caused this report to be signed on its behalf by the undersigned, thereunto duly authorized.
| | |
| | | Goldman Sachs Trust |
| |
| By: | | /s/ James A. McNamara |
| |
| | |
| | James A. McNamara |
| | Chief Executive Officer |
| | Goldman Sachs Trust |
| |
| Date: | | March 10, 2016 |
Pursuant to the requirements of the Securities Exchange Act of 1934 and the Investment Company Act of 1940, this report has been signed below by the following persons on behalf of the registrant and in the capacities and on the dates indicated.
| | |
| By: | | /s/ James A. McNamara |
| |
| | |
| | James A. McNamara |
| | Chief Executive Officer |
| | Goldman Sachs Trust |
| |
| Date: | | March 10, 2016 |
| |
| By: | | /s/ Scott McHugh |
| |
| | |
| | Scott McHugh |
| | Principal Financial Officer |
| | Goldman Sachs Trust |
| |
| Date: | | March 10, 2016 |