UNITED STATES
SECURITIES AND EXCHANGE COMMISSION
Washington, D.C. 20549
FORM N-CSR
CERTIFIED SHAREHOLDER REPORT OF REGISTERED
MANAGEMENT INVESTMENT COMPANIES
Investment Company Act file number 811-05349
Goldman Sachs Trust
(Exact name of registrant as specified in charter)
71 South Wacker Drive, Chicago, Illinois 60606
(Address of principal executive offices) (Zip code)
| | |
| Caroline Kraus, Esq. | | Copies to: |
| Goldman, Sachs & Co. | | Geoffrey R.T. Kenyon, Esq. |
| 200 West Street | | Dechert LLP |
| New York, New York 10282 | | 100 Oliver Street |
| | 40th Floor |
| | Boston, MA 02110-2605 |
(Name and address of agents for service)
Registrant’s telephone number, including area code: (312) 655-4400
Date of fiscal year end: March 31
Date of reporting period: March 31, 2016
| ITEM 1. | REPORTS TO STOCKHOLDERS. |
| | The Annual Report to Shareholders is filed herewith. |
Goldman Sachs Funds

| | | | |
| | |
| Annual Report | | | | March 31, 2016 |
| | |
| | | | Multi Sector Fixed Income Funds |
| | | | Bond Fund |
| | | | Core Fixed Income |
| | | | Global Income |
| | | | Strategic Income |

Goldman Sachs Multi Sector Fixed Income Funds
| | | | |
TABLE OF CONTENTS | | | | |
| |
Investment Process | | | 1 | |
| |
Market Review | | | 2 | |
| |
Portfolio Management Discussions and Performance Summaries | | | 4 | |
| |
Schedules of Investments | | | 31 | |
| |
Financial Statements | | | 114 | |
| |
Financial Highlights | | | 118 | |
| |
Notes to the Financial Statements | | | 126 | |
| |
Report of Independent Registered Public Accounting Firm | | | 158 | |
| |
Other Information | | | 159 | |
| | | | |
| | | |
| NOT FDIC-INSURED | | May Lose Value | | No Bank Guarantee |
GOLDMAN SACHS MULTI SECTOR FIXED INCOME FUNDS
What Differentiates the Goldman Sachs Asset Management Fixed Income Investment Process?
At Goldman Sachs Asset Management, L.P. (“GSAM”), the goal of our fixed income investment process is to provide consistent, strong performance by actively managing our portfolios within a research-intensive, risk-managed framework.
A key element of our fixed income investment philosophy is to evaluate the broadest global opportunity set to capture relative value across sectors and instruments. Our globally integrated investment process involves managing dynamically along the risk/return spectrum, as we continue to develop value-added strategies through:

| n | | Assess relative value among sectors (such as mortgage-backed and corporate debt securities) and sub-sectors |
| n | | Leverage the vast resources of GSAM in selecting securities for each portfolio |

| n | | Team approach to decision making |
| n | | Manage risk by avoiding significant sector and interest rate bets |
| n | | Careful management of yield curve strategies — while closely managing portfolio duration |

Fixed Income portfolios that:
| | n | | Include domestic and global investment options, income opportunities, and access to areas of specialization | |
| | n | | Capitalize on GSAM’s industry-renowned credit research capabilities | |
| | n | | Use a risk-managed framework to seek total return, recognizing the importance of investors’ capital accumulation goals as well as their need for income | |
1
MARKET REVIEW
Goldman Sachs Multi Sector Fixed Income Funds
Market Review
Shifting expectations about global economic growth, central bank monetary policy and commodities prices influenced the performance of the global fixed income markets during the 12 months ended March 31, 2016 (the “Reporting Period”).
When the Reporting Period began in April 2015, the performance of spread, or non-government bond, sectors was mixed. U.S. Treasury yields rose as U.S. economic data improved, including positive surprises in inflation and retail sales. First quarter 2015 U.S. Gross Domestic Product (“GDP”) was revised upwards from -0.7% to a seasonally adjusted annualized rate of -0.2%. The upward revision stemmed in part from stronger than estimated consumer spending and inventory data. U.S. dollar gains hit a roadblock during the second calendar quarter on uncertainty around the Federal Reserve’s (the “Fed”) plans for raising interest rates in 2015. The Eurozone’s economic progress took a back seat to the seemingly intractable challenges surrounding Greece.
In the third quarter of 2015, spread sectors underperformed U.S. Treasuries as the outlook for the global economy grew cloudy. Investors focused on slowing economic growth in China, the devaluation of the Chinese renminbi and an unexpected increase in market volatility. Oil and commodities prices dropped to new lows, partly because of falling demand from China. The U.S. dollar appreciated modestly during the third calendar quarter on cautious optimism that the Fed was on track to raise rates in 2015. However, the Fed chose to leave rates unchanged at its September 2015 policy meeting, citing conditions in the global economy. Although the U.S. economy continued to improve, economic growth in other developed countries softened, and emerging markets economies broadly weakened. Despite accommodative monetary policies by many global central banks, inflation remained subdued in the world’s major economies.
In the fourth quarter of 2015, spread sectors generated positive returns. Outside the U.S., the global monetary policy environment remained highly accommodative, with the European Central Bank (“ECB”) lowering interest rates into negative territory and expanding its stimulus program. The U.S. dollar gained on expectations the Fed would hike interest rates, which it did at its December 2015 policy meeting. During the fourth calendar quarter, the U.S. economy continued to display a positive growth trend, but economic growth in other developed countries had softened by the end of 2015. At the same time, growth in emerging markets countries broadly weakened, largely due to commodity price declines and concerns about the slowing Chinese economy.
The first quarter of 2016 was very much a tale of two halves. Spread sectors sold off significantly from January to mid-February 2016 and then largely retraced their losses by the end of March 2016. Volatility early in the first calendar quarter was driven by an increase in a number of perceived risks, such as slowing Chinese economic activity, the possibility of persistent oil oversupply, and deteriorating corporate bond fundamentals as the U.S. credit cycle entered its later stage. Some of these risks eased in the second half of the first calendar quarter, as economic news from China improved, U.S. oil production showed signs of slowing, and commodity prices appeared to stabilize. Global central banks remained accommodative. The Bank of Japan, in a surprise move at its January 2016 policy meeting, introduced a -0.1% interest rate, reaffirming its commitment to achieving a 2% inflation target. The ECB shifted its focus from currency depreciation to credit creation by leaving the deposit rate unchanged, expanding its asset purchase program to include purchases of non-financial corporate credit and announcing a new series of easing measures in the form of targeted
2
MARKET REVIEW
long-term refinancing operations (“TLTRO II”). (TLTRO II is designed to offer attractive long-term funding conditions to Eurozone banks to further ease private sector credit conditions and to stimulate credit creation.) In the U.S., Fed statements during March 2016 suggested U.S. interest rates would remain lower for longer than previously expected. After a sustained period of appreciation, the U.S. dollar weakened during the first calendar quarter due to generally tighter financial conditions, mixed U.S. economic data and the Fed’s more dovish commentary. (Dovish commentary tends to imply lower interest rates.)
For the Reporting Period overall, sovereign emerging markets debt and asset-backed securities slightly outperformed U.S. Treasuries. Mortgage-backed securities and commercial mortgage-backed securities generally performed in line with U.S. Treasuries, while investment grade corporate bonds and agencies underperformed. High yield corporate bonds significantly underperformed Treasuries. The U.S. Treasury yield curve, or spectrum of maturities, flattened during the Reporting Period. Both short-term and long-term yields rose during the Reporting Period, but long-term yields rose less. Intermediate-term U.S. Treasury yields actually declined modestly, with the yield on the bellwether 10-year U.S. Treasury declining approximately 15 basis points to end the Reporting Period at 1.77%. (A basis point is 1/100th of a percentage point.)
Looking Ahead
At the end of the Reporting Period, we expected a continuation of trends seen in the early months of 2016: 1) modest global economic growth; 2) extreme monetary policy measures helping to support gradual economic improvement in Europe and Japan; and 3) a backdrop of rising U.S. inflation, rising debt in China and unpredictable politics globally.
Overall, we believe global economic growth may be stuck in low gear. After a modestly stronger year for the U.S., Europe and Japan in 2015, we expect some softening in 2016. In terms of monetary policy, we believe the economic benefits of negative interest rates in Europe and Japan and a strong U.S. dollar are questionable, and investors appear increasingly focused on the potential negatives. Indeed, we see the ECB’s policy decision in March 2016 as shifting its emphasis away from negative rates and currency depreciation and toward stimulating domestic demand through the credit channel. In Japan, the corporate bond market is relatively small and government bond purchases are already at what we consider to be extreme levels, which we believe could limit the Bank of Japan’s options. As a result, we think further rate cuts are possible. In the U.S., the Fed has adjusted its approach, reducing the number of projected interest rate hikes in 2016 from four to two, while emphasizing risks from soft global economic growth and continued strength of the U.S. dollar. In terms of the emerging markets, we believe they remain broadly at risk from developments in China.
At the end of the Reporting Period, we considered the environment positive for selective exposure to corporate bonds, emerging markets debt and other higher yielding sectors of the fixed income market. At the same time, however, the volatility in the first quarter of 2016 added to our sense that markets are fragile and longer-term risks are growing. As a result, we remained biased to staying nimble overall with an emphasis on higher credit quality.
3
PORTFOLIO RESULTS
Goldman Sachs Bond Fund
Investment Objective
The Fund seeks a total return consisting of capital appreciation and income that exceeds the total return of the Barclays U.S. Aggregate Bond Index.
Portfolio Management Discussion and Analysis
Below, the Goldman Sachs U.S. Fixed Income Investment Management Team discusses the Goldman Sachs Bond Fund’s (the “Fund”) performance and positioning for the 12-month period ended March 31, 2016 (the “Reporting Period”).
| Q | | How did the Fund perform during the Reporting Period? |
| A | | During the Reporting Period, the Fund’s Class A, C, Institutional, Service, IR and R Shares generated average annual total returns, without sales charges, of 1.83%, 0.98%, 2.18%, 1.68%, 2.18% and 1.58%, respectively. These returns compare to the 1.96% average annual total return of the Fund’s benchmark, the Barclays U.S. Aggregate Bond Index (the “Barclays Index”), during the same time period. |
| | Since their inception on July 31, 2015, the Fund’s Class R6 Shares generated a cumulative total return, without sales charge, of 2.42%. This return compares to the 2.99% cumulative total return of the Barclays Index during the same period. |
| Q | | What key factors were responsible for the Fund’s performance during the Reporting Period? |
| A | | Our cross-sector strategy detracted from Fund performance during the Reporting Period. Our cross-sector strategy is one in which we invest Fund assets across a variety of fixed income sectors, including some that may not be included in the Fund’s benchmark. |
| | Tactical management of the Fund’s duration and yield curve positioning strategy contributed positively to relative performance during the Reporting Period. The duration strategy is primarily implemented via interest rate swaps and/ or futures. Duration is a measure of the Fund’s sensitivity to changes in interest rates. Yield curve indicates the spectrum of maturities within a particular sector. |
| | Our top-down currency strategy further boosted the Fund’s relative results. In our currency strategy, positions in several developed market currencies proved beneficial during the Reporting Period, particularly having underweighted positions in the Australian dollar and Canadian dollar. The currency strategy is primarily implemented via currency forwards. Bottom-up individual issue selection overall added value as well. |
| Q | | Which fixed income market sectors most significantly affected Fund performance? |
| A | | Implemented via our cross-sector strategy, the Fund’s overweighted exposure to corporate credit detracted from relative results. Credit spreads, or the yield differential between corporate bonds and duration-equivalent U.S. Treasuries, widened during the Reporting Period amidst concerns of protracted low commodity prices, economic slowdown in China and broad global market volatility. An allocation to tax-exempt Puerto Rican municipal debt also dampened results, as spreads widened due largely to increased concerns about the commonwealth’s ability to meet its debt obligations. Exposure to the government/swaps sector further detracted from the Fund’s relative performance during the Reporting Period. This was slightly offset by an allocation to mortgage-backed securities, which contributed positively to Fund results. |
| | Individual issue selection of structured debt, investment grade industrials and high yield financials within the corporate credit sector added value. Tactical trades within our government/swaps strategy also contributed positively to relative results. The government/swaps selections strategy is |
4
PORTFOLIO RESULTS
| | primarily implemented via interest rate swaps and/or futures. Selections of mortgage-backed securities contributed positively to performance within our securitized strategy. Within emerging markets debt, selections of U.S. dollar-denominated Brazilian and Venezuelan debt added to returns. There were no meaningful detractors from a security selection perspective during the Reporting Period. |
| Q | | Did the Fund’s duration and yield curve positioning strategy help or hurt its results during the Reporting Period? |
| A | | Tactical management of the Fund’s duration and yield curve positioning contributed positively to its results during the Reporting Period. We maintained a short U.S. duration position relative to the Barclays Index during the second quarter of 2015, which helped as government yields rose broadly on stronger economic data and expectations that the Federal Reserve (the “Fed”) would raise interest rates in 2015. In August 2015, we removed the short U.S. duration position and moved to a rather neutral position relative to the Barclays Index as volatility picked up early in the month. We then shifted to a modestly longer duration position than that of the Barclays Index in September 2015, ahead of the Fed’s meeting, due to tightening financial conditions and on our view, proved correct, that the Fed was not likely to raise rates. We maintained a bullish bias regarding the Fed’s monetary policy, but toward the end of September 2015, we returned to a more neutral duration position in the Fund compared to that of the Barclays Index as yields moved lower amid Fed rhetoric indicating its bias toward hiking rates in late 2015. We subsequently moved back to a longer duration position than that of the Barclays Index in both U.S. and European rates in the fourth quarter of 2015. The Fed finally raised rates in December 2015, signaling that the U.S. economy was strengthening. After the initial lift-off, as that first interest rate hike was commonly referred to, financial conditions tightened, driven largely by a strong U.S. dollar and weakness in credit markets. In January 2016, we moved to a neutral duration position relative to the Barclays Index in U.S. rates. We similarly moved to a neutral European rates duration position, as upside surprises in economic data contended with expectations for further easing from the European Central Bank (“ECB”) given persistently low inflation data. Later in the first quarter of 2016, we moved to a short U.S. duration position relative to the Barclays Index given what we viewed to be positive inflation, labor market and economic growth data. |
| Q | | How did the Fund use derivatives and similar instruments during the Reporting Period? |
| A | | As market conditions warranted during the Reporting Period, currency transactions were carried out using primarily over-the-counter (“OTC”) spot and forward foreign exchange contracts as well as purchased OTC options. Currency transactions were used as we sought both to enhance returns and to hedge the Fund’s portfolio against currency exchange rate fluctuations. Also, Treasury futures were used as warranted to facilitate specific duration, yield curve and country strategies; swaptions (or options on interest rate swap contracts) to express an outright term structure view and manage volatility (term structure, most often depicted as a yield curve, refers to the term structure of interest rates, which is the relationship between the yield to maturity and the time to maturity for pure discount bonds); credit default swaps to manage exposure to fluctuations in credit spreads (or the differential in yields between Treasury securities and non-Treasury securities that are identical in all respects except for quality rating); and interest rate swaps to manage exposure to fluctuations in interest rates. The Fund also used forward sales contracts to help manage duration. Overall, we employ derivatives and similar instruments for the efficient management of the Fund’s portfolio. Derivatives and similar instruments allow us to manage interest rate, credit and currency risks more effectively by allowing us both to hedge and to apply active investment views with greater versatility and to afford greater risk management precision than we would otherwise be able to implement. Derivatives are used in combination with cash securities to implement our views in the Fund. |
| Q | | Were there any notable changes in the Fund’s weightings during the Reporting Period? |
| A | | As mentioned earlier, we adjusted the Fund’s U.S. and European duration positions during the Reporting Period as market conditions and perceptions around central bank policy shifted. |
| | From a sector perspective, we reduced the Fund’s overweighted exposure to corporate credit on our expectations that acceleration in global economic growth would likely be muted. The Fund’s allocation to U.S. Treasury Obligations also decreased during the Reporting Period, while its allocation to Federal agency securities increased. We maintained the Fund’s underweighted exposure to agency mortgage-backed securities on our view that valuations within the sector remained unattractive relative to other fixed income sectors amid high prepayment speeds. |
5
PORTFOLIO RESULTS
| Q | | How was the Fund positioned relative to its benchmark index at the end of March 2016? |
| A | | At the end of March 2016, the Fund had overweighted allocations relative to the Barclays Index on a market-value weighted basis in asset-backed securities, residential mortgage-backed securities and high yield corporate bonds. The Fund also had modest exposure to municipal bonds, which is a sector not represented in the Barclays Index. The Fund had underweighted exposure relative to the Barclays Index in U.S. government securities and, to a lesser extent, in quasi-government securities and investment grade corporate bonds. The Fund held rather neutral positions compared to the Barclays Index in commercial mortgage-backed securities, covered bonds and emerging markets debt. (Covered bonds are debt securities backed by cash flows from mortgage loans or public sector loans.) The Fund also maintained a position in cash at the end of the Reporting Period. The Fund maintained a shorter overall duration compared to the Barclays Index at the end of the Reporting Period. |
6
FUND BASICS
Bond Fund
as of March 31, 2016
| | | | | | | | | | | | | | | | | | |
| | PERFORMANCE REVIEW | |
| | | April 1, 2015– March 31, 2016 | | Fund Total Return
(based on NAV)1 | | | Barclays
U.S. Aggregate
Bond Index2 | | | 30-Day
Standardized
Subsidized Yield3 | | | 30-Day
Standardized
Unsubsidized Yield3 | |
| | Class A | | | 1.83 | % | | | 1.96 | % | | | 1.60 | % | | | 1.38 | % |
| | Class C | | | 0.98 | | | | 1.96 | | | | 0.93 | | | | 0.70 | |
| | Institutional | | | 2.18 | | | | 1.96 | | | | 2.00 | | | | 1.77 | |
| | Service | | | 1.68 | | | | 1.96 | | | | 1.55 | | | | 1.32 | |
| | Class IR | | | 2.18 | | | | 1.96 | | | | 1.90 | | | | 1.68 | |
| | | Class R | | | 1.58 | | | | 1.96 | | | | 1.42 | | | | 1.19 | |
| | | | | |
| | | | | | | | | | | | | | | |
| | | July 31, 2015– March 31, 2016 | | | | | | | | | | | | |
| | | Class R6 | | | 2.42 | % | | | 2.99 | % | | | 1.90 | % | | | 1.68 | % |
| | 1 | | The net asset value (“NAV”) represents the net assets of the class of the Fund (ex-dividend) divided by the total number of shares of the class outstanding. The Fund’s performance assumes the reinvestment of dividends and other distributions. The Fund’s performance does not reflect the deduction of any applicable sales charges. |
| | 2 | | The Barclays U.S. Aggregate Bond Index represents an unmanaged diversified portfolio of fixed income securities, including U.S. Treasuries, investment-grade corporate bonds and mortgage-backed and asset-backed securities. The index figure does not reflect any deduction for fees, expenses or taxes. It is not possible to invest directly in an index. |
| | 3 | | The method of calculation of the 30-Day Standardized Subsidized Yield is mandated by the Securities and Exchange Commission and is determined by dividing the net investment income per share earned during the last 30 days of the period by the maximum public offering price (“POP”) per share on the last day of the period. This number is then annualized. The 30-Day Standardized Subsidized Yield reflects fee waivers and/or expense reimbursements recorded by the Fund during the period. Without waivers and/or reimbursements, yields would be reduced. This yield does not necessarily reflect income actually earned and distributed by the Fund and, therefore, may not be correlated with the dividends or other distributions paid to shareholders. The 30-Day Standardized Unsubsidized Yield does not adjust for any fee waivers and/ or expense reimbursements in effect. If the Fund does not incur any fee waivers and/or expense reimbursements during the period, the 30-Day Standard Subsidized Yield and 30-Day Standardized Unsubsidized Yield will be identical. |
The returns set forth in the table above represent past performance. Past performance does not guarantee future results. The Fund’s investment return and principal value will fluctuate so that an investor’s shares, when redeemed, may be worth more or less than their original cost. Current performance may be lower or higher than the performance quoted above. Please visit our web site at www.GSAMFUNDS.com to obtain the most recent month-end returns. Performance reflects fee waivers and/or expense limitations in effect during the period shown. In their absence, performance would be reduced. Returns do not reflect the deduction of taxes that a shareholder would pay on Fund distributions or the redemption of Fund shares.
7
FUND BASICS
| | | | | | | | | | | | | | | | |
| | STANDARDIZED TOTAL RETURNS4 |
| | | For the period ended 3/31/16 | | One Year | | | Five Years | | | Since Inception | | | Inception Date |
| | Class A | | | -2.01 | % | | | 3.48 | % | | | 4.30 | % | | 11/30/06 |
| | Class C | | | -0.03 | | | | 3.51 | | | | 3.94 | | | 11/30/06 |
| | Institutional | | | 2.18 | | | | 4.64 | | | | 5.10 | | | 11/30/06 |
| | Service | | | 1.68 | | | | 4.13 | | | | 4.89 | | | 6/20/07 |
| | Class IR | | | 2.18 | | | | 4.46 | | | | 4.85 | | | 11/30/07 |
| | Class R | | | 1.58 | | | | 4.01 | | | | 4.36 | | | 11/30/07 |
| | | Class R6 | | | N/A | | | | N/A | | | | 2.42 | | | 7/31/15 |
| | 4 | | The Standardized Total Returns are average annual total returns or cumulative total returns for periods of less than 1 year as of the most recent calendar quarter-end. They assume reinvestment of all distributions at NAV. These returns reflect a maximum initial sales charge of 3.75% for Class A Shares and the assumed contingent deferred sales charge for Class C Shares (1% if redeemed within 12 months of purchase). Prior to July 29, 2009, the maximum initial sales charge applicable to Class A Shares was 4.5%, which is not reflected in the average annual total return figures shown. Because Institutional, Service, Class IR, Class R and Class R6 Shares do not involve a sales charge, such a charge is not applied to their Standardized Total Returns. |
The returns set forth in the table above represent past performance. Past performance does not guarantee future results. The Fund’s investment return and principal value will fluctuate so that an investor’s shares, when redeemed, may be worth more or less than their original cost. Current performance may be lower or higher than the performance quoted above. Please visit our web site at www.GSAMFUNDS.com to obtain the most recent month-end returns. Performance reflects applicable fee waivers and/or expense limitations in effect during the periods shown. In their absence, performance would be reduced. Returns do not reflect the deduction of taxes that a shareholder would pay on Fund distributions or the redemption of Fund shares.
| | | | | | | | | | |
| | EXPENSE RATIOS5 | |
| | | | | Net Expense Ratio (Current) | | | Gross Expense Ratio (Before Waivers) | |
| | Class A | | | 0.79 | % | | | 1.12 | % |
| | Class C | | | 1.54 | | | | 1.87 | |
| | Institutional | | | 0.45 | | | | 0.78 | |
| | Service | | | 0.95 | | | | 1.29 | |
| | Class IR | | | 0.54 | | | | 0.87 | |
| | Class R | | | 1.04 | | | | 1.38 | |
| | | Class R6 | | | 0.43 | | | | 0.76 | |
| | 5 | | The expense ratios of the Fund, both current (net of applicable fee waivers and/or expense limitations) and before waivers (gross of applicable fee waivers and/or expense limitations) are as set forth above according to the most recent publicly available Prospectus for the Fund and may differ from the expense ratios disclosed in the Financial Highlights in this report. Pursuant to a contractual arrangement, the Fund’s waivers and/or expense limitations will remain in place through at least July 29, 2016, and prior to such date the investment adviser may not terminate the arrangements without the approval of the Fund’s Board of Trustees. If these arrangements are discontinued in the future, the expense ratios may change without shareholder approval. |
8
FUND BASICS
|
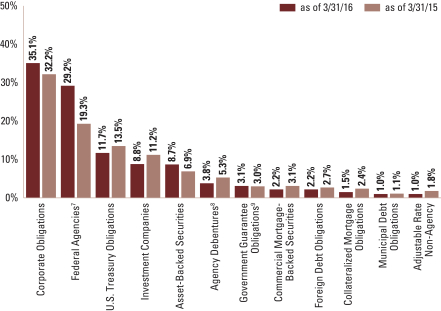
| FUND COMPOSITION6 |
| Percentage of Net Assets |
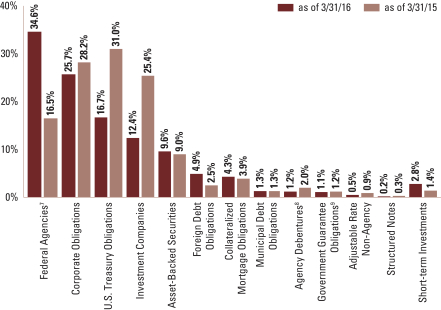
| | 6 | | The percentage shown for each investment category reflects the value of investments in that category as a percentage of net assets. Short-term investments represent certificates of deposits and commercial papers. Figures in the graph may not sum to 100% due to the exclusion of other assets and liabilities. The graph depicts the Fund’s investments but may not represent the Fund’s market exposure due to the exclusion of certain derivatives, if any, as listed in the Additional Investment Information section of the Schedule of Investments. |
| | 7 | | “Federal Agencies” are mortgage-backed securities guaranteed by the Government National Mortgage Association (“GNMA”), Federal National Mortgage Association (“FNMA”) and Federal Home Loan Mortgage Corp. (“FHLMC”). GNMA instruments are backed by the full faith and credit of the U.S. Government. |
| | 8 | | “Agency Debentures” include agency securities offered by companies such as FNMA and FHLMC, which operate under a government charter. While they are required to report to a government regulator, their assets are not explicitly guaranteed by the government and they otherwise operate like any other publicly traded company. |
| | 9 | | “Government Guarantee Obligations” are guaranteed by a foreign government guarantee program and are backed by the full faith and credit of the government of a foreign country. |
9
GOLDMAN SACHS BOND FUND
Performance Summary
March 31, 2016
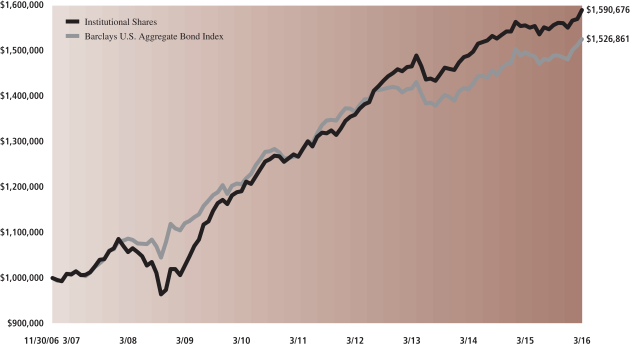
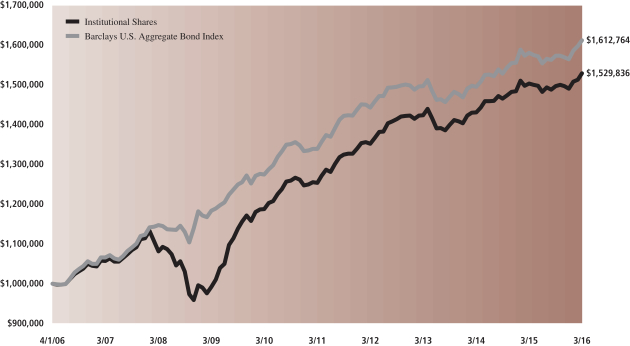
The following graph shows the value, as of March 31, 2016, of a $1,000,000 investment made on November 30, 2006 (commencement of operations) in Institutional Shares at NAV. For comparative purposes, the performance of the Fund’s benchmark, the Barclays U.S. Aggregate Bond Index, is shown. This performance data represents past performance and should not be considered indicative of future performance, which will fluctuate with changes in market conditions. These performance fluctuations will cause an investor’s shares, when redeemed, to be worth more or less than their original cost. Performance reflects applicable fee waivers and/or expense limitations in effect during the periods shown and in their absence, performance would be reduced. Returns do not reflect the deduction of taxes that a shareholder would pay on Fund distributions or the redemption of Fund shares. Performance of Class A, Class C, Service, Class IR, Class R and Class R6 Shares will vary from Institutional Shares due to differences in class specific fees and any applicable sales charges. In addition to the investment adviser’s decisions regarding issuer/industry/country investment selection and allocation, other factors may affect Fund performance. These factors include, but are not limited to, Fund operating fees and expenses, portfolio turnover and subscription and redemption cash flows affecting the Fund.
|
| Bond Fund’s Lifetime Performance |
Performance of a $1,000,000 Investment, with distributions reinvested, from November 30, 2006 through March 31, 2016.
| | | | | | | | | | |
| Average Annual Total Return through March 31, 2016 | | | One Year | | | | Five Years | | | Since Inception |
Class A (Commenced November 30, 2006) | | | | | | | | | | |
Excluding sales charges | | | 1.83% | | | | 4.28% | | | 4.73% |
Including sales charges | | | -2.01% | | | | 3.48% | | | 4.30% |
|
Class C (Commenced November 30, 2006) | | | | | | | | | | |
Excluding contingent deferred sales charges | | | 0.98% | | | | 3.51% | | | 3.94% |
Including contingent deferred sales charges | | | -0.03% | | | | 3.51% | | | 3.94% |
|
Institutional Class (Commenced November 30, 2006) | | | 2.18% | | | | 4.64% | | | 5.10% |
|
Service Class (Commenced June 20, 2007) | | | 1.68% | | | | 4.13% | | | 4.89% |
|
Class IR (Commenced November 30, 2007) | | | 2.18% | | | | 4.46% | | | 4.85% |
|
Class R (Commenced November 30, 2007) | | | 1.58% | | | | 4.01% | | | 4.36% |
|
Class R6 (Commenced July 31, 2015) | | | N/A | | | | N/A | | | 2.42%* |
|
| * | | Total return for periods of less than one year represents cumulative total return. |
10
PORTFOLIO RESULTS
Goldman Sachs Core Fixed Income Fund
Investment Objective
The Fund seeks a total return consisting of capital appreciation and income that exceeds the total return of the Barclays U.S. Aggregate Bond Index.
Portfolio Management Discussion and Analysis
Below, the Goldman Sachs U.S. Fixed Income Investment Management Team discusses the Goldman Sachs Core Fixed Income Fund’s (the “Fund”) performance and positioning for the 12-month period ended March 31, 2016 (the “Reporting Period”).
| Q | | How did the Fund perform during the Reporting Period? |
| A | | During the Reporting Period, the Fund’s Class A, C, Institutional, Service, IR and R Shares generated average annual total returns, without sales charges, of 1.35%, 0.69%, 1.69%, 1.19%, 1.60% and 1.09%, respectively. These returns compare to the 1.96% average annual total return of the Fund’s benchmark, the Barclays U.S. Aggregate Bond Index (the “Barclays Index”), during the same period. |
| | Since their inception on July 31, 2015, the Fund’s Class R6 Shares generated a cumulative total return, without sales charge, of 2.34%. This return compares to the 2.99% cumulative total return of the Barclays Index during the same period. |
| Q | | What key factors were responsible for the Fund’s performance during the Reporting Period? |
| A | | Our top-down cross-sector strategy overall detracted from the Fund’s relative results during the Reporting Period. Our cross-sector strategy is one in which we invest Fund assets across a variety of fixed income sectors, including some that may not be included in the Fund’s benchmark. |
| | Tactical management of the Fund’s duration and yield curve positioning strategy also detracted from relative performance during the Reporting Period. The duration strategy is primarily implemented via interest rate swaps and/or futures. Duration is a measure of the Fund’s sensitivity to changes in interest rates. Yield curve indicates the spectrum of maturities within a particular sector. |
| | Our top-down country and currency strategies were the primary positive contributors to Fund performance during the Reporting Period. In our country strategy, a long Europe versus short U.S. and U.K. rates position contributed most positively. The country strategy is primarily implemented via interest rate swaps and/or futures. In our currency strategy, an overweight position in the Swedish krona helped most, although some of the positive performance was offset by an underweight to the Japanese yen, which detracted. The currency strategy is primarily implemented via currency forwards. Our bottom-up individual issue selection overall also added value during the Reporting Period. |
| Q | | Which fixed income market sectors most significantly affected Fund performance? |
| A | | Implemented via our cross-sector strategy, the Fund’s overweighted exposure to corporate credit detracted from relative results. Credit spreads, or the yield differential between corporate bonds and duration-equivalent U.S. Treasuries, widened during the Reporting Period amidst concerns of protracted low commodity prices, economic slowdown in China and broad global market volatility. The Fund’s overweighted allocation to U.S. agency debt also detracted. On the positive side, the Fund’s exposure to the government/swaps sector boosted results. The government/ swaps selection strategy is primarily implemented via interest rate swaps and/or futures. |
| | Individual issue selection amongst long-dated securities and structured products within the corporate credit sector and amongst mortgage-backed securities within the securitized sector contributed positively to relative results. To a lesser |
11
PORTFOLIO RESULTS
| | extent, selections of emerging markets debt and government/ swaps added value as well. There were no meaningful detractors from a security selection perspective during the Reporting Period. |
| Q | | Did the Fund’s duration and yield curve positioning strategy help or hurt its results during the Reporting Period? |
| A | | Tactical management of the Fund’s duration and yield curve positioning detracted from its results during the Reporting Period due primarily to the Fund’s U.S. rates position. We maintained a short U.S. duration position relative to the Barclays Index at the beginning of the Reporting Period and through most of the third quarter of 2015 and then moved to a neutral U.S. rates position relative to the Barclays Index at the end of the third quarter of 2015 amid global market volatility driven by low commodity prices. We then shifted to a slightly long U.S. rates position relative to the Barclays Index in the fourth quarter of 2015. The U.S. Federal Reserve (the “Fed”) raised interest rates in December 2015, signaling improvement in the U.S. economy. Financial conditions tightened in the new year, driven in large part by a strong U.S. dollar and by weakness in the credit markets. In January 2016, we moved the Fund back to a modestly short U.S. rates position relative to the Barclays Index based on improved labor market data and positive inflation. |
| Q | | How did the Fund use derivatives and similar instruments during the Reporting Period? |
| A | | As market conditions warranted during the Reporting Period, currency transactions were carried out using primarily over-the-counter (“OTC”) spot and forward foreign exchange contracts as well as purchased OTC options. Currency transactions were used as we sought both to enhance returns and to hedge the Fund’s portfolio against currency exchange rate fluctuations. Also, Treasury and international government bond futures, Eurodollar futures and other futures contracts were used as warranted to facilitate specific duration, yield curve and country strategies; swaptions (or options on interest rate swap contracts) to express an outright term structure view and manage volatility (term structure, most often depicted as a yield curve, refers to the term structure of interest rates, which is the relationship between the yield to maturity and the time to maturity for pure discount bonds); credit default swaps to manage exposure to fluctuations in credit spreads (or the differential in yields between Treasury securities and non-Treasury securities that are identical in all respects except for quality rating); and interest rate swaps to manage exposure to fluctuations in interest rates. The Fund also used forward sales contracts to help manage duration. Overall, we employ derivatives and similar instruments for the efficient management of the Fund’s portfolio. Derivatives and similar instruments allow us to manage interest rate, credit and currency risks more effectively by allowing us both to hedge and to apply active investment views with greater versatility and to afford greater risk management precision than we would otherwise be able to implement. |
| Q | | Were there any notable changes in the Fund’s weightings during the Reporting Period? |
| A | | As mentioned earlier, we shifted the Fund’s U.S. duration position as market conditions and perceptions around central bank policy shifted. |
| | From a sector perspective, we maintained the Fund’s overweighted exposure relative to the Barclays Index to corporate credit based on our view that there is a supportive macroeconomic outlook in the developed markets despite the greater global volatility. However, we reduced the Fund’s overweight in early 2016 due to weakness in the credit markets. We maintained the Fund’s underweighted exposure to agency mortgage-backed securities during the Reporting Period based on our belief that the sector faces headwinds, including high prepayment speeds. |
| Q | | How was the Fund positioned relative to its benchmark index at the end of March 2016? |
| A | | At the end of March 2016, the Fund had its most overweighted allocations relative to the Barclays Index on a market-value weighted basis in investment grade corporate bonds (with an emphasis on the financials and industrials industries) and asset-backed securities. The Fund also had a more modestly overweighted exposure at the end of the Reporting Period to quasi-government securities, commercial mortgage-backed securities and covered bonds. (Covered bonds are debt securities backed by cash flows from mortgage loans or public sector loans.) The Fund had its most underweighted exposure relative to the Barclays Index in U.S. government securities and residential mortgage-backed securities. The Fund maintained rather neutral exposures relative to the Barclays Index to high yield corporate bonds and emerging markets debt. The Fund had a sizable position in cash and cash equivalents at the end of March 2016. The Fund maintained a rather neutral overall duration compared to the Barclays Index at the end of the Reporting Period. |
12
FUND BASICS
Core Fixed Income Fund
as of March 31, 2016
| | | | | | | | | | | | | | | | | | |
| | PERFORMANCE REVIEW | |
| | | April 1, 2015– March 31, 2016 | | Fund Total Return
(based on NAV)1 | | | Barclays
Index2 | | | 30-Day
Standardized
Subsidized Yield3 | | | 30-Day
Standardized
Unsubsidized Yield3 | |
| | Class A | | | 1.35 | % | | | 1.96 | % | | | 1.86 | % | | | 1.79 | % |
| | Class C | | | 0.69 | | | | 1.96 | | | | 1.20 | | | | 1.12 | |
| | Institutional | | | 1.69 | | | | 1.96 | | | | 2.27 | | | | 2.19 | |
| | Service | | | 1.19 | | | | 1.96 | | | | 1.79 | | | | 1.70 | |
| | Class IR | | | 1.60 | | | | 1.96 | | | | 2.18 | | | | 2.10 | |
| | | Class R | | | 1.09 | | | | 1.96 | | | | 1.56 | | | | 1.46 | |
| | | | | |
| | | | | | | | | | | | | | | |
| | | July 31, 2015– March 31, 2016 | | | | | | | | | | | | |
| | | Class R6 | | | 2.34 | % | | | 2.99 | % | | | 2.29 | % | | | 2.21 | % |
| | 1 | | The net asset value (“NAV”) represents the net assets of the class of the Fund (ex-dividend) divided by the total number of shares of the class outstanding. The Fund’s performance assumes the reinvestment of dividends and other distributions. The Fund’s performance does not reflect the deduction of any applicable sales charges. |
| | 2 | | The Barclays U.S. Aggregate Bond Index represents an unmanaged diversified portfolio of fixed income securities, including U.S. Treasuries, investment-grade corporate bonds, and mortgage-backed and asset-backed securities. The index figure does not reflect any deduction for fees, expenses or taxes. It is not possible to invest directly in an index. |
| | 3 | | The method of calculation of the 30-Day Standardized Subsidized Yield is mandated by the Securities and Exchange Commission and is determined by dividing the net investment income per share earned during the last 30 days of the period by the maximum public offering price (“POP”) per share on the last day of the period. This number is then annualized. The 30-Day Standardized Subsidized Yield reflects fee waivers and/or expense reimbursements recorded by the Fund during the period. Without waivers and/or reimbursements, yields would be reduced. This yield does not necessarily reflect income actually earned and distributed by the Fund and, therefore, may not be correlated with the dividends or other distributions paid to shareholders. The 30-Day Standardized Unsubsidized Yield does not adjust for any fee waivers and/ or expense reimbursements in effect. If the Fund does not incur any fee waivers and/or expense reimbursements during the period, the 30-Day Standard Subsidized Yield and 30-Day Standardized Unsubsidized Yield will be identical. |
The returns set forth in the table above represent past performance. Past performance does not guarantee future results. The Fund’s investment return and principal value will fluctuate so that an investor’s shares, when redeemed, may be worth more or less than their original cost. Current performance may be lower or higher than the performance quoted above. Please visit our web site at www.GSAMFUNDS.com to obtain the most recent month-end returns. Performance reflects fee waivers and/or expense limitations in effect during the period shown. In their absence, performance would be reduced. Returns do not reflect the deduction of taxes that a shareholder would pay on Fund distributions or the redemption of Fund shares.
13
FUND BASICS
| | | | | | | | | | | | | | | | | | | | |
| | STANDARDIZED TOTAL RETURNS4 |
| | | For the period ended 3/31/16 | | One Year | | | Five Years | | | Ten Years | | | Since Inception | | | Inception Date |
| | Class A | | | -2.40 | % | | | 2.92 | % | | | 3.59 | % | | | 4.73 | % | | 5/1/97 |
| | Class C | | | -0.31 | | | | 2.94 | | | | 3.23 | | | | 4.03 | | | 8/15/97 |
| | Institutional | | | 1.69 | | | | 4.05 | | | | 4.34 | | | | 5.42 | | | 1/5/94 |
| | Service | | | 1.19 | | | | 3.53 | | | | 3.83 | | | | 4.85 | | | 3/13/96 |
| | Class IR | | | 1.60 | | | | 3.98 | | | | N/A | | | | 3.80 | | | 11/30/07 |
| | Class R | | | 1.09 | | | | 3.45 | | | | N/A | | | | 3.30 | | | 11/30/07 |
| | | Class R6 | | | N/A | | | | N/A | | | | N/A | | | | 2.34 | | | 7/31/15 |
| | 4 | | The Standardized Total Returns are average annual total returns or cumulative total returns for periods of less than 1 year as of the most recent calendar quarter-end. They assume reinvestment of all distributions at NAV. These returns reflect a maximum initial sales charge of 3.75% for Class A Shares and the assumed contingent deferred sales charge for Class C Shares (1% if redeemed within 12 months of purchase). Prior to July 29, 2009, the maximum initial sales charge applicable to Class A Shares was 4.5%, which is not reflected in the average annual total return figures shown. Because Institutional, Service, Class IR, Class R Shares and Class R6 Shares do not involve a sales charge, such a charge is not applied to their Standardized Total Returns. |
The returns set forth in the table above represent past performance. Past performance does not guarantee future results. The Fund’s investment return and principal value will fluctuate so that an investor’s shares, when redeemed, may be worth more or less than their original cost. Current performance may be lower or higher than the performance quoted above. Please visit our web site at www.GSAMFUNDS.com to obtain the most recent month-end returns. Performance reflects applicable fee waivers and/or expense limitations in effect during the periods shown. In their absence, performance would be reduced. Returns do not reflect the deduction of taxes that a shareholder would pay on Fund distributions or the redemption of Fund shares.
| | | | | | | | | | |
| | EXPENSE RATIOS5 | |
| | | | | Net Expense Ratio (Current) | | | Gross Expense Ratio (Before Waivers) | |
| | Class A | | | 0.78 | % | | | 0.81 | % |
| | Class C | | | 1.53 | | | | 1.56 | |
| | Institutional | | | 0.44 | | | | 0.47 | |
| | Service | | | 0.94 | | | | 0.97 | |
| | Class IR | | | 0.53 | | | | 0.58 | |
| | Class R | | | 1.03 | | | | 1.07 | |
| | | Class R6 | | | 0.42 | | | | 0.45 | |
| | 5 | | The expense ratios of the Fund, both current (net of applicable fee waivers and/or expense limitations) and before waivers (gross of applicable fee waivers and/or expense limitations) are as set forth above according to the most recent publicly available Prospectus for the Fund and may differ from the expense ratios disclosed in the Financial Highlights in this report. Pursuant to a contractual arrangement, the Fund’s waivers and/or expense limitations will remain in place through at least July 29, 2016, and prior to such date the investment adviser may not terminate the arrangements without the approval of the Fund’s Board of Trustees. If these arrangements are discontinued in the future, the expense ratios may change without shareholder approval. |
14
FUND BASICS
|
| FUND COMPOSITION6 |
| Percentage of Net Assets |
| | 6 | | The percentage shown for each investment category reflects the value of investments in that category as a percentage of net assets. Figures in the graph may not sum to 100% due to the exclusion of other assets and liabilities. The graph depicts the Fund’s investments but may not represent the Fund’s market exposure due to the exclusion of certain derivatives, if any, as listed in the Additional Investment Information section of the Schedule of Investments. |
| | 7 | | “Federal Agencies” are mortgage-backed securities guaranteed by the Government National Mortgage Association (“GNMA”), Federal National Mortgage Association (“FNMA”) and Federal Home Loan Mortgage Corp. (“FHLMC”). GNMA instruments are backed by the full faith and credit of the U.S. Government. |
| | 8 | | “Agency Debentures” include agency securities offered by companies such as FNMA and FHLMC, which operate under a government charter. While they are required to report to a government regulator, their assets are not explicitly guaranteed by the government and they otherwise operate like any other publicly traded company. |
| | 9 | | “Government Guarantee Obligations” are guaranteed by a foreign government guarantee program and are backed by full faith and credit or the United States or the government of a foreign country. |
15
GOLDMAN SACHS CORE FIXED INCOME FUND
Performance Summary
March 31, 2016
The following graph shows the value, as of March 31, 2016, of a $1,000,000 investment made on April 1, 2006 in Institutional Shares at NAV. For comparative purposes, the performance of the Fund’s benchmark, the Barclays U.S. Aggregate Bond Index, is shown. This performance data represents past performance and should not be considered indicative of future performance, which will fluctuate with changes in market conditions. These performance fluctuations will cause an investor’s shares, when redeemed, to be worth more or less than their original cost. Performance reflects applicable fee waivers and/or expense limitations in effect during the periods shown and in their absence, performance would be reduced. Returns do not reflect the deduction of taxes that a shareholder would pay on Fund distributions or the redemption of Fund shares. Performance of Class A, Class C, Service, Class IR, Class R and Class R6 Shares will vary from Institutional Shares due to differences in class specific fees and any applicable sales charges. In addition to the investment adviser’s decisions regarding issuer/industry/country investment selection and allocation, other factors may affect Fund performance. These factors include, but are not limited to, Fund operating fees and expenses, portfolio turnover and subscription and redemption cash flows affecting the Fund.
|
| Core Fixed Income Fund’s 10 Year Performance |
Performance of a $1,000,000 Investment, with distributions reinvested, from April 1, 2006 through March 31, 2016.
| | | | | | | | | | | | | | |
| Average Annual Total Return through March 31, 2016 | | | One Year | | | | Five Years | | | | Ten Years | | | Since Inception |
Class A (Commenced May 1, 1997) | | | | | | | | | | | | | | |
Excluding sales charges | | | 1.35% | | | | 3.70% | | | | 3.99% | | | 4.94% |
Including sales charges | | | -2.40% | | | | 2.92% | | | | 3.59% | | | 4.73% |
|
Class C (Commenced August 15, 1997) | | | | | | | | | | | | | | |
Excluding contingent deferred sales charges | | | 0.69% | | | | 2.94% | | | | 3.23% | | | 4.03% |
Including contingent deferred sales charges | | | -0.31% | | | | 2.94% | | | | 3.23% | | | 4.03% |
|
Institutional Class (Commenced January 5, 1994) | | | 1.69% | | | | 4.05% | | | | 4.34% | | | 5.42% |
|
Service Class (Commenced March 13, 1996) | | | 1.19% | | | | 3.53% | | | | 3.83% | | | 4.85% |
|
Class IR (Commenced November 30, 2007) | | | 1.60% | | | | 3.98% | | | | N/A | | | 3.80% |
|
Class R (Commenced November 30, 2007) | | | 1.09% | | | | 3.45% | | | | N/A | | | 3.30% |
|
Class R6 (Commenced July 31, 2015) | | | N/A | | | | N/A | | | | N/A | | | 2.34%* |
|
| * | | Total return for periods of less than one year represents cumulative total return. |
16
PORTFOLIO RESULTS
Goldman Sachs Global Income Fund
Investment Objective
The Fund seeks a high total return, emphasizing current income, and, to a lesser extent, providing opportunities for capital appreciation.
Portfolio Management Discussion and Analysis
Below, the Goldman Sachs Global Fixed Income Investment Management Team discusses the Goldman Sachs Global Income Fund’s (the “Fund”) performance and positioning for the 12-month period ended March 31, 2016 (the “Reporting Period”).
| Q | | How did the Fund perform during the Reporting Period? |
| A | | During the Reporting Period, the Fund’s Class A, C, Institutional, Service and IR Shares generated average annual total returns, without sales charges, of 1.67%, 0.83%, 2.00%, 1.23% and 1.95%, respectively. These returns compare to the 2.44% average annual total return of the Fund’s benchmark, the Barclays Global Aggregate Bond Index (Gross, USD, hedged) (the “Barclays Index”), during the same time period. |
| | Since their inception on July 31, 2015, the Fund’s Class R6 Shares generated a cumulative total return, without sales charge, of 2.92%. This return compares to the 3.72% cumulative total return of the Barclays Index during the same period. |
| Q | | What key factors were responsible for the Fund’s performance during the Reporting Period? |
| A | | Detracting from the Fund’s performance was our cross-sector strategy. Our cross sector strategy is one in which we invest Fund assets across a variety of fixed income sectors, including some that may not be included in the Fund’s benchmark. |
| | The primary contributor to the Fund’s performance was our country strategy. Within our country strategy, our five-year/ five-year relative value trading, implemented via the use of interest rate swaps, proved most effective. (The strategy looks at various countries, both developed and emerging market, for relative value opportunities.) In particular, the Fund’s exposure to the European and Canadian interest rate curves proved effective. Such positioning more than offset the detracting impact of positioning in the U.K. and Japan during the Reporting Period. Additionally, several relative value trades benefited results, especially our long Japanese yen versus short U.S. dollar; our long Canadian dollar versus short U.S. dollar; and our outright long Australian dollar and long Canadian dollar trades. The country strategy is primarily implemented via interest rate swaps and/or futures. |
| | Bottom-up individual issue selection within the government/ swaps sector also contributed positively to the Fund’s results during the Reporting Period. The government/swaps strategy is primarily implemented via interest rate swaps and/or futures. Individual issue selection strategies reflect any active views we take on a particular sector. |
| | To a more modest degree, our duration strategy also added value. The duration strategy is primarily implemented via interest rate swaps and/or futures. Duration is a measure of the Fund’s sensitivity to changes in interest rates. |
| Q | | Which fixed income market sectors most significantly affected Fund performance? |
| A | | Our cross-sector strategy was a significant detractor. Cross-sector positioning detracted primarily due to an overweighted allocation to corporate credit, as credit spreads widened during the Reporting Period. Such widening was driven by factors that included persistent weakness in commodity prices, concerns about slowing economic growth in China, uncertainty around the future path of central bank monetary policy, and fears of a possible U.S. recession. |
| | On the positive side, individual issue selection within the government/swaps sector proved particularly effective during the Reporting Period. Positions in a number of Italian government bonds contributed positively to the Fund’s relative results. Also, a number of butterfly and curve steepener/ flattener positions across both the European and U.S. interest rate curves added value. (A butterfly position is a neutral option strategy that use four option contracts with the same expiration |
| | but three different strike prices to create a range of prices the strategy can profit from. A strike price is the price at which a |
17
PORTFOLIO RESULTS
| | specific derivative contract can be exercised. The trader sells two option contracts at the middle strike price and buys one option contract at a lower strike price and one option contract at a higher strike price. Both puts and calls can be used for a butterfly spread. A curve steepener strategy is one that uses derivatives to benefit from escalating yield differences that occur as a result of increases in the yield curve between two Treasury bonds of different maturities. This strategy can be effective in certain macroeconomic scenarios in which the price of the longer term Treasury is driven down. A curve flattener is the converse, using derivatives to benefit in a yield-rate environment in which long-term rates are decreasing at a rate faster than short-term rates. This causes the yield curve to flatten as the short-term and long-term rates start to converge.) The Fund’s New York tactical auction trade, which looks to take advantage of mis-pricing in the yield curve in the run-up to, or time preceding, issuance, also performed well. |
| Q | | Did the Fund’s duration and yield curve positioning strategy help or hurt its results during the Reporting Period? |
| A | | The combined effect of the Fund’s duration and yield curve positioning contributed positively to results during the Reporting Period. The Fund’s duration strategy is actively managed and constantly monitored in an effort to generate greater performance and reduced risk through volatile markets. We tactically adjusted the Fund’s duration position throughout the Reporting Period as market conditions shifted. |
| | For example, we maintained a short U.S. duration position relative to the Barclays Index during the second quarter of 2015, which helped as government yields rose broadly on stronger economic data and expectations that the Federal Reserve (the “Fed”) would raise interest rates in 2015. In August 2015, we removed the short U.S. duration position and moved to a rather neutral position relative to the Barclays Index as volatility picked up early in the month. We then shifted to a modestly longer duration position than that of the Barclays Index in September 2015, ahead of the Fed’s meeting, due to tightening financial conditions and on our view, proved correct, that the Fed was not likely to raise rates. We maintained a bullish bias regarding the Fed’s monetary policy, but toward the end of September 2015, we returned to a more neutral duration position in the Fund compared to that of the Barclays Index as yields moved lower amid Fed rhetoric indicating its bias toward hiking rates in late 2015. We subsequently moved back to a longer duration position than that of the Barclays Index in both U.S. and European rates in the fourth quarter of 2015. The Fed finally raised rates in December 2015, signaling that the U.S. economy was strengthening. After the initial lift-off, as that first interest rate hike was commonly referred to, financial conditions tightened, driven largely by a strong U.S. dollar and weakness in credit markets. In January 2016, we moved to a neutral duration position relative to the Barclays Index in U.S. rates. We similarly moved to a neutral European rates duration positions, as upside surprises in economic data contended with expectations for further easing from the European Central Bank (“ECB”) given persistently low inflation data. Later in the first quarter of 2016, we moved to a short U.S. duration position relative to the Barclays Index given what we viewed to be positive inflation, labor market and economic growth data. As mentioned earlier, duration is a measure of the Fund’s sensitivity to changes in interest rates. |
| Q | | How did the Fund use derivatives and similar instruments during the Reporting Period? |
| A | | We used derivatives and similar instruments for the efficient management of the Fund. These derivatives and similar instruments allowed us to manage interest rate, credit and currency risks more effectively by allowing us both to hedge and to apply active investment views with greater versatility and to afford greater risk management precision than we would otherwise be able to implement. Derivatives are used in combination with cash securities to implement our views in the Fund. |
| | During the Reporting Period, we used interest rate and bond exchange traded futures contracts to implement duration and country strategies within the Fund, especially in the U.S., Eurozone, U.K. and Japanese markets. Currency transactions were carried out using primarily over-the-counter (“OTC”) spot and forward foreign exchange contracts as well as by purchasing OTC options. Currency transactions were used as we sought both to enhance returns and to hedge the Fund’s portfolio against currency exchange rate fluctuations. Interest rate and credit default swaps were also used as cost-efficient instruments to help grant us greater precision and versatility in the management of active strategies. Forward sales contracts were used to implement currency transactions based on our active views and for hedging purposes. Written option contracts were used to implement active views within our top-down and bottom-up selection strategies and for hedging purposes. |
18
PORTFOLIO RESULTS
| Q | | Were there any notable changes in the Fund’s weightings during the Reporting Period? |
| A | | As mentioned earlier, we adjusted the Fund’s U.S. and European duration positions during the Reporting Period as market conditions and perceptions around central bank policy shifted. |
| | From a sector perspective, on a market-value weighted basis, we increased the Fund’s exposure relative to the Barclays Index to U.S. Treasuries as well as to asset-backed securities and residential mortgage-backed securities. We decreased its relative weightings in quasi-government securities, commercial mortgage-backed securities and emerging market debt. |
| | From a country perspective, on a market-value weighted basis, we increased the Fund’s exposure relative to the Barclays Index to Japan and the U.S. and decreased its relative weightings in Canada, the U.K. and the Eurozone overall. |
| Q | | How was the Fund positioned relative to its benchmark index at the end of March 2016? |
| A | | At the end of March 2016, on a market-value weighted basis, the Fund had overweighted allocations relative to the Barclays Index in asset-backed securities, residential mortgage-backed securities, commercial mortgage-backed securities and investment grade corporate bonds. The Fund had underweighted exposure relative to the Barclays Index in quasi-government securities, covered bonds and emerging markets debt. (Covered bonds are debt securities backed by cash flows from mortgage loans or public sector loans.) The Fund was rather neutrally weighted compared to the Barclays Index in government securities and had no position in high yield corporate bonds at the end of the Reporting Period. |
| | From a country perspective, on a market-value weighted basis, the Fund was overweight relative to the Barclays Index in the U.S. The Fund was underweight compared to the Barclays Index in the U.K. and Australia. The Fund was relatively neutrally weighted to the Eurozone overall, but within the region, was overweight Germany, underweight France and rather neutral to the remaining markets at the end of the Reporting Period. The Fund was also relatively neutrally weighted at the end of the Reporting Period to Canada, Denmark, Japan, Norway and Sweden. The Fund had a modestly shorter duration than the Barclays Index at the end of the Reporting Period. |
19
FUND BASICS
Global Income Fund
as of March 31, 2016
| | | | | | | | | | | | | | | | | | |
| | PERFORMANCE REVIEW | |
| | | April 1, 2015– March 31, 2016 | | Fund Total Return
(based on NAV)1 | | | Barclays
Index2 | | | 30-Day
Standardized
Subsidized Yield3 | | | 30-Day
Standardized
Unsubsidized Yield3 | |
| | Class A | | | 1.67 | % | | | 2.44 | % | | | 0.33 | % | | | 0.21 | % |
| | Class C | | | 0.83 | | | | 2.44 | | | | -0.31 | | | | -0.53 | |
| | Institutional | | | 2.00 | | | | 2.44 | | | | 0.68 | | | | 0.56 | |
| | Service | | | 1.23 | | | | 2.44 | | | | 0.18 | | | | 0.06 | |
| | | Class IR | | | 1.95 | | | | 2.44 | | | | 0.59 | | | | 0.46 | |
| | | | | |
| | | | | | | | | | | | | | | |
| | | July 31, 2015– March 31, 2016 | | | | | | | | | | | | |
| | | Class R6 | | | 2.92 | % | | | 3.72 | % | | | 0.70 | % | | | 0.57 | % |
| | 1 | | The net asset value (“NAV”) represents the net assets of the class of the Fund (ex-dividend) divided by the total number of shares of the class outstanding. The Fund’s performance reflects the reinvestment of dividends and other distributions. The Fund’s performance does not reflect the deduction of any applicable sales charges. |
| | 2 | | The Barclays Global Aggregate Bond Index (Gross, USD, hedged), an unmanaged index, provides a broad based measure of the global investment-grade fixed-rate debt markets and covers the most liquid portion of the global investment grade fixed-rate bond market, including government, credit and collateralized securities. The index figures do not include any deduction for fees, expenses or taxes. It is not possible to invest directly in an index. |
| | 3 | | The method of calculation of the 30-Day Standardized Subsidized Yield is mandated by the Securities and Exchange Commission and is determined by dividing the net investment income per share earned during the last 30 days of the period by the maximum public offering price (“POP”) per share on the last day of the period. This number is then annualized. The 30-Day Standardized Subsidized Yield reflects fee waivers and/or expense reimbursements recorded by the Fund during the period. Without waivers and/or reimbursements, yields would be reduced. This yield does not necessarily reflect income actually earned and distributed by the Fund and, therefore, may not be correlated with the dividends or other distributions paid to shareholders. The 30-Day Standardized Unsubsidized Yield does not adjust for any fee waivers and/ or expense reimbursements in effect. If the Fund does not incur any fee waivers and/or expense reimbursements during the period, the 30-Day Standard Subsidized Yield and 30-Day Standardized Unsubsidized Yield will be identical. |
The returns set forth in the table above represent past performance. Past performance does not guarantee future results. The Fund’s investment return and principal value will fluctuate so that an investor’s shares, when redeemed, may be worth more or less than their original cost. Current performance may be lower or higher than the performance quoted above. Please visit our web site at www.GSAMFUNDS.com to obtain the most recent month-end returns. Performance reflects fee waivers and/or expense limitations in effect during the period shown. In their absence, performance would be reduced. Returns do not reflect the deduction of taxes that a shareholder would pay on Fund distributions or the redemption of Fund shares.
20
FUND BASICS
| | | | | | | | | | | | | | | | | | | | |
| | STANDARDIZED TOTAL RETURNS4 |
| | | For the period ended 3/31/16 | | One Year | | | Five Years | | | Ten Years | | | Since Inception | | | Inception Date |
| | Class A | | | -2.16 | % | | | 3.50 | % | | | 3.94 | % | | | 5.32 | % | | 8/2/91 |
| | Class C | | | -0.18 | | | | 3.51 | | | | 3.56 | | | | 3.98 | | | 8/15/97 |
| | Institutional | | | 2.00 | | | | 4.65 | | | | 4.70 | | | | 5.74 | | | 8/1/95 |
| | Service | | | 1.23 | | | | 4.06 | | | | 4.14 | | | | 4.67 | | | 3/12/97 |
| | Class IR | | | 1.95 | | | | 4.54 | | | | N/A | | | | 3.85 | | | 7/30/10 |
| | | Class R6 | | | N/A | | | | N/A | | | | N/A | | | | 2.92 | | | 7/31/15 |
| | 4 | | The Standardized Total Returns are average annual total returns or cumulative total returns for periods of less than 1 year as of the most recent calendar quarter-end. They assume reinvestment of all distributions at NAV. These returns reflect a maximum initial sales charge of 3.75% for Class A Shares and the assumed contingent deferred sales charge for Class C Shares (1% if redeemed within 12 months of purchase). Prior to July 29, 2009, the maximum initial sales charge applicable to Class A Shares was 4.5%, which is not reflected in the average annual total return figures shown. Because Institutional, Service, Class IR Shares and Class R6 Shares do not involve a sales charge, such a charge is not applied to their Standardized Total Returns. |
The returns set forth in the table above represent past performance. Past performance does not guarantee future results. The Fund’s investment return and principal value will fluctuate so that an investor’s shares, when redeemed, may be worth more or less than their original cost. Current performance may be lower or higher than the performance quoted above. Please visit our web site at www.GSAMFUNDS.com to obtain the most recent month-end returns. Performance reflects applicable fee waivers and/or expense limitations in effect during the periods shown. In their absence, performance would be reduced. Returns do not reflect the deduction of taxes that a shareholder would pay on Fund distributions or the redemption of Fund shares.
| | | | | | | | | | |
| | EXPENSE RATIOS5 | |
| | | | | Net Expense Ratio (Current) | | | Gross Expense Ratio (Before Waivers) | |
| | Class A | | | 1.03 | % | | | 1.18 | % |
| | Class C | | | 1.77 | | | | 1.93 | |
| | Institutional | | | 0.70 | | | | 0.84 | |
| | Service | | | 1.20 | | | | 1.34 | |
| | Class IR | | | 0.77 | | | | 0.90 | |
| | | Class R6 | | | 0.68 | | | | 0.82 | |
| | 5 | | The expense ratios of the Fund, both current (net of applicable fee waivers and/or expense limitations) and before waivers (gross of applicable fee waivers and/or expense limitations) are as set forth above according to the most recent publicly available Prospectus for the Fund and may differ from the expense ratios disclosed in the Financial Highlights in this report. Pursuant to a contractual arrangement, the Fund’s waivers and/or expense limitations will remain in place through at least July 29, 2016, and prior to such date the investment adviser may not terminate the arrangements without the approval of the Fund’s Board of Trustees. If these arrangements are discontinued in the future, the expense ratios may change without shareholder approval. |
21
FUND BASICS
| | | | | | | | | | |
| | CURRENCY ALLOCATION6 | |
| | | | | Percentage of Net Assets | |
| | | | | as of 3/31/16 | | | as of 3/31/15 | |
| | U.S. Dollar7 | | | 56.6 | % | | | 45.7 | % |
| | Euro | | | 25.7 | | | | 27.6 | |
| | Japanese Yen | | | 17.0 | | | | 11.0 | |
| | British Pound | | | 3.8 | | | | 5.8 | |
| | Canadian Dollar | | | 2.1 | | | | 3.4 | |
| | Mexican Peso | | | 0.6 | | | | 3.5 | |
| | South Korean Won | | | 0.5 | | | | 0.8 | |
| | Australian Dollar | | | 0.3 | | | | 0.5 | |
| | South African Rand | | | 0.2 | | | | 0.4 | |
| | Danish Krone | | | 0.1 | | | | 0.2 | |
| | Polish Zloty | | | 0.1 | | | | 0.1 | |
| | | Czech Koruna | | | 0.1 | | | | 0.1 | |
| | 6 | | The percentage shown for each currency reflects the value of investments in that category as a percentage of net assets. Figures in the table may not sum to 100% due to the exclusion of other assets and liabilities. The table depicts the Fund’s investments but may not represent the Fund’s market exposure due to the exclusion of certain derivatives, if any, as listed in the Additional Investment Information section of the Schedule of Investments. |
| | 7 | | These figures represent the value excluding short-term obligations. If short-term obligations had been included, the percentages for 3/31/16 and 3/31/15 would have been 61.7% and 50.0%, respectively. |
22
GOLDMAN SACHS GLOBAL INCOME FUND
Performance Summary
March 31, 2016
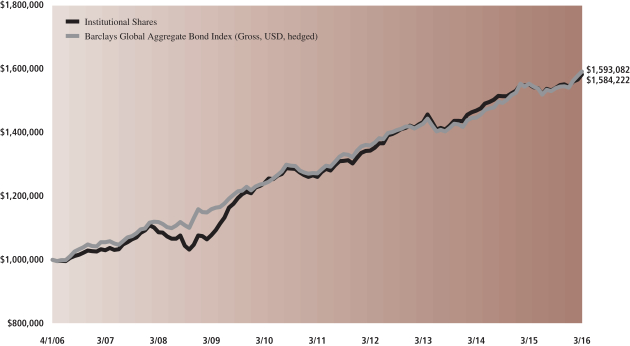
The following graph shows the value, as of March 31, 2016, of a $1,000,000 investment made on April 1, 2006 in Institutional Shares at NAV. For comparative purposes, the performance of the Fund’s benchmark, the Barclays Global Aggregate Bond Index (Gross, USD, hedged) is shown. This performance data represents past performance and should not be considered indicative of future performance, which will fluctuate with changes in market conditions. These performance fluctuations will cause an investor’s shares, when redeemed, to be worth more or less than their original cost. Performance reflects applicable fee waivers and/or expense limitations in effect during the periods shown and in their absence, performance would be reduced. Returns do not reflect the deduction of taxes that a shareholder would pay on Fund distributions or the redemption of Fund shares. Performance of Class A, Class C, Service, Class IR and Class R6 Shares will vary from Institutional Shares due to differences in class specific fees and any applicable sales charges. In addition to the investment adviser’s decisions regarding issuer/industry/country investment selection and allocation, other factors may affect Fund performance. These factors include, but are not limited to, Fund operating fees and expenses, portfolio turnover and subscription and redemption cash flows affecting the Fund.
|
| Global Income Fund’s 10 Year Performance |
Performance of a $1,000,000 Investment, with distributions reinvested, from April 1, 2006 through March 31, 2016.
| | | | | | | | | | | | | | |
| Average Annual Total Return through March 31, 2016 | | | One Year | | | | Five Years | | | | Ten Years | | | Since Inception |
Class A (Commenced August 2, 1991) | | | | | | | | | | | | | | |
Excluding sales charges | | | 1.67% | | | | 4.29% | | | | 4.34% | | | 5.48% |
Including sales charges | | | -2.16% | | | | 3.50% | | | | 3.94% | | | 5.32% |
|
Class C (Commenced August 15, 1997) | | | | | | | | | | | | | | |
Excluding contingent deferred sales charges | | | 0.83% | | | | 3.51% | | | | 3.56% | | | 3.98% |
Including contingent deferred sales charges | | | -0.18% | | | | 3.51% | | | | 3.56% | | | 3.98% |
|
Institutional Class (Commenced August 1, 1995) | | | 2.00% | | | | 4.65% | | | | 4.70% | | | 5.74% |
|
Service Class (Commenced March 12, 1997) | | | 1.23% | | | | 4.06% | | | | 4.14% | | | 4.67% |
|
Class IR (Commenced July 30, 2010) | | | 1.95% | | | | 4.54% | | | | N/A | | | 3.85% |
|
Class R6 (Commenced July 31, 2015) | | | N/A | | | | N/A | | | | N/A | | | 2.92%* |
|
| * | | Total return for periods of less than one year represents cumulative total return. |
23
PORTFOLIO RESULTS
Goldman Sachs Strategic Income Fund
Investment Objective
The Fund seeks total return comprised of income and capital appreciation.
Portfolio Management Discussion and Analysis
Below, the Goldman Sachs U.S. Fixed Income Investment Management Team discusses the Goldman Sachs Strategic Income Fund’s (the “Fund”) performance and positioning for the 12-month period ended March 31, 2016 (the “Reporting Period”).
| Q | | How did the Fund perform during the Reporting Period? |
| A | | During the Reporting Period, the Fund’s Class A, C, Institutional, IR and R Shares generated average annual total returns, without sales charges, of -2.49%, -3.21%, -2.16%, -2.24% and -2.73%, respectively. These returns compare to the 0.33% average annual total return of the Fund’s benchmark, the Bank of America Merrill Lynch U.S. Dollar 3-Month LIBOR Constant Maturity Index (the “LIBOR Index”), during the same period. |
| | Since their inception on July 31, 2015, the Fund’s Class R6 Shares generated a cumulative total return, without sales charge, of -3.05%. This return compares to the 0.24% cumulative total return of the LIBOR Index during the same period. |
| | We note that the Fund’s benchmark being the LIBOR Index is a means of emphasizing that the Fund has an unconstrained strategy. That said, this Fund employs a benchmark agnostic strategy and thus comparisons to a benchmark index are not particularly relevant. |
| Q | | What key factors were responsible for the Fund’s performance during the Reporting Period? |
| A | | Detracting most from the Fund’s performance during the Reporting Period was individual issue selection. These strategies reflect any active views we take on these particular sectors. |
| | Within our top-down strategies, our country and currency strategies contributed positively to Fund performance. Within our country strategy, the Fund benefited through most of the first half of the Reporting Period from a long Japan/U.S. versus short U.K./Europe trade, implemented as we sought to capture the divergence of the respective economies. Following strong performance, we wound down the trade and pivoted into a long Europe versus short U.K. and U.S. rates position. Within our currency strategy, the Fund benefited most from overweighted exposure to the Swedish krona and from underweighted exposure to a basket of Asian currencies, such as the Chinese renminbi and the South Korean won. Such positive contributors were partially offset by an overweighted position in the Mexican peso, which detracted. |
| | The Fund’s duration strategy contributed positively, albeit modestly, to its performance. Duration is a measure of the Fund’s sensitivity to changes in interest rates. |
| Q | | Which fixed income market sectors most significantly affected Fund performance? |
| A | | Individual issue selection within the corporate bond and municipal debt sectors detracted. Through much of the Reporting Period, the broad corporate bond sector, both investment grade and high yield, experienced significant spread widening, meaning the differential in yields between these sectors and U.S. Treasuries increased. The Fund held modest exposure to corporate credit during the Reporting Period on our view that valuations were expensive. Toward the end of 2015, spreads widened further, and we took the opportunity to begin increasing exposure to the sector. However, as oil prices deteriorated at the end of 2015 and to start 2016, credit spreads meaningfully widened amidst heightened investor risk globally, which hurt overall performance. Early in 2016, we reduced the Fund’s corporate credit exposure. Within the municipal debt sector, exposure to Puerto Rico debt, primarily general obligation and special tax bonds, hurt most. There was significant downward price movement following comments in June 2015 by the commonwealth’s governor indicating that its current debt was unsustainable and there was a need for a debt restructure. At the end of the Reporting Period, the commonwealth was continuing to explore various options to restructure its outstanding debt. |
24
PORTFOLIO RESULTS
| | Conversely, individual issue selection within the government/ swaps sector contributed positively to the Fund’s performance. In particular, the Fund benefited from its U.S. and Europe yield curve steepening positions within the sector. |
| Q | | Did the Fund’s duration and yield curve positioning strategy help or hurt its results during the Reporting Period? |
| A | | The combined effect of the Fund’s tactical duration and yield curve positioning contributed positively, albeit modestly, to results during the Reporting Period. The Fund benefited from tactical long exposure during certain points in the Reporting Period. We are able to make tactical duration bets by going either long or short in duration within the Fund. During the Reporting Period, we had decided to take active views in duration by establishing long duration positions in European interest rates, which was beneficial to the Fund. However, such positive contribution was partially offset by short positions in U.S. interest rates, which detracted. |
| Q | | How did the Fund use derivatives and similar instruments during the Reporting Period? |
| A | | We used derivatives and similar instruments for the efficient management of the Fund. These derivatives and similar instruments allowed us to manage interest rate, credit and currency risks more effectively by allowing us both to hedge and to apply active investment views with greater versatility and to afford greater risk management precision than we would otherwise be able to implement. |
| | During the Reporting Period, we used interest rate and bond exchange traded futures contracts to implement duration and country strategies within the Fund, especially in the U.S., Eurozone and Japanese markets. Currency transactions were carried out using primarily over-the-counter (“OTC”) spot and forward foreign exchange contracts as well as by purchasing OTC options. Currency transactions were used as we sought both to enhance returns and to hedge the Fund’s portfolio against currency exchange rate fluctuations. Also, we used written options contracts and swaptions (or options on interest rate swap contracts) to express an outright term structure view and manage volatility (term structure, most often depicted as a yield curve, refers to the term structure of interest rates, which is the relationship between the yield to maturity and the time to maturity for pure discount bonds); credit default swaps to manage exposure to fluctuations in credit spreads (or the differential in yields between Treasury securities and non-Treasury securities that are identical in all respects except for quality rating); and interest rate swaps to manage exposure to fluctuations in interest rates. We used total return swaps to manage curve exposure across various strategies within the Fund. Our currency strategy used forward sales contracts to implement long and short views within the strategy. |
| | Both the country strategy and currency strategy employ derivatives to achieve their views. In the country strategy, the Fund’s Team primarily uses swaps/futures to express relative value trades in the interest rates of two separate countries. The country strategy overall contributed positively to the Fund’s performance during the Reporting Period. In the currency strategy, transactions were carried out primarily using OTC spot and forward foreign exchange contracts as well as by purchasing OTC options. The currency strategy overall contributed positively, albeit modestly, to the Fund’s performance during the Reporting Period. |
| Q | | Were there any notable changes in the Fund’s weightings during the Reporting Period? |
| A | | The Fund is a broadly diversified, multi-sector portfolio designed to provide total return opportunities from across the fixed income spectrum, including government, securitized, corporate credit and emerging market fixed income sectors. |
| | As mentioned earlier, we tactically adjusted the Fund’s duration and country positions during the Reporting Period as market conditions and perceptions around central bank policy shifted. Also during the Reporting Period, we modestly reduced our exposure to Puerto Rico municipal debt, as these securities had come under heavy pressure following comments from the commonwealth’s governor. We kept the Fund’s corporate bond exposure relatively modest throughout the Reporting Period, but added to this position towards the end of 2015 based on what we considered to be attractive valuations. As credit spreads further deteriorated in 2016, we switched to a more neutral stance on credit. During the Reporting Period, we also added to the Fund’s securitized exposure mainly through commercial mortgage-backed securities, as we sought to capture more spread in the Fund. Within our currency strategy, we increased the Fund’s exposure to the Swedish krona toward the end of the Reporting Period, as we believe the market was underpricing the strength in domestic growth in Sweden. |
25
PORTFOLIO RESULTS
| Q | | How was the Fund positioned at the end of March 2016? |
| A | | At the end of March 2016, the Fund had the majority of its total net assets invested in U.S. government securities, followed by collateralized loan obligations, emerging markets debt, agency and non-agency mortgage-backed securities, investment grade corporate bonds, commercial mortgage-backed securities, asset-backed securities, quasi-government securities, high yield corporate bonds and municipal bonds. The Fund’s credit exposure at the end of the Reporting Period was modest, as we reduced the allocation to begin 2016 on the back of significant spread widening. The Fund held Federal Family Education Loan Program (“FFELP”) student loans, as we believe these securities represent an opportunity to garner high quality cash flows at attractive levels. The Fund also had a substantial position in cash and cash equivalents at the end of the Reporting Period. |
| | The Fund’s largest duration positions at the end of the Reporting Period were its long duration position in Europe versus its short duration positions in the U.K., U.S. and Japan. From a currency perspective, the Fund maintained long currency positions in the U.S. dollar, Mexican peso and Swedish krona. The Fund was most short a basket of Asian currencies at the end of the Reporting Period. |
26
FUND BASICS
Strategic Income Fund
as of March 31, 2016
| | | | | | | | | | | | | | | | | | |
| | PERFORMANCE REVIEW | |
| | | April 1, 2015– March 31, 2016 | | Fund Total Return
(based on NAV)1 | | | LIBOR Index2 | | | 30-Day
Standardized
Subsidized Yield3 | | | 30-Day
Standardized
Unsubsidized Yield3 | |
| | Class A | | | -2.49 | % | | | 0.33 | % | | | 1.98 | % | | | 1.95 | % |
| | Class C | | | -3.21 | | | | 0.33 | | | | 1.36 | | | | 1.29 | |
| | Institutional | | | -2.16 | | | | 0.33 | | | | 2.39 | | | | 2.36 | |
| | Class IR | | | -2.24 | | | | 0.33 | | | | 2.30 | | | | 2.27 | |
| | | Class R | | | -2.73 | | | | 0.33 | | | | 1.81 | | | | 1.77 | |
| | | | | |
| | | | | | | | | | | | | | | |
| | | July 31, 2015– March 31, 2016 | | | | | | | | | | | | |
| | | Class R6 | | | -3.05 | % | | | 0.24 | % | | | 2.41 | % | | | 2.38 | % |
| | 1 | | The net asset value (NAV) represents the net assets of the class of the Fund (ex-dividend) divided by the total number of shares of the class outstanding. The Fund’s performance reflects the reinvestment of dividends and other distributions. The Fund’s performance does not reflect the deduction of any applicable sales charges. |
| | 2 | | The Bank of America Merrill Lynch U.S. Dollar Three-Month LIBOR Constant Maturity Index tracks the performance of a synthetic asset paying LIBOR to a stated maturity. The index is based on the assumed purchase at par of a synthetic instrument having exactly its stated maturity and with a coupon equal to that day’s fixing rate. That issue is assumed to be sold the following business day (priced at a yield equal to the current day fixing rate) and rolled into a new instrument. |
| | 3 | | The method of calculation of the 30-Day Standardized Subsidized Yield is mandated by the Securities and Exchange Commission and is determined by dividing the net investment income per share earned during the last 30 days of the period by the maximum public offering price (“POP”) per share on the last day of the period. This number is then annualized. The 30-Day Standardized Subsidized Yield reflects fee waivers and/or expense reimbursements recorded by the Fund during the period. Without waivers and/or reimbursements, yields would be reduced. This yield does not necessarily reflect income actually earned and distributed by the Fund and, therefore, may not be correlated with the dividends or other distributions paid to shareholders. The 30-Day Standardized Unsubsidized Yield does not adjust for any fee waivers and/ or expense reimbursements in effect. If the Fund does not incur any fee waivers and/or expense reimbursements during the period, the 30-Day Standard Subsidized Yield and 30-Day Standardized Unsubsidized Yield will be identical. |
27
FUND BASICS
| | | | | | | | | | | | | | | | |
| | STANDARDIZED TOTAL RETURNS4 |
| | | For the period ended 3/31/16 | | One Year | | | Five Years | | | Since Inception | | | Inception Date |
| | Class A | | | -6.12 | % | | | 1.36 | % | | | 1.59 | % | | 6/30/10 |
| | Class C | | | -4.17 | | | | 1.37 | | | | 1.51 | | | 6/30/10 |
| | Institutional | | | -2.16 | | | | 2.50 | | | | 2.61 | | | 6/30/10 |
| | Class IR | | | -2.24 | | | | 2.41 | | | | 2.52 | | | 6/30/10 |
| | Class R | | | -2.73 | | | | 1.89 | | | | 2.01 | | | 6/30/10 |
| | | Class R6 | | | N/A | | | | N/A | | | | -3.05 | | | 7/31/15 |
| | 4 | | The Standardized Total Returns are average annual total returns or cumulative total returns for periods of less than 1 year as of the most recent calendar quarter-end. They assume reinvestment of all distributions at NAV. These returns reflect a maximum initial sales charge of 3.75% for Class��A Shares and the assumed contingent deferred sales charge for Class C Shares (1% if redeemed within 12 months of purchase). Because Institutional, Class IR, Class R and Class R6 Shares do not involve a sales charge, such a charge is not applied to their Standardized Total Returns. |
The returns set forth in the tables above represent past performance. Past performance does not guarantee future results. The Fund’s investment return and principal value will fluctuate so that an investor’s shares, when redeemed, may be worth more or less than their original cost. Current performance may be lower or higher than the performance quoted above. Please visit our web site at www.GSAMFUNDS.com to obtain the most recent month-end returns. Performance reflects applicable fee waivers and/or expense limitations in effect during the period shown. In their absence, performance would be reduced. Returns do not reflect the deduction of taxes that a shareholder would pay on Fund distributions or the redemption of Fund shares.
| | | | | | | | | | |
| | EXPENSE RATIOS5 | |
| | | | | Net Expense Ratio (Current) | | | Gross Expense Ratio (Before Waivers) | |
| | Class A | | | 0.91 | % | | | 0.91 | % |
| | Class C | | | 1.66 | | | | 1.66 | |
| | Institutional | | | 0.57 | | | | 0.57 | |
| | Class IR | | | 0.66 | | | | 0.66 | |
| | Class R | | | 1.16 | | | | 1.16 | |
| | | Class R6 | | | 0.55 | | | | 0.55 | |
| | 5 | | The expense ratios of the Fund, both current (net of applicable fee waivers and/or expense limitations) and before waivers (gross of applicable fee waivers and/or expense limitations), are as set forth above according to the most recent publicly available Prospectus. |
28
FUND BASICS
|
| FUND COMPOSITION6 |
| Percentage of Net Assets |
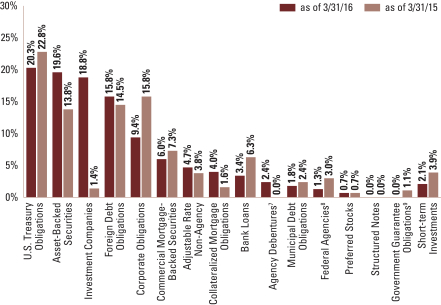
| | 6 | | The percentage shown for each investment category reflects the value of investments in that category as a percentage of net assets. Short-term investments represent certificate of deposits and repurchase agreements. Figures in the graph may not sum to 100% due to the exclusion of other assets and liabilities. The graph depicts the Fund’s investments but may not represent the Fund’s market exposure due to the exclusion of certain derivatives, if any, as listed in the Additional Investment Information section of the Schedule of Investments. |
| | 7 | | “Agency Debentures” include agency securities offered by companies such as Federal National Mortgage Association (“FNMA”) and Federal Home Loan Mortgage Corp. (“FHLMC”), which operate under a government charter. While they are required to report to a government regulator, their assets are not explicitly guaranteed by the government and they otherwise operate like any other publicly traded company. |
| | 8 | | “Federal Agencies” are mortgage-backed securities guaranteed by the Government National Mortgage Association (“GNMA”), FNMA and FHLMC. GNMA instruments are backed by the full faith and credit of the U.S. Government. |
| | 9 | | “Government Guarantee Obligations” are guaranteed by a foreign government guarantee program and are backed by the full faith and credit of the United States or the government of a foreign country. |
29
GOLDMAN SACHS STRATEGIC INCOME FUND
Performance Summary
March 31, 2016
The following graph shows the value, as of March 31, 2016, of a $1,000,000 investment made on June 30, 2010 (commencement of operations) in Institutional Shares at NAV. For comparative purposes, the performance of the Fund’s benchmark, the Bank of America Merrill Lynch U.S. Dollar Three-Month LIBOR Constant Maturity Index, is shown. This performance data represents past performance and should not be considered indicative of future performance, which will fluctuate with changes in market conditions. These performance fluctuations will cause an investor’s shares, when redeemed, to be worth more or less than their original cost. Performance reflects applicable fee waivers and/or expense limitations in effect during the periods shown and in their absence, performance would be reduced. Returns do not reflect the deduction of taxes that a shareholder would pay on Fund distributions or the redemption of Fund shares. Performance of Class A, Class C, Class IR, Class R and Class R6 Shares will vary from Institutional Shares due to differences in class specific fees and any applicable sales charges. In addition to the investment adviser’s decisions regarding issuer/industry/country investment selection and allocation, other factors may affect Fund performance. These factors include, but are not limited to, Fund operating fees and expenses, portfolio turnover and subscription and redemption cash flows affecting the Fund.
|
| Strategic Income Fund’s Lifetime Performance |
Performance of a $1,000,000 Investment, with distributions reinvested, from June 30, 2010 through March 31, 2016.
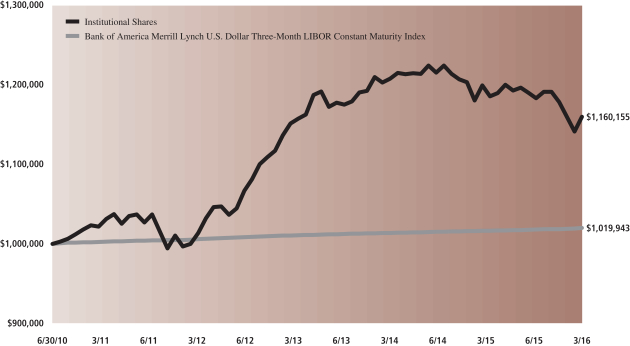
| | | | | | | | | | |
| Average Annual Total Return through March 31, 2016 | | | One Year | | | | Five Years | | | Since Inception |
Class A (Commenced June 30, 2010) | | | | | | | | | | |
Excluding sales charges | | | -2.49% | | | | 2.13% | | | 2.27% |
Including sales charges | | | -6.12% | | | | 1.36% | | | 1.59% |
|
Class C (Commenced June 30, 2010) | | | | | | | | | | |
Excluding contingent deferred sales charges | | | -3.21% | | | | 1.37% | | | 1.51% |
Including contingent deferred sales charges | | | -4.17% | | | | 1.37% | | | 1.51% |
|
Institutional Class (Commenced June 30, 2010) | | | -2.16% | | | | 2.50% | | | 2.61% |
|
Class IR (Commenced June 30, 2010) | | | -2.24% | | | | 2.41% | | | 2.52% |
|
Class R (Commenced June 30, 2010) | | | -2.73% | | | | 1.89% | | | 2.01% |
|
Class R6 (Commenced July 31, 2015) | | | N/A | | | | N/A | | | -3.05%* |
|
| * | | Total return for periods of less than one year represents cumulative total return. |
30
GOLDMAN SACHS BOND FUND
Schedule of Investments
March 31, 2016
| | | | | | | | | | | | | | |
Principal Amount | | | Interest Rate | | | Maturity Date | | | Value | |
| | Corporate Obligations – 25.7% | |
| | Automotive – 0.8% | |
| Ford Motor Credit Co. LLC | |
| $ | 2,175,000 | | | | 5.875 | % | | | 08/02/21 | | | $ | 2,486,082 | |
| General Motors Financial Co., Inc. | |
| | 1,050,000 | | | | 3.500 | | | | 07/10/19 | | | | 1,070,649 | |
| | | | | | | | | | | | | | |
| | | | | | | | | | | | | 3,556,731 | |
| | |
| | Banks – 5.5% | |
| American Express Co.(a)(b) | |
| | 1,200,000 | | | | 6.800 | | | | 09/01/66 | | | | 1,197,000 | |
| Banco Bilbao Vizcaya Argentaria SA | |
| | 1,175,000 | | | | 3.000 | | | | 10/20/20 | | | | 1,184,620 | |
| Banco Nacional de Costa Rica(c) | |
| | 260,000 | | | | 6.250 | | | | 11/01/23 | | | | 254,800 | |
| Bank of America Corp. | |
| | 625,000 | | | | 4.125 | | | | 01/22/24 | | | | 658,717 | |
| | 575,000 | | | | 4.000 | | | | 04/01/24 | | | | 601,698 | |
| BNP Paribas SA(a)(b)(c) | |
| | 450,000 | | | | 7.625 | | | | 03/30/49 | | | | 452,475 | |
| Citigroup, Inc.(a)(b) | |
| | 375,000 | | | | 5.875 | | | | 03/27/49 | | | | 360,000 | |
| | 425,000 | | | | 6.125 | | | | 11/15/49 | | | | 429,250 | |
| Compass Bank | |
| | 275,000 | | | | 1.850 | (a) | | | 09/29/17 | | | | 273,639 | |
| | 475,000 | | | | 5.500 | | | | 04/01/20 | | | | 505,288 | |
| Credit Suisse AG(c) | |
| | 250,000 | | | | 6.500 | | | | 08/08/23 | | | | 268,750 | |
| Credit Suisse Group AG(a)(b)(c) | |
| | 400,000 | | | | 7.500 | | | | 12/18/49 | | | | 393,000 | |
| Credit Suisse Group Funding Guernsey Ltd. | |
| | 250,000 | | | | 3.750 | | | | 03/26/25 | | | | 237,973 | |
| Discover Financial Services(a) | |
| | 900,000 | | | | 3.750 | | | | 03/04/25 | | | | 871,136 | |
| ING Bank NV(a)(b) | |
| | 700,000 | | | | 4.125 | | | | 11/21/23 | | | | 705,999 | |
| ING Groep NV(a)(b) | |
| | 475,000 | | | | 6.000 | | | | 04/16/49 | | | | 446,500 | |
| Intesa Sanpaolo SpA | |
| | 675,000 | | | | 2.375 | | | | 01/13/17 | | | | 677,928 | |
| | 950,000 | | | | 3.875 | | | | 01/16/18 | | | | 972,076 | |
| | 1,025,000 | | | | 5.017 | (c) | | | 06/26/24 | | | | 961,232 | |
| | 200,000 | | | | 5.710 | (c) | | | 01/15/26 | | | | 194,809 | |
| JPMorgan Chase & Co.(a)(b) | |
| | 1,075,000 | | | | 5.300 | | | | 05/01/49 | | | | 1,077,688 | |
| Lloyds Bank PLC | |
| | 350,000 | | | | 2.300 | | | | 11/27/18 | | | | 352,804 | |
| | 1,875,000 | | | | 2.350 | | | | 09/05/19 | | | | 1,892,544 | |
| Lloyds Banking Group PLC(a)(b) | |
| | 325,000 | | | | 7.500 | | | | 06/27/49 | | | | 323,375 | |
| Macquarie Bank Ltd.(c) | |
| | 400,000 | | | | 6.625 | | | | 04/07/21 | | | | 455,143 | |
| Mitsubishi UFJ Financial Group, Inc. | |
| | 525,000 | | | | 2.950 | | | | 03/01/21 | | | | 535,446 | |
| | 900,000 | | | | 3.850 | | | | 03/01/26 | | | | 935,835 | |
| Nationwide Building Society(c) | |
| | 900,000 | | | | 3.900 | | | | 07/21/25 | | | | 949,885 | |
| | |
| | Corporate Obligations – (continued) | |
| | Banks – (continued) | |
| PNC Preferred Funding Trust II(a)(b)(c) | |
| $ | 800,000 | | | | 1.856 | % | | | 03/29/49 | | | $ | 672,000 | |
| Royal Bank of Scotland Group PLC(a)(b) | |
| | 300,000 | | | | 7.500 | | | | 08/10/49 | | | | 279,612 | |
| | 275,000 | | | | 8.000 | | | | 08/10/49 | | | | 262,625 | |
| Santander Bank NA | |
| | 325,000 | | | | 2.000 | (a) | | | 01/12/18 | | | | 322,248 | |
| | 400,000 | | | | 8.750 | | | | 05/30/18 | | | | 445,686 | |
| Santander Holdings USA, Inc.(a) | |
| | 275,000 | | | | 4.500 | | | | 07/17/25 | | | | 280,445 | |
| Santander UK Group Holdings PLC | |
| | 950,000 | | | | 2.875 | | | | 10/16/20 | | | | 945,907 | |
| | 775,000 | | | | 4.750 | (c) | | | 09/15/25 | | | | 737,296 | |
| Sumitomo Mitsui Financial Group, Inc.(c) | |
| | 975,000 | | | | 4.436 | | | | 04/02/24 | | | | 1,018,622 | |
| Synchrony Financial(a) | |
| | 1,675,000 | | | | 3.000 | | | | 08/15/19 | | | | 1,689,880 | |
| UBS Group Funding Jersey Ltd.(c) | |
| | 1,275,000 | | | | 4.125 | | | | 09/24/25 | | | | 1,276,818 | |
| | | | | | | | | | | | | | |
| | | | | | | | | | | | | 26,100,749 | |
| | |
| | Brokerage – 0.5% | |
| Morgan Stanley, Inc. | |
| | 325,000 | | | | 3.875 | | | | 04/29/24 | | | | 338,994 | |
| | 1,050,000 | | | | 3.700 | | | | 10/23/24 | | | | 1,078,403 | |
| | 50,000 | | | | 4.000 | | | | 07/23/25 | | | | 52,237 | |
| | 750,000 | | | | 5.550 | (a)(b) | | | 07/15/49 | | | | 736,875 | |
| | | | | | | | | | | | | | |
| | | | | | | | | | | | | 2,206,509 | |
| | |
| | Building Materials(a)(c) – 0.1% | |
| HD Supply, Inc. | |
| | 300,000 | | | | 5.250 | | | | 12/15/21 | | | | 314,625 | |
| | |
| | Chemicals(a) – 0.3% | |
| Eastman Chemical Co. | |
| | 675,000 | | | | 3.800 | | | | 03/15/25 | | | | 684,319 | |
| LyondellBasell Industries NV | |
| | 300,000 | | | | 5.000 | | | | 04/15/19 | | | | 319,543 | |
| Solvay Finance America LLC(c) | |
| �� | 575,000 | | | | 3.400 | | | | 12/03/20 | | | | 584,552 | |
| | | | | | | | | | | | | | |
| | | | | | | | | | | | | 1,588,414 | |
| | |
| | Consumer Products – 0.3% | |
| Newell Rubbermaid, Inc. | |
| | 625,000 | | | | 2.600 | | | | 03/29/19 | | | | 634,286 | |
| Sally Holdings LLC/Sally Capital, Inc.(a) | |
| | 450,000 | | | | 5.625 | | | | 12/01/25 | | | | 479,812 | |
| Spectrum Brands, Inc.(a) | |
| | 100,000 | | | | 6.625 | | | | 11/15/22 | | | | 108,000 | |
| | | | | | | | | | | | | | |
| | | | | | | | | | | | | 1,222,098 | |
| | |
| | Diversified Financial Services(c) – 0.1% | |
| GE Capital International Funding Co. | |
| | 551,000 | | | | 4.418 | | | | 11/15/35 | | | | 596,966 | |
| | |
| | Electric(a) – 0.3% | |
| Consumers Energy Co. | |
| | 850,000 | | | | 3.950 | | | | 05/15/43 | | | | 876,977 | |
| | |
| | |
| The accompanying notes are an integral part of these financial statements. | | 31 |
GOLDMAN SACHS BOND FUND
Schedule of Investments (continued)
March 31, 2016
| | | | | | | | | | | | | | |
Principal Amount | | | Interest Rate | | | Maturity Date | | | Value | |
| | Corporate Obligations – (continued) | |
| | Electric(a) – (continued) | |
| Puget Sound Energy, Inc.(b) | |
| $ | 600,000 | | | | 6.974 | % | | | 06/01/67 | | | $ | 457,500 | |
| | | | | | | | | | | | | | |
| | | | | | | | | | | | | 1,334,477 | |
| | |
| | Energy – 1.5% | |
| Anadarko Petroleum Corp. | |
| | 330,000 | | | | 3.450 | (a) | | | 07/15/24 | | | | 294,913 | |
| | 275,000 | | | | 6.450 | | | | 09/15/36 | | | | 274,058 | |
| Antero Resources Corp.(a) | |
| | 475,000 | | | | 5.625 | | | | 06/01/23 | | | | 434,625 | |
| Apache Corp.(a) | |
| | 100,000 | | | | 3.250 | | | | 04/15/22 | | | | 95,974 | |
| | 650,000 | | | | 4.250 | | | | 01/15/44 | | | | 554,627 | |
| Brazil Minas SPE via State of Minas Gerais | |
| | 420,000 | | | | 5.333 | | | | 02/15/28 | | | | 360,150 | |
| ConocoPhillips Co.(a) | |
| | 400,000 | | | | 4.200 | | | | 03/15/21 | | | | 417,784 | |
| | 580,000 | | | | 3.350 | | | | 11/15/24 | | | | 552,147 | |
| | 325,000 | | | | 4.950 | | | | 03/15/26 | | | | 339,940 | |
| | 400,000 | | | | 4.150 | | | | 11/15/34 | | | | 349,823 | |
| Devon Energy Corp.(a) | |
| | 250,000 | | | | 3.250 | | | | 05/15/22 | | | | 208,750 | |
| | 200,000 | | | | 5.600 | | | | 07/15/41 | | | | 155,138 | |
| Halliburton Co.(a) | |
| | 525,000 | | | | 3.375 | | | | 11/15/22 | | | | 533,174 | |
| | 525,000 | | | | 3.800 | | | | 11/15/25 | | | | 523,558 | |
| Laredo Petroleum, Inc.(a) | |
| | 150,000 | | | | 6.250 | | | | 03/15/23 | | | | 125,625 | |
| Occidental Petroleum Corp.(a) | |
| | 825,000 | | | | 3.400 | | | | 04/15/26 | | | | 834,346 | |
| Petroleos de Venezuela SA | |
| | 120,000 | | | | 9.000 | | | | 11/17/21 | | | | 44,400 | |
| | 590,000 | | | | 6.000 | | | | 05/16/24 | | | | 183,195 | |
| | 270,000 | | | | 6.000 | | | | 11/15/26 | | | | 83,295 | |
| | 20,000 | | | | 5.375 | | | | 04/12/27 | | | | 6,323 | |
| | 10,000 | | | | 5.500 | | | | 04/12/37 | | | | 3,175 | |
| Pioneer Natural Resources Co.(a) | |
| | 525,000 | | | | 3.450 | | | | 01/15/21 | | | | 522,007 | |
| Valero Energy Corp. | |
| | 425,000 | | | | 3.650 | | | | 03/15/25 | | | | 417,533 | |
| | | | | | | | | | | | | | |
| | | | | | | | | | | | | 7,314,560 | |
| | |
| | Food & Beverage – 1.6% | |
| Anheuser-Busch InBev Finance, Inc.(a) | |
| | 2,425,000 | | | | 2.650 | | | | 02/01/21 | | | | 2,490,851 | |
| | 2,050,000 | | | | 3.650 | | | | 02/01/26 | | | | 2,154,316 | |
| | 300,000 | | | | 4.900 | | | | 02/01/46 | | | | 336,294 | |
| Kraft Heinz Foods Co.(a)(c) | |
| | 525,000 | | | | 2.800 | | | | 07/02/20 | | | | 536,700 | |
| | 775,000 | | | | 3.950 | | | | 07/15/25 | | | | 824,440 | |
| SABMiller Holdings, Inc.(c) | |
| | 675,000 | | | | 4.950 | | | | 01/15/42 | | | | 753,109 | |
| Suntory Holdings Ltd.(c) | |
| | 550,000 | | | | 2.550 | | | | 09/29/19 | | | | 558,006 | |
| | | | | | | | | | | | | | |
| | | | | | | | | | | | | 7,653,716 | |
| | |
| | Corporate Obligations – (continued) | |
| | Food & Drug Retailers(a) – 0.5% | |
| CVS Health Corp. | |
| $ | 425,000 | | | | 3.500 | % | | | 07/20/22 | | | $ | 455,617 | |
| | 1,525,000 | | | | 3.375 | | | | 08/12/24 | | | | 1,597,973 | |
| Walgreens Boots Alliance, Inc. | |
| | 200,000 | | | | 2.700 | | | | 11/18/19 | | | | 203,904 | |
| | 50,000 | | | | 4.800 | | | | 11/18/44 | | | | 49,688 | |
| | | | | | | | | | | | | | |
| | | | | | | | | | | | | 2,307,182 | |
| | |
| | Gaming – 0.1% | |
| MGM Resorts International | |
| | 475,000 | | | | 6.750 | | | | 10/01/20 | | | | 510,625 | |
| | |
| | Health Care – Services – 0.5% | |
| CHS/Community Health Systems, Inc.(a) | |
| | 100,000 | | | | 8.000 | | | | 11/15/19 | | | | 97,375 | |
| McKesson Corp.(a) | |
| | 650,000 | | | | 2.700 | | | | 12/15/22 | | | | 645,763 | |
| UnitedHealth Group, Inc. | |
| | 450,000 | | | | 4.625 | | | | 07/15/35 | | | | 501,057 | |
| | 925,000 | | | | 4.750 | | | | 07/15/45 | | | | 1,063,265 | |
| | | | | | | | | | | | | | |
| | | | | | | | | | | | | 2,307,460 | |
| | |
| | Health Care Products – 0.3% | |
| Becton Dickinson & Co. | |
| | 475,000 | | | | 2.675 | | | | 12/15/19 | | | | 485,267 | |
| Stryker Corp.(a) | |
| | 275,000 | | | | 2.625 | | | | 03/15/21 | | | | 280,539 | |
| | 475,000 | | | | 3.500 | | | | 03/15/26 | | | | 493,493 | |
| Thermo Fisher Scientific, Inc.(a) | |
| | 350,000 | | | | 3.650 | | | | 12/15/25 | | | | 357,476 | |
| | | | | | | | | | | | | | |
| | | | | | | | | | | | | 1,616,775 | |
| | |
| | Home Construction – 0.2% | |
| MDC Holdings, Inc. | |
| | 500,000 | | | | 5.625 | | | | 02/01/20 | | | | 508,272 | |
| | 200,000 | | | | 5.500 | (a) | | | 01/15/24 | | | | 192,583 | |
| | 300,000 | | | | 6.000 | (a) | | | 01/15/43 | | | | 234,686 | |
| | | | | | | | | | | | | | |
| | | | | | | | | | | | | 935,541 | |
| | |
| | Life Insurance(c) – 0.7% | |
| Meiji Yasuda Life Insurance Co.(a)(b) | |
| | 550,000 | | | | 5.200 | | | | 10/20/45 | | | | 593,010 | |
| Reliance Standard Life Global Funding II | |
| | 675,000 | | | | 2.500 | | | | 01/15/20 | | | | 677,197 | |
| Teachers Insurance & Annuity Association of America | |
| | 870,000 | | | | 4.900 | | | | 09/15/44 | | | | 932,248 | |
| The Northwestern Mutual Life Insurance Co. | |
| | 800,000 | | | | 6.063 | | | | 03/30/40 | | | | 983,325 | |
| | | | | | | | | | | | | | |
| | | | | | | | | | | | | 3,185,780 | |
| | |
| | Media – Cable – 0.7% | |
| CCO Safari II LLC(a)(c) | |
| | 150,000 | | | | 3.579 | | | | 07/23/20 | | | | 152,783 | |
| | 925,000 | | | | 4.908 | | | | 07/23/25 | | | | 977,923 | |
| Numericable-SFR SA(a)(c) | |
| | 1,000,000 | | | | 6.000 | | | | 05/15/22 | | | | 975,000 | |
| | |
| | |
| 32 | | The accompanying notes are an integral part of these financial statements. |
GOLDMAN SACHS BOND FUND
| | | | | | | | | | | | | | |
Principal Amount | | | Interest Rate | | | Maturity Date | | | Value | |
| | Corporate Obligations – (continued) | |
| | Media – Cable – (continued) | |
| Time Warner Cable, Inc. | |
| $ | 225,000 | | | | 5.000 | % | | | 02/01/20 | | | $ | 243,658 | |
| Videotron Ltd. | |
| | 825,000 | | | | 5.000 | | | | 07/15/22 | | | | 849,750 | |
| | | | | | | | | | | | | | |
| | | | | | | | | | | | | 3,199,114 | |
| | |
| | Media – Non Cable – 0.9% | |
| 21st Century Fox America, Inc. | |
| | 1,125,000 | | | | 4.000 | | | | 10/01/23 | | | | 1,209,135 | |
| NBCUniversal Media LLC | |
| | 750,000 | | | | 4.375 | | | | 04/01/21 | | | | 836,740 | |
| | 1,525,000 | | | | 4.450 | | | | 01/15/43 | | | | 1,634,461 | |
| Nielsen Finance LLC/Nielsen Finance Co.(a) | |
| | 525,000 | | | | 4.500 | | | | 10/01/20 | | | | 538,125 | |
| Time Warner, Inc.(a) | |
| | 150,000 | | | | 3.875 | | | | 01/15/26 | | | | 157,200 | |
| | | | | | | | | | | | | | |
| | | | | | | | | | | | | 4,375,661 | |
| | |
| | Metals & Mining – 0.2% | |
| Freeport-McMoRan, Inc.(a) | |
| | 475,000 | | | | 5.400 | | | | 11/14/34 | | | | 290,937 | |
| Glencore Finance Canada Ltd.(c) | |
| | 880,000 | | | | 2.700 | | | | 10/25/17 | | | | 862,400 | |
| | | | | | | | | | | | | | |
| | | | | | | | | | | | | 1,153,337 | |
| | |
| | Noncaptive – Financial – 0.6% | |
| Capital One Financial Corp.(a) | |
| | 700,000 | | | | 4.200 | | | | 10/29/25 | | | | 711,852 | |
| General Electric Co. | |
| MXN | 2,000,000 | | | | 8.500 | | | | 04/06/18 | | | | 123,770 | |
| $ | 200,000 | | | | 6.150 | | | | 08/07/37 | | | | 269,722 | |
| | 172,000 | | | | 5.875 | | | | 01/14/38 | | | | 224,849 | |
| International Lease Finance Corp.(c) | |
| | 200,000 | | | | 6.750 | | | | 09/01/16 | | | | 203,000 | |
| | 575,000 | | | | 7.125 | | | | 09/01/18 | | | | 626,031 | |
| Roper Technologies, Inc.(a) | |
| | 475,000 | | | | 3.000 | | | | 12/15/20 | | | | 483,697 | |
| | | | | | | | | | | | | | |
| | | | | | | | | | | | | 2,642,921 | |
| | |
| | Packaging(a) – 0.1% | |
| Reynolds Group Issuer, Inc./Reynolds Group Issuer LLC/
Reynolds Group Issuer Lu |
|
| | 575,000 | | | | 5.750 | | | | 10/15/20 | | | | 589,375 | |
| | |
| | Paper(a)(c) – 0.1% | |
| Sappi Papier Holding GmbH | |
| | 550,000 | | | | 7.750 | | | | 07/15/17 | | | | 574,063 | |
| | |
| | Pharmaceuticals – 1.6% | |
| AbbVie, Inc.(a) | |
| | 750,000 | | | | 2.500 | | | | 05/14/20 | | | | 761,346 | |
| Actavis Funding SCS | |
| | 1,125,000 | | | | 2.350 | | | | 03/12/18 | | | | 1,138,113 | |
| | 275,000 | | | | 3.450 | (a) | | | 03/15/22 | | | | 284,392 | |
| | 595,000 | | | | 3.800 | (a) | | | 03/15/25 | | | | 618,095 | |
| | 550,000 | | | | 4.850 | (a) | | | 06/15/44 | | | | 585,700 | |
| Bayer US Finance LLC(c) | |
| | 1,025,000 | | | | 3.000 | | | | 10/08/21 | | | | 1,072,201 | |
| | |
| | Corporate Obligations – (continued) | |
| | Pharmaceuticals – (continued) | |
| EMD Finance LLC(a)(c) | |
| $ | 1,500,000 | | | | 2.950 | % | | | 03/19/22 | | | $ | 1,531,071 | |
| Forest Laboratories LLC(a)(c) | |
| | 1,050,000 | | | | 4.375 | | | | 02/01/19 | | | | 1,114,075 | |
| | 425,000 | | | | 5.000 | | | | 12/15/21 | | | | 474,480 | |
| | | | | | | | | | | | | | |
| | | | | | | | | | | | | 7,579,473 | |
| | |
| | Pipelines – 0.6% | |
| Enbridge, Inc.(a) | |
| | 325,000 | | | | 3.500 | | | | 06/10/24 | | | | 288,828 | |
| Energy Transfer Partners LP(a) | |
| | 70,000 | | | | 3.600 | | | | 02/01/23 | | | | 60,392 | |
| | 100,000 | | | | 4.750 | | | | 01/15/26 | | | | 91,295 | |
| Enterprise Products Operating LLC(a)(b) | |
| | 1,075,000 | | | | 8.375 | | | | 08/01/66 | | | | 849,250 | |
| | 125,000 | | | | 7.034 | | | | 01/15/68 | | | | 124,063 | |
| Kinder Morgan, Inc. | |
| | 500 | | | | 7.750 | | | | 01/15/32 | | | | 523 | |
| Sunoco Logistics Partners Operations LP(a) | |
| | 200,000 | | | | 4.250 | | | | 04/01/24 | | | | 181,768 | |
| Western Gas Partners LP(a) | |
| | 525,000 | | | | 3.950 | | | | 06/01/25 | | | | 448,875 | |
| Williams Partners LP(a) | |
| | 475,000 | | | | 3.600 | | | | 03/15/22 | | | | 387,125 | |
| | 600,000 | | | | 3.900 | | | | 01/15/25 | | | | 480,000 | |
| | | | | | | | | | | | | | |
| | | | | | | | | | | | | 2,912,119 | |
| | |
| | Property/Casualty Insurance – 0.4% | |
| Allied World Assurance Co. Holdings Ltd.(a) | |
| | 100,000 | | | | 4.350 | | | | 10/29/25 | | | | 100,504 | |
| American International Group, Inc.(a) | |
| | 450,000 | | | | 3.750 | | | | 07/10/25 | | | | 450,542 | |
| The Chubb Corp.(a)(b) | |
| | 500,000 | | | | 6.375 | | | | 03/29/67 | | | | 432,500 | |
| Trinity Acquisition PLC | |
| | 475,000 | | | | 4.400 | | | | 03/15/26 | | | | 484,274 | |
| ZFS Finance USA Trust II(a)(b)(c) | |
| | 625,000 | | | | 6.450 | | | | 12/15/65 | | | | 623,750 | |
| | | | | | | | | | | | | | |
| | | | | | | | | | | | | 2,091,570 | |
| | |
| | Real Estate Investment Trust – 1.5% | |
| American Campus Communities Operating Partnership LP(a) | |
| | 800,000 | | | | 3.750 | | | | 04/15/23 | | | | 807,958 | |
| ARC Properties Operating Partnership LP(a) | |
| | 575,000 | | | | 3.000 | | | | 02/06/19 | | | | 563,849 | |
| CBRE Services, Inc.(a) | |
| | 500,000 | | | | 5.250 | | | | 03/15/25 | | | | 513,750 | |
| DDR Corp. | |
| | 755,000 | | | | 7.500 | | | | 04/01/17 | | | | 797,163 | |
| Education Realty Operating Partnership LP(a) | |
| | 750,000 | | | | 4.600 | | | | 12/01/24 | | | | 745,511 | |
| HCP, Inc. | |
| | 525,000 | | | | 6.000 | | | | 01/30/17 | | | | 542,325 | |
| | 800,000 | | | | 4.250 | (a) | | | 11/15/23 | | | | 798,215 | |
| National Retail Properties, Inc.(a) | |
| | 400,000 | | | | 4.000 | | | | 11/15/25 | | | | 407,393 | |
| | |
| | |
| The accompanying notes are an integral part of these financial statements. | | 33 |
GOLDMAN SACHS BOND FUND
Schedule of Investments (continued)
March 31, 2016
| | | | | | | | | | | | | | |
Principal Amount | | | Interest Rate | | | Maturity Date | | | Value | |
| | Corporate Obligations – (continued) | |
| | Real Estate Investment Trust – (continued) | |
| Select Income REIT(a) | |
| $ | 125,000 | | | | 2.850 | % | | | 02/01/18 | | | $ | 125,236 | |
| | 225,000 | | | | 3.600 | | | | 02/01/20 | | | | 226,120 | |
| | 325,000 | | | | 4.150 | | | | 02/01/22 | | | | 319,909 | |
| Senior Housing Properties Trust(a) | |
| | 300,000 | | | | 3.250 | | | | 05/01/19 | | | | 298,552 | |
| Trust F/1401(a)(c) | |
| | 300,000 | | | | 5.250 | | | | 12/15/24 | | | | 305,250 | |
| WEA Finance LLC/Westfield UK & Europe Finance PLC(a)(c) | |
| | 900,000 | | | | 3.750 | | | | 09/17/24 | | | | 916,026 | |
| | | | | | | | | | | | | | |
| | | | | | | | | | | | | 7,367,257 | |
| | |
| | Retailers(a) – 0.4% | |
| Amazon.com, Inc. | |
| | 1,650,000 | | | | 3.300 | | | | 12/05/21 | | | | 1,751,917 | |
| Dollar Tree, Inc.(c) | |
| | 50,000 | | | | 5.250 | | | | 03/01/20 | | | | 52,312 | |
| | 150,000 | | | | 5.750 | | | | 03/01/23 | | | | 158,625 | |
| | | | | | | | | | | | | | |
| | | | | | | | | | | | | 1,962,854 | |
| | |
| | Schools – 0.1% | |
| Rensselaer Polytechnic Institute | |
| | 350,000 | | | | 5.600 | | | | 09/01/20 | | | | 397,828 | |
| | |
| | Technology – 1.3% | |
| Cisco Systems, Inc. | |
| | 650,000 | | | | 2.200 | | | | 02/28/21 | | | | 662,559 | |
| Fidelity National Information Services, Inc.(a) | |
| | 1,000,000 | | | | 3.625 | | | | 10/15/20 | | | | 1,034,045 | |
| Fiserv, Inc.(a) | |
| | 675,000 | | | | 2.700 | | | | 06/01/20 | | | | 683,959 | |
| Hewlett Packard Enterprise Co.(a)(c) | |
| | 600,000 | | | | 4.900 | | | | 10/15/25 | | | | 615,598 | |
| Intel Corp.(a) | |
| | 1,125,000 | | | | 3.700 | | | | 07/29/25 | | | | 1,230,779 | |
| Microsoft Corp.(a) | |
| | 800,000 | | | | 3.125 | | | | 11/03/25 | | | | 841,830 | |
| Oracle Corp.(a) | |
| | 775,000 | | | | 2.500 | | | | 05/15/22 | | | | 789,785 | |
| Tech Data Corp. | |
| | 400,000 | | | | 3.750 | | | | 09/21/17 | | | | 407,540 | |
| | | | | | | | | | | | | | |
| | | | | | | | | | | | | 6,266,095 | |
| | |
| | Tobacco – 1.4% | |
| BAT International Finance PLC(c) | |
| | 1,450,000 | | | | 3.950 | | | | 06/15/25 | | | | 1,587,244 | |
| Philip Morris International, Inc.(a) | |
| | 500,000 | | | | 2.750 | | | | 02/25/26 | | | | 507,909 | |
| Reynolds American, Inc. | |
| | 700,000 | | | | 4.850 | | | | 09/15/23 | | | | 787,723 | |
| | 3,550,000 | | | | 4.450 | (a) | | | 06/12/25 | | | | 3,906,213 | |
| | | | | | | | | | | | | | |
| | | | | | | | | | | | | 6,789,089 | |
| | |
| | Transportation(c) – 0.4% | |
| Penske Truck Leasing Co. LP/PTL Finance Corp. | |
| | 500,000 | | | | 2.875 | | | | 07/17/18 | | | | 503,627 | |
| | 750,000 | | | | 3.050 | (a) | | | 01/09/20 | | | | 745,749 | |
| | |
| | Corporate Obligations – (continued) | |
| | Transportation(c) – (continued) | |
| $ | 525,000 | | | | 3.375 | %(a) | | | 02/01/22 | | | $ | 521,247 | |
| | | | | | | | | | | | | | |
| | | | | | | | | | | | | 1,770,623 | |
| | |
| | Wireless Telecommunications – 0.5% | |
| American Tower Corp. | |
| | 300,000 | | | | 3.400 | | | | 02/15/19 | | | | 308,057 | |
| | 275,000 | | | | 3.300 | (a) | | | 02/15/21 | | | | 279,789 | |
| Crown Castle International Corp. | |
| | 575,000 | | | | 5.250 | | | | 01/15/23 | | | | 619,562 | |
| Digicel Ltd.(a)(c) | |
| | 800,000 | | | | 6.750 | | | | 03/01/23 | | | | 702,000 | |
| Sprint Communications, Inc.(c) | |
| | 250,000 | | | | 7.000 | | | | 03/01/20 | | | | 250,938 | |
| | | | | | | | | | | | | | |
| | | | | | | | | | | | | 2,160,346 | |
| | |
| | Wirelines Telecommunications – 1.6% | |
| AT&T, Inc.(a) | |
| | 400,000 | | | | 4.450 | | | | 04/01/24 | | | | 432,838 | |
| | 175,000 | | | | 3.950 | | | | 01/15/25 | | | | 182,159 | |
| Telefonica Emisiones SAU | |
| | 600,000 | | | | 5.134 | | | | 04/27/20 | | | | 664,327 | |
| | 150,000 | | | | 5.462 | | | | 02/16/21 | | | | 169,482 | |
| Verizon Communications, Inc. | |
| | 275,000 | | | | 2.625 | | | | 02/21/20 | | | | 282,365 | |
| | 1,500,000 | | | | 4.500 | | | | 09/15/20 | | | | 1,655,917 | |
| | 2,100,000 | | | | 5.150 | | | | 09/15/23 | | | | 2,423,248 | |
| | 1,775,000 | | | | 4.150 | (a) | | | 03/15/24 | | | | 1,934,432 | |
| | | | | | | | | | | | | | |
| | | | | | | | | | | | | 7,744,768 | |
| | |
| | TOTAL CORPORATE OBLIGATIONS | |
| | (Cost $121,641,088) | | | $ | 122,328,701 | |
| | |
| | | | | | | | | | | | | | |
| | Mortgage-Backed Obligations – 39.4% | |
| | Adjustable Rate Non-Agency(b) – 0.5% | |
| Aire Valley Mortgages PLC Series 2006-1X, Class 2A1 | |
| EUR | 530,296 | | | | 0.066 | % | | | 09/20/66 | | | $ | 586,518 | |
| Credit Suisse European Mortgage Capital Ltd.
Series 2015-1HWA, Class A(c) |
|
| | 1,151,415 | | | | 2.750 | | | | 04/20/20 | | | | 1,283,991 | |
| Deutsche Alt-A Securities Mortgage Loan Trust
Series 2007-OA3, Class A1 |
|
| $ | 543,265 | | | | 0.573 | | | | 07/25/47 | | | | 431,652 | |
| Lehman XS Trust Series 2007-4N, Class 1A1 | |
| | 41,453 | | | | 0.566 | | | | 03/25/47 | | | | 40,747 | |
| Master Adjustable Rate Mortgages Trust Series 2006-OA2,
Class 4A1B |
|
| | 297,458 | | | | 1.522 | | | | 12/25/46 | | | | 224,174 | |
| | |
| TOTAL ADJUSTABLE RATE
NON-AGENCY |
| | $ | 2,567,082 | |
| | |
| | Collateralized Mortgage Obligations – 4.3% | |
| | Interest Only(d) – 0.2% | |
| FHLMC STRIPS Series 304, Class C45 | |
| $ | 554,729 | | | | 3.000 | % | | | 12/15/27 | | | $ | 51,102 | |
| | |
| | |
| 34 | | The accompanying notes are an integral part of these financial statements. |
GOLDMAN SACHS BOND FUND
| | | | | | | | | | | | | | |
Principal Amount | | | Interest Rate | | | Maturity Date | | | Value | |
| | Mortgage-Backed Obligations – (continued) | |
| | Interest Only(d) – (continued) | |
| GNMA REMIC Series 2015-117, Class KI | |
| $ | 3,075,357 | | | | 5.000 | % | | | 08/20/45 | | | $ | 542,076 | |
| GNMA REMIC Series 2015-14, Class IO | |
| | 1,429,043 | | | | 5.000 | | | | 10/20/44 | | | | 255,267 | |
| | | | | | | | | | | | | | |
| | | | | | | | | | | | | 848,445 | |
| | |
| | Inverse Floaters(b) – 0.9% | |
| FHLMC REMIC Series 4314, Class SE | |
| | 719,062 | | | | 5.614 | | | | 03/15/44 | | | | 120,233 | |
| FHLMC REMIC Series 4320, Class SD | |
| | 484,158 | | | | 5.664 | | | | 07/15/39 | | | | 78,827 | |
| FHLMC REMIC Series 4431, Class ST | |
| | 911,038 | | | | 5.664 | | | | 01/15/45 | | | | 209,883 | |
| FNMA REMIC Series 2010-126, Class LS | |
| | 1,258,740 | | | | 4.562 | | | | 11/25/40 | | | | 243,710 | |
| FNMA REMIC Series 2013-121, Class SA | |
| | 1,024,156 | | | | 5.667 | | | | 12/25/43 | | | | 174,693 | |
| FNMA REMIC Series 2013-96, Class SW | |
| | 478,248 | | | | 5.667 | | | | 09/25/43 | | | | 82,590 | |
| FNMA REMIC Series 2014-87, Class MS | |
| | 1,565,126 | | | | 5.817 | | | | 01/25/45 | | | | 270,473 | |
| FNMA REMIC Series 2015-79, Class SA | |
| | 889,268 | | | | 5.817 | | | | 11/25/45 | | | | 144,133 | |
| FNMA REMIC Series 2015-81, Class SA | |
| | 3,298,175 | | | | 5.267 | | | | 11/25/45 | | | | 487,434 | |
| FNMA REMIC Series 2015-82, Class MS | |
| | 1,019,425 | | | | 5.267 | | | | 11/25/45 | | | | 160,118 | |
| FNMA REMIC Series 2015-86, Class BS | |
| | 456,245 | | | | 5.267 | | | | 11/25/45 | | | | 70,918 | |
| GNMA REMIC Series 2010-101, Class S | |
| | 924,961 | | | | 5.568 | | | | 08/20/40 | | | | 148,294 | |
| GNMA REMIC Series 2010-20, Class SE | |
| | 954,300 | | | | 5.818 | | | | 02/20/40 | | | | 158,171 | |
| GNMA REMIC Series 2010-31, Class SA | |
| | 721,035 | | | | 5.318 | | | | 03/20/40 | | | | 107,572 | |
| GNMA REMIC Series 2012-149, Class MS | |
| | 203,703 | | | | 5.818 | | | | 12/20/42 | | | | 32,748 | |
| GNMA REMIC Series 2013-113, Class SD | |
| | 667,091 | | | | 6.259 | | | | 08/16/43 | | | | 134,268 | |
| GNMA REMIC Series 2013-134, Class DS | |
| | 258,055 | | | | 5.668 | | | | 09/20/43 | | | | 42,048 | |
| GNMA REMIC Series 2013-152, Class SG | |
| | 832,376 | | | | 5.718 | | | | 06/20/43 | | | | 134,067 | |
| GNMA REMIC Series 2013-167, Class SG | |
| | 393,153 | | | | 5.718 | | | | 11/20/43 | | | | 60,063 | |
| GNMA REMIC Series 2013-181, Class SA | |
| | 1,071,059 | | | | 5.668 | | | | 11/20/43 | | | | 175,223 | |
| GNMA REMIC Series 2014-133, Class BS | |
| | 661,760 | | | | 5.168 | | | | 09/20/44 | | | | 97,768 | |
| GNMA REMIC Series 2014-41, Class SA | |
| | 282,627 | | | | 5.668 | | | | 03/20/44 | | | | 47,096 | |
| GNMA REMIC Series 2015-110, Class MS | |
| | 3,746,642 | | | | 5.278 | | | | 08/20/45 | | | | 570,892 | |
| GNMA REMIC Series 2015-126, Class HS | |
| | 458,655 | | | | 5.768 | | | | 09/20/45 | | | | 78,935 | |
| | |
| | Mortgage-Backed Obligations – (continued) | |
| | Inverse Floaters(b) – (continued) | |
| GNMA REMIC Series 2015-167, Class AS | |
| $ | 883,184 | | | | 5.818 | % | | | 11/20/45 | | | $ | 127,276 | |
| GNMA REMIC Series 2015-168, Class SD | |
| | 453,104 | | | | 5.768 | | | | 11/20/45 | | | | 74,201 | |
| GNMA REMIC Series 2016-4, Class SM | |
| | 1,481,826 | | | | 5.218 | | | | 01/20/46 | | | | 224,480 | |
| GNMA REMIC Series 2016-6, Class SB | |
| | 1,175,856 | | | | 5.218 | | | | 01/20/46 | | | | 180,592 | |
| | | | | | | | | | | | | | |
| | | | | | | | | | | | | 4,436,706 | |
| | |
| | Planned Amortization Class – 0.0% | |
| FNMA REMIC Series 2005-70, Class PA | |
| | 110,588 | | | | 5.500 | | | | 08/25/35 | | | | 124,328 | |
| | |
| | Sequential Fixed Rate – 1.6% | |
| FHLMC Multifamily Structured Pass-Through Certificates
Series K005, Class A2 |
|
| | 1,500,000 | | | | 4.317 | | | | 11/25/19 | | | | 1,644,402 | |
| FHLMC Multifamily Structured Pass-Through Certificates
Series K026, Class A2 |
|
| | 2,000,000 | | | | 2.510 | | | | 11/25/22 | | | | 2,069,220 | |
| FHLMC Multifamily Structured Pass-Through Certificates
Series K044, Class A2 |
|
| | 1,700,000 | | | | 2.811 | | | | 01/25/25 | | | | 1,770,209 | |
| FNMA REMIC Series 2011-52, Class GB | |
| | 909,219 | | | | 5.000 | | | | 06/25/41 | | | | 1,008,299 | |
| FNMA REMIC Series 2012-111, Class B | |
| | 85,232 | | | | 7.000 | | | | 10/25/42 | | | | 98,562 | |
| FNMA REMIC Series 2012-153, Class B | |
| | 218,962 | | | | 7.000 | | | | 07/25/42 | | | | 258,336 | |
| NCUA Guaranteed Notes Series A4 | |
| | 600,000 | | | | 3.000 | | | | 06/12/19 | | | | 634,429 | |
| | | | | | | | | | | | | | |
| | | | | | | | | | | | | 7,483,457 | |
| | |
| | Sequential Floating Rate(b) – 1.6% | |
| Banc of America Commercial Mortgage, Inc. Series 2007-2,
Class AM |
|
| | 225,000 | | | | 5.800 | | | | 04/10/49 | | | | 231,260 | |
| Commercial Mortgage Trust Series 2007-C9, Class A1A | |
| | 2,349,246 | | | | 6.006 | | | | 12/10/49 | | | | 2,440,199 | |
| Countrywide Alternative Loan Trust Series 2006-0C8, Class 2A3 | |
| | 1,719,120 | | | | 0.686 | | | | 11/25/36 | | | | 1,003,059 | |
| FHLMC Multifamily Structured Pass-Through Certificates
Series K033, Class A2 |
|
| | 1,200,000 | | | | 3.060 | | | | 07/25/23 | | | | 1,279,818 | |
| FHLMC Multifamily Structured Pass-Through Certificates
Series K714, Class A2 |
|
| | 600,000 | | | | 3.034 | | | | 10/25/20 | | | | 635,796 | |
| FHLMC Structured Agency Credit Risk Debt Notes
Series 2015-DNA1, Class M3 |
|
| | 260,000 | | | | 3.736 | | | | 10/25/27 | | | | 245,232 | |
| FHLMC Structured Agency Credit Risk Debt Notes
Series 2015-HQ1, Class M3 |
|
| | 300,000 | | | | 4.236 | | | | 03/25/25 | | | | 289,560 | |
| FNMA Connecticut Avenue Securities Series 2014-C03,
Class 1M1 |
|
| | 71,781 | | | | 1.636 | | | | 07/25/24 | | | | 71,524 | |
| | |
| | |
| The accompanying notes are an integral part of these financial statements. | | 35 |
GOLDMAN SACHS BOND FUND
Schedule of Investments (continued)
March 31, 2016
| | | | | | | | | | | | | | |
Principal Amount | | | Interest Rate | | | Maturity Date | | | Value | |
| | Mortgage-Backed Obligations – (continued) | |
| | Sequential Floating Rate(b) – (continued) | |
| FNMA Connecticut Avenue Securities Series 2015-C01,
Class 2M1 |
|
| $ | 10,529 | | | | 1.936 | % | | | 02/25/25 | | | $ | 10,531 | |
| FNMA REMIC Series 2011-63, Class FG | |
| | 230,884 | | | | 0.883 | | | | 07/25/41 | | | | 230,984 | |
| FREMF Mortgage Trust Series 2014-K40, Class C(c) | |
| | 600,000 | | | | 4.072 | | | | 11/25/47 | | | | 523,963 | |
| FREMF Mortgage Trust Series 2014-K41, Class B(c) | |
| | 400,000 | | | | 3.831 | | | | 11/25/47 | | | | 355,896 | |
| Morgan Stanley Capital I Trust Series 2007-HQ11, Class AM | |
| | 50,000 | | | | 5.478 | | | | 02/12/44 | | | | 50,699 | |
| Morgan Stanley Capital I Trust Series 2007-HQ13, Class AM | |
| | 50,000 | | | | 5.931 | | | | 12/15/44 | | | | 48,109 | |
| | | | | | | | | | | | | | |
| | | | | | | | | | | | | 7,416,630 | |
| | |
| TOTAL COLLATERALIZED
MORTGAGE OBLIGATIONS |
| | $ | 20,309,566 | |
| | |
| | Federal Agencies – 34.6% | |
| | Adjustable Rate FHLMC(b) – 0.0% | |
| $ | 78,930 | | | | 2.530 | % | | | 09/01/35 | | | $ | 83,026 | |
| | |
| | FHLMC – 0.7% | |
| | 8,982 | | | | 5.000 | | | | 05/01/18 | | | | 9,345 | |
| | 266,542 | | | | 6.000 | | | | 08/01/27 | | | | 301,652 | |
| | 25,059 | | | | 5.000 | | | | 08/01/33 | | | | 27,656 | |
| | 5,111 | | | | 5.000 | | | | 09/01/33 | | | | 5,641 | |
| | 7,371 | | | | 5.000 | | | | 10/01/33 | | | | 8,134 | |
| | 3,287 | | | | 6.000 | | | | 12/01/33 | | | | 3,820 | |
| | 6,335 | | | | 5.000 | | | | 11/01/34 | | | | 6,989 | |
| | 364,725 | | | | 5.000 | | | | 12/01/34 | | | | 402,348 | |
| | 10,250 | | | | 5.000 | | | | 07/01/35 | | | | 11,307 | |
| | 3,625 | | | | 5.000 | | | | 11/01/35 | | | | 4,001 | |
| | 54,981 | | | | 6.500 | | | | 08/01/37 | | | | 64,958 | |
| | 162,550 | | | | 6.500 | | | | 10/01/37 | | | | 192,888 | |
| | 22,126 | | | | 6.500 | | | | 09/01/38 | | | | 25,891 | |
| | 276,100 | | | | 6.000 | | | | 01/01/39 | | | | 313,943 | |
| | 274,634 | | | | 7.000 | | | | 02/01/39 | | | | 324,253 | |
| | 85,989 | | | | 5.000 | | | | 03/01/39 | | | | 94,486 | |
| | 22,479 | | | | 5.000 | | | | 05/01/39 | | | | 24,700 | |
| | 44,491 | | | | 5.000 | | | | 04/01/40 | | | | 49,130 | |
| | 8,362 | | | | 5.000 | | | | 08/01/40 | | | | 9,224 | |
| | 1,086,734 | | | | 5.500 | | | | 08/01/40 | | | | 1,210,968 | |
| | 6,764 | | | | 5.000 | | | | 04/01/41 | | | | 7,485 | |
| | 7,667 | | | | 5.000 | | | | 06/01/41 | | | | 8,451 | |
| | | | | | | | | | | | | | |
| | | | | | | | | | | | | 3,107,270 | |
| | |
| | FNMA – 22.0% | |
| | 718,314 | | | | 2.800 | | | | 03/01/18 | | | | 730,379 | |
| | 1,600,000 | | | | 4.506 | | | | 06/01/19 | | | | 1,679,339 | |
| | 43,375 | | | | 6.000 | | | | 06/01/21 | | | | 46,879 | |
| | 44,185 | | | | 5.000 | | | | 08/01/23 | | | | 48,176 | |
| | 23,873 | | | | 5.500 | | | | 09/01/23 | | | | 26,071 | |
| | 14,448 | | | | 5.500 | | | | 10/01/23 | | | | 15,853 | |
| | 101,885 | | | | 5.000 | | | | 02/01/24 | | | | 109,499 | |
| | 380,407 | | | | 5.500 | | | | 05/01/25 | | | | 396,539 | |
| | 68,905 | | | | 6.000 | | | | 12/01/32 | | | | 79,448 | |
| | |
| | Mortgage-Backed Obligations – (continued) | |
| | FNMA – (continued) | |
| $ | 1,375 | | | | 5.500 | % | | | 03/01/33 | | | $ | 1,549 | |
| | 120,872 | | | | 5.500 | | | | 04/01/33 | | | | 137,513 | |
| | 245 | | | | 6.000 | | | | 05/01/33 | | | | 286 | |
| | 3,549 | | | | 5.000 | | | | 08/01/33 | | | | 3,931 | |
| | 906 | | | | 5.500 | | | | 09/01/33 | | | | 1,023 | |
| | 29,586 | | | | 5.500 | | | | 12/01/33 | | | | 33,447 | |
| | 216 | | | | 6.000 | | | | 12/01/33 | | | | 250 | |
| | 1,137 | | | | 5.500 | | | | 02/01/34 | | | | 1,285 | |
| | 13,985 | | | | 6.000 | | | | 02/01/34 | | | | 16,123 | |
| | 2,581 | | | | 5.500 | | | | 03/01/34 | | | | 2,920 | |
| | 212 | | | | 5.500 | | | | 04/01/34 | | | | 241 | |
| | 6,063 | | | | 5.500 | | | | 09/01/34 | | | | 6,843 | |
| | 2,184 | | | | 5.500 | | | | 10/01/34 | | | | 2,468 | |
| | 8,061 | | | | 5.500 | | | | 12/01/34 | | | | 9,124 | |
| | 43,382 | | | | 5.000 | | | | 04/01/35 | | | | 48,412 | |
| | 163 | | | | 6.000 | | | | 04/01/35 | | | | 188 | |
| | 5,897 | | | | 5.500 | | | | 05/01/35 | | | | 6,646 | |
| | 2,433 | | | | 5.500 | | | | 07/01/35 | | | | 2,750 | |
| | 549,626 | | | | 6.000 | | | | 07/01/35 | | | | 627,058 | |
| | 1,391 | | | | 5.500 | | | | 09/01/35 | | | | 1,583 | |
| | 133,805 | | | | 6.000 | | | | 09/01/35 | | | | 152,655 | |
| | 5,256 | | | | 6.000 | | | | 03/01/36 | | | | 6,057 | |
| | 8,190 | | | | 6.000 | | | | 04/01/36 | | | | 9,416 | |
| | 101 | | | | 5.500 | | | | 02/01/37 | | | | 114 | |
| | 202 | | | | 5.500 | | | | 04/01/37 | | | | 228 | |
| | 63 | | | | 5.500 | | | | 05/01/37 | | | | 71 | |
| | 6,226 | | | | 5.000 | | | | 02/01/38 | | | | 6,884 | |
| | 14,948 | | | | 5.500 | | | | 02/01/38 | | | | 16,798 | |
| | 251 | | | | 5.500 | | | | 03/01/38 | | | | 284 | |
| | 224 | | | | 5.500 | | | | 06/01/38 | | | | 253 | |
| | 223 | | | | 5.500 | | | | 07/01/38 | | | | 252 | |
| | 235 | | | | 5.500 | | | | 08/01/38 | | | | 265 | |
| | 229 | | | | 5.500 | | | | 09/01/38 | | | | 258 | |
| | 206,046 | | | | 6.000 | | | | 11/01/38 | | | | 236,578 | |
| | 63 | | | | 5.500 | | | | 12/01/38 | | | | 71 | |
| | 74,714 | | | | 6.000 | | | | 12/01/38 | | | | 85,725 | |
| | 36,101 | | | | 4.500 | | | | 02/01/39 | | | | 39,278 | |
| | 182,590 | | | | 7.000 | | | | 03/01/39 | | | | 216,578 | |
| | 18,099 | | | | 4.500 | | | | 04/01/39 | | | | 19,985 | |
| | 4,234 | | | | 5.500 | | | | 06/01/39 | | | | 4,786 | |
| | 58,353 | | | | 5.000 | | | | 07/01/39 | | | | 64,539 | |
| | 21,986 | | | | 4.500 | | | | 08/01/39 | | | | 24,301 | |
| | 768,060 | | | | 5.000 | | | | 10/01/39 | | | | 849,474 | |
| | 3,805 | | | | 5.500 | | | | 11/01/39 | | | | 4,296 | |
| | 244,387 | | | | 4.500 | | | | 12/01/39 | | | | 270,124 | |
| | 274,579 | | | | 4.500 | | | | 06/01/40 | | | | 299,453 | |
| | 115,271 | | | | 4.500 | | | | 08/01/41 | | | | 125,952 | |
| | 741,461 | | | | 3.500 | | | | 12/01/41 | | | | 778,822 | |
| | 164,968 | | | | 5.000 | | | | 12/01/41 | | | | 182,793 | |
| | 1,416,790 | | | | 3.500 | | | | 02/01/42 | | | | 1,487,944 | |
| | 1,801,312 | | | | 3.500 | | | | 03/01/42 | | | | 1,891,777 | |
| | 581,272 | | | | 3.500 | | | | 07/01/42 | | | | 610,465 | |
| | 590,701 | | | | 3.500 | | | | 09/01/42 | | | | 620,366 | |
| | 100,226 | | | | 3.000 | | | | 12/01/42 | | | | 103,550 | |
| | 244,528 | | | | 3.000 | | | | 01/01/43 | | | | 252,638 | |
| | 73,981 | | | | 3.000 | | | | 02/01/43 | | | | 76,434 | |
| | |
| | |
| 36 | | The accompanying notes are an integral part of these financial statements. |
GOLDMAN SACHS BOND FUND
| | | | | | | | | | | | | | |
Principal Amount | | | Interest Rate | | | Maturity Date | | | Value | |
| | Mortgage-Backed Obligations – (continued) | |
| | FNMA – (continued) | |
| $ | 252,666 | | | | 3.000 | % | | | 03/01/43 | | | $ | 261,044 | |
| | 554,896 | | | | 3.000 | | | | 04/01/43 | | | | 573,298 | |
| | 288,737 | | | | 3.000 | | | | 05/01/43 | | | | 298,313 | |
| | 78,822 | | | | 3.000 | | | | 06/01/43 | | | | 81,436 | |
| | 702,534 | | | | 3.000 | | | | 07/01/43 | | | | 725,832 | |
| | 1,348,322 | | | | 3.500 | | | | 07/01/43 | | | | 1,414,564 | |
| | 584,881 | | | | 3.500 | | | | 08/01/43 | | | | 613,616 | |
| | 804,722 | | | | 3.500 | | | | 11/01/43 | | | | 845,137 | |
| | 579,965 | | | | 5.000 | | | | 11/01/43 | | | | 641,026 | |
| | 86,851 | | | | 5.000 | | | | 06/01/44 | | | | 96,086 | |
| | 56,324 | | | | 3.500 | | | | 02/01/45 | | | | 59,099 | |
| | 37,230 | | | | 3.500 | | | | 03/01/45 | | | | 39,064 | |
| | 848,846 | | | | 3.000 | | | | 04/01/45 | | | | 873,151 | |
| | 8,288,777 | | | | 3.500 | | | | 11/01/45 | | | | 8,701,921 | |
| | 26,867,353 | | | | 3.500 | | | | 01/01/46 | | | | 28,208,623 | |
| | 10,057,141 | | | | 3.500 | | | | 02/01/46 | | | | 10,559,213 | |
| | 31,000,000 | | | | 3.000 | | | | TBA-30yr | (e) | | | 31,801,641 | |
| | 6,000,000 | | | | 4.000 | | | | TBA-30yr | (e) | | | 6,412,031 | |
| | | | | | | | | | | | | | |
| | | | | | | | | | | | | 104,680,382 | |
| | |
| | GNMA – 11.9% | |
| | 183,210 | | | | 3.950 | | | | 07/15/25 | | | | 203,858 | |
| | 82,002 | | | | 5.500 | | | | 11/15/32 | | | | 93,674 | |
| | 45,867 | | | | 5.500 | | | | 01/15/33 | | | | 52,601 | |
| | 74,322 | | | | 5.500 | | | | 02/15/33 | | | | 85,234 | |
| | 90,292 | | | | 5.500 | | | | 03/15/33 | | | | 103,548 | |
| | 73,668 | | | | 5.500 | | | | 07/15/33 | | | | 83,543 | |
| | 41,874 | | | | 5.500 | | | | 08/15/33 | | | | 48,022 | |
| | 32,239 | | | | 5.500 | | | | 09/15/33 | | | | 36,972 | |
| | 42,644 | | | | 5.500 | | | | 04/15/34 | | | | 48,809 | |
| | 44,462 | | | | 5.500 | | | | 05/15/34 | | | | 50,890 | |
| | 385,564 | | | | 5.500 | | | | 09/15/34 | | | | 441,309 | |
| | 326,503 | | | | 5.500 | | | | 12/15/34 | | | | 373,709 | |
| | 316,493 | | | | 5.500 | | | | 01/15/35 | | | | 359,558 | |
| | 2,116 | | | | 5.500 | | | | 05/15/36 | | | | 2,404 | |
| | 37,478 | | | | 5.000 | | | | 11/15/40 | | | | 41,873 | |
| | 77,273 | | | | 4.000 | | | | 08/20/43 | | | | 82,761 | |
| | 1,958,032 | | | | 4.000 | | | | 10/20/43 | | | | 2,094,635 | |
| | 2,336,516 | | | | 4.000 | | | | 10/20/45 | | | | 2,501,533 | |
| | 1,000,000 | | | | 3.000 | | | | TBA-30yr | (e) | | | 1,033,984 | |
| | 46,000,000 | | | | 4.000 | | | | TBA-30yr | (e) | | | 49,187,657 | |
| | | | | | | | | | | | | | |
| | | | | | | | | | | | | 56,926,574 | |
| | |
| | TOTAL FEDERAL AGENCIES | | | $ | 164,797,252 | |
| | |
| | TOTAL MORTGAGE-BACKED OBLIGATIONS | |
| | (Cost $185,806,323) | | | $ | 187,673,900 | |
| | |
| | | | | | | | | | | | | | |
| | Agency Debentures – 1.2% | |
| FHLB | |
| $ | 2,400,000 | | | | 4.625 | % | | | 09/11/20 | | | $ | 2,730,734 | |
| | 400,000 | | | | 5.375 | | | | 08/15/24 | | | | 500,008 | |
| FNMA | |
| | 800,000 | | | | 6.250 | | | | 05/15/29 | | | | 1,142,304 | |
| | |
| | Agency Debentures – (continued) | |
| Tennessee Valley Authority | |
| $ | 1,200,000 | | | | 3.875 | % | | | 02/15/21 | | | $ | 1,335,604 | |
| | |
| | TOTAL AGENCY DEBENTURES | |
| | (Cost $5,179,194) | | | $ | 5,708,650 | |
| | |
| | | | | | | | | | | | | | |
| | Asset-Backed Securities – 9.6% | |
| | Collateralized Loan Obligations – 6.9% | |
| ACIS CLO Ltd. Series 2013-1A, Class ACOM(b)(c) | |
| $ | 4,000,000 | | | | 1.543 | % | | | 04/18/24 | | | $ | 3,804,800 | |
| ACIS CLO Ltd. Series 2013-2A, Class A(b)(c) | |
| | 287,744 | | | | 0.821 | | | | 10/14/22 | | | | 283,430 | |
| ACIS CLO Ltd. Series 2013-2A, Class ACOM(b)(c) | |
| | 2,084,210 | | | | 1.019 | | | | 10/14/22 | | | | 2,034,606 | |
| Crown Point CLO lll Ltd. Series 2015-3A, Class ACOM(b)(c) | |
| | 3,900,000 | | | | 0.000 | | | | 12/31/27 | | | | 3,797,040 | |
| Crown Point CLO Ltd. Series 2012-1A, Class ACOM(b)(c) | |
| | 917,897 | | | | 0.000 | | | | 11/21/22 | | | | 906,790 | |
| Duane Street CLO IV Ltd. Series 2007-4A, Class A1R(b)(c) | |
| | 2,683,103 | | | | 0.622 | | | | 11/14/21 | | | | 2,626,618 | |
| Golub Capital Management CLO Ltd. Series 2007-1A,
Class A(b)(c) |
|
| | 159,512 | | | | 0.856 | | | | 07/31/21 | | | | 158,374 | |
| Greywolf CLO V Ltd. Series 2015-1A, Class A1(b)(c) | |
| | 1,450,000 | | | | 1.920 | | | | 04/25/27 | | | | 1,444,557 | |
| Halcyon Loan Advisors Funding Ltd. Series 2015-1A,
Class A(b)(c) |
|
| | 1,700,000 | | | | 1.767 | | | | 04/20/27 | | | | 1,661,583 | |
| Halcyon Loan Advisors Funding Ltd. Series 2015-2A,
Class A(b)(c) |
|
| | 2,300,000 | | | | 1.720 | | | | 07/25/27 | | | | 2,232,272 | |
| NewMark Capital Funding CLO Ltd. Series 2013-1A,
Class A2(b)(c) |
|
| | 2,500,000 | | | | 1.536 | | | | 06/02/25 | | | | 2,437,220 | |
| OCP CLO Ltd. Series 2012-2A, Class ACOM(b)(c) | |
| | 2,069,639 | | | | 0.000 | | | | 11/22/23 | | | | 2,039,422 | |
| OFSI Fund V Ltd. Series 2013-5A, Class ACOM(c) | |
| | 1,650,000 | | | | 1.618 | | | | 04/17/25 | | | | 1,596,540 | |
| Red River CLO Ltd. Series 1A, Class A(b)(c) | |
| | 328,679 | | | | 0.599 | | | | 07/27/18 | | | | 327,587 | |
| Regatta IV Funding Ltd. Series 2014-1A, Class A1(b)(c) | |
| | 1,538,552 | | | | 1.730 | | | | 07/25/26 | | | | 1,519,439 | |
| Regatta IV Funding Ltd. Series 2014-1A, Class B(b)(c) | |
| | 311,448 | | | | 2.330 | | | | 07/25/26 | | | | 300,202 | |
| Sound Point CLO Vlll Ltd. Series 2015-1A, Class B(b)(c) | |
| | 700,000 | | | | 2.371 | | | | 04/15/27 | | | | 658,243 | |
| SPS Servicer Advance Receivables Trust Series 2015-T2,
Class AT2(c) |
|
| | 1,800,000 | | | | 2.620 | | | | 01/15/47 | | | | 1,800,394 | |
| Westchester CLO Ltd. Series 2007-1X, Class A1A(b) | |
| | 3,508,991 | | | | 0.554 | | | | 08/01/22 | | | | 3,464,736 | |
| | | | | | | | | | | | | | |
| | | | | | | | | | | | | 33,093,853 | |
| | |
| | |
| The accompanying notes are an integral part of these financial statements. | | 37 |
GOLDMAN SACHS BOND FUND
Schedule of Investments (continued)
March 31, 2016
| | | | | | | | | | | | | | |
Principal Amount | | | Interest Rate | | | Maturity Date | | | Value | |
| | Asset-Backed Securities – (continued) | |
| | Home Equity – 0.5% | |
| Bayview Opportunity Master Fund IIIb RPL Trust Series 2015-3,
Class A1(c)(f) |
|
| $ | 134,736 | | | | 3.623 | % | | | 04/28/30 | | | $ | 134,727 | |
| Bear Stearns Asset Backed Securities Trust Series 2001-3,
Class A2(b) |
|
| | 7,141 | | | | 1.233 | | | | 10/27/32 | | | | 6,481 | |
| Bear Stearns Asset Backed Securities Trust Series 2002-2,
Class A1(b) |
|
| | 3,823 | | | | 1.096 | | | | 10/25/32 | | | | 3,671 | |
| Bear Stearns Asset Backed Securities Trust Series 2005-SD4,
Class 2A1(b) |
|
| | 44,908 | | | | 1.236 | | | | 12/25/42 | | | | 44,907 | |
| CS First Boston Mortgage Securities Corp. Series 2001-HE17,
Class A1(b) |
|
| | 1,425 | | | | 1.056 | | | | 01/25/32 | | | | 1,179 | |
| GMAC Mortgage Corp. Loan Trust Series 2007-HE3,
Class 1A1(b) |
|
| | 78,618 | | | | 7.000 | | | | 09/25/37 | | | | 78,000 | |
| GMAC Mortgage Corp. Loan Trust Series 2007-HE3,
Class 2A1(b) |
|
| | 41,511 | | | | 7.000 | | | | 09/25/37 | | | | 41,518 | |
| GSAMP Trust Series 2006-HE8, Class A2C(b) | |
| | 1,330,380 | | | | 0.606 | | | | 01/25/37 | | | | 1,041,091 | |
| Home Equity Asset Trust Series 2002-1, Class A4(b) | |
| | 257 | | | | 1.036 | | | | 11/25/32 | | | | 209 | |
| Home Equity Loan Trust Series 2007-FRE1, Class 2AV3(b) | |
| | 1,400,000 | | | | 0.666 | | | | 04/25/37 | | | | 846,097 | |
| Renaissance Home Equity Loan Trust Series 2003-2, Class A(b) | |
| | 1,069 | | | | 1.316 | | | | 08/25/33 | | | | 956 | |
| Renaissance Home Equity Loan Trust Series 2003-3, Class A(b) | |
| | 3,933 | | | | 0.936 | | | | 12/25/33 | | | | 3,724 | |
| | | | | | | | | | | | | | |
| | | | | | | | | | | | | 2,202,560 | |
| | |
| | Student Loan(b) – 2.2% | |
| Edsouth Indenture No. 9 LLC Series 2015-1, Class A(c) | |
| | 1,916,438 | | | | 1.233 | | | | 10/25/56 | | | | 1,833,609 | |
| Scholar Funding Trust Series 2010-A, Class A(c) | |
| | 723,282 | | | | 1.371 | | | | 10/28/41 | | | | 672,983 | |
| SLM Student Loan Trust Series 2005-4, Class A3 | |
| | 493,873 | | | | 0.739 | | | | 01/25/27 | | | | 463,466 | |
| SLM Student Loan Trust Series 2005-5, Class A4 | |
| | 1,650,000 | | | | 0.759 | | | | 10/25/28 | | | | 1,552,069 | |
| SLM Student Loan Trust Series 2006-10, Class A5A | |
| | 1,507,484 | | | | 0.719 | | | | 04/25/27 | | | | 1,471,217 | |
| SLM Student Loan Trust Series 2006-2, Class A5 | |
| | 3,530,487 | | | | 0.729 | | | | 07/25/25 | | | | 3,482,008 | |
| SLM Student Loan Trust Series 2008-2, Class A3 | |
| | 381,076 | | | | 1.369 | | | | 04/25/23 | | | | 365,218 | |
| SLM Student Loan Trust Series 2008-4, Class A4 | |
| | 850,000 | | | | 2.269 | | | | 07/25/22 | | | | 851,008 | |
| | | | | | | | | | | | | | |
| | | | | | | | | | | | | 10,691,578 | |
| | |
| | TOTAL ASSET-BACKED SECURITIES | |
| | (Cost $45,915,120) | | | $ | 45,987,991 | |
| | |
| | | | | | | | | | | | | | |
| | Foreign Debt Obligations – 4.9% | |
| | Sovereign – 4.7% | |
| Dominican Republic | |
| DOP | 100,000 | | | | 10.375 | % | | | 03/04/22 | | | $ | 2,191 | |
| | 300,000 | | | | 14.500 | | | | 02/10/23 | | | | 7,466 | |
| $ | 280,000 | | | | 6.600 | (c) | | | 01/28/24 | | | | 296,800 | |
| | 210,000 | | | | 6.600 | | | | 01/28/24 | | | | 222,600 | |
| | 360,000 | | | | 6.875 | (c) | | | 01/29/26 | | | | 381,600 | |
| | 191,000 | | | | 8.625 | | | | 04/20/27 | | | | 217,740 | |
| DOP | 100,000 | | | | 11.375 | | | | 07/06/29 | | | | 2,233 | |
| $ | 450,000 | | | | 6.850 | | | | 01/27/45 | | | | 441,000 | |
| Italy Buoni Poliennali Del Tesoro | |
| EUR | 2,726,725 | | | | 2.350 | | | | 09/15/19 | | | | 3,412,108 | |
| Japan Treasury Discount Bill(g) | |
| JPY | 930,000,000 | | | | 0.000 | | | | 04/18/16 | | | | 8,263,361 | |
| Republic of Colombia | |
| $ | 500,000 | | | | 8.125 | | | | 05/21/24 | | | | 626,250 | |
| | 260,000 | | | | 4.500 | | | | 01/28/26 | | | | 265,850 | |
| Republic of Croatia | |
| EUR | 150,000 | | | | 3.875 | | | | 05/30/22 | | | | 174,739 | |
| Republic of Indonesia | |
| $ | 320,000 | | | | 4.125 | (c) | | | 01/15/25 | | | | 321,600 | |
| | 1,060,000 | | | | 4.750 | (c) | | | 01/08/26 | | | | 1,110,350 | |
| | 220,000 | | | | 7.750 | | | | 01/17/38 | | | | 282,700 | |
| Republic of South Africa | |
| | 200,000 | | | | 5.875 | | | | 09/16/25 | | | | 217,000 | |
| Republic of Turkey | |
| | 500,000 | | | | 5.750 | | | | 03/22/24 | | | | 540,625 | |
| Republic of Venezuela | |
| | 270,000 | | | | 7.750 | | | | 10/13/19 | | | | 101,250 | |
| | 60,000 | | | | 6.000 | | | | 12/09/20 | | | | 20,100 | |
| | 50,000 | | | | 12.750 | | | | 08/23/22 | | | | 21,500 | |
| | 20,000 | | | | 9.000 | | | | 05/07/23 | | | | 7,000 | |
| | 300,000 | | | | 8.250 | | | | 10/13/24 | | | | 102,000 | |
| | 60,000 | | | | 11.750 | | | | 10/21/26 | | | | 23,550 | |
| | 40,000 | | | | 9.250 | | | | 09/15/27 | | | | 16,000 | |
| | 400,000 | | | | 9.250 | | | | 05/07/28 | | | | 141,000 | |
| | 130,000 | | | | 11.950 | | | | 08/05/31 | | | | 51,350 | |
| | 90,000 | | | | 9.375 | | | | 01/13/34 | | | | 31,725 | |
| Spain Government Inflation Linked Bond(c) | |
| EUR | 2,279,069 | | | | 0.550 | | | | 11/30/19 | | | | 2,689,306 | |
| United Mexican States | |
| MXN | 2,128,400 | | | | 6.500 | | | | 06/10/21 | | | | 129,390 | |
| $ | 530,000 | | | | 3.625 | | | | 03/15/22 | | | | 547,225 | |
| MXN | 186,400 | | | | 8.000 | | | | 12/07/23 | | | | 12,276 | |
| | 4,356,000 | | | | 7.500 | | | | 06/03/27 | | | | 279,622 | |
| | 1,065,300 | | | | 8.500 | | | | 05/31/29 | | | | 73,741 | |
| | 3,616,300 | | | | 7.750 | | | | 11/23/34 | | | | 235,475 | |
| $ | 20,000 | | | | 6.050 | | | | 01/11/40 | | | | 23,450 | |
| | 700,000 | | | | 4.750 | | | | 03/08/44 | | | | 700,000 | |
| | 90,000 | | | | 5.550 | | | | 01/21/45 | | | | 99,675 | |
| | 480,000 | | | | 4.600 | | | | 01/23/46 | | | | 470,400 | |
| | | | | | | | | | | | | | |
| | | | | | | | | | | | | 22,562,248 | |
| | |
| | |
| 38 | | The accompanying notes are an integral part of these financial statements. |
GOLDMAN SACHS BOND FUND
| | | | | | | | | | | | | | |
Principal Amount | | | Interest Rate | | | Maturity Date | | | Value | |
| | Foreign Debt Obligations – (continued) | |
| | Supranational – 0.2% | |
| Inter-American Development Bank | |
| $ | 700,000 | | | | 1.000 | % | | | 02/27/18 | | | $ | 696,235 | |
| | |
| | TOTAL FOREIGN DEBT OBLIGATIONS | |
| | (Cost $22,831,627) | | | $ | 23,258,483 | |
| | |
| | | | | | | | | | | | | | |
| | Structured Note – 0.2% | |
| Notas do Tesouro Nacional Series B (Issuer HSBC Corp.) | |
| BRL | 4,674,294 | | | | 6.000 | % | | | 08/15/40 | | | $ | 1,222,447 | |
| | (Cost $2,548,010) | | | | | | | | | | | | | |
| | |
| | | | | | | | | | | | | | |
| | Municipal Debt Obligations – 1.3% | |
| | California – 0.5% | |
| California State GO Bonds Build America Taxable Series 2009 | |
| $ | 210,000 | | | | 7.550 | % | | | 04/01/39 | | | $ | 321,519 | |
| California State GO Bonds Build America Taxable Series 2010 | |
| | 625,000 | | | | 7.950 | | | | 03/01/36 | | | | 756,231 | |
| East Bay Municipal Utility Disrtict Water System RB Build
America SubSeries 2010 |
|
| | 900,000 | | | | 5.874 | | | | 06/01/40 | | | | 1,174,869 | |
| | | | | | | | | | | | | | |
| | | | | | | | | | | | | 2,252,619 | |
| | |
| | Illinois – 0.1% | |
| Illinois State GO Bonds Build America Series 2010 | |
| | 500,000 | | | | 7.350 | | | | 07/01/35 | | | | 546,280 | |
| Illinois State GO Bonds Taxable-Pension Series 2003 | |
| | 115,000 | | | | 5.100 | | | | 06/01/33 | | | | 107,542 | |
| | | | | | | | | | | | | | |
| | | | | | | | | | | | | 653,822 | |
| | |
| | Ohio – 0.1% | |
| American Municipal Power-Ohio, Inc. RB Build America
Taxable Series 2010 |
|
| | 250,000 | | | | 6.270 | | | | 02/15/50 | | | | 302,873 | |
| | |
| | Puerto Rico – 0.6% | |
| Puerto Rico Commonwealth Aqueduct & Sewer Authority RB
(Senior Lien) Series 2008 A |
|
| | 85,000 | | | | 6.000 | | | | 07/01/38 | | | | 57,163 | |
| | 45,000 | | | | 6.000 | | | | 07/01/44 | | | | 30,150 | |
| Puerto Rico Commonwealth Aqueduct & Sewer Authority RB
(Senior Lien) Series 2012 A |
|
| | 120,000 | | | | 5.500 | | | | 07/01/28 | | | | 79,800 | |
| | 20,000 | | | | 5.750 | | | | 07/01/37 | | | | 13,300 | |
| | 35,000 | | | | 6.000 | | | | 07/01/47 | | | | 23,363 | |
| Puerto Rico Commonwealth Aqueduct & Sewer Authority RB
(Senior Lien) Series 2012 D |
|
| | 50,000 | | | | 5.000 | | | | 07/01/33 | | | | 32,375 | |
| Puerto Rico Commonwealth GO Bonds for Public Improvement
Series 2011 A |
|
| | 10,000 | | | | 5.750 | | | | 07/01/41 | | | | 5,975 | |
| Puerto Rico Commonwealth GO Bonds Refunding for Public
Improvement Series 2008 A |
|
| | 15,000 | | | | 5.500 | | | | 07/01/32 | | | | 8,925 | |
| | |
| | Municipal Debt Obligations – (continued) | |
| | Puerto Rico – (continued) | |
| Puerto Rico Commonwealth GO Bonds Refunding for Public
Improvement Series 2009 B |
|
| $ | 10,000 | | | | 5.750 | % | | | 07/01/38 | | | $ | 5,975 | |
| Puerto Rico Commonwealth GO Bonds Refunding for Public
Improvement Series 2012 A |
|
| | 1,060,000 | | | | 5.750 | | | | 07/01/28 | | | | 638,650 | |
| | 170,000 | | | | 5.000 | | | | 07/01/41 | | | | 100,725 | |
| Puerto Rico Commonwealth GO Bonds Series 2007 A | |
| | 15,000 | | | | 5.250 | | | | 07/01/37 | | | | 8,906 | |
| Puerto Rico Commonwealth GO Bonds Series 2014 A | |
| | 595,000 | | | | 8.000 | | | | 07/01/35 | | | | 409,062 | |
| Puerto Rico Commonwealth GO Bonds Unrefunded Balance for
Public Improvement Series 2006 A |
|
| | 10,000 | | | | 5.250 | | | | 07/01/27 | | | | 6,000 | |
| Puerto Rico Sales Tax Financing Corp. Sales Tax RB Capital
Appreciation SubSeries 2010 C(g) |
|
| | 15,000 | | | | 0.000 | | | | 08/01/37 | | | | 1,415 | |
| | 15,000 | | | | 0.000 | | | | 08/01/38 | | | | 1,326 | |
| Puerto Rico Sales Tax Financing Corp. Sales Tax RB
SubSeries 2009 A |
|
| | 105,000 | | | | 5.250 | | | | 08/01/27 | | | | 43,050 | |
| | 325,000 | | | | 0.000 | (g) | | | 08/01/32 | | | | 125,947 | |
| | 95,000 | | | | 5.750 | | | | 08/01/37 | | | | 39,663 | |
| | 15,000 | | | | 6.375 | | | | 08/01/39 | | | | 6,394 | |
| | 270,000 | | | | 6.000 | | | | 08/01/42 | | | | 114,075 | |
| Puerto Rico Sales Tax Financing Corp. Sales Tax RB
SubSeries 2010 A |
|
| | 50,000 | | | | 0.000 | (g) | | | 08/01/33 | | | | 13,270 | |
| | 80,000 | | | | 5.500 | | | | 08/01/37 | | | | 33,000 | |
| | 75,000 | | | | 5.375 | | | | 08/01/39 | | | | 30,750 | |
| | 595,000 | | | | 5.500 | | | | 08/01/42 | | | | 245,437 | |
| Puerto Rico Sales Tax Financing Corp. Sales Tax RB
SubSeries 2010 C |
|
| | 150,000 | | | | 5.375 | | | | 08/01/36 | | | | 61,500 | |
| | 15,000 | | | | 5.375 | | | | 08/01/38 | | | | 6,150 | |
| | 290,000 | | | | 6.000 | | | | 08/01/39 | | | | 122,525 | |
| | 935,000 | | | | 5.250 | | | | 08/01/41 | | | | 381,012 | |
| Puerto Rico Sales Tax Financing Corp. Sales Tax RB
SubSeries 2011 A-1 |
|
| | 370,000 | | | | 5.000 | | | | 08/01/43 | | | | 148,925 | |
| | 50,000 | | | | 5.250 | | | | 08/01/43 | | | | 20,375 | |
| Puerto Rico Sales Tax Financing Corp. Sales Tax RB Unrefunded
SubSeries 2009 A |
|
| | 130,000 | | | | 5.500 | | | | 08/01/28 | | | | 53,950 | |
| | | | | | | | | | | | | | |
| | | | | | | | | | | | | 2,869,133 | |
| | |
| | TOTAL MUNICIPAL DEBT OBLIGATIONS | |
| | (Cost $6,733,851) | | | $ | 6,078,447 | |
| | |
| | | | | | | | | | | | | | |
| | Government Guarantee Obligations(h) – 1.1% | |
| Hashemite Kingdom of Jordan Government AID Bond | |
| $ | 1,600,000 | | | | 2.503 | % | | | 10/30/20 | | | $ | 1,669,021 | |
| | |
| | |
| The accompanying notes are an integral part of these financial statements. | | 39 |
GOLDMAN SACHS BOND FUND
Schedule of Investments (continued)
March 31, 2016
| | | | | | | | | | | | | | |
Principal Amount | | | Interest Rate | | | Maturity Date | | | Value | |
| | Government Guarantee Obligations(h) – (continued) | |
| Israel Government AID Bond | |
| $ | 2,000,000 | | | | 5.500 | % | | | 09/18/23 | | | $ | 2,492,473 | |
| | 300,000 | | | | 5.500 | | | | 12/04/23 | | | | 375,366 | |
| | 650,000 | | | | 5.500 | | | | 04/26/24 | | | | 814,888 | |
| | 40,000 | | | | 5.500 | | | | 09/18/33 | | | | 54,495 | |
| | |
| TOTAL GOVERNMENT GUARANTEE
OBLIGATIONS |
| | | | |
| | (Cost $5,209,428) | | | $ | 5,406,243 | |
| | |
| | | | | | | | | | | | | | |
| | U.S. Treasury Obligations – 16.7% | |
| United States Treasury Bonds | |
| $ | 9,000,000 | | | | 3.750 | %(i) | | | 11/15/43 | | | $ | 11,185,020 | |
| | 4,800,000 | | | | 3.625 | (i) | | | 02/15/44 | | | | 5,825,904 | |
| | 2,080,000 | | | | 3.000 | | | | 11/15/44 | | | | 2,245,193 | |
| | 100,000 | | | | 2.875 | | | | 08/15/45 | | | | 105,233 | |
| | 4,800,000 | | | | 3.000 | (i) | | | 11/15/45 | | | | 5,184,336 | |
| United States Treasury Inflation Protected Securities | |
| | 1,355,939 | | | | 0.125 | | | | 04/15/17 | | | | 1,371,614 | |
| | 1,844,730 | | | | 0.125 | | | | 04/15/18 | | | | 1,878,157 | |
| | 1,360,697 | | | | 0.125 | | | | 01/15/22 | | | | 1,382,591 | |
| | 513,175 | | | | 0.125 | | | | 01/15/23 | | | | 517,983 | |
| | 3,588,380 | | | | 0.375 | | | | 07/15/23 | | | | 3,699,942 | |
| | 3,685,575 | | | | 0.625 | | | | 01/15/24 | | | | 3,841,623 | |
| | 937,857 | | | | 0.125 | | | | 07/15/24 | | | | 942,255 | |
| | 882,736 | | | | 2.500 | | | | 01/15/29 | | | | 1,110,870 | |
| | 712,446 | | | | 2.125 | | | | 02/15/40 | | | | 912,486 | |
| | 1,067,325 | | | | 1.375 | | | | 02/15/44 | | | | 1,198,574 | |
| United States Treasury Notes | |
| | 5,400,000 | | | | 0.750 | | | | 01/31/18 | | | | 5,401,512 | |
| | 6,600,000 | | | | 1.625 | | | | 06/30/20 | | | | 6,731,868 | |
| | 4,300,000 | | | | 1.625 | | | | 07/31/20 | | | | 4,385,656 | |
| | 15,100,000 | | | | 1.500 | | | | 02/28/23 | | | | 15,060,136 | |
| | 6,500,000 | | | | 1.500 | | | | 03/31/23 | | | | 6,479,200 | |
| | |
| | TOTAL U.S. TREASURY OBLIGATIONS | |
| | (Cost $76,559,189) | | | $ | 79,460,153 | |
| | |
| | | | | | | | |
| Shares | | Rate | | | Value | |
| Investment Company(b)(j) – 12.4% | |
Goldman Sachs Financial Square Government Fund – FST Institutional Shares | |
| 58,985,636 | | | 0.250 | % | | $ | 58,985,636 | |
| (Cost $58,985,636) | | | | | |
| |
TOTAL INVESTMENTS BEFORE
SHORT-TERM INVESTMENT | |
| (Cost $531,409,466) | | | $ | 536,110,651 | |
| |
| | | | | | | | | | | | | | |
Principal Amount | | | Interest
Rate | | | Maturity
Date | | | Value | |
| | Short-term Investments – 2.8% | |
| | Commercial Paper – 2.8% | |
| AutoZone, Inc.(g) | |
| $ | 2,200,000 | | | | 0.000 | % | | | 04/08/16 | | | $ | 2,199,705 | |
| Barclays Bank PLC | |
| | 3,250,000 | | | | 1.222 | | | | 04/13/16 | | | | 3,250,000 | |
| Bayer Corp.(g) | |
| | 1,800,000 | | | | 0.000 | | | | 04/05/16 | | | | 1,799,872 | |
| Southern Co.(g) | |
| | 1,800,000 | | | | 0.000 | | | | 04/21/16 | | | | 1,799,190 | |
| | 2,200,000 | | | | 0.000 | | | | 04/01/16 | | | | 2,200,000 | |
| United Healthcare Co. | |
| | 2,000,000 | | | | 0.864 | | | | 05/09/16 | | | | 1,998,205 | |
| | |
| | TOTAL SHORT-TERM INVESTMENTS | |
| | (Cost $13,246,972) | | | $ | 13,246,972 | |
| | |
| | TOTAL INVESTMENTS – 115.3% | |
| | (Cost $544,656,438) | | | $ | 549,357,623 | |
| | |
| LIABILITIES IN EXCESS OF
OTHER ASSETS – (15.3)% |
| | | (73,007,780 | ) |
| | |
| | NET ASSETS – 100.0% | | | $ | 476,349,843 | |
| | |
| | |
| The percentage shown for each investment category reflects the value of investments in that category as a percentage of net assets. |
(a) | | Security with “Call” features with resetting interest rates. Maturity dates disclosed are the final maturity dates. |
(b) | | Variable rate security. Interest rate or distribution rate disclosed is that which is in effect on March 31, 2016. |
(c) | | Exempt from registration under Rule 144A of the Securities Act of 1933. Such securities may be deemed liquid by the investment adviser and may be resold, normally to qualified institutional buyers in transactions exempt from registration. Total market value of Rule 144A securities amounts to $69,768,343, which represents approximately 14.7% of net assets as of March 31, 2016. |
(d) | | Security with a notional or nominal principal amount. The actual effective yield of this security is different than the stated interest rate. |
(e) | | TBA (To Be Announced) Securities are purchased on a forward commitment basis with an approximate principal amount and no defined maturity date. The actual principal and maturity date will be determined upon settlement when the specific mortgage pools are assigned. Total market value of TBA securities (excluding forward sales contracts, if any) amounts to $88,435,313 which represents approximately 18.6% of net assets as of March 31, 2016. |
(f) | | Coupon changes periodically based upon a predetermined schedule. Interest rate disclosed is that which is in effect on March 31, 2016. |
(g) | | Issued with a zero coupon. Income is recognized through the accretion of discount. |
(h) | | Guaranteed by the United States Government until maturity. Total market value for these securities amounts to $5,406,243, which represents approximately 1.1% of net assets as of March 31, 2016. |
(i) | | All or a portion of security is segregated as collateral for initial margin requirements on futures transactions. |
(j) | | Represents an affiliated fund. |
| | |
| 40 | | The accompanying notes are an integral part of these financial statements. |
GOLDMAN SACHS BOND FUND
| | |
|
Currency Abbreviations: |
AED | | —United Arab Emirates Dirham |
AUD | | —Australian Dollar |
BRL | | —Brazilian Real |
CAD | | —Canadian Dollar |
CHF | | —Swiss Franc |
CNH | | —Chinese Yuan Renminbi Offshore |
CNY | | —Chinese Yuan Renminbi |
COP | | —Colombian Peso |
DOP | | —Dominican Peso |
EUR | | —Euro |
GBP | | —British Pound |
HKD | | —Hong Kong Dollar |
HUF | | —Hungarian Forint |
IDR | | —Indonesian Rupiah |
INR | | —Indian Rupee |
JPY | | —Japanese Yen |
KRW | | —South Korean Won |
MXN | | —Mexican Peso |
MYR | | —Malaysian Ringgit |
NOK | | —Norwegian Krone |
NZD | | —New Zealand Dollar |
PLN | | —Polish Zloty |
RUB | | —Russian Ruble |
SEK | | —Swedish Krona |
SGD | | —Singapore Dollar |
THB | | —Thai Baht |
TRY | | —Turkish Lira |
TWD | | —Taiwan Dollar |
USD | | —U.S. Dollar |
ZAR | | —South African Rand |
|
|
Investment Abbreviations: |
AUDOR | | —Australian Dollar Offered Rate |
CDOR | | —Canadian Dollar Offered Rate |
CLO | | —Collateralized Loan Obligation |
EURO | | —Euro Offered Rate |
FHLB | | —Federal Home Loan Bank |
FHLMC | | —Federal Home Loan Mortgage Corp. |
FNMA | | —Federal National Mortgage Association |
FREMF | | —Freddie Mac Multi Family |
GMAC | | —General Motors Acceptance Corporation |
GNMA | | —Government National Mortgage Association |
GO | | —General Obligation |
JIBAR | | —Johannesburg Interbank Agreed Rate |
JYOR | | —Japanese Yen Offered Rate |
KLIBOR | | —Kuala Lumpur Interbank Offered Rate |
KWCDC | | —South Korean Won Certificate of Deposit |
LIBOR | | —London Interbank Offered Rate |
LLC | | —Limited Liability Company |
LP | | —Limited Partnership |
NCUA | | —National Credit Union Administration |
NIBOR | | —Norwegian Interbank Offered Rate |
NZDOR | | —New Zealand Dollar Offered Rate |
RB | | —Revenue Bond |
REIT | | —Real Estate Investment Trust |
REMIC | | —Real Estate Mortgage Investment Conduit |
STIBOR | | —Stockholm Interbank Offered Rate |
STRIPS | | —Separate Trading of Registered Interest and Principal of Securities |
SPA | | —Stand-by Purchase Agreement |
TIIE | | —La Tasa de Interbank Equilibrium Interest Rate |
WIBOR | | —Warsaw Interbank Offered Rate |
|
|
| ADDITIONAL INVESTMENT INFORMATION |
FORWARD FOREIGN CURRENCY EXCHANGE CONTRACTS — At March 31, 2016, the Fund had the following forward foreign currency exchange contracts:
FORWARD FOREIGN CURRENCY EXCHANGE CONTRACTS WITH UNREALIZED GAIN
| | | | | | | | | | | | | | | | | | | | | | | | |
| Counterparty | | Currency Purchased | | | Currency Sold | | | Current Value | | | Settlement Date | | | Unrealized Gain | |
Bank of America Securities LLC | | AUD | | | 129,719 | | | USD | | | 97,098 | | | $ | 99,308 | | | | 04/28/16 | | | $ | 2,209 | |
| | BRL | | | 2,381,388 | | | USD | | | 649,000 | | | | 661,509 | | | | 04/04/16 | | | | 12,509 | |
| | CAD | | | 965,842 | | | USD | | | 694,120 | | | | 743,685 | | | | 04/06/16 | | | | 49,565 | |
| | HUF | | | 120,071,386 | | | EUR | | | 382,000 | | | | 435,035 | | | | 04/26/16 | | | | 19 | |
| | JPY | | | 769,158,394 | | | USD | | | 6,788,430 | | | | 6,839,734 | | | | 04/26/16 | | | | 51,303 | |
| | NZD | | | 2,427,000 | | | USD | | | 1,618,338 | | | | 1,675,227 | | | | 04/26/16 | | | | 56,889 | |
| | PLN | | | 3,184,986 | | | EUR | | | 739,000 | | | | 853,238 | | | | 04/26/16 | | | | 11,676 | |
| | RUB | | | 61,668,563 | | | USD | | | 827,000 | | | | 916,827 | | | | 04/04/16 | | | | 89,827 | |
| | SEK | | | 44,240,621 | | | EUR | | | 4,743,807 | | | | 5,454,524 | | | | 04/26/16 | | | | 52,344 | |
Barclays Bank PLC | | AUD | | | 1,653,000 | | | USD | | | 1,245,124 | | | | 1,265,590 | | | | 04/26/16 | | | | 20,466 | |
| | CAD | | | 552,987 | | | USD | | | 423,000 | | | | 425,802 | | | | 04/26/16 | | | | 2,802 | |
| | CNH | | | 2,494,570 | | | USD | | | 363,764 | | | | 383,005 | | | | 09/01/16 | | | | 19,241 | |
| | CNY | | | 698,756 | | | USD | | | 105,792 | | | | 107,850 | | | | 05/19/16 | | | | 2,058 | |
| | CNY | | | 2,659,920 | | | USD | | | 392,840 | | | | 408,444 | | | | 08/05/16 | | | | 15,604 | |
| | CNY | | | 3,283,331 | | | USD | | | 487,720 | | | | 503,798 | | | | 08/16/16 | | | | 16,078 | |
| | EUR | | | 738,000 | | | GBP | | | 578,161 | | | | 840,424 | | | | 04/26/16 | | | | 9,975 | |
| | EUR | | | 667,613 | | | SEK | | | 6,155,722 | | | | 760,268 | | | | 04/26/16 | | | | 1,315 | |
| | INR | | | 27,557,414 | | | USD | | | 399,000 | | | | 415,616 | | | | 04/07/16 | | | | 16,616 | |
| | INR | | | 27,406,015 | | | USD | | | 406,000 | | | | 412,663 | | | | 04/18/16 | | | | 6,663 | |
| | |
| The accompanying notes are an integral part of these financial statements. | | 41 |
GOLDMAN SACHS BOND FUND
Schedule of Investments (continued)
March 31, 2016
|
| ADDITIONAL INVESTMENT INFORMATION (continued) |
| | | | | | | | | | | | | | | | | | | | | | | | |
| Counterparty | | Currency Purchased | | | Currency Sold | | | Current Value | | | Settlement Date | | | Unrealized Gain | |
Barclays Bank PLC | | NZD | | | 629,000 | | | USD | | | 416,918 | | | $ | 434,165 | | | | 04/26/16 | | | $ | 17,247 | |
(continued) | | ZAR | | | 2,479,431 | | | USD | | | 162,000 | | | | 167,085 | | | | 04/26/16 | | | | 5,085 | |
BNP Paribas SA | | CNH | | | 7,173,294 | | | USD | | | 1,053,038 | | | | 1,101,356 | | | | 09/01/16 | | | | 48,318 | |
| | EUR | | | 384,000 | | | GBP | | | 301,813 | | | | 437,294 | | | | 04/26/16 | | | | 3,781 | |
| | GBP | | | 312,000 | | | USD | | | 442,787 | | | | 448,145 | | | | 04/26/16 | | | | 5,358 | |
| | HUF | | | 120,809,088 | | | EUR | | | 384,000 | | | | 437,708 | | | | 04/26/16 | | | | 414 | |
| | INR | | | 26,959,421 | | | USD | | | 404,068 | | | | 406,814 | | | | 04/04/16 | | | | 2,746 | |
| | INR | | | 27,501,235 | | | USD | | | 398,000 | | | | 414,769 | | | | 04/07/16 | | | | 16,769 | |
| | MXN | | | 251,546 | | | USD | | | 14,182 | | | | 14,524 | | | | 04/26/16 | | | | 342 | |
| | MYR | | | 1,652,284 | | | USD | | | 400,000 | | | | 423,864 | | | | 04/01/16 | | | | 23,864 | |
| | MYR | | | 1,632,595 | | | USD | | | 408,752 | | | | 421,073 | | | | 04/25/16 | | | | 12,321 | |
| | NOK | | | 3,811,608 | | | USD | | | 447,325 | | | | 460,582 | | | | 04/26/16 | | | | 13,257 | |
| | NZD | | | 266,782 | | | USD | | | 177,962 | | | | 184,145 | | | | 04/26/16 | | | | 6,183 | |
| | RUB | | | 44,825,580 | | | USD | | | 652,122 | | | | 665,073 | | | | 04/11/16 | | | | 12,951 | |
| | TWD | | | 54,050,565 | | | USD | | | 1,669,000 | | | | 1,681,518 | | | | 04/21/16 | | | | 12,518 | |
Citibank NA (London) | | BRL | | | 774,429 | | | USD | | | 210,878 | | | | 215,123 | | | | 04/04/16 | | | | 4,245 | |
| | CNH | | | 9,467,244 | | | USD | | | 1,386,680 | | | | 1,453,558 | | | | 09/01/16 | | | | 66,878 | |
| | COP | | | 578,922,296 | | | USD | | | 180,448 | | | | 192,928 | | | | 04/04/16 | | | | 12,480 | |
| | EUR | | | 376,000 | | | GBP | | | 293,212 | | | | 428,183 | | | | 04/26/16 | | | | 7,025 | |
| | GBP | | | 2,204,831 | | | USD | | | 3,158,178 | | | | 3,166,753 | | | | 04/07/16 | | | | 8,575 | |
| | GBP | | | 140,815 | | | USD | | | 199,562 | | | | 202,261 | | | | 04/26/16 | | | | 2,699 | |
| | IDR | | | 5,775,635,978 | | | USD | | | 434,000 | | | | 437,985 | | | | 05/02/16 | | | | 3,985 | |
| | INR | | | 18,005,628 | | | USD | | | 271,292 | | | | 271,558 | | | | 04/07/16 | | | | 266 | |
| | MYR | | | 1,663,087 | | | USD | | | 398,000 | | | | 426,635 | | | | 04/01/16 | | | | 28,635 | |
| | NZD | | | 1,306,071 | | | USD | | | 887,241 | | | | 901,510 | | | | 04/26/16 | | | | 14,269 | |
| | RUB | | | 29,682,608 | | | USD | | | 399,000 | | | | 441,292 | | | | 04/04/16 | | | | 42,292 | |
| | RUB | | | 81,010,121 | | | USD | | | 1,069,681 | | | | 1,202,984 | | | | 04/08/16 | | | | 133,303 | |
| | RUB | | | 67,180,759 | | | USD | | | 906,978 | | | | 994,166 | | | | 04/20/16 | | | | 87,188 | |
| | RUB | | | 22,102,453 | | | USD | | | 316,604 | | | | 326,892 | | | | 04/22/16 | | | | 10,288 | |
| | RUB | | | 74,744,013 | | | USD | | | 1,098,732 | | | | 1,104,178 | | | | 04/26/16 | | | | 5,446 | |
| | SEK | | | 309,033 | | | EUR | | | 33,267 | | | | 38,101 | | | | 04/26/16 | | | | 217 | |
| | USD | | | 173,375 | | | NZD | | | 250,883 | | | | 173,171 | | | | 04/26/16 | | | | 204 | |
| | ZAR | | | 2,517,172 | | | USD | | | 162,000 | | | | 169,628 | | | | 04/26/16 | | | | 7,628 | |
Credit Suisse International | | COP | | | 517,656,300 | | | USD | | | 159,000 | | | | 172,511 | | | | 04/04/16 | | | | 13,511 | |
(London) | | COP | | | 1,314,529,580 | | | USD | | | 434,000 | | | | 437,590 | | | | 05/02/16 | | | | 3,590 | |
| | COP | | | 1,618,792,234 | | | USD | | | 531,274 | | | | 537,874 | | | | 05/13/16 | | | | 6,600 | |
| | EUR | | | 366,000 | | | CHF | | | 395,448 | | | | 417,463 | | | | 06/15/16 | | | | 4,783 | |
| | EUR | | | 369,000 | | | USD | | | 417,435 | | | | 420,212 | | | | 04/26/16 | | | | 2,777 | |
| | RUB | | | 22,781,412 | | | USD | | | 324,000 | | | | 337,713 | | | | 04/14/16 | | | | 13,713 | |
| | RUB | | | 127,944,118 | | | USD | | | 1,796,147 | | | | 1,894,459 | | | | 04/18/16 | | | | 98,312 | |
| | RUB | | | 11,965,725 | | | USD | | | 171,000 | | | | 176,818 | | | | 04/25/16 | | | | 5,818 | |
Deutsche Bank AG (London) | | CNH | | | 2,477,524 | | | USD | | | 364,000 | | | | 380,388 | | | | 09/01/16 | | | | 16,388 | |
| | CNY | | | 3,147,938 | | | USD | | | 465,967 | | | | 483,708 | | | | 07/26/16 | | | | 17,743 | |
| | CNY | | | 2,736,568 | | | USD | | | 404,968 | | | | 420,299 | | | | 08/02/16 | | | | 15,332 | |
| | CNY | | | 1,346,379 | | | USD | | | 198,962 | | | | 206,771 | | | | 08/03/16 | | | | 7,809 | |
| | HUF | | | 287,060,155 | | | USD | | | 1,016,142 | | | | 1,040,058 | | | | 04/26/16 | | | | 23,915 | |
| | IDR | | | 5,316,522,000 | | | USD | | | 400,000 | | | | 404,237 | | | | 04/07/16 | | | | 4,237 | |
| | IDR | | | 5,533,527,450 | | | USD | | | 417,000 | | | | 420,270 | | | | 04/18/16 | | | | 3,270 | |
| | MXN | | | 103,429,712 | | | USD | | | 5,788,220 | | | | 5,972,097 | | | | 04/26/16 | | | | 183,877 | |
| | USD | | | 435,801 | | | EUR | | | 382,000 | | | | 435,016 | | | | 04/26/16 | | | | 784 | |
| | USD | | | 940,337 | | | THB | | | 32,723,735 | | | | 929,617 | | | | 04/26/16 | | | | 10,721 | |
HSBC Bank PLC | | CNH | | | 4,893,048 | | | USD | | | 725,000 | | | | 751,257 | | | | 09/01/16 | | | | 26,257 | |
| | CNY | | | 2,339,975 | | | USD | | | 347,487 | | | | 361,978 | | | | 04/14/16 | | | | 14,492 | |
| | CNY | | | 4,729,205 | | | USD | | | 694,973 | | | | 727,273 | | | | 07/14/16 | | | | 32,300 | |
| | |
| 42 | | The accompanying notes are an integral part of these financial statements. |
GOLDMAN SACHS BOND FUND
|
| ADDITIONAL INVESTMENT INFORMATION (continued) |
| | | | | | | | | | | | | | | | | | | | | | | | |
| Counterparty | | Currency Purchased | | | Currency Sold | | | Current Value | | | Settlement Date | | | Unrealized Gain | |
HSBC Bank PLC | | CNY | | | 4,033,347 | | | USD | | | 596,936 | | | $ | 620,220 | | | | 07/15/16 | | | $ | 23,284 | |
(continued) | | CNY | | | 2,416,843 | | | USD | | | 356,283 | | | | 371,495 | | | | 07/21/16 | | | | 15,212 | |
| | CNY | | | 3,813,286 | | | USD | | | 564,221 | | | | 585,668 | | | | 08/02/16 | | | | 21,447 | |
| | CNY | | | 2,691,812 | | | USD | | | 404,601 | | | | 412,979 | | | | 08/18/16 | | | | 8,378 | |
| | EUR | | | 1,121,000 | | | USD | | | 1,253,678 | | | | 1,276,579 | | | | 04/26/16 | | | | 22,901 | |
| | KRW | | | 2,017,620,843 | | | USD | | | 1,667,593 | | | | 1,760,914 | | | | 04/08/16 | | | | 93,321 | |
| | MYR | | | 1,476,642 | | | USD | | | 380,000 | | | | 380,859 | | | | 05/04/16 | | | | 859 | |
| | NOK | | | 3,498,013 | | | EUR | | | 368,000 | | | | 422,688 | | | | 04/26/16 | | | | 3,614 | |
| | SEK | | | 23,817,826 | | | EUR | | | 2,549,024 | | | | 2,936,552 | | | | 04/26/16 | | | | 33,760 | |
| | TRY | | | 2,371,622 | | | USD | | | 811,000 | | | | 835,282 | | | | 04/26/16 | | | | 24,282 | |
| | TWD | | | 13,250,216 | | | USD | | | 406,000 | | | | 412,199 | | | | 04/18/16 | | | | 6,199 | |
| | TWD | | | 27,976,812 | | | USD | | | 868,000 | | | | 870,420 | | | | 04/26/16 | | | | 2,420 | |
| | USD | | | 137,538 | | | KRW | | | 157,205,827 | | | | 137,204 | | | | 04/08/16 | | | | 334 | |
JPMorgan Chase Bank | | BRL | | | 5,763,471 | | | USD | | | 1,564,975 | | | | 1,600,993 | | | | 04/04/16 | | | | 36,018 | |
(London) | | CNH | | | 2,467,707 | | | USD | | | 363,000 | | | | 378,881 | | | | 09/01/16 | | | | 15,881 | |
| | CNY | | | 7,283,260 | | | USD | | | 1,065,688 | | | | 1,120,272 | | | | 07/11/16 | | | | 54,584 | |
| | CNY | | | 4,888,287 | | | USD | | | 716,260 | | | | 751,839 | | | �� | 07/12/16 | | | | 35,579 | |
| | EUR | | | 2,589,075 | | | USD | | | 2,905,331 | | | | 2,950,601 | | | | 05/19/16 | | | | 45,271 | |
| | IDR | | | 5,306,728,000 | | | USD | | | 396,024 | | | | 402,077 | | | | 04/04/16 | | | | 6,053 | |
| | IDR | | | 3,790,442,982 | | | USD | | | 285,318 | | | | 288,203 | | | | 04/07/16 | | | | 2,885 | |
| | INR | | | 27,240,136 | | | USD | | | 407,512 | | | | 411,050 | | | | 04/04/16 | | | | 3,538 | |
| | MXN | | | 29,327,932 | | | USD | | | 1,671,000 | | | | 1,693,414 | | | | 04/26/16 | | | | 22,414 | |
| | MYR | | | 1,660,175 | | | USD | | | 406,000 | | | | 428,161 | | | | 04/20/16 | | | | 22,161 | |
| | MYR | | | 1,703,186 | | | USD | | | 417,000 | | | | 439,259 | | | | 04/21/16 | | | | 22,259 | |
| | PLN | | | 14,158,577 | | | USD | | | 3,579,448 | | | | 3,792,995 | | | | 04/26/16 | | | | 213,547 | |
| | RUB | | | 12,894,811 | | | USD | | | 174,672 | | | | 191,707 | | | | 04/04/16 | | | | 17,035 | |
| | USD | | | 357,000 | | | CNH | | | 2,303,632 | | | | 353,689 | | | | 09/01/16 | | | | 3,311 | |
| | USD | | | 435,000 | | | RUB | | | 29,406,000 | | | | 434,034 | | | | 04/29/16 | | | | 966 | |
Morgan Stanley & Co. | | BRL | | | 5,251,666 | | | USD | | | 1,395,225 | | | | 1,458,822 | | | | 04/04/16 | | | | 63,597 | |
International PLC | | CNH | | | 1,395,011 | | | USD | | | 204,568 | | | | 214,184 | | | | 09/01/16 | | | | 9,616 | |
| | EUR | | | 372,000 | | | USD | | | 419,382 | | | | 423,628 | | | | 04/26/16 | | | | 4,247 | |
| | MXN | | | 7,289,013 | | | USD | | | 406,000 | | | | 420,872 | | | | 04/26/16 | | | | 14,872 | |
| | MYR | | | 1,525,859 | | | USD | | | 369,679 | | | | 393,465 | | | | 04/08/16 | | | | 23,786 | |
| | NZD | | | 605,000 | | | USD | | | 404,387 | | | | 417,599 | | | | 04/26/16 | | | | 13,212 | |
| | RUB | | | 23,538,582 | | | USD | | | 324,000 | | | | 349,240 | | | | 04/11/16 | | | | 25,240 | |
| | RUB | | | 28,679,293 | | | USD | | | 419,000 | | | | 424,284 | | | | 04/21/16 | | | | 5,284 | |
| | RUB | | | 29,607,003 | | | USD | | | 434,000 | | | | 437,001 | | | | 04/29/16 | | | | 3,001 | |
Royal Bank of Canada | | AUD | | | 766,949 | | | USD | | | 573,559 | | | | 587,202 | | | | 04/26/16 | | | | 13,642 | |
| | BRL | | | 1,597,388 | | | USD | | | 397,570 | | | | 443,727 | | | | 04/04/16 | | | | 46,157 | |
| | CAD | | | 566,688 | | | USD | | | 436,000 | | | | 436,351 | | | | 04/26/16 | | | | 351 | |
| | USD | | | 425,000 | | | BRL | | | 1,527,369 | | | | 424,277 | | | | 04/04/16 | | | | 723 | |
| | USD | | | 435,000 | | | MXN | | | 7,473,313 | | | | 431,514 | | | | 04/26/16 | | | | 3,486 | |
Royal Bank of Scotland PLC | | COP | | | 522,213,638 | | | USD | | | 159,000 | | | | 174,030 | | | | 04/04/16 | | | | 15,030 | |
| | COP | | | 1,264,618,128 | | | USD | | | 400,027 | | | | 421,366 | | | | 04/11/16 | | | | 21,338 | |
| | COP | | | 517,668,084 | | | USD | | | 162,000 | | | | 172,464 | | | | 04/15/16 | | | | 10,464 | |
| | EUR | | | 366,000 | | | GBP | | | 284,184 | | | | 416,796 | | | | 04/26/16 | | | | 8,604 | |
| | EUR | | | 372,000 | | | NOK | | | 3,496,019 | | | | 423,628 | | | | 04/26/16 | | | | 1,182 | |
| | NOK | | | 6,904,820 | | | EUR | | | 728,000 | | | | 834,355 | | | | 04/26/16 | | | | 5,318 | |
| | TRY | | | 3,634,503 | | | USD | | | 1,257,000 | | | | 1,280,067 | | | | 04/26/16 | | | | 23,067 | |
| | USD | | | 419,000 | | | MXN | | | 7,252,505 | | | | 418,764 | | | | 04/26/16 | | | | 236 | |
Standard Chartered Bank | | AUD | | | 563,000 | | | USD | | | 424,412 | | | | 431,051 | | | | 04/26/16 | | | | 6,639 | |
| | CNH | | | 4,962,114 | | | USD | | | 727,000 | | | | 761,861 | | | | 09/01/16 | | | | 34,861 | |
| | CNY | | | 4,924,430 | | | USD | | | 722,799 | | | | 756,937 | | | | 07/21/16 | | | | 34,138 | |
| | CNY | | | 4,890,436 | | | USD | | | 722,822 | | | | 751,661 | | | | 07/22/16 | | | | 28,839 | |
| | |
| The accompanying notes are an integral part of these financial statements. | | 43 |
GOLDMAN SACHS BOND FUND
Schedule of Investments (continued)
March 31, 2016
|
| ADDITIONAL INVESTMENT INFORMATION (continued) |
| | | | | | | | | | | | | | | | | | | | | | | | |
| Counterparty | | Currency Purchased | | | Currency Sold | | | Current Value | | | Settlement Date | | | Unrealized Gain | |
Standard Chartered Bank | | EUR | | | 2,902,001 | | | USD | | | 3,251,886 | | | $ | 3,304,758 | | | | 04/26/16 | | | $ | 52,872 | |
(continued) | | INR | | | 52,270,155 | | | USD | | | 756,223 | | | | 788,329 | | | | 04/07/16 | | | | 32,106 | |
| | INR | | | 27,337,807 | | | USD | | | 406,000 | | | | 411,636 | | | | 04/18/16 | | | | 5,636 | |
| | MYR | | | 3,291,165 | | | USD | | | 805,000 | | | | 848,705 | | | | 04/11/16 | | | | 43,705 | |
| | NZD | | | 353,910 | | | USD | | | 233,448 | | | | 244,285 | | | | 04/26/16 | | | | 10,837 | |
| | USD | | | 1,431,000 | | | CNH | | | 9,255,760 | | | | 1,421,089 | | | | 09/01/16 | | | | 9,911 | |
| | USD | | | 261,000 | | | ZAR | | | 3,859,736 | | | | 260,102 | | | | 04/26/16 | | | | 898 | |
| | ZAR | | | 5,189,672 | | | USD | | | 338,000 | | | | 349,724 | | | | 04/26/16 | | | | 11,724 | |
State Street Bank (London) | | EUR | | | 375,000 | | | SEK | | | 3,461,850 | | | | 427,045 | | | | 04/26/16 | | | | 225 | |
| | EUR | | | 726,067 | | | USD | | | 814,235 | | | | 826,834 | | | | 04/26/16 | | | | 12,599 | |
| | GBP | | | 303,526 | | | EUR | | | 382,000 | | | | 435,973 | | | | 04/26/16 | | | | 957 | |
| | GBP | | | 153,587 | | | USD | | | 216,774 | | | | 220,606 | | | | 04/26/16 | | | | 3,832 | |
| | MXN | | | 7,221,928 | | | USD | | | 406,000 | | | | 416,999 | | | | 04/26/16 | | | | 10,999 | |
| | SEK | | | 55,720,685 | | | EUR | | | 5,996,681 | | | | 6,869,926 | | | | 04/26/16 | | | | 40,990 | |
| | ZAR | | | 31,198,951 | | | USD | | | 2,000,317 | | | | 2,102,450 | | | | 04/26/16 | | | | 102,133 | |
UBS AG (London) | | AUD | | | 541,000 | | | USD | | | 404,699 | | | | 414,207 | | | | 04/26/16 | | | | 9,508 | |
| | BRL | | | 4,651,107 | | | USD | | | 1,208,000 | | | | 1,291,998 | | | | 04/04/16 | | | | 83,998 | |
| | CHF | | | 809,059 | | | EUR | | | 737,000 | | | | 842,360 | | | | 04/26/16 | | | | 3,074 | |
| | EUR | | | 365,000 | | | GBP | | | 282,862 | | | | 415,657 | | | | 04/26/16 | | | | 9,366 | |
| | EUR | | | 736,000 | | | USD | | | 823,928 | | | | 838,147 | | | | 04/26/16 | | | | 14,217 | |
| | NOK | | | 6,911,611 | | | EUR | | | 730,000 | | | | 834,944 | | | | 06/15/16 | | | | 2,300 | |
| | PLN | | | 1,595,492 | | | EUR | | | 370,000 | | | | 427,422 | | | | 04/26/16 | | | | 6,071 | |
| | SEK | | | 3,445,959 | | | EUR | | | 368,000 | | | | 424,860 | | | | 04/26/16 | | | | 5,787 | |
| | USD | | | 436,857 | | | AUD | | | 568,000 | | | | 434,879 | | | | 04/26/16 | | | | 1,978 | |
| | USD | | | 2,972,807 | | | JPY | | | 330,627,223 | | | | 2,940,099 | | | | 04/26/16 | | | | 32,707 | |
Westpac Banking Corp. | | AUD | | | 477,700 | | | USD | | | 360,587 | | | | 365,743 | | | | 04/26/16 | | | | 5,156 | |
| | CNH | | | 2,501,455 | | | USD | | | 364,000 | | | | 384,062 | | | | 09/01/16 | | | | 20,062 | |
| | IDR | | | 5,306,728,000 | | | USD | | | 399,754 | | | | 403,045 | | | | 04/18/16 | | | | 3,292 | |
| | MYR | | | 904,094 | | | USD | | | 231,108 | | | | 233,134 | | | | 04/08/16 | | | | 2,026 | |
| | NZD | | | 1,620,937 | | | USD | | | 1,101,292 | | | | 1,118,846 | | | | 04/26/16 | | | | 17,554 | |
| | USD | | | 393,270 | | | IDR | | | 5,158,524,780 | | | | 391,789 | | | | 04/18/16 | | | | 1,481 | |
| | | USD | | | 434,500 | | | NZD | | | 626,000 | | | | 432,094 | | | | 04/26/16 | | | | 2,406 | |
| TOTAL | | | | | | | | | | | | | | | | | | | | | | $ | 3,295,015 | |
FORWARD FOREIGN CURRENCY EXCHANGE CONTRACTS WITH UNREALIZED LOSS
| | | | | | | | | | | | | | | | | | | | | | | | |
| Counterparty | | Currency Purchased | | | Currency Sold | | | Current Value | | | Settlement Date | | | Unrealized Loss | |
Bank of America Securities LLC | | AUD | | | 1,134,000 | | | USD | | | 868,253 | | | $ | 868,227 | | | | 04/26/16 | | | $ | (25 | ) |
| | EUR | | | 376,000 | | | PLN | | | 1,603,264 | | | | 428,183 | | | | 04/26/16 | | | | (1,321 | ) |
| | HUF | | | 120,220,642 | | | EUR | | | 387,020 | | | | 435,576 | | | | 04/26/16 | | | | (5,157 | ) |
| | USD | | | 554,812 | | | CAD | | | 772,000 | | | | 594,429 | | | | 04/06/16 | | | | (39,617 | ) |
| | USD | | | 398,000 | | | CNH | | | 2,634,386 | | | | 406,146 | | | | 06/15/16 | | | | (8,146 | ) |
| | USD | | | 417,599 | | | EUR | | | 368,000 | | | | 419,073 | | | | 04/26/16 | | | | (1,474 | ) |
| | USD | | | 399,000 | | | INR | | | 27,036,240 | | | | 407,973 | | | | 04/04/16 | | | | (8,973 | ) |
Barclays Bank PLC | | USD | | | 427,000 | | | CAD | | | 566,103 | | | | 435,901 | | | | 04/26/16 | | | | (8,901 | ) |
| | USD | | | 105,792 | | | CNH | | | 698,756 | | | | 107,877 | | | | 05/19/16 | | | | (2,085 | ) |
| | USD | | | 392,840 | | | CNH | | | 2,658,348 | | | | 408,725 | | | | 08/05/16 | | | | (15,885 | ) |
| | USD | | | 487,720 | | | CNH | | | 3,281,380 | | | | 504,228 | | | | 08/16/16 | | | | (16,508 | ) |
| | USD | | | 1,882,706 | | | CNH | | | 12,636,643 | | | | 1,940,173 | | | | 09/01/16 | | | | (57,467 | ) |
| | USD | | | 435,244 | | | EUR | | | 383,000 | | | | 436,155 | | | | 04/26/16 | | | | (911 | ) |
| | USD | | | 404,987 | | | NZD | | | 601,000 | | | | 414,838 | | | | 04/26/16 | | | | (9,850 | ) |
| | |
| 44 | | The accompanying notes are an integral part of these financial statements. |
GOLDMAN SACHS BOND FUND
|
| ADDITIONAL INVESTMENT INFORMATION (continued) |
| | | | | | | | | | | | | | | | | | | | | | | | |
| Counterparty | | Currency Purchased | | | Currency Sold | | | Current Value | | | Settlement Date | | | Unrealized Loss | |
Barclays Bank PLC | | USD | | | 834,859 | | | TWD | | | 27,366,680 | | | $ | 851,345 | | | | 04/18/16 | | | $ | (16,486 | ) |
(continued) | | USD | | | 1,475,441 | | | TWD | | | 48,629,045 | | | | 1,512,956 | | | | 04/26/16 | | | | (37,516 | ) |
BNP Paribas SA | | EUR | | | 365,000 | | | PLN | | | 1,565,970 | | | | 415,657 | | | | 04/26/16 | | | | (3,857 | ) |
| | HUF | | | 6,364,952 | | | EUR | | | 20,322 | | | | 23,061 | | | | 04/26/16 | | | | (82 | ) |
| | USD | | | 1,625,524 | | | AED | | | 6,003,637 | | | | 1,630,889 | | | | 12/07/16 | | | | (5,365 | ) |
| | USD | | | 406,404 | | | EUR | | | 364,000 | | | | 414,518 | | | | 04/26/16 | | | | (8,114 | ) |
| | USD | | | 399,000 | | | INR | | | 27,163,318 | | | | 409,891 | | | | 04/04/16 | | | | (10,891 | ) |
| | USD | | | 402,921 | | | INR | | | 26,959,421 | | | | 405,938 | | | | 04/18/16 | | | | (3,018 | ) |
| | USD | | | 848,616 | | | JPY | | | 96,234,794 | | | | 855,767 | | | | 04/26/16 | | | | (7,151 | ) |
| | USD | | | 598,924 | | | KRW | | | 699,237,215 | | | | 609,948 | | | | 04/28/16 | | | | (11,024 | ) |
| | USD | | | 408,660 | | | MYR | | | 1,632,595 | | | | 418,813 | | | | 04/01/16 | | | | (10,153 | ) |
Citibank NA (London) | | EUR | | | 357,080 | | | CHF | | | 390,781 | | | | 406,637 | | | | 04/26/16 | | | | (228 | ) |
| | EUR | | | 626,085 | | | SEK | | | 5,822,088 | | | | 712,976 | | | | 04/26/16 | | | | (4,842 | ) |
| | IDR | | | 5,323,841,460 | | | USD | | | 406,000 | | | | 404,508 | | | | 04/14/16 | | | | (1,492 | ) |
| | USD | | | 2,667,000 | | | AED | | | 9,829,052 | | | | 2,673,415 | | | | 08/11/16 | | | | (6,415 | ) |
| | USD | | | 1,527,330 | | | AUD | | | 2,057,592 | | | | 1,575,359 | | | | 04/26/16 | | | | (48,030 | ) |
| | USD | | | 210,878 | | | BRL | | | 765,541 | | | | 212,654 | | | | 04/04/16 | | | | (1,776 | ) |
| | USD | | | 1,576,415 | | | CAD | | | 2,103,947 | | | | 1,620,047 | | | | 04/26/16 | | | | (43,631 | ) |
| | USD | | | 357,379 | | | CNH | | | 2,337,005 | | | | 358,813 | | | | 09/01/16 | | | | (1,435 | ) |
| | USD | | | 186,320 | | | COP | | | 627,991,373 | | | | 209,134 | | | | 04/28/16 | | | | (22,814 | ) |
| | USD | | | 859,912 | | | EUR | | | 770,590 | | | | 877,537 | | | | 04/26/16 | | | | (17,624 | ) |
| | USD | | | 3,391,258 | | | GBP | | | 2,373,414 | | | | 3,408,884 | | | | 04/07/16 | | | | (17,627 | ) |
| | USD | | | 671,110 | | | IDR | | | 9,106,964,982 | | | | 692,440 | | | | 04/07/16 | | | | (21,329 | ) |
| | USD | | | 270,802 | | | INR | | | 18,005,628 | | | | 271,118 | | | | 04/18/16 | | | | (316 | ) |
| | USD | | | 183,779 | | | JPY | | | 20,855,282 | | | | 185,455 | | | | 04/26/16 | | | | (1,676 | ) |
| | USD | | | 402,000 | | | KRW | | | 484,570,800 | | | | 422,918 | | | | 04/08/16 | | | | (20,918 | ) |
| | USD | | | 402,000 | | | KRW | | | 486,233,070 | | | | 424,335 | | | | 04/11/16 | | | | (22,335 | ) |
| | USD | | | 365,994 | | | KRW | | | 449,871,900 | | | | 392,456 | | | | 04/25/16 | | | | (26,463 | ) |
| | USD | | | 594,193 | | | MYR | | | 2,429,953 | | | | 626,599 | | | | 04/08/16 | | | | (32,406 | ) |
| | USD | | | 427,000 | | | MYR | | | 1,722,667 | | | | 444,320 | | | | 04/28/16 | | | | (17,320 | ) |
| | USD | | | 1,105,190 | | | RUB | | | 74,744,013 | | | | 1,111,220 | | | | 04/04/16 | | | | (6,030 | ) |
| | USD | | | 428,569 | | | RUB | | | 30,400,306 | | | | 451,046 | | | | 04/11/16 | | | | (22,478 | ) |
| | USD | | | 178,361 | | | SEK | | | 1,490,097 | | | | 183,717 | | | | 04/26/16 | | | | (5,357 | ) |
| | USD | | | 2,626,817 | | | SGD | | | 3,634,332 | | | | 2,696,084 | | | | 04/26/16 | | | | (69,268 | ) |
| | USD | | | 375,552 | | | TWD | | | 12,479,582 | | | | 388,204 | | | | 04/14/16 | | | | (12,652 | ) |
| | USD | | | 755,524 | | | TWD | | | 24,811,392 | | | | 771,864 | | | | 04/19/16 | | | | (16,340 | ) |
| | USD | | | 162,000 | | | ZAR | | | 2,459,967 | | | | 165,773 | | | | 04/26/16 | | | | (3,773 | ) |
Credit Suisse International | | EUR | | | 370,000 | | | CHF | | | 405,265 | | | | 421,351 | | | | 04/26/16 | | | | (595 | ) |
(London) | | GBP | | | 300,065 | | | EUR | | | 380,000 | | | | 431,002 | | | | 04/26/16 | | | | (1,737 | ) |
| | JPY | | | 19,463,921 | | | USD | | | 173,526 | | | | 173,083 | | | | 04/26/16 | | | | (444 | ) |
| | USD | | | 258,579 | | | CAD | | | 343,051 | | | | 264,151 | | | | 04/26/16 | | | | (5,572 | ) |
| | USD | | | 534,255 | | | COP | | | 1,618,792,234 | | | | 539,469 | | | | 04/04/16 | | | | (5,214 | ) |
| | USD | | | 168,000 | | | RUB | | | 11,547,312 | | | | 170,980 | | | | 04/18/16 | | | | (2,980 | ) |
| | USD | | | 169,000 | | | RUB | | | 11,515,694 | | | | 170,315 | | | | 04/22/16 | | | | (1,315 | ) |
Deutsche Bank AG (London) | | EUR | | | 369,000 | | | SEK | | | 3,435,656 | | | | 420,212 | | | | 04/26/16 | | | | (3,377 | ) |
| | IDR | | | 9,286,142,160 | | | USD | | | 708,000 | | | | 705,778 | | | | 04/11/16 | | | | (2,222 | ) |
| | IDR | | | 5,483,834,290 | | | USD | | | 419,000 | | | | 416,370 | | | | 04/21/16 | | | | (2,630 | ) |
| | MXN | | | 7,476,627 | | | USD | | | 434,000 | | | | 431,705 | | | | 04/26/16 | | | | (2,295 | ) |
| | USD | | | 465,967 | | | CNH | | | 3,146,187 | | | | 483,983 | | | | 07/26/16 | | | | (18,017 | ) |
| | USD | | | 404,968 | | | CNH | | | 2,734,746 | | | | 420,537 | | | | 08/02/16 | | | | (15,570 | ) |
| | USD | | | 198,962 | | | CNH | | | 1,345,583 | | | | 206,907 | | | | 08/03/16 | | | | (7,945 | ) |
| | USD | | | 1,792,777 | | | CNH | | | 11,977,286 | | | | 1,838,939 | | | | 09/01/16 | | | | (46,162 | ) |
| | USD | | | 354,493 | | | IDR | | | 4,856,556,600 | | | | 368,595 | | | | 04/25/16 | | | | (14,102 | ) |
| | USD | | | 850,000 | | | KRW | | | 989,950,800 | | | | 863,607 | | | | 04/25/16 | | | | (13,607 | ) |
| | |
| The accompanying notes are an integral part of these financial statements. | | 45 |
GOLDMAN SACHS BOND FUND
Schedule of Investments (continued)
March 31, 2016
|
| ADDITIONAL INVESTMENT INFORMATION (continued) |
| | | | | | | | | | | | | | | | | | | | | | | | |
| Counterparty | | Currency Purchased | | | Currency Sold | | | Current Value | | | Settlement Date | | | Unrealized Loss | |
HSBC Bank PLC | | KRW | | | 157,205,827 | | | USD | | | 137,478 | | | $ | 137,142 | | | | 04/25/16 | | | $ | (336 | ) |
| | USD | | | 1,023,948 | | | AED | | | 3,782,774 | | | | 1,027,591 | | | | 12/07/16 | | | | (3,642 | ) |
| | USD | | | 193,997 | | | AUD | | | 260,044 | | | | 199,098 | | | | 04/26/16 | | | | (5,101 | ) |
| | USD | | | 419,000 | | | BRL | | | 1,524,850 | | | | 423,577 | | | | 04/04/16 | | | | (4,577 | ) |
| | USD | | | 347,487 | | | CNH | | | 2,342,060 | | | | 362,129 | | | | 04/14/16 | | | | (14,642 | ) |
| | USD | | | 694,973 | | | CNH | | | 4,728,597 | | | | 727,863 | | | | 07/14/16 | | | | (32,890 | ) |
| | USD | | | 596,936 | | | CNH | | | 4,032,124 | | | | 620,624 | | | | 07/15/16 | | | | (23,688 | ) |
| | USD | | | 356,283 | | | CNH | | | 2,416,308 | | | | 371,802 | | | | 07/21/16 | | | | (15,519 | ) |
| | USD | | | 564,221 | | | CNH | | | 3,811,402 | | | | 586,101 | | | | 08/02/16 | | | | (21,880 | ) |
| | USD | | | 404,601 | | | CNH | | | 2,689,789 | | | | 413,279 | | | | 08/18/16 | | | | (8,678 | ) |
| | USD | | | 2,157,212 | | | CNH | | | 14,513,612 | | | | 2,228,355 | | | | 09/01/16 | | | | (71,143 | ) |
| | USD | | | 855,000 | | | HKD | | | 6,633,355 | | | | 855,269 | | | | 04/26/16 | | | | (269 | ) |
| | USD | | | 905,142 | | | INR | | | 62,481,973 | | | | 942,342 | | | | 04/07/16 | | | | (37,199 | ) |
| | USD | | | 249,395 | | | MYR | | | 1,049,330 | | | | 269,187 | | | | 04/01/16 | | | | (19,792 | ) |
| | USD | | | 427,000 | | | SGD | | | 585,461 | | | | 434,317 | | | | 04/26/16 | | | | (7,317 | ) |
| | USD | | | 265,932 | | | TWD | | | 8,761,129 | | | | 272,552 | | | | 04/19/16 | | | | (6,620 | ) |
JPMorgan Chase Bank | | IDR | | | 3,637,464,940 | | | USD | | | 276,824 | | | | 276,070 | | | | 04/25/16 | | | | (754 | ) |
(London) | | NZD | | | 630,000 | | | USD | | | 434,880 | | | | 434,855 | | | | 04/26/16 | | | | (25 | ) |
| | USD | | | 1,016,151 | | | BRL | | | 4,253,000 | | | | 1,181,410 | | | | 04/04/16 | | | | (165,259 | ) |
| | USD | | | 1,145,960 | | | BRL | | | 4,253,000 | | | | 1,162,488 | | | | 06/02/16 | | | | (16,528 | ) |
| | USD | | | 126,117 | | | CAD | | | 167,978 | | | | 129,341 | | | | 04/06/16 | | | | (3,224 | ) |
| | USD | | | 3,498,053 | | | CNH | | | 22,869,570 | | | | 3,534,522 | | | | 04/26/16 | | | | (36,469 | ) |
| | USD | | | 1,065,688 | | | CNH | | | 7,286,105 | | | | 1,121,711 | | | | 07/11/16 | | | | (56,024 | ) |
| | USD | | | 716,260 | | | CNH | | | 4,890,264 | | | | 752,827 | | | | 07/12/16 | | | | (36,567 | ) |
| | USD | | | 709,000 | | | CNH | | | 4,661,516 | | | | 715,708 | | | | 09/01/16 | | | | (6,708 | ) |
| | USD | | | 846,543 | | | EUR | | | 753,000 | | | | 857,506 | | | | 04/26/16 | | | | (10,962 | ) |
| | USD | | | 11,270,287 | | | EUR | | | 10,043,476 | | | | 11,445,899 | | | | 05/19/16 | | | | (175,612 | ) |
| | USD | | | 524,205 | | | IDR | | | 6,979,260,852 | | | | 530,448 | | | | 04/11/16 | | | | (6,243 | ) |
| | USD | | | 427,000 | | | IDR | | | 5,690,330,100 | | | | 431,701 | | | | 04/29/16 | | | | (4,701 | ) |
| | USD | | | 284,568 | | | IDR | | | 3,790,442,982 | | | | 287,441 | | | | 05/02/16 | | | | (2,874 | ) |
| | USD | | | 964,000 | | | KRW | | | 1,163,413,040 | | | | 1,015,389 | | | | 04/08/16 | | | | (51,389 | ) |
| | USD | | | 811,000 | | | MXN | | | 14,449,567 | | | | 834,327 | | | | 04/26/16 | | | | (23,327 | ) |
| | USD | | | 423,000 | | | MYR | | | 1,696,272 | | | | 437,496 | | | | 04/25/16 | | | | (14,496 | ) |
| | USD | | | 326,307 | | | SEK | | | 2,805,000 | | | | 345,749 | | | | 04/19/16 | | | | (19,442 | ) |
| | USD | | | 266,866 | | | SEK | | | 2,220,668 | | | | 273,791 | | | | 04/26/16 | | | | (6,926 | ) |
| | USD | | | 423,847 | | | TWD | | | 14,139,543 | | | | 439,829 | | | | 04/12/16 | | | | (15,982 | ) |
Morgan Stanley & Co. | | USD | | | 1,939,675 | | | BRL | | | 7,304,338 | | | | 2,029,019 | | | | 04/04/16 | | | | (89,344 | ) |
International PLC | | USD | | | 835,000 | | | JPY | | | 94,250,625 | | | | 838,123 | | | | 04/26/16 | | | | (3,123 | ) |
| | USD | | | 406,000 | | | KRW | | | 483,546,000 | | | | 421,945 | | | | 04/15/16 | | | | (15,945 | ) |
| | USD | | | 423,000 | | | KRW | | | 490,468,500 | | | | 427,872 | | | | 04/25/16 | | | | (4,872 | ) |
| | USD | | | 151,000 | | | MYR | | | 633,445 | | | | 162,499 | | | | 04/01/16 | | | | (11,499 | ) |
| | USD | | | 785,653 | | | MYR | | | 3,177,360 | | | | 819,445 | | | | 04/20/16 | | | | (33,792 | ) |
| | USD | | | 424,572 | | | NZD | | | 633,000 | | | | 436,926 | | | | 04/26/16 | | | | (12,354 | ) |
| | USD | | | 398,000 | | | RUB | | | 29,501,969 | | | | 438,606 | | | | 04/04/16 | | | | (40,606 | ) |
| | USD | | | 170,000 | | | RUB | | | 11,551,772 | | | | 170,849 | | | | 04/22/16 | | | | (849 | ) |
| | USD | | | 402,000 | | | TWD | | | 13,167,832 | | | | 409,597 | | | | 04/11/16 | | | | (7,597 | ) |
Royal Bank of Canada | | CAD | | | 1,082,403 | | | USD | | | 834,000 | | | | 833,454 | | | | 04/26/16 | | | | (546 | ) |
| | GBP | | | 301,040 | | | EUR | | | 380,000 | | | | 432,402 | | | | 04/26/16 | | | | (336 | ) |
| | USD | | | 868,000 | | | BRL | | | 3,136,145 | | | | 871,167 | | | | 04/04/16 | | | | (3,167 | ) |
| | USD | | | 804,000 | | | CAD | | | 1,071,539 | | | | 825,089 | | | | 04/26/16 | | | | (21,089 | ) |
| | USD | | | 4,017,290 | | | EUR | | | 3,613,110 | | | | 4,114,558 | | | | 04/26/16 | | | | (97,268 | ) |
| | USD | | | 8,205,240 | | | JPY | | | 929,711,145 | | | | 8,269,647 | | | | 05/06/16 | | | | (64,407 | ) |
| | USD | | | 774,825 | | | MXN | | | 13,966,609 | | | | 805,382 | | | | 05/10/16 | | | | (30,557 | ) |
| | USD | | | 154,840 | | | SEK | | | 1,310,908 | | | | 161,585 | | | | 04/19/16 | | | | (6,745 | ) |
| | |
| 46 | | The accompanying notes are an integral part of these financial statements. |
GOLDMAN SACHS BOND FUND
|
| ADDITIONAL INVESTMENT INFORMATION (continued) |
| | | | | | | | | | | | | | | | | | | | | | | | |
| Counterparty | | Currency Purchased | | | Currency Sold | | | Current Value | | | Settlement Date | | | Unrealized Loss | |
Royal Bank of Scotland PLC | | COP | | | 522,599,256 | | | USD | | | 174,000 | | | $ | 173,908 | | | | 05/04/16 | | | $ | (92 | ) |
| | EUR | | | 380,000 | | | PLN | | | 1,620,337 | | | | 432,739 | | | | 04/26/16 | | | | (1,340 | ) |
| | GBP | | | 596,756 | | | EUR | | | 756,000 | | | | 857,158 | | | | 04/26/16 | | | | (3,764 | ) |
| | MXN | | | 7,521,141 | | | USD | | | 435,000 | | | | 434,275 | | | | 04/26/16 | | | | (725 | ) |
| | USD | | | 848,000 | | | MXN | | | 14,779,974 | | | | 853,405 | | | | 04/26/16 | | | | (5,405 | ) |
| | USD | | | 1,905,827 | | | TRY | | | 5,640,250 | | | | 1,986,489 | | | | 04/26/16 | | | | (80,661 | ) |
Standard Chartered Bank | | USD | | | 722,799 | | | CNH | | | 4,924,430 | | | | 757,731 | | | | 07/21/16 | | | | (34,932 | ) |
| | USD | | | 722,822 | | | CNH | | | 4,887,544 | | | | 752,016 | | | | 07/22/16 | | | | (29,194 | ) |
| | USD | | | 748,000 | | | CNH | | | 5,000,379 | | | | 767,736 | | | | 09/01/16 | | | | (19,736 | ) |
| | USD | | | 342,000 | | | ZAR | | | 5,156,871 | | | | 347,513 | | | | 04/26/16 | | | | (5,513 | ) |
State Street Bank (London) | | EUR | | | 377,000 | | | SEK | | | 3,488,279 | | | | 429,322 | | | | 04/26/16 | | | | (755 | ) |
| | USD | | | 4,298,806 | | | AUD | | | 5,793,539 | | | | 4,435,722 | | | | 04/26/16 | | | | (136,917 | ) |
| | USD | | | 409,202 | | | CAD | | | 544,558 | | | | 419,312 | | | | 04/26/16 | | | | (10,110 | ) |
| | USD | | | 728,000 | | | EUR | | | 655,655 | | | | 746,651 | | | | 04/26/16 | | | | (18,651 | ) |
UBS AG (London) | | CHF | | | 399,727 | | | EUR | | | 366,673 | | | | 417,145 | | | | 06/15/16 | | | | (1,087 | ) |
| | EUR | | | 383,000 | | | PLN | | | 1,638,434 | | | | 436,155 | | | | 04/26/16 | | | | (2,771 | ) |
| | USD | | | 400,000 | | | BRL | | | 1,554,341 | | | | 431,769 | | | | 04/04/16 | | | | (31,769 | ) |
| | USD | | | 428,873 | | | EUR | | | 381,000 | | | | 433,877 | | | | 04/26/16 | | | | (5,004 | ) |
| | USD | | | 183,115 | | | KRW | | | 212,431,176 | | | | 185,403 | | | | 04/08/16 | | | | (2,289 | ) |
| | USD | | | 283,219 | | | SEK | | | 2,361,530 | | | | 291,158 | | | | 04/26/16 | | | | (7,940 | ) |
Westpac Banking Corp. | | USD | | | 700,615 | | | AUD | | | 922,056 | | | | 705,956 | | | | 04/26/16 | | | | (5,341 | ) |
| | USD | | | 1,079,000 | | | CNH | | | 7,188,862 | | | | 1,103,746 | | | | 09/01/16 | | | | (24,746 | ) |
| | USD | | | 417,570 | | | EUR | | | 368,000 | | | | 419,073 | | | | 04/26/16 | | | | (1,504 | ) |
| | USD | | | 399,603 | | | IDR | | | 5,306,728,000 | | | | 402,077 | | | | 04/04/16 | | | | (2,474 | ) |
| | USD | | | 370,231 | | | IDR | | | 5,006,630,000 | | | | 380,253 | | | | 04/18/16 | | | | (10,022 | ) |
| | USD | | | 914,184 | | | INR | | | 62,852,458 | | | | 947,929 | | | | 04/07/16 | | | | (33,745 | ) |
| | USD | | | 209,084 | | | MYR | | | 866,402 | | | | 223,422 | | | | 04/11/16 | | | | (14,338 | ) |
| | USD | | | 1,010,592 | | | MYR | | | 4,153,181 | | | | 1,071,110 | | | | 04/20/16 | | | | (60,517 | ) |
| | USD | | | 2,152,232 | | | NZD | | | 3,197,112 | | | | 2,206,794 | | | | 04/26/16 | | | | (54,563 | ) |
| | | USD | | | 654,485 | | | TWD | | | 21,437,657 | | | | 666,864 | | | | 04/14/16 | | | | (12,379 | ) |
| TOTAL | | | | | | | | | | | | | | | | | | | | | | $ | (2,867,521 | ) |
FORWARD SALES CONTRACT — At March 31, 2016, the Fund had the following forward sales contracts:
| | | | | | | | | | | | | | | | | | |
| Description | | Interest
Rate | | | Maturity
Date(a) | | Settlement
Date | | | Principal
Amount | | | Value | |
FNMA (Proceeds Received: $(24,049,063)) | | | 3.500 | % | | TBA-30yr | | | 04/13/16 | | | $ | (23,000,000 | ) | | $ | (24,117,657 | ) |
| | (a) | | TBA (To Be Announced) Securities are purchased or sold on a forward commitment basis with an approximate principal amount and no defined maturity date. The actual principal and maturity date will be determined upon settlement when the specific mortgage pools are assigned. |
| | |
| The accompanying notes are an integral part of these financial statements. | | 47 |
GOLDMAN SACHS BOND FUND
Schedule of Investments (continued)
March 31, 2016
|
| ADDITIONAL INVESTMENT INFORMATION (continued) |
FUTURES CONTRACTS — At March 31, 2016, the Fund had the following futures contracts:
| | | | | | | | | | | | | | |
| Type | | Number of Contracts Long (Short) | | | Expiration Date | | Current Value | | | Unrealized Gain (Loss) | |
Australian 10 Year Government Bonds | | | 33 | | | June 2016 | | $ | 3,312,631 | | | $ | 22,088 | |
Ultra Long U.S. Treasury Bonds | | | 32 | | | June 2016 | | | 5,521,000 | | | | 10,560 | |
5 Year German Euro-Bobl | | | 2 | | | June 2016 | | | 298,357 | | | | (595 | ) |
2 Year U.S. Treasury Notes | | | 178 | | | June 2016 | | | 38,937,500 | | | | 29,882 | |
5 Year U.S. Treasury Notes | | | (75 | ) | | June 2016 | | | (9,087,305 | ) | | | (92,862 | ) |
5 Year U.S. Treasury Notes | | | 161 | | | June 2016 | | | 19,507,414 | | | | 30,491 | |
10 Year U.S. Treasury Notes | | | (185 | ) | | June 2016 | | | (24,122,266 | ) | | | (42,148 | ) |
20 Year U.S. Treasury Bonds | | | 43 | | | June 2016 | | | 7,070,813 | | | | 94,094 | |
| TOTAL | | | $ | 51,510 | |
SWAP CONTRACTS — At March 31, 2016, the Fund had the following swap contracts:
OVER THE COUNTER INTEREST RATE SWAP CONTRACTS
| | | | | | | | | | | | | | | | | | | | | | | | |
| | | | | | | | | | | | Rates Exchanged | | | | |
| Counterparty | | Notional Amount (000s) | | | Termination Date | | | Payments Received | | | Payments Made | | | Unrealized
Gain (Loss)* | |
Barclays Bank PLC | | | MYR | | | | 380 | | | | 08/14/23 | | | | 3 month KLIBOR | | | | 4.485% | | | $ | (4,238 | ) |
| | | KRW | | | | 2,447,430 | (b) | | | 10/01/25 | | | | 3 month KWCDC | | | | 2.160 | | | | (48,328 | ) |
Citibank NA | | | | | | | 1,102,660 | | | | 10/06/17 | | | | 2.239% | | | | 3 month KWCDC | | | | 13,062 | |
| | | MYR | | | | 1,220 | | | | 11/19/18 | | | | 3 month KLIBOR | | | | 3.915 | | | | (2,678 | ) |
| | | | | | | 775 | | | | 11/15/23 | | | | 3 month KLIBOR | | | | 4.450 | | | | (8,250 | ) |
Deutsche Bank AG | | | KRW | | | | 765,310 | | | | 10/06/17 | | | | 2.245 | | | | 3 month KWCDC | | | | 9,139 | |
| | | | | | | 3,978,210 | | | | 10/15/17 | | | | 2.253 | | | | 3 month KWCDC | | | | 47,936 | |
| | | MYR | | | | 1,100 | | | | 11/14/18 | | | | 3 month KLIBOR | | | | 3.880 | | | | (2,152 | ) |
| | | | | | | 330 | | | | 08/14/23 | | | | 3 month KLIBOR | | | | 4.490 | | | | (3,708 | ) |
JPMorgan Securities, Inc. | | | MYR | | | | 420 | | | | 09/26/23 | | | | 3 month KLIBOR | | | | 4.330 | | | | (3,544 | ) |
| | | KRW | | | | 133,720 | | | | 01/15/24 | | | | 3 month KWCDC | | | | 3.445 | | | | (17,480 | ) |
| | | | | | | 878,070 | (b) | | | 11/09/25 | | | | 2.236 | | | | 3 month KWCDC | | | | 20,096 | |
| | | | | | | 1,183,800 | (b) | | | 11/10/25 | | | | 2.330 | | | | 3 month KWCDC | | | | 31,758 | |
Morgan Stanley & Co. International PLC | | | | | | | 1,213,740 | | | | 10/29/17 | | | | 2.175 | | | | 3 month KWCDC | | | | 13,326 | |
| | | MYR | | | | 1,440 | | | | 11/20/18 | | | | 3 month KLIBOR | | | | 3.934 | | | | (3,377 | ) |
| | | | | | | | 374,240 | (b) | | | 11/11/25 | | | | 2.297 | | | | 3 month KWCDC | | | | 9,523 | |
| TOTAL | | | | | | | | | | | | | | | | | | | | | | $ | 51,085 | |
| | * | | There are no upfront payments on the swap contracts (s), therefore the unrealized gain (loss) on the swap contracts is equal to their market value. |
| | (b) | | Represents forward starting interest rate swaps whose effective dates of commencement of accruals and cash flows occur subsequent to March 31, 2016. |
| | |
| 48 | | The accompanying notes are an integral part of these financial statements. |
GOLDMAN SACHS BOND FUND
|
| ADDITIONAL INVESTMENT INFORMATION (continued) |
CENTRALLY CLEARED INTEREST RATE SWAP CONTRACTS
| | | | | | | | | | | | | | | | | | |
| | | | | | | Rates Exchanged | | Market Value | |
Notional Amount (000s) | | | Termination
Date | | | Payments Received | | Payments Made | | Upfront Payments
Made (Received) | | | Unrealized
Gain (Loss) | |
| MXN | 28,730 | | | | 11/07/16 | | | 3.910% | | Mexico Interbank TIIE
28 Days | | $ | 4 | | | $ | (3,809 | ) |
| | 12,210 | | | | 11/08/16 | | | 3.920 | | Mexico Interbank TIIE
28 Days | | | 2 | | | | (1,585 | ) |
| | 24,710 | | | | 11/09/16 | | | 3.900 | | Mexico Interbank TIIE
28 Days | | | 4 | | | | (3,401 | ) |
| SEK | 126,750 | (b) | | | 06/15/18 | | | 0.050 | | 3 month STIBOR | | | 122,617 | | | | (10,439 | ) |
| EUR | 13,200 | (b) | | | 02/17/19 | | | 6 month EURO | | 0.086% | | | 1,131 | | | | (8,859 | ) |
| | 5,300 | (b) | | | 02/09/20 | | | 6 month EURO | | 0.100 | | | (3,374 | ) | | | (6,401 | ) |
| | 14,480 | (b) | | | 02/26/20 | | | 0.050 | | 6 month EURO | | | 6,214 | | | | 1,324 | |
| GBP | 3,220 | (b) | | | 02/16/21 | | | 6 month GBP | | 1.160 | | | (3,797 | ) | | | (770 | ) |
| CAD | 47,380 | (b) | | | 06/15/21 | | | 1.000 | | 6 month CDOR | | | 2,805 | | | | 3,897 | |
| AUD | 5,110 | (b) | | | 06/15/21 | | | 2.500 | | 6 month AUDOR | | | 13,372 | | | | 16,982 | |
| $ | 23,510 | (b) | | | 06/15/21 | | | 3 month LIBOR | | 2.000 | | | (678,479 | ) | | | (207,907 | ) |
| SEK | 151,520 | (b) | | | 06/15/21 | | | 3 month STIBOR | | 0.500 | | | (139,835 | ) | | | 5,170 | |
| GBP | 4,780 | (b) | | | 06/15/21 | | | 6 month GBP | | 1.750 | | | (249,524 | ) | | | 7,458 | |
| | 3,410 | (b) | | | 12/11/22 | | | 6 month GBP | | 1.940 | | | (12,906 | ) | | | (142,571 | ) |
| EUR | 1,780 | (b) | | | 02/09/23 | | | 0.500 | | 6 month EURO | | | 2,096 | | | | 13,546 | |
| | 11,100 | (b) | | | 06/15/23 | | | 0.750 | | 6 month EURO | | | 365,794 | | | | 70,221 | |
| JPY | 2,118,080 | (b) | | | 06/15/23 | | | 6 month JYOR | | 0.100 | | | (95,428 | ) | | | (5,273 | ) |
| GBP | 3,160 | (b) | | | 02/16/25 | | | 1.570 | | 6 month GBP | | | 13,372 | | | | 7,871 | |
| EUR | 2,950 | (b) | | | 05/11/25 | | | 1.567 | | 6 month EURO | | | 91,813 | | | | 25,297 | |
| | 21,930 | (b) | | | 05/11/25 | | | 1.567 | | 6 month EURO | | | (107,910 | ) | | | 978,495 | |
| NOK | 6,510 | (b) | | | 06/17/25 | | | 3 month NIBOR | | 2.500 | | | (8,324 | ) | | | (18,142 | ) |
| ZAR | 6,340 | (b) | | | 08/24/25 | | | 3 month JIBAR | | 9.145 | | | 3,074 | | | | (1,809 | ) |
| EUR | 5,735 | (b) | | | 09/16/25 | | | 2.000 | | 6 month EURO | | | 104,474 | | | | 237,982 | |
| GBP | 5,115 | (b) | | | 09/16/25 | | | 6 month GBP | | 2.750 | | | (551,409 | ) | | | 217,754 | |
| ZAR | 10,510 | (b) | | | 09/28/25 | | | 9.370 | | 3 month JIBAR | | | 9 | | | | 2,171 | |
| | 4,700 | (b) | | | 10/27/25 | | | 9.200 | | 3 month JIBAR | | | 4 | | | | (552 | ) |
| | 38,090 | (b) | | | 12/10/25 | | | 10.065 | | 3 month JIBAR | | | 30 | | | | 55,379 | |
| | 7,310 | (b) | | | 12/11/25 | | | 10.455 | | 3 month JIBAR | | | 6 | | | | 15,818 | |
| JPY | 1,108,160 | (b) | | | 12/16/25 | | | 6 month JYOR | | 1.000 | | | (460,406 | ) | | | 134,668 | |
| EUR | 15,180 | (b) | | | 01/06/26 | | | 1.550 | | 6 month EURO | | | 435,121 | | | | 25,992 | |
| ZAR | 6,480 | (b) | | | 01/20/26 | | | 10.130 | | 3 month JIBAR | | | 5 | | | | 10,024 | |
| PLN | 1,610 | (b) | | | 01/20/26 | | | 3.295 | | 6 month WIBOR | | | 5 | | | | 11,656 | |
| | 3,310 | (b) | | | 01/22/26 | | | 3.125 | | 6 month WIBOR | | | 10 | | | | 17,419 | |
| | 1,550 | (b) | | | 01/25/26 | | | 3.155 | | 6 month WIBOR | | | 5 | | | | 8,715 | |
| AUD | 4,050 | (b) | | | 03/24/26 | | | 3.100 | | 6 month AUDOR | | | 13,104 | | | | 9,931 | |
| EUR | 29,900 | (b) | | | 06/15/26 | | | 1.000 | | 6 month EURO | | | 1,449,072 | | | | 9,533 | |
| $ | 7,980 | (b) | | | 06/15/26 | | | 3 month LIBOR | | 2.250 | | | (288,173 | ) | | | (139,151 | ) |
| NZD | 8,960 | (b) | | | 06/15/26 | | | 3 month NZDOR | | 3.000 | | | 68,273 | | | | (61,557 | ) |
| SEK | 53,090 | (b) | | | 06/15/26 | | | 3 month STIBOR | | 1.250 | | | (23,346 | ) | | | (11,984 | ) |
| AUD | 16,870 | (b) | | | 06/15/26 | | | 3.000 | | 6 month AUDOR | | | 342,884 | | | | 91,528 | |
| | 4,370 | (b) | | | 06/16/26 | | | 3.000 | | 6 month AUDOR | | | 73,259 | | | | 39,204 | |
| $ | 5,840 | (b) | | | 12/15/26 | | | 2.500 | | 3 month LIBOR | | | 53,091 | | | | 18,709 | |
| EUR | 1,410 | (b) | | | 12/15/26 | | | 6 month EURO | | 1.500 | | | (20,662 | ) | | | (2,987 | ) |
| GBP | 6,000 | (b) | | | 12/11/27 | | | 2.190 | | 6 month GBP | | | 40,592 | | | | 390,100 | |
| | 3,060 | (b) | | | 12/11/32 | | | 6 month GBP | | 2.250 | | | (21,931 | ) | | | (259,525 | ) |
| | 910 | (b) | | | 02/16/33 | | | 6 month GBP | | 1.820 | | | (5,679 | ) | | | 462 | |
| EUR | 7,480 | (b) | | | 05/11/35 | | | 6 month EURO | | 1.695 | | | (160,470 | ) | | | (328,430 | ) |
| | |
| The accompanying notes are an integral part of these financial statements. | | 49 |
GOLDMAN SACHS BOND FUND
Schedule of Investments (continued)
March 31, 2016
|
| ADDITIONAL INVESTMENT INFORMATION (continued) |
CENTRALLY CLEARED INTEREST RATE SWAP CONTRACTS (continued)
| | | | | | | | | | | | | | | | | | |
| | | | | | Rates Exchanged | | Market Value | |
Notional Amount (000s) | | | Termination Date | | Payments Received | | | Payments Made | | Upfront Payments
Made (Received) | | | Unrealized
Gain (Loss) | |
| $ | 7,860 | (b) | | 12/17/35 | | | 3.000% | | | 3 month LIBOR | | $ | 299,232 | | | $ | 9,767 | |
| JPY | 1,001,450 | (b) | | 12/17/35 | | | 6 month JYOR | | | 2.000% | | | (880,696 | ) | | | (105,194 | ) |
| | 260,540 | (b) | | 03/30/36 | | | 6 month JYOR | | | 0.900 | | | (5,052 | ) | | | (3,279 | ) |
| | 105,670 | (b) | | 06/15/36 | | | 6 month JYOR | | | 0.500 | | | 946 | | | | 222 | |
| EUR | 2,560 | (b) | | 12/19/45 | | | 1.250 | | | 6 month EURO | | | (393 | ) | | | 32,978 | |
| $ | 7,820 | (b) | | 12/19/45 | | | 2.750 | | | 3 month LIBOR | | | 161,773 | | | | 845 | |
| JPY | 1,086,670 | (b) | | 12/19/45 | | | 6 month JYOR | | | 2.000 | | | (706,680 | ) | | | (297,885 | ) |
| GBP | 4,300 | (b) | | 01/05/46 | | | 6 month GBP | | | 2.250 | | | (164,440 | ) | | $ | (261,812 | ) |
| $ | 460 | (b) | | 06/15/46 | | | 2.500 | | | 3 month LIBOR | | | 36,026 | | | | 1,604 | |
| GBP | 6,370 | (b) | | 06/15/46 | | | 6 month GBP | | | 2.000 | | | (807,762 | ) | | | 24,148 | |
| | TOTAL | | | | | | | | | | | $ | (1,696,457 | ) | | $ | 613,548 | |
| | (b) | | Represents forward starting interest rate swaps whose effective dates of commencement of accruals and cash flows occur subsequent to March 31, 2016. |
OVER THE COUNTER CREDIT DEFAULT SWAP CONTRACTS
| | | | | | | | | | | | | | | | | | | | | | | | | | |
| | | | | | | | | | | | | | | | | Market Value | |
| Counterparty | | Referenced Obligation | | Notional
Amount
(000s) | | | Rates Received
(Paid) | | | Termination
Date | | | Credit
Spread at
March 31,
2016(c) | | | Upfront
Payments
Made (Received) | | | Unrealized
Gain (Loss) | |
Protection Purchased: | | | | | | | | | | | | | | | | | | | | | | | | | | |
Bank of America Securities LLC | | People’s Republic of China 7.500%, 10/28/27 | | $ | 60 | | | | (1.000 | )% | | | 06/20/19 | | | | 0.791 | % | | $ | (231 | ) | | $ | (185 | ) |
| | | | | 40 | | | | (1.000 | ) | | | 06/20/19 | | | | 0.791 | | | | (171 | ) | | | (106 | ) |
| | | | | 830 | | | | (1.000 | ) | | | 12/20/20 | | | | 1.128 | | | | 4,652 | | | | (45 | ) |
Barclays Bank PLC | | | | | 270 | | | | (1.000 | ) | | | 03/20/19 | | | | 0.752 | | | | (624 | ) | | | (1,422 | ) |
Citibank NA | | | | | 2,860 | | | | (1.000 | ) | | | 03/20/19 | | | | 0.752 | | | | (8,292 | ) | | | (13,384 | ) |
| | | | | 4,390 | | | | (1.000 | ) | | | 06/20/19 | | | | 0.791 | | | | (12,834 | ) | | | (17,564 | ) |
| | | | | 720 | | | | (1.000 | ) | | | 12/20/20 | | | | 1.128 | | | | 5,740 | | | | (1,784 | ) |
| | | | | 220 | | | | (1.000 | ) | | | 03/20/19 | | | | 0.752 | | | | (247 | ) | | | (1,420 | ) |
JPMorgan Securities, Inc. | | | | | 270 | | | | (1.000 | ) | | | 03/20/19 | | | | 0.752 | | | | (563 | ) | | | (1,484 | ) |
| | | | | 120 | | | | (1.000 | ) | | | 06/20/19 | | | | 0.791 | | | | (522 | ) | | | (308 | ) |
| | | | | | 6,410 | | | | (1.000 | ) | | | 12/20/20 | | | | 1.128 | | | | 47,489 | | | | (12,046 | ) |
| TOTAL | | | | | | | | | | | | | | | | | | | | $ | 34,397 | | | $ | (49,748 | ) |
| | (c) | | Credit spread on the Referenced Obligation, together with the term of the swap contract, are indicators of payment/performance risk. The likelihood of a credit event occurring which would require a fund to make a payment or otherwise be required to perform under the swap contract is generally greater as the credit spread and the term of the swap contract increase. |
| | |
| 50 | | The accompanying notes are an integral part of these financial statements. |
GOLDMAN SACHS BOND FUND
|
| ADDITIONAL INVESTMENT INFORMATION (continued) |
CENTRALLY CLEARED CREDIT DEFAULT SWAP CONTRACT
| | | | | | | | | | | | | | | | | | | | | | |
| | | | Market Value | |
| Referenced Obligation | | Notional
Amount
(000s) | | Rates Received
(Paid) | | | Termination
Date | | | Credit
Spread at
March 31,
2016(c) | | | Upfront
Payments
Made (Received) | | | Unrealized
Gain (Loss) | |
Protection Sold: | | | | | | | | | | | | | | | | | | | | | | |
CDX North America Investment Grade Index 25 | | $24,775 | | | 1.000 | % | | | 12/20/20 | | | | 0.899 | % | | $ | 118,465 | | | $ | 1,739 | |
| | (c) | | Credit spread on the Referenced Obligation, together with the term of the swap contract, are indicators of payment/performance risk. The likelihood of a credit event occurring which would require a fund to make a payment or otherwise be required to perform under the swap contract is generally greater as the credit spread and the term of the swap contract increase. |
For the fiscal year ended March 31, 2016, the Fund had the following interest rate swaptions activities:
INTEREST RATE SWAPTION CONTRACTS
| | | | | | | | |
| | | Notional
Amount
(000s) | | | Premiums
Received | |
Contracts Outstanding March 31, 2015 | | $ | — | | | $ | — | |
Contracts Written | | | 11,400 | | | | 264,960 | |
Contracts Bought to Close | | | (11,400 | ) | | | (264,960 | ) |
Contracts Outstanding March 31, 2016 | | $ | — | | | $ | — | |
| | |
| The accompanying notes are an integral part of these financial statements. | | 51 |
GOLDMAN SACHS CORE FIXED INCOME FUND
Schedule of Investments
March 31, 2016
| | | | | | | | | | | | | | |
Principal Amount | | | Interest Rate | | | Maturity Date | | | Value | |
| | | | | | | | | | | | | | |
| | Corporate Obligations – 35.1% | |
| | Automotive – 0.7% | |
| Ford Motor Credit Co. LLC | |
| $ | 3,250,000 | | | | 5.875 | % | | | 08/02/21 | | | $ | 3,714,834 | |
| General Motors Financial Co., Inc. | |
| | 1,125,000 | | | | 3.250 | | | | 05/15/18 | | | | 1,139,090 | |
| | 1,755,000 | | | | 3.500 | | | | 07/10/19 | | | | 1,789,514 | |
| | | | | | | | | | | | | | |
| | | | | | | | | | | | | 6,643,438 | |
| | |
| | Banks – 6.9% | |
| American Express Co.(a) | |
| | 700,000 | | | | 3.625 | | | | 12/05/24 | | | | 696,931 | |
| | 2,475,000 | | | | 6.800 | (b) | | | 09/01/66 | | | | 2,468,812 | |
| Banco Bilbao Vizcaya Argentaria SA | |
| | 3,125,000 | | | | 3.000 | | | | 10/20/20 | | | | 3,150,585 | |
| Bank of America Corp. | |
| | 3,050,000 | | | | 4.125 | | | | 01/22/24 | | | | 3,214,541 | |
| | 2,300,000 | | | | 4.000 | | | | 04/01/24 | | | | 2,406,793 | |
| Bank of Scotland PLC(c) | |
| | 400,000 | | | | 5.250 | | | | 02/21/17 | | | | 414,301 | |
| BNP Paribas SA(a)(b)(c) | |
| | 925,000 | | | | 7.625 | | | | 12/29/49 | | | | 930,087 | |
| Compass Bank(a) | |
| | 875,000 | | | | 1.850 | | | | 09/29/17 | | | | 870,670 | |
| | 1,000,000 | | | | 2.750 | | | | 09/29/19 | | | | 987,982 | |
| Credit Suisse AG | |
| | 1,475,000 | | | | 2.300 | | | | 05/28/19 | | | | 1,487,755 | |
| Credit Suisse Group Funding Guernsey Ltd. | |
| | 475,000 | | | | 3.750 | | | | 03/26/25 | | | | 452,149 | |
| Discover Financial Services(a) | |
| | 1,625,000 | | | | 3.750 | | | | 03/04/25 | | | | 1,572,884 | |
| ING Bank NV(a)(b) | |
| | 2,025,000 | | | | 4.125 | | | | 11/21/23 | | | | 2,042,354 | |
| Intesa Sanpaolo SpA | |
| | 1,175,000 | | | | 2.375 | | | | 01/13/17 | | | | 1,180,097 | |
| | 2,800,000 | | | | 3.875 | | | | 01/16/18 | | | | 2,865,067 | |
| | 1,550,000 | | | | 5.017 | (c) | | | 06/26/24 | | | | 1,453,570 | |
| | 850,000 | | | | 5.710 | (c) | | | 01/15/26 | | | | 827,937 | |
| JPMorgan Chase & Co.(a)(b) | |
| | 2,250,000 | | | | 5.300 | | | | 12/29/49 | | | | 2,255,625 | |
| KBC Bank NV(a)(b) | |
| | 1,600,000 | | | | 8.000 | | | | 01/25/23 | | | | 1,724,000 | |
| Keycorp | |
| | 4,350,000 | | | | 2.900 | | | | 09/15/20 | | | | 4,384,992 | |
| Lloyds Bank PLC | |
| | 1,575,000 | | | | 2.300 | | | | 11/27/18 | | | | 1,587,616 | |
| Macquarie Bank Ltd.(c) | |
| | 1,175,000 | | | | 6.625 | | | | 04/07/21 | | | | 1,336,983 | |
| Mitsubishi UFJ Financial Group, Inc. | |
| | 325,000 | | | | 2.950 | | | | 03/01/21 | | | | 331,467 | |
| | 1,350,000 | | | | 3.850 | | | | 03/01/26 | | | | 1,403,752 | |
| Nationwide Building Society(c) | |
| | 1,950,000 | | | | 3.900 | | | | 07/21/25 | | | | 2,058,085 | |
| PNC Preferred Funding Trust II(a)(b)(c) | |
| | 2,500,000 | | | | 1.856 | | | | 03/29/49 | | | | 2,100,000 | |
| Royal Bank of Scotland Group PLC | |
| | 1,700,000 | | | | 5.125 | | | | 05/28/24 | | | | 1,639,618 | |
| | |
| | | | | | | | | | | | | | |
| | Corporate Obligations – (continued) | |
| | Banks – (continued) | |
| Royal Bank of Scotland PLC(a)(b) | |
| $ | 1,025,000 | | | | 9.500 | % | | | 03/16/22 | | | $ | 1,086,500 | |
| Santander Bank NA | |
| | 1,900,000 | | | | 2.000 | (a) | | | 01/12/18 | | | | 1,883,908 | |
| | 975,000 | | | | 8.750 | | | | 05/30/18 | | | | 1,086,360 | |
| Santander Holdings USA, Inc.(a) | |
| | 650,000 | | | | 2.650 | | | | 04/17/20 | | | | 638,788 | |
| Santander UK Group Holdings PLC | |
| | 1,375,000 | | | | 2.875 | | | | 10/16/20 | | | | 1,369,075 | |
| | 1,125,000 | | | | 4.750 | (c) | | | 09/15/25 | | | | 1,070,269 | |
| Santander UK PLC(c) | |
| | 1,125,000 | | | | 5.000 | | | | 11/07/23 | | | | 1,141,769 | |
| Synchrony Financial(a) | |
| | 1,625,000 | | | | 2.600 | | | | 01/15/19 | | | | 1,628,515 | |
| | 1,900,000 | | | | 3.000 | | | | 08/15/19 | | | | 1,916,879 | |
| The Bank of Tokyo-Mitsubishi UFJ Ltd.(c) | |
| | 2,700,000 | | | | 2.150 | | | | 09/14/18 | | | | 2,714,124 | |
| UBS Group Funding Jersey Ltd.(c) | |
| | 3,350,000 | | | | 4.125 | | | | 09/24/25 | | | | 3,354,777 | |
| | | | | | | | | | | | | | |
| | | | | | | | | | | | | 63,735,617 | |
| | |
| | Brokerage – 0.8% | |
| Morgan Stanley, Inc. | |
| | 4,700,000 | | | | 3.700 | | | | 10/23/24 | | | | 4,827,135 | |
| | 700,000 | | | | 4.000 | | | | 07/23/25 | | | | 731,320 | |
| TD Ameritrade Holding Corp.(a) | |
| | 1,950,000 | | | | 2.950 | | | | 04/01/22 | | | | 1,989,202 | |
| | | | | | | | | | | | | | |
| | | | | | | | | | | | | 7,547,657 | |
| | |
| | Chemicals – 0.4% | |
| Ecolab, Inc. | |
| | 975,000 | | | | 5.500 | | | | 12/08/41 | | | | 1,107,960 | |
| Monsanto Co.(a) | |
| | 1,175,000 | | | | 4.400 | | | | 07/15/44 | | | | 1,087,185 | |
| Solvay Finance America LLC(a)(c) | |
| | 1,575,000 | | | | 3.400 | | | | 12/03/20 | | | | 1,601,164 | |
| | | | | | | | | | | | | | |
| | | | | | | | | | | | | 3,796,309 | |
| | |
| | Consumer Products – 0.3% | |
| Kimberly-Clark Corp. | |
| | 1,525,000 | | | | 3.700 | | | | 06/01/43 | | | | 1,535,363 | |
| Newell Rubbermaid, Inc. | |
| | 1,275,000 | | | | 2.600 | | | | 03/29/19 | | | | 1,293,943 | |
| | | | | | | | | | | | | | |
| | | | | | | | | | | | | 2,829,306 | |
| | |
| | Diversified Financial Services(c) – 0.1% | |
| GE Capital International Funding Co. | |
| | 1,110,000 | | | | 4.418 | | | | 11/15/35 | | | | 1,202,600 | |
| | |
| | Diversified Manufacturing(a) – 0.1% | |
| Roper Technologies, Inc. | |
| | 1,300,000 | | | | 3.000 | | | | 12/15/20 | | | | 1,323,802 | |
| | |
| | Electric – 0.8% | | | | | | | | | |
| Florida Power & Light Co.(a) | |
| | 2,132,000 | | | | 4.125 | | | | 02/01/42 | | | | 2,276,384 | |
| Pacific Gas & Electric Co.(a) | |
| | 975,000 | | | | 3.500 | | | | 06/15/25 | | | | 1,026,040 | |
| | |
| | |
| 52 | | The accompanying notes are an integral part of these financial statements. |
GOLDMAN SACHS CORE FIXED INCOME FUND
| | | | | | | | | | | | | | |
Principal Amount | | | Interest Rate | | | Maturity Date | | | Value | |
| | | | | | | | | | | | | | |
| | Corporate Obligations – (continued) | |
| | Electric – (continued) | | | | | | | | | |
| Puget Sound Energy, Inc.(a)(b) | |
| $ | 1,230,000 | | | | 6.974 | % | | | 06/01/67 | | | $ | 937,875 | |
| Ruwais Power Co. PJSC(c) | |
| | 740,000 | | | | 6.000 | | | | 08/31/36 | | | | 802,900 | |
| Southern California Edison Co.(a) | |
| | 1,950,000 | | | | 4.050 | | | | 03/15/42 | | | | 1,993,705 | |
| | | | | | | | | | | | | | |
| | | | | | | | | | | | | 7,036,904 | |
| | |
| | Energy – 1.8% | |
| Anadarko Petroleum Corp. | |
| | 190,000 | | | | 3.450 | (a) | | | 07/15/24 | | | | 169,798 | |
| | 1,125,000 | | | | 6.450 | | | | 09/15/36 | | | | 1,121,146 | |
| Apache Corp.(a) | |
| | 275,000 | | | | 3.250 | | | | 04/15/22 | | | | 263,929 | |
| | 1,375,000 | | | | 4.250 | | | | 01/15/44 | | | | 1,173,249 | |
| ConocoPhillips Co.(a) | |
| | 850,000 | | | | 4.200 | | | | 03/15/21 | | | | 887,790 | |
| | 1,510,000 | | | | 3.350 | | | | 11/15/24 | | | | 1,437,487 | |
| | 725,000 | | | | 4.950 | | | | 03/15/26 | | | | 758,328 | |
| | 900,000 | | | | 4.150 | | | | 11/15/34 | | | | 787,103 | |
| Devon Energy Corp.(a) | |
| | 250,000 | | | | 4.000 | | | | 07/15/21 | | | | 220,000 | |
| | 425,000 | | | | 5.600 | | | | 07/15/41 | | | | 329,668 | |
| | 825,000 | | | | 4.750 | | | | 05/15/42 | | | | 610,771 | |
| Dolphin Energy Ltd.(c) | |
| | 415,164 | | | | 5.888 | | | | 06/15/19 | | | | 443,188 | |
| Halliburton Co.(a) | |
| | 1,425,000 | | | | 3.375 | | | | 11/15/22 | | | | 1,447,186 | |
| | 1,475,000 | | | | 3.800 | | | | 11/15/25 | | | | 1,470,949 | |
| Occidental Petroleum Corp.(a) | |
| | 1,650,000 | | | | 3.400 | | | | 04/15/26 | | | | 1,668,691 | |
| Petroleos Mexicanos(c) | |
| | 250,000 | | | | 5.500 | | | | 02/04/19 | | | | 261,250 | |
| | 610,000 | | | | 6.375 | | | | 02/04/21 | | | | 649,040 | |
| | 470,000 | | | | 6.875 | | | | 08/04/26 | | | | 507,600 | |
| Pioneer Natural Resources Co.(a) | |
| | 1,450,000 | | | | 3.450 | | | | 01/15/21 | | | | 1,441,735 | |
| Valero Energy Corp. | |
| | 950,000 | | | | 3.650 | | | | 03/15/25 | | | | 933,309 | |
| | | | | | | | | | | | | | |
| | | | | | | | | | | | | 16,582,217 | |
| | |
| | Food & Beverage – 3.1% | |
| Amazon.com, Inc.(a) | |
| | 2,650,000 | | | | 3.300 | | | | 12/05/21 | | | | 2,813,685 | |
| Anheuser-Busch InBev Finance, Inc.(a) | |
| | 6,000,000 | | | | 2.650 | | | | 02/01/21 | | | | 6,162,930 | |
| | 4,550,000 | | | | 3.650 | | | | 02/01/26 | | | | 4,781,530 | |
| | 800,000 | | | | 4.900 | | | | 02/01/46 | | | | 896,783 | |
| CVS Health Corp.(a) | |
| | 1,100,000 | | | | 4.125 | | | | 05/15/21 | | | | 1,201,218 | |
| | 2,100,000 | | | | 3.500 | | | | 07/20/22 | | | | 2,251,282 | |
| | 2,150,000 | | | | 3.375 | | | | 08/12/24 | | | | 2,252,880 | |
| | |
| | | | | | | | | | | | | | |
| | Corporate Obligations – (continued) | |
| | Food & Beverage – (continued) | |
| Kraft Heinz Foods Co.(a)(c) | |
| $ | 1,050,000 | | | | 2.800 | % | | | 07/02/20 | | | $ | 1,073,401 | |
| | 1,550,000 | | | | 3.950 | | | | 07/15/25 | | | | 1,648,880 | |
| Pernod-Ricard SA(c) | |
| | 2,300,000 | | | | 4.450 | | | | 01/15/22 | | | | 2,482,772 | |
| SABMiller Holdings, Inc.(c) | |
| | 525,000 | | | | 4.950 | | | | 01/15/42 | | | | 585,751 | |
| Suntory Holdings Ltd.(c) | |
| | 2,550,000 | | | | 2.550 | | | | 09/29/19 | | | | 2,587,118 | |
| Walgreens Boots Alliance, Inc.(a) | |
| | 450,000 | | | | 2.700 | | | | 11/18/19 | | | | 458,784 | |
| | | | | | | | | | | | | | |
| | | | | | | | | | | | | 29,197,014 | |
| | |
| | Health Care – Services – 0.5% | |
| Cigna Corp.(a) | |
| | 1,675,000 | | | | 3.250 | | | | 04/15/25 | | | | 1,664,085 | |
| UnitedHealth Group, Inc. | |
| | 950,000 | | | | 4.625 | | | | 07/15/35 | | | | 1,057,788 | |
| | 2,000,000 | | | | 4.750 | | | | 07/15/45 | | | | 2,298,951 | |
| | | | | | | | | | | | | | |
| | | | | | | | | | | | | 5,020,824 | |
| | |
| | Health Care Products – 0.8% | |
| Becton Dickinson & Co. | |
| | 2,000,000 | | | | 2.675 | | | | 12/15/19 | | | | 2,043,229 | |
| Medtronic, Inc. | |
| | 725,000 | | | | 2.500 | | | | 03/15/20 | | | | 749,715 | |
| | 1,275,000 | | | | 3.150 | | | | 03/15/22 | | | | 1,341,750 | |
| Stryker Corp.(a) | |
| | 575,000 | | | | 2.625 | | | | 03/15/21 | | | | 586,581 | |
| | 1,400,000 | | | | 3.375 | | | | 11/01/25 | | | | 1,436,268 | |
| | 575,000 | | | | 3.500 | | | | 03/15/26 | | | | 597,387 | |
| Thermo Fisher Scientific, Inc.(a) | |
| | 1,025,000 | | | | 3.650 | | | | 12/15/25 | | | | 1,046,895 | |
| | | | | | | | | | | | | | |
| | | | | | | | | | | | | 7,801,825 | |
| | |
| | Home Construction – 0.3% | |
| MDC Holdings, Inc. | |
| | 1,950,000 | | | | 5.625 | | | | 02/01/20 | | | | 1,982,259 | |
| | 1,350,000 | | | | 6.000 | (a) | | | 01/15/43 | | | | 1,056,089 | |
| | | | | | | | | | | | | | |
| | | | | | | | | | | | | 3,038,348 | |
| | |
| | Life Insurance(c) – 1.1% | |
| AIA Group Ltd.(a) | |
| | 1,525,000 | | | | 3.200 | | | | 03/11/25 | | | | 1,534,406 | |
| Meiji Yasuda Life Insurance Co.(a)(b) | |
| | 1,100,000 | | | | 5.200 | | | | 10/20/45 | | | | 1,186,020 | |
| Reliance Standard Life Global Funding II | |
| | 2,050,000 | | | | 2.500 | | | | 01/15/20 | | | | 2,056,673 | |
| Teachers Insurance & Annuity Association of America | |
| | 1,760,000 | | | | 4.900 | | | | 09/15/44 | | | | 1,885,926 | |
| The Northwestern Mutual Life Insurance Co. | |
| | 2,500,000 | | | | 6.063 | | | | 03/30/40 | | | | 3,072,890 | |
| | | | | | | | | | | | | | |
| | | | | | | | | | | | | 9,735,915 | |
| | |
| | |
| The accompanying notes are an integral part of these financial statements. | | 53 |
GOLDMAN SACHS CORE FIXED INCOME FUND
Schedule of Investments (continued)
March 31, 2016
| | | | | | | | | | | | | | |
Principal Amount | | | Interest Rate | | | Maturity Date | | | Value | |
| | | | | | | | | | | | | | |
| | Corporate Obligations – (continued) | |
| | Lodging(a) – 0.1% | | | | | | | | | | | | | |
| Marriott International, Inc. | |
| $ | 766,000 | | | | 2.875 | % | | | 03/01/21 | | | $ | 773,528 | |
| | |
| | Media – Cable – 0.7% | |
| CCO Safari II LLC(a)(c) | |
| | 350,000 | | | | 3.579 | | | | 07/23/20 | | | | 356,493 | |
| | 1,975,000 | | | | 4.908 | | | | 07/23/25 | | | | 2,087,998 | |
| Comcast Corp.(a) | |
| | 3,075,000 | | | | 3.375 | | | | 08/15/25 | | | | 3,271,557 | |
| Time Warner Cable, Inc. | |
| | 425,000 | | | | 5.000 | | | | 02/01/20 | | | | 460,243 | |
| | 202,000 | | | | 7.300 | | | | 07/01/38 | | | | 233,717 | |
| | 275,000 | | | | 5.875 | (a) | | | 11/15/40 | | | | 284,546 | |
| | | | | | | | | | | | | | |
| | | | | | | | | | | | | 6,694,554 | |
| | |
| | Media – Non Cable – 0.8% | |
| 21st Century Fox America, Inc.(a) | |
| | 2,900,000 | | | | 3.700 | | | | 09/15/24 | | | | 3,054,511 | |
| NBCUniversal Media LLC | |
| | 3,850,000 | | | | 4.375 | | | | 04/01/21 | | | | 4,295,265 | |
| Time Warner, Inc.(a) | |
| | 450,000 | | | | 3.875 | | | | 01/15/26 | | | | 471,601 | |
| | | | | | | | | | | | | | |
| | | | | | | | | | | | | 7,821,377 | |
| | |
| | Metals & Mining – 0.4% | |
| Freeport-McMoRan, Inc.(a) | |
| | 1,175,000 | | | | 5.400 | | | | 11/14/34 | | | | 719,687 | |
| Glencore Funding LLC(c) | |
| | 3,075,000 | | | | 2.700 | | | | 10/25/17 | | | | 3,013,500 | |
| | 228,000 | | | | 2.500 | | | | 01/15/19 | | | | 208,620 | |
| | | | | | | | | | | | | | |
| | | | | | | | | | | | | 3,941,807 | |
| | |
| | Noncaptive – Financial – 0.9% | |
| Capital One Financial Corp.(a) | |
| | 1,950,000 | | | | 4.200 | | | | 10/29/25 | | | | 1,983,017 | |
| General Electric Co. | |
| | 337,000 | | | | 6.150 | | | | 08/07/37 | | | | 454,481 | |
| International Lease Finance Corp. | |
| | 4,000,000 | | | | 5.750 | | | | 05/15/16 | | | | 4,000,000 | |
| | 1,400,000 | | | | 7.125 | (c) | | | 09/01/18 | | | | 1,524,250 | |
| | | | | | | | | | | | | | |
| | | | | | | | | | | | | 7,961,748 | |
| | |
| | Pharmaceuticals – 2.0% | |
| AbbVie, Inc.(a) | |
| | 1,950,000 | | | | 2.500 | | | | 05/14/20 | | | | 1,979,501 | |
| Actavis Funding SCS | |
| | 2,200,000 | | | | 2.350 | | | | 03/12/18 | | | | 2,225,644 | |
| | 525,000 | | | | 3.450 | (a) | | | 03/15/22 | | | | 542,929 | |
| | 1,935,000 | | | | 3.800 | (a) | | | 03/15/25 | | | | 2,010,106 | |
| | 1,225,000 | | | | 4.850 | (a) | | | 06/15/44 | | | | 1,304,514 | |
| Bayer US Finance LLC(c) | |
| | 2,775,000 | | | | 3.000 | | | | 10/08/21 | | | | 2,902,789 | |
| EMD Finance LLC(a)(c) | |
| | 3,325,000 | | | | 2.950 | | | | 03/19/22 | | | | 3,393,874 | |
| | |
| | | | | | | | | | | | | | |
| | Corporate Obligations – (continued) | |
| | Pharmaceuticals – (continued) | |
| Forest Laboratories LLC(a)(c) | |
| $ | 3,175,000 | | | | 4.375 | % | | | 02/01/19 | | | $ | 3,368,751 | |
| | 900,000 | | | | 5.000 | | | | 12/15/21 | | | | 1,004,781 | |
| | | | | | | | | | | | | | |
| | | | | | | | | | | | | 18,732,889 | |
| | |
| | Pipelines – 1.3% | |
| Columbia Pipeline Group, Inc.(a)(c) | |
| | 925,000 | | | | 3.300 | | | | 06/01/20 | | | | 915,380 | |
| | Enbridge, Inc.(a) | | | | | | | | | | | | | |
| | 700,000 | | | | 3.500 | | | | 06/10/24 | | | | 622,092 | |
| Energy Transfer Partners LP(a) | |
| | 175,000 | | | | 5.200 | | | | 02/01/22 | | | | 165,375 | |
| | 210,000 | | | | 3.600 | | | | 02/01/23 | | | | 181,175 | |
| | 125,000 | | | | 4.750 | | | | 01/15/26 | | | | 114,119 | |
| EnLink Midstream Partners LP(a) | |
| | 1,650,000 | | | | 4.150 | | | | 06/01/25 | | | | 1,266,375 | |
| Enterprise Products Operating LLC(a) | |
| | 215,000 | | | | 3.350 | | | | 03/15/23 | | | | 211,535 | |
| | 85,000 | | | | 3.750 | | | | 02/15/25 | | | | 84,591 | |
| | 2,900,000 | | | | 8.375 | (b) | | | 08/01/66 | | | | 2,291,000 | |
| | 1,350,000 | | | | 7.000 | (b) | | | 06/01/67 | | | | 955,125 | |
| Kinder Morgan, Inc.(a) | |
| | 1,850,000 | | | | 3.050 | | | | 12/01/19 | | | | 1,812,055 | |
| Sunoco Logistics Partners Operations LP(a) | |
| | 475,000 | | | | 4.250 | | | | 04/01/24 | | | | 431,700 | |
| Tennessee Gas Pipeline Co. | |
| | 425,000 | | | | 8.375 | | | | 06/15/32 | | | | 459,298 | |
| Western Gas Partners LP(a) | |
| | 1,050,000 | | | | 3.950 | | | | 06/01/25 | | | | 897,750 | |
| Williams Partners LP(a) | |
| | 1,600,000 | | | | 3.900 | | | | 01/15/25 | | | | 1,280,000 | |
| | | | | | | | | | | | | | |
| | | | | | | | | | | | | 11,687,570 | |
| | |
| | Property/Casualty Insurance – 0.5% | |
| Allied World Assurance Co. Holdings Ltd.(a) | |
| | 300,000 | | | | 4.350 | | | | 10/29/25 | | | | 301,513 | |
| American International Group, Inc.(a) | |
| | 1,000,000 | | | | 3.750 | | | | 07/10/25 | | | | 1,001,204 | |
| Arch Capital Group Ltd. | |
| | 1,200,000 | | | | 7.350 | | | | 05/01/34 | | | | 1,539,729 | |
| The Chubb Corp.(a)(b) | |
| | 1,125,000 | | | | 6.375 | | | | 03/29/67 | | | | 973,125 | |
| ZFS Finance USA Trust II(a)(b)(c) | |
| | 1,175,000 | | | | 6.450 | | | | 12/15/65 | | | | 1,172,650 | |
| | | | | | | | | | | | | | |
| | | | | | | | | | | | | 4,988,221 | |
| | |
| | Real Estate Investment Trusts – 2.4% | |
| American Campus Communities Operating Partnership LP(a) | |
| | 2,575,000 | | | | 3.750 | | | | 04/15/23 | | | | 2,600,615 | |
| Camden Property Trust | |
| | 3,575,000 | | | | 5.700 | | | | 05/15/17 | | | | 3,720,753 | |
| CubeSmart LP(a) | |
| | 1,500,000 | | | | 4.000 | | | | 11/15/25 | | | | 1,525,352 | |
| | HCP, Inc. | | | | | | | | | | | | | |
| | 2,250,000 | | | | 6.000 | | | | 01/30/17 | | | | 2,324,250 | |
| | |
| | |
| 54 | | The accompanying notes are an integral part of these financial statements. |
GOLDMAN SACHS CORE FIXED INCOME FUND
| | | | | | | | | | | | | | |
Principal Amount | | | Interest Rate | | | Maturity Date | | | Value | |
| | Corporate Obligations – (continued) | |
| | Real Estate Investment Trusts – (continued) | |
| Healthcare Trust of America Holdings LP(a) | |
| $ | 2,275,000 | | | | 3.700 | % | | | 04/15/23 | | | $ | 2,235,654 | |
| Kilroy Realty LP | |
| | 2,375,000 | | | | 6.625 | | | | 06/01/20 | | | | 2,724,075 | |
| | 1,500,000 | | | | 3.800 | (a) | | | 01/15/23 | | | | 1,531,902 | |
| National Retail Properties, Inc.(a) | |
| | 1,150,000 | | | | 4.000 | | | | 11/15/25 | | | | 1,171,254 | |
| Select Income REIT(a) | |
| | 275,000 | | | | 2.850 | | | | 02/01/18 | | | | 275,519 | |
| | 525,000 | | | | 3.600 | | | | 02/01/20 | | | | 527,612 | |
| | 725,000 | | | | 4.150 | | | | 02/01/22 | | | | 713,642 | |
| | Ventas Realty LP(a) | | | | | | | | | | | | | |
| | 975,000 | | | | 3.500 | | | | 02/01/25 | | | | 956,494 | |
| | Welltower, Inc.(a) | | | | | | | | | | | | | |
| | 1,557,000 | | | | 4.125 | | | | 04/01/19 | | | | 1,635,933 | |
| | | | | | | | | | | | | | |
| | | | | | | | | | | | | 21,943,055 | |
| | |
| | Schools – 0.3% | | | | | | | | | | | | | |
| Rensselaer Polytechnic Institute | |
| | 2,600,000 | | | | 5.600 | | | | 09/01/20 | | | | 2,955,290 | |
| | |
| | Technology – Hardware – 1.5% | |
| Cisco Systems, Inc. | |
| | 1,450,000 | | | | 2.200 | | | | 02/28/21 | | | | 1,478,016 | |
| Fidelity National Information Services, Inc.(a) | |
| | 2,575,000 | | | | 3.625 | | | | 10/15/20 | | | | 2,662,666 | |
| Fiserv, Inc.(a) | |
| | 1,425,000 | | | | 2.700 | | | | 06/01/20 | | | | 1,443,914 | |
| Hewlett Packard Enterprise Co.(a)(c) | |
| | 1,625,000 | | | | 4.900 | | | | 10/15/25 | | | | 1,667,244 | |
| Intel Corp.(a) | |
| | 2,375,000 | | | | 3.700 | | | | 07/29/25 | | | | 2,598,311 | |
| Microsoft Corp.(a) | |
| | 2,200,000 | | | | 3.125 | | | | 11/03/25 | | | | 2,315,033 | |
| Oracle Corp.(a) | |
| | 1,600,000 | | | | 2.500 | | | | 05/15/22 | | | | 1,630,524 | |
| | | | | | | | | | | | | | |
| | | | | | | | | | | | | 13,795,708 | |
| | |
| | Tobacco – 2.8% | |
| BAT International Finance PLC(c) | |
| | 14,950,000 | | | | 2.750 | | | | 06/15/20 | | | | 15,374,161 | |
| Philip Morris International, Inc.(a) | |
| | 1,075,000 | | | | 2.750 | | | | 02/25/26 | | | | 1,092,004 | |
| Reynolds American, Inc.(a) | |
| | 9,050,000 | | | | 4.450 | | | | 06/12/25 | | | | 9,958,092 | |
| | | | | | | | | | | | | | |
| | | | | | | | | | | | | 26,424,257 | |
| | |
| | Transportation(c) – 0.7% | |
| ERAC USA Finance LLC | |
| | 3,525,000 | | | | 2.350 | | | | 10/15/19 | | | | 3,531,042 | |
| Penske Truck Leasing Co. LP/PTL Finance Corp. | |
| | 1,225,000 | | | | 3.375 | (a) | | | 02/01/22 | | | | 1,216,243 | |
| | 1,425,000 | | | | 4.250 | | | | 01/17/23 | | | | 1,443,955 | |
| | | | | | | | | | | | | | |
| | | | | | | | | | | | | 6,191,240 | |
| | |
| | Corporate Obligations – (continued) | |
| | Wirelines Telecommunications – 3.0% | |
| American Tower Corp.(a) | |
| $ | 1,025,000 | | | | 3.300 | % | | | 02/15/21 | | | $ | 1,042,848 | |
| AT&T, Inc. | |
| | 2,450,000 | | | | 3.800 | | | | 03/15/22 | | | | 2,567,467 | |
| Telefonica Emisiones SAU | |
| | 3,875,000 | | | | 5.462 | | | | 02/16/21 | | | | 4,378,274 | |
| Verizon Communications, Inc. | |
| | 6,181,000 | | | | 2.625 | | | | 02/21/20 | | | | 6,346,530 | |
| | 3,300,000 | | | | 4.500 | | | | 09/15/20 | | | | 3,643,018 | |
| | 8,500,000 | | | | 5.150 | | | | 09/15/23 | | | | 9,808,386 | |
| | | | | | | | | | | | | | |
| | | | | | | | | | | | | 27,786,523 | |
| | |
| | TOTAL CORPORATE OBLIGATIONS | |
| | (Cost $322,323,457) | | | $ | 327,189,543 | |
| | |
| | |
| | Mortgage-Backed Obligations – 33.9% | |
| | Adjustable Rate Non-Agency(b) – 1.0% | |
| Aire Valley Mortgages PLC Series 2006-1A, Class 1A(c) | |
| $ | 809,813 | | | | 0.843 | % | | | 09/20/66 | | | $ | 780,044 | |
| Aire Valley Mortgages PLC Series 2006-1X, Class 2A1 | |
| EUR | 1,414,122 | | | | 0.066 | | | | 09/20/66 | | | | 1,564,048 | |
| Aire Valley Mortgages PLC Series 2007-1A, Class 2A1(c) | |
| $ | 1,730,635 | | | | 0.863 | | | | 09/20/66 | | | | 1,668,220 | |
| Harborview Mortgage Loan Trust Series 2005-16, Class 2A1A | |
| | 734,933 | | | | 0.672 | | | | 01/19/36 | | | | 460,335 | |
| Leek Finance Number Eighteen PLC Series 2018X, Class A2C | |
| EUR | 248,664 | | | | 0.127 | | | | 09/21/38 | | | | 298,719 | |
| Leek Finance Number Seventeen PLC Series 2017X, Class A2A | |
| GBP | 156,486 | | | | 0.865 | | | | 12/21/37 | | | | 241,173 | |
| Leek Finance PLC Series 2017X, Class A2C | |
| EUR | 339,053 | | | | 0.147 | | | | 12/21/37 | | | | 413,956 | |
| Leek Finance PLC Series 2018X, Class A2B | |
| $ | 1,699,204 | | | | 0.830 | | | | 09/21/38 | | | | 1,788,698 | |
| Master Adjustable Rate Mortgages Trust Series 2006-OA2,
Class 4A1A |
|
| | 1,189,832 | | | | 1.172 | | | | 12/25/46 | | | | 870,036 | |
| Sequoia Mortgage Trust Series 2003-4, Class 1A2 | |
| | 808,591 | | | | 1.509 | | | | 07/20/33 | | | | 737,079 | |
| Washington Mutual Mortgage Pass-Through Certificates
Series 2002-AR19, Class A7 |
|
| | 52,363 | | | | 2.538 | | | | 02/25/33 | | | | 50,585 | |
| | |
| TOTAL ADJUSTABLE RATE
NON-AGENCY |
| | $ | 8,872,893 | |
| | |
| | Collateralized Mortgage Obligations – 1.5% | |
| | Interest Only(b)(d) – 0.0% | |
| CS First Boston Mortgage Securities Corp. Series 2003-AR18,
Class 2X |
|
| $ | 360,454 | | | | 0.000 | % | | | 07/25/33 | | | $ | — | |
| CS First Boston Mortgage Securities Corp. Series 2003-AR20,
Class 2X |
|
| | 405,686 | | | | 0.000 | | | | 08/25/33 | | | | 1 | |
| | | | | | | | | | | | | | |
| | | | | | | | | | | | | 1 | |
| | |
| | |
| The accompanying notes are an integral part of these financial statements. | | 55 |
GOLDMAN SACHS CORE FIXED INCOME FUND
Schedule of Investments (continued)
March 31, 2016
| | | | | | | | | | | | | | |
Principal Amount | | | Interest Rate | | | Maturity Date | | | Value | |
| | Mortgage-Backed Obligations – (continued) | |
| | Inverse Floaters(b) – 0.0% | |
| GNMA REMIC Series 2002-13, Class SB | |
| $ | 87,777 | | | | 35.507 | % | | | 02/16/32 | | | $ | 154,930 | |
| | |
| | Planned Amortization Class – 0.0% | |
| FNMA REMIC Series 2003-134, Class ME | |
| | 23,502 | | | | 4.500 | | | | 06/25/33 | | | | 24,121 | |
| FNMA REMIC Series 2004-64, Class BA | |
| | 13,922 | | | | 5.000 | | | | 03/25/34 | | | | 14,197 | |
| | | | | | | | | | | | | | |
| | | | | | | | | | | | | 38,318 | |
| | |
| | Sequential Fixed Rate – 1.5% | |
| FHLMC REMIC Series 2755, Class ZA | |
| | 825,608 | | | | 5.000 | | | | 02/15/34 | | | | 908,155 | |
| FHLMC REMIC Series 4273, Class PD | |
| | 2,180,003 | | | | 6.500 | | | | 11/15/43 | | | | 2,533,604 | |
| FNMA REMIC Series 2011-52, Class GB | |
| | 2,101,305 | | | | 5.000 | | | | 06/25/41 | | | | 2,330,292 | |
| FNMA REMIC Series 2011-99, Class DB | |
| | 2,030,764 | | | | 5.000 | | | | 10/25/41 | | | | 2,245,283 | |
| FNMA REMIC Series 2012-111, Class B | |
| | 369,338 | | | | 7.000 | | | | 10/25/42 | | | | 427,103 | |
| FNMA REMIC Series 2012-153, Class B | |
| | 1,240,784 | | | | 7.000 | | | | 07/25/42 | | | | 1,463,904 | |
| NCUA Guaranteed Notes Series A4 | |
| | 3,500,000 | | | | 3.000 | | | | 06/12/19 | | | | 3,700,837 | |
| | | | | | | | | | | | | | |
| | | | | | | | | | | | | 13,609,178 | |
| | |
| TOTAL COLLATERALIZED MORTGAGE
OBLIGATIONS |
| | $ | 13,802,427 | |
| | |
| | Commercial Mortgage-Backed Securities – 2.2% | |
| | Sequential Fixed Rate – 1.1% | |
| FHLMC Multifamily Structured Pass-Through Certificates
Series K020, Class A2 |
|
| $ | 800,000 | | | | 2.373 | % | | | 05/25/22 | | | $ | 823,224 | |
| Wachovia Bank Commercial Mortgage Trust Series 2007-C31,
Class A4 |
|
| | 9,000,000 | | | | 5.509 | | | | 04/15/47 | | | | 9,117,838 | |
| | | | | | | | | | | | | | |
| | | | | | | | | | | | | 9,941,062 | |
| | |
| | Sequential Floating Rate(b) – 1.1% | |
| Citigroup Commercial Mortgage Trust Series 2008-C7,
Class A1A |
|
| | 10,126,810 | | | | 6.051 | | | | 12/10/49 | | | | 10,571,078 | |
| | |
| TOTAL COMMERCIAL
MORTGAGE-BACKED SECURITIES |
| | $ | 20,512,140 | |
| | |
| | | | | | | | | | | | | | |
| | Federal Agencies – 29.2% | |
| | Adjustable Rate FNMA(b) – 0.8% | |
| $ | 9,188 | | | | 2.583 | % | | | 06/01/33 | | | $ | 9,690 | |
| | 1,320,205 | | | | 2.451 | | | | 07/01/34 | | | | 1,387,129 | |
| | 2,857,026 | | | | 2.330 | | | | 09/01/34 | | | | 2,982,173 | |
| | 2,193,061 | | | | 2.595 | | | | 05/01/35 | | | | 2,307,574 | |
| | 499,703 | | | | 2.166 | | | | 06/01/35 | | | | 519,226 | |
| | | | | | | | | | | | | | |
| | | | | | | | | | | | | 7,205,792 | |
| | |
| | Mortgage-Backed Obligations – (continued) | |
| | FHLMC – 0.6% | |
| $ | 171 | | | | 5.000 | % | | | 01/01/17 | | | $ | 177 | |
| | 1,183 | | | | 5.000 | | | | 02/01/17 | | | | 1,220 | |
| | 1,181 | | | | 5.000 | | | | 03/01/17 | | | | 1,201 | |
| | 9,460 | | | | 5.000 | | | | 09/01/17 | | | | 9,767 | |
| | 27,482 | | | | 5.000 | | | | 10/01/17 | | | | 28,380 | |
| | 168 | | | | 7.000 | | | | 10/01/17 | | | | 172 | |
| | 20,639 | | | | 5.000 | | | | 11/01/17 | | | | 21,310 | |
| | 8,263 | | | | 5.000 | | | | 12/01/17 | | | | 8,534 | |
| | 11,992 | | | | 5.000 | | | | 01/01/18 | | | | 12,368 | |
| | 31,862 | | | | 5.000 | | | | 02/01/18 | | | | 32,785 | |
| | 22,337 | | | | 5.000 | | | | 03/01/18 | | | | 23,019 | |
| | 14,605 | | | | 5.000 | | | | 04/01/18 | | | | 15,058 | |
| | 9,844 | | | | 5.000 | | | | 05/01/18 | | | | 10,158 | |
| | 8,081 | | | | 5.000 | | | | 06/01/18 | | | | 8,344 | |
| | 17,339 | | | | 5.000 | | | | 07/01/18 | | | | 17,954 | |
| | 4,844 | | | | 5.000 | | | | 08/01/18 | | | | 5,008 | |
| | 27,912 | | | | 4.500 | | | | 09/01/18 | | | | 28,790 | |
| | 2,815 | | | | 5.000 | | | | 10/01/18 | | | | 2,919 | |
| | 5,088 | | | | 5.000 | | | | 11/01/18 | | | | 5,275 | |
| | 58,647 | | | | 5.000 | | | | 06/01/19 | | | | 61,420 | |
| | 101,127 | | | | 5.000 | | | | 05/01/23 | | | | 111,369 | |
| | 289,933 | | | | 4.500 | | | | 10/01/23 | | | | 314,746 | |
| | 54,245 | | | | 5.500 | | | | 10/01/25 | | | | 60,538 | |
| | 30,398 | | | | 5.500 | | | | 11/01/25 | | | | 33,800 | |
| | 5,917 | | | | 7.000 | | | | 06/01/26 | | | | 6,464 | |
| | 20,715 | | | | 7.500 | | | | 12/01/30 | | | | 22,555 | |
| | 13,383 | | | | 7.500 | | | | 01/01/31 | | | | 14,629 | |
| | 517,807 | | | | 5.500 | | | | 03/01/33 | | | | 581,000 | |
| | 24,240 | | | | 5.000 | | | | 10/01/33 | | | | 26,763 | |
| | 63,146 | | | | 6.500 | | | | 10/01/33 | | | | 74,125 | |
| | 963 | | | | 5.500 | | | | 12/01/33 | | | | 1,089 | |
| | 25,376 | | | | 5.500 | | | | 09/01/34 | | | | 28,598 | |
| | 2,113 | | | | 5.500 | | | | 12/01/34 | | | | 2,370 | |
| | 1,962 | | | | 5.500 | | | | 03/01/35 | | | | 2,194 | |
| | 4,873 | | | | 5.000 | | | | 04/01/35 | | | | 5,378 | |
| | 35,255 | | | | 5.000 | | | | 07/01/35 | | | | 38,893 | |
| | 57,673 | | | | 5.500 | | | | 11/01/35 | | | | 64,617 | |
| | 187,128 | | | | 5.000 | | | | 12/01/35 | | | | 208,655 | |
| | 410 | | | | 5.500 | | | | 02/01/36 | | | | 464 | |
| | 81,186 | | | | 5.500 | | | | 06/01/36 | | | | 90,776 | |
| | 64,598 | | | | 5.500 | | | | 08/01/37 | | | | 71,970 | |
| | 382,580 | | | | 5.000 | | | | 01/01/38 | | | | 420,257 | |
| | 187,747 | | | | 5.500 | | | | 03/01/38 | | | | 210,871 | |
| | 74,837 | | | | 5.500 | | | | 04/01/38 | | | | 84,055 | |
| | 107,477 | | | | 5.500 | | | | 08/01/38 | | | | 121,051 | |
| | 2,676 | | | | 5.500 | | | | 09/01/38 | | | | 3,006 | |
| | 6,459 | | | | 6.500 | | | | 09/01/38 | | | | 7,558 | |
| | 13,361 | | | | 5.500 | | | | 11/01/38 | | | | 15,193 | |
| | 21,200 | | | | 5.500 | | | | 12/01/38 | | | | 23,704 | |
| | 914,844 | | | | 5.000 | | | | 01/01/39 | | | | 1,004,972 | |
| | 1,144,310 | | | | 7.000 | | | | 02/01/39 | | | | 1,351,056 | |
| | 6,405 | | | | 5.500 | | | | 03/01/39 | | | | 7,218 | |
| | 258,713 | | | | 5.000 | | | | 06/01/39 | | | | 284,278 | |
| | 9,008 | | | | 5.500 | | | | 10/01/39 | | | | 10,105 | |
| | 19,724 | | | | 5.500 | | | | 03/01/40 | | | | 22,271 | |
| | |
| | |
| 56 | | The accompanying notes are an integral part of these financial statements. |
GOLDMAN SACHS CORE FIXED INCOME FUND
| | | | | | | | | | | | | | |
Principal Amount | | | Interest Rate | | | Maturity Date | | | Value | |
| | Mortgage-Backed Obligations – (continued) | |
| | FHLMC – (continued) | |
| $ | 40,750 | | | | 5.500 | % | | | 06/01/40 | | | $ | 45,718 | |
| | 24,845 | | | | 5.000 | | | | 08/01/40 | | | | 27,408 | |
| | 7,533 | | | | 4.500 | | | | 11/01/40 | | | | 8,203 | |
| | 20,098 | | | | 5.000 | | | | 04/01/41 | | | | 22,240 | |
| | 22,782 | | | | 5.000 | | | | 06/01/41 | | | | 25,110 | |
| | | | | | | | | | | | | | |
| | | | | | | | | | | | | 5,749,126 | |
| | |
| | FNMA – 14.4% | |
| | 4,489,462 | | | | 2.800 | | | | 03/01/18 | | | | 4,564,869 | |
| | 2,786,005 | | | | 3.740 | | | | 05/01/18 | | | | 2,913,140 | |
| | 3,480,000 | | | | 3.840 | | | | 05/01/18 | | | | 3,649,066 | |
| | 29,025 | | | | 5.000 | | | | 06/01/18 | | | | 30,014 | |
| | 202,238 | | | | 4.500 | | | | 07/01/18 | | | | 208,740 | |
| | 13,182 | | | | 4.500 | | | | 08/01/18 | | | | 13,605 | |
| | 169 | | | | 6.500 | | | | 10/01/18 | | | | 193 | |
| | 9,000,000 | | | | 4.506 | | | | 06/01/19 | | | | 9,446,282 | |
| | 1,869,870 | | | | 3.414 | | | | 10/01/20 | | | | 2,013,138 | |
| | 1,440,224 | | | | 3.619 | | | | 12/01/20 | | | | 1,557,047 | |
| | 3,821,654 | | | | 4.381 | | | | 06/01/21 | | | | 4,253,525 | |
| | 475,361 | | | | 6.000 | | | | 11/01/22 | | | | 541,666 | |
| | 199,999 | | | | 5.000 | | | | 07/01/23 | | | | 221,103 | |
| | 178,433 | | | | 5.000 | | | | 08/01/23 | | | | 197,261 | |
| | 137,424 | | | | 5.500 | | | | 09/01/23 | | | | 150,134 | |
| | 43,343 | | | | 5.500 | | | | 10/01/23 | | | | 47,558 | |
| | 697,925 | | | | 5.000 | | | | 11/01/23 | | | | 771,568 | |
| | 407,542 | | | | 5.000 | | | | 02/01/24 | | | | 437,996 | |
| | 492,433 | | | | 6.000 | | | | 03/01/24 | | | | 561,119 | |
| | 428,487 | | | | 6.000 | | | | 07/01/25 | | | | 488,254 | |
| | 212,858 | | | | 6.000 | | | | 03/01/26 | | | | 242,435 | |
| | 126,940 | | | | 6.000 | | | | 11/01/26 | | | | 144,646 | |
| | 142,261 | | | | 6.000 | | | | 04/01/27 | | | | 162,105 | |
| | 436,481 | | | | 6.000 | | | | 07/01/27 | | | | 497,363 | |
| | 63,610 | | | | 7.000 | | | | 08/01/27 | | | | 74,477 | |
| | 2,011 | | | | 6.500 | | | | 09/01/27 | | | | 2,328 | |
| | 476,759 | | | | 6.000 | | | | 03/01/28 | | | | 543,258 | |
| | 249,864 | | | | 7.000 | | | | 03/01/28 | | | | 293,988 | |
| | 4,096 | | | | 6.500 | | | | 05/01/28 | | | | 4,744 | |
| | 169,467 | | | | 5.000 | | | | 06/01/29 | | | | 187,309 | |
| | 188,115 | | | | 5.000 | | | | 07/01/29 | | | | 207,920 | |
| | 206,474 | | | | 5.000 | | | | 03/01/30 | | | | 228,213 | |
| | 199,864 | | | | 5.000 | | | | 08/01/30 | | | | 220,906 | |
| | 18,578 | | | | 8.000 | | | | 02/01/31 | | | | 22,149 | |
| | 99,572 | | | | 7.000 | | | | 03/01/31 | | | | 112,842 | |
| | 1,716 | | | | 5.500 | | | | 05/01/33 | | | | 1,932 | |
| | 25,243 | | | | 5.000 | | | | 07/01/33 | | | | 28,161 | |
| | 56,076 | | | | 5.000 | | | | 08/01/33 | | | | 62,113 | |
| | 1,905 | | | | 5.000 | | | | 09/01/33 | | | | 2,110 | |
| | 10,856 | | | | 5.500 | | | | 09/01/33 | | | | 12,256 | |
| | 1,872 | | | | 6.500 | | | | 09/01/33 | | | | 2,179 | |
| | 20,128 | | | | 5.000 | | | | 12/01/33 | | | | 22,401 | |
| | 726 | | | | 5.500 | | | | 12/01/33 | | | | 818 | |
| | 1,305 | | | | 5.500 | | | | 01/01/34 | | | | 1,476 | |
| | 15,345 | | | | 5.500 | | | | 02/01/34 | | | | 17,344 | |
| | 2,538 | | | | 5.500 | | | | 04/01/34 | | | | 2,890 | |
| | 8,740 | | | | 5.500 | | | | 05/01/34 | | | | 9,895 | |
| | 2,758 | | | | 6.000 | | | | 07/01/34 | | | | 3,179 | |
| | |
| | Mortgage-Backed Obligations – (continued) | |
| | FNMA – (continued) | |
| $ | 3,432 | | | | 5.500 | % | | | 08/01/34 | | | $ | 3,906 | |
| | 8,598 | | | | 5.500 | | | | 10/01/34 | | | | 9,717 | |
| | 6,606 | | | | 5.500 | | | | 11/01/34 | | | | 7,482 | |
| | 96,533 | | | | 5.500 | | | | 12/01/34 | | | | 109,272 | |
| | 162,134 | | | | 6.000 | | | | 02/01/35 | | | | 184,095 | |
| | 232,602 | | | | 5.000 | | | | 04/01/35 | | | | 259,569 | |
| | 8,897 | | | | 5.500 | | | | 04/01/35 | | | | 10,083 | |
| | 7,783 | | | | 5.500 | | | | 07/01/35 | | | | 8,822 | |
| | 349 | | | | 5.500 | | | | 08/01/35 | | | | 398 | |
| | 1,453,546 | | | | 5.000 | | | | 09/01/35 | | | | 1,609,913 | |
| | 22,379 | | | | 5.500 | | | | 09/01/35 | | | | 25,429 | |
| | 1,615 | | | | 5.500 | | | | 12/01/35 | | | | 1,843 | |
| | 306 | | | | 5.500 | | | | 02/01/36 | | | | 347 | |
| | 151,607 | | | | 5.500 | | | | 03/01/36 | | | | 171,813 | |
| | 26,280 | | | | 6.000 | | | | 03/01/36 | | | | 30,283 | |
| | 1,329 | | | | 5.500 | | | | 04/01/36 | | | | 1,505 | |
| | 4,855 | | | | 6.000 | | | | 04/01/36 | | | | 5,573 | |
| | 316,015 | | | | 6.000 | | | | 07/01/36 | | | | 359,857 | |
| | 334,886 | | | | 6.000 | | | | 09/01/36 | | | | 381,346 | |
| | 2,645 | | | | 5.500 | | | | 01/01/37 | | | | 2,994 | |
| | 5,272 | | | | 6.000 | | | | 01/01/37 | | | | 6,079 | |
| | 1,135 | | | | 5.500 | | | | 02/01/37 | | | | 1,284 | |
| | 30,758 | | | | 6.000 | | | | 02/01/37 | | | | 35,021 | |
| | 66,411 | | | | 6.000 | | | | 03/01/37 | | | | 75,629 | |
| | 2,541 | | | | 5.500 | | | | 04/01/37 | | | | 2,874 | |
| | 2,457 | | | | 5.500 | | | | 05/01/37 | | | | 2,786 | |
| | 1,096 | | | | 5.500 | | | | 06/01/37 | | | | 1,239 | |
| | 682 | | | | 5.500 | | | | 07/01/37 | | | | 768 | |
| | 531,261 | | | | 6.000 | | | | 07/01/37 | | | | 604,888 | |
| | 31,099 | | | | 6.000 | | | | 07/01/37 | | | | 35,409 | |
| | 49 | | | | 5.500 | | | | 08/01/37 | | | | 56 | |
| | 8,557 | | | | 6.000 | | | | 08/01/37 | | | | 9,743 | |
| | 181,408 | | | | 6.000 | | | | 09/01/37 | | | | 206,549 | |
| | 513,773 | | | | 6.000 | | | | 10/01/37 | | | | 584,976 | |
| | 558,794 | | | | 6.000 | | | | 11/01/37 | | | | 641,930 | |
| | 538 | | | | 5.500 | | | | 12/01/37 | | | | 608 | |
| | 30,322 | | | | 5.000 | | | | 02/01/38 | | | | 33,187 | |
| | 1,287 | | | | 5.500 | | | | 02/01/38 | | | | 1,454 | |
| | 6,585 | | | | 5.500 | | | | 03/01/38 | | | | 7,441 | |
| | 37,611 | | | | 6.000 | | | | 03/01/38 | | | | 43,312 | |
| | 77,724 | | | | 5.000 | | | | 04/01/38 | | | | 85,933 | |
| | 302,976 | | | | 6.000 | | | | 04/01/38 | | | | 345,037 | |
| | 1,197 | | | | 5.500 | | | | 05/01/38 | | | | 1,352 | |
| | 620,933 | | | | 6.000 | | | | 05/01/38 | | | | 706,987 | |
| | 7,125 | | | | 5.500 | | | | 06/01/38 | | | | 8,044 | |
| | 71,743 | | | | 6.000 | | | | 06/01/38 | | | | 81,685 | |
| | 5,179 | | | | 5.500 | | | | 07/01/38 | | | | 5,848 | |
| | 2,750 | | | | 5.500 | | | | 08/01/38 | | | | 3,080 | |
| | 2,939 | | | | 5.500 | | | | 09/01/38 | | | | 3,319 | |
| | 349,099 | | | | 6.000 | | | | 10/01/38 | | | | 397,480 | |
| | 372,972 | | | | 6.000 | | | | 11/01/38 | | | | 424,883 | |
| | 4,360 | | | | 5.500 | | | | 12/01/38 | | | | 4,913 | |
| | 66,131 | | | | 5.000 | | | | 02/01/39 | | | | 73,119 | |
| | 97,844 | | | | 6.000 | | | | 02/01/39 | | | | 111,427 | |
| | 730,360 | | | | 7.000 | | | | 03/01/39 | | | | 866,312 | |
| | 47,998 | | | | 4.500 | | | | 04/01/39 | | | | 53,000 | |
| | |
| | |
| The accompanying notes are an integral part of these financial statements. | | 57 |
GOLDMAN SACHS CORE FIXED INCOME FUND
Schedule of Investments (continued)
March 31, 2016
| | | | | | | | | | | | | | |
Principal Amount | | | Interest Rate | | | Maturity Date | | | Value | |
| | Mortgage-Backed Obligations – (continued) | |
| | FNMA – (continued) | |
| $ | 453,656 | | | | 6.000 | % | | | 04/01/39 | | | $ | 516,528 | |
| | 14,834 | | | | 4.500 | | | | 05/01/39 | | | | 16,380 | |
| | 16,243 | | | | 5.500 | | | | 06/01/39 | | | | 18,362 | |
| | 10,154 | | | | 4.500 | | | | 07/01/39 | | | | 11,223 | |
| | 751,450 | | | | 5.000 | | | | 07/01/39 | | | | 831,103 | |
| | 90,589 | | | | 4.500 | | | | 08/01/39 | | | | 100,129 | |
| | 493,894 | | | | 6.000 | | | | 09/01/39 | | | | 562,342 | |
| | 14,616 | | | | 5.500 | | | | 11/01/39 | | | | 16,505 | |
| | 485,511 | | | | 6.000 | | | | 11/01/39 | | | | 554,216 | |
| | 648,110 | | | | 4.500 | | | | 12/01/39 | | | | 716,364 | |
| | 62,485 | | | | 6.000 | | | | 04/01/40 | | | | 71,159 | |
| | 409,306 | | | | 5.000 | | | | 06/01/40 | | | | 453,468 | |
| | 132,771 | | | | 5.000 | | | | 07/01/40 | | | | 147,097 | |
| | 708,615 | | | | 6.000 | | | | 10/01/40 | | | | 806,820 | |
| | 409,546 | | | | 5.000 | | | | 11/01/40 | | | | 452,957 | |
| | 448,466 | | | | 6.000 | | | | 04/01/41 | | | | 510,618 | |
| | 1,200,745 | | | | 4.500 | | | | 05/01/41 | | | | 1,309,692 | |
| | 323,690 | | | | 6.000 | | | | 05/01/41 | | | | 368,549 | |
| | 243,351 | | | | 4.500 | | | | 08/01/41 | | | | 265,899 | |
| | 571,763 | | | | 5.000 | | | | 07/01/42 | | | | 633,453 | |
| | 43,526 | | | | 3.000 | | | | 11/01/42 | | | | 44,962 | |
| | 892,066 | | | | 3.000 | | | | 12/01/42 | | | | 920,198 | |
| | 1,320,872 | | | | 3.000 | | | | 01/01/43 | | | | 1,364,971 | |
| | 205,971 | | | | 3.000 | | | | 02/01/43 | | | | 212,801 | |
| | 1,317,365 | | | | 3.000 | | | | 03/01/43 | | | | 1,361,055 | |
| | 2,210,087 | | | | 3.000 | | | | 04/01/43 | | | | 2,283,384 | |
| | 413,184 | | | | 3.500 | | | | 04/01/43 | | | | 433,484 | |
| | 1,600,436 | | | | 3.000 | | | | 05/01/43 | | | | 1,653,513 | |
| | 153,842 | | | | 3.000 | | | | 06/01/43 | | | | 158,945 | |
| | 1,371,192 | | | | 3.000 | | | | 07/01/43 | | | | 1,416,667 | |
| | 9,230,211 | | | | 3.500 | | | | 07/01/43 | | | | 9,683,690 | |
| | 2,907,652 | | | | 3.500 | | | | 08/01/43 | | | | 3,050,504 | |
| | 1,921,197 | | | | 5.000 | | | | 05/01/44 | | | | 2,125,475 | |
| | 1,408,275 | | | | 5.000 | | | | 06/01/44 | | | | 1,558,015 | |
| | 39,000,000 | | | | 3.000 | | | | TBA-30yr | (e) | | | 40,008,517 | |
| | 11,000,000 | | | | 3.500 | | | | TBA-30yr | (e) | | | 11,534,532 | |
| | 4,000,000 | | | | 4.000 | | | | TBA-30yr | (e) | | | 4,274,688 | |
| | | | | | | | | | | | | | |
| | | | | | | | | | | | | 134,277,879 | |
| | |
| | GNMA – 13.4% | |
| | 1,160,331 | | | | 3.950 | | | | 07/15/25 | | | | 1,291,103 | |
| | 15,688 | | | | 6.000 | | | | 11/15/38 | | | | 18,196 | |
| | 188,707 | | | | 5.000 | | | | 07/15/40 | | | | 210,833 | |
| | 362,961 | | | | 5.000 | | | | 01/15/41 | | | | 405,518 | |
| | 23,496,837 | | | | 4.000 | | | | 10/20/43 | | | | 25,136,108 | |
| | 19,238,379 | | | | 4.000 | | | | 07/20/45 | | | | 20,592,580 | |
| | 5,313,511 | | | | 4.000 | | | | 10/20/45 | | | | 5,688,778 | |
| | 10,172,389 | | | | 4.000 | | | | 11/20/45 | | | | 10,884,872 | |
| | 15,877,589 | | | | 4.000 | | | | 01/20/46 | | | | 16,989,669 | |
| | 2,990,731 | | | | 4.000 | | | | 02/20/46 | | | | 3,208,727 | |
| | 38,000,000 | | | | 4.000 | | | | TBA-30yr | (e) | | | 40,633,282 | |
| | | | | | | | | | | | | | |
| | | | | | | | | | | | | 125,059,666 | |
| | |
| | TOTAL FEDERAL AGENCIES | | | $ | 272,292,463 | |
| | |
| | TOTAL MORTGAGE-BACKED OBLIGATIONS | |
| | (Cost $313,288,513) | | | $ | 315,479,923 | |
| | |
| | Agency Debentures – 3.8% | |
| FHLB | | | | | |
| $ | 6,800,000 | | | | 2.125 | % | | | 06/09/23 | | | $ | 6,910,221 | |
| | 3,500,000 | | | | 3.375 | | | | 09/08/23 | | | | 3,859,299 | |
| | 750,000 | | | | 3.375 | | | | 12/08/23 | | | | 828,782 | |
| | 2,400,000 | | | | 5.000 | | | | 09/28/29 | | | | 3,025,150 | |
| FNMA(f) | | | | | |
| | 4,200,000 | | | | 6.250 | | | | 05/15/29 | | | | 5,997,098 | |
| Private Export Funding Corp. | | | | | |
| | 7,000,000 | | | | 5.450 | | | | 09/15/17 | | | | 7,460,950 | |
| Small Business Administration | | | | | |
| | 34,092 | | | | 6.300 | | | | 06/01/18 | | | | 35,889 | |
| Tennessee Valley Authority | | | | | |
| | 5,400,000 | | | | 3.875 | | | | 02/15/21 | | | | 6,010,218 | |
| | 1,400,000 | | | | 4.625 | | | | 09/15/60 | | | | 1,593,527 | |
| | |
| | TOTAL AGENCY DEBENTURES | |
| | (Cost $33,835,300) | | | $ | 35,721,134 | |
| | |
| | | | | | | | | | | | | | |
| | Asset-Backed Securities – 8.7% | |
| | Collateralized Loan Obligations(c) – 5.5% | |
| B&M CLO Ltd. Series 2014-1A, Class A1(b) | |
| $ | 3,700,000 | | | | 1.717 | % | | | 04/16/26 | | | $ | 3,621,612 | |
| B&M CLO Ltd. Series 2014-1A, Class A2(b) | |
| | 650,000 | | | | 2.267 | | | | 04/16/26 | | | | 613,881 | |
| Halcyon Loan Advisors Funding Ltd. Series 2014-1A, Class A1(b) | |
| | 3,400,000 | | | | 1.845 | | | | 04/18/26 | | | | 3,329,647 | |
| Halcyon Loan Advisors Funding Ltd. Series 2014-2A,
Class A1B(b) |
|
| | 6,950,000 | | | | 1.743 | | | | 04/28/25 | | | | 6,824,031 | |
| Halcyon Loan Advisors Funding Ltd. Series 2014-2A, Class A2(b) | |
| | 1,750,000 | | | | 2.323 | | | | 04/28/25 | | | | 1,637,297 | |
| Madison Park Funding X Ltd. Series 2012-10A, Class A1A(b) | |
| | 4,700,000 | | | | 1.687 | | | | 01/20/25 | | | | 4,674,051 | |
| Magnetite VIII Ltd. Series 2014-8A, Class A(b) | |
| | 5,750,000 | | | | 1.801 | | | | 04/15/26 | | | | 5,734,176 | |
| Shackleton CLO Ltd. Series 2014-5A, Class A(b) | |
| | 7,800,000 | | | | 1.844 | | | | 05/07/26 | | | | 7,752,248 | |
| Shackleton CLO Ltd. Series 2014-5A, Class B1(b) | |
| | 1,150,000 | | | | 2.344 | | | | 05/07/26 | | | | 1,110,569 | |
| SPS Servicer Advance Receivables Trust Series 2015-T2,
Class AT2 |
|
| | 4,850,000 | | | | 2.620 | | | | 01/15/47 | | | | 4,851,062 | |
| Trinitas CLO Ltd. Series 2014-1A, Class A1(b) | |
| | 2,950,000 | | | | 1.851 | | | | 04/15/26 | | | | 2,902,411 | |
| Trinitas CLO Ltd. Series 2014-1A, Class B1(b) | |
| | 750,000 | | | | 2.221 | | | | 04/15/26 | | | | 691,704 | |
| Whitehorse VIII Ltd. Series 2014-1A, Class A(b) | |
| | 7,500,000 | | | | 1.829 | | | | 05/01/26 | | | | 7,352,670 | |
| | | | | | | | | | | | | | |
| | | | | | | | | | | | | 51,095,359 | |
| | |
| | Credit Card – 0.3% | | | | | |
| Discover Card Execution Note Trust Series 2015-A2, Class A | |
| | 2,700,000 | | | | 1.900 | | | | 10/17/22 | | | | 2,719,170 | |
| | |
| | Home Equity(b) – 0.0% | |
| Impac CMB Trust Series 2004-08, Class 1A | |
| | 315,543 | | | | 1.156 | | | | 10/25/34 | | | | 252,300 | |
| | |
| | |
| 58 | | The accompanying notes are an integral part of these financial statements. |
GOLDMAN SACHS CORE FIXED INCOME FUND
| | | | | | | | | | | | | | |
Principal Amount | | | Interest Rate | | | Maturity Date | | | Value | |
| | Asset-Backed Securities – (continued) | |
| | Student Loan(b) – 2.9% | | | | | |
| Chase Education Loan Trust Series 2007-A, Class A3 | |
| $ | 778,819 | | | | 0.700 | % | | | 12/28/23 | | | $ | 762,585 | |
| Edsouth Indenture No. 9 LLC Series 2015-1, Class A(c) | |
| | 3,955,201 | | | | 1.233 | | | | 10/25/56 | | | | 3,784,257 | |
| Educational Funding of the South, Inc. Series 2011-1, Class A2 | |
| | 4,113,460 | | | | 1.269 | | | | 04/25/35 | | | | 4,008,943 | |
| EFS Volunteer No 3 LLC Series 2012-1, Class A2(c) | |
| | 4,720,363 | | | | 1.433 | | | | 02/25/25 | | | | 4,693,271 | |
| Nelnet Student Loan Trust Series 2006-1, Class A5 | |
| | 4,200,000 | | | | 0.728 | | | | 08/23/27 | | | | 4,086,777 | |
| Nelnet Student Loan Trust Series 2013-5A, Class A(c) | |
| | 816,768 | | | | 1.063 | | | | 01/25/37 | | | | 784,847 | |
| Northstar Education Finance, Inc. Series 2004-2, Class A3 | |
| | 728,880 | | | | 0.791 | | | | 07/30/18 | | | | 725,042 | |
| Scholar Funding Trust Series 2010-A, Class A(c) | |
| | 1,928,753 | | | | 1.371 | | | | 10/28/41 | | | | 1,794,622 | |
| SLC Student Loan Trust Series 2006-2, Class A5 | |
| | 4,250,000 | | | | 0.734 | | | | 09/15/26 | | | | 4,101,202 | |
| SLM Student Loan Trust Series 2005-3, Class A5 | |
| | 2,412,659 | | | | 0.709 | | | | 10/25/24 | | | | 2,361,853 | |
| | | | | | | | | | | | | | |
| | | | | | | | | | | | | 27,103,399 | |
| | |
| | TOTAL ASSET-BACKED SECURITIES | | | | | |
| | (Cost $82,282,058) | | | $ | 81,170,228 | |
| | |
| | | | | | | | | | | | | | |
| | Foreign Debt Obligations – 2.2% | |
| | Sovereign – 1.9% | |
| Italy Buoni Poliennali Del Tesoro | |
| EUR | 2,355,890 | | | | 2.350 | % | | | 09/15/19 | | | $ | 2,948,061 | |
| Republic of Chile | |
| $ | 239,000 | | | | 3.125 | | | | 01/21/26 | | | | 241,988 | |
| | 390,000 | | | | 3.625 | | | | 10/30/42 | | | | 370,500 | |
| Republic of Colombia | |
| | 1,750,000 | | | | 4.000 | | | | 02/26/24 | | | | 1,758,750 | |
| | 200,000 | | | | 5.625 | | | | 02/26/44 | | | | 199,000 | |
| Republic of Indonesia | |
| | 200,000 | | | | 5.875 | | | | 01/15/24 | | | | 225,000 | |
| | 420,000 | | | | 4.125 | (c) | | | 01/15/25 | | | | 422,100 | |
| | 380,000 | | | | 4.125 | | | | 01/15/25 | | | | 381,900 | |
| | 510,000 | | | | 6.750 | | | | 01/15/44 | | | | 614,644 | |
| Republic of Turkey | |
| | 1,560,000 | | | | 4.250 | | | | 04/14/26 | | | | 1,513,200 | |
| Spain Government Bond(c) | |
| EUR | 110,000 | | | | 5.500 | | | | 04/30/21 | | | | 156,851 | |
| | 10,000 | | | | 4.400 | | | | 10/31/23 | | | | 14,169 | |
| Spain Government Inflation Linked Bond(c) | |
| | 2,160,676 | | | | 0.550 | | | | 11/30/19 | | | | 2,549,602 | |
| United Mexican States | |
| $ | 20,000 | | | | 6.050 | | | | 01/11/40 | | | | 23,450 | |
| | 3,750,000 | | | | 4.750 | | | | 03/08/44 | | | | 3,750,000 | |
| | 1,340,000 | | | | 5.550 | | | | 01/21/45 | | | | 1,484,050 | |
| | 920,000 | | | | 4.600 | | | | 01/23/46 | | | | 901,600 | |
| | 60,000 | | | | 5.750 | | | | 10/12/49 | | | | 61,050 | |
| | | | | | | | | | | | | | |
| | | | | | | | | | | | | 17,615,915 | |
| | |
| | Foreign Debt Obligations – (continued) | |
| | Supranational – 0.3% | | | | | |
| Inter-American Development Bank | |
| $ | 2,700,000 | | | | 1.000 | % | | | 02/27/18 | | | $ | 2,685,479 | |
| | |
| | TOTAL FOREIGN DEBT OBLIGATIONS | |
| | (Cost $20,082,770) | | | $ | 20,301,394 | |
| | |
| | | | | | | | | | | | | | |
| | Municipal Debt Obligations – 1.0% | |
| | California – 0.6% | |
| California State GO Bonds Build America Taxable Series 2009 | |
| $ | 950,000 | | | | 7.500 | % | | | 04/01/34 | | | $ | 1,388,710 | |
| | 1,650,000 | | | | 7.550 | | | | 04/01/39 | | | | 2,526,216 | |
| California State GO Bonds Build America Taxable Series 2010 | |
| | 1,645,000 | | | | 7.950 | | | | 03/01/36 | | | | 1,990,400 | |
| | | | | | | | | | | | | | |
| | | | | | | | | | | | | 5,905,326 | |
| | |
| | Illinois – 0.2% | |
| Illinois State GO Bonds Build America Series 2010 | |
| | 1,280,000 | | | | 7.350 | | | | 07/01/35 | | | | 1,398,477 | |
| | |
| | Ohio – 0.2% | |
| American Municipal Power-Ohio, Inc. RB Build America
Taxable Series 2010 |
|
| | 1,700,000 | | | | 6.270 | | | | 02/15/50 | | | | 2,059,533 | |
| | |
| | TOTAL MUNICIPAL DEBT OBLIGATIONS | |
| | (Cost $7,442,905) | | | $ | 9,363,336 | |
| | |
| | | | | | | | | | | | | | |
| | Government Guarantee Obligations(g) – 3.1% | |
| Hashemite Kingdom of Jordan Government AID Bond | |
| $ | 7,400,000 | | | | 2.503 | % | | | 10/30/20 | | | $ | 7,719,220 | |
| Israel Government AID Bond | |
| | 7,827,000 | | | | 5.500 | | | | 09/18/23 | | | | 9,754,295 | |
| | 1,200,000 | | | | 5.500 | | | | 12/04/23 | | | | 1,501,465 | |
| | 2,400,000 | | | | 5.500 | | | | 04/26/24 | | | | 3,008,816 | |
| | 4,700,000 | | | | 5.500 | | | | 09/18/33 | | | | 6,403,162 | |
| | |
| | TOTAL GOVERNMENT GUARANTEE OBLIGATIONS | |
| | (Cost $26,517,190) | | | $ | 28,386,958 | |
| | |
| | | | | | | | | | | | | | |
| | U.S. Treasury Obligations – 11.7% | |
| United States Treasury Bonds | |
| $ | 7,900,000 | | | | 3.625 | % | | | 08/15/43 | | | $ | 9,600,160 | |
| | 3,200,000 | | | | 3.750 | | | | 11/15/43 | | | | 3,976,896 | |
| | 1,400,000 | | | | 3.625 | | | | 02/15/44 | | | | 1,699,222 | |
| | 31,750,000 | | | | 3.000 | | | | 11/15/44 | | | | 34,271,583 | |
| | 900,000 | | | | 2.875 | | | | 08/15/45 | | | | 947,097 | |
| | 10,600,000 | | | | 3.000 | | | | 11/15/45 | | | | 11,448,742 | |
| United States Treasury Inflation Protected Securities | |
| | 2,711,848 | | | | 0.125 | | | | 04/15/17 | | | | 2,743,197 | |
| | 11,273,350 | | | | 0.125 | | | | 04/15/18 | | | | 11,477,623 | |
| | 2,360,605 | | | | 0.125 | | | | 01/15/23 | | | | 2,382,724 | |
| | 8,245,638 | | | | 0.375 | (f) | | | 07/15/23 | | | | 8,501,995 | |
| | 7,574,213 | | | | 0.625 | | | | 01/15/24 | | | | 7,894,905 | |
| | |
| | |
| The accompanying notes are an integral part of these financial statements. | | 59 |
GOLDMAN SACHS CORE FIXED INCOME FUND
Schedule of Investments (continued)
March 31, 2016
| | | | | | | | | | | | | | |
Principal Amount | | | Interest Rate | | | Maturity Date | | | Value | |
| | U.S. Treasury Obligations – (continued) | |
| United States Treasury Inflation Protected Securities –
(continued) |
|
| $ | 3,034,405 | | | | 2.500 | % | | | 01/15/29 | | | $ | 3,818,617 | |
| | 712,446 | | | | 2.125 | | | | 02/15/40 | | | | 912,486 | |
| | 1,931,350 | | | | 1.375 | | | | 02/15/44 | | | | 2,168,848 | |
| United States Treasury Notes | |
| | 1,200,000 | | | | 1.625 | | | | 06/30/20 | | | | 1,223,976 | |
| | 800,000 | | | | 1.625 | | | | 07/31/20 | | | | 815,936 | |
| | 4,700,000 | | | | 1.500 | | | | 03/31/23 | | | | 4,684,960 | |
| | |
| | TOTAL U.S. TREASURY OBLIGATIONS | |
| | (Cost $103,413,486) | | | $ | 108,568,967 | |
| | |
| | | | | | | | |
| Shares | | Rate | | | Value | |
| Investment Company(b)(h) – 8.8% | |
Goldman Sachs Financial Square Government Fund – FST Institutional Shares | |
| 81,617,969 | | | 0.250 | % | | $ | 81,617,969 | |
| (Cost $81,617,969) | |
| |
| TOTAL INVESTMENTS – 108.3% | |
| (Cost $990,803,648) | | | $ | 1,007,799,452 | |
| |
LIABILITIES IN EXCESS OF OTHER ASSETS – (8.3)% | | | | (76,865,946 | ) |
| |
| NET ASSETS – 100.0% | | | $ | 930,933,506 | |
| |
| | |
| The percentage shown for each investment category reflects the value of investments in that category as a percentage of net assets. |
(a) | | Security with “Call” features with resetting interest rates. Maturity dates disclosed are the final maturity dates. |
(b) | | Variable rate security. Interest rate or distribution rate disclosed is that which is in effect on March 31, 2016. |
(c) | | Exempt from registration under Rule 144A of the Securities Act of 1933. Such securities may be deemed liquid by the investment adviser and may be resold, normally to qualified institutional buyers in transactions exempt from registration. Total market value of Rule 144A securities amounts to $151,908,554, which represents approximately 16.3% of net assets as of March 31, 2016. |
(d) | | Security with a notional or nominal principal amount. The actual effective yield of this security is different than the stated interest rate. |
(e) | | TBA (To Be Announced) Securities are purchased on a forward commitment basis with an approximate principal amount and no defined maturity date. The actual principal and maturity date will be determined upon settlement when the specific mortgage pools are assigned. Total market value of TBA securities (excluding forward sales contracts, if any) amounts to $96,451,019 which represents approximately 10.4% of net assets as of March 31, 2016. |
(f) | | All or a portion of security is segregated as collateral for initial margin requirements on futures transactions. |
(g) | | Guaranteed by the United States Government until maturity. Total market value for these securities amounts to $28,386,958, which represents approximately 3.1% of net assets as of March 31, 2016. |
(h) | | Represents an affiliated fund. |
| | |
|
Currency Abbreviations: |
AUD | | —Australian Dollar |
CAD | | —Canadian Dollar |
CHF | | —Swiss Franc |
EUR | | —Euro |
GBP | | —British Pound |
JPY | | —Japanese Yen |
NOK | | —Norwegian Krone |
NZD | | —New Zealand Dollar |
SEK | | —Swedish Krona |
USD | | —U.S. Dollar |
| | |
Investment Abbreviations: |
AUDOR | | —Australian Dollar Offered Rate |
CDOR | | —Canadian Dollar Offered Rate |
CLO | | —Collateralized Loan Obligation |
EURO | | —Euro Offered Rate |
FHLB | | —Federal Home Loan Bank |
FHLMC | | —Federal Home Loan Mortgage Corp. |
FNMA | | —Federal National Mortgage Association |
GNMA | | —Government National Mortgage Association |
GO | | —General Obligation |
JYOR | | —Japanese Yen Offered Rate |
LIBOR | | —London Interbank Offered Rate |
LLC | | —Limited Liability Company |
LP | | —Limited Partnership |
NCUA | | —National Credit Union Administration |
NZDOR | | —New Zealand Dollar Offered Rate |
RB | | —Revenue Bond |
REIT | | —Real Estate Investment Trust |
REMIC | | —Real Estate Mortgage Investment Conduit |
STIBOR | | —Stockholm Interbank Offered Rate |
|
| | |
| 60 | | The accompanying notes are an integral part of these financial statements. |
GOLDMAN SACHS CORE FIXED INCOME FUND
|
| ADDITIONAL INVESTMENT INFORMATION |
FORWARD FOREIGN CURRENCY EXCHANGE CONTRACTS — At March 31, 2016, the Fund had the following forward foreign currency exchange contracts:
FORWARD FOREIGN CURRENCY EXCHANGE CONTRACTS WITH UNREALIZED GAIN
| | | | | | | | | | | | | | | | | | | | | | | | |
| Counterparty | | Currency Purchased | | | Currency Sold | | | Current Value | | | Settlement Date | | | Unrealized Gain | |
Bank of America Securities LLC | | EUR | | | 3,017,477 | | | USD | | | 3,388,431 | | | $ | 3,438,823 | | | | 05/19/16 | | | $ | 50,392 | |
| | JPY | | | 679,615,633 | | | USD | | | 6,001,196 | | | | 6,043,475 | | | | 04/26/16 | | | | 42,280 | |
| | NZD | | | 4,311,000 | | | USD | | | 2,874,601 | | | | 2,975,651 | | | | 04/26/16 | | | | 101,050 | |
| | SEK | | | 39,494,170 | | | EUR | | | 4,234,857 | | | | 4,869,323 | | | | 04/26/16 | | | | 46,729 | |
Barclays Bank PLC | | AUD | | | 3,474,595 | | | USD | | | 2,612,837 | | | | 2,660,263 | | | | 04/26/16 | | | | 47,426 | |
| | CAD | | | 1,913,402 | | | USD | | | 1,468,000 | | | | 1,473,327 | | | | 04/26/16 | | | | 5,327 | |
| | EUR | | | 1,267,000 | | | GBP | | | 992,588 | | | | 1,442,842 | | | | 04/26/16 | | | | 17,126 | |
| | EUR | | | 817,401 | | | SEK | | | 7,540,550 | | | | 930,844 | | | | 04/26/16 | | | | 1,152 | |
| | GBP | | | 3,398,712 | | | USD | | | 4,858,612 | | | | 4,881,500 | | | | 04/07/16 | | | | 22,888 | |
| | NZD | | | 1,080,000 | | | USD | | | 715,853 | | | | 745,466 | | | | 04/26/16 | | | | 29,613 | |
BNP Paribas SA | | AUD | | | 961,000 | | | USD | | | 719,357 | | | | 735,773 | | | | 04/26/16 | | | | 16,416 | |
| | CHF | | | 708,477 | | | EUR | | | 644,000 | | | | 737,638 | | | | 04/26/16 | | | | 4,260 | |
| | EUR | | | 1,300,000 | | | GBP | | | 1,014,691 | | | | 1,480,421 | | | | 04/26/16 | | | | 22,959 | |
| | EUR | | | 1,926,000 | | | USD | | | 2,162,111 | | | | 2,193,302 | | | | 04/26/16 | | | | 31,191 | |
| | GBP | | | 745,685 | | | USD | | | 1,058,269 | | | | 1,071,074 | | | | 04/26/16 | | | | 12,805 | |
| | NOK | | | 11,053,856 | | | USD | | | 1,297,264 | | | | 1,335,710 | | | | 04/26/16 | | | | 38,446 | |
| | NZD | | | 1,537,826 | | | USD | | | 1,027,369 | | | | 1,061,479 | | | | 04/26/16 | | | | 34,110 | |
| | SEK | | | 6,115,280 | | | EUR | | | 653,000 | | | | 753,966 | | | | 04/26/16 | | | | 10,339 | |
| | USD | | | 737,312 | | | EUR | | | 646,000 | | | | 735,656 | | | | 04/26/16 | | | | 1,656 | |
Citibank NA | | EUR | | | 696,000 | | | CHF | | | 752,299 | | | | 793,864 | | | | 06/15/16 | | | | 8,783 | |
| | EUR | | | 1,296,000 | | | GBP | | | 1,008,423 | | | | 1,475,867 | | | | 04/26/16 | | | | 27,405 | |
| | EUR | | | 646,000 | | | NOK | | | 6,066,328 | | | | 735,656 | | | | 04/26/16 | | | | 2,622 | |
| | EUR | | | 648,000 | | | SEK | | | 5,984,928 | | | | 737,933 | | | | 04/26/16 | | | | 38 | |
| | EUR | | | 634,000 | | | USD | | | 716,674 | | | | 721,990 | | | | 04/26/16 | | | | 5,317 | |
| | GBP | | | 242,409 | | | USD | | | 343,541 | | | | 348,187 | | | | 04/26/16 | | | | 4,646 | |
| | NOK | | | 12,255,912 | | | EUR | | | 1,292,000 | | | | 1,480,962 | | | | 04/26/16 | | | | 9,651 | |
| | NZD | | | 2,264,696 | | | USD | | | 1,537,960 | | | | 1,563,198 | | | | 04/26/16 | | | | 25,238 | |
| | SEK | | | 533,785 | | | EUR | | | 57,462 | | | | 65,812 | | | | 04/26/16 | | | | 375 | |
| | USD | | | 294,290 | | | NZD | | | 425,853 | | | | 293,943 | | | | 04/26/16 | | | | 347 | |
Credit Suisse International (London) | | GBP | | | 657,597 | | | USD | | | 930,135 | | | | 944,493 | | | | 04/07/16 | | | | 14,358 | |
HSBC Bank PLC | | EUR | | | 1,955,000 | | | USD | | | 2,186,265 | | | | 2,226,326 | | | | 04/26/16 | | | | 40,061 | |
| | NOK | | | 6,007,457 | | | EUR | | | 632,000 | | | | 725,920 | | | | 04/26/16 | | | | 6,208 | |
| | SEK | | | 21,262,478 | | | EUR | | | 2,275,546 | | | | 2,621,498 | | | | 04/26/16 | | | | 30,138 | |
Royal Bank of Canada | | AUD | | | 678,422 | | | USD | | | 515,856 | | | | 519,374 | | | | 04/28/16 | | | | 3,518 | |
Standard Chartered Bank | | AUD | | | 970,000 | | | USD | | | 731,225 | | | | 742,664 | | | | 04/26/16 | | | | 11,439 | |
| | EUR | | | 6,269,327 | | | USD | | | 7,005,564 | | | | 7,139,420 | | | | 04/26/16 | | | | 133,856 | |
| | NZD | | | 610,197 | | | USD | | | 402,501 | | | | 421,186 | | | | 04/26/16 | | | | 18,685 | |
State Street Bank (London) | | CHF | | | 703,677 | | | EUR | | | 642,000 | | | | 732,640 | | | | 04/26/16 | | | | 1,540 | |
| | EUR | | | 645,000 | | | SEK | | | 5,954,382 | | | | 734,517 | | | | 04/26/16 | | | | 388 | |
| | EUR | | | 1,264,369 | | | USD | | | 1,417,744 | | | | 1,439,845 | | | | 04/26/16 | | | | 22,101 | |
| | GBP | | | 513,292 | | | EUR | | | 646,000 | | | | 737,273 | | | | 04/26/16 | | | | 1,617 | |
| | GBP | | | 264,807 | | | USD | | | 373,751 | | | | 380,358 | | | | 04/26/16 | | | | 6,607 | |
| | NOK | | | 13,132,025 | | | EUR | | | 1,390,000 | | | | 1,586,390 | | | | 06/15/16 | | | | 942 | |
| | SEK | | | 106,844,384 | | | EUR | | | 11,499,015 | | | | 13,173,080 | | | | 04/26/16 | | | | 78,164 | |
| | USD | | | 738,547 | | | AUD | | | 960,000 | | | | 735,007 | | | | 04/26/16 | | | | 3,540 | |
| | USD | | | 2,281,099 | | | JPY | | | 254,166,858 | | | | 2,260,176 | | | | 04/26/16 | | | | 20,922 | |
| | |
| The accompanying notes are an integral part of these financial statements. | | 61 |
GOLDMAN SACHS CORE FIXED INCOME FUND
Schedule of Investments (continued)
March 31, 2016
|
| ADDITIONAL INVESTMENT INFORMATION (continued) |
FORWARD FOREIGN CURRENCY EXCHANGE CONTRACTS WITH UNREALIZED GAIN (continued)
| | | | | | | | | | | | | | | | | | | | | | | | |
| Counterparty | | Currency Purchased | | | Currency Sold | | | Current Value | | | Settlement Date | | | Unrealized Gain | |
Westpac Banking Corp. | | AUD | | | 822,800 | | | USD | | | 621,082 | | | $ | 629,963 | | | | 04/26/16 | | | $ | 8,880 | |
| | NZD | | | 2,782,164 | | | USD | | | 1,890,184 | | | | 1,920,378 | | | | 04/26/16 | | | | 30,196 | |
| | | USD | | | 735,735 | | | NZD | | | 1,060,000 | | | | 731,661 | | | | 04/26/16 | | | | 4,075 | |
| TOTAL | | | | | | | | | | | | | | | | | | | | | | $ | 1,057,822 | |
FORWARD FOREIGN CURRENCY EXCHANGE CONTRACTS WITH UNREALIZED LOSS
| | | | | | | | | | | | | | | | | | | | | | | | |
| Counterparty | | Currency Purchased | | | Currency Sold | | | Current Value | | | Settlement Date | | | Unrealized Loss | |
Bank of America Securities LLC | | AUD | | | 1,922,000 | | | USD | | | 1,471,589 | | | $ | 1,471,546 | | | | 04/26/16 | | | $ | (43 | ) |
| | USD | | | 717,181 | | | EUR | | | 632,000 | | | | 719,713 | | | | 04/26/16 | | | | (2,532 | ) |
| | USD | | | 11,935,800 | | | EUR | | | 10,629,110 | | | | 12,113,308 | | | | 05/19/16 | | | | (177,508 | ) |
Barclays Bank PLC | | CAD | | | 1,861,411 | | | USD | | | 1,434,000 | | | | 1,433,293 | | | | 04/26/16 | | | | (707 | ) |
| | GBP | | | 518,454 | | | EUR | | | 654,000 | | | | 744,687 | | | | 04/26/16 | | | | (78 | ) |
| | USD | | | 2,171,000 | | | CAD | | | 2,887,882 | | | | 2,223,680 | | | | 04/26/16 | | | | (52,680 | ) |
| | USD | | | 736,392 | | | EUR | | | 648,000 | | | | 737,933 | | | | 04/26/16 | | | | (1,541 | ) |
| | USD | | | 719,004 | | | NZD | | | 1,067,000 | | | | 736,493 | | | | 04/26/16 | | | | (17,488 | ) |
BNP Paribas SA | | CHF | | | 715,358 | | | EUR | | | 656,280 | | | | 746,530 | | | | 06/15/16 | | | | (2,029 | ) |
| | USD | | | 1,455,858 | | | EUR | | | 1,298,000 | | | | 1,478,144 | | | | 04/26/16 | | | | (22,286 | ) |
| | USD | | | 3,057,061 | | | JPY | | | 345,884,414 | | | | 3,075,774 | | | | 04/26/16 | | | | (18,713 | ) |
| | USD | | | 729,428 | | | NZD | | | 1,090,000 | | | | 752,368 | | | | 04/26/16 | | | | (22,940 | ) |
| | USD | | | 487,620 | | | SEK | | | 4,065,309 | | | | 501,221 | | | | 04/26/16 | | | | (13,601 | ) |
Citibank NA | | EUR | | | 1,291,938 | | | CHF | | | 1,416,287 | | | | 1,471,241 | | | | 04/26/16 | | | | (3,340 | ) |
| | EUR | | | 1,828,328 | | | SEK | | | 16,972,164 | | | | 2,082,074 | | | | 04/26/16 | | | | (10,462 | ) |
| | GBP | | | 1,545,909 | | | EUR | | | 1,958,000 | | | | 2,220,485 | | | | 04/26/16 | | | | (9,258 | ) |
| | JPY | | | 33,038,472 | | | USD | | | 294,615 | | | | 293,794 | | | | 04/26/16 | | | | (821 | ) |
| | USD | | | 2,988,623 | | | AUD | | | 4,026,220 | | | | 3,082,606 | | | | 04/26/16 | | | | (93,983 | ) |
| | USD | | | 2,857,458 | | | CAD | | | 3,810,145 | | | | 2,933,825 | | | | 04/26/16 | | | | (76,367 | ) |
| | USD | | | 1,477,256 | | | EUR | | | 1,323,807 | | | | 1,507,533 | | | | 04/26/16 | | | | (30,277 | ) |
| | USD | | | 1,157,963 | | | GBP | | | 813,823 | | | | 1,168,877 | | | | 04/07/16 | | | | (10,914 | ) |
| | USD | | | 316,864 | | | JPY | | | 35,957,750 | | | | 319,754 | | | | 04/26/16 | | | | (2,890 | ) |
| | USD | | | 314,777 | | | SEK | | | 2,629,772 | | | | 324,230 | | | | 04/26/16 | | | | (9,454 | ) |
HSBC Bank PLC | | USD | | | 345,938 | | | AUD | | | 463,715 | | | | 355,035 | | | | 04/26/16 | | | | (9,097 | ) |
| | USD | | | 668,343 | | | CAD | | | 929,000 | | | | 715,317 | | | | 04/06/16 | | | | (46,974 | ) |
JPMorgan Securities, Inc. | | USD | | | 705,621 | | | SEK | | | 6,065,658 | | | | 747,664 | | | | 04/19/16 | | | | (42,043 | ) |
Royal Bank of Canada | | USD | | | 1,005,401 | | | JPY | | | 113,919,000 | | | | 1,013,293 | | | | 05/06/16 | | | | (7,892 | ) |
Royal Bank of Scotland PLC | | USD | | | 4,918,970 | | | GBP | | | 3,438,517 | | | | 4,938,670 | | | | 04/07/16 | | | | (19,700 | ) |
Standard Chartered Bank | | NZD | | | 1,066,000 | | | USD | | | 736,118 | | | | 735,802 | | | | 04/26/16 | | | | (315 | ) |
| | USD | | | 1,450,239 | | | EUR | | | 1,290,000 | | | | 1,469,034 | | | | 04/26/16 | | | | (18,794 | ) |
| | USD | | | 460,317 | | | SEK | | | 3,828,777 | | | | 472,058 | | | | 04/26/16 | | | | (11,742 | ) |
State Street Bank (London) | | EUR | | | 1,304,000 | | | SEK | | | 12,097,847 | | | | 1,484,976 | | | | 04/26/16 | | | | (6,593 | ) |
| | USD | | | 3,609,953 | | | AUD | | | 4,865,165 | | | | 3,724,930 | | | | 04/26/16 | | | | (114,977 | ) |
| | USD | | | 703,592 | | | CAD | | | 936,326 | | | | 720,975 | | | | 04/26/16 | | | | (17,383 | ) |
| | USD | | | 286,284 | | | EUR | | | 257,835 | | | | 293,618 | | | | 04/26/16 | | | | (7,334 | ) |
Westpac Banking Corp. | | USD | | | 1,207,137 | | | AUD | | | 1,588,672 | | | | 1,216,339 | | | | 04/26/16 | | | | (9,203 | ) |
| | USD | | | 717,130 | | | EUR | | | 632,000 | | | | 719,713 | | | | 04/26/16 | | | | (2,582 | ) |
| | | USD | | | 4,711,740 | | | NZD | | | 6,996,783 | | | | 4,829,502 | | | | 04/26/16 | | | | (117,762 | ) |
| TOTAL | | | | | | | | | | | | | | | | | | | | | | $ | (1,012,303 | ) |
| | |
| 62 | | The accompanying notes are an integral part of these financial statements. |
GOLDMAN SACHS CORE FIXED INCOME FUND
|
| ADDITIONAL INVESTMENT INFORMATION (continued) |
FORWARD SALES CONTRACT — At March 31, 2016, the Fund had the following forward sales contracts:
| | | | | | | | | | | | | | | | | | |
| Description | | Interest
Rate | | | Maturity
Date(a) | | Settlement
Date | | | Principal
Amount | | | Value | |
FNMA (Proceeds Received: $(4,059,219)) | | | 3.000 | % | | TBA-30yr | | | 05/12/16 | | | $ | (4,000,000 | ) | | $ | (4,095,000 | ) |
| | (a) | | TBA (To Be Announced) Securities are purchased or sold on a forward commitment basis with an approximate principal amount and no defined maturity date. The actual principal and maturity date will be determined upon settlement when the specific mortgage pools are assigned. |
FUTURES CONTRACTS — At March 31, 2016, the Fund had the following futures contracts:
| | | | | | | | | | | | | | |
| Type | | Number of
Contracts
Long (Short) | | | Expiration Date | | Current Value | | | Unrealized Gain (Loss) | |
Australian 10 Year Government Bonds | | | 29 | | | June 2016 | | $ | 2,911,100 | | | $ | 19,411 | |
Eurodollars | | | 1 | | | March 2017 | | | 247,825 | | | | 248 | |
Ultra Long U.S. Treasury Bonds | | | (61 | ) | | June 2016 | | | (10,524,406 | ) | | | (23,127 | ) |
2 Year U.S. Treasury Notes | | | 432 | | | June 2016 | | | 94,500,000 | | | | 30,796 | |
5 Year U.S. Treasury Notes | | | 399 | | | June 2016 | | | 48,344,461 | | | | 156,658 | |
10 Year U.S. Treasury Notes | | | (239 | ) | | June 2016 | | | (31,163,359 | ) | | | (96,034 | ) |
20 Year U.S. Treasury Bonds | | | 3 | | | June 2016 | | | 493,312 | | | | 6,288 | |
| TOTAL | | | $ | 94,240 | |
SWAP CONTRACTS — At March 31, 2016, the Fund had the following swap contracts:
CENTRALLY CLEARED INTEREST RATE SWAP CONTRACTS
| | | | | | | | | | | | | | | | | | |
| | | | | | | Rates Exchanged | | Market Value | |
Notional Amount (000s)(b) | | | Termination
Date | | | Payments
Received | | Payments
Made | | Upfront
Payments
Made (Received) | | | Unrealized
Gain (Loss) | |
| SEK | 97,180 | | | | 06/15/18 | | | 0.050% | | 3 month STIBOR | | $ | 93,834 | | | $ | (7,827 | ) |
| EUR | 12,510 | | | | 02/17/19 | | | 6 month EURO | | 0.086% | | | 1,073 | | | | (8,397 | ) |
| | 4,540 | | | | 02/09/20 | | | 6 month EURO | | 0.100 | | | (3,050 | ) | | | (5,323 | ) |
| | 11,280 | | | | 02/26/20 | | | 0.050 | | 6 month EURO | | | 4,516 | | | | 1,357 | |
| GBP | 2,620 | | | | 02/16/21 | | | 6 month GBP | | 1.160 | | | (2,927 | ) | | | (790 | ) |
| CAD | 36,750 | | | | 06/15/21 | | | 1.000 | | 6 month CDOR | | | 2,017 | | | | 3,181 | |
| AUD | 5,110 | | | | 06/15/21 | | | 2.500 | | 6 month AUDOR | | | 13,372 | | | | 16,982 | |
| $ | 16,440 | | | | 06/15/21 | | | 3 month LIBOR | | 2.000 | | | (479,748 | ) | | | (140,081 | ) |
| SEK | 99,260 | | | | 06/15/21 | | | 3 month STIBOR | | 0.500 | | | (89,235 | ) | | | 1,017 | |
| GBP | 3,780 | | | | 06/15/21 | | | 6 month GBP | | 1.750 | | | (199,621 | ) | | | 8,196 | |
| | 3,240 | | | | 12/11/22 | | | 6 Month GBP | | 1.940 | | | (10,776 | ) | | | (136,949 | ) |
| EUR | 1,520 | | | | 02/09/23 | | | 0.500 | | 6 month EURO | | | 1,798 | | | | 11,559 | |
| | 8,380 | | | | 06/15/23 | | | 0.750 | | 6 month EURO | | | 275,991 | | | | 53,180 | |
| JPY | 1,596,410 | | | | 06/15/23 | | | 6 month JYOR | | 0.100 | | | (71,872 | ) | | | (4,027 | ) |
| GBP | 2,570 | | | | 02/16/25 | | | 1.570 | | 6 Month GBP | | | 10,571 | | | | 6,706 | |
| EUR | 2,530 | | | | 05/11/25 | | | 1.567 | | 6 month EURO | | | 78,739 | | | | 21,698 | |
| | 17,550 | | | | 05/11/25 | | | 1.568 | | 6 month EURO | | | 20,943 | | | | 675,763 | |
| | 4,240 | | | | 09/16/25 | | | 2.000 | | 6 month EURO | | | 80,221 | | | | 172,963 | |
| GBP | 2,780 | | | | 09/16/25 | | | 6 month GBP | | 2.750 | | | (258,621 | ) | | | 77,279 | |
| JPY | 1,670,820 | | | | 12/16/25 | | | 6 month JYOR | | 1.000 | | | (565,963 | ) | | | 74,833 | |
| EUR | 12,110 | | | | 01/06/26 | | | 1.550 | | 6 month EURO | | | 1,851,609 | | | | (1,483,751 | ) |
| AUD | 3,010 | | | | 03/24/26 | | | 3.100 | | 6 month AUDOR | | | 9,739 | | | | 7,381 | |
| EUR | 22,330 | | | | 06/15/26 | | | 1.000 | | 6 month EURO | | | 1,092,292 | | | | (2,972 | ) |
| | |
| The accompanying notes are an integral part of these financial statements. | | 63 |
GOLDMAN SACHS CORE FIXED INCOME FUND
Schedule of Investments (continued)
March 31, 2016
|
| ADDITIONAL INVESTMENT INFORMATION (continued) |
CENTRALLY CLEARED INTEREST RATE SWAP CONTRACTS (continued)
| | | | | | | | | | | | | | | | | | |
| | | | | | | Rates Exchanged | | Market Value | |
Notional Amount (000s)(b) | | | Termination
Date | | | Payments
Received | | Payments
Made | | Upfront
Payments
Made (Received) | | | Unrealized
Gain (Loss) | |
| $ | 6,920 | | | | 06/15/26 | | | 3 month LIBOR | | 2.250% | | $ | (249,894 | ) | | $ | (120,667 | ) |
| NZD | 6,790 | | | | 06/15/26 | | | 3 month NZDOR | | 3.000 | | | 51,384 | | | | (46,294 | ) |
| SEK | 46,250 | | | | 06/15/26 | | | 3 month STIBOR | | 1.250 | | | (20,338 | ) | | | (10,440 | ) |
| AUD | 14,400 | | | | 06/15/26 | | | 3.000% | | 6 month AUDOR | | | 292,608 | | | | 78,200 | |
| | 2,410 | | | | 06/16/26 | | | 3.000 | | 6 month AUDOR | | | 37,694 | | | | 24,327 | |
| $ | 7,200 | | | | 12/15/26 | | | 2.500 | | 3 month LIBOR | | | 67,042 | | | | 21,479 | |
| SEK | 14,260 | | | | 12/15/26 | | | 2.750 | | 3 month STIBOR | | | (976 | ) | | | 46,600 | |
| GBP | 5,700 | | | | 12/11/27 | | | 2.190 | | 6 month GBP | | | 33,740 | | | | 375,417 | |
| | 2,910 | | | | 12/11/32 | | | 6 month GBP | | 2.250 | | | (17,571 | ) | | | (250,088 | ) |
| | 740 | | | | 02/16/33 | | | 6 month GBP | | 1.820 | | | (4,398 | ) | | | 155 | |
| EUR | 6,100 | | | | 05/11/35 | | | 6 month GBP | | 1.695 | | | (117,254 | ) | | | (281,448 | ) |
| $ | 5,830 | | | | 12/17/35 | | | 3.000 | | 3 month LIBOR | | | 223,887 | | | | 5,306 | |
| JPY | 742,850 | | | | 12/17/35 | | | 6 month JYOR | | 2.000 | | | (648,958 | ) | | | (82,349 | ) |
| | 193,300 | | | | 03/30/36 | | | 6 month JYOR | | 0.900 | | | (3,748 | ) | | | (2,433 | ) |
| | 78,290 | | | | 06/15/36 | | | 6 month JYOR | | 0.500 | | | 701 | | | | 165 | |
| EUR | 1,860 | | | | 12/19/45 | | | 1.250 | | 6 month EURO | | | (113 | ) | | | 23,788 | |
| $ | 5,880 | | | | 12/19/45 | | | 2.750 | | 3 month LIBOR | | | 121,859 | | | | 417 | |
| JPY | 807,750 | | | | 12/19/45 | | | 6 month JYOR | | 2.000 | | | (519,444 | ) | | | (227,276 | ) |
| GBP | 3,380 | | | | 01/05/46 | | | 6 month GBP | | 2.250 | | | (126,023 | ) | | | (209,031 | ) |
| $ | 330 | | | | 06/15/46 | | | 2.500 | | 3 month LIBOR | | | 25,858 | | | | 1,138 | |
| GBP | 34,590 | | | | 06/15/46 | | | 6 month GBP | | 2.000 | | | (588,436 | ) | | | 23,791 | |
| | TOTAL | | | | | | | | | | | $ | 412,522 | | | $ | (1,287,265 | ) |
| | (b) | | Represents forward starting interest rate swaps whose effective dates of commencement of accruals and cash flows occur subsequent to March 31, 2016. |
CENTRALLY CLEARED CREDIT DEFAULT SWAP CONTRACT
| | | | | | | | | | | | | | | | | | | | | | |
| | | | | | | | | | | | | | Market Value | |
| Referenced Obligation | | Notional Amount
(000s) | | Rates
Received
(Paid) | | | Termination
Date | | | Credit
Spread at
March 31,
2016(c) | | | Upfront
Payments
Made (Received) | | | Unrealized
Gain (Loss) | |
Protection Purchased: | | | | | | | | | | | | | | | | | | | | | | |
CDX Investment Grade Index 26 | | $59,725 | | | (1.000 | )% | | | 06/20/21 | | | | 0.796 | % | | $ | (577,109 | ) | | $ | (46,721 | ) |
| | (c) | | Credit spread on the Referenced Obligation, together with the term of the swap contract, are indicators of payment/performance risk. The likelihood of a credit event occurring which would require a fund to make a payment or otherwise be required to perform under the swap contract is generally greater as the credit spread and the term of the swap contract increase. |
INTEREST RATE SWAPTION CONTRACTS
For the fiscal year ended March 31, 2016, the Fund had the following interest rate swaptions activities:
| | | | | | | | |
| | | Notional
Amount
(000s) | | | Premiums
Received | |
Contracts Outstanding March 31, 2015 | | $ | — | | | $ | — | |
Contracts Written | | | 30,000 | | | | 697,260 | |
Contracts Bought to Close | | | (30,000 | ) | | | (697,260 | ) |
Contracts Outstanding March 31, 2016 | | $ | — | | | $ | — | |
| | |
| 64 | | The accompanying notes are an integral part of these financial statements. |
GOLDMAN SACHS GLOBAL INCOME FUND
Schedule of Investments
March 31, 2016
| | | | | | | | | | | | | | |
Principal Amount | | | Interest Rate | | | Maturity Date | | | Value | |
| | | | | | | | | | | | | | |
| | Foreign Sovereign Debt Obligations – 46.2% | |
| | British Pound – 3.3% | |
| United Kingdom Treasury | |
| GBP | 3,400,000 | | | | 1.750 | % | | | 07/22/19 | | | $ | 5,067,541 | |
| | 2,930,000 | | | | 2.000 | | | | 09/07/25 | | | | 4,428,090 | |
| | 2,000,000 | | | | 4.500 | | | | 09/07/34 | | | | 3,939,373 | |
| | 1,200,000 | | | | 4.250 | | | | 03/07/36 | | | | 2,313,867 | |
| | 2,170,000 | | | | 3.250 | | | | 01/22/44 | | | | 3,739,120 | |
| | 2,970,000 | | | | 3.500 | | | | 01/22/45 | | | | 5,362,234 | |
| | 720,000 | | | | 3.500 | | | | 07/22/68 | | | | 1,482,557 | |
| | | | | | | | | | | | | | |
| | | | | | | | | | | | | 26,332,782 | |
| | |
| | Canadian Dollar – 1.6% | |
| British Columbia Province of Canada | |
| CAD | 800,000 | | | | 3.250 | | | | 12/18/21 | | | | 676,472 | |
| Government of Canada | |
| | 2,530,000 | | | | 2.500 | | | | 06/01/24 | | | | 2,154,498 | |
| | 2,920,000 | | | | 4.000 | | | | 06/01/41 | | | | 3,120,482 | |
| Ontario Province of Canada | |
| | 1,800,000 | | | | 4.400 | | | | 06/02/19 | | | | 1,527,232 | |
| | 1,700,000 | | | | 2.600 | | | | 06/02/25 | | | | 1,354,398 | |
| | 2,300,000 | | | | 4.650 | | | | 06/02/41 | | | | 2,244,588 | |
| Quebec Province of Canada | |
| | 1,800,000 | | | | 4.250 | | | | 12/01/21 | | | | 1,590,763 | |
| | | | | | | | | | | | | | |
| | | | | | | | | | | | | 12,668,433 | |
| | |
| | Czech Koruna – 0.1% | |
| Czech Republic Government Bond | |
| CZK | 11,190,000 | | | | 1.500 | | | | 10/29/19 | | | | 496,044 | |
| | |
| | Danish Krone – 0.1% | |
| Kingdom of Denmark | |
| DKK | 3,000,000 | | | | 4.500 | | | | 11/15/39 | | | | 799,502 | |
| | |
| | Euro – 20.8% | |
| Federal Republic of Germany | |
| EUR | 10,750,000 | | | | 0.500 | | | | 02/23/18 | | | | 12,460,680 | |
| | 14,900,000 | | | | 0.000 | | | | 03/16/18 | | | | 17,117,303 | |
| | 950,000 | | | | 2.250 | | | | 09/04/20 | | | | 1,209,471 | |
| | 4,000,000 | | | | 1.000 | | | | 08/15/24 | | | | 4,948,772 | |
| | 6,270,000 | | | | 4.750 | | | | 07/04/34 | | | | 12,261,436 | |
| | 500,000 | | | | 2.500 | | | | 08/15/46 | | | | 822,445 | |
| Government of France | |
| | 2,200,000 | | | | 1.000 | | | | 11/25/18 | | | | 2,595,229 | |
| | 18,980,000 | | | | 1.750 | | | | 11/25/24 | | | | 24,366,980 | |
| | 1,330,000 | | | | 4.500 | | | | 04/25/41 | | | | 2,566,950 | |
| Italy Buoni Poliennali Del Tesoro | |
| | 3,468,394 | | | | 2.350 | | | | 09/15/19 | | | | 4,340,201 | |
| | 1,370,000 | | | | 5.000 | | | | 03/01/22 | | | | 1,962,138 | |
| | 8,030,198 | | | | 2.350 | (a) | | | 09/15/24 | | | | 10,669,015 | |
| | 2,040,000 | | | | 3.500 | (a) | | | 03/01/30 | | | | 2,857,679 | |
| | 190,000 | | | | 5.000 | | | | 08/01/34 | | | | 318,006 | |
| Kingdom of Belgium | |
| | 4,485,000 | | | | 3.750 | (a) | | | 09/28/20 | | | | 6,032,824 | |
| | 40,000 | | | | 2.250 | | | | 06/22/23 | | | | 52,791 | |
| | 3,100,000 | | | | 2.600 | (a) | | | 06/22/24 | | | | 4,216,055 | |
| Kingdom of The Netherlands(a) | |
| | 7,320,000 | | | | 4.000 | | | | 07/15/18 | | | | 9,179,611 | |
| | 3,580,000 | | | | 0.250 | | | | 07/15/25 | | | | 4,080,688 | |
| | |
| | | | | | | | | | | | | | |
| | Foreign Sovereign Debt Obligations – (continued) | |
| | Euro – (continued) | |
| Republic of Austria(a) | |
| EUR | 8,990,000 | | | | 4.350 | % | | | 03/15/19 | | | $ | 11,661,880 | |
| Republic of Ireland | |
| | 860,000 | | | | 4.500 | | | | 04/18/20 | | | | 1,158,861 | |
| | 510,000 | | | | 3.400 | | | | 03/18/24 | | | | 710,462 | |
| Republic of Italy | |
| | 7,059,088 | | | | 2.150 | | | | 11/12/17 | | | | 8,334,718 | |
| | 1,310,000 | | | | 5.000 | | | | 08/01/39 | | | | 2,260,912 | |
| Spain Government Bond(a) | |
| | 2,200,000 | | | | 4.800 | | | | 01/31/24 | | | | 3,200,821 | |
| | 2,230,000 | | | | 3.800 | | | | 04/30/24 | | | | 3,048,065 | |
| | 1,250,000 | | | | 2.750 | | | | 10/31/24 | | | | 1,593,984 | |
| | 5,345,000 | | | | 5.900 | | | | 07/30/26 | | | | 8,650,169 | |
| Spain Government Inflation Linked Bond(a) | |
| | 3,157,152 | | | | 0.550 | | | | 11/30/19 | | | | 3,725,446 | |
| | | | | | | | | | | | | | |
| | | | | | | | | | | | | 166,403,592 | |
| | |
| | Japanese Yen – 17.0% | |
| Government of Japan | |
| JPY | 2,402,800,000 | | | | 0.300 | | | | 03/20/18 | | | | 21,565,955 | |
| | 667,500,000 | | | | 0.200 | | | | 09/20/18 | | | | 5,993,414 | |
| | 3,126,500,000 | | | | 1.300 | | | | 06/20/20 | | | | 29,549,585 | |
| | 2,037,100,000 | | | | 0.800 | | | | 09/20/23 | | | | 19,420,190 | |
| | 108,950,000 | | | | 0.400 | | | | 06/20/25 | | | | 1,012,114 | |
| | 642,950,000 | | | | 0.400 | | | | 09/20/25 | | | | 5,974,302 | |
| | 436,000,000 | | | | 2.200 | | | | 03/20/31 | | | | 5,032,256 | |
| | 225,000,000 | | | | 1.700 | | | | 09/20/32 | | | | 2,465,374 | |
| | 214,000,000 | | | | 1.400 | | | | 09/20/34 | | | | 2,251,616 | |
| | 1,574,200,000 | | | | 2.500 | | | | 09/20/34 | | | | 19,303,025 | |
| | 348,000,000 | | | | 2.200 | | | | 09/20/39 | | | | 4,244,985 | |
| | 391,000,000 | | | | 1.400 | | | | 09/20/45 | | | | 4,277,115 | |
| | 141,600,000 | | | | 2.000 | | | | 03/20/52 | | | | 1,827,809 | |
| | 162,700,000 | | | | 1.400 | | | | 03/20/55 | | | | 1,834,002 | |
| Japanese Government CPI Linked Bond | |
| | 23,359,000 | | | | 0.100 | | | | 09/10/24 | | | | 218,408 | |
| | 1,177,969,200 | | | | 0.100 | | | | 03/10/25 | | | | 11,024,523 | |
| | | | | | | | | | | | | | |
| | | | | | | | | | | | | 135,994,673 | |
| | |
| | Mexican Peso – 0.5% | |
| United Mexican States | |
| MXN | 13,428,840 | | | | 0.000 | (b) | | | 04/28/16 | | | | 774,027 | |
| | 14,260,700 | | | | 0.000 | (b) | | | 05/12/16 | | | | 820,778 | |
| | 14,401,940 | | | | 0.000 | (b) | | | 06/16/16 | | | | 827,012 | |
| | 7,154,300 | | | | 7.750 | | | | 11/23/34 | | | | 465,851 | |
| | 13,763,300 | | �� | | 10.000 | | | | 11/20/36 | | | | 1,096,346 | |
| | 1,882,300 | | | | 8.500 | | | | 11/18/38 | | | | 131,588 | |
| | | | | | | | | | | | | | |
| | | | | | | | | | | | | 4,115,602 | |
| | |
| | Polish Zloty – 0.1% | |
| Poland Government Bond | |
| PLN | 980,000 | | | | 3.250 | | | | 07/25/19 | | | | 276,258 | |
| | 290,000 | | | | 4.000 | | | | 10/25/23 | | | | 85,546 | |
| | 1,200,000 | | | | 3.250 | | | | 07/25/25 | | | | 335,783 | |
| | | | | | | | | | | | | | |
| | | | | | | | | | | | | 697,587 | |
| | |
| | |
| The accompanying notes are an integral part of these financial statements. | | 65 |
GOLDMAN SACHS GLOBAL INCOME FUND
Schedule of Investments (continued)
March 31, 2016
| | | | | | | | | | | | | | |
Principal Amount | | | Interest Rate | | | Maturity Date | | | Value | |
| | | | | | | | | | | | | | |
| | Foreign Sovereign Debt Obligations – (continued) | |
| | South African Rand – 0.2% | |
| Republic of South Africa | |
| ZAR | 18,820,000 | | | | 7.750 | % | | | 02/28/23 | | | $ | 1,196,065 | |
| | 6,569,608 | | | | 10.500 | | | | 12/21/26 | | | | 486,309 | |
| | | | | | | | | | | | | | |
| | | | | | | | | | | | | 1,682,374 | |
| | |
| | South Korean Won – 0.5% | |
| Republic of Korea | |
| KRW | 3,819,000,000 | | | | 5.000 | | | | 06/10/20 | | | | 3,804,851 | |
| | |
| | United States Dollar – 2.0% | |
| Republic of Chile | |
| $ | 6,171,000 | | | | 3.125 | | | | 01/21/26 | | | | 6,248,137 | |
| | 150,000 | | | | 3.625 | | | | 10/30/42 | | | | 142,500 | |
| Republic of Colombia | |
| | 200,000 | | | | 5.625 | | | | 02/26/44 | | | | 199,000 | |
| | 200,000 | | | | 5.000 | | | | 06/15/45 | | | | 187,500 | |
| Republic of Indonesia | |
| | 970,000 | | | | 5.875 | | | | 01/15/24 | | | | 1,091,250 | |
| | 200,000 | | | | 4.125 | (a) | | | 01/15/25 | | | | 201,000 | |
| | 1,110,000 | | | | 4.125 | | | | 01/15/25 | | | | 1,115,550 | |
| | 1,050,000 | | | | 6.750 | | | | 01/15/44 | | | | 1,265,444 | |
| | 230,000 | | | | 5.125 | | | | 01/15/45 | | | | 228,850 | |
| Republic of Kazakhstan | |
| | 550,000 | | | | 5.125 | | | | 07/21/25 | | | | 565,950 | |
| Republic of Korea | |
| | 660,000 | | | | 7.125 | | | | 04/16/19 | | | | 767,930 | |
| Republic of Peru | |
| | 580,000 | | | | 6.550 | | | | 03/14/37 | | | | 722,100 | |
| Republic of South Africa | |
| | 210,000 | | | | 5.875 | | | | 09/16/25 | | | | 227,850 | |
| Republic of Turkey | |
| | 500,000 | | | | 5.750 | | | | 03/22/24 | | | | 540,625 | |
| United Mexican States | |
| | 460,000 | | | | 4.750 | | | | 03/08/44 | | | | 460,000 | |
| | 1,210,000 | | | | 5.550 | | | | 01/21/45 | | | | 1,340,075 | |
| | 470,000 | | | | 5.750 | | | | 10/12/10 | | | | 478,225 | |
| | | | | | | | | | | | | | |
| | | | | | | | | | | | | 15,781,986 | |
| | |
| TOTAL FOREIGN SOVEREIGN DEBT
OBLIGATIONS |
| | | | |
| | (Cost $355,947,674) | | | $ | 368,777,426 | |
| | |
| | | | | | | | | | | | | | |
| | Corporate Obligations – 19.8% | |
| | Automotive – 0.5% | |
| BMW US Capital LLC | |
| EUR | 350,000 | | | | 1.125 | % | | | 09/18/21 | | | $ | 413,260 | |
| FCE Bank PLC | |
| | 750,000 | | | | 1.625 | | | | 09/09/16 | | | | 858,783 | |
| Ford Motor Credit Co. LLC | |
| $ | 2,300,000 | | | | 3.984 | | | | 06/15/16 | | | | 2,314,580 | |
| | 300,000 | | | | 4.250 | | | | 02/03/17 | | | | 306,693 | |
| | | | | | | | | | | | | | |
| | | | | | | | | | | | | 3,893,316 | |
| | |
| | | | | | | | | | | | | | |
| | Corporate Obligations – (continued) | |
| | Banks – 7.4% | |
| ABN AMRO Bank NV | |
| EUR | 1,000,000 | | | | 2.875 | %(c)(d) | | | 06/30/25 | | | $ | 1,160,055 | |
| $ | 800,000 | | | | 4.750 | (a) | | | 07/28/25 | | | | 805,790 | |
| American Express Credit Corp. | |
| | 700,000 | | | | 2.800 | | | | 09/19/16 | | | | 705,956 | |
| Bank of America Corp. | |
| EUR | 300,000 | | | | 4.625 | | | | 08/07/17 | | | | 362,036 | |
| $ | 1,550,000 | | | | 5.750 | | | | 12/01/17 | | | | 1,645,070 | |
| | 1,000,000 | | | | 5.650 | | | | 05/01/18 | | | | 1,072,646 | |
| | 1,400,000 | | | | 2.600 | | | | 01/15/19 | | | | 1,422,439 | |
| | 600,000 | | | | 2.650 | | | | 04/01/19 | | | | 609,974 | |
| | 1,450,000 | | | | 4.125 | | | | 01/22/24 | | | | 1,528,224 | |
| | 150,000 | | | | 3.875 | | | | 08/01/25 | | | | 155,725 | |
| Bank of Ireland | |
| EUR | 6,500,000 | | | | 1.250 | | | | 04/09/20 | | | | 7,473,123 | |
| BBVA Subordinated Capital SAU(c)(d) | |
| | 600,000 | | | | 3.500 | | | | 04/11/24 | | | | 701,884 | |
| BNP Paribas SA(c)(d) | |
| | 150,000 | | | | 4.730 | | | | 04/12/49 | | | | 170,709 | |
| Branch Banking & Trust Co.(d) | |
| $ | 1,250,000 | | | | 3.625 | | | | 09/16/25 | | | | 1,304,702 | |
| Citigroup, Inc. | |
| | 1,300,000 | | | | 3.700 | | | | 01/12/26 | | | | 1,335,010 | |
| Cooperatieve Rabobank UA | |
| EUR | 1,600,000 | | | | 3.875 | | | | 07/25/23 | | | | 2,054,774 | |
| Credit Agricole SA(a) | |
| $ | 1,500,000 | | | | 2.125 | | | | 04/17/18 | | | | 1,510,548 | |
| Credit Suisse AG | |
| | 750,000 | | | | 6.500 | | | | 08/08/23 | | | | 806,250 | |
| HSBC Holdings PLC | |
| | 200,000 | | | | 4.250 | | | | 08/18/25 | | | | 197,193 | |
| | 450,000 | | | | 6.800 | | | | 06/01/38 | | | | 543,365 | |
| ING Bank NV | |
| EUR | 300,000 | | | | 6.125 | (c)(d) | | | 05/29/23 | | | | 373,984 | |
| $ | 900,000 | | | | 5.800 | (a) | | | 09/25/23 | | | | 980,719 | |
| | 2,800,000 | | | | 4.125 | (c)(d) | | | 11/21/23 | | | | 2,823,996 | |
| Intesa Sanpaolo SpA | |
| | 800,000 | | | | 2.375 | | | | 01/13/17 | | | | 803,470 | |
| | 1,700,000 | | | | 3.875 | | | | 01/16/18 | | | | 1,739,505 | |
| | 900,000 | | | | 3.875 | | | | 01/15/19 | | | | 924,153 | |
| | 500,000 | | | | 5.017 | (a) | | | 06/26/24 | | | | 468,894 | |
| JPMorgan Chase & Co.(d) | |
| | 1,550,000 | | | | 3.300 | | | | 04/01/26 | | | | 1,568,891 | |
| KBC Bank NV(c)(d) | |
| | 1,000,000 | | | | 8.000 | | | | 01/25/23 | | | | 1,077,500 | |
| KBC Groep NV(c)(d) | |
| EUR | 1,600,000 | | | | 1.875 | | | | 03/11/27 | | | | 1,777,272 | |
| Lloyds TSB Bank PLC(c)(d) | |
| | 1,250,000 | | | | 11.875 | | | | 12/16/21 | | | | 1,531,625 | |
| Mitsubishi UFJ Financial Group, Inc. | |
| $ | 1,150,000 | | | | 2.950 | | | | 03/01/21 | | | | 1,172,882 | |
| | 1,100,000 | | | | 3.850 | | | | 03/01/26 | | | | 1,143,798 | |
| Morgan Stanley, Inc. | |
| | 500,000 | | | | 5.625 | | | | 09/23/19 | | | | 555,513 | |
| EUR | 900,000 | | | | 2.375 | | | | 03/31/21 | | | | 1,089,694 | |
| $ | 50,000 | | | | 3.875 | | | | 04/29/24 | | | | 52,153 | |
| | |
| | |
| 66 | | The accompanying notes are an integral part of these financial statements. |
GOLDMAN SACHS GLOBAL INCOME FUND
| | | | | | | | | | | | | | |
Principal Amount | | | Interest Rate | | | Maturity Date | | | Value | |
| | | | | | | | | | | | | | |
| | Corporate Obligations – (continued) | |
| | Banks – (continued) | |
| Morgan Stanley, Inc. – (continued) | |
| $ | 1,700,000 | | | | 3.700 | % | | | 10/23/24 | | | $ | 1,745,985 | |
| EUR | 300,000 | | | | 1.750 | | | | 01/30/25 | | | | 340,168 | |
| $ | 300,000 | | | | 4.000 | | | | 07/23/25 | | | | 313,423 | |
| | 1,000,000 | | | | 3.950 | | | | 04/23/27 | | | | 992,545 | |
| | 350,000 | | | | 4.300 | | | | 01/27/45 | | | | 351,129 | |
| Regions Financial Corp.(d) | |
| | 750,000 | | | | 2.000 | | | | 05/15/18 | �� | | | 745,537 | |
| Santander UK Group Holdings PLC(a) | |
| | 3,600,000 | | | | 4.750 | | | | 09/15/25 | | | | 3,424,860 | |
| | 900,000 | | | | 5.625 | | | | 09/15/45 | | | | 830,281 | |
| Synchrony Financial(d) | |
| | 100,000 | | | | 1.875 | | | | 08/15/17 | | | | 99,578 | |
| | 250,000 | | | | 3.000 | | | | 08/15/19 | | | | 252,221 | |
| The Bank of Tokyo-Mitsubishi UFJ Ltd.(a) | |
| | 1,050,000 | | | | 1.700 | | | | 03/05/18 | | | | 1,044,331 | |
| UBS Group Funding Jersey Ltd.(a) | |
| | 2,400,000 | | | | 3.000 | | | | 04/15/21 | | | | 2,404,411 | |
| | 1,750,000 | | | | 4.125 | | | | 09/24/25 | | | | 1,752,495 | |
| Wells Fargo & Co. | |
| | 800,000 | | | | 3.300 | | | | 09/09/24 | | | | 824,763 | |
| | | | | | | | | | | | | | |
| | | | | | | | | | | | | 58,771,249 | |
| | |
| | Chemicals – 0.3% | |
| Bayer AG(c)(d) | |
| EUR | 850,000 | | | | 3.750 | | | | 07/01/74 | | | | 999,036 | |
| Eastman Chemical Co.(d) | |
| $ | 650,000 | | | | 3.800 | | | | 03/15/25 | | | | 658,974 | |
| LYB International Finance BV | |
| | 150,000 | | | | 5.250 | | | | 07/15/43 | | | | 154,629 | |
| LyondellBasell Industries NV(d) | |
| | 500,000 | | | | 5.000 | | | | 04/15/19 | | | | 532,572 | |
| Monsanto Co.(d) | |
| | 150,000 | | | | 4.400 | | | | 07/15/44 | | | | 138,790 | |
| | | | | | | | | | | | | | |
| | | | | | | | | | | | | 2,484,001 | |
| | |
| | Communications – 2.0% | |
| 21st Century Fox America, Inc. | |
| | 50,000 | | | | 4.000 | | | | 10/01/23 | | | | 53,739 | |
| | 600,000 | | | | 3.700 | (d) | | | 09/15/24 | | | | 631,968 | |
| | 550,000 | | | | 3.700 | (d) | | | 10/15/25 | | | | 574,931 | |
| America Movil SAB de CV | |
| MXN | 5,260,000 | | | | 6.000 | | | | 06/09/19 | | | | 300,431 | |
| American Tower Corp.(d) | |
| $ | 450,000 | | | | 3.300 | | | | 02/15/21 | | | | 457,836 | |
| AT&T, Inc.(d) | |
| | 1,750,000 | | | | 3.400 | | | | 05/15/25 | | | | 1,754,802 | |
| British Telecommunications PLC | |
| GBP | 244,000 | | | | 6.625 | | | | 06/23/17 | | | | 372,351 | |
| CCO Safari II LLC(a)(d) | |
| $ | 150,000 | | | | 3.579 | | | | 07/23/20 | | | | 152,783 | |
| | 1,150,000 | | | | 4.908 | | | | 07/23/25 | | | | 1,215,796 | |
| Comcast Corp. | |
| | 50,000 | | | | 4.500 | | | | 01/15/43 | | | | 54,343 | |
| | 1,600,000 | | | | 4.600 | (d) | | | 08/15/45 | | | | 1,781,042 | |
| | |
| | | | | | | | | | | | | | |
| | Corporate Obligations – (continued) | |
| | Communications – (continued) | |
| Orange SA | |
| $ | 50,000 | | | | 5.375 | % | | | 01/13/42 | | | $ | 58,322 | |
| | 250,000 | | | | 5.500 | (d) | | | 02/06/44 | | | | 297,048 | |
| Time Warner Cable, Inc. | |
| | 300,000 | | | | 6.750 | | | | 07/01/18 | | | | 328,830 | |
| | 450,000 | | | | 5.000 | | | | 02/01/20 | | | | 487,316 | |
| | 100,000 | | | | 4.125 | (d) | | | 02/15/21 | | | | 105,233 | |
| | 28,000 | | | | 7.300 | | | | 07/01/38 | | | | 32,396 | |
| | 100,000 | | | | 5.500 | (d) | | | 09/01/41 | | | | 99,859 | |
| Verizon Communications, Inc. | |
| | 2,248,000 | | | | 2.625 | | | | 02/21/20 | | | | 2,308,203 | |
| | 350,000 | | | | 4.500 | | | | 09/15/20 | | | | 386,381 | |
| | 750,000 | | | | 5.150 | | | | 09/15/23 | | | | 865,446 | |
| | 2,850,000 | | | | 3.500 | (d) | | | 11/01/24 | | | | 2,990,034 | |
| | 40,000 | | | | 6.400 | | | | 09/15/33 | | | | 49,397 | |
| | 86,000 | | | | 6.550 | | | | 09/15/43 | | | | 112,806 | |
| | 505,000 | | | | 4.522 | | | | 09/15/48 | | | | 505,153 | |
| | 25,000 | | | | 4.672 | | | | 03/15/55 | | | | 24,096 | |
| | | | | | | | | | | | | | |
| | | | | | | | | | | | | 16,000,542 | |
| | |
| | Consumer Cyclical Services(d) – 0.2% | |
| Visa, Inc. | |
| | 350,000 | | | | 2.800 | | | | 12/14/22 | | | | 364,520 | |
| | 1,100,000 | | | | 3.150 | | | | 12/14/25 | | | | 1,148,158 | |
| | | | | | | | | | | | | | |
| | | | | | | | | | | | | 1,512,678 | |
| | |
| | Diversified Manufacturing – 0.1% | |
| Roper Technologies, Inc. | |
| | 400,000 | | | | 2.050 | | | | 10/01/18 | | | | 399,628 | |
| | |
| | Electric – 0.5% | |
| Berkshire Hathaway Energy Co. | |
| | 350,000 | | | | 5.950 | | | | 05/15/37 | | | | 420,846 | |
| EDP Finance BV | |
| EUR | 200,000 | | | | 4.875 | | | | 09/14/20 | | | | 260,506 | |
| | 350,000 | | | | 4.125 | | | | 01/20/21 | | | | 443,954 | |
| | 100,000 | | | | 2.625 | | | | 01/18/22 | | | | 118,930 | |
| Electricite de France SA(c)(d) | |
| | 400,000 | | | | 4.125 | | | | 01/22/49 | | | | 433,927 | |
| | 700,000 | | | | 5.000 | | | | 01/22/49 | | | | 754,792 | |
| Enel Finance International NV | |
| GBP | 150,000 | | | | 5.625 | | | | 08/14/24 | | | | 256,827 | |
| | 100,000 | | | | 5.750 | | | | 09/14/40 | | | | 177,066 | |
| Engie(c)(d) | |
| EUR | 400,000 | | | | 3.875 | | | | 07/10/49 | | | | 473,662 | |
| Exelon Corp.(d) | |
| $ | 450,000 | | | | 3.950 | | | | 06/15/25 | | | | 466,382 | |
| Ruwais Power Co. PJSC(a) | |
| | 520,000 | | | | 6.000 | | | | 08/31/36 | | | | 564,200 | |
| | | | | | | | | | | | | | |
| | | | | | | | | | | | | 4,371,092 | |
| | |
| | Energy – 1.2% | |
| Anadarko Petroleum Corp.(d) | |
| | 50,000 | | | | 3.450 | | | | 07/15/24 | | | | 44,684 | |
| | 400,000 | | | | 4.500 | | | | 07/15/44 | | | | 312,875 | |
| | |
| | |
| The accompanying notes are an integral part of these financial statements. | | 67 |
GOLDMAN SACHS GLOBAL INCOME FUND
Schedule of Investments (continued)
March 31, 2016
| | | | | | | | | | | | | | |
Principal Amount | | | Interest Rate | | | Maturity Date | | | Value | |
| | | | | | | | | | | | | | |
| | Corporate Obligations – (continued) | |
| | Energy – (continued) | |
| Apache Corp.(d) | |
| $ | 100,000 | | | | 3.250 | % | | | 04/15/22 | | | $ | 95,974 | |
| | 100,000 | | | | 4.750 | | | | 04/15/43 | | | | 90,023 | |
| APT Pipelines Ltd. | |
| EUR | 800,000 | | | | 1.375 | | | | 03/22/22 | | | | 884,012 | |
| | 1,650,000 | | | | 2.000 | | | | 03/22/27 | | | | 1,773,425 | |
| Brazil Minas SPE via State of Minas Gerais(e) | |
| $ | 231,000 | | | | 5.333 | | | | 02/15/28 | | | | 198,083 | |
| Buckeye Partners LP(d) | |
| | 550,000 | | | | 4.150 | | | | 07/01/23 | | | | 482,444 | |
| Columbia Pipeline Group, Inc.(a) | |
| | 100,000 | | | | 2.450 | | | | 06/01/18 | | | | 98,700 | |
| | 150,000 | | | | 3.300 | (d) | | | 06/01/20 | | | | 148,440 | |
| Devon Energy Corp.(d) | |
| | 500,000 | | | | 3.250 | | | | 05/15/22 | | | | 417,500 | |
| | 200,000 | | | | 5.600 | | | | 07/15/41 | | | | 155,138 | |
| | 50,000 | | | | 4.750 | | | | 05/15/42 | | | | 37,016 | |
| Dolphin Energy Ltd. | |
| | 224,284 | | | | 5.888 | | | | 06/15/19 | | | | 239,423 | |
| | 334,040 | | | | 5.888 | (a) | | | 06/15/19 | | | | 356,588 | |
| Energy Transfer Partners LP(d) | |
| | 150,000 | | | | 3.600 | | | | 02/01/23 | | | | 129,411 | |
| Enterprise Products Operating LLC(d) | |
| | 500,000 | | | | 3.750 | | | | 02/15/25 | | | | 497,595 | |
| Halliburton Co.(d) | |
| | 550,000 | | | | 3.375 | | | | 11/15/22 | | | | 558,563 | |
| | 50,000 | | | | 3.500 | | | | 08/01/23 | | | | 50,050 | |
| | 550,000 | | | | 3.800 | | | | 11/15/25 | | | | 548,489 | |
| Kinder Morgan, Inc.(d) | |
| | 350,000 | | | | 3.050 | | | | 12/01/19 | | | | 342,821 | |
| TOTAL SA(c)(d) | |
| EUR | 900,000 | | | | 2.250 | | | | 02/26/49 | | | | 963,585 | |
| | 700,000 | | | | 2.625 | | | | 02/26/49 | | | | 724,683 | |
| Williams Partners LP(d) | |
| $ | 450,000 | | | | 3.900 | | | | 01/15/25 | | | | 360,000 | |
| | | | | | | | | | | | | | |
| | | | | | | | | | | | | 9,509,522 | |
| | |
| | Financial Companies – 0.4% | |
| GE Capital European Funding | |
| EUR | 1,200,000 | | | | 2.875 | | | | 06/18/19 | | | | 1,484,986 | |
| GE Capital International Funding Co.(a) | |
| $ | 1,500,000 | | | | 3.373 | | | | 11/15/25 | | | | 1,600,222 | |
| | | | | | | | | | | | | | |
| | | | | | | | | | | | | 3,085,208 | |
| | |
| | Food & Beverage – 1.7% | |
| Anheuser-Busch InBev Finance, Inc.(d) | |
| | 2,050,000 | | | | 2.650 | | | | 02/01/21 | | | | 2,105,668 | |
| | 600,000 | | | | 3.300 | | | | 02/01/23 | | | | 624,417 | |
| | 3,500,000 | | | | 3.650 | | | | 02/01/26 | | | | 3,678,100 | |
| | 350,000 | | | | 4.900 | | | | 02/01/46 | | | | 392,343 | |
| CVS Health Corp.(d) | |
| | 550,000 | | | | 2.800 | | | | 07/20/20 | | | | 570,272 | |
| | 300,000 | | | | 3.500 | | | | 07/20/22 | | | | 321,612 | |
| | 350,000 | | | | 4.000 | | | | 12/05/23 | | | | 382,557 | |
| | 250,000 | | | | 3.875 | | | | 07/20/25 | | | | 269,615 | |
| | |
| | | | | | | | | | | | | | |
| | Corporate Obligations – (continued) | |
| | Food & Beverage – (continued) | |
| Kraft Heinz Foods Co.(a)(d) | |
| $ | 600,000 | | | | 2.800 | % | | | 07/02/20 | | | $ | 613,372 | |
| | 500,000 | | | | 3.500 | | | | 07/15/22 | | | | 525,114 | |
| | 500,000 | | | | 3.950 | | | | 07/15/25 | | | | 531,897 | |
| | 150,000 | | | | 5.000 | | | | 07/15/35 | | | | 164,447 | |
| | 150,000 | | | | 5.200 | | | | 07/15/45 | | | | 168,411 | |
| Mead Johnson Nutrition Co.(d) | |
| | 800,000 | | | | 4.125 | | | | 11/15/25 | | | | 849,250 | |
| Pernod-Ricard SA(a) | |
| | 400,000 | | | | 4.450 | | | | 01/15/22 | | | | 431,786 | |
| | 1,050,000 | | | | 4.250 | | | | 07/15/22 | | | | 1,128,464 | |
| | 885,000 | | | | 5.500 | | | | 01/15/42 | | | | 954,931 | |
| | | | | | | | | | | | | | |
| | | | | | | | | | | | | 13,712,256 | |
| | |
| | Health Care – Services – 0.1% | |
| Humana, Inc.(d) | |
| | 150,000 | | | | 3.850 | | | | 10/01/24 | | | | 153,372 | |
| UnitedHealth Group, Inc. | |
| | 700,000 | | | | 2.875 | | | | 12/15/21 | | | | 726,835 | |
| | | | | | | | | | | | | | |
| | | | | | | | | | | | | 880,207 | |
| | |
| | Health Care Products – 0.4% | |
| Medtronic, Inc. | |
| | 200,000 | | | | 2.500 | | | | 03/15/20 | | | | 206,818 | |
| | 350,000 | | | | 3.500 | | | | 03/15/25 | | | | 372,599 | |
| | 300,000 | | | | 4.625 | | | | 03/15/45 | | | | 335,294 | |
| Stryker Corp.(d) | |
| | 1,850,000 | | | | 3.375 | | | | 11/01/25 | | | | 1,897,926 | |
| | 50,000 | | | | 3.500 | | | | 03/15/26 | | | | 51,947 | |
| | | | | | | | | | | | | | |
| | | | | | | | | | | | | 2,864,584 | |
| | |
| | Insurance – 0.4% | |
| Allianz Finance II BV(c)(d) | |
| EUR | 100,000 | | | | 5.750 | | | | 07/08/41 | | | | 131,240 | |
| Assicurazioni Generali SpA(c)(d) | |
| GBP | 50,000 | | | | 6.416 | | | | 02/28/49 | | | | 69,588 | |
| Chubb INA Holdings, Inc.(d) | |
| $ | 400,000 | | | | 2.875 | | | | 11/03/22 | | | | 412,285 | |
| Generali Finance BV(c)(d) | |
| GBP | 150,000 | | | | 6.214 | | | | 12/31/49 | | | | 214,627 | |
| Meiji Yasuda Life Insurance Co.(a)(c)(d) | |
| $ | 850,000 | | | | 5.200 | | | | 10/20/45 | | | | 916,470 | |
| Prudential Financial, Inc.(c)(d) | |
| | 200,000 | | | | 5.375 | | | | 05/15/45 | | | | 197,000 | |
| QBE Insurance Group Ltd.(a) | |
| | 400,000 | | | | 2.400 | | | | 05/01/18 | | | | 401,350 | |
| Standard Life PLC(c)(d) | |
| GBP | 150,000 | | | | 6.546 | | | | 01/06/49 | | | | 223,193 | |
| Teachers Insurance & Annuity Association of America(a) | |
| $ | 800,000 | | | | 4.900 | | | | 09/15/44 | | | | 857,239 | |
| | | | | | | | | | | | | | |
| | | | | | | | | | | | | 3,422,992 | |
| | |
| | |
| 68 | | The accompanying notes are an integral part of these financial statements. |
GOLDMAN SACHS GLOBAL INCOME FUND
| | | | | | | | | | | | | | |
Principal Amount | | | Interest Rate | | | Maturity Date | | | Value | |
| | | | | | | | | | | | | | |
| | Corporate Obligations – (continued) | |
| | Metals & Mining – 0.2% | |
| Glencore Funding LLC(a) | |
| $ | 350,000 | | | | 2.500 | % | | | 01/15/19 | | | $ | 320,250 | |
| Rio Tinto Finance USA Ltd. | |
| | 752,000 | | | | 9.000 | | | | 05/01/19 | | | | 893,305 | |
| | | | | | | | | | | | | | |
| | | | | | | | | | | | | 1,213,555 | |
| | |
| | Noncaptive – Financial – 0.2% | |
| Capital One Financial Corp.(d) | |
| | 1,000,000 | | | | 4.200 | | | | 10/29/25 | | | | 1,016,932 | |
| General Electric Co. | |
| MXN | 2,000,000 | | | | 8.500 | | | | 04/06/18 | | | | 123,770 | |
| $ | 350,000 | | | | 5.550 | | | | 05/04/20 | | | | 403,683 | |
| | 150,000 | | | | 4.650 | | | | 10/17/21 | | | | 171,126 | |
| | | | | | | | | | | | | | |
| | | | | | | | | | | | | 1,715,511 | |
| | |
| | Pharmaceuticals – 1.3% | |
| AbbVie, Inc. | |
| | 1,500,000 | | | | 1.750 | | | | 11/06/17 | | | | 1,506,165 | |
| | 400,000 | | | | 2.500 | (d) | | | 05/14/20 | | | | 406,052 | |
| | 50,000 | | | | 3.200 | (d) | | | 11/06/22 | | | | 51,297 | |
| | 200,000 | | | | 3.600 | (d) | | | 05/14/25 | | | | 209,381 | |
| Actavis Funding SCS | |
| | 50,000 | | | | 2.450 | | | | 06/15/19 | | | | 50,670 | |
| | 250,000 | | | | 3.000 | (d) | | | 03/12/20 | | | | 255,905 | |
| | 100,000 | | | | 3.450 | (d) | | | 03/15/22 | | | | 103,415 | |
| | 850,000 | | | | 3.800 | (d) | | | 03/15/25 | | | | 882,992 | |
| | 100,000 | | | | 4.850 | (d) | | | 06/15/44 | | | | 106,491 | |
| EMD Finance LLC(a)(d) | |
| | 2,050,000 | | | | 3.250 | | | | 03/19/25 | | | | 2,047,296 | |
| Forest Laboratories LLC(a)(d) | |
| | 300,000 | | | | 4.375 | | | | 02/01/19 | | | | 318,307 | |
| | 4,100,000 | | | | 5.000 | | | | 12/15/21 | | | | 4,577,334 | |
| Merck KGaA(c)(d) | |
| EUR | 150,000 | | | | 2.625 | | | | 12/12/74 | | | | 171,282 | |
| | | | | | | | | | | | | | |
| | | | | | | | | | | | | 10,686,587 | |
| | |
| | Real Estate Investment Trusts(d) – 0.7% | |
| Hammerson PLC | |
| EUR | 100,000 | | | | 2.000 | | | | 07/01/22 | | | | 118,137 | |
| HCP, Inc. | |
| $ | 100,000 | | | | 2.625 | | | | 02/01/20 | | | | 98,553 | |
| | 1,750,000 | | | | 5.375 | | | | 02/01/21 | | | | 1,910,707 | |
| | 200,000 | | | | 4.250 | | | | 11/15/23 | | | | 199,554 | |
| Prologis LP | |
| EUR | 100,000 | | | | 3.000 | | | | 01/18/22 | | | | 123,877 | |
| Trust F/1401(a) | |
| $ | 330,000 | | | | 5.250 | | | | 12/15/24 | | | | 335,775 | |
| Ventas Realty LP | |
| | 1,600,000 | | | | 3.500 | | | | 02/01/25 | | | | 1,569,631 | |
| Ventas Realty LP/Ventas Capital Corp. | |
| | 200,000 | | | | 3.250 | | | | 08/15/22 | | | | 200,476 | |
| WEA Finance LLC/Westfield UK & Europe Finance PLC(a) | |
| | 350,000 | | | | 2.700 | | | | 09/17/19 | | | | 352,379 | |
| | 400,000 | | | | 3.750 | | | | 09/17/24 | | | | 407,123 | |
| | | | | | | | | | | | | | |
| | | | | | | | | | | | | 5,316,212 | |
| | |
| | | | | | | | | | | | | | |
| | Corporate Obligations – (continued) | |
| | Restaurants(d) – 0.0% | |
| McDonald’s Corp. | |
| $ | 100,000 | | | | 2.750 | % | | | 12/09/20 | | | $ | 103,342 | |
| | |
| | Technology – 0.4% | |
| Apple, Inc. | |
| | 400,000 | | | | 3.850 | | | | 05/04/43 | | | | 387,536 | |
| Fidelity National Information Services, Inc.(d) | |
| | 650,000 | | | | 4.500 | | | | 10/15/22 | | | | 686,589 | |
| | 1,100,000 | | | | 5.000 | | | | 10/15/25 | | | | 1,182,557 | |
| Oracle Corp.(d) | |
| | 1,050,000 | | | | 2.950 | | | | 05/15/25 | | | | 1,075,265 | |
| | | | | | | | | | | | | | |
| | | | | | | | | | | | | 3,331,947 | |
| | |
| | Tobacco – 1.5% | |
| BAT International Finance PLC(a) | |
| | 800,000 | | | | 2.750 | | | | 06/15/20 | | | | 822,698 | |
| | 200,000 | | | | 3.500 | | | | 06/15/22 | | | | 212,726 | |
| | 3,300,000 | | | | 3.950 | | | | 06/15/25 | | | | 3,612,348 | |
| Philip Morris International, Inc.(d) | |
| | 800,000 | | | | 1.875 | | | | 02/25/21 | | | | 803,236 | |
| | 1,300,000 | | | | 2.750 | | | | 02/25/26 | | | | 1,320,563 | |
| Reynolds American, Inc. | |
| | 108,000 | | | | 3.250 | | | | 06/12/20 | | | | 112,843 | |
| | 150,000 | | | | 4.000 | | | | 06/12/22 | | | | 162,776 | |
| | 2,700,000 | | | | 4.450 | (d) | | | 06/12/25 | | | | 2,970,922 | |
| | 250,000 | | | | 5.700 | (d) | | | 08/15/35 | | | | 293,839 | |
| | 1,100,000 | | | | 5.850 | (d) | | | 08/15/45 | | | | 1,342,695 | |
| | | | | | | | | | | | | | |
| | | | | | | | | | | | | 11,654,646 | |
| | |
| | Transportation(a) – 0.3% | |
| Penske Truck Leasing Co. LP/PTL Finance Corp. | |
| | 2,350,000 | | | | 3.375 | (d) | | | 02/01/22 | | | | 2,333,200 | |
| | 450,000 | | | | 4.250 | | | | 01/17/23 | | | | 455,986 | |
| | | | | | | | | | | | | | |
| | | | | | | | | | | | | 2,789,186 | |
| | |
| | TOTAL CORPORATE OBLIGATIONS | | | | | |
| | (Cost $155,592,078) | | | $ | 157,718,261 | |
| | |
| | | | | | | | | | | | | | |
| | Foreign Debt Obligations(e) – 0.6% | |
| | Supranational – 0.6% | |
| European Financial Stability Facility | |
| EUR | 500,000 | | | | 2.350 | % | | | 07/29/44 | | | $ | 725,013 | |
| | 3,310,000 | | | | 1.200 | | | | 02/17/45 | | | | 3,710,592 | |
| | |
| | TOTAL FOREIGN DEBT OBLIGATIONS | | | | | |
| | (Cost $3,931,402) | | | $ | 4,435,605 | |
| | |
| | | | | | | | | | | | | | |
| | Asset-Backed Securities(c) – 9.3% | |
| | Collateralized Loan Obligations(a) – 6.1% | |
| Aberdeen Loan Funding Ltd. Series 2008-1A, Class A | |
| $ | 1,313,119 | | | | 0.979 | % | | | 11/01/18 | | | $ | 1,302,684 | |
| B&M CLO Ltd. Series 2014-1A, Class A1 | |
| | 1,750,000 | | | | 1.717 | | | | 04/16/26 | | | | 1,712,924 | |
| | |
| | |
| The accompanying notes are an integral part of these financial statements. | | 69 |
GOLDMAN SACHS GLOBAL INCOME FUND
Schedule of Investments (continued)
March 31, 2016
| | | | | | | | | | | | | | |
Principal Amount | | | Interest Rate | | | Maturity Date | | | Value | |
| | | | | | | | | | | | | | |
| | Asset-Backed Securities(c) – (continued) | |
| | Collateralized Loan Obligations(a) – (continued) | |
| B&M CLO Ltd. Series 2014-1A, Class A2 | |
| $ | 300,000 | | | | 2.267 | % | | | 04/16/26 | | | $ | 283,330 | |
| Callidus Debt Partners CLO Fund VI Ltd. Series 2006-A,
Class A1T |
|
| | 1,834,649 | | | | 0.576 | | | | 10/23/21 | | | | 1,799,833 | |
| Duane Street CLO IV Ltd. Series 2007-4A, Class A1R | |
| | 4,503,220 | | | | 0.622 | | | | 11/14/21 | | | | 4,408,418 | |
| Greywolf CLO V Ltd. Series 2015-1A, Class A1 | |
| | 1,800,000 | | | | 1.920 | | | | 04/25/27 | | | | 1,793,243 | |
| Halcyon Loan Advisors Funding Ltd. Series 2013-1A, Class A1 | |
| | 2,450,000 | | | | 1.471 | | | | 04/15/25 | | | | 2,393,354 | |
| Halcyon Loan Advisors Funding Ltd. Series 2014-1A, Class A1 | |
| | 5,650,000 | | | | 1.845 | | | | 04/18/26 | | | | 5,533,090 | |
| Halcyon Loan Advisors Funding Ltd. Series 2014-2A, Class A1B | |
| | 3,250,000 | | | | 1.743 | | | | 04/28/25 | | | | 3,191,094 | |
| Halcyon Loan Advisors Funding Ltd. Series 2014-2A, Class A2 | |
| | 850,000 | | | | 2.323 | | | | 04/28/25 | | | | 795,258 | |
| Madison Park Funding X Ltd. Series 2012-10A, Class A1A | |
| | 2,600,000 | | | | 1.687 | | | | 01/20/25 | | | | 2,585,645 | |
| Magnetite VIII Ltd. Series 2014-8A, Class A | |
| | 2,700,000 | | | | 1.801 | | | | 04/15/26 | | | | 2,692,570 | |
| OFSI Fund V Ltd. Series 2014-7A, Class ACOM | |
| | 2,850,000 | | | | 0.000 | | | | 10/18/26 | | | | 2,778,465 | |
| OHA Credit Partners VIII Ltd. Series 2013-8A, Class A | |
| | 6,100,000 | | | | 1.437 | | | | 04/20/25 | | | | 6,024,262 | |
| Shackleton CLO Ltd. Series 2014-5A, Class A | |
| | 3,650,000 | | | | 1.844 | | | | 05/07/26 | | | | 3,627,655 | |
| Shackleton CLO Ltd. Series 2014-5A, Class B1 | |
| | 550,000 | | | | 2.344 | | | | 05/07/26 | | | | 531,142 | |
| Sound Point CLO Vlll Ltd. Series 2015-1A, Class A | |
| | 900,000 | | | | 1.851 | | | | 04/15/27 | | | | 890,252 | |
| Trinitas CLO II Ltd. Series 2014-2A, Class ACOM | |
| | 1,250,000 | | | | 0.000 | | | | 07/15/26 | | | | 1,193,500 | |
| Trinitas CLO Ltd. Series 2014-1A, Class A1 | |
| | 1,550,000 | | | | 1.851 | | | | 04/15/26 | | | | 1,524,995 | |
| Trinitas CLO Ltd. Series 2014-1A, Class B1 | |
| | 400,000 | | | | 2.221 | | | | 04/15/26 | | | | 368,909 | |
| Whitehorse VIII Ltd. Series 2014-1A, Class A | |
| | 3,500,000 | | | | 1.829 | | | | 05/01/26 | | | | 3,431,246 | |
| | | | | | | | | | | | | | |
| | | | | | | | | | | | | 48,861,869 | |
| | |
| | Home Equity – 0.6% | |
| CIT Mortgage Loan Trust Series 2007-1, Class 2A3(a) | |
| | 2,495,075 | | | | 1.883 | | | | 10/25/37 | | | | 2,295,478 | |
| GMAC Mortgage Corp. Loan Trust Series 2007-HE3, Class 1A1 | |
| | 46,456 | | | | 7.000 | | | | 09/25/37 | | | | 46,091 | |
| GMAC Mortgage Corp. Loan Trust Series 2007-HE3, Class 2A1 | |
| | 89,942 | | | | 7.000 | | | | 09/25/37 | | | | 89,957 | |
| New Century Home Equity Loan Trust Series 2005-3, Class M1 | |
| | 2,179,126 | | | | 0.916 | | | | 07/25/35 | | | | 2,172,769 | |
| | | | | | | | | | | | | | |
| | | | | | | | | | | | | 4,604,295 | |
| | |
| | | | | | | | | | | | | | |
| | Asset-Backed Securities(c) – (continued) | |
| | Student Loans – 2.6% | |
| Chase Education Loan Trust Series 2007-A, Class A3 | |
| $ | 467,291 | | | | 0.700 | % | | | 12/28/23 | | | $ | 457,551 | |
| Educational Services of America, Inc. Series 2010-1, Class A1(a) | |
| | 890,549 | | | | 1.469 | | | | 07/25/23 | | | | 877,394 | |
| Educational Services of America, Inc. Series 2015-2, Class A(a) | |
| | 3,530,651 | | | | 1.436 | | | | 12/25/56 | | | | 3,513,687 | |
| Knowledgeworks Foundation Student Loan Series 2010-1,
Class A |
|
| | 670,842 | | | | 1.579 | | | | 02/25/42 | | | | 668,468 | |
| Nelnet Student Loan Trust Series 2006-2, Class A5 | |
| | 2,374,418 | | | | 0.719 | | | | 01/25/30 | | | | 2,314,707 | |
| Nelnet Student Loan Trust Series 2010-3A, Class A(a) | |
| | 692,029 | | | | 1.399 | | | | 07/27/48 | | | | 677,603 | |
| Nelnet Student Loan Trust Series 2011-1A, Class A(a) | |
| | 383,090 | | | | 1.283 | | | | 02/25/43 | | | | 370,799 | |
| Northstar Education Finance, Inc. Series 2004-2, Class A3 | |
| | 425,180 | | | | 0.791 | | | | 07/30/18 | | | | 422,941 | |
| Scholar Funding Trust Series 2010-A, Class A(a) | |
| | 1,145,197 | | | | 1.371 | | | | 10/28/41 | | | | 1,065,557 | |
| SLC Student Loan Center Series 2011-1, Class A(a) | |
| | 859,541 | | | | 1.653 | | | | 10/25/27 | | | | 852,815 | |
| SLC Student Loan Trust Series 2006-1, Class A4 | |
| | 521,444 | | | | 0.714 | | | | 12/15/21 | | | | 519,231 | |
| SLC Student Loan Trust Series 2006-1, Class A5 | |
| | 2,550,000 | | | | 0.744 | | | | 03/15/27 | | | | 2,445,958 | |
| SLM Student Loan Trust Series 2005-3, Class A5 | |
| | 1,431,239 | | | | 0.709 | | | | 10/25/24 | | | | 1,401,099 | |
| SLM Student Loan Trust Series 2006-5, Class A5 | |
| | 3,303,114 | | | | 0.729 | | | | 01/25/27 | | | | 3,218,416 | |
| Wachovia Student Loan Trust Series 2006-1, Class A5(a) | |
| | 2,097,164 | | | | 0.739 | | | | 07/26/27 | | | | 2,059,606 | |
| | | | | | | | | | | | | | |
| | | | | | | | | | | | | 20,865,832 | |
| | |
| | TOTAL ASSET-BACKED SECURITIES | | | | | |
| | (Cost $74,803,874) | | | $ | 74,331,996 | |
| | |
| | | | | | | | | | | | | | |
| | Mortgage-Backed Obligations – 20.1% | |
| | Adjustable Rate Non-Agency(c) – 0.4% | |
| Countrywide Alternative Loan Trust Series 2005-38, Class A1 | |
| $ | 165,113 | | | | 1.822 | % | | | 09/25/35 | | | $ | 137,876 | |
| Countrywide Alternative Loan Trust Series 2006-OA1, Class 2A1 | |
| | 869,038 | | | | 0.642 | | | | 03/20/46 | | | | 625,968 | |
| Countrywide Home Loan Mortgage Pass-Through Trust
Series 2004-HYB5, Class 2A1 |
|
| | 131,308 | | | | 2.595 | | | | 04/20/35 | | | | 127,707 | |
| Harborview Mortgage Loan Trust Series 2006-6, Class 3A1A | |
| | 821,506 | | | | 2.883 | | | | 08/19/36 | | | | 656,390 | |
| Residential Accredit Loans, Inc. Series 2005-Q05, Class A1 | |
| | 1,059,855 | | | | 1.322 | | | | 01/25/46 | | | | 715,523 | |
| | |
| | |
| 70 | | The accompanying notes are an integral part of these financial statements. |
GOLDMAN SACHS GLOBAL INCOME FUND
| | | | | | | | | | | | | | |
Principal Amount | | | Interest Rate | | | Maturity Date | | | Value | |
| | | | | | | | | | | | | | |
| | Mortgage-Backed Obligations – (continued) | |
| | Adjustable Rate Non-Agency(c) – (continued) | |
| Sequoia Mortgage Trust Series 2004-10, Class A3A | |
| $ | 187,638 | | | | 1.178 | % | | | 11/20/34 | | | $ | 176,511 | |
| Structured Adjustable Rate Mortgage Loan Trust Series 2004-16,
Class 3A1 |
|
| | 422,475 | | | | 2.719 | | | | 11/25/34 | | | | 416,512 | |
| | |
| TOTAL ADJUSTABLE RATE
NON-AGENCY |
| | $ | 2,856,487 | |
| | |
| | Collateralized Mortgage Obligations – 1.8% | |
| Aire Valley Mortgages PLC Series 2006-1A, Class 1A(a)(c) | |
| $ | 612,832 | | | | 0.843 | % | | | 09/20/66 | | | $ | 590,303 | |
| Aire Valley Mortgages PLC Series 2007-1A, Class 2A1(a)(c) | |
| | 916,719 | | | | 0.863 | | | | 09/20/66 | | | | 883,658 | |
| Aire Valley Mortgages PLC Series 2007-1X, Class 2A2(c) | |
| EUR | 1,528,957 | | | | 0.026 | | | | 09/20/66 | | | | 1,689,006 | |
| FHLMC REMIC Series 4320, Class SD(c) | |
| $ | 583,837 | | | | 5.664 | | | | 07/15/39 | | | | 95,056 | |
| FHLMC STRIPS Series 304, Class C45 | |
| | 665,675 | | | | 3.000 | | | | 12/15/27 | | | | 61,322 | |
| FNMA Connecticut Avenue Securities Series 2015-C01,
Class 2M1(c) |
|
| | 12,959 | | | | 1.936 | | | | 02/25/25 | | | | 12,962 | |
| FNMA REMIC Series 2010-126, Class LS(c) | |
| | 2,423,074 | | | | 4.562 | | | | 11/25/40 | | | | 469,141 | |
| FNMA REMIC Series 2011-52, Class GB | |
| | 909,219 | | | | 5.000 | | | | 06/25/41 | | | | 1,008,300 | |
| FNMA REMIC Series 2011-99, Class DB | |
| | 836,197 | | | | 5.000 | | | | 10/25/41 | | | | 924,528 | |
| FNMA REMIC Series 2012-111, Class B | |
| | 113,642 | | | | 7.000 | | | | 10/25/42 | | | | 131,416 | |
| FNMA REMIC Series 2012-153, Class B | |
| | 437,924 | | | | 7.000 | | | | 07/25/42 | | | | 516,672 | |
| FNMA REMIC Series 2013-121, Class SA(c) | |
| | 1,234,240 | | | | 5.667 | | | | 12/25/43 | | | | 210,528 | |
| FNMA REMIC Series 2013-96, Class SW(c) | |
| | 549,477 | | | | 5.667 | | | | 09/25/43 | | | | 94,891 | |
| FNMA REMIC Series 2014-87, Class MS(c) | |
| | 2,248,745 | | | | 5.817 | | | | 01/25/45 | | | | 388,611 | |
| FNMA REMIC Series 2015-79, Class SA(c) | |
| | 889,268 | | | | 5.817 | | | | 11/25/45 | | | | 144,133 | |
| FNMA REMIC Series 2015-81, Class SA(c) | |
| | 4,249,997 | | | | 5.267 | | | | 11/25/45 | | | | 628,103 | |
| FNMA REMIC Series 2015-82, Class MS(c) | |
| | 1,178,002 | | | | 5.267 | | | | 11/25/45 | | | | 185,025 | |
| FNMA REMIC Series 2015-86, Class BS(c) | |
| | 479,058 | | | | 5.267 | | | | 11/25/45 | | | | 74,463 | |
| GNMA REMIC Series 2010-101, Class S(c) | |
| | 1,970,167 | | | | 5.568 | | | | 08/20/40 | | | | 315,866 | |
| GNMA REMIC Series 2010-20, Class SE(c) | |
| | 553,494 | | | | 5.818 | | | | 02/20/40 | | | | 91,739 | |
| GNMA REMIC Series 2010-31, Class SA(c) | |
| | 836,401 | | | | 5.318 | | | | 03/20/40 | | | | 124,783 | |
| GNMA REMIC Series 2012-149, Class MS(c) | |
| | 1,089,812 | | | | 5.818 | | | | 12/20/42 | | | | 175,203 | |
| GNMA REMIC Series 2013-134, Class DS(c) | |
| | 312,383 | | | | 5.668 | | | | 09/20/43 | | | | 50,901 | |
| | |
| | | | | | | | | | | | | | |
| | Mortgage-Backed Obligations – (continued) | |
| | Collateralized Mortgage Obligations – (continued) | |
| GNMA REMIC Series 2013-152, Class SG(c) | |
| $ | 581,342 | | | | 5.718 | % | | | 06/20/43 | | | $ | 93,634 | |
| GNMA REMIC Series 2013-152, Class TS(c) | |
| | 535,834 | | | | 5.668 | | | | 06/20/43 | | | | 88,990 | |
| GNMA REMIC Series 2013-167, Class SG(c) | |
| | 298,254 | | | | 5.718 | | | | 11/20/43 | | | | 45,565 | |
| GNMA REMIC Series 2013-181, Class SA(c) | |
| | 1,803,175 | | | | 5.668 | | | | 11/20/43 | | | | 294,996 | |
| GNMA REMIC Series 2014-133, Class BS(c) | |
| | 661,760 | | | | 5.168 | | | | 09/20/44 | | | | 97,768 | |
| GNMA REMIC Series 2014-41, Class SA(c) | |
| | 357,002 | | | | 5.668 | | | | 03/20/44 | | | | 59,489 | |
| GNMA REMIC Series 2015-110, Class MS(c) | |
| | 4,162,935 | | | | 5.278 | | | | 08/20/45 | | | | 634,324 | |
| GNMA REMIC Series 2015-117, Class KI | |
| | 5,690,456 | | | | 5.000 | | | | 08/20/45 | | | | 1,003,025 | |
| GNMA REMIC Series 2015-126, Class HS(c) | |
| | 1,605,292 | | | | 5.768 | | | | 09/20/45 | | | | 276,271 | |
| GNMA REMIC Series 2015-129, Class IC | |
| | 859,092 | | | | 4.500 | | | | 09/16/45 | | | | 129,616 | |
| GNMA REMIC Series 2015-14, Class IO | |
| | 2,858,087 | | | | 5.000 | | | | 10/20/44 | | | | 510,533 | |
| GNMA REMIC Series 2015-167, Class AS(c) | |
| | 883,184 | | | | 5.818 | | | | 11/20/45 | | | | 127,276 | |
| GNMA REMIC Series 2015-168, Class SD(c) | |
| | 453,104 | | | | 5.768 | | | | 11/20/45 | | | | 74,201 | |
| GNMA REMIC Series 2016-1, Class ST(c) | |
| | 961,919 | | | | 5.768 | | | | 01/20/46 | | | | 165,546 | |
| GNMA REMIC Series 2016-4, Class SM(c) | |
| | 1,290,622 | | | | 5.218 | | | | 01/20/46 | | | | 195,515 | |
| GNMA REMIC Series 2016-6, Class SB(c) | |
| | 1,199,854 | | | | 5.218 | | | | 01/20/46 | | | | 184,278 | |
| Leek Finance Number Eighteen PLC Series 2018X, Class A2C(c) | |
| EUR | 124,332 | | | | 0.127 | | | | 09/21/38 | | | | 149,360 | |
| Leek Finance Number Seventeen PLC Series 2017X,
Class A2A(c) |
|
| GBP | 78,243 | | | | 0.865 | | | | 12/21/37 | | | | 120,587 | |
| Leek Finance PLC Series 2017X, Class A2C(c) | |
| EUR | 130,405 | | | | 0.147 | | | | 12/21/37 | | | | 159,214 | |
| Leek Finance PLC Series 2018X, Class A2B(c) | |
| $ | 704,548 | | | | 0.830 | | | | 09/21/38 | | | | 741,655 | |
| | |
| TOTAL COLLATERALIZED MORTGAGE
OBLIGATIONS |
| | $ | 14,018,453 | |
| | |
| | Commercial Mortgage-Backed Securities – 2.2% | |
| Banc of America Commercial Mortgage, Inc. Series 2007-2,
Class AM(c) |
|
| $ | 600,000 | | | | 5.800 | % | | | 04/10/49 | | | $ | 616,695 | |
| Bear Stearns Commercial Mortgage Securities Trust
Series 2007-PW18, Class A1A |
|
| | 2,349,887 | | | | 5.602 | | | | 06/11/50 | | | | 2,458,040 | |
| Commercial Mortgage Trust Series 2007-C9, Class A1A(c) | |
| | 3,888,407 | | | | 6.006 | | | | 12/10/49 | | | | 4,038,950 | |
| FNMA ACES Series 2012-M8, Class ASQ2 | |
| | 145,960 | | | | 1.520 | | | | 12/25/19 | | | | 146,607 | |
| | |
| | |
| The accompanying notes are an integral part of these financial statements. | | 71 |
GOLDMAN SACHS GLOBAL INCOME FUND
Schedule of Investments (continued)
March 31, 2016
| | | | | | | | | | | | | | |
Principal Amount | | | Interest Rate | | | Maturity Date | | | Value | |
| | | | | | | | | | | | | | |
| | Mortgage-Backed Obligations – (continued) | |
| | Commercial Mortgage-Backed Securities – (continued) | |
| FNMA ACES Series 2012-M8, Class ASQ3 | |
| $ | 300,000 | | | | 1.800 | % | | | 12/25/19 | | | $ | 303,659 | |
| FREMF Mortgage Trust Series 2015-K44, Class B(a)(c) | |
| | 1,750,000 | | | | 3.685 | | | | 01/25/48 | | | | 1,520,696 | |
| GS Mortgage Securities Trust Series 2007-GG10, Class A1A(c) | |
| | 3,474,576 | | | | 5.794 | | | | 08/10/45 | | | | 3,586,812 | |
| LB Commercial Mortgage Trust Series 2007-C3, Class A1A(c) | |
| | 2,995,155 | | | | 5.852 | | | | 07/15/44 | | | | 3,095,656 | |
| Morgan Stanley Capital I Trust Series 2007-HQ11, Class AM(c) | |
| | 150,000 | | | | 5.478 | | | | 02/12/44 | | | | 152,098 | |
| Morgan Stanley Capital I Trust Series 2007-HQ13, Class AM(c) | |
| | 250,000 | | | | 5.931 | | | | 12/15/44 | | | | 240,543 | |
| Wachovia Bank Commercial Mortgage Trust Series 2007-C34,
Class A1A(c) |
|
| | 1,717,052 | | | | 5.608 | | | | 05/15/46 | | | | 1,753,132 | |
| | |
| TOTAL COMMERCIAL
MORTGAGE-BACKED SECURITIES |
| | $ | 17,912,888 | |
| | |
| | Federal Agencies – 15.7% | |
| | FHLMC – 0.2% | |
| $ | 79 | | | | 5.000 | % | | | 09/01/16 | | | $ | 80 | |
| | 683 | | | | 5.000 | | | | 11/01/16 | | | | 706 | |
| | 326 | | | | 5.000 | | | | 12/01/16 | | | | 337 | |
| | 2,621 | | | | 5.000 | | | | 01/01/17 | | | | 2,700 | |
| | 5,271 | | | | 5.000 | | | | 02/01/17 | | | | 5,433 | |
| | 5,249 | | | | 5.000 | | | | 03/01/17 | | | | 5,399 | |
| | 10,189 | | | | 5.000 | | | | 04/01/17 | | | | 10,499 | |
| | 437 | | | | 5.000 | | | | 05/01/17 | | | | 452 | |
| | 179 | | | | 5.000 | | | | 06/01/17 | | | | 185 | |
| | 494 | | | | 5.000 | | | | 08/01/17 | | | | 510 | |
| | 35,842 | | | | 5.000 | | | | 09/01/17 | | | | 37,010 | |
| | 46,304 | | | | 5.000 | | | | 10/01/17 | | | | 47,814 | |
| | 31,205 | | | | 5.000 | | | | 11/01/17 | | | | 32,221 | |
| | 31,427 | | | | 5.000 | | | | 12/01/17 | | | | 32,449 | |
| | 40,705 | | | | 5.000 | | | | 01/01/18 | | | | 42,101 | |
| | 93,596 | | | | 5.000 | | | | 02/01/18 | | | | 96,884 | |
| | 90,526 | | | | 5.000 | | | | 03/01/18 | | | | 93,821 | |
| | 89,641 | | | | 5.000 | | | | 04/01/18 | | | | 92,818 | |
| | 67,034 | | | | 5.000 | | | | 05/01/18 | | | | 69,634 | |
| | 18,185 | | | | 5.000 | | | | 06/01/18 | | | | 18,833 | |
| | 18,618 | | | | 5.000 | | | | 07/01/18 | | | | 19,281 | |
| | 7,959 | | | | 5.000 | | | | 08/01/18 | | | | 8,246 | |
| | 5,987 | | | | 5.000 | | | | 09/01/18 | | | | 6,207 | |
| | 25,893 | | | | 5.000 | | | | 10/01/18 | | | | 26,927 | |
| | 30,741 | | | | 5.000 | | | | 11/01/18 | | | | 31,947 | |
| | 21,588 | | | | 5.000 | | | | 12/01/18 | | | | 22,459 | |
| | 14,006 | | | | 5.000 | | | | 01/01/19 | | | | 14,582 | |
| | 1,428 | | | | 5.000 | | | | 02/01/19 | | | | 1,495 | |
| | 3,818 | | | | 5.000 | | | | 03/01/19 | | | | 4,008 | |
| | 3,742 | | | | 5.000 | | | | 01/01/33 | | | | 4,142 | |
| | 1,021 | | | | 5.000 | | | | 06/01/33 | | | | 1,127 | |
| | 9,426 | | | | 5.000 | | | | 07/01/33 | | | | 10,403 | |
| | 11,348 | | | | 5.000 | | | | 08/01/33 | | | | 12,524 | |
| | 2,137 | | | | 5.000 | | | | 10/01/33 | | | | 2,358 | |
| | 8,691 | | | | 5.000 | | | | 11/01/33 | | | | 9,591 | |
| | 2,644 | | | | 5.000 | | | | 12/01/33 | | | | 2,918 | |
| | |
| | | | | | | | | | | | | | |
| | Mortgage-Backed Obligations – (continued) | |
| | FHLMC – (continued) | |
| $ | 8,710 | | | | 5.000 | % | | | 02/01/34 | | | $ | 9,611 | |
| | 3,322 | | | | 5.000 | | | | 03/01/34 | | | | 3,664 | |
| | 5,535 | | | | 5.000 | | | | 04/01/34 | | | | 6,106 | |
| | 10,308 | | | | 5.000 | | | | 05/01/34 | | | | 11,376 | |
| | 142,560 | | | | 5.000 | | | | 06/01/34 | | | | 157,324 | |
| | 1,858 | | | | 5.000 | | | | 11/01/34 | | | | 2,049 | |
| | 38,570 | | | | 5.000 | | | | 04/01/35 | | | | 42,567 | |
| | 2,914 | | | | 5.000 | | | | 11/01/35 | | | | 3,216 | |
| | 8,381 | | | | 5.000 | | | | 02/01/37 | | | | 9,348 | |
| | 822 | | | | 5.000 | | | | 11/01/37 | | | | 903 | |
| | 366,179 | | | | 7.000 | | | | 02/01/39 | | | | 432,338 | |
| | 51,926 | | | | 5.000 | | | | 01/01/40 | | | | 57,405 | |
| | | | | | | | | | | | | | |
| | | | | | | | | | | | | 1,504,008 | |
| | |
| | FNMA – 6.6% | |
| | 1,012 | | | | 5.000 | | | | 04/01/18 | | | | 1,047 | |
| | 8,002 | | | | 5.000 | | | | 05/01/18 | | | | 8,254 | |
| | 1,212 | | | | 5.000 | | | | 06/01/18 | | | | 1,253 | |
| | 1,082 | | | | 5.000 | | | | 11/01/18 | | | | 1,121 | |
| | 1,377 | | | | 5.000 | | | | 03/01/19 | | | | 1,440 | |
| | 1,827 | | | | 5.000 | | | | 04/01/19 | | | | 1,912 | |
| | 4,000,000 | | | | 4.506 | | | | 06/01/19 | | | | 4,198,348 | |
| | 1,382,078 | | | | 3.416 | | | | 10/01/20 | | | | 1,487,972 | |
| | 1,101,348 | | | | 3.612 | | | | 12/01/20 | | | | 1,190,683 | |
| | 707,288 | | | | 3.763 | | | | 12/01/20 | | | | 767,878 | |
| | 1,910,827 | | | | 4.375 | | | | 06/01/21 | | | | 2,126,762 | |
| | 390,421 | | | | 3.830 | | | | 07/01/21 | | | | 426,785 | |
| | 174,483 | | | | 5.000 | | | | 05/01/26 | | | | 192,854 | |
| | 3,549 | | | | 5.000 | | | | 08/01/33 | | | | 3,931 | |
| | 2,544 | | | | 5.500 | | | | 02/01/34 | | | | 2,876 | |
| | 4,479 | | | | 5.500 | | | | 05/01/34 | | | | 5,071 | |
| | 3,207 | | | | 5.500 | | | | 10/01/34 | | | | 3,629 | |
| | 17,606 | | | | 5.500 | | | | 12/01/34 | | | | 19,953 | |
| | 4,594 | | | | 5.500 | | | | 04/01/35 | | | | 5,206 | |
| | 3,912 | | | | 5.500 | | | | 07/01/35 | | | | 4,434 | |
| | 603,541 | | | | 4.500 | | | | 07/01/36 | | | | 659,557 | |
| | 64,228 | | | | 4.500 | | | | 12/01/36 | | | | 70,169 | |
| | 53,271 | | | | 4.500 | | | | 05/01/38 | | | | 57,950 | |
| | 228,238 | | | | 7.000 | | | | 03/01/39 | | | | 270,723 | |
| | 40,765 | | | | 4.500 | | | | 05/01/39 | | | | 45,013 | |
| | 23,027 | | | | 4.500 | | | | 06/01/39 | | | | 25,427 | |
| | 21,986 | | | | 4.500 | | | | 08/01/39 | | | | 24,301 | |
| | 30,568 | | | | 4.500 | | | | 09/01/39 | | | | 33,258 | |
| | 46,560 | | | | 4.500 | | | | 10/01/39 | | | | 50,658 | |
| | 15,239 | | | | 4.500 | | | | 03/01/40 | | | | 16,580 | |
| | 220,084 | | | | 4.500 | | | | 04/01/40 | | | | 240,021 | |
| | 237,753 | | | | 5.000 | | | | 06/01/40 | | | | 263,405 | |
| | 14,439 | | | | 4.500 | | | | 12/01/40 | | | | 15,746 | |
| | 257,742 | | | | 4.500 | | | | 01/01/41 | | | | 281,261 | |
| | 69,289 | | | | 4.500 | | | | 04/01/41 | | | | 75,677 | |
| | 99,527 | | | | 4.500 | | | | 06/01/41 | | | | 108,558 | |
| | 104,471 | | | | 4.500 | | | | 07/01/41 | | | | 114,102 | |
| | 118,592 | | | | 5.000 | | | | 07/01/41 | | | | 131,471 | |
| | 151,282 | | | | 4.500 | | | | 08/01/41 | | | | 165,230 | |
| | 425,003 | | | | 4.500 | | | | 09/01/41 | | | | 464,319 | |
| | 333,818 | | | | 4.500 | | | | 10/01/41 | | | | 364,383 | |
| | |
| | |
| 72 | | The accompanying notes are an integral part of these financial statements. |
GOLDMAN SACHS GLOBAL INCOME FUND
| | | | | | | | | | | | | | |
Principal Amount | | | Interest Rate | | | Maturity Date | | | Value | |
| | | | | | | | | | | | | | |
| | Mortgage-Backed Obligations – (continued) | |
| | FNMA – (continued) | |
| $ | 282,171 | | | | 4.500 | % | | | 11/01/41 | | | $ | 308,007 | |
| | 111,945 | | | | 4.500 | | | | 12/01/41 | | | | 122,103 | |
| | 204,840 | | | | 4.500 | | | | 01/01/42 | | | | 223,441 | |
| | 60,207 | | | | 4.500 | | | | 03/01/42 | | | | 65,757 | |
| | 79,699 | | | | 4.500 | | | | 04/01/42 | | | | 86,934 | |
| | 140,689 | | | | 3.000 | | | | 12/01/42 | | | | 145,356 | |
| | 372,566 | | | | 3.000 | | | | 01/01/43 | | | | 384,992 | |
| | 430,820 | | | | 3.000 | | | | 04/01/43 | | | | 445,107 | |
| | 378,715 | | | | 3.500 | | | | 07/01/43 | | | | 397,322 | |
| | 584,881 | | | | 3.500 | | | | 08/01/43 | | | | 613,616 | |
| | 43,786 | | | | 3.500 | | | | 10/01/45 | | | | 45,943 | |
| | 80,641 | | | | 3.500 | | | | 11/01/45 | | | | 84,614 | |
| | 30,000,000 | | | | 3.000 | | | | TBA-30yr | (f) | | | 30,775,782 | |
| | 4,000,000 | | | | 3.500 | | | | TBA-30yr | (f) | | | 4,194,375 | |
| | 1,000,000 | | | | 4.500 | | | | TBA-30yr | (f) | | | 1,088,281 | |
| | | | | | | | | | | | | | |
| | | | | | | | | | | | | 52,910,848 | |
| | |
| | GNMA – 8.9% | |
| | 549,630 | | | | 3.950 | | | | 07/15/25 | | | | 611,575 | |
| | 12,727,208 | | | | 4.000 | | | | 10/20/43 | | | | 13,615,130 | |
| | 12,504,946 | | | | 4.000 | | | | 07/20/45 | | | | 13,385,177 | |
| | 96,460 | | | | 3.500 | | | | 09/20/45 | | | | 102,112 | |
| | 975,125 | | | | 4.000 | | | | 10/20/45 | | | | 1,043,993 | |
| | 5,000,000 | | | | 3.000 | | | | TBA-30yr | (f) | | | 5,177,188 | |
| | 35,000,000 | | | | 4.000 | | | | TBA-30yr | (f) | | | 37,425,391 | |
| | | | | | | | | | | | | | |
| | | | | | | | | | | | | 71,360,566 | |
| | |
| | TOTAL FEDERAL AGENCIES | | | $ | 125,775,422 | |
| | |
| TOTAL MORTGAGE-BACKED
OBLIGATIONS |
| | | | |
| | (Cost $161,646,181) | | | $ | 160,563,250 | |
| | |
| | | | | | | | | | | | | | |
| | Agency Debenture – 0.3% | |
| FHLMC | |
| | 1,800,000 | | | | 6.750 | % | | | 03/15/31 | | | $ | 2,715,148 | |
| | (Cost $2,371,970) | |
| | |
| | | | | | | | | | | | | | |
| | Government Guarantee Obligations(e) – 2.1% | |
| Banca Monte dei Paschi di Siena SpA | |
| EUR | 3,500,000 | | | | 3.500 | % | | | 03/20/17 | | | $ | 4,091,312 | |
| Canada Housing Trust No. 1(a) | |
| CAD | 5,200,000 | | | | 2.350 | | | | 12/15/18 | | | | 4,162,923 | |
| Dexia Credit Local SA | |
| GBP | 1,800,000 | | | | 1.875 | | | | 07/17/17 | | | | 2,606,499 | |
| $ | 3,500,000 | | | | 1.875 | (a) | | | 03/28/19 | | | | 3,516,849 | |
| Kreditanstalt fuer Wiederaufbau | |
| AUD | 3,000,000 | | | | 6.000 | | | | 08/20/20 | | | | 2,613,185 | |
| | |
| TOTAL GOVERNMENT GUARANTEE
OBLIGATIONS |
| | | | |
| | (Cost $18,533,014) | | | $ | 16,990,768 | |
| | |
| | | | | | | | | | | | | | |
| | | | | | | | | | | | | | |
| | U.S. Treasury Obligations – 8.7% | |
| United States Treasury Bonds | |
| $ | 19,460,000 | | | | 3.750 | % | | | 11/15/43 | | | $ | 24,184,499 | |
| | 1,000,000 | | | | 3.000 | | | | 11/15/45 | | | | 1,080,070 | |
| | 2,500,000 | | | | 2.500 | (g) | | | 02/15/46 | | | | 2,438,175 | |
| United States Treasury Inflation Protected Securities | |
| | 5,313,856 | | | | 0.375 | | | | 07/15/23 | | | | 5,479,063 | |
| | 5,259,306 | | | | 0.625 | | | | 01/15/24 | | | | 5,481,985 | |
| | 788,199 | | | | 0.125 | | | | 07/15/24 | | | | 791,896 | |
| | 774,217 | | | | 0.375 | | | | 07/15/25 | | | | 791,877 | |
| | 624,760 | | | | 2.125 | | | | 02/15/40 | | | | 800,180 | |
| | 1,941,515 | | | | 1.375 | | | | 02/15/44 | | | | 2,180,263 | |
| United States Treasury Notes | |
| | 17,150,000 | | | | 1.500 | | | | 05/31/20 | | | | 17,410,852 | |
| | 8,800,000 | | | | 1.500 | | | | 03/31/23 | | | | 8,771,840 | |
| | 300,000 | | | | 2.250 | | | | 11/15/25 | | | | 312,252 | |
| | |
| | TOTAL U.S. TREASURY OBLIGATIONS | | | | | |
| | (Cost $69,012,456) | | | $ | 69,722,952 | |
| | |
| TOTAL INVESTMENTS BEFORE
SHORT-TERM INVESTMENT |
| | | | |
| | (Cost $841,838,649) | | | $ | 855,255,406 | |
| | |
| | | | | | | | | | | | | | |
| | Short-term Investments – 5.1% | |
| | Commercial Paper – 0.5% | |
| Barclays Bank PLC | |
| $ | 3,750,000 | | | | 1.222 | % | | | 04/13/16 | | | $ | 3,750,000 | |
| | |
| | Repurchase Agreements(h) – 4.6% | |
| Joint Repurchase Agreement Account II | |
| | 37,200,000 | | | | 0.301 | | | | 04/01/16 | | | | 37,200,000 | |
| | |
| | TOTAL SHORT-TERM INVESTMENTS | |
| | (Cost $40,950,000) | | | $ | 40,950,000 | |
| | |
| | TOTAL INVESTMENTS – 112.2% | |
| | (Cost $882,788,649) | | | $ | 896,205,406 | |
| | |
| LIABILITIES IN EXCESS OF
OTHER ASSETS – (12.2)% |
| | | (97,437,365 | ) |
| | |
| | NET ASSETS – 100.0% | | | $ | 798,768,041 | |
| | |
| | |
| The accompanying notes are an integral part of these financial statements. | | 73 |
GOLDMAN SACHS GLOBAL INCOME FUND
Schedule of Investments (continued)
March 31, 2016
| | |
| The percentage shown for each investment category reflects the value of investments in that category as a percentage of net assets. |
(a) | | Exempt from registration under Rule 144A of the Securities Act of 1933. Such securities may be deemed liquid by the investment adviser and may be resold, normally to qualified institutional buyers in transactions exempt from registration. Total market value of Rule 144A securities amounts to $180,214,435, which represents approximately 22.6% of net assets as of March 31, 2016. |
(b) | | Issued with a zero coupon. Income is recognized through the accretion of discount. |
(c) | | Variable rate security. Interest rate or distribution rate disclosed is that which is in effect on March 31, 2016. |
(d) | | Security with “Call” features with resetting interest rates. Maturity dates disclosed are the final maturity dates. |
(e) | | Guaranteed by a foreign government until maturity. Total market value of these securities amounts to $21,624,456, which represents approximately 2.7% of net assets as of March 31, 2016. |
(f) | | TBA (To Be Announced) Securities are purchased on a forward commitment basis with an approximate principal amount and no defined maturity date. The actual principal and maturity date will be determined upon settlement when the specific mortgage pools are assigned. Total market value of TBA securities (excluding forward sales contracts, if any) amounts to $78,661,017 which represents approximately 9.9% of net assets as of March 31, 2016. |
(g) | | All or a portion of security is segregated as collateral for initial margin requirements on futures transactions. |
(h) | | Joint repurchase agreement was entered into on March 31, 2016. Additional information appears on page 113. |
| | |
|
Currency Abbreviations: |
AED | | —United Arab Emirates Dirham |
AUD | | —Australian Dollar |
BRL | | —Brazilian Real |
CAD | | —Canadian Dollar |
CHF | | —Swiss Franc |
CNH | | —Chinese Yuan Renminbi Offshore |
CNY | | —Chinese Yuan Renminbi |
COP | | —Colombian Peso |
CZK | | —Czech Koruna |
DKK | | —Danish Krone |
EUR | | —Euro |
GBP | | —British Pound |
HKD | | —Hong Kong Dollar |
HUF | | —Hungarian Forint |
IDR | | —Indonesian Rupiah |
INR | | —Indian Rupee |
JPY | | —Japanese Yen |
KRW | | —South Korean Won |
MXN | | —Mexican Peso |
MYR | | —Malaysian Ringgit |
NOK | | —Norwegian Krone |
NZD | | —New Zealand Dollar |
PLN | | —Polish Zloty |
RUB | | —Russian Ruble |
SEK | | —Swedish Krona |
SGD | | —Singapore Dollar |
THB | | —Thai Baht |
TRY | | —Turkish Lira |
TWD | | —Taiwan Dollar |
USD | | —U.S. Dollar |
ZAR | | —South African Rand |
| | |
Investment Abbreviations: |
ACES | | —Alternative Credit Enhancement Securities |
AUDOR | | —Australian Dollar Offered Rate |
CDOR | | —Canadian Dollar Offered Rate |
CHFOR | | —Swiss Franc Offered Rate |
CLO | | —Collateralized Loan Obligation |
CPI | | —Consumer Price Index |
EURO | | —Euro Offered Rate |
FHLMC | | —Federal Home Loan Mortgage Corp. |
FNMA | | —Federal National Mortgage Association |
FREMF | | —Freddie Mac Multi Family |
GMAC | | —General Motors Acceptance Corporation |
GNMA | | —Government National Mortgage Association |
JYOR | | —Japanese Yen Offered Rate |
LIBOR | | —London Interbank Offered Rate |
LLC | | —Limited Liability Company |
LP | | —Limited Partnership |
NZDOR | | —New Zealand Dollar Offered Rate |
REMIC | | —Real Estate Mortgage Investment Conduit |
STIBOR | | —Stockholm Interbank Offered Rate |
STRIPS | | —Separate Trading of Registered Interest and Principal of Securities |
TIIE | | —La Tasa de Interbank Equilibrium Interest Rate |
|
| | |
| 74 | | The accompanying notes are an integral part of these financial statements. |
GOLDMAN SACHS GLOBAL INCOME FUND
|
| ADDITIONAL INVESTMENT INFORMATION |
FORWARD FOREIGN CURRENCY EXCHANGE CONTRACTS — At March 31, 2016, the Fund had the following forward foreign currency exchange contracts:
FORWARD FOREIGN CURRENCY EXCHANGE CONTRACTS WITH UNREALIZED GAIN
| | | | | | | | | | | | | | | | | | | | | | | | |
| Counterparty | | Currency Purchased | | | Currency Sold | | | Current Value | | | Settlement Date | | | Unrealized Gain | |
Bank of America Securities LLC | | BRL | | | 3,258,351 | | | USD | | | 888,000 | | | $ | 905,114 | | | | 04/04/16 | | | $ | 17,114 | |
| | GBP | | | 1,762,811 | | | USD | | | 2,529,875 | | | | 2,531,889 | | | | 04/07/16 | | | | 2,013 | |
| | HUF | | | 159,990,407 | | | EUR | | | 509,000 | | | | 579,667 | | | | 04/26/16 | | | | 25 | |
| | JPY | | | 1,055,195,637 | | | USD | | | 9,312,792 | | | | 9,383,317 | | | | 04/26/16 | | | | 70,524 | |
| | NZD | | | 3,313,000 | | | USD | | | 2,209,128 | | | | 2,286,785 | | | | 04/26/16 | | | | 77,657 | |
| | PLN | | | 4,344,334 | | | EUR | | | 1,008,000 | | | | 1,163,820 | | | | 04/26/16 | | | | 15,923 | |
| | RUB | | | 88,438,834 | | | USD | | | 1,186,000 | | | | 1,314,821 | | | | 04/04/16 | | | | 128,821 | |
| | SEK | | | 62,828,942 | | | EUR | | | 6,736,984 | | | | 7,746,319 | | | | 04/26/16 | | | | 74,337 | |
Barclays Bank PLC | | AUD | | | 2,237,000 | | | USD | | | 1,684,789 | | | | 1,712,720 | | | | 04/26/16 | | | | 27,932 | |
| | CAD | | | 736,008 | | | USD | | | 563,000 | | | | 566,729 | | | | 04/26/16 | | | | 3,729 | |
| | CNH | | | 3,247,551 | | | USD | | | 473,565 | | | | 498,615 | | | | 09/01/16 | | | | 25,049 | |
| | CNY | | | 982,626 | | | USD | | | 148,770 | | | | 151,665 | | | | 05/19/16 | | | | 2,895 | |
| | CNY | | | 3,671,846 | | | USD | | | 542,290 | | | | 563,831 | | | | 08/05/16 | | | | 21,541 | |
| | CNY | | | 4,500,746 | | | USD | | | 668,560 | | | | 690,600 | | | | 08/16/16 | | | | 22,040 | |
| | EUR | | | 984,000 | | | GBP | | | 770,881 | | | | 1,120,565 | | | | 04/26/16 | | | | 13,300 | |
| | EUR | | | 868,965 | | | SEK | | | 8,012,511 | | | | 989,565 | | | | 04/26/16 | | | | 1,684 | |
| | INR | | | 38,953,337 | | | USD | | | 564,000 | | | | 587,487 | | | | 04/07/16 | | | | 23,487 | |
| | INR | | | 37,396,385 | | | USD | | | 554,000 | | | | 563,092 | | | | 04/18/16 | | | | 9,092 | |
| | NZD | | | 838,000 | | | USD | | | 555,449 | | | | 578,426 | | | | 04/26/16 | | | | 22,977 | |
| | ZAR | | | 3,382,434 | | | USD | | | 221,000 | | | | 227,937 | | | | 04/26/16 | | | | 6,937 | |
BNP Paribas SA | | CNH | | | 28,255,629 | | | USD | | | 4,271,448 | | | | 4,360,751 | | | | 05/26/16 | | | | 89,303 | |
| | CNH | | | 25,086,935 | | | USD | | | 3,781,000 | | | | 3,868,118 | | | | 06/13/16 | | | | 87,118 | |
| | CNH | | | 28,384,840 | | | USD | | | 4,314,461 | | | | 4,359,443 | | | | 08/26/16 | | | | 44,982 | |
| | CNH | | | 7,089,459 | | | USD | | | 1,040,731 | | | | 1,088,484 | | | | 09/01/16 | | | | 47,753 | |
| | CNH | | | 33,383,027 | | | USD | | | 5,050,382 | | | | 5,123,349 | | | | 09/09/16 | | | | 72,966 | |
| | EUR | | | 515,000 | | | GBP | | | 404,775 | | | | 586,475 | | | | 04/26/16 | | | | 5,072 | |
| | GBP | | | 395,000 | | | USD | | | 560,580 | | | | 567,363 | | | | 04/26/16 | | | | 6,783 | |
| | HUF | | | 160,764,177 | | | EUR | | | 511,000 | | | | 582,470 | | | | 04/26/16 | | | | 550 | |
| | INR | | | 36,437,054 | | | USD | | | 546,119 | | | | 549,830 | | | | 04/04/16 | | | | 3,711 | |
| | INR | | | 38,833,402 | | | USD | | | 562,000 | | | | 585,678 | | | | 04/07/16 | | | | 23,678 | |
| | MXN | | | 341,384 | | | USD | | | 19,247 | | | | 19,712 | | | | 04/26/16 | | | | 465 | |
| | MYR | | | 2,267,760 | | | USD | | | 549,000 | | | | 581,753 | | | | 04/01/16 | | | | 32,753 | |
| | MYR | | | 2,268,115 | | | USD | | | 567,866 | | | | 584,984 | | | | 04/25/16 | | | | 17,117 | |
| | NOK | | | 4,122,076 | | | USD | | | 483,761 | | | | 498,097 | | | | 04/26/16 | | | | 14,337 | |
| | NZD | | | 366,112 | | | USD | | | 244,222 | | | | 252,707 | | | | 04/26/16 | | | | 8,485 | |
| | RUB | | | 53,118,608 | | | USD | | | 772,769 | | | | 788,116 | | | | 04/11/16 | | | | 15,347 | |
| | TWD | | | 72,056,625 | | | USD | | | 2,225,000 | | | | 2,241,688 | | | | 04/21/16 | | | | 16,688 | |
Citibank NA (London) | | BRL | | | 1,030,236 | | | USD | | | 280,535 | | | | 286,182 | | | | 04/04/16 | | | | 5,647 | |
| | CNH | | | 7,233,216 | | | USD | | | 1,057,179 | | | | 1,110,556 | | | | 09/01/16 | | | | 53,377 | |
| | CNY | | | 15,419,184 | | | USD | | | 2,332,000 | | | | 2,378,219 | | | | 05/31/16 | | | | 46,219 | |
| | COP | | | 796,018,157 | | | USD | | | 248,116 | | | | 265,276 | | | | 04/04/16 | | | | 17,160 | |
| | EUR | | | 502,000 | | | GBP | | | 391,469 | | | | 571,670 | | | | 04/26/16 | | | | 9,379 | |
| | GBP | | | 188,754 | | | USD | | | 267,502 | | | | 271,119 | | | | 04/26/16 | | | | 3,617 | |
| | IDR | | | 7,691,976,026 | | | USD | | | 578,000 | | | | 583,307 | | | | 05/02/16 | | | | 5,307 | |
| | INR | | | 15,635,881 | | | USD | | | 235,587 | | | | 235,818 | | | | 04/07/16 | | | | 231 | |
| | MYR | | | 2,381,808 | | | USD | | | 570,000 | | | | 611,010 | | | | 04/01/16 | | | | 41,010 | |
| | NZD | | | 1,766,135 | | | USD | | | 1,199,506 | | | | 1,219,068 | | | | 04/26/16 | | | | 19,562 | |
| | RUB | | | 40,915,875 | | | USD | | | 550,000 | | | | 608,297 | | | | 04/04/16 | | | | 58,297 | |
| | RUB | | | 71,363,959 | | | USD | | | 942,310 | | | | 1,059,740 | | | | 04/08/16 | | | | 117,430 | |
| | |
| The accompanying notes are an integral part of these financial statements. | | 75 |
GOLDMAN SACHS GLOBAL INCOME FUND
Schedule of Investments (continued)
March 31, 2016
|
| ADDITIONAL INVESTMENT INFORMATION (continued) |
FORWARD FOREIGN CURRENCY EXCHANGE CONTRACTS WITH UNREALIZED GAIN (continued)
| | | | | | | | | | | | | | | | | | | | | | | | |
| Counterparty | | Currency Purchased | | | Currency Sold | | | Current Value | | | Settlement Date | | | Unrealized Gain | |
Citibank NA (London) (continued) | | RUB | | | 40,914,000 | | | USD | | | 552,362 | | | $ | 605,461 | | | | 04/20/16 | | | $ | 53,099 | |
| | RUB | | | 39,954,216 | | | USD | | | 572,320 | | | | 590,916 | | | | 04/22/16 | | | | 18,597 | |
| | RUB | | | 104,833,511 | | | USD | | | 1,541,046 | | | | 1,548,684 | | | | 04/26/16 | | | | 7,638 | |
| | SEK | | | 412,044 | | | EUR | | | 44,356 | | | | 50,802 | | | | 04/26/16 | | | | 290 | |
| | USD | | | 231,929 | | | NZD | | | 335,613 | | | | 231,656 | | | | 04/26/16 | | | | 273 | |
| | ZAR | | | 3,433,920 | | | USD | | | 221,000 | | | | 231,407 | | | | 04/26/16 | | | | 10,407 | |
Credit Suisse International (London) | | COP | | | 742,299,600 | | | USD | | | 228,000 | | | | 247,374 | | | | 04/04/16 | | | | 19,374 | |
| | COP | | | 1,750,686,860 | | | USD | | | 578,000 | | | | 582,781 | | | | 05/02/16 | | | | 4,781 | |
| | COP | | | 2,287,152,407 | | | USD | | | 750,624 | | | | 759,949 | | | | 05/13/16 | | | | 9,325 | |
| | EUR | | | 525,000 | | | CHF | | | 567,242 | | | | 598,820 | | | | 06/15/16 | | | | 6,862 | |
| | EUR | | | 492,000 | | | USD | | | 556,580 | | | | 560,283 | | | | 04/26/16 | | | | 3,703 | |
| | RUB | | | 28,125,200 | | | USD | | | 400,000 | | | | 416,929 | | | | 04/14/16 | | | | 16,929 | |
| | RUB | | | 210,005,973 | | | USD | | | 2,938,571 | | | | 3,109,541 | | | | 04/18/16 | | | | 170,971 | |
| | RUB | | | 15,954,300 | | | USD | | | 228,000 | | | | 235,758 | | | | 04/25/16 | | | | 7,758 | |
Deutsche Bank AG (London) | | CNY | | | 4,279,559 | | | USD | | | 633,488 | | | | 657,592 | | | | 07/26/16 | | | | 24,104 | |
| | CNY | | | 3,718,733 | | | USD | | | 550,312 | | | | 571,146 | | | | 08/02/16 | | | | 20,834 | |
| | CNY | | | 1,864,216 | | | USD | | | 275,486 | | | | 286,299 | | | | 08/03/16 | | | | 10,812 | |
| | HUF | | | 355,456,930 | | | USD | | | 1,258,255 | | | | 1,287,868 | | | | 04/26/16 | | | | 29,614 | |
| | IDR | | | 7,296,926,445 | | | USD | | | 549,000 | | | | 554,815 | | | | 04/07/16 | | | | 5,815 | |
| | IDR | | | 7,378,036,600 | | | USD | | | 556,000 | | | | 560,361 | | | | 04/18/16 | | | | 4,361 | |
| | MXN | | | 138,349,436 | | | USD | | | 7,742,427 | | | | 7,988,384 | | | | 04/26/16 | | | | 245,957 | |
| | USD | | | 579,546 | | | EUR | | | 508,000 | | | | 578,503 | | | | 04/26/16 | | | | 1,043 | |
| | USD | | | 1,262,965 | | | THB | | | 43,951,183 | | | | 1,248,566 | | | | 04/26/16 | | | | 14,399 | |
HSBC Bank PLC | | CNH | | | 28,514,051 | | | USD | | | 4,312,211 | | | | 4,400,634 | | | | 05/26/16 | | | | 88,423 | |
| | CNH | | | 275,092 | | | USD | | | 40,644 | | | | 42,414 | | | | 06/14/16 | | | | 1,770 | |
| | CNH | | | 28,384,840 | | | USD | | | 4,220,794 | | | | 4,359,443 | | | | 08/26/16 | | | | 138,649 | |
| | CNH | | | 6,278,504 | | | USD | | | 930,000 | | | | 963,974 | | | | 09/01/16 | | | | 33,974 | |
| | CNY | | | 3,069,272 | | | USD | | | 455,787 | | | | 474,796 | | | | 04/14/16 | | | | 19,008 | |
| | CNY | | | 6,203,153 | | | USD | | | 911,575 | | | | 953,942 | | | | 07/14/16 | | | | 42,367 | |
| | CNY | | | 5,271,168 | | | USD | | | 780,134 | | | | 810,563 | | | | 07/15/16 | | | | 30,430 | |
| | CNY | | | 3,169,059 | | | USD | | | 467,172 | | | | 487,118 | | | | 07/21/16 | | | | 19,947 | |
| | CNY | | | 5,184,121 | | | USD | | | 767,052 | | | | 796,209 | | | | 08/02/16 | | | | 29,157 | |
| | CNY | | | 3,781,187 | | | USD | | | 568,343 | | | | 580,112 | | | | 08/18/16 | | | | 11,769 | |
| | CNY | | | 15,558,575 | | | USD | | | 2,330,000 | | | | 2,385,718 | | | | 08/26/16 | | | | 55,718 | |
| | EUR | | | 1,504,000 | | | USD | | | 1,681,927 | | | | 1,712,734 | | | | 04/26/16 | | | | 30,807 | |
| | KRW | | | 3,145,396,622 | | | USD | | | 2,599,716 | | | | 2,745,200 | | | | 04/08/16 | | | | 145,484 | |
| | MYR | | | 2,249,936 | | | USD | | | 579,000 | | | | 580,308 | | | | 05/04/16 | | | | 1,308 | |
| | NOK | | | 4,667,186 | | | EUR | | | 491,000 | | | | 563,967 | | | | 04/26/16 | | | | 4,822 | |
| | SEK | | | 33,825,221 | | | EUR | | | 3,620,032 | | | | 4,170,386 | | | | 04/26/16 | | | | 47,945 | |
| | TRY | | | 3,240,158 | | | USD | | | 1,108,000 | | | | 1,141,180 | | | | 04/26/16 | | | | 33,180 | |
| | TWD | | | 18,145,616 | | | USD | | | 556,000 | | | | 564,489 | | | | 04/18/16 | | | | 8,489 | |
| | TWD | | | 37,259,441 | | | USD | | | 1,156,000 | | | | 1,159,223 | | | | 04/26/16 | | | | 3,223 | |
| | USD | | | 1,490,219 | | | KRW | | | 1,703,320,684 | | | | 1,486,603 | | | | 04/08/16 | | | | 3,616 | |
JPMorgan Chase Bank (London) | | BRL | | | 2,070,322 | | | USD | | | 551,000 | | | | 575,100 | | | | 04/04/16 | | | | 24,100 | |
| | CNH | | | 13,910,726 | | | USD | | | 2,122,000 | | | | 2,144,753 | | | | 06/14/16 | | | | 22,753 | |
| | CNH | | | 3,222,295 | | | USD | | | 474,000 | | | | 494,737 | | | | 09/01/16 | | | | 20,737 | |
| | CNH | | | 50,161,945 | | | USD | | | 7,637,906 | | | | 7,696,435 | | | | 09/14/16 | | | | 58,530 | |
| | CNY | | | 9,519,795 | | | USD | | | 1,392,938 | | | | 1,464,283 | | | | 07/11/16 | | | | 71,346 | |
| | CNY | | | 6,411,344 | | | USD | | | 939,427 | | | | 986,092 | | | | 07/12/16 | | | | 46,665 | |
| | IDR | | | 7,610,506,000 | | | USD | | | 567,948 | | | | 576,628 | | | | 04/04/16 | | | | 8,680 | |
| | |
| 76 | | The accompanying notes are an integral part of these financial statements. |
GOLDMAN SACHS GLOBAL INCOME FUND
|
| ADDITIONAL INVESTMENT INFORMATION (continued) |
FORWARD FOREIGN CURRENCY EXCHANGE CONTRACTS WITH UNREALIZED GAIN (continued)
| | | | | | | | | | | | | | | | | | | | | | | | |
| Counterparty | | Currency Purchased | | | Currency Sold | | | Current Value | | | Settlement Date | | | Unrealized Gain | |
JPMorgan Chase Bank (London) (continued) | | IDR | | | 4,141,003,972 | | | USD | | | 311,705 | | | $ | 314,857 | | | | 04/07/16 | | | $ | 3,152 | |
| | INR | | | 38,274,115 | | | USD | | | 572,580 | | | | 577,551 | | | | 04/04/16 | | | | 4,971 | |
| | MXN | | | 39,281,217 | | | USD | | | 2,238,000 | | | | 2,268,123 | | | | 04/26/16 | | | | 30,123 | |
| | MYR | | | 2,265,361 | | | USD | | | 554,000 | | | | 584,239 | | | | 04/20/16 | | | | 30,239 | |
| | MYR | | | 2,270,915 | | | USD | | | 556,000 | | | | 585,678 | | | | 04/21/16 | | | | 29,678 | |
| | PLN | | | 19,428,700 | | | USD | | | 4,911,794 | | | | 5,204,828 | | | | 04/26/16 | | | | 293,034 | |
| | RUB | | | 17,730,365 | | | USD | | | 240,174 | | | | 263,598 | | | | 04/04/16 | | | | 23,424 | |
| | USD | | | 450,000 | | | CNH | | | 2,903,738 | | | | 445,827 | | | | 09/01/16 | | | | 4,173 | |
| | USD | | | 579,000 | | | RUB | | | 39,140,400 | | | | 577,714 | | | | 04/29/16 | | | | 1,286 | |
Morgan Stanley & Co. International PLC | | BRL | | | 7,091,834 | | | USD | | | 1,883,391 | | | | 1,969,989 | | | | 04/04/16 | | | | 86,598 | |
| | CNH | | | 1,820,412 | | | USD | | | 266,950 | | | | 279,498 | | | | 09/01/16 | | | | 12,548 | |
| | EUR | | | 497,000 | | | USD | | | 560,303 | | | | 565,977 | | | | 04/26/16 | | | | 5,674 | |
| | MXN | | | 9,946,092 | | | USD | | | 554,000 | | | | 574,294 | | | | 04/26/16 | | | | 20,294 | |
| | MYR | | | 2,091,414 | | | USD | | | 506,700 | | | | 539,302 | | | | 04/08/16 | | | | 32,602 | |
| | NZD | | | 829,000 | | | USD | | | 554,110 | | | | 572,214 | | | | 04/26/16 | | | | 18,104 | |
| | RUB | | | 32,111,275 | | | USD | | | 442,000 | | | | 476,432 | | | | 04/11/16 | | | | 34,432 | |
| | RUB | | | 38,330,320 | | | USD | | | 560,000 | | | | 567,063 | | | | 04/21/16 | | | | 7,063 | |
| | RUB | | | 39,430,524 | | | USD | | | 578,000 | | | | 581,996 | | | | 04/29/16 | | | | 3,996 | |
Royal Bank of Canada | | AUD | | | 1,050,403 | | | USD | | | 785,539 | | | | 804,223 | | | | 04/26/16 | | | | 18,684 | |
| | BRL | | | 2,290,898 | | | USD | | | 570,176 | | | | 636,372 | | | | 04/04/16 | | | | 66,196 | |
| | CAD | | | 753,850 | | | USD | | | 580,000 | | | | 580,468 | | | | 04/26/16 | | | | 468 | |
| | USD | | | 565,000 | | | BRL | | | 2,030,503 | | | | 564,039 | | | | 04/04/16 | | | | 961 | |
| | USD | | | 579,000 | | | MXN | | | 9,947,237 | | | | 574,360 | | | | 04/26/16 | | | | 4,640 | |
Royal Bank of Scotland PLC | | COP | | | 748,834,650 | | | USD | | | 228,000 | | | | 249,552 | | | | 04/04/16 | | | | 21,552 | |
| | COP | | | 1,732,180,174 | | | USD | | | 547,926 | | | | 577,155 | | | | 04/11/16 | | | | 29,229 | |
| | COP | | | 706,201,522 | | | USD | | | 221,000 | | | | 235,274 | | | | 04/15/16 | | | | 14,274 | |
| | EUR | | | 500,000 | | | GBP | | | 388,230 | | | | 569,393 | | | | 04/26/16 | | | | 11,754 | |
| | EUR | | | 497,000 | | | NOK | | | 4,670,756 | | | | 565,977 | | | | 04/26/16 | | | | 1,578 | |
| | EUR | | | 510,000 | | | SEK | | | 4,710,513 | | | | 580,781 | | | | 04/26/16 | | | | 11 | |
| | NOK | | | 9,408,766 | | | EUR | | | 992,000 | | | | 1,136,923 | | | | 04/26/16 | | | | 7,247 | |
| | TRY | | | 4,881,154 | | | USD | | | 1,688,000 | | | | 1,719,136 | | | | 04/26/16 | | | | 31,136 | |
| | USD | | | 560,000 | | | MXN | | | 9,693,085 | | | | 559,685 | | | | 04/26/16 | | | | 315 | |
Standard Chartered Bank | | AUD | | | 750,000 | | | USD | | | 565,380 | | | | 574,225 | | | | 04/26/16 | | | | 8,845 | |
| | CNH | | | 6,470,498 | | | USD | | | 948,000 | | | | 993,451 | | | | 09/01/16 | | | | 45,451 | |
| | CNH | | | 33,694,875 | | | USD | | | 5,050,138 | | | | 5,171,208 | | | | 09/09/16 | | | | 121,070 | |
| | CNY | | | 6,466,423 | | | USD | | | 949,130 | | | | 993,958 | | | | 07/21/16 | | | | 44,828 | |
| | CNY | | | 6,414,727 | | | USD | | | 948,118 | | | | 985,946 | | | | 07/22/16 | | | | 37,828 | |
| | EUR | | | 3,764,012 | | | USD | | | 4,218,049 | | | | 4,286,403 | | | | 04/26/16 | | | | 68,354 | |
| | INR | | | 71,401,715 | | | USD | | | 1,033,011 | | | | 1,076,868 | | | | 04/07/16 | | | | 43,857 | |
| | INR | | | 37,303,313 | | | USD | | | 554,000 | | | | 561,690 | | | | 04/18/16 | | | | 7,690 | |
| | MYR | | | 4,509,510 | | | USD | | | 1,103,000 | | | | 1,162,884 | | | | 04/11/16 | | | | 59,884 | |
| | NZD | | | 473,195 | | | USD | | | 312,131 | | | | 326,621 | | | | 04/26/16 | | | | 14,490 | |
| | USD | | | 1,797,000 | | | CNH | | | 11,623,032 | | | | 1,784,548 | | | | 09/01/16 | | | | 12,452 | |
| | USD | | | 2,612,563 | | | JPY | | | 290,871,000 | | | | 2,587,256 | | | | 05/06/16 | | | | 25,307 | |
| | USD | | | 348,000 | | | ZAR | | | 5,146,314 | | | | 346,802 | | | | 04/26/16 | | | | 1,198 | |
| | ZAR | | | 6,909,327 | | | USD | | | 450,000 | | | | 465,609 | | | | 04/26/16 | | | | 15,609 | |
State Street Bank (London) | | CNH | | | 88,955,485 | | | USD | | | 13,471,000 | | | | 13,715,916 | | | | 06/13/16 | | | | 244,916 | |
| | CNH | | | 54,595,130 | | | USD | | | 8,374,000 | | | | 8,417,467 | | | | 06/14/16 | | | | 43,467 | |
| | CNH | | | 33,251,782 | | | USD | | | 4,861,727 | | | | 5,119,982 | | | | 07/08/16 | | | | 258,255 | |
| | CNH | | | 35,119,731 | | | USD | | | 5,220,324 | | | | 5,389,883 | | | | 09/09/16 | | | | 169,559 | |
| | |
| The accompanying notes are an integral part of these financial statements. | | 77 |
GOLDMAN SACHS GLOBAL INCOME FUND
Schedule of Investments (continued)
March 31, 2016
|
| ADDITIONAL INVESTMENT INFORMATION (continued) |
FORWARD FOREIGN CURRENCY EXCHANGE CONTRACTS WITH UNREALIZED GAIN (continued)
| | | | | | | | | | | | | | | | | | | | | | | | |
| Counterparty | | Currency Purchased | | | Currency Sold | | | Current Value | | | Settlement Date | | | Unrealized Gain | |
State Street Bank (London) (continued) | | CNH | | | 18,619,003 | | | USD | | | 2,771,618 | | | $ | 2,856,746 | | | | 09/14/16 | | | $ | 85,128 | |
| | EUR | | | 501,000 | | | SEK | | | 4,625,032 | | | | 570,532 | | | | 04/26/16 | | | | 301 | |
| | EUR | | | 981,422 | | | USD | | | 1,100,472 | | | | 1,117,630 | | | | 04/26/16 | | | | 17,157 | |
| | GBP | | | 403,642 | | | EUR | | | 508,000 | | | | 579,775 | | | | 04/26/16 | | | | 1,273 | |
| | GBP | | | 205,352 | | | USD | | | 289,836 | | | | 294,960 | | | | 04/26/16 | | | | 5,124 | |
| | MXN | | | 9,854,552 | | | USD | | | 554,000 | | | | 569,008 | | | | 04/26/16 | | | | 15,008 | |
| | SEK | | | 78,457,640 | | | EUR | | | 8,443,759 | | | | 9,673,216 | | | | 04/26/16 | | | | 57,582 | |
| | ZAR | | | 43,823,940 | | | USD | | | 2,809,767 | | | | 2,953,229 | | | | 04/26/16 | | | | 143,462 | |
UBS AG (London) | | AUD | | | 738,000 | | | USD | | | 552,067 | | | | 565,037 | | | | 04/26/16 | | | | 12,970 | |
| | BRL | | | 6,461,112 | | | USD | | | 1,677,000 | | | | 1,794,785 | | | | 04/04/16 | | | | 117,785 | |
| | CHF | | | 1,091,210 | | | EUR | | | 994,000 | | | | 1,136,125 | | | | 04/26/16 | | | | 4,172 | |
| | CNH | | | 12,372,453 | | | USD | | | 1,851,055 | | | | 1,898,821 | | | | 09/09/16 | | | | 47,766 | |
| | EUR | | | 500,000 | | | GBP | | | 387,482 | | | | 569,393 | | | | 04/26/16 | | | | 12,829 | |
| | EUR | | | 994,000 | | | USD | | | 1,112,620 | | | | 1,131,953 | | | | 04/26/16 | | | | 19,333 | |
| | NOK | | | 9,922,422 | | | EUR | | | 1,048,000 | | | | 1,198,660 | | | | 06/15/16 | | | | 3,301 | |
| | PLN | | | 2,181,943 | | | EUR | | | 506,000 | | | | 584,529 | | | | 04/26/16 | | | | 8,304 | |
| | SEK | | | 4,700,738 | | | EUR | | | 502,000 | | | | 579,564 | | | | 04/26/16 | | | | 7,894 | |
| | USD | | | 581,451 | | | AUD | | | 756,000 | | | | 578,818 | | | | 04/26/16 | | | | 2,633 | |
| | USD | | | 4,094,513 | | | JPY | | | 455,380,240 | | | | 4,049,464 | | | | 04/26/16 | | | | 45,048 | |
Westpac Banking Corp. | | AUD | | | 635,800 | | | USD | | | 479,927 | | | | 486,789 | | | | 04/26/16 | | | | 6,862 | |
| | CNH | | | 3,257,390 | | | USD | | | 474,000 | | | | 500,125 | | | | 09/01/16 | | | | 26,125 | |
| | IDR | | | 7,610,506,000 | | | USD | | | 573,296 | | | | 578,017 | | | | 04/18/16 | | | | 4,720 | |
| | MYR | | | 997,090 | | | USD | | | 254,880 | | | | 257,114 | | | | 04/08/16 | | | | 2,234 | |
| | NZD | | | 2,162,923 | | | USD | | | 1,469,475 | | | | 1,492,949 | | | | 04/26/16 | | | | 23,474 | |
| | USD | | | 1,205,489 | | | IDR | | | 15,812,402,000 | | | | 1,200,949 | | | | 04/18/16 | | | | 4,540 | |
| | | USD | | | 578,871 | | | NZD | | | 834,000 | | | | 575,665 | | | | 04/26/16 | | | | 3,206 | |
| TOTAL | | | | | | | | | | | | | | | | | | | | | | $ | 5,871,991 | |
FORWARD FOREIGN CURRENCY EXCHANGE CONTRACTS WITH UNREALIZED LOSS
| | | | | | | | | | | | | | | | | | | | | | | | |
| Counterparty | | Currency Purchased | | | Currency Sold | | | Current Value | | | Settlement Date | | | Unrealized Loss | |
Bank of America Securities LLC | | AUD | | | 1,508,000 | | | USD | | | 1,154,608 | | | $ | 1,154,574 | | | | 04/26/16 | | | $ | (34 | ) |
| | EUR | | | 501,000 | | | PLN | | | 2,136,264 | | | | 570,532 | | | | 04/26/16 | | | | (1,761 | ) |
| | HUF | | | 160,185,882 | | | EUR | | | 515,678 | | | | 580,375 | | | | 04/26/16 | | | | (6,872 | ) |
| | USD | | | 1,484,000 | | | CNH | | | 9,822,685 | | | | 1,514,374 | | | | 06/15/16 | | | | (30,374 | ) |
| | USD | | | 557,177 | | | EUR | | | 491,000 | | | | 559,144 | | | | 04/26/16 | | | | (1,967 | ) |
| | USD | | | 19,845,824 | | | EUR | | | 17,681,281 | | | | 20,150,211 | | | | 05/19/16 | | | | (304,387 | ) |
| | USD | | | 550,000 | | | INR | | | 37,268,000 | | | | 562,369 | | | | 04/04/16 | | | | (12,369 | ) |
Barclays Bank PLC | | USD | | | 570,000 | | | CAD | | | 755,687 | | | | 581,882 | | | | 04/26/16 | | | | (11,882 | ) |
| | USD | | | 148,770 | | | CNH | | | 982,626 | | | | 151,703 | | | | 05/19/16 | | | | (2,933 | ) |
| | USD | | | 542,290 | | | CNH | | | 3,669,676 | | | | 564,218 | | | | 08/05/16 | | | | (21,928 | ) |
| | USD | | | 668,560 | | | CNH | | | 4,498,072 | | | | 691,189 | | | | 08/16/16 | | | | (22,629 | ) |
| | USD | | | 1,627,772 | | | CNH | | | 10,969,343 | | | | 1,684,184 | | | | 09/01/16 | | | | (56,412 | ) |
| | USD | | | 578,431 | | | EUR | | | 509,000 | | | | 579,642 | | | | 04/26/16 | | | | (1,211 | ) |
| | USD | | | 552,562 | | | NZD | | | 820,000 | | | | 566,002 | | | | 04/26/16 | | | | (13,440 | ) |
| | USD | | | 565,057 | | | TWD | | | 18,522,570 | | | | 576,215 | | | | 04/18/16 | | | | (11,158 | ) |
| | USD | | | 1,901,847 | | | TWD | | | 62,682,989 | | | | 1,950,205 | | | | 04/26/16 | | | | (48,358 | ) |
| | USD | | | 1,612,737 | | | ZAR | | | 26,016,197 | | | | 1,748,010 | | | | 05/10/16 | | | | (135,272 | ) |
| | |
| 78 | | The accompanying notes are an integral part of these financial statements. |
GOLDMAN SACHS GLOBAL INCOME FUND
|
| ADDITIONAL INVESTMENT INFORMATION (continued) |
FORWARD FOREIGN CURRENCY EXCHANGE CONTRACTS WITH UNREALIZED LOSS (continued)
| | | | | | | | | | | | | | | | | | | | | | | | |
| Counterparty | | Currency Purchased | | | Currency Sold | | | Current Value | | | Settlement Date | | | Unrealized Loss | |
BNP Paribas SA | | EUR | | | 500,000 | | | PLN | | | 2,145,165 | | | $ | 569,393 | | | | 04/26/16 | | | $ | (5,284 | ) |
| | HUF | | | 8,592,685 | | | EUR | | | 27,435 | | | | 31,132 | | | | 04/26/16 | | | | (109 | ) |
| | USD | | | 5,784,687 | | | AED | | | 21,283,520 | | | | 5,788,929 | | | | 08/11/16 | | | | (4,242 | ) |
| | USD | | | 1,396,063 | | | AED | | | 5,139,431 | | | | 1,397,812 | | | | 08/15/16 | | | | (1,749 | ) |
| | USD | | | 4,340,190 | | | CNH | | | 28,384,840 | | | | 4,380,692 | | | | 05/26/16 | | | | (40,502 | ) |
| | USD | | | 5,050,382 | | | CNH | | | 33,193,638 | | | | 5,118,078 | | | | 06/13/16 | | | | (67,696 | ) |
| | USD | | | 4,271,448 | | | CNH | | | 28,394,451 | | | | 4,360,919 | | | | 08/26/16 | | | | (89,471 | ) |
| | USD | | | 3,781,000 | | | CNH | | | 25,206,668 | | | | 3,868,509 | | | | 09/09/16 | | | | (87,509 | ) |
| | USD | | | 554,898 | | | EUR | | | 497,000 | | | | 565,977 | | | | 04/26/16 | | | | (11,079 | ) |
| | USD | | | 550,000 | | | INR | | | 37,443,170 | | | | 565,012 | | | | 04/04/16 | | | | (15,012 | ) |
| | USD | | | 544,568 | | | INR | | | 36,437,054 | | | | 548,647 | | | | 04/18/16 | | | | (4,078 | ) |
| | USD | | | 1,092,469 | | | JPY | | | 123,888,147 | | | | 1,101,674 | | | | 04/26/16 | | | | (9,205 | ) |
| | USD | | | 1,017,385 | | | KRW | | | 1,187,787,024 | | | | 1,036,112 | | | | 04/28/16 | | | | (18,726 | ) |
| | USD | | | 567,738 | | | MYR | | | 2,268,115 | | | | 581,844 | | | | 04/01/16 | | | | (14,106 | ) |
Citibank NA (London) | | EUR | | | 487,193 | | | CHF | | | 533,175 | | | | 554,809 | | | | 04/26/16 | | | | (311 | ) |
| | EUR | | | 855,359 | | | SEK | | | 7,954,153 | | | | 974,071 | | | | 04/26/16 | | | | (6,615 | ) |
| | IDR | | | 7,264,552,140 | | | USD | | | 554,000 | | | | 551,964 | | | | 04/14/16 | | | | (2,036 | ) |
| | USD | | | 2,162,709 | | | AUD | | | 2,913,563 | | | | 2,230,719 | | | | 04/26/16 | | | | (68,010 | ) |
| | USD | | | 280,535 | | | BRL | | | 1,018,411 | | | | 282,897 | | | | 04/04/16 | | | | (2,362 | ) |
| | USD | | | 2,329,093 | | | CAD | | | 3,108,501 | | | | 2,393,557 | | | | 04/26/16 | | | | (64,464 | ) |
| | USD | | | 417,781 | | | CNH | | | 2,731,992 | | | | 419,458 | | | | 09/01/16 | | | | (1,677 | ) |
| | USD | | | 327,968 | | | CNH | | | 2,264,455 | | | | 344,326 | | | | 02/03/17 | | | | (16,358 | ) |
| | USD | | | 509,645 | | | COP | | | 1,717,758,866 | | | | 572,049 | | | | 04/28/16 | | | | (62,404 | ) |
| | USD | | | 1,147,316 | | | EUR | | | 1,028,140 | | | | 1,170,831 | | | | 04/26/16 | | | | (23,514 | ) |
| | USD | | | 1,661,697 | | | GBP | | | 1,167,850 | | | | 1,677,359 | | | | 04/07/16 | | | | (15,662 | ) |
| | USD | | | 842,884 | | | IDR | | | 11,437,930,417 | | | | 869,672 | | | | 04/07/16 | | | | (26,789 | ) |
| | USD | | | 235,161 | | | INR | | | 15,635,881 | | | | 235,435 | | | | 04/18/16 | | | | (274 | ) |
| | USD | | | 245,720 | | | JPY | | | 27,884,405 | | | | 247,962 | | | | 04/26/16 | | | | (2,241 | ) |
| | USD | | | 551,000 | | | KRW | | | 664,175,400 | | | | 579,671 | | | | 04/08/16 | | | | (28,671 | ) |
| | USD | | | 551,000 | | | KRW | | | 666,453,785 | | | | 581,613 | | | | 04/11/16 | | | | (30,613 | ) |
| | USD | | | 971,367 | | | KRW | | | 1,193,984,340 | | | | 1,041,600 | | | | 04/25/16 | | | | (70,234 | ) |
| | USD | | | 755,228 | | | MYR | | | 3,088,504 | | | | 796,416 | | | | 04/08/16 | | | | (41,188 | ) |
| | USD | | | 570,000 | | | MYR | | | 2,299,580 | | | | 593,120 | | | | 04/28/16 | | | | (23,120 | ) |
| | USD | | | 1,550,104 | | | RUB | | | 104,833,511 | | | | 1,558,561 | | | | 04/04/16 | | | | (8,458 | ) |
| | USD | | | 59,922 | | | RUB | | | 4,250,526 | | | | 63,065 | | | | 04/11/16 | | | | (3,143 | ) |
| | USD | | | 244,768 | | | SEK | | | 2,044,893 | | | | 252,119 | | | | 04/26/16 | | | | (7,351 | ) |
| | USD | | | 3,869,561 | | | SGD | | | 5,353,732 | | | | 3,971,599 | | | | 04/26/16 | | | | (102,038 | ) |
| | USD | | | 492,277 | | | TWD | | | 16,358,371 | | | | 508,862 | | | | 04/14/16 | | | | (16,585 | ) |
| | USD | | | 1,499,522 | | | TWD | | | 49,244,291 | | | | 1,531,953 | | | | 04/19/16 | | | | (32,431 | ) |
| | USD | | | 221,000 | | | ZAR | | | 3,355,881 | | | | 226,148 | | | | 04/26/16 | | | | (5,148 | ) |
Credit Suisse International (London) | | EUR | | | 505,000 | | | CHF | | | 553,132 | | | | 575,087 | | | | 04/26/16 | | | | (812 | ) |
| | GBP | | | 398,771 | | | EUR | | | 505,000 | | | | 572,779 | | | | 04/26/16 | | | | (2,308 | ) |
| | JPY | | | 26,037,501 | | | USD | | | 232,132 | | | | 231,538 | | | | 04/26/16 | | | | (593 | ) |
| | USD | | | 354,366 | | | CAD | | | 470,130 | | | | 362,002 | | | | 04/26/16 | | | | (7,636 | ) |
| | USD | | | 754,836 | | | COP | | | 2,287,152,407 | | | | 762,203 | | | | 04/04/16 | | | | (7,367 | ) |
| | USD | | | 224,000 | | | RUB | | | 15,396,416 | | | | 227,973 | | | | 04/18/16 | | | | (3,973 | ) |
| | USD | | | 226,000 | | | RUB | | | 15,399,685 | | | | 227,759 | | | | 04/22/16 | | | | (1,759 | ) |
Deutsche Bank AG (London) | | EUR | | | 505,000 | | | SEK | | | 4,701,914 | | | | 575,087 | | | | 04/26/16 | | | | (4,623 | ) |
| | IDR | | | 12,722,539,400 | | | USD | | | 970,000 | | | | 966,956 | | | | 04/11/16 | | | | (3,044 | ) |
| | IDR | | | 7,329,229,600 | | | USD | | | 560,000 | | | | 556,486 | | | | 04/21/16 | | | | (3,514 | ) |
| | MXN | | | 9,957,351 | | | USD | | | 578,000 | | | | 574,944 | | | | 04/26/16 | | | | (3,056 | ) |
| | |
| The accompanying notes are an integral part of these financial statements. | | 79 |
GOLDMAN SACHS GLOBAL INCOME FUND
Schedule of Investments (continued)
March 31, 2016
|
| ADDITIONAL INVESTMENT INFORMATION (continued) |
FORWARD FOREIGN CURRENCY EXCHANGE CONTRACTS WITH UNREALIZED LOSS (continued)
| | | | | | | | | | | | | | | | | | | | | | | | |
| Counterparty | | Currency Purchased | | | Currency Sold | | | Current Value | | | Settlement Date | | | Unrealized Loss | |
Deutsche Bank AG (London) (continued) | | USD | | | 633,488 | | | CNH | | | 4,277,179 | | | $ | 657,966 | | | | 07/26/16 | | | $ | (24,478 | ) |
| | USD | | | 550,312 | | | CNH | | | 3,716,257 | | | | 571,470 | | | | 08/02/16 | | | | (21,158 | ) |
| | USD | | | 275,486 | | | CNH | | | 1,863,115 | | | | 286,487 | | | | 08/03/16 | | | | (11,000 | ) |
| | USD | | | 1,515,066 | | | CNH | | | 10,145,006 | | | | 1,557,619 | | | | 09/01/16 | | | | (42,553 | ) |
| | USD | | | 441,875 | | | IDR | | | 6,053,691,000 | | | | 459,453 | | | | 04/25/16 | | | | (17,578 | ) |
| | USD | | | 1,718,000 | | | KRW | | | 2,000,865,264 | | | | 1,745,502 | | | | 04/25/16 | | | | (27,502 | ) |
| | USD | | | 628,479 | | | PLN | | | 2,488,986 | | | | 666,842 | | | | 04/20/16 | | | | (38,363 | ) |
HSBC Bank PLC | | KRW | | | 1,703,320,684 | | | USD | | | 1,489,568 | | | | 1,485,932 | | | | 04/25/16 | | | | (3,636 | ) |
| | USD | | | 266,957 | | | AUD | | | 357,844 | | | | 273,977 | | | | 04/26/16 | | | | (7,020 | ) |
| | USD | | | 560,000 | | | BRL | | | 2,037,986 | | | | 566,117 | | | | 04/04/16 | | | | (6,117 | ) |
| | USD | | | 15,606,785 | | | CAD | | | 21,693,509 | | | | 16,703,706 | | | | 04/06/16 | | | | (1,096,921 | ) |
| | USD | | | 455,787 | | | CNH | | | 3,072,007 | | | | 474,993 | | | | 04/14/16 | | | | (19,206 | ) |
| | USD | | | 4,251,137 | | | CNH | | | 28,384,840 | | | | 4,380,692 | | | | 05/26/16 | | | | (129,555 | ) |
| | USD | | | 14,366 | | | CNH | | | 97,310 | | | | 15,004 | | | | 06/13/16 | | | | (638 | ) |
| | USD | | | 911,575 | | | CNH | | | 6,202,355 | | | | 954,716 | | | | 07/14/16 | | | | (43,141 | ) |
| | USD | | | 780,134 | | | CNH | | | 5,269,568 | | | | 811,092 | | | | 07/15/16 | | | | (30,958 | ) |
| | USD | | | 467,172 | | | CNH | | | 3,168,358 | | | | 487,521 | | | | 07/21/16 | | | | (20,349 | ) |
| | USD | | | 767,052 | | | CNH | | | 5,181,559 | | | | 796,797 | | | | 08/02/16 | | | | (29,745 | ) |
| | USD | | | 568,343 | | | CNH | | | 3,778,346 | | | | 580,533 | | | | 08/18/16 | | | | (12,190 | ) |
| | USD | | | 6,601,448 | | | CNH | | | 43,922,154 | | | | 6,745,718 | | | | 08/26/16 | | | | (144,270 | ) |
| | USD | | | 3,217,619 | | | CNH | | | 21,736,424 | | | | 3,337,313 | | | | 09/01/16 | | | | (119,695 | ) |
| | USD | | | 1,141,000 | | | HKD | | | 8,852,232 | | | | 1,141,359 | | | | 04/26/16 | | | | (359 | ) |
| | USD | | | 1,190,331 | | | INR | | | 82,168,560 | | | | 1,239,251 | | | | 04/07/16 | | | | (48,920 | ) |
| | USD | | | 746,178 | | | MXN | | | 14,141,557 | | | | 815,312 | | | | 05/12/16 | | | | (69,135 | ) |
| | USD | | | 353,635 | | | MYR | | | 1,487,918 | | | | 381,698 | | | | 04/01/16 | | | | (28,064 | ) |
| | USD | | | 570,000 | | | SGD | | | 781,529 | | | | 579,768 | | | | 04/26/16 | | | | (9,768 | ) |
| | USD | | | 569,728 | | | TWD | | | 18,769,687 | | | | 583,911 | | | | 04/19/16 | | | | (14,183 | ) |
JPMorgan Chase Bank (London) | | IDR | | | 5,176,392,415 | | | USD | | | 393,942 | | | | 392,869 | | | | 04/25/16 | | | | (1,072 | ) |
| | NZD | | | 838,000 | | | USD | | | 578,459 | | | | 578,426 | | | | 04/26/16 | | | | (33 | ) |
| | USD | | | 4,839,256 | | | CNH | | | 31,638,085 | | | | 4,889,707 | | | | 04/26/16 | | | | (50,452 | ) |
| | USD | | | 7,681,180 | | | CNH | | | 50,161,945 | | | | 7,733,959 | | | | 06/14/16 | | | | (52,780 | ) |
| | USD | | | 1,392,938 | | | CNH | | | 9,523,514 | | | | 1,466,165 | | | | 07/11/16 | | | | (73,227 | ) |
| | USD | | | 939,427 | | | CNH | | | 6,413,936 | | | | 987,387 | | | | 07/12/16 | | | | (47,961 | ) |
| | USD | | | 1,368,000 | | | CNH | | | 9,065,075 | | | | 1,391,811 | | | | 09/01/16 | | | | (23,811 | ) |
| | USD | | | 2,122,000 | | | CNH | | | 13,973,537 | | | | 2,143,984 | | | | 09/14/16 | | | | (21,984 | ) |
| | USD | | | 1,388,290 | | | EUR | | | 1,234,000 | | | | 1,405,262 | | | | 04/26/16 | | | | (16,972 | ) |
| | USD | | | 184,296,758 | | | EUR | | | 164,235,403 | | | | 187,168,448 | | | | 05/19/16 | | | | (2,871,690 | ) |
| | USD | | | 659,343 | | | IDR | | | 8,778,496,422 | | | | 667,196 | | | | 04/11/16 | | | | (7,852 | ) |
| | USD | | | 570,000 | | | IDR | | | 7,595,991,000 | | | | 576,276 | | | | 04/29/16 | | | | (6,276 | ) |
| | USD | | | 310,886 | | | IDR | | | 4,141,003,972 | | | | 314,026 | | | | 05/02/16 | | | | (3,139 | ) |
| | USD | | | 551,000 | | | KRW | | | 664,979,860 | | | | 580,373 | | | | 04/08/16 | | | | (29,373 | ) |
| | USD | | | 3,877,454 | | | KRW | | | 4,655,077,000 | | | | 4,060,535 | | | | 04/29/16 | | | | (183,082 | ) |
| | USD | | | 1,107,000 | | | MXN | | | 19,723,418 | | | | 1,138,843 | | | | 04/26/16 | | | | (31,843 | ) |
| | USD | | | 563,000 | | | MYR | | | 2,257,686 | | | | 582,294 | | | | 04/25/16 | | | | (19,294 | ) |
| | USD | | | 356,811 | | | SEK | | | 2,969,128 | | | | 366,070 | | | | 04/26/16 | | | | (9,260 | ) |
| | USD | | | 484,583 | | | TWD | | | 16,165,705 | | | | 502,855 | | | | 04/12/16 | | | | (18,272 | ) |
Morgan Stanley & Co. International PLC | | USD | | | 2,977,890 | | | BRL | | | 11,086,422 | | | | 3,079,616 | | | | 04/04/16 | | | | (101,726 | ) |
| | USD | | | 474,157 | | | CZK | | | 11,729,150 | | | | 493,670 | | | | 04/20/16 | | | | (19,513 | ) |
| | USD | | | 1,113,000 | | | JPY | | | 125,629,875 | | | | 1,117,162 | | | | 04/26/16 | | | | (4,162 | ) |
| | |
| 80 | | The accompanying notes are an integral part of these financial statements. |
GOLDMAN SACHS GLOBAL INCOME FUND
|
| ADDITIONAL INVESTMENT INFORMATION (continued) |
FORWARD FOREIGN CURRENCY EXCHANGE CONTRACTS WITH UNREALIZED LOSS (continued)
| | | | | | | | | | | | | | | | | | | | | | | | |
| Counterparty | | Currency Purchased | | | Currency Sold | | | Current Value | | | Settlement Date | | | Unrealized Loss | |
Morgan Stanley & Co. International PLC (continued) | | USD | | | 554,000 | | | KRW | | | 659,814,000 | | | $ | 575,757 | | | | 04/15/16 | | | $ | (21,757 | ) |
| | USD | | | 563,000 | | | KRW | | | 652,798,500 | | | | 569,484 | | | | 04/25/16 | | | | (6,484 | ) |
| | USD | | | 788,770 | | | MXN | | | 14,260,961 | | | | 819,683 | | | | 06/16/16 | | | | (30,913 | ) |
| | USD | | | 213,000 | | | MYR | | | 893,535 | | | | 229,220 | | | | 04/01/16 | | | | (16,220 | ) |
| | USD | | | 1,105,343 | | | MYR | | | 4,470,121 | | | | 1,152,849 | | | | 04/20/16 | | | | (47,505 | ) |
| | USD | | | 564,755 | | | NZD | | | 842,000 | | | | 581,187 | | | | 04/26/16 | | | | (16,433 | ) |
| | USD | | | 570,000 | | | RUB | | | 42,251,564 | | | | 628,155 | | | | 04/04/16 | | | | (58,155 | ) |
| | USD | | | 226,000 | | | RUB | | | 15,357,062 | | | | 227,128 | | | | 04/22/16 | | | | (1,128 | ) |
| | USD | | | 551,000 | | | TWD | | | 18,048,446 | | | | 561,413 | | | | 04/11/16 | | | | (10,413 | ) |
Royal Bank of Canada | | CAD | | | 1,443,204 | | | USD | | | 1,112,000 | | | | 1,111,272 | | | | 04/26/16 | | | | (728 | ) |
| | GBP | | | 400,066 | | | EUR | | | 505,000 | | | | 574,640 | | | | 04/26/16 | | | | (447 | ) |
| | USD | | | 1,156,000 | | | BRL | | | 4,176,709 | | | | 1,160,218 | | | | 04/04/16 | | | | (4,218 | ) |
| | USD | | | 1,102,000 | | | CAD | | | 1,468,702 | | | | 1,130,905 | | | | 04/26/16 | | | | (28,905 | ) |
| | USD | | | 5,327,506 | | | EUR | | | 4,791,504 | | | | 5,456,497 | | | | 04/26/16 | | | | (128,991 | ) |
| | USD | | | 134,693,915 | | | JPY | | | 15,261,763,406 | | | | 135,751,187 | | | | 05/06/16 | | | | (1,057,272 | ) |
| | USD | | | 3,012,551 | | | MXN | | | 54,302,744 | | | | 3,131,357 | | | | 05/10/16 | | | | (118,806 | ) |
Royal Bank of Scotland PLC | | COP | | | 696,799,008 | | | USD | | | 232,000 | | | | 231,877 | | | | 05/04/16 | | | | (123 | ) |
| | EUR | | | 505,000 | | | PLN | | | 2,153,342 | | | | 575,087 | | | | 04/26/16 | | | | (1,780 | ) |
| | GBP | | | 795,675 | | | EUR | | | 1,008,000 | | | | 1,142,877 | | | | 04/26/16 | | | | (5,019 | ) |
| | MXN | | | 10,010,898 | | | USD | | | 579,000 | | | | 578,036 | | | | 04/26/16 | | | | (964 | ) |
| | USD | | | 31,231,768 | | | GBP | | | 21,832,000 | | | | 31,356,848 | | | | 04/07/16 | | | | (125,080 | ) |
| | USD | | | 1,135,000 | | | MXN | | | 19,782,111 | | | | 1,142,232 | | | | 04/26/16 | | | | (7,232 | ) |
| | USD | | | 2,714,970 | | | TRY | | | 8,035,210 | | | | 2,829,990 | | | | 04/26/16 | | | | (115,020 | ) |
Standard Chartered Bank | | USD | | | 2,332,000 | | | CNH | | | 15,415,686 | | | | 2,378,670 | | | | 05/31/16 | | | | (46,670 | ) |
| | USD | | | 5,050,138 | | | CNH | | | 33,488,981 | | | | 5,163,617 | | | | 06/13/16 | | | | (113,479 | ) |
| | USD | | | 949,130 | | | CNH | | | 6,466,423 | | | | 995,000 | | | | 07/21/16 | | | | (45,870 | ) |
| | USD | | | 948,118 | | | CNH | | | 6,410,935 | | | | 986,411 | | | | 07/22/16 | | | | (38,293 | ) |
| | USD | | | 415,000 | | | CNH | | | 2,764,523 | | | | 424,452 | | | | 09/01/16 | | | | (9,452 | ) |
| | USD | | | 456,000 | | | ZAR | | | 6,875,827 | | | | 463,351 | | | | 04/26/16 | | | | (7,351 | ) |
State Street Bank (London) | | EUR | | | 502,000 | | | SEK | | | 4,644,870 | | | | 571,670 | | | | 04/26/16 | | | | (1,006 | ) |
| | USD | | | 5,782,672 | | | AUD | | | 7,793,358 | | | | 5,966,850 | | | | 04/26/16 | | | | (184,178 | ) |
| | USD | | | 546,584 | | | CAD | | | 727,383 | | | | 560,088 | | | | 04/26/16 | | | | (13,504 | ) |
| | USD | | | 5,220,324 | | | CNH | | | 34,890,037 | | | | 5,379,644 | | | | 06/13/16 | | | | (159,319 | ) |
| | USD | | | 2,789,791 | | | CNH | | | 18,619,003 | | | | 2,870,675 | | | | 06/14/16 | | | | (80,883 | ) |
| | USD | | | 13,471,000 | | | CNH | | | 89,363,419 | | | | 13,714,751 | | | | 09/09/16 | | | | (243,751 | ) |
| | USD | | | 8,374,000 | | | CNH | | | 54,807,411 | | | | 8,409,197 | | | | 09/14/16 | | | | (35,197 | ) |
| | USD | | | 4,861,727 | | | CNH | | | 33,487,576 | | | | 5,130,763 | | | | 10/11/16 | | | | (269,036 | ) |
| | USD | | | 222,918 | | | EUR | | | 200,766 | | | | 228,629 | | | | 04/26/16 | | | | (5,711 | ) |
UBS AG (London) | | CHF | | | 548,259 | | | EUR | | | 502,924 | | | | 572,149 | | | | 06/15/16 | | | | (1,491 | ) |
| | EUR | | | 511,000 | | | PLN | | | 2,186,004 | | | | 581,920 | | | | 04/26/16 | | | | (3,697 | ) |
| | USD | | | 549,000 | | | BRL | | | 2,133,333 | | | | 592,603 | | | | 04/04/16 | | | | (43,603 | ) |
| | USD | | | 1,861,919 | | | CNH | | | 12,372,453 | | | | 1,907,690 | | | | 06/13/16 | | | | (45,771 | ) |
| | USD | | | 670,399 | | | DKK | | | 4,549,000 | | | | 695,046 | | | | 04/20/16 | | | | (24,647 | ) |
| | USD | | | 575,208 | | | EUR | | | 511,000 | | | | 581,920 | | | | 04/26/16 | | | | (6,711 | ) |
| | USD | | | 97,337 | | | KRW | | | 112,920,678 | | | | 98,554 | | | | 04/08/16 | | | | (1,216 | ) |
| | USD | | | 379,639 | | | SEK | | | 3,165,503 | | | | 390,282 | | | | 04/26/16 | | | | (10,643 | ) |
Westpac Banking Corp. | | USD | | | 932,901 | | | AUD | | | 1,227,760 | | | | 940,013 | | | | 04/26/16 | | | | (7,112 | ) |
| | USD | | | 2,737,852 | | | AUD | | | 3,656,758 | | | | 2,799,473 | | | | 04/28/16 | | | | (61,622 | ) |
| | USD | | | 1,312,000 | | | CNH | | | 8,750,744 | | | | 1,343,551 | | | | 09/01/16 | | | | (31,551 | ) |
| | USD | | | 557,138 | | | EUR | | | 491,000 | | | | 559,144 | | | | 04/26/16 | | | | (2,006 | ) |
| | |
| The accompanying notes are an integral part of these financial statements. | | 81 |
GOLDMAN SACHS GLOBAL INCOME FUND
Schedule of Investments (continued)
March 31, 2016
|
| ADDITIONAL INVESTMENT INFORMATION (continued) |
FORWARD FOREIGN CURRENCY EXCHANGE CONTRACTS WITH UNREALIZED LOSS (continued)
| | | | | | | | | | | | | | | | | | | | | | | | |
| Counterparty | | Currency Purchased | | | Currency Sold | | | Current Value | | | Settlement Date | | | Unrealized Loss | |
Westpac Banking Corp. (continued) | | USD | | | 573,080 | | | IDR | | | 7,610,506,000 | | | $ | 576,628 | | | | 04/04/16 | | | $ | (3,548 | ) |
| | USD | | | 461,237 | | | IDR | | | 6,237,310,000 | | | | 473,723 | | | | 04/18/16 | | | | (12,485 | ) |
| | USD | | | 1,202,222 | | | INR | | | 82,655,775 | | | | 1,246,599 | | | | 04/07/16 | | | | (44,377 | ) |
| | USD | | | 292,717 | | | MYR | | | 1,212,963 | | | | 312,791 | | | | 04/11/16 | | | | (20,074 | ) |
| | USD | | | 1,332,090 | | | MYR | | | 5,487,118 | | | | 1,415,133 | | | | 04/20/16 | | | | (83,046 | ) |
| | USD | | | 3,371,092 | | | NZD | | | 5,006,509 | | | | 3,455,723 | | | | 04/26/16 | | | | (84,635 | ) |
| | | USD | | | 1,107,892 | | | TWD | | | 36,289,000 | | | | 1,128,847 | | | | 04/14/16 | | | | (20,956 | ) |
| TOTAL | | | | | | | | | | | | | | | | | | | | | | $ | (10,928,897 | ) |
FUTURES CONTRACTS — At March 31, 2016, the Fund had the following futures contracts:
| | | | | | | | | | | | | | |
| Type | | Number of Contracts Long (Short) | | | Expiration Date | | Current Value | | | Unrealized Gain (Loss) | |
Australian 3 Year Government Bonds | | | 62 | | | June 2016 | | $ | 5,321,182 | | | $ | 24,139 | |
Australian 10 year Government Bonds | | | 95 | | | June 2016 | | | 9,536,361 | | | | 63,586 | |
Canada 10 Year Government Bonds | | | 3 | | | June 2016 | | | 325,882 | | | | (2,386 | ) |
Euro Buxl 30 Year Bonds | | | (8 | ) | | June 2016 | | | (1,534,253 | ) | | | (37,791 | ) |
Italian 10 Year Government Bonds | | | 47 | | | June 2016 | | | 7,520,539 | | | | 113,308 | |
Japan 10 Year Government Bond | | | 4 | | | June 2016 | | | 5,377,405 | | | | 3,895 | |
Ultra Long U.S. Treasury Bonds | | | (41 | ) | | June 2016 | | | (7,073,781 | ) | | | (35,620 | ) |
5 Year German Euro-Bobl | | | 37 | | | June 2016 | | | 5,519,610 | | | | (11,003 | ) |
10 Year German Euro-Bund | | | 5 | | | June 2016 | | | 929,209 | | | | 4,464 | |
10 Year U.K. Long Gilt | | | (16 | ) | | June 2016 | | | (2,785,634 | ) | | | (18,871 | ) |
2 Year U.S. Treasury Notes | | | 30 | | | June 2016 | | | 6,562,500 | | | | 1,356 | |
5 Year U.S. Treasury Notes | | | (10 | ) | | June 2016 | | | (1,211,641 | ) | | | (10,213 | ) |
10 Year U.S. Treasury Notes | | | (426 | ) | | June 2016 | | | (55,546,406 | ) | | | (161,778 | ) |
20 Year U.S. Treasury Bonds | | | (50 | ) | | June 2016 | | | (8,221,875 | ) | | | (31,089 | ) |
| TOTAL | | | $ | (98,003 | ) |
SWAP CONTRACTS — At March 31, 2016, the Fund had the following swap contracts:
CENTRALLY CLEARED INTEREST RATE SWAP CONTRACTS
| | | | | | | | | | | | | | | | |
| | | | | | Rates Exchanged | | Market Value | |
Notional
Amount
(000s) | | | Termination
Date | | Payments
Received | | Payments
Made | | Upfront Payments
Made (Received) | | | Unrealized
Gain (Loss) | |
| MXN | 47,600 | | | 11/07/16 | | 3.910% | | Mexico Interbank TIIE
28 Days | | $ | 7 | | | $ | (6,302 | ) |
| | 20,230 | | | 11/08/16 | | 3.920 | | Mexico Interbank TIIE
28 Days | | | 3 | | | | (2,626 | ) |
| | 40,930 | | | 11/09/16 | | 3.900 | | Mexico Interbank TIIE
28 Days | | | 6 | | | | (5,633 | ) |
| SEK | 175,080 | (a) | | 06/15/18 | | 0.050 | | 3 month STIBOR | | | 169,353 | | | | (14,402 | ) |
| GBP | 6,210 | (a) | | 06/15/18 | | 1.250 | | 6 month GBP | | | 64,118 | | | | 13,460 | |
| EUR | 9,020 | (a) | | 06/15/18 | | 6 month EURO | | 0.250% | | | (93,167 | ) | | | 10,448 | |
| | 17,530 | (a) | | 02/17/19 | | 6 month EURO | | 0.086 | | | 1,503 | | | | (11,765 | ) |
| | |
| 82 | | The accompanying notes are an integral part of these financial statements. |
GOLDMAN SACHS GLOBAL INCOME FUND
|
| ADDITIONAL INVESTMENT INFORMATION (continued) |
CENTRALLY CLEARED INTEREST RATE SWAP CONTRACTS (continued)
| | | | | | | | | | | | | | | | |
| | | | | | Rates Exchanged | | Market Value | |
Notional
Amount
(000s) | | | Termination
Date | | Payments
Received | | Payments
Made | | Upfront Payments
Made (Received) | | | Unrealized
Gain (Loss) | |
| GBP | 1,180 | (a) | | 06/15/19 | | 1.500% | | 6 month GBP | | $ | 36,330 | | | $ | (5,111 | ) |
| EUR | 7,050 | (a) | | 02/09/20 | | 6 month EURO | | 0.100% | | | (4,737 | ) | | | (8,265 | ) |
| | 20,050 | (a) | | 02/26/20 | | 0.050 | | 6 month EURO | | | 8,296 | | | | 2,141 | |
| GBP | 4,580 | (a) | | 02/16/21 | | 6 month GBP | | 1.160 | | | (9,443 | ) | | | 2,946 | |
| CHF | 2,460 | (a) | | 06/15/21 | | 0.500 | | 6 month CHFOR | | | 19,844 | | | | (13,261 | ) |
| EUR | 8,830 | (a) | | 06/15/21 | | 0.500 | | 6 month EURO | | | 238,850 | | | | (10,351 | ) |
| CAD | 64,600 | (a) | | 06/15/21 | | 1.000 | | 6 month CDOR | | | 2,686 | | | | 6,451 | |
| AUD | 6,440 | (a) | | 06/15/21 | | 2.500 | | 6 month AUDOR | | | 16,852 | | | | 21,402 | |
| $ | 30,720 | (a) | | 06/15/21 | | 3 month LIBOR | | 2.000 | | | (896,942 | ) | | | (261,279 | ) |
| SEK | 180,990 | (a) | | 06/15/21 | | 3 month STIBOR | | 0.500 | | | (162,754 | ) | | | 1,897 | |
| GBP | 2,910 | (a) | | 06/15/21 | | 6 month GBP | | 1.750 | | | (153,676 | ) | | | 6,310 | |
| | 4,330 | (a) | | 12/11/22 | | 6 month GBP | | 1.940 | | | (21,409 | ) | | | (176,013 | ) |
| EUR | 2,370 | (a) | | 02/09/23 | | 0.500 | | 6 month EURO | | | 2,801 | | | | 18,026 | |
| | 15,140 | (a) | | 06/15/23 | | 0.750 | | 6 month EURO | | | 498,737 | | | | 95,972 | |
| GBP | 800 | (a) | | 06/15/23 | | 2.000 | | 6 month GBP | | | 66,904 | | | | (5,557 | ) |
| JPY | 2,897,070 | (a) | | 06/15/23 | | 6 month JYOR | | 0.100 | | | (130,434 | ) | | | (7,303 | ) |
| GBP | 4,450 | (a) | | 02/16/25 | | 1.570 | | 6 month GBP | | | 26,452 | | | | 3,463 | |
| EUR | 3,930 | (a) | | 05/11/25 | | 1.567 | | 6 month EURO | | | 122,310 | | | | 33,705 | |
| | 28,940 | (a) | | 05/11/25 | | 1.568 | | 6 month EURO | | | (50,010 | ) | | | 1,198,881 | |
| | 7,740 | (a) | | 09/16/25 | | 2.000 | | 6 month EURO | | | 180,873 | | | | 281,308 | |
| GBP | 5,890 | (a) | | 09/16/25 | | 6 month GBP | | 2.750 | | | (714,160 | ) | | | 329,951 | |
| JPY | 3,033,920 | (a) | | 12/16/25 | | 6 month JYOR | | 1.000 | | | (1,011,218 | ) | | | 119,410 | |
| EUR | 21,230 | (a) | | 01/06/26 | | 1.550 | | 6 month EURO | | | 109,022 | | | | 535,868 | |
| AUD | 5,460 | (a) | | 03/24/26 | | 3.100 | | 6 month AUDOR | | | 17,666 | | | | 13,389 | |
| CHF | 2,250 | (a) | | 06/15/26 | | 0.100 | | 6 month CHFOR | | | 11,647 | | | | (2,139 | ) |
| EUR | 38,900 | (a) | | 06/15/26 | | 1.000 | | 6 month EURO | | | 1,902,828 | | | | (5,178 | ) |
| GBP | 2,580 | (a) | | 06/15/26 | | 2.000 | | 6 month GBP | | | 197,201 | | | | (3,058 | ) |
| $ | 10,820 | (a) | | 06/15/26 | | 3 month LIBOR | | 2.250 | | | (390,731 | ) | | | (188,674 | ) |
| NZD | 12,120 | (a) | | 06/15/26 | | 3 month NZDOR | | 3.000 | | | 92,227 | | | | (83,141 | ) |
| SEK | 59,580 | (a) | | 06/15/26 | | 3 month STIBOR | | 1.250 | | | (26,200 | ) | | | (13,450 | ) |
| AUD | 22,650 | (a) | | 06/15/26 | | 3.000 | | 6 month AUDOR | | | 460,548 | | | | 122,702 | |
| | 4,370 | (a) | | 06/16/26 | | 3.000 | | 6 month AUDOR | | | 68,350 | | | | 44,112 | |
| $ | 12,700 | (a) | | 12/15/26 | | 2.500 | | 3 month LIBOR | | | 120,403 | | | | 35,737 | |
| | 16,430 | (a) | | 12/15/26 | | 2.750 | | 3 month STIBOR | | | (1,125 | ) | | | 53,692 | |
| GBP | 7,600 | (a) | | 12/11/27 | | 2.190 | | 6 month GBP | | | 67,567 | | | | 477,976 | |
| EUR | 350 | (a) | | 06/15/31 | | 1.250 | | 6 month EURO | | | 17,530 | | | | 3,175 | |
| GBP | 3,870 | (a) | | 12/11/32 | | 6 month GBP | | 2.250 | | | (38,989 | ) | | | (316,970 | ) |
| | 1,280 | (a) | | 02/16/33 | | 6 month GBP | | 1.820 | | | (11,685 | ) | | | 4,347 | |
| EUR | 9,950 | (a) | | 05/11/35 | | 6 month EURO | | 1.695 | | | (104,323 | ) | | | (546,019 | ) |
| $ | 10,520 | (a) | | 12/17/35 | | 3.000 | | 3 month LIBOR | | | 409,388 | | | | 4,183 | |
| JPY | 1,339,240 | (a) | | 12/17/35 | | 6 month JYOR | | 2.000 | | | (1,170,978 | ) | | | (147,454 | ) |
| | 350,190 | (a) | | 03/30/36 | | 6 month JYOR | | 0.900 | | | (6,790 | ) | | | (4,408 | ) |
| | 142,000 | (a) | | 06/15/36 | | 6 month JYOR | | 0.500 | | | 1,270 | | | | 299 | |
| EUR | 3,400 | (a) | | 12/19/45 | | 1.250 | | 6 month EURO | | | (466 | ) | | | 43,743 | |
| $ | 10,600 | (a) | | 12/19/45 | | 2.750 | | 3 month LIBOR | | | 220,263 | | | | 165 | |
| JPY | 1,455,220 | (a) | | 12/19/45 | | 6 month JYOR | | 2.000 | | | (938,177 | ) | | | (407,092 | ) |
| GBP | 5,970 | (a) | | 01/05/46 | | 6 month GBP | | 2.250 | | | (215,049 | ) | | | (376,746 | ) |
| | |
| The accompanying notes are an integral part of these financial statements. | | 83 |
GOLDMAN SACHS GLOBAL INCOME FUND
Schedule of Investments (continued)
March 31, 2016
|
| ADDITIONAL INVESTMENT INFORMATION (continued) |
CENTRALLY CLEARED INTEREST RATE SWAP CONTRACTS (continued)
| | | | | | | | | | | | | | | | |
| | | | | | Rates Exchanged | | Market Value | |
Notional
Amount
(000s) | | | Termination
Date | | Payments
Received | | Payments
Made | | Upfront Payments
Made (Received) | | | Unrealized
Gain (Loss) | |
| EUR | 910 | (a) | | 06/15/46 | | 1.500% | | 6 month EURO | | $ | 104,120 | | | $ | 25,001 | |
| $ | 600 | (a) | | 06/15/46 | | 2.500 | | 3 month LIBOR | | | 46,991 | | | | 2,092 | |
| GBP | 7,540 | (a) | | 06/15/46 | | 6 month GBP | | 2.000% | | | (964,661 | ) | | | 37,119 | |
| | TOTAL | | | | | | | | | $ | (1,814,178 | ) | | $ | 927,174 | |
| | (a) | | Represents forward starting interest rate swaps whose effective dates of commencement of accruals and cash flows occur subsequent to March 31, 2016. |
OVER THE COUNTER CREDIT DEFAULT SWAP CONTRACTS
| | | | | | | | | | | | | | | | | | | | | | | | | | |
| | | | Market Value | |
| Counterparty | | Referenced
Obligation | | Notional
Amount
(000s) | | | Rates Received
(Paid) | | | Termination
Date | | | Credit
Spread at
March 31,
2016(b) | | | Upfront Payments
Made (Received) | | | Unrealized
Gain (Loss) | |
Protection Purchased: | | | | | | | | | | | | | | | | | | | | | | | | | | |
Citibank NA | | People’s Republic of China 7.500% 10/28/27 | | $ | 13,280 | | | | (1.000 | )% | | | 12/20/20 | | | | 1.128 | % | | $ | 95,057 | | | $ | (22,082 | ) |
Protection Sold: | | | | | | | | | | | | | | | | | | | | | | | | | | |
Bank of America Securities LLC | | CDX North America Investment Grade Index 16 | | | 5,400 | | | | 1.000 | | | | 06/20/16 | | | | 0.157 | | | | 338 | | | | 11,537 | |
Morgan Stanley & Co. International PLC | | CDX North America Investment Grade Index 16 | | | 2,650 | | | | 1.000 | | | | 06/20/16 | | | | 0.157 | | | | 158 | | | | 5,669 | |
| TOTAL | | | $ | 95,553 | | | $ | (4,876 | ) |
| | (b) | | Credit spread on the Referenced Obligation, together with the term of the swap contract, are indicators of payment/performance risk. The likelihood of a credit event occurring which would require a fund to make a payment or otherwise be required to perform under the swap contract is generally greater as the credit spread and the term of the swap contract increase. |
CENTRALLY CLEARED CREDIT DEFAULT SWAP CONTRACTS
| | | | | | | | | | | | | | | | | | | | | | |
| | | | Market Value | |
| Referenced Obligation | | Notional
Amount
(000s) | | Rates Received
(Paid) | | | Termination
Date | | | Credit
Spread at
March 31,
2016(b) | | | Upfront Payments
Made (Received) | | | Unrealized
Gain (Loss) | |
Protection Sold: | | | | | | | | | | | | | | | | | | | | | | |
iTraxx Europe Series 24 | | $45,700 | | | 1.000 | % | | | 12/20/20 | | | | 0.730 | % | | $ | 696,419 | | | $ | (24,415 | ) |
CDX North America Investment Grade Index 26 | | 27,950 | | | 1.000 | | | | 06/20/21 | | | | 0.796 | | | | 284,306 | | | | 7,634 | |
| TOTAL | | | $ | 980,725 | | | $ | (16,781 | ) |
| | (b) | | Credit spread on the Referenced Obligation, together with the term of the swap contract, are indicators of payment/performance risk. The likelihood of a credit event occurring which would require a fund to make a payment or otherwise be required to perform under the swap contract is generally greater as the credit spread and the term of the swap contract increase. |
| | |
| 84 | | The accompanying notes are an integral part of these financial statements. |
GOLDMAN SACHS GLOBAL INCOME FUND
|
| ADDITIONAL INVESTMENT INFORMATION (continued) |
WRITTEN OPTIONS CONTRACTS — For the fiscal year ended March 31, 2016 the Fund had following written options:
WRITTEN CURRENCY OPTION CONTRACTS
| | | | | | | | | | | | | | |
| Counterparty | | Description | | Notional
Amount
(000s) | | | Expiration
Date | | Exercise
Price | | Value | |
Citibank NA | | Call USD/Put CNH | | $ | 2,216 | | | 01/25/17 | | 7.550% | | $ | (13,571 | ) |
(Premium received $44,808) | | | | | | | | | | | | | | |
For the fiscal year ended March 31, 2016, the Fund had the following currency options activities:
CURRENCY OPTION CONTRACTS
| | | | | | | | |
| | | Notional
Amount
(000s) | | | Premiums Received | |
Contracts Outstanding March 31, 2015 | | $ | — | | | $ | — | |
Contracts Written | | | 18,383 | | | | 119,321 | |
Contracts Expired | | | (16,167 | ) | | | (74,513 | ) |
Contracts Outstanding March 31, 2016 | | $ | 2,216 | | | $ | 44,808 | |
| | |
| The accompanying notes are an integral part of these financial statements. | | 85 |
GOLDMAN SACHS STRATEGIC INCOME FUND
Schedule of Investments
March 31, 2016
| | | | | | | | | | | | | | |
Principal Amount | | | Interest Rate | | | Maturity Date | | | Value | |
| | | | | | | | | | | | | | |
| | Corporate Obligations – 9.4% | |
| | Airlines(a)(b) – 0.2% | | | | | |
| | Air Canada | | | | | | | | | | | | | |
| $ | 24,840,000 | | | | 6.750 | % | | | 10/01/19 | | | $ | 25,585,200 | |
| | |
| | Automotive – 0.0% | | | | | |
| General Motors Co. | | | | | |
| | 2,200,000 | | | | 3.500 | | | | 10/02/18 | | | | 2,242,940 | |
| | |
| | Banks – 2.5% | | | | | | | | | | | | | |
| American Express Co.(a)(c) | | | | | | | | | |
| | 10,415,000 | | | | 6.800 | | | | 09/01/66 | | | | 10,388,963 | |
| Banco Nacional de Costa Rica | | | | | |
| | 3,100,000 | | | | 6.250 | (b) | | | 11/01/23 | | | | 3,038,000 | |
| | 2,810,000 | | | | 6.250 | | | | 11/01/23 | | | | 2,753,800 | |
| Bank of America Corp. | | | | | |
| | 36,375,000 | | | | 4.000 | | | | 01/22/25 | | | | 36,229,069 | |
| Intesa Sanpaolo SpA(b) | | | | | |
| | 33,975,000 | | | | 5.017 | | | | 06/26/24 | | | | 31,861,313 | |
| JPMorgan Chase & Co. | | | | | |
| | 14,825,000 | | | | 3.875 | | | | 09/10/24 | | | | 15,136,632 | |
| | 12,575,000 | | | | 3.125 | (a) | | | 01/23/25 | | | | 12,566,014 | |
| | 16,075,000 | | | | 5.300 | (a)(c) | | | 05/01/49 | | | | 16,115,188 | |
| Lloyds Bank PLC(a)(c) | | | | | |
| | 17,730,000 | | | | 9.875 | | | | 12/16/21 | | | | 18,653,024 | |
| GBP | 16,268,000 | | | | 10.750 | | | | 12/16/21 | | | | 24,669,762 | |
| Morgan Stanley, Inc. | | | | | |
| $ | 13,125,000 | | | | 4.000 | | | | 07/23/25 | | | | 13,712,252 | |
| | 35,950,000 | | | | 3.950 | | | | 04/23/27 | | | | 35,682,010 | |
| PNC Preferred Funding Trust II(a)(b)(c) | | | | | |
| | 60,900,000 | | | | 1.856 | | | | 03/29/49 | | | | 51,156,000 | |
| Royal Bank of Scotland PLC(a)(c) | | | | | |
| | 45,465,000 | | | | 9.500 | | | | 03/16/22 | | | | 48,192,900 | |
| Santander UK PLC(b) | | | | | |
| | 25,720,000 | | | | 5.000 | | | | 11/07/23 | | | | 26,103,382 | |
| | | | | | | | | | | | | | |
| | | | | | | | | | | | | 346,258,309 | |
| | |
| | Consumer Cyclical Services(a)(b) – 0.0% | |
| | First Data Corp. | | | | | | | | | | | | | |
| | 300,000 | | | | 5.750 | | | | 01/15/24 | | | | 300,000 | |
| | |
| | Electric(a)(c) – 0.5% | | | | | |
| EDP – Energias de Portugal SA | | | | | |
| EUR | 16,700,000 | | | | 5.375 | | | | 09/16/75 | | | | 18,582,392 | |
| Electricite de France SA | | | | | |
| | 5,100,000 | | | | 4.125 | | | | 01/22/49 | | | | 5,532,566 | |
| | 3,100,000 | | | | 4.250 | | | | 01/29/49 | | | | 3,502,091 | |
| | RWE AG | | | | | | | | | | | | | |
| $ | 36,250,000 | | | | 7.000 | | | | 10/12/72 | | | | 35,737,062 | |
| | | | | | | | | | | | | | |
| | | | | | | | | | | | | 63,354,111 | |
| | |
| | Energy – 0.5% | | | | | | | | | | | | | |
| Petroleos de Venezuela SA | | | | | |
| | 76,870,000 | | | | 6.000 | | | | 05/16/24 | | | | 23,868,135 | |
| | 68,160,000 | | | | 6.000 | | | | 11/15/26 | | | | 21,027,360 | |
| | 7,040,000 | | | | 5.375 | | | | 04/12/27 | | | | 2,225,696 | |
| | 2,650,000 | | | | 5.500 | | | | 04/12/37 | | | | 841,375 | |
| | TOTAL SA(a)(c) | | | | | | | | | | | | | |
| EUR | 20,575,000 | | | | 2.625 | | | | 02/26/49 | | | | 21,300,501 | |
| | | | | | | | | | | | | | |
| | | | | | | | | | | | | 69,263,067 | |
| | |
| | | | | | | | | | | | | | |
| Corporate Obligations – (continued) | |
| | Energy – Exploration & Production – 0.4% | | | | | |
| Antero Resources Corp.(a) | | | | | |
| $ | 14,050,000 | | | | 5.625 | % | | | 06/01/23 | | | $ | 12,855,750 | |
| Laredo Petroleum, Inc.(a) | | | | | |
| | 11,925,000 | | | | 5.625 | | | | 01/15/22 | | | | 9,987,187 | |
| MEG Energy Corp.(a)(b) | | | | | |
| | 24,995,000 | | | | 6.375 | | | | 01/30/23 | | | | 14,747,050 | |
| | SM Energy Co.(a) | | | | | | | | | | | | | |
| | 9,625,000 | | | | 5.000 | | | | 01/15/24 | | | | 6,641,250 | |
| Whiting Petroleum Corp. | | | | | |
| | 8,900,000 | | | | 1.250 | (b) | | | 04/01/20 | | | | 5,178,688 | |
| | 9,800,000 | | | | 5.750 | (a) | | | 03/15/21 | | | | 6,517,000 | |
| | 50,000 | | | | 6.250 | (a) | | | 04/01/23 | | | | 33,625 | |
| | | | | | | | | | | | | | |
| | | | | | | | | | | | | 55,960,550 | |
| | |
| | Food & Beverage(a) – 0.6% | | | | | |
| Anheuser-Busch InBev Finance, Inc. | | | | | |
| | 22,875,000 | | | | 3.650 | | | | 02/01/26 | | | | 24,039,010 | |
| | 5,975,000 | | | | 4.700 | | | | 02/01/36 | | | | 6,466,652 | |
| | 22,300,000 | | | | 4.900 | | | | 02/01/46 | | | | 24,997,842 | |
| Bumble Bee Holding, Inc.(b) | | | | | |
| | 3,166,000 | | | | 9.000 | | | | 12/15/17 | | | | 3,173,915 | |
| | Sysco Corp. | | | | | | | | | | | | | |
| | 18,813,000 | | | | 4.850 | | | | 10/01/45 | | | | 20,192,168 | |
| | | | | | | | | | | | | | |
| | | | | | | | | | | | | 78,869,587 | |
| | |
| | Gaming – 0.4% | | | | | | | | | | | | | |
| MGM Resorts International | | | | | |
| | 21,900,000 | | | | 7.500 | | | | 06/01/16 | | | | 21,900,000 | |
| | 25,800,000 | | | | 10.000 | | | | 11/01/16 | | | | 26,961,000 | |
| | 5,000,000 | | | | 8.625 | | | | 02/01/19 | | | | 5,687,500 | |
| | | | | | | | | | | | | | |
| | | | | | | | | | | | | 54,548,500 | |
| | |
| | Media – Cable – 0.5% | | | | | |
| CCO Holdings LLC/CCO Holdings Capital Corp.(a) | |
| | 6,129,000 | | | | 7.000 | | | | 01/15/19 | | | | 6,257,709 | |
| CCO Safari II LLC(a)(b) | | | | | |
| | 14,650,000 | | | | 3.579 | | | | 07/23/20 | | | | 14,921,788 | |
| | 14,525,000 | | | | 4.908 | | | | 07/23/25 | | | | 15,356,037 | |
| | 16,500,000 | | | | 6.484 | | | | 10/23/45 | | | | 18,375,844 | |
| Time Warner Cable, Inc. | | | | | |
| | 19,754,000 | | | | 5.850 | | | | 05/01/17 | | | | 20,567,171 | |
| | | | | | | | | | | | | | |
| | | | | | | | | | | | | 75,478,549 | |
| | |
| | Media – Non Cable(a) – 0.3% | | | | | |
| Grupo Televisa SAB | | | | | |
| | 3,400,000 | | | | 4.625 | | | | 01/30/26 | | | | 3,518,286 | |
| | 14,310,000 | | | | 6.125 | | | | 01/31/46 | | | | 15,054,406 | |
| Univision Communications, Inc.(b) | | | | | |
| | 16,087,000 | | | | 8.500 | | | | 05/15/21 | | | | 16,408,740 | |
| | | | | | | | | | | | | | |
| | | | | | | | | | | | | 34,981,432 | |
| | |
| | Noncaptive – Financial – 0.1% | | | | | |
| CIBanco SA Institucion de Banca Multiple(a)(b)(d) | |
| | 1,514,838 | | | | 9.625 | | | | 05/02/21 | | | | 45,445 | |
| General Electric Co. | | | | | |
| MXN | 110,000,000 | | | | 8.500 | | | | 04/06/18 | | | | 6,807,373 | |
| | |
| | |
| 86 | | The accompanying notes are an integral part of these financial statements. |
GOLDMAN SACHS STRATEGIC INCOME FUND
| | | | | | | | | | | | | | |
Principal Amount | | | Interest Rate | | | Maturity Date | | | Value | |
| | | | | | | | | | | | | | |
| Corporate Obligations – (continued) | |
| | Noncaptive – Financial – (continued) | | | | | |
| Speedy Cash Intermediate Holdings Corp.(a)(b) | |
| $ | 17,625,000 | | | | 10.750 | % | | | 05/15/18 | | | $ | 10,486,875 | |
| | | | | | | | | | | | | | |
| | | | | | | | | | | | | 17,339,693 | |
| | |
| | Packaging(a) – 0.2% | | | | | |
| Ardagh Packaging Finance PLC | | | | | |
| | 2,239,000 | | | | 9.125 | (b) | | | 10/15/20 | | | | 2,306,170 | |
| EUR | 19,775,000 | | | | 9.250 | | | | 10/15/20 | | | | 23,514,557 | |
| | | | | | | | | | | | | | |
| | | | | | | | | | | | | 25,820,727 | |
| | |
| | Pharmaceuticals(a) – 0.7% | | | | | |
| Actavis Funding SCS | | | | | |
| $ | 56,620,000 | | | | 3.800 | | | | 03/15/25 | | | | 58,817,671 | |
| | 4,825,000 | | | | 4.750 | | | | 03/15/45 | | | | 5,081,234 | |
| Bayer AG(c) | | | | | |
| EUR | 12,150,000 | | | | 2.375 | | | | 04/02/75 | | | | 13,376,845 | |
| | Celgene Corp. | | | | | | | | | | | | | |
| $ | 4,450,000 | | | | 5.000 | | | | 08/15/45 | | | | 4,799,777 | |
| | Merck KGaA(c) | | | | | | | | | | | | | |
| EUR | 11,950,000 | | | | 2.625 | | | | 12/12/74 | | | | 13,645,495 | |
| | | | | | | | | | | | | | |
| | | | | | | | | | | | | 95,721,022 | |
| | |
| | Pipelines(a)(c) – 0.3% | | | | | | | | | | | | | |
| Enterprise Products Operating LLC | | | | | |
| $ | 42,850,000 | | | | 8.375 | | | | 08/01/66 | | | | 33,851,500 | |
| | 1,850,000 | | | | 7.000 | | | | 06/01/67 | | | | 1,308,875 | |
| | 5,900,000 | | | | 7.034 | | | | 01/15/68 | | | | 5,855,750 | |
| | | | | | | | | | | | | | |
| | | | | | | | | | | | | 41,016,125 | |
| | |
| | Property/Casualty Insurance(a)(c) – 0.2% | | | | | |
| ING Capital Funding Trust III | | | | | |
| | 12,250,000 | | | | 4.231 | | | | 12/29/49 | | | | 11,913,125 | |
| | The Chubb Corp. | | | | | | | | | | | | | |
| | 11,794,000 | | | | 6.375 | | | | 03/29/67 | | | | 10,201,810 | |
| | | | | | | | | | | | | | |
| | | | | | | | | | | | | 22,114,935 | |
| | |
| | Real Estate Investment Trusts(b) – 0.1% | | | | | |
| | Trust F/1401 | | | | | | | | | | | | | |
| | 18,700,000 | | | | 5.250 | (a) | | | 12/15/24 | | | | 19,027,250 | |
| | 300,000 | | | | 6.950 | | | | 01/30/44 | | | | 291,000 | |
| | | | | | | | | | | | | | |
| | | | | | | | | | | | | 19,318,250 | |
| | |
| | Retailers(a) – 0.3% | | | | | | | | | | | | | |
| | Amazon.com, Inc. | | | | | | | | | | | | | |
| | 37,300,000 | | | | 4.950 | | | | 12/05/44 | | | | 42,770,703 | |
| | |
| | Retailers – Food & Drug(a) – 0.4% | | | | | |
| BI-LO LLC/BI-LO Finance Corp.(b)(e) | | | | | |
| | 11,205,000 | | | | 8.625 | | | | 09/15/18 | | | | 8,515,800 | |
| | CVS Health Corp. | | | | | | | | | | | | | |
| | 25,000 | | | | 3.875 | | | | 07/20/25 | | | | 26,962 | |
| | 38,500,000 | | | | 5.125 | | | | 07/20/45 | | | | 44,699,674 | |
| | | | | | | | | | | | | | |
| | | | | | | | | | | | | 53,242,436 | |
| | |
| | Telecommunications – Cellular – 0.1% | | | | | |
| America Movil SAB de CV | | | | | |
| MXN | 256,740,000 | | | | 6.000 | | | | 06/09/19 | | | | 14,664,011 | |
| | |
| | | | | | | | | | | | | | |
| | Corporate Obligations – (continued) | |
| | Tobacco(a) – 0.6% | | | | | |
| Reynolds American, Inc. | |
| $ | 12,425,000 | | | | 4.450 | % | | | 06/12/25 | | | $ | 13,671,745 | |
| | 53,869,000 | | | | 5.850 | | | | 08/15/45 | | | | 65,754,218 | |
| | | | | | | | | | | | | | |
| | | | | | | | | | | | | 79,425,963 | |
| | |
| | Wireless Telecommunications – 0.2% | | | | | |
| Intelsat Jackson Holdings SA(a) | |
| | 18,150,000 | | | | 5.500 | | | | 08/01/23 | | | | 10,980,750 | |
| Sprint Capital Corp. | | | | | |
| | 175,000 | | | | 6.875 | | | | 11/15/28 | | | | 127,750 | |
| Sprint Communications, Inc. | | | | | |
| | 100,000 | | | | 7.000 | | | | 08/15/20 | | | | 79,250 | |
| | Sprint Corp. | | | | | | | | | | | | | |
| | 23,175,000 | | | | 7.125 | | | | 06/15/24 | | | | 17,381,250 | |
| | | | | | | | | | | | | | |
| | | | | | | | | | | | | 28,569,000 | |
| | |
| | Wirelines Telecommunications – 0.3% | | | | | |
| Verizon Communications, Inc. | | | | | |
| | 20,800,000 | | | | 5.150 | | | | 09/15/23 | | | | 24,001,698 | |
| | 19,650,000 | | | | 4.862 | | | | 08/21/46 | | | | 20,820,669 | |
| | | | | | | | | | | | | | |
| | | | | | | | | | | | | 44,822,367 | |
| | |
| | TOTAL CORPORATE OBLIGATIONS | | | | | |
| | (Cost $1,347,380,897) | | | | | | | $ | 1,291,667,477 | |
| | |
| | | | | | | | | | | | | | |
| Mortgage-Backed Obligations – 16.0% | |
| | Adjustable Rate Non-Agency(c) – 4.7% | |
| Aire Valley Mortgages PLC Series 2005-1X, Class 2A1 | |
| GBP | 1,525,017 | | | | 0.948 | % | | | 09/20/66 | | | $ | 2,132,075 | |
| Aire Valley Mortgages PLC Series 2005-1X, Class 2A3 | |
| $ | 3,761,708 | | | | 0.963 | | | | 09/20/66 | | | | 3,639,152 | |
| Aire Valley Mortgages PLC Series 2006-1A, Class 1A(b) | |
| | 31,355,087 | | | | 0.843 | | | | 09/20/66 | | | | 30,202,443 | |
| Aire Valley Mortgages PLC Series 2006-1X, Class 2A2 | |
| GBP | 11,077,287 | | | | 0.888 | | | | 09/20/66 | | | | 15,453,613 | |
| Aire Valley Mortgages PLC Series 2007-1A, Class 2A1(b) | |
| $ | 27,969,102 | | | | 0.863 | | | | 09/20/66 | | | | 26,960,396 | |
| Aire Valley Mortgages PLC Series 2007-1X, Class 2A2 | |
| EUR | 8,762,526 | | | | 0.026 | | | | 09/20/66 | | | | 9,679,777 | |
| American Home Mortgage Assets Trust Series 2006-2, Class 2A1 | |
| $ | 10,379,273 | | | | 0.626 | | | | 09/25/46 | | | | 7,344,191 | |
| American Home Mortgage Assets Trust Series 2006-6, Class A1A | |
| | 5,916,744 | | | | 0.626 | | | | 12/25/46 | | | | 3,687,673 | |
| American Home Mortgage Investment Trust Series 2005-3,
Class 2A4 |
|
| | 6,100,000 | | | | 2.506 | | | | 09/25/35 | | | | 3,613,626 | |
| American Home Mortgage Investment Trust Series 2006-3,
Class 11A1 |
|
| | 174,876 | | | | 0.616 | | | | 12/25/46 | | | | 137,600 | |
| American Home Mortgage Investment Trust Series 2007-2,
Class 11A1 |
|
| | 4,942,377 | | | | 0.666 | | | | 03/25/47 | | | | 2,635,394 | |
| Banc of America Funding Corp. Series 2006-H, Class 6A1 | |
| | 26,101,705 | | | | 0.622 | | | | 10/20/36 | | | | 20,078,567 | |
| | |
| | |
| The accompanying notes are an integral part of these financial statements. | | 87 |
GOLDMAN SACHS STRATEGIC INCOME FUND
Schedule of Investments (continued)
March 31, 2016
| | | | | | | | | | | | | | |
Principal Amount | | | Interest Rate | | | Maturity Date | | | Value | |
| | | | | | | | | | | | | | |
| Mortgage-Backed Obligations – (continued) | |
| | Adjustable Rate Non-Agency(c) – (continued) | |
| Bear Stearns Mortgage Funding Trust Series 2007-AR4,
Class 1A1 |
|
| $ | 4,302,900 | | | | 0.636 | % | | | 09/25/47 | | | $ | 3,341,615 | |
| Chevy Chase Funding LLC Mortgage-Backed Certificates
Series 2005-4A, Class A1(b) |
|
| | 6,211,923 | | | | 0.636 | | | | 10/25/36 | | | | 4,783,181 | |
| Chevy Chase Funding LLC Mortgage-Backed Certificates
Series 2006-1A, Class A1(b) |
|
| | 32,009,519 | | | | 0.583 | | | | 12/25/46 | | | | 24,055,154 | |
| Chevy Chase Funding LLC Mortgage-Backed Certificates
Series 2006-2A, Class A1(b) |
|
| | 20,240,522 | | | | 0.563 | | | | 04/25/47 | | | | 14,042,874 | |
| Chevy Chase Funding LLC Mortgage-Backed Certificates
Series 2006-3A, Class A1(b) |
|
| | 16,557,488 | | | | 0.563 | | | | 08/25/47 | | | | 11,681,308 | |
| Citigroup Mortgage Loan Trust, Inc. Series 2006-AR7,
Class 2A2A |
|
| | 5,223,068 | | | | 2.852 | | | | 11/25/36 | | | | 4,402,084 | |
| Countrywide Alternative Loan Trust Series 2005-16, Class A1 | |
| | 5,187,080 | | | | 1.967 | | | | 06/25/35 | | | | 4,407,684 | |
| Countrywide Alternative Loan Trust Series 2005-9CB, Class 1A5 | |
| | 1,060,150 | | | | 0.936 | | | | 05/25/35 | | | | 865,134 | |
| Countrywide Alternative Loan Trust Series 2006-0C8,
Class 2A2B |
|
| | 3,706,970 | | | | 0.606 | | | | 11/25/36 | | | | 3,650,700 | |
| Countrywide Alternative Loan Trust Series 2006-OA1, Class 2A1 | |
| | 394,433 | | | | 0.642 | | | | 03/20/46 | | | | 284,110 | |
| Countrywide Alternative Loan Trust Series 2007-19, Class 1A11 | |
| | 12,143,102 | | | | 0.936 | | | | 08/25/37 | | | | 7,674,461 | |
| Countrywide Alternative Loan Trust Series 2007-HY6, Class A1 | |
| | 6,260,254 | | | | 0.646 | | | | 08/25/47 | | | | 5,197,264 | |
| Countrywide Alternative Loan Trust Series 2007-OA11,
Class A1A |
|
| | 29,972,815 | | | | 1.702 | | | | 11/25/47 | | | | 21,816,609 | |
| Countrywide Home Loans Mortgage Pass-Through Trust
Series 2005-3, Class 1A1 |
|
| | 7,964,409 | | | | 0.746 | | | | 04/25/35 | | | | 5,998,950 | |
| Credit Suisse European Mortgage Capital Ltd.
Series 2015-1HWA, Class A(b) |
|
| EUR | 54,884,118 | | | | 2.750 | | | | 04/20/20 | | | | 61,203,575 | |
| Deutsche Alt-A Securities Mortgage Loan Trust
Series 2007-OA5, Class A1A |
|
| $ | 3,501,442 | | | | 0.633 | | | | 08/25/47 | | | | 2,799,004 | |
| Deutsche Alt-A Securities Mortgage Loan Trust
Series 2007-OA5, Class A1B |
|
| | 4,369,800 | | | | 0.653 | | | | 08/25/47 | | | | 3,557,452 | |
| Downey Savings & Loan Association Mortgage Trust
Series 2005-AR5, Class 2A1A |
|
| | 10,964,671 | | | | 0.760 | | | | 09/19/45 | | | | 7,644,322 | |
| GreenPoint Mortgage Funding Trust Series 2006-OH1, Class A1 | |
| | 1,757,778 | | | | 0.616 | | | | 01/25/37 | | | | 1,370,998 | |
| HarborView Mortgage Loan Trust Series 2006-11, Class A1A | |
| | 6,682,408 | | | | 0.600 | | | | 12/19/36 | | | | 4,800,598 | |
| HomeBanc Mortgage Trust Series 2006-1, Class 3A2 | |
| | 3,061,475 | | | | 2.441 | | | | 04/25/37 | | | | 1,849,866 | |
| | |
| | | | | | | | | | | | | | |
| Mortgage-Backed Obligations – (continued) | |
| | Adjustable Rate Non-Agency(c) – (continued) | |
| Impac Secured Assets Trust Series 2006-5, Class 1A1B | |
| $ | 25,495,515 | | | | 0.636 | % | | | 02/25/37 | | | $ | 21,247,534 | |
| Indymac Index Mortgage Loan Trust Series 2005-AR10, Class A1 | |
| | 5,516,977 | | | | 0.696 | | | | 06/25/35 | | | | 4,721,707 | |
| Indymac Index Mortgage Loan Trust Series 2005-AR13,
Class 4A1 |
|
| | 1,052,197 | | | | 2.587 | | | | 08/25/35 | | | | 881,877 | |
| Indymac Index Mortgage Loan Trust Series 2005-AR23,
Class 6A1 |
|
| | 3,765,920 | | | | 2.826 | | | | 11/25/35 | | | | 3,009,521 | |
| Indymac Index Mortgage Loan Trust Series 2006-AR41, Class A3 | |
| | 8,021,719 | | | | 0.616 | | | | 02/25/37 | | | | 5,722,729 | |
| Indymac Index Mortgage Loan Trust Series 2007-AR1, Class 1A1 | |
| | 7,685,521 | | | | 3.123 | | | | 03/25/37 | | | | 6,896,623 | |
| Indymac Index Mortgage Loan Trust Series 2007-FLX4,
Class 2A1 |
|
| | 8,009,305 | | | | 0.613 | | | | 07/25/37 | | | | 6,551,342 | |
| JPMorgan Alternative Loan Trust Series 2006-A2, Class 2A2 | |
| | 7,698,505 | | | | 2.835 | | | | 05/25/36 | | | | 6,156,982 | |
| JPMorgan Alternative Loan Trust Series 2006-A5, Class 1A1 | |
| | 7,567,750 | | | | 0.596 | | | | 10/25/36 | | | | 6,065,879 | |
| Leek Finance Number Eighteen PLC Series 2018X, Class A2C | |
| EUR | 8,910,460 | | | | 0.127 | | | | 09/21/38 | | | | 10,704,111 | |
| Leek Finance Number Seventeen PLC Series 2017A, Class A2B(b) | |
| $ | 5,737,820 | | | | 0.850 | | | | 12/21/37 | | | | 6,152,345 | |
| Lehman XS Trust Series 2005-5N, Class 1A1 | |
| | 19,495,576 | | | | 0.736 | | | | 11/25/35 | | | | 16,229,748 | |
| Lehman XS Trust Series 2005-7N, Class 1A1A | |
| | 10,738,258 | | | | 0.705 | | | | 12/25/35 | | | | 9,043,872 | |
| Lehman XS Trust Series 2005-9N, Class 1A1 | |
| | 5,157,347 | | | | 0.706 | | | | 02/25/36 | | | | 3,960,110 | |
| Lehman XS Trust Series 2006-GP1, Class A2A | |
| | 12 | | | | 0.606 | | | | 05/25/46 | | | | 12 | |
| Lehman XS Trust Series 2007-12N, Class 2A1 | |
| | 4,672,108 | | | | 0.613 | | | | 07/25/37 | | | | 3,185,629 | |
| Lehman XS Trust Series 2007-16N, Class 2A2 | |
| | 13,206,183 | | | | 1.283 | | | | 09/25/47 | | | | 10,204,230 | |
| Lehman XS Trust Series 2007-4N, Class 3A2A | |
| | 5,988,150 | | | | 1.072 | | | | 03/25/47 | | | | 4,703,089 | |
| Lehman XS Trust Series 2007-5H, Class 3A4 | |
| | 7,872,861 | | | | 2.835 | | | | 05/25/37 | | | | 5,326,710 | |
| Lehman XS Trust Series Series 2006-14N, Class 1A1A | |
| | 15,578,323 | | | | 0.626 | | | | 09/25/46 | | | | 12,556,100 | |
| LSTAR Securities Investment Trust Series 2014-2, Class A(b) | |
| | 21,227,579 | | | | 2.439 | | | | 12/01/21 | | | | 20,866,604 | |
| LSTAR Securities Investment Trust Series 2015-3, Class A(b) | |
| | 14,881,719 | | | | 2.439 | | | | 03/01/20 | | | | 14,539,882 | |
| Luminent Mortgage Trust Series 2007-2, Class 2A1 | |
| | 1,742,169 | | | | 0.666 | | | | 05/25/37 | | | | 1,227,620 | |
| Master Adjustable Rate Mortgages Trust Series 2006-OA2,
Class 1A1 |
|
| | 9,416,275 | | | | 1.122 | | | | 12/25/46 | | | | 6,868,012 | |
| Master Adjustable Rate Mortgages Trust Series 2006-OA2,
Class 4A1A |
|
| | 3,718,224 | | | | 1.172 | | | | 12/25/46 | | | | 2,718,861 | |
| | |
| | |
| 88 | | The accompanying notes are an integral part of these financial statements. |
GOLDMAN SACHS STRATEGIC INCOME FUND
| | | | | | | | | | | | | | |
Principal Amount | | | Interest Rate | | | Maturity Date | | | Value | |
| | | | | | | | | | | | | | |
| Mortgage-Backed Obligations – (continued) | |
| | Adjustable Rate Non-Agency(c) – (continued) | |
| Master Adjustable Rate Mortgages Trust Series 2007-2, Class A1 | |
| $ | 4,409,612 | | | | 0.586 | % | | | 03/25/47 | | | $ | 3,552,986 | |
| Master Adjustable Rate Mortgages Trust Series 2007-3,
Class 12A1 |
|
| | 1,898,260 | | | | 0.633 | | | | 05/25/47 | | | | 1,448,338 | |
| Master Adjustable Rate Mortgages Trust Series 2007-HF2,
Class A1 |
|
| | 6,623,879 | | | | 0.746 | | | | 09/25/37 | | | | 5,949,617 | |
| Morgan Stanley Mortgage Loan Trust Series 2005-6AR,
Class 1A3 |
|
| | 1,241,280 | | | | 0.846 | | | | 11/25/35 | | | | 1,111,072 | |
| Nomura Asset Acceptance Corp. Alternative Loan Trust
Series 2006-AR4, Class A4A |
|
| | 2,661,820 | | | | 0.676 | | | | 12/25/36 | | | | 1,987,685 | |
| Residential Accredit Loans, Inc. Series 2005-Q05, Class A1 | |
| | 5,921,941 | | | | 1.322 | | | | 01/25/46 | | | | 3,997,985 | |
| Residential Accredit Loans, Inc. Series 2005-QA12, Class CB3 | |
| | 6,945,026 | | | | 3.740 | | | | 12/25/35 | | | | 5,532,660 | |
| Residential Accredit Loans, Inc. Series 2006-QA10, Class A1 | |
| | 12,768,283 | | | | 0.621 | | | | 12/25/36 | | | | 9,527,219 | |
| Residential Accredit Loans, Inc. Series 2006-QA10, Class A2 | |
| | 6,694,955 | | | | 0.616 | | | | 12/25/36 | | | | 5,213,147 | |
| Residential Accredit Loans, Inc. Series 2006-QA2, Class 2A1 | |
| | 4,979,253 | | | | 4.262 | | | | 02/25/36 | | | | 3,565,603 | |
| Residential Accredit Loans, Inc. Series 2006-QO1, Class 3A1 | |
| | 3,251,977 | | | | 0.706 | | | | 02/25/46 | | | | 1,832,660 | |
| Residential Accredit Loans, Inc. Series 2006-QO7, Class 1A1 | |
| | 6,315,486 | | | | 1.122 | | | | 09/25/46 | | | | 4,280,276 | |
| Residential Accredit Loans, Inc. Series 2007-QO4, Class A1A | |
| | 1,569,110 | | | | 0.626 | | | | 05/25/47 | | | | 1,220,883 | |
| Residential Funding Mortgage Securities I Series 2005-SA4,
Class 2A1 |
|
| | 6,068,855 | | | | 3.026 | | | | 09/25/35 | | | | 5,150,246 | |
| Residential Funding Mortgage Securities I Series 2005-SA5,
Class 2A |
|
| | 3,324,009 | | | | 3.266 | | | | 11/25/35 | | | | 2,844,904 | |
| Structured Adjustable Rate Mortgage Loan Trust Series 2006-11,
Class 1A1 |
|
| | 5,935,095 | | | | 0.596 | | | | 12/25/36 | | | | 4,760,845 | |
| Structured Adjustable Rate Mortgage Loan Trust Series 2006-9,
Class 3A1 |
|
| | 3,595,300 | | | | 5.976 | | | | 10/25/36 | | | | 2,475,319 | |
| Structured Adjustable Rate Mortgage Loan Trust Series 2007-11,
Class 1A1 |
|
| | 8,459,866 | | | | 1.586 | | | | 12/25/37 | | | | 5,610,316 | |
| Structured Asset Mortgage Investments II Trust Series 2005-AR7,
Class 5A1 |
|
| | 1,504,521 | | | | 1.782 | | | | 03/25/46 | | | | 1,218,860 | |
| Structured Asset Mortgage Investments II Trust Series 2006-AR3,
Class 21A1 |
|
| | 4,383,175 | | | | 0.836 | | | | 02/25/36 | | | | 3,125,153 | |
| Structured Asset Mortgage Investments II Trust Series 2006-AR5,
Class 1A1 |
|
| | 6,907,516 | | | | 0.646 | | | | 05/25/46 | | | | 5,038,110 | |
| | |
| | | | | | | | | | | | | | |
| Mortgage-Backed Obligations – (continued) | |
| | Adjustable Rate Non-Agency(c) – (continued) | |
| Structured Asset Mortgage Investments II Trust Series 2006-AR7,
Class A1A |
|
| $ | 594,037 | | | | 0.646 | % | | | 08/25/36 | | | $ | 448,352 | |
| Structured Asset Mortgage Investments II Trust Series 2007-AR4,
Class A4A |
|
| | 6,839,768 | | | | 0.616 | | | | 09/25/47 | | | | 5,472,414 | |
| Structured Asset Mortgage Investments II Trust Series 2007-AR7,
Class 1A1 |
|
| | 1,759,409 | | | | 1.286 | | | | 05/25/47 | | | | 1,261,954 | |
| Structured Asset Mortgage Investments II Trust Series 2007-AR7,
Class 3A1 |
|
| | 15,997,187 | | | | 6.500 | | | | 05/25/47 | | | | 10,399,939 | |
| Washington Mutual Alternative Mortgage Pass-Through
Certificates Series 2005-4, Class CB1 |
|
| | 94,275 | | | | 0.886 | | | | 06/25/35 | | | | 69,973 | |
| Washington Mutual Alternative Mortgage Pass-Through
Certificates Series 2006-AR4, Class DA |
|
| | 2,880,455 | | | | 1.292 | | | | 06/25/46 | | | | 1,565,599 | |
| Washington Mutual Mortgage Pass-Through Certificates
Series 2005-AR1, Class A2A1 |
|
| | 8,883,479 | | | | 1.116 | | | | 01/25/45 | | | | 8,114,819 | |
| Washington Mutual Mortgage Pass-Through Certificates
Series 2005-AR19, Class A1A1 |
|
| | 545,302 | | | | 0.706 | | | | 12/25/45 | | | | 500,850 | |
| Washington Mutual Mortgage Pass-Through Certificates
Series 2005-AR8, Class 1A1A |
|
| | 336,293 | | | | 0.706 | | | | 07/25/45 | | | | 313,214 | |
| Washington Mutual Mortgage Pass-Through Certificates
Series 2005-AR8, Class 2A1A |
|
| | 1,250,341 | | | | 0.726 | | | | 07/25/45 | | | | 1,152,205 | |
| Washington Mutual Mortgage Pass-Through Certificates
Series 2005-AR9, Class A1A |
|
| | 4,502,691 | | | | 1.076 | | | | 07/25/45 | | | | 4,190,827 | |
| Washington Mutual Mortgage Pass-Through Certificates
Series 2006-AR13, Class 1A |
|
| | 7,309,919 | | | | 1.202 | | | | 10/25/46 | | | | 5,636,277 | |
| Washington Mutual Mortgage Pass-Through Certificates
Series 2006-AR19, Class 1A |
|
| | 9,587,006 | | | | 1.062 | | | | 01/25/47 | | | | 7,435,455 | |
| Washington Mutual Mortgage Pass-Through Certificates
Series 2007-OA4, Class A1A |
|
| | 6,479,614 | | | | 1.082 | | | | 04/25/47 | | | | 4,721,745 | |
| Washington Mutual Mortgage Pass-Through Certificates
Series 2007-OA6, Class 2A |
|
| | 5,597,033 | | | | 1.755 | | | | 07/25/47 | | | | 3,740,627 | |
| | |
| TOTAL ADJUSTABLE RATE
NON-AGENCY |
| | $ | 645,000,713 | |
| | |
| | Collateralized Mortgage Obligations – 4.0% | |
| | Interest Only(f) – 0.3% | |
| FHLMC STRIPS Series 304, Class C45 | |
| $ | 44,388,455 | | | | 3.000 | % | | | 12/15/27 | | | $ | 4,089,087 | |
| FNMA REMIC Series 2015-34, Class LS(c) | |
| | 41,761,644 | | | | 5.667 | | | | 06/25/45 | | | | 8,785,055 | |
| GNMA REMIC Series 2013-182, Class PI | |
| | 20,965,792 | | | | 4.500 | | | | 12/20/43 | | | | 3,561,482 | |
| | |
| | |
| The accompanying notes are an integral part of these financial statements. | | 89 |
GOLDMAN SACHS STRATEGIC INCOME FUND
Schedule of Investments (continued)
March 31, 2016
| | | | | | | | | | | | | | |
Principal Amount | | | Interest Rate | | | Maturity Date | | | Value | |
| | | | | | | | | | | | | | |
| Mortgage-Backed Obligations – (continued) | |
| | Interest Only(f) – (continued) | |
| GNMA REMIC Series 2014-11, Class NI | |
| $ | 18,511,607 | | | | 4.500 | % | | | 12/16/42 | | | $ | 2,279,582 | |
| GNMA REMIC Series 2014-180, Class PI | |
| | 20,317,934 | | | | 4.000 | | | | 08/20/44 | | | | 2,732,037 | |
| GNMA REMIC Series 2015-111, Class IW | |
| | 21,254,575 | | | | 4.000 | | | | 06/20/45 | | | | 3,233,945 | |
| GNMA REMIC Series 2015-129, Class IC | |
| | 8,590,917 | | | | 4.500 | | | | 09/16/45 | | | | 1,296,164 | |
| GNMA REMIC Series 2015-95, Class GI | |
| | 64,322,541 | | | | 4.500 | | | | 07/16/45 | | | | 13,135,351 | |
| | | | | | | | | | | | | | |
| | | | | | | | | | | | | 39,112,703 | |
| | |
| | Inverse Floaters(c) – 2.7% | |
| FHLMC REMIC Series 3753, Class SK | |
| | 23,673,815 | | | | 5.614 | | | | 11/15/38 | | | | 2,672,589 | |
| FHLMC REMIC Series 4273, Class PS | |
| | 60,268,777 | | | | 5.664 | | | | 11/15/43 | | | | 10,364,609 | |
| FHLMC REMIC Series 4320, Class SD | |
| | 63,171,166 | | | | 5.664 | | | | 07/15/39 | | | | 10,285,056 | |
| FHLMC REMIC Series 4431, Class ST | |
| | 21,864,913 | | | | 5.664 | | | | 01/15/45 | | | | 5,037,197 | |
| FHLMC REMIC Series 4468, Class SY | |
| | 19,014,189 | | | | 5.664 | | | | 05/15/45 | | | | 4,121,628 | |
| FNMA REMIC Series 2010-126, Class LS | |
| | 7,460,770 | | | | 4.562 | | | | 11/25/40 | | | | 1,444,510 | |
| FNMA REMIC Series 2013-121, Class SA | |
| | 57,155,808 | | | | 5.667 | | | | 12/25/43 | | | | 9,749,215 | |
| FNMA REMIC Series 2013-96, Class SW | |
| | 63,596,858 | | | | 5.667 | | | | 09/25/43 | | | | 10,982,758 | |
| FNMA REMIC Series 2014-19, Class MS | |
| | 34,014,244 | | | | 6.167 | | | | 11/25/39 | | | | 4,940,814 | |
| FNMA REMIC Series 2014-87, Class MS | |
| | 23,476,896 | | | | 5.817 | | | | 01/25/45 | | | | 4,057,101 | |
| FNMA REMIC Series 2015-20, Class ES | |
| | 58,822,737 | | | | 5.717 | | | | 04/25/45 | | | | 13,754,438 | |
| FNMA REMIC Series 2015-22, Class DS | |
| | 14,896,719 | | | | 5.767 | | | | 04/25/45 | | | | 3,366,590 | |
| FNMA REMIC Series 2015-24, Class SG | |
| | 23,395,594 | | | | 5.167 | | | | 04/25/45 | | | | 4,948,107 | |
| FNMA REMIC Series 2015-79, Class SA | |
| | 48,909,738 | | | | 5.817 | | | | 11/25/45 | | | | 7,927,300 | |
| FNMA REMIC Series 2015-79, Class SE | |
| | 19,719,924 | | | | 5.817 | | | | 11/25/45 | | | | 3,199,721 | |
| FNMA REMIC Series 2015-81, Class SA | |
| | 191,382,664 | | | | 5.267 | | | | 11/25/45 | | | | 28,284,272 | |
| FNMA REMIC Series 2015-82, Class MS | |
| | 135,719,465 | | | | 5.267 | | | | 11/25/45 | | | | 21,316,995 | |
| FNMA REMIC Series 2015-86, Class BS | |
| | 33,328,719 | | | | 5.267 | | | | 11/25/45 | | | | 5,180,526 | |
| GNMA REMIC Series 2010-1, Class SD | |
| | 11,153,396 | | | | 5.358 | | | | 01/20/40 | | | | 1,776,808 | |
| GNMA REMIC Series 2010-162, Class SE | |
| | 28,010,491 | | | | 6.118 | | | | 12/20/40 | | | | 3,175,687 | |
| GNMA REMIC Series 2010-20, Class SC | |
| | 16,313,839 | | | | 5.718 | | | | 02/20/40 | | | | 2,690,100 | |
| | |
| | | | | | | | | | | | | | |
| Mortgage-Backed Obligations – (continued) | |
| | Inverse Floaters(c) – (continued) | |
| GNMA REMIC Series 2010-20, Class SD | |
| $ | 14,820,708 | | | | 5.248 | % | | | 02/20/40 | | | $ | 2,197,379 | |
| GNMA REMIC Series 2010-20, Class SE | |
| | 23,017,723 | | | | 5.818 | | | | 02/20/40 | | | | 3,815,093 | |
| GNMA REMIC Series 2010-35, Class DS | |
| | 17,952,798 | | | | 5.248 | | | | 03/20/40 | | | | 2,673,768 | |
| GNMA REMIC Series 2010-37, Class SG | |
| | 36,589,545 | | | | 5.268 | | | | 03/20/40 | | | | 5,448,352 | |
| GNMA REMIC Series 2010-58, Class AI | |
| | 5,793,973 | | | | 5.338 | | | | 05/20/40 | | | | 872,203 | |
| GNMA REMIC Series 2010-59, Class SA | |
| | 10,271,840 | | | | 6.068 | | | | 05/20/40 | | | | 1,789,967 | |
| GNMA REMIC Series 2010-85, Class SN | |
| | 21,840,093 | | | | 5.508 | | | | 07/20/40 | | | | 3,921,172 | |
| GNMA REMIC Series 2010-9, Class XD | |
| | 39,875,257 | | | | 6.159 | | | | 01/16/40 | | | | 6,846,602 | |
| GNMA REMIC Series 2010-9, Class YD | |
| | 55,147,171 | | | | 6.359 | | | | 01/16/40 | | | | 9,884,496 | |
| GNMA REMIC Series 2010-90, Class ES | |
| | 35,027,570 | | | | 5.518 | | | | 07/20/40 | | | | 5,352,651 | |
| GNMA REMIC Series 2012-149, Class MS | |
| | 9,125,901 | | | | 5.818 | | | | 12/20/42 | | | | 1,467,116 | |
| GNMA REMIC Series 2013-103, Class DS | |
| | 22,426,337 | | | | 5.718 | | | | 07/20/43 | | | | 3,680,364 | |
| GNMA REMIC Series 2013-111, Class SA | |
| | 23,284,914 | | | | 6.268 | | | | 07/20/43 | | | | 4,208,106 | |
| GNMA REMIC Series 2013-113, Class SA | |
| | 27,447,842 | | | | 6.268 | | | | 08/20/43 | | | | 5,027,764 | |
| GNMA REMIC Series 2013-113, Class SD | |
| | 91,392,063 | | | | 6.259 | | | | 08/16/43 | | | | 18,394,846 | |
| GNMA REMIC Series 2013-117, Class PS | |
| | 31,729,850 | | | | 5.718 | | | | 04/20/43 | | | | 4,666,436 | |
| GNMA REMIC Series 2013-147, Class SD | |
| | 30,555,143 | | | | 6.218 | | | | 12/20/39 | | | | 5,480,703 | |
| GNMA REMIC Series 2013-152, Class SJ | |
| | 35,284,960 | | | | 5.718 | | | | 05/20/41 | | | | 5,773,251 | |
| GNMA REMIC Series 2013-167, Class SG | |
| | 29,350,923 | | | | 5.718 | | | | 11/20/43 | | | | 4,484,026 | |
| GNMA REMIC Series 2014-133, Class BS | |
| | 17,205,748 | | | | 5.168 | | | | 09/20/44 | | | | 2,541,955 | |
| GNMA REMIC Series 2014-3, Class TS | |
| | 13,749,577 | | | | 5.118 | | | | 01/20/44 | | | | 1,969,881 | |
| GNMA REMIC Series 2014-41, Class SA | |
| | 38,823,975 | | | | 5.668 | | | | 03/20/44 | | | | 6,469,449 | |
| GNMA REMIC Series 2014-5, Class SA | |
| | 21,341,553 | | | | 5.118 | | | | 01/20/44 | | | | 3,028,780 | |
| GNMA REMIC Series 2014-56, Class ST | |
| | 33,637,403 | | | | 5.659 | | | | 12/16/39 | | | | 5,238,911 | |
| GNMA REMIC Series 2014-76, Class SA | |
| | 44,627,896 | | | | 5.168 | | | | 01/20/40 | | | | 6,390,884 | |
| GNMA REMIC Series 2014-96, Class SE | |
| | 27,198,056 | | | | 5.168 | | | | 07/20/44 | | | | 3,872,484 | |
| GNMA REMIC Series 2015-110, Class MS | |
| | 29,184,366 | | | | 5.278 | | | | 08/20/45 | | | | 4,446,944 | |
| GNMA REMIC Series 2015-111, Class SM | |
| | 24,938,634 | | | | 5.768 | | | | 08/20/45 | | | | 4,268,559 | |
| | |
| | |
| 90 | | The accompanying notes are an integral part of these financial statements. |
GOLDMAN SACHS STRATEGIC INCOME FUND
| | | | | | | | | | | | | | |
Principal Amount | | | Interest Rate | | | Maturity Date | | | Value | |
| | | | | | | | | | | | | | |
| Mortgage-Backed Obligations – (continued) | |
| | Inverse Floaters(c) – (continued) | |
| GNMA REMIC Series 2015-112, Class SB | |
| $ | 49,078,814 | | | | 5.308 | % | | | 08/20/45 | | | $ | 7,526,236 | |
| GNMA REMIC Series 2015-123, Class SE | |
| | 30,050,891 | | | | 5.288 | | | | 09/20/45 | | | | 4,580,131 | |
| GNMA REMIC Series 2015-126, Class HS | |
| | 53,387,792 | | | | 5.768 | | | | 09/20/45 | | | | 9,188,039 | |
| GNMA REMIC Series 2015-126, Class LS | |
| | 16,238,695 | | | | 5.768 | | | | 09/20/45 | | | | 2,794,679 | |
| GNMA REMIC Series 2015-133, Class SA | |
| | 9,341,333 | | | | 5.268 | | | | 09/20/45 | | | | 1,414,978 | |
| GNMA REMIC Series 2015-133, Class SB | |
| | 14,052,147 | | | | 5.268 | | | | 09/20/45 | | | | 2,172,462 | |
| GNMA REMIC Series 2015-144, Class QS | |
| | 32,803,466 | | | | 5.268 | | | | 10/20/45 | | | | 4,778,438 | |
| GNMA REMIC Series 2015-167, Class SA | |
| | 28,429,977 | | | | 5.818 | | | | 11/20/45 | | | | 4,193,953 | |
| GNMA REMIC Series 2015-168, Class SD | |
| | 44,109,675 | | | | 5.768 | | | | 11/20/45 | | | | 7,223,475 | |
| GNMA REMIC Series 2016-4, Class SM | |
| | 122,062,389 | | | | 5.218 | | | | 01/20/46 | | | | 18,491,097 | |
| GNMA REMIC Series 2016-6, Class S | |
| | 32,093,542 | | | | 5.218 | | | | 01/20/46 | | | | 4,809,442 | |
| GNMA REMIC Series 2016-6, Class SB | |
| | 60,952,560 | | | | 5.218 | | | | 01/20/46 | | | | 9,361,320 | |
| | | | | | | | | | | | | | |
| | | | | | | | | | | | | 370,022,413 | |
| | |
| | Planned Amortization Class(c) – 0.0% | |
| GNMA REMIC Series 2011-50, Class PS | |
| | 39,794,759 | | | | 5.668 | | | | 02/20/41 | | | | 6,128,723 | |
| | |
| | Regular Floater(c) – 0.5% | |
| Countrywide Alternative Loan Trust Series 2005-26CB, Class A1 | |
| | 980,421 | | | | 0.936 | | | | 07/25/35 | | | | 731,803 | |
| Countrywide Alternative Loan Trust Series 2005-36, Class 2A1A | |
| | 7,933,281 | | | | 0.746 | | | | 08/25/35 | | | | 6,015,828 | |
| Countrywide Alternative Loan Trust Series 2005-64CB,
Class 1A12 |
|
| | 1,262,085 | | | | 1.236 | | | | 12/25/35 | | | | 1,016,626 | |
| FHLMC REMIC Series 3231, Class FB | |
| | 785,787 | | | | 0.786 | | | | 10/15/36 | | | | 784,539 | |
| FHLMC REMIC Series 3314, Class FC | |
| | 494,307 | | | | 0.836 | | | | 12/15/36 | | | | 493,733 | |
| FHLMC REMIC Series 3371, Class FA | |
| | 661,066 | | | | 1.036 | | | | 09/15/37 | | | | 664,933 | |
| FHLMC REMIC Series 3545, Class FA | |
| | 961,986 | | | | 1.286 | | | | 06/15/39 | | | | 967,950 | |
| FHLMC REMIC Series 3827, Class KF | |
| | 1,094,538 | | | | 0.806 | | | | 03/15/41 | | | | 1,094,185 | |
| FHLMC Structured Agency Credit Risk Debt Notes
Series 2015-DNA1, Class M3 |
|
| | 13,210,000 | | | | 3.736 | | | | 10/25/27 | | | | 12,459,654 | |
| FHLMC Structured Agency Credit Risk Debt Notes
Series 2015-HQ1, Class M3 |
|
| | 15,550,000 | | | | 4.236 | | | | 03/25/25 | | | | 15,008,860 | |
| FNMA Connecticut Avenue Securities Series 2014-C03,
Class 1M1 |
|
| | 14,935,980 | | | | 1.636 | | | | 07/25/24 | | | | 14,882,600 | |
| | |
| | | | | | | | | | | | | | |
| Mortgage-Backed Obligations – (continued) | |
| | Regular Floater(c) – (continued) | |
| FNMA Connecticut Avenue Securities Series 2015-C01,
Class 2M1 |
|
| $ | 598,522 | | | | 1.936 | % | | | 02/25/25 | | | $ | 598,675 | |
| FNMA REMIC Series 2006-45, Class TF | |
| | 1,396,072 | | | | 0.833 | | | | 06/25/36 | | | | 1,395,448 | |
| FNMA REMIC Series 2006-76, Class QF | |
| | 1,481,765 | | | | 0.833 | | | | 08/25/36 | | | | 1,480,723 | |
| FNMA REMIC Series 2006-79, Class PF | |
| | 1,512,897 | | | | 0.833 | | | | 08/25/36 | | | | 1,511,504 | |
| FNMA REMIC Series 2007-33, Class HF | |
| | 1,976,439 | | | | 0.783 | | | | 04/25/37 | | | | 1,966,261 | |
| FNMA REMIC Series 2007-75, Class VF | |
| | 537,066 | | | | 0.883 | | | | 08/25/37 | | | | 537,610 | |
| FNMA REMIC Series 2009-84, Class WF | |
| | 353,577 | | | | 1.533 | | | | 10/25/39 | | | | 358,480 | |
| Nomura Resecuritization Trust Series 2014-5R, Class 2A11(b) | |
| | 4,810,359 | | | | 8.500 | | | | 12/26/36 | | | | 3,138,077 | |
| Sequoia Mortgage Trust Series 2007-3, Class 2AA1 | |
| | 4,962,723 | | | | 2.685 | | | | 07/20/37 | | | | 3,991,909 | |
| | | | | | | | | | | | | | |
| | | | | | | | | | | | | 69,099,398 | |
| | |
| | Sequential Fixed Rate – 0.5% | |
| Banc of America Funding Corp. Series 2007-8, Class 2A1 | |
| | 2,192,672 | | | | 7.000 | | | | 10/25/37 | | | | 1,176,682 | |
| BCAP LLC Trust Series 2007-AA2, Class 2A7 | |
| | 1,980,882 | | | | 6.000 | | | | 04/25/37 | | | | 1,655,012 | |
| Citicorp Mortgage Securities, Inc. Series 2007-4, Class 2A1 | |
| | 131,238 | | | | 5.500 | | | | 05/25/22 | | | | 134,720 | |
| Citigroup Mortgage Loan Trust Series 2007-9, Class 1A1(b) | |
| | 8,768,648 | | | | 5.750 | | | | 04/25/47 | | | | 7,241,460 | |
| CitiMortgage Alternative Loan Trust Series 2007-A1, Class 1A7 | |
| | 1,414,259 | | | | 6.000 | | | | 01/25/37 | | | | 1,164,051 | |
| CitiMortgage Alternative Loan Trust Series 2007-A3, Class 1A7 | |
| | 7,531,393 | | | | 5.750 | | | | 03/25/37 | | | | 6,120,871 | |
| Countrywide Alternative Loan Trust Series 2005-77T1,
Class 1A2 |
|
| | 2,702,105 | | | | 6.000 | | | | 02/25/36 | | | | 2,281,880 | |
| Countrywide Alternative Loan Trust Series 2007-06, Class A4 | |
| | 3,366,366 | | | | 5.750 | | | | 04/25/47 | | | | 2,839,584 | |
| Countrywide Alternative Loan Trust Series 2007-15CB, Class A5 | |
| | 1,332,798 | | | | 5.750 | | | | 07/25/37 | | | | 1,195,128 | |
| Countrywide Alternative Loan Trust Series 2007-18CB,
Class 2A25 |
|
| | 530,802 | | | | 6.000 | | | | 08/25/37 | | | | 488,493 | |
| Countrywide Home Loans Mortgage Pass-Through Trust
Series 2007-1, Class A4 |
|
| | 1,514,500 | | | | 6.000 | | | | 03/25/37 | | | | 1,384,535 | |
| Countrywide Home Loans Mortgage Pass-Through Trust
Series 2007-7, Class A3 |
|
| | 3,028,810 | | | | 5.750 | | | | 06/25/37 | | | | 2,730,015 | |
| Countrywide Home Mortgage Loan Pass-Through Trust
Series 2007-10, Class A5 |
|
| | 2,329,878 | | | | 6.000 | | | | 07/25/37 | | | | 2,080,636 | |
| Countrywide Home Mortgage Pass-Through Trust
Series 2007-10, Class A22 |
|
| | 4,379,012 | | | | 6.000 | | | | 07/25/37 | | | | 3,910,563 | |
| | |
| | |
| The accompanying notes are an integral part of these financial statements. | | 91 |
GOLDMAN SACHS STRATEGIC INCOME FUND
Schedule of Investments (continued)
March 31, 2016
| | | | | | | | | | | | | | |
Principal Amount | | | Interest Rate | | | Maturity Date | | | Value | |
| | | | | | | | | | | | | | |
| Mortgage-Backed Obligations – (continued) | |
| | Sequential Fixed Rate – (continued) | |
| JPMorgan Alternative Loan Trust Series 2008-R2, Class A1(b) | |
| $ | 9,242,492 | | | | 6.000 | % | | | 11/25/36 | | | $ | 7,657,534 | |
| Morgan Stanley Mortgage Loan Trust Series 2005-4, Class 1A | |
| | 675,704 | | | | 5.000 | | | | 08/25/35 | | | | 670,954 | |
| Residential Accredit Loans, Inc. Series 2006-QS2, Class 1A9 | |
| | 771,828 | | | | 5.500 | | | | 02/25/36 | | | | 627,267 | |
| Residential Accredit Loans, Inc. Series 2006-QS6, Class 1A13 | |
| | 1,290,487 | | | | 6.000 | | | | 06/25/36 | | | | 1,044,877 | |
| Residential Accredit Loans, Inc. Series 2006-QS9, Class 1A11 | |
| | 2,198,726 | | | | 6.500 | | | | 07/25/36 | | | | 1,758,934 | |
| Residential Asset Securitization Trust Series 2006-A15,
Class A13 |
|
| | 7,348,566 | | | | 6.250 | | | | 01/25/37 | | | | 5,014,387 | |
| Residential Asset Securitization Trust Series 2006-A8, Class 1A1 | |
| | 1,781,711 | | | | 6.000 | | | | 08/25/36 | | | | 1,525,355 | |
| Residential Asset Securitization Trust Series 2006-A8, Class 2A3 | |
| | 7,381,331 | | | | 6.000 | | | | 08/25/36 | | | | 4,212,283 | |
| Residential Funding Mortgage Securities I Series 2007-S9,
Class 1A1 |
|
| | 5,679,685 | | | | 6.000 | | | | 10/25/37 | | | | 4,564,978 | |
| Wells Fargo Mortgage Backed Securities Trust Series 2007-11,
Class A85 |
|
| | 1,359,580 | | | | 6.000 | | | | 08/25/37 | | | | 1,281,090 | |
| | | | | | | | | | | | | | |
| | | | | | | | | | | | | 62,761,289 | |
| | |
| | Sequential Floating Rate(c) – 0.0% | |
| Banc of America Funding Corp. Series 2007-2, Class 2A1 | |
| | 85,870 | | | | 5.735 | | | | 03/25/37 | | | | 84,545 | |
| Countrywide Alternative Loan Trust Series 2007-16CB,
Class 4A3 |
|
| | 6,265,111 | | | | 0.936 | | | | 08/25/37 | | | | 4,697,905 | |
| Washington Mutual Alternative Mortgage Pass-Through
Certificates Series 2006-AR10, Class A1 |
|
| | 1,145,801 | | | | 0.536 | | | | 12/25/36 | | | | 756,126 | |
| | | | | | | | | | | | | | |
| | | | | | | | | | | | | 5,538,576 | |
| | |
| TOTAL COLLATERALIZED
MORTGAGE OBLIGATIONS |
| | $ | 552,663,102 | |
| | |
| | Commercial Mortgage-Backed Securities – 6.0% | |
| | Sequential Fixed Rate – 2.8% | |
| Credit Suisse Commercial Mortgage Trust Series 2007-C1,
Class A1A |
|
| $ | 102,187,056 | | | | 5.361 | % | | | 02/15/40 | | | $ | 103,870,057 | |
| CSMC Trust Series 2014-USA, Class E(b) | |
| | 17,900,000 | | | | 4.373 | | | | 09/15/37 | | | | 14,732,062 | |
| FHLMC Multifamily Structured Pass-Through Certificates
Series K030, Class A1 |
|
| | 20,744,660 | | | | 2.779 | | | | 09/25/22 | | | | 21,656,450 | |
| FHLMC Multifamily Structured Pass-Through Certificates
Series K037, Class A2 |
|
| | 122,500,000 | | | | 3.490 | | | | 01/25/24 | | | | 133,987,278 | |
| FHLMC Multifamily Structured Pass-Through Certificates
Series K038, Class A2 |
|
| | 24,500,000 | | | | 3.389 | | | | 03/25/24 | | | | 26,609,188 | |
| | |
| | | | | | | | | | | | | | |
| Mortgage-Backed Obligations – (continued) | |
| | Sequential Fixed Rate – (continued) | |
| Wachovia Bank Commercial Mortgage Trust Series 2006-C28,
Class A1A |
|
| $ | 72,320,545 | | | | 5.559 | % | | | 10/15/48 | | | $ | 72,976,181 | |
| WF-RBS Commercial Mortgage Trust Series 2012-C6, Class B | |
| | 2,500,000 | | | | 4.697 | | | | 04/15/45 | | | | 2,698,343 | |
| | | | | | | | | | | | | | |
| | | | | | | | | | | | | 376,529,559 | |
| | |
| | Sequential Floating Rate(c) – 3.2% | |
| CGBAM Commercial Mortgage Trust Series 2015-SMRT,
Class E(b) |
|
| | 12,450,000 | | | | 3.786 | | | | 04/10/28 | | | | 12,078,659 | |
| Citigroup Commercial Mortgage Trust Series 2014-388G,
Class E(b) |
|
| | 27,996,000 | | | | 2.786 | | | | 06/15/33 | | | | 27,119,188 | |
| Citigroup Commercial Mortgage Trust Series 2015-SSHP,
Class D(b) |
|
| | 9,913,500 | | | | 3.486 | | | | 09/15/17 | | | | 9,211,860 | |
| Citigroup Commercial Mortgage Trust Series 2015-SSHP,
Class E(b) |
|
| | 11,719,000 | | | | 3.836 | | | | 09/15/17 | | | | 10,841,322 | |
| COMM 2015-CCRE23 Mortgage Trust Series 2015-CR23,
Class CMD(b) |
|
| | 15,000,000 | | | | 3.685 | | | | 05/10/48 | | | | 13,423,645 | |
| Commercial Mortgage Pass Through Certificates
Series 2014-KYO, Class F(b) |
|
| | 14,494,000 | | | | 3.938 | | | | 06/11/27 | | | | 14,327,367 | |
| Credit Suisse Commercial Mortgage Trust Series 2007-C2,
Class A1A |
|
| | 132,419,851 | | | | 5.526 | | | | 01/15/49 | | | | 135,683,193 | |
| Credit Suisse Commercial Mortgage Trust Series 2007-C3,
Class A1A1 |
|
| | 63,386,472 | | | | 5.699 | | | | 06/15/39 | | | | 64,977,587 | |
| FHLMC Multifamily Structured Pass-Through Certificates
Series K029, Class A2 |
|
| | 33,200,000 | | | | 3.320 | | | | 02/25/23 | | | | 35,984,650 | |
| FREMF Mortgage Trust Series 2014-K40, Class C(b) | |
| | 7,800,000 | | | | 4.072 | | | | 09/25/25 | | | | 6,811,515 | |
| FREMF Mortgage Trust Series 2014-K41, Class B(b) | |
| | 19,950,000 | | | | 3.831 | | | | 11/25/47 | | | | 17,750,341 | |
| GRACE Mortgage Trust Series 2014-GRCE, Class F(b) | |
| | 15,250,000 | | | | 3.590 | | | | 06/10/28 | | | | 13,749,261 | |
| GS Mortgage Securities Trust Series 2007-GG10, Class A1A | |
| | 25,257,497 | | | | 5.794 | | | | 08/10/45 | | | | 26,073,362 | |
| Hilton Mortgage Trust Series 2014-ORL, Class E(b) | |
| | 17,950,000 | | | | 3.686 | | | | 07/15/29 | | | | 16,713,496 | |
| JPMorgan Chase Commercial Mortgage Securities Trust
Series 2014-CBM, Class E(b) |
|
| | 15,000,000 | | | | 4.286 | | | | 10/15/29 | | | | 14,177,277 | |
| Morgan Stanley Capital I Trust Series 2007-HQ11, Class AM | |
| | 1,450,000 | | | | 5.478 | | | | 02/12/44 | | | | 1,470,279 | |
| Morgan Stanley Capital I Trust Series 2007-HQ13, Class AM | |
| | 1,200,000 | | | | 5.931 | | | | 12/15/44 | | | | 1,154,606 | |
| Morgan Stanley Capital I Trust Series 2014-CPT, Class F(b) | |
| | 15,245,000 | | | | 3.446 | | | | 07/13/29 | | | | 14,287,006 | |
| Tricon American Homes Trust Series 2015-SFR1, Class D(b) | |
| | 1,920,000 | | | | 2.641 | | | | 05/17/32 | | | | 1,789,215 | |
| | |
| | |
| 92 | | The accompanying notes are an integral part of these financial statements. |
GOLDMAN SACHS STRATEGIC INCOME FUND
| | | | | | | | | | | | | | |
Principal Amount | | | Interest Rate | | | Maturity Date | | | Value | |
| | | | | | | | | | | | | | |
| | Mortgage-Backed Obligations – (continued) | |
| | Sequential Floating Rate(c) – (continued) | |
| Tricon American Homes Trust Series 2015-SFR1, Class E(b) | |
| $ | 3,790,000 | | | | 3.427 | % | | | 05/17/32 | | | $ | 3,484,579 | |
| | | | | | | | | | | | | | |
| | | | | | | | | | | | | 441,108,408 | |
| | |
| TOTAL COMMERCIAL
MORTGAGE-BACKED SECURITIES |
| | $ | 817,637,967 | |
| | |
| | Federal Agencies – 1.3% | | | | | |
| | FHLMC – 0.0% | | | | | |
| $ | 22,743 | | | | 5.000 | % | | | 01/01/33 | | | $ | 25,177 | |
| | 2,250 | | | | 5.000 | | | | 03/01/33 | | | | 2,483 | |
| | 13,299 | | | | 5.000 | | | | 04/01/33 | | | | 14,677 | |
| | 4,100 | | | | 5.000 | | | | 05/01/33 | | | | 4,525 | |
| | 10,055 | | | | 5.000 | | | | 06/01/33 | | | | 11,096 | |
| | 57,298 | | | | 5.000 | | | | 07/01/33 | | | | 63,235 | |
| | 80,028 | | | | 5.000 | | | | 08/01/33 | | | | 88,341 | |
| | 9,952 | | | | 5.000 | | | | 09/01/33 | | | | 11,005 | |
| | 17,141 | | | | 5.000 | | | | 10/01/33 | | | | 18,917 | |
| | 52,829 | | | | 5.000 | | | | 11/01/33 | | | | 58,303 | |
| | 18,774 | | | | 5.000 | | | | 12/01/33 | | | | 20,719 | |
| | 18,681 | | | | 5.000 | | | | 01/01/34 | | | | 20,617 | |
| | 59,563 | | | | 5.000 | | | | 02/01/34 | | | | 65,726 | |
| | 23,930 | | | | 5.000 | | | | 03/01/34 | | | | 26,398 | |
| | 41,553 | | | | 5.000 | | | | 04/01/34 | | | | 45,839 | |
| | 67,258 | | | | 5.000 | | | | 05/01/34 | | | | 74,225 | |
| | 866,563 | | | | 5.000 | | | | 06/01/34 | | | | 956,304 | |
| | 13,940 | | | | 5.000 | | | | 11/01/34 | | | | 15,379 | |
| | 234,454 | | | | 5.000 | | | | 04/01/35 | | | | 258,748 | |
| | 17,712 | | | | 5.000 | | | | 11/01/35 | | | | 19,548 | |
| | | | | | | | | | | | | | |
| | | | | | | | | | | | | 1,801,262 | |
| | |
| | FNMA – 1.3% | | | | | |
| | 3,824,187 | | | | 3.094 | | | | 01/01/18 | | | | 3,895,318 | |
| | 6,007,930 | | | | 3.434 | | | | 01/01/18 | | | | 6,140,448 | |
| | 155,210 | | | | 5.000 | | | | 01/01/18 | | | | 161,367 | |
| | 810,158 | | | | 5.000 | | | | 02/01/18 | | | | 844,124 | |
| | 544,539 | | | | 5.000 | | | | 03/01/18 | | | | 567,369 | |
| | 814,814 | | | | 5.000 | | | | 04/01/18 | | | | 848,973 | |
| | 82,550 | | | | 5.000 | | | | 05/01/18 | | | | 86,011 | |
| | 72,175 | | | | 5.000 | | | | 06/01/18 | | | | 75,201 | |
| | 1,069 | | | | 5.500 | | | | 01/01/19 | | | | 1,123 | |
| | 37,344 | | | | 5.500 | | | | 02/01/19 | | | | 38,933 | |
| | 40,837 | | | | 5.500 | | | | 03/01/19 | | | | 42,638 | |
| | 32,409 | | | | 5.500 | | | | 04/01/19 | | | | 33,823 | |
| | 17,173 | | | | 5.500 | | | | 05/01/19 | | | | 18,003 | |
| | 82,943 | | | | 5.500 | | | | 06/01/19 | | | | 86,420 | |
| | 234,784 | | | | 5.500 | | | | 07/01/19 | | | | 245,269 | |
| | 220,818 | | | | 5.500 | | | | 08/01/19 | | | | 231,803 | |
| | 198,106 | | | | 5.500 | | | | 09/01/19 | | | | 208,570 | |
| | 59,839 | | | | 5.500 | | | | 10/01/19 | | | | 62,899 | |
| | 61,186 | | | | 5.500 | | | | 11/01/19 | | | | 64,543 | |
| | 103,079 | | | | 5.500 | | | | 12/01/19 | | | | 108,613 | |
| | 9,389 | | | | 5.500 | | | | 01/01/20 | | | | 9,900 | |
| | 3,837 | | | | 5.500 | | | | 06/01/20 | | | | 4,015 | |
| | 1,152,790 | | | | 5.500 | | | | 07/01/20 | | | | 1,215,285 | |
| | 1,788,571 | | | | 3.416 | | | | 10/01/20 | | | | 1,925,611 | |
| | 1,355,505 | | | | 3.619 | | | | 12/01/20 | | | | 1,465,456 | |
| | |
| | | | | | | | | | | | | | |
| | Mortgage-Backed Obligations – (continued) | |
| | FNMA – (continued) | | | | | |
| $ | 5,459,506 | | | | 4.381 | % | | | 06/01/21 | | | $ | 6,076,464 | |
| | 335,281 | | | | 6.000 | | | | 08/01/22 | | | | 382,047 | |
| | 3,843 | | | | 6.000 | | | | 01/01/24 | | | | 4,379 | |
| | 97,412 | | | | 6.000 | | | | 04/01/24 | | | | 111,224 | |
| | 2,187,343 | | | | 5.500 | | | | 05/01/25 | | | | 2,280,097 | |
| | 141,460 | | | | 6.000 | | | | 09/01/25 | | | | 161,192 | |
| | 484,856 | | | | 6.000 | | | | 10/01/25 | | | | 552,485 | |
| | 71,055 | | | | 6.000 | | | | 02/01/26 | | | | 80,966 | |
| | 316,800 | | | | 6.000 | | | | 03/01/26 | | | | 360,821 | |
| | 83,155 | | | | 6.000 | | | | 04/01/26 | | | | 94,754 | |
| | 561,454 | | | | 6.000 | | | | 03/01/27 | | | | 639,767 | |
| | 42,011 | | | | 6.000 | | | | 07/01/27 | | | | 47,871 | |
| | 64,482 | | | | 6.000 | | | | 09/01/28 | | | | 73,476 | |
| | 676,480 | | | | 6.000 | | | | 10/01/28 | | | | 770,838 | |
| | 5,363 | | | | 4.500 | | | | 09/01/29 | | | | 5,833 | |
| | 7,411 | | | | 6.000 | | | | 12/01/32 | | | | 8,545 | |
| | 998 | | | | 6.000 | | | | 01/01/33 | | | | 1,151 | |
| | 4,579 | | | | 6.000 | | | | 04/01/33 | | | | 5,280 | |
| | 193,998 | | | | 6.000 | | | | 10/01/33 | | | | 226,581 | |
| | 6,945 | | | | 6.000 | | | | 02/01/34 | | | | 8,007 | |
| | 53,072 | | | | 6.000 | | | | 03/01/34 | | | | 61,187 | |
| | 152,425 | | | | 6.000 | | | | 08/01/34 | | | | 175,879 | |
| | 38,393 | | | | 6.000 | | | | 11/01/34 | | | | 44,263 | |
| | 355,728 | | | | 6.000 | | | | 05/01/35 | | | | 410,420 | |
| | 79,663 | | | | 6.000 | | | | 06/01/35 | | | | 91,405 | |
| | 201,072 | | | | 6.000 | | | | 10/01/35 | | | | 231,220 | |
| | 24,818 | | | | 6.000 | | | | 11/01/35 | | | | 28,454 | |
| | 33,073 | | | | 6.000 | | | | 12/01/35 | | | | 37,732 | |
| | 150,450 | | | | 6.000 | | | | 02/01/36 | | | | 173,384 | |
| | 14,026 | | | | 6.000 | | | | 05/01/36 | | | | 16,136 | |
| | 682,976 | | | | 6.000 | | | | 08/01/36 | | | | 780,320 | |
| | 35,511 | | | | 6.000 | | | | 09/01/36 | | | | 40,760 | |
| | 25,873 | | | | 6.000 | | | | 10/01/36 | | | | 29,858 | |
| | 252,753 | | | | 6.000 | | | | 11/01/36 | | | | 291,826 | |
| | 509,001 | | | | 6.000 | | | | 12/01/36 | | | | 580,083 | |
| | 1,810,077 | | | | 6.000 | | | | 01/01/37 | | | | 2,061,194 | |
| | 3,058,279 | | | | 6.000 | | | | 02/01/37 | | | | 3,519,138 | |
| | 108,703 | | | | 6.000 | | | | 04/01/37 | | | | 125,025 | |
| | 905,969 | | | | 6.000 | | | | 05/01/37 | | | | 1,032,928 | |
| | 1,398,965 | | | | 6.000 | | | | 07/01/37 | | | | 1,611,147 | |
| | 83,148 | | | | 4.500 | | | | 08/01/37 | | | | 90,767 | |
| | 1,735,937 | | | | 6.000 | | | | 08/01/37 | | | | 1,987,247 | |
| | 42,774 | | | | 6.000 | | | | 09/01/37 | | | | 48,703 | |
| | 144,472 | | | | 6.000 | | | | 10/01/37 | | | | 165,248 | |
| | 5,796 | | | | 6.000 | | | | 11/01/37 | | | | 6,650 | |
| | 420,676 | | | | 6.000 | | | | 12/01/37 | | | | 479,010 | |
| | 1,247,462 | | | | 6.000 | | | | 01/01/38 | | | | 1,426,430 | |
| | 111,847 | | | | 5.000 | | | | 03/01/38 | | | | 125,128 | |
| | 102,912 | | | | 6.000 | | | | 03/01/38 | | | | 118,409 | |
| | 365,363 | | | | 6.000 | | | | 05/01/38 | | | | 418,213 | |
| | 24,631 | | | | 6.000 | | | | 07/01/38 | | | | 28,051 | |
| | 24,805 | | | | 6.000 | | | | 08/01/38 | | | | 28,384 | |
| | 911,403 | | | | 6.000 | | | | 09/01/38 | | | | 1,047,089 | |
| | 448,896 | | | | 6.000 | | | | 10/01/38 | | | | 512,640 | |
| | 2,272,068 | | | | 6.000 | | | | 11/01/38 | | | | 2,600,625 | |
| | 6,609,440 | | | | 6.000 | | | | 12/01/38 | | | | 7,529,428 | |
| | |
| | |
| The accompanying notes are an integral part of these financial statements. | | 93 |
GOLDMAN SACHS STRATEGIC INCOME FUND
Schedule of Investments (continued)
March 31, 2016
| | | | | | | | | | | | | | |
Principal Amount | | | Interest Rate | | | Maturity Date | | | Value | |
| | | | | | | | | | | | | | |
| | Mortgage-Backed Obligations – (continued) | |
| | FNMA – (continued) | | | | | |
| $ | 3,531 | | | | 6.000 | % | | | 01/01/39 | | | $ | 4,040 | |
| | 18,596 | | | | 4.500 | | | | 04/01/39 | | | | 20,290 | |
| | 9,093 | | | | 6.000 | | | | 04/01/39 | | | | 10,471 | |
| | 123,690 | | | | 6.000 | | | | 07/01/39 | | | | 143,378 | |
| | 28,340 | | | | 4.000 | | | | 08/01/39 | | | | 30,287 | |
| | 13,980 | | | | 4.000 | | | | 09/01/39 | | | | 14,940 | |
| | 103,793 | | | | 6.000 | | | | 09/01/39 | | | | 118,202 | |
| | 73,133 | | | | 4.500 | | | | 10/01/39 | | | | 80,950 | |
| | 954,575 | | | | 6.000 | | | | 10/01/39 | | | | 1,098,391 | |
| | 318,443 | | | | 6.000 | | | | 10/01/40 | | | | 362,575 | |
| | 10,433 | | | | 4.500 | | | | 05/01/41 | | | | 11,492 | |
| | 1,635,872 | | | | 6.000 | | | | 05/01/41 | | | | 1,862,729 | |
| | 46,904 | | | | 4.500 | | | | 06/01/41 | | | | 51,390 | |
| | 166,388 | | | | 6.000 | | | | 07/01/41 | | | | 190,929 | |
| | 54,019 | | | | 4.500 | | | | 08/01/41 | | | | 59,708 | |
| | 14,805 | | | | 4.500 | | | | 10/01/41 | | | | 16,304 | |
| | 418,047 | | | | 5.000 | | | | 11/01/41 | | | | 463,218 | |
| | 15,035 | | | | 6.000 | | | | 01/01/42 | | | | 17,412 | |
| | 8,495 | | | | 4.500 | | | | 11/01/42 | | | | 9,266 | |
| | 1,749,223 | | | | 3.000 | | | | 12/01/42 | | | | 1,807,234 | |
| | 3,162,786 | | | | 3.000 | | | | 01/01/43 | | | | 3,269,080 | |
| | 825,939 | | | | 3.000 | | | | 04/01/43 | | | | 853,330 | |
| | 72,524 | | | | 4.500 | | | | 12/01/43 | | | | 79,845 | |
| | 2,000,000 | | | | 3.000 | | | | TBA-30yr | (g) | | | 2,051,719 | |
| | 100,000,000 | | | | 3.500 | | | | TBA-30yr | (g) | | | 104,859,380 | |
| | 1,000,000 | | | | 6.000 | | | | TBA-30yr | (g) | | | 1,140,469 | |
| | | | | | | | | | | | | | |
| | | | | | | | | | | | | 176,854,903 | |
| | |
| | TOTAL FEDERAL AGENCIES | | | $ | 178,656,165 | |
| | |
| | TOTAL MORTGAGE-BACKED OBLIGATIONS | |
| | (Cost $2,193,440,574) | | | $ | 2,193,957,947 | |
| | |
| | | | | | | | | | | | | | |
| | Agency Debentures – 2.4% | |
| | FFCB | | | | | | | | | | | | | |
| $ | 31,600,000 | | | | 3.440 | % | | | 06/17/30 | | | $ | 33,774,965 | |
| | 11,000,000 | | | | 2.850 | | | | 02/10/31 | | | | 10,875,777 | |
| | 3,000,000 | | | | 3.020 | | | | 04/09/31 | | | | 3,042,135 | |
| | FHLB(h) | | | | | | | | | | | | | |
| | 130,000,000 | | | | 0.000 | | | | 04/21/16 | | | | 129,984,400 | |
| | 150,000,000 | | | | 0.000 | | | | 04/26/16 | | | | 149,978,100 | |
| | |
| | TOTAL AGENCY DEBENTURES | | | | | |
| | (Cost $324,472,616) | | | $ | 327,655,377 | |
| | |
| | | | | | | | | | | | | | |
| | Asset-Backed Securities – 19.6% | |
| | Auto(b) – 0.1% | | | | | | | | | | | | | |
| Skopos Auto Receivables Trust Series 2015-1A, Class A | |
| $ | 5,170,249 | �� | | | 3.100 | % | | | 12/15/23 | | | $ | 5,167,307 | |
| Skopos Auto Receivables Trust Series 2015-2A, Class A | |
| | 9,915,743 | | | | 3.550 | | | | 02/15/20 | | | | 9,904,719 | |
| | | | | | | | | | | | | | |
| | | | | | | | | | | | | 15,072,026 | |
| | |
| | | | | | | | | | | | | | |
| | Asset-Backed Securities – (continued) | |
| | Collateralized Loan Obligations – 14.3% | |
| ACIS CLO Ltd. Series 2013-1A, Class ACOM(b)(c) | |
| $ | 23,550,000 | | | | 1.543 | % | | | 04/18/24 | | | $ | 22,400,760 | |
| ACIS CLO Ltd. Series 2013-2A, Class A(b)(c) | |
| | 8,596,364 | | | | 0.821 | | | | 10/14/22 | | | | 8,467,479 | |
| ACIS CLO Ltd. Series 2013-2A, Class ACOM(b)(c) | |
| | 53,626,295 | | | | 1.019 | | | | 10/14/22 | | | | 52,349,990 | |
| ACIS CLO Ltd. Series 2014-4A, Class ACOM(b)(c) | |
| | 177,900,000 | | | | 1.814 | | | | 05/01/26 | | | | 171,460,020 | |
| ACIS CLO Ltd. Series 2014-4A, Class C(b)(c) | |
| | 11,050,000 | | | | 2.879 | | | | 05/01/26 | | | | 9,122,604 | |
| B&M CLO Ltd. Series 2014-1A, Class A1(b)(c) | |
| | 74,650,000 | | | | 1.717 | | | | 04/16/26 | | | | 73,068,465 | |
| B&M CLO Ltd. Series 2014-1A, Class A2(b)(c) | |
| | 12,850,000 | | | | 2.267 | | | | 04/16/26 | | | | 12,135,964 | |
| Black Diamond CLO Ltd. Series 2006-1A, Class AD(b)(c) | |
| | 15,637,596 | | | | 0.868 | | | | 04/29/19 | | | | 15,309,269 | |
| Callidus Debt Partners CLO Fund VI Ltd. Series 6X, Class A1D(c) | |
| | 6,959,013 | | | | 0.576 | | | | 10/23/21 | | | | 6,840,167 | |
| Crown Point CLO lll Ltd. Series 2015-3A, Class ACOM(b)(c) | |
| | 32,600,000 | | | | 0.000 | | | | 12/31/27 | | | | 31,739,360 | |
| Crown Point CLO Ltd. Series 2012-1A, Class ACOM(b)(c) | |
| | 5,617,527 | | | | 0.000 | | | | 11/21/22 | | | | 5,549,555 | |
| Crown Point CLO Ltd. Series 2013-2A, Class ACOM(b)(c) | |
| | 118,100,000 | | | | 0.000 | | | | 12/14/23 | | | | 114,924,764 | |
| Cutwater 2015-I Ltd. Series 2015-1A, Class A2(b)(c) | |
| | 24,850,000 | | | | 1.851 | | | | 07/15/27 | | | | 24,199,725 | |
| Doral CLO 1 Ltd. Series 2012-3A, Class A1(b)(c) | |
| | 9,868,001 | | | | 2.020 | | | | 12/19/22 | | | | 9,755,121 | |
| Halcyon Loan Advisors Funding Ltd. Series 2014-1A,
Class A1(b)(c) |
|
| | 47,300,000 | | | | 1.845 | | | | 04/18/26 | | | | 46,321,268 | |
| Halcyon Loan Advisors Funding Ltd. Series 2014-2A,
Class A1B(b)(c) |
|
| | 64,150,000 | | | | 1.743 | | | | 04/28/25 | | | | 62,987,281 | |
| Halcyon Loan Advisors Funding Ltd. Series 2014-2A,
Class A2(b)(c) |
|
| | 55,600,000 | | | | 2.323 | | | | 04/28/25 | | | | 52,019,249 | |
| Halcyon Loan Advisors Funding Ltd. Series 2015-2A,
Class A(b)(c) |
|
| | 113,550,000 | | | | 1.720 | | | | 07/25/27 | | | | 110,206,293 | |
| ICG US CLO Ltd. Series 2014-1A, Class A1(b)(c) | |
| | 88,820,289 | | | | 1.467 | | | | 04/20/26 | | | | 86,644,903 | |
| ICG US CLO Ltd. Series 2014-1A, Class A2(b)(c) | |
| | 23,329,710 | | | | 2.067 | | | | 04/20/26 | | | | 21,643,415 | |
| Monroe Capital BSL CLO Ltd. Series 2015-1A, Class ACOM(b)(c) | |
| | 154,600,000 | | | | 1.931 | | | | 05/22/27 | | | | 151,121,500 | |
| Monroe Capital BSL CLO Ltd. Series 2015-1A, Class B(b)(c) | |
| | 10,248,000 | | | | 2.578 | | | | 05/22/27 | | | | 9,839,976 | |
| Mountain View Funding CLO Series 2007-3A, Class A1(b)(c) | |
| | 1,315,303 | | | | 0.532 | | | | 04/16/21 | | | | 1,309,238 | |
| Ocean Trails CLO Ltd. Series 2006-1X, Class A1(c) | |
| | 1,661,542 | | | | 0.571 | | | | 10/12/20 | | | | 1,637,938 | |
| OCP CLO Ltd. Series 2012-2A, Class ACOM(b)(c) | |
| | 14,722,660 | | | | 0.000 | | | | 11/22/23 | | | | 14,507,709 | |
| OCP CLO Ltd. Series 2014-5A, Class ACOM(b)(c) | |
| | 140,200,000 | | | | 0.000 | | | | 04/26/26 | | | | 134,802,300 | |
| | |
| | |
| 94 | | The accompanying notes are an integral part of these financial statements. |
GOLDMAN SACHS STRATEGIC INCOME FUND
| | | | | | | | | | | | | | |
Principal Amount | | | Interest Rate | | | Maturity Date | | | Value | |
| | | | | | | | | | | | | | |
| | Asset-Backed Securities – (continued) | |
| | Collateralized Loan Obligations – (continued) | |
| OFSI Fund V Ltd. Series 2013-5A, Class ACOM(b)(h) | |
| $ | 11,950,000 | | | | 0.000 | % | | | 04/17/25 | | | $ | 11,562,820 | |
| OFSI Fund VI Ltd. Series 2014-6A, Class A1(b)(c) | |
| | 32,975,300 | | | | 1.351 | | | | 03/20/25 | | | | 31,986,701 | |
| OFSI Fund VI Ltd. Series 2014-6A, Class ACOM(b)(c) | |
| | 120,000,000 | | | | 0.000 | | | | 03/20/25 | | | | 115,440,000 | |
| OFSI Fund VII Ltd. Series 2014-7A, Class ACOM(b)(c) | |
| | 146,000,000 | | | | 0.000 | | | | 10/18/26 | | | | 142,335,400 | |
| OHA Park Avenue CLO I Ltd. Series 2007-1A, Class A1A(b)(c) | |
| | 5,233,916 | | | | 0.752 | | | | 03/14/22 | | | | 5,126,605 | |
| Saratoga Investment CLO Corp. Series 2013-1A, Ltd.
Class A1(b)(c) |
|
| | 16,000,000 | | | | 1.617 | | | | 10/20/23 | | | | 15,879,520 | |
| Sound Point CLO VI Ltd. Series 2014-2A, Class B(b)(c) | |
| | 29,982,680 | | | | 2.297 | | | | 10/20/26 | | | | 28,260,655 | |
| Sound Point CLO VI Ltd. Series 2014-2A, Class C(b)(c) | |
| | 11,700,000 | | | | 3.217 | | | | 10/20/26 | | | | 11,112,145 | |
| Symphony CLO XI Ltd. Series 2013-11A, Class A(b)(c) | |
| | 6,500,000 | | | | 1.615 | | | | 01/17/25 | | | | 6,446,674 | |
| Trinitas CLO II Ltd. Series 2014-2A, Class ACOM(b)(c) | |
| | 57,100,000 | | | | 0.000 | | | | 07/15/26 | | | | 54,519,080 | |
| Trinitas CLO II Ltd. Series 2014-2A, Class C(b)(c) | |
| | 10,050,000 | | | | 3.131 | | | | 07/15/26 | | | | 8,257,763 | |
| Trinitas CLO Ltd. Series 2014-1A, Class A1(b)(c) | |
| | 58,150,000 | | | | 1.851 | | | | 04/15/26 | | | | 57,211,924 | |
| Trinitas CLO Ltd. Series 2014-1A, Class B1(b)(c) | |
| | 14,950,000 | | | | 2.221 | | | | 04/15/26 | | | | 13,787,966 | |
| Z Capital Credit Partners CLO Ltd. Series 2015-1A,
Class ACOM(b)(c) |
|
| | 120,650,000 | | | | 0.000 | | | | 07/16/27 | | | | 116,837,460 | |
| Zais CLO 1 Ltd. Series 2014-1A, Class ACOM(b)(c) | |
| | 93,200,000 | | | | 1.714 | | | | 04/15/26 | | | | 91,028,440 | |
| | | | | | | | | | | | | | |
| | | | | | | | | | | | | 1,960,157,466 | |
| | |
| | Home Equity – 1.2% | |
| ACE Securities Corp. Home Equity Loan Trust
Series 2007-ASAP1, Class A2C(c) |
|
| | 10,939,400 | | | | 0.696 | | | | 03/25/37 | | | | 6,318,141 | |
| ACE Securities Corp. Home Equity Loan Trust Series 2007-HE2,
Class A2D(c) |
|
| | 16,641,000 | | | | 0.706 | | | | 05/25/36 | | | | 10,568,636 | |
| Ameriquest Mortgage Securities, Inc. Asset-Backed Pass-Through
Certificates Series 05-R8, Class M2(c) |
|
| | 5,440,000 | | | | 0.926 | | | | 10/25/35 | | | | 4,935,234 | |
| Bayview Financial Mortgage Pass-Through Trust 2006-A,
Class M3(c) |
|
| | 10,095,000 | | | | 1.083 | | | | 02/28/41 | | | | 7,835,183 | |
| Bayview Opportunity Master Fund IIIb RPL Trust Series 2015-3,
Class A1(b)(i) |
|
| | 6,762,864 | | | | 3.623 | | | | 04/28/30 | | | | 6,762,436 | |
| Citigroup Mortgage Loan Trust Series 2006-WFH1, Class M3(c) | |
| | 6,400,000 | | | | 0.836 | | | | 01/25/36 | | | | 5,293,451 | |
| Citigroup Mortgage Loan Trust Series 2007-WFH2, Class A4(c) | |
| | 300,000 | | | | 0.786 | | | | 03/25/37 | | | | 269,765 | |
| | |
| | | | | | | | | | | | | | |
| | Asset-Backed Securities – (continued) | |
| | Home Equity – (continued) | |
| Credit-Based Asset Servicing and Securitization LLC
Series 2005-CB8, Class AF3(i) |
|
| $ | 8,886,000 | | | | 4.131 | % | | | 12/25/35 | | | $ | 8,346,132 | |
| First Franklin Mortgage Loan Trust Series 2006-FF12, Class A4(c) | |
| | 2,206,559 | | | | 0.576 | | | | 09/25/36 | | | | 1,998,454 | |
| First Franklin Mortgage Loan Trust Series 2006-FF6, Class A4(c) | |
| | 25,000,000 | | | | 0.686 | | | | 04/25/36 | | | | 19,663,383 | |
| GSAA Home Equity Trust Series 2007-10, Class A2A | |
| | 4,373,323 | | | | 6.500 | | | | 11/25/37 | | | | 3,099,883 | |
| GSAMP Trust Series 2006-HE8, Class A2C(c) | |
| | 17,492,032 | | | | 0.606 | | | | 01/25/37 | | | | 13,688,419 | |
| HSI Asset Securitization Corp. Trust Series 2006-OPT1,
Class 2A4(c) |
|
| | 8,600,000 | | | | 0.736 | | | | 12/25/35 | | | | 7,698,901 | |
| JPMorgan Mortgage Acquisition Trust Series 2006-CH1,
Class A5(c) |
|
| | 3,850,000 | | | | 0.665 | | | | 07/25/36 | | | | 3,607,731 | |
| JPMorgan Mortgage Acquisition Trust Series 2007-CH2,
Class AV5(c) |
|
| | 7,450,000 | | | | 0.696 | | | | 01/25/37 | | | | 5,678,040 | |
| Lehman XS Trust Series 2006-16N, Class A321(c) | |
| | 7,732,973 | | | | 0.636 | | | | 11/25/46 | | | | 5,551,443 | |
| Morgan Stanley Mortgage Loan Trust Series 2007-1XS,
Class 2A1(c) |
|
| | 7,832,750 | | | | 0.516 | | | | 09/25/46 | | | | 2,768,431 | |
| Saxon Asset Securities Trust Series 2007-2, Class A2C(c) | |
| | 6,874,306 | | | | 0.676 | | | | 05/25/47 | | | | 4,727,906 | |
| Securitized Asset Backed Receivables LLC Trust
Series 2004-DO1, Class M1(c) |
|
| | 4,889,592 | | | | 1.411 | | | | 07/25/34 | | | | 4,514,536 | |
| Structured Asset Securities Corp. Mortgage Loan Trust
Series 2006-BC3, Class A3(c) |
|
| | 3,178,111 | | | | 0.596 | | | | 10/25/36 | | | | 2,385,076 | |
| Structured Asset Securities Corp. Mortgage Loan Trust
Series 2007-EQ1, Class A1(c) |
|
| | 5,698,493 | | | | 0.651 | | | | 03/25/37 | | | | 4,155,533 | |
| Vericrest Opportunity Loan Trust XXV LLC Series 2015-NPL8,
Class A1(b)(i) |
|
| | 31,047,542 | | | | 3.500 | | | | 06/26/45 | | | | 30,701,983 | |
| Wachovia Mortgage Loan Trust Series 2005-WMC1, Class M1(c) | |
| | 4,188,952 | | | | 1.096 | | | | 10/25/35 | | | | 4,006,699 | |
| | | | | | | | | | | | | | |
| | | | | | | | | | | | | 164,575,396 | |
| | |
| | Student Loan(c) – 4.0% | |
| Access Group, Inc. Series 2006-1, Class A2 | |
| | 10,779,462 | | | | 0.739 | | | | 08/25/23 | | | | 10,698,651 | |
| Access Group, Inc. Series 2015-1, Class A(b) | |
| | 40,860,081 | | | | 1.133 | | | | 07/25/56 | | | | 39,133,939 | |
| GCO Education Loan Funding Trust Series 2006-1, Class A8L | |
| | 4,305,184 | | | | 0.759 | | | | 05/25/25 | | | | 4,170,628 | |
| Goal Capital Funding Trust Series 2006-1, Class A3 | |
| | 5,585,628 | | | | 0.749 | | | | 11/25/26 | | | | 5,567,823 | |
| Higher Education Funding I Series 2005-1, Class A4 | |
| | 22,400,000 | | | | 0.769 | | | | 02/25/30 | | | | 22,089,708 | |
| Nelnet Student Loan Trust Series 2005-4, Class A3 | |
| | 37,746,347 | | | | 0.754 | | | | 06/22/26 | | | | 37,155,473 | |
| | |
| | |
| The accompanying notes are an integral part of these financial statements. | | 95 |
GOLDMAN SACHS STRATEGIC INCOME FUND
Schedule of Investments (continued)
March 31, 2016
| | | | | | | | | | | | | | |
Principal Amount | | | Interest Rate | | | Maturity Date | | | Value | |
| | | | | | | | | | | | | | |
| | Asset-Backed Securities – (continued) | |
| | Student Loan(c) – (continued) | |
| Panhandle-Plains Higher Education Authority, Inc. Series 2011-1,
Class A2 |
|
| $ | 5,925,177 | | | | 1.575 | % | | | 07/01/24 | | | $ | 5,894,453 | |
| Scholar Funding Trust Series 2010-A, Class A(b) | |
| | 35,923,019 | | | | 1.371 | | | | 10/28/41 | | | | 33,424,835 | |
| SLC Student Loan Trust Series 2005-3, Class A3 | |
| | 8,800,000 | | | | 0.754 | | | | 06/15/29 | | | | 8,337,722 | |
| SLM Student Loan Trust Series 2003-14, Class A5 | |
| | 19,674,799 | | | | 0.849 | | | | 01/25/23 | | | | 19,378,177 | |
| SLM Student Loan Trust Series 2005-4, Class A3 | |
| | 72,545,435 | | | | 0.739 | | | | 01/25/27 | | | | 68,078,993 | |
| SLM Student Loan Trust Series 2005-5, Class A4 | |
| | 12,400,000 | | | | 0.759 | | | | 10/25/28 | | | | 11,664,029 | |
| SLM Student Loan Trust Series 2006-9, Class A4 | |
| | 4,191,585 | | | | 0.689 | | | | 10/25/22 | | | | 4,181,254 | |
| SLM Student Loan Trust Series 2007-1, Class A5 | |
| | 50,750,000 | | | | 0.709 | | | | 01/26/26 | | | | 48,188,064 | |
| SLM Student Loan Trust Series 2007-2, Class A4 | |
| | 81,200,000 | | | | 0.679 | | | | 07/25/22 | | | | 74,474,691 | |
| SLM Student Loan Trust Series 2008-2, Class A3 | |
| | 20,662,801 | | | | 1.369 | | | | 04/25/23 | | | | 19,802,941 | |
| SLM Student Loan Trust Series 2008-4, Class A4 | |
| | 40,600,000 | | | | 2.269 | | | | 07/25/22 | | | | 40,648,164 | |
| SLM Student Loan Trust Series 2008-5, Class A4 | |
| | 46,645,000 | | | | 2.319 | | | | 07/25/23 | | | | 46,672,479 | |
| SunTrust Student Loan Trust Series 2006-1A, Class A4(b) | |
| | 35,350,000 | | | | 0.811 | | | | 10/28/37 | | | | 32,597,709 | |
| Wachovia Student Loan Trust Series 2005-1, Class A5 | |
| | 12,012,417 | | | | 0.749 | | | | 01/26/26 | | | | 11,765,512 | |
| | | | | | | | | | | | | | |
| | | | | | | | | | | | | 543,925,245 | |
| | |
| | TOTAL ASSET-BACKED SECURITIES | | | | | |
| | (Cost $2,712,090,336) | | | $ | 2,683,730,133 | |
| | |
| | | | | | | | | | | | | | |
| | Foreign Debt Obligations – 15.8% | |
| | Sovereign – 15.2% | |
| Brazil Letras do Tesouro Nacional(h) | |
| BRL | 256,152,000 | | | | 0.000 | % | | | 01/01/17 | | | $ | 64,587,050 | |
| Brazil Loan Trust 1 | |
| $ | 7,668,544 | | | | 5.477 | | | | 07/24/23 | | | | 7,035,889 | |
| Brazil Notas do Tesouro Nacional | |
| BRL | 32,887,000 | | | | 10.000 | | | | 01/01/17 | | | | 8,910,634 | |
| | 45,853,686 | | | | 6.000 | | | | 08/15/40 | | | | 11,991,908 | |
| | 640,369,752 | | | | 6.000 | | | | 08/15/50 | | | | 165,671,472 | |
| Dominican Republic | |
| DOP | 61,100,000 | | | | 10.375 | | | | 03/04/22 | | | | 1,338,928 | |
| | 98,700,000 | | | | 14.500 | | | | 02/10/23 | | | | 2,456,342 | |
| $ | 17,540,000 | | | | 6.600 | (b) | | | 01/28/24 | | | | 18,592,400 | |
| | 16,850,000 | | | | 6.600 | | | | 01/28/24 | | | | 17,861,000 | |
| | 15,512,000 | | | | 5.875 | | | | 04/18/24 | | | | 15,899,800 | |
| | 75,910,000 | | | | 5.500 | (b) | | | 01/27/25 | | | | 75,720,225 | |
| | 8,375,000 | | | | 5.500 | | | | 01/27/25 | | | | 8,354,063 | |
| | 2,784,000 | | | | 8.625 | | | | 04/20/27 | | | | 3,173,760 | |
| DOP | 30,000,000 | | | | 18.500 | | | | 02/04/28 | | | | 928,607 | |
| | |
| | | | | | | | | | | | | | |
| | Foreign Debt Obligations – (continued) | |
| | Sovereign – (continued) | |
| Dominican Republic – (continued) | |
| DOP | 58,700,000 | | | | 11.375 | % | | | 07/06/29 | | | $ | 1,310,571 | |
| $ | 15,210,000 | | | | 7.450 | (b) | | | 04/30/44 | | | | 15,970,500 | |
| | 15,340,000 | | | | 7.450 | | | | 04/30/44 | | | | 16,107,000 | |
| | 7,850,000 | | | | 6.850 | | | | 01/27/45 | | | | 7,693,000 | |
| | 2,900,000 | | | | 6.850 | (b) | | | 01/27/45 | | | | 2,842,000 | |
| Italy Buoni Poliennali Del Tesoro | |
| EUR | 96,037,719 | | | | 2.100 | | | | 09/15/16 | | | | 111,674,562 | |
| | 202,050,323 | | | | 2.350 | | | | 09/15/19 | | | | 252,837,189 | |
| Japan Treasury Discount Bill(h) | |
| JPY | 37,130,000,000 | | | | 0.000 | | | | 04/18/16 | | | | 329,912,479 | |
| Japanese Government CPI Linked Bond | |
| | 2,075,770,200 | | | | 0.100 | | | | 09/10/24 | | | | 19,408,530 | |
| Republic of Costa Rica | |
| $ | 3,360,000 | | | | 9.995 | | | | 08/01/20 | | | | 4,078,200 | |
| | 10,280,000 | | | | 5.625 | | | | 04/30/43 | | | | 7,928,450 | |
| | 18,800,000 | | | | 7.158 | (b) | | | 03/12/45 | | | | 17,108,000 | |
| | 2,430,000 | | | | 7.158 | | | | 03/12/45 | | | | 2,211,300 | |
| Republic of Croatia | |
| | 15,660,000 | | | | 6.625 | | | | 07/14/20 | | | | 17,179,020 | |
| EUR | 10,110,000 | | | | 3.875 | | | | 05/30/22 | | | | 11,777,391 | |
| Republic of Honduras(b) | |
| $ | 13,980,000 | | | | 8.750 | | | | 12/16/20 | | | | 15,622,650 | |
| Republic of Indonesia | |
| | 13,166,000 | | | | 5.375 | | | | 10/17/23 | | | | 14,433,228 | |
| | 32,300,000 | | | | 5.875 | | | | 01/15/24 | | | | 36,337,500 | |
| | 31,370,000 | | | | 4.125 | | | | 01/15/25 | | | | 31,526,850 | |
| | 42,660,000 | | | | 4.750 | (b) | | | 01/08/26 | | | | 44,686,350 | |
| | 1,800,000 | | | | 5.250 | | | | 01/17/42 | | | | 1,809,000 | |
| | 5,140,000 | | | | 6.750 | | | | 01/15/44 | | | | 6,194,651 | |
| | 9,710,000 | | | | 5.125 | | | | 01/15/45 | | | | 9,661,450 | |
| Republic of Sri Lanka | |
| | 8,819,000 | | | | 6.125 | | | | 06/03/25 | | | | 8,069,385 | |
| Republic of Venezuela | |
| | 28,990,000 | | | | 7.750 | | | | 10/13/19 | | | | 10,871,250 | |
| | 6,130,000 | | | | 12.750 | (j) | | | 08/23/22 | | | | 2,635,900 | |
| | 18,317,000 | | | | 9.000 | | | | 05/07/23 | | | | 6,410,950 | |
| | 54,030,000 | | | | 8.250 | | | | 10/13/24 | | | | 18,370,200 | |
| | 9,230,000 | | | | 11.750 | | | | 10/21/26 | | | | 3,622,775 | |
| | 23,330,000 | | | | 9.250 | | | | 05/07/28 | | | | 8,223,825 | |
| | 18,810,000 | | | | 11.950 | | | | 08/05/31 | | | | 7,429,950 | |
| Spain Government Inflation Linked Bond(b) | |
| EUR | 121,954,862 | | | | 0.550 | | | | 11/30/19 | | | | 143,906,993 | |
| United Mexican States | |
| MXN | 1,242,540,430 | | | | 0.000 | (h) | | | 04/28/16 | | | | 71,618,957 | |
| | 1,468,425,940 | | | | 0.000 | (h) | | | 05/12/16 | | | | 84,515,564 | |
| | 1,594,311,900 | | | | 0.000 | (h) | | | 06/16/16 | | | | 91,551,207 | |
| | 1,632,738,142 | | | | 5.000 | | | | 06/16/16 | | | | 94,700,967 | |
| | 309,206,360 | | | | 0.000 | (h) | | | 06/23/16 | | | | 17,715,901 | |
| | 1,600,614,300 | | | | 4.750 | | | | 06/14/18 | | | | 93,077,688 | |
| | 241,369,600 | | | | 6.500 | | | | 06/10/21 | | | | 14,673,341 | |
| | 154,502,100 | | | | 8.000 | | | | 12/07/23 | | | | 10,174,966 | |
| | 39,328,100 | | | | 10.000 | | | | 12/05/24 | | | | 2,922,209 | |
| | 75,763,000 | | | | 8.500 | | | | 05/31/29 | | | | 5,244,373 | |
| | 475,100 | | | | 10.000 | | | | 11/20/36 | | | | 37,845 | |
| | |
| | |
| 96 | | The accompanying notes are an integral part of these financial statements. |
GOLDMAN SACHS STRATEGIC INCOME FUND
| | | | | | | | | | | | | | |
Principal Amount | | | Interest Rate | | | Maturity Date | | | Value | |
| | | | | | | | | | | | | | |
| | Foreign Debt Obligations – (continued) | |
| | Sovereign – (continued) | |
| United Mexican States – (continued) | |
| $ | 780,000 | | | | 6.050 | % | | | 01/11/40 | | | $ | 914,550 | |
| | 2,890,000 | | | | 4.750 | | | | 03/08/44 | | | | 2,890,000 | |
| | 2,318,000 | | | | 4.600 | | | | 01/23/46 | | | | 2,271,640 | |
| | | | | | | | | | | | | | |
| | | | | | | | | | | | | 2,082,682,385 | |
| | |
| | Supranational – 0.6% | |
| European Investment Bank | |
| GBP | 29,200,000 | | | | 3.875 | | | | 06/08/37 | | | | 51,949,192 | |
| | 16,900,000 | | | | 5.000 | | | | 04/15/39 | | | | 34,844,305 | |
| | | | | | | | | | | | | | |
| | | | | | | | | | | | | 86,793,497 | |
| | |
| | TOTAL FOREIGN DEBT OBLIGATIONS | |
| | (Cost $2,311,262,010) | | | $ | 2,169,475,882 | |
| | |
| | | | | | | | | | | | | | |
| | Structured Note – 0.0% | |
| Notas do Tesouro Nacional Series B (Issuer HSBC Corp.) | |
| $ | 7,809,491 | | | | 6.000 | % | | | 08/15/40 | | | $ | 2,042,381 | |
| | (Cost $4,217,901) | | | | | |
| | |
| | | | | | | | | | | | | | |
| | Municipal Debt Obligations – 1.8% | |
| | Puerto Rico – 1.8% | |
| Puerto Rico Commonwealth Aqueduct & Sewer Authority RB
(Senior Lien) Series 2008 A |
|
| $ | 4,955,000 | | | | 6.000 | % | | | 07/01/38 | | | $ | 3,332,237 | |
| | 17,570,000 | | | | 6.000 | | | | 07/01/44 | | | | 11,771,900 | |
| Puerto Rico Commonwealth Aqueduct & Sewer Authority RB
(Senior Lien) Series 2012 A |
|
| | 6,730,000 | | | | 5.750 | | | | 07/01/37 | | | | 4,475,450 | |
| Puerto Rico Commonwealth Aqueduct & Sewer Authority RB
(Senior Lien) Series 2012 D |
|
| | 2,680,000 | | | | 5.000 | | | | 07/01/33 | | | | 1,735,300 | |
| Puerto Rico Commonwealth GO Bonds for Public Improvement
Series 2011 A |
|
| | 3,020,000 | | | | 5.750 | | | | 07/01/41 | | | | 1,804,450 | |
| Puerto Rico Commonwealth GO Bonds Refunding for Public
Improvement Series 2008 A |
|
| | 1,485,000 | | | | 5.500 | | | | 07/01/32 | | | | 883,575 | |
| Puerto Rico Commonwealth GO Bonds Refunding for Public
Improvement Series 2009 B |
|
| | 1,150,000 | | | | 5.875 | | | | 07/01/36 | | | | 688,563 | |
| | 3,340,000 | | | | 5.750 | | | | 07/01/38 | | | | 1,995,650 | |
| Puerto Rico Commonwealth GO Bonds Refunding for Public
Improvement Series 2009 C |
|
| | 1,285,000 | | | | 6.000 | | | | 07/01/39 | | | | 769,394 | |
| Puerto Rico Commonwealth GO Bonds Refunding for Public
Improvement Series 2011 A |
|
| | 1,110,000 | | | | 6.000 | | | | 07/01/34 | | | | 664,613 | |
| Puerto Rico Commonwealth GO Bonds Refunding for Public
Improvement Series 2011 E |
|
| | 1,000,000 | | | | 5.625 | | | | 07/01/32 | | | | 596,250 | |
| | |
| | | | | | | | | | | | | | |
| | Municipal Debt Obligations – (continued) | |
| | Puerto Rico – (continued) | |
| Puerto Rico Commonwealth GO Bonds Refunding for Public
Improvement Series 2012 A |
|
| $ | 515,000 | | | | 5.500 | % | | | 07/01/26 | | | $ | 309,644 | |
| | 5,720,000 | | | | 5.750 | | | | 07/01/28 | | | | 3,446,300 | |
| | 455,000 | | | | 5.500 | | | | 07/01/39 | | | | 270,725 | |
| | 2,095,000 | | | | 5.000 | | | | 07/01/41 | | | | 1,241,287 | |
| Puerto Rico Commonwealth GO Bonds Series 2007 A | |
| | 5,270,000 | | | | 5.250 | | | | 07/01/37 | | | | 3,129,062 | |
| Puerto Rico Commonwealth GO Bonds Series 2014 A | |
| | 112,780,000 | | | | 8.000 | | | | 07/01/35 | | | | 77,536,250 | |
| Puerto Rico Commonwealth GO Bonds Unrefunded Balance for
Public Improvement Series 2001 A |
|
| | 1,950,000 | | | | 5.125 | | | | 07/01/31 | | | | 1,157,812 | |
| Puerto Rico Commonwealth GO Bonds Unrefunded Balance for
Public Improvement Series 2004 A |
|
| | 455,000 | | | | 5.000 | | | | 07/01/34 | | | | 269,588 | |
| Puerto Rico Commonwealth GO Bonds Unrefunded Balance for
Public Improvement Series 2006 A |
|
| | 605,000 | | | | 5.250 | | | | 07/01/27 | | | | 363,000 | |
| Puerto Rico Sales Tax Financing Corp. Sales Tax RB Capital
Appreciation Series 2010 A(h) |
|
| | 1,990,000 | | | | 0.000 | | | | 08/01/35 | | | | 208,572 | |
| Puerto Rico Sales Tax Financing Corp. Sales Tax RB Capital
Appreciation SubSeries 2010 C(h) |
|
| | 5,285,000 | | | | 0.000 | | | | 08/01/37 | | | | 498,693 | |
| | 4,305,000 | | | | 0.000 | | | | 08/01/38 | | | | 380,519 | |
| Puerto Rico Sales Tax Financing Corp. Sales Tax RB
Series 2011 C |
|
| | 1,205,000 | | | | 5.250 | | | | 08/01/40 | | | | 732,038 | |
| Puerto Rico Sales Tax Financing Corp. Sales Tax RB
SubSeries 2009 A |
|
| | 1,005,000 | | | | 5.500 | | | | 08/01/23 | | | | 434,663 | |
| | 1,650,000 | | | | 5.250 | | | | 08/01/27 | | | | 676,500 | |
| | 35,660,000 | | | | 0.000 | (i) | | | 08/01/32 | | | | 13,819,320 | |
| | 20,990,000 | | | | 5.750 | | | | 08/01/37 | | | | 8,763,325 | |
| | 155,000 | | | | 6.375 | | | | 08/01/39 | | | | 66,069 | |
| | 30,650,000 | | | | 6.000 | | | | 08/01/42 | | | | 12,949,625 | |
| | 500,000 | | | | 6.500 | | | | 08/01/44 | | | | 213,750 | |
| Puerto Rico Sales Tax Financing Corp. Sales Tax RB
SubSeries 2010 A |
|
| | 9,275,000 | | | | 0.000 | (i) | | | 08/01/33 | | | | 2,461,585 | |
| | 19,375,000 | | | | 5.500 | | | | 08/01/37 | | | | 7,992,187 | |
| | 20,435,000 | | | | 5.375 | | | | 08/01/39 | | | | 8,378,350 | |
| | 53,680,000 | | | | 5.500 | | | | 08/01/42 | | | | 22,143,000 | |
| Puerto Rico Sales Tax Financing Corp. Sales Tax RB
SubSeries 2010 C |
|
| | 5,965,000 | | | | 5.375 | | | | 08/01/38 | | | | 2,445,650 | |
| | 1,935,000 | | | | 6.000 | | | | 08/01/39 | | | | 817,537 | |
| | 61,625,000 | | | | 5.250 | | | | 08/01/41 | | | | 25,112,187 | |
| Puerto Rico Sales Tax Financing Corp. Sales Tax RB
SubSeries 2011 A-1 |
|
| | 14,040,000 | | | | 5.000 | | | | 08/01/43 | | | | 5,651,100 | |
| | 9,575,000 | | | | 5.250 | | | | 08/01/43 | | | | 3,901,812 | |
| | |
| | |
| The accompanying notes are an integral part of these financial statements. | | 97 |
GOLDMAN SACHS STRATEGIC INCOME FUND
Schedule of Investments (continued)
March 31, 2016
| | | | | | | | | | | | | | |
Principal Amount | | | Interest Rate | | | Maturity Date | | | Value | |
| | | | | | | | | | | | | | |
| | Municipal Debt Obligations – (continued) | |
| | Puerto Rico – (continued) | |
| Puerto Rico Sales Tax Financing Corp. Sales Tax RB Unrefunded
SubSeries 2009 A |
|
| $ | 29,245,000 | | | | 5.500 | % | | | 08/01/28 | | | $ | 12,136,675 | |
| | |
| | TOTAL MUNICIPAL DEBT OBLIGATIONS | |
| | (Cost $379,955,347) | | | $ | 246,224,207 | |
| | |
| | | | | | | | | | | | | | |
| | U.S. Treasury Obligations – 20.3% | |
| United States Treasury Bills(h) | |
| $ | 925,000,000 | | | | 0.000 | % | | | 04/21/16 | | | $ | 924,946,017 | |
| | 400,000,000 | | | | 0.000 | | | | 06/30/16 | | | | 399,795,012 | |
| United States Treasury Bonds | |
| | 293,600,000 | | | | 2.875 | | | | 08/15/45 | | | | 308,964,094 | |
| | 42,400,000 | | | | 3.000 | (k) | | | 11/15/45 | | | | 45,794,970 | |
| United States Treasury Inflation Protected Securities | |
| | 41,877,655 | | | | 0.125 | | | | 04/15/17 | | | | 42,361,760 | |
| | 38,635,090 | | | | 2.625 | (i)(k) | | | 07/15/17 | | | | 40,675,409 | |
| | 34,375,020 | | | | 0.125 | | | | 04/15/19 | | | | 35,132,302 | |
| | 71,384,258 | | | | 0.125 | | | | 01/15/22 | | | | 72,532,831 | |
| | 110,399,931 | | | | 0.375 | | | | 07/15/23 | | | | 113,832,265 | |
| | 45,902,165 | | | | 0.625 | | | | 01/15/24 | | | | 47,845,663 | |
| | 28,534,792 | | | | 0.125 | | | | 07/15/24 | | | | 28,668,620 | |
| | 22,178,742 | | | | 2.500 | | | | 01/15/29 | | | | 27,910,616 | |
| | 88,689,625 | | | | 1.375 | | | | 02/15/44 | | | | 99,595,788 | |
| United States Treasury Notes | |
| | 410,000,000 | | | | 0.250 | | | | 05/15/16 | | | | 409,979,512 | |
| | 75,900,000 | | | | 1.625 | | | | 06/30/20 | | | | 77,416,476 | |
| | 111,000,000 | | | | 2.000 | | | | 07/31/20 | | | | 114,960,489 | |
| | |
| | TOTAL U.S. TREASURY OBLIGATIONS | |
| | (Cost $2,761,714,659) | | | $ | 2,790,411,824 | |
| | |
| | | | | | | | | | | | | | |
| | Bank Loans(l) – 3.4% | |
| | Automotive – 0.0% | |
| Chrysler Group LLC | |
| $ | 5,513,136 | | | | 3.500 | % | | | 05/24/17 | | | $ | 5,509,332 | |
| | |
| | Building Materials – 0.0% | |
| Atkore International, Inc. | |
| | 6,790,000 | | | | 7.750 | | | | 10/09/21 | | | | 6,178,900 | |
| | |
| | Consumer Cyclical Services – Business – 0.2% | |
| First Data Corp. | |
| | 25,075,000 | | | | 4.182 | | | | 07/08/22 | | | | 24,899,475 | |
| | |
| | Energy – 0.5% | |
| American Energy – Marcellus LLC | |
| | 24,800,885 | | | | 5.250 | | | | 08/04/20 | | | | 4,050,729 | |
| | 10,300,000 | | | | 8.500 | | | | 08/04/21 | | | | 394,799 | |
| Magnum Hunter Resources, Inc. | |
| | 20,268,720 | | | | 9.000 | | | | 09/15/16 | | | | 20,066,033 | |
| | 96,554,092 | | | | 0.000 | (d) | | | 10/22/19 | | | | 41,228,597 | |
| | | | | | | | | | | | | | |
| | | | | | | | | | | | | 65,740,158 | |
| | |
| | | | | | | | | | | | | | |
| | Bank Loans(l) – (continued) | |
| | Energy – Exploration & Production – 0.1% | |
| EP Energy LLC | |
| $ | 12,810,626 | | | | 3.500 | % | | | 05/24/18 | | | $ | 8,422,986 | |
| | |
| | Entertainment – 0.1% | |
| WMG Acquisition Corp. | |
| | 6,778,684 | | | | 3.750 | | | | 07/01/20 | | | | 6,674,157 | |
| | |
| | Environmental – 0.2% | |
| EnergySolutions LLC | |
| | 36,962,579 | | | | 6.750 | | | | 05/29/20 | | | | 34,005,572 | |
| | |
| | Food & Beverages – 0.3% | |
| Shearer’s Foods, Inc. | |
| | 16,340,736 | | | | 7.750 | | | | 06/30/22 | | | | 15,033,478 | |
| | US Foods, Inc. | | | | | | | | | | | | | |
| | 21,348,197 | | | | 4.500 | | | | 03/31/19 | | | | 21,233,770 | |
| | | | | | | | | | | | | | |
| | | | | | | | | | | | | 36,267,248 | |
| | |
| | Gaming – 0.1% | |
| MGM Resorts International | |
| | 11,325,476 | | | | 3.500 | | | | 12/20/19 | | | | 11,293,086 | |
| | |
| | Health Care – 0.1% | |
| American Renal Holdings, Inc. | |
| | 18,771,176 | | | | 8.500 | | | | 03/20/20 | | | | 18,395,752 | |
| | |
| | Health Care – Services – 0.3% | |
| MPH Acquisition Holdings LLC | |
| | 23,935,213 | | | | 3.750 | | | | 03/31/21 | | | | 23,683,893 | |
| Sedgwick Claims Management Services, Inc. | |
| | 8,118,837 | | | | 3.750 | | | | 03/01/21 | | | | 7,888,830 | |
| | 8,375,909 | | | | 6.750 | | | | 02/28/22 | | | | 7,758,186 | |
| | 8,910,000 | | | | 6.750 | | | | 02/28/22 | | | | 8,252,887 | |
| | | | | | | | | | | | | | |
| | | | | | | | | | | | | 47,583,796 | |
| | |
| | Media – Broadcasting & Radio – 0.2% | |
| Getty Images, Inc. | |
| | 35,679,373 | | | | 4.750 | | | | 10/18/19 | | | | 26,422,003 | |
| | |
| | Media – Cable – 0.0% | |
| Neptune Finco Corp. | |
| | 1,375,000 | | | | 5.000 | | | | 10/09/22 | | | | 1,374,780 | |
| | |
| | Media – Non Cable – 0.4% | |
| Checkout Holding Corp. | |
| | 46,758,393 | | | | 4.500 | | | | 04/09/21 | | | | 39,744,634 | |
| | 16,750,000 | | | | 7.750 | | | | 04/11/22 | | | | 10,265,405 | |
| | | | | | | | | | | | | | |
| | | | | | | | | | | | | 50,010,039 | |
| | |
| | Pharmaceutical – 0.1% | |
| Valeant Pharmaceuticals International, Inc. | |
| | 13,188,016 | | | | 4.000 | | | | 04/01/22 | | | | 12,435,244 | |
| | |
| | Retailers – 0.4% | |
| Neiman Marcus Group Ltd., Inc. | |
| | 26,307,888 | | | | 4.250 | | | | 10/25/20 | | | | 24,051,987 | |
| Petco Animal Supplies, Inc. | |
| | 8,500,000 | | | | 5.750 | | | | 01/26/23 | | | | 8,486,995 | |
| True Religion Apparel, Inc. | |
| | 57,140,833 | | | | 5.875 | | | | 07/30/19 | | | | 25,141,966 | |
| | |
| | |
| 98 | | The accompanying notes are an integral part of these financial statements. |
GOLDMAN SACHS STRATEGIC INCOME FUND
| | | | | | | | | | | | | | |
Principal Amount | | | Interest Rate | | | Maturity Date | | | Value | |
| | | | | | | | | | | | | | |
| | Bank Loans(l) – (continued) | |
| | Retailers – (continued) | |
| True Religion Apparel, Inc. – (continued) | |
| $ | 8,400,000 | | | | 11.000 | % | | | 01/30/20 | | | $ | 3,360,000 | |
| | | | | | | | | | | | | | |
| | | | | | | | | | | | | 61,040,948 | |
| | |
| | Services Cyclical – Business Services – 0.1% | |
| ADS Waste Holdings, Inc. | |
| | 12,256,056 | | | | 3.750 | | | | 10/09/19 | | | | 12,143,668 | |
| | |
| | Technology – Software – 0.2% | |
| BMC Software Finance, Inc. | |
| | 18,492,451 | | | | 5.000 | | | | 09/10/20 | | | | 15,470,045 | |
| Renaissance Learning, Inc. | |
| | 1,700,000 | | | | 8.000 | | | | 04/11/22 | | | | 1,504,500 | |
| TTM Technologies, Inc. | |
| | 6,298,306 | | | | 6.000 | | | | 05/31/21 | | | | 5,967,645 | |
| | | | | | | | | | | | | | |
| | | | | | | | | | | | | 22,942,190 | |
| | |
| | Technology – Software/Services – 0.1% | |
| NXP BV | |
| | 7,980,000 | | | | 3.750 | | | | 12/07/20 | | | | 7,992,449 | |
| | |
| | TOTAL BANK LOANS | |
| | (Cost $600,313,157) | | | $ | 459,331,783 | |
| | |
| | | | | | | | |
| Shares | | Rate | | | Value | |
| | | | | | | | |
| Preferred Stocks – 0.7% | |
| Banks – 0.4% | |
Citigroup Capital XIII(c) | |
| 797,300 | | | 6.988 | % | | $ | 20,961,017 | |
ING Groep NV | |
| 707,693 | | | 6.125 | | | | 17,982,479 | |
| 248,139 | | | 6.200 | | | | 6,312,656 | |
| 300,962 | | | 6.375 | | | | 7,743,752 | |
| | | | | | | | |
| | | | | | | 52,999,904 | |
| |
| Diversified Financial Services(c) – 0.3% | |
GMAC Capital Trust I | |
| 1,971,974 | | | 6.402 | | | | 48,333,083 | |
| |
| TOTAL PREFERRED STOCKS – 0.7% | |
| (Cost $106,283,863) | | | $ | 101,332,987 | |
| |
| | | | | | | | |
| Investment Company(c)(m) – 18.8% | |
Goldman Sachs Financial Square Government Fund – FST Institutional Shares | |
| $2,576,641,388 | | | 0.250 | % | | $ | 2,576,641,388 | |
| (Cost $2,576,641,388) | | | | | |
| |
| | | | | | | | | | | | | | |
Principal
Amount | | | Interest
Rate | | | Maturity
Date | | | Value | |
| | Short-term Investments(h) – 2.1% | |
| | Commercial Paper – 2.1% | |
| AutoZone, Inc. | |
| $ | 10,000,000 | | | | 0.000 | % | | | 04/08/16 | | | $ | 9,998,658 | |
| Dominion Resources, Inc. | |
| | 13,350,000 | | | | 0.000 | | | | 04/12/16 | | | | 13,347,063 | |
| Duke Energy Corp. | |
| | 25,000,000 | | | | 0.000 | | | | 04/12/16 | | | | 24,993,431 | |
| | 30,000,000 | | | | 0.000 | | | | 05/18/16 | | | | 29,963,575 | |
| | Eaton Corp. | | | | | | | | | | | | | |
| | 12,997,000 | | | | 0.000 | | | | 04/07/16 | | | | 12,995,375 | |
| Marriott International, Inc. | |
| | 10,100,000 | | | | 0.000 | | | | 04/22/16 | | | | 10,095,581 | |
| | 7,600,000 | | | | 0.000 | | | | 04/15/16 | | | | 7,597,636 | |
| Mondelez International, Inc. | |
| | 17,000,000 | | | | 0.000 | | | | 05/03/16 | | | | 16,987,911 | |
| Southern Co. | |
| | 1,850,000 | | | | 0.000 | | | | 04/01/16 | | | | 1,850,000 | |
| St. Jude Medical, Inc. | |
| | 50,000,000 | | | | 0.000 | | | | 04/01/16 | | | | 50,000,000 | |
| United Healthcare Co. | |
| | 50,000,000 | | | | 0.000 | | | | 04/19/16 | | | | 49,981,000 | |
| | 31,100,000 | | | | 0.000 | | | | 05/09/16 | | | | 31,072,097 | |
| Virginia Electric & Power | |
| | 24,500,000 | | | | 0.000 | | | | 05/09/16 | | | | 24,478,794 | |
| | |
| | TOTAL SHORT-TERM INVESTMENTS | |
| | (Cost $283,361,121) | | | $ | 283,361,121 | |
| | |
| | TOTAL INVESTMENTS – 110.3% | |
| | (Cost $15,601,133,869) | | | $ | 15,125,832,507 | |
| | |
| | | | | | | | | | | | | | |
| | Reverse Repurchase Agreement – (0.1)% | |
| First Boston Reverse Repurchase Agreement | |
| $ | (2,663,485 | ) | | | (0.500 | )% | | | 02/04/17 | | | $ | (2,663,485 | ) |
| | (Cost $(2,663,485)) | | | | | |
| | |
| LIABILITIES IN EXCESS OF
OTHER ASSETS – (10.2)% |
| | | (1,405,052,917 | ) |
| | |
| | NET ASSETS – 100.0% | | | $ | 13,718,116,105 | |
| | |
| | |
| The percentage shown for each investment category reflects the value of investments in that category as a percentage of net assets. |
(a) | | Security with “Call” features with resetting interest rates. Maturity dates disclosed are the final maturity dates. |
(b) | | Exempt from registration under Rule 144A of the Securities Act of 1933. Such securities may be deemed liquid by the investment adviser and may be resold, normally to qualified institutional buyers in transactions exempt from registration. Total market value of Rule 144A securities amounts to $3,133,721,530, which represents approximately 22.8% of net assets as of March 31, 2016. |
(c) | | Variable rate security. Interest rate or distribution rate disclosed is that which is in effect on March 31, 2016. |
(d) | | Security is currently in default and/or non-income producing. |
(e) | | Pay-in-kind securities. |
| | |
| The accompanying notes are an integral part of these financial statements. | | 99 |
GOLDMAN SACHS STRATEGIC INCOME FUND
Schedule of Investments (continued)
March 31, 2016
| | |
(f) | | Security with a notional or nominal principal amount. The actual effective yield of this security is different than the stated interest rate. |
(g) | | TBA (To Be Announced) Securities are purchased on a forward commitment basis with an approximate principal amount and no defined maturity date. The actual principal and maturity date will be determined upon settlement when the specific mortgage pools are assigned. Total market value of TBA securities (excluding forward sales contracts, if any) amounts to $108,051,568 which represents approximately 0.8% of net assets as of March 31, 2016. |
(h) | | Issued with a zero coupon. Income is recognized through the accretion of discount. |
(i) | | Coupon changes periodically based upon a predetermined schedule. Interest rate disclosed is that which is in effect on March 31, 2016. |
(j) | | All or a portion of the security was pledged as collateral against open reverse repurchase agreements. As of March 31, 2016, the value of securities pledged amounted to $2,635,900. |
(k) | | All or a portion of security is segregated as collateral for initial margin requirements on futures transactions. |
(l) | | Bank Loans often require prepayments from excess cash flows or permit the borrower to repay at its election. The degree to which borrowers repay, whether as a contractual requirement or at their election, cannot be predicted with accuracy. As a result, the actual remaining maturity may be substantially less than the stated maturities shown. The stated interest rate represents the weighted average interest rate of all contracts within the bank loan facility on March 31, 2016. Bank Loans typically have rates of interest which are predetermined either daily, monthly, quarterly or semi-annually by reference to a base lending rate, plus a premium. These base lending rates are primarily the London-Interbank Offered Rate (“LIBOR”), and secondarily the prime rate offered by one or more major United States banks (the “Prime Rate”) and the certificate of deposit (“CD”) rate or other base lending rates used by commercial lenders. |
(m) | | Represents an affiliated fund. |
| | |
|
Currency Abbreviations: |
AED | | —United Arab Emirates Dirham |
AUD | | —Australian Dollar |
BRL | | —Brazilian Real |
CAD | | —Canadian Dollar |
CHF | | —Swiss Franc |
CNH | | —Chinese Yuan Renminbi Offshore |
CNY | | —Chinese Yuan Renminbi |
COP | | —Colombian Peso |
DOP | | —Dominican Peso |
EUR | | —Euro |
GBP | | —British Pound |
HKD | | —Hong Kong Dollar |
HUF | | —Hungarian Forint |
IDR | | —Indonesian Rupiah |
INR | | —Indian Rupee |
JPY | | —Japanese Yen |
KRW | | —South Korean Won |
MXN | | —Mexican Peso |
MYR | | —Malaysian Ringgit |
NOK | | —Norwegian Krone |
NZD | | —New Zealand Dollar |
PLN | | —Polish Zloty |
RUB | | —Russian Ruble |
SEK | | —Swedish Krona |
SGD | | —Singapore Dollar |
THB | | —Thai Baht |
TRY | | —Turkish Lira |
TWD | | —Taiwan Dollar |
USD | | —U.S. Dollar |
ZAR | | —South African Rand |
Investment Abbreviations: |
AUDOR | | —Australian Dollar Offered Rate |
BP | | —British Pound Offered Rate |
CDOR | | —Canadian Dollar Offered Rate |
CLO | | —Collateralized Loan Obligation |
CPI | | —Consumer Price Index |
EURO | | —Euro Offered Rate |
FFCB | | —Federal Farm Credit Bank |
FHLB | | —Federal Home Loan Bank |
FHLMC | | —Federal Home Loan Mortgage Corp. |
FNMA | | —Federal National Mortgage Association |
FREMF | | —Freddie Mac Multi Family |
GMAC | | —General Motors Acceptance Corporation |
GNMA | | —Government National Mortgage Association |
GO | | —General Obligation |
JIBAR | | —Johannesburg Interbank Agreed Rate |
JYOR | | —Japanese Yen Offered Rate |
KLIBOR | | —Kuala Lumpur Interbank Offered Rate |
KWCDC | | —South Korean Won Certificate of Deposit |
LIBOR | | —London Interbank Offered Rate |
LLC | | —Limited Liability Company |
NIBOR | | —Norwegian Interbank Offered Rate |
NZDOR | | —New Zealand Dollar Offered Rate |
RB | | —Revenue Bond |
REMIC | | —Real Estate Mortgage Investment Conduit |
STIBOR | | —Stockholm Interbank Offered Rate |
STRIPS | | —Separate Trading of Registered Interest and Principal of Securities |
WIBOR | | —Warsaw Interbank Offered Rate |
|
| | |
| 100 | | The accompanying notes are an integral part of these financial statements. |
GOLDMAN SACHS STRATEGIC INCOME FUND
|
| ADDITIONAL INVESTMENT INFORMATION |
FORWARD FOREIGN CURRENCY EXCHANGE CONTRACTS — At March 31, 2016, the Fund had the following forward foreign currency exchange contracts:
FORWARD FOREIGN CURRENCY EXCHANGE CONTRACTS WITH UNREALIZED GAIN
| | | | | | | | | | | | | | | | | | | | | | | | |
| Counterparty | | Currency
Purchased | | | Currency
Sold | | | Current
Value | | | Settlement
Date | | | Unrealized
Gain | |
Bank of America Securities LLC | | AUD | | | 75,372,260 | | | USD | | | 56,418,398 | | | $ | 57,702,096 | | | | 04/28/16 | | | $ | 1,283,698 | |
| | BRL | | | 136,032,911 | | | USD | | | 37,073,000 | | | | 37,787,595 | | | | 04/04/16 | | | | 714,595 | |
| | CAD | | | 272,371,204 | | | USD | | | 195,744,623 | | | | 209,722,115 | | | | 04/06/16 | | | | 13,977,492 | |
| | GBP | | | 14,726,424 | | | USD | | | 21,134,437 | | | | 21,151,257 | | | | 04/07/16 | | | | 16,821 | |
| | HUF | | | 6,235,539,674 | | | EUR | | | 19,838,000 | | | | 22,592,200 | | | | 04/26/16 | | | | 967 | |
| | JPY | | | 46,872,644,898 | | | USD | | | 413,667,820 | | | | 416,814,528 | | | | 04/26/16 | | | | 3,146,708 | |
| | NZD | | | 139,152,000 | | | USD | | | 92,787,389 | | | | 96,049,120 | | | | 04/26/16 | | | | 3,261,732 | |
| | PLN | | | 181,979,464 | | | EUR | | | 42,224,000 | | | | 48,751,168 | | | | 04/26/16 | | | | 667,077 | |
| | RUB | | | 2,677,847,359 | | | USD | | | 35,911,000 | | | | 39,811,596 | | | | 04/04/16 | | | | 3,900,596 | |
| | SEK | | | 2,888,824,076 | | | EUR | | | 309,761,079 | | | | 356,169,501 | | | | 04/26/16 | | | | 3,417,979 | |
| | SEK | | | 1,433,759,000 | | | USD | | | 166,912,887 | | | | 176,727,745 | | | | 04/19/16 | | | | 9,814,858 | |
| | USD | | | 51,013,113 | | | BRL | | | 183,457,947 | | | | 50,961,451 | | | | 04/04/16 | | | | 51,662 | |
Barclays Bank PLC | | AUD | | | 91,468,000 | | | USD | | | 68,862,156 | | | | 70,030,890 | | | | 04/26/16 | | | | 1,168,735 | |
| | CAD | | | 29,922,721 | | | USD | | | 22,889,000 | | | | 23,040,603 | | | | 04/26/16 | | | | 151,603 | |
| | CNH | | | 183,736,605 | | | USD | | | 26,792,901 | | | | 28,210,099 | | | | 09/01/16 | | | | 1,417,198 | |
| | CNY | | | 42,143,731 | | | USD | | | 6,380,580 | | | | 6,504,731 | | | | 05/19/16 | | | | 124,151 | |
| | CNY | | | 171,434,712 | | | USD | | | 25,318,965 | | | | 26,324,676 | | | | 08/05/16 | | | | 1,005,711 | |
| | CNY | | | 208,465,697 | | | USD | | | 30,966,384 | | | | 31,987,229 | | | | 08/16/16 | | | | 1,020,845 | |
| | EUR | | | 40,943,000 | | | GBP | | | 32,075,401 | | | | 46,625,308 | | | | 04/26/16 | | | | 553,426 | |
| | EUR | | | 37,020,000 | | | SEK | | | 341,330,914 | | | | 42,157,851 | | | | 04/26/16 | | | | 74,408 | |
| | INR | | | 1,649,093,657 | | | USD | | | 23,877,000 | | | | 24,871,332 | | | | 04/07/16 | | | | 994,332 | |
| | INR | | | 1,564,370,438 | | | USD | | | 23,175,000 | | | | 23,555,323 | | | | 04/18/16 | | | | 380,323 | |
| | NZD | | | 34,883,000 | | | USD | | | 23,121,394 | | | | 24,077,853 | | | | 04/26/16 | | | | 956,459 | |
| | ZAR | | | 141,878,555 | | | USD | | | 9,270,000 | | | | 9,560,981 | | | | 04/26/16 | | | | 290,981 | |
BNP Paribas SA | | CNH | | | 684,364,311 | | | USD | | | 100,464,520 | | | | 105,074,244 | | | | 09/01/16 | | | | 4,609,724 | |
| | EUR | | | 20,314,000 | | | GBP | | | 15,966,215 | | | | 23,133,295 | | | | 04/26/16 | | | | 200,033 | |
| | GBP | | | 19,186,069 | | | USD | | | 27,228,677 | | | | 27,558,137 | | | | 04/26/16 | | | | 329,460 | |
| | HUF | | | 1,917,529,665 | | | EUR | | | 6,095,000 | | | | 6,947,468 | | | | 04/26/16 | | | | 6,569 | |
| | INR | | | 1,013,484,275 | | | USD | | | 15,190,112 | | | | 15,293,341 | | | | 04/04/16 | | | | 103,229 | |
| | INR | | | 1,655,394,681 | | | USD | | | 23,957,000 | | | | 24,966,363 | | | | 04/07/16 | | | | 1,009,363 | |
| | MXN | | | 13,080,399 | | | USD | | | 737,464 | | | | 755,271 | | | | 04/26/16 | | | | 17,807 | |
| | MYR | | | 96,352,941 | | | USD | | | 23,326,000 | | | | 24,717,607 | | | | 04/01/16 | | | | 1,391,607 | |
| | MYR | | | 95,557,543 | | | USD | | | 23,924,675 | | | | 24,645,839 | | | | 04/25/16 | | | | 721,164 | |
| | NOK | | | 436,816,070 | | | USD | | | 51,264,077 | | | | 52,783,339 | | | | 04/26/16 | | | | 1,519,262 | |
| | NZD | | | 15,218,541 | | | USD | | | 10,151,832 | | | | 10,504,538 | | | | 04/26/16 | | | | 352,706 | |
| | RUB | | | 4,188,199,375 | | | USD | | | 60,929,899 | | | | 62,139,918 | | | | 04/11/16 | | | | 1,210,019 | |
| | TWD | | | 2,999,563,470 | | | USD | | | 92,622,000 | | | | 93,316,687 | | | | 04/21/16 | | | | 694,687 | |
Citibank NA | | BRL | | | 41,752,592 | | | USD | | | 11,369,293 | | | | 11,598,149 | | | | 04/04/16 | | | | 228,856 | |
| | CNH | | | 1,229,976,620 | | | USD | | | 180,507,263 | | | | 188,845,124 | | | | 09/01/16 | | | | 8,337,861 | |
| | COP | | | 33,707,750,685 | | | USD | | | 10,506,585 | | | | 11,233,248 | | | | 04/04/16 | | | | 726,663 | |
| | EUR | | | 20,857,000 | | | GBP | | | 16,264,685 | | | | 23,751,656 | | | | 04/26/16 | | | | 389,683 | |
| | GBP | | | 7,834,699 | | | USD | | | 11,103,312 | | | | 11,253,463 | | | | 04/26/16 | | | | 150,151 | |
| | IDR | | | 275,141,183,975 | | | USD | | | 20,675,000 | | | | 20,864,841 | | | | 05/02/16 | | | | 189,841 | |
| | INR | | | 2,121,133,975 | | | USD | | | 31,959,228 | | | | 31,990,558 | | | | 04/07/16 | | | | 31,330 | |
| | MYR | | | 98,535,802 | | | USD | | | 23,581,000 | | | | 25,277,581 | | | | 04/01/16 | | | | 1,696,581 | |
| | NZD | | | 71,317,444 | | | USD | | | 48,413,409 | | | | 49,226,586 | | | | 04/26/16 | | | | 813,177 | |
| | NZD | | | 146,342,000 | | | USD | | | 98,791,826 | | | | 101,001,310 | | | | 04/28/16 | | | | 2,209,484 | |
| | RUB | | | 1,732,601,325 | | | USD | | | 23,290,000 | | | | 25,758,609 | | | | 04/04/16 | | | | 2,468,609 | |
| | |
| The accompanying notes are an integral part of these financial statements. | | 101 |
GOLDMAN SACHS STRATEGIC INCOME FUND
Schedule of Investments (continued)
March 31, 2016
|
| ADDITIONAL INVESTMENT INFORMATION (continued) |
FORWARD FOREIGN CURRENCY EXCHANGE CONTRACTS WITH UNREALIZED GAIN (continued)
| | | | | | | | | | | | | | | | | | | | | | | | |
| Counterparty | | Currency
Purchased | | | Currency
Sold | | | Current
Value | | | Settlement
Date | | | Unrealized
Gain | |
Citibank NA (continued) | | RUB | | | 2,033,855,800 | | | USD | | | 26,855,609 | | | $ | 30,202,340 | | | | 04/08/16 | | | $ | 3,346,732 | |
| | RUB | | | 5,716,672,094 | | | USD | | | 77,178,276 | | | | 84,597,441 | | | | 04/20/16 | | | | 7,419,165 | |
| | RUB | | | 2,389,620,274 | | | USD | | | 34,229,853 | | | | 35,342,093 | | | | 04/22/16 | | | | 1,112,240 | |
| | RUB | | | 3,413,294,463 | | | USD | | | 50,175,215 | | | | 50,423,897 | | | | 04/26/16 | | | | 248,682 | |
| | SEK | | | 16,743,984 | | | EUR | | | 1,802,483 | | | | 2,064,403 | | | | 04/26/16 | | | | 11,761 | |
| | USD | | | 9,021,960 | | | NZD | | | 13,055,248 | | | | 9,011,334 | | | | 04/26/16 | | | | 10,626 | |
| | ZAR | | | 65,803,854 | | | USD | | | 4,235,000 | | | | 4,434,422 | | | | 04/26/16 | | | | 199,422 | |
Credit Suisse International (London) | | COP | | | 54,274,321,530 | | | USD | | | 17,919,000 | | | | 18,067,220 | | | | 05/02/16 | | | | 148,220 | |
| | COP | | | 64,695,710,872 | | | USD | | | 21,232,593 | | | | 21,496,353 | | | | 05/13/16 | | | | 263,760 | |
| | EUR | | | 21,702,000 | | | CHF | | | 23,448,143 | | | | 24,753,508 | | | | 06/15/16 | | | | 283,625 | |
| | EUR | | | 20,487,000 | | | USD | | | 23,176,124 | | | | 23,330,305 | | | | 04/26/16 | | | | 154,181 | |
| | RUB | | | 1,303,603,020 | | | USD | | | 18,540,000 | | | | 19,324,662 | | | | 04/14/16 | | | | 784,662 | |
| | RUB | | | 4,398,442,847 | | | USD | | | 61,999,858 | | | | 65,127,382 | | | | 04/18/16 | | | | 3,127,525 | |
| | RUB | | | 1,356,605,325 | | | USD | | | 19,387,000 | | | | 20,046,626 | | | | 04/25/16 | | | | 659,626 | |
Deutsche Bank AG | | CNH | | | 182,608,476 | | | USD | | | 26,829,000 | | | | 28,036,891 | | | | 09/01/16 | | | | 1,207,891 | |
| | CNY | | | 212,345,981 | | | USD | | | 31,431,641 | | | | 32,628,828 | | | | 07/26/16 | | | | 1,197,187 | |
| | CNY | | | 179,661,304 | | | USD | | | 26,586,949 | | | | 27,593,497 | | | | 08/02/16 | | | | 1,006,548 | |
| | CNY | | | 87,810,514 | | | USD | | | 12,976,284 | | | | 13,485,573 | | | | 08/03/16 | | | | 509,289 | |
| | HUF | | | 23,797,903,037 | | | USD | | | 84,240,365 | | | | 86,223,008 | | | | 04/26/16 | | | | 1,982,644 | |
| | IDR | | | 310,032,980,430 | | | USD | | | 23,326,000 | | | | 23,573,067 | | | | 04/07/16 | | | | 247,067 | |
| | IDR | | | 307,263,376,750 | | | USD | | | 23,155,000 | | | | 23,336,600 | | | | 04/18/16 | | | | 181,600 | |
| | MXN | | | 5,802,237,336 | | | USD | | | 324,709,684 | | | | 335,024,863 | | | | 04/26/16 | | | | 10,315,179 | |
| | USD | | | 22,592,035 | | | EUR | | | 19,803,000 | | | | 22,551,375 | | | | 04/26/16 | | | | 40,659 | |
| | USD | | | 65,200,631 | | | THB | | | 2,268,981,956 | | | | 64,457,286 | | | | 04/26/16 | | | | 743,345 | |
HSBC Bank PLC | | CNH | | | 379,435,526 | | | USD | | | 56,279,000 | | | | 58,256,838 | | | | 09/01/16 | | | | 1,977,838 | |
| | CNY | | | 168,405,587 | | | USD | | | 25,008,255 | | | | 26,051,206 | | | | 04/14/16 | | | | 1,042,951 | |
| | CNY | | | 340,356,094 | | | USD | | | 50,016,509 | | | | 52,341,119 | | | | 07/14/16 | | | | 2,324,610 | |
| | CNY | | | 287,605,480 | | | USD | | | 42,565,654 | | | | 44,225,961 | | | | 07/15/16 | | | | 1,660,308 | |
| | CNY | | | 168,886,462 | | | USD | | | 24,896,655 | | | | 25,959,655 | | | | 07/21/16 | | | | 1,062,999 | |
| | CNY | | | 250,125,137 | | | USD | | | 37,008,972 | | | | 38,415,769 | | | | 08/02/16 | | | | 1,406,797 | |
| | CNY | | | 162,780,817 | | | USD | | | 24,467,280 | | | | 24,973,918 | | | | 08/18/16 | | | | 506,638 | |
| | COP | | | 43,965,364,058 | | | USD | | | 13,044,941 | | | | 14,641,364 | | | | 04/28/16 | | | | 1,596,423 | |
| | EUR | | | 61,729,000 | | | USD | | | 69,027,496 | | | | 70,296,110 | | | | 04/26/16 | | | | 1,268,613 | |
| | KRW | | | 89,499,631,455 | | | USD | | | 73,972,751 | | | | 78,112,375 | | | | 04/08/16 | | | | 4,139,624 | |
| | MYR | | | 87,763,052 | | | USD | | | 22,585,000 | | | | 22,636,028 | | | | 05/04/16 | | | | 51,028 | |
| | NOK | | | 194,073,181 | | | EUR | | | 20,417,000 | | | | 23,451,130 | | | | 04/26/16 | | | | 200,540 | |
| | SEK | | | 1,555,256,391 | | | EUR | | | 166,446,172 | | | | 191,750,995 | | | | 04/26/16 | | | | 2,204,455 | |
| | TRY | | | 135,466,400 | | | USD | | | 46,324,000 | | | | 47,711,087 | | | | 04/26/16 | | | | 1,387,087 | |
| | TWD | | | 756,110,848 | | | USD | | | 23,168,000 | | | | 23,521,721 | | | | 04/18/16 | | | | 353,721 | |
| | TWD | | | 1,458,661,976 | | | USD | | | 45,256,000 | | | | 45,382,173 | | | | 04/26/16 | | | | 126,173 | |
| | USD | | | 24,864,293 | | | KRW | | | 28,419,886,510 | | | | 24,803,955 | | | | 04/08/16 | | | | 60,338 | |
JPMorgan Chase Bank (London) | | BRL | | | 1,159,624,104 | | | USD | | | 310,103,837 | | | | 322,123,558 | | | | 04/04/16 | | | | 12,019,722 | |
| | CNH | | | 182,413,149 | | | USD | | | 26,833,000 | | | | 28,006,901 | | | | 09/01/16 | | | | 1,173,901 | |
| | CNY | | | 531,162,419 | | | USD | | | 77,719,750 | | | | 81,700,529 | | | | 07/11/16 | | | | 3,980,779 | |
| | CNY | | | 353,131,587 | | | USD | | | 51,742,863 | | | | 54,313,119 | | | | 07/12/16 | | | | 2,570,256 | |
| | EUR | | | 105,229,470 | | | USD | | | 118,083,250 | | | | 119,923,209 | | | | 05/19/16 | | | | 1,839,959 | |
| | IDR | | | 805,408,949,000 | | | USD | | | 60,105,145 | | | | 61,023,755 | | | | 04/04/16 | | | | 918,609 | |
| | IDR | | | 459,322,218,935 | | | USD | | | 34,574,499 | | | | 34,924,135 | | | | 04/07/16 | | | | 349,636 | |
| | INR | | | 2,013,356,392 | | | USD | | | 30,119,775 | | | | 30,381,277 | | | | 04/04/16 | | | | 261,502 | |
| | MXN | | | 1,595,211,698 | | | USD | | | 90,874,000 | | | | 92,108,535 | | | | 04/26/16 | | | | 1,234,535 | |
| | |
| 102 | | The accompanying notes are an integral part of these financial statements. |
GOLDMAN SACHS STRATEGIC INCOME FUND
|
| ADDITIONAL INVESTMENT INFORMATION (continued) |
FORWARD FOREIGN CURRENCY EXCHANGE CONTRACTS WITH UNREALIZED GAIN (continued)
| | | | | | | | | | | | | | | | | | | | | | | | |
| Counterparty | | Currency
Purchased | | | Currency
Sold | | | Current
Value | | | Settlement
Date | | | Unrealized
Gain | |
JPMorgan Chase Bank (London) (continued) | | MYR | | | 94,764,893 | | | USD | | | 23,175,000 | | | $ | 24,439,963 | | | | 04/20/16 | | | $ | 1,264,963 | |
| | MYR | | | 94,573,819 | | | USD | | | 23,155,000 | | | | 24,390,972 | | | | 04/21/16 | | | | 1,235,972 | |
| | PLN | | | 882,919,471 | | | USD | | | 223,211,985 | | | | 236,528,644 | | | | 04/26/16 | | | | 13,316,659 | |
| | RUB | | | 750,800,374 | | | USD | | | 10,170,277 | | | | 11,162,160 | | | | 04/04/16 | | | | 991,883 | |
| | USD | | | 30,274,000 | | | CNH | | | 195,350,554 | | | | 29,993,253 | | | | 09/01/16 | | | | 280,747 | |
| | USD | | | 22,585,000 | | | RUB | | | 1,526,746,000 | | | | 22,534,830 | | | | 04/29/16 | | | | 50,170 | |
Merrill Lynch & Co., Inc. | | NOK | | | 175,890,000 | | | USD | | | 20,190,395 | | | | 21,254,688 | | | | 04/19/16 | | | | 1,064,293 | |
Morgan Stanley & Co. | | BRL | | | 297,043,966 | | | USD | | | 78,869,887 | | | | 82,513,687 | | | | 04/04/16 | | | | 3,643,799 | |
| | CNH | | | 102,820,710 | | | USD | | | 15,077,898 | | | | 15,786,633 | | | | 09/01/16 | | | | 708,735 | |
| | EUR | | | 20,320,000 | | | USD | | | 22,908,158 | | | | 23,140,128 | | | | 04/26/16 | | | | 231,969 | |
| | MXN | | | 416,066,221 | | | USD | | | 23,175,000 | | | | 24,023,927 | | | | 04/26/16 | | | | 848,927 | |
| | MYR | | | 88,268,309 | | | USD | | | 21,385,298 | | | | 22,761,271 | | | | 04/08/16 | | | | 1,375,973 | |
| | NZD | | | 34,555,000 | | | USD | | | 23,096,838 | | | | 23,851,453 | | | | 04/26/16 | | | | 754,614 | |
| | RUB | | | 410,908,083 | | | USD | | | 5,656,000 | | | | 6,096,604 | | | | 04/11/16 | | | | 440,604 | |
| | RUB | | | 1,566,546,489 | | | USD | | | 22,887,000 | | | | 23,175,650 | | | | 04/21/16 | | | | 288,650 | |
| | RUB | | | 564,170,303 | | | USD | | | 8,270,000 | | | | 8,327,175 | | | | 04/29/16 | | | | 57,175 | |
Royal Bank of Canada | | AUD | | | 47,211,922 | | | USD | | | 35,307,200 | | | | 36,146,991 | | | | 04/26/16 | | | | 839,791 | |
| | BRL | | | 94,756,193 | | | USD | | | 23,583,641 | | | | 26,321,635 | | | | 04/04/16 | | | | 2,737,994 | |
| | CAD | | | 29,322,180 | | | USD | | | 22,560,000 | | | | 22,578,184 | | | | 04/26/16 | | | | 18,184 | |
| | USD | | | 22,855,000 | | | BRL | | | 82,136,528 | | | | 22,816,110 | | | | 04/04/16 | | | | 38,890 | |
| | USD | | | 22,585,000 | | | MXN | | | 388,010,978 | | | | 22,404,000 | | | | 04/26/16 | | | | 181,000 | |
Royal Bank of Scotland PLC | | COP | | | 30,987,960,188 | | | USD | | | 9,435,000 | | | | 10,326,866 | | | | 04/04/16 | | | | 891,866 | |
| | COP | | | 49,956,324,209 | | | USD | | | 15,762,758 | | | | 16,645,244 | | | | 04/11/16 | | | | 882,486 | |
| | COP | | | 29,622,118,140 | | | USD | | | 9,270,000 | | | | 9,868,745 | | | | 04/15/16 | | | | 598,745 | |
| | EUR | | | 24,201,000 | | | GBP | | | 18,791,108 | | | | 27,559,755 | | | | 04/26/16 | | | | 568,925 | |
| | EUR | | | 20,310,000 | | | NOK | | | 190,871,349 | | | | 23,128,740 | | | | 04/26/16 | | | | 64,508 | |
| | EUR | | | 19,881,000 | | | SEK | | | 183,626,880 | | | | 22,640,201 | | | | 04/26/16 | | | | 437 | |
| | GBP | | | 508,031,512 | | | USD | | | 726,764,480 | | | | 729,675,097 | | | | 04/07/16 | | | | 2,910,617 | |
| | NOK | | | 393,992,070 | | | EUR | | | 41,540,000 | | | | 47,608,635 | | | | 04/26/16 | | | | 303,473 | |
| | TRY | | | 230,427,161 | | | USD | | | 79,655,000 | | | | 81,156,141 | | | | 04/26/16 | | | | 1,501,141 | |
| | USD | | | 22,889,000 | | | MXN | | | 396,187,532 | | | | 22,876,119 | | | | 04/26/16 | | | | 12,881 | |
Standard Chartered Bank | | AUD | | | 30,347,000 | | | USD | | | 22,876,782 | | | | 23,234,655 | | | | 04/26/16 | | | | 357,873 | |
| | CNH | | | 366,032,340 | | | USD | | | 53,628,000 | | | | 56,198,973 | | | | 09/01/16 | | | | 2,570,973 | |
| | CNY | | | 344,610,588 | | | USD | | | 50,581,328 | | | | 52,970,332 | | | | 07/21/16 | | | | 2,389,004 | |
| | CNY | | | 341,709,486 | | | USD | | | 50,505,781 | | | | 52,520,854 | | | | 07/22/16 | | | | 2,015,073 | |
| | EUR | | | 209,283,102 | | | USD | | | 234,405,487 | | | | 238,328,627 | | | | 04/26/16 | | | | 3,923,140 | |
| | INR | | | 3,458,439,432 | | | USD | | | 50,035,293 | | | | 52,159,557 | | | | 04/07/16 | | | | 2,124,264 | |
| | INR | | | 1,560,477,038 | | | USD | | | 23,175,000 | | | | 23,496,698 | | | | 04/18/16 | | | | 321,698 | |
| | MYR | | | 189,652,885 | | | USD | | | 46,388,000 | | | | 48,906,491 | | | | 04/11/16 | | | | 2,518,491 | |
| | NZD | | | 19,593,554 | | | USD | | | 12,924,398 | | | | 13,524,373 | | | | 04/26/16 | | | | 599,975 | |
| | USD | | | 121,273,000 | | | CNH | | | 784,396,411 | | | | 120,432,726 | | | | 09/01/16 | | | | 840,274 | |
| | USD | | | 13,551,000 | | | ZAR | | | 200,395,711 | | | | 13,504,363 | | | | 04/26/16 | | | | 46,637 | |
| | ZAR | | | 281,132,839 | | | USD | | | 18,310,000 | | | | 18,945,116 | | | | 04/26/16 | | | | 635,116 | |
| | ZAR | | | 275,354,867 | | | USD | | | 17,069,919 | | | | 18,500,895 | | | | 05/10/16 | | | | 1,430,976 | |
State Street Bank (London) | | EUR | | | 25,383,000 | | | SEK | | | 234,325,703 | | | | 28,905,800 | | | | 04/26/16 | | | | 15,267 | |
| | EUR | | | 40,892,766 | | | USD | | | 45,852,748 | | | | 46,568,102 | | | | 04/26/16 | | | | 715,353 | |
| | GBP | | | 15,734,870 | | | EUR | | | 19,803,000 | | | | 22,600,966 | | | | 04/26/16 | | | | 49,591 | |
| | GBP | | | 8,503,006 | | | USD | | | 12,001,227 | | | | 12,213,392 | | | | 04/26/16 | | | | 212,165 | |
| | MXN | | | 412,236,900 | | | USD | | | 23,175,000 | | | | 23,802,820 | | | | 04/26/16 | | | | 627,820 | |
| | SEK | | | 3,329,934,276 | | | EUR | | | 358,527,776 | | | | 410,554,951 | | | | 04/26/16 | | | | 2,268,606 | |
| | ZAR | | | 1,853,429,423 | | | USD | | | 118,832,431 | | | | 124,899,798 | | | | 04/26/16 | | | | 6,067,367 | |
| | |
| The accompanying notes are an integral part of these financial statements. | | 103 |
GOLDMAN SACHS STRATEGIC INCOME FUND
Schedule of Investments (continued)
March 31, 2016
|
| ADDITIONAL INVESTMENT INFORMATION (continued) |
FORWARD FOREIGN CURRENCY EXCHANGE CONTRACTS WITH UNREALIZED GAIN (continued)
| | | | | | | | | | | | | | | | | | | | | | | | |
| Counterparty | | Currency
Purchased | | | Currency
Sold | | | Current
Value | | | Settlement
Date | | | Unrealized
Gain | |
UBS AG (London) | | AUD | | | 30,907,000 | | | USD | | | 23,120,229 | | | $ | 23,663,409 | | | | 04/26/16 | | | $ | 543,181 | |
| | BRL | | | 269,429,935 | | | USD | | | 69,943,000 | | | | 74,842,985 | | | | 04/04/16 | | | | 4,899,985 | |
| | CHF | | | 45,545,724 | | | EUR | | | 41,488,000 | | | | 47,420,396 | | | | 04/26/16 | | | | 174,451 | |
| | EUR | | | 20,847,000 | | | GBP | | | 16,155,654 | | | | 23,740,268 | | | | 04/26/16 | | | | 534,904 | |
| | EUR | | | 41,432,000 | | | USD | | | 46,375,915 | | | | 47,182,174 | | | | 04/26/16 | | | | 806,258 | |
| | KRW | | | 24,307,619,000 | | | USD | | | 20,234,092 | | | | 21,203,074 | | | | 04/29/16 | | | | 968,982 | |
| | NOK | | | 410,360,322 | | | EUR | | | 43,342,000 | | | | 49,572,819 | | | | 06/15/16 | | | | 136,521 | |
| | PLN | | | 91,279,380 | | | EUR | | | 21,168,000 | | | | 24,453,179 | | | | 04/26/16 | | | | 347,361 | |
| | SEK | | | 197,468,454 | | | EUR | | | 21,088,000 | | | | 24,346,322 | | | | 04/26/16 | | | | 331,606 | |
| | USD | | | 22,617,365 | | | AUD | | | 29,407,000 | | | | 22,514,960 | | | | 04/26/16 | | | | 102,404 | |
| | USD | | | 183,462,695 | | | JPY | | | 20,404,207,220 | | | | 181,444,210 | | | | 04/26/16 | | | | 2,018,485 | |
Westpac Banking Corp. | | AUD | | | 25,740,550 | | | USD | | | 19,429,997 | | | | 19,707,806 | | | | 04/26/16 | | | | 277,810 | |
| | CNH | | | 184,138,723 | | | USD | | | 26,795,000 | | | | 28,271,838 | | | | 09/01/16 | | | | 1,476,838 | |
| | IDR | | | 805,408,949,000 | | | USD | | | 60,671,107 | | | | 61,170,670 | | | | 04/18/16 | | | | 499,563 | |
| | JPY | | | 8,011,183,000 | | | USD | | | 70,570,675 | | | | 71,258,319 | | | | 05/06/16 | | | | 687,644 | |
| | MYR | | | 97,621,648 | | | USD | | | 24,954,409 | | | | 25,173,166 | | | | 04/08/16 | | | | 218,757 | |
| | NZD | | | 87,320,495 | | | USD | | | 59,311,643 | | | | 60,272,627 | | | | 04/26/16 | | | | 960,984 | |
| | USD | | | 18,407,408 | | | IDR | | | 241,449,967,230 | | | | 18,338,083 | | | | 04/18/16 | | | | 69,326 | |
| | | USD | | | 22,564,172 | | | NZD | | | 32,509,000 | | | | 22,439,209 | | | | 04/26/16 | | | | 124,964 | |
| TOTAL | | | | | | | | | | | | | | | | | | | | | | $ | 241,736,659 | |
FORWARD FOREIGN CURRENCY EXCHANGE CONTRACTS WITH UNREALIZED LOSS
| | | | | | | | | | | | | | | | | | | | | | | | |
| Counterparty | | Currency
Purchased | | | Currency
Sold | | | Current
Value | | | Settlement
Date | | | Unrealized
Loss | |
Bank of America Securities LLC | | AUD | | | 59,085,000 | | | USD | | | 45,238,726 | | | $ | 45,237,407 | | | | 04/26/16 | | | $ | (1,319 | ) |
| | EUR | | | 20,293,000 | | | PLN | | | 86,529,352 | | | | 23,109,381 | | | | 04/26/16 | | | | (71,296 | ) |
| | HUF | | | 6,668,671,494 | | | EUR | | | 21,468,104 | | | | 24,161,495 | | | | 04/26/16 | | | | (286,077 | ) |
| | USD | | | 190,949,519 | | | CAD | | | 265,699,000 | | | | 204,584,609 | | | | 04/06/16 | | | | (13,635,090 | ) |
| | USD | | | 23,581,000 | | | CNH | | | 156,084,054 | | | | 24,063,650 | | | | 06/15/16 | | | | (482,650 | ) |
| | USD | | | 23,183,555 | | | EUR | | | 20,430,000 | | | | 23,265,394 | | | | 04/26/16 | | | | (81,839 | ) |
| | USD | | | 23,290,000 | | | INR | | | 1,578,130,400 | | | | 23,813,776 | | | | 04/04/16 | | | | (523,776 | ) |
| | USD | | | 149,032,744 | | | SEK | | | 1,280,170,999 | | | | 157,796,208 | | | | 04/19/16 | | | | (8,763,465 | ) |
Barclays Bank PLC | | USD | | | 22,734,000 | | | CAD | | | 30,139,987 | | | | 23,207,899 | | | | 04/26/16 | | | | (473,899 | ) |
| | USD | | | 6,380,580 | | | CNH | | | 42,143,731 | | | | 6,506,356 | | | | 05/19/16 | | | | (125,776 | ) |
| | USD | | | 25,318,965 | | | CNH | | | 171,333,436 | | | | 26,342,779 | | | | 08/05/16 | | | | (1,023,814 | ) |
| | USD | | | 30,966,384 | | | CNH | | | 208,341,832 | | | | 32,014,528 | | | | 08/16/16 | | | | (1,048,144 | ) |
| | USD | | | 161,026,295 | | | CNH | | | 1,079,476,077 | | | | 165,737,942 | | | | 09/01/16 | | | | (4,711,647 | ) |
| | USD | | | 22,645,182 | | | EUR | | | 19,927,000 | | | | 22,692,585 | | | | 04/26/16 | | | | (47,403 | ) |
| | USD | | | 23,139,541 | | | NZD | | | 34,339,000 | | | | 23,702,360 | | | | 04/26/16 | | | | (562,818 | ) |
| | USD | | | 24,398,247 | | | TWD | | | 799,774,536 | | | | 24,880,048 | | | | 04/18/16 | | | | (481,801 | ) |
| | USD | | | 89,269,872 | | | TWD | | | 2,942,245,708 | | | | 91,539,717 | | | | 04/26/16 | | | | (2,269,845 | ) |
BNP Paribas SA | | EUR | | | 20,838,000 | | | PLN | | | 89,401,897 | | | | 23,730,019 | | | | 04/26/16 | | | | (220,194 | ) |
| | HUF | | | 345,935,142 | | | EUR | | | 1,104,501 | | | | 1,253,370 | | | | 04/26/16 | | | | (4,420 | ) |
| | USD | | | 132,324,858 | | | AED | | | 488,722,670 | | | | 132,761,581 | | | | 12/07/16 | | | | (436,723 | ) |
| | USD | | | 23,206,349 | | | EUR | | | 20,785,000 | | | | 23,669,663 | | | | 04/26/16 | | | | (463,315 | ) |
| | USD | | | 21,280,000 | | | INR | | | 1,448,710,267 | | | | 21,860,843 | | | | 04/04/16 | | | | (580,843 | ) |
| | USD | | | 15,146,978 | | | INR | | | 1,013,484,275 | | | | 15,260,420 | | | | 04/18/16 | | | | (113,442 | ) |
| | USD | | | 52,890,920 | | | JPY | | | 5,997,936,087 | | | | 53,336,587 | | | | 04/26/16 | | | | (445,667 | ) |
| | |
| 104 | | The accompanying notes are an integral part of these financial statements. |
GOLDMAN SACHS STRATEGIC INCOME FUND
|
| ADDITIONAL INVESTMENT INFORMATION (continued) |
FORWARD FOREIGN CURRENCY EXCHANGE CONTRACTS WITH UNREALIZED LOSS (continued)
| | | | | | | | | | | | | | | | | | | | | | | | |
| Counterparty | | Currency
Purchased | | | Currency
Sold | | | Current
Value | | | Settlement
Date | | | Unrealized
Loss | |
BNP Paribas SA (continued) | | USD | | | 43,457,101 | | | KRW | | | 50,735,730,313 | | | $ | 44,256,988 | | | | 04/28/16 | | | $ | (799,888 | ) |
| | USD | | | 23,919,285 | | | MYR | | | 95,557,543 | | | | 24,513,562 | | | | 04/01/16 | | | | (594,277 | ) |
Citibank NA | | EUR | | | 20,401,468 | | | CHF | | | 22,326,959 | | | | 23,232,903 | | | | 04/26/16 | | | | (13,039 | ) |
| | EUR | | | 36,843,385 | | | SEK | | | 342,617,773 | | | | 41,956,724 | | | | 04/26/16 | | | | (285,378 | ) |
| | IDR | | | 303,891,689,250 | | | USD | | | 23,175,000 | | | | 23,089,823 | | | | 04/14/16 | | | | (85,177 | ) |
| | USD | | | 241,727,000 | | | AED | | | 890,869,076 | | | | 242,308,518 | | | | 08/11/16 | | | | (581,518 | ) |
| | USD | | | 90,829,843 | | | AUD | | | 122,364,362 | | | | 93,686,155 | | | | 04/26/16 | | | | (2,856,313 | ) |
| | USD | | | 11,369,293 | | | BRL | | | 41,273,376 | | | | 11,465,031 | | | | 04/04/16 | | | | (95,738 | ) |
| | USD | | | 86,287,260 | | | CAD | | | 115,162,429 | | | | 88,675,485 | | | | 04/26/16 | | | | (2,388,225 | ) |
| | USD | | | 32,490,236 | | | CNH | | | 212,463,399 | | | | 32,620,683 | | | | 09/01/16 | | | | (130,447 | ) |
| | USD | | | 47,740,088 | | | EUR | | | 42,781,115 | | | | 48,718,527 | | | | 04/26/16 | | | | (978,439 | ) |
| | USD | | | 97,852,469 | | | GBP | | | 68,771,291 | | | | 98,774,775 | | | | 04/07/16 | | | | (922,306 | ) |
| | USD | | | 56,695,298 | | | IDR | | | 769,355,199,365 | | | | 58,497,202 | | | | 04/07/16 | | | | (1,801,903 | ) |
| | USD | | | 31,901,549 | | | INR | | | 2,121,133,975 | | | | 31,938,724 | | | | 04/18/16 | | | | (37,175 | ) |
| | USD | | | 10,174,553 | | | JPY | | | 1,154,610,355 | | | | 10,267,361 | | | | 04/26/16 | | | | (92,808 | ) |
| | USD | | | 23,255,000 | | | KRW | | | 28,031,577,000 | | | | 24,465,051 | | | | 04/08/16 | | | | (1,210,051 | ) |
| | USD | | | 23,194,000 | | | KRW | | | 28,053,954,790 | | | | 24,482,631 | | | | 04/11/16 | | | | (1,288,631 | ) |
| | USD | | | 25,565,141 | | | KRW | | | 31,424,160,150 | | | | 27,413,609 | | | | 04/25/16 | | | | (1,848,468 | ) |
| | USD | | | 45,455,424 | | | MYR | | | 185,889,958 | | | | 47,934,438 | | | | 04/08/16 | | | | (2,479,013 | ) |
| | USD | | | 22,734,000 | | | MYR | | | 91,716,913 | | | | 23,656,114 | | | | 04/28/16 | | | | (922,114 | ) |
| | USD | | | 50,470,124 | | | RUB | | | 3,413,294,463 | | | | 50,745,498 | | | | 04/04/16 | | | | (275,375 | ) |
| | USD | | | 532,874 | | | RUB | | | 37,799,149 | | | | 560,822 | | | | 04/11/16 | | | | (27,948 | ) |
| | USD | | | 10,174,555 | | | SEK | | | 85,002,303 | | | | 10,480,122 | | | | 04/26/16 | | | | (305,567 | ) |
| | USD | | | 169,373,679 | | | SGD | | | 234,336,953 | | | | 173,839,965 | | | | 04/26/16 | | | | (4,466,286 | ) |
| | USD | | | 26,232,792 | | | TWD | | | 871,715,667 | | | | 27,116,585 | | | | 04/14/16 | | | | (883,793 | ) |
| | USD | | | 75,286,241 | | | TWD | | | 2,472,400,160 | | | | 76,914,509 | | | | 04/19/16 | | | | (1,628,267 | ) |
| | USD | | | 9,270,000 | | | ZAR | | | 140,764,765 | | | | 9,485,924 | | | | 04/26/16 | | | | (215,924 | ) |
Credit Suisse International (London) | | EUR | | | 21,158,000 | | | CHF | | | 23,174,569 | | | | 24,094,430 | | | | 04/26/16 | | | | (34,010 | ) |
| | GBP | | | 16,153,768 | | | EUR | | | 20,457,000 | | | | 23,202,655 | | | | 04/26/16 | | | | (93,486 | ) |
| | JPY | | | 1,012,850,338 | | | USD | | | 9,029,842 | | | | 9,006,762 | | | | 04/26/16 | | | | (23,081 | ) |
| | USD | | | 14,786,995 | | | CAD | | | 19,617,611 | | | | 15,105,631 | | | | 04/26/16 | | | | (318,636 | ) |
| | USD | | | 21,351,720 | | | COP | | | 64,695,710,872 | | | | 21,560,114 | | | | 04/04/16 | | | | (208,394 | ) |
| | USD | | | 9,155,000 | | | RUB | | | 629,259,770 | | | | 9,317,398 | | | | 04/18/16 | | | | (162,398 | ) |
| | USD | | | 9,141,000 | | | RUB | | | 622,869,568 | | | | 9,212,139 | | | | 04/22/16 | | | | (71,139 | ) |
Deutsche Bank AG | | EUR | | | 21,096,000 | | | SEK | | | 196,418,949 | | | | 24,023,826 | | | | 04/26/16 | | | | (193,101 | ) |
| | IDR | | | 535,422,168,440 | | | USD | | | 40,822,000 | | | | 40,693,911 | | | | 04/11/16 | | | | (128,089 | ) |
| | IDR | | | 299,542,996,170 | | | USD | | | 22,887,000 | | | | 22,743,367 | | | | 04/21/16 | | | | (143,633 | ) |
| | MXN | | | 389,818,213 | | | USD | | | 22,628,000 | | | | 22,508,351 | | | | 04/26/16 | | | | (119,649 | ) |
| | USD | | | 31,431,641 | | | CNH | | | 212,227,780 | | | | 32,647,358 | | | | 07/26/16 | | | | (1,215,717 | ) |
| | USD | | | 26,586,949 | | | CNH | | | 179,541,663 | | | | 27,609,122 | | | | 08/02/16 | | | | (1,022,174 | ) |
| | USD | | | 12,976,284 | | | CNH | | | 87,758,609 | | | | 13,494,427 | | | | 08/03/16 | | | | (518,143 | ) |
| | USD | | | 139,015,716 | | | CNH | | | 929,587,133 | | | | 142,724,662 | | | | 09/01/16 | | | | (3,708,946 | ) |
| | USD | | | 30,653,234 | | | IDR | | | 419,949,306,000 | | | | 31,872,607 | | | | 04/25/16 | | | | (1,219,372 | ) |
| | USD | | | 329,591,408 | | | JPY | | | 37,133,415,960 | | | | 330,133,429 | | | | 04/18/16 | | | | (542,021 | ) |
| | USD | | | 43,248,000 | | | KRW | | | 50,368,696,704 | | | | 43,940,323 | | | | 04/25/16 | | | | (692,323 | ) |
| | USD | | | 16,949,089 | | | MXN | | | 305,702,248 | | | | 17,560,853 | | | | 06/23/16 | | | | (611,763 | ) |
HSBC Bank PLC | | KRW | | | 28,419,886,510 | | | USD | | | 24,853,421 | | | | 24,792,760 | | | | 04/25/16 | | | | (60,661 | ) |
| | USD | | | 83,353,237 | | | AED | | | 307,931,845 | | | | 83,649,728 | | | | 12/07/16 | | | | (296,491 | ) |
| | USD | | | 11,068,121 | | | AUD | | | 14,836,325 | | | | 11,359,175 | | | | 04/26/16 | | | | (291,054 | ) |
| | USD | | | 22,887,000 | | | BRL | | | 83,291,744 | | | | 23,137,009 | | | | 04/04/16 | | | | (250,009 | ) |
| | USD | | | 25,008,255 | | | CNH | | | 168,555,637 | | | | 26,062,051 | | | | 04/14/16 | | | | (1,053,797 | ) |
| | |
| The accompanying notes are an integral part of these financial statements. | | 105 |
GOLDMAN SACHS STRATEGIC INCOME FUND
Schedule of Investments (continued)
March 31, 2016
|
| ADDITIONAL INVESTMENT INFORMATION (continued) |
FORWARD FOREIGN CURRENCY EXCHANGE CONTRACTS WITH UNREALIZED LOSS (continued)
| | | | | | | | | | | | | | | | | | | | | | | | |
| Counterparty | | Currency
Purchased | | | Currency
Sold | | | Current
Value | | | Settlement
Date | | | Unrealized
Loss | |
HSBC Bank PLC (continued) | | USD | | | 50,016,509 | | | CNH | | | 340,312,330 | | | $ | 52,383,591 | | | | 07/14/16 | | | $ | (2,367,082 | ) |
| | USD | | | 42,565,654 | | | CNH | | | 287,518,220 | | | | 44,254,792 | | | | 07/15/16 | | | | (1,689,138 | ) |
| | USD | | | 24,896,655 | | | CNH | | | 168,849,117 | | | | 25,981,117 | | | | 07/21/16 | | | | (1,084,462 | ) |
| | USD | | | 37,008,972 | | | CNH | | | 250,001,527 | | | | 38,444,129 | | | | 08/02/16 | | | | (1,435,157 | ) |
| | USD | | | 24,467,280 | | | CNH | | | 162,658,480 | | | | 24,992,063 | | | | 08/18/16 | | | | (524,782 | ) |
| | USD | | | 176,195,590 | | | CNH | | | 1,182,750,315 | | | | 181,594,208 | | | | 09/01/16 | | | | (5,398,618 | ) |
| | USD | | | 45,468,000 | | | HKD | | | 352,754,839 | | | | 45,482,299 | | | | 04/26/16 | | | | (14,299 | ) |
| | USD | | | 64,159,067 | | | INR | | | 4,428,900,385 | | | | 66,795,873 | | | | 04/07/16 | | | | (2,636,807 | ) |
| | USD | | | 14,743,543 | | | MYR | | | 62,033,456 | | | | 15,913,563 | | | | 04/01/16 | | | | (1,170,020 | ) |
| | USD | | | 11,079,000 | | | SGD | | | 15,190,461 | | | | 11,268,855 | | | | 04/26/16 | | | | (189,855 | ) |
| | USD | | | 12,374,277 | | | TWD | | | 407,670,553 | | | | 12,682,324 | | | | 04/19/16 | | | | (308,047 | ) |
JPMorgan Chase Bank (London) | | IDR | | | 220,206,531,389 | | | USD | | | 16,758,488 | | | | 16,712,865 | | | | 04/25/16 | | | | (45,623 | ) |
| | NZD | | | 32,678,000 | | | USD | | | 22,557,133 | | | | 22,555,861 | | | | 04/26/16 | | | | (1,272 | ) |
| | USD | | | 212,205,763 | | | BRL | | | 888,166,000 | | | | 246,717,183 | | | | 04/04/16 | | | | (34,511,421 | ) |
| | USD | | | 244,548,272 | | | BRL | | | 907,592,000 | | | | 248,075,367 | | | | 06/02/16 | | | | (3,527,096 | ) |
| | USD | | | 7,932,091 | | | CAD | | | 10,564,942 | | | | 8,134,861 | | | | 04/06/16 | | | | (202,771 | ) |
| | USD | | | 155,731,785 | | | CNH | | | 1,018,143,267 | | | | 157,355,366 | | | | 04/26/16 | | | | (1,623,581 | ) |
| | USD | | | 77,719,750 | | | CNH | | | 531,369,931 | | | | 81,805,505 | | | | 07/11/16 | | | | (4,085,755 | ) |
| | USD | | | 51,742,863 | | | CNH | | | 353,274,397 | | | | 54,384,490 | | | | 07/12/16 | | | | (2,641,627 | ) |
| | USD | | | 89,746,000 | | | CNH | | | 593,334,343 | | | | 91,097,909 | | | | 09/01/16 | | | | (1,351,909 | ) |
| | USD | | | 39,759,064 | | | EUR | | | 35,390,000 | | | | 40,301,630 | | | | 04/26/16 | | | | (542,566 | ) |
| | USD | | | 862,173,263 | | | EUR | | | 768,322,651 | | | | 875,607,543 | | | | 05/19/16 | | | | (13,434,280 | ) |
| | USD | | | 44,313,391 | | | IDR | | | 589,988,488,752 | | | | 44,841,137 | | | | 04/11/16 | | | | (527,746 | ) |
| | USD | | | 22,734,000 | | | IDR | | | 302,960,104,200 | | | | 22,984,304 | | | | 04/29/16 | | | | (250,304 | ) |
| | USD | | | 34,483,650 | | | IDR | | | 459,322,218,935 | | | | 34,831,882 | | | | 05/02/16 | | | | (348,232 | ) |
| | USD | | | 23,255,000 | | | KRW | | | 28,065,529,300 | | | | 24,494,684 | | | | 04/08/16 | | | | (1,239,684 | ) |
| | USD | | | 46,389,000 | | | MXN | | | 826,518,645 | | | | 47,723,711 | | | | 04/26/16 | | | | (1,334,711 | ) |
| | USD | | | 18,125,000 | | | MYR | | | 72,683,063 | | | | 18,746,140 | | | | 04/25/16 | | | | (621,140 | ) |
| | USD | | | 14,774,469 | | | SEK | | | 122,942,785 | | | | 15,157,887 | | | | 04/26/16 | | | | (383,419 | ) |
| | USD | | | 7,415,450 | | | TWD | | | 247,379,414 | | | | 7,695,059 | | | | 04/12/16 | | | | (279,609 | ) |
Merrill Lynch & Co., Inc. | | USD | | | 22,025,886 | | | NOK | | | 191,880,000 | | | | 23,186,932 | | | | 04/19/16 | | | | (1,161,047 | ) |
Morgan Stanley & Co. | | USD | | | 121,768,767 | | | BRL | | | 459,895,189 | | | | 127,750,945 | | | | 04/04/16 | | | | (5,982,178 | ) |
| | USD | | | 42,314,000 | | | JPY | | | 4,776,192,750 | | | | 42,472,246 | | | | 04/26/16 | | | | (158,246 | ) |
| | USD | | | 23,175,000 | | | KRW | | | 27,601,425,000 | | | | 24,085,150 | | | | 04/15/16 | | | | (910,150 | ) |
| | USD | | | 22,889,000 | | | KRW | | | 26,539,795,500 | | | | 23,152,618 | | | | 04/25/16 | | | | (263,618 | ) |
| | USD | | | 87,317,776 | | | MXN | | | 1,578,705,397 | | | | 90,739,930 | | | | 06/16/16 | | | | (3,422,153 | ) |
| | USD | | | 8,891,000 | | | MYR | | | 37,297,745 | | | | 9,568,063 | | | | 04/01/16 | | | | (677,063 | ) |
| | USD | | | 37,858,073 | | | MYR | | | 152,696,950 | | | | 39,380,699 | | | | 04/20/16 | | | | (1,522,626 | ) |
| | USD | | | 22,871,222 | | | NZD | | | 34,099,000 | | | | 23,536,701 | | | | 04/26/16 | | | | (665,478 | ) |
| | USD | | | 23,581,000 | | | RUB | | | 1,747,954,595 | | | | 25,986,866 | | | | 04/04/16 | | | | (2,405,866 | ) |
| | USD | | | 15,314,000 | | | RUB | | | 1,040,610,802 | | | | 15,390,464 | | | | 04/22/16 | | | | (76,464 | ) |
| | USD | | | 9,890,000 | | | TWD | | | 323,954,862 | | | | 10,076,902 | | | | 04/11/16 | | | | (186,902 | ) |
Royal Bank of Canada | | CAD | | | 75,054,376 | | | USD | | | 57,830,000 | | | | 57,792,140 | | | | 04/26/16 | | | | (37,860 | ) |
| | GBP | | | 16,210,993 | | | EUR | | | 20,463,000 | | | | 23,284,852 | | | | 04/26/16 | | | | (18,122 | ) |
| | GBP | | | 3,086,597 | | | USD | | | 4,434,681 | | | | 4,433,216 | | | | 04/07/16 | | | | (1,466 | ) |
| | USD | | | 45,256,000 | | | BRL | | | 163,513,096 | | | | 45,421,116 | | | | 04/04/16 | | | | (165,116 | ) |
| | USD | | | 46,388,000 | | | CAD | | | 61,824,071 | | | | 47,604,758 | | | | 04/26/16 | | | | (1,216,758 | ) |
| | USD | | | 228,860,544 | | | EUR | | | 205,834,830 | | | | 234,401,785 | | | | 04/26/16 | | | | (5,541,241 | ) |
| | USD | | | 386,668,359 | | | MXN | | | 6,969,890,508 | | | | 401,917,384 | | | | 05/10/16 | | | | (15,249,025 | ) |
| | USD | | | 11,734,948 | | | SEK | | | 99,350,590 | | | | 12,246,135 | | | | 04/19/16 | | | | (511,187 | ) |
| | |
| 106 | | The accompanying notes are an integral part of these financial statements. |
GOLDMAN SACHS STRATEGIC INCOME FUND
|
| ADDITIONAL INVESTMENT INFORMATION (continued) |
FORWARD FOREIGN CURRENCY EXCHANGE CONTRACTS WITH UNREALIZED LOSS (continued)
| | | | | | | | | | | | | | | | | | | | | | | | |
| Counterparty | | Currency
Purchased | | | Currency
Sold | | | Current
Value | | | Settlement
Date | | | Unrealized
Loss | |
Royal Bank of Scotland PLC | | COP | | | 27,103,078,656 | | | USD | | | 9,024,000 | | | $ | 9,019,212 | | | | 05/04/16 | | | $ | (4,788 | ) |
| | EUR | | | 20,464,000 | | | PLN | | | 87,259,396 | | | | 23,304,113 | | | | 04/26/16 | | | | (72,137 | ) |
| | GBP | | | 32,150,633 | | | EUR | | | 40,730,000 | | | | 46,179,941 | | | | 04/26/16 | | | | (202,805 | ) |
| | MXN | | | 390,494,198 | | | USD | | | 22,585,000 | | | | 22,547,383 | | | | 04/26/16 | | | | (37,617 | ) |
| | USD | | | 797,424,071 | | | GBP | | | 557,424,816 | | | | 800,617,673 | | | | 04/07/16 | | | | (3,193,602 | ) |
| | USD | | | 63,001,000 | | | MXN | | | 1,097,568,124 | | | | 63,374,279 | | | | 04/26/16 | | | | (373,279 | ) |
| | USD | | | 127,125,121 | | | TRY | | | 376,271,958 | | | | 132,522,485 | | | | 04/26/16 | | | | (5,397,365 | ) |
Standard Chartered Bank | | EUR | | | 27,298,920 | | | PLN | | | 116,262,962 | | | | 31,087,623 | | | | 04/26/16 | | | | (58,502 | ) |
| | GBP | | | 5,774,000 | | | USD | | | 8,372,566 | | | | 8,293,076 | | | | 04/07/16 | | | | (79,489 | ) |
| | USD | | | 50,581,328 | | | CNH | | | 344,610,588 | | | | 53,025,851 | | | | 07/21/16 | | | | (2,444,523 | ) |
| | USD | | | 50,505,781 | | | CNH | | | 341,507,463 | | | | 52,545,628 | | | | 07/22/16 | | | | (2,039,847 | ) |
| | USD | | | 32,374,000 | | | CNH | | | 215,659,401 | | | | 33,111,383 | | | | 09/01/16 | | | | (737,383 | ) |
| | USD | | | 29,074,000 | | | ZAR | | | 438,246,555 | | | | 29,532,771 | | | | 04/26/16 | | | | (458,771 | ) |
State Street Bank (London) | | EUR | | | 20,906,000 | | | SEK | | | 193,437,573 | | | | 23,807,456 | | | | 04/26/16 | | | | (41,889 | ) |
| | USD | | | 291,469,085 | | | AUD | | | 392,815,479 | | | | 300,752,369 | | | | 04/26/16 | | | | (9,283,284 | ) |
| | USD | | | 22,697,469 | | | CAD | | | 30,205,338 | | | | 23,258,219 | | | | 04/26/16 | | | | (560,750 | ) |
| | USD | | | 17,275,529 | | | CHF | | | 17,008,000 | | | | 17,692,681 | | | | 04/06/16 | | | | (417,153 | ) |
| | USD | | | 9,252,760 | | | EUR | | | 8,333,267 | | | | 9,489,807 | | | | 04/26/16 | | | | (237,047 | ) |
| | USD | | | 91,987,516 | | | NZD | | | 136,046,019 | | | | 93,905,229 | | | | 04/26/16 | | | | (1,917,713 | ) |
UBS AG (London) | | CHF | | | 23,078,222 | | | EUR | | | 21,169,884 | | | | 24,083,842 | | | | 06/15/16 | | | | (62,728 | ) |
| | EUR | | | 20,355,000 | | | PLN | | | 87,076,553 | | | | 23,179,985 | | | | 04/26/16 | | | | (147,282 | ) |
| | USD | | | 23,326,000 | | | BRL | | | 90,641,384 | | | | 25,178,612 | | | | 04/04/16 | | | | (1,852,612 | ) |
| | USD | | | 22,139,324 | | | EUR | | | 19,668,000 | | | | 22,397,639 | | | | 04/26/16 | | | | (258,316 | ) |
| | USD | | | 4,295,008 | | | KRW | | | 4,982,638,645 | | | | 4,348,685 | | | | 04/08/16 | | | | (53,678 | ) |
| | USD | | | 15,757,819 | | | SEK | | | 131,391,687 | | | | 16,199,571 | | | | 04/26/16 | | | | (441,753 | ) |
Westpac Banking Corp. | | USD | | | 34,499,812 | | | AUD | | | 45,404,048 | | | | 34,762,823 | | | | 04/26/16 | | | | (263,011 | ) |
| | USD | | | 91,114,000 | | | CNH | | | 605,649,028 | | | | 92,988,650 | | | | 09/01/16 | | | | (1,874,650 | ) |
| | USD | | | 23,177,382 | | | EUR | | | 20,426,000 | | | | 23,260,839 | | | | 04/26/16 | | | | (83,457 | ) |
| | USD | | | 60,648,264 | | | IDR | | | 805,408,949,000 | | | | 61,023,755 | | | | 04/04/16 | | | | (375,490 | ) |
| | USD | | | 34,911,281 | | | IDR | | | 472,105,249,856 | | | | 35,856,312 | | | | 04/18/16 | | | | (945,031 | ) |
| | USD | | | 64,799,991 | | | INR | | | 4,455,161,360 | | | | 67,191,937 | | | | 04/07/16 | | | | (2,391,946 | ) |
| | USD | | | 61,017,617 | | | JPY | | | 6,926,719,922 | | | | 61,612,176 | | | | 05/06/16 | | | | (594,559 | ) |
| | USD | | | 12,591,629 | | | MYR | | | 52,177,191 | | | | 13,455,125 | | | | 04/11/16 | | | | (863,496 | ) |
| | USD | | | 72,818,568 | | | MYR | | | 297,140,729 | | | | 76,632,898 | | | | 04/20/16 | | | | (3,814,330 | ) |
| | USD | | | 140,401,888 | | | NZD | | | 208,514,653 | | | | 143,926,418 | | | | 04/26/16 | | | | (3,524,529 | ) |
| | | USD | | | 53,648,907 | | | TWD | | | 1,757,269,934 | | | | 54,663,649 | | | | 04/14/16 | | | | (1,014,741 | ) |
| TOTAL | | | | | | | | | | | | | | | | | | | | | | $ | (247,110,550 | ) |
FUTURES CONTRACTS — At March 31, 2016, the Fund had the following futures contracts:
| | | | | | | | | | | | | | |
| Type | | Number of
Contracts
Long (Short) | | | Expiration
Date | | Current
Value | | | Unrealized
Gain (Loss) | |
Japan 10 Year Government Bonds | | | (19 | ) | | June 2016 | | $ | (25,542,672 | ) | | $ | 67,994 | |
Ultra Long U.S. Treasury Bonds | | | (1,501 | ) | | June 2016 | | | (258,969,406 | ) | | | (752,875 | ) |
2 Year U.S. Treasury Notes | | | (1,931 | ) | | June 2016 | | | (422,406,250 | ) | | | (1,121,294 | ) |
5 Year U.S. Treasury Notes | | | 8,439 | | | June 2016 | | | 1,022,503,528 | | | | 1,804,040 | |
10 Year U.S. Treasury Notes | | | (4,064 | ) | | June 2016 | | | (529,907,500 | ) | | | (2,531,665 | ) |
20 Year U.S. Treasury Bonds | | | (3,195 | ) | | June 2016 | | | (525,377,813 | ) | | | 1,761,856 | |
| TOTAL | | | $ | (771,944 | ) |
| | |
| The accompanying notes are an integral part of these financial statements. | | 107 |
GOLDMAN SACHS STRATEGIC INCOME FUND
Schedule of Investments (continued)
March 31, 2016
|
| ADDITIONAL INVESTMENT INFORMATION (continued) |
SWAP CONTRACTS — At March 31, 2016, the Fund had the following swap contracts:
OVER THE COUNTER INTEREST RATE SWAP CONTRACTS
| | | | | | | | | | | | | | | | | | |
| | | | | | | | | | | Rates Exchanged | | | |
| Counterparty | | Notional
Amount
(000s) | | | Termination
Date | | | Payments
Received | | Payments
Made | | Unrealized
Gain (Loss)* | |
Bank of America Securities LLC | | KRW | | | 57,343,520 | | | | 11/04/17 | | | 2.060% | | 3 month KWCDC | | $ | 533,755 | |
| | | | | 33,004,820 | (a) | | | 06/03/25 | | | 3 month KWCDC | | 2.427% | | | (1,045,522 | ) |
Barclays Bank PLC | | KRW | | | 217,875,100 | | | | 11/07/17 | | | 2.034 | | 3 month KWCDC | | | 1,932,404 | |
| | | | | 19,262,500 | | | | 05/20/23 | | | 3 month KWCDC | | 2.840 | | | (1,582,724 | ) |
| | MYR | | | 31,310 | | | | 08/14/23 | | | 3 month KLIBOR | | 4.485 | | | (349,163 | ) |
| | KRW | | | 39,385,400 | (a) | | | 07/15/25 | | | 3 month KWCDC | | 2.615 | | | (1,554,415 | ) |
Citibank NA | | | | | 7,061,700 | | | | 10/14/17 | | | 2.240 | | 3 month KWCDC | | | 83,819 | |
| | | | | 136,480,620 | | | | 10/28/17 | | | 2.173 | | 3 month KWCDC | | | 1,496,073 | |
| | MYR | | | 112,250 | | | | 09/17/18 | | | 3 month KLIBOR | | 3.830 | | | (179,081 | ) |
| | | | | 42,800 | | | | 09/24/18 | | | 3 month KLIBOR | | 3.785 | | | (56,569 | ) |
| | | | | 169,560 | | | | 11/19/18 | | | 3 month KLIBOR | | 3.915 | | | (372,223 | ) |
| | | | | 51,130 | | | | 11/21/18 | | | 3 month KLIBOR | | 3.960 | | | (129,328 | ) |
| | | | | 36,600 | | | | 11/15/23 | | | 3 month KLIBOR | | 4.450 | | | (389,602 | ) |
| | KRW | | | 28,266,470 | | | | 01/07/24 | | | 3 month KWCDC | | 3.471 | | | (3,748,011 | ) |
Credit Suisse International (London) | | BRL | | | 36,980 | | | | 01/02/18 | | | 11.935 | | 1 month Brazilian
Interbank Deposit
Average | | | (368,876 | ) |
Deutsche Bank AG | | KRW | | | 55,677,880 | | | | 03/03/17 | | | 2.850 | | 3 month KWCDC | | | 662,373 | |
| | | | | 111,467,390 | | | | 10/13/17 | | | 2.248 | | 3 month KWCDC | | | 1,330,668 | |
| | | | | 278,210,230 | | | | 10/15/17 | | | 2.253 | | 3 month KWCDC | | | 3,352,343 | |
| | KRW | | | 34,254,690 | | | | 11/04/17 | | | 2.075 | | 3 month KWCDC | | | 326,699 | |
| | BRL | | | 40 | | | | 01/02/18 | | | 11.900 | | 1 month Brazilian
Interbank Deposit
Average | | | (408 | ) |
| | MYR | | | 112,770 | | | | 09/13/18 | | | 3 month KLIBOR | | 3.920 | | | (242,055 | ) |
| | | | | 50,380 | | | | 11/14/18 | | | 3 month KLIBOR | | 3.880 | | | (98,571 | ) |
| | | | | 477,120 | | | | 03/12/19 | | | 3 month KLIBOR | | 4.027 | | | (1,511,767 | ) |
| | | | | 26,840 | | | | 08/14/23 | | | 3 month KLIBOR | | 4.490 | | | (301,571 | ) |
JPMorgan Securities, Inc. | | KRW | | | 230,094,560 | | | | 03/05/17 | | | 2.889 | | 3 month KWCDC | | | 2,821,475 | |
| | MYR | | �� | 113,040 | | | | 11/26/18 | | | 3 month KLIBOR | | 3.955 | | | (281,481 | ) |
| | | | | 254,240 | | | | 12/11/18 | | | 3 month KLIBOR | | 3.972 | | | (663,159 | ) |
| | | | | 34,420 | | | | 08/15/23 | | | 3 month KLIBOR | | 4.520 | | | (404,011 | ) |
| | | | | 64,380 | | | | 09/26/23 | | | 3 month KLIBOR | | 4.330 | | | (543,312 | ) |
| | KRW | | | 31,495,660 | | | | 10/31/23 | | | 3 month KWCDC | | 3.230 | | | (3,552,028 | ) |
| | | | | 62,836,430 | | | | 11/06/23 | | | 3 month KWCDC | | 3.320 | | | (7,457,419 | ) |
| | | | | 34,996,240 | | | | 01/15/24 | | | 3 month KWCDC | | 3.445 | | | (4,574,687 | ) |
| | | | | 55,465,440 | (a) | | | 11/09/25 | | | 2.236 | | 3 month KWCDC | | | 1,269,381 | |
| | | | | 38,001,380 | (a) | | | 11/10/25 | | | 2.330 | | 3 month KWCDC | | | 1,019,471 | |
| | | | | 8,900,000 | | | | 12/18/28 | | | 3 month KWCDC | | 3.495 | | | (1,785,565 | ) |
Morgan Stanley & Co. International PLC | | | | | 19,402,350 | | | | 10/13/17 | | | 2.250 | | 3 month KWCDC | | | 232,359 | |
| | | | | 113,180,350 | | | | 10/13/17 | | | 2.245 | | 3 month KWCDC | | | 1,346,800 | |
| | | | | 14,081,670 | | | | 10/14/17 | | | 2.250 | | 3 month KWCDC | | | 169,295 | |
| | | | | 14,081,680 | | | | 10/14/17 | | | 2.245 | | 3 month KWCDC | | | 168,220 | |
| | | | | 53,882,840 | | | | 10/28/17 | | | 2.168 | | 3 month KWCDC | | | 586,126 | |
| | | | | 132,770,610 | | | | 10/29/17 | | | 2.175 | | 3 month KWCDC | | | 1,457,688 | |
| | |
| 108 | | The accompanying notes are an integral part of these financial statements. |
GOLDMAN SACHS STRATEGIC INCOME FUND
|
| ADDITIONAL INVESTMENT INFORMATION (continued) |
OVER THE COUNTER INTEREST RATE SWAP CONTRACTS (continued)
| | | | | | | | | | | | | | | | | | |
| | | | | | | | | | | Rates Exchanged | | | |
| Counterparty | | Notional
Amount
(000s) | | | Termination
Date | | | Payments
Received | | Payments
Made | | Unrealized
Gain (Loss)* | |
Morgan Stanley & Co. International PLC (continued) | | MYR | | | 67,180 | | | | 11/20/18 | | | 3 month KLIBOR | | 3.934% | | $ | (157,530 | ) |
| | BRL | | | 63,100 | | | | 01/04/21 | | | 1 month Brazilian
Interbank Deposit
Average | | 11.980 | | | 1,045,272 | |
| | KRW | | | 36,546,310 | | | | 06/27/23 | | | 3 month KWCDC | | 3.413 | | | (4,301,632 | ) |
| | | | | 150 | (a) | | | 09/23/25 | | | 3 month KWCDC | | 2.265 | | | (4 | ) |
| | | | | 19,344,010 | (a) | | | 09/23/25 | | | 3 month KWCDC | | 2.260 | | | (465,792 | ) |
| TOTAL | | | | | | | | | | | | | | | | $ | (16,282,285 | ) |
| | * | | There are no upfront payments on the swap contracts (s), therefore the unrealized gain (loss) on the swap contracts is equal to their market value. |
| | (a) | | Represents forward starting interest rate swaps whose effective dates of commencement of accruals and cash flows occur subsequent to March 31, 2016. |
CENTRALLY CLEARED INTEREST RATE SWAP CONTRACTS
| | | | | | | | | | | | | | | | |
| | | | | | Rates Exchanged | | Market Value | |
Notional
Amount
(000s) | | | Termination
Date | | Payments
Received | | Payments
Made | | Upfront Payments
Made (Received) | | | Unrealized
Gain (Loss) | |
| SEK | 7,907,650 | (a) | | 06/15/18 | | 0.050% | | 3 month STIBOR | | $ | 7,628,502 | | | $ | (629,990 | ) |
| $ | 811,400 | (a) | | 06/15/18 | | 3 month LIBOR | | 1.250% | | | (3,123,372 | ) | | | (2,530,301 | ) |
| EUR | 829,050 | (a) | | 02/17/19 | | 6 month EURO | | 0.086 | | | 71,114 | | | | (556,481 | ) |
| $ | 870,700 | (a) | | 06/15/19 | | 3 month LIBOR | | 1.500 | | | (7,967,240 | ) | | | (4,834,837 | ) |
| PLN | 285,790 | | | 06/17/19 | | 3.048 | | 6 month WIBOR | | | 1,029,178 | | | | 3,865,208 | |
| | 285,790 | | | 06/17/19 | | 6 month WIBOR | | 3.045 | | | 328 | | | | (4,890,544 | ) |
| EUR | 127,140 | | | 06/18/19 | | 1.250 | | 6 month EURO | | | — | | | | (12,659 | ) |
| | 364,820 | (a) | | 02/09/20 | | 6 month EURO | | 0.100 | | | (232,364 | ) | | | (440,434 | ) |
| | 909,300 | (a) | | 02/26/20 | | 0.050 | | 6 month EURO | | | 380,133 | | | | 93,238 | |
| GBP | 172,390 | (a) | | 02/16/21 | | 6 month GBP | | 1.160 | | | (204,448 | ) | | | (40,102 | ) |
| CAD | 2,847,140 | (a) | | 06/15/21 | | 1.000 | | 6 month CDOR | | | 134,561 | | | | 268,149 | |
| AUD | 362,100 | (a) | | 06/15/21 | | 2.500 | | 6 month AUDOR | | | 947,548 | | | | 1,203,352 | |
| $ | 4,140,480 | (a) | | 06/15/21 | | 3 month LIBOR | | 2.000 | | | (119,849,058 | ) | | | (36,257,389 | ) |
| SEK | 9,296,720 | (a) | | 06/15/21 | | 3 month STIBOR | | 0.500 | | | (8,136,475 | ) | | | (126,105 | ) |
| GBP | 275,920 | (a) | | 06/15/21 | | 6 month GBP | | 1.750 | | | (14,571,267 | ) | | | 598,284 | |
| CAD | 415,250 | (a) | | 09/29/22 | | 2.241 | | 6 month CDOR | | | (573,532 | ) | | | 5,051,869 | |
| GBP | 268,930 | (a) | | 12/11/22 | | 6 month GBP | | 1.940 | | | (395,613 | ) | | | (11,866,025 | ) |
| EUR | 122,720 | (a) | | 02/09/23 | | 0.500 | | 6 month EURO | | | 144,701 | | | | 933,721 | |
| CAD | 129,300 | (a) | | 02/12/23 | | 1.589 | | 6 month CDOR | | | 784 | | | | (74,764 | ) |
| EUR | 669,060 | (a) | | 06/15/23 | | 0.750 | | 6 month EURO | | | 22,018,209 | | | | 4,262,898 | |
| $ | 594,250 | (a) | | 06/15/23 | | 3 month LIBOR | | 2.000 | | | (14,843,540 | ) | | | (7,497,289 | ) |
| JPY | 127,770,580 | (a) | | 06/15/23 | | 6 month JYOR | | 0.100 | | | (5,744,896 | ) | | | (329,783 | ) |
| GBP | 32,010 | | | 12/15/24 | | 6 month GBP | | 3.150 | | | (2,073,124 | ) | | | (725,523 | ) |
| | 168,990 | (a) | | 02/16/25 | | 1.570 | | 6 month GBP | | | 687,177 | | | | 448,860 | |
| EUR | 202,960 | (a) | | 05/11/25 | | 1.567 | | 6 month EURO | | | 6,316,700 | | | | 1,740,480 | |
| | 1,386,260 | (a) | | 05/11/25 | | 1.567 | | 6 month EURO | | | (7,662,393 | ) | | | 62,694,650 | |
| NOK | 496,880 | (a) | | 06/17/25 | | 3 month NIBOR | | 2.500 | | | (635,297 | ) | | | (1,384,679 | ) |
| ZAR | 532,560 | (a) | | 08/24/25 | | 9.145 | | 3 month JIBAR | | | 491 | | | | (106,795 | ) |
| EUR | 336,180 | (a) | | 09/16/25 | | 2.000 | | 6 month EURO | | | 6,353,713 | | | | 13,720,718 | |
| GBP | 274,020 | (a) | | 09/16/25 | | 6 month GBP | | 2.750 | | | (25,675,305 | ) | | | 7,800,787 | |
| | |
| The accompanying notes are an integral part of these financial statements. | | 109 |
GOLDMAN SACHS STRATEGIC INCOME FUND
Schedule of Investments (continued)
March 31, 2016
|
| ADDITIONAL INVESTMENT INFORMATION (continued) |
CENTRALLY CLEARED INTEREST RATE SWAP CONTRACTS (continued)
| | | | | | | | | | | | | | | | |
| | | | | | Rates Exchanged | | Market Value | |
Notional
Amount
(000s) | | | Termination
Date | | Payments
Received | | Payments
Made | | Upfront Payments
Made (Received) | | | Unrealized
Gain (Loss) | |
| ZAR | 451,720 | (a) | | 10/27/25 | | 9.200% | | 3 month JIBAR | | $ | 403 | | | $ | (53,008 | ) |
| | 928,450 | (a) | | 12/10/25 | | 10.065 | | 3 month JIBAR | | | 732 | | | | 1,349,870 | |
| | 660,960 | (a) | | 12/11/25 | | 10.455 | | 3 month JIBAR | | | 508 | | | | 1,430,281 | |
| JPY | 63,645,010 | (a) | | 12/16/25 | | 6 month JYOR | | 1.000% | | | (31,157,466 | ) | | | 12,449,299 | |
| EUR | 898,880 | (a) | | 01/06/26 | | 1.550 | | 6 month EURO | | | 89,207,338 | | | | (61,902,646 | ) |
| ZAR | 109,080 | (a) | | 01/20/26 | | 10.130 | | 3 month JIBAR | | | 79 | | | | 168,737 | |
| PLN | 120,250 | (a) | | 01/20/26 | | 3.295 | | 6 month WIBOR | | | 358 | | | | 870,608 | |
| | 258,340 | (a) | | 01/22/26 | | 3.125 | | 6 month WIBOR | | | 765 | | | | 1,359,523 | |
| | 124,260 | (a) | | 01/25/26 | | 3.155 | | 6 month WIBOR | | | 367 | | | | 698,665 | |
| AUD | 233,960 | (a) | | 03/24/26 | | 3.100 | | 6 month AUDOR | | | 757,046 | | | | 573,673 | |
| EUR | 1,691,360 | (a) | | 06/15/26 | | 1.000 | | 6 month EURO | | | 78,194,180 | | | | 4,315,077 | |
| $ | 539,880 | (a) | | 06/15/26 | | 3 month LIBOR | | 2.250 | | | (19,679,182 | ) | | | (9,231,068 | ) |
| NZD | 520,920 | (a) | | 06/15/26 | | 3 month NZDOR | | 3.000 | | | 4,004,568 | | | | (3,614,083 | ) |
| SEK | 3,492,960 | (a) | | 06/15/26 | | 3 month STIBOR | | 1.250 | | | (1,094,266 | ) | | | (1,230,258 | ) |
| EUR | 33,030 | (a) | | 06/15/26 | | 6 month EURO | | 1.000 | | | (1,532,951 | ) | | | (78,344 | ) |
| AUD | 1,486,800 | (a) | | 06/16/26 | | 3.000 | | 6 month AUDOR | | | 28,124,230 | | | | 10,138,692 | |
| $ | 337,790 | (a) | | 12/15/26 | | 2.500 | | 3 month LIBOR | | | 3,097,923 | | | | 1,055,036 | |
| EUR | 82,240 | (a) | | 12/15/26 | | 6 month EURO | | 1.500% | | | (1,205,158 | ) | | | (174,206 | ) |
| GBP | 472,430 | (a) | | 12/11/27 | | 2.190 | | 6 month GBP | | | 1,183,995 | | | | 32,727,981 | |
| | 32,010 | | | 12/15/29 | | 3.377 | | 6 month GBP | | | 2,927,902 | | | | 1,244,781 | |
| | 240,760 | (a) | | 12/11/32 | | 6 month GBP | | 2.250 | | | (310,545 | ) | | | (21,834,349 | ) |
| GBP | 48,890 | (a) | | 02/16/33 | | 6 month GBP | | 1.820 | | | (289,735 | ) | | | 9,459 | |
| EUR | 475,180 | (a) | | 05/11/35 | | 6 month EURO | | 1.695 | | | (11,679,744 | ) | | | (19,378,479 | ) |
| $ | 457,080 | (a) | | 12/17/35 | | 3.000 | | 3 month LIBOR | | | 17,287,488 | | | | 681,607 | |
| JPY | 57,747,460 | (a) | | 12/17/35 | | 6 month JYOR | | 2.000 | | | (50,168,356 | ) | | | (6,681,836 | ) |
| | 15,018,980 | (a) | | 03/30/36 | | 6 month JYOR | | 0.900 | | | (291,194 | ) | | | (189,048 | ) |
| | 6,005,310 | (a) | | 06/15/36 | | 6 month JYOR | | 0.500 | | | 53,847 | | | | 12,510 | |
| GBP | 31,000 | | | 06/08/37 | | 6 month GBP | | 2.100 | | | (1,355,341 | ) | | | (2,265,604 | ) |
| | 19,800 | | | 04/15/39 | | 6 month GBP | | 2.060 | | | (645,347 | ) | | | (1,696,049 | ) |
| | 24,900 | | | 12/15/39 | | 3.568 | | 6 month GBP | | | 3,370,308 | | | | 2,180,257 | |
| CAD | 58,010 | (a) | | 09/29/40 | | 6 month CDOR | | 2.835 | | | 745,658 | | | | (4,152,434 | ) |
| | 17,300 | (a) | | 02/12/41 | | 6 month CDOR | | 2.265 | | | 427 | | | | 243,530 | |
| GBP | 24,900 | | | 12/15/44 | | 6 month GBP | | 3.565 | | | (4,063,106 | ) | | | (3,055,327 | ) |
| EUR | 142,840 | (a) | | 12/19/45 | | 1.250 | | 6 month EURO | | | (41,152 | ) | | | 1,859,282 | |
| $ | 462,640 | (a) | | 12/19/45 | | 2.750 | | 3 month LIBOR | | | 9,513,981 | | | | 106,664 | |
| JPY | 63,346,990 | (a) | | 12/19/45 | | 6 month JYOR | | 2.000 | | | (40,504,934 | ) | | | (18,055,782 | ) |
| GBP | 270,580 | (a) | | 01/05/46 | | 6 month GBP | | 2.250 | | | (10,885,759 | ) | | | (15,936,349 | ) |
| $ | 25,550 | (a) | | 06/15/46 | | 2.500 | | 3 month LIBOR | | | 2,000,822 | | | | 89,275 | |
| | 159,500 | (a) | | 06/15/46 | | 3 month LIBOR | | 2.500 | | | (10,234,494 | ) | | | (2,813,276 | ) |
| GBP | 367,810 | (a) | | 06/15/46 | | 6 month GBP | | 2.000 | | | (46,469,935 | ) | | | 1,223,354 | |
| | TOTAL | | | | | | | | | $ | (157,110,525 | ) | | $ | (67,175,471 | ) |
| | (a) | | Represents forward starting interest rate swaps whose effective dates of commencement of accruals and cash flows occur subsequent to March 31, 2016. |
| | |
| 110 | | The accompanying notes are an integral part of these financial statements. |
GOLDMAN SACHS STRATEGIC INCOME FUND
|
| ADDITIONAL INVESTMENT INFORMATION (continued) |
OVER THE COUNTER CREDIT DEFAULT SWAP CONTRACTS
| | | | | | | | | | | | | | | | | | | | | | | | | | |
| | | | Market Value | |
| Counterparty | | Referenced Obligation | | Notional
Amount
(000s) | | | Rates Received
(Paid) | | | Termination
Date | | | Credit
Spread at
March 31, 2016(b) | | | Upfront Payments
Made (Received) | | | Unrealized
Gain (Loss) | |
Protection Purchased: | | | | | | | | | | | | | | | | | | | | | | | | | | |
Bank of America Securities LLC | | People’s Republic of China 7.500% 10/28/27 | | $ | 13,180 | | | | (1.000 | )% | | | 03/20/19 | | | | 0.752 | % | | $ | (14,795 | ) | | $ | (85,098 | ) |
Barclays Bank PLC | | | | | 98,670 | | | | (1.000 | ) | | | 03/20/19 | | | | 0.752 | | | | (196,412 | ) | | | (551,423 | ) |
Citibank NA | | | | | 518,290 | | | | (1.000 | ) | | | 03/20/19 | | | | 0.752 | | | | (1,526,701 | ) | | | (2,401,500 | ) |
| | | | | 1,072,530 | | | | (1.000 | ) | | | 06/20/19 | | | | 0.791 | | | | (3,706,980 | ) | | | (3,719,493 | ) |
JPMorgan Securities, Inc. | | | | | 66,660 | | | | (1.000 | ) | | | 03/20/19 | | | | 0.752 | | | | (186,298 | ) | | | (318,927 | ) |
| | | | | | 24,020 | | | | (1.000 | ) | | | 06/20/19 | | | | 0.791 | | | | (90,746 | ) | | | (75,575 | ) |
| TOTAL | | | $ | (5,721,932 | ) | | $ | (7,152,016 | ) |
| | (b) | | Credit spread on the Referenced Obligation, together with the term of the swap contract, are indicators of payment/performance risk. The likelihood of a credit event occurring which would require a fund to make a payment or otherwise be required to perform under the swap contract is generally greater as the credit spread and the term of the swap contract increase. |
CENTRALLY CLEARED CREDIT DEFAULT SWAP CONTRACT
| | | | | | | | | | | | | | | | | | | | | | |
| | | | Market Value | |
| Referenced Obligation | | Notional
Amount
(000s) | | Rates Received
(Paid) | | | Termination
Date | | | Credit
Spread at
March 31, 2016(b) | | | Upfront Payments
Made (Received) | | | Unrealized
Gain (Loss) | |
Protection Purchased: | | | | | | | | | | | | | | | | | | | | | | |
CDX North America High Yield Index 25 | | $399,350 | | | (5.000 | )% | | | 12/20/20 | | | | 4.279 | % | | $ | 309,093 | | | $ | (12,615,504 | ) |
| | (b) | | Credit spread on the Referenced Obligation, together with the term of the swap contract, are indicators of payment/performance risk. The likelihood of a credit event occurring which would require a fund to make a payment or otherwise be required to perform under the swap contract is generally greater as the credit spread and the term of the swap contract increase. |
| | |
| The accompanying notes are an integral part of these financial statements. | | 111 |
GOLDMAN SACHS STRATEGIC INCOME FUND
Schedule of Investments (continued)
March 31, 2016
|
| ADDITIONAL INVESTMENT INFORMATION (continued) |
OVER THE COUNTER TOTAL RETURN SWAP CONTRACTS
| | | | | | | | | | | | | | | | | | | | |
| | | | | | | | | | | | | Market Value | |
| Counterparty | | Notional
Amount
(000s) | | | Reference
Security | | Termination
Date | | | Financing
Fee# | | Upfront Payments
Made (Received) | | | Unrealized
Gain (Loss) | |
Barclays Bank PLC | | $ | 21,177 | | | Markit MBX Fannie-Mae Index, 30 yr Fixed Rate, 6.500%, Series 67 | | | 01/12/38 | | | 1 month LIBOR | | $ | 48,365 | | | $ | 18,615 | |
Credit Suisse International (London) | | | 31,238 | | | Markit IOS Fannie-Mae Index, 30 yr Fixed Rate, 2.064%, Series 13 | | | 01/12/44 | | | 1 month LIBOR | | | (5,304 | ) | | | 331,464 | |
| | | 30,935 | | | Markit IOS Fannie-Mae Index, 30 yr Fixed Rate, 3.500%, Series 14 | | | 01/12/45 | | | 1 month LIBOR | | | 111,595 | | | | (545,771 | ) |
| | | 137,837 | | | Markit IOS Fannie-Mae Index, 30 yr Fixed Rate, 4.000%, Series 13 | | | 01/12/44 | | | 1 month LIBOR | | | (1,837,587 | ) | | | 280,490 | |
| | | 26,568 | | | Markit MBX Fannie-Mae Index, 30 yr Fixed Rate, 6.500%, Series 67 | | | 01/12/38 | | | 1 month LIBOR | | | 39,908 | | | | 44,125 | |
Deutsche Bank AG | | | 148,918 | | | Markit MBX Fannie-Mae Index, 30 yr Fixed Rate, 6.500%, Series 67 | | | 01/12/38 | | | 1 month LIBOR | | | (116,158 | ) | | | 587,168 | |
JPMorgan Securities, Inc. | | | 21,333 | | | Markit IOS Fannie-Mae Index, 30 yr Fixed Rate, 3.500%, Series 13 | | | 01/12/44 | | | 1 month LIBOR | | | (7,986 | ) | | | 230,730 | |
| | | 64,312 | | | Markit IOS Fannie-Mae Index, 30 yr Fixed Rate, 3.500%, Series 14 | | | 01/12/45 | | | 1 month LIBOR | | | (834,666 | ) | | | (67,963 | ) |
| | | 65,635 | | | Markit IOS Fannie-Mae Index, 30 yr Fixed Rate, 4.000%, Series 13 | | | 01/12/44 | | | 1 month LIBOR | | | (364,368 | ) | | | (377,005 | ) |
| | | 123,678 | | | Markit MBX Fannie-Mae Index, 30 yr Fixed Rate, 6.500%, Series 67 | | | 01/12/38 | | | 1 month LIBOR | | | 45,834 | | | | (252,791 | ) |
| | | | 27,436 | | | Markit MBX Ginnie-Mae Index, 30 yr Fixed Rate, 4.500%, Series 10 | | | 01/12/41 | | | 1 month LIBOR | | | 76,559 | | | | (197,441 | ) |
| TOTAL | | | | | | | | | | | | | | $ | (2,843,808 | ) | | $ | 51,621 | |
| | # | | The Fund receives annual coupon payments in accordance with the swap contract(s). On the termination date of the swap contract(s), the Fund will either receive from or pay to the counterparty an amount equal to the net of the accrued financing fees and the value of the reference security subtracted from the original notional cost (notional multiplied by the price change of the reference security, converted to U.S. Dollars). |
| | |
| 112 | | The accompanying notes are an integral part of these financial statements. |
GOLDMAN SACHS MULTI SECTOR FIXED INCOME FUNDS
Schedule of Investments
March 31, 2016
|
| ADDITIONAL INVESTMENT INFORMATION |
JOINT REPURCHASE AGREEMENT ACCOUNT II — At March 31, 2016, the Global Income Fund had undivided interests in the Joint Repurchase Agreement Account II, with a maturity date of April 1, 2016, as follows:
| | | | |
| Principal Amount | | Maturity Value | | Collateral Allocation Value |
$37,200,000 | | $37,200,311 | | $37,944,003 |
REPURCHASE AGREEMENTS — At March 31, 2016, the Principal Amounts of the Fund’s interest in the Joint Repurchase Agreement Account II were as follows:
| | | | | | | | |
| Counterparty | | Interest
Rate | | | Principal
Amount | |
BNP Paribas Securities Co. | | | 0.310 | % | | $ | 9,183,506 | |
Citigroup Global Markets, Inc. | | | 0.330 | | | | 7,312,791 | |
Merrill Lynch & Co., Inc. | | | 0.300 | | | | 6,928,445 | |
Merrill Lynch & Co., Inc. | | | 0.280 | | | | 13,775,258 | |
| TOTAL | | | | | | $ | 37,200,000 | |
At March 31, 2016, the Joint Repurchase Agreement Account II was fully collateralized by:
| | | | | | | | |
| Issuer | | Interest Rates | | | Maturity Dates | |
Federal Farm Credit Banks | | | 3.050% to 3.340 | % | | | 10/18/27 to 02/01/33 | |
Federal Home Loan Banks | | | 2.750 to 5.500 | | | | 06/08/18 to 07/15/36 | |
Federal Home Loan Mortgage Corp. | | | 3.000 to 6.000 | | | | 04/01/22 to 10/01/45 | |
Federal National Mortgage Association | | | 3.500 to 6.000 | | | | 12/01/17 to 09/01/44 | |
Government National Mortgage Association | | | 3.500 to 10.000 | | | | 04/05/18 to 09/20/45 | |
United States Treasury Note | | | 0.625 to 2.875 | | | | 03/31/18 to 11/15/25 | |
United States Treasury Stripped Securities | | | 0.000 | | | | 02/15/31 to 02/15/45 | |
| | |
| The accompanying notes are an integral part of these financial statements. | | 113 |
GOLDMAN SACHS MULTI SECTOR FIXED INCOME FUNDS
Statements of Assets and Liabilities
March 31, 2016
| | | | | | | | | | | | | | | | | | |
| | | | | Bond Fund | | | Core Fixed
Income Fund | | | Global
Income Fund | | | Strategic
Income Fund | |
| | Assets: | | | | | | | | | | | | | | | | |
| | Investments of unaffiliated issuers, at value (cost $485,670,802, $909,185,679, $882,788,649 and $13,024,492,481) | | $ | 490,371,987 | | | $ | 926,181,483 | | | $ | 896,205,406 | | | $ | 12,549,191,119 | |
| | Investments of affiliated issuers, at value (cost $58,985,636, $81,617,969, $0 and $2,576,641,388) | | | 58,985,636 | | | | 81,617,969 | | | | — | | | | 2,576,641,388 | |
| | Cash | | | 4,757,860 | | | | 9,362,251 | | | | 103,365 | | | | 139,837,342 | |
| | Foreign currencies, at value (cost $44,755, $37,298, $359,736 and $380,769, respectively) | | | 42,907 | | | | 36,863 | | | | 360,409 | | | | 213,086 | |
| | Unrealized gain on swap contracts | | | 144,840 | | | | — | | | | 17,206 | | | | 21,326,813 | |
| | Unrealized gain on forward foreign currency exchange contracts | | | 3,295,015 | | | | 1,057,822 | | | | 5,871,991 | | | | 241,736,659 | |
| | Variation margin on certain derivative contracts | | | 9,604 | | | | 50,543 | | | | 21,003 | | | | — | |
| | Receivables: | | | | | | | | | | | | | | | | |
| | Investments sold on an extended-settlement basis | | | 29,215,822 | | | | 21,966,830 | | | | 9,255,392 | | | | 163,252,565 | |
| | Collateral on certain derivative contracts(a) | | | 5,257,270 | | | | 3,517,163 | | | | 6,833,221 | | | | 337,572,463 | |
| | Investments sold | | | 1,363,284 | | | | 1,975,950 | | | | 14,339,216 | | | | 303,227,934 | |
| | Interest | | | 2,328,313 | | | | 5,282,386 | | | | 4,726,691 | | | | 73,320,482 | |
| | Fund shares sold | | | 1,758,253 | | | | 2,708,234 | | | | 3,359,417 | | | | 12,645,708 | |
| | Due from broker — upfront payment | | | 135,021 | | | | 16,061 | | | | 39,393 | | | | 1,697,825 | |
| | Reimbursement from investment adviser | | | 65,021 | | | | 59,930 | | | | 85,407 | | | | — | |
| | Upfront payments made on swap contracts | | | 57,881 | | | | — | | | | 95,553 | | | | 322,261 | |
| | Other assets | | | 1,189 | | | | 4,021 | | | | 1,843 | | | | 94,764 | |
| | Total assets | | | 597,789,903 | | | | 1,053,837,506 | | | | 941,315,513 | | | | 16,421,080,409 | |
| | | | | | | | | | | | | | | | | | |
| | Liabilities: | | | | | | | | | | | | | | | | |
| | Reverse Repurchase Agreement, at value | | | — | | | | — | | | | — | | | | 2,663,485 | |
| | Unrealized loss on swap contracts | | | 143,503 | | | | — | | | | 22,082 | | | | 44,709,493 | |
| | Unrealized loss on forward foreign currency exchange contracts | | | 2,867,521 | | | | 1,012,303 | | | | 10,928,897 | | | | 247,110,550 | |
| | Variation margin on certain derivative contracts | | | 180,122 | | | | 77,353 | | | | 262,387 | | | | 15,641,225 | |
| | Written option contracts, at value (premium received $0, $0, $44,808 and $0, respectively | | | — | | | | — | | | | 13,571 | | | | — | |
| | Forward sale contracts, at value (proceeds received $24,049,063, $4,059,219, $0 and $0, respectively) | | | 24,117,657 | | | | 4,095,000 | | | | — | | | | — | |
| | Payables: | | | | | | | | | | | | | | | | |
| | Investments purchased on an extended — settlement basis | | | 93,058,411 | | | | 112,631,973 | | | | 88,929,740 | | | | 107,462,891 | |
| | Fund shares redeemed | | | 528,776 | | | | 2,515,107 | | | | 41,449,421 | | | | 52,513,033 | |
| | Management fees | | | 149,870 | | | | 306,339 | | | | 445,858 | | | | 5,639,988 | |
| | Distribution and Service fees and Transfer Agency fees | | | 88,451 | | | | 90,522 | | | | 68,635 | | | | 1,551,691 | |
| | Income distribution | | | 32,438 | | | | 56,800 | | | | 9,253 | | | | 2,612,245 | |
| | Upfront payments received on swap contracts | | | 23,484 | | | | — | | | | — | | | | 8,888,001 | |
| | Investments purchased | | | 11,348 | | | | 1,656,570 | | | | — | | | | 2,208,698,486 | |
| | Collateral on certain derivative contracts | | | 10,000 | | | | 250,000 | | | | 189,803 | | | | 4,240,000 | |
| | Collateral on Reverse Repurchase agreements | | | 4,000 | | | | — | | | | — | | | | 35,904 | |
| | Accrued expenses | | | 224,479 | | | | 212,033 | | | | 227,825 | | | | 1,197,312 | |
| | Total liabilities | | | 121,440,060 | | | | 122,904,000 | | | | 142,547,472 | | | | 2,702,964,304 | |
| | | | | | | | | | | | | | | | | | |
| | Net Assets: | | | | | | | | | | | | | | | | |
| | Paid-in capital | | | 474,395,802 | | | | 933,748,691 | | | | 798,369,427 | | | | 16,058,274,369 | |
| | Undistributed (distributions in excess of) net investment income | | | (634,504 | ) | | | 10,231,659 | | | | (7,344,072 | ) | | | (127,267,112 | ) |
| | Accumulated net realized gain (loss) | | | (3,142,136 | ) | | | (28,812,947 | ) | | | (1,530,424 | ) | | | (1,628,453,277 | ) |
| | Net unrealized gain (loss) | | | 5,730,681 | | | | 15,766,103 | | | | 9,273,110 | | | | (584,437,875 | ) |
| | | NET ASSETS | | $ | 476,349,843 | | | $ | 930,933,506 | | | $ | 798,768,041 | | | $ | 13,718,116,105 | |
| | | Net Assets: | | | | | | | | | | | | | | | | |
| | | Class A | | $ | 129,351,218 | | | $ | 142,298,862 | | | $ | 111,851,545 | | | $ | 1,383,884,966 | |
| | | Class C | | | 17,254,181 | | | | 18,124,286 | | | | 12,653,184 | | | | 710,230,260 | |
| | | Institutional | | | 279,435,456 | | | | 697,260,007 | | | | 639,914,743 | | | | 11,261,977,360 | |
| | | Service | | | 1,119,074 | | | | 1,577,829 | | | | 2,280,078 | | | | — | |
| | | Class IR | | | 39,938,779 | | | | 5,057,974 | | | | 31,548,300 | | | | 332,916,721 | |
| | | Class R | | | 9,240,901 | | | | 9,523,779 | | | | — | | | | 9,398,739 | |
| | | Class R6 | | | 10,234 | | | | 57,090,769 | | | | 520,191 | | | | 19,708,059 | |
| | | Total Net Assets | | $ | 476,349,843 | | | $ | 930,933,506 | | | $ | 798,768,041 | | | $ | 13,718,116,105 | |
| | | Shares Outstanding $0.001 par value (unlimited number of shares authorized): | | | | | | | | | | | | | | | | |
| | | Class A | | | 12,583,512 | | | | 13,514,492 | | | | 9,139,725 | | | | 147,075,715 | |
| | | Class C | | | 1,679,744 | | | | 1,712,131 | | | | 1,042,239 | | | | 75,456,661 | |
| | | Institutional | | | 27,191,349 | | | | 65,941,804 | | | | 52,372,100 | | | | 1,196,873,610 | |
| | | Service | | | 108,898 | | | | 149,157 | | | | 187,538 | | | | — | |
| | | Class IR | | | 3,897,854 | | | | 479,975 | | | | 2,585,471 | | | | 35,393,974 | |
| | | Class R | | | 900,045 | | | | 903,700 | | | | — | | | | 999,667 | |
| | | Class R6 | | | 996 | | | | 5,398,918 | | | | 42,579 | | | | 2,094,470 | |
| | | Net asset value, offering and redemption price per share:(b) | | | | | | | | | | | | | | | | |
| | | Class A | | | $10.28 | | | | $10.53 | | | | $12.24 | | | | $9.41 | |
| | | Class C | | | 10.27 | | | | 10.59 | | | | 12.14 | | | | 9.41 | |
| | | Institutional | | | 10.28 | | | | 10.57 | | | | 12.22 | | | | 9.41 | |
| | | Service | | | 10.28 | | | | 10.58 | | | | 12.16 | | | | — | |
| | | Class IR | | | 10.25 | | | | 10.54 | | | | 12.20 | | | | 9.41 | |
| | | Class R | | | 10.27 | | | | 10.54 | | | | — | | | | 9.40 | |
| | | Class R6 | | | 10.28 | | | | 10.57 | | | | 12.22 | | | | 9.41 | |
| | (a) | | Segregated for initial margin and/or collateral on future transactions of $640,000 and $11,197,000 for the Bond and Strategic Income Funds, respectively. Also includes amounts segregated for initial margin and/or collateral on swap transactions of $4,617,270, $3,517,163, $6,833,221 and $326,375,463 for the Bond, Core Fixed Income, Global Income and Strategic Income Funds, respectively. |
| | (b) | | Maximum public offering price per share for Class A Shares of the Bond, Core Fixed Income, Global Income and Strategic Income Funds is $10.68, $10.94, $12.72 and $9.78, respectively. At redemption, Class C Shares may be subject to a contingent deferred sales charge, assessed on the amount equal to the lesser of the current net asset value or the original purchase price of the shares. |
| | |
| 114 | | The accompanying notes are an integral part of these financial statements. |
GOLDMAN SACHS MULTI SECTOR FIXED INCOME FUNDS
Statements of Operations
For the Fiscal Year Ended March 31, 2016
| | | | | | | | | | | | | | | | | | |
| | | | | Bond Fund | | | Core Fixed
Income Fund | | | Global
Income Fund | | | Strategic
Income Fund | |
| | Investment income: | |
| | Interest (net of foreign withholding taxes of $44, $0, $24,526 and $21,260) | | $ | 11,547,466 | | | $ | 27,122,912 | | | $ | 13,208,762 | | | $ | 691,051,603 | |
| | Dividends — unaffiliated issuers | | | — | | | | — | | | | — | | | | 10,339,913 | |
| | Dividends — affiliated issuers | | | 36,053 | | | | 35,658 | | | | — | | | | 1,094,952 | |
| | Total investment income | | | 11,583,519 | | | | 27,158,570 | | | | 13,208,762 | | | | 702,486,468 | |
| | | | | |
| | Expenses: | |
| | Management fees | | | 1,879,089 | | | | 3,933,334 | | | | 4,091,276 | | | | 94,750,329 | |
| | Distribution and Service fees(a) | | | 449,655 | | | | 554,938 | | | | 241,687 | | | | 14,224,749 | |
| | Custody, accounting and administrative services | | | 353,845 | | | | 323,904 | | | | 407,377 | | | | 2,654,977 | |
| | Transfer Agency fees(a) | | | 309,039 | | | | 542,534 | | | | 331,885 | | | | 10,621,614 | |
| | Professional fees | | | 139,308 | | | | 136,615 | | | | 134,622 | | | | 176,861 | |
| | Registration fees | | | 119,363 | | | | 106,398 | | | | 106,463 | | | | 264,060 | |
| | Printing and mailing costs | | | 68,183 | | | | 73,975 | | | | 71,888 | | | | 1,035,525 | |
| | Trustee fees | | | 23,873 | | | | 31,603 | | | | 30,573 | | | | 80,789 | |
| | Service Share fees — Service Plan | | | 171 | | | | 4,626 | | | | 1,916 | | | | — | |
| | Service Share fees — Shareholder Administration Plan | | | 171 | | | | 4,626 | | | | 1,916 | | | | — | |
| | Other | | | 14,359 | | | | 32,954 | | | | 22,264 | | | | 308,244 | |
| | Total expenses | | | 3,357,056 | | | | 5,745,507 | | | | 5,441,867 | | | | 124,117,148 | |
| | Less — expense reductions | | | (930,108 | ) | | | (677,283 | ) | | | (748,500 | ) | | | (1,180,525 | ) |
| | Net expenses | | | 2,426,948 | | | | 5,068,224 | | | | 4,693,367 | | | | 122,936,623 | |
| | NET INVESTMENT INCOME | | | 9,156,571 | | | | 22,090,346 | | | | 8,515,395 | | | | 579,549,845 | |
| | | | | | | | | | | | | | | | | | |
| | Realized and unrealized gain (loss): | |
| | Net realized gain (loss) from: | | | | | | | | | | | | | | | | |
| | Investments — unaffiliated issuers | | | (1,670,852 | ) | | | (1,062,663 | ) | | | (10,727,185 | ) | | | (867,444,696 | ) |
| | Futures contracts | | | 3,657,295 | | | | 4,209,792 | | | | 3,651,220 | | | | (9,030,280 | ) |
| | Written options | | | (101,550 | ) | | | (267,180 | ) | | | 74,513 | | | | — | |
| | Swap contracts | | | 3,197,915 | | | | 1,549,999 | | | | 2,658,875 | | | | 130,461,728 | |
| | Forward foreign currency exchange contracts | | | (1,422,822 | ) | | | (332,294 | ) | | | (13,274,881 | ) | | | 83,152,257 | |
| | Foreign currency transactions | | | 475,048 | | | | 393,896 | | | | 9,089,715 | | | | 81,569,012 | |
| | Net change in unrealized gain (loss) on: | | | | | | | | | | | | | | | | |
| | Investments — unaffiliated issuers | | | (3,292,934 | ) | | | (9,232,546 | ) | | | 28,542,196 | | | | (310,284,243 | ) |
| | Futures contracts | | | (953,645 | ) | | | (1,594 | ) | | | (455,988 | ) | | | 15,021,763 | |
| | Written options | | | — | | | | — | | | | 31,237 | | | | — | |
| | Swap contracts | | | (475,974 | ) | | | (755,259 | ) | | | (2,066,150 | ) | | | 5,937,523 | |
| | Forward foreign currency exchange contracts | | | 109,966 | | | | (103,487 | ) | | | (8,656,962 | ) | | | (75,988,408 | ) |
| | Foreign currency translation | | | 9,572 | | | | 3,383 | | | | 237,527 | | | | 743,308 | |
| | Net realized and unrealized gain (loss) | | | (467,981 | ) | | | (5,597,953 | ) | | | 9,104,117 | | | | (945,862,036 | ) |
| | NET INCREASE (DECREASE) IN NET ASSETS RESULTING FROM OPERATIONS | | $ | 8,688,590 | | | $ | 16,492,393 | | | $ | 17,619,512 | | | $ | (366,312,191 | ) |
| | (a) | | Class specific Distribution and Service and Transfer Agency fees were as follows: |
| | | | | | | | | | | | | | | | | | | | | | | | | | | | | | | | | | | | | | | | |
| | | Distribution and Service Fees | | | Transfer Agent Fees | |
Fund | | Class A | | | Class C | | | Class R | | | Class A | | | Class C | | | Institutional | | | Service | | | Class IR | | | Class R | | | Class R6(b) | |
Bond | | $ | 291,971 | | | $ | 130,484 | | | $ | 27,200 | | | $ | 151,825 | | | $ | 16,963 | | | $ | 103,886 | | | $ | 29 | | | $ | 29,262 | | | $ | 7,072 | | | $ | 2 | |
Core Fixed Income | | | 360,394 | | | | 187,033 | | | | 7,511 | | | | 187,405 | | | | 24,314 | | | | 317,838 | | | | 740 | | | | 6,446 | | | | 1,953 | | | | 3,838 | |
Global Income | | | 170,403 | | | | 71,284 | | | | — | | | | 88,610 | | | | 9,267 | | | | 215,820 | | | | 307 | | | | 17,865 | | | | — | | | | 16 | |
Strategic Income | | | 5,058,888 | | | | 9,116,152 | | | | 49,709 | | | | 2,630,622 | | | | 1,185,100 | | | | 6,153,250 | | | | — | | | | 638,236 | | | | 12,924 | | | | 1,482 | |
| | (b) | | Commenced operations on July 31, 2015. |
| | |
| The accompanying notes are an integral part of these financial statements. | | 115 |
GOLDMAN SACHS MULTI SECTOR FIXED INCOME FUNDS
Statements of Changes in Net Assets
| | | | | | | | | | |
| | | | | Bond Fund | |
| | | | | For the Fiscal
Year Ended
March 31, 2016 | | | For the Fiscal
Year Ended
March 31, 2015 | |
| | From operations: | | | | | | | | |
| | Net investment income | | $ | 9,156,571 | | | $ | 5,521,597 | |
| | Net realized gain (loss) | | | 4,135,034 | | | | 4,839,244 | |
| | Net change in unrealized gain (loss) | | | (4,603,015 | ) | | | 1,112,990 | |
| | Net increase (decrease) in net assets resulting from operations | | | 8,688,590 | | | | 11,473,831 | |
| | | | | | | | | | |
| | Distributions to shareholders: | | | | | | | | |
| | From net investment income | | | | | | | | |
| | Class A Shares | | | (3,961,371 | ) | | | (1,147,520 | ) |
| | Class B Shares(a) | | | — | | | | (17,592 | ) |
| | Class C Shares | | | (341,571 | ) | | | (130,944 | ) |
| | Institutional Shares | | | (9,211,907 | ) | | | (5,401,984 | ) |
| | Service Shares | | | (1,365 | ) | | | (310 | ) |
| | Class IR Shares | | | (784,440 | ) | | | (215,201 | ) |
| | Class R Shares | | | (192,061 | ) | | | (1,932 | ) |
| | Class R6 Shares(b) | | | (287 | ) | | | — | |
| | From net realized gains | | | | | | | | |
| | Class A Shares | | | (11,720 | ) | | | (758,933 | ) |
| | Class C Shares | | | (1,224 | ) | | | (151,624 | ) |
| | Institutional Shares | | | (22,834 | ) | | | (2,898,668 | ) |
| | Service Shares | | | (1 | ) | | | (230 | ) |
| | Class IR Shares | | | (2,040 | ) | | | (146,579 | ) |
| | Class R Shares | | | (718 | ) | | | (1,545 | ) |
| | Class R6 Shares(b) | | | (1 | ) | | | — | |
| | Return of capital | | | | |
| | Class A Shares | | | — | | | | — | |
| | Class C Shares | | | — | | | | — | |
| | Institutional Shares | | | — | | | | — | |
| | Class IR Shares | | | — | | | | — | |
| | Class R Shares | | | — | | | | — | |
| | Class R6 Shares(b) | | | — | | | | — | |
| | Total distributions to shareholders | | | (14,531,540 | ) | | | (10,873,062 | ) |
| | | | | | | | | | |
| | From share transactions: | | | | | | | | |
| | Proceeds from sales of shares | | | 218,562,128 | | | | 277,906,927 | |
| | Reinvestment of distributions | | | 13,754,731 | | | | 10,233,485 | |
| | Cost of shares redeemed | | | (195,724,054 | ) | | | (98,640,237 | ) |
| | Net increase (decrease) in net assets resulting from share transactions | | | 36,592,805 | | | | 189,500,175 | |
| | TOTAL INCREASE (DECREASE) | | | 30,749,855 | | | | 190,100,944 | |
| | | | | | | | | | |
| | Net assets: | | | | | | | | |
| | Beginning of year | | | 445,599,988 | | | | 255,499,044 | |
| | End of year | | $ | 476,349,843 | | | $ | 445,599,988 | |
| | Undistributed (distributions in excess of) net investment income | | $ | (634,504 | ) | | $ | 1,017,799 | |
| | (a) | | Class B Shares were converted into Class A Shares at the close of business on November 14, 2014. |
| | (b) | | Commenced operations on July 31, 2015. |
| | |
| 116 | | The accompanying notes are an integral part of these financial statements. |
GOLDMAN SACHS MULTI SECTOR FIXED INCOME FUNDS
| | | | | | | | | | | | | | | | | | | | | | | | | | | | | | | | |
| | | Core Fixed Income Fund | | | | | Global Income Fund | | | | | Strategic Income Fund | |
| | | For the Fiscal
Year Ended
March 31, 2016 | | | | | For the Fiscal
Year Ended
March 31, 2015 | | | | | For the Fiscal Year Ended
March 31, 2016 | | | | | For the Fiscal
Year Ended
March 31, 2015 | | | | | For the Fiscal
Year Ended
March 31, 2016 | | | For the Fiscal
Year Ended
March 31, 2015 | |
| | | | | | | | | | | | | | | | | | | | | | | | | | | | | | | | |
| | $ | 22,090,346 | | | | | $ | 21,695,131 | | | | | $ | 8,515,395 | | | | | $ | 7,483,331 | | | | | $ | 579,549,845 | | | $ | 570,638,704 | |
| | | 4,491,550 | | | | | | 16,006,646 | | | | | | (8,527,743 | ) | | | | | 45,743,748 | | | | | | (581,291,979 | ) | | | (736,339,322 | ) |
| | | (10,089,503 | ) | | | | | 11,868,359 | | | | | | 17,631,860 | | | | | | (26,722,377 | ) | | | | | (364,570,057 | ) | | | (491,939,658 | ) |
| | | 16,492,393 | | | | | | 49,570,136 | | | | | | 17,619,512 | | | | | | 26,504,702 | | | | | | (366,312,191 | ) | | | (657,640,276 | ) |
| | | | | | | | | | | | | | | | | | | | | | | | | | | | | | | | |
| | | | | | | | | | | | | | | | | | | | | | | | | | | | | | | | |
| | | (3,435,801 | ) | | | | | (3,124,347 | ) | | | | | (3,642,568 | ) | | | | | (1,456,880 | ) | | | | | (81,465,780 | ) | | | (89,978,961 | ) |
| | | — | | | | | | (27,740 | ) | | | | | — | | | | | | (5,781 | ) | | | | | — | | | | — | |
| | | (304,056 | ) | | | | | (284,053 | ) | | | | | (349,221 | ) | | | | | (90,663 | ) | | | | | (30,121,737 | ) | | | (23,626,625 | ) |
| | | (21,524,563 | ) | | | | | (21,321,052 | ) | | | | | (34,535,212 | ) | | | | | (11,422,559 | ) | | | | | (675,970,981 | ) | | | (605,463,366 | ) |
| | | (41,047 | ) | | | | | (34,030 | ) | | | | | (21,936 | ) | | | | | (4,575 | ) | | | | | — | | | | — | |
| | | (130,448 | ) | | | | | (69,739 | ) | | | | | (774,269 | ) | | | | | (139,405 | ) | | | | | (20,986,423 | ) | | | (24,753,453 | ) |
| | | (31,417 | ) | | | | | (14,716 | ) | | | | | — | | | | | | — | | | | | | (401,579 | ) | | | (135,507 | ) |
| | | (605,243 | ) | | | | | — | | | | | | (1,372 | ) | | | | | — | | | | | | (510,041 | ) | | | — | |
| | | — | | | | | | — | | | | | | (63,770 | ) | | | | | (1,303,585 | ) | | | | | — | | | | — | |
| | | — | | | | | | — | | | | | | (7,092 | ) | | | | | (115,184 | ) | | | | | — | | | | — | |
| | | — | | | | | | — | | | | | | (571,392 | ) | | | | | (8,585,681 | ) | | | | | — | | | | — | |
| | | — | | | | | | — | | | | | | (346 | ) | | | | | (3,820 | ) | | | | | — | | | | — | |
| | | — | | | | | | — | | | | | | (12,363 | ) | | | | | (162,396 | ) | | | | | — | | | | — | |
| | | — | | | | | | — | | | | | | — | | | | | | — | | | | | | — | | | | — | |
| | | — | | | | | | — | | | | | | (10 | ) | | | | | — | | | | | | — | | | | — | |
| | | — | | | | | | — | | | | | | — | | | | | | — | | | | | | — | | | | (231,031 | ) |
| | | — | | | | | | — | | | | | | — | | | | | | — | | | | | | — | | | | (60,664 | ) |
| | | — | | | | | | — | | | | | | — | | | | | | — | | | | | | — | | | | (1,554,593 | ) |
| | | — | | | | | | — | | | | | | — | | | | | | — | | | | | | — | | | | (509 | ) |
| | | — | | | | | | — | | | | | | — | | | | | | — | | | | | | — | | | | (63,396 | ) |
| | | — | | | | | | — | | | | | | — | | | | | | — | | | | | | — | | | | — | |
| | | (26,072,575 | ) | | | | | (24,875,677 | ) | | | | | (39,979,551 | ) | | | | | (23,290,529 | ) | | | | | (809,456,541 | ) | | | (745,868,105 | ) |
| | | | | | | | | | | | | | | | | | | | | | | | | | | | | | | | |
| | | | | | | | | | | | | | | | | | | | | | | | | | | | | | | | |
| | | 399,469,538 | | | | | | 222,387,498 | | | | | | 565,955,923 | | | | | | 238,497,946 | | | | | | 3,677,437,056 | | | | 13,610,453,817 | |
| | | 24,899,720 | | | | | | 23,337,727 | | | | | | 39,281,036 | | | | | | 22,753,298 | | | | | | 670,751,973 | | | | 610,293,925 | |
| | | (420,613,359 | ) | | | | | (391,122,027 | ) | | | | | (303,265,507 | ) | | | | | (239,996,406 | ) | | | | | (12,579,124,637 | ) | | | (10,593,267,722 | ) |
| | | 3,755,899 | | | | | | (145,396,802 | ) | | | | | 301,971,452 | | | | | | 21,254,838 | | | | | | (8,230,935,608 | ) | | | 3,627,480,020 | |
| | | (5,824,283 | ) | | | | | (120,702,343 | ) | | | | | 279,611,413 | | | | | | 24,469,011 | | | | | | (9,406,704,340 | ) | | | 2,223,971,639 | |
| | | | | | | | | | | | | | | | | | | | | | | | | | | | | | | | |
| | | | | | | | | | | | | | | | | | | | | | | | | | | | | | | | |
| | | 936,757,789 | | | | | | 1,057,460,132 | | | | | | 519,156,628 | | | | | | 494,687,617 | | | | | | 23,124,820,445 | | | | 20,900,848,806 | |
| | $ | 930,933,506 | | | | | $ | 936,757,789 | | | | | $ | 798,768,041 | | | | | $ | 519,156,628 | | | | | $ | 13,718,116,105 | | | $ | 23,124,820,445 | |
| | $ | 10,231,659 | | | | | $ | 9,469,673 | | | | | $ | (7,344,072 | ) | | | | $ | 32,095,532 | | | | | $ | (127,267,112 | ) | | $ | (132,269,442 | ) |
| | |
| The accompanying notes are an integral part of these financial statements. | | 117 |
GOLDMAN SACHS BOND FUND
Financial Highlights
Selected Data for a Share Outstanding Throughout Each Year
| | | | | | | | | | | | | | | | | | | | | | | | | | | | | | |
| | | | | | Income (loss) from
investment operations | | | Distributions
to shareholders | |
| | | Year - Share Class | | Net asset
value,
beginning
of year | | | Net
investment
income(a) | | | Net realized
and unrealized
gain (loss) | | | Total from
investment
operations | | | From net
investment
income | | | From net
realized
gains | | | Total
distributions | |
| | FOR THE FISCAL YEARS ENDED MARCH 31, | |
| | 2016 - A | | $ | 10.44 | | | $ | 0.21 | | | $ | (0.03 | ) | | $ | 0.18 | | | $ | (0.34 | ) | | $ | — | (d) | | $ | (0.34 | ) |
| | 2016 - C | | | 10.44 | | | | 0.13 | | | | (0.03 | ) | | | 0.10 | | | | (0.27 | ) | | | — | (d) | | | (0.27 | ) |
| | 2016 - Institutional | | | 10.44 | | | | 0.24 | | | | (0.02 | ) | | | 0.22 | | | | (0.38 | ) | | | — | (d) | | | (0.38 | ) |
| | 2016 - Service | | | 10.44 | | | | 0.18 | | | | (0.01 | ) | | | 0.17 | | | | (0.33 | ) | | | — | (d) | | | (0.33 | ) |
| | 2016 - IR | | | 10.40 | | | | 0.23 | | | | (0.01 | ) | | | 0.22 | | | | (0.37 | ) | | | — | (d) | | | (0.37 | ) |
| | 2016 - R | | | 10.43 | | | | 0.18 | | | | (0.02 | ) | | | 0.16 | | | | (0.32 | ) | | | — | (d) | | | (0.32 | ) |
| | 2016 - R6 (Commenced July 31, 2015) | | | 10.33 | | | | 0.16 | | | | 0.08 | | | | 0.24 | | | | (0.29 | ) | | | — | (d) | | | (0.29 | ) |
| | 2015 - A | | | 10.42 | | | | 0.17 | | | | 0.25 | | | | 0.42 | | | | (0.24 | ) | | | (0.16 | ) | | | (0.40 | ) |
| | 2015 - C | | | 10.41 | | | | 0.10 | | | | 0.25 | | | | 0.35 | | | | (0.16 | ) | | | (0.16 | ) | | | (0.32 | ) |
| | 2015 - Institutional | | | 10.42 | | | | 0.22 | | | | 0.24 | | | | 0.46 | | | | (0.28 | ) | | | (0.16 | ) | | | (0.44 | ) |
| | 2015 - Service | | | 10.42 | | | | 0.17 | | | | 0.24 | | | | 0.41 | | | | (0.23 | ) | | | (0.16 | ) | | | (0.39 | ) |
| | 2015 - IR | | | 10.38 | | | | 0.19 | | | | 0.26 | | | | 0.45 | | | | (0.27 | ) | | | (0.16 | ) | | | (0.43 | ) |
| | 2015 - R | | | 10.41 | | | | 0.15 | | | | 0.25 | | | | 0.40 | | | | (0.22 | ) | | | (0.16 | ) | | | (0.38 | ) |
| | 2014 - A | | | 10.57 | | | | 0.22 | | | | (0.09 | ) | | | 0.13 | | | | (0.28 | ) | | | — | | | | (0.28 | ) |
| | 2014 - C | | | 10.57 | | | | 0.15 | | | | (0.11 | ) | | | 0.04 | | | | (0.20 | ) | | | — | | | | (0.20 | ) |
| | 2014 - Institutional | | | 10.57 | | | | 0.26 | | | | (0.09 | ) | | | 0.17 | | | | (0.32 | ) | | | — | | | | (0.32 | ) |
| | 2014 - Service | | | 10.57 | | | | 0.21 | | | | (0.10 | ) | | | 0.11 | | | | (0.26 | ) | | | — | | | | (0.26 | ) |
| | 2014 - IR | | | 10.54 | | | | 0.25 | | | | (0.11 | ) | | | 0.14 | | | | (0.30 | ) | | | — | | | | (0.30 | ) |
| | 2014 - R | | | 10.57 | | | | 0.19 | | | | (0.10 | ) | | | 0.09 | | | | (0.25 | ) | | | — | | | | (0.25 | ) |
| | 2013 - A | | | 10.37 | | | | 0.20 | | | | 0.57 | | | | 0.77 | | | | (0.25 | ) | | | (0.32 | ) | | | (0.57 | ) |
| | 2013 - C | | | 10.37 | | | | 0.12 | | | | 0.57 | | | | 0.69 | | | | (0.17 | ) | | | (0.32 | ) | | | (0.49 | ) |
| | 2013 - Institutional | | | 10.37 | | | | 0.23 | | | | 0.57 | | | | 0.80 | | | | (0.28 | ) | | | (0.32 | ) | | | (0.60 | ) |
| | 2013 - Service | | | 10.37 | | | | 0.18 | | | | 0.57 | | | | 0.75 | | | | (0.23 | ) | | | (0.32 | ) | | | (0.55 | ) |
| | 2013 - IR | | | 10.34 | | | | 0.22 | | | | 0.57 | | | | 0.79 | | | | (0.27 | ) | | | (0.32 | ) | | | (0.59 | ) |
| | 2013 - R | | | 10.37 | | | | 0.18 | | | | 0.56 | | | | 0.74 | | | | (0.22 | ) | | | (0.32 | ) | | | (0.54 | ) |
| | 2012 - A | | | 10.17 | | | | 0.27 | | | | 0.42 | | | | 0.69 | | | | (0.27 | ) | | | (0.22 | ) | | | (0.49 | ) |
| | 2012 - C | | | 10.16 | | | | 0.19 | | | | 0.43 | | | | 0.62 | | | | (0.19 | ) | | | (0.22 | ) | | | (0.41 | ) |
| | 2012 - Institutional | | | 10.17 | | | | 0.30 | | | | 0.43 | | | | 0.73 | | | | (0.31 | ) | | | (0.22 | ) | | | (0.53 | ) |
| | 2012 - Service | | | 10.17 | | | | 0.25 | | | | 0.43 | | | | 0.68 | | | | (0.26 | ) | | | (0.22 | ) | | | (0.48 | ) |
| | 2012 - IR | | | 10.18 | | | | 0.29 | | | | 0.38 | | | | 0.67 | | | | (0.29 | ) | | | (0.22 | ) | | | (0.51 | ) |
| | 2012 - R | | | 10.17 | | | | 0.25 | | | | 0.41 | | | | 0.66 | | | | (0.24 | ) | | | (0.22 | ) | | | (0.46 | ) |
| | (a) | | Calculated based on the average shares outstanding methodology. |
| | (b) | | Assumes investment at the net asset value at the beginning of the year, reinvestment of all dividends and distributions, a complete redemption of the investment at the net asset value at the end of the year and no sales or redemption charges. Total returns would be reduced if a sales or redemption charge was taken into account. Returns do not reflect the deduction of taxes that a shareholder would pay on Fund distributions or the redemption of Fund shares. Total returns for periods less than one full year are not annualized. |
| | (c) | | The Fund’s portfolio turnover rate is calculated in accordance with regulatory requirements, without regard to transactions involving short term investments and certain derivatives. If such transactions were included, the Fund’s portfolio turnover rate may be higher. |
| | (d) | | Rounds to less than $0.01 per share. |
| | |
| 118 | | The accompanying notes are an integral part of these financial statements. |
GOLDMAN SACHS BOND FUND
| | | | | | | | | | | | | | | | | | | | | | | | | | | | | | | | | | | | | | | | |
| | | | | | | | | | | | | | | | | | | | | | | | | | | | | | | | | | |
| | | Net asset
value, end
of year | | | | | Total
return(b) | | | | | Net assets,
end of
year
(in 000s) | | | | | Ratio of
net expenses
to average
net assets | | | | | Ratio of
total expenses
to average
net assets | | | | | Ratio of
net investment
income
to average
net assets | | | | | Portfolio
turnover
rate(c) | |
| | | | | | | | | | | | | | | | | | | | | | | | | | | | | | | | | | | | | | | | |
| | $ | 10.28 | | | | | | 1.83 | % | | $ | | | 129,351 | | | | | | 0.78 | % | | | | | 1.00 | % | | | | | 2.00 | % | | | | | 588 | % |
| | | 10.27 | | | | | | 0.98 | | | | | | 17,254 | | | | | | 1.53 | | | | | | 1.75 | | | | | | 1.25 | | | | | | 588 | |
| | | 10.28 | | | | | | 2.18 | | | | | | 279,435 | | | | | | 0.44 | | | | | | 0.66 | | | | | | 2.33 | | | | | | 588 | |
| | | 10.28 | | | | | | 1.68 | | | | | | 1,119 | | | | | | 0.94 | | | | | | 1.17 | | | | | | 1.74 | | | | | | 588 | |
| | | 10.25 | | | | | | 2.18 | | | | | | 39,939 | | | | | | 0.53 | | | | | | 0.75 | | | | | | 2.23 | | | | | | 588 | |
| | | 10.27 | | | | | | 1.58 | | | | | | 9,241 | | | | | | 1.03 | | | | | | 1.26 | | | | | | 1.77 | | | | | | 588 | |
| | | 10.28 | | | | | | 2.42 | | | | | | 10 | | | | | | 0.47 | (e) | | | | | 0.69 | (e) | | | | | 2.37 | (e) | | | | | 588 | |
| | | 10.44 | | | | | | 4.09 | | | | | | 106,694 | | | | | | 0.80 | | | | | | 1.06 | | | | | | 1.64 | | | | | | 454 | |
| | | 10.44 | | | | | | 3.41 | | | | | | 11,813 | | | | | | 1.56 | | | | | | 1.82 | | | | | | 0.97 | | | | | | 454 | |
| | | 10.44 | | | | | | 4.45 | | | | | | 302,035 | | | | | | 0.47 | | | | | | 0.73 | | | | | | 2.06 | | | | | | 454 | |
| | | 10.44 | | | | | | 3.94 | | | | | | 15 | | | | | | 0.96 | | | | | | 1.23 | | | | | | 1.61 | | | | | | 454 | |
| | | 10.40 | | | | | | 4.36 | | | | | | 24,680 | | | | | | 0.54 | | | | | | 0.80 | | | | | | 1.80 | | | | | | 454 | |
| | | 10.43 | | | | | | 3.84 | | | | | | 363 | | | | | | 1.06 | | | | | | 1.33 | | | | | | 1.47 | | | | | | 454 | |
| | | 10.42 | | | | | | 1.27 | | | | | | 34,403 | | | | | | 0.84 | | | | | | 1.06 | | | | | | 2.15 | | | | | | 580 | |
| | | 10.41 | | | | | | 0.42 | | | | | | 7,298 | | | | | | 1.59 | | | | | | 1.81 | | | | | | 1.40 | | | | | | 580 | |
| | | 10.42 | | | | | | 1.62 | | | | | | 207,604 | | | | | | 0.50 | | | | | | 0.71 | | | | | | 2.46 | | | | | | 580 | |
| | | 10.42 | | | | | | 1.12 | | | | | | 14 | | | | �� | | 1.00 | | | | | | 1.22 | | | | | | 2.01 | | | | | | 580 | |
| | | 10.38 | | | | | | 1.42 | | | | | | 3,808 | | | | | | 0.59 | | | | | | 0.81 | | | | | | 2.41 | | | | | | 580 | |
| | | 10.41 | | | | | | 0.92 | | | | | | 133 | | | | | | 1.09 | | | | | | 1.29 | | | | | | 1.83 | | | | | | 580 | |
| | | 10.57 | | | | | | 7.48 | | | | | | 40,783 | | | | | | 0.83 | | | | | | 0.98 | | | | | | 1.86 | | | | | | 1,025 | |
| | | 10.57 | | | | | | 6.68 | | | | | | 9,993 | | | | | | 1.58 | | | | | | 1.73 | | | | | | 1.11 | | | | | | 1,025 | |
| | | 10.57 | | | | | | 7.84 | | | | | | 301,201 | | | | | | 0.49 | | | | | | 0.64 | | | | | | 2.20 | | | | | | 1,025 | |
| | | 10.57 | | | | | | 7.31 | | | | | | 14 | | | | | | 0.99 | | | | | | 1.13 | | | | | | 1.70 | | | | | | 1,025 | |
| | | 10.54 | | | | | | 7.76 | | | | | | 2,847 | | | | | | 0.58 | | | | | | 0.73 | | | | | | 2.11 | | | | | | 1,025 | |
| | | 10.57 | | | | | | 7.22 | | | | | | 195 | | | | | | 1.08 | | | | | | 1.24 | | | | | | 1.68 | | | | | | 1,025 | |
| | | 10.37 | | | | | | 6.89 | | | | | | 91,437 | | | | | | 0.83 | | | | | | 0.99 | | | | | | 2.60 | | | | | | 767 | |
| | | 10.37 | | | | | | 6.20 | | | | | | 10,592 | | | | | | 1.58 | | | | | | 1.74 | | | | | | 1.85 | | | | | | 767 | |
| | | 10.37 | | | | | | 7.25 | | | | | | 232,692 | | | | | | 0.49 | | | | | | 0.65 | | | | | | 2.94 | | | | | | 767 | |
| | | 10.37 | | | | | | 6.75 | | | | | | 13 | | | | | | 0.99 | | | | | | 1.15 | | | | | | 2.44 | | | | | | 767 | |
| | | 10.34 | | | | | | 6.74 | | | | | | 2,739 | | | | | | 0.58 | | | | | | 0.74 | | | | | | 2.82 | | | | | | 767 | |
| | | 10.37 | | | | | | 6.63 | | | | | | 21 | | | | | | 1.08 | | | | | | 1.24 | | | | | | 2.37 | | | | | | 767 | |
| | |
| The accompanying notes are an integral part of these financial statements. | | 119 |
GOLDMAN SACHS CORE FIXED INCOME FUND
Financial Highlights
Selected Data for a Share Outstanding Throughout Each Year
| | | | | | | | | | | | | | | | | | | | | | |
| | | | | | | | Income (loss) from
Investment operations | | | | |
| | | Year - Share Class | | Net asset
value,
beginning
of year | | | Net
investment
income(a) | | | Net realized
and unrealized
gain (loss) | | | Total from
investment
operations | | | Distributions
to shareholders
from net
investment
income | |
| | FOR THE FISCAL YEARS ENDED MARCH 31, | |
| | 2016 - A | | $ | 10.64 | | | $ | 0.21 | | | $ | (0.07 | ) | | $ | 0.14 | | | $ | (0.25 | ) |
| | 2016 - C | | | 10.69 | | | | 0.13 | | | | (0.06 | ) | | | 0.07 | | | | (0.17 | ) |
| | 2016 - Institutional | | | 10.68 | | | | 0.24 | | | | (0.06 | ) | | | 0.18 | | | | (0.29 | ) |
| | 2016 - Service | | | 10.69 | | | | 0.19 | | | | (0.07 | ) | | | 0.12 | | | | (0.23 | ) |
| | 2016 - IR | | | 10.65 | | | | 0.23 | | | | (0.06 | ) | | | 0.17 | | | | (0.28 | ) |
| | 2016 - R | | | 10.65 | | | | 0.19 | | | | (0.08 | ) | | | 0.11 | | | | (0.22 | ) |
| | 2016 - R6 (Commenced July 31, 2015) | | | 10.52 | | | | 0.16 | | | | 0.08 | | | | 0.24 | | | | (0.19 | ) |
| | 2015 - A | | | 10.38 | | | | 0.20 | | | | 0.29 | | | | 0.49 | | | | (0.23 | ) |
| | 2015 - C | | | 10.43 | | | | 0.12 | | | | 0.29 | | | | 0.41 | | | | (0.15 | ) |
| | 2015 - Institutional | | | 10.42 | | | | 0.23 | | | | 0.30 | | | | 0.53 | | | | (0.27 | ) |
| | 2015 - Service | | | 10.43 | | | | 0.18 | | | | 0.30 | | | | 0.48 | | | | (0.22 | ) |
| | 2015 - IR | | | 10.39 | | | | 0.22 | | | | 0.30 | | | | 0.52 | | | | (0.26 | ) |
| | 2015 - R | | | 10.39 | | | | 0.17 | | | | 0.30 | | | | 0.47 | | | | (0.21 | ) |
| | 2014 - A | | | 10.61 | | | | 0.19 | | | | (0.18 | ) | | | 0.01 | | | | (0.24 | ) |
| | 2014 - C | | | 10.67 | | | | 0.11 | | | | (0.19 | ) | | | (0.08 | ) | | | (0.16 | ) |
| | 2014 - Institutional | | | 10.65 | | | | 0.22 | | | | (0.17 | ) | | | 0.05 | | | | (0.28 | ) |
| | 2014 - Service | | | 10.66 | | | | 0.15 | | | | (0.16 | ) | | | (0.01 | ) | | | (0.22 | ) |
| | 2014 - IR | | | 10.62 | | | | 0.21 | | | | (0.17 | ) | | | 0.04 | | | | (0.27 | ) |
| | 2014 - R | | | 10.62 | | | | 0.16 | | | | (0.18 | ) | | | (0.02 | ) | | | (0.21 | ) |
| | 2013 - A | | | 10.31 | | | | 0.16 | | | | 0.36 | | | | 0.52 | | | | (0.22 | ) |
| | 2013 - C | | | 10.37 | | | | 0.08 | | | | 0.36 | | | | 0.44 | | | | (0.14 | ) |
| | 2013 - Institutional | | | 10.36 | | | | 0.20 | | | | 0.35 | | | | 0.55 | | | | (0.26 | ) |
| | 2013 - Service | | | 10.36 | | | | 0.14 | | | | 0.37 | | | | 0.51 | | | | (0.21 | ) |
| | 2013 - IR | | | 10.32 | | | | 0.19 | | | | 0.36 | | | | 0.55 | | | | (0.25 | ) |
| | 2013 - R | | | 10.33 | | | | 0.13 | | | | 0.36 | | | | 0.49 | | | | (0.20 | ) |
| | 2012 - A | | | 9.79 | | | | 0.19 | | | | 0.53 | | | | 0.72 | | | | (0.20 | ) |
| | 2012 - C | | | 9.84 | | | | 0.12 | | | | 0.53 | | | | 0.65 | | | | (0.12 | ) |
| | 2012 - Institutional | | | 9.83 | | | | 0.23 | | | | 0.53 | | | | 0.76 | | | | (0.23 | ) |
| | 2012 - Service | | | 9.84 | | | | 0.17 | | | | 0.53 | | | | 0.70 | | | | (0.18 | ) |
| | 2012 - IR | | | 9.79 | | | | 0.22 | | | | 0.53 | | | | 0.75 | | | | (0.22 | ) |
| | 2012 - R | | | 9.80 | | | | 0.17 | | | | 0.53 | | | | 0.70 | | | | (0.17 | ) |
| | (a) | | Calculated based on the average shares outstanding methodology. |
| | (b) | | Assumes investment at the net asset value at the beginning of the year, reinvestment of all dividends and distributions, a complete redemption of the investment at the net asset value at the end of the year and no sales or redemption charges. Total returns would be reduced if a sales or redemption charge was taken into account. Returns do not reflect the deduction of taxes that a shareholder would pay on Fund distributions or the redemption of Fund shares. Total returns for periods less than one full year are not annualized. |
| | (c) | | The Fund’s portfolio turnover rate is calculated in accordance with regulatory requirements, without regard to transactions involving short term investments and certain derivatives. If such transactions were included, the Fund’s portfolio turnover rate may be higher. |
| | |
| 120 | | The accompanying notes are an integral part of these financial statements. |
GOLDMAN SACHS CORE FIXED INCOME FUND
| | | | | | | | | | | | | | | | | | | | | | | | | | | | | | | | | | | | | | | | |
| | | | | | | | | | | | | | | | | | | | | | | | | | | | | | | | | | |
| | | Net asset
value, end
of year | | | | | Total
return(b) | | | | | Net assets,
end of
year
(in 000s) | | | | | Ratio of
net expenses
to average
net assets | | | | | Ratio of
total expenses
to average
net assets | | | | | Ratio of
net investment
income
to average
net assets | | | | | Portfolio
turnover
rate(c) | |
| | | | | | | | | | | | | | | | | | | | | | | | | | | | | | | | | | | | | | | | |
| | $ | 10.53 | | | | | | 1.35 | % | | | | $ | 142,299 | | | | | | 0.78 | % | | | | | 0.85 | % | | | | | 1.98 | % | | | | | 450 | % |
| | | 10.59 | | | | | | 0.69 | | | | | | 18,124 | | | | | | 1.53 | | | | | | 1.60 | | | | | | 1.23 | | | | | | 450 | |
| | | 10.57 | | | | | | 1.69 | | | | | | 697,260 | | | | | | 0.44 | | | | | | 0.51 | | | | | | 2.31 | | | | | | 450 | |
| | | 10.58 | | | | | | 1.19 | | | | | | 1,578 | | | | | | 0.94 | | | | | | 1.01 | | | | | | 1.82 | | | | | | 450 | |
| | | 10.54 | | | | | | 1.60 | | | | | | 5,058 | | | | | | 0.53 | | | | | | 0.60 | | | | | | 2.23 | | | | | | 450 | |
| | | 10.54 | | | | | | 1.09 | | | | | | 9,524 | | | | | | 1.03 | | | | | | 1.11 | | | | | | 1.79 | | | | | | 450 | |
| | | 10.57 | | | | | | 2.34 | | | | | | 57,091 | | | | | | 0.43 | (d) | | | | | 0.49 | (d) | | | | | 2.36 | (d) | | | | | 450 | |
| | | 10.64 | | | | | | 4.77 | | | | | | 150,677 | | | | | | 0.83 | | | | | | 0.85 | | | | | | 1.86 | | | | | | 388 | |
| | | 10.69 | | | | | | 3.98 | | | | | | 19,477 | | | | | | 1.58 | | | | | | 1.60 | | | | | | 1.12 | | | | | | 388 | |
| | | 10.68 | | | | | | 5.11 | | | | | | 758,542 | | | | | | 0.49 | | | | | | 0.51 | | | | | | 2.21 | | | | | | 388 | |
| | | 10.69 | | | | | | 4.59 | | | | | | 1,882 | | | | | | 0.99 | | | | | | 1.01 | | | | | | 1.71 | | | | | | 388 | |
| | | 10.65 | | | | | | 5.03 | | | | | | 5,054 | | | | | | 0.56 | | | | | | 0.60 | | | | | | 2.10 | | | | | | 388 | |
| | | 10.65 | | | | | | 4.51 | | | | | | 1,126 | | | | | | 1.07 | | | | | | 1.10 | | | | | | 1.60 | | | | | | 388 | |
| | | 10.38 | | | | | | 0.12 | | | | | | 134,288 | | | | | | 0.83 | | | | | | 0.83 | | | | | | 1.80 | | | | | | 516 | |
| | | 10.43 | | | | | | (0.71 | ) | | | | | 20,262 | | | | | | 1.58 | | | | | | 1.58 | | | | | | 1.05 | | | | | | 516 | |
| | | 10.42 | | | | | | 0.47 | | | | | | 895,504 | | | | | | 0.49 | | | | | | 0.49 | | | | | | 2.13 | | | | | | 516 | |
| | | 10.43 | | | | | | (0.03 | ) | | | | | 1,837 | | | | | | 0.98 | | | | | | 0.98 | | | | | | 1.40 | | | | | | 516 | |
| | | 10.39 | | | | | | 0.37 | | | | | | 1,374 | | | | | | 0.58 | | | | | | 0.58 | | | | | | 2.03 | | | | | | 516 | |
| | | 10.39 | | | | | | (0.13 | ) | | | | | 557 | | | | | | 1.08 | | | | | | 1.08 | | | | | | 1.54 | | | | | | 516 | |
| | | 10.61 | | | | | | 5.08 | | | | | | 159,470 | | | | | | 0.81 | | | | | | 0.81 | | | | | | 1.54 | | | | | | 782 | |
| | | 10.67 | | | | | | 4.28 | | | | | | 25,723 | | | | | | 1.56 | | | | | | 1.56 | | | | | | 0.79 | | | | | | 782 | |
| | | 10.65 | | | | | | 5.32 | | | | | | 1,198,584 | | | | | | 0.47 | | | | | | 0.47 | | | | | | 1.88 | | | | | | 782 | |
| | | 10.66 | | | | | | 4.90 | | | | | | 17,528 | | | | | | 0.97 | | | | | | 0.97 | | | | | | 1.35 | | | | | | 782 | |
| | | 10.62 | | | | | | 5.34 | | | | | | 1,622 | | | | | | 0.56 | | | | | | 0.56 | | | | | | 1.78 | | | | | | 782 | |
| | | 10.62 | | | | | | 4.72 | | | | | | 648 | | | | | | 1.06 | | | | | | 1.06 | | | | | | 1.24 | | | | | | 782 | |
| | | 10.31 | | | | | | 7.37 | | | | | | 204,327 | | | | | | 0.81 | | | | | | 0.81 | | | | | | 1.90 | | | | | | 687 | |
| | | 10.37 | | | | | | 6.65 | | | | | | 28,539 | | | | | | 1.56 | | | | | | 1.56 | | | | | | 1.13 | | | | | | 687 | |
| | | 10.36 | | | | | | 7.81 | | | | | | 1,363,229 | | | | | | 0.47 | | | | | | 0.47 | | | | | | 2.23 | | | | | | 687 | |
| | | 10.36 | | | | | | 7.17 | | | | | | 10,969 | | | | | | 0.97 | | | | | | 0.97 | | | | | | 1.70 | | | | | | 687 | |
| | | 10.32 | | | | | | 7.74 | | | | | | 1,081 | | | | | | 0.56 | | | | | | 0.56 | | | | | | 2.14 | | | | | | 687 | |
| | | 10.33 | | | | | | 7.21 | | | | | | 19 | | | | | | 1.06 | | | | | | 1.06 | | | | | | 1.64 | | | | | | 687 | |
| | |
| The accompanying notes are an integral part of these financial statements. | | 121 |
GOLDMAN SACHS GLOBAL INCOME FUND
Financial Highlights
Selected Data for a Share Outstanding Throughout Each Year
| | | | | | | | | | | | | | | | | | | | | | | | | | | | | | |
| | | | | | Income (loss) from
investment operations | | | Distributions
to shareholders | |
| | | Year - Share Class | |
Net asset
value,
beginning
of year | | | Net
investment
income(a) | | | Net realized
and unrealized
gain | | | Total from
investment
operations | | | From net
investment
income | | | From net
realized
gains | | | Total
distributions | |
| | FOR THE FISCAL YEARS ENDED MARCH 31, | |
| | 2016 - A | | $ | 12.76 | | | $ | 0.13 | | | $ | 0.07 | | | $ | 0.20 | | | $ | (0.71 | ) | | $ | (0.01 | ) | | $ | (0.72 | ) |
| | 2016 - C | | | 12.67 | | | | 0.04 | | | | 0.05 | | | | 0.09 | | | | (0.61 | ) | | | (0.01 | ) | | | (0.62 | ) |
| | 2016 - Institutional | | | 12.74 | | | | 0.17 | | | | 0.07 | | | | 0.24 | | | | (0.75 | ) | | | (0.01 | ) | | | (0.76 | ) |
| | 2016 - Service | | | 12.71 | | | | 0.09 | | | | 0.05 | | | | 0.14 | | | | (0.68 | ) | | | (0.01 | ) | | | (0.69 | ) |
| | 2016 - IR | | | 12.72 | | | | 0.16 | | | | 0.07 | | | | 0.23 | | | | (0.74 | ) | | | (0.01 | ) | | | (0.75 | ) |
| | 2016 - R6 (Commenced July 31, 2015) | | | 12.55 | | | | 0.09 | | | | 0.26 | | | | 0.35 | | | | (0.67 | ) | | | (0.01 | ) | | | (0.68 | ) |
| | 2015 - A | | | 12.70 | | | | 0.16 | | | | 0.50 | | | | 0.66 | | | | (0.31 | ) | | | (0.29 | ) | | | (0.60 | ) |
| | 2015 - C | | | 12.61 | | | | 0.06 | | | | 0.51 | | | | 0.57 | | | | (0.22 | ) | | | (0.29 | ) | | | (0.51 | ) |
| | 2015 - Institutional | | | 12.68 | | | | 0.20 | | | | 0.50 | | | | 0.70 | | | | (0.35 | ) | | | (0.29 | ) | | | (0.64 | ) |
| | 2015 - Service | | | 12.66 | | | | 0.14 | | | | 0.49 | | | | 0.63 | | | | (0.29 | ) | | | (0.29 | ) | | | (0.58 | ) |
| | 2015 - IR | | | 12.66 | | | | 0.15 | | | | 0.54 | | | | 0.69 | | | | (0.34 | ) | | | (0.29 | ) | | | (0.63 | ) |
| | 2014 - A | | | 13.20 | | | | 0.24 | | | | 0.03 | | | | 0.27 | | | | (0.58 | ) | | | (0.19 | ) | | | (0.77 | ) |
| | 2014 - C | | | 13.11 | | | | 0.14 | | | | 0.03 | | | | 0.17 | | | | (0.48 | ) | | | (0.19 | ) | | | (0.67 | ) |
| | 2014 - Institutional | | | 13.18 | | | | 0.28 | | | | 0.03 | | | | 0.31 | | | | (0.62 | ) | | | (0.19 | ) | | | (0.81 | ) |
| | 2014 - Service | | | 13.16 | | | | 0.22 | | | | 0.03 | | | | 0.25 | | | | (0.56 | ) | | | (0.19 | ) | | | (0.75 | ) |
| | 2014 - IR | | | 13.17 | | | | 0.27 | | | | 0.02 | | | | 0.29 | | | | (0.61 | ) | | | (0.19 | ) | | | (0.80 | ) |
| | 2013 - A | | | 13.17 | | | | 0.22 | | | | 0.60 | | | | 0.82 | | | | (0.34 | ) | | | (0.45 | ) | | | (0.79 | ) |
| | 2013 - C | | | 13.09 | | | | 0.12 | | | | 0.59 | | | | 0.71 | | | | (0.24 | ) | | | (0.45 | ) | | | (0.69 | ) |
| | 2013 - Institutional | | | 13.15 | | | | 0.27 | | | | 0.60 | | | | 0.87 | | | | (0.39 | ) | | | (0.45 | ) | | | (0.84 | ) |
| | 2013 - Service | | | 13.13 | | | | 0.20 | | | | 0.60 | | | | 0.80 | | | | (0.32 | ) | | | (0.45 | ) | | | (0.77 | ) |
| | 2013 - IR | | | 13.15 | | | | 0.26 | | | | 0.59 | | | | 0.85 | | | | (0.38 | ) | | | (0.45 | ) | | | (0.83 | ) |
| | 2012 - A | | | 12.63 | | | | 0.23 | | | | 0.54 | | | | 0.77 | | | | (0.23 | ) | | | — | | | | (0.23 | ) |
| | 2012 - C | | | 12.55 | | | | 0.14 | | | | 0.54 | | | | 0.68 | | | | (0.14 | ) | | | — | | | | (0.14 | ) |
| | 2012 - Institutional | | | 12.61 | | | | 0.27 | | | | 0.55 | | | | 0.82 | | | | (0.28 | ) | | | — | | | | (0.28 | ) |
| | 2012 - Service | | | 12.59 | | | | 0.21 | | | | 0.54 | | | | 0.75 | | | | (0.21 | ) | | | — | | | | (0.21 | ) |
| | 2012 - IR | | | 12.61 | | | | 0.24 | | | | 0.57 | | | | 0.81 | | | | (0.27 | ) | | | — | | | | (0.27 | ) |
| | (a) | | Calculated based on the average shares outstanding methodology. |
| | (b) | | Assumes investment at the NAV at the beginning of the period, reinvestment of all dividends and distributions, a complete redemption of the investment at the NAV at the end of the period and no sales or redemption charges. Total returns would be reduced if a sales or redemption charge was taken into account. Returns do not reflect the deduction of taxes that a shareholder would pay on Fund distributions or the redemption of Fund shares. Total returns for periods less than one full year are not annualized. |
| | (c) | | The Fund’s portfolio turnover rate is calculated in accordance with regulatory requirements, without regard to transactions involving short term investments and certain derivatives. If such transactions were included, the Fund’s portfolio turnover rate may be higher. |
| | |
| 122 | | The accompanying notes are an integral part of these financial statements. |
GOLDMAN SACHS GLOBAL INCOME FUND
| | | | | | | | | | | | | | | | | | | | | | | | | | | | | | | | | | | | | | | | |
| | | | | | | | | | | | | | | | | | | | | | | | | | | | | | | | | | |
| | | Net asset
value, end
of year | | | | | Total
return(b) | | | | | Net assets,
end of
year
(in 000s) | | | | | Ratio of
net expenses
to average
net assets | | | | | Ratio of
total expenses
to average
net assets | | | | | Ratio of
net investment
income
to average
net assets | | | | | Portfolio
turnover
rate(c) | |
| | | | | | | | | | | | | | | | | | | | | | | | | | | | | | | | | | | | | | | | |
| | $ | 12.24 | | | | | | 1.67 | % | | | | $ | 111,852 | | | | | | 1.03 | % | | | | | 1.15 | % | | | | | 1.06 | % | | | | | 261 | % |
| | | 12.14 | | | | | | 0.83 | | | | | | 12,653 | | | | | | 1.77 | | | | | | 1.90 | | | | | | 0.31 | | | | | | 261 | |
| | | 12.22 | | | | | | 2.00 | | | | | | 639,915 | | | | | | 0.69 | | | | | | 0.81 | | | | | | 1.41 | | | | | | 261 | |
| | | 12.16 | | | | | | 1.23 | | | | | | 2,280 | | | | | | 1.18 | | | | | | 1.29 | | | | | | 0.75 | | | | | | 261 | |
| | | 12.20 | | | | | | 1.95 | | | | | | 31,548 | | | | | | 0.78 | | | | | | 0.90 | | | | | | 1.26 | | | | | | 261 | |
| | | 12.22 | | | | | | 2.92 | | | | | | 520 | | | | | | 0.68 | (d) | | | | | 0.79 | (d) | | | | | 1.10 | (d) | | | | | 261 | |
| | | 12.76 | | | | | | 5.27 | | | | | | 64,939 | | | | | | 1.03 | | | | | | 1.18 | | | | | | 1.26 | | | | | | 226 | |
| | | 12.67 | | | | | | 4.53 | | | | | | 6,592 | | | | | | 1.77 | | | | | | 1.93 | | | | | | 0.50 | | | | | | 226 | |
| | | 12.74 | | | | | | 5.63 | | | | | | 437,007 | | | | | | 0.70 | | | | | | 0.84 | | | | | | 1.60 | | | | | | 226 | |
| | | 12.71 | | | | | | 5.03 | | | | | | 358 | | | | | | 1.20 | | | | | | 1.34 | | | | | | 1.12 | | | | | | 226 | |
| | | 12.72 | | | | | | 5.54 | | | | | | 10,261 | | | | | | 0.77 | | | | | | 0.90 | | | | | | 1.20 | | | | | | 226 | |
| | | 12.70 | | | | | | 2.16 | | | | | | 61,198 | | | | | | 1.04 | | | | | | 1.20 | | | | | | 1.83 | | | | | | 288 | |
| | | 12.61 | | | | | | 1.40 | | | | | | 4,688 | | | | | | 1.79 | | | | | | 1.95 | | | | | | 1.08 | | | | | | 288 | |
| | | 12.68 | | | | | | 2.51 | | | | | | 426,746 | | | | | | 0.70 | | | | | | 0.86 | | | | | | 2.19 | | | | | | 288 | |
| | | 12.66 | | | | | | 1.98 | | | | | | 239 | | | | | | 1.20 | | | | | | 1.35 | | | | | | 1.70 | | | | | | 288 | |
| | | 12.66 | | | | | | 2.34 | | | | | | 757 | | | | | | 0.79 | | | | | | 0.95 | | | | | | 2.09 | | | | | | 288 | |
| | | 13.20 | | | | | | 6.32 | | | | | | 79,838 | | | | | | 1.04 | | | | | | 1.15 | | | | | | 1.64 | | | | | | 444 | |
| | | 13.11 | | | | | | 5.57 | | | | | | 5,757 | | | | | | 1.79 | | | | | | 1.90 | | | | | | 0.92 | | | | | | 444 | |
| | | 13.18 | | | | | | 6.69 | | | | | | 387,889 | | | | | | 0.69 | | | | | | 0.81 | | | | | | 1.99 | | | | | | 444 | |
| | | 13.16 | | | | | | 6.16 | | | | | | 145 | | | | | | 1.19 | | | | | | 1.31 | | | | | | 1.49 | | | | | | 444 | |
| | | 13.17 | | | | | | 6.51 | | | | | | 545 | | | | | | 0.79 | | | | | | 0.90 | | | | | | 1.94 | | | | | | 444 | |
| | | 13.17 | | | | | | 6.16 | | | | | | 198,463 | | | | | | 1.03 | | | | | | 1.14 | | | | | | 1.78 | | | | | | 333 | |
| | | 13.09 | | | | | | 5.32 | | | | | | 6,359 | | | | | | 1.78 | | | | | | 1.89 | | | | | | 1.06 | | | | | | 333 | |
| | | 13.15 | | | | | | 6.53 | | | | | | 574,373 | | | | | | 0.69 | | | | | | 0.80 | | | | | | 2.10 | | | | | | 333 | |
| | | 13.13 | | | | | | 6.01 | | | | | | 189 | | | | | | 1.19 | | | | | | 1.30 | | | | | | 1.61 | | | | | | 333 | |
| | | 13.15 | | | | | | 6.43 | | | | | | 402 | | | | | | 0.78 | | | | | | 0.89 | | | | | | 1.87 | | | | | | 333 | |
| | |
| The accompanying notes are an integral part of these financial statements. | | 123 |
GOLDMAN SACHS STRATEGIC INCOME FUND
Financial Highlights
Selected Data for a Share Outstanding Throughout Each Year
| | | | | | | | | | | | | | | | | | | | | | | | | | | | | | |
| | | | | | | | Income (loss) from
investment operations | | | Distributions
to shareholders | |
| | | Year - Share Class | |
Net asset
value,
beginning
of year | | | Net
investment
income(a) | | | Net realized
and unrealized
gain (loss) | | | Total from
investment
operations | | | From net
investment
income | | | From
capital | | | Total
distributions | |
| | FOR THE FISCAL YEARS ENDED MARCH 31, | |
| | 2016 - A | | $ | 10.06 | | | $ | 0.28 | | | $ | (0.52 | ) | | $ | (0.24 | ) | | $ | (0.41 | ) | | $ | — | | | $ | (0.41 | ) |
| | 2016 - C | | | 10.06 | | | | 0.21 | | | | (0.52 | ) | | | (0.31 | ) | | | (0.34 | ) | | | — | | | | (0.34 | ) |
| | 2016 - Institutional | | | 10.06 | | | | 0.31 | | | | (0.52 | ) | | | (0.21 | ) | | | (0.44 | ) | | | — | | | | (0.44 | ) |
| | 2016 - IR | | | 10.06 | | | | 0.31 | | | | (0.53 | ) | | | (0.22 | ) | | | (0.43 | ) | | | — | | | | (0.43 | ) |
| | 2016 - R | | | 10.05 | | | | 0.25 | | | | (0.52 | ) | | | (0.27 | ) | | | (0.38 | ) | | | — | | | | (0.38 | ) |
| | 2016 - R6 (Commenced July 31, 2015) | | | 10.04 | | | | 0.20 | | | | (0.50 | ) | | | (0.30 | ) | | | (0.33 | ) | | | — | | | | (0.33 | ) |
| | 2015 - A | | | 10.64 | | | | 0.22 | | | | (0.51 | ) | | | (0.29 | ) | | | (0.29 | ) | | | — | (e) | | | (0.29 | ) |
| | 2015 - C | | | 10.64 | | | | 0.14 | | | | (0.51 | ) | | | (0.37 | ) | | | (0.21 | ) | | | — | (e) | | | (0.21 | ) |
| | 2015 - Institutional | | | 10.64 | | | | 0.25 | | | | (0.50 | ) | | | (0.25 | ) | | | (0.33 | ) | | | — | (e) | | | (0.33 | ) |
| | 2015 - IR | | | 10.63 | | | | 0.24 | | | | (0.49 | ) | | | (0.25 | ) | | | (0.32 | ) | | | — | (e) | | | (0.32 | ) |
| | 2015 - R | | | 10.63 | | | | 0.19 | | | | (0.51 | ) | | | (0.32 | ) | | | (0.26 | ) | | | — | (e) | | | (0.26 | ) |
| | 2014 - A | | | 10.46 | | | | 0.22 | | | | 0.21 | | | | 0.43 | | | | (0.25 | ) | | | — | | | | (0.25 | ) |
| | 2014 - C | | | 10.46 | | | | 0.14 | | | | 0.21 | | | | 0.35 | | | | (0.17 | ) | | | — | | | | (0.17 | ) |
| | 2014 - Institutional | | | 10.46 | | | | 0.26 | | | | 0.21 | | | | 0.47 | | | | (0.29 | ) | | | — | | | | (0.29 | ) |
| | 2014 - IR | | | 10.46 | | | | 0.25 | | | | 0.20 | | | | 0.45 | | | | (0.28 | ) | | | — | | | | (0.28 | ) |
| | 2014 - R | | | 10.45 | | | | 0.21 | | | | 0.19 | | | | 0.40 | | | | (0.22 | ) | | | — | | | | (0.22 | ) |
| | 2013 - A | | | 9.87 | | | | 0.32 | | | | 0.73 | | | | 1.05 | | | | (0.46 | ) | | | — | | | | (0.46 | ) |
| | 2013 - C | | | 9.88 | | | | 0.24 | | | | 0.72 | | | | 0.96 | | | | (0.38 | ) | | | — | | | | (0.38 | ) |
| | 2013 - Institutional | | | 9.87 | | | | 0.35 | | | | 0.73 | | | | 1.08 | | | | (0.49 | ) | | | — | | | | (0.49 | ) |
| | 2013 - IR | | | 9.87 | | | | 0.34 | | | | 0.73 | | | | 1.07 | | | | (0.48 | ) | | | — | | | | (0.48 | ) |
| | 2013 - R | | | 9.87 | | | | 0.30 | | | | 0.71 | | | | 1.01 | | | | (0.43 | ) | | | — | | | | (0.43 | ) |
| | 2012 - A | | | 10.03 | | | | 0.32 | | | | (0.16 | ) | | | 0.16 | | | | (0.32 | ) | | | — | | | | (0.32 | ) |
| | 2012 - C | | | 10.04 | | | | 0.24 | | | | (0.15 | ) | | | 0.09 | | | | (0.25 | ) | | | — | | | | (0.25 | ) |
| | 2012 - Institutional | | | 10.03 | | | | 0.35 | | | | (0.15 | ) | | | 0.20 | | | | (0.36 | ) | | | — | | | | (0.36 | ) |
| | 2012 - IR | | | 10.03 | | | | 0.34 | | | | (0.15 | ) | | | 0.19 | | | | (0.35 | ) | | | — | | | | (0.35 | ) |
| | 2012 - R | | | 10.03 | | | | 0.29 | | | | (0.15 | ) | | | 0.14 | | | | (0.30 | ) | | | — | | | | (0.30 | ) |
| | (a) | | Calculated based on the average shares outstanding methodology. |
| | (b) | | Assumes investment at the NAV at the beginning of the period, reinvestment of all dividends and distributions, a complete redemption of the investment at the NAV at the end of the period and no sales or redemption charges. Total returns would be reduced if a sales or redemption charge was taken into account. Returns do not reflect the deduction of taxes that a shareholder would pay on Fund distributions or the redemption of Fund shares. Total returns for periods less than one full year are not annualized. |
| | (c) | | The Fund’s portfolio turnover rate is calculated in accordance with regulatory requirements, without regard to transactions involving short term investments and certain derivatives. If such transactions were included, the Fund’s portfolio turnover rate may be higher. |
| | (e) | | Rounds to less than $0.01 per share. |
| | |
| 124 | | The accompanying notes are an integral part of these financial statements. |
GOLDMAN SACHS STRATEGIC INCOME FUND
| | | | | | | | | | | | | | | | | | | | | | | | | | | | | | | | | | | | | | | | |
| | | | | | | | | | | | | | | | | | | | | | | | | | | | | | | | | | |
| | | Net asset
value, end
of year | | | | | Total
return(b) | | | | | Net assets,
end of
year
(in 000s) | | | | | Ratio of
net expenses
to average
net assets | | | | | Ratio of
total expenses
to average
net assets | | | | | Ratio of
net investment
income
to average
net assets | | | | | Portfolio
turnover
rate(c) | |
| | | | | | | | | | | | | | | | | | | | | | | | | | | | | | | | | | | | | | | | |
| | $ | 9.41 | | | | | | (2.49 | )% | | | | $ | 1,383,885 | | | | | | 0.90 | % | | | | | 0.91 | % | | | | | 2.83 | % | | | | | 212 | % |
| | | 9.41 | | | | | | (3.21 | ) | | | | | 710,230 | | | | | | 1.65 | | | | | | 1.66 | | | | | | 2.08 | | | | | | 212 | |
| | | 9.41 | | | | | | (2.16 | ) | | | | | 11,261,977 | | | | | | 0.56 | | | | | | 0.57 | | | | | | 3.17 | | | | | | 212 | |
| | | 9.41 | | | | | | (2.24 | ) | | | | | 332,917 | | | | | | 0.65 | | | | | | 0.66 | | | | | | 3.09 | | | | | | 212 | |
| | | 9.40 | | | | | | (2.73 | ) | | | | | 9,399 | | | | | | 1.15 | | | | | | 1.16 | | | | | | 2.58 | | | | | | 212 | |
| | | 9.41 | | | | | | (3.05 | ) | | | | | 19,708 | | | | | | 0.53 | (d) | | | | | 0.55 | (d) | | | | | 3.19 | (d) | | | | | 212 | |
| | | 10.06 | | | | | | (2.78 | ) | | | | | 2,648,848 | | | | | | 0.91 | | | | | | 0.91 | | | | | | 2.10 | | | | | | 188 | |
| | | 10.06 | | | | | | (3.51 | ) | | | | | 1,096,577 | | | | | | 1.66 | | | | | | 1.66 | | | | | | 1.34 | | | | | | 188 | |
| | | 10.06 | | | | | | (2.45 | ) | | | | | 18,685,774 | | | | | | 0.57 | | | | | | 0.57 | | | | | | 2.43 | | | | | | 188 | |
| | | 10.06 | | | | | | (2.44 | ) | | | | | 684,204 | | | | | | 0.66 | | | | | | 0.66 | | | | | | 2.34 | | | | | | 188 | |
| | | 10.05 | | | | | | (3.03 | ) | | | | | 9,418 | | | | | | 1.16 | | | | | | 1.16 | | | | | | 1.85 | | | | | | 188 | |
| | | 10.64 | | | | | | 4.16 | | | | | | 3,694,217 | | | | | | 0.91 | | | | | | 0.91 | | | | | | 2.08 | | | | | | 302 | |
| | | 10.64 | | | | | | 3.37 | | | | | | 1,017,213 | | | | | | 1.66 | | | | | | 1.66 | | | | | | 1.31 | | | | | | 302 | |
| | | 10.64 | | | | | | 4.51 | | | | | | 15,469,529 | | | | | | 0.57 | | | | | | 0.57 | | | | | | 2.44 | | | | | | 302 | |
| | | 10.63 | | | | | | 4.32 | | | | | | 71,823 | | | | | | 0.66 | | | | | | 0.66 | | | | | | 2.32 | | | | | | 302 | |
| | | 10.63 | | | | | | 3.90 | | | | | | 5,454 | | | | | | 1.16 | | | | | | 1.16 | | | | | | 1.96 | | | | | | 302 | |
| | | 10.46 | | | | | | 10.80 | | | | | | 709,730 | | | | | | 0.99 | | | | | | 0.99 | | | | | | 3.17 | | | | | | 727 | |
| | | 10.46 | | | | | | 9.86 | | | | | | 239,501 | | | | | | 1.74 | | | | | | 1.74 | | | | | | 2.36 | | | | | | 727 | |
| | | 10.46 | | | | | | 11.18 | | | | | | 2,428,689 | | | | | | 0.65 | | | | | | 0.65 | | | | | | 3.42 | | | | | | 727 | |
| | | 10.46 | | | | | | 11.07 | | | | | | 107,502 | | | | | | 0.74 | | | | | | 0.74 | | | | | | 3.33 | | | | | | 727 | |
| | | 10.45 | | | | | | 10.45 | | | | | | 12 | | | | | | 1.23 | | | | | | 1.23 | | | | | | 2.98 | | | | | | 727 | |
| | | 9.87 | | | | | | 1.60 | | | | | | 728,059 | | | | | | 1.00 | | | | | | 1.00 | | | | | | 3.23 | | | | | | 636 | |
| | | 9.88 | | | | | | 0.94 | | | | | | 148,590 | | | | | | 1.75 | | | | | | 1.75 | | | | | | 2.51 | | | | | | 636 | |
| | | 9.87 | | | | | | 2.04 | | | | | | 993,936 | | | | | | 0.66 | | | | | | 0.66 | | | | | | 3.59 | | | | | | 636 | |
| | | 9.87 | | | | | | 1.95 | | | | | | 50,350 | | | | | | 0.75 | | | | | | 0.75 | | | | | | 3.54 | | | | | | 636 | |
| | | 9.87 | | | | | | 1.46 | | | | | | 29 | | | | | | 1.25 | | | | | | 1.25 | | | | | | 3.00 | | | | | | 636 | |
| | |
| The accompanying notes are an integral part of these financial statements. | | 125 |
GOLDMAN SACHS MULTI SECTOR FIXED INCOME FUNDS
Notes to Financial Statements
March 31, 2016
Goldman Sachs Trust (the “Trust”) is a Delaware statutory trust registered under the Investment Company Act of 1940, as amended (the “Act”), as an open-end management investment company. The following table lists those series of the Trust that are included in this report (collectively, the “Funds” or individually a “Fund”), along with their corresponding share classes and respective diversification status under the Act:
| | | | |
| Fund | | Share Classes Offered* | | Diversified/ Non-diversified |
Bond and Core Fixed Income | | A, C, Institutional, Service, IR, R and R6 | | Diversified |
Global Income | | A, C, Institutional, Service, IR and R6 | | Non-diversified |
Strategic Income | | A, C, Institutional, IR, R and R6 | | Diversified |
| * | | Class R6 commenced operations July 31, 2015. |
Class A Shares are sold with a front-end sales charge of up to 3.75%. Class C Shares are sold with a contingent deferred sales charge (“CDSC”) of 1.00%, which is imposed on redemptions made within 12 months of purchase. Institutional, Service, Class IR, Class R, and Class R6 Shares are not subject to a sales charge.
Goldman Sachs Asset Management, L.P. (“GSAM”), an affiliate of Goldman, Sachs & Co. (“Goldman Sachs”), serves as investment adviser to each of the Bond, Core Fixed Income and Strategic Income Funds pursuant to management agreements with the Trust. Goldman Sachs Asset Management International (“GSAMI”), an affiliate of GSAM and Goldman Sachs, serves as investment adviser pursuant to a management agreement with the Trust on behalf of the Global Income Fund (the management agreements with GSAM and GSAMI are collectively referred to herein as the “Agreements”).
|
| 2. SIGNIFICANT ACCOUNTING POLICIES |
The financial statements have been prepared in accordance with accounting principles generally accepted in the United States of America (“GAAP”) and require management to make estimates and assumptions that may affect the reported amounts and disclosures. Actual results may differ from those estimates and assumptions.
A. Investment Valuation — The Funds’ valuation policy is to value investments at fair value.
B. Investment Income and Investments — Investment income includes interest income and dividend income, net of any foreign withholding taxes, less any amounts reclaimable. Interest income is accrued daily and adjusted for amortization of premiums and accretion of discounts. Dividend income is recognized on ex-dividend date or, for certain foreign securities, as soon as such information is obtained subsequent to the ex-dividend date. Investment transactions are reflected on trade date. Realized gains and losses are calculated using identified cost. Investment transactions are recorded on the following business day for daily net asset value (“NAV”) calculations. Any foreign capital gains tax is accrued daily based upon net unrealized gains, and is payable upon sale of such investments. Distributions received from the Funds’ investments in U.S. real estate investment trusts (“REITs”) may be characterized as ordinary income, net capital gain or a return of capital. A return of capital is recorded by the Funds as a reduction to the cost basis of the REIT.
For derivative contracts, realized gains and losses are recorded upon settlement of the contract. Upfront payments, if any, are made or received upon entering into a swap agreement and are reflected in the Statements of Assets and Liabilities. Upfront payments are recognized over the contract’s term/event as realized gains or losses, with the exception of forward starting interest rate swaps whose realized gains or losses are recognized from the effective start date. For securities with paydown provisions,
126
GOLDMAN SACHS MULTI SECTOR FIXED INCOME FUNDS
|
| 2. SIGNIFICANT ACCOUNTING POLICIES (continued) |
principal payments received are treated as a proportionate reduction to the cost basis of the securities, and excess or shortfall amounts are recorded as income.
For treasury inflation protected securities (“TIPS”), adjustments to principal due to inflation/deflation are reflected as increases/decreases to interest income with a corresponding adjustment to cost.
C. Class Allocations and Expenses — Investment income, realized and unrealized gain (loss), and non-class specific expenses of each Fund are allocated daily based upon the proportion of net assets of each class. Non-class specific expenses directly incurred by a Fund are charged to that Fund, while such expenses incurred by the Trust are allocated across the applicable Funds on a straight-line and/or pro-rata basis depending upon the nature of the expenses. Class specific expenses, where applicable, are borne by the respective share classes and include Distribution and Service, Transfer Agency and Service and Shareholder Administration fees.
D. Federal Taxes and Distributions to Shareholders — It is each Fund’s policy to comply with the requirements of the Internal Revenue Code of 1986, as amended (the “Code”), applicable to regulated investment companies (mutual funds) and to distribute each year substantially all of its investment company taxable income and capital gains to its shareholders. Accordingly, the Funds are not required to make any provisions for the payment of federal income tax. Distributions to shareholders are recorded on the ex-dividend date. Income distributions, if any, are declared daily and paid monthly, and capital gains distributions, if any, are declared and paid annually.
Net capital losses are carried forward to future fiscal years and may be used to the extent allowed by the Code to offset any future capital gains. Utilization of capital loss carryforwards will reduce the requirement of future capital gains distributions.
Under the Regulated Investment Company Modernization Act of 2010, the Funds are permitted to carry forward capital losses incurred in taxable years beginning after December 22, 2010 for an unlimited period. However, any losses incurred during those future taxable years will be required to be utilized prior to the losses incurred in pre-enactment taxable years. As a result of this ordering rule, pre-enactment capital loss carryforwards may be more likely to expire unused. Additionally, post-enactment capital losses that are carried forward will retain their character as either short-term or long-term capital losses rather than being considered all short-term as under previous law.
The characterization of distributions to shareholders for financial reporting purposes is determined in accordance with federal income tax rules, which may differ from GAAP. The source of each Fund’s distributions may be shown in the accompanying financial statements as either from net investment income, net realized gain or capital. Certain components of the Funds’ net assets on the Statements of Assets and Liabilities reflect permanent GAAP/tax differences based on the appropriate tax character.
E. Foreign Currency Translation — The accounting records and reporting currency of the Funds are maintained in U.S. dollars. Assets and liabilities denominated in foreign currencies are translated into U.S. dollars using the current exchange rates at the close of each business day. The effect of changes in foreign currency exchange rates on investments is included within net realized and unrealized gain (loss) on investments. Changes in the value of other assets and liabilities as a result of fluctuations in foreign exchange rates are included in the Statements of Operations within net change in unrealized gain (loss) on foreign currency translations. Transactions denominated in foreign currencies are translated into U.S. dollars on the date the transaction occurred, the effects of which are included within net realized gain (loss) on foreign currency transactions.
|
| 3. INVESTMENTS AND FAIR VALUE MEASUREMENTS |
The fair value of a financial instrument is the amount that would be received to sell an asset or paid to transfer a liability in an orderly transaction between market participants at the measurement date (i.e., the exit price). GAAP establishes a fair value
127
GOLDMAN SACHS MULTI SECTOR FIXED INCOME FUNDS
Notes to Financial Statements (continued)
March 31, 2016
|
| 3. INVESTMENTS AND FAIR VALUE MEASUREMENTS (continued) |
hierarchy that prioritizes the inputs to valuation techniques used to measure fair value. The hierarchy gives the highest priority to unadjusted quoted prices in active markets for identical assets or liabilities (Level 1 measurements) and the lowest priority to unobservable inputs (Level 3 measurements). The levels used for classifying investments are not necessarily an indication of the risk associated with investing in these investments. The three levels of the fair value hierarchy are described below:
Level 1 — Unadjusted quoted prices in active markets that are accessible at the measurement date for identical, unrestricted assets or liabilities;
Level 2 — Quoted prices in markets that are not active or financial instruments for which significant inputs are observable (including, but not limited to, quoted prices for similar investments, interest rates, foreign exchange rates, volatility and credit spreads), either directly or indirectly;
Level 3 — Prices or valuations that require significant unobservable inputs (including GSAM’s and GSAMI’s assumptions in determining fair value measurement).
Changes in valuation techniques may result in transfers into or out of an assigned level within the hierarchy. In accordance with the Funds’ policy, transfers between different levels of the fair value hierarchy resulting from such changes are deemed to have occurred as of the beginning of the reporting period.
The Board of Trustees (“Trustees”) has approved Valuation Procedures that govern the valuation of the portfolio investments held by the Funds, including investments for which market quotations are not readily available. The Trustees have delegated to GSAM and GSAMI day-to-day responsibility for implementing and maintaining internal controls and procedures related to the valuation of the Funds’ portfolio investments. To assess the continuing appropriateness of pricing sources and methodologies, GSAM and GSAMI regularly perform price verification procedures and issue challenges as necessary to third party pricing vendors or brokers, and any differences are reviewed in accordance with the Valuation Procedures.
A. Level 1 and Level 2 Fair Value Investments — The valuation techniques and significant inputs used in determining the fair values for investments classified as Level 1 and Level 2 are as follows:
Debt Securities — Debt securities for which market quotations are readily available are valued daily on the basis of quotations supplied by dealers or an independent pricing service approved by the Trustees. The pricing services may use valuation models or matrix pricing, which consider: (i) yield or price with respect to bonds that are considered comparable in characteristics such as rating, interest rate and maturity date or (ii) quotations from securities dealers to determine current value. Short-term debt obligations that mature in sixty days or less and that do not exhibit signs of credit deterioration are valued at amortized cost, which approximates fair value. With the exception of treasury securities of G8 countries (not held in money market funds), which are generally classified as Level 1, these investments are generally classified as Level 2 of the fair value hierarchy.
i. Bank Loans — Bank loans (“Loans”) are interests in amounts owed by corporate, governmental, or other borrowers to lenders or lending syndicates. Loans are arranged through private negotiations between the borrower and one or more financial institutions (“Lenders”). A Fund’s investments in Loans are in the form of either participations in Loans (“Participations”) or assignments of all or a portion of Loans from third parties (“Assignments”). With respect to Participations, a Fund has the right to receive payments of principal, interest and any fees to which it is entitled from the Lender selling the Participations and only upon receipt by the Lender of the payments from the borrower. A Fund generally has no right to enforce compliance by the borrower with the terms of the loan agreement with respect to Participations. Conversely, Assignments result in a Fund having a direct contractual relationship with the borrower, and the Fund may be permitted to enforce compliance by the borrower with the terms of the loan agreement.
128
GOLDMAN SACHS MULTI SECTOR FIXED INCOME FUNDS
|
| 3. INVESTMENTS AND FAIR VALUE MEASUREMENTS (continued) |
ii. Inverse Floaters — The interest rate on inverse floating rate securities (“inverse floaters”) resets in the opposite direction from the market rate of interest to which the inverse floaters are indexed. An inverse floater may be considered to be leveraged to the extent that its interest rate varies by a magnitude that exceeds the magnitude of the change in the index rate of interest. The higher the degree of leverage of an inverse floater, the greater the volatility of its market value.
iii. Mortgage-Backed and Asset-Backed Securities — Mortgage-backed securities represent direct or indirect participations in, or are collateralized by and payable from, mortgage loans secured by residential and/or commercial real estate property. Asset-backed securities include securities whose principal and interest payments are collateralized by pools of other assets or receivables. The value of certain mortgage-backed and asset-backed securities (including adjustable rate mortgage loans) may be particularly sensitive to changes in prevailing interest rates. The value of these securities may also fluctuate in response to the market’s perception of the creditworthiness of the issuers.
Asset-backed securities may present credit risks that are not presented by mortgage-backed securities because they generally do not have the benefit of a security interest in collateral that is comparable to mortgage assets. Some asset-backed securities may only have a subordinated claim on collateral.
Stripped mortgage-backed securities are usually structured with two different classes: one that receives substantially all interest payments (interest-only, or “IO” and/or high coupon rate with relatively low principal amount, or “IOette”), and the other that receives substantially all principal payments (principal-only, or “PO”) from a pool of mortgage loans. Little to no principal will be received at the maturity of an IO; as a result, periodic adjustments are recorded to reduce the cost of the security until maturity. These adjustments are included in interest income.
iv. Mortgage Dollar Rolls — Mortgage dollar rolls are transactions whereby a Fund sells mortgage-backed-securities and simultaneously contracts with the same counterparty to repurchase similar securities on a specified future date. During the settlement period, a Fund will not be entitled to accrue interest and receive principal payments on the securities sold. The Funds account for mortgage dollar roll transactions as purchases and sales and realize gains and losses on these transactions.
v. Structured Notes — The values of structured notes are based on the price movements of a reference security or index. Upon termination, a Fund will receive a payment from the issuer based on the value of the referenced instrument (notional amount multiplied by price of the referenced instrument) and record a realized gain or loss.
vi. Treasury Inflation Protected Securities — TIPS are treasury securities in which the principal amount is adjusted daily to keep pace with inflation, as measured by the U.S. Consumer Pricing Index for Urban Consumers. The repayment of the original bond principal upon maturity is guaranteed by the full faith and credit of the U.S. Government.
vii. When-Issued Securities and Forward Commitments — When-issued securities, including TBA (“To Be Announced”) securities, are securities that are authorized but not yet issued in the market and purchased in order to secure what is considered to be an advantageous price or yield to a Fund. A forward commitment involves entering into a contract to purchase or sell securities, typically on an extended settlement basis, for a fixed price at a future date. The purchase of securities on a when-issued or forward commitment basis involves a risk of loss if the value of the security to be purchased declines before the settlement date. Conversely, the sale of securities on a forward commitment basis involves the risk that the value of the securities sold may increase before the settlement date. Although a Fund will generally purchase securities on a when-issued or forward commitment basis with the intention of acquiring the securities for its portfolio, the Fund may dispose of when-issued securities or forward commitments prior to settlement which may result in a realized gain or loss.
Equity Securities — Equity securities traded on a United States (“U.S.”) securities exchange or the NASDAQ system, or those located on certain foreign exchanges, including but not limited to the Americas, are valued daily at their last sale price or official
129
GOLDMAN SACHS MULTI SECTOR FIXED INCOME FUNDS
Notes to Financial Statements (continued)
March 31, 2016
|
| 3. INVESTMENTS AND FAIR VALUE MEASUREMENTS (continued) |
closing price on the principal exchange or system on which they are traded. If there is no sale or official closing price or such price is believed by GSAM to not represent fair value, equity securities are valued at the last bid price for long positions and at the last ask price for short positions. To the extent these investments are actively traded, they are classified as Level 1 of the fair value hierarchy, otherwise they are generally classified as Level 2.
Unlisted equity securities for which market quotations are available are valued at the last sale price on the valuation date, or if no sale occurs, at the last bid price. Securities traded on certain foreign securities exchanges are valued daily at fair value determined by an independent fair value service (if available) under Valuation Procedures approved by the Trustees and consistent with applicable regulatory guidance. The independent fair value service takes into account multiple factors including, but not limited to, movements in the securities markets, certain depositary receipts, futures contracts and foreign currency exchange rates that have occurred subsequent to the close of the foreign securities exchange. These investments are generally classified as Level 2 of the fair value hierarchy.
Money Market Funds — Investments in the Goldman Sachs Financial Square Government Fund (“Underlying Fund”) are valued at the NAV of the FST Institutional Share class on the day of valuation. These investments are generally classified as Level 1 of the fair value hierarchy. For information regarding an Underlying Fund’s accounting policies and investment holdings, please see the Underlying Fund’s shareholder report.
Derivative Contracts — A derivative is an instrument whose value is derived from underlying assets, indices, reference rates or a combination of these factors. The Funds enter into derivative transactions to hedge against changes in interest rates, securities prices, and/or currency exchange rates, to increase total return, or to gain access to certain markets or attain exposure to other underliers.
Exchange-traded derivatives, including futures and options contracts, are valued at the last sale or settlement price and typically fall within Level 1 of the fair value hierarchy. Over-the-counter (“OTC”) and centrally cleared derivatives are valued using market transactions and other market evidence, including market-based inputs to models, calibration to market-clearing transactions, broker or dealer quotations, or other alternative pricing sources. Where models are used, the selection of a particular model to value OTC and centrally cleared derivatives depends upon the contractual terms of, and specific risks inherent in, the instrument, as well as the availability of pricing information in the market. Valuation models require a variety of inputs, including contractual terms, market prices, yield curves, credit curves, measures of volatility, voluntary and involuntary prepayment rates, loss severity rates and correlations of such inputs. For OTC and centrally cleared derivatives that trade in liquid markets, model inputs can generally be verified and model selection does not involve significant management judgment. OTC and centrally cleared derivatives are classified within Level 2 of the fair value hierarchy when significant inputs are corroborated by market evidence.
i. Forward Contracts — A forward contract is a contract between two parties to buy or sell an asset at a specified price on a future date. A forward contract settlement can occur on a cash or delivery basis. Forward contracts are marked-to-market daily using independent vendor prices, and the change in value, if any, is recorded as an unrealized gain or loss. Cash and certain investments may be used to collateralize forward contracts.
A forward foreign currency contract is a forward contract in which a Fund agrees to receive or deliver a fixed quantity of one currency for another, at a pre-determined price at a future date. All forward foreign currency exchange contracts are marked-to-market daily at the applicable forward rate. Non-deliverable forward foreign currency exchange contracts are settled with the counterparty in cash without the delivery of foreign currency.
A non-deliverable bond forward is a short term forward contract between two parties to buy or sell a bond denominated in a non-deliverable foreign currency at a specified future time and price. Non-deliverable bond forwards are marked-to-market daily using market quotations. Unrealized gains or losses on non-deliverable bond forwards are recorded by a Fund on a daily basis, and realized gains or losses are recorded on the termination date or sale of a contract.
130
GOLDMAN SACHS MULTI SECTOR FIXED INCOME FUNDS
|
| 3. INVESTMENTS AND FAIR VALUE MEASUREMENTS (continued) |
ii. Futures Contracts — Futures contracts are contracts to buy or sell a standardized quantity of a specified commodity or security and are valued based on exchanged settlement prices or independent market quotes. Futures contracts are valued at the last settlement price, or in the absence of a sale, the last bid price for long positions and at the last ask price for short positions, at the end of each day on the board of trade or exchange upon which they are traded. Upon entering into a futures contract, a Fund deposits cash or securities in an account on behalf of the broker in an amount sufficient to meet the initial margin requirement. Subsequent payments are made or received by a Fund equal to the daily change in the contract value and are recorded as variation margin receivable or payable with a corresponding offset to unrealized gains or losses.
iii. Option Contracts — When a Fund writes call or put option contracts, an amount equal to the premium received is recorded as a liability and is subsequently marked-to-market to reflect the current value of the option written. Swaptions are options on interest rate swap contracts.
Upon the purchase of a call option or a put option by a Fund, the premium paid is recorded as an investment and subsequently marked-to-market to reflect the current value of the option. Certain options may be purchased with premiums to be determined on a future date. The premiums for these options are based upon implied volatility parameters at specified terms.
iv. Swap Contracts — Bilateral swap contracts are agreements in which a Fund and a counterparty agree to exchange periodic payments on a specified notional amount or make a net payment upon termination. Bilateral swap transactions are privately negotiated in the OTC market and payments are settled through direct payments between a Fund and the counterparty. By contrast, certain swap transactions are subject to mandatory central clearing. These swaps are executed through a derivatives clearing member (“DCM”), acting in an agency capacity, and submitted to a central counterparty (“CCP”) (“centrally cleared swaps”), in which case all payments are settled with the CCP through the DCM. Swaps are marked-to-market daily using pricing vendor quotations, counterparty or clearinghouse prices or model prices, and the change in value, if any, is recorded as an unrealized gain or loss. Upon entering into a swap contract, a Fund is required to satisfy an initial margin requirement by delivering cash or securities to the counterparty (or in some cases, segregated in a triparty account on behalf of the counterparty), which can be adjusted by any mark-to-market gains or losses pursuant to bilateral or centrally cleared arrangements. For centrally cleared swaps the daily change in valuation, if any, is recorded as a receivable or payable for variation margin.
An interest rate swap is an agreement that obligates two parties to exchange a series of cash flows at specified intervals, based upon or calculated by reference to changes in interest rates on a specified notional principal amount. The payment flows are usually netted against each other, with the difference being paid by one party to the other.
A credit default swap is an agreement that involves one party (the buyer of protection) making a stream of payments to another party (the seller of protection) in exchange for the right to receive protection on a reference security or obligation, including a group of assets or exposure to the performance of an index. A Fund’s investment in credit default swaps may involve greater risks than if the Fund had invested in the referenced obligation directly. Credit events are contract specific but may include bankruptcy, failure to pay, restructuring and obligation acceleration. If a Fund buys protection through a credit default swap and no credit event occurs, its payments are limited to the periodic payments previously made to the counterparty. Upon the occurrence of a specified credit event, a Fund, as a buyer of credit protection, is entitled to receive an amount equal to the notional amount of the swap and deliver to the seller the defaulted reference obligation in a physically settled trade. A Fund may also receive a net settlement amount in the form of cash or securities equal to the notional amount of the swap reduced by the recovery value of the reference obligation in a cash settled trade.
As a seller of protection, a Fund generally receives a payment stream throughout the term of the swap, provided that there is no credit event. In addition, if a Fund sells protection through a credit default swap, a Fund could suffer a loss because
131
GOLDMAN SACHS MULTI SECTOR FIXED INCOME FUNDS
Notes to Financial Statements (continued)
March 31, 2016
|
| 3. INVESTMENTS AND FAIR VALUE MEASUREMENTS (continued) |
the value of the referenced obligation and the premium payments received may be less than the notional amount of the swap paid to the buyer of protection. Upon the occurrence of a specified credit event, a Fund, as a seller of credit protection, may be required to take possession of the defaulted reference obligation and pay the buyer an amount equal to the notional amount of the swap in a physically settled trade. A Fund may also pay a net settlement amount in the form of cash or securities equal to the notional amount of the swap reduced by the recovery value of the reference obligation in a cash settled trade. Recovery values are at times established through the credit event auction process in which market participants are ensured that a transparent price has been set for the defaulted security or obligation. In addition, a Fund is entitled to a return of any assets, which have been pledged as collateral to the counterparty upon settlement.
The maximum potential amount of future payments (undiscounted) that a Fund as seller of protection could be required to make under a credit default swap would be an amount equal to the notional amount of the agreement. These potential amounts would be partially offset by any recovery values of the respective referenced obligations or net amounts received from a settlement of a credit default swap for the same reference security or obligation where a Fund bought credit protection.
A total return swap is an agreement that gives a Fund the right to receive the appreciation in the value of a specified security, index or other instrument in return for a fee paid to the counterparty, which will typically be an agreed upon interest rate. If the underlying asset declines in value over the term of the swap, a Fund may also be required to pay the dollar value of that decline to the counterparty.
Short Term Investments — Short-term investments having a maturity of 60 days or less are generally valued at amortized cost which approximates fair market value. These investments are classified as Level 2 of the fair value hierarchy.
i. Repurchase Agreements — Repurchase agreements involve the purchase of securities subject to the seller’s agreement to repurchase the securities at a mutually agreed upon date and price, under the terms of a Master Repurchase Agreement (“MRA”). During the term of a repurchase agreement, the value of the underlying securities held as collateral on behalf of a Fund, including accrued interest, is required to exceed the value of the repurchase agreement, including accrued interest. The gross value of repurchase agreements is included in the Statements of Assets and Liabilities for financial reporting purposes. The underlying securities for all repurchase agreements are held at the Funds’ custodian or designated sub-custodians under tri-party repurchase agreements.
An MRA governs transactions between a Fund and select counterparties. An MRA contains provisions for, among other things, initiation of the transaction, income payments, events of default and maintenance of securities for both repurchase and reverse repurchase agreements. An MRA also permits offsetting with collateral to create one single net payment in the event of default or similar events, including the bankruptcy or insolvency of a counterparty.
If the seller defaults, a Fund could suffer a loss to the extent that the proceeds from the sale of the underlying securities and other collateral held by the Fund are less than the repurchase price and the Fund’s costs associated with delay and enforcement of the repurchase agreement. In addition, in the event of default or insolvency of the seller, a court could determine that a Fund’s interest in the collateral is not enforceable, resulting in additional losses to the Fund.
Pursuant to exemptive relief granted by the Securities and Exchange Commission (“SEC”) and terms and conditions contained therein, the Funds, together with other funds of the Trust and registered investment companies having management agreements with GSAM or its affiliates, may transfer uninvested cash into joint accounts, the daily aggregate balance of which is invested in one or more repurchase agreements. Under these joint accounts, the Funds maintain pro-rata credit exposure to the underlying repurchase agreements’ counterparties. With the exception of certain transaction fees, the Funds are not subject to any expenses in relation to these investments.
ii. Commercial Paper — Commercial paper normally represents short-term unsecured promissory notes issued in bearer form by banks or bank holding companies, corporations, finance companies and other issuers. Commercial paper consists of
132
GOLDMAN SACHS MULTI SECTOR FIXED INCOME FUNDS
|
| 3. INVESTMENTS AND FAIR VALUE MEASUREMENTS (continued) |
direct U.S. dollar-denominated obligations of domestic or foreign issuers. Asset-backed commercial paper is issued by a special purpose entity that is organized to issue the commercial paper and to purchase trade receivables or other financial assets.
Secured Borrowings — Secured borrowings are valued at their contractual amounts, which approximate fair value, and are generally classified as Level 2 of the fair value hierarchy.
i. Reverse Repurchase Agreements — Reverse repurchase agreements involve the sale of securities held by the Funds subject to the Funds’ agreement to repurchase the securities at a mutually agreed upon date and price (including interest), under the terms of an MRA. The gross value of reverse repurchase agreements is included in the Statements of Assets and Liabilities for financial reporting purposes.
A Fund entering into a reverse repurchase agreement is required to deliver securities as collateral to the counterparty that exceed the value of the reverse repurchase agreement. During the term of a reverse repurchase agreement, the value of the underlying securities pledged as collateral on behalf of a Fund, including accrued interest, is required to exceed the value of the reverse repurchase agreement, including accrued interest. If the value of those securities pledged as collateral, including accrued interest, becomes less than the value of the reverse repurchase agreement, including accrued interest, a Fund will be obligated to deliver additional collateral to the buyer. If the buyer defaults on its commitment to sell back the securities, the Fund could suffer a loss to the extent that the amount borrowed is less than the replacement cost of similar securities and the Fund’s costs associated with delay and enforcement of the reverse repurchase agreement. In addition, in the event of default or insolvency of the buyer, a court could determine that the Fund’s interest in the amount borrowed is not enforceable, resulting in additional losses to the Fund.
B. Level 3 Fair Value Investments — To the extent that significant inputs to valuation models and other alternative pricing sources are unobservable, or if quotations are not readily available, or if GSAM and GSAMI believe that such quotations do not accurately reflect fair value, the fair value of the Funds’ investments may be determined under Valuation Procedures approved by the Board of Trustees. GSAM and GSAMI, consistent with their procedures and applicable regulatory guidance, may make an adjustment to the most recent valuation prices of either domestic or foreign securities in light of significant events to reflect what it believes to be the fair value of the securities at the time of determining a Fund’s NAV. Significant events which could affect a large number of securities in a particular market may include, but are not limited to: significant fluctuations in U.S. or foreign markets; market dislocations; market disruptions; or unscheduled market closings. Significant events which could also affect a single issuer may include, but are not limited to: corporate actions such as reorganizations, mergers and buy-outs; ratings downgrades; and bankruptcies. To the extent investments are valued using single source broker quotations obtained directly from the broker or passed through from third party pricing vendors, such investments are classified as Level 3 investments.
GSAM and GSAMI did not develop the unobservable inputs (examples include but are not limited to single source broker quotations, third party pricing, etc.) for the valuation of Level 3 Assets and Liabilities.
133
GOLDMAN SACHS MULTI SECTOR FIXED INCOME FUNDS
Notes to Financial Statements (continued)
March 31, 2016
|
| 3. INVESTMENTS AND FAIR VALUE MEASUREMENTS (continued) |
C. Fair Value Hierarchy — The following is a summary of the Funds’ investments and derivatives classified in the fair value hierarchy as of March 31, 2016:
| | | | | | | | | | | | |
|
| BOND | |
| | | |
| Investment Type | | Level 1 | | | Level 2 | | | Level 3 | |
| Assets | | | | | | | | | | | | |
Fixed Income | | | | | | | | | | | | |
Corporate Obligations | | $ | — | | | $ | 122,328,701 | | | $ | — | |
Mortgage-Backed Obligations | | | — | | | | 186,389,909 | | | | 1,283,991 | |
U.S. Treasury Obligations and/or Other U.S. Government Agencies | | | 79,460,153 | | | | 5,708,650 | | | | — | |
Asset-Backed Securities | | | — | | | | 45,987,991 | | | | — | |
Foreign Debt Obligations | | | 11,675,469 | | | | 11,583,014 | | | | — | |
Structured Note | | | — | | | | 1,222,447 | | | | — | |
Municipal Debt Obligations | | | — | | | | 6,078,447 | | | | — | |
Government Guarantee Obligations | | | — | | | | 5,406,243 | | | | — | |
Investment Company | | | 58,985,636 | | | | — | | | | — | |
Short-term Investments | | | — | | | | 13,246,972 | | | | — | |
| Total | | $ | 150,121,258 | | | $ | 397,952,374 | | | $ | 1,283,991 | |
| Liabilities | | | | | | | | | | | | |
Fixed Income | | | | | | | | | | | | |
Mortgage-Backed Obligations — Forward Sales Contracts | | $ | — | | | $ | (24,117,657 | ) | | $ | — | |
| | | |
| Derivative Type | | | | | | | | | |
| Assets(a) | | | | | | | | | | | | |
Forward Foreign Currency Exchange Contracts | | $ | — | | | $ | 3,295,015 | | | $ | — | |
Futures Contracts | | | 187,115 | | | | — | | | | — | |
Interest Rate Swap Contracts | | | — | | | | 2,641,710 | | | | — | |
Credit Default Swap Contracts | | | — | | | | 1,739 | | | | — | |
| Total | | $ | 187,115 | | | $ | 5,938,464 | | | $ | — | |
| Liabilities(a) | | | | | | | | | | | | |
Forward Foreign Currency Exchange Contracts | | $ | — | | | $ | (2,867,521 | ) | | $ | — | |
Futures Contracts | | | (135,605 | ) | | | — | | | | — | |
Interest Rate Swap Contracts | | | — | | | | (1,977,077 | ) | | | — | |
Credit Default Swap Contracts | | | — | | | | (49,748 | ) | | | — | |
| Total | | $ | (135,605 | ) | | $ | (4,894,346 | ) | | $ | — | |
134
GOLDMAN SACHS MULTI SECTOR FIXED INCOME FUNDS
|
| 3. INVESTMENTS AND FAIR VALUE MEASUREMENTS (continued) |
| | | | | | | | | | | | |
| | | |
| CORE FIXED INCOME | | | | | | | | | | | | |
| | | |
| Investment Type | | Level 1 | | | Level 2 | | | Level 3 | |
| Assets | | | | | | | | | | | | |
Fixed Income | | | | | | | | | | | | |
Corporate Obligations | | $ | — | | | $ | 327,189,543 | | | $ | — | |
Mortgage-Backed Obligations | | | — | | | | 315,479,922 | | | | 1 | |
U.S. Treasury Obligations and/or Other U.S. Government Agencies | | | 108,568,967 | | | | 35,721,134 | | | | — | |
Asset-Backed Securities | | | — | | | | 81,170,228 | | | | — | |
Foreign Debt Obligations | | | 2,948,061 | | | | 17,353,333 | | | | — | |
Municipal Debt Obligations | | | — | | | | 9,363,336 | | | | — | |
Government Guarantee Obligations | | | — | | | | 28,386,958 | | | | — | |
Investment Company | | | 81,617,969 | | | | — | | | | — | |
| Total | | $ | 193,134,997 | | | $ | 814,664,454 | | | $ | 1 | |
| Liabilities | | | | | | | | | | | | |
Fixed Income | | | | | | | | | | | | |
Mortgage-Backed Obligations — Forward Sales Contracts | | $ | — | | | $ | (4,095,000 | ) | | $ | — | |
| | | |
| Derivative Type | | | | | | | | | |
| Assets(a) | | | | | | | | | | | | |
Forward Foreign Currency Exchange Contracts | | $ | — | | | $ | 1,057,822 | | | $ | — | |
Futures Contracts | | | 213,401 | | | | — | | | | — | |
Interest Rate Swap Contracts | | | — | | | | 1,732,878 | | | | — | |
| Total | | $ | 213,401 | | | $ | 2,790,700 | | | $ | — | |
| Liabilities(a) | | | | | | | | | | | | |
Forward Foreign Currency Exchange Contracts | | $ | — | | | $ | (1,012,303 | ) | | $ | — | |
Futures Contracts | | | (119,161 | ) | | | — | | | | — | |
Interest Rate Swap Contracts | | | — | | | | (3,020,143 | ) | | | — | |
Credit Default Swap Contracts | | | — | | | | (46,721 | ) | | | | |
| Total | | $ | (119,161 | ) | | $ | (4,079,167 | ) | | $ | — | |
135
GOLDMAN SACHS MULTI SECTOR FIXED INCOME FUNDS
Notes to Financial Statements (continued)
March 31, 2016
|
| 3. INVESTMENTS AND FAIR VALUE MEASUREMENTS (continued) |
| | | | | | | | | | | | |
| | | |
| GLOBAL INCOME | | | | | | | | | | | | |
| | | |
| Investment Type | | Level 1 | | | Level 2 | | | Level 3 | |
| Assets | | | | | | | | | | | | |
Fixed Income | | | | | | | | | | | | |
Foreign Sovereign Debt Obligations | | $ | 284,087,823 | | | $ | 84,689,603 | | | $ | — | |
Corporate Obligations | | | — | | | | 157,718,261 | | | | — | |
Foreign Debt Obligations | | | — | | | | 4,435,605 | | | | — | |
Asset-Backed Securities | | | — | | | | 74,331,996 | | | | — | |
Mortgage-Backed Obligations | | | — | | | | 160,563,250 | | | | — | |
U.S. Treasury Obligations and/or Other U.S. Government Agencies | | | 69,722,952 | | | | 2,715,148 | | | | — | |
Government Guarantee Obligations | | | 4,162,923 | | | | 12,827,845 | | | | — | |
Short-term Investments | | | — | | | | 40,950,000 | | | | — | |
| Total | | $ | 357,973,698 | | | $ | 538,231,708 | | | $ | — | |
| | | |
| Derivative Type | | | | | | | | | |
| Assets(a) | | | | | | | | | | | | |
Forward Foreign Currency Exchange Contracts | | $ | — | | | $ | 5,871,991 | | | $ | — | |
Futures Contracts | | | 210,748 | | | | — | | | | — | |
Interest Rate Swap Contracts | | | — | | | | 3,549,371 | | | | — | |
Credit Default Swap Contracts | | | — | | | | 24,840 | | | | — | |
| Total | | $ | 210,748 | | | $ | 9,446,202 | | | $ | — | |
| Liabilities | | | | | | | | | | | | |
Forward Foreign Currency Exchange Contracts(a) | | $ | — | | | $ | (10,928,897 | ) | | $ | — | |
Futures Contracts(a) | | | (308,751 | ) | | | — | | | | — | |
Interest Rate Swap Contracts(a) | | | — | | | | (2,622,197 | ) | | | — | |
Credit Default Swap Contracts(a) | | | — | | | | (46,497 | ) | | | — | |
Written Options Contracts | | | — | | | | (13,571 | ) | | | — | |
| Total | | $ | (308,751 | ) | | $ | (13,611,162 | ) | | $ | — | |
136
GOLDMAN SACHS MULTI SECTOR FIXED INCOME FUNDS
|
| 3. INVESTMENTS AND FAIR VALUE MEASUREMENTS (continued) |
| | | | | | | | | | | | |
| | | |
| STRATEGIC INCOME | | | | | | | | | | | | |
| | | |
| Investment Type | | Level 1 | | | Level 2 | | | Level 3 | |
| Assets | | | | | | | | | | | | |
Fixed Income | | | | | | | | | | | | |
Corporate Obligations | | $ | — | | | $ | 1,291,667,477 | | | $ | — | |
Mortgage-Backed Obligations | | | — | | | | 2,132,754,372 | | | | 61,203,575 | |
U.S. Treasury Obligations and/or Other U.S. Government Agencies | | | 2,790,411,824 | | | | 327,655,377 | | | | — | |
Asset-Backed Securities | | | — | | | | 2,683,730,133 | | | | — | |
Foreign Debt Obligations | | | 713,832,760 | | | | 1,455,643,122 | | | | — | |
Structured Note | | | — | | | | 2,042,381 | | | | — | |
Municipal Debt Obligations | | | — | | | | 246,224,207 | | | | — | |
Bank Loans | | | — | | | | 314,528,492 | | | | 144,803,291 | |
Common Stock and/or Other Equity Investments(b) | | | | | | | | | | | | |
North America | | | — | | | | 69,294,100 | | | | — | |
Europe | | | — | | | | 32,038,887 | | | | — | |
Investment Company | | | 2,576,641,388 | | | | — | | | | — | |
Short-term Investments | | | — | | | | 283,361,121 | | | | — | |
| Total | | $ | 6,080,885,972 | | | $ | 8,838,939,669 | | | $ | 206,006,866 | |
| Liabilities | | | | | | | | | | | | |
Reverse Repurchase Agreements | | $ | — | | | $ | (2,663,485 | ) | | $ | — | |
| | | |
| Derivative Type | | | | | | | | | |
| Assets(a) | | | | | | | | | | | | |
Forward Foreign Currency Exchange Contracts | | $ | — | | | $ | 241,736,659 | | | $ | — | |
Futures Contracts | | | 3,633,890 | | | | — | | | | — | |
Interest Rate Swap Contracts | | | — | | | | 197,304,596 | | | | — | |
Total Return Swap Contracts | | | — | | | | 1,492,592 | | | | — | |
| Total | | $ | 3,633,890 | | | $ | 440,533,847 | | | $ | — | |
| Liabilities(a) | | | | | | | | | | | | |
Forward Foreign Currency Exchange Contracts | | $ | — | | | $ | (247,110,550 | ) | | $ | — | |
Futures Contracts | | | (4,405,834 | ) | | | — | | | | — | |
Interest Rate Swap Contracts | | | — | | | | (280,762,352 | ) | | | — | |
Credit Default Swap Contracts | | | — | | | | (19,767,520 | ) | | | — | |
Total Return Swap Contracts | | | — | | | | (1,440,971 | ) | | | — | |
| Total | | $ | (4,405,834 | ) | | $ | (549,081,393 | ) | | $ | — | |
137
GOLDMAN SACHS MULTI SECTOR FIXED INCOME FUNDS
Notes to Financial Statements (continued)
March 31, 2016
|
| 3. INVESTMENTS AND FAIR VALUE MEASUREMENTS (continued) |
The following is a reconciliation of Level 3 investments for the fiscal year ended March 31, 2016:
| | | | | | | | |
| | | Mortgage-Backed
Securities | | | Bank Loans | |
Beginning Balance as of April 1, 2015 | | $ | — | | | $ | 102,685,355 | |
Realized gain (loss) | | | 86,157 | | | | (284,405 | ) |
Net change in unrealized gain (loss) relating to instruments still held at reporting date | | | 3,800,271 | | | | (89,335,924 | ) |
Purchases | | | 59,389,537 | | | | 56,908,617 | |
Sales | | | (2,072,390 | ) | | | (29,973,863 | ) |
Amortization | | | — | | | | 1,384,635 | |
Transfers into Level 3 | | | — | | | | 103,418,876 | |
Ending Balance as of March 31, 2016 | | $ | 61,203,575 | | | $ | 144,803,291 | |
| (a) | | Amount shown represents unrealized gain (loss) at period end. |
| (b) | | Amounts are disclosed by continent to highlight the impact of time zone differences between local market close and the calculation of net asset value. Security valuations are based on the principle exchange or system on which they are traded, which may differ from country of domicile. The Funds utilize fair value model prices provided by an independent fair value service for international equities, resulting in a Level 2 classification. |
For further information regarding security characteristics, see the Schedules of Investments.
|
| 4. INVESTMENTS IN DERIVATIVES |
The following tables set forth, by certain risk types, the gross value of derivative contracts as of March 31, 2016. These instruments were used as part of the Funds’ investment strategies and to obtain and/or manage exposure related to the risks below. The values in the tables below exclude the effects of cash collateral received or posted pursuant to these derivative contracts, and therefore are not representative of the Funds’ net exposure.
| | | | | | | | | | | | |
| | | |
| Bond | | | | | | | | | | |
| Risk | | Statements of Assets
and Liabilities | | Assets | | | Statements of Assets
and Liabilities | | Liabilities | |
Interest rate | | Receivable for unrealized gain on swap contracts; Variation margin on certain derivative contracts | | $ | 2,828,825 | (a) | | Payable for unrealized loss on swap contracts; Variation margin on certain derivative contracts | | $ | (2,112,682) | (a)(b) |
Credit | | Receivable for unrealized gain on swap contracts | | | 1,739 | | | Payable for unrealized loss on swap contracts | | | (49,748) | (b) |
Currency | | Receivable for unrealized gain on forward foreign currency exchange contracts | | | 3,295,015 | | | Payable for unrealized loss on forward foreign currency exchange contracts | | | (2,867,521) | |
| Total | | | | $ | 6,125,579 | | | | | $ | (5,029,951) | |
138
GOLDMAN SACHS MULTI SECTOR FIXED INCOME FUNDS
|
| 4. INVESTMENTS IN DERIVATIVES (continued) |
| | | | | | | | | | | | |
| | | |
| Core Fixed Income | | | | | | | | | | |
| Risk | | Statements of Assets
and Liabilities | | Assets | | | Statements of Assets
and Liabilities | | Liabilities | |
Interest rate | | Receivable for unrealized gain on swap contracts; Variation margin on certain derivative contracts | | $ | 1,946,279 | (a) | | Payable for unrealized loss on swap contracts; Variation margin on certain derivative contracts | | $ | (3,139,304) | (a) |
Credit | | Receivable for unrealized gain on swap contracts | | | — | | | Payable for unrealized loss on swap contracts | | | (46,721) | |
Currency | | Receivable for unrealized gain on forward foreign currency exchange contracts | | | 1,057,822 | | | Payable for unrealized loss on forward foreign currency exchange contracts | | | (1,012,303) | |
| Total | | | | $ | 3,004,101 | | | | | $ | (4,198,328) | |
| | | |
| Global Income | | | | | | | | | | |
| Risk | | Statements of Assets
and Liabilities | | Assets | | | Statements of Assets
and Liabilities | | Liabilities | |
Interest rate | | Receivable for unrealized gain on swap contracts; Variation margin on certain derivative contracts | | $ | 3,760,119 | (a) | | Payable for unrealized loss on swap contracts; Variation margin on certain derivative contracts | | $ | (2,930,948) | (a) |
Credit | | Receivable for unrealized gain on swap contracts | | | 24,840 | | | Payable for unrealized loss on swap contracts | | | (46,497) | |
Currency | | Receivable for unrealized gain on forward foreign currency exchange contracts | | | 5,871,991 | | | Payable for unrealized loss on forward foreign currency exchange contracts; Investments, at value; Written options, at value | | | (10,942,468) | |
| Total | | | | $ | 9,656,950 | | | | | $ | (13,919,913) | |
| | | |
| Strategic Income | | | | | | | | | | |
| Risk | | Statements of Assets
and Liabilities | | Assets | | | Statements of Assets
and Liabilities | | Liabilities | |
Interest rate | | Receivable for unrealized gain on swap contracts; Variation margin on certain derivative contracts | | $ | 202,431,078 | (a) | | Payable for unrealized loss on swap contracts; Variation margin on certain derivative contracts | | $ | (286,609,157) | (a)(b) |
Credit | | Receivable for unrealized gain on swap contracts | | | — | | | Payable for unrealized loss on swap contracts | | | (19,767,520) | (b) |
Currency | | Receivable for unrealized gain on forward foreign currency exchange contracts | | | 241,736,659 | | | Payable for unrealized loss on forward foreign currency exchange contracts | | | (247,110,550) | |
| Total | | | | $ | 444,167,737 | | | | | $ | (553,487,227) | |
| (a) | | Includes unrealized gain (loss) on futures contracts and centrally cleared swaps described in the Additional Investment Information sections of the Schedules of Investments. Only current day’s variation margin is reported within the Statements of Assets and Liabilities. |
| (b) | | Aggregate of amounts include $143,503, $22,082 and $44,709,493 for Bond, Global Income and Strategic Income Funds, which represent the payments to be made pursuant to bilateral agreements should counterparties exercise their “right to terminate” provisions based on, among others, the Funds’ performance, their failure to pay on their obligations or failure to pledge collateral. Such amounts do not include incremental charges directly associated with the close-out of the agreements. They also do not reflect the fair value of any assets pledged as collateral which, through the daily margining process, substantially offsets the aforementioned amounts and for which the Funds are entitled to a full return. |
139
GOLDMAN SACHS MULTI SECTOR FIXED INCOME FUNDS
Notes to Financial Statements (continued)
March 31, 2016
|
| 4. INVESTMENTS IN DERIVATIVES (continued) |
The following tables set forth, by certain risk types, the Funds’ gains (losses) related to these derivatives and their indicative volumes for the fiscal year ended March 31, 2016. These gains (losses) should be considered in the context that these derivative contracts may have been executed to create investment opportunities and/or economically hedge certain investments, and accordingly, certain gains (losses) on such derivative contracts may offset certain (losses) gains attributable to investments. These gains (losses) are included in “Net realized gain (loss)” or “Net change in unrealized gain (loss)” on the Statements of Operations:
| | | | | | | | | | | | | | |
| | |
| Bond | | | | | | | | | |
| Risk | | Statements of Operations | | Net
Realized
Gain (Loss) | | | Net Change in
Unrealized
Gain (Loss) | | | Average
Number of
Contracts(a) | |
| Interest rate | | Net realized gain (loss) from investments, futures contracts and swap contracts/Net change in unrealized gain (loss) on investments, futures contracts and swap contracts | | $ | 7,080,464 | | | $ | (1,221,694 | ) | | | 988 | |
| Credit | | Net realized gain (loss) from swap contracts/Net change in unrealized gain (loss) on swap contracts | | | (340,579 | ) | | | (207,925 | ) | | | 53 | |
| Currency | | Net realized gain (loss) from forward foreign currency exchange contracts/Net change in unrealized gain (loss) on forward foreign currency exchange contracts | | | (1,422,822 | ) | | | 109,966 | | | | 367 | |
| Total | | | | $ | 5,317,063 | | | $ | (1,319,653 | ) | | | 1408 | |
| | |
| Core Fixed Income | | | | | | | | | |
| Risk | | Statements of Operations | | Net
Realized
Gain (Loss) | | | Net Change in
Unrealized
Gain (Loss) | | | Average
Number of
Contracts(a) | |
| Interest rate | | Net realized gain (loss) from investments, futures contracts, swap contracts and written options/Net change in unrealized gain (loss) on futures contracts and swap contracts | | $ | 6,329,086 | | | $ | (668,924 | ) | | | 1,321 | |
| Credit | | Net realized gain (loss) from swap contracts/Net change in unrealized gain (loss) on swap contracts | | | (847,241 | ) | | | (87,929 | ) | | | 14 | |
| Currency | | Net realized gain (loss) from forward foreign currency exchange contracts/Net change in unrealized gain (loss) on forward foreign currency exchange contracts | | | (332,294 | ) | | | (103,487 | ) | | | 172 | |
| Total | | | | $ | 5,149,551 | | | $ | (860,340 | ) | | | 1,507 | |
| | |
| Global Income | | | | | | | | | |
| Risk | | Statements of Operations | | Net
Realized
Gain (Loss) | | | Net Change in
Unrealized
Gain (Loss) | | | Average
Number of
Contracts(a) | |
| Interest rate | | Net realized gain (loss) from investments, futures contracts and swap contracts/Net change in unrealized gain (loss) on futures contracts and swap contracts | | $ | 7,389,962 | | | $ | (2,373,010 | ) | | | 1,113 | |
| Credit | | Net realized gain (loss) from swap contracts/Net change in unrealized gain (loss) on swap contracts | | | (1,091,684 | ) | | | (149,128 | ) | | | 4 | |
| Currency | | Net realized gain (loss) from investments, forward foreign currency exchange contracts and written options/Net change in unrealized gain (loss) on investments forward foreign currency exchange contracts and written options | | | (13,531,567 | ) | | | (8,542,204 | ) | | | 495 | |
| Total | | | | $ | (7,233,289 | ) | | $ | (11,064,342 | ) | | | 1,612 | |
140
GOLDMAN SACHS MULTI SECTOR FIXED INCOME FUNDS
|
| 4. INVESTMENTS IN DERIVATIVES (continued) |
| | | | | | | | | | | | | | |
| | |
| Strategic Income | | | | | | | | | |
| Risk | | Statements of Operations | | Net
Realized
Gain (Loss) | | | Net Change in
Unrealized
Gain (Loss) | | | Average
Number of
Contracts(a) | |
| Interest rate | | Net realized gain (loss) from investments, futures contracts and swap contracts/Net change in unrealized gain (loss) on investments, futures contracts and swap contracts | | $ | 188,617,797 | | | $ | 49,239,213 | | | | 30,135 | |
| Credit | | Net realized gain (loss) from swap contracts/Net change in unrealized gain (loss) on swap contracts | | | (125,296,915 | ) | | | (3,154,597 | ) | | | 63 | |
| Currency | | Net realized gain (loss) from forward foreign currency exchange contracts/Net change in unrealized gain (loss) on forward foreign currency exchange contracts | | | 83,152,257 | | | | (75,988,408 | ) | | | 391 | |
| Total | | | | $ | 146,473,139 | | | $ | (29,903,792 | ) | | | 30,589 | |
| (a) | | Average number of contracts is based on the average of month end balances for the fiscal year ended March 31, 2016. |
In order to better define its contractual rights and to secure rights that will help a Fund mitigate its counterparty risk, a Fund may enter into an International Swaps and Derivatives Association, Inc. Master Agreement (“ISDA Master Agreement”) or similar agreement with its derivatives counterparties. An ISDA Master Agreement is a bilateral agreement between a Fund and a counterparty that governs OTC derivatives, (including forward foreign currency exchange contracts, and certain options and swaps) and typically contains, among other things, collateral posting terms and netting provisions in the event of a default and/or termination event. The provisions of the ISDA Master Agreement typically permit a single net payment in the event of a default (close-out netting) or similar event, including the bankruptcy or insolvency of the counterparty.
Collateral and margin requirements differ between exchange traded derivatives and OTC derivatives. Margin requirements are established by the broker or clearing house for exchange-traded and centrally cleared derivatives (financial futures contracts, options and centrally cleared swaps) pursuant to governing agreements for those instrument types. Brokers can ask for margin in excess of the minimum in certain circumstances. Collateral terms are contract-specific for OTC derivatives. For derivatives traded under an ISDA Master Agreement, the collateral requirements are typically calculated by netting the marked to market amount for each transaction under such agreement and comparing that amount to the value of any collateral currently pledged by a Fund and the counterparty. Additionally, a Fund may be required to post initial margin to the counterparty, the terms of which would be outlined in the confirmation of the OTC transaction.
For financial reporting purposes, cash collateral that has been pledged to cover obligations of a Fund and cash collateral received from the counterparty, if any, is reported separately on the Statements of Assets and Liabilities as receivables/payables for collateral on certain derivative contracts. Non-cash collateral pledged by a Fund, if any, is noted in the Schedules of Investments. Generally, the amount of collateral due from or to a counterparty must exceed a minimum transfer amount threshold before a transfer is required to be made. To the extent amounts due to a Fund from its counterparties are not fully collateralized, contractually or otherwise, the Fund bears the risk of loss from counterparty nonperformance. A Fund attempts to mitigate counterparty risk by only entering into agreements with counterparties that the Investment Adviser believes to be of good standing and by monitoring the financial stability of those counterparties.
Additionally, the netting of assets and liabilities and the offsetting of collateral pledged or received are based on contractual netting/set-off provisions in the ISDA Master Agreement or similar agreements. However, in the event of a default or insolvency of a counterparty, a court could determine that such rights are not enforceable due to the restrictions or prohibitions against the right of setoff that may be imposed in accordance with a particular jurisdiction’s bankruptcy or insolvency laws.
141
GOLDMAN SACHS MULTI SECTOR FIXED INCOME FUNDS
Notes to Financial Statements (continued)
March 31, 2016
|
| 4. INVESTMENTS IN DERIVATIVES (continued) |
The following tables set forth the Funds’ net exposure for derivative instruments that are subject to enforceable master netting arrangements or similar agreements as of March 31, 2016:
| | | | | | | | | | | | | | | | | | | | | | | | | | | | | | | | | | | | |
|
| Bond Fund | |
| | | Derivative Assets(1) | | | Derivative Liabilities(1) | | | Net Derivative
Asset
(Liabilities) | | | Collateral
(Received)
Pledged(1) | | | Net
Amount(2) | |
| Counterparty | | Swaps | | | Forward
Currency
Contracts | | | Total | | | Swaps | | | Forward
Currency
Contracts | | | Total | | | | |
Bank of America
Securities LLC | | $ | — | | | $ | 326,341 | | | $ | 326,341 | | | $ | (336 | ) | | $ | (64,713 | ) | | $ | (65,049 | ) | | $ | 261,292 | | | $ | — | | | $ | 261,292 | |
Barclays Bank PLC | | | — | | | | 133,150 | | | | 133,150 | | | | (53,988 | ) | | | (165,609 | ) | | | (219,597 | ) | | | (86,447 | ) | | | 86,447 | | | | — | |
BNP Paribas SA | | | — | | | | 158,822 | | | | 158,822 | | | | — | | | | (59,655 | ) | | | (59,655 | ) | | | 99,167 | | | | — | | | | 99,167 | |
Citibank NA | | | 13,062 | | | | — | | | | 13,062 | | | | (45,080 | ) | | | — | | | | (45,080 | ) | | | (32,018 | ) | | | 32,018 | | | | — | |
Citibank NA (London) | | | — | | | | 435,623 | | | | 435,623 | | | | — | | | | (444,575 | ) | | | (444,575 | ) | | | (8,952 | ) | | | — | | | | (8,952 | ) |
Credit Suisse International (London) | | | — | | | | 149,104 | | | | 149,104 | | | | — | | | | (17,857 | ) | | | (17,857 | ) | | | 131,247 | | | | — | | | | 131,247 | |
Deutsche Bank AG | | | 57,075 | | | | — | | | | 57,075 | | | | (5,860 | ) | | | — | | | | (5,860 | ) | | | 51,215 | | | | — | | | | 51,215 | |
Deutsche Bank AG (London) | | | — | | | | 284,076 | | | | 284,076 | | | | — | | | | (125,927 | ) | | | (125,927 | ) | | | 158,149 | | | | — | | | | 158,149 | |
HSBC Bank PLC | | | — | | | | 329,060 | | | | 329,060 | | | | — | | | | (273,293 | ) | | | (273,293 | ) | | | 55,767 | | | | — | | | | 55,767 | |
JPMorgan Chase Bank (London) | | | — | | | | 501,502 | | | | 501,502 | | | | — | | | | (653,512 | ) | | | (653,512 | ) | | | (152,010 | ) | | | — | | | | (152,010 | ) |
JPMorgan Securities, Inc. | | | 51,854 | | | | — | | | | 51,854 | | | | (34,862 | ) | | | — | | | | (34,862 | ) | | | 16,992 | | | | — | | | | 16,992 | |
Morgan Stanley & Co. International PLC | | | 22,849 | | | | 162,855 | | | | 185,704 | | | | (3,377 | ) | | | (219,981 | ) | | | (223,358 | ) | | | (37,654 | ) | | | — | | | | (37,654 | ) |
Royal Bank of Canada | | | — | | | | 64,359 | | | | 64,359 | | | | — | | | | (224,115 | ) | | | (224,115 | ) | | | (159,756 | ) | | | — | | | | (159,756 | ) |
Royal Bank of Scotland PLC | | | — | | | | 85,239 | | | | 85,239 | | | | — | | | | (91,987 | ) | | | (91,987 | ) | | | (6,748 | ) | | | — | | | | (6,748 | ) |
Standard Chartered Bank | | | — | | | | 272,166 | | | | 272,166 | | | | — | | | | (89,375 | ) | | | (89,375 | ) | | | 182,791 | | | | — | | | | 182,791 | |
State Street Bank (London) | | | — | | | | 171,735 | | | | 171,735 | | | | — | | | | (166,433 | ) | | | (166,433 | ) | | | 5,302 | | | | — | | | | 5,302 | |
UBS AG (London) | | | — | | | | 169,006 | | | | 169,006 | | | | — | | | | (50,860 | ) | | | (50,860 | ) | | | 118,146 | | | | — | | | | 118,146 | |
Westpac Banking Corp. | | | — | | | | 51,977 | | | | 51,977 | | | | — | | | | (219,629 | ) | | | (219,629 | ) | | | (167,652 | ) | | | — | | | | (167,652 | ) |
Total | | $ | 144,840 | | | $ | 3,295,015 | | | $ | 3,439,855 | | | $ | (143,503 | ) | | $ | (2,867,521 | ) | | $ | (3,011,024 | ) | | $ | 428,831 | | | $ | 118,465 | | | $ | 547,296 | |
142
GOLDMAN SACHS MULTI SECTOR FIXED INCOME FUNDS
|
| 4. INVESTMENTS IN DERIVATIVES (continued) |
| | | | | | | | | | | | | | | | | | | | | | | | | | | | | | | | | | | | | | |
|
| Global Income Fund | |
| | | Derivative Assets(1) | | | Derivative Liabilities(1) | | | Net
Derivative
Asset
(Liabilities) | | | Collateral
(Received)
Pledged(1) | | | Net
Amount(2) | |
| Counterparty | | Swaps | | Forward
Currency
Contracts | | | Total | | | Swaps | | | Forward
Currency
Contracts | | | Options
Written | | | Total | | | | |
Bank of America Securities LLC | | $11,537 | | $ | 386,414 | | | $ | 397,951 | | | $ | — | | | $ | (357,764 | ) | | $ | — | | | $ | (357,764 | ) | | $ | 40,187 | | | $ | — | | | $ | 40,187 | |
Barclays Bank PLC | | — | | | 180,663 | | | | 180,663 | | | | — | | | | (325,223 | ) | | | — | | | | (325,223 | ) | | | (144,560 | ) | | | — | | | | (144,560 | ) |
BNP Paribas SA | | — | | | 487,108 | | | | 487,108 | | | | — | | | | (368,768 | ) | | | — | | | | (368,768 | ) | | | 118,340 | | | | — | | | | 118,340 | |
Citibank NA | | — | | | — | | | | — | | | | (22,082 | ) | | | — | | | | (13,571 | ) | | | (35,653 | ) | | | (35,653 | ) | | | — | | | | (35,653 | ) |
Citibank NA (London) | | — | | | 467,540 | | | | 467,540 | | | | — | | | | (661,697 | ) | | | — | | | | (661,697 | ) | | | (194,157 | ) | | | — | | | | (194,157 | ) |
Credit Suisse International (London) | | — | | | 239,703 | | | | 239,703 | | | | — | | | | (24,448 | ) | | | — | | | | (24,448 | ) | | | 215,255 | | | | — | | | | 215,255 | |
Deutsche Bank AG (London) | | — | | | 356,939 | | | | 356,939 | | | | — | | | | (196,869 | ) | | | — | | | | (196,869 | ) | | | 160,070 | | | | — | | | | 160,070 | |
HSBC Bank PLC | | — | | | 750,086 | | | | 750,086 | | | | — | | | | (1,833,870 | ) | | | — | | | | (1,833,870 | ) | | | (1,083,784 | ) | | | — | | | | (1,083,784 | ) |
JPMorgan Chase Bank (London) | | — | | | 672,891 | | | | 672,891 | | | | — | | | | (3,468,373 | ) | | | — | | | | (3,468,373 | ) | | | (2,795,482 | ) | | | — | | | | (2,795,482 | ) |
Morgan Stanley & Co. International PLC | | 5,669 | | | 221,311 | | | | 226,980 | | | | — | | | | (334,409 | ) | | | — | | | | (334,409 | ) | | | (107,429 | ) | | | — | | | | (107,429 | ) |
Royal Bank of Canada | | — | | | 90,949 | | | | 90,949 | | | | — | | | | (1,339,367 | ) | | | — | | | | (1,339,367 | ) | | | (1,248,418 | ) | | | — | | | | (1,248,418 | ) |
Royal Bank of Scotland PLC | | — | | | 117,096 | | | | 117,096 | | | | — | | | | (255,218 | ) | | | — | | | | (255,218 | ) | | | (138,122 | ) | | | — | | | | (138,122 | ) |
Standard Chartered Bank | | — | | | 506,863 | | | | 506,863 | | | | — | | | | (261,115 | ) | | | — | | | | (261,115 | ) | | | 245,748 | | | | — | | | | 245,748 | |
State Street Bank (London) | | — | | | 1,041,232 | | | | 1,041,232 | | | | — | | | | (992,585 | ) | | | — | | | | (992,585 | ) | | | 48,647 | | | | — | | | | 48,647 | |
UBS AG (London) | | — | | | 282,035 | | | | 282,035 | | | | — | | | | (137,779 | ) | | | — | | | | (137,779 | ) | | | 144,256 | | | | — | | | | 144,256 | |
Westpac Banking Corp. | | — | | | 71,161 | | | | 71,161 | | | | — | | | | (371,412 | ) | | | — | | | | (371,412 | ) | | | (300,251 | ) | | | — | | | | (300,251 | ) |
Total | | $17,206 | | $ | 5,871,991 | | | $ | 5,889,197 | | | $ | (22,082 | ) | | $ | (10,928,897 | ) | | $ | (13,571 | ) | | $ | (10,964,550 | ) | | $ | (5,075,353 | ) | | $ | — | | | $ | (5,075,353 | ) |
143
GOLDMAN SACHS MULTI SECTOR FIXED INCOME FUNDS
Notes to Financial Statements (continued)
March 31, 2016
|
| 4. INVESTMENTS IN DERIVATIVES (continued) |
| | | | | | | | | | | | | | | | | | | | | | | | | | | | | | | | | | | | |
|
| Strategic Income Fund | |
| | | Derivative Assets(1) | | | Derivative Liabilities(1) | | | Net Derivative
Asset
(Liabilities) | | | Collateral
(Received)
Pledged(1) | | | Net
Amount(2) | |
| Counterparty | | Swaps | | | Forward
Currency
Contracts | | | Total | | | Swaps | | | Forward
Currency
Contracts | | | Total | | | | |
Bank of America Securities LLC | | $ | 533,755 | | | $ | 40,254,185 | | | $ | 40,787,940 | | | $ | (1,130,620 | ) | | $ | (23,845,512 | ) | | $ | (24,976,132 | ) | | $ | 15,811,808 | | | $ | — | | | $ | 15,811,808 | |
Barclays Bank PLC | | | 1,951,019 | | | | 8,138,172 | | | | 10,089,191 | | | | (4,037,725 | ) | | | (10,745,147 | ) | | | (14,782,872 | ) | | | (4,693,681 | ) | | | 2,510,000 | | | | (2,183,681 | ) |
BNP Paribas SA | | | — | | | | 12,165,630 | | | | 12,165,630 | | | | — | | | | (3,658,769 | ) | | | (3,658,769 | ) | | | 8,506,861 | | | | — | | | | 8,506,861 | |
Citibank NA | | | 1,579,892 | | | | 29,590,864 | | | | 31,170,756 | | | | (10,995,807 | ) | | | (25,819,903 | ) | | | (36,815,710 | ) | | | (5,644,954 | ) | | | 5,644,954 | | | | — | |
Credit Suisse International (London) | | | 656,079 | | | | 5,421,599 | | | | 6,077,678 | | | | (914,647 | ) | | | (911,144 | ) | | | (1,825,791 | ) | | | 4,251,887 | | | | — | | | | 4,251,887 | |
Deutsche Bank AG | | | 6,259,251 | | | | 17,431,409 | | | | 23,690,660 | | | | (2,154,372 | ) | | | (10,114,931 | ) | | | (12,269,303 | ) | | | 11,421,357 | | | | (3,930,000 | ) | | | 7,491,357 | |
HSBC Bank PLC | | | — | | | | 21,370,143 | | | | 21,370,143 | | | | — | | | | (18,770,279 | ) | | | (18,770,279 | ) | | | 2,599,864 | | | | — | | | | 2,599,864 | |
JPMorgan
Chase Bank (London) | | | — | | | | 41,489,293 | | | | 41,489,293 | | | | — | | | | (66,952,746 | ) | | | (66,952,746 | ) | | | (25,463,453 | ) | | | — | | | | (25,463,453 | ) |
JPMorgan Securities, Inc. | | | 5,341,057 | | | | — | | | | 5,341,057 | | | | (20,551,364 | ) | | | — | | | | (20,551,364 | ) | | | (15,210,307 | ) | | | 15,210,307 | | | | — | |
Merrill Lynch & Co., Inc. | | | — | | | | 1,064,293 | | | | 1,064,293 | | | | — | | | | (1,161,047 | ) | | | (1,161,047 | ) | | | (96,754 | ) | | | — | | | | (96,754 | ) |
Morgan Stanley & Co. | | | — | | | | 8,350,446 | | | | 8,350,446 | | | | — | | | | (16,270,744 | ) | | | (16,270,744 | ) | | | (7,920,298 | ) | | | — | | | | (7,920,298 | ) |
Morgan Stanley & Co. International PLC | | | 5,005,760 | | | | — | | | | 5,005,760 | | | | (4,924,958 | ) | | | — | | | | (4,924,958 | ) | | | 80,802 | | | | — | | | | 80,802 | |
Royal Bank of Canada | | | — | | | | 3,815,859 | | | | 3,815,859 | | | | — | | | | (22,740,775 | ) | | | (22,740,775 | ) | | | (18,924,916 | ) | | | — | | | | (18,924,916 | ) |
Royal Bank of Scotland PLC | | | — | | | | 7,735,079 | | | | 7,735,079 | | | | — | | | | (9,281,593 | ) | | | (9,281,593 | ) | | | (1,546,514 | ) | | | — | | | | (1,546,514 | ) |
Standard Chartered Bank | | | — | | | | 19,773,494 | | | | 19,773,494 | | | | — | | | | (5,818,515 | ) | | | (5,818,515 | ) | | | 13,954,979 | | | | — | | | | 13,954,979 | |
State Street Bank (London) | | | — | | | | 9,956,169 | | | | 9,956,169 | | | | — | | | | (12,457,836 | ) | | | (12,457,836 | ) | | | (2,501,667 | ) | | | — | | | | (2,501,667 | ) |
UBS AG (London) | | | — | | | | 10,864,138 | | | | 10,864,138 | | | | — | | | | (2,816,369 | ) | | | (2,816,369 | ) | | | 8,047,769 | | | | — | | | | 8,047,769 | |
Westpac Banking Corp. | | | — | | | | 4,315,886 | | | | 4,315,886 | | | | — | | | | (15,745,240 | ) | | | (15,745,240 | ) | | | (11,429,354 | ) | | | — | | | | (11,429,354 | ) |
Total | | $ | 21,326,813 | | | $ | 241,736,659 | | | $ | 263,063,472 | | | $ | (44,709,493 | ) | | $ | (247,110,550 | ) | | $ | (291,820,043 | ) | | $ | (28,756,571 | ) | | $ | 19,435,261 | | | $ | (9,321,310 | ) |
| (1) | | Gross amounts available for offset but not netted in the Statement of Assets and Liabilities. |
| (2) | | Net amount represents the net amount due (to) from counterparty in the event of a default based on the contractual set-off rights under the agreement. Net amount excludes any over-collateralized amounts. |
144
GOLDMAN SACHS MULTI SECTOR FIXED INCOME FUNDS
|
| 5. AGREEMENTS AND AFFILIATED TRANSACTIONS |
A. Management Agreement — Under the Agreement, GSAM and GSAMI manage the Funds, subject to the general supervision of the Trustees.
As compensation for the services rendered pursuant to the Agreement, the assumption of the expenses related thereto and administration of the Funds’ business affairs, including providing facilities, GSAM and GSAMI are entitled to a management fee, accrued daily and paid monthly, equal to an annual percentage rate of each Fund’s average daily net assets.
For the fiscal year ended March 31, 2016, contractual and effective net management fees with GSAM and GSAMI were at the following rates:
| | | | | | | | | | | | | | | | | | | | | | | | | | | | | | |
| | | | | Contractual Management Rate | | | Effective Net
Management
Rate^ | |
| Fund | | | | First
$1 Billion | | | Next
$1 Billion | | | Next
$3 Billion | | | Next
$3 Billion | | | Over
$8 Billion | | | Effective
Rate | | |
Bond | | | | | 0.45 | % | | | 0.41 | % | | | 0.39 | % | | | 0.38 | % | | | 0.37 | % | | | 0.45 | % | | | 0.41 | %* |
Core Fixed Income | | | | | 0.40 | | | | 0.36 | | | | 0.34 | | | | 0.33 | | | | 0.32 | | | | 0.40 | | | | 0.40 | |
Global Income | | | | | 0.65 | | | | 0.59 | | | | 0.56 | | | | 0.55 | | | | 0.54 | | | | 0.65 | | | | 0.65 | |
Strategic Income | | | | | 0.60 | | | | 0.54 | | | | 0.51 | | | | 0.50 | | | | 0.49 | | | | 0.50 | | | | 0.50 | |
| ^ | | Effective Net Management Rate includes the impact of management fee waivers of affiliated underlying funds, if any. |
| * | | GSAM has agreed to waive a portion of its management fee in order to achieve net management rates, as defined in the Funds’ most recent prospectuses. These waivers will be effective through at least July 29, 2016, and prior to such date GSAM may not terminate the arrangements without the approval of the Trustees. |
The Bond, Core Fixed Income, and Strategic Income Funds invest in FST Institutional Shares of the Goldman Sachs Financial Square Government Fund, which is an affiliated Underlying Fund. GSAM has agreed to waive a portion of its management fee payable by the Funds in an amount equal to the management fee it earns as an investment adviser to any of the affiliated Underlying Funds in which the Funds invest. For the fiscal year ended March 31, 2016, GSAM waived $61,046, $110,550 and $1,155,596 of the management fee for the Bond, Core Fixed Income, and Strategic Income Funds, respectively.
B. Distribution and Service Plans — The Trust, on behalf of each Fund, has adopted Distribution and Service Plans (the “Plans”). Under the Plans, Goldman Sachs, which serves as distributor (the “Distributor”), is entitled to a fee accrued daily and paid monthly, for distribution services and personal and account maintenance services, which may then be paid by Goldman Sachs to authorized dealers, at the following annual rates calculated on a Fund’s average daily net assets of each respective share class:
| | | | | | | | | | | | |
| | | Distribution and Service Plan Rates | |
| | | Class A* | | | Class C | | | Class R* | |
Distribution Plan | | | 0.25 | % | | | 0.75 | % | | | 0.50 | % |
Service Plan | | | — | | | | 0.25 | | | | — | |
| * | | With respect to Class A and Class R Shares, the Distributor at its discretion may use compensation for distribution services paid under the Distribution Plan to compensate service organizations for personal and account maintenance services and expenses as long as such total compensation does not exceed the maximum cap on “service fees” imposed by the Financial Industry Regulatory Authority. |
145
GOLDMAN SACHS MULTI SECTOR FIXED INCOME FUNDS
Notes to Financial Statements (continued)
March 31, 2016
|
| 5. AGREEMENTS AND AFFILIATED TRANSACTIONS (continued) |
C. Distribution Agreement — Goldman Sachs, as Distributor of the shares of the Funds pursuant to a Distribution Agreement, may retain a portion of the Class A Shares’ front end sales charge and Class C Shares’ CDSC. During the fiscal year ended March 31, 2016, Goldman Sachs advised that it retained the following amounts:
| | | | | | | | | | |
| | | | | Front End
Sales Charge | | | Contingent Deferred
Sales Charge | |
| Fund | | | | Class A | | | Class C | |
Bond | | | | $ | 4,769 | | | $ | 87 | |
Core Fixed Income | | | | | 4,731 | | | | 1,536 | |
Global Income | | | | | 8,618 | | | | — | |
Strategic Income | | | | | 80,396 | | | | 4 | |
D. Service Plan and Shareholder Administration Plan — The Trust, on behalf of each Fund that offers Service Shares, has adopted a Service Plan and a Shareholder Administration Plan. These plans allow for service organizations to provide varying levels of personal and account maintenance and shareholder administration services to their customers who are beneficial owners of such shares. The Service Plan and Shareholder Administration Plan each provide for compensation to the service organizations which is accrued daily and paid monthly at an annual rate of 0.25% (0.50% in aggregate) of the average daily net assets of the Service Shares.
E. Transfer Agency Agreement — Goldman Sachs also serves as the transfer agent of the Funds for a fee pursuant to the Transfer Agency Agreement. The fees charged for such transfer agency services are accrued daily and paid monthly at annual rates as follows: 0.13% of the average daily net assets of Class A, Class C, Class IR and Class R Shares, 0.02% of the average daily net assets of Class R6 Shares and 0.04% of the average daily net assets of Institutional and Service Shares.
F. Other Expense Agreements and Affiliated Transactions — GSAM and GSAMI have agreed to limit certain “Other Expenses” of the Funds (excluding acquired fund fees and expenses, transfer agency fees and expenses, service fees and shareholder administration fees (as applicable), taxes, interest, brokerage fees, shareholder meeting, litigation, indemnification and extraordinary expenses) to the extent such expenses exceed, on an annual basis, a percentage rate of the average daily net assets of each Fund. Such Other Expense reimbursements, if any, are accrued daily and paid monthly. In addition, the Funds are not obligated to reimburse GSAM and GSAMI for prior fiscal year expense reimbursements, if any. The Other Expense limitations as an annual percentage rate of average daily net assets for the Bond, Core Fixed Income, Global Income and Strategic Income Funds are 0.41%, 0.014%, 0.004% and 0.054%, respectively. The Other Expense limitations will remain in place through at least July 29, 2016, and prior to such date GSAM and GSAMI may not terminate the arrangements without the approval of the Trustees. In addition, the Funds have entered into certain offset arrangements with the custodian and the transfer agent, which may result in a reduction of the Funds’ expenses and are received irrespective of the application of the “Other Expense” limitations described above.
146
GOLDMAN SACHS MULTI SECTOR FIXED INCOME FUNDS
|
| 5. AGREEMENTS AND AFFILIATED TRANSACTIONS (continued) |
For the fiscal year ended March 31, 2016, these expense reductions, including any fee waivers and Other Expense reimbursements, were as follows:
| | | | | | | | | | | | | | | | | | |
| Fund | | | | Management
Fee Waiver | | | Distribution and
Service Fees | | | Other Expense
Reimbursements | | | Total Expense
Reductions | |
Bond | | | | $ | 228,076 | | | $ | — | | | $ | 702,032 | | | $ | 930,108 | |
Core Fixed Income | | | | | 110,550 | | | | — | | | | 566,733 | | | | 677,283 | |
Global Income | | | | | — | | | | 883 | | | | 747,617 | | | | 748,500 | |
Strategic Income | | | | | 1,155,596 | | | | 24,929 | | | | — | | | | 1,180,525 | |
G. Line of Credit Facility — As of March 31, 2016, the Funds participated in a $1,205,000,000 committed, unsecured revolving line of credit facility (the “facility”) together with other funds of the Trust and certain registered investment companies having management agreements with GSAM or its affiliates (“Other Borrowers”). Pursuant to the terms of the facility, the Funds and Other Borrowers could increase the credit amount by up to an additional $115,000,000 for a total of up to $1,320,000,000. This facility is to be used for temporary emergency purposes, or to allow for an orderly liquidation of securities to meet redemption requests. The interest rate on borrowings is based on the federal funds rate. The facility also requires a fee to be paid by the Funds based on the amount of the commitment that has not been utilized. For the fiscal year ended March 31, 2016, the Funds did not have any borrowings under the facility.
H. Other Transactions with Affiliates — For the fiscal year ended March 31, 2016, Goldman Sachs earned $47,393, $58,085, $63,916, and $2,254,957 in brokerage commissions from portfolio transactions, including futures transactions executed with Goldman Sachs as the Futures Commission Merchant, on behalf of the Bond, Core Fixed Income, Global Income and Strategic Income Funds, respectively.
The Funds may purchase securities from, or sell securities to, an affiliated fund provided the affiliation is solely due to having a common investment adviser, common officers, or common trustees. For the fiscal year ended March 31, 2016, the purchase, sale transactions and related net realized gain (loss) for the Strategic Income Fund with an affiliated fund in compliance with Rule 17a-7 under the Act were $24,936,224, $30,563,214 and $(39,781) respectively.
As of March 31, 2016, the following Fund of Funds Portfolios were the beneficial owners of 5% or more of total outstanding shares of the following Fund:
| | | | | | | | | | |
| Fund | | | | Goldman Sachs Balanced Strategy Portfolio | | | Goldman Sachs Growth and Income Strategy Portfolio | |
Global Income | | | | | 20 | % | | | 22 | % |
As of March 31, 2016, Goldman Sachs Group, Inc. was the beneficial owner of 100% of outstanding Class R6 Shares of the Bond Fund.
147
GOLDMAN SACHS MULTI SECTOR FIXED INCOME FUNDS
Notes to Financial Statements (continued)
March 31, 2016
|
| 5. AGREEMENTS AND AFFILIATED TRANSACTIONS (continued) |
The table below shows the transactions in and earnings from investments in this affiliated Fund for the fiscal year ended March 31, 2016:
| | | | | | | | | | | | | | | | | | | | | | |
| Fund | | Underlying Fund | | Market
Value
3/31/15 | | | Purchases
at Cost | | | Proceeds
from Sales | | | Market
Value
3/31/16 | | | Dividend
Income | |
Bond Fund | | Goldman Sachs Financial
Square Government Fund | | $ | 113,325,598 | | | $ | 516,795,440 | | | $ | (571,135,402 | ) | | $ | 58,985,636 | | | $ | 36,053 | |
Core Fixed Income Fund | | Goldman Sachs Financial Square Government Fund | | | 104,601,189 | | | | 782,950,225 | | | | (805,933,445 | ) | | | 81,617,969 | | | | 35,658 | |
Strategic Income | | Goldman Sachs Financial Square Government Fund | | | 325,124,425 | | | | 16,558,885,988 | | | | (14,307,369,025 | ) | | | 2,576,641,388 | | | | 1,094,952 | |
|
| 6. PORTFOLIO SECURITIES TRANSACTIONS |
The cost of purchases and proceeds from sales and maturities of long-term securities for the fiscal year ended March 31, 2016, were as follows:
| | | | | | | | | | | | | | | | | | |
| Fund | | | | Purchases of
U.S. Government and
Agency Obligations | | | Purchases (Excluding
U.S. Government and
Agency Obligations) | | | Sales and
Maturities of
U.S. Government and
Agency Obligations | | | Sales and
Maturities (Excluding
U.S. Government and
Agency Obligations) | |
Bond | | | | $ | 2,413,143,660 | | | $ | 135,684,370 | | | $ | 2,331,042,162 | | | $ | 129,263,040 | |
Core Fixed Income | | | | | 4,369,588,384 | | | | 272,309,199 | | | | 4,317,064,469 | | | | 242,260,960 | |
Global Income | | | | | 1,386,874,481 | | | | 573,555,734 | | | | 1,257,623,581 | | | | 363,552,896 | |
Strategic Income | | | | | 20,984,157,719 | | | | 13,251,917,970 | | | | 25,837,278,400 | | | | 18,286,756,393 | |
The table below summarizes the reverse repurchase agreement activity for the fiscal year ended March 31, 2016:
| | | | | | | | | | | | | | |
| Fund | | | | Average amount of borrowings | | | Weighted average interest rate (Paid) Received | | | Number of days outstanding during
the period | |
Bond | | | | $ | 2,143,308 | | | | 0.775 | % | | | 288 | |
Core Fixed Income | | | | | 2,215,094 | | | | 1.133 | | | | 310 | |
Strategic Income | | | | | 34,379,450 | | | | 1.197 | | | | 332 | |
148
GOLDMAN SACHS MULTI SECTOR FIXED INCOME FUNDS
|
| 6. PORTFOLIO SECURITIES TRANSACTIONS (continued) |
As of March 31, 2016 the remaining contractual maturity of the reverse repurchase agreement was greater than 90 days for the Strategic Income Fund. The gross value of the reverse repurchase agreement is reported on the Statement of Assets and Liabilities. The gross amount of recognized liabilities for reverse repurchase agreements was $2,663,485 with associated foreign debt obligations and cash pledged as collateral.
The tax character of distributions paid during the fiscal year ended March 31, 2016 was as follows:
| | | | | | | | | | | | | | | | |
| | | Bond | | | Core Fixed
Income | | | Global
Income | | | Strategic Income | |
Distribution paid from: | | | | | | | | | | | | | | | | |
Ordinary income | | $ | 14,493,976 | | | $ | 26,072,575 | | | $ | 39,324,578 | | | $ | 809,456,541 | |
Net long-term capital gains | | | 37,564 | | | | — | | | | 654,973 | | | | — | |
Total taxable distributions | | $ | 14,531,540 | | | $ | 26,072,575 | | | $ | 39,979,551 | | | $ | 809,456,541 | |
The tax character of distributions paid during the fiscal year ended March 31, 2015 was as follows:
| | | | | | | | | | | | | | | | |
| | | Bond | | | Core Fixed
Income | | | Global
Income | | | Strategic
Income | |
Distribution paid from: | | | | | | | | | | | | | | | | |
Ordinary income | | $ | 6,916,174 | | | $ | 24,875,677 | | | $ | 22,091,731 | | | $ | 743,957,912 | |
Net long-term capital gains | | | 3,956,888 | | | | — | | | | 1,198,798 | | | | — | |
Total taxable distributions | | $ | 10,873,062 | | | $ | 24,875,677 | | | $ | 23,290,529 | | | $ | 743,957,912 | |
Tax return of capital | | $ | — | | | $ | — | | | $ | — | | | $ | 1,910,193 | |
As of March 31, 2016, the components of accumulated earnings (losses) on a tax basis were as follows:
| | | | | | | | | | | | | | | | |
| | | Bond | | | Core Fixed Income | | | Global Income | | | Strategic Income | |
Undistributed ordinary income — net | | $ | 1,152,716 | | | $ | 10,774,405 | | | $ | 4,809,614 | | | $ | 32,488,874 | |
Undistributed long-term capital gains | | | — | | | | — | | | | 130,341 | | | | — | |
Total undistributed earnings | | $ | 1,152,716 | | | $ | 10,774,405 | | | $ | 4,939,955 | | | $ | 32,488,874 | |
Capital loss carryforwards:(1) (2) | | | | | | | | | | | | | | | | |
Expiring 2018 | | | — | | | | (22,550,107 | ) | | | — | | | | — | |
Perpetual Short-Term | | | (71,097 | ) | | | — | | | | — | | | | (695,819,431 | ) |
Perpetual Long-Term | | | — | | | | — | | | | — | | | | (300,996,024 | ) |
Total capital loss carryforwards | | $ | (71,097 | ) | | $ | (22,550,107 | ) | | $ | — | | | $ | (996,815,455 | ) |
Timing differences Qualified Late Year Loss Deferral, Straddle Deferral, Dividend and Distribution Payable) | | $ | (3,959,991 | ) | | $ | (6,498,214 | ) | | $ | (18,579,346 | ) | | $ | (735,005,459 | ) |
Unrealized gains (losses) — net | | | 4,832,413 | | | | 15,458,731 | | | | 14,038,006 | | | | (640,826,224 | ) |
Total accumulated earnings (losses) net | | $ | 1,954,041 | | | $ | (2,815,185 | ) | | $ | 398,615 | | | $ | (2,340,158,264 | ) |
| (1) | | With the exception of perpetual capital loss carryforwards, expiration occurs on March 31 of the year indicated. |
| (2) | | The Core Fixed Income Fund utilized $763,493 of capital losses in the current fiscal year. |
149
GOLDMAN SACHS MULTI SECTOR FIXED INCOME FUNDS
Notes to Financial Statements (continued)
March 31, 2016
|
| 7. TAX INFORMATION (continued) |
��
As of March 31, 2016, the Funds’ aggregate security unrealized gains and losses based on cost for U.S. federal income tax purposes were as follows:
| | | | | | | | | | | | | | | | |
| | | Bond | | | Core Fixed Income | | | Global
Income | | | Strategic
Income | |
Tax Cost | | $ | 544,784,632 | | | $ | 990,992,331 | | | $ | 883,211,251 | | | $ | 15,608,463,047 | |
Gross unrealized gain | | | 10,911,376 | | | | 27,355,456 | | | | 27,008,669 | | | | 178,931,577 | |
Gross unrealized loss | | | (6,338,385 | ) | | | (10,548,335 | ) | | | (14,014,514 | ) | | | (661,562,117 | ) |
Net unrealized gains (losses) on securities | | $ | 4,572,991 | | | $ | 16,807,121 | | | $ | 12,994,155 | | | $ | (482,630,540 | ) |
Net unrealized gains (losses) on other investments | | | 259,422 | | | | (1,348,390 | ) | | | 1,043,851 | | | | (158,195,684 | ) |
Net unrealized gains (losses) | | $ | 4,832,413 | | | $ | 15,458,731 | | | $ | 14,038,006 | | | $ | (640,826,224 | ) |
The difference between GAAP-basis and tax-basis unrealized gains (losses) is attributable primarily to wash sales, net mark to market gains/(losses) on regulated futures contracts, foreign currency contracts, and differences related to the tax treatment of inflation protected securities and swap transactions.
In order to present certain components of the Funds’ capital accounts on a tax-basis, certain reclassifications have been recorded to the Funds’ accounts. These reclassifications have no impact on the net asset value of the Funds and result primarily from paydown securities, dividend redesignation, redemptions utilized as distributions, consent fees, material modification of debt securities and inflation protected securities and differences in the tax treatment of swap transactions, foreign currency transactions and underlying fund investments.
| | | | | | | | | | | | | | |
| Fund | | | | Paid-in
Capital | | | Accumulated
Net Realized
Gain (Loss) | | | Undistributed
Net Investment
Income (Loss) | |
Bond | | | | | 393,187 | | | | (4,077,315 | ) | | | 3,684,128 | |
Core Fixed Income | | | | | — | | | | (4,744,215 | ) | | | 4,744,215 | |
Global Income | | | | | — | | | | 8,630,421 | | | | (8,630,421 | ) |
Strategic Income | | | | | — | | | | (234,909,026 | ) | | | 234,909,026 | |
GSAM has reviewed the Funds’ tax positions for all open tax years (the current year and prior three years, as applicable) and has concluded that no provision for income tax is required in the Funds’ financial statements. Such open tax years remain subject to examination and adjustment by tax authorities.
The Funds’ risks include, but are not limited to, the following:
Derivatives Risk — Loss may result from the Funds’ investments in derivative instruments. These instruments may be illiquid, difficult to price and leveraged so that small changes in the value of the underlying instruments may produce disproportionate losses to the Funds. Derivatives are also subject to counterparty risk, which is the risk that the other party in the transaction will not fulfill its contractual obligation. Losses from investments in derivatives can result from a lack of correlation between changes in the value of derivative instruments and the portfolio assets (if any) being hedged.
Foreign Custody Risk — A Fund that invests in foreign securities may hold such securities and cash with foreign banks, agents, and securities depositories appointed by the Fund’s custodian (each a “Foreign Custodian”). Some foreign custodians may be
150
GOLDMAN SACHS MULTI SECTOR FIXED INCOME FUNDS
|
| 8. OTHER RISKS (continued) |
recently organized or new to the foreign custody business. In some countries, Foreign Custodians may be subject to little or no regulatory oversight over, or independent evaluation of, their operations. Further, the laws of certain countries may place limitations on a Fund’s ability to recover its assets if a Foreign Custodian enters bankruptcy.
Large Shareholder Transactions Risk — A Fund may experience adverse effects when certain large shareholders, such as other funds, institutional investors (including those trading by use of non-discretionary mathematical formulas), financial intermediaries (who may make investment decisions on behalf of underlying clients and/or include a Fund in their investment model), individuals, accounts and Goldman Sachs affiliates, purchase or redeem large amounts of shares of a Fund. Such large shareholder redemptions may cause the Fund to sell portfolio securities at times when it would not otherwise do so, which may negatively impact a Fund’s NAV and liquidity. These transactions may also accelerate the realization of taxable income to shareholders if such sales of investments resulted in gains, and may also increase transaction costs. In addition, a large redemption could result in a Fund’s current expenses being allocated over a smaller asset base, leading to an increase in the Fund’s expense ratio. Similarly, large Fund share purchases may adversely affect a Fund’s performance to the extent that the Fund is delayed in investing new cash and is required to maintain a larger cash position than it ordinarily would.
Leverage Risk — Leverage creates exposure to potential gains and losses in excess of the initial amount invested. Borrowings and the use of derivatives may result in leverage and may make the Funds more volatile. When the Funds use leverage, the sum of each Fund’s investment exposure may significantly exceed the amount of assets invested in each Fund, although these exposures may vary over time. Relatively small market movements may result in large changes in the value of a leveraged investment. Each Fund will identify liquid assets on its books or otherwise cover transactions that may give rise to such risk, to the extent required by applicable law. The use of leverage may cause the Funds to liquidate portfolio positions to satisfy their obligations or to meet segregation requirements when it may not be advantageous to do so. The use of leverage by each Fund can substantially increase the adverse impact to which each Fund’s investment portfolio may be subject.
Interest Rate Risk — When interest rates increase, fixed income securities or instruments held by the Fund will generally decline in value. Long-term fixed income securities or instruments will normally have more price volatility because of this risk than short-term fixed income securities or instruments. The risks associated with increasing rates are heightened given that interest rates are near historic lows, but are expected to increase in the future with unpredictable effects on the markets and the Funds’ investments.
Investments in Other Investment Companies — As a shareholder of another investment company, including an exchange-traded fund (“ETF”), a Fund will indirectly bear its proportionate share of any net management fees and other expenses paid by such other investment companies, in addition to the fees and expenses regularly borne by the Fund. ETFs are subject to risks that do not apply to conventional mutual funds, including but not limited to the following: (i) the market price of the ETF’s shares may trade at a premium or a discount to their NAV; and (ii) an active trading market for an ETF’s shares may not develop or be maintained.
Liquidity Risk — The Funds may make investments that are illiquid or that may become less liquid in response to market developments or adverse investor perceptions. Illiquid investments may be more difficult to value. Liquidity risk may also refer to the risk that a Fund will not be able to pay redemption proceeds within the allowable time period because of unusual market conditions, an unusually high volume of redemption requests, or other reasons. To meet redemption requests, a Fund may be forced to sell investments at an unfavorable time and/or under unfavorable conditions. Liquidity risk may be the result of, among other things, the reduced number and capacity of traditional market participants to make a market in fixed income securities or the lack of an active market. The potential for liquidity risk may be magnified by a rising interest rate environment or other circumstances where investor redemptions from fixed income mutual funds may be higher than normal, potentially causing increased supply in the market due to selling activity.
Loan-Related Investments Risk — In addition to risks generally associated with debt investments, loan-related investments such as loan participations and assignments are subject to other risks. Although a loan obligation may be fully collateralized at the time of acquisition, the collateral may decline in value, be relatively illiquid, or lose all or substantially all of its value subsequent to investment. Many loan investments are subject to legal or contractual restrictions on resale and may be relatively illiquid and
151
GOLDMAN SACHS MULTI SECTOR FIXED INCOME FUNDS
Notes to Financial Statements (continued)
March 31, 2016
|
| 8. OTHER RISKS (continued) |
difficult to value. There is less readily available, reliable information about most loan investments than is the case for many other types of securities. Substantial increases in interest rates may cause an increase in loan obligation defaults. With respect to loan participations, the Fund may not always have direct recourse against a borrower if the borrower fails to pay scheduled principal and/or interest; may be subject to greater delays, expenses and risks than if the Fund had purchased a direct obligation of the borrower; and may be regarded as the creditor of the agent lender (rather than the borrower), subjecting the Fund to the creditworthiness of that lender as well. The market for loan obligations may be subject to irregular trading activity, wide bid/ask spreads and extended trade settlement periods. Because transactions in many loans are subject to extended trade settlement periods, the Fund may not receive the proceeds from the sale of a loan for a period after the sale. As a result, sale proceeds related to the sale of loans may not be available to make additional investments or to meet the Fund’s redemption obligations for a period after the sale of the loans, and, as a result, the Fund may have to sell other investments or engage in borrowing transactions, such as borrowing from its credit facility, if necessary to raise cash to meet its obligations.
Senior Loans hold the most senior position in the capital structure of a business entity, and are typically secured with specific collateral, but are nevertheless usually rated below investment grade. Because Second Lien Loans are subordinated or unsecured and thus lower in priority of payment to Senior Loans, they are subject to the additional risk that the cash flow of the borrower and property securing the loan or debt, if any, may be insufficient to meet scheduled payments after giving effect to the senior secured obligations of the borrower. Second Lien Loans generally have greater price volatility than Senior Loans and may be less liquid.
Market and Credit Risks — In the normal course of business, the Funds trade financial instruments and enter into financial transactions where risk of potential loss exists due to changes in the market (market risk). Additionally, the Funds may also be exposed to credit risk in the event that an issuer or guarantor fails to perform or that an institution or entity with which the Funds have unsettled or open transactions defaults.
Investing in foreign markets may involve special risks and considerations not typically associated with investing in the United States. Foreign securities may be subject to risk of loss because of more or less foreign government regulation, less public information and less economic, political and social stability in the countries in which the Funds invest. Loss may also result from the imposition of exchange controls, confiscations and other government restrictions by the United States or other governments, or from problems in registration, settlement or custody. Foreign risk also involves the risk of negative foreign currency rate fluctuations, which may cause the value of securities denominated in such foreign currency (or other instruments through which the Funds have exposure to foreign currencies) to decline in value. Currency exchange rates may fluctuate significantly over short periods of time. To the extent that the Funds also invest in securities of issuers located in emerging markets, these risks may be more pronounced.
Non-Diversification Risk — The Global Income Fund is non-diversified, meaning that it is permitted to invest a larger percentage of its assets in fewer issuers than diversified mutual funds. Thus, a Fund may be more susceptible to adverse developments affecting any single issuer held in its portfolio, and may be more susceptible to greater losses because of these developments.
Portfolio Concentration Risk — As a result of the Global Income Fund’s ability to invest a large percentage of its assets in obligations of issuers within the same country, state, region, currency or economic sector, an adverse economic, business or political development may affect the value of the Fund’s investments more than if its investments were not so concentrated.
Short Position Risk — A Fund may enter into a short position through a futures contract, an option or swap agreement or through short sales of any instrument that a Fund may purchase for investment. Taking short positions involves leverage of a Fund’s assets and presents various risks. If the value of the underlying instrument or market in which a Fund has taken a short position increases, then the Fund will incur a loss equal to the increase in value from the time that the short position was entered into plus any related interest payments or other fees. Taking short positions involves the risk that losses may be disproportionate, may exceed the amount invested, and may be unlimited.
152
GOLDMAN SACHS MULTI SECTOR FIXED INCOME FUNDS
Under the Trust’s organizational documents, its Trustees, officers, employees and agents are indemnified, to the extent permitted by the Act and state law, against certain liabilities that may arise out of performance of their duties to the Funds. Additionally, in the course of business, the Funds enter into contracts that contain a variety of indemnification clauses. The Funds’ maximum exposure under these arrangements is unknown, as this would involve future claims that may be made against the Funds that have not yet occurred. However, GSAM and GSAMI believe the risk of loss under these arrangements to be remote.
Subsequent events after the Statement of Assets and Liabilities date have been evaluated through the date the financial statements were issued. GSAM and GSAMI have concluded that there is no impact requiring adjustment or disclosure in the financial statements.
153
GOLDMAN SACHS MULTI SECTOR FIXED INCOME FUNDS
Notes to Financial Statements (continued)
March 31, 2016
|
| 11. SUMMARY OF SHARE TRANSACTIONS |
Share activity is as follows:
| | | | | | | | | | | | | | | | |
| | | Bond Fund | |
| | | | |
| | | For the Fiscal Year Ended
March 31, 2016 | | | For the Fiscal Year Ended
March 31, 2015 | |
| | | | |
| | | Shares | | | Dollars | | | Shares | | | Dollars | |
| | | | |
| Class A Shares | | | | | | | | | | | | | | | | |
Shares sold | | | 4,993,945 | | | $ | 51,178,185 | | | | 8,072,473 | | | $ | 84,508,818 | |
Reinvestment of distributions | | | 360,014 | | | | 3,676,908 | | | | 165,537 | | | | 1,732,419 | |
Shares converted from Class B(a) | | | — | | | | — | | | | 84,367 | | | | 891,377 | |
Shares redeemed | | | (2,987,560 | ) | | | (30,662,635 | ) | | | (1,406,921 | ) | | | (14,777,926 | ) |
| | | | 2,366,399 | | | | 24,192,458 | | | | 6,915,456 | | | | 72,354,688 | |
| Class B Shares(a) | | | | | | | | | | | | | | | | |
Shares sold | | | — | | | | — | | | | 5,448 | | | | 56,966 | |
Reinvestment of distributions | | | — | | | | — | | | | 1,373 | | | | 14,480 | |
Shares converted to Class A | | | — | | | | — | | | | (84,447 | ) | | | (891,377 | ) |
Shares redeemed | | | — | | | | — | | | | (137,420 | ) | | | (1,450,088 | ) |
| | | | — | | | | — | | | | (215,046 | ) | | | (2,270,019 | ) |
| Class C Shares | | | | | | | | | | | | | | | | |
Shares sold | | | 889,003 | | | | 9,074,268 | | | | 613,552 | | | | 6,445,571 | |
Reinvestment of distributions | | | 25,087 | | | | 255,633 | | | | 21,063 | | | | 220,162 | |
Shares redeemed | | | (366,352 | ) | | | (3,763,207 | ) | | | (203,431 | ) | | | (2,134,205 | ) |
| | | | 547,738 | | | | 5,566,694 | | | | 431,184 | | | | 4,531,528 | |
| Institutional Shares | | | | | | | | | | | | | | | | |
Shares sold | | | 11,979,862 | | | | 122,560,143 | | | | 15,787,785 | | | | 165,285,733 | |
Reinvestment of distributions | | | 879,826 | | | | 8,996,243 | | | | 754,297 | | | | 7,902,566 | |
Shares redeemed | | | (14,599,108 | ) | | | (150,137,633 | ) | | | (7,540,706 | ) | | | (79,458,639 | ) |
| | | | (1,739,420 | ) | | | (18,581,247 | ) | | | 9,001,376 | | | | 93,729,660 | |
| Service Shares | | | | | | | | | | | | | | | | |
Shares sold | | | 108,752 | | | | 1,105,191 | | | | — | | | | — | |
Reinvestment of distributions | | | 133 | | | | 1,367 | | | | 52 | | | | 540 | |
Shares redeemed | | | (1,420 | ) | | | (14,564 | ) | | | — | | | | — | |
| | | | 107,465 | | | | 1,091,994 | | | | 52 | | | | 540 | |
| Class IR Shares | | | | | | | | | | | | | | | | |
Shares sold | | | 2,379,638 | | | | 24,182,232 | | | | 2,043,425 | | | | 21,313,093 | |
Reinvestment of distributions | | | 77,162 | | | | 785,740 | | | | 34,738 | | | | 361,772 | |
Shares redeemed | | | (931,715 | ) | | | (9,519,254 | ) | | | (72,141 | ) | | | (751,307 | ) |
| | | | 1,525,085 | | | | 15,448,718 | | | | 2,006,022 | | | | 20,923,558 | |
| Class R Shares | | | | | | | | | | | | | | | | |
Shares sold | | | 1,020,324 | | | | 10,452,104 | | | | 28,431 | | | | 296,746 | |
Reinvestment of distributions | | | 3,790 | | | | 38,556 | | | | 148 | | | | 1,546 | |
Shares redeemed | | | (158,917 | ) | | | (1,626,756 | ) | | | (6,487 | ) | | | (68,072 | ) |
| | | | 865,197 | | | | 8,863,904 | | | | 22,092 | | | | 230,220 | |
| Class R6 Shares(b) | | | | | | | | | | | | | | | | |
Shares sold | | | 969 | | | | 10,005 | | | | — | | | | — | |
Reinvestment of distributions | | | 28 | | | | 284 | | | | — | | | | — | |
Shares redeemed | | | (1 | ) | | | (5 | ) | | | — | | | | — | |
| | | | 996 | | | | 10,284 | | | | — | | | | — | |
NET INCREASE | | | 3,673,460 | | | $ | 36,592,805 | | | | 18,161,136 | | | $ | 189,500,175 | |
| (a) | | Class B Shares were converted into Class A Shares at the close of business on November 14, 2014. |
| (b) | | Commenced operations on July 31, 2015. |
154
GOLDMAN SACHS MULTI SECTOR FIXED INCOME FUNDS
|
| 11. SUMMARY OF SHARE TRANSACTIONS (continued) |
| | | | | | | | | | | | | | | | |
| | | Core Fixed Income Fund | |
| | | | |
| | | For the Fiscal Year Ended
March 31, 2016 | | | For the Fiscal Year Ended
March 31, 2015 | |
| | | | |
| | | Shares | | | Dollars | | | Shares | | | Dollars | |
| | | | |
| Class A Shares | | | | | | | | | | | | | | | | |
Shares sold | | | 3,252,990 | | | $ | 33,932,511 | | | | 5,099,659 | | | $ | 53,735,846 | |
Reinvestment of distributions | | | 319,873 | | | | 3,342,023 | | | | 287,467 | | | | 3,034,550 | |
Shares converted from Class B(a) | | | — | | | | — | | | | 31,881 | | | | 335,465 | |
Shares redeemed | | | (4,224,084 | ) | | | (44,126,078 | ) | | | (4,191,307 | ) | | | (44,170,106 | ) |
| | | | (651,221 | ) | | | (6,851,544 | ) | | | 1,227,700 | | | | 12,935,755 | |
| Class B Shares(a) | | | | | | | | | | | | | | | | |
Shares sold | | | — | | | | — | | | | 11,588 | | | | 122,357 | |
Reinvestment of distributions | | | — | | | | — | | | | 2,308 | | | | 24,367 | |
Shares converted to Class A | | | — | | | | — | | | | (31,755 | ) | | | (335,465 | ) |
Shares redeemed | | | — | | | | — | | | | (330,928 | ) | | | (3,496,749 | ) |
| | | | — | | | | — | | | | (348,787 | ) | | | (3,685,490 | ) |
| Class C Shares | | | | | | | | | | | | | | | | |
Shares sold | | | 508,257 | | | | 5,332,470 | | | | 438,581 | | | | 4,651,241 | |
Reinvestment of distributions | | | 26,813 | | | | 281,538 | | | | 24,841 | | | | 263,520 | |
Shares redeemed | | | (644,416 | ) | | | (6,758,102 | ) | | | (583,801 | ) | | | (6,182,549 | ) |
| | | | (109,346 | ) | | | (1,144,094 | ) | | | (120,379 | ) | | | (1,267,788 | ) |
| Institutional Shares | | | | | | | | | | | | | | | | |
Shares sold | | | 27,965,702 | | | | 292,874,669 | | | | 14,960,991 | | | | 158,423,574 | |
Reinvestment of distributions | | | 1,953,290 | | | | 20,490,618 | | | | 1,879,885 | | | | 19,917,051 | |
Shares redeemed | | | (34,999,122 | ) | | | (366,124,700 | ) | | | (31,748,821 | ) | | | (335,879,047 | ) |
| | | | (5,080,130 | ) | | | (52,759,413 | ) | | | (14,907,945 | ) | | | (157,538,422 | ) |
| Service Shares | | | | | | | | | | | | | | | | |
Shares sold | | | 33,804 | | | | 354,906 | | | | 64,012 | | | | 677,867 | |
Reinvestment of distributions | | | 2,002 | | | | 21,005 | | | | 1,363 | | | | 14,447 | |
Shares redeemed | | | (62,728 | ) | | | (656,549 | ) | | | (65,443 | ) | | | (690,563 | ) |
| | | | (26,922 | ) | | | (280,638 | ) | | | (68 | ) | | | 1,751 | |
| Class IR Shares | | | | | | | | | | | | | | | | |
Shares sold | | | 81,723 | | | | 853,932 | | | | 389,647 | | | | 4,104,801 | |
Reinvestment of distributions | | | 12,469 | | | | 130,405 | | | | 6,584 | | | | 69,739 | |
Shares redeemed | | | (89,024 | ) | | | (931,375 | ) | | | (53,734 | ) | | | (567,992 | ) |
| | | | 5,168 | | | | 52,962 | | | | 342,497 | | | | 3,606,548 | |
| Class R Shares | | | | | | | | | | | | | | | | |
Shares sold | | | 823,059 | | | | 8,578,041 | | | | 63,511 | | | | 671,812 | |
Reinvestment of distributions | | | 2,748 | | | | 28,803 | | | | 1,328 | | | | 14,053 | |
Shares redeemed | | | (27,806 | ) | | | (290,567 | ) | | | (12,756 | ) | | | (135,021 | ) |
| | | | 798,001 | | | | 8,316,277 | | | | 52,083 | | | | 550,844 | |
| Class R6 Shares(b) | | | | | | | | | | | | | | | | |
Shares sold | | | 5,506,298 | | | | 57,543,009 | | | | — | | | | — | |
Reinvestment of distributions | | | 57,877 | | | | 605,328 | | | | — | | | | — | |
Shares redeemed | | | (165,257 | ) | | | (1,725,988 | ) | | | — | | | | — | |
| | | | 5,398,918 | | | | 56,422,349 | | | | — | | | | — | |
NET INCREASE (DECREASE) | | | 334,468 | | | $ | 3,755,899 | | | | (13,754,899 | ) | | $ | (145,396,802 | ) |
| (a) | | Class B Shares were converted into Class A Shares at the close of business on November 14, 2014. |
| (b) | | Commenced operations on July 31, 2015. |
155
GOLDMAN SACHS MULTI SECTOR FIXED INCOME FUNDS
Notes to Financial Statements (continued)
March 31, 2016
|
| 11. SUMMARY OF SHARE TRANSACTIONS (continued) |
| | | | | | | | | | | | | | | | |
| | | Global Income Fund | |
| | | | |
| | | For the Fiscal Year Ended
March 31, 2016 | | | For the Fiscal Year Ended
March 31, 2015 | |
| | | | |
| | | Shares | | | Dollars | | | Shares | | | Dollars | |
| | | | |
| Class A Shares | | | | | | | | | | | | | | | | |
Shares sold | | | 5,506,569 | | | $ | 67,160,547 | | | | 1,586,338 | | | $ | 20,325,913 | |
Reinvestment of distributions | | | 297,989 | | | | 3,600,719 | | | | 210,095 | | | | 2,675,011 | |
Shares converted from Class B(a) | | | — | | | | — | | | | 18,795 | | | | 243,133 | |
Shares redeemed | | | (1,754,152 | ) | | | (21,744,852 | ) | | | (1,546,288 | ) | | | (19,861,472 | ) |
| | | | 4,050,406 | | | | 49,016,414 | | | | 268,940 | | | | 3,382,585 | |
| Class B Shares(a) | | | | | | | | | | | | | | | | |
Shares sold | | | — | | | | — | | | | 2,457 | | | | 31,682 | |
Reinvestment of distributions | | | — | | | | — | | | | 368 | | | | 4,712 | |
Shares converted to Class A | | | — | | | | — | | | | (18,868 | ) | | | (243,133 | ) |
Shares redeemed | | | — | | | | — | | | | (67,729 | ) | | | (871,960 | ) |
| | | | — | | | | — | | | | (83,772 | ) | | | (1,078,699 | ) |
| Class C Shares | | | | | | | | | | | | | | | | |
Shares sold | | | 650,861 | | | | 7,885,464 | | | | 229,686 | | | | 2,915,333 | |
Reinvestment of distributions | | | 26,894 | | | | 321,133 | | | | 14,547 | | | | 183,561 | |
Shares redeemed | | | (155,922 | ) | | | (1,915,497 | ) | | | (95,731 | ) | | | (1,221,241 | ) |
| | | | 521,833 | | | | 6,291,100 | | | | 148,502 | | | | 1,877,653 | |
| Institutional Shares | | | | | | | | | | | | | | | | |
Shares sold | | | 37,434,632 | | | | 461,794,981 | | | | 16,097,969 | | | | 205,279,334 | |
Reinvestment of distributions | | | 2,863,569 | | | | 34,552,548 | | | | 1,539,528 | | | | 19,582,924 | |
Shares redeemed | | | (22,227,361 | ) | | | (273,644,934 | ) | | | (16,999,841 | ) | | | (217,509,193 | ) |
| | | | 18,070,840 | | | | 222,702,595 | | | | 637,656 | | | | 7,353,065 | |
| Service Shares | | | | | | | | | | | | | | | | |
Shares sold | | | 176,874 | | | | 2,116,062 | | | | 31,658 | | | | 405,008 | |
Reinvestment of distributions | | | 1,567 | | | | 18,859 | | | | 417 | | | | 5,289 | |
Shares redeemed | | | (19,066 | ) | | | (233,220 | ) | | | (22,770 | ) | | | (292,806 | ) |
| | | | 159,375 | | | | 1,901,701 | | | | 9,305 | | | | 117,491 | |
| Class IR Shares | | | | | | | | | | | | | | | | |
Shares sold | | | 2,174,979 | | | | 26,444,885 | | | | 742,176 | | | | 9,540,676 | |
Reinvestment of distributions | | | 65,265 | | | | 786,398 | | | | 23,848 | | | | 301,801 | |
Shares redeemed | | | (461,738 | ) | | | (5,685,730 | ) | | | (18,837 | ) | | | (239,734 | ) |
| | | | 1,778,506 | | | | 21,545,553 | | | | 747,187 | | | | 9,602,743 | |
| Class R6 Shares(b) | | | | | | | | | | | | | | | | |
Shares sold | | | 45,878 | | | | 553,984 | | | | — | | | | — | |
Reinvestment of distributions | | | 114 | | | | 1,379 | | | | — | | | | — | |
Shares redeemed | | | (3,413 | ) | | | (41,274 | ) | | | — | | | | — | |
| | | | 42,579 | | | | 514,089 | | | | — | | | | — | |
NET INCREASE | | | 24,623,539 | | | $ | 301,971,452 | | | | 1,727,818 | | | $ | 21,254,838 | |
| (a) | | Class B Shares were converted into Class A Shares at the close of business on November 14, 2014. |
| (b) | | Commenced operations on July 31, 2015. |
156
GOLDMAN SACHS MULTI SECTOR FIXED INCOME FUNDS
|
| 11. SUMMARY OF SHARE TRANSACTIONS (continued) |
| | | | | | | | | | | | | | | | |
| | | Strategic Income Fund | |
| | | | |
| | | For the Fiscal Year Ended
March 31, 2016 | | | For the Fiscal Year Ended
March 31, 2015 | |
| | | | |
| | | Shares | | | Dollars | | | Shares | | | Dollars | |
| | | | |
| Class A Shares | | | | | | | | | | | | | | | | |
Shares sold | | | 36,868,744 | | | $ | 363,552,779 | | | | 139,942,256 | | | $ | 1,468,550,175 | |
Reinvestment of distributions | | | 7,904,030 | | | | 77,435,551 | | | | 8,316,052 | | | | 86,539,197 | |
Shares redeemed | | | (160,983,204 | ) | | | (1,582,299,263 | ) | | | (232,189,012 | ) | | | (2,424,542,617 | ) |
| | | | (116,210,430 | ) | | | (1,141,310,933 | ) | | | (83,930,704 | ) | | | (869,453,245 | ) |
| Class C Shares | | | | | | | | | | | | | | | | |
Shares sold | | | 7,231,309 | | | | 71,646,822 | | | | 41,310,685 | | | | 434,597,330 | |
Reinvestment of distributions | | | 2,432,712 | | | | 23,792,801 | | | | 1,770,115 | | | | 18,371,732 | |
Shares redeemed | | | (43,166,049 | ) | | | (425,167,852 | ) | | | (29,695,594 | ) | | | (307,734,078 | ) |
| | | | (33,502,028 | ) | | | (329,728,229 | ) | | | 13,385,206 | | | | 145,234,984 | |
| Institutional Shares | | | | | | | | | | | | | | | | |
Shares sold | | | 314,004,126 | | | | 3,101,913,662 | | | | 1,075,029,579 | | | | 11,278,202,983 | |
Reinvestment of distributions | | | 55,944,745 | | | | 547,783,055 | | | | 46,283,903 | | | | 480,503,449 | |
Shares redeemed | | | (1,030,340,783 | ) | | | (10,109,131,076 | ) | | | (718,001,633 | ) | | | (7,425,931,157 | ) |
| | | | (660,391,912 | ) | | | (6,459,434,359 | ) | | | 403,311,849 | | | | 4,332,775,275 | |
| Class IR Shares | | | | | | | | | | | | | | | | |
Shares sold | | | 11,204,074 | | | | 110,163,385 | | | | 40,287,154 | | | | 423,066,106 | |
Reinvestment of distributions | | | 2,138,511 | | | | 20,963,327 | | | | 2,380,769 | | | | 24,732,972 | |
Shares redeemed | | | (45,981,957 | ) | | | (453,121,610 | ) | | | (41,947,589 | ) | | | (433,303,517 | ) |
| | | | (32,639,372 | ) | | | (321,994,898 | ) | | | 720,334 | | | | 14,495,561 | |
| Class R Shares | | | | | | | | | | | | | | | | |
Shares sold | | | 570,892 | | | | 5,621,320 | | | | 578,286 | | | | 6,037,223 | |
Reinvestment of distributions | | | 27,401 | | | | 267,225 | | | | 14,134 | | | | 146,575 | |
Shares redeemed | | | (535,313 | ) | | | (5,192,301 | ) | | | (168,664 | ) | | | (1,756,353 | ) |
| | | | 62,980 | | | | 696,244 | | | | 423,756 | | | | 4,427,445 | |
| Class R6 Shares(a) | | | | | | | | | | | | | | | | |
Shares sold | | | 2,484,802 | | | | 24,539,088 | | | | — | | | | — | |
Reinvestment of distributions | | | 53,301 | | | | 510,014 | | | | — | | | | — | |
Shares redeemed | | | (443,633 | ) | | | (4,212,535 | ) | | | — | | | | — | |
| | | | 2,094,470 | | | | 20,836,567 | | | | — | | | | — | |
NET INCREASE (DECREASE) | | | (840,586,292 | ) | | $ | (8,230,935,608 | ) | | | 333,910,441 | | | $ | 3,627,480,020 | |
| (a) | | Commenced operations on July 31, 2015. |
157
Report of Independent Registered Public
Accounting Firm
To the Board of Trustees of Goldman Sachs Trust and Shareholders of
Goldman Sachs Multi-Sector Fixed Income Funds:
In our opinion, the accompanying statements of assets and liabilities, including the schedules of investments, and the related statements of operations and of changes in net assets and the financial highlights present fairly, in all material respects, the financial position of the Goldman Sachs Core Fixed Income Fund, Goldman Sachs Bond Fund, Goldman Sachs Strategic Income Fund, and the Goldman Sachs Global Income Fund (collectively the “Funds”), funds of Goldman Sachs Trust, at March 31, 2016, and the results of each of their operations, the changes in each of their net assets and the financial highlights for each of the periods indicated, in conformity with accounting principles generally accepted in the United States of America. These financial statements and financial highlights (hereafter referred to as “financial statements”) are the responsibility of the Funds’ management. Our responsibility is to express an opinion on these financial statements based on our audits. We conducted our audits of these financial statements in accordance with the standards of the Public Company Accounting Oversight Board (United States). Those standards require that we plan and perform the audit to obtain reasonable assurance about whether the financial statements are free of material misstatement. An audit includes examining, on a test basis, evidence supporting the amounts and disclosures in the financial statements, assessing the accounting principles used and significant estimates made by management, and evaluating the overall financial statement presentation. We believe that our audits, which included confirmation of securities at March 31, 2016 by correspondence with the custodian, brokers, transfer agent of the underlying fund and the application of alternative auditing procedures where confirmation of securities purchased had not been received, provide a reasonable basis for the opinion expressed above.
PricewaterhouseCoopers LLP
Boston, Massachusetts
May 26, 2016
158
GOLDMAN SACHS MULTI SECTOR FIXED INCOME FUNDS
Fund Expenses — Six Month Period Ended March 31, 2016 (Unaudited)
As a shareholder of Class A, Class C, Institutional, Service, Class IR, Class R or Class R6 Shares of a Fund, you incur two types of costs: (1) transaction costs, including sales charges on purchase payments (with respect to Class A Shares), contingent deferred sales charges on redemptions (with respect to Class C Shares), and (2) ongoing costs, including management fees; distribution and service (12b-1) fees (with respect to Class A and Class R Shares); and other Fund expenses. This Example is intended to help you understand your ongoing costs (in dollars) of investing in Class A, Class C, Institutional, Service, Class IR, Class R or Class R6 Shares of the Funds and to compare these costs with the ongoing costs of investing in other mutual funds.
The Example is based on an investment of $1,000 invested at the beginning of the period and held for the entire period from October 1, 2015 through March 31, 2016, which represents a period of 183 days of a 366 day year.
Actual Expenses — The first line under each share class in the table below provides information about actual account values and actual expenses. You may use the information in this line, together with the amount you invested, to estimate the expenses that you paid over the period. Simply divide your account value by $1,000 (for example, an $8,600 account value divided by $1,000=8.6), then multiply the result by the number in the first line under the heading entitled “Expenses Paid” to estimate the expenses you paid on your account during this period.
Hypothetical Example for Comparison Purposes — The second line under each share class in the table below provides information about hypothetical account values and hypothetical expenses based on the Funds’ actual net expense ratios and an assumed rate of return of 5% per year before expenses, which is not the Funds’ actual return. The hypothetical account values and expenses may not be used to estimate the actual ending account balance or expenses you paid for the period. You may use this information to compare the ongoing costs of investing in the Funds and other funds. To do so, compare this 5% hypothetical example with the 5% hypothetical examples that appear in the shareholder reports of the other funds.
Please note that the expenses shown in the table are meant to highlight your ongoing costs only and do not reflect any transactional costs, such as sales charges, redemption fees, or exchange fees. Therefore, the second line of the table is useful in comparing ongoing costs only, and will not help you determine the relative total costs of owning different funds. In addition, if these transactional costs were included, your costs would have been higher.
| | | | | | | | | | | | | | | | | | | | | | | | | | | | | | | | | | | | | | | | | | | | | | | | |
| | | Bond Fund | | | Core Fixed Income Fund | | | Global Income Fund | | | Strategic Income Fund | |
| Share Class | | Beginning
Account
Value
10/1/15 | | | Ending
Account
Value
3/31/16 | | | Expenses
Paid for the
6 months ended
3/31/16* | | | Beginning
Account
Value
10/1/15 | | | Ending
Account
Value
3/31/16 | | | Expenses
Paid for the
6 months ended
3/31/16* | | | Beginning
Account
Value
10/1/15 | | | Ending
Account
Value
3/31/16 | | | Expenses
Paid for the
6 months ended
3/31/16* | | | Beginning
Account
Value
10/1/15 | | | Ending
Account
Value
3/31/16 | | | Expenses
Paid for the
6 months ended
3/31/16* | |
| Class A | | | | | | | | | | | | | | | | | | | | | | | | | | | | | | | | | | | | | | | | | | | | | | | | |
Actual | | $ | 1,000.00 | | | $ | 1,019.20 | | | $ | 3.94 | | | $ | 1,000.00 | | | $ | 1,019.70 | | | $ | 3.94 | | | $ | 1,000.00 | | | $ | 1,025.80 | | | $ | 5.22 | | | $ | 1,000.00 | | | $ | 978.60 | | | $ | 4.45 | |
Hypothetical 5% return | | | 1,000.00 | | | | 1,021.10 | + | | | 3.94 | | | | 1,000.00 | | | | 1,021.10 | + | | | 3.94 | | | | 1,000.00 | | | | 1,019.85 | + | | | 5.20 | | | | 1,000.00 | | | | 1,020.50 | + | | | 4.55 | |
| Class C | | | | | | | | | | | | | | | | | | | | | | | | | | | | | | | | | | | | | | | | | | | | | | | | |
Actual | | | 1,000.00 | | | | 1,015.40 | | | | 7.71 | | | | 1,000.00 | | | | 1,016.80 | | | | 7.71 | | | | 1,000.00 | | | | 1,022.10 | | | | 8.90 | | | | 1,000.00 | | | | 975.00 | | | | 8.10 | |
Hypothetical 5% return | | | 1,000.00 | | | | 1,017.35 | + | | | 7.72 | | | | 1,000.00 | | | | 1,017.35 | + | | | 7.72 | | | | 1,000.00 | | | | 1,016.20 | + | | | 8.87 | | | | 1,000.00 | | | | 1,016.80 | + | | | 8.27 | |
| Institutional | | | | | | | | | | | | | | | | | | | | | | | | | | | | | | | | | | | | | | | | | | | | | | | | |
Actual | | | 1,000.00 | | | | 1,020.90 | | | | 2.22 | | | | 1,000.00 | | | | 1,021.40 | | | | 2.22 | | | | 1,000.00 | | | | 1,027.50 | | | | 3.50 | | | | 1,000.00 | | | | 980.30 | | | | 2.77 | |
Hypothetical 5% return | | | 1,000.00 | | | | 1,022.80 | + | | | 2.23 | | | | 1,000.00 | | | | 1,022.80 | + | | | 2.23 | | | | 1,000.00 | | | | 1,021.55 | + | | | 3.49 | | | | 1,000.00 | | | | 1,022.20 | + | | | 2.83 | |
| Service | | | | | | | | | | | | | | | | | | | | | | | | | | | | | | | | | | | | | | | | | | | | | | | | |
Actual | | | 1,000.00 | | | | 1,018.60 | | | | 4.74 | | | | 1,000.00 | | | | 1,018.90 | | | | 4.74 | | | | 1,000.00 | | | | 1,022.30 | | | | 5.92 | | | | N/A | | | | N/A | | | | N/A | |
Hypothetical 5% return | | | 1,000.00 | | | | 1,020.30 | + | | | 4.75 | | | | 1,000.00 | | | | 1,020.30 | + | | | 4.75 | | | | 1,000.00 | | | | 1,019.15 | + | | | 5.91 | | | | N/A | | | | N/A | + | | | N/A | |
| Class IR | | | | | | | | | | | | | | | | | | | | | | | | | | | | | | | | | | | | | | | | | | | | | | | | |
Actual | | | 1,000.00 | | | | 1,021.50 | | | | 2.68 | | | | 1,000.00 | | | | 1,021.00 | | | | 2.68 | | | | 1,000.00 | | | | 1,027.50 | | | | 3.95 | | | | 1,000.00 | | | | 979.90 | | | | 3.22 | |
Hypothetical 5% return | | | 1,000.00 | | | | 1,022.35 | + | | | 2.68 | | | | 1,000.00 | | | | 1,022.35 | + | | | 2.68 | | | | 1,000.00 | | | | 1,021.10 | + | | | 3.94 | | | | 1,000.00 | | | | 1,021.75 | + | | | 3.29 | |
| Class R | | | | | | | | | | | | | | | | | | | | | | | | | | | | | | | | | | | | | | | | | | | | | | | | |
Actual | | | 1,000.00 | | | | 1,018.00 | | | | 5.20 | | | | 1,000.00 | | | | 1,018.50 | | | | 5.20 | | | | N/A | | | | N/A | | | | N/A | | | | 1,000.00 | | | | 977.40 | | | | 5.69 | |
Hypothetical 5% return | | | 1,000.00 | | | | 1,019.85 | + | | | 5.20 | | | | 1,000.00 | | | | 1,019.85 | + | | | 5.20 | | | | N/A | | | | N/A | | | | N/A | | | | 1,000.00 | | | | 1,019.25 | + | | | 5.81 | |
| Class R6 | | | | | | | | | | | | | | | | | | | | | | | | | | | | | | | | | | | | | | | | | | | | | | | | |
Actual | | | 1,000.00 | | | | 1,020.70 | | | | 2.37 | | | | 1,000.00 | | | | 1,020.50 | | | | 2.15 | | | | 1,000.00 | | | | 1,027.50 | | | | 3.45 | | | | 1,000.00 | | | | 980.40 | | | | 2.62 | |
Hypothetical 5% return | | | 1,000.00 | | | | 1,022.65 | + | | | 2.38 | | | | 1,000.00 | | | | 1,022.87 | + | | | 2.15 | | | | 1,000.00 | | | | 1,021.60 | + | | | 3.44 | | | | 1,000.00 | | | | 1,022.35 | + | | | 2.68 | |
| * | | Expenses for each share class are calculated using each Fund’s annualized net expense ratio for each class, which represents the ongoing expenses as a percentage of net assets for the six months ended March 31, 2016. Expenses are calculated by multiplying the annualized net expense ratio by the average account value for the period; then multiplying the result by the number of days in the most recent fiscal half year; and then dividing that result by the number of days in the fiscal year. The annualized net expense ratios for the period were as follows: |
| | | | | | | | | | | | | | | | | | | | | | | | | | | | |
| Fund | | Class A | | | Class C | | | Institutional | | | Service | | | Class IR | | | Class R | | | Class R6 | |
Bond | | | 0.78 | % | | | 1.53 | % | | | 0.44 | % | | | 0.94 | % | | | 0.53 | % | | | 1.03 | % | | | 0.47 | % |
Core Fixed Income | | | 0.78 | | | | 1.53 | | | | 0.44 | | | | 0.94 | | | | 0.53 | | | | 1.03 | | | | 0.43 | |
Global Income | | | 1.03 | | | | 1.76 | | | | 0.69 | | | | 1.17 | | | | 0.78 | | | | N/A | | | | 0.68 | |
Strategic Income | | | 0.90 | | | | 1.64 | | | | 0.56 | | | | N/A | | | | 0.65 | | | | 1.15 | | | | 0.53 | |
| + | | Hypothetical expenses are based on each Fund’s actual annualized net expense ratios and an assumed rate of return of 5% per year before expenses. |
159
GOLDMAN SACHS MULTI SECTOR FIXED INCOME FUNDS
Trustees and Officers (Unaudited)
Independent Trustees
| | | | | | | | | | |
Name,
Address and Age1 | | Position(s) Held with the Trust | | Term of Office and
Length of
Time Served2 | | Principal Occupation(s) During Past 5 Years | | Number of
Portfolios in
Fund Complex
Overseen by
Trustee3 | | Other Directorships Held by Trustee4 |
Ashok N. Bakhru Age: 74 | | Chairman of the Board of Trustees | | Since 1996 (Trustee since 1991) | | Mr. Bakhru is retired. He was formerly Director, Apollo Investment Corporation (a business development company) (2008-2013); President, ABN Associates (a management and financial consulting firm) (1994-1996 and 1998-2012); Trustee, Scholarship America (1998-2005); Trustee, Institute for Higher Education Policy (2003-2008); Director, Private Equity Investors — III and IV (1998-2007), and Equity-Linked Investors II (April 2002-2007). Chairman of the Board of Trustees — Goldman Sachs Trust; Goldman Sachs Variable Insurance Trust; Goldman Sachs Trust II; Goldman Sachs BDC, Inc.; Goldman Sachs MLP Income Opportunities Fund; Goldman Sachs MLP and Energy Renaissance Fund; and Goldman Sachs ETF Trust. | | 142 | | None |
Kathryn A. Cassidy Age: 62 | | Trustee | | Since 2015 | | Ms. Cassidy is retired. Formerly, she was Advisor to the Chairman (May 2014-December 2014); and Senior Vice President and Treasurer (2008-2014), General Electric Company & General Electric Capital Corporation (technology and financial services companies). Trustee — Goldman Sachs Trust and Goldman Sachs Variable Insurance Trust. | | 109 | | None |
Diana M. Daniels Age: 66 | | Trustee | | Since 2007 | | Ms. Daniels is retired. Formerly, she was Vice President, General Counsel and Secretary, The Washington Post Company (1991-2006). Ms. Daniels is a Trustee Emeritus and serves as a Presidential Councillor of Cornell University (2013-Present); former Member of the Legal Advisory Board, New York Stock Exchange (2003-2006) and of the Corporate Advisory Board, Standish Mellon Management Advisors (2006-2007). Trustee — Goldman Sachs Trust and Goldman Sachs Variable Insurance Trust. | | 109 | | None |
Herbert J. Markley Age: 65 | | Trustee | | Since 2013 | | Mr. Markley is retired. Formerly, he was Executive Vice President, Deere & Company (an agricultural and construction equipment manufacturer) (2007-2009); and President, Agricultural Division, Deere & Company (2001-2007). Previously, Mr. Markley served as an Advisory Board Member of Goldman Sachs Trust and Goldman Sachs Variable Insurance Trust (June 2013-October 2013). Trustee — Goldman Sachs Trust and Goldman Sachs Variable Insurance Trust. | | 109 | | None |
Jessica Palmer Age: 67 | | Trustee | | Since 2007 | | Ms. Palmer is retired. She is Director, Emerson Center for the Arts and Culture (2011-Present); and was formerly a Consultant, Citigroup Human Resources Department (2007-2008); Managing Director, Citigroup Corporate and Investment Banking (previously, Salomon Smith Barney/Salomon Brothers) (1984-2006). Ms. Palmer was a Member of the Board of Trustees of Indian Mountain School (private elementary and secondary school) (2004-2009). Trustee — Goldman Sachs Trust and Goldman Sachs Variable Insurance Trust. | | 109 | | None |
| | | | | | | | | | |
160
GOLDMAN SACHS MULTI SECTOR FIXED INCOME FUNDS
Trustees and Officers (Unaudited) (continued)
Independent Trustees
| | | | | | | | | | |
Name,
Address and Age1 | | Position(s) Held with the Trust | | Term of Office and
Length of
Time Served2 | | Principal Occupation(s) During Past 5 Years | | Number of
Portfolios in
Fund Complex
Overseen by
Trustee3 | | Other Directorships Held by Trustee4 |
Roy W. Templin Age: 55 | | Trustee | | Since 2013 | | Mr. Templin is retired. He recently served as Chairman of the Board of Directors, Con-Way Incorporated (a transportation, logistics and supply chain management service company) (2014-2015) and was formerly Executive Vice President and Chief Financial Officer, Whirlpool Corporation (an appliance manufacturer and marketer) (2004-2012). Previously, Mr. Templin served as an Advisory Board Member of Goldman Sachs Trust and Goldman Sachs Variable Insurance Trust (June 2013-October 2013). Trustee — Goldman Sachs Trust and Goldman Sachs Variable Insurance Trust. | | 109 | | None |
Gregory G. Weaver Age: 64 | | Trustee | | Since 2015 | | Mr. Weaver is retired. He is Director, Verizon Communications Inc. (2015-Present); and was formerly Chairman and Chief Executive Officer, Deloitte & Touche LLP (a professional services firm) (2001-2005 and 2012-2014); and Member of the Board of Directors, Deloitte & Touche LLP (2006-2012). Trustee — Goldman Sachs Trust and Goldman Sachs Variable Insurance Trust. | | 109 | | Verizon Communications Inc. |
| | | | | | | | | | |
161
GOLDMAN SACHS MULTI SECTOR FIXED INCOME FUNDS
Trustees and Officers (Unaudited) (continued)
Interested Trustees*
| | | | | | | | | | |
Name,
Address and Age1 | | Position(s) Held with the Trust | | Term of Office and
Length of
Time Served2 | | Principal Occupation(s) During Past 5 Years | | Number of
Portfolios in
Fund Complex
Overseen by
Trustee3 | | Other Directorships Held by Trustee4 |
James A. McNamara Age: 53 | | President and Trustee | | Since 2007 | | Managing Director, Goldman Sachs (December 1998-Present); Director of Institutional Fund Sales, GSAM (April 1998-December 2000); and Senior Vice President and Manager, Dreyfus Institutional Service Corporation (January 1993- April 1998). President and Trustee — Goldman Sachs Trust; Goldman Sachs Variable Insurance Trust; Goldman Sachs Trust II; Goldman Sachs MLP Income Opportunities Fund; Goldman Sachs MLP and Energy Renaissance Fund; and Goldman Sachs ETF Trust. | | 141 | | None |
Alan A. Shuch Age: 66 | | Trustee | | Since 1990 | | Advisory Director — GSAM (May 1999-Present); Consultant to GSAM (December 1994-May 1999); and Limited Partner, Goldman Sachs (December 1994-May 1999). Trustee — Goldman Sachs Trust and Goldman Sachs Variable Insurance Trust. | | 109 | | None |
| | | | | | | | | | |
| * | | These persons are considered to be “Interested Trustees” because they hold positions with Goldman Sachs and own securities issued by The Goldman Sachs Group, Inc. Each Interested Trustee holds comparable positions with certain other companies of which Goldman Sachs, GSAM or an affiliate thereof is the investment adviser, administrator and/or distributor. |
| 1 | | Each Trustee may be contacted by writing to the Trustee, c/o Goldman Sachs, 200 West Street, New York, New York, 10282, Attn: Caroline Kraus. Information is provided as of March 31, 2016. |
| 2 | | Each Trustee holds office for an indefinite term until the earliest of: (a) the election of his or her successor; (b) the date the Trustee resigns or is removed by the Board of Trustees or shareholders, in accordance with the Trust’s Declaration of Trust; (c) December 31st of the year in which the Trustee turns 74 years of age, subject to waiver by a majority of the Trustees (in accordance with the current resolutions of the Board of Trustees, which may be changed by the Trustees without shareholder vote); or (d) the termination of the Trust. |
| 3 | | The Goldman Sachs Fund Complex includes certain other companies listed above for each respective Trustee. As of March 31, 2016, Goldman Sachs Trust consisted of 100 portfolios (95 of which offered shares to the public); Goldman Sachs Variable Insurance Trust consisted of 14 portfolios; Goldman Sachs Trust II consisted of 16 portfolios (seven of which offered shares to the public); Goldman Sachs BDC, Inc., Goldman Sachs MLP Income Opportunities Fund, and Goldman Sachs MLP and Energy Renaissance Fund each consisted of one portfolio; and Goldman Sachs ETF Trust consisted of 14 portfolios (five of which offered shares to the public). |
| 4 | | This column includes only directorships of companies required to report to the Securities and Exchange Commission under the Securities Exchange Act of 1934 (i.e., “public companies”) or other investment companies registered under the Act. |
Additional information about the Trustees is available in the Funds’ Statement of Additional Information, which can be obtained from Goldman Sachs free of charge by calling this toll-free number (in the United States of America): 1-800-526-7384.
162
GOLDMAN SACHS MULTI SECTOR FIXED INCOME FUNDS
Trustees and Officers (Unaudited) (continued)
Officers of the Trust*
| | | | | | |
| Name, Address and Age1 | | Position(s) Held With the Trust | | Term of
Office and
Length of
Time Served2 | | Principal Occupation(s) During Past 5 Years |
James A. McNamara 200 West Street New York, NY 10282 Age: 53 | | Trustee and President | | Since 2007 | | Managing Director, Goldman Sachs (December 1998-Present); Director of Institutional Fund Sales, GSAM (April 1998-December 2000); and Senior Vice President and Manager, Dreyfus Institutional Service Corporation (January 1993-April 1998). President and Trustee — Goldman Sachs Trust; Goldman Sachs Variable Insurance Trust; Goldman Sachs Trust II; Goldman Sachs MLP Income Opportunities Fund; Goldman Sachs MLP and Energy Renaissance Fund; and Goldman Sachs ETF Trust. |
Caroline L. Kraus 200 West Street New York, NY 10282 Age: 38 | | Secretary | | Since 2012 | | Managing Director, Goldman Sachs (January 2016-Present); Vice President, Goldman Sachs (August 2006-December 2015); Associate General Counsel, Goldman Sachs (2012-Present); Assistant General Counsel, Goldman Sachs (August 2006-December 2011); and Associate, Weil, Gotshal & Manges, LLP (2002-2006). Secretary — Goldman Sachs Trust (previously Assistant Secretary (2012)); Goldman Sachs Variable Insurance Trust (previously Assistant Secretary (2012)); Goldman Sachs Trust II; Goldman Sachs BDC, Inc.; Goldman Sachs MLP Income Opportunities Fund; Goldman Sachs MLP and Energy Renaissance Fund; and Goldman Sachs ETF Trust. |
Scott M. McHugh 200 West Street New York, NY 10282 Age: 44 | | Treasurer, Senior Vice President and Principal Financial Officer | | Since 2009 (Principal Financial Officer since 2013) | | Managing Director, Goldman Sachs (January 2016-Present); Vice President, Goldman Sachs (February 2007-December 2015); Assistant Treasurer of certain mutual funds administered by DWS Scudder (2005-2007); and Director (2005-2007), Vice President (2000-2005), and Assistant Vice President (1998-2000), Deutsche Asset Management or its predecessor (1998-2007). Treasurer, Senior Vice President and Principal Financial Officer — Goldman Sachs Trust; Goldman Sachs Variable Insurance Trust; Goldman Sachs Trust II; Goldman Sachs MLP Income Opportunities Fund; Goldman Sachs MLP and Energy Renaissance Fund; and Goldman Sachs ETF Trust. |
| | | | | | |
| * | | Represents a partial list of officers of the Trust. Additional information about all the officers is available in the Funds’ Statement of Additional Information, which can be obtained from Goldman Sachs free of charge by calling this toll-free number (in the United States): 1-800-526-7384. |
| 1 | | Information is provided as of March 31, 2016. |
| 2 | | Officers hold office at the pleasure of the Board of Trustees or until their successors are duly elected and qualified. Each officer holds comparable positions with certain other companies of which Goldman Sachs, GSAM or an affiliate thereof is the investment adviser, administrator and/or distributor. |
163
GOLDMAN SACHS MULTI SECTOR FIXED INCOME FUNDS
Multi Sector Fixed Income Funds Tax Information (Unaudited)
For the fiscal year ended March 31, 2016, 0.99% of the dividends paid from net investment company taxable income by the Strategic Income Fund qualify for the dividends received deduction available to corporations.
Pursuant to Section 852 of the Internal Revenue Code, the Bond and Global Income Funds designate $37,564 and $654,973, respectively, or, if different, the maximum amount allowable, as capital gain dividends paid during the year ended March 31, 2016.
164
FUNDS PROFILE
Goldman Sachs Funds

Goldman Sachs is a premier financial services firm, known since 1869 for creating thoughtful and customized investment solutions in complex global markets.
Today, the Investment Management Division of Goldman Sachs serves a diverse set of clients worldwide, including private institutions, public entities and individuals. With approximately $1.11 trillion in assets under supervision as of March 31, 2016, Goldman Sachs Asset Management (“GSAM”) has portfolio management teams located around the world and our investment professionals bring firsthand knowledge of local markets to every investment decision. Assets under supervision includes assets under management and other client assets for which Goldman Sachs does not have full discretion. GSAM leverages the resources of Goldman, Sachs & Co. subject to legal, internal and regulatory restrictions.

Money Market1
Financial Square FundsSM
| n | | Financial Square Tax-Exempt Funds |
| n | | Financial Square Treasury Solutions Fund2 |
| n | | Financial Square Government Fund |
| n | | Financial Square Money Market Fund |
| n | | Financial Square Prime Obligations Fund |
| n | | Financial Square Treasury Instruments Fund |
| n | | Financial Square Treasury Obligations Fund |
| n | | Financial Square Federal Instruments Fund |
| n | | Financial Square Tax-Exempt Money Market Fund |
Investor FundsSM
| n | | Investor Money Market Fund |
| n | | Investor Tax-Exempt Money Market Fund3 |
Fixed Income
Short Duration and Government
| n | | High Quality Floating Rate Fund |
| n | | Limited Maturity Obligations Fund |
| n | | Short Duration Government Fund |
| n | | Short Duration Income Fund |
| n | | Inflation Protected Securities Fund |
Multi-Sector
Municipal and Tax-Free
| n | | High Yield Municipal Fund |
| n | | Dynamic Municipal Income Fund |
| n | | Short Duration Tax-Free Fund |
Single Sector
| n | | Investment Grade Credit Fund |
| n | | High Yield Floating Rate Fund |
| n | | Emerging Markets Debt Fund |
| n | | Local Emerging Markets Debt Fund |
| n | | Dynamic Emerging Markets Debt Fund |
Fixed Income Alternatives
| n | | Long Short Credit Strategies Fund |
| n | | Fixed Income Macro Strategies Fund |
Fundamental Equity
| n | | Small/Mid Cap Value Fund |
| n | | Small/Mid Cap Growth Fund |
| n | | Flexible Cap Growth Fund |
| n | | Concentrated Growth Fund |
| n | | Technology Opportunities Fund4 |
| n | | Growth Opportunities Fund |
| n | | Rising Dividend Growth Fund |
| n | | Dynamic U.S. Equity Fund |
Tax-Advantaged Equity
| n | | U.S. Tax-Managed Equity Fund |
| n | | International Tax-Managed Equity Fund |
| n | | U.S. Equity Dividend and Premium Fund |
| n | | International Equity Dividend and Premium Fund |
Equity Insights
| n | | Small Cap Equity Insights Fund |
| n | | U.S. Equity Insights Fund |
| n | | Small Cap Growth Insights Fund |
| n | | Large Cap Growth Insights Fund |
| n | | Large Cap Value Insights Fund |
| n | | Small Cap Value Insights Fund |
| n | | International Small Cap Insights Fund5 |
| n | | International Equity Insights Fund |
| n | | Emerging Markets Equity Insights Fund |
Fundamental Equity International
| n | | Strategic International Equity Fund |
| n | | Focused International Equity Fund |
| n | | Emerging Markets Equity Fund6 |
Select Satellite7
| n | | Real Estate Securities Fund |
| n | | International Real Estate Securities Fund |
| n | | Commodity Strategy Fund |
| n | | Global Real Estate Securities Fund |
| n | | Dynamic Commodity Strategy Fund |
| n | | Dynamic Allocation Fund |
| n | | Absolute Return Tracker Fund |
| n | | Managed Futures Strategy Fund |
| n | | MLP Energy Infrastructure Fund |
| n | | Multi-Manager Alternatives Fund |
| n | | Multi-Asset Real Return Fund |
| n | | Absolute Return Multi-Asset Fund |
Total Portfolio Solutions7
| n | | Global Managed Beta Fund |
| n | | Multi-Manager Non-Core Fixed Income Fund |
| n | | Multi-Manager U.S. Dynamic Equity Fund |
| n | | Multi-Manager Global Equity Fund |
| n | | Multi-Manager International Equity Fund |
| n | | Multi-Manager U.S. Small Cap Equity Fund |
| n | | Tactical Tilt Implementation Fund |
| n | | Balanced Strategy Portfolio |
| n | | Multi-Manager Real Assets Strategy Fund |
| n | | Growth and Income Strategy Portfolio |
| n | | Growth Strategy Portfolio |
| n | | Equity Growth Strategy Portfolio |
| n | | Satellite Strategies Portfolio |
| n | | Enhanced Dividend Global Equity Portfolio |
| n | | Tax Advantaged Global Equity Portfolio |
| 1 | | An investment in a money market portfolio is not insured or guaranteed by the Federal Deposit Insurance Corporation or any other government agency. Although a money market portfolio seeks to preserve the value of an investment at $1.00 per share, it is possible to lose money by investing in a money market portfolio. The Fund’s sponsor has no legal obligation to provide financial support to a money market portfolio, and you should not expect that the sponsor will provide financial support to the money market portfolio at any time. |
| 2 | | Effective on September 30, 2015, the Goldman Sachs Financial Square Federal Fund was renamed the Goldman Sachs Financial Square Treasury Solutions Fund. |
| 3 | | Effective on March 31, 2016, the Goldman Sachs Financial Square Tax-Free Money Market Fund was renamed the Goldman Sachs Investor Tax-Exempt Money Market Fund. |
| 4 | | Effective on July 31, 2015, the Goldman Sachs Technology Tollkeeper Fund was renamed the Goldman Sachs Technology Opportunities Fund. |
| 5 | | Effective at the close of business on February 5, 2016, the Goldman Sachs International Small Cap Fund was reorganized with and into the Goldman Sachs International Small Cap Insights Fund. |
| 6 | | Effective at the close of business on October 23, 2015, the Goldman Sachs BRIC Fund (Brazil, Russia, India, China) was reorganized with and into the Goldman Sachs Emerging Markets Equity Fund. |
| 7 | | Individual Funds within the Total Portfolio Solutions and Select Satellite categories will have various placement on the risk/return spectrum and may have greater or lesser risk than that indicated by the placement of the general Total Portfolio Solutions or Select Satellite category. |
| * | | This list covers open-end funds only. Please visit our website at www.GSAMFUNDS.com to learn about our closed-end funds and exchange-traded funds. |
| | |
TRUSTEES Ashok N. Bakhru, Chairman Kathryn A. Cassidy Diana M. Daniels Herbert J. Markley James A. McNamara Jessica Palmer Alan A. Shuch Roy W. Templin Gregory G. Weaver | | OFFICERS James A. McNamara, President Scott M. McHugh, Treasurer, Senior Vice President and Principal Financial Officer Caroline L. Kraus, Secretary GOLDMAN, SACHS & CO. Distributor and Transfer Agent GOLDMAN SACHS ASSET MANAGEMENT INTERNATIONAL Investment Adviser |
| |
| | GOLDMAN SACHS ASSET MANAGEMENT, L.P. Investment Adviser |
Visit our web site at www.GSAMFUNDS.com to obtain the most recent month-end returns.
Goldman Sachs Asset Management, L.P., 200 West Street, New York, New York 10282
The reports concerning the Funds included in this shareholder report may contain certain forward-looking statements about the factors that may affect the performance of the Funds in the future. These statements are based on Funds management’s predictions and expectations concerning certain future events and their expected impact on the Funds, such as performance of the economy as a whole and of specific industry sectors, changes in the levels of interest rates, the impact of developing world events, and other factors that may influence the future performance of the Funds. Management believes these forward-looking statements to be reasonable, although they are inherently uncertain and difficult to predict. Actual events may cause adjustments in portfolio management strategies from those currently expected to be employed.
A description of the policies and procedures that the Funds use to determine how to vote proxies relating to portfolio securities and information regarding how a Fund voted proxies relating to portfolio securities during the most recent 12-month period ended June 30 is available (i) without charge, upon request by calling 1-800-526-7384 (for Retail Shareholders) or 1-800-621-2550 (for Institutional Shareholders); and (ii) on the Securities and Exchange Commission (“SEC”) web site at http://www.sec.gov.
The Funds file their complete schedule of portfolio holdings with the SEC for the first and third quarters of each fiscal year on Form N-Q. The Funds’ Form N-Qs are available on the SEC’s web site at http://www.sec.gov within 60 days after the Portfolios’ first and third fiscal quarters. The Funds’ Form N-Qs may be reviewed and copied at the SEC’s Public Reference Room in Washington, D.C. and information on the operation of the Public Reference Room may also be obtained by calling 1-800-SEC-0330. Form N-Q may be obtained upon request and without charge by calling 1-800-526-7384 (for Retail Shareholders) or 1-800-621-2550 (for Institutional Shareholders).
Economic and market forecasts presented herein reflect our judgment as of the date of this report and are subject to change without notice. These forecasts do not take into account the specific investment objectives, restrictions, tax and financial situation or other needs of any specific client. Actual data will vary and may not be reflected here. These forecasts are subject to high levels of uncertainty that may affect actual performance. Accordingly, these forecasts should be viewed as merely representative of a broad range of possible outcomes. These forecasts are estimated, based on assumptions, and are subject to significant revision and may change materially as economic and market conditions change. Goldman Sachs has no obligation to provide updates or changes to these forecasts. Case studies and examples are for illustrative purposes only.
Goldman, Sachs & Co. (“Goldman Sachs”) does not provide legal, tax or accounting advice. Any statement contained in this communication (including any attachments) concerning U.S. tax matters was not intended or written to be used, and cannot be used, for the purpose of avoiding penalties under the Internal Revenue Code, and was written to support the promotion or marketing of the transaction(s) or matter(s) addressed. Clients of Goldman Sachs should obtain their own independent tax advice based on their particular circumstances.
Fund holdings and allocations shown are as of March 31, 2016 and may not be representative of future investments. Fund holdings should not be relied on in making investment decisions and should not be construed as research or investment advice regarding particular securities. Current and future holdings are subject to risk.
This material is not authorized for distribution to prospective investors unless preceded or accompanied by a current Prospectus or summary prospectus, if applicable. Investors should consider a Fund’s objective, risks, and charges and expenses, and read the summary prospectus, if available, and/or the Prospectus carefully before investing or sending money. The summary prospectus, if available, and the Prospectus contain this and other information about a Fund and may be obtained from your authorized dealer or from Goldman, Sachs & Co. by calling (retail – 1-800-526-7384) (institutional – 1-800-621-2550).
Goldman, Sachs & Co. is the distributor of the Goldman Sachs Funds.
© 2016 Goldman Sachs. All rights reserved. 46359-TMPL-05/2016 MSFIAR-16/128K
(a) As of the end of the period covered by this report, the registrant has adopted a code of ethics that applies to the registrant’s principal executive officer, principal financial officer, principal accounting officer or controller, or persons performing similar functions, regardless of whether these individuals are employed by the registrant or a third party (the “Code of Ethics”).
(b) During the period covered by this report, no amendments were made to the provisions of the Code of Ethics.
(c) During the period covered by this report, the registrant did not grant any waivers, including an implicit waiver, from any provision of the Code of Ethics.
(d) A copy of the Code of Ethics is available as provided in Item 12(a)(1) of this report.
| ITEM 3. | AUDIT COMMITTEE FINANCIAL EXPERT. |
The registrant’s board of trustees has determined that the registrant has at least one “audit committee financial expert” (as defined in Item 3 of Form N-CSR) serving on its audit committee. Gregory G. Weaver is the “audit committee financial expert” and is “independent” (as each term is defined in Item 3 of Form N-CSR).
| ITEM 4. | PRINCIPAL ACCOUNTANT FEES AND SERVICES. |
The following disclosure relates to the independence of PricewaterhouseCoopers LLP (“PwC”) with respect to SEC Rule 2-01(c)(1)(ii)(A) of Regulation S-X (the “Loan Rule”). The Loan Rule prohibits accounting firms, such as PwC, from having certain financial relationships with their audit clients and affiliated entities. Specifically, the Loan Rule provides, in relevant part, that an accounting firm generally would not be independent if it receives a loan from a lender that is a “record or beneficial owner of more than ten percent of the audit client’s equity securities.” The Goldman Sachs Asset Management investment company complex (the “Funds”) has been notified by PwC that one of its lenders owns more than ten percent of at least one of the Funds. The Funds are providing this disclosure to explain the facts and circumstances as well as PwC’s conclusions concerning its independence and its objectivity and impartiality with respect to the audits of the Funds.
PwC has advised the Funds that, after evaluating the facts and circumstances related to the matter described above, it has concluded that its financial relationship described above did not and will not impair PwC’s application of objective and impartial judgment on any issues encompassed within its audits of the financial statements of the Funds. PwC has advised the Funds that this conclusion is based in part on the following considerations: (1) the lenders to PwC have no influence over the fund adviser to the Funds; (2) an investment in any such Fund is passive; (3) the PwC lenders are part of various syndicates of unrelated lenders; (4) there have been no changes to the loans in question since the origination of each respective note; (5) the debts are in good standing and no lender has the right to take action against PwC, as borrower, in connection with the financings; (6) the debt balances are immaterial to PwC and to each lender; and (7) the PwC audit engagement team has no involvement in PwC’s treasury function and PwC’s treasury function has no oversight of or ability to influence the PwC audit engagement team.
If it were ultimately determined that PwC was not independent with respect to the Funds for certain periods, any Fund filings with the SEC which contain the Funds’ financial statements for such periods would not comply with applicable securities laws which potentially could have a material adverse effect on the Funds.
Table 1 — Items 4(a) - 4(d). The accountant fees below reflect the aggregate fees billed by all of the Funds of the Goldman Sachs Trust and includes the Goldman Sachs Funds to which this certified shareholder report relates.
| | | | | | | | | | | | |
| | | 2016 | | 2015 | | Description of Services Rendered |
| | | |
| | | | | | | | | | | | |
| | | |
Audit Fees: | | | | | | | | | | | | |
| | | |
• PricewaterhouseCoopers LLP
(“PwC”) | | | $ | 3,724,925 | | | | $ | 3,570,472 | | | Financial Statement audits. |
| | | |
Audit-Related Fees: | | | | | | | | | | | | |
| | | |
• PwC | | | $ | 158,000 | | | | $ | 0 | | | Other attest services. |
| | | |
Tax Fees: | | | | | | | | | | | | |
| | | |
• PwC | | | $ | 1,091,628 | | | | $ | 659,410 | | | Tax compliance services provided in connection with the preparation and review of registrant’s tax returns. |
Table 2 — Items 4(b)(c) & (d). Non-Audit Services to the Goldman Sachs Trust’s service affiliates * that were pre-approved by the Audit Committee of the Goldman Sachs Trust pursuant to Rule 2-01(c)(7)(ii) of Regulation S-X.
| | | | | | | | | | | | |
| | | 2016 | | 2015 | | Description of Services Rendered |
| | | |
| | | | | | | | | | | | |
| | | |
Audit-Related Fees: | | | | | | | | | | | | |
| | | |
• PwC | | | $ | 1,653,616 | | | | $ | 1,568,616 | | | Internal control review performed in accordance with Statement on Standards for Attestation Engagements No. 16. These fees are borne by the Funds’ Adviser. |
| * | These include the advisor (excluding sub-advisors) and any entity controlling, controlled by or under common control with the advisor that provides ongoing services to the registrant (hereinafter referred to as “service affiliates”). |
Item 4(e)(1) — Audit Committee Pre-Approval Policies and Procedures
Pre-Approval of Audit and Non-Audit Services Provided to the Funds of the Goldman Sachs Trust. The Audit and Non-Audit Services Pre-Approval Policy (the “Policy”) adopted by the Audit Committee of Goldman Sachs Trust (“GST”) sets forth the procedures and the conditions pursuant to which services performed by an independent auditor for GST may be pre-approved. Services may be pre-approved specifically by the Audit Committee as a whole or, in certain circumstances, by the Audit Committee Chairman or the person designated as the Audit Committee Financial Expert. In addition, subject to specified cost limitations, certain services may be pre-approved under the provisions of the Policy. The Policy provides that the Audit Committee will consider whether the services provided by an independent auditor are consistent with the Securities and Exchange Commission’s rules on auditor independence. The Policy provides for periodic review and pre-approval by the Audit Committee of the services that may be provided by the independent auditor.
De Minimis Waiver. The pre-approval requirements of the Policy may be waived with respect to the provision of non-audit services that are permissible for an independent auditor to perform, provided (1) the aggregate amount of all such services provided constitutes no more than five percent of the total amount of revenues subject to pre-approval that was paid to the independent auditors during the fiscal year in which the services are provided; (2) such services were not recognized by GST at the time of the engagement to be non-audit services; and (3) such services are promptly brought to the attention of the Audit Committee and approved prior to the completion of the audit by the Audit Committee or by one or more members of the Audit Committee to whom authority to grant such approvals has been delegated by the Audit Committee, pursuant to the pre-approval provisions of the Policy.
Pre-Approval of Non-Audit Services Provided to GST’s Investment Advisers. The Policy provides that, in addition to requiring pre-approval of audit and non-audit services provided to GST, the Audit Committee will pre-approve those non-audit services provided to GST’s investment advisers (and entities controlling, controlled by or under common control with the investment advisers that provide ongoing services to GST) where the engagement relates directly to the operations or financial reporting of GST.
Item 4(e)(2) – 0% of the audit-related fees, tax fees and other fees listed in Table 1 were approved by GST’s Audit Committee pursuant to the “de minimis” exception of Rule 2-01(c)(7)(i)(C) of Regulation S-X. In addition, 0% of the non-audit services to the GST’s service affiliates listed in Table 2 were approved by GST’s Audit Committee pursuant to the “de minimis” exception of Rule 2-01(c)(7)(i)(C) of Regulation S-X.
Item 4(f) – Not applicable.
Item 4(g) Aggregate Non-Audit Fees Disclosure
The aggregate non-audit fees billed to GST by PwC for the twelve months ended March 31, 2016 and March 31, 2015 were approximately $1,091,628 and $659,410 respectively. The aggregate non-audit fees billed to GST’s adviser and service affiliates by PwC for non-audit services for the twelve months ended December 31, 2015 and December 31, 2014 were approximately $14.4 million and $10.2 million respectively. With regard to the aggregate non-audit fees billed to GST’s adviser and service affiliates, the 2015 and 2014 amounts include fees for non-audit services required to be pre-approved [see Table 2] and fees for non-audit services that did not require pre-approval since they did not directly relate to GST’s operations or financial reporting.
Item 4(h) — GST’s Audit Committee has considered whether the provision of non-audit services to GST’s investment adviser and service affiliates that did not require pre-approval pursuant to paragraph (c)(7)(ii) of Rule 2-01 of Regulation S-X is compatible with maintaining the auditors’ independence.
| ITEM 5. | AUDIT COMMITTEE OF LISTED REGISTRANTS. |
| ITEM 6. | SCHEDULE OF INVESTMENTS. |
| | Schedule of Investments is included as part of the Report to Shareholders filed under Item 1. |
| ITEM 7. | DISCLOSURE OF PROXY VOTING POLICIES AND PROCEDURES FOR CLOSED-END MANAGEMENT INVESTMENT COMPANIES. |
| ITEM 8. | PORTFOLIO MANAGERS OF CLOSED-END MANAGEMENT INVESTMENT COMPANIES. |
| ITEM 9. | PURCHASES OF EQUITY SECURITIES BY CLOSED-END MANAGEMENT INVESTMENT COMPANY AND AFFILIATED PURCHASERS. |
| ITEM 10. | SUBMISSION OF MATTERS TO A VOTE OF SECURITY HOLDERS. |
| | There have been no material changes to the procedures by which shareholders may recommend nominees to the registrant’s board of trustees. |
| ITEM 11. | CONTROLS AND PROCEDURES. |
| | (a) | The registrant’s principal executive and principal financial officers, or persons performing similar functions have concluded that the registrant’s disclosure controls and procedures (as defined in Rule 30a-3(c) under the Investment Company Act of 1940, as amended (the “1940 Act”)) are effective as of a date within 90 days of the filing of this report that includes the disclosure required by this paragraph, based on the evaluation of these controls and procedures required by Rule 30a-3(b) under the 1940 Act and 15d-15(b) under the Securities Exchange Act of 1934, as amended. |
| | (b) | There were no changes in the registrant’s internal control over financial reporting (as defined in Rule 30a-3(d) under the 1940 Act) that occurred during the registrant’s second fiscal quarter of the period covered by this report that have materially affected, or are reasonably likely to materially affect, the registrant’s internal control over financial reporting. |
| | | | |
| (a)(1) | | Goldman Sachs Trust’s Code of Ethics for Principal Executive and Senior Financial Officers is incorporated by reference to Exhibit 12(a)(1) of the registrant’s Form N-CSR filed on July 8, 2015 for its International Equity Insights Funds. |
| | |
| (a)(2) | | Exhibit 99.CERT | | Certifications pursuant to Section 302 of the Sarbanes-Oxley Act of 2002 filed herewith. |
| | |
| (b) | | Exhibit 99.906CERT | | Certifications pursuant to Section 906 of the Sarbanes-Oxley Act of 2002 filed herewith. |
SIGNATURES
Pursuant to the requirements of the Securities Exchange Act of 1934 and the Investment Company Act of 1940, the registrant has duly caused this report to be signed on its behalf by the undersigned, thereunto duly authorized.
| | |
| | | Goldman Sachs Trust |
| |
| By: | | /s/ James A. McNamara |
| |
| | |
| | James A. McNamara |
| | President/Chief Executive Officer |
| | Goldman Sachs Trust |
| |
| Date: | | June 6, 2016 |
Pursuant to the requirements of the Securities Exchange Act of 1934 and the Investment Company Act of 1940, this report has been signed below by the following persons on behalf of the registrant and in the capacities and on the dates indicated.
| | |
| By: | | /s/ James A. McNamara |
| |
| | |
| | James A. McNamara |
| | President/Chief Executive Officer |
| | Goldman Sachs Trust |
| |
| Date: | | June 6, 2016 |
| |
| By: | | /s/ Scott McHugh |
| |
| | |
| | Scott McHugh |
| | Principal Financial Officer |
| | Goldman Sachs Trust |
| |
| Date: | | June 6, 2016 |