UNITED STATES
SECURITIES AND EXCHANGE COMMISSION
Washington, D.C. 20549
FORM N-CSR
CERTIFIED SHAREHOLDER REPORT OF REGISTERED
MANAGEMENT INVESTMENT COMPANIES
Investment Company Act file number 811-05349
Goldman Sachs Trust
(Exact name of registrant as specified in charter)
71 South Wacker Drive, Chicago, Illinois 60606
(Address of principal executive offices) (Zip code)
| | |
| Caroline Kraus, Esq. | | Copies to: |
| Goldman, Sachs & Co. | | Geoffrey R.T. Kenyon, Esq. |
| 200 West Street | | Dechert LLP |
| New York, New York 10282 | | 100 Oliver Street |
| | 40th Floor |
| | Boston, MA 02110-2605 |
(Name and address of agents for service)
Registrant’s telephone number, including area code: (312) 655-4400
Date of fiscal year end: December 31
Date of reporting period: December 31, 2015
| ITEM 1. | REPORTS TO STOCKHOLDERS. |
| | The Annual Report to Shareholders is filed herewith. |
Goldman Sachs Funds

| | | | |
| | |
| Annual Report | | | | December 31, 2015 |
| | |
| | | | Select Satellite Funds |
| | | | Absolute Return Tracker |
| | | | Commodity Strategy |
| | | | Dynamic Allocation |
| | | | Dynamic Commodity Strategy |
| | | | Managed Futures Strategy |
| | | | Global Real Estate Securities |
| | | | International Real Estate Securities |
| | | | Real Estate Securities |

Goldman Sachs Select Satellite Funds
| n | | ABSOLUTE RETURN TRACKER |
| n | | DYNAMIC COMMODITY STRATEGY |
| n | | MANAGED FUTURES STRATEGY |
| n | | GLOBAL REAL ESTATE SECURITIES |
| n | | INTERNATIONAL REAL ESTATE SECURITIES |
| | | | |
TABLE OF CONTENTS | | | | |
| |
Principal Investment Strategies and Risks | | | 1 | |
| |
Portfolio Management Discussions and Performance Summaries | | | 6 | |
| |
Schedules of Investments | | | 60 | |
| |
Financial Statements | | | 88 | |
| |
Financial Highlights | | | 96 | |
| |
Notes to Financial Statements | | | 112 | |
| |
Report of Independent Registered Public Accounting Firm | | | 147 | |
| |
Other Information | | | 148 | |
| | | | |
| | | |
| NOT FDIC-INSURED | | May Lose Value | | No Bank Guarantee |
GOLDMAN SACHS SELECT SATELLITE FUNDS
Principal Investment Strategies and Risks
This is not a complete list of risks that may affect the Funds. For additional information concerning the risks applicable to the Funds, please see the Funds’ Prospectuses.
The Goldman Sachs Absolute Return Tracker Fund seeks to deliver long-term total return consistent with investment results that approximate the return and risk patterns of a diversified universe of hedge funds. The Fund’s Investment Adviser believes that hedge funds derive a large portion of their returns from exposure to sources of market risk (“Market Exposures”) and “Trading Strategies” involving long and/or short positions in Market Exposures and/or individual securities or baskets of securities. In seeking to meet its investment objective, the Fund uses a dynamic investment process to seek to identify the appropriate weights to Market Exposures and Trading Strategies that approximate the return and risk patterns of specific hedge fund sub-strategies. The Investment Adviser then applies a quantitative methodology, in combination with a qualitative overlay, to assess the appropriate weight to each Market Exposure and Trading Strategy. The Fund may seek to establish long and/or short positions in a multitude of Market Exposures. However, from time to time, regulatory constraints or other considerations may prevent the Fund from precisely replicating the returns of the Market Exposures and Trading Strategies. The Fund does not intend to outperform market returns, even during periods of sustained increases in the prices of stocks and bonds.
The Fund seeks to gain exposure to the commodities markets by investing in a wholly-owned subsidiary of the Fund organized as a company under the laws of the Cayman Islands (the “ART Subsidiary”). The ART Subsidiary primarily obtains its commodity exposure by investing in commodity-linked derivative instruments (which may include total return swaps on commodity indexes, sub-indexes and single commodities, as well as commodity (U.S. or foreign) futures, commodity options and commodity-linked notes). The ART Subsidiary will also invest in other instruments, including fixed income securities, either as investments or to serve as margin or collateral for its swap positions, and foreign currency transactions (including forward contracts). The Fund is subject to the risk that exposure to the commodities markets may subject the Fund to greater volatility than investments in traditional securities. Derivative instruments may involve a high degree of financial risk. These risks include the risk that a small movement in the price of the underlying security or benchmark may result in a disproportionately large movement, unfavorable or favorable, in the price of the derivative instrument; the risk of default by a counterparty; and liquidity risk. Over-the-counter transactions are subject to less government regulation and supervision. The Fund may also hold significant amounts of U.S. Treasury or short-term instruments. Foreign and emerging markets investments may be more volatile and less liquid than U.S. securities and are subject to the risks of currency fluctuations and adverse economic or political developments. At times, the Fund may be unable to sell certain of its illiquid investments without a substantial drop in price, if at all. The Fund is subject to the risks associated with short selling of securities, which involves leverage of the Fund’s assets and presents various other risks. The Fund may be obligated to cover its short position at a higher price than the short price, resulting in a loss. Losses on short sales are potentially unlimited as a loss occurs when the value of a security sold short increases. The Fund is not appropriate for all investors. The Investment Adviser’s use of quantitative models to execute the Fund’s investment strategy may fail to produce the intended result. Different investment styles (e.g., “quantitative”) tend to shift in and out of favor, and at times the Fund may underperform other funds that invest in similar asset classes.
The investment program of the Fund is speculative, entails substantial risks and includes alternative investment techniques not employed by traditional mutual funds. The Fund should not be relied upon as a complete investment program. The Fund’s investment techniques (if they do not perform as designed) may increase the volatility of performance and the risk of investment loss, including the loss of the entire amount that is invested, and there can be no assurance that the investment objective of the Fund will be achieved.
The Goldman Sachs Commodity Strategy Fund seeks to maintain substantial economic exposure to the performance of the commodities markets. The Fund primarily gains exposure to the commodities markets by investing in a wholly-owned subsidiary of the Fund organized as a company under the laws of the Cayman Islands (the “Subsidiary”). The Subsidiary primarily obtains its commodity exposure by investing in commodity-linked swaps (which may include total return swaps). The Subsidiary also
1
GOLDMAN SACHS SELECT SATELLITE FUNDS
invests in other instruments, including fixed income securities, either as investments or to serve as margin or collateral for its swap positions. The Fund is subject to the risk that exposure to the commodities markets may subject the Fund to greater volatility than investments in traditional securities. Derivative instruments may involve a high degree of financial risk. These risks include the risk that a small movement in the price of the underlying security or benchmark may result in a disproportionately large movement, unfavorable or favorable, in the price of the derivative instrument; the risk of default by a counterparty; and liquidity risk. The Fund’s borrowing and use of derivatives result in leverage, which can make the Fund more volatile. Over-the-counter transactions are subject to less government regulation and supervision. The Fund may hold significant amounts of U.S. Treasury or short-term investments. Investments in fixed income securities are subject to the risks associated with debt securities generally, including credit, liquidity and interest rate risk. Investments in mortgage-backed securities are subject to prepayment risk, the risk that in a declining interest rate environment the Fund’s underlying mortgages may be prepaid, causing the Fund to have to reinvest at lower interest rates. Foreign investments may be more volatile and less liquid than U.S. securities and are subject to the risks of currency fluctuations and adverse economic or political developments. At times, the Fund may be unable to sell certain of its illiquid investments without a substantial drop in price, if at all. The Fund is “non-diversified” and may invest more of its assets in fewer issuers than “diversified” funds. Accordingly, the Fund may be more susceptible to adverse developments affecting any single issuer held in its portfolio and to greater losses resulting from these developments.
The investment program of the Fund is speculative, entails substantial risks and includes asset classes and investment techniques not employed by more traditional mutual funds. The Fund should not be relied upon as a complete investment program. There can be no assurance that the investment objective of the Fund will be achieved.
The Goldman Sachs Dynamic Allocation Fund invests primarily in exchange-traded funds (“ETFs”), stocks and derivative instruments, including futures and swaps, that provide exposure to a broad spectrum of asset classes, including but not limited to equities (both in U.S. and non-U.S. companies), fixed income (U.S. and non-U.S., investment grade and high yield) and commodities. Derivative instruments may involve a high degree of financial risk. These risks include the risk that a small movement in the price of the underlying security or benchmark may result in a disproportionately large movement, unfavorable or favorable, in the price of the derivative instrument; risk of default by a counterparty; and liquidity risk. The Fund’s borrowing and use of derivatives result in leverage, which can make the Fund more volatile. Over-the-counter transactions are subject to less government regulation and supervision. The Fund may also hold significant amounts of U.S. Treasury or short-term instruments. The Fund’s equity investments are subject to market risk, which means that the value of its investments may go up or down in response to the prospects of individual companies, particular sectors and/or general economic conditions. The Fund’s fixed income investments are subject to the risks associated with debt securities generally, including credit, liquidity and interest rate risk. High yield, lower rated investments involve greater price volatility and present greater risks than higher rated fixed income securities. The Fund seeks to gain exposure to the commodities markets by investing in a wholly-owned subsidiary of the Fund organized as a company under the laws of the Cayman Islands (the “DAF Subsidiary”). The DAF Subsidiary primarily obtains its commodity exposure by investing in commodity-linked derivative instruments, which may include but are not limited to total return swaps, commodity (U.S. or foreign) futures and commodity-linked notes. The DAF Subsidiary may also invest in other instruments, including fixed income securities, either as investments or to serve as margin or collateral for its swap positions, and foreign currency transactions (including forward contracts). The Fund is subject to the risk that exposure to the commodities markets may subject the Fund to greater volatility than investments in traditional securities. Foreign and emerging markets investments may be more volatile and less liquid than investments in U.S. securities and are subject to the risks of currency fluctuations and adverse economic or political developments. At times, the Fund may be unable to sell certain of its illiquid investments without a substantial drop in price, if at all. The Fund’s investments in other investment companies (including ETFs) subject it to additional expenses. The Fund is “non-diversified” and may invest more of its assets in fewer issuers than “diversified” funds. Accordingly, the
2
GOLDMAN SACHS SELECT SATELLITE FUNDS
Fund may be more susceptible to adverse developments affecting any single issuer held in its portfolio and to greater losses resulting from these developments.
The investment program of the Fund is speculative, entails substantial risks and includes asset classes and investment techniques not employed by more traditional mutual funds. The Fund should not be relied upon as a complete investment program. There can be no assurance that the investment objective of the Fund will be achieved.
The Goldman Sachs Dynamic Commodity Strategy Fund seeks to maintain substantial economic exposure to the performance of the commodities markets. The Fund primarily gains exposure to the commodities markets by investing in a wholly-owned subsidiary of the Fund organized as a company under the laws of the Cayman Islands (the “Subsidiary”) and in commodity index-linked structured notes. The Subsidiary primarily obtains its commodity exposure by investing in commodity-linked derivative instruments (which may include total return swaps). The Subsidiary also invests in other instruments, including fixed income securities, either as investments or to serve as margin or collateral for its swap positions. The Fund is subject to the risk that exposure to the commodities markets may subject the Fund to greater volatility than investments in traditional securities. The Fund is subject to tax risk as a result of its investments in the Subsidiary and in commodity index-linked structured notes, as the Fund has not received a private letter ruling from the Internal Revenue Service (“IRS”) concluding that income and gains from such investments are “qualifying income.” The IRS has suspended granting such private letter rulings, and the Fund cannot rely on private letter rulings granted to other taxpayers. The tax treatment of investments in the Subsidiary and in commodity index-linked structured notes may be adversely affected by future legislation and/or IRS guidance. While the Fund has obtained an opinion of counsel regarding such investments, if the IRS were to successfully assert that the Fund’s income from such investments was not “qualifying income,” in which case the Fund would fail to qualify as a regulated investment company, the Fund would be subject to federal and state income tax on all of its taxable income at regular corporate tax rates with no deduction for any distributions paid to shareholders, which would significantly adversely affect the returns to Fund shareholders.
Derivative instruments may involve a high degree of financial risk. These risks include the risk that a small movement in the price of the underlying security or benchmark may result in a disproportionately large movement, unfavorable or favorable, in the price of the derivative instrument; the risk of default by a counterparty; and liquidity risk. The Fund’s borrowing and use of derivatives may result in leverage, and may make the Fund more volatile. Over-the-counter transactions are subject to less governmental regulation and supervision. Any guarantee on U.S. government securities applies only to the underlying securities of the Fund if held to maturity and not to the value of the Fund’s shares. Investments in fixed income securities are subject to the risks associated with debt securities generally, including credit, liquidity and interest rate risk. Investments in mortgage-backed and other asset-backed securities are subject to prepayment risk, the risk that in a declining interest rate environment the Fund’s underlying mortgages may be prepaid, causing the Fund to have to reinvest at lower interest rates. At times, the Fund may be unable to sell certain of its illiquid investments without a substantial drop in price, if at all. The Fund may invest in non-investment grade securities, which involve greater price volatility and present greater risks than higher rated fixed income securities. The Fund is “non-diversified” and may invest more of its assets in fewer issuers than “diversified” funds. Accordingly, the Fund may be more susceptible to adverse developments affecting any single issuer held in its portfolio and to greater losses resulting from these developments.
The investment program of the Fund is speculative, entails substantial risks and includes asset classes and investment techniques not employed by more traditional mutual funds. The Fund should not be relied upon as a complete investment program. There can be no assurance that the investment objective of the Fund will be achieved.
The Goldman Sachs Managed Futures Strategy Fund implements a trend-following strategy that takes long and/or short positions in a wide range of asset classes, including equities, fixed income,
3
GOLDMAN SACHS SELECT SATELLITE FUNDS
commodities and currencies, among others, to seek long-term absolute return. Investments in fixed income securities are subject to the risks associated with debt securities generally, including credit, liquidity, interest rate, call, and extension risk. The Fund’s equity investments are subject to market risk, which means that the value of its investments may go up or down in response to the prospects of individual companies, particular industry sectors and/or general economic conditions. Different investment styles tend to shift in and out of favor, and at times the Fund may underperform other funds that invest in similar asset classes. Managed futures strategies have historically offered the potential for stronger performance in extreme bull and bear markets and weaker performance in range-bound and sharply reversing markets. Foreign and emerging market investments may be more volatile and less liquid than investments in U.S. securities and will be subject to the risks of currency fluctuation and adverse economic or political developments. The Fund is subject to the risk that exposure to the commodities markets may subject the Fund to greater volatility than investments in traditional securities. Derivative investments may involve a high degree of financial risk. These risks include the risk that a small movement in the price of the underlying security or benchmark may result in a disproportionately large movement, unfavorable or favorable, in the price of the derivative instrument; risk of default by a counterparty; and liquidity risk. At times, the Fund may be unable to sell certain of its illiquid investments without a substantial drop in price, if at all. Over-the-counter transactions are subject to less government regulation and supervision. The Fund’s borrowing and use of derivatives may result in leverage, which can make the Fund more volatile. The Fund is subject to tax risk as a result of its investments in commodity-linked structured notes, as the Fund has not received a private letter ruling from the Internal Revenue Service (“IRS”) concluding that income and gains from such investments are “qualifying income.” The IRS has suspended granting such private letter rulings, and the Fund cannot rely on private letter rulings granted to other taxpayers. The tax treatment of investments in commodity-linked structured notes may be adversely affected by future legislation and/or IRS guidance. While the Fund has obtained an opinion of counsel regarding such investments, if the IRS were to successfully assert that the Fund’s income from such investments was not “qualifying income,” in which case the Fund would fail to qualify as a regulated investment company, the Fund would be subject to federal and state income tax on all of its taxable income at regular corporate tax rates with no deduction for any distributions paid to shareholders, which would significantly adversely affect the returns to Fund shareholders. The tax treatment of commodity-linked derivative instruments may be adversely affected by future legislation or regulatory developments. The Fund is “non-diversified” and may invest more of its assets in fewer issuers than “diversified” funds. Accordingly, the Fund may be more susceptible to adverse developments affecting any single issuer held in its portfolio and to greater losses resulting from these developments.
The investment program of the Fund is speculative, entails substantial risks and includes asset classes and investment techniques not employed by more traditional mutual funds. The Fund should not be relied upon as a complete investment program. There can be no assurance that the investment objective of the Fund will be achieved.
The Goldman Sachs Global Real Estate Securities Fund invests primarily in a portfolio of equity investments in issuers that are primarily engaged in or related to the real estate industry, including real
estate investment trusts (“REITs”), within and outside the United States. Investing in REITs involves certain unique risks in addition to those risks associated with investing in the real estate industry in general. REITs whose underlying properties are concentrated in a particular industry or geographic region are also subject to risks affecting such industries and regions. The securities of REITs involve greater risks than those associated with larger, more established companies and may be subject to more abrupt or erratic price movements because of interest rate changes, economic conditions and other factors. Foreign and emerging markets investments may be more volatile and less liquid than U.S. securities
4
GOLDMAN SACHS SELECT SATELLITE FUNDS
and are subject to the risks of currency fluctuations and adverse economic or political developments. Because the Fund concentrates its investments in the real estate industry, the Fund is subject to greater risk of loss as a result of adverse economic, business or other developments affecting this industry than if its investments were more diversified across different industries, and its performance may be substantially different from that of the broader stock market. The Fund is subject to market risk, which means that the value of the securities in which it invests may go up or down in response to the prospects of individual companies, particular sectors and/or general economic conditions. The securities of mid- and small-capitalization companies involve greater risks than those associated with larger, more established companies and may be subject to more abrupt or erratic price movements. The Fund is “non-diversified” and may invest more of its assets in fewer issuers than “diversified” funds. Accordingly, the Fund may be more susceptible to adverse developments affecting any single issuer held in its portfolio and to greater losses resulting from these developments.
The Goldman Sachs International Real Estate Securities Fund invests primarily in a portfolio of equity investments in issuers that are primarily engaged in or related to the real estate industry outside the United States, including real estate investment trusts (“REITs”). Investing in REITs involves certain unique risks in addition to those risks associated with investing in the real estate industry in general. REITs whose underlying properties are concentrated in a particular industry or geographic region are also subject to risks affecting such industries and regions. The securities of REITs involve greater risks than those associated with larger, more established companies and may be subject to more abrupt or erratic price movements because of interest rate changes, economic conditions and other factors. Foreign and emerging markets investments may be more volatile and less liquid than U.S. securities and are subject to the risks of currency fluctuations and adverse economic or political developments. Because the Fund concentrates its investments in the real estate industry, the Fund is subject to greater risk of loss as a result of adverse economic, business or other developments affecting this industry than if its investments were more diversified across different industries, and its performance may be substantially different from that of the broader stock market. The Fund is subject to market risk, which means that the value of the securities in which the Fund invests. The Fund is “non-diversified” and may invest more of its assets in fewer issuers than “diversified” funds. Accordingly, the Fund may be more susceptible to adverse developments affecting any single issuer held in its portfolio and to greater losses resulting from these developments.
The Goldman Sachs Real Estate Securities Fund invests primarily in a portfolio of equity investments in issuers that are primarily engaged in or related to the real estate industry, including real estate investment trusts (“REITs”). Investing in REITs involves certain unique risks in addition to those risks associated with investing in the real estate industry in general. REITs whose underlying properties are concentrated in a particular industry or geographic region are also subject to risks affecting such industries and regions. The securities of REITs involve greater risks than those associated with larger, more established companies and may be subject to more abrupt or erratic price movements because of interest rate changes, economic conditions and other factors. Because the Fund concentrates its investments in the real estate industry, the Fund is subject to greater risk of loss as a result of adverse economic, business or other developments affecting this industry than if its investments were more diversified across different industries, and its performance may be substantially different from that of the broader stock market. The Fund is “non-diversified” and may invest more of its assets in fewer issuers than “diversified” funds. Accordingly, the Fund may be more susceptible to adverse developments affecting any single issuer held in its portfolio and to greater losses resulting from these developments.
5
PORTFOLIO RESULTS
Goldman Sachs Absolute Return Tracker Fund
Investment Objective
The Fund seeks to deliver long-term total return consistent with investment results that approximate the return and risk patterns of a diversified universe of hedge funds.
Portfolio Management Discussion and Analysis
Below, the Goldman Sachs Quantitative Investment Strategies (“QIS”) Team discusses the Goldman Sachs Absolute Return Tracker Fund’s (the “Fund”) performance and positioning for the 12-month period ended December 31, 2015 (“the Reporting Period”).
| Q | | How did the Fund perform during the Reporting Period? |
| A | | During the Reporting Period, the Fund’s Class A, C, Institutional, IR and R Shares generated average annual total returns, without sales charges, of -2.45%, -3.20%, -2.18%, -2.23% and -2.71%, respectively. These returns compare to the -3.64% average annual total return of the Fund’s benchmark, the HFRX Global Hedge Fund Index (net of management, administrative and performance/incentive fees) (the “HFRX Global Hedge Fund Index”)1, during the same time period. |
| | Since their inception on July 31, 2015, the Fund’s Class R6 Shares generated a cumulative total return, without sales charge, of -2.98%. This return compares to the -4.82% cumulative total return of the Index during the same period. |
| Q | | What economic and market factors most influenced the hedge fund asset class as a whole during the Reporting Period? |
| A | | Hedge funds, as measured by the HFRX Global Hedge Fund Index, overall generated modestly negative returns during the Reporting Period. Event driven hedge funds posted losses for the Reporting Period, with the HFRX Event Driven Index returning -6.94% during the Reporting Period. Among event driven hedge funds, performance was particularly weak among distressed restructuring-focused funds. Relative value hedge funds also posted negative returns during the Reporting Period, with the HFRX Relative Value Arbitrage Index returning -3.10%. Energy infrastructure funds lost most among relative value hedge funds amid steep declines in oil prices during 2015. Equity long/short hedge funds, as measured by the HFRX Equity Hedge Index, lost ground |
| | 1 | | The HFRX Global Hedge Fund Index is a trademark of Hedge Fund Research, Inc. (“HFR”). HFR has not participated in the formation of the Fund. HFR does not endorse or approve the Fund or make any recommendation with respect to investing in the Fund. |
| | as well, returning -2.33% during the Reporting Period, with gains in the first half of 2015 being erased by a weak second half of the calendar year. Within equity long/short hedge funds, fundamental value managers performed the worst. Global macro hedge funds were the least weak, though also down, with the HFRX Macro/CTA Index returning -1.96% during the Reporting Period. Among macro hedge funds, commodity managers focused on metals struggled the most. |
| | As the Reporting Period began, hedge funds were broadly down, with the HFRX Global Hedge Fund Index declining 0.29% for the first month of the new year. January 2015 was an eventful start to the year in financial markets, with continued declines in oil prices, depreciation of the euro on the back of the European Central Bank’s announcement of new plans for quantitative easing as well as the election of the Syriza party in Greece. Additionally, the Swiss franc appreciated sharply upon the Swiss National Bank’s decision to abandon the cap against the euro, and the U.S. dollar continued to rally. For the month, only global macro hedge funds posted gains, with trend-following funds faring particularly well driven by strong trends in currencies. In a turnaround, hedge funds were up in February 2015, with the HFRX Global Hedge Fund Index gaining 2.02% for the month. Global equities rallied, as international developed markets posted strong performance, and the S&P 500 Index recovered January 2015’s losses. Yields rose on U.S. Treasuries; high yield credit spreads tightened during the month; and the U.S. dollar posted mixed performance against global currencies. Each of the major sub-strategies gained ground in February 2015, though trend-following funds within the global macro sub-strategy struggled with the reversal of medium-term trends in fixed income and currencies. In March 2015, hedge fund performance moderated, but the HFRX Global Hedge Fund Index still gained 0.33% for the month. Indeed, despite a decline in U.S. equities, three of the |
6
PORTFOLIO RESULTS
| | four major sub-strategies represented in the HFRX Global Hedge Fund Index were up in March 2015. |
| | Modest performance continued in April 2015, with the HFRX Global Hedge Fund Index up 0.21% for the month. Despite the choppy performance across financial markets in April 2015, three of the four major sub-strategies were up for the month. After 11 consecutive months of gains through March 2015, the global macro sub-strategy struggled in April 2015, with trend-following funds losing ground given reversals in European equities and developed market government bonds. Similarly in May 2015, hedge funds were slightly up, with the HFRX Global Hedge Fund Index gaining 0.26% for the month. Event driven, macro and relative value sub-indices were up in May 2015, while equity long/short hedge funds were slightly down, with performance especially weak among fundamental growth managers. Hedge funds posted losses in June 2015, with the HFRX Global Hedge Fund Index declining 1.24% for the month. All four major sub-strategies were down for the month. The global macro sub-strategy declined most on the back of price reversals in currencies, fixed income and commodities. |
| | Hedge funds were flat overall in July 2015, with the HFRX Global Hedge Fund Index returning -0.03% for the month. Event driven and equity long/short hedge funds lost ground during the month, while global macro funds and relative value funds posted positive performance. Indeed, after challenged performance in the second calendar quarter amid heightened volatility across currency, commodities and fixed income markets, the macro sub-index recovered 2.31% in July 2015 on the back of strong trending behavior across commodities and currencies. August 2015 was a challenging month for hedge funds, with the HFRX Global Hedge Fund Index returning -2.21%, the largest one-month decline in four years. All four major sub-strategies lost ground against a backdrop of heightened volatility across global markets, weakening Chinese economic data, a broad sell-off in equities and further speculation on the timing of a rate hike by the Federal Reserve (the “Fed”). September 2015 was another challenging month for hedge funds, with the HFRX Global Hedge Fund Index returning -2.07%. All four major sub-strategies against lost ground against a backdrop of continued volatility across global financial markets, further declines in global equities and commodities, and the announcement of the Fed’s decision to postpone an interest rate hike. Throughout the quarter, fundamental growth funds within the equity long/short sub-strategy were particularly weak. |
| | Hedge funds posted positive performance overall in October 2015, with the HFRX Global Hedge Fund Index returning 1.46%. Global equities rebounded in October 2015, while government bonds posted mixed performance on the back of weak economic data out of the U.K. and Japan, along with dovish posturing from the European Central Bank. Three of the four major sub-strategies were up for the month, while the global macro sub-strategy lost ground in October 2015, with trend-following managers impacted by reversals in commodities, mixed performance of the U.S. dollar against global currencies, and broad price reversals across asset classes. Hedge funds posted mixed performance in November 2015, with the HFRX Global Hedge Fund Index returning -0.72% during the month. Global equities were mixed across regions in November 2015, while the U.S. dollar rallied, commodities largely sold off, and U.S. yields rose across the curve in anticipation of a potential Fed interest rate hike in December 2015. The relative value and event driven sub-strategies lost ground as credit spreads widened, while the equity long/short sub-strategy was flat overall. The global macro sub-strategy was up for the month with trend-following funds benefiting from strong trends in commodities and currencies. Hedge funds were challenged in December, with the HFRX Global Hedge Fund Index returning -1.33%. Global equities and commodities sold off in December, while the U.S. dollar gave up some strength but still finished the year up against global currencies. All four major hedge fund sub-strategies declined in December 2015, with the relative value sub-index falling the most. |
| Q | | What key factors were responsible for the Fund’s performance during the Reporting Period? |
| A | | We believe hedge funds derive a large portion of their returns from exposure to sources of market risk. The Fund uses a quantitative methodology in combination with a qualitative overlay to seek to identify the Market Exposures, or sources of market risk, that approximate the return and risk patterns of specific hedge fund sub-strategies. The Fund’s quantitative methodology seeks to allocate the Fund’s exposure to each Hedge Fund Sub-Strategy such that the Fund’s investment results approximate the return and risk patterns of a diversified universe of hedge funds. During the Reporting Period, two of the four Hedge Fund Sub-Strategies employed by the Fund contributed positively to performance on an absolute basis, while one was relatively flat and the other detracted. |
| | The Fund’s Relative Value Hedge Fund Sub-Strategy contributed most positively to the Fund’s performance on an absolute basis, followed by the Event Driven Hedge Fund |
7
PORTFOLIO RESULTS
| | Sub-Strategy. Within both of these Hedge Fund Sub-Strategies, long exposure to put options on the S&P 500® Index and long positions in high yield credit contributed positively to returns. There were no detractors from returns for either of these Hedge Fund Sub-Strategies. |
| | The Fund’s Macro Hedge Fund Sub-Strategy had a rather neutral impact on the Fund’s returns on an absolute basis. Long exposure to a broad commodities index detracted most from returns, as commodity prices tumbled during the Reporting Period. Conversely, the trend strategy contributed positively to absolute results. Within the trend strategy in which the Fund invests, short positions in the Canadian dollar against the U.S. dollar, in crude oil and in natural gas contributed most positively to absolute results. |
| | The Fund’s Equity Long/Short Hedge Fund Sub-Strategy detracted the most from the Fund’s returns on an absolute basis. The Fund’s long exposure to emerging markets equities and its short position in U.S. growth equities hurt returns the most. |
| | In addition to the asset classes mentioned above, the Fund was invested in a variety of developed and emerging market equities, short-term interest rates, developed market government bonds, currencies and commodities during the Reporting Period. |
| Q | | How did the Fund use derivatives and similar instruments during the Reporting Period? |
| A | | The Fund used exchange-traded index futures contracts to gain exposure to U.S. large-cap and small-cap equities, non-U.S. developed market equities including those in Europe, the U.K. and Japan, commodities, government bonds and short-term interest rates. The Fund used currency forward contracts to gain exposure to select developed and emerging market currencies of non-U.S. developed markets. The Fund trades exchange-traded securities and over-the-counter total return swaps to gain exposure to U.S. large-cap and small-cap equities. The Fund used total return swaps to get exposure to commodity indices. The Fund had used a total return swap to gain exposure to a basket of single-name stocks to which hedge funds had large investments according to 13F filings with the Securities and Exchange Commission (“SEC”). However, the Fund trades the individual underlying stocks outright. The Fund also used listed put options to gain exposure to U.S. large-cap equities. Lastly, the Fund used exchange-traded credit default swaps to gain exposure to North American high yield credit markets. Overall, the use of derivatives had a positive impact on the Fund’s performance during the Reporting Period. |
| Q | | Were there any changes made in the Fund’s investment strategy during the Reporting Period? |
| A | | During the Reporting Period, we added a Commodity Cross-Market Momentum strategy within the Macro Hedge Fund Sub-Strategy employed by the Fund. The Commodity Cross-Market Momentum strategy seeks to capture trends across commodity markets on a market-neutral basis by taking long and short positions in commodities based on their relative momentum. |
| Q | | How was the Fund positioned at the end of the Reporting Period? |
| A | | At the end of the Reporting Period, the Fund had a 47% allocation to the Equity Long/Short Hedge Fund Sub-Strategy, 22% to the Macro Hedge Fund Sub-Strategy, 21% to the Relative Value Hedge Fund Sub-Strategy and 10% to the Event Driven Hedge Fund Sub-Strategy. |
| Q | | Were there any changes to the Fund’s portfolio management team during the Reporting Period? |
| A | | In July 2015, Matt Hoehn, previously vice president and portfolio manager of the Fund within the QIS Customized Beta Strategies (“CBS”) team, left to pursue a different opportunity within Goldman Sachs Asset Management. Matt shared portfolio management responsibilities for the Fund strategy with Gary Chropuvka, managing director and QIS team member since 1999. Gary is the head of the QIS Customized Beta Strategies team as well as the Alternative Investment Strategies and Tax-Advantaged Core Strategies businesses within QIS. Gary continues to manage the Fund with Alex Chung, vice president, who has been with the QIS team since 2010 and has 11 years of investment experience as of December 31, 2015. |
| Q | | What is the Fund’s tactical view and strategy going forward? |
| A | | In the coming months, we intend to remain focused on the Fund’s investment objective of seeking to deliver long-term total return consistent with investment results that approximate the return and risk patterns of a diversified universe of hedge funds. We understand that the hedge fund industry is dynamic, and to keep pace, we seek to understand trends in the hedge fund industry by digesting information from a number of sources, including hedge fund return databases, prime brokerage reports, hedge fund consultants, regulatory filings and other public sources. Additionally, we emphasize ongoing research and continued process and model enhancement, which we can implement through our scalable, robust technological platform. |
8
FUND BASICS
Absolute Return Tracker Fund
as of December 31, 2015
| | | | | | | | | | |
| | PERFORMANCE REVIEW | |
| | | January 1, 2015–December 31, 2015 | | Fund Total Return
(based on NAV)1 | | | HFRX Global Hedge
Fund Index2 | |
| | Class A | | | -2.45 | % | | | -3.64 | % |
| | Class C | | | -3.20 | | | | -3.64 | |
| | Institutional | | | -2.18 | | | | -3.64 | |
| | Class IR | | | -2.23 | | | | -3.64 | |
| | | Class R | | | -2.71 | | | | -3.64 | |
| | | |
| | | | | | | | | |
| | | July 31, 2015–December 31, 2015 | | | | | | |
| | | Class R6 | | | -2.98 | % | | | -4.82 | % |
| | 1 | | The net asset value (“NAV”) represents the net assets of the class of the Fund (ex-dividend) divided by the total number of shares of the class outstanding. The Fund’s performance reflects the reinvestment of dividends and other distributions. The Fund’s performance does not reflect the deduction of any applicable sales charges. |
| | 2 | | The HFRX Global Hedge Fund Index is designed to be representative of the overall composition of the hedge fund universe. It is comprised of all eligible hedge fund strategies, including but not limited to convertible arbitrage, distressed securities, equity hedge, equity market neutral, event driven, macro, merger arbitrage, and relative value arbitrage. The strategies are asset weighted based on the distribution of assets in the hedge fund industry. The index is investable through products managed by HFR Asset Management, LLC that track HFRX Indices. The HFRX Global Hedge Fund Index is a trademark of HFR. HFR has not participated in the formation of the Fund. HFR does not endorse or approve the Fund or make any recommendation with respect to investing in the Fund. |
| | | | | | | | | | | | | | | | |
| | STANDARDIZED TOTAL RETURNS3 |
| | | For the period ended 12/31/15 | | One Year | | | Five Years | | | Since Inception | | | Inception Date |
| | Class A | | | -7.78 | % | | | 0.09 | % | | | -0.86 | % | | 5/30/08 |
| | Class C | | | -4.16 | | | | 0.48 | | | | -0.86 | | | 5/30/08 |
| | Institutional | | | -2.18 | | | | 1.60 | | | | 0.27 | | | 5/30/08 |
| | Class IR | | | -2.23 | | | | 1.45 | | | | 0.13 | | | 5/30/08 |
| | Class R | | | -2.71 | | | | 0.96 | | | | -0.37 | | | 5/30/08 |
| | | Class R6 | | | N/A | | | | N/A | | | | -2.98 | | | 7/31/15 |
| | 3 | | The Standardized Total Returns are average annual or cumulative total returns (only if the performance period is one year or less) as of the most recent calendar quarter-end and cumulative total returns for periods less than one year. They assume reinvestment of all distributions at NAV. These returns reflect a maximum initial sales charge of 5.5% for Class A Shares, and the assumed contingent deferred sales charge for Class C Shares (1% if redeemed within 12 months of purchase). Because Institutional, Class IR, Class R and Class R6 Shares do not involve a sales charge, such a charge is not applied to their Standardized Total Returns. |
The returns set forth in the tables above represent past performance. Past performance does not guarantee future results. The Fund’s investment return and principal value will fluctuate so that an investor’s shares, when redeemed, may be worth more or less than their original cost. Current performance may be lower or higher than the performance quoted above. Please visit our web site at www.GSAMFUNDS.com to obtain the most recent month-end returns. Performance reflects applicable fee waivers and/or expense limitations in effect during the periods shown. In their absence, performance would be reduced. Returns do not reflect the deduction of taxes that a shareholder would pay on Fund distributions or the redemption of Fund shares.
9
FUND BASICS
| | | | | | | | | | |
| | EXPENSE RATIOS4 | |
| | | | | Net Expense Ratio (Current) | | | Gross Expense Ratio (Before Waivers) | |
| | Class A | | | 1.20 | % | | | 1.75 | % |
| | Class C | | | 1.95 | | | | 2.50 | |
| | Institutional | | | 0.80 | | | | 1.35 | |
| | Class IR | | | 0.96 | | | | 1.50 | |
| | Class R | | | 1.45 | | | | 2.00 | |
| | | Class R6 | | | 0.78 | | | | 1.33 | |
| | 4 | | The expense ratios of the Fund, both current (net of applicable fee waivers and/or expense limitations) and before waivers (gross of applicable fee waivers and/or expense limitations) are as set forth above according to the most recent publicly available Prospectus for the Fund and may differ from the expense ratios disclosed in the Financial Highlights in this report. Pursuant to a contractual arrangement, the Fund’s waivers and/or expense limitations will remain in place through at least July 31, 2016, and prior to such date the Investment Adviser may not terminate the arrangements without the approval of the Fund’s Board of Trustees. If these arrangements are discontinued in the future, the expense ratios may change without shareholder approval. |
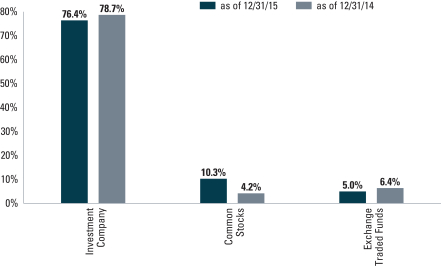
| | 5 | | The percentage shown for each investment category reflects the value of investments in that category as a percentage of net assets. Figures in the above graph may not sum to 100% due to the exclusion of other assets and liabilities. Underlying sector allocations of exchange traded funds and investment companies held by the Fund are not reflected in the graph above. Consequently, the Fund’s overall sector allocations may differ from the percentages contained in the graph above. The above graph depicts the Fund’s investments but may not represent the Fund’s market exposure due to the exclusion of certain derivatives, if any, as listed in the Additional Investment Information Section of the Schedule of Investments. |
10
GOLDMAN SACHS ABSOLUTE RETURN TRACKER FUND
Performance Summary
December 31, 2015
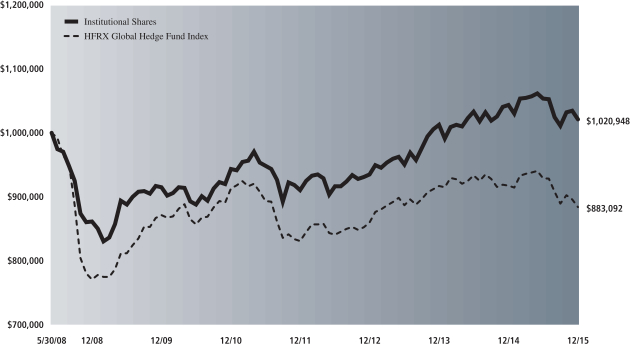
The following graph shows the value as of December 31, 2015, of a $1,000,000 investment made on May 30, 2008 (commencement of operations) in Institutional Shares at NAV. For comparative purposes, the performance of the Fund’s benchmark the HFRX Global Hedge Fund Index (net of management, administrative and performance/incentive fees), is shown. This performance data represents past performance and should not be considered indicative of future performance, which will fluctuate with changes in market conditions. These performance fluctuations will cause an investor’s shares, when redeemed, to be worth more or less than their original cost. Performance reflects applicable fee waivers and/or expense limitations in effect during the periods shown and in their absence, performance would be reduced. Returns do not reflect the deduction of taxes that a shareholder would pay on Fund distributions or the redemption of Fund shares. Performance of Class A, Class C, Class IR, Class R and Class R6 Shares will vary from Institutional Shares due to differences in class specific fees and any applicable sales charges. In addition to the Investment Adviser’s decision regarding issuer/industry investment selection and allocation, other factors may affect Fund performance. These factors include, but are not limited to, Fund operating fees and expenses, portfolio turnover, and subscription and redemption cash flows affecting the Fund.
| | | | |
| Absolute Return Tracker Fund’s Lifetime Performance | | | | |
Performance of a $1,000,000 Investment, with distributions reinvested, from May 30, 2008 through December 31, 2015.
| | | | | | | | | | |
| Average Annual Total Return through December 31, 2015 | | | One Year | | | | Five Years | | | Since Inception |
Class A (Commenced May 30, 2008) | | | | | | | | | | |
Excluding sales charges | | | -2.45% | | | | 1.24% | | | -0.12% |
Including sales charges | | | -7.78% | | | | 0.09% | | | -0.86% |
|
Class C (Commenced May 30, 2008) | | | | | | | | | | |
Excluding contingent deferred sales charges | | | -3.20% | | | | 0.48% | | | -0.86% |
Including contingent deferred sales charges | | | -4.16% | | | | 0.48% | | | -0.86% |
|
Institutional (Commenced May 30, 2008) | | | -2.18% | | | | 1.60% | | | 0.27% |
|
Class IR (Commenced May 30, 2008) | | | -2.23% | | | | 1.45% | | | 0.13% |
|
Class R (Commenced May 30, 2008) | | | -2.71% | | | | 0.96% | | | -0.37% |
|
Class R6 (Commenced July 31, 2015) | | | N/A | | | | N/A | | | -2.98%* |
|
| * | | Total return for periods of less than one year represents cumulative total return. |
11
GOLDMAN SACHS COMMODITY STRATEGY FUND
What Differentiates the Goldman Sachs Commodity Investment Process?
At Goldman Sachs Asset Management, L.P. (“GSAM”), the goal of our commodity investment process is to provide consistent, strong performance by actively managing our portfolios within a research-intensive, risk-managed framework.
Goldman Sachs’ Commodity Investment Process
Our commodity investment process emphasizes the importance of both short-term, tactical opportunities and long-term investment views. Our team-based approach to managing the Fund ensures continuity and idea sharing among some of the industry’s most experienced fixed income specialists. We pursue strong, consistent performance across commodity markets through:

The Goldman Sachs Commodity Strategy Fund primarily gains exposure to the performance of the commodity markets through investment in a wholly-owned subsidiary of the Fund organized as a company under the laws of the Cayman Islands (the “Subsidiary”). The Subsidiary invests primarily in commodity-linked swaps (which may include total return swaps), as well as other commodity-linked securities and derivative instruments that provide exposure to the performance of the commodities markets, and in fixed income and debt instruments. The Fund’s portfolio is designed to provide exposure that corresponds to the investment return of assets that trade in the commodity markets without direct investment in physical commodities.
The Fund implements enhanced cash strategies that capitalize on GSAM’s global fixed income expertise. The Fixed Income Team will employ the full spectrum of capabilities offered, including bottom-up strategies (credit, mortgages, governments /municipals, high yield, and emerging markets debt) and top-down strategies (duration, cross-sector, currency and country) in an attempt to enhance the return of the Fund.

A Commodity Fund that:
| n | | Provides exposure to the commodity markets without direct investment in physical commodities |
| n | | Utilizes commodity-linked swaps that provide economic exposure to movements in commodity prices |
12
PORTFOLIO RESULTS
Goldman Sachs Commodity Strategy Fund
Investment Objective
The Fund seeks long-term total return.
Portfolio Management Discussion and Analysis
Below, the Goldman Sachs Commodities Team discusses the Goldman Sachs Commodity Strategy Fund’s (the “Fund”) performance and positioning for the 12-month period ended December 31, 2015 (the “Reporting Period”).
| Q | | How did the Fund perform during the Reporting Period? |
| A | | During the Reporting Period, the Fund’s Class A, C, Institutional, IR and R Shares generated average annual total returns, without sales charges, of -32.43%, -32.95%, -32.38%, -32.15% and -32.88%, respectively. These returns compare to the -32.86% average annual total return of the Fund’s benchmark, the S&P GSCI® Total Return Index (Gross, USD, Unhedged, formerly the Goldman Sachs Commodity Index) (the “S&P GSCI®”), during the same period. |
| | Since their inception on July 31, 2015, the Fund’s Class R6 Shares generated a cumulative total return, without sales charge, of -21.23%. This return compares to the -21.67% cumulative total return of the S&P GSCI® during the same period. |
| Q | | What economic and market factors most influenced the commodities markets as a whole during the Reporting Period? |
| A | | Commodities markets, as measured by the S&P GSCI®, experienced great challenges during the Reporting Period overall, returning -32.86%. By comparison, the S&P 500® Index and the U.S. Dollar Index (“DXY”) returned 1.38% and 9.3%, respectively.1 |
| | In our opinion, weaknesses in the commodities markets during the Reporting Period can be attributed to several macro factors. The U.S. dollar continued to strengthen, fueled by improving economic indicators in the U.S. and the anticipation of central bank policy divergence with the U.S. Federal Reserve (the “Fed”) beginning to raise its target interest rate in December 2015. Outside the U.S., the trend of monetary policy easing intensified with the European Central Bank and the Bank of Japan continuing their respective programs of quantitative easing. Further, Chinese economic data continued to disappoint, with its government attempting to smoothly transition into a slower growth economy. |
| Q | | Which commodity subsectors were weakest during the Reporting Period? |
| A | | The energy component of the S&P GSCI® was weakest, returning -41.5% during the Reporting Period. The persisting global oversupply in crude oil weakened prices. Global production remained elevated, and the latest OPEC (“Organization of the Petroleum Exporting Countries”) meeting in December 2015 yielded no cuts to production. Additionally, shale production cuts in the U.S. underwhelmed the market (i.e. fell short of broad consensus hopes). Natural gas prices also fell, as strong production and an unusually warm start to the 2015-16 winter kept inventories at seasonally high levels. |
| | The industrial metals subsector, as measured by the S&P GSCI® Industrial Metals Index, returned -24.5% for the Reporting Period overall. Prices declined broadly, as the Chinese economy, the largest consumer of industrial metals, continued to show signs of deceleration. Additionally, the strengthening U.S. dollar weighed on prices of dollar-denominated commodities. |
| | Agriculture was also down, with the S&P GSCI® Agriculture Index declining 16.9% for the Reporting Period. Grains continued to weaken as the 2015 U.S. harvest progressed at healthy levels and weak export data against a backdrop of an already well-supplied market increased the expected carryover in supply to next year. Additionally, favorable changes in the weather in South America and potential increases in Argentinean exports further bolstered forecasted inventories. |
| | The precious metals subsector of the S&P GSCI® retuned -11.1% during the Reporting Period. Precious metals prices |
| | 1 | | The S&P 500® Index is the Standard & Poor’s 500 Composite Index of 500 stocks, an unmanaged index of common stock prices. The DXY is a measure of the general international value on of the U.S. dollar as calculated by averaging the exchange rates between the U.S. dollar and six major world currencies. |
13
PORTFOLIO RESULTS
| | weakened ahead of the first interest rate hike by the Fed in nearly a decade. Increasing interest rates tend to make non-yielding assets like gold less attractive to investors. |
| Q | | Which commodity subsectors were strongest during the Reporting Period? |
| A | | None of the commodity subsectors posted a positive return during the Reporting Period. |
| Q | | What key factors were responsible for the Fund’s performance during the Reporting Period? |
| A | | While absolute returns disappointed, the Fund generated returns that performed in line with the S&P GSCI® during the Reporting Period. The Fund extensively employed deferred positioning along the futures curves across the commodities markets in 2015, attempting to exploit more persistent contango found at the front of the futures curves, where the S&P GSCI® sits, in a broadly negative Reporting Period for commodities. (Contango is defined as a common market condition in which futures prices get progressively higher in the distant delivery months, often reflecting carrying costs. In other words, the nearby contract is trading at a lower price than the futures contract, such that one is rolling each month at a higher price.) In short, our enhanced roll-timing strategies via exposure to commodity index-linked swaps contributed positively to returns during the Reporting Period. Our enhanced cash management strategy also added value during the Reporting Period. |
| Q | | How did the Fund’s enhanced roll-timing strategies impact performance during the Reporting Period? |
| A | | Our enhanced roll-timing strategies contributed positively to the Fund’s performance via exposure to commodity index-linked swaps. We employ an approach whereby we do not take active views on individual commodities but rather gain Fund exposure to commodities through investments whose performance is linked to commodity indices. |
| | We often implement commodity roll-timing strategies by deviating from the S&P GSCI® roll convention, which typically calls for rolling forward exposure at the front, or near-month, end of the futures curve on a monthly basis. The roll occurs during business days 5 through 9. To the extent our team believes fundamental or technical developments will impact the futures roll-timing decision, we will incorporate those views into the portfolio by electing to roll positions earlier, later, forward or in different weights versus the S&P GSCI® roll. Roll-timing strategies employed may include 1) alternative roll date modifications, which avoid the market impact of plain vanilla S&P GSCI® rolls during business days 5 to 9; 2) forward exposure roll modifications, which avoid the market impact of plain vanilla S&P GSCI® rolls and move exposure out the curve to mitigate the returns impact often associated with persistent contango; and 3) seasonal roll modifications, which take advantage of seasonal relationships in commodity markets to increase returns. During most of the Reporting Period, we employed a forward roll-timing strategy that rolled commodity exposures underlying the S&P GSCI® a few months out on the futures curve instead of rolling at the very front of the futures curve. |
| | The Fund’s deferred positioning across the commodities curves contributed positively to relative results in 2015. Returns were driven primarily by deferred crude oil, both West Texas Intermediate (“WTI”) and Brent, exposure and natural gas exposure. Persistently oversupplied crude oil markets, coupled with elevated production, helped pressure WTI crude oil inventories in the U.S. and Brent crude oil inventories globally. Natural gas inventories also maintained seasonally elevated levels, driven by strong production as well as by a very mild start, in terms of weather, to the 2015-16 winter. Elevated inventories, in turn, pressured the front end of the futures curve as storage became more costly. |
| Q | | How did you implement the Fund’s enhanced cash management strategy? |
| A | | In addition to seeking value through management of the commodities portion of the Fund’s portfolio, we also attempt to add a modest amount of excess return through thoughtful management of collateral held in the Fund. The cash portion of the Fund’s portfolio is typically allocated to high-grade collateral that includes U.S. Treasury securities, agency debentures, mortgage-backed securities and short-term fixed income instruments. During the Reporting Period, we favored high quality government and agency securities for the Fund’s collateral allocation. |
| Q | | How did the Fund use derivatives and similar instruments during the Reporting Period? |
| A | | As mentioned earlier in some detail, the Fund used commodity index-linked total return swaps in implementing our enhanced roll-timing strategies in order to gain exposure |
14
PORTFOLIO RESULTS
| | to the commodities markets. In implementing our enhanced cash management strategy, the Fund used futures, interest rate swaps and forward sales contracts, which are agency mortgage-backed derivatives used in purchasing a future issuance of agency mortgage-backed securities. The use of these instruments is integral to the Fund’s investment strategy, which realized negative absolute returns during the Reporting Period. |
| Q | | Did you make any changes in the Fund’s strategy or allocations during the Reporting Period? |
| A | | The Fund continued to hold exposure to the commodities markets primarily in the form of swaps linked to the S&P GSCI®. In the beginning of the Reporting Period, the Fund held six months forward exposure to the S&P GSCI®. In May 2015, the Fund shifted to a 25%/75% blend of three months forward and six months forward exposure in the futures curve across all commodities held in the S&P GSCI® via customized swaps on the S&P GSCI®. In October 2015, the Fund shifted to the front month exposure aligned with the S&P GSCI®. In December 2015, the Fund shifted to 25% six months forward exposure to the S&P GSCI®. |
| Q | | How was the Fund positioned at the end of the Reporting Period? |
| A | | At the end of the Reporting Period, the Fund’s positioning was deferred 25% six months forward across the stack of commodities curves. As described earlier, the Fund held exposure to the commodities underlying the S&P GSCI® through customized swaps in the Subsidiary and held no deferred commodity exposure at the end of the Reporting Period. (The Subsidiary has the same objective as the Fund, but unlike the Fund, it may invest, without limitation, in commodity index-linked securities, such as swaps and futures, that provide exposure to the performance of the commodity markets.) |
| | The cash portion of the Fund’s portfolio was allocated across various fixed income sectors, with an emphasis on the higher quality, lower volatility segments of the market, such as U.S. government and government-sponsored bonds. |
| Q | | Were there any changes to the Fund’s portfolio management team during the Reporting Period? |
| A | | There were no changes to the Fund’s portfolio management team during the Reporting Period. |
| Q | | What is the Fund’s view and strategy going forward? |
| A | | At the end of the Reporting Period, we held a bearish view toward many commodity markets, such as crude oil, natural gas, grains, gold and base metals. Crude oil markets remain in surplus, and we expect a new, higher volatility regime to replace the earlier, lower volatility in prices. Shale oil is the new balancing power, in our view, and we expect oil prices to eventually stabilize around a price that reflects shale oil’s marginal cost of production. We believe that natural gas prices may also continue to decline, as inventories remain seasonally high given an unusually warm winter through the end of 2015. Gold may underperform the S&P GSCI® as we expect the Fed to continue raising target interest rates. In our opinion, base metals may be further pressured by the continued slowdown in Chinese economic growth and industrial demand. We also believe that grain prices may weaken looking ahead to the South American harvest, as favorable changes to the weather, coupled with an expected increase in exports from Argentina, may bolster market supply. Irrespective of directionality, however, we believe the market will continue to hold opportunities for the active, relative value investor, especially amid a heightened volatility regime. Historically, volatility moves prices away from fundamentals and affords opportunities to the active investor. |
15
FUND BASICS
Commodity Strategy Fund
as of December 31, 2015
| | | | | | | | | | |
| | PERFORMANCE REVIEW | |
| | | January 1, 2015–December 31, 2015 | | Fund Total Return
(based on NAV)1 | | | S&P GSCI®2 | |
| | Class A | | | -32.43 | % | | | -32.86 | % |
| | Class C | | | -32.95 | | | | -32.86 | |
| | Institutional | | | -32.38 | | | | -32.86 | |
| | Class IR | | | -32.15 | | | | -32.86 | |
| | | Class R | | | -32.88 | | | | -32.86 | |
| | | |
| | | | | | | | | |
| | | July 31, 2015–December 31, 2015 | | Fund Total Return
(based on NAV)1 | | | S&P GSCI®2 | |
| | | Class R6 | | | -21.23 | % | | | -21.67 | % |
| | 1 | | The net asset value (“NAV”) represents the net assets of the class of the Fund (ex-dividend) divided by the total number of shares of the class outstanding. The Fund’s performance reflects the reinvestment of dividends and other distributions. The Fund’s performance does not reflect the deduction of any applicable sales charges. |
| | 2 | | The S&P GSCI® is an unmanaged composite index of commodity sector returns, representing an unleveraged, long-only investment in commodity futures that is broadly diversified across the spectrum of commodities. Individual components qualify for inclusion in the S&P GSCI® on the basis of liquidity and are weighted by their respective world production quantities. The figures for the S&P GSCI® do not include any deduction for fees, expenses or taxes. It is not possible to invest directly in an index. |
| | | | | | | | | | | | | | | | |
| | STANDARDIZED TOTAL RETURNS3 |
| | | For the period ended 12/31/15 | | One Year | | | Five Years | | | Since Inception | | | Inception Date |
| | Class A | | | -35.41 | % | | | -15.62 | % | | | -11.53 | % | | 3/30/07 |
| | Class C | | | -33.20 | | | | -15.46 | | | | -11.72 | | | 3/30/07 |
| | Institutional | | | -32.38 | | | | -14.62 | | | | -10.80 | | | 3/30/07 |
| | Class IR | | | -32.15 | | | | -14.63 | | | | -13.41 | | | 11/30/07 |
| | Class R | | | -32.88 | | | | -15.11 | | | | -13.89 | | | 11/30/07 |
| | | Class R6 | | | N/A | | | | N/A | | | | -21.23 | | | 7/31/15 |
| | 3 | | The Standardized Total Returns are average annual or cumulative total returns (only if the performance period is one year or less) as of the most recent calendar quarter-end or cumulative total returns for periods less than one year. They assume reinvestment of all distributions at NAV. These returns reflect a maximum initial sales charge of 4.5% for Class A Shares and the assumed contingent deferred sales charge for Class C Shares (1% if redeemed within 12 months of purchase). Because Institutional, Class IR, Class R and Class R6 Shares do not involve a sales charge, such a charge is not applied to their Standardized Total Returns. |
The returns set forth in the tables above represent past performance. Past performance does not guarantee future results. The Fund’s investment return and principal value will fluctuate so that an investor’s shares, when redeemed, may be worth more or less than their original cost. Current performance may be lower or higher than the performance quoted above. Please visit our web site at www.GSAMFUNDS.com to obtain the most recent month-end returns. Performance reflects applicable fee waivers and/or expense limitations in effect during the periods shown. In their absence, performance would be reduced. Returns do not reflect the deduction of taxes that a shareholder would pay on Fund distributions or the redemption of Fund shares.
16
FUND BASICS
| | | | | | | | | | |
| | EXPENSE RATIOS4 | |
| | | | | Net Expense Ratio (Current) | | | Gross Expense Ratio (Before Waivers) | |
| | Class A | | | 0.98 | % | | | 1.11 | % |
| | Class C | | | 1.72 | | | | 1.87 | |
| | Institutional | | | 0.63 | | | | 0.78 | |
| | Class IR | | | 0.71 | | | | 0.87 | |
| | Class R | | | 1.22 | | | | 1.37 | |
| | | Class R6 | | | 0.61 | | | | 0.76 | |
| | 4 | | The expense ratios of the Fund, both current (net of applicable fee waivers and/or expense limitations) and before waivers (gross of applicable fee waivers and/or expense limitations) are as set forth above according to the most recent publicly available Prospectus for the Fund and may differ from the expense ratios disclosed in the Financial Highlights in this report. The Fund’s waivers and/or expense limitations will remain in place through at least July 31, 2016, and prior to such date the Investment Adviser may not terminate the arrangements without the approval of the Fund’s Board of Trustees. If these arrangements are discontinued in the future, the expense ratios may change without shareholder approval. |
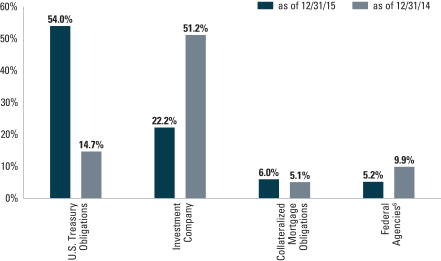
| | 5 | | The percentage shown for each investment category reflects the value of investments in that category as a percentage of net assets. Figures in the graph may not sum to 100% due to the exclusion of other assets and liabilities. Underlying sector allocations of Investment Companies held by the Fund are not reflected in the graph above. Consequently, the graph depicts the Fund’s investments but may not represent the Fund’s market exposure due to the exclusion of certain derivatives, if any, as listed in the Additional Investment Information section of the Schedule of Investments. |
| | 6 | | “Federal Agencies” are mortgage-backed securities guaranteed by the Government National Mortgage Association (“GNMA”), Federal National Mortgage Association (“FNMA”) or Federal Home Loan Mortgage Corp. (“FHLMC”). GNMA instruments are backed by the full faith and credit of the United States Government. |
17
GOLDMAN SACHS COMMODITY STRATEGY FUND
Performance Summary
December 31, 2015
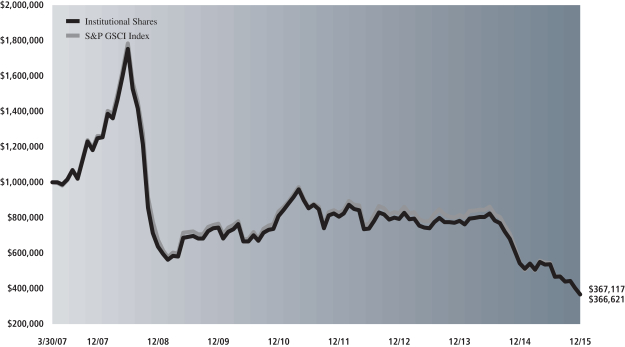
The following graph shows the value as of December 31, 2015, of a $1,000,000 investment made on March 30, 2007 (commencement of operations) in Institutional Shares at NAV. For comparative purposes, the performance of the Fund’s benchmark, the S&P GSCI® Total Return Index (Gross, USD, Unhedged) (“S&P GSCI Index”), is shown. This performance data represents past performance and should not be considered indicative of future performance, which will fluctuate with changes in market conditions. These performance fluctuations will cause an investor’s shares, when redeemed, to be worth more or less than their original cost. Performance reflects applicable fee waivers and/or expense limitations in effect during the periods shown and in their absence, performance would be reduced. Returns do not reflect the deduction of taxes that a shareholder would pay on Fund distributions or the redemption of Fund shares. Performance of Class A, Class C, Class IR, Class R and Class R6 Shares will vary from Institutional Shares due to differences in class specific fees and any applicable sales charges. In addition to the Investment Adviser’s decision regarding issuer/industry investment selection and allocation, other factors may affect Fund performance. These factors include, but are not limited to, Fund operating fees and expenses, portfolio turnover, and subscription and redemption cash flows affecting the Fund.
| | |
| Commodity Strategy Fund’s Lifetime Performance | | |
Performance of a $1,000,000 Investment, with distributions reinvested, from March 30, 2007 through December 31, 2015.
| | | | | | | | | | |
| Average Annual Total Return through December 31, 2015 | | | One Year | | | | Five Years | | | Since Inception |
Class A (Commenced March 30, 2007) | | | | | | | | | | |
Excluding sales charges | | | -32.43% | | | | -14.85% | | | -11.06% |
Including sales charges | | | -35.41% | | | | -15.62% | | | -11.53% |
|
Class C (Commenced March 30, 2007) | | | | | | | | | | |
Excluding contingent deferred sales charges | | | -32.95% | | | | -15.46% | | | -11.72% |
Including contingent deferred sales charges | | | -33.20% | | | | -15.46% | | | -11.72% |
|
Institutional (Commenced March 30, 2007) | | | -32.38% | | | | -14.62% | | | -10.80% |
|
Class IR (Commenced November 30, 2007) | | | -32.15% | | | | -14.63% | | | -13.41% |
|
Class R (Commenced November 30, 2007) | | | -32.88% | | | | -15.11% | | | -13.89% |
|
Class R6 (Commenced July 31, 2015) | | | N/A | | | | N/A | | | -21.23%* |
|
| * | | Total return for periods of less than one year represents cumulative total return. |
18
PORTFOLIO RESULTS
Goldman Sachs Dynamic Allocation Fund
Investment Objective
The Fund seeks long-term capital appreciation.
Portfolio Management Discussion and Analysis
Below, the Goldman Sachs Quantitative Investment Strategies (“QIS”) Team discusses the Goldman Sachs Dynamic Allocation Fund’s (the “Fund”) performance and positioning for the 12 month period ended December 31, 2015 (the “Reporting Period”).
| Q | | How did the Fund perform during the Reporting Period? |
| A | | During the Reporting Period, the Fund’s Class A, C, Institutional, IR and R Shares generated average annual total returns, without sales charges, of -7.17%, -7.82%, -6.84%, -6.90% and -7.35%, respectively. These returns compare to the 0.18% average annual total return of the Fund’s benchmark, the Bank of America Merrill Lynch USD LIBOR One-Month Constant Maturity Index (the “LIBOR One-Month Index”). The Dynamic Allocation Fund Composite Index, comprised 60% of the MSCI All Country World Index Investable Market Index (Net, USD, Unhedged) (“MSCI ACWI IMI”) and 40% of the Barclays Global Aggregate Bond Index (Gross, USD, Hedged) (“Barclays Bond Index”), returned -0.71% during the same period. The MSCI ACWI IMI and Barclays Bond Index posted average annual total returns of -2.19% and 1.02%, respectively, during the same period. |
| | Since their inception on July 31, 2015, the Fund’s Class R6 Shares generated a cumulative total return, without sales charge, of -5.48%. This return compares to the 0.08% cumulative total return of the LIBOR One-Month Index during the same period. The Dynamic Allocation Fund Composite Index returned -3.17% during the same period. The MSCI ACWI IMI and Barclays Bond Index posted cumulative total returns of -5.70% and 0.42%, respectively, during the same period. |
| | The Fund’s overall annualized volatility was 7.42% during the Reporting Period. To compare, the overall annualized volatility of the S&P 500® Index during the same time period was 15.43%. |
| Q | | What were the primary contributors to and detractors from the Fund’s performance based on your team’s asset allocation decisions during the Reporting Period? |
| A | | The Fund seeks to achieve its investment objective by investing primarily in exchange-traded funds (“ETFs”), stocks, futures, swaps, structured notes and other derivatives that provide exposure to a broad spectrum of asset classes, including but not limited to equities (both in U.S. and non-U.S. companies), fixed income (U.S. and non-U.S., investment grade and high yield) and commodities. Our team manages the Fund dynamically by changing its allocations to these asset classes based on our tactical views and in response to changing market conditions. Our team uses a disciplined, rigorous and quantitative approach, in combination with a qualitative overlay, in allocation to and within the asset classes in which the Fund invests. Allocations are adjusted within the Fund at least monthly based on continuous analysis to help determine which investments are relatively attractive and provide the best opportunities for growth in any given period of time. Since the markets represented by each investment are constantly changing, so are the Fund’s allocations. |
| | Overall, the Fund realized negative returns during the Reporting Period. Allocations to U.S. equities and emerging market equities detracted most from performance, as these asset classes performed weakly during the Reporting Period. These detractors were partially offset by allocations to Japanese equities and Australian equities, which contributed most positively to the Fund’s performance. |
19
PORTFOLIO RESULTS
| Q | | How did the Goldman Sachs Market Sentiment Indicator factor into risk allocation decisions that were made during the Reporting Period? |
| A | | The Goldman Sachs Market Sentiment Indicator (“MSI”) is a proprietary tool that analyzes how the markets will potentially respond to future global changes in financial, economic and sociopolitical events. With the help of the MSI, the Fund seeks to mitigate risk in unstable markets by reducing volatility. |
| | Shifts in central bank policy, global economic growth concerns centering around China, and the sell-off in commodities were key themes affecting the markets throughout 2015. In January 2015, the MSI was elevated but still below our de-risking level. Heightened volatility in core asset classes and developed international market currencies contributed to the elevated MSI level as a result of the dramatic appreciation of the Swiss franc. Throughout February and March 2015, the MSI stabilized amid mixed global equity market performance. By late June 2015, the MSI detected heightened levels of overall market distress, in part on the heels of the ongoing uncertainty surrounding Greece and whether or not it would remain in the euro. This led us to de-risk the Fund in July 2015. The Fund continued gradually decreasing its risk exposure until September 2015. After spiking in August 2015, the MSI steadily retreated through the fourth calendar quarter until mid-December 2015, when declines in high yield credit, driven by concerns about liquidity and persistent declines in oil prices, reverberated across global markets. The Fund ended the Reporting Period slightly below its full-risk target. |
| Q | | How did the Fund use derivatives and similar instruments during the Reporting Period? |
| A | | The Fund invested in futures and total return swaps to achieve exposure to equities (both in U.S. and non-U.S. companies), and the Fund used futures, interest rate swaps and credit default swaps to achieve exposure to fixed income (U.S. and non-U.S., investment grade and high yield) during the Reporting Period. The Fund also used futures, total return swaps and commodity index-linked structured notes to gain exposure to commodities. The use of these instruments is integral to the Fund’s investment strategy, which realized negative absolute returns during the Reporting Period. |
| Q | | What changes did you make within the Fund during the Reporting Period? |
| A | | During the Reporting Period, the Fund adjusted its exposure to asset classes as market conditions shifted. Indeed, during the first months of the Reporting Period, the Fund increased and then, going into the summer of 2015, tapered its overall exposure, finishing the Reporting Period with larger overall exposures than at the beginning of the Reporting Period. Most notably, from the start to the end of the Reporting Period, the Fund increased its allocations to fixed income and credit, while it decreased its allocations to U.S. and non-U.S. equities along with commodities. |
| Q | | Were there any changes to the Fund’s portfolio management team during the Reporting Period? |
| A | | Edward J. Tostanoski III was named a portfolio manager of the Fund during the Reporting Period. Edward joined the QIS Macro Alpha team in 2007 and is a senior portfolio manager on the team. Steve Jeneste is no longer a portfolio manager of the Fund, moving internally within the firm to the Customized Beta Strategies team. Also, Osman Ali is no longer a portfolio manager of the Fund, now more exclusively focused on QIS equity strategies, across both alpha and advanced beta platforms. |
| Q | | What is the Fund’s asset allocation view and strategy for the months ahead? |
| A | | At the end of December 2015, amid year-end market turbulence, the Fund decreased its exposure to credit, U.S. and non-U.S. equities and fixed income. That said, the Fund held the majority of its exposure in global equities and fixed income as of December 31, 2015. The Fund also maintained exposure to credit and Treasury inflation protected securities (“TIPS”) and minimal exposure to commodities at the end of the Reporting Period. |
| | We continue to believe the Fund’s dynamic allocation approach is important because it can adapt to changing markets, seeking what we believe are the best opportunities for investment and attempting to mitigate risk when the markets become unstable. There is no guarantee that the Fund’s dynamic management strategy will cause it to achieve its investment objective. |
20
FUND BASICS
Dynamic Allocation Fund
as of December 31, 2015
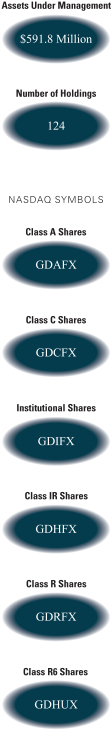
| | | | | | | | | | | | | | | | | | | | | | |
| | PERFORMANCE REVIEW | |
| | | January 1, 2015–
December 31, 2015 | | Fund Total
Return
(based on NAV)1 | | | Bank of
America Merrill
Lynch USD LIBOR
One-Month Constant
Maturity Index2 | | | Dynamic
Allocation Fund
Composite
Index3 | | | MSCI All
Country
World Index
Investable
Market Index4 | | | Barclays
Global
Aggregate
Bond Index5 | |
| | Class A | | | -7.17 | % | | | 0.18 | % | | | -0.71 | % | | | -2.19 | % | | | 1.02 | % |
| | Class C | | | -7.82 | | | | 0.18 | | | | -0.71 | | | | -2.19 | | | | 1.02 | |
| | Institutional | | | -6.84 | | | | 0.18 | | | | -0.71 | | | | -2.19 | | | | 1.02 | |
| | Class IR | | | -6.90 | | | | 0.18 | | | | -0.71 | | | | -2.19 | | | | 1.02 | |
| | | Class R | | | -7.35 | | | | 0.18 | | | | -0.71 | | | | -2.19 | | | | 1.02 | |
| | | | | | |
| | | | | | | | | | | | | | | | | | |
| | | July 31, 2015–December 31,
2015 | | | | | | | | | | | | | | | |
| | | Class R6 | | | -5.48 | % | | | 0.08 | % | | | -3.17 | % | | | -5.70 | % | | | 0.42 | % |
| | 1 | | The net asset value (“NAV”) represents the net assets of the class of the Fund (ex-dividend) divided by the total number of shares of the class outstanding. The Fund’s performance reflects the reinvestment of dividends and other distributions. The Fund’s performance does not reflect the deduction of any applicable sales charges. |
| | 2 | | The Bank of America Merrill Lynch USD LIBOR One-Month Constant Maturity Index tracks the performance of a synthetic asset paying Libor to a stated maturity. The Index is based on the assumed purchase at par of a synthetic instrument having exactly its stated maturity and with a coupon equal to that day’s fixing rate. That issue is assumed to be sold the following business day (priced at a yield equal to the current day fixing rate) and rolled into a new instrument. The Index figures do not reflect any deduction for fees, expenses or taxes. It is not possible to invest directly in an index. |
| | 3 | | The Dynamic Allocation Fund Composite Index is comprised 60% of the MSCI ACWI IMI Index and 40% of the Barclays Bond Index. |
| | 4 | | The MSCI All Country World Index Investable Market Index (“MSCI ACWI IMI Index”) is a free float-adjusted market capitalization weighted index that is designed to measure the equity market performance of developed and emerging markets. The MSCI ACWI IMI Index consists of 45 country indices comprising 24 developed and 21 emerging market country indices. The developed market country indices included are: Australia, Austria, Belgium, Canada, Denmark, Finland, France, Germany, Greece, Hong Kong, Ireland, Israel, Italy, Japan, Netherlands, New Zealand, Norway, Portugal, Singapore, Spain, Sweden, Switzerland, the United Kingdom and the United States. The emerging market country indices included are: Brazil, Chile, China, Colombia, Czech Republic, Egypt, Hungary, India, Indonesia, Korea, Malaysia, Mexico, Morocco, Peru, Philippines, Poland, Russia, South Africa, Taiwan, Thailand, and Turkey. The Index figures do not reflect any deduction for fees, expenses or taxes. It is not possible to invest directly in an index. |
| | 5 | | The Barclays Global Aggregate Bond Index (“Barclays Bond Index”) provides a broad-based measure of the global investment-grade fixed income markets. The three major components of the Barclays Bond Index are the U.S. Aggregate, the Pan-European Aggregate, and the Asian-Pacific Aggregate Indices. The Barclays Bond Index also includes Eurodollar and Euro-Yen corporate bonds, Canadian government, agency and corporate securities, and USD investment grade 144A securities. The Barclays Bond Index figures do not reflect any deduction for fees, expenses or taxes. It is not possible to invest directly in an index. |
The returns set forth in the table above represent past performance. Past performance does not guarantee future results. The Fund’s investment return and principal value will fluctuate so that an investor’s shares, when redeemed, may be worth more or less than their original cost. Current performance may be lower or higher than the performance quoted above. Please visit our web site at www.GSAMFUNDS.com to obtain the most recent month-end returns. Performance reflects applicable fee waivers and/or expense limitations in effect during the periods shown. In their absence, performance would be reduced. Returns do not reflect the deduction of taxes that a shareholder would pay on Fund distributions or the redemption of Fund shares.
21
FUND BASICS
| | | | | | | | | | | | | | | | |
| | STANDARDIZED TOTAL RETURNS6 |
| | | For the period ended 12/31/15 | | One Year | | | Five Years | | | Since Inception | | | Inception Date |
| | Class A | | | -12.27 | % | | | -0.03 | % | | | 1.15 | % | | 1/5/10 |
| | Class C | | | -8.75 | | | | 0.34 | | | | 1.36 | | | 1/5/10 |
| | Institutional | | | -6.84 | | | | 1.49 | | | | 2.52 | | | 1/5/10 |
| | Class IR | | | -6.90 | | | | 1.35 | | | | 2.37 | | | 1/5/10 |
| | Class R | | | -7.35 | | | | 0.84 | | | | 1.86 | | | 1/5/10 |
| | | Class R6 | | | N/A | | | | N/A | | | | -5.48 | | | 7/31/15 |
| | 6 | | The Standardized Total Returns are average annual or cumulative total returns (only if the performance period is one year or less) as of the most recent calendar quarter-end and cumulative total returns for periods less than one year. They assume reinvestment of all distributions at NAV. These returns reflect a maximum initial sales charge of 5.5% for Class A Shares and the assumed contingent deferred sales charge for Class C Shares (1% if redeemed within 12 months of purchase). Because Institutional, Class IR, Class R and Class R6 Shares do not involve a sales charge, such a charge is not applied to their Standardized Total Returns. |
The returns set forth in the table above represent past performance. Past performance does not guarantee future results. The Fund’s investment return and principal value will fluctuate so that an investor’s shares, when redeemed, may be worth more or less than their original cost. Current performance may be lower or higher than the performance quoted above. Please visit our web site at www.GSAMFUNDS.com to obtain the most recent month-end returns. Performance reflects applicable fee waivers and/or expense limitations in effect during the periods shown. In their absence, performance would be reduced. Returns do not reflect the deduction of taxes that a shareholder would pay on Fund distributions or the redemption of Fund shares.
| | | | | | | | | | |
| | EXPENSE RATIOS7 | |
| | | | | Net Expense Ratio (Current) | | | Gross Expense Ratio (Before Waivers) | |
| | Class A | | | 1.26 | % | | | 1.50 | % |
| | Class C | | | 2.00 | | | | 2.25 | |
| | Institutional | | | 0.84 | | | | 1.10 | |
| | Class IR | | | 1.00 | | | | 1.25 | |
| | Class R | | | 1.52 | | | | 1.70 | |
| | | Class R6 | | | 0.82 | | | | 1.08 | |
| | 7 | | The expense ratios of the Fund, both current (net of applicable fee waivers and/or expense limitations) and before waivers (gross of applicable fee waivers and/or expense limitations) are as set forth above according to the most recent publicly available Prospectus for the Fund and may differ from the expense ratios disclosed in the Financial Highlights in this report. Pursuant to a contractual arrangement, the Fund’s waivers and/or expense limitations will remain in place through at least July 31, 2016, and prior to such date the Investment Adviser may not terminate the arrangements without the approval of the Fund’s Board of Trustees. If these arrangements are discontinued in the future, the expense ratios may change without shareholder approval. |
22
FUND BASICS
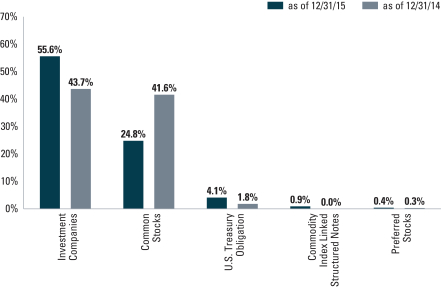
| | 8 | | The Fund is actively managed and, as such, its composition may differ over time. The percentage shown for each investment category reflects the value of investments in that category as a percentage of net assets. Figures in the above graph may not sum to 100% due to the exclusion of other assets and liabilities. Underlying sector allocations of Investment Companies held by the Fund are not reflected in the graph above. Consequently, the Fund’s overall sector allocations may differ from the percentages contained in the graph above. The above graph depicts the Fund’s investments but may not represent the Fund’s market exposure due to the exclusion of certain derivatives, if any, as listed in the Additional Investment Information section of the Schedule of Investments. |
23
GOLDMAN SACHS DYNAMIC ALLOCATION FUND
Performance Summary
December 31, 2015
The following graph shows the value as of December 31, 2015, of a $1,000,000 investment made on January 5, 2010 (commencement of operations) in Institutional Shares at NAV. For comparative purposes, the performance of the Fund’s benchmarks, the Bank of America Merrill Lynch USD LIBOR One-Month Constant Maturity Index (the “LIBOR One-Month Index”), Barclays Global Aggregate Bond Index (USD, Hedged) (“Barclays Bond Index”), and the MSCI All Country World Index Investable Market (Net, USD, Unhedged) (“MSCI ACWI IMI”) is shown. This performance data represents past performance and should not be considered indicative of future performance, which will fluctuate with changes in market conditions. These performance fluctuations will cause an investor’s shares, when redeemed, to be worth more or less than their original cost. Performance reflects applicable fee waivers and/or expense limitations in effect during the periods shown and in their absence, performance would be reduced. Returns do not reflect the deduction of taxes that a shareholder would pay on Fund distributions or the redemption of Fund shares. Performance of Class A, Class C, Class IR, Class R and Class R6 Shares will vary from Institutional Shares due to differences in class specific fees and any applicable sales charges. In addition to the Investment Adviser’s decision regarding issuer/industry investment selection and allocation, other factors may affect Fund performance. These factors include, but are not limited to, Fund operating fees and expenses, portfolio turnover, and subscription and redemption cash flows affecting the Fund.
| | |
| Dynamic Allocation Fund’s Lifetime Performance | | |
Performance of a $1,000,000 Investment, with distributions reinvested, from January 5, 2010 through December 31, 2015.
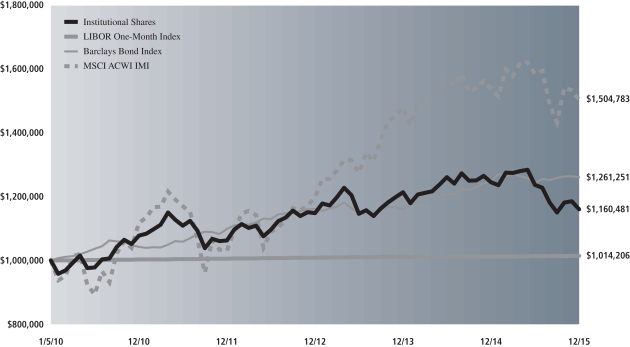
| | | | | | | | | | |
| Average Annual Total Return through December 31, 2015 | | | One Year | | | | Five Years | | | Since Inception |
Class A (Commenced January 5, 2010) | | | | | | | | | | |
Excluding sales charges | | | -7.17% | | | | 1.10% | | | 2.11% |
Including sales charges | | | -12.27% | | | | -0.03% | | | 1.15% |
|
Class C (Commenced January 5, 2010) | | | | | | | | | | |
Excluding contingent deferred sales charges | | | -7.82% | | | | 0.34% | | | 1.36% |
Including contingent deferred sales charges | | | -8.75% | | | | 0.34% | | | 1.36% |
|
Institutional (Commenced January 5, 2010) | | | -6.84% | | | | 1.49% | | | 2.52% |
|
Class IR (Commenced January 5, 2010) | | | -6.90% | | | | 1.35% | | | 2.37% |
|
Class R (Commenced January 5, 2010) | | | -7.35% | | | | 0.84% | | | 1.86% |
|
Class R6 (Commenced July 31, 2015) | | | N/A | | | | N/A | | | -5.48%* |
|
| * | | Total return for periods of less than one year represents cumulative total return. |
24
PORTFOLIO RESULTS
Goldman Sachs Dynamic Commodity Strategy Fund
Investment Objective
The Fund seeks long-term total return.
Portfolio Management Discussion and Analysis
Below, the Goldman Sachs Commodities Team discusses the Goldman Sachs Dynamic Commodity Strategy Fund’s (the “Fund”) performance and positioning for the 12-month period ended December 31, 2015 (the “Reporting Period”).
| Q | | How did the Fund perform during the Reporting Period? |
| A | | During the Reporting Period, the Fund’s Class A, C, Institutional, IR and R Shares generated average annual total returns, without sales charges, of -23.54%, -24.17%, -23.35%, -23.38% and -23.72%, respectively. These returns compare to the -24.66% average annual total return of the Fund’s benchmark, the Bloomberg Commodity Index® Total Return (the “Commodity Index”) during the same period. |
| Q | | What economic and market factors most influenced the commodities markets as a whole during the Reporting Period? |
| A | | Commodities markets, as measured by the Commodity Index, experienced great challenges during the Reporting Period overall, returning nearly -24.7%. By comparison, the S&P 500® Index and the U.S. Dollar Index (“DXY”) returned 1.38% and 9.3%, respectively.1 |
| | Weakness in the commodities markets during the Reporting Period can be attributed to several macro factors. The U.S. dollar continued to strengthen, fueled by improving economic indicators in the U.S. and the anticipation of central bank policy divergence with the U.S. Federal Reserve (the “Fed”) beginning to raise its target interest rate in December 2015. Outside the U.S., the trend of monetary policy easing intensified with the European Central Bank and the Bank of Japan continuing their respective programs of quantitative easing. Further, Chinese economic data continued to disappoint, with its government attempting to smoothly transition into a slower growth economy. |
| | The energy subsector of the Commodity Index was weakest, returning -38.9% during the Reporting Period. The persisting global oversupply in crude oil weakened prices. Global production remained elevated, and the latest OPEC (“Organization of the Petroleum Exporting Countries”) meeting in December 2015 yielded no cuts to production. Additionally, shale production cuts in the U.S. underwhelmed the market (i.e. fell short of broad consensus hopes). Natural gas prices also fell, as strong production and an unusually warm start to the 2015-16 winter kept inventories at seasonally high levels. |
| | The industrial metals component of the Commodity Index returned -26.9% for the Reporting Period overall. Prices declined broadly, as the Chinese economy, the largest consumer of industrial metals, continued to show signs of deceleration. Additionally, the strengthening U.S. dollar weighed on prices of dollar-denominated commodities. |
| | Agriculture was also down within the Commodity Index, returning -15.6% for the Reporting Period. Grains continued to weaken as the 2015 U.S. harvest progressed at healthy levels and weak export data against a backdrop of an already well-supplied market increased the expected carryover in supply to next year. Additionally, favorable changes in the weather in South America and potential increases in Argentinean exports further bolstered forecasted inventories. |
| | The precious metals subsector of the Commodity Index returned -11.5% during the Reporting Period. Precious metals prices weakened ahead of the first interest rate hike by the Fed in nearly a decade. Increasing interest rates tend to make non-yielding assets like gold less attractive to investors. |
| | 1 | | The S&P 500® Index is the Standard & Poor’s 500 Composite Index of 500 stocks, an unmanaged index of common stock prices. The DXY is a measure of the general international value of the U.S. dollar as calculated by averaging the exchange rates between the U.S. dollar and six major world currencies. |
25
PORTFOLIO RESULTS
| Q | | What key factors were responsible for the Fund’s performance during the Reporting Period? |
| A | | The Fund is a long-only, actively managed fund that seeks to generate alpha, or added value, principally through overweight and underweight positioning in individual commodities relative to the Commodity Index. In addition, the Fund’s portfolio may be positioned on commodity curves at different nodes, or segments, from the Commodity Index, and it may include allocations to out-of-benchmark commodities, all with the intention of capturing active returns in excess of the Commodity Index. As such, we believe this strategy provides an efficient way to gain broad commodity exposure in a long-only, unlevered and actively managed portfolio by combining beta, or market, exposure with our ability to implement views on individual commodities and sectors. |
| | | During the Reporting Period, absolute returns disappointed, but the Fund generated returns that outperformed the Commodity Index. The Fund’s outperformance was largely driven by its underweight positioning in grains, particularly in corn and wheat, as the U.S. harvest in 2015 progressed at a healthy pace and expected inventories were substantial. |
| Q | | Which positions contributed most positively to the Fund’s performance during the Reporting Period? |
| A | | As indicated, within agriculture, the Fund’s underweighted position relative to the Commodity Index in grains contributed most positively to relative returns, as the healthy progress of the 2015 harvest weighed on prices. Similarly, within energy, the Fund’s underweighted exposure compared to the Commodity Index to crude oil contributed positively to returns, as the persistent oversupply in global crude oil markets drove prices lower. |
| | | Also, the Fund invests a portion of its cash collateral in the Goldman Sachs Financial Square Government Fund2 — a high quality money market portfolio that comprises U.S. government and U.S. Treasury securities, including bills, bonds, notes and repurchase agreements. |
| Q | | Which positions detracted significantly from the Fund’s performance during the Reporting Period? |
| A | | Within metals, the Fund’s out-of-benchmark exposure to platinum and palladium detracted most from returns, as a slowdown in Chinese auto demand, for which the metals are used in the production of catalytic converters, weighed on prices. Additionally, the market remained well supplied, despite concerns about production in Russia and South Africa, where a miner strike in 2014 had halted production. |
| Q | | How did the Fund use derivatives and similar instruments during the Reporting Period? |
| A | | The Fund seeks to maintain substantial economic exposure to the performance of the commodities markets by investing in a wholly-owned subsidiary of the Fund organized as a company under the laws of the Cayman Islands (the “Subsidiary”) and in commodity index-linked notes. The Subsidiary primarily obtains its commodity exposure investing in commodity- linked derivative instruments, including total return swaps. The Subsidiary also invests in other instruments, including fixed income securities, either as investments or to serve as margin or collateral for its swap positions. The use of these instruments is integral to the Fund’s investment strategy, which realized negative absolute returns during the Reporting Period. |
| Q | | Did you make any changes in the Fund’s strategy or allocations during the Reporting Period? |
| A | | During the Reporting Period, relative to the Commodity Index, we decreased the Fund’s exposure to commodities overall, increasing underweights within energy and metals in particular. We correspondingly increased the Fund’s position in cash and cash equivalents. |
| Q | | Were there any changes to the Fund’s portfolio management team during the Reporting Period? |
| A | | There were no changes to the Fund’s portfolio management team during the Reporting Period. |
| Q | | How was the Fund positioned at the end of the Reporting Period? |
| A | | At the end of the Reporting Period, the Fund was underweight relative to the Commodity Index in crude oil, natural gas and grains. In the metals subsectors, the Fund held exposure to platinum and palladium versus underweights in gold and industrial metals at the end of the Reporting Period. |
| | 2 | | An investment in a money market portfolio is not insured or guaranteed by the Federal Deposit Insurance Corporation or any other government agency. Although a money market portfolio seeks to preserve the value of an investment at $1.00 per share, it is possible to lose money by investing in a money market portfolio. |
26
PORTFOLIO RESULTS
| Q | | What is the Fund’s view and strategy going forward? |
| A | | At the end of the Reporting Period, we held a bearish view toward many commodity markets, such as crude oil, natural gas, grains, gold and base metals. Crude oil markets remain in surplus, and we expect a new, higher volatility regime to replace the earlier, lower volatility in prices. Shale oil is the new balancing power, in our view, and we expect oil prices to eventually stabilize around a price that reflects shale oil’s marginal cost of production. In our opinion, natural gas prices may also continue to decline as inventories remain seasonally high given an unusually warm winter through the end of 2015. In addition, it is our view that gold may underperform the Commodity Index as we expect the Fed to continue raising target interest rates. Base metals, in our opinion, may be further pressured by the continued slowdown in Chinese economic growth and industrial demand. We believe grain prices may weaken looking ahead to the South American harvest, as favorable changes to the weather, coupled with an expected increase in exports from Argentina, may bolster market supply. Irrespective of directionality, however, we believe the market will continue to hold opportunities for the active, relative value investor, especially amid a heightened volatility regime. Historically, volatility moves prices away from fundamentals and affords opportunities to the active investor. |
27
FUND BASICS
Dynamic Commodity Strategy Fund
as of December 31, 2015
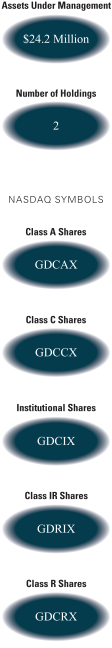
| | | | | | | | | | |
| | PERFORMANCE REVIEW | |
| | | January 1, 2015–December 31, 2015 | | Fund Total Return
(based on NAV)1 | | | Bloomberg
Commodity Index2 | |
| | Class A | | | -23.54 | % | | | -24.66 | % |
| | Class C | | | -24.17 | | | | -24.66 | |
| | Institutional | | | -23.35 | | | | -24.66 | |
| | Class IR | | | -23.38 | | | | -24.66 | |
| | | Class R | | | -23.72 | | | | -24.66 | |
| | 1 | | The net asset value (“NAV”) represents the net assets of the class of the Fund (ex-dividend) divided by the total number of shares of the class outstanding. The Fund’s performance reflects the reinvestment of dividends and other distributions. The Fund’s performance does not reflect the deduction of any applicable sales charges. |
| | 2 | | The Bloomberg Commodity Index Total Return (the “Index”) is designed to be a highly liquid and diversified benchmark for the commodity futures market. It is rules based and composed of futures contracts on physical commodities. The index is unhedged and expressed in USD. The Index is reweighted and rebalanced each year in January on a price-percentage basis. Rebalancing and reweighting means that, in general, the index may reallocate out of commodities that have appreciated in value and into commodities that have underperformed. To the extent that commodity markets exhibit mean-reverting characteristics over time, this approach may help enhance performance. |
The returns set forth in the table above represent past performance. Past performance does not guarantee future results. The Fund’s investment return and principal value will fluctuate so that an investor’s shares, when redeemed, may be worth more or less than their original cost. Current performance may be lower or higher than the performance quoted above. Please visit our web site at www.GSAMFUNDS.com to obtain the most recent month-end returns. Performance reflects applicable fee waivers and/or expense limitations in effect during the periods shown. In their absence, performance would be reduced. Returns do not reflect the deduction of taxes that a shareholder would pay on Fund distributions or the redemption of Fund shares.
28
FUND BASICS
| | | | | | | | | | | | |
| | STANDARDIZED TOTAL RETURNS3 |
| | | For the period ended 12/31/15 | | One Year | | | Since Inception | | | Inception Date |
| | Class A | | | -26.97 | % | | | -28.22 | % | | 4/30/14 |
| | Class C | | | -24.93 | | | | -26.81 | | | 4/30/14 |
| | Institutional | | | -23.35 | | | | -26.01 | | | 4/30/14 |
| | Class IR | | | -23.38 | | | | -26.08 | | | 4/30/14 |
| | | Class R | | | -23.72 | | | | -26.45 | | | 4/30/14 |
| | 3 | | The Standardized Total Returns are average annual total returns as of the most recent calendar quarter-end. They assume reinvestment of all distributions at NAV. These returns reflect a maximum initial sales charge of 4.5% for Class A Shares and the assumed contingent deferred sales charge for Class C Shares (1% if redeemed within 12 months of purchase). Because Institutional, Class IR and Class R Shares do not involve a sales charge, such a charge is not applied to their Standardized Total Returns. |
The returns set forth in the table above represent past performance. Past performance does not guarantee future results. The Fund’s investment return and principal value will fluctuate so that an investor’s shares, when redeemed, may be worth more or less than their original cost. Current performance may be lower or higher than the performance quoted above. Please visit our web site at www.GSAMFUNDS.com to obtain the most recent month-end returns. Performance reflects applicable fee waivers and/or expense limitations in effect during the periods shown. In their absence, performance would be reduced. Returns do not reflect the deduction of taxes that a shareholder would pay on Fund distributions or the redemption of Fund shares.
| | | | | | | | | | |
| | EXPENSE RATIOS4 | |
| | | | | Net Expense Ratio (Current) | | | Gross Expense Ratio (Before Waivers) | |
| | Class A | | | 1.23 | % | | | 2.46 | % |
| | Class C | | | 2.02 | | | | 3.22 | |
| | Institutional | | | 0.91 | | | | 2.12 | |
| | Class IR | | | 1.01 | | | | 2.22 | |
| | | Class R | | | 1.51 | | | | 2.72 | |
| | 4 | | The expense ratios of the Fund, both current (net of applicable fee waivers and/or expense limitations) and before waivers (gross of applicable fee waivers and/or expense limitations) are as set forth above according to the most recent publicly available Prospectus for the Fund and may differ from the expense ratios disclosed in the Financial Highlights in this report. Pursuant to a contractual arrangement, the Fund’s waivers and/or expense limitations will remain in place through at least July 31, 2016, and prior to such date the Investment Adviser may not terminate the arrangements without the approval of the Fund’s Board of Trustees. If these arrangements are discontinued in the future, the expense ratios may change without shareholder approval. |
29
FUND BASICS
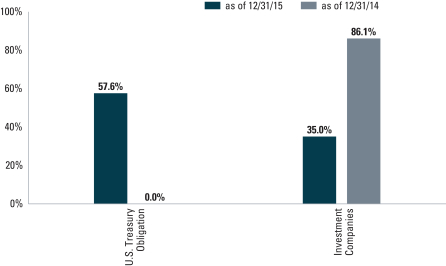
| | 5 | | The Fund is actively managed and, as such, its composition may differ over time. The percentage shown for each investment category reflects the value of investments in that category as a percentage of net assets. Figures in the above graph may not sum to 100% due to the exclusion of other assets and liabilities. Underlying sector allocations of Investment Companies held by the Fund are not reflected in the graph above. Consequently, the graph depicts the Fund’s investments but may not represent the Fund’s market exposure due to the exclusion of certain derivatives, if any, as listed in the Additional Investment Information section of the Schedule of Investments. |
30
GOLDMAN SACHS DYNAMIC COMMODITY STRATEGY FUND
Performance Summary
December 31, 2015
The following graph shows the value as of December 31, 2015, of a $1,000,000 investment made on April 30, 2014 (commencement of operations) in Institutional Shares at NAV. For comparative purposes, the performance of the Fund’s benchmark, the Bloomberg Commodity Index Total Return is shown. This performance data represents past performance and should not be considered indicative of future performance, which will fluctuate with changes in market conditions. These performance fluctuations will cause an investor’s shares, when redeemed, to be worth more or less than their original cost. Performance reflects applicable fee waivers and/or expense limitations in effect during the periods shown and in their absence, performance would be reduced. Returns do not reflect the deduction of taxes that a shareholder would pay on Fund distributions or the redemption of Fund shares. Performance of Class A, Class C, Class IR and Class R Shares will vary from Institutional Shares due to differences in class specific fees and any applicable sales charges. In addition to the Investment Adviser’s decision regarding issuer/industry investment selection and allocation, other factors may affect Fund performance. These factors include, but are not limited to, Fund operating fees and expenses, portfolio turnover, and subscription and redemption cash flows affecting the Fund.
| | |
| Dynamic Commodity Strategy Fund’s Lifetime Performance | | |
Performance of a $1,000,000 Investment, with distributions reinvested, from April 30, 2014 through December 31, 2015.
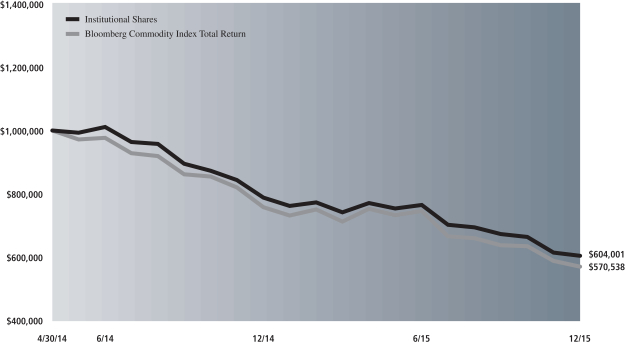
| | | | | | |
| Average Annual Total Return through December 31, 2015 | | | One Year | | | Since Inception |
Class A (Commenced April 30, 2014) | | | | | | |
Excluding sales charges | | | -23.54% | | | -26.23% |
Including sales charges | | | -26.97% | | | -28.22% |
|
Class C (Commenced April 30, 2014) | | | | | | |
Excluding contingent deferred sales charges | | | -24.17% | | | -26.81% |
Including contingent deferred sales charges | | | -24.93% | | | -26.81% |
|
Institutional (Commenced April 30, 2014) | | | -23.35% | | | -26.01% |
|
Class IR (Commenced April 30, 2014) | | | -23.38% | | | -26.08% |
|
Class R (Commenced April 30, 2014) | | | -23.72% | | | -26.45% |
|
31
PORTFOLIO RESULTS
Goldman Sachs Managed Futures Strategy Fund
Investment Objective
The Fund seeks to generate long-term absolute return.
Portfolio Management Discussion and Analysis
Below, the Goldman Sachs Quantitative Investment Strategies Team discusses the Goldman Sachs Managed Futures Strategy Fund’s (the “Fund”) performance and positioning for the 12-month period ended December 31, 2015 (the “Reporting Period”).
| Q | | How did the Fund perform during the Reporting Period? |
| A | | During the Reporting Period, the Fund’s Class A, C, Institutional, IR and R Shares generated average annual total returns, without sales charges, of 9.69%, 8.93%, 10.24%, 10.08% and 9.47%, respectively. These returns compare to the 0.18% average annual total return of the Fund’s benchmark, the Bank of America Merrill Lynch USD LIBOR One-Month Constant Maturity Index (the “LIBOR One- Month Index”), during the same time period. |
| | We note that the Fund’s benchmark being the LIBOR One- Month Index is a means of emphasizing that the Fund has an unconstrained strategy. That said, this Fund employs a benchmark agnostic strategy and thus we believe that comparisons to a benchmark index are not particularly relevant. |
| | The Fund’s overall annualized volatility was 7.62% during the Reporting Period, while the overall annualized volatility of the S&P® 500 Index during the same time period was 15.43%. |
| Q | | What were the primary contributors to and detractors from the Fund’s performance during the Reporting Period? |
| A | | The Fund implements a trend-following strategy that takes long and/or short positions in a wide range of asset classes, including equities, fixed income and currencies, among others, to seek long-term absolute return. The Fund seeks to achieve its investment objective by investing primarily in a portfolio of equities, equity index futures, bonds, bond futures, equity swaps, interest rate swaps, currency forwards and non-deliverable forwards, options, exchange-traded funds (“ETFs”) and structured securities. As a result of the Fund’s use of derivatives, the Fund may also hold significant amounts of U.S. Treasuries or short-term investments. The Fund’s investments are made without restriction as to issuer capitalization, country, currency, maturity or credit rating. |
| | Positive Fund performance for the Reporting Period overall can be attributed primarily to January and July 2015, only partially offset by negative performance mostly concentrated in April and November 2015. |
| | During the Reporting Period, the primary positive contributors to Fund performance were positions in event-driven strategies, short positions in emerging market currencies and short positions in commodities. Within event-driven strategies, the primary positive contributors to returns were Fund positions in U.S. equities, Australian fixed income and U.S. fixed income. The Fund’s position in U.K. fixed income modestly detracted from returns. Emerging market currencies saw many volatile movements during the Reporting Period, with most of the emerging market currencies depreciating throughout 2015 and most evidently during the fourth calendar quarter. Within the Fund’s emerging market currencies exposure, the Fund’s short positions in the Malaysian ringgit, Colombian peso, South African rand and Brazilian real contributed most positively to returns during the Reporting Period. The only emerging market currency position that detracted from Fund performance during the Reporting Period was a long position in the Indian rupee. Commodity prices tumbled during the Reporting Period, with crude oil prices ending 2015 approximately 33% lower. Within the Fund’s overall short commodity exposure, all individual positions contributed positively to returns during the Reporting Period. In particular, the Fund’s short positions in industrial metals, petroleum and livestock contributed the most toward positive returns. |
| Q | | How did the Fund use derivatives and similar instruments during the Reporting Period? |
| A | | The Fund used derivatives, including futures, swaps and forwards, to implement long and short positions. The Fund invested in futures and currency forwards to achieve |
32
PORTFOLIO RESULTS
| | exposure to equities (both in U.S. and non-U.S. companies) and currencies (U.S. and non-U.S. currencies), respectively. The Fund used interest rate swaps and currency forwards to achieve exposure to fixed income. We used sector-based commodity-linked structured notes as a means of expressing momentum/trend views on various commodity assets. The use of these instruments is integral to the Fund’s investment strategy, which realized positive absolute returns during the Reporting Period. |
| Q | | What changes did you make within the Fund during the Reporting Period? |
| A | | In early 2015, the Fund was net long a broad basket of international developed market equities as well as U.S. equities. The Fund also had a smaller positive exposure to emerging market equities. The Fund was generally net short both international developed market currencies and emerging market currencies. The Fund was net long in its exposures to fixed income, primarily through net long positions in short-term U.K. and U.S. fixed income. The Fund began the Reporting Period with short exposure to commodities. |
| | By mid-2015, the Fund remained net long a broad basket of international developed market equities and also remained net long in U.S. equity markets. Due to weakening momentum in emerging markets and repercussions of a poorly performing Chinese equity market, the Fund reversed its long positions in emerging market equities and instead held short positions in emerging market currencies. While still maintaining net long positions in short-term fixed income, the Fund changed course and held net short exposure to long-term fixed income from May to July 2015. The Fund continued to hold a net short position in developed and emerging market currencies. The Fund also maintained its net short exposure to commodities through mid-2015 with the exception of May when the Fund had a modest net long position in commodities. |
| | Through late 2015, the Fund reduced its net long exposure to international developed equities, including U.S. equities. The Fund also slightly increased its short exposure to emerging market equities due to the observance of strong downward trends in emerging markets. Starting in August 2015, the Fund maintained net long exposure to short-, medium- and long-term fixed income. The Fund remained net short in international developed currencies and emerging market currencies. Within commodities, the Fund continued to hold a net short position in a broad basket of commodities, with its largest net short positions toward the end of the Reporting Period in grains and precious metals. |
| Q | | Were there any changes to the Fund’s portfolio management team during the Reporting Period? |
| A | | Effective April 30, 2015, Alex Wang, CFA, became the lead portfolio manager of the Fund. Alex had been working on the macro trading strategies within the Quantitative Investment Strategies (“QIS”) team since he joined the firm in 2010. In addition, he developed and traded tactical models for all major global macro asset classes. Alex also served as a co-portfolio manager for a number of other funds and separate accounts trading global macro strategies. Effective July 2015, Alex Wang left the firm. Alex’s portfolio management responsibilities were assumed by James Park, managing director and senior portfolio manager on the QIS Macro Alpha Strategies team. |
| | Alex had shared portfolio management responsibilities for the Fund with Bill Fallon and James Park. Bill is a managing director and Chief Investment Officer of the QIS Macro Alpha Strategies team. He has been a QIS team member since 2004 and has 11 years of investment experience. All of Alex’s direct investment responsibilities within the QIS Macro Alpha Strategies team were performed within a team leadership structure. Therefore, there were no interruptions in day-to-day investment decision-making in any portfolio. His primary research and portfolio responsibilities were absorbed by James Park. |
| Q | | What is the Fund’s tactical asset allocation view and strategy for the months ahead? |
| A | | Going into the start of 2016, we intend to continue to seek to identify price trends in various asset classes over short-, medium- and long-term horizons via a proprietary investment model. Upon identifying a trend in a given instrument or asset, the Fund will take a long or short position in the instrument or asset. Long positions benefit from an increase in price of the underlying instrument or asset, while short positions benefit from a decrease in price of the underlying instrument or asset. The size of the Fund’s position in an instrument or asset is primarily related to the strength of the overall trend identified by the investment model. |
| | We continue to believe that the Fund’s trend-following strategy is important because it can adapt to changing markets, seeking what we believe are the best opportunities for investment and attempting to mitigate risk when the markets become unstable. There is no guarantee that the Fund’s trend-following strategy will cause it to achieve its investment objective. |
33
FUND BASICS
Managed Futures Strategy Fund
as of December 31, 2015

| | | | | | | | | | |
| | PERFORMANCE REVIEW | |
| | | January 1, 2015–December 31, 2015 | | Fund Total Return
(based on NAV)1 | | | Bank of America Merrill Lynch
USD LIBOR One-Month Constant
Maturity Index2 | |
| | Class A | | | 9.69 | % | | | 0.18 | % |
| | Class C | | | 8.93 | | | | 0.18 | |
| | Institutional | | | 10.24 | | | | 0.18 | |
| | Class IR | | | 10.08 | | | | 0.18 | |
| | | Class R | | | 9.47 | | | | 0.18 | |
| | 1 | | The net asset value (“NAV”) represents the net assets of the class of the Fund (ex-dividend) divided by the total number of shares of the class outstanding. The Fund’s performance reflects the reinvestment of dividends and other distributions. The Fund’s performance does not reflect the deduction of any applicable sales charges. |
| | 2 | | The Bank of America Merrill Lynch USD One-Month LIBOR Constant Maturity Index tracks the performance of a synthetic asset paying LIBOR to a stated maturity. The index is based on the assumed purchase at par of a synthetic instrument having exactly its stated maturity and with a coupon equal to that day’s fixing rate. That issue is assumed to be sold the following business day (priced at a yield equal to the current day fixing rate) and rolled into a new instrument. The index figures do not reflect any deduction for fees, expenses or taxes. It is not possible to invest directly in an index. |
| | | | | | | | | | | | |
| | STANDARDIZED TOTAL RETURNS3 |
| | | For the period ended 12/31/15 | | One Year | | | Since Inception | | | Inception Date |
| | Class A | | | 3.68 | % | | | 0.32 | % | | 2/29/12 |
| | Class C | | | 7.90 | | | | 1.02 | | | 2/29/12 |
| | Institutional | | | 10.24 | | | | 2.21 | | | 2/29/12 |
| | Class IR | | | 10.08 | | | | 2.06 | | | 2/29/12 |
| | | Class R | | | 9.47 | | | | 1.53 | | | 2/29/12 |
| | 3 | | The Standardized Total Returns are average annual total returns as of the most recent calendar quarter-end. They assume reinvestment of all distributions at NAV. These returns reflect a maximum initial sales charge of 5.5% for Class A Shares and the assumed contingent deferred sales charge for Class C Shares (1% if redeemed within 12 months of purchase). Because Institutional, Class IR and Class R Shares do not involve a sales charge, such a charge is not applied to their Standardized Total Returns. |
The returns set forth in the tables above represent past performance. Past performance does not guarantee future results. The Fund’s investment return and principal value will fluctuate so that an investor’s shares, when redeemed, may be worth more or less than their original cost. Current performance may be lower or higher than the performance quoted above. Please visit our web site at www.GSAMFUNDS.com to obtain the most recent month-end returns. Performance reflects applicable fee waivers and/or expense limitations in effect during the periods shown. In their absence, performance would be reduced. Returns do not reflect the deduction of taxes that a shareholder would pay on Fund distributions or the redemption of Fund shares.
34
FUND BASICS
| | | | | | | | | | |
| | EXPENSE RATIOS4 | |
| | | | | Net Expense Ratio (Current) | | | Gross Expense Ratio (Before Waivers) | |
| | Class A | | | 1.72 | % | | | 2.07 | % |
| | Class C | | | 2.47 | | | | 2.80 | |
| | Institutional | | | 1.32 | | | | 1.65 | |
| | Class IR | | | 1.47 | | | | 1.80 | |
| | | Class R | | | 1.97 | | | | 2.31 | |
| | 4 | | The expense ratios of the Fund, both current (net of applicable fee waivers and/or expense limitations) and before waivers (gross of applicable fee waivers and/or expense limitations) are as set forth above according to the most recent publicly available Prospectus for the Fund and may differ from the expense ratios disclosed in the Financial Highlights in this report. Pursuant to a contractual arrangement, the Fund’s waivers and/or expense limitations will remain in place through at least July 31, 2016, and prior to such date the Investment Adviser may not terminate the arrangements without the approval of the Fund’s Board of Trustees. If these arrangements are discontinued in the future, the expense ratios may change without shareholder approval. |
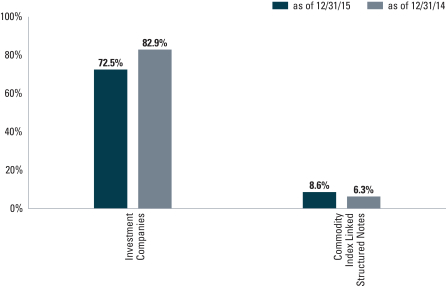
| | 5 | | The Fund is actively managed and, as such, its composition may differ over time. The percentage shown for each investment category reflects the value of investments in that category as a percentage of net assets. Figures in the above graph may not sum to 100% due to the exclusion of other assets and liabilities. Underlying sector allocations of investment companies held by the Fund, if any, are not reflected in the graph above. Consequently, the Fund’s overall sector allocations may differ from the percentages contained in the graph above. The graph depicts the Fund’s investments but may not represent the Fund’s market exposure due to the exclusion of certain derivatives, if any, as listed in the Additional Investment Information section of the Schedule of Investments. |
35
GOLDMAN SACHS MANAGED FUTURES STRATEGY FUND
Performance Summary
December 31, 2015
The following graph shows the value as of December 31, 2015, of a $1,000,000 investment made on February 29, 2012 (commencement of operations) in Institutional Shares at NAV. For comparative purposes, the performance of the Fund’s benchmark, the Bank of America Merrill Lynch USD LIBOR One-Month Constant Maturity Index (the “LIBOR One-Month Index”), is shown. This performance data represents past performance and should not be considered indicative of future performance, which will fluctuate with changes in market conditions. These performance fluctuations will cause an investor’s shares, when redeemed, to be worth more or less than their original cost. Performance reflects applicable fee waivers and/or expense limitations in effect during the periods shown and in their absence, performance would be reduced. Returns do not reflect the deduction of taxes that a shareholder would pay on Fund distributions or the redemption of Fund shares. Performance of Class A, Class C, Class IR and Class R Shares will vary from Institutional Shares due to differences in class specific fees and any applicable sales charges. In addition to the Investment Adviser’s decision regarding issuer/industry investment selection and allocation, other factors may affect Fund performance. These factors include, but are not limited to, Fund operating fees and expenses, portfolio turnover, and subscription and redemption cash flows affecting the Fund.
| | |
| Managed Futures Strategy Fund’s Lifetime Performance | | |
Performance of a $1,000,000 Investment, with distributions reinvested, from February 29, 2012 through December 31, 2015.
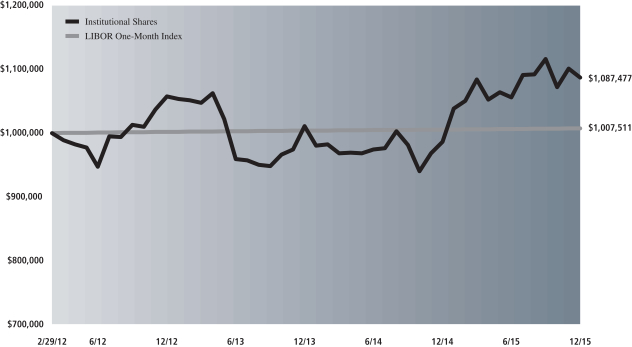
| | | | | | | | | | |
| Average Annual Total Return through December 31, 2015 | | | One Year | | | | Three Years | | | Since Inception |
Class A (Commenced February 29, 2012) | | | | | | | | | | |
Excluding sales charges | | | 9.69% | | | | 0.50% | | | 1.80% |
Including sales charges | | | 3.68% | | | | -1.36% | | | 0.32% |
|
Class C (Commenced February 29, 2012) | | | | | | | | | | |
Excluding contingent deferred sales charges | | | 8.93% | | | | -0.27% | | | 1.02% |
Including contingent deferred sales charges | | | 7.90% | | | | -0.27% | | | 1.02% |
|
Institutional (Commenced February 29, 2012) | | | 10.24% | | | | 0.92% | | | 2.21% |
|
Class IR (Commenced February 29, 2012) | | | 10.08% | | | | 0.77% | | | 2.06% |
|
Class R (Commenced February 29, 2012) | | | 9.47% | | | | 0.23% | | | 1.53% |
|
36
GOLDMAN SACHS REAL ESTATE SECURITIES FUNDS
What Differentiates the Goldman Sachs Real Estate Securities Investment Process?
The Goldman Sachs Global Real Estate Securities, International Real Estate Securities and Real Estate Securities Funds seek to generate long-term growth of capital and dividend income by investing primarily in real estate industry companies, including REITs, on an international or domestic basis, respectively. REITs which offer daily liquidity have historically strong returns, low volatility and low correlation to traditional asset classes.

Buy high quality companies.
We seek to purchase those companies that combine attractive exposures, management teams, capital structures and growth prospects.
Buy at a reasonable price.
We seek to consistently select securities that are trading at discounts to their intrinsic value.
Diversification reduces risk.
We seek to diversify the portfolio holdings based on property type and geographic markets to manage risk without compromising returns.

Team Based:
Portfolio decisions are made by the entire team.
Continuous Scrutiny:
Market, industry and company developments are reviewed daily.
Fundamental Analysis:
Portfolio holdings are determined by the risk/reward characteristics of an issuer and the team’s conviction in the overall business and management’s ability to create value.

Real estate securities portfolio that:
| n | | is a high quality portfolio that is strategically positioned for long-term growth potential |
| n | | is a result of bottom-up stock selection with a focus on long-term investing |
37
PORTFOLIO RESULTS
Goldman Sachs Global Real Estate Securities Fund
Investment Objective
The Fund seeks total return comprised of long-term growth of capital and dividend income.
Portfolio Management Discussion and Analysis
The Goldman Sachs Global Real Estate Securities Fund (the “Fund’) launched on August 31, 2015. Below, the Goldman Sachs Real Estate Securities Investment Team discusses the Fund’s performance and positioning for the period from inception on August 31, 2015 through December 31, 2015 (the “Reporting Period”).
| Q | | How did the Fund perform during the Reporting Period? |
| A | | During the Reporting Period, the Fund’s Class A, C, Institutional, IR, R and R6 Shares generated cumulative total returns, without sales charges, of 5.71%, 5.41%, 5.81%, 5.78%, 5.65% and 5.82%, respectively. These returns compare to the 5.69% cumulative total return of the Fund’s benchmark, the FTSE EPRA/NAREIT Developed Index (Gross, USD, Unhedged) (the “FTSE Index”) during the same period. |
| Q | | What economic and market factors most influenced the global real estate securities market as a whole during the Reporting Period? |
| A | | For the Reporting Period overall, the global real estate securities market, as measured by the FTSE Index, gained 5.69%. The U.S. Federal Reserve’s (the “Fed”) decision to raise interest rates in December 2015 had a muted effect on the global real estate market, as many international central banks maintained a loose, or accommodative, monetary policy. The U.S. and Australia were the top performing markets within the FTSE Index, while Canada and the U.K. underperformed most. The U.S. economy’s steady recovery and the real estate investment trust (“REIT”) industry’s encouraging fundamental backdrop acted as tailwinds during the Reporting Period for the U.S. real estate market. The Australian market benefited from gradual improvements to its economy, particularly stronger growth in employment and positive consumer sentiment data. Currency weakness and a challenging economic backdrop adversely impacted real estate valuations in Canada. The U.K. central bank had signaled concern about the U.K. real estate market, specifically commercial real estate and the “buy-to-rent” residential market, and thus the U.K. REIT market struggled. |
| Q | | What key factors were responsible for the Fund’s performance during the Reporting Period? |
| A | | The Fund generally outperformed the FTSE Index during the Reporting Period. Stock selection in Australia, the U.S. and the U.K. contributed most positively to the Fund’s relative results. Having exposure to China, which is not a component of the FTSE Index and which outperformed the FTSE Index, and having an underweighted allocation to Hong Kong, which significantly lagged the FTSE Index during the Reporting Period, also helped. Partially offsetting these positive contributors was stock selection in Singapore and Japan, which detracted. There were no significant detractors from an allocation perspective during the Reporting Period. |
| Q | | What were some of the Fund’s best-performing individual holdings? |
| A | | Data center provider CyrusOne was the top positive contributor to the Fund’s performance. Its shares gained, as investors appeared constructive on CyrusOne’s significant growth potential and differentiated business model as well as on its progress integrating its recent acquisition, Cervalis Holdings. We believe CyrusOne is well positioned to serve the data storage needs of enterprise customers, and, as a result, we expect the company to benefit from demand growth. Additionally, we view the strength of CyrusOne’s sales force and customer penetration among Fortune 1000 companies as meaningful competitive advantages. We also remained encouraged at the end of the Reporting Period by the company’s opportunity to increasingly provide its services to small and mid-size customers. Overall, we believe the stock continued to present at the end of the Reporting Period a compelling risk/reward opportunity given what we consider to be its attractive valuation and prospects for future growth. |
38
PORTFOLIO RESULTS
| | Mirvac Group, an Australian-based REIT that invests and manages office, retail, industrial and residential assets, was also a top contributor to the Fund’s relative returns. We added to the Fund’s existing position at what we considered to be an attractive valuation after its shares underperformed due to concerns about a slowing residential market in New South Wales, where Mirvac Group has the majority of its residential exposure. The company recovered strongly in the fourth quarter of 2015, as investors reacted positively to news that its board would secure and deliver solid earnings per share growth. At the end of the Reporting Period, we remained positive on Mirvac Group’s strong balance sheet, large commercial leasing portfolio and quality management team. |
| Q | | Which positions detracted significantly from the Fund’s performance during the Reporting Period? |
| A | | RLJ Lodging Trust, a select-service hotel owner, was the top detractor from the Fund’s results during the Reporting Period. In a difficult industry environment, investors were increasingly cautious on both demand trends in Houston and new supply in New York City, two of the company’s larger markets. Despite short-term weakness, we remained optimistic on RLJ Lodging Trust’s focus on select-service hotels, as these assets historically tend to have significantly higher margins and free cash flow yields compared to their full-service peers. Furthermore, the company’s management team, which we view as one of the best in the industry, is repositioning the company’s portfolio toward high quality urban markets, where competition for land keeps supply more muted. Overall, we remained constructive at the end of the Reporting Period on RLJ Lodging Trust’s internal and external growth opportunities, and we viewed its shares as attractively valued relative to its peers. |
| | City Developments, a diversified landlord and real estate developer in Singapore, was also a top detractor from the Fund’s performance during the Reporting Period. Shares of the company declined following news of slowing domestic home sales and on concerns about flattening and possibly contracting real estate values in Singapore. In addition, market participants were disappointed by the newly elected government’s decision to not loosen real estate policies that were imposed in prior years. While we maintained a cautious view on Singapore at the end of the Reporting Period, we maintained high conviction in City Developments given what we see as its pricing power and potential to benefit from improving demand. Furthermore, we viewed the company as well managed and its stock as undervalued relative to peers. |
| Q | | How did the Fund use derivatives and similar instruments during the Reporting Period? |
| A | | The Fund did not use derivatives during the Reporting Period. |
| Q | | Did the Fund make any significant purchases or sales during the Reporting Period? |
| A | | Given the Fund’s launch date on August 31, 2015, it was not a matter of making purchases and sales but of building the Fund’s portfolio during the Reporting Period. |
| Q | | Were there any changes made in the Fund’s investment strategy during the Reporting Period? |
| A | | In constructing the Fund’s portfolio, we focus on picking securities rather than on making regional, country or subsector bets. We seek to outpace the benchmark index by overweighting stocks that we expect to outperform and underweighting those that we think may lag. Consequently, changes in its regional or subsector weights are generally the direct result of individual stock selection or of real estate securities’ appreciation or depreciation. That said, given the Fund’s launch date on August 31, 2015, there were not many significant changes in market exposures during the Reporting Period. However, the Fund’s exposure to the U.S. and the U.K. did increase relative to the FTSE Index from the start to the end of the Reporting Period, and its position in cash decreased. |
| Q | | How was the Fund positioned relative to its benchmark index at the end of the Reporting Period? |
| A | | From a country perspective, the Fund was modestly overweighted relative to the FTSE Index in the U.S. and Continental Europe real estate markets and was rather neutrally weighted compared to the FTSE Index in the other constituent countries of the FTSE Index at the end of December 2015 and also had exposure to China, which is not a component of the FTSE Index. |
| Q | | What is the Fund’s tactical view and strategy for the months ahead? |
| A | | At the end of the Reporting Period, we believed that global REITs can continue to generate positive returns during 2016 given reasonable demand in most subsectors and the industry’s overall favorable supply picture. |
| | In the U.S., while new supply is growing due to the attractive spread, or differential, between development yields and cap rates, it is still below demand, and we believe this may lead |
39
PORTFOLIO RESULTS
| | to further increases in occupancy levels and rental rates as well as to higher re-leasing spreads on expiring leases. (Cap rate, or capitalization rate, is a rate of return on a real estate investment property based on the expected income that the property will generate. Capitalization rate is used to estimate the investor’s potential return on his or her investment.) In our view, this encouraging fundamental backdrop coupled with both an accommodative financing environment and a robust transaction market may support additional gains by the REIT asset class. Furthermore, we believed at the end of the Reporting Period that a number of U.S. REITs were trading significantly below their private market values, presenting management teams with a variety of strategic options to increase shareholder value. More specifically, REITs trading at discounts to their net asset values may be considered as possible acquisition candidates. In addition, certain REITs may decide to sell select assets at premium valuations in the private market and use the proceeds to repurchase company stock or recycle capital into accretive development projects. |
| | Separately, while we do expect interest rates to gradually move higher in the U.S., they remain low by historical standards, and we believe that investors may well continue to appreciate the yield and growth attributes of the REIT asset class. Unlike fixed income, the majority of REITs operate dynamic businesses that can still potentially create value and growth even with rising interest rates. |
| | Outside of the U.S., policy makers and central bankers have enacted supportive measures in an effort to sustain economic growth and combat low inflation. We believe this dynamic will continue in 2016, and consequently interest rates in many developed and emerging markets may remain low for an extended period of time. In our view, this favorable backdrop may benefit REITs in securing financing and deploying capital toward high quality projects that may have the potential to drive future growth. In addition, the subdued environment since the global financial crisis has kept new real estate development at lower levels, leading to a rather stable rental and yield outlook for the asset class going forward. |
| | As fundamental, bottom-up investors, we believe we are seeing opportunities that go beyond the headline risks associated with certain regions. We intend to continue to focus our approach on those companies that have well-capitalized balance sheets and that possess quality attributes, such as a robust business model, a high quality asset exposure and a strong management team with a sound reinvestment strategy. Overall, we believe that global REITs can continue to offer attractive risk-adjusted returns, relative to fixed income in particular, given their potential yield, diversification and inflation hedge benefits. |
40
FUND BASICS
Global Real Estate Securities Fund
as of December 31, 2015
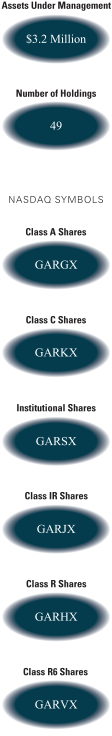
| | | | | | | | | | |
| | PERFORMANCE REVIEW | |
| | | August 31, 2015–December 31, 2015 | | Fund Total Return
(based on NAV)1 | | | FTSE EPRA/
NAREIT Developed Index
(Gross, USD, Unhedged)2 | |
| | Class A | | | 5.71 | % | | | 5.69 | % |
| | Class C | | | 5.41 | | | | 5.69 | |
| | Institutional | | | 5.81 | | | | 5.69 | |
| | Class IR | | | 5.78 | | | | 5.69 | |
| | Class R | | | 5.65 | | | | 5.69 | |
| | | Class R6 | | | 5.82 | | | | 5.69 | |
| | 1 | | The net asset value (“NAV”) represents the net assets of the class of the Fund (ex-dividend) divided by the total number of shares of the class outstanding. The Fund’s performance reflects the reinvestment of dividends and other distributions. The Fund’s performance does not reflect the deduction of any applicable sales charges. |
| | 2 | | The FTSE EPRA/NAREIT Developed Index is designed to measure the stock performance of companies engaged in specific real estate activities of the North American, European and Asian real estate markets. Relevant real estate activities are defined as the ownership, trading and development of income-producing real estate. |
| | | | | | | | |
| | STANDARDIZED TOTAL RETURNS3 |
| | | For the period ended 12/31/15 | | Since Inception | | | Inception Date |
| | Class A | | | -0.09 | % | | 8/31/15 |
| | Class C | | | 3.39 | | | 8/31/15 |
| | Institutional | | | 5.81 | | | 8/31/15 |
| | Class IR | | | 5.78 | | | 8/31/15 |
| | Class R | | | 5.65 | | | 8/31/15 |
| | | Class R6 | | | 5.82 | | | 8/31/15 |
| | 3 | | The Standardized Total Returns are cumulative total returns as of the most recent calendar quarter-end. They assume reinvestment of all distributions at NAV. These returns reflect a maximum initial sales charge of 5.5% for Class A Shares, and the assumed contingent deferred sales charge for Class C Shares (1% if redeemed within 12 months of purchase). Because Institutional, Service, Class IR, Class R and Class R6 Shares do not involve a sales charge, such a charge is not applied to their Standardized Total Returns. |
The returns set forth in the tables above represent past performance. Past performance does not guarantee future results. The Fund’s investment return and principal value will fluctuate so that an investor’s shares, when redeemed, may be worth more or less than their original cost. Current performance may be lower or higher than the performance quoted above. Please visit our web site at www.GSAMFUNDS.com to obtain the most recent month-end returns. Performance reflects applicable fee waivers and/or expense limitations in effect during the periods shown. In their absence, performance would be reduced. Returns do not reflect the deduction of taxes that a shareholder would pay on Fund distributions or the redemption of Fund shares.
41
FUND BASICS
| | | | | | | | | | |
| | EXPENSE RATIOS4 | |
| | | | | Net Expense Ratio (Current) | | | Gross Expense Ratio (Before Waivers) | |
| | Class A | | | 1.40 | % | | | 2.34 | % |
| | Class C | | | 2.15 | | | | 3.09 | |
| | Institutional | | | 1.00 | | | | 1.94 | |
| | Class IR | | | 1.15 | | | | 2.09 | |
| | Class R | | | 1.65 | | | | 2.59 | |
| | | Class R6 | | | 0.98 | | | | 1.92 | |
| | 4 | | The expense ratios of the Fund, both current (net of applicable fee waivers and/or expense limitations) and before waivers (gross of applicable fee waivers and/or expense limitations) are as set forth above according to the most recent publicly available Prospectus for the Fund and may differ from the expense ratios disclosed in the Financial Highlights in this report. Pursuant to a contractual arrangement, the Fund’s waivers and/or expense limitations will remain in place through at least August 31, 2016, and prior to such date the Investment Adviser may not terminate the arrangements without the approval of the Fund’s Board of Trustees. If these arrangements are discontinued in the future, the expense ratios may change without shareholder approval. |
| | | | | | | | | | |
| | TOP TEN HOLDINGS AS OF 12/31/155 |
| | | Holding | | % of Total Net Assets | | | Subsectors | | Country |
| | Simon Property Group, Inc. (REIT) | | | 5.6 | % | | Retail | | United States |
| | Mitsui Fudosan Co. Ltd. | | | 4.0 | | | Office | | Japan |
| | AvalonBay Communities, Inc. (REIT) | | | 3.9 | | | Residential | | United States |
| | Public Storage (REIT) | | | 3.7 | | | Industrial | | United States |
| | Boston Properties, Inc. (REIT) | | | 3.4 | | | Office | | United States |
| | Vornado Realty Trust (REIT) | | | 3.1 | | | Diversified | | United States |
| | Ventas, Inc. (REIT) | | | 3.1 | | | Health Care | | United States |
| | Prologis, Inc. (REIT) | | | 3.0 | | | Industrial | | United States |
| | Klepierre (REIT) | | | 2.9 | | | Retail | | France |
| | | Sun Hung Kai Properties Ltd. | | | 2.6 | | | Diversified | | Hong Kong |
| | 5 | | The top 10 holdings may not be representative of the Fund’s future investments. |
42
FUND BASICS
|
| FUND VS. BENCHMARK SECTOR ALLOCATION6 |
| As of December 31, 2015 |
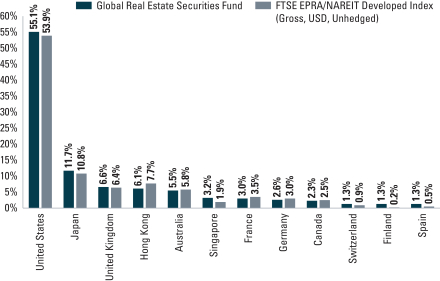
| | 6 | | The Fund is actively managed and, as such, its composition may differ over time. Consequently, the Fund’s overall country allocations may differ from percentages contained in the graph above. The percentage shown for each investment category reflects the value of investments in that category as a percentage of market value. |
43
PORTFOLIO RESULTS
Goldman Sachs International Real Estate Securities Fund
Investment Objective
The Fund seeks total return comprised of long-term growth of capital and dividend income.
Portfolio Management Discussion and Analysis
Below, the Goldman Sachs Real Estate Securities Investment Team discusses the Goldman Sachs International Real Estate Securities Fund’s (the “Fund”) performance and positioning for the 12-month period ended December 31, 2015 (the “Reporting Period”).
| Q | | How did the Fund perform during the Reporting Period? |
| A | | During the Reporting Period, the Fund’s Class A, C, Institutional and IR Shares generated average annual total returns, without sales charges, of -2.25%, -3.03%, -1.73% and -2.04%, respectively. These returns compare to the -3.23% average annual total return of the Fund’s benchmark, the FTSE EPRA/NAREIT Developed Ex-US Real Estate Index (Gross, USD, Unhedged) (the “Real Estate Index”) during the same period. |
| | Since their inception on July 31, 2015, the Fund’s Class R6 Shares generated a cumulative total return, without sales charge, of -5.03%. This return compares to the -5.25% cumulative total return of the Index during the same period. |
| Q | | What economic and market factors most influenced the international real estate securities market as a whole during the Reporting Period? |
| A | | For the Reporting Period overall, the international real estate securities market, as measured by the Real Estate Index, underperformed the U.S. real estate securities market, as measured by the Wilshire Real Estate Securities Index1 (with dividends reinvested), by nearly eight percentage points, and underperformed the broad international equity market, as measured by the MSCI EAFE® Index2 (net), by just more than two percentage points. |
| | During the first quarter of 2015, the Real Estate Index increased solidly. Despite the likelihood that the U.S. would raise interest rates in the near future, the international real estate securities market responded positively in anticipation of monetary policies remaining accommodative outside the U.S. During the first quarter of 2015, Continental Europe was a top performer due to the launch of the European Central Bank’s quantitative easing program and the resulting downward move in European interest rates. Merger and acquisition activity and credit growth helped lift the region even higher. Canada was the only detractor, as the country continued to be negatively impacted by weakness in energy prices. |
| | The Real Estate Index then declined during the second quarter of 2015. Despite this near-term weakness, tenant demand remained strong across a number of international markets. During the second quarter of 2015, Hong Kong and the U.K. were the top performing markets, while Continental Europe and Japan lagged the Real Estate Index. The Hong Kong market benefited from historically low levels of prime office supply and an increase in tenancy. The U.K. market was supported by the U.K. economy, which continued to perform well. Results of the U.K. national elections in May 2015 proved to be a significant positive surprise to its financial markets. Continental Europe underperformed, as interest rates in the region increased and uncertainty about the Greek debt crisis contributed to a sell-off in risk assets. Increases in Japanese government bond yields was a factor impacting the Japanese real estate market’s underperformance. |
| | The Real Estate Index continued to fall during the third quarter of 2015. Continental Europe and the U.K. were the top performing markets, while Singapore and Hong Kong underperformed most. Continental Europe benefited from the spread of an economic recovery from Spain and Ireland to Italy, as rents started to rise, albeit from a rather depressed |
44
| | 1 | | The Wilshire Real Estate Securities Index measures U.S. publicly- traded real estate securities. Designed to offer a market-based index that is more reflective of real estate held by pension funds, the index is comprised of publicly-traded real estate equity securities and unencumbered by limitations of other appraisal-based indexes. |
| | 2 | | The MSCI EAFE Index serves as a benchmark of the performance in major international equity markets as represented by 21 major MSCI indexes from Europe, Australia and Southeast Asia. |
PORTFOLIO RESULTS
| | base. More challenged growth prospects and currency weakness adversely impacted real estate valuations in Singapore and Hong Kong. |
| | During the fourth quarter of 2015, the Real Estate Index rebounded somewhat, posting modestly positive returns. The U.S. Federal Reserve’s (the “Fed”) decision to raise interest rates in December 2015 had a muted effect on the international real estate market, as many international central banks maintained a loose monetary policy. During the fourth quarter of 2015, Australia and Singapore were the top performing markets, while the U.K. and Canada underperformed most. The Australian market benefited from gradual improvements to the economy, particularly stronger growth in employment and positive consumer sentiment data. China has impactful geographical exposure to several REITs in Singapore. Therefore, steady and robust real estate market performance in China led to better REIT performance in Singapore. The U.K. central bank had signaled concern about the U.K. real estate market, specifically commercial real estate and the “buy-to-rent” residential market, and thus the U.K. REIT market struggled. Currency weakness and a challenging economic backdrop adversely impacted real estate valuations in Canada. |
| | For the Reporting Period overall, the strongest markets in the Real Estate Index were Israel, Continental Europe and the U. K. Conversely, Canada, Hong Kong and Singapore were the weakest performers within the Real Estate Index during the Reporting Period. |
| Q | | What key factors were responsible for the Fund’s performance during the Reporting Period? |
| A | | While absolute returns were disappointing, the Fund outperformed the Real Estate Index on a relative basis during the Reporting Period. Stock selection in Hong Kong, the U. K. and Australia contributed most positively to the Fund’s relative results. Having exposure to China, which is not a component of the Real Estate Index and which outperformed the Real Estate Index, and having underweighted allocations to Hong Kong and Singapore, which significantly lagged the Real Estate Index during the Reporting Period, also helped. Partially offsetting these positive contributors was stock selection in Singapore, which detracted. Having exposure to India, which is not a component of the Real Estate Index but which performed poorly during the Reporting Period, also dampened the Fund’s relative results. |
| Q | | What were some of the Fund’s best-performing individual holdings? |
| A | | During the Reporting Period, a position in Big Yellow Group, the leading self-storage operator in the U.K., was the top contributor to the Fund’s relative returns. The company experienced strong tailwinds from an improving domestic economy, driving up occupancy. Additionally, Big Yellow Group employs a dynamic pricing model that ensures increased incremental pricing as occupancy increases, which allowed the company to maximize revenues per store. Despite concerns regarding the strength of the broader U.K. real estate market, Big Yellow Group performed well. |
| | Mirvac Group, an Australian-based REIT that invests and manages office, retail, industrial and residential assets, was also a top contributor to the Fund’s relative returns. We added to the Fund’s existing position at what we considered to be an attractive valuation after its shares underperformed due to concern about a slowing residential market in New South Wales, where Mirvac Group has the majority of its residential exposure. The company recovered strongly in the fourth quarter of 2015, as investors reacted positively to news that its board would secure and deliver solid earnings per share growth. At the end of the Reporting Period, we remained positive on Mirvac Group’s strong balance sheet, large commercial leasing portfolio and quality management team. |
| Q | | Which positions detracted significantly from the Fund’s performance during the Reporting Period? |
| A | | City Developments, a diversified landlord and real estate developer in Singapore, was the top detractor from the Fund’s performance during the Reporting Period. Shares of the company declined following news of slowing domestic home sales and on concerns about flattening and possibly contracting real estate values in Singapore. In addition, market participants were disappointed by the newly elected government’s decision to not loosen real estate policies that were imposed in prior years. While we maintained a cautious view on Singapore at the end of the Reporting Period, we maintained high conviction in City Developments given its pricing power and potential to benefit from improving demand. Furthermore, we viewed the company as well managed and its stock as undervalued relative to peers. |
| | Nomura Real Estate Office Fund, a Japanese REIT that invests in office properties, was also a top detractor from the Fund’s performance during the Reporting Period. The Japanese REIT market experienced a rally that began in |
45
PORTFOLIO RESULTS
| | the fourth quarter of 2014 and peaked in January 2015. A subsequent correction occurred, as Japanese REITs issued new equity to acquire real estate at yields that were not particularly accretive due to the tight cap rate environment among high quality assets in Japan. (Cap rate, or capitalization rate, is a rate of return on a real estate investment property based on the expected income that the property will generate. Capitalization rate is used to estimate the investor’s potential return on his or her investment.) In late May 2015, Nomura Group announced an intended merger of three of its subsidiary Japanese REITS, including Nomura Real Estate Office Fund, Nomura Real Estate Master Fund and Nomura Real Estate Residential Fund. We subsequently converted the Fund’s position in Nomura Real Estate Office Fund into Nomura Real Estate Master Fund. The merged entity, into which we converted the Fund’s existing holdings, benefited during the second half of the Reporting Period from an enhanced platform for achieving rent and asset acquisition pricing. |
| Q | | How did the Fund use derivatives and similar instruments during the Reporting Period? |
| A | | The Fund did not use derivatives during the Reporting Period. |
| Q | | Did the Fund make any significant purchases or sales during the Reporting Period? |
| A | | We established a new Fund position in Japan Retail Fund Investment, a large, established Japanese REIT focused on the retail sector. We initiated this position at what we considered to be an attractive valuation after shares underperformed the Real Estate Index due to investor concerns about the potential impact of the Japanese consumption tax hike. We believe the company has a high quality management team and portfolio of assets, and we are constructive on its leverage to the Japanese economy. |
| | We initiated a Fund position in Vonovia, the largest residential landlord in Germany. We are positive on the company’s ability to add residential units to its portfolio with significant marginal profits, and we view Vonovia’s market share in this space as a meaningful competitive advantage. As the company has made many strategic acquisitions during the past year or so, we are confident that the synergies from these acquisitions may allow Vonovia to perform well. |
| | In addition to the converted position of Nomura Real Estate Office Fund, mentioned earlier, we sold the Fund’s position in Global Logistic Properties, a logistics warehouse landlord and developer with facilities in China, Japan and Brazil. |
| | When we established the Fund’s position in Global Logistic Properties, we believed that China’s growing demand for logistics facilities and the company’s success in forging strategic alliances with domestic tenants would allow its management to accelerate its capital return and deployment plans. Following the November 2014 passing of co-founder Jeffrey Schwartz, however, we have been monitoring Global Logistic Properties’ business trajectory closely. We subsequently became increasingly cautious on the slowing of development activities due to greater competition in China and Japan as well as a recession in Brazil. As such, we decided to exit the position for now, but we intend to continue to follow its new leadership team as it works to deliver the next stage of growth for the company. |
| Q | | Were there any changes made in the Fund’s investment strategy during the Reporting Period? |
| A | | In constructing the Fund’s portfolio, we focus on picking securities rather than on making regional, country or subsector bets. We seek to outpace the benchmark index by overweighting stocks that we expect to outperform and underweighting those that we think may lag. Consequently, changes in its regional or subsector weights are generally the direct result of individual stock selection or of real estate securities’ appreciation or depreciation. That said, during the Reporting Period, the Fund’s exposure to Continental Europe, Hong Kong, Japan and Singapore increased relative to the Real Estate Index, and its exposure to the U.K. decreased relative to the Real Estate Index. We also eliminated positions in India, Indonesia, Malaysia and Taiwan and decreased exposure to China during the Reporting Period, none of which is a component of the Real Estate Index. |
| Q | | How was the Fund positioned relative to its benchmark index at the end of the Reporting Period? |
| A | | From a country perspective, the Fund was overweighted relative to the Real Estate Index in Japan and was underweighted relative to the Real Estate Index in Singapore. The Fund was rather neutrally weighted compared to the Real Estate Index in the other constituent countries of the Real Estate Index at the end of December 2015. |
| Q | | What is the Fund’s tactical view and strategy for the months ahead? |
| A | | At the end of the Reporting Period, we believed that international REITs can continue to generate positive returns during 2016 given reasonable demand in most subsectors and the industry’s overall favorable supply picture. |
46
PORTFOLIO RESULTS
| | Throughout 2015, policy makers and central bankers outside the U.S. enacted supportive measures in an effort to sustain economic growth and combat low inflation. As a result, we believe interest rates in many developed and emerging market countries may remain low for an extended period of time. |
| | Overall, we believe the global environment remains supportive of REIT fundamentals. While the trajectory of economic growth among larger economies like Japan, China and Continental Europe was put into question, commercial and housing tenancy demand in these regions strengthened rather than weakened. Furthermore, while we expect company management teams to be prudent with their balance sheets, we believe it is important to recognize that banks globally appear willing and able to lend to the real estate industry at historically low interest rates. We believe this favorable backdrop may benefit REITs in securing financing and deploying capital toward high quality projects that may potentially drive future growth. In addition, the subdued environment since the global financial crisis, in our opinion, has kept new real estate development at lower levels, leading to a rather stable rental and yield outlook for the asset class going forward. |
| | Overall, we believe REITs can continue to offer attractive risk-adjusted returns, relative to fixed income in particular, given their potential yield, growth, diversification and inflation hedge benefits. On a stock by stock basis, we believe opportunities abound around the world, as both listed and unlisted real estate offer high and stable income for REITs to capture. As fundamental, bottom-up investors, we believe we are seeing opportunities that go beyond the headline risks associated with certain regions. We intend to continue to focus our approach on those companies that have well-capitalized balance sheets and that possess quality attributes, such as a robust business model, a high quality asset exposure and a strong management team with a sound reinvestment strategy. |
47
FUND BASICS
International Real Estate Securities Fund
as of December 31, 2015
| | | | | | | | | | |
| | PERFORMANCE REVIEW | |
| | | January 1, 2015–December 31, 2015 | | Fund Total Return
(based on NAV)1 | | | FTSE EPRA/NAREIT Developed
Ex-US Real Estate Index
(Gross, USD, Unhedged)2 | |
| | Class A | | | -2.25 | % | | | -3.23 | % |
| | Class C | | | -3.03 | | | | -3.23 | |
| | Institutional | | | -1.73 | | | | -3.23 | |
| | | Class IR | | | -2.04 | | | | -3.23 | |
| | | |
| | | | | | | | | |
| | | July 31, 2015–December 31, 2015 | | Fund Total Return
(based on NAV)1 | | | FTSE EPRA/NAREIT Developed
Ex-US Real Estate Index
(Gross, USD, Unhedged)2 | |
| | | Class R6 | | | -5.03 | % | | | -5.25 | % |
| | 1 | | The net asset value (“NAV”) represents the net assets of the class of the Fund (ex-dividend) divided by the total number of shares of the class outstanding. The Fund’s performance reflects the reinvestment of dividends and other distributions. The Fund’s performance does not reflect the deduction of any applicable sales charges. |
| | 2 | | The FTSE EPRA/NAREIT Developed Ex-US Real Estate Index (Gross, USD, Unhedged) is a market capitalization weighted index comprised of REITs and non-REITs within the international (global ex U.S.) real estate securities market. The market capitalization for each constituent is adjusted for free float. It is not possible to invest directly in an index. |
| | | | | | | | | | | | | | | | |
| | STANDARDIZED TOTAL RETURNS3 |
| | | For the period ended 12/31/15 | | One Year | | | Five Year | | | Since Inception | | | Inception Date |
| | Class A | | | -7.61 | % | | | 2.52 | % | | | -0.40 | % | | 7/31/06 |
| | Class C | | | -4.00 | | | | 2.91 | | | | -0.51 | | | 7/31/06 |
| | Institutional | | | -1.73 | | | | 4.12 | | | | 0.46 | | | 7/31/06 |
| | Class IR | | | -2.04 | | | | 3.96 | | | | -2.29 | | | 11/30/07 |
| | | Class R6 | | | N/A | | | | N/A | | | | -5.03 | | | 7/31/15 |
| | 3 | | The Standardized Total Returns are average annual or cumulative total returns (only if the performance period is one year or less) as of the most recent calendar quarter-end or cumulative total returns for periods of less than one year. They assume reinvestment of all distributions at NAV. These returns reflect a maximum initial sales charge of 5.5% for Class A Shares and the assumed contingent deferred sales charge for Class C Shares (1% if redeemed within 12 months of purchase). Because Institutional, Class IR Shares and Class R6 Shares do not involve a sales charge, such a charge is not applied to their Standardized Total Returns. |
The returns set forth in the tables above represent past performance. Past performance does not guarantee future results. The Fund’s investment return and principal value will fluctuate so that an investor’s shares, when redeemed, may be worth more or less than their original cost. Current performance may be lower or higher than the performance quoted above. Please visit our web site at www.GSAMFUNDS.com to obtain the most recent month-end returns. Performance reflects applicable fee waivers and/or expense limitations in effect during the periods shown. In their absence, performance would be reduced. Returns do not reflect the deduction of taxes that a shareholder would pay on Fund distributions or the redemption of Fund shares.
48
FUND BASICS
| | | | | | | | | | |
| | EXPENSE RATIOS4 | |
| | | | | Net Expense Ratio (Current) | | | Gross Expense Ratio (Before Waivers) | |
| | Class A | | | 1.40 | % | | | 1.61 | % |
| | Class C | | | 2.15 | | | | 2.36 | |
| | Institutional | | | 0.99 | | | | 1.21 | |
| | Class IR | | | 1.15 | | | | 1.35 | |
| | | Class R6 | | | 0.97 | | | | 1.19 | |
| | 4 | | The expense ratios of the Fund, both current (net of applicable fee waivers and/or expense limitations) and before waivers (gross of applicable fee waivers and/or expense limitations) are as set forth above according to the most recent publicly available Prospectus for the Fund and may differ from the expense ratios disclosed in the Financial Highlights in this report. Pursuant to a contractual arrangement, the Fund’s waivers and/or expense limitations will remain in place through at least July 31, 2016, and prior to such date the Investment Adviser may not terminate the arrangements without the approval of the Fund’s Board of Trustees. If these arrangements are discontinued in the future, the expense ratios may change without shareholder approval. |
| | | | | | | | | | |
| | TOP TEN HOLDINGS AS OF 12/31/155 |
| | | Holding | | % of Total
Net Assets | | | Line of Business | | Country |
| | Mitsubishi Estate Co. Ltd. | | | 6.4 | % | | Diversified | | Japan |
| | Mitsui Fudosan Co. Ltd. | | | 6.1 | | | Office | | Japan |
| | Sun Hung Kai Properties Ltd. | | | 5.7 | | | Diversified | | Hong Kong |
| | Unibail-Rodamco SE (REIT) | | | 5.6 | | | Retail | | France |
| | Klepierre (REIT) | | | 4.5 | | | Retail | | France |
| | Sumitomo Realty & Development Co. Ltd. | | | 3.9 | | | Office | | Japan |
| | Mirvac Group (REIT) | | | 3.4 | | | Diversified | | Australia |
| | Japan Retail Fund Investment Corp. (REIT) | | | 3.3 | | | Retail | | Japan |
| | Hongkong Land Holdings Ltd. | | | 3.3 | | | Office | | Hong Kong |
| | | British Land Co. PLC (REIT) | | | 3.1 | | | Diversified | | United Kingdom |
| | 5 | | The top 10 holdings may not be representative of the Fund’s future investments. |
49
FUND BASICS
|
| FUND VS. BENCHMARK COUNTRY ALLOCATION6 |
| As of December 31, 2015 |
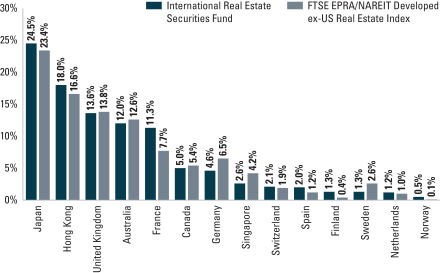
| | 6 | | The Fund is actively managed and, as such, its composition may differ over time. Consequently, the Fund’s overall country allocations may differ from percentages contained in the graph above. The percentage shown for each investment category reflects the value of investments in that category as a percentage of market value. |
50
GOLDMAN SACHS INTERNATIONAL REAL ESTATE SECURITIES FUND
Performance Summary
December 31, 2015
The following graph shows the value as of December 31, 2015, of a $1,000,000 investment made on July 31, 2006 (commencement of operations) in Institutional Shares at NAV. For comparative purposes, the performance of the Fund’s benchmark, the FTSE EPRA/NAREIT Developed Ex-US Real Estate Index (with dividends reinvested), is shown. This performance data represents past performance and should not be considered indicative of future performance, which will fluctuate with changes in market conditions. These performance fluctuations will cause an investor’s shares, when redeemed, to be worth more or less than their original cost. Performance reflects applicable fee waivers and/or expense limitations in effect during the periods shown and in their absence, performance would be reduced. Returns do not reflect the deduction of taxes that a shareholder would pay on Fund distributions or the redemption of Fund shares. Performance of Class A, Class C, Class IR and Class R6 Shares will vary from Institutional Shares due to differences in class specific fees and any applicable sales charges. In addition to the Investment Adviser’s decision regarding issuer/industry/country investment selection and allocation, other factors may affect Fund performance. These factors include, but are not limited to, Fund operating fees and expenses, portfolio turnover, and subscription and redemption cash flows affecting the Fund.
| | | | |
| International Real Estate Securities Fund’s Lifetime Performance | | | | |
Performance of a $1,000,000 Investment, with distributions reinvested, from July 31, 2006 through December 31, 2015.
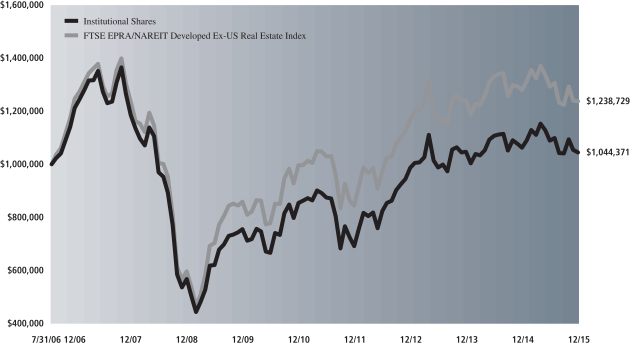
| | | | | | | | | | |
| Average Annual Total Return through December 31, 2015 | | | One Year | | | | Five Years | | | Since Inception |
Class A (Commenced July 31, 2006) | | | | | | | | | | |
Excluding sales charges | | | -2.25% | | | | 3.69% | | | 0.20% |
Including sales charges | | | -7.61% | | | | 2.52% | | | -0.40% |
|
Class C (Commenced July 31, 2006) | | | | | | | | | | |
Excluding contingent deferred sales charges | | | -3.03% | | | | 2.91% | | | -0.51% |
Including contingent deferred sales charges | | | -4.00% | | | | 2.91% | | | -0.51% |
|
Institutional (Commenced July 31, 2006) | | | -1.73% | | | | 4.12% | | | 0.46% |
|
Class IR (Commenced November 30, 2007) | | | -2.04% | | | | 3.96% | | | -2.29% |
|
Class R6 (Commenced July 31, 2015) | | | N/A | | | | N/A | | | -5.03%* |
|
| * | | Total return for periods of less than one year represents cumulative total return. |
51
PORTFOLIO RESULTS
Goldman Sachs Real Estate Securities Fund
Investment Objective
The Fund seeks total return comprised of long-term growth of capital and dividend income.
Portfolio Management Discussion and Analysis
Below, the Goldman Sachs Real Estate Securities Investment Team discusses the Goldman Sachs Real Estate Securities Fund’s (the “Fund”) performance and positioning for the 12-month period ended December 31, 2015 (the “Reporting Period”).
| Q | | How did the Fund perform during the Reporting Period? |
| A | | During the Reporting Period, the Fund’s Class A, C, Institutional, Service, IR and R Shares generated average annual total returns, without sales charges, of 3.14%, 2.39%, 3.56%, 3.09%, 3.44% and 2.89%, respectively. These returns compare to the 4.80% average annual total return of the Fund’s benchmark, the Wilshire U.S. Real Estate Securities Index (gross, with dividends reinvested) (the “Wilshire Index”) during the same period. |
| | Since their inception on July 31, 2015, the Fund’s Class R6 Shares generated a cumulative total return, without sales charge, of 3.64%. This return compares to the 4.49% cumulative total return of the Wilshire Index during the same period. |
| Q | | What economic and market factors most influenced the U.S. real estate securities market as a whole during the Reporting Period? |
| A | | The U.S. real estate securities market, as represented by the Wilshire Index, posted positive absolute returns during the Reporting Period that significantly outperformed the broad U.S. equity market, as represented by the S&P 500® Index, which was up 1.38% for the same period.1 |
| | During the first quarter of 2015, the Wilshire Index increased solidly. Real estate investment trusts (“REITs”) benefited from strong demand for income-oriented assets, as persistent uncertainty about the initial timing of interest rate increases by the Federal Reserve (the “Fed”) led to a modest decline in the 10-year U.S. Treasury yield. The U.S. economy’s recovery and the REIT industry’s encouraging fundamental backdrop acted as additional tailwinds during the first quarter of 2015. For the first three months of the year, self-storage and multifamily were the top performing subsectors, while |
| | 1 | | The S&P 500® Index is the Standard & Poor’s 500 Composite Index of 500 stocks, an unmanaged index of common stock prices. |
| | the leisure and industrial subsectors trailed the higher returns of the broader market. The self-storage subsector gained, as investors better appreciated the industry’s favorable supply/ demand imbalance, while leisure underperformed due largely to concerns about the recent strength of the U.S. dollar and its potential impact on international markets. |
| | The Wilshire Index declined significantly during the second quarter of 2015. REITs traded lower as greater expectations for interest rate hikes by the Fed led the 10-year U.S. Treasury yield to increase from approximately 1.9% to approximately 2.4% during the April to June 2015 span alone. For the second quarter of 2015, self-storage and leisure were the top performing subsectors, while the health care and industrial subsectors underperformed the broader market. The self-storage subsector was a relative outperformer, as investors increasingly appreciated the industry’s strengthening fundamentals and favorable supply/demand imbalance. Health care, which generally has longer lease terms and higher dividend yields, underperformed the Wilshire Index largely due to the subsector’s limited economic sensitivity and relatively less attractive yields in a rising interest rate environment. |
| | The Wilshire Index then rebounded into positive territory during the third quarter of 2015. In a challenging global macroeconomic environment, REITs experienced a volatile quarter, but ultimately finished higher, as the 10-year U.S. Treasury yield declined and the Fed delayed its decision to raise interest rates. For the third quarter of 2015, self-storage and multifamily were the top performing subsectors, while the leisure and office subsectors underperformed the broader market. The self-storage subsector outperformed, as investors continued to appreciate the industry’s strengthening fundamentals and favorable supply/demand imbalance. The leisure subsector underperformed due to fears of new supply as well as concerns about the recent strength of the U.S. dollar and its potential impact on international travelers. |
52
PORTFOLIO RESULTS
| | The Wilshire Index increased substantially during the fourth quarter of 2015. In December 2015, the Fed finally raised interest rates for the first time in nearly a decade. However, REITs gained as investors remained positive on strong private market demand, discounted valuations in the public market and healthy operating fundamentals at the company level. For the fourth quarter of 2015, self-storage and industrial were the top performing subsectors, while the leisure and health care subsectors underperformed the broader market. Relative performance of the self-storage and leisure subsectors was driven by the same reasons they had in the prior quarter. |
| | For the Reporting Period overall, the strongest subsector in the Wilshire Index by a wide margin was self-storage. Conversely, the leisure subsector was by far the weakest performer within the Wilshire Index during the Reporting Period, posting a double-digit decline. |
| Q | | What key factors were responsible for the Fund’s performance during the Reporting Period? |
| A | | The Fund posted positive absolute returns during the Reporting Period but underperformed the return of the Wilshire Index. Detracting most from the Fund’s relative results was stock selection in the leisure, self-storage and industrial subsectors. Having an overweighted exposure to the leisure subsector, the weakest in the Wilshire Index during the Reporting Period, and an underweighted allocation to the multifamily subsector, which was the second-best performer in the Wilshire Index during the Reporting Period, also hurt. Partially offsetting these detractors was effective individual stock selection in the retail and health care subsectors, which contributed positively to relative returns. Having exposure to what is termed as the “other” subsector, which outpaced the Wilshire Index during the Reporting Period; having an underweighted allocation to the health care subsector, which lagged the Wilshire Index during the Reporting Period; and having an overweighted allocation to the strongly performing self-storage subsector also boosted the Fund’s relative results. |
| Q | | What were some of the Fund’s weakest-performing individual holdings? |
| A | | Chesapeake Lodging Trust, an owner of upscale hotels in key gateway markets in the U.S., was the top detractor from the Fund’s relative returns during the Reporting Period. In our view, Chesapeake Lodging Trust’s underperformance of the Wilshire Index in 2015 was largely driven by the broad-based headwinds impacting the entire lodging industry. As previously mentioned, these headwinds included fears of new supply as well as concerns about the recent strength of the U.S. dollar and its potential impact on international travelers. Amidst the more challenging operating environment, the company lowered its fourth quarter 2015 outlook due to weakness in both San Francisco and New York City. Despite these industry-wide difficulties, we maintained, at the end of the Reporting Period, high conviction in Chesapeake Lodging Trust’s strategy and assets over the remainder of this hotel cycle. We believe the company’s hotels are in attractive locations, and the company has completed several large-scale renovations that we view as value enhancing. Furthermore, we believed that what we consider to be the company’s strong balance sheet should provide its management with potential opportunities to execute additional transactions and expand the company’s footprint. Lastly, Chesapeake Lodging Trust’s high quality assets and relatively small size may make the company a compelling acquisition candidate, in our view. |
| | Similarly, RLJ Lodging Trust, a select-service hotel owner, was a top detractor from the Fund’s results during the Reporting Period. In a difficult industry environment, investors were increasingly cautious on both demand trends in Houston and new supply in New York City, two of the company’s larger markets. Despite short-term weakness, we remained optimistic on RLJ Lodging Trust’s focus on select-service hotels, as these assets tend to have significantly higher margins and free cash flow yields compared to their full-service peers. Furthermore, the company’s management team, which we view as one of the best in the industry, is repositioning the company’s portfolio toward high quality urban markets, where competition for land keeps supply more muted. Overall, we remained constructive at the end of the Reporting Period on RLJ Lodging Trust’s internal and external growth opportunities, and we viewed its shares as attractively valued relative to its peers. |
| Q | | What were some of the Fund’s best-performing individual holdings? |
| A | | Data center provider CyrusOne, a new purchase for the Fund during the Reporting Period, was the top positive contributor to the Fund’s performance. Its shares gained, as investors appeared constructive on CyrusOne’s significant growth potential and differentiated business model as well as on its progress integrating its recent acquisition, Cervalis Holdings. We believe CyrusOne is well positioned to serve the data storage needs of enterprise customers, and, as a result, we expect the company to benefit from demand growth. Additionally, we view the strength of CyrusOne’s sales force and customer penetration among Fortune 1000 companies |
53
PORTFOLIO RESULTS
| | as meaningful competitive advantages. We also remained encouraged at the end of the Reporting Period by the company’s opportunity to increasingly provide its services to small and mid-size customers. Overall, we believe the stock continued to present at the end of the Reporting Period a compelling risk/reward opportunity given what we consider to be its attractive valuation and prospects for future growth. |
| | Mid-America Apartment Communities, an owner and operator of apartments across the Sunbelt region, was also a top contributor to the Fund’s performance during the Reporting Period. At the end of July 2015, its shares traded higher after the company reported better than expected second calendar quarter earnings and raised its full-year guidance. Near the end of October 2015, its shares continued to gain, after the company announced third calendar quarter earnings that exceeded investor expectations and again raised its full-year guidance. Its quarterly results were highlighted by both strong rent growth as well as increased occupancy levels. In addition to a discounted valuation relative to peers, we remained positive at the end of the Reporting Period on Mid-America Apartment Communities’ geographical exposure and presence in suburban markets, which we view as less susceptible to the potential threat of new supply. Going forward, we believe this dynamic may allow for stronger pricing power and more stable rent growth. |
| Q | | How did the Fund use derivatives and similar instruments during the Reporting Period? |
| A | | During the Reporting Period, the Fund hedged its British pound currency exposure, via currency forwards, for one position domiciled in the United Kingdom. The use of the currency forwards did not have a material impact on the Fund’s performance during the Reporting Period. |
| Q | | Did the Fund make any significant purchases or sales during the Reporting Period? |
| A | | In addition to the purchase of CyrusOne, already mentioned, we initiated a Fund position in Federal Realty Investment Trust, an owner of retail and mixed-use shopping centers. In our view, Federal Realty Investment Trust’s exposure to the nation’s top urban markets, including Washington D.C. and San Francisco, may provide the company with pricing power and above-average rent growth moving forward. In addition to what we consider to be a strong balance sheet, we believe that the company’s development pipeline is being underappreciated by investors and that its management’s track record of building shareholder value may lead to meaningful upside in its stock. |
| | During the Reporting Period, we exited the Fund’s position Macerich, an owner and operator of regional shopping malls. We had initiated the Fund’s position in Macerich based on our belief that the company’s assets were being undervalued by investors and given our outlook that the business may generate outsized net operating income growth relative to competitors over the next several years. Subsequently, in November 2014, Simon Property Group announced it had taken a 4% stake in Macerich’s stock, causing shares of Macerich to rally in anticipation of a potential deal. At the end of the first quarter of 2015, however, Macerich rejected Simon Property Group’s takeover bid, as the company’s management team did not believe the offer fully appreciated the long-term value of Macerich’s business. Following this announcement, we reduced the Fund’s position size in Macerich and eventually fully transitioned the capital into names where we saw greater upside potential. |
| | We sold the Fund’s position in Empire State Realty Trust, the owner of the Empire State Building as well as other office and retail properties in New York City. When we had established the Fund’s position in Empire State Realty Trust, we believed that investors were underappreciating the company’s substantial growth potential and high quality balance sheet. In addition, we believed the company’s upcoming re-leasing opportunities may lead to meaningful increases in its rental rates. As time passed, however, we became increasingly cautious on new supply in the observatory market and its potential impact on Empire State Realty Trust. As a result of these concerns, we exited the position and transitioned capital into higher conviction names. |
| Q | | Were there any changes made in the Fund’s investment strategy during the Reporting Period? |
| A | | In constructing the Fund’s portfolio, we focus on picking securities rather than on making real estate subsector bets. We seek to outpace the benchmark index by overweighting stocks that we expect to outperform and underweighting those that we think may lag. Consequently, changes in its real estate subsector weights are generally the direct result of individual stock selection or of real estate securities’ appreciation or depreciation. That said, during the Reporting Period, the Fund’s exposure to the self-storage and health care subsectors increased relative to the Wilshire Index and its exposure to the leisure subsector decreased relative to the Wilshire Index. The Fund’s position in cash also decreased during the Reporting Period. |
54
PORTFOLIO RESULTS
| Q | | How was the Fund positioned relative to its benchmark index at the end of the Reporting Period? |
| A | | From a subsector perspective, the Fund had an overweighted exposure compared to the Wilshire Index in the self-storage and what is termed the “other” subsectors at the end of the Reporting Period. The Fund was underweighted compared to its benchmark index in the office and multifamily subsectors and was rather neutrally weighted in the health care, industrial, leisure and retail subsectors within the Wilshire Index. |
| Q | | What is the Fund’s tactical view and strategy for the months ahead? |
| A | | At the end of the Reporting Period, we believed that U.S. REITs can continue to generate positive returns during 2016 given reasonable demand in most subsectors and the industry’s overall favorable supply picture. While new supply is growing due to the attractive spread, or differential, between development yields and cap rates, it is still below demand, and we believe this may lead to further increases in occupancy levels and rental rates as well as higher re-leasing spreads on expiring leases. (Cap rate, or capitalization rate, is a rate of return on a real estate investment property based on the expected income that the property will generate. Capitalization rate is used to estimate the investor’s potential return on his or her investment.) |
| | In our view, this encouraging fundamental backdrop coupled with both an accommodative financing environment and a healthy transaction market may support additional gains by the REIT asset class. Furthermore, we believed at the end of the Reporting Period that a number of REITs were trading significantly below their private market values, presenting management teams with a variety of strategic options to increase shareholder value. More specifically, REITs trading at discounts to their net asset values may be considered as possible acquisition candidates. In addition, certain REITs may decide to sell select assets at premium valuations in the private market and use the proceeds to repurchase company stock or recycle capital into accretive development projects. |
| | Separately, while we do expect interest rates to gradually move higher, they remain low by historical standards, and we believe that investors may well continue to appreciate the yield and growth attributes of the REIT asset class. Unlike fixed income, the majority of REITs operate dynamic businesses that can potentially still create value and growth even with rising interest rates. Overall, we believe that REITs can continue to provide investors with attractive risk-adjusted returns, relative to fixed income in particular, given the potential yield, growth, diversification and inflation hedge benefits the REIT asset class can provide. |
| | As fundamental, bottom-up investors, we intend to continue to focus our approach on those companies that have strong balance sheets and that possess quality attributes, such as a robust business model, a high quality asset exposure and a strong management team. |
55
FUND BASICS
Real Estate Securities Fund
as of December 31, 2015
| | | | | | | | | | |
| | PERFORMANCE REVIEW | |
| | | January 1, 2015–December 31, 2015 | | Fund Total Return
(based on NAV)1 | | | Wilshire U.S. Real Estate
Securities Index (Gross)2 | |
| | Class A | | | 3.14 | % | | | 4.80 | % |
| | Class C | | | 2.39 | | | | 4.80 | |
| | Institutional | | | 3.56 | | | | 4.80 | |
| | Service | | | 3.09 | | | | 4.80 | |
| | Class IR | | | 3.44 | | | | 4.80 | |
| | | Class R | | | 2.89 | | | | 4.80 | |
| | | |
| | | | | | | | | |
| | | July 31, 2015–December 31, 2015 | | | | | | |
| | | Class R6 | | | 3.64 | % | | | 4.49 | % |
| | 1 | | The net asset value (“NAV”) represents the net assets of the class of the Fund (ex-dividend) divided by the total number of shares of the class outstanding. The Fund’s performance reflects the reinvestment of dividends and other distributions. The Fund’s performance does not reflect the deduction of any applicable sales charges. |
| | 2 | | The Wilshire U.S. Real Estate Securities Index (Gross, with dividends reinvested) is an unmanaged market capitalization-weighted index comprised of publicly traded REITs and real estate operating companies. The figures do not reflect any fees or expenses. It is not possible to invest directly in an index. |
| | | | | | | | | | | | | | | | | | | | |
| | STANDARDIZED TOTAL RETURNS3 |
| | | For the period ended 12/31/15 | | One Year | | | Five Years | | | Ten Years | | | Since Inception | | | Inception Date |
| | Class A | | | -2.51 | % | | | 10.46 | % | | | 5.71 | % | | | 9.58 | % | | 7/27/98 |
| | Class C | | | 1.36 | | | | 10.89 | | | | 5.52 | | | | 9.14 | | | 7/27/98 |
| | Institutional | | | 3.56 | | | | 12.19 | | | | 6.76 | | | | 10.39 | | | 7/27/98 |
| | Service | | | 3.09 | | | | 11.62 | | | | 6.20 | | | | 9.85 | | | 7/27/98 |
| | Class IR | | | 3.44 | | | | 11.99 | | | | N/A | | | | 5.90 | | | 11/30/07 |
| | Class R | | | 2.89 | | | | 11.46 | | | | N/A | | | | 5.39 | | | 11/30/07 |
| | | Class R6 | | | N/A | | | | N/A | | | | N/A | | | | 3.64 | | | 7/31/15 |
| | 3 | | The Standardized Total Returns are average annual or cumulative total returns (only if the performance period is one year or less) as of the most recent calendar quarter-end or cumulative total returns for periods less than one year. They assume reinvestment of all distributions at NAV. These returns reflect a maximum initial sales charge of 5.5% for Class A Shares, and the assumed contingent deferred sales charge for Class C Shares (1% if redeemed within 12 months of purchase). Because Institutional, Service, Class IR, Class R and Class R6 Shares do not involve a sales charge, such a charge is not applied to their Standardized Total Returns. |
The returns set forth in the tables above represent past performance. Past performance does not guarantee future results. The Fund’s investment return and principal value will fluctuate so that an investor’s shares, when redeemed, may be worth more or less than their original cost. Current performance may be lower or higher than the performance quoted above. Please visit our web site at www.GSAMFUNDS.com to obtain the most recent month-end returns. Performance reflects applicable fee waivers and/or expense limitations in effect during the periods shown. In their absence, performance would be reduced. Returns do not reflect the deduction of taxes that a shareholder would pay on Fund distributions or the redemption of Fund shares.
56
FUND BASICS
| | | | | | | | | | |
| | EXPENSE RATIOS4 | |
| | | | | Net Expense Ratio (Current) | | | Gross Expense Ratio (Before Waivers) | |
| | Class A | | | 1.31 | % | | | 1.52 | % |
| | Class C | | | 2.06 | | | | 2.26 | |
| | Institutional | | | 0.91 | | | | 1.11 | |
| | Service | | | 1.41 | | | | 1.61 | |
| | Class IR | | | 1.06 | | | | 1.27 | |
| | Class R | | | 1.56 | | | | 1.77 | |
| | | Class R6 | | | 0.89 | | | | 1.09 | |
| | 4 | | The expense ratios of the Fund, both current (net of applicable fee waivers and/or expense limitations) and before waivers (gross of applicable fee waivers and/or expense limitations) are as set forth above according to the most recent publicly available Prospectus for the Fund and may differ from the expense ratios disclosed in the Financial Highlights in this report. Pursuant to a contractual arrangement, the Fund’s waivers and/or expense limitations will remain in place through at least July 31, 2016, and prior to such date the Investment Adviser may not terminate the arrangements without the approval of the Fund’s Board of Trustees. If these arrangements are discontinued in the future, the expense ratios may change without shareholder approval. |
| | | | | | | | |
| | TOP TEN HOLDINGS AS OF 12/31/155 |
| | | Holding | | % of Total
Net Assets | | | Subsectors |
| | Simon Property Group, Inc. (REIT) | | | 11.3 | % | | Retail |
| | Public Storage (REIT) | | | 7.9 | | | Self Storage |
| | AvalonBay Communities, Inc. (REIT) | | | 6.8 | | | Multifamily |
| | Boston Properties, Inc. (REIT) | | | 6.1 | | | Commercial |
| | Vornado Realty Trust (REIT) | | | 5.8 | | | Commercial |
| | Ventas, Inc. (REIT) | | | 4.7 | | | Health Care |
| | Mid-America Apartment Communities, Inc. (REIT) | | | 3.9 | | | Multifamily |
| | Brixmor Property Group, Inc. (REIT) | | | 3.8 | | | Retail |
| | Prologis, Inc. (REIT) | | | 3.6 | | | Commercial |
| | | Federal Realty Investment Trust (REIT) | | | 3.5 | | | Retail |
| | 5 | | The top 10 holdings may not be representative of the Fund’s future investments. |
57
FUND BASICS
|
| FUND VS. BENCHMARK SECTOR ALLOCATION6 |
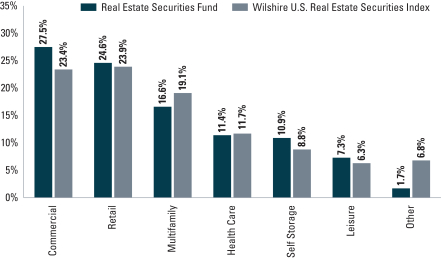
| | 6 | | The Fund is actively managed and, as such, its composition may differ over time. Consequently, the Fund’s overall sector allocations may differ from percentages contained in the graph above. The graph categorizes investments using Global Industry Classification Standard (“GICS”), however, the sector classifications used by the portfolio management team may differ from GICS. The percentage shown for each investment category reflects the value of investments in that category as a percentage of market value. The graph depicts the Fund’s investments but may not represent the Fund’s market exposure due to the exclusion of certain derivatives, if any, as listed in the Additional Investment Information section of the Schedule of Investments. |
58
GOLDMAN SACHS REAL ESTATE SECURITIES FUND
Performance Summary
December 31, 2015
The following graph shows the value as of December 31, 2015, of a $1,000,000 investment made on January 1, 2006 in Institutional Shares at NAV. For comparative purposes, the performance of the Fund’s benchmark, the Wilshire U.S. Real Estate Securities Index, is shown. This performance data represents past performance and should not be considered indicative of future performance, which will fluctuate with changes in market conditions. These performance fluctuations will cause an investor’s shares, when redeemed, to be worth more or less than their original cost. Performance reflects applicable fee waivers and/or expense limitations in effect during the periods shown and in their absence, performance would be reduced. Returns do not reflect the deduction of taxes that a shareholder would pay on Fund distributions or the redemption of Fund shares. Performance of Class A, Class C, Service, Class IR, Class R and Class R6 Shares will vary from Institutional Shares due to differences in class specific fees and any applicable sales charges. In addition to the Investment Adviser’s decision regarding issuer/industry investment selection and allocation, other factors may affect Fund performance. These factors include, but are not limited to, Fund operating fees and expenses, portfolio turnover, and subscription and redemption cash flows affecting the Fund.
| | |
| Real Estate Securities Fund’s 10 Year Performance | | |
Performance of a $1,000,000 Investment, with distributions reinvested, from January 1, 2006 through December 31, 2015.
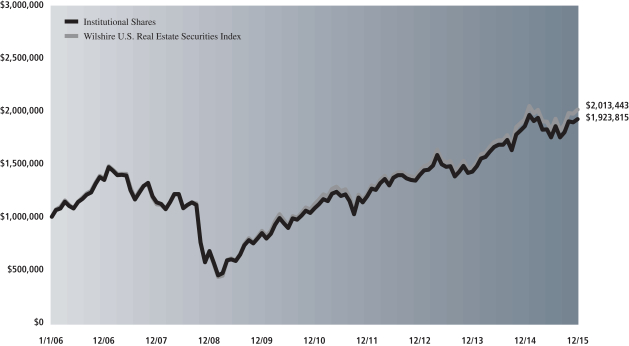
| | | | | | | | | | | | | | |
| Average Annual Total Return through December 31, 2015 | | | One Year | | | | Five Years | | | | Ten Years | | | Since Inception |
Class A (Commenced July 27, 1998) | | | | | | | | | | | | | | |
Excluding sales charges | | | 3.14% | | | | 11.73% | | | | 6.31% | | | 9.93% |
Including sales charges | | | -2.51% | | | | 10.46% | | | | 5.71% | | | 9.58% |
|
Class C (Commenced July 27, 1998) | | | | | | | | | | | | | | |
Excluding contingent deferred sales charges | | | 2.39% | | | | 10.89% | | | | 5.52% | | | 9.14% |
Including contingent deferred sales charges | | | 1.36% | | | | 10.89% | | | | 5.52% | | | 9.14% |
|
Institutional (Commenced July 27, 1998) | | | 3.56% | | | | 12.19% | | | | 6.76% | | | 10.39% |
|
Service (Commenced July 27, 1998) | | | 3.09% | | | | 11.62% | | | | 6.20% | | | 9.85% |
|
Class IR (Commenced November 30, 2007) | | | 3.44% | | | | 11.99% | | | | N/A | | | 5.90% |
|
Class R (Commenced November 30, 2007) | | | 2.89% | | | | 11.46% | | | | N/A | | | 5.39% |
|
Class R6 (Commenced July 31, 2015) | | | N/A | | | | N/A | | | | N/A | | | 3.64%* |
|
| * | | Total return for periods of less than one year represents cumulative total return. |
59
GOLDMAN SACHS ABSOLUTE RETURN TRACKER FUND
Consolidated Schedule of Investments
December 31, 2015
| | | | | | | | |
Shares | | | Description | | Value | |
| | | | | | | | |
| | Common Stocks – 10.3% | |
| | Automobiles & Components – 0.1% | |
| | 26,451 | | | General Motors Co. | | $ | 899,599 | |
| | 6,094 | | | Lear Corp. | | | 748,526 | |
| | | | | | | | |
| | | | | | | 1,648,125 | |
| | |
| | Banks – 0.3% | |
| | 55,092 | | | KeyCorp | | | 726,663 | |
| | 43,265 | | | Regions Financial Corp. | | | 415,344 | |
| | 17,062 | | | SunTrust Banks, Inc. | | | 730,936 | |
| | 10,163 | | | Wells Fargo & Co. | | | 552,461 | |
| | 24,822 | | | Zions Bancorporation | | | 677,641 | |
| | | | | | | | |
| | | | | | | 3,103,045 | |
| | |
| | Capital Goods – 0.5% | |
| | 3,013 | | | 3M Co. | | | 453,878 | |
| | 5,467 | | | Danaher Corp. | | | 507,775 | |
| | 23,354 | | | General Electric Co. | | | 727,477 | |
| | 26,854 | | | KBR, Inc. | | | 454,370 | |
| | 17,618 | | | MSC Industrial Direct Co., Inc. Class A | | | 991,365 | |
| | 2,268 | | | Precision Castparts Corp. | | | 526,199 | |
| | 22,210 | | | Quanta Services, Inc.* | | | 449,752 | |
| | 11,287 | | | Spirit AeroSystems Holdings, Inc. Class A* | | | 565,140 | |
| | 3,968 | | | The Boeing Co. | | | 573,733 | |
| | 5,303 | | | The Toro Co. | | | 387,490 | |
| | | | | | | | |
| | | | | | | 5,637,179 | |
| | |
| | Commercial & Professional Services – 0.2% | |
| | 40,871 | | | Clean Harbors, Inc.* | | | 1,702,277 | |
| | 13,422 | | | KAR Auction Services, Inc. | | | 497,016 | |
| | 10,371 | | | Waste Connections, Inc. | | | 584,095 | |
| | | | | | | | |
| | | | | | | 2,783,388 | |
| | |
| | Consumer Durables & Apparel – 0.2% | |
| | 13,714 | | | D.R. Horton, Inc. | | | 439,260 | |
| | 10,959 | | | Jarden Corp.* | | | 625,978 | |
| | 9,477 | | | Lennar Corp. Class A | | | 463,520 | |
| | 253 | | | NVR, Inc.* | | | 415,679 | |
| | 2,990 | | | Whirlpool Corp. | | | 439,141 | |
| | | | | | | | |
| | | | | | | 2,383,578 | |
| | |
| | Consumer Services – 0.2% | |
| | 35,246 | | | H&R Block, Inc. | | | 1,174,044 | |
| | 4,039 | | | McDonald’s Corp. | | | 477,168 | |
| | 4,381 | | | Royal Caribbean Cruises Ltd. | | | 443,401 | |
| | 11,273 | | | Starbucks Corp. | | | 676,718 | |
| | | | | | | | |
| | | | | | | 2,771,331 | |
| | |
| | Diversified Financials – 0.6% | |
| | 21,634 | | | Ally Financial, Inc.* | | | 403,258 | |
| | 15,632 | | | Berkshire Hathaway, Inc. Class B* | | | 2,064,049 | |
| | 12,652 | | | Discover Financial Services | | | 678,400 | |
| | 36,113 | | | E*TRADE Financial Corp.* | | | 1,070,389 | |
| | 30,748 | | | Interactive Brokers Group, Inc. Class A | | | 1,340,613 | |
| | 7,284 | | | McGraw Hill Financial, Inc. | | | 718,057 | |
| | 23,326 | | | Synchrony Financial* | | | 709,344 | |
| | | | | | | | |
| | | | | | | 6,984,110 | |
| | |
| | | | | | | | |
| | Common Stocks – (continued) | |
| | Energy – 0.4% | |
| | 14,281 | | | Cheniere Energy, Inc.* | | $ | 531,967 | |
| | 7,599 | | | Diamondback Energy, Inc. | | | 508,373 | |
| | 7,879 | | | EOG Resources, Inc. | | | 557,754 | |
| | 7,779 | | | Helmerich & Payne, Inc. | | | 416,566 | |
| | 61,309 | | | Kinder Morgan, Inc. | | | 914,730 | |
| | 13,154 | | | Newfield Exploration Co.* | | | 428,294 | |
| | 5,373 | | | Pioneer Natural Resources Co. | | | 673,667 | |
| | 5,405 | | | Schlumberger Ltd. | | | 376,999 | |
| | 15,573 | | | The Williams Companies, Inc. | | | 400,226 | |
| | | | | | | | |
| | | | | | | 4,808,576 | |
| | |
| | Food & Staples Retailing – 0.2% | |
| | 5,661 | | | CVS Health Corp. | | | 553,476 | |
| | 11,898 | | | Walgreens Boots Alliance, Inc. | | | 1,013,174 | |
| | 21,591 | | | Whole Foods Market, Inc. | | | 723,299 | |
| | | | | | | | |
| | | | | | | 2,289,949 | |
| | |
| | Health Care Equipment & Services – 0.9% | |
| | 3,318 | | | Becton, Dickinson and Co. | | | 511,271 | |
| | 53,324 | | | Brookdale Senior Living, Inc.* | | | 984,361 | |
| | 5,710 | | | Cigna Corp. | | | 835,544 | |
| | 7,160 | | | DENTSPLY International, Inc. | | | 435,686 | |
| | 5,461 | | | Express Scripts Holding Co.* | | | 477,346 | |
| | 7,184 | | | HCA Holdings, Inc.* | | | 485,854 | |
| | 5,834 | | | Henry Schein, Inc.* | | | 922,880 | |
| | 3,076 | | | McKesson Corp. | | | 606,679 | |
| | 11,763 | | | Medtronic PLC | | | 904,810 | |
| | 8,776 | | | Patterson Companies, Inc. | | | 396,763 | |
| | 11,747 | | | Quest Diagnostics, Inc. | | | 835,682 | |
| | 6,775 | | | St. Jude Medical, Inc. | | | 418,492 | |
| | 4,050 | | | UnitedHealth Group, Inc. | | | 476,442 | |
| | 12,447 | | | VCA Antech, Inc.* | | | 684,585 | |
| | 14,028 | | | Zimmer Biomet Holdings, Inc. | | | 1,439,133 | |
| | | | | | | | |
| | | | | | | 10,415,528 | |
| | |
| | Household & Personal Products – 0.1% | |
| | 24,762 | | | Herbalife Ltd.* | | | 1,327,738 | |
| | |
| | Insurance – 0.2% | |
| | 3,798 | | | ACE Ltd. | | | 443,796 | |
| | 23,758 | | | American International Group, Inc. | | | 1,472,283 | |
| | 4,851 | | | American National Insurance Co. | | | 496,112 | |
| | 11,924 | | | MetLife, Inc. | | | 574,856 | |
| | | | | | | | |
| | | | | | | 2,987,047 | |
| | |
| | Materials – 0.3% | |
| | 6,761 | | | Aptargroup, Inc. | | | 491,187 | |
| | 11,522 | | | CF Industries Holdings, Inc. | | | 470,213 | |
| | 9,184 | | | Eagle Materials, Inc. | | | 554,989 | |
| | 11,467 | | | FMC Corp. | | | 448,704 | |
| | 45,437 | | | Newmont Mining Corp. | | | 817,411 | |
| | 52,670 | | | Owens-Illinois, Inc.* | | | 917,511 | |
| | | | | | | | |
| | | | | | | 3,700,015 | |
| | |
| | Media – 0.3% | |
| | 8,192 | | | Comcast Corp. Class A | | | 462,275 | |
| | 12,714 | | | Liberty Broadband Corp.* | | | 659,348 | |
| | 19,915 | | | Liberty Media Corp. Series C* | | | 758,363 | |
| | |
| | |
| 60 | | The accompanying notes are an integral part of these financial statements. |
GOLDMAN SACHS ABSOLUTE RETURN TRACKER FUND
| | | | | | | | |
Shares | | | Description | | Value | |
| | | | | | | | |
| | Common Stocks – (continued) | |
| | Media – (continued) | |
| | 15,787 | | | Live Nation Entertainment, Inc.* | | $ | 387,887 | |
| | 2,438 | | | Time Warner Cable, Inc. | | | 452,468 | |
| | 32,543 | | | Tribune Media Co. | | | 1,100,279 | |
| | | | | | | | |
| | | | | | | 3,820,620 | |
| | |
| | Pharmaceuticals, Biotechnology & Life Sciences – 0.9% | |
| | 25,345 | | | AbbVie, Inc. | | | 1,501,438 | |
| | 4,170 | | | Amgen, Inc. | | | 676,916 | |
| | 1,868 | | | Biogen, Inc.* | | | 572,262 | |
| | 11,253 | | | Bristol-Myers Squibb Co. | | | 774,094 | |
| | 9,219 | | | Celgene Corp.* | | | 1,104,067 | |
| | 15,300 | | | Gilead Sciences, Inc. | | | 1,548,207 | |
| | 2,796 | | | Jazz Pharmaceuticals PLC* | | | 393,006 | |
| | 8,410 | | | Johnson & Johnson | | | 863,875 | |
| | 7,474 | | | Merck & Co., Inc. | | | 394,777 | |
| | 11,082 | | | Mylan NV* | | | 599,204 | |
| | 45,461 | | | Pfizer, Inc. | | | 1,467,481 | |
| | 3,231 | | | Thermo Fisher Scientific, Inc. | | | 458,317 | |
| | 2,839 | | | United Therapeutics Corp.* | | | 444,616 | |
| | | | | | | | |
| | | | | | | 10,798,260 | |
| | |
| | Real Estate – 0.5% | |
| | 87,866 | | | American Capital Agency Corp. (REIT) | | | 1,523,596 | |
| | 9,198 | | | American Tower Corp. (REIT) | | | 891,746 | |
| | 6,625 | | | Crown Castle International Corp. (REIT) | | | 572,731 | |
| | 2,329 | | | Equinix, Inc. (REIT) | | | 704,290 | |
| | 24,460 | | | Forest City Enterprises, Inc. Class A* | | | 536,408 | |
| | 2,822 | | | Jones Lang LaSalle, Inc. | | | 451,125 | |
| | 26,932 | | | NorthStar Realty Finance Corp. (REIT) | | | 458,652 | |
| | 7,986 | | | WP Carey, Inc. (REIT) | | | 471,174 | |
| | | | | | | | |
| | | | | | | 5,609,722 | |
| | |
| | Retailing – 0.8% | |
| | 2,322 | | | Amazon.com, Inc.* | | | 1,569,417 | |
| | 29,174 | | | Cabela’s, Inc.* | | | 1,363,301 | |
| | 9,835 | | | Dollar Tree, Inc.* | | | 759,459 | |
| | 12,192 | | | Expedia, Inc. | | | 1,515,455 | |
| | 20,820 | | | Liberty Interactive Corp QVC Group Series A* | | | 568,802 | |
| | 30,218 | | | Liberty Ventures Series A* | | | 1,363,134 | |
| | 3,461 | | | Netflix, Inc.* | | | 395,869 | |
| | 3,485 | | | The Home Depot, Inc. | | | 460,891 | |
| | 435 | | | The Priceline Group, Inc.* | | | 554,603 | |
| | 5,761 | | | TripAdvisor, Inc.* | | | 491,125 | |
| | | | | | | | |
| | | | | | | 9,042,056 | |
| | |
| | Semiconductors & Semiconductor Equipment – 0.5% | |
| | 201,074 | | | Atmel Corp. | | | 1,731,247 | |
| | 23,688 | | | Lam Research Corp. | | | 1,881,301 | |
| | 64,821 | | | Micron Technology, Inc.* | | | 917,866 | |
| | 12,904 | | | Skyworks Solutions, Inc. | | | 991,414 | |
| | | | | | | | |
| | | | | | | 5,521,828 | |
| | |
| | | | | | | | |
| | Common Stocks – (continued) | |
| | Software & Services – 1.9% | |
| | 18,247 | | | Activision Blizzard, Inc. | | $ | 706,341 | |
| | 4,042 | | | Alphabet, Inc. Class A* | | | 3,144,717 | |
| | 2,726 | | | Alphabet, Inc. Class C* | | | 2,068,707 | |
| | 8,550 | | | DST Systems, Inc. | | | 975,213 | |
| | 19,158 | | | eBay, Inc.* | | | 526,462 | |
| | 34,161 | | | Facebook, Inc. Class A* | | | 3,575,290 | |
| | 19,499 | | | FireEye, Inc.* | | | 404,409 | |
| | 1,848 | | | LinkedIn Corp. Class A* | | | 415,948 | |
| | 14,319 | | | Mastercard, Inc. Class A | | | 1,394,098 | |
| | 45,239 | | | Microsoft Corp. | | | 2,509,860 | |
| | 20,973 | | | Nuance Communications, Inc.* | | | 417,153 | |
| | 13,270 | | | Oracle Corp. | | | 484,753 | |
| | 37,682 | | | PayPal Holdings, Inc.* | | | 1,364,088 | |
| | 5,856 | | | salesforce.com inc* | | | 459,110 | |
| | 5,251 | | | ServiceNow, Inc.* | | | 454,527 | |
| | 4,912 | | | Tableau Software, Inc. Class A* | | | 462,809 | |
| | 13,202 | | | Visa, Inc. Class A | | | 1,023,815 | |
| | 6,259 | | | Workday, Inc. Class A* | | | 498,717 | |
| | 22,072 | | | Yahoo!, Inc.* | | | 734,115 | |
| | 19,674 | | | Yelp, Inc.* | | | 566,611 | |
| | | | | | | | |
| | | | | | | 22,186,743 | |
| | |
| | Technology Hardware & Equipment – 0.5% | |
| | 38,458 | | | Apple, Inc. | | | 4,048,089 | |
| | 21,145 | | | Cisco Systems, Inc. | | | 574,192 | |
| | 26,895 | | | EMC Corp. | | | 690,664 | |
| | 3,493 | | | Palo Alto Networks, Inc.* | | | 615,257 | |
| | 6,921 | | | Zebra Technologies Corp. Class A* | | | 482,048 | |
| | | | | | | | |
| | | | | | | 6,410,250 | |
| | |
| | Transportation – 0.6% | |
| | 3,382 | | | Amerco, Inc. | | | 1,317,289 | |
| | 9,646 | | | American Airlines Group, Inc. | | | 408,508 | |
| | 29,307 | | | Copa Holdings SA Class A | | | 1,414,356 | |
| | 24,869 | | | Delta Air Lines, Inc. | | | 1,260,610 | |
| | 3,536 | | | FedEx Corp. | | | 526,829 | |
| | 7,728 | | | Genesee & Wyoming, Inc. Class A* | | | 414,916 | |
| | 11,072 | | | Macquarie Infrastructure Corp. | | | 803,827 | |
| | 6,257 | | | Union Pacific Corp. | | | 489,297 | |
| | | | | | | | |
| | | | | | | 6,635,632 | |
| | |
| | Utilities – 0.1% | |
| | 10,738 | | | American Water Works Co., Inc. | | | 641,595 | |
| | |
| | TOTAL COMMON STOCKS | |
| | (Cost $121,933,820) | | $ | 121,506,315 | |
| | |
| | | | | | | | |
| | Exchange Traded Funds – 5.0% | |
| | 179,119 | | | Energy Select Sector SPDR Fund | | $ | 10,845,655 | |
| | 264,870 | | | Health Care Select Sector SPDR Fund | | | 19,083,884 | |
| | 903,516 | | | Vanguard FTSE Emerging Markets Fund | | | 29,554,008 | |
| | |
| | TOTAL EXCHANGE TRADED FUNDS | |
| | (Cost $57,829,708) | | $ | 59,483,547 | |
| | |
| | |
| The accompanying notes are an integral part of these financial statements. | | 61 |
GOLDMAN SACHS ABSOLUTE RETURN TRACKER FUND
Consolidated Schedule of Investments (continued)
December 31, 2015
| | | | | | | | |
| Shares | | | Distribution
Rate | | Value | |
| | | | | | | | |
| | Investment Company(a)(b) – 76.4% | |
| Goldman Sachs Financial Square Government Fund – FST Shares | |
| | 904,143,179 | | | 0.185% | | $ | 904,143,179 | |
| | (Cost $904,143,179) | |
| | |
| TOTAL INVESTMENTS – 91.7%
(Cost $1,083,906,707) | | $ | 1,085,133,041 | |
| | |
| OTHER ASSETS IN EXCESS OF
LIABILITIES – 8.3% | | | 98,539,839 | |
| | |
| | NET ASSETS – 100.0% | | $ | 1,183,672,880 | |
| | |
| | |
| The percentage shown for each investment category reflects the value of investments in that category as a percentage of net assets. |
* | | Non-income producing security. |
(a) | | Represents an affiliated issuer. |
(b) | | Variable rate security. Interest rate or distribution rate disclosed is that which is in effect on December 31, 2015. |
| | | | |
|
Investment Abbreviations: |
REIT | | —Real Estate Investment Trust |
SPDR | | — Standard and Poor’s Depositary Receipts |
| | | | |
Currency Abbreviations: |
AUD | | — Australian Dollar |
BRL | | — Brazilian Real |
CAD | | — Canadian Dollar |
CHF | | — Swiss Franc |
CLP | | — Chilean Peso |
CNY | | — Chinese Yuan |
CZK | | — Czech Koruna |
EUR | | — Euro |
GBP | | — British Pound |
HUF | | — Hungarian Forint |
IDR | | — Indonesian Rupiah |
ILS | | — Israel New Shekel |
INR | | — Indian Rupee |
JPY | | — Japanese Yen |
KRW | | — South Korean Won |
MXN | | — Mexican Peso |
MYR | | — Malaysian Ringgit |
NOK | | — Norwegian Krone |
NZD | | — New Zealand Dollar |
PHP | | — Philippines Peso |
PLN | | — Polish Zloty |
SEK | | — Swedish Krona |
SGD | | — Singapore Dollar |
TRY | | — Turkish Lira |
TWD | | — Taiwan Dollar |
USD | | — United States Dollar |
ZAR | | — South African Rand |
|
|
| ADDITIONAL INVESTMENT INFORMATION |
FORWARD FOREIGN CURRENCY EXCHANGE CONTRACTS — At December 31, 2015, the Fund had the following forward foreign currency exchange contracts:
FORWARD FOREIGN CURRENCY EXCHANGE CONTRACTS WITH UNREALIZED GAIN
| | | | | | | | | | | | | | | | | | | | | | | | |
| Counterparty | | | | Currency
Purchased | | | | | Currency
Sold | | | Settlement
Date | | | Current
Value | | | Unrealized
Gain | |
UBS AG | | AUD | | | 2,460,000 | | | USD | | | 1,790,442 | | | | 01/27/16 | | | $ | 1,790,616 | | | $ | 173 | |
| | BRL | | | 280,000 | | | USD | | | 70,040 | | | | 01/27/16 | | | | 70,212 | | | | 174 | |
| | CNY | | | 600,000 | | | USD | | | 91,696 | | | | 01/27/16 | | | | 91,703 | | | | 7 | |
| | INR | | | 4,000,000 | | | USD | | | 60,106 | | | | 01/28/16 | | | | 60,228 | | | | 122 | |
| | JPY | | | 314,000,000 | | | USD | | | 2,604,410 | | | | 01/26/16 | | | | 2,613,640 | | | | 9,230 | |
| | NZD | | | 440,000 | | | USD | | | 300,371 | | | | 01/27/16 | | | | 300,477 | | | | 107 | |
| | PHP | | | 2,400,000 | | | USD | | | 50,371 | | | | 01/27/16 | | | | 51,059 | | | | 687 | |
| | SEK | | | 300,000 | | | USD | | | 35,510 | | | | 01/26/16 | | | | 35,562 | | | | 52 | |
| | TRY | | | 280,000 | | | USD | | | 95,268 | | | | 01/26/16 | | | | 95,414 | | | | 146 | |
| | TWD | | | 600,000 | | | USD | | | 18,148 | | | | 01/27/16 | | | | 18,179 | | | | 30 | |
| | USD | | | 3,029,997 | | | CHF | | | 3,000,000 | | | | 01/26/16 | | | | 2,997,944 | | | | 32,053 | |
| | USD | | | 1,523,217 | | | CZK | | | 37,600,000 | | | | 01/26/16 | | | | 1,512,951 | | | | 10,266 | |
| | USD | | | 21,652,246 | | | EUR | | | 19,800,000 | | | | 01/26/16 | | | | 21,529,103 | | | | 123,143 | |
| | USD | | | 7,012,462 | | | GBP | | | 4,710,000 | | | | 01/26/16 | | | | 6,943,896 | | | | 68,566 | |
| | USD | | | 1,976,656 | | | HUF | | | 568,000,000 | | | | 01/26/16 | | | | 1,956,448 | | | | 20,208 | |
| | USD | | | 36,000 | | | ILS | | | 140,000 | | | | 01/26/16 | | | | 35,992 | | | | 8 | |
| | USD | | | 15,060 | | | INR | | | 1,000,000 | | | | 01/28/16 | | | | 15,057 | | | | 3 | |
| | |
| 62 | | The accompanying notes are an integral part of these financial statements. |
GOLDMAN SACHS ABSOLUTE RETURN TRACKER FUND
|
| ADDITIONAL INVESTMENT INFORMATION (continued) |
FORWARD FOREIGN CURRENCY EXCHANGE CONTRACTS WITH UNREALIZED GAIN (continued)
| | | | | | | | | | | | | | | | | | | | | | | | |
| Counterparty | | | | Currency
Purchased | | | | | Currency
Sold | | | Settlement
Date | | | Current
Value | | | Unrealized
Gain | |
UBS AG (continued) | | USD | | | 2,961,552 | | | KRW | | | 3,480,000,000 | | | | 01/27/16 | | | $ | 2,959,044 | | | $ | 2,508 | |
| | USD | | | 2,482,779 | | | MXN | | | 42,750,000 | | | | 01/26/16 | | | | 2,476,617 | | | | 6,162 | |
| | USD | | | 13,934 | | | MYR | | | 60,000 | | | | 01/28/16 | | | | 13,903 | | | | 31 | |
| | USD | | | 2,222,758 | | | NOK | | | 19,500,000 | | | | 01/26/16 | | | | 2,202,506 | | | | 20,252 | |
| | USD | | | 1,771,316 | | | PLN | | | 6,900,000 | | | | 01/26/16 | | | | 1,758,149 | | | | 13,167 | |
| | USD | | | 2,960,828 | | | SGD | | | 4,175,000 | | | | 01/26/16 | | | | 2,942,251 | | | | 18,577 | |
| | USD | | | 5,391,233 | | | TWD | | | 177,600,000 | | | | 01/27/16 | | | | 5,380,864 | | | | 10,369 | |
| | | USD | | | 1,271,152 | | | ZAR | | | 19,320,000 | | | | 01/26/16 | | | | 1,244,419 | | | | 26,733 | |
| TOTAL | | | | | | | | | | | | | | | | | | | | | | $ | 362,774 | |
FORWARD FOREIGN CURRENCY EXCHANGE CONTRACTS WITH UNREALIZED LOSS
| | | | | | | | | | | | | | | | | | | | | | | | |
| Counterparty | | Currency
Purchased | | | Currency
Sold | | | Settlement
Date | | | Current
Value | | | Unrealized
Loss | |
UBS AG | | CLP | | | 20,000,000 | | | USD | | | 28,790 | | | | 01/27/16 | | | $ | 28,151 | | | $ | (639 | ) |
| | EUR | | | 220,000 | | | USD | | | 239,629 | | | | 01/26/16 | | | | 239,212 | | | | (417 | ) |
| | GBP | | | 110,000 | | | USD | | | 163,269 | | | | 01/26/16 | | | | 162,172 | | | | (1,098 | ) |
| | HUF | | | 160,000,000 | | | USD | | | 557,434 | | | | 01/26/16 | | | | 551,112 | | | | (6,321 | ) |
| | IDR | | | 1,080,000,000 | | | USD | | | 78,100 | | | | 01/27/16 | | | | 77,565 | | | | (536 | ) |
| | KRW | | | 40,000,000 | | | USD | | | 34,098 | | | | 01/27/16 | | | | 34,012 | | | | (86 | ) |
| | PLN | | | 1,020,000 | | | USD | | | 261,490 | | | | 01/26/16 | | | | 259,900 | | | | (1,590 | ) |
| | SEK | | | 4,950,000 | | | USD | | | 588,248 | | | | 01/26/16 | | | | 586,767 | | | | (1,481 | ) |
| | SGD | | | 425,000 | | | USD | | | 300,108 | | | | 01/26/16 | | | | 299,510 | | | | (597 | ) |
| | TWD | | | 1,800,000 | | | USD | | | 54,811 | | | | 01/27/16 | | | | 54,536 | | | | (275 | ) |
| | USD | | | 3,719,592 | | | AUD | | | 5,180,000 | | | | 01/27/16 | | | | 3,770,483 | | | | (50,891 | ) |
| | USD | | | 1,113,849 | | | BRL | | | 4,520,000 | | | | 01/27/16 | | | | 1,133,436 | | | | (19,587 | ) |
| | USD | | | 6,881,043 | | | CAD | | | 9,600,000 | | | | 01/26/16 | | | | 6,938,215 | | | | (57,172 | ) |
| | USD | | | 4,482,417 | | | JPY | | | 542,000,000 | | | | 01/26/16 | | | | 4,511,441 | | | | (29,024 | ) |
| | USD | | | 50,900 | | | KRW | | | 60,000,000 | | | | 01/27/16 | | | | 51,018 | | | | (118 | ) |
| | USD | | | 28,777 | | | MXN | | | 500,000 | | | | 01/26/16 | | | | 28,966 | | | | (189 | ) |
| | USD | | | 730,120 | | | NZD | | | 1,080,000 | | | | 01/27/16 | | | | 737,535 | | | | (7,415 | ) |
| | USD | | | 1,538,983 | | | SEK | | | 13,050,000 | | | | 01/26/16 | | | | 1,546,932 | | | | (7,949 | ) |
| | | USD | | | 26,919 | | | ZAR | | | 420,000 | | | | 01/26/16 | | | | 27,053 | | | | (134 | ) |
| TOTAL | | | | | | | | | | | | | | $ | (185,519 | ) |
FUTURES CONTRACTS — At December 31, 2015, the Fund had the following futures contracts:
| | | | | | | | | | | | | | |
| Type | | Number of
Contracts
Long (Short) | | | Expiration
Date | | Current
Value | | | Unrealized
Gain (Loss) | |
90 Day Bank Bill | | | (58 | ) | | March 2016 | | $ | (42,034,501 | ) | | $ | 5,921 | |
90 Day Bank Bill | | | (58 | ) | | June 2016 | | | (42,041,718 | ) | | | (1,294 | ) |
90 Day Bank Bill | | | (12 | ) | | September 2016 | | | (8,698,927 | ) | | | (849 | ) |
90 Day Eurodollar | | | (45 | ) | | March 2016 | | | (11,167,313 | ) | | | 2,671 | |
90 Day Eurodollar | | | (21 | ) | | June 2016 | | | (5,202,750 | ) | | | 1,676 | |
90 Day Eurodollar | | | (4 | ) | | September 2016 | | | (989,350 | ) | | | (209 | ) |
90 Day Eurodollar | | | 21 | | | December 2016 | | | 5,185,425 | | | | 28,778 | |
90 Day Eurodollar | | | 21 | | | March 2017 | | | 5,177,550 | | | | 22,668 | |
90 Day Eurodollar | | | 17 | | | June 2017 | | | 4,184,975 | | | | 11,949 | |
90 Day Eurodollar | | | 17 | | | September 2017 | | | 4,179,663 | | | | 7,273 | |
| | |
| The accompanying notes are an integral part of these financial statements. | | 63 |
GOLDMAN SACHS ABSOLUTE RETURN TRACKER FUND
Consolidated Schedule of Investments (continued)
December 31, 2015
|
| ADDITIONAL INVESTMENT INFORMATION (continued) |
FUTURES CONTRACTS (continued)
| | | | | | | | | | | | | | |
| Type | | Number of
Contracts
Long (Short) | | | Expiration
Date | | Current
Value | | | Unrealized
Gain (Loss) | |
90 Day Eurodollar | | | 17 | | | December 2017 | | $ | 4,174,563 | | | $ | (3,689 | ) |
90 Day Sterling | | | 42 | | | March 2016 | | | 7,690,018 | | | | 30,283 | |
90 Day Sterling | | | 43 | | | June 2016 | | | 7,865,189 | | | | 35,331 | |
90 Day Sterling | | | 33 | | | September 2016 | | | 6,028,170 | | | | 39,245 | |
90 Day Sterling | | | 33 | | | December 2016 | | | 6,019,048 | | | | 30,877 | |
90 Day Sterling | | | 33 | | | March 2017 | | | 6,010,534 | | | | 19,116 | |
90 Day Sterling | | | 29 | | | June 2017 | | | 5,274,503 | | | | 16,705 | |
90 Day Sterling | | | 29 | | | September 2017 | | | 5,268,625 | | | | 16,552 | |
90 Day Sterling | | | 29 | | | December 2017 | | | 5,263,281 | | | | (10,227 | ) |
Brent Crude Futures | | | (40 | ) | | January 2016 | | | (1,506,800 | ) | | | 160,810 | |
CAC 40 Index | | | 7 | | | January 2016 | | | 352,862 | | | | 521 | |
Cocoa Futures | | | 21 | | | March 2016 | | | 674,310 | | | | (8,023 | ) |
Coffee ‘C’ Futures | | | (5 | ) | | March 2016 | | | (237,563 | ) | | | (9,409 | ) |
Copper Futures | | | (20 | ) | | March 2016 | | | (1,067,500 | ) | | | 19,007 | |
Corn Futures | | | (125 | ) | | March 2016 | | | (2,242,188 | ) | | | 77,069 | |
Cotton No. 2 Futures | | | 20 | | | March 2016 | | | 632,800 | | | | 9,890 | |
DAX Index | | | 3 | | | March 2016 | | | 877,985 | | | | 16,669 | |
Euro CHF 3-Month ICE | | | (8 | ) | | March 2016 | | | (2,011,981 | ) | | | 442 | |
Euro CHF 3-Month ICE | | | (2 | ) | | June 2016 | | | (503,095 | ) | | | (3 | ) |
EURO STOXX 50 Index | | | 1,146 | | | March 2016 | | | 40,874,536 | | | | 509,278 | |
Euro-Bobl | | | 135 | | | March 2016 | | | 19,170,759 | | | | (44,924 | ) |
Euro-Bund | | | 94 | | | March 2016 | | | 16,132,238 | | | | (40,877 | ) |
Euro-Schatz | | | 254 | | | March 2016 | | | 30,780,607 | | | | 6,732 | |
FTSE 100 Index | | | 260 | | | March 2016 | | | 23,756,438 | | | | 831,127 | |
FTSE/MIB Index | | | (5 | ) | | March 2016 | | | (582,552 | ) | | | 912 | |
Gasoline RBOB Futures | | | (12 | ) | | January 2016 | | | (640,584 | ) | | | 2,101 | |
Gold 100 oz. Futures | | | (40 | ) | | February 2016 | | | (4,240,800 | ) | | | 96,600 | |
Hang Seng Index | | | (8 | ) | | January 2016 | | | (1,130,831 | ) | | | 17,932 | |
Hard Red Winter Wheat Futures | | | (16 | ) | | March 2016 | | | (374,800 | ) | | | 5,924 | |
IBEX 35 Index | | | (14 | ) | | January 2016 | | | (1,449,379 | ) | | | 20,094 | |
KOSPI 200 Index | | | (21 | ) | | March 2016 | | | (2,153,192 | ) | | | (36,025 | ) |
Lean Hogs Futures | | | (3 | ) | | February 2016 | | | (71,760 | ) | | | (3,279 | ) |
Live Cattle Futures | | | 3 | | | February 2016 | | | 164,160 | | | | 831 | |
LME Lead Futures | | | 39 | | | January 2016 | | | 1,751,831 | | | | 117,115 | |
LME Lead Futures | | | (39 | ) | | January 2016 | | | (1,751,831 | ) | | | (151,660 | ) |
LME Lead Futures | | | 26 | | | February 2016 | | | 1,168,375 | | | | 34,501 | |
LME Lead Futures | | | (31 | ) | | February 2016 | | | (1,393,063 | ) | | | (85,710 | ) |
LME Nickel Futures | | | 26 | | | January 2016 | | | 1,370,928 | | | | (9,733 | ) |
LME Nickel Futures | | | (26 | ) | | January 2016 | | | (1,370,928 | ) | | | 116,111 | |
LME Nickel Futures | | | 2 | | | February 2016 | | | 105,618 | | | | 613 | |
LME Nickel Futures | | | (27 | ) | | February 2016 | | | (1,425,843 | ) | | | (252 | ) |
LME Primary Aluminum Futures | | | 75 | | | January 2016 | | | 2,822,813 | | | | 15,136 | |
LME Primary Aluminum Futures | | | (75 | ) | | January 2016 | | | (2,822,813 | ) | | | 25,224 | |
LME Primary Aluminum Futures | | | 29 | | | February 2016 | | | 1,093,844 | | | | (2,649 | ) |
LME Primary Aluminum Futures | | | (68 | ) | | February 2016 | | | (2,564,875 | ) | | | (15,485 | ) |
LME Zinc Futures | | | 35 | | | January 2016 | | | 1,400,000 | | | | 62,768 | |
LME Zinc Futures | | | (35 | ) | | January 2016 | | | (1,400,000 | ) | | | 34,018 | |
LME Zinc Futures | | | 7 | | | February 2016 | | | 280,744 | | | | 127 | |
LME Zinc Futures | | | (37 | ) | | February 2016 | | | (1,483,931 | ) | | | (66,943 | ) |
Long Gilt | | | 47 | | | March 2016 | | | 8,090,690 | | | | (68,972 | ) |
Low Sulphur Gas Oil Futures | | | (35 | ) | | February 2016 | | | (1,169,875 | ) | | | 180,230 | |
NASDAQ 100 E-mini Index | | | 23 | | | March 2016 | | | 2,110,365 | | | | 12,241 | |
Natural Gas Futures | | | (45 | ) | | January 2016 | | | (1,051,650 | ) | | | (79,334 | ) |
| | |
| 64 | | The accompanying notes are an integral part of these financial statements. |
GOLDMAN SACHS ABSOLUTE RETURN TRACKER FUND
|
| ADDITIONAL INVESTMENT INFORMATION (continued) |
FUTURES CONTRACTS (continued)
| | | | | | | | | | | | | | |
| Type | | Number of
Contracts
Long (Short) | | | Expiration
Date | | Current
Value | | | Unrealized
Gain (Loss) | |
NY Harbor USLD Futures | | | (23 | ) | | January 2016 | | $ | (1,085,687 | ) | | $ | 207,979 | |
Russell 2000 Mini Index | | | 172 | | | March 2016 | | | 19,461,800 | | | | 223,039 | |
S&P 500 E-Mini Index | | | (48 | ) | | March 2016 | | | (4,884,960 | ) | | | (61,405 | ) |
S&P Mid Cap 400 E-mini Index | | | (12 | ) | | March 2016 | | | (1,672,200 | ) | | | (4,941 | ) |
S&P/TSX 60 Index | | | (11 | ) | | March 2016 | | | (1,209,785 | ) | | | (2,941 | ) |
Silver Futures | | | (11 | ) | | March 2016 | | | (759,165 | ) | | | 20,770 | |
Soybean Futures | | | (43 | ) | | March 2016 | | | (1,858,138 | ) | | | 42,606 | |
Sugar #11 (World) Futures | | | 61 | | | February 2016 | | | 1,041,197 | | | | 5,092 | |
TSE TOPIX Index | | | 73 | | | March 2016 | | | 9,398,685 | | | | (86,394 | ) |
U.S. Long Bond | | | 62 | | | March 2016 | | | 9,532,500 | | | | (6,108 | ) |
Wheat Futures | | | (5 | ) | | March 2016 | | | (117,500 | ) | | | 1,172 | |
WTI Crude Oil Futures | | | (47 | ) | | January 2016 | | | (1,740,880 | ) | | | 176,771 | |
2 Year U.S. Treasury Notes | | | 17 | | | March 2016 | | | 3,692,984 | | | | (5,451 | ) |
5 Year U.S. Treasury Notes | | | 39 | | | March 2016 | | | 4,614,492 | | | | (12,318 | ) |
10 Year Canadian Government Bonds | | | 108 | | | March 2016 | | | 11,004,495 | | | | 156,158 | |
10 Year Japanese Government Bonds | | | 8 | | | March 2016 | | | 9,919,880 | | | | 2,641 | |
10 Year U.S. Treasury Notes | | | 58 | | | March 2016 | | | 7,302,563 | | | | (10,945 | ) |
| TOTAL | | | | | | | | | | | | $ | 2,649,247 | |
SWAP CONTRACTS — At December 31, 2015, the Fund had the following swap contracts:
CENTRALLY CLEARED CREDIT DEFAULT SWAP CONTRACT
| | | | | | | | | | | | | | | | | | | | | | |
| | | | | | | | | | | | | | Market Value | |
| Referenced Obligation | | Notional
Amount
(000’s) | | Rates Received (Paid) | | | Termination
Date | | | Credit
Spread on
December 31,
2015 (a) | | | Upfront
Payments
Made (Received) | | | Unrealized
Gain (Loss) | |
Protection Sold: | | | | | | | | | | | | | | | | | | | | | | |
CDX North America High Yield Index | | $151,830 | | | 5.000 | % | | | 12/20/20 | | | | 4.726 | % | | $ | (221,107 | ) | | $ | 1,951,709 | |
| | (a) | | Credit spread on the Referenced Obligation, together with the period of expiration, are indicators of payment/performance risk. The likelihood of a credit event occurring which would require a fund to make a payment or otherwise be required to perform under the swap contract is generally greater as the credit spread and term of the swap contract increase. |
OVER THE COUNTER TOTAL RETURN SWAP CONTRACTS(a)
| | | | | | | | | | | | | | | | | | |
| Counterparty | | Referenced Obligation | | Notional
Amount
(000’s) | | | Rate Received
(Paid) | | | Termination
Date | | | Unrealized Gain (Loss)(b) | |
Deutsche Bank AG | | Russell Top 200 Growth Index Total Return | | $ | 54,586 | | | | 0.385 | % | | | 02/25/16 | | | $ | 335,070 | |
| | Russell Top 200 Growth Index Total Return | | | 20,305 | | | | 0.385 | | | | 03/24/16 | | | | 127,713 | |
| | Russell Top 200 Value Index Total Return | | | 52,098 | | | | (0.385 | ) | | | 02/25/16 | | | | (267,649 | ) |
| | Russell Top 200 Value Index Total Return | | | 22,923 | | | | (0.385 | ) | | | 03/24/16 | | | | (121,125 | ) |
JPMorgan Chase Bank, N.A. | | Bloomberg Roll Select Commodity Total Return Index | | | 10,246 | | | | (0.002 | ) | | | 03/21/16 | | | | 79,077 | |
| TOTAL | | | | | | | | | | | | | | | | $ | 153,086 | |
| | (a) | | The Fund receives weekly payments based on any positive weekly return of the Referenced Obligation. The Fund makes payments on any negative weekly return of such Referenced Obligation. |
| | (b) | | There are no upfront payments on the swap contracts listed above, therefore the unrealized gains (losses) on the swap contracts are equal to their market value. |
| | |
| The accompanying notes are an integral part of these financial statements. | | 65 |
GOLDMAN SACHS ABSOLUTE RETURN TRACKER FUND
Consolidated Schedule of Investments (continued)
December 31, 2015
|
| ADDITIONAL INVESTMENT INFORMATION (continued) |
WRITTEN OPTIONS CONTRACTS — At December 31, 2015, the Fund had the following written options:
| | | | | | | | | | | | | | |
| Put Options | | Number of Contracts | | | Exercise
Price | | | Expiration
Month | | Value | |
S&P 500 Index | | | 41 | | | $ | 1,825 | | | January 2016 | | $ | (3,977 | ) |
| | | 40 | | | $ | 1,850 | | | January 2016 | | | (6,000 | ) |
| | | 39 | | | $ | 1,875 | | | January 2016 | | | (7,800 | ) |
| | | 38 | | | $ | 1,900 | | | January 2016 | | | (9,310 | ) |
| | | 37 | | | $ | 1,925 | | | January 2016 | | | (12,950 | ) |
| | | 36 | | | $ | 1,950 | | | January 2016 | | | (21,240 | ) |
| | | 36 | | | $ | 1,975 | | | January 2016 | | | (32,400 | ) |
| | | 35 | | | $ | 2,000 | | | January 2016 | | | (45,500 | ) |
| | | 34 | | | $ | 2,025 | | | January 2016 | | | (71,060 | ) |
| | | 42 | | | $ | 1,875 | | | February 2016 | | | (53,550 | ) |
| | | 41 | | | $ | 1,900 | | | February 2016 | | | (65,190 | ) |
| | | 40 | | | $ | 1,925 | | | February 2016 | | | (77,600 | ) |
| | | 39 | | | $ | 1,950 | | | February 2016 | | | (90,480 | ) |
| | | 38 | | | $ | 1,975 | | | February 2016 | | | (98,800 | ) |
| | | 37 | | | $ | 2,000 | | | February 2016 | | | (133,570 | ) |
| | | 36 | | | $ | 2,025 | | | February 2016 | | | (141,300 | ) |
| | | 35 | | | $ | 2,050 | | | February 2016 | | | (177,800 | ) |
| | | 34 | | | $ | 2,075 | | | February 2016 | | | (217,192 | ) |
| | | 35 | | | $ | 1,850 | | | March 2016 | | | (68,600 | ) |
| | | 35 | | | $ | 1,875 | | | March 2016 | | | (80,850 | ) |
| | | 33 | | | $ | 1,900 | | | March 2016 | | | (88,440 | ) |
| | | 33 | | | $ | 1,925 | | | March 2016 | | | (94,545 | ) |
| | | 32 | | | $ | 1,950 | | | March 2016 | | | (116,160 | ) |
| | | 31 | | | $ | 1,975 | | | March 2016 | | | (117,800 | ) |
| | | 30 | | | $ | 2,000 | | | March 2016 | | | (147,000 | ) |
| | | 30 | | | $ | 2,025 | | | March 2016 | | | (169,500 | ) |
| | | | 29 | | | $ | 2,050 | | | March 2016 | | | (191,400 | ) |
| TOTAL (Premiums Received $3,800,048) | | | 966 | | | | | | | | | $ | (2,340,014 | ) |
For the year ended December 31, 2015, the Fund had the following written options activity:
| | | | | | | | |
| | | Number of Contracts | | | Premiums
Received | |
Contracts Outstanding December 31, 2014 | | | 2,773 | | | $ | 7,265,961 | |
Contracts written | | | 9,682 | | | | 35,545,046 | |
Contracts bought to close | | | (4,173 | ) | | | (16,727,380 | ) |
Contracts expired | | | (7,316 | ) | | | (22,283,579 | ) |
Contracts Outstanding December 31, 2015 | | | 966 | | | $ | 3,800,048 | |
| | |
| 66 | | The accompanying notes are an integral part of these financial statements. |
GOLDMAN SACHS COMMODITY STRATEGY FUND
Consolidated Schedule of Investments
December 31, 2015
| | | | | | | | | | | | | | |
Principal
Amount | | | Interest
Rate | | | Maturity
Date | | | Value | |
| | | | | | | | | | | | | | |
| | Mortgage-Backed Obligations – 11.2% | |
| | Collateralized Mortgage Obligations – 6.0% | |
| | Agency Multi-Family(a) – 3.7% | |
| FHLMC Multifamily Structured Pass-Through Certificates
Series K011, Class A2 |
|
| $ | 5,500,000 | | | | 4.084 | % | | | 11/25/20 | | | $ | 5,945,481 | |
| FHLMC Multifamily Structured Pass-Through Certificates
Series K714, Class A2 |
|
| | 16,400,000 | | | | 3.034 | | | | 10/25/20 | | | | 16,955,381 | |
| | | | | | | | | | | | | | |
| | | | | | | | | | | | | 22,900,862 | |
| | |
| | Regular Floater(a)(c) – 1.1% | |
| FDIC Guaranteed Notes Trust Series 2010-S1, Class 1A(b) | |
| | 87,102 | | | | 0.978 | | | | 02/25/48 | | | | 86,931 | |
| FHLMC REMIC Series 3371, Class FA | |
| | 378,430 | | | | 0.930 | | | | 09/15/37 | | | | 382,810 | |
| National Credit Union Administration Guaranteed Notes
Series 2010-A1, Class A |
|
| | 429,860 | | | | 0.637 | | | | 12/07/20 | | | | 430,670 | |
| National Credit Union Administration Guaranteed Notes
Series 2010-R1, Class 1A |
|
| | 600,100 | | | | 0.726 | | | | 10/07/20 | | | | 602,116 | |
| National Credit Union Administration Guaranteed Notes
Series 2010-R2, Class 1A |
|
| | 776,593 | | | | 0.646 | | | | 11/06/17 | | | | 777,443 | |
| National Credit Union Administration Guaranteed Notes
Series 2011-R2, Class 1A |
|
| | 1,841,816 | | | | 0.669 | | | | 02/06/20 | | | | 1,843,974 | |
| National Credit Union Administration Guaranteed Notes
Series 2011-R3, Class 1A |
|
| | 1,210,424 | | | | 0.595 | | | | 03/11/20 | | | | 1,212,835 | |
| National Credit Union Administration Guaranteed Notes
Series 2011-R4, Class 1A |
|
| | 774,036 | | | | 0.656 | | | | 03/06/20 | | | | 774,580 | |
| National Credit Union Administration Guaranteed Notes
Series 2011-R5, Class 1A |
|
| | 341,924 | | | | 0.655 | | | | 04/06/20 | | | | 341,924 | |
| | | | | | | | | | | | | | |
| | | | | | | | | | | | | 6,453,283 | |
| | |
| | Sequential Fixed Rate – 1.2% | |
| FHLMC REMIC Series 2755, Class ZA | |
| | 757,232 | | | | 5.000 | | | | 02/15/34 | | | | 821,969 | |
| FHLMC REMIC Series 4273, Class PD(c) | |
| | 2,451,995 | | | | 6.500 | | | | 11/15/43 | | | | 2,805,477 | |
| FNMA REMIC Series 2012-111, Class B | |
| | 789,544 | | | | 7.000 | | | | 10/25/42 | | | | 896,893 | |
| FNMA REMIC Series 2012-153, Class B | |
| | 2,630,160 | | | | 7.000 | | | | 07/25/42 | | | | 3,051,885 | |
| National Credit Union Administration Guaranteed Notes
Series 2010-R1, Class 2A(c) |
|
| | 7,765 | | | | 1.840 | | | | 10/07/20 | | | | 7,765 | |
| | | | | | | | | | | | | | |
| | | | | | | | | | | | | 7,583,989 | |
| | |
| TOTAL COLLATERALIZED
MORTGAGE OBLIGATIONS |
| | $ | 36,938,134 | |
| | |
| | Federal Agencies – 5.2% | |
| | FHLMC – 2.1% | |
| $ | 112 | | | | 5.000 | % | | | 09/01/16 | | | $ | 116 | |
| | |
| | | | | | | | | | | | | | |
| | Mortgage-Backed Obligations – (continued) | |
| | FHLMC – (continued) | |
| $ | 977 | | | | 5.000 | % | | | 11/01/16 | | | $ | 1,011 | |
| | 402 | | | | 5.000 | | | | 12/01/16 | | | | 416 | |
| | 1,798 | | | | 5.000 | | | | 01/01/17 | | | | 1,860 | |
| | 3,544 | | | | 5.000 | | | | 01/01/18 | | | | 3,651 | |
| | 38,054 | | | | 5.000 | | | | 02/01/18 | | | | 39,272 | |
| | 26,221 | | | | 5.000 | | | | 03/01/18 | | | | 27,109 | |
| | 16,225 | | | | 5.000 | | | | 04/01/18 | | | | 16,771 | |
| | 11,722 | | | | 5.000 | | | | 05/01/18 | | | | 12,128 | |
| | 9,459 | | | | 5.000 | | | | 06/01/18 | | | | 9,798 | |
| | 21,348 | | | | 5.000 | | | | 07/01/18 | | | | 22,157 | |
| | 5,556 | | | | 5.000 | | | | 08/01/18 | | | | 5,756 | |
| | 3,132 | | | | 5.000 | | | | 10/01/18 | | | | 3,260 | |
| | 5,770 | | | | 5.000 | | | | 11/01/18 | | | | 5,994 | |
| | 557 | | | | 5.000 | | | | 02/01/19 | | | | 583 | |
| | 117,975 | | | | 5.500 | | | | 01/01/20 | | | | 124,217 | |
| | 88,541 | | | | 5.000 | | | | 11/01/25 | | | | 96,625 | |
| | 177,627 | | | | 5.000 | | | | 08/01/28 | | | | 193,779 | |
| | 16,886 | | | | 5.000 | | | | 01/01/33 | | | | 18,591 | |
| | 1,668 | | | | 5.000 | | | | 03/01/33 | | | | 1,829 | |
| | 11,419 | | | | 5.000 | | | | 04/01/33 | | | | 12,525 | |
| | 3,043 | | | | 5.000 | | | | 05/01/33 | | | | 3,337 | |
| | 7,586 | | | | 5.000 | | | | 06/01/33 | | | | 8,321 | |
| | 44,874 | | | | 5.000 | | | | 07/01/33 | | | | 49,220 | |
| | 61,372 | | | | 5.000 | | | | 08/01/33 | | | | 67,330 | |
| | 5,656 | | | | 5.000 | | | | 09/01/33 | | | | 6,204 | |
| | 12,989 | | | | 5.000 | | | | 10/01/33 | | | | 14,247 | |
| | 39,431 | | | | 5.000 | | | | 11/01/33 | | | | 43,250 | |
| | 14,277 | | | | 5.000 | | | | 12/01/33 | | | | 15,660 | |
| | 14,551 | | | | 5.000 | | | | 01/01/34 | | | | 15,960 | |
| | 47,030 | | | | 5.000 | | | | 02/01/34 | | | | 51,576 | |
| | 18,343 | | | | 5.000 | | | | 03/01/34 | | | | 20,108 | |
| | 33,006 | | | | 5.000 | | | | 04/01/34 | | | | 36,182 | |
| | 51,154 | | | | 5.000 | | | | 05/01/34 | | | | 56,106 | |
| | 657,869 | | | | 5.000 | | | | 06/01/34 | | | | 721,523 | |
| | 9,498 | | | | 5.000 | | | | 11/01/34 | | | | 10,412 | |
| | 181,976 | | | | 5.000 | | | | 04/01/35 | | | | 199,601 | |
| | 3,288,696 | | | | 5.000 | | | | 07/01/35 | | | | 3,605,089 | |
| | 13,124 | | | | 5.000 | | | | 11/01/35 | | | | 14,395 | |
| | 120,370 | | | | 5.000 | | | | 03/01/36 | | | | 132,581 | |
| | 49,890 | | | | 5.000 | | | | 03/01/37 | | | | 54,468 | |
| | 110,734 | | | | 5.000 | | | | 12/01/37 | | | | 120,896 | |
| | 270,480 | | | | 5.000 | | | | 02/01/38 | | | | 295,310 | |
| | 727,305 | | | | 5.000 | | | | 03/01/38 | | | | 794,071 | |
| | 356,088 | | | | 5.000 | | | | 07/01/38 | | | | 388,777 | |
| | 349,975 | | | | 5.000 | | | | 11/01/38 | | | | 382,103 | |
| | 813,314 | | | | 5.000 | | | | 12/01/38 | | | | 887,951 | |
| | 444,650 | | | | 5.000 | | | | 01/01/39 | | | | 485,469 | |
| | 102,324 | | | | 5.000 | | | | 02/01/39 | | | | 111,717 | |
| | 2,538,105 | | | | 7.000 | | | | 02/01/39 | | | | 2,939,794 | |
| | 740,164 | | | | 5.000 | | | | 06/01/41 | | | | 808,089 | |
| | | | | | | | | | | | | | |
| | | | | | | | | | | | | 12,937,195 | |
| | |
| | FNMA – 3.1% | |
| | 21,497 | | | | 5.000 | | | | 03/01/18 | | | | 22,169 | |
| | 72,107 | | | | 5.000 | | | | 04/01/18 | | | | 74,544 | |
| | 1,192 | | | | 5.500 | | | | 01/01/19 | | | | 1,252 | |
| | |
| | |
| The accompanying notes are an integral part of these financial statements. | | 67 |
GOLDMAN SACHS COMMODITY STRATEGY FUND
Consolidated Schedule of Investments (continued)
December 31, 2015
| | | | | | | | | | | | | | |
Principal
Amount | | | Interest
Rate | | | Maturity
Date | | | Value | |
| | | | | | | | | | | | | | |
| | Mortgage-Backed Obligations – (continued) | |
| | FNMA – (continued) | |
| $ | 25,130 | | | | 5.500 | % | | | 02/01/19 | | | $ | 26,212 | |
| | 25,015 | | | | 5.500 | | | | 03/01/19 | | | | 26,142 | |
| | 18,548 | | | | 5.500 | | | | 04/01/19 | | | | 19,358 | |
| | 10,890 | | | | 5.500 | | | | 05/01/19 | | | | 11,408 | |
| | 50,639 | | | | 5.500 | | | | 06/01/19 | | | | 52,743 | |
| | 149,852 | | | | 5.500 | | | | 07/01/19 | | | | 156,601 | |
| | 141,158 | | | | 5.500 | | | | 08/01/19 | | | | 148,279 | |
| | 121,674 | | | | 5.500 | | | | 09/01/19 | | | | 127,989 | |
| | 32,993 | | | | 5.500 | | | | 10/01/19 | | | | 34,722 | |
| | 38,749 | | | | 5.500 | | | | 11/01/19 | | | | 40,845 | |
| | 64,297 | | | | 5.500 | | | | 12/01/19 | | | | 67,692 | |
| | 4,903 | | | | 5.500 | | | | 01/01/20 | | | | 5,189 | |
| | 2,544 | | | | 5.500 | | | | 06/01/20 | | | | 2,662 | |
| | 752,839 | | | | 5.500 | | | | 07/01/20 | | | | 793,659 | |
| | 10,232 | | | | 6.000 | | | | 03/01/34 | | | | 11,702 | |
| | 36,874 | | | | 6.000 | | | | 08/01/34 | | | | 42,162 | |
| | 247,781 | | | | 6.000 | | | | 08/01/35 | | | | 280,874 | |
| | 186,323 | | | | 6.000 | | | | 09/01/35 | | | | 210,888 | |
| | 159,175 | | | | 6.000 | | | | 10/01/35 | | | | 180,160 | |
| | 212,353 | | | | 6.000 | | | | 11/01/35 | | | | 241,007 | |
| | 5,859 | | | | 6.000 | | | | 02/01/36 | | | | 6,632 | |
| | 346,125 | | | | 6.000 | | | | 03/01/36 | | | | 391,758 | |
| | 8,112 | | | | 6.000 | | | | 06/01/36 | | | | 9,163 | |
| | 6,297 | | | | 6.000 | | | | 07/01/36 | | | | 7,113 | |
| | 1,958,998 | | | | 6.000 | | | | 09/01/36 | | | | 2,223,574 | |
| | 300,092 | | | | 6.000 | | | | 12/01/36 | | | | 338,732 | |
| | 26,212 | | | | 6.000 | | | | 01/01/37 | | | | 29,609 | |
| | 557,635 | | | | 6.000 | | | | 02/01/37 | | | | 629,442 | |
| | 2,418 | | | | 6.000 | | | | 04/01/37 | | | | 2,730 | |
| | 13,210 | | | | 6.000 | | | | 05/01/37 | | | | 14,921 | |
| | 170,805 | | | | 6.000 | | | | 06/01/37 | | | | 192,797 | |
| | 138,687 | | | | 6.000 | | | | 07/01/37 | | | | 156,549 | |
| | 457,693 | | | | 6.000 | | | | 08/01/37 | | | | 517,626 | |
| | 120,745 | | | | 6.000 | | | | 09/01/37 | | | | 136,375 | |
| | 29,173 | | | | 6.000 | | | | 10/01/37 | | | | 32,949 | |
| | 179,029 | | | | 5.000 | | | | 11/01/37 | | | | 198,386 | |
| | 150,491 | | | | 6.000 | | | | 11/01/37 | | | | 170,203 | |
| | 2,856 | | | | 6.000 | | | | 12/01/37 | | | | 3,239 | |
| | 539,919 | | | | 6.000 | | | | 01/01/38 | | | | 609,474 | |
| | 14,816 | | | | 6.000 | | | | 04/01/38 | | | | 16,736 | |
| | 46,009 | | | | 6.000 | | | | 05/01/38 | | | | 51,968 | |
| | 4,298 | | | | 6.000 | | | | 09/01/38 | | | | 4,854 | |
| | 151,903 | | | | 6.000 | | | | 10/01/38 | | | | 171,806 | |
| | 4,449 | | | | 6.000 | | | | 12/01/38 | | | | 5,025 | |
| | 5,178 | | | | 6.000 | | | | 01/01/39 | | | | 5,848 | |
| | 1,558,002 | | | | 7.000 | | | | 03/01/39 | | | | 1,804,456 | |
| | 18,215 | | | | 4.000 | | | | 08/01/39 | | | | 19,281 | |
| | 40,121 | | | | 6.000 | | | | 10/01/39 | | | | 45,315 | |
| | 40,268 | | | | 4.500 | | | | 02/01/40 | | | | 43,491 | |
| | 6,797 | | | | 6.000 | | | | 04/01/40 | | | | 7,677 | |
| | 66,673 | | | | 6.000 | | | | 05/01/41 | | | | 75,304 | |
| | 382,847 | | | | 5.000 | | | | 07/01/41 | | | | 422,807 | |
| | 250,192 | | | | 4.500 | | | | 08/01/41 | | | | 271,244 | |
| | 131,903 | | | | 3.500 | | | | 01/01/45 | | | | 136,207 | |
| | 847,000 | | | | 3.500 | | | | 02/01/45 | | | | 874,634 | |
| | 700,846 | | | | 3.500 | | | | 03/01/45 | | | | 723,711 | |
| | |
| | | | | | | | | | | | | | |
| | Mortgage-Backed Obligations – (continued) | |
| | FNMA – (continued) | |
| $ | 143,570 | | | | 3.500 | % | | | 04/01/45 | | | $ | 148,254 | |
| | 599,801 | | | | 3.500 | | | | 05/01/45 | | | | 619,370 | |
| | 1,285,710 | | | | 3.500 | | | | 07/01/45 | | | | 1,327,657 | |
| | 2,536,507 | | | | 3.500 | | | | 09/01/45 | | | | 2,619,189 | |
| | 1,000,000 | | | | 6.000 | | | | TBA-30yr | (d) | | | 1,130,156 | |
| | | | | | | | | | | | | | |
| | | | | | | | | | | | | 18,774,521 | |
| | |
| | TOTAL FEDERAL AGENCIES | | | $ | 31,711,716 | |
| | |
| | TOTAL MORTGAGE-BACKED OBLIGATIONS | |
| | (Cost $68,213,133) | | | $ | 68,649,850 | |
| | |
| | | | | | | | | | | | | | |
| | Asset-Backed Securities(c) – 0.0% | |
| | Home Equity – 0.0% | |
| GMAC Mortgage Corp. Loan Trust Series 2007-HE3, Class 1A1 | |
| $ | 61,978 | | | | 7.000 | % | | | 09/25/37 | | | $ | 61,484 | |
| GMAC Mortgage Corp. Loan Trust Series 2007-HE3,
Class 2A1(a) |
|
| | 114,935 | | | | 6.656 | | | | 09/25/37 | | | | 115,075 | |
| | |
| | TOTAL ASSET-BACKED SECURITIES | |
| | (Cost $177,245) | | | | | | | | | | | $ | 176,559 | |
| | |
| | | | | | | | | | | | | | |
| | U.S. Treasury Obligations – 54.0% | |
| United States Treasury Bill(e) | |
| $ | 150,000,000 | | | | 0.000 | % | | | 06/23/16 | | | $ | 149,662,879 | |
| United States Treasury Bonds | |
| | 1,100,000 | | | | 2.750 | | | | 11/15/42 | | | | 1,049,466 | |
| | 11,800,000 | | | | 3.625 | (f) | | | 08/15/43 | | | | 13,298,245 | |
| | 5,650,000 | | | | 3.750 | (f) | | | 11/15/43 | | | | 6,511,625 | |
| | 10,400,000 | | | | 3.625 | (f) | | | 02/15/44 | | | | 11,704,161 | |
| | 4,900,000 | | | | 3.375 | (f) | | | 05/15/44 | | | | 5,261,571 | |
| | 7,700,000 | | | | 3.000 | | | | 11/15/44 | | | | 7,676,053 | |
| | 5,400,000 | | | | 3.000 | | | | 05/15/45 | | | | 5,377,806 | |
| | 800,000 | | | | 2.875 | | | | 08/15/45 | | | | 777,376 | |
| | 2,800,000 | | | | 3.000 | | | | 11/15/45 | | | | 2,792,664 | |
| United States Treasury Inflation-Protected Securities | |
| | 7,183,970 | | | | 2.500 | | | | 07/15/16 | | | | 7,301,859 | |
| | 6,282,840 | | | | 0.125 | (f) | | | 04/15/17 | | | | 6,270,086 | |
| | 1,543,335 | | | | 0.125 | | | | 04/15/18 | | | | 1,540,927 | |
| United States Treasury Notes | |
| | 3,900,000 | | | | 1.500 | | | | 05/31/19 | | | | 3,904,134 | |
| | 7,500,000 | | | | 1.625 | | | | 08/31/19 | | | | 7,523,025 | |
| | 6,300,000 | | | | 1.750 | | | | 09/30/19 | | | | 6,343,659 | |
| | 4,000,000 | | | | 1.250 | | | | 01/31/20 | | | | 3,938,720 | |
| | 9,000,000 | | | | 1.375 | | | | 02/29/20 | | | | 8,897,850 | |
| | 6,100,000 | | | | 1.375 | | | | 03/31/20 | | | | 6,026,312 | |
| | 3,600,000 | | | | 1.375 | | | | 04/30/20 | | | | 3,553,884 | |
| | 13,100,000 | | | | 1.625 | | | | 06/30/20 | | | | 13,045,635 | |
| | 4,200,000 | | | | 1.750 | | | | 12/31/20 | | | | 4,196,556 | |
| | 6,600,000 | | | | 2.250 | | | | 04/30/21 | | | | 6,731,803 | |
| | 2,600,000 | | | | 2.000 | | | | 05/31/21 | | | | 2,618,044 | |
| | 6,600,000 | | | | 2.000 | | | | 10/31/21 | | | | 6,619,800 | |
| | 4,600,000 | | | | 2.125 | | | | 12/31/21 | | | | 4,641,446 | |
| | |
| | |
| 68 | | The accompanying notes are an integral part of these financial statements. |
GOLDMAN SACHS COMMODITY STRATEGY FUND
| | | | | | | | | | | | | | |
Principal
Amount | | | Interest
Rate | | | Maturity
Date | | | Value | |
| | | | | | | | | | | | | | |
| | U.S. Treasury Obligations – (continued) | |
| United States Treasury Notes – (continued) | |
| $ | 3,000,000 | | | | 1.750 | % | | | 02/28/22 | | | $ | 2,958,060 | |
| | 6,800,000 | | | | 1.875 | | | | 05/31/22 | | | | 6,735,944 | |
| | 800,000 | | | | 2.125 | | | | 06/30/22 | | | | 804,216 | |
| | 5,800,000 | | | | 1.750 | | | | 09/30/22 | | | | 5,685,218 | |
| | 3,700,000 | | | | 1.875 | | | | 10/31/22 | | | | 3,653,380 | |
| | 9,300,000 | | | | 2.125 | | | | 12/31/22 | | | | 9,317,484 | |
| | 7,200,000 | | | | 2.250 | | | | 11/15/24 | | | | 7,196,112 | |
| | |
| | TOTAL U.S. TREASURY OBLIGATIONS | |
| | (Cost $330,854,247) | | | $ | 333,616,000 | |
| | |
| | | |
| Shares | | | Distribution Rate | | | | | | Value | |
| | Investment Company(a)(g) – 22.2% | |
| Goldman Sachs Financial Square Government Fund – FST
Shares |
|
| | 137,213,970 | | | | 0.185 | % | | | | | | $ | 137,213,970 | |
| | (Cost $137,213,970) | |
| | |
| | TOTAL INVESTMENTS – 87.4% | |
| | (Cost $536,458,595) | | | $ | 539,656,379 | |
| | |
| OTHER ASSETS IN EXCESS OF
LIABILITIES – 12.6% |
| | | 78,519,068 | |
| | |
| | NET ASSETS – 100.0% | | | $ | 618,175,447 | |
| | |
| | |
| The percentage shown for each investment category reflects the value of investments in that category as a percentage of net assets. |
(a) | | Variable rate security. Interest rate or distribution rate disclosed is that which is in effect on December 31, 2015. |
(b) | | Exempt from registration under Rule 144A of the Securities Act of 1933. Under procedures approved by the Board of Trustees, such securities may be deemed liquid by the Investment Adviser and may be resold, normally to qualified institutional buyers in transactions exempt from registration. Total market value of Rule 144A securities amounts to $86,931, which represents approximately 0.0% of net assets as of December 31, 2015. |
(c) | | Securities with “Call” features. Maturity dates disclosed are the final maturity dates. |
(d) | | TBA (To Be Announced) Securities are purchased on a forward commitment basis with an approximate principal amount and no defined maturity date. The actual principal and maturity date will be determined upon settlement when the specific mortgage pools are assigned. Total market value of TBA securities (excluding forward sales contracts, if any) amounts to $1,130,156 which represents approximately 0.2% of net assets as of December 31, 2015. |
(e) | | Issued with a zero coupon. Income is recognized through the accretion of discount. |
(f) | | All or a portion of security is segregated as collateral for initial margin requirements on futures transactions. |
(g) | | Represents an affiliated issuer. |
| | |
|
Investment Abbreviations: |
FDIC | | —Federal Deposit Insurance Corp. |
FHLMC | | —Federal Home Loan Mortgage Corp. |
FNMA | | —Federal National Mortgage Association |
LIBOR | | —London Interbank Offered Rate |
REMIC | | —Real Estate Mortgage Investment Conduit |
|
|
| ADDITIONAL INVESTMENT INFORMATION |
FORWARD SALES CONTRACT — At December 31, 2015, the Fund had the following forward sales contracts:
| | | | | | | | | | | | | | | | | | | | |
| Description | | Interest
Rate | | | Maturity
Date(a) | | | Settlement
Date | | | Principal
Amount | | | Value | |
FNMA | | | | | | | | | | | | | | | | | | | | |
| (Proceeds Received: $5,169,727) | | | 3.500 | % | | | TBA-30yr | | | | 01/25/46 | | | $ | (5,000,000 | ) | | $ | (5,157,422 | ) |
| | (a) | | TBA (To Be Announced) Securities are sold on a forward commitment basis with an approximate principal amount and no defined maturity date. The actual principal and maturity date will be determined upon settlement when the specific mortgage pools are assigned. |
| | |
| The accompanying notes are an integral part of these financial statements. | | 69 |
GOLDMAN SACHS COMMODITY STRATEGY FUND
Consolidated Schedule of Investments (continued)
December 31, 2015
|
| ADDITIONAL INVESTMENT INFORMATION (continued) |
FUTURES CONTRACTS — At December 31, 2015, the Fund had the following futures contracts:
| | | | | | | | | | | | | | |
| Type | | Number of
Contracts
Long (Short) | | | Expiration
Date | | Current
Value | | | Unrealized
Gain (Loss) | |
U.S. Long Bond | | | (123 | ) | | March 2016 | | $ | (18,911,250 | ) | | $ | (2,165 | ) |
U.S. Ultra Long Treasury Bonds | | | (308 | ) | | March 2016 | | | (48,875,750 | ) | | | (222,355 | ) |
2 Year U.S. Treasury Notes | | | (268 | ) | | March 2016 | | | (58,218,813 | ) | | | 29,469 | |
5 Year U.S. Treasury Notes | | | (635 | ) | | March 2016 | | | (75,133,398 | ) | | | 133,742 | |
10 Year U.S. Treasury Notes | | | (305 | ) | | March 2016 | | | (38,401,406 | ) | | | 108,881 | |
| TOTAL | | | | | | | | | | | | $ | 47,572 | |
SWAP CONTRACTS — At December 31, 2015, the Fund had the following swap contracts:
CENTRALLY CLEARED INTEREST RATE SWAP CONTRACT
| | | | | | | | | | | | | | | | | | |
| | | | | | Rates Exchanged | | Market Value | |
Notional
Amount
(000’s) | | | Termination
Date | | Payments
Received | | | Payments
Made | | Upfront
Payments
Made (Received) | | | Unrealized
Gain (Loss) | |
| $ | 100 | | | 06/19/43 | | | 2.750 | % | | 3 Month LIBOR | | $ | (9,851 | ) | | $ | 12,137 | |
OVER THE COUNTER TOTAL RETURN SWAP CONTRACTS(a)
| | | | | | | | | | | | | | | | | | |
| Counterparty | | Referenced Obligation | | Notional
Amount
(000’s) | | | Rate Received
(Paid) | | | Termination
Date | | | Unrealized Gain (Loss)(b) | |
Deutsche Bank AG | | S&P GSCI Official Close Index | | $ | 133,401 | | | | (0.12 | )% | | | 04/20/16 | | | $ | (11,543,384 | ) |
Macquarie Bank Ltd. | | S&P GSCI Official Close Index | | | 148,621 | | | | (0.16 | ) | | | 08/15/16 | | | | (11,919,548 | ) |
Merrill Lynch International | | Merrill Lynch Commodity Index eXtra GB6 Excess Return | | | 156,289 | | | | (0.25 | ) | | | 06/21/16 | | | | (4,549,199 | ) |
Societe Generale SA | | S&P GSCI Official Close Index | | | 107,888 | | | | (0.13 | ) | | | 04/26/16 | | | | (8,706,293 | ) |
UBS AG | | S&P GSCI Official Close Index | | | 158,029 | | | | (0.15 | ) | | | 04/22/16 | | | | (12,568,307 | ) |
| TOTAL | | | | | | | | | | | | | | | | $ | (49,286,731 | ) |
| | (a) | | The Fund receives monthly payments based on any positive monthly return of the Referenced Obligation. The Fund makes payments on any negative monthly return of such Referenced Obligation. |
| | (b) | | There are no upfront payments on the swap contracts listed above, therefore the unrealized gains (losses) on the swap contracts are equal to their market value. |
| | |
| 70 | | The accompanying notes are an integral part of these financial statements. |
GOLDMAN SACHS DYNAMIC ALLOCATION FUND
Consolidated Schedule of Investments
December 31, 2015
| | | | | | | | |
Shares | | | Description | | Value | |
| | Common Stocks – 24.8% | |
| | Automobiles & Components – 3.3% | | | | |
| | 47,100 | | | Bridgestone Corp. | | $ | 1,615,597 | |
| | 22,752 | | | Compagnie Generale des Etablissements Michelin Class B | | | 2,165,594 | |
| | 9,690 | | | Continental AG | | | 2,344,108 | |
| | 135,700 | | | Daihatsu Motor Co. Ltd. | | | 1,830,596 | |
| | 41,300 | | | Fuji Heavy Industries Ltd. | | | 1,701,406 | |
| | 83,000 | | | Mazda Motor Corp. | | | 1,712,685 | |
| | 191,300 | | | Mitsubishi Motors Corp. | | | 1,618,501 | |
| | 125,100 | | | Sumitomo Rubber Industries Ltd. | | | 1,626,722 | |
| | 54,700 | | | Suzuki Motor Corp. | | | 1,661,995 | |
| | 99,800 | | | The Yokohama Rubber Co. Ltd. | | | 1,532,710 | |
| | 70,100 | | | Yamaha Motor Co. Ltd. | | | 1,571,313 | |
| | | | | | | | |
| | | | | | | 19,381,227 | |
| | |
| | Banks – 2.1% | | | | |
| | 158,321 | | | Banco Popolare SC* | | | 2,181,714 | |
| | 641,265 | | | Banco Popular Espanol SA | | | 2,112,895 | |
| | 201,826 | | | Commerzbank AG* | | | 2,082,558 | |
| | 189,145 | | | Credit Agricole SA | | | 2,228,912 | |
| | 333,000 | | | Fukuoka Financial Group, Inc. | | | 1,651,221 | |
| | 48,548 | | | Societe Generale SA | | | 2,237,196 | |
| | | | | | | | |
| | | | | | | 12,494,496 | |
| | |
| | Capital Goods – 2.5% | | | | |
| | 120,693 | | | ABB Ltd. (Registered)* | | | 2,154,082 | |
| | 70,134 | | | ACS Actividades de Construccion y Servicios SA | | | 2,051,945 | |
| | 8,667 | | | Colfax Corp.* | | | 202,375 | |
| | 2,377 | | | Cummins, Inc. | | | 209,200 | |
| | 3,587 | | | Dover Corp. | | | 219,919 | |
| | 356,000 | | | Ebara Corp. | | | 1,691,764 | |
| | 4,677 | | | Emerson Electric Co. | | | 223,701 | |
| | 141,300 | | | Hino Motors Ltd. | | | 1,633,069 | |
| | 153,000 | | | Mitsubishi Electric Corp. | | | 1,606,017 | |
| | 3,864 | | | MSC Industrial Direct Co., Inc. Class A | | | 217,427 | |
| | 205,000 | | | OKUMA Corp. | | | 1,657,871 | |
| | 10,913 | | | Quanta Services, Inc.* | | | 220,988 | |
| | 36,655 | | | Schneider Electric SE | | | 2,082,149 | |
| | 1,178 | | | W.W. Grainger, Inc. | | | 238,651 | |
| | 4,958 | | | WESCO International, Inc.* | | | 216,566 | |
| | | | | | | | |
| | | | | | | 14,625,724 | |
| | |
| | Commercial & Professional Services – 1.1% | | | | |
| | 33,264 | | | Adecco SA (Registered)* | | | 2,276,679 | |
| | 2,600 | | | Manpowergroup, Inc. | | | 219,154 | |
| | 36,857 | | | Randstad Holding NV | | | 2,295,138 | |
| | 54,100 | | | Recruit Holdings Co. Ltd. | | | 1,590,204 | |
| | | | | | | | |
| | | | | | | 6,381,175 | |
| | |
| | Consumer Durables & Apparel – 1.8% | | | | |
| | 24,308 | | | adidas AG | | | 2,359,312 | |
| | 74,100 | | | Bandai Namco Holdings, Inc. | | | 1,565,520 | |
| | 6,377 | | | Fossil Group, Inc.* | | | 233,143 | |
| | 13,173 | | | LVMH Moet Hennessy Louis Vuitton SE | | | 2,069,087 | |
| | 5,704 | | | Michael Kors Holdings Ltd.* | | | 228,502 | |
| | |
| | Common Stocks – (continued) | |
| | Consumer Durables & Apparel – (continued) | | | | |
| | 1,897 | | | Ralph Lauren Corp. | | $ | 211,478 | |
| | 143,800 | | | Sekisui Chemical Co. Ltd. | | | 1,877,491 | |
| | 6,275 | | | The Swatch Group AG | | | 2,179,088 | |
| | | | | | | | |
| | | | | | | 10,723,621 | |
| | |
| | Diversified Financials – 0.4% | | | | |
| | 87,945 | | | Deutsche Bank AG (Registered) | | | 2,135,716 | |
| | |
| | Energy – 0.3% | | | | |
| | 3,864 | | | Dril-Quip, Inc.* | | | 228,865 | |
| | 173,000 | | | Inpex Corp. | | | 1,686,562 | |
| | 6,297 | | | National Oilwell Varco, Inc. | | | 210,886 | |
| | | | | | | | |
| | | | | | | 2,126,313 | |
| | |
| | Food & Staples Retailing – 1.1% | | | | |
| | 72,947 | | | Carrefour SA | | | 2,105,221 | |
| | 105,914 | | | Koninklijke Ahold NV | | | 2,234,091 | |
| | 32,000 | | | Matsumotokiyoshi Holdings Co. Ltd. | | | 1,632,919 | |
| | 3,906 | | | Wal-Mart Stores, Inc. | | | 239,438 | |
| | 7,839 | | | Whole Foods Market, Inc. | | | 262,606 | |
| | | | | | | | |
| | | | | | | 6,474,275 | |
| | |
| | Food, Beverage & Tobacco – 0.1% | | | | |
| | 4,946 | | | Keurig Green Mountain, Inc. | | | 445,041 | |
| | |
| | Health Care Equipment & Services – 0.9% | | | | |
| | 1,787 | | | Anthem, Inc. | | | 249,179 | |
| | 4,086 | | | Centene Corp.* | | | 268,900 | |
| | 3,728 | | | Health Net, Inc.* | | | 255,219 | |
| | 1,400 | | | Humana, Inc. | | | 249,914 | |
| | 3,453 | | | Quest Diagnostics, Inc. | | | 245,646 | |
| | 3,788 | | | St. Jude Medical, Inc. | | | 233,985 | |
| | 39,748 | | | Zimmer Biomet Holdings, Inc. | | | 4,077,747 | |
| | | | | | | | |
| | | | | | | 5,580,590 | |
| | |
| | Insurance – 0.4% | | | | |
| | 387,690 | | | Aegon NV | | | 2,192,566 | |
| | |
| | Materials – 3.3% | | | | |
| | 32,199 | | | Akzo Nobel NV | | | 2,151,494 | |
| | 272,000 | | | Asahi Kasei Corp. | | | 1,839,293 | |
| | 27,614 | | | BASF SE | | | 2,103,581 | |
| | 28,755 | | | HeidelbergCement AG | | | 2,343,462 | |
| | 134,500 | | | Hitachi Metals Ltd. | | | 1,659,488 | |
| | 88,760 | | | K+S AG (Registered) | | | 2,262,594 | |
| | 25,200 | | | Nitto Denko Corp. | | | 1,839,743 | |
| | 4,032 | | | Reliance Steel & Aluminum Co. | | | 233,493 | |
| | 305,000 | | | Sumitomo Chemical Co. Ltd. | | | 1,751,644 | |
| | 484,000 | | | Teijin Ltd. | | | 1,649,408 | |
| | 306,000 | | | Tosoh Corp. | | | 1,574,068 | |
| | | | | | | | |
| | | | | | | 19,408,268 | |
| | |
| | Media – 0.3% | | | | |
| | 40,700 | | | CyberAgent, Inc. | | | 1,676,943 | |
| | |
| | Pharmaceuticals, Biotechnology & Life Sciences – 1.3% | | | | |
| | 120,700 | | | Astellas Pharma, Inc. | | | 1,718,257 | |
| | 2,202 | | | Gilead Sciences, Inc. | | | 222,820 | |
| | |
| | |
| The accompanying notes are an integral part of these financial statements. | | 71 |
GOLDMAN SACHS DYNAMIC ALLOCATION FUND
Consolidated Schedule of Investments (continued)
December 31, 2015
| | | | | | | | |
Shares | | | Description | | Value | |
| | Common Stocks – (continued) | |
| | Pharmaceuticals, Biotechnology & Life Sciences – (continued) | |
| | 49,500 | | | Otsuka Holdings Co. Ltd. | | $ | 1,758,682 | |
| | 25,723 | | | Sanofi | | | 2,192,160 | |
| | 141,900 | | | Sumitomo Dainippon Pharma Co. Ltd. | | | 1,671,790 | |
| | | | | | | | |
| | | | | | | 7,563,709 | |
| | |
| | Retailing – 0.3% | | | | |
| | 9,900 | | | Aaron’s, Inc. | | | 221,661 | |
| | 4,376 | | | Bed Bath & Beyond, Inc.* | | | 211,142 | |
| | 7,690 | | | Best Buy Co., Inc. | | | 234,161 | |
| | 6,019 | | | Dick’s Sporting Goods, Inc. | | | 212,772 | |
| | 3,106 | | | Dillard’s, Inc. Class A | | | 204,095 | |
| | 10,290 | | | DSW, Inc. Class A | | | 245,519 | |
| | 19,090 | | | Staples, Inc. | | | 180,782 | |
| | 8,696 | | | The Gap, Inc. | | | 214,791 | |
| | 10,201 | | | Urban Outfitters, Inc.* | | | 232,073 | |
| | | | | | | | |
| | | | | | | 1,956,996 | |
| | |
| | Semiconductors & Semiconductor Equipment – 0.1% | | | | |
| | 6,769 | | | Intel Corp. | | | 233,192 | |
| | 26,937 | | | Marvell Technology Group Ltd. | | | 237,584 | |
| | 15,205 | | | Micron Technology, Inc.* | | | 215,303 | |
| | | | | | | | |
| | | | | | | 686,079 | |
| | |
| | Software & Services – 0.8% | | | | |
| | 27,928 | | | AtoS SE | | | 2,344,625 | |
| | 8,296 | | | CA, Inc. | | | 236,934 | |
| | 342,000 | | | Fujitsu Ltd. | | | 1,706,963 | |
| | 11,766 | | | Symantec Corp. | | | 247,086 | |
| | 8,247 | | | Teradata Corp.* | | | 217,886 | |
| | 22,430 | | | Xerox Corp. | | | 238,431 | |
| | | | | | | | |
| | | | | | | 4,991,925 | |
| | |
| | Technology Hardware & Equipment – 2.6% | | | | |
| | 4,113 | | | Arrow Electronics, Inc.* | | | 222,842 | |
| | 5,145 | | | Avnet, Inc. | | | 220,412 | |
| | 23,819 | | | Brocade Communications Systems, Inc. | | | 218,659 | |
| | 143,900 | | | Brother Industries Ltd. | | | 1,653,089 | |
| | 226,400 | | | Citizen Holdings Co. Ltd. | | | 1,627,199 | |
| | 9,263 | | | EMC Corp. | | | 237,874 | |
| | 2,265 | | | F5 Networks, Inc.* | | | 219,614 | |
| | 163,700 | | | Konica Minolta, Inc. | | | 1,639,485 | |
| | 1,330,000 | | | Oki Electric Industry Co. Ltd. | | | 1,664,907 | |
| | 4,728 | | | QUALCOMM, Inc. | | | 236,329 | |
| | 160,400 | | | Ricoh Co. Ltd. | | | 1,651,608 | |
| | 661 | | | SanDisk Corp. | | | 50,229 | |
| | 111,500 | | | Seiko Epson Corp. | | | 1,717,006 | |
| | 238,695 | | | Telefonaktiebolaget LM Ericsson Class B | | | 2,301,332 | |
| | 3,802 | | | Western Digital Corp. | | | 228,310 | |
| | 141,100 | | | Yokogawa Electric Corp. | | | 1,696,860 | |
| | | | | | | | |
| | | | | | | 15,585,755 | |
| | |
| | Telecommunication Services – 0.3% | | | | |
| | 69,800 | | | KDDI Corp. | | | 1,812,720 | |
| | |
| | Common Stocks – (continued) | |
| | Transportation – 1.1% | | | | |
| | 156,261 | | | Deutsche Lufthansa AG (Registered)* | | $ | 2,461,278 | |
| | 79,252 | | | Deutsche Post AG (Registered) | | | 2,215,712 | |
| | 46,900 | | | Japan Airlines Co. Ltd. | | | 1,678,687 | |
| | | | | | | | |
| | | | | | | 6,355,677 | |
| | |
| | Utilities – 0.7% | | | | |
| | 461,000 | | | Osaka Gas Co. Ltd. | | | 1,665,104 | |
| | 186,586 | | | RWE AG | | | 2,352,362 | |
| | | | | | | | |
| | | | | | | 4,017,466 | |
| | |
| | TOTAL COMMON STOCKS | |
| | (Cost $148,582,078) | | $ | 146,616,282 | |
| | |
| | | | | | | | | | |
| Shares | | Description | | Rate | | | Value | |
| | | | | | | | | | |
| Preferred Stock – 0.4% | |
| Household & Personal Products | |
| 20,117 | | Henkel AG &
Co. KGaA | | | 1.310 | % | | $ | 2,245,098 | |
| (Cost $2,193,236) | | | | | | | | |
| |
| | | | | | | | | | | | |
Principal
Amount | | Interest
Rate | | | Maturity
Date | | | Value | |
| | | | | | | | | | | | |
| Commodity Index Linked Structured Notes(a)(b)(c)(d)(e) – 0.9% | |
UBS AG | |
| $ 2,150,000 | | | 0.083 | % | | | 05/31/16 | | | $ | 4,869,250 | |
| 500,000 | | | 0.038 | | | | 10/31/16 | | | | 846,283 | |
| |
TOTAL COMMODITY INDEX LINKED
STRUCTURED NOTES | |
| (Cost $2,650,000) | | | $ | 5,715,533 | |
| |
| | | | | | | | | | | | |
| U.S. Treasury Obligation – 4.1% | |
United States Treasury Inflation-Protected Securities | |
| $25,134,429 | | | 0.375% | | | | 07/15/25 | | | $ | 24,364,561 | |
| (Cost $24,810,887) | | | | | |
| |
| | | | | | | | |
| Shares | | | Distribution
Rate | | Value | |
| | | | | | | | |
| | Investment Company(e)(f) – 55.6% | |
| Goldman Sachs Financial Square Government Fund – FST Shares | |
| | 329,041,062 | | | 0.185% | | $ | 329,041,062 | |
| | (Cost $329,041,062) | | | | |
| | |
| | TOTAL INVESTMENTS – 85.8% | |
| | (Cost $507,277,263) | | $ | 507,982,536 | |
| | |
| OTHER ASSETS IN EXCESS OF
LIABILITIES – 14.2% | | | 83,840,708 | |
| | |
| | NET ASSETS – 100.0% | | $ | 591,823,244 | |
| | |
| | |
| 72 | | The accompanying notes are an integral part of these financial statements. |
GOLDMAN SACHS DYNAMIC ALLOCATION FUND
| | |
| The percentage shown for each investment category reflects the value of investments in that category as a percentage of net assets. |
| | |
* | | Non-income producing security. |
(a) | | Exempt from registration under Rule 144A of the Securities Act of 1933. Under procedures approved by the Board of Trustees, such securities may be deemed liquid by the Investment Adviser and may be resold, normally to qualified institutional buyers in transactions exempt from registration. Total market value of Rule 144A securities amounts to $5,715,533, which represents approximately 0.9% of net assets as of December 31, 2015. |
(b) | | Interest rate is LIBOR as of December 31, 2015 minus a spread. |
(c) | | Security is linked to the Bloomberg Petroleum Sub Index Total Return (the “BCOMPETR”). The BCOMPETR is a commodity group sub index of the Bloomberg Commodity Index Total Return. The BCOMPETR is composed of futures contracts on crude oil, heating oil, and unleaded gasoline. |
(d) | | These Structured Notes take into consideration a leverage factor of 300% on the return of the underlying linked index. |
(e) | | Variable rate security. Interest rate or distribution rate disclosed is that which is in effect on December 31, 2015. |
(f) | | Represents an affiliated issuer. |
| | | | |
|
Investment Abbreviation: | | |
LIBOR | | —London Interbank Offered Rate |
| | |
Currency Abbreviations: |
CHF | | —Swiss Franc |
DKK | | —Denmark Krone |
EUR | | —Euro |
JPY | | —Japanese Yen |
NOK | | —Norwegian Krone |
SEK | | —Swedish Krona |
USD | | —United States Dollar |
|
|
| ADDITIONAL INVESTMENT INFORMATION |
FORWARD FOREIGN CURRENCY EXCHANGE CONTRACTS — At December 31, 2015, the Fund had the following forward foreign currency exchange contracts:
FORWARD FOREIGN CURRENCY EXCHANGE CONTRACTS WITH UNREALIZED GAIN
| | | | | | | | | | | | | | | | | | | | | | | | |
| Counterparty | | Currency
Purchased | | | Currency
Sold | | | Settlement
Date | | | Current
Value | | | Unrealized
Gain | |
Morgan Stanley Co., Inc. | | DKK | | | 870,000 | | | USD | | | 126,898 | | | | 03/16/16 | | | $ | 126,969 | | | $ | 71 | |
| | EUR | | | 1,160,000 | | | USD | | | 1,260,901 | | | | 03/16/16 | | | | 1,262,946 | | | | 2,045 | |
| | JPY | | | 106,000,000 | | | USD | | | 870,083 | | | | 03/16/16 | | | | 883,417 | | | | 13,334 | |
| | SEK | | | 2,850,000 | | | USD | | | 335,065 | | | | 03/16/16 | | | | 338,324 | | | | 3,259 | |
| | | USD | | | 3,089,153 | | | NOK | | | 26,800,000 | | | | 03/16/16 | | | | 3,025,572 | | | | 63,581 | |
| TOTAL | | | | | | | | | | | | | | | | | | | | | | $ | 82,290 | |
FORWARD FOREIGN CURRENCY EXCHANGE CONTRACTS WITH UNREALIZED LOSS
| | | | | | | | | | | | | | | | | | | | | | | | |
| Counterparty | | Currency
Purchased | | | Currency
Sold | | | Settlement
Date | | | Current
Value | | | Unrealized
Loss | |
Morgan Stanley Co., Inc. | | CHF | | | 550,000 | | | USD | | | 555,690 | | | | 03/16/16 | | | $ | 550,825 | | | $ | (4,865 | ) |
| | DKK | | | 500,000 | | | USD | | | 73,546 | | | | 03/16/16 | | | | 72,971 | | | | (575 | ) |
| | EUR | | | 1,700,000 | | | USD | | | 1,863,965 | | | | 03/16/16 | | | | 1,850,869 | | | | (13,096 | ) |
| | NOK | | | 800,000 | | | USD | | | 92,184 | | | | 03/16/16 | | | | 90,316 | | | | (1,868 | ) |
| | USD | | | 9,978,033 | | | CHF | | | 10,120,000 | | | | 03/16/16 | | | | 10,135,173 | | | | (157,140 | ) |
| | USD | | | 3,101,875 | | | DKK | | | 21,751,093 | | | | 03/16/16 | | | | 3,174,381 | | | | (72,506 | ) |
| | USD | | | 62,123,947 | | | EUR | | | 58,480,000 | | | | 03/16/16 | | | | 63,669,912 | | | | (1,545,966 | ) |
| | USD | | | 74,534,995 | | | JPY | | | 9,178,000,000 | | | | 03/16/16 | | | | 76,490,581 | | | | (1,955,586 | ) |
| | | USD | | | 5,396,368 | | | SEK | | | 46,800,000 | | | | 03/16/16 | | | | 5,555,638 | | | | (159,270 | ) |
| TOTAL | | | | | | | | | | | | | | | | | | | | | | $ | (3,910,872 | ) |
| | |
| The accompanying notes are an integral part of these financial statements. | | 73 |
GOLDMAN SACHS DYNAMIC ALLOCATION FUND
Consolidated Schedule of Investments (continued)
December 31, 2015
|
| ADDITIONAL INVESTMENT INFORMATION (continued) |
FUTURES CONTRACTS — At December 31, 2015, the Fund had the following futures contracts:
| | | | | | | | | | | | | | |
| Type | | Number of
Contracts
Long (Short) | | | Expiration
Date | | Current
Value | | | Unrealized
Gain (Loss) | |
Amsterdam Index | | | 48 | | | January 2016 | | $ | 4,609,733 | | | $ | 115,253 | |
Brent Crude Futures | | | (7 | ) | | January 2016 | | | (263,690 | ) | | | 47,382 | |
CAC 40 Index | | | 124 | | | January 2016 | | | 6,250,703 | | | | 17,378 | |
CBOE Volatility Index | | | (78 | ) | | January 2016 | | | (1,444,950 | ) | | | (84,462 | ) |
Cocoa Futures | | | 9 | | | March 2016 | | | 288,990 | | | | (7,889 | ) |
Coffee ‘C’ Futures | | | (8 | ) | | March 2016 | | | (380,100 | ) | | | (13,864 | ) |
Corn Futures | | | 8 | | | March 2016 | | | 143,500 | | | | (12,009 | ) |
Cotton No. 2 Futures | | | 4 | | | March 2016 | | | 126,560 | | | | 716 | |
DAX Index | | | (3 | ) | | March 2016 | | | (877,985 | ) | | | (27,649 | ) |
Euro-Bund | | | 53 | | | March 2016 | | | 9,095,837 | | | | (84,641 | ) |
Feeder Cattle Futures | | | (2 | ) | | March 2016 | | | (163,650 | ) | | | (13,902 | ) |
FTSE 100 Index | | | (8 | ) | | March 2016 | | | (730,967 | ) | | | (28,274 | ) |
FTSE/MIB Index | | | 43 | | | March 2016 | | | 5,009,950 | | | | 54,525 | |
Gas Oil Futures | | | (1 | ) | | February 2016 | | | (33,425 | ) | | | 7,549 | |
Hang Seng Index | | | (14 | ) | | January 2016 | | | (1,978,955 | ) | | | 17,125 | |
Hard Red Winter Wheat Futures | | | (2 | ) | | March 2016 | | | (46,850 | ) | | | 3,998 | |
IBEX 35 Index | | | (79 | ) | | January 2016 | | | (8,178,638 | ) | | | 113,288 | |
Lean Hogs Futures | | | (14 | ) | | February 2016 | | | (334,880 | ) | | | (9,103 | ) |
Live Cattle Futures | | | (5 | ) | | February 2016 | | | (273,600 | ) | | | 3,795 | |
LME Copper Futures | | | 2 | | | January 2016 | | | 235,625 | | | | 5,374 | |
LME Copper Futures | | | (2 | ) | | January 2016 | | | (235,625 | ) | | | 13,086 | |
LME Copper Futures | | | (2 | ) | | February 2016 | | | (235,563 | ) | | | (5,489 | ) |
LME Lead Futures | | | 2 | | | January 2016 | | | 89,838 | | | | 7,111 | |
LME Lead Futures | | | (2 | ) | | January 2016 | | | (89,838 | ) | | | (6,689 | ) |
LME Lead Futures | | | 2 | | | February 2016 | | | 89,875 | | | | 6,649 | |
LME Nickel Futures | | | 2 | | | January 2016 | | | 105,456 | | | | (11,095 | ) |
LME Nickel Futures | | | (2 | ) | | January 2016 | | | (105,456 | ) | | | 1,343 | |
LME Nickel Futures | | | 1 | | | February 2016 | | | 52,809 | | | | (1,084 | ) |
LME Primary Aluminum Futures | | | 11 | | | January 2016 | | | 414,013 | | | | (6,368 | ) |
LME Primary Aluminum Futures | | | (11 | ) | | January 2016 | | | (414,013 | ) | | | (3,856 | ) |
LME Primary Aluminum Futures | | | 4 | | | February 2016 | | | 150,875 | | | | 973 | |
LME Primary Aluminum Futures | | | (6 | ) | | February 2016 | | | (226,313 | ) | | | 184 | |
LME Zinc Futures | | | 5 | | | January 2016 | | | 200,000 | | | | 8,122 | |
LME Zinc Futures | | | (5 | ) | | January 2016 | | | (200,000 | ) | | | 6,435 | |
LME Zinc Futures | | | (5 | ) | | February 2016 | | | (200,531 | ) | | | (7,940 | ) |
Long Gilt | | | 103 | | | March 2016 | | | 17,730,660 | | | | (65,920 | ) |
mini MSCI Emerging Markets Index Futures | | | 448 | | | March 2016 | | | 17,640,000 | | | | 626,304 | |
Natural Gas Futures | | | (20 | ) | | January 2016 | | | (467,400 | ) | | | (21,626 | ) |
NY Harbor USLD Futures | | | (5 | ) | | January 2016 | | | (236,019 | ) | | | 52,246 | |
OMX Stockholm 30 Index | | | (689 | ) | | January 2016 | | | (11,818,728 | ) | | | (201,024 | ) |
Russell 2000 Mini Index | | | (3 | ) | | March 2016 | | | (339,450 | ) | | | 2,144 | |
S&P 500 E-Mini Index | | | 976 | | | March 2016 | | | 99,327,520 | | | | (265,247 | ) |
S&P/TSX 60 Index | | | (21 | ) | | March 2016 | | | (2,309,590 | ) | | | (37,295 | ) |
Silver Futures | | | 1 | | | March 2016 | | | 69,015 | | | | (6,521 | ) |
Soybean Futures | | | 3 | | | March 2016 | | | 129,638 | | | | (4,878 | ) |
SPI 200 Index | | | (125 | ) | | March 2016 | | | (11,971,174 | ) | | | (632,249 | ) |
Sugar #11 (World) Futures | | | 15 | | | February 2016 | | | 256,032 | | | | 20,078 | |
TSE TOPIX Index | | | (235 | ) | | March 2016 | | | (30,256,042 | ) | | | 450,788 | |
Wheat Futures | | | (9 | ) | | March 2016 | | | (211,500 | ) | | | 3,059 | |
WTI Crude Oil Futures | | | (8 | ) | | January 2016 | | | (296,320 | ) | | | 38,230 | |
| | |
| 74 | | The accompanying notes are an integral part of these financial statements. |
GOLDMAN SACHS DYNAMIC ALLOCATION FUND
|
| ADDITIONAL INVESTMENT INFORMATION (continued) |
FUTURES CONTRACTS (continued)
| | | | | | | | | | | | | | |
| Type | | Number of
Contracts
Long (Short) | | | Expiration
Date | | Current
Value | | | Unrealized
Gain (Loss) | |
10 Year Australian Government Bonds | | | (16 | ) | | March 2016 | | $ | (1,479,463 | ) | | $ | (6,476 | ) |
10 Year Canadian Government Bonds | | | 76 | | | March 2016 | | | 7,743,904 | | | | 148,391 | |
10 Year Japanese Government Bonds | | | 96 | | | March 2016 | | | 119,038,562 | | | | 355,189 | |
| TOTAL | | | | | | | | | | | | $ | 561,165 | |
SWAP CONTRACTS — At December 31, 2015, the Fund had the following swap contracts:
CENTRALLY CLEARED CREDIT DEFAULT SWAP CONTRACTS
| | | | | | | | | | | | | | | | | | | | | | |
| | | | | | | | | | | | | | Market Value | |
| Referenced Obligation | | Notional
Amount
(000’s) | | Rates Received
(Paid) | | | Termination
Date | | | Credit
Spread on
December 31,
2015(a) | | | Upfront
Payments
Made (Received) | | | Unrealized
Gain (Loss) | |
Protection Sold: | | | | | | | | | | | | | | | | | | | | | | |
Markit CDX North America High Yield Index | | $54,790 | | | 5.000 | % | | | 12/20/20 | | | | 4.726 | % | | $ | 590,285 | | | $ | 34,227 | |
Markit CDX North America Investment Grade Index | | 31,760 | | | 1.000 | | | | 12/20/20 | | | | 0.885 | | | | 196,913 | | | | (20,693 | ) |
| TOTAL | | | | | | | | | | | | | | | | $ | 787,198 | | | $ | 13,534 | |
| | (a) | | Credit spread on the Referenced Obligation, together with the period of expiration, are indicators of payment/performance risk. The likelihood of a credit event occurring which would require a fund to make a payment or otherwise be required to perform under the swap contract is generally greater as the credit spread and term of the swap contract increase. |
CENTRALLY CLEARED INTEREST RATE SWAP CONTRACT
| | | | | | | | | | | | | | | | | | |
| | | | | | Rates Exchanged | | Market Value | |
Notional
Amount
(000’s)(a) | | | Termination
Date | | Payments
Received | | | Payments
Made | | Upfront
Payments
Made (Received) | | | Unrealized
Gain (Loss) | |
| $ | 69,750 | | | 03/16/26 | | | 2.250 | % | | 3 Month LIBOR | | $ | 539,416 | | | $ | (629,470 | ) |
| | (a) | | Represents forward starting interest rate swaps whose effective dates of commencement of accruals and cash flows occur subsequent to December 31, 2015. |
OVER THE COUNTER TOTAL RETURN SWAP CONTRACTS
| | | | | | | | | | | | | | | | | | |
| Counterparty | | Referenced
Obligation | | Notional
Amount
(000’s) | | | Rate Received
(Paid) | | | Termination
Date | | | Unrealized
Gain (Loss)(a) | |
Deutsche Bank AG | | FTSE NAREIT Mortgage Index(b) | | $ | 26,947 | | | | (0.324 | )% | | | 06/23/16 | | | $ | (329,020 | ) |
| | | | | 2,555 | | | | (0.407 | ) | | | 06/23/16 | | | | (19,379 | ) |
JPMorgan Chase Bank, N.A. | | S&P GSCI Official Close Index(c) | | | 5,122 | | | | (0.100 | ) | | | 01/29/16 | | | | (37,275 | ) |
UBS AG | | S&P GSCI Total Return Index(c) | | | 4,142 | | | | (0.120 | ) | | | 02/12/16 | | | | 73,823 | |
| TOTAL | | | | | | | | | | | | | | | | $ | (311,851 | ) |
| | (a) | | There are no upfront payments on the swap contracts listed above, therefore the unrealized gains (losses) on the swap contracts are equal to their market value. |
| | (b) | | The Fund receives quarterly payments based on any positive monthly return of the Referenced Obligation. The Fund makes payments on any negative monthly return of such Referenced Obligation. |
| | (c) | | The Fund receives monthly payments based on any positive monthly return of the Referenced Obligation. The Fund makes payments on any negative monthly return of such Referenced Obligation. |
| | |
| The accompanying notes are an integral part of these financial statements. | | 75 |
GOLDMAN SACHS DYNAMIC COMMODITY STRATEGY FUND
Consolidated Schedule of Investments
December 31, 2015
| | | | | | | | | | | | |
Principal
Amount | | Interest
Rate | | | Maturity
Date | | | Value | |
| | | | | | | | | | | | |
| U.S. Government Obligation(a) – 57.6% | |
United States Treasury Bill | | | | | |
| $14,000,000 | | | 0.000 | % | | | 06/23/16 | | | $ | 13,968,535 | |
| (Cost $13,970,497) | | | | | | | | | |
| |
| | | | | | |
| Shares | | Distribution
Rate | | Value | |
| | | | | | |
| Investment Company(b)(c) – 35.0% | |
Goldman Sachs Financial Square Government Fund – FST Shares | |
| 8,464,763 | | 0.185% | | $ | 8,464,763 | |
| (Cost $8,464,763) | | | | |
| |
| TOTAL INVESTMENTS – 92.6% | |
| (Cost $22,435,260) | | $ | 22,433,298 | |
| |
OTHER ASSETS IN EXCESS OF
LIABILITIES – 7.4% | | | 1,782,823 | |
| |
| NET ASSETS – 100.0% | | $ | 24,216,121 | |
| |
| | |
| The percentage shown for each investment category reflects the value of investments in that category as a percentage of net assets. |
(a) | | Issued with a zero coupon. Income is recognized through the accretion of discount. |
(b) | | Represents an affiliated issuer. |
(c) | | Variable rate security. Interest rate or distribution rate disclosed is that which is in effect on December 31, 2015. |
|
| ADDITIONAL INVESTMENT INFORMATION |
SWAP CONTRACTS — At December 31, 2015, the Fund had the following swap contracts:
OVER THE COUNTER TOTAL RETURN SWAP CONTRACTS(a)
| | | | | | | | | | | | | | | | | | |
| Counterparty | | Referenced
Obligation | | Notional
Amount
(000’s) | | | Rate Received
(Paid) | | | Termination
Date | | | Unrealized
Gain (Loss)(b) | |
Merrill Lynch International | | Bloomberg Aluminum Subindex | | $ | 609 | | | | (0.180 | )% | | | 04/28/16 | | | $ | 22,641 | |
| | Bloomberg Brent Crude 3 Month Forward Subindex | | | 336 | | | | (0.180 | ) | | | 04/28/16 | | | | (14,552 | ) |
| | Bloomberg Coffee Subindex | | | 412 | | | | (0.180 | ) | | | 04/28/16 | | | | 23,677 | |
| | Bloomberg Cotton Subindex | | | 709 | | | | (0.180 | ) | | | 04/28/16 | | | | (679 | ) |
| | Bloomberg Gold Subindex | | | 315 | | | | (0.180 | ) | | | 04/28/16 | | | | (1,250 | ) |
| | Bloomberg Heating Oil Subindex | | | 991 | | | | (0.150 | ) | | | 04/28/16 | | | | (164,400 | ) |
| | Bloomberg Lean Hogs Subindex | | | 543 | | | | (0.200 | ) | | | 04/28/16 | | | | 25,508 | |
| | Bloomberg Live Cattle Subindex | | | 882 | | | | (0.200 | ) | | | 04/28/16 | | | | 29,638 | |
| | Bloomberg Natural Gas 3 Month Forward Subindex | | | 153 | | | | (0.180 | ) | | | 04/28/16 | | | | 1,596 | |
| | Bloomberg Natural Gas Subindex | | | 401 | | | | (0.150 | ) | | | 04/28/16 | | | | 79,669 | |
| | Bloomberg Nickel Subindex | | | 586 | | | | (0.180 | ) | | | 04/28/16 | | | | (5,209 | ) |
| | Bloomberg Platinum Subindex | | | 1,572 | | | | (0.180 | ) | | | 04/28/16 | | | | 92,899 | |
| | Bloomberg Silver Subindex | | | 531 | | | | (0.180 | ) | | | 04/28/16 | | | | (9,207 | ) |
| | Bloomberg Soybean Meal Subindex | | | 756 | | | | (0.180 | ) | | | 04/28/16 | | | | (54,267 | ) |
| | Bloomberg Soybean Oil Subindex | | | 452 | | | | (0.180 | ) | | | 04/28/16 | | | | 17,622 | |
| | Bloomberg Sugar Subindex | | | 1,125 | | | | (0.180 | ) | | | 04/28/16 | | | | 23,795 | |
| | Bloomberg Unleaded Gasoline Subindex | | | 1,109 | | | | (0.150 | ) | | | 04/28/16 | | | | (43,135 | ) |
| | Bloomberg Zinc Subindex | | | 510 | | | | (0.180 | ) | | | 04/28/16 | | | | 37,969 | |
| | Merrill Lynch Commodity index eXtra (Palladium) Excess Return | | | 701 | | | | (0.180 | ) | | | 04/28/16 | | | | 24,163 | |
UBS AG | | Bloomberg Brent Crude 3 Month Forward Subindex | | | 1,212 | | | | (0.170 | ) | | | 03/16/16 | | | | (38,108 | ) |
| | Bloomberg Copper Subindex | | | 250 | | | | (0.160 | ) | | | 03/16/16 | | | | 10,680 | |
| | |
| 76 | | The accompanying notes are an integral part of these financial statements. |
GOLDMAN SACHS DYNAMIC COMMODITY STRATEGY FUND
|
| ADDITIONAL INVESTMENT INFORMATION (continued) |
OVER THE COUNTER TOTAL RETURN SWAP CONTRACTS(a) (continued)
| | | | | | | | | | | | | | | | | | |
| Counterparty | | Referenced
Obligation | | Notional
Amount
(000’s) | | | Rate Received
(Paid) | | | Termination
Date | | | Unrealized
Gain (Loss)(b) | |
UBS AG (continued) | | Bloomberg Natural Gas Subindex | | $ | 250 | | | | (0.180 | )% | | | 03/16/16 | | | $ | 780 | |
| | | Bloomberg WTI Crude Oil 3 Month Forward Subindex | | | 426 | | | | (0.170 | ) | | | 03/16/16 | | | | (4,670 | ) |
| TOTAL | | | | | | | | | | | | | | | | $ | 55,160 | |
| | (a) | | The Fund receives monthly payments based on any positive monthly return of the Referenced Obligation. The Fund makes payments on any negative monthly return of such Referenced Obligation. |
| | (b) | | There are no upfront payments on the swap contracts listed above, therefore the unrealized gains (losses) on the swap contracts are equal to their market value. |
| | |
| The accompanying notes are an integral part of these financial statements. | | 77 |
GOLDMAN SACHS MANAGED FUTURES STRATEGY FUND
Schedule of Investments
December 31, 2015
| | | | | | | | | | | | | | |
Principal
Amount | | | Interest
Rate | | | Maturity
Date | | | Value | |
| | | | | | | | | | | | | | |
| | Commodity Index Linked Structured Notes(a)(b)(c)(d) – 8.6% | |
| JPMorgan Chase Bank, N.A.(e) | | | | | |
| $ | 60,000 | | | | 0.111 | % | | | 02/09/16 | | | $ | 85,533 | |
| | 652,000 | | | | 0.174 | | | | 07/05/16 | | | | 1,086,394 | |
| | 360,000 | | | | 0.194 | | | | 08/09/16 | | | | 757,031 | |
| | 610,000 | | | | 0.170 | | | | 10/12/16 | | | | 832,352 | |
| | 361,000 | | | | 0.228 | | | | 10/23/16 | | | | 440,425 | |
| | 500,000 | | | | 0.286 | | | | 12/05/16 | | | | 576,603 | |
| | 1,411,000 | | | | 0.342 | | | | 12/12/16 | | | | 1,685,706 | |
| UBS AG(f) | | | | | |
| | 500,000 | | | | 0.194 | | | | 08/09/16 | | | | 622,974 | |
| | 450,000 | | | | 0.352 | | | | 09/13/16 | | | | 549,134 | |
| | 480,000 | | | | 0.272 | | | | 09/30/16 | | | | 552,407 | |
| | 670,000 | | | | 0.047 | | | | 11/15/16 | | | | 794,388 | |
| | 250,000 | | | | 0.063 | | | | 11/23/16 | | | | 292,896 | |
| | 560,000 | | | | 0.083 | | | | 11/30/16 | | | | 629,674 | |
| | 290,000 | | | | 0.252 | | | | 12/16/16 | | | | 309,408 | |
| | 790,000 | | | | 0.143 | | | | 01/03/17 | | | | 782,372 | |
| | 500,000 | | | | 0.272 | | | | 01/18/17 | | | | 468,843 | |
| | |
| TOTAL COMMODITY INDEX LINKED
STRUCTURED NOTES
(Cost $8,444,000) |
| | $ | 10,466,140 | |
| | |
| | | | | | |
| Shares | | Distribution
Rate | | Value | |
| | | | | | |
| Investment Company(d)(g) –72.5% | |
Goldman Sachs Financial Square Government Fund – FST Shares | |
| 88,106,078 | | 0.185% | | $ | 88,106,078 | |
| (Cost $88,106,078) | |
| |
| TOTAL INVESTMENTS – 81.1% | |
| (Cost $96,550,078) | | $ | 98,572,218 | |
| |
OTHER ASSETS IN EXCESS OF LIABILITIES – 18.9% | | | 22,990,906 | |
| |
| NET ASSETS – 100.0% | | $ | 121,563,124 | |
| |
| | |
| The percentage shown for each investment category reflects the value of investments in that category as a percentage of net assets. |
(a) | | Exempt from registration under Rule 144A of the Securities Act of 1933. Under procedures approved by the Board of Trustees, such securities may be deemed liquid by the Investment Adviser and may be resold, normally to qualified institutional buyers in transactions exempt from registration. Total market value of Rule 144A securities amounts to $10,466,140, which represents approximately 8.6% of net assets as of December 31, 2015. |
(b) | | Interest rate is LIBOR as of December 31, 2015 minus a spread. |
(c) | | These Structured Notes take into consideration a leverage factor of 300% on the return of the underlying linked index. |
(d) | | Variable rate security. Interest rate or distribution rate disclosed is that which is in effect on December 31, 2015. |
| | |
(e) | | Security is linked to the Bloomberg Industrial Metals Sub Index Total Return (the “BCOMINTR”), the Bloomberg Precious Metals Sub Index Total Return (the “BCOMPRTR”), and the Bloomberg Petroleum Sub Index Total Return (the “BCOMPETR”). The BCOMINTR, BCOMPRTR and BCOMPETR are commodity group sub-indices of the Bloomberg Commodity Index Total Return. The BCOMINTR is composed of longer-dates futures contracts on aluminum, copper, nickel and zinc. The BCOMPRTR is composed of futures contracts on gold and silver. The BCOMPETR is composed of futures contracts on crude oil, heating oil, and unleaded gasoline. |
(f) | | Security is linked to the Bloomberg Grains Sub Index Total Return (the “BCOMGRTR”), the Bloomberg Livestock Sub Index Total Return (the “BCOMLITR”), and Bloomberg Softs Sub Index Total Return (the “BCOMSOTR”). The BCOMGRTR, BCOMLITR and BCOMSOTR are commodity group sub-indices of the Bloomberg Commodity Index Total Return. The BCOMGRTR is composed of futures contracts on corn, soybeans and wheat. The BCOMLITR is composed of futures contracts on live cattle and lean hogs. The BCOMSOTR is composed of futures contracts on coffee, cotton and sugar. |
(g) | | Represents an affiliated issuer. |
| | |
|
Investment Abbreviations: |
BA | | — Banker Acceptance Rate |
BUBOR | | — Budapest Interbank Offered Rate |
EURIBOR | | — Euro Interbank Offered Rate |
JIBAR | | — Johannesburg Interbank Agreed Rate |
LIBOR | | — London Interbank Offered Rate |
PRIBOR | | — Prague Interbank Offered Rate |
STIBOR | | — Stockholm Interbank Offered Rate |
TIIE | | — Interbank Equilibrium Interest Rate |
WIBOR | | — Warsaw Interbank Offered Rate |
|
Currency Abbreviations: |
AUD | | — Australian Dollar |
BRL | | — Brazilian Real |
CAD | | — Canadian Dollar |
CHF | | — Swiss Franc |
CLP | | — Chilean Peso |
COP | | — Colombian Peso |
CZK | | — Czech Koruna |
EUR | | — Euro |
GBP | | — British Pound |
HUF | | — Hungarian Forint |
IDR | | — Indonesian Rupiah |
INR | | — Indian Rupee |
JPY | | — Japanese Yen |
KRW | | — South Korean Won |
MXN | | — Mexican Peso |
MYR | | — Malaysian Ringgit |
NOK | | — Norwegian Krone |
NZD | | — New Zealand Dollar |
PLN | | — Polish Zloty |
RUB | | — Russian Ruble |
SEK | | — Swedish Krona |
TRY | | — Turkish Lira |
USD | | — United States Dollar |
ZAR | | — South African Rand |
|
| | |
| 78 | | The accompanying notes are an integral part of these financial statements. |
GOLDMAN SACHS MANAGED FUTURES STRATEGY FUND
|
| ADDITIONAL INVESTMENT INFORMATION |
FORWARD FOREIGN CURRENCY EXCHANGE CONTRACTS — At December 31, 2015, the Fund had the following forward foreign currency exchange contracts:
FORWARD FOREIGN CURRENCY EXCHANGE CONTRACTS WITH UNREALIZED GAIN
| | | | | | | | | | | | | | | | | | | | | | | | |
| Counterparty | | Currency
Purchased | | | Currency
Sold | | | Settlement
Date | | | Current
Value | | | Unrealized
Gain | |
Morgan Stanley Co., Inc. | | AUD | | | 2,280,000 | | | USD | | | 1,653,954 | | | | 03/16/16 | | | $ | 1,655,503 | | | $ | 1,549 | |
| | BRL | | | 80,000 | | | USD | | | 20,130 | | | | 01/05/16 | | | | 20,221 | | | | 91 | |
| | CAD | | | 460,000 | | | USD | | | 330,545 | | | | 03/16/16 | | | | 332,506 | | | | 1,961 | |
| | CHF | | | 56,000 | | | USD | | | 55,241 | | | | 03/16/16 | | | | 56,084 | | | | 843 | |
| | COP | | | 176,000,000 | | | USD | | | 53,452 | | | | 03/16/16 | | | | 54,998 | | | | 1,546 | |
| | IDR | | | 1,980,000,000 | | | USD | | | 137,905 | | | | 03/16/16 | | | | 139,941 | | | | 2,036 | |
| | INR | | | 1,000,000 | | | USD | | | 14,932 | | | | 03/16/16 | | | | 14,948 | | | | 16 | |
| | JPY | | | 207,848,000 | | | USD | | | 1,715,429 | | | | 03/16/16 | | | | 1,732,231 | | | | 16,802 | |
| | NZD | | | 5,940,000 | | | USD | | | 3,986,925 | | | | 03/16/16 | | | | 4,044,780 | | | | 57,855 | |
| | SEK | | | 5,020,000 | | | USD | | | 593,156 | | | | 03/16/16 | | | | 595,926 | | | | 2,770 | |
| | TRY | | | 5,840,000 | | | USD | | | 1,952,528 | | | | 03/16/16 | | | | 1,962,329 | | | | 9,801 | |
| | USD | | | 4,770,416 | | | AUD | | | 6,560,000 | | | | 03/16/16 | | | | 4,763,201 | | | | 7,215 | |
| | USD | | | 2,085,324 | | | BRL | | | 7,980,000 | | | | 01/05/16 | | | | 2,017,062 | | | | 68,262 | |
| | USD | | | 1,981,252 | | | BRL | | | 7,820,000 | | | | 02/02/16 | | | | 1,956,560 | | | | 24,692 | |
| | USD | | | 6,765,929 | | | CAD | | | 9,043,000 | | | | 03/16/16 | | | | 6,536,636 | | | | 229,293 | |
| | USD | | | 4,271,914 | | | CLP | | | 3,040,000,000 | | | | 03/16/16 | | | | 4,255,231 | | | | 16,683 | |
| | USD | | | 2,146,601 | | | COP | | | 6,798,000,000 | | | | 03/16/16 | | | | 2,124,307 | | | | 22,294 | |
| | USD | | | 585,105 | | | CZK | | | 14,400,000 | | | | 03/16/16 | | | | 580,344 | | | | 4,761 | |
| | USD | | | 1,007,528 | | | EUR | | | 914,000 | | | | 03/16/16 | | | | 995,114 | | | | 12,414 | |
| | USD | | | 9,596,807 | | | GBP | | | 6,415,250 | | | | 03/16/16 | | | | 9,458,500 | | | | 138,307 | |
| | USD | | | 242,680 | | | HUF | | | 69,700,000 | | | | 03/16/16 | | | | 239,901 | | | | 2,779 | |
| | USD | | | 2,772,564 | | | KRW | | | 3,220,000,000 | | | | 03/16/16 | | | | 2,735,271 | | | | 37,293 | |
| | USD | | | 5,409,580 | | | MXN | | | 91,124,000 | | | | 03/16/16 | | | | 5,259,982 | | | | 149,598 | |
| | USD | | | 3,307,609 | | | MYR | | | 14,040,000 | | | | 03/16/16 | | | | 3,248,385 | | | | 59,224 | |
| | USD | | | 4,683,100 | | | NOK | | | 40,600,000 | | | | 03/16/16 | | | | 4,583,516 | | | | 99,584 | |
| | USD | | | 2,051,159 | | | RUB | | | 143,000,000 | | | | 03/16/16 | | | | 1,920,671 | | | | 130,488 | |
| | USD | | | 407,222 | | | SEK | | | 3,420,000 | | | | 03/16/16 | | | | 405,988 | | | | 1,234 | |
| | USD | | | 20,212 | | | TRY | | | 60,000 | | | | 03/16/16 | | | | 20,161 | | | | 51 | |
| | | USD | | | 2,864,411 | | | ZAR | | | 41,935,000 | | | | 03/16/16 | | | | 2,675,612 | | | | 188,799 | |
| TOTAL | | | | | | | | | | | | | | | | | | | | | | $ | 1,288,241 | |
| | |
| The accompanying notes are an integral part of these financial statements. | | 79 |
GOLDMAN SACHS MANAGED FUTURES STRATEGY FUND
Schedule of Investments (continued)
December 31, 2015
|
| ADDITIONAL INVESTMENT INFORMATION (continued) |
FORWARD FOREIGN CURRENCY EXCHANGE CONTRACTS WITH UNREALIZED LOSS
| | | | | | | | | | | | | | | | | | | | | | | | |
| Counterparty | | Currency
Purchased | | | Currency
Sold | | | Settlement
Date | | | Current
Value | | | Unrealized
Loss | |
Morgan Stanley Co., Inc. | | BRL | | | 7,900,000 | | | USD | | | 2,023,532 | | | | 01/05/16 | | | $ | 1,996,840 | | | $ | (26,692 | ) |
| | CAD | | | 127,000 | | | USD | | | 94,450 | | | | 03/16/16 | | | | 91,800 | | | | (2,650 | ) |
| | CHF | | | 227,000 | | | USD | | | 231,871 | | | | 03/16/16 | | | | 227,340 | | | | (4,531 | ) |
| | CLP | | | 310,000,000 | | | USD | | | 443,332 | | | | 03/16/16 | | | | 433,922 | | | | (9,410 | ) |
| | EUR | | | 558,000 | | | USD | | | 614,318 | | | | 03/16/16 | | | | 607,521 | | | | (6,797 | ) |
| | GBP | | | 42,000 | | | USD | | | 62,125 | | | | 01/04/16 | | | | 61,916 | | | | (209 | ) |
| | GBP | | | 512,000 | | | USD | | | 767,850 | | | | 03/16/16 | | | | 754,882 | | | | (12,968 | ) |
| | HUF | | | 7,900,000 | | | USD | | | 27,265 | | | | 03/16/16 | | | | 27,191 | | | | (74 | ) |
| | IDR | | | 28,800,000,000 | | | USD | | | 2,038,814 | | | | 03/16/16 | | | | 2,035,498 | | | | (3,316 | ) |
| | KRW | | | 1,860,000,000 | | | USD | | | 1,591,962 | | | | 03/16/16 | | | | 1,580,001 | | | | (11,961 | ) |
| | MXN | | | 21,750,000 | | | USD | | | 1,305,615 | | | | 03/16/16 | | | | 1,255,483 | | | | (50,132 | ) |
| | MYR | | | 300,000 | | | USD | | | 70,671 | | | | 03/16/16 | | | | 69,410 | | | | (1,261 | ) |
| | USD | | | 170,352 | | | AUD | | | 240,000 | | | | 03/16/16 | | | | 174,263 | | | | (3,911 | ) |
| | USD | | | 307,242 | | | CAD | | | 429,000 | | | | 03/16/16 | | | | 310,098 | | | | (2,856 | ) |
| | USD | | | 104,622 | | | COP | | | 352,000,000 | | | | 03/16/16 | | | | 109,997 | | | | (5,375 | ) |
| | USD | | | 3,540,195 | | | CZK | | | 89,915,000 | | | | 03/16/16 | | | | 3,623,728 | | | | (83,533 | ) |
| | USD | | | 6,490,955 | | | EUR | | | 6,092,000 | | | | 03/16/16 | | | | 6,632,645 | | | | (141,690 | ) |
| | USD | | | 3,648,555 | | | HUF | | | 1,071,150,000 | | | | 03/16/16 | | | | 3,686,792 | | | | (38,237 | ) |
| | USD | | | 5,545,563 | | | INR | | | 375,000,000 | | | | 03/16/16 | | | | 5,605,556 | | | | (59,993 | ) |
| | USD | | | 10,018,517 | | | JPY | | | 1,226,887,000 | | | | 03/16/16 | | | | 10,225,026 | | | | (206,509 | ) |
| | USD | | | 3,187,390 | | | KRW | | | 3,760,000,000 | | | | 03/16/16 | | | | 3,193,981 | | | | (6,591 | ) |
| | USD | | | 97,087 | | | MYR | | | 420,000 | | | | 03/16/16 | | | | 97,173 | | | | (86 | ) |
| | USD | | | 4,141,406 | | | NZD | | | 6,280,000 | | | | 03/16/16 | | | | 4,276,299 | | | | (134,893 | ) |
| | USD | | | 3,858,050 | | | PLN | | | 15,597,000 | | | | 03/16/16 | | | | 3,970,530 | | | | (112,480 | ) |
| | USD | | | 6,348,709 | | | SEK | | | 54,760,600 | | | | 03/16/16 | | | | 6,500,642 | | | | (151,933 | ) |
| | USD | | | 2,898,124 | | | TRY | | | 8,690,000 | | | | 03/16/16 | | | | 2,919,972 | | | | (21,848 | ) |
| | | ZAR | | | 7,820,000 | | | USD | | | 508,129 | | | | 03/16/16 | | | | 498,946 | | | | (9,183 | ) |
| TOTAL | | | | | | | | | | | | | | | | | | | | | | $ | (1,109,119 | ) |
| | |
| 80 | | The accompanying notes are an integral part of these financial statements. |
GOLDMAN SACHS MANAGED FUTURES STRATEGY FUND
|
| ADDITIONAL INVESTMENT INFORMATION (continued) |
FUTURES CONTRACTS — At December 31, 2015, the Fund had the following futures contracts:
| | | | | | | | | | | | | | |
| Type | | Number of
Contracts
Long (Short) | | | Expiration
Date | | Current
Value | | | Unrealized
Gain (Loss) | |
Amsterdam Index | | | 15 | | | January 2016 | | $ | 1,440,541 | | | $ | (9,375 | ) |
BIST 30 Index | | | (900 | ) | | February 2016 | | | (2,748,851 | ) | | | 100,156 | |
CAC 40 Index | | | 37 | | | January 2016 | | | 1,865,129 | | | | (11,336 | ) |
DAX Index | | | 7 | | | March 2016 | | | 2,048,632 | | | | 6,069 | |
DJIA Mini-e-CBOT | | | 19 | | | March 2016 | | | 1,647,395 | | | | (13,619 | ) |
FTSE 100 Index | | | 7 | | | March 2016 | | | 639,596 | | | | (1,553 | ) |
FTSE/JSE Top 40 Index | | | (101 | ) | | March 2016 | | | (3,021,967 | ) | | | (85,604 | ) |
FTSE/MIB Index | | | 13 | | | March 2016 | | | 1,514,636 | | | | (1,504 | ) |
Hang Seng Index | | | 5 | | | January 2016 | | | 706,770 | | | | (8,655 | ) |
H-Shares Index | | | (41 | ) | | January 2016 | | | (2,567,112 | ) | | | 20,019 | |
IBEX 35 Index | | | 9 | | | January 2016 | | | 931,744 | | | | (13,176 | ) |
KOSPI 200 Index | | | (47 | ) | | March 2016 | | | (4,819,048 | ) | | | (54,780 | ) |
MSCI Taiwan Index | | | (114 | ) | | January 2016 | | | (3,470,160 | ) | | | 46,227 | |
NASDAQ 100 E-mini Index | | | 15 | | | March 2016 | | | 1,376,325 | | | | (6,551 | ) |
Nikkei 225 Index | | | 5 | | | March 2016 | | | 791,630 | | | | (21,961 | ) |
OMX Stockholm 30 Index | | | 57 | | | January 2016 | | | 977,747 | | | | 3,071 | |
Russell 2000 Mini Index | | | (12 | ) | | March 2016 | | | (1,357,800 | ) | | | (1,355 | ) |
S&P 500 E-Mini Index | | | 30 | | | March 2016 | | | 3,053,100 | | | | (19,603 | ) |
S&P/TSX 60 Index | | | 4 | | | March 2016 | | | 439,922 | | | | (11,222 | ) |
SET50 Index | | | (860 | ) | | March 2016 | | | (3,798,005 | ) | | | (10,882 | ) |
SGX S&P CNX Nifty Index | | | (286 | ) | | January 2016 | | | (4,546,256 | ) | | | (19,293 | ) |
SPI 200 Index | | | 5 | | | March 2016 | | | 478,847 | | | | 9,029 | |
TSE TOPIX Index | | | 23 | | | March 2016 | | | 2,961,230 | | | | 24,546 | |
| TOTAL | | | | | | | | | | | | $ | (81,352 | ) |
| | |
| The accompanying notes are an integral part of these financial statements. | | 81 |
GOLDMAN SACHS MANAGED FUTURES STRATEGY FUND
Schedule of Investments (continued)
December 31, 2015
|
| ADDITIONAL INVESTMENT INFORMATION (continued) |
SWAP CONTRACTS — At December 31, 2015, the Fund had the following swap contracts:
CENTRALLY CLEARED INTEREST RATE SWAP CONTRACTS
| | | | | | | | | | | | | | | | | | |
| | | | | | | Rates Exchanged | | Market Value | |
Notional
Amount
(000’s)(a) | | | Termination
Date | | | Payments
Received | | Payments
Made | | Upfront
Payments
Made (Received) | | | Unrealized
Gain (Loss) | |
| EUR | 315,830 | | | | 03/16/17 | | | 0.250% | | 6 month EURIBOR | | $ | 173,715 | | | $ | 938,379 | |
| GBP | 232,040 | | | | 03/16/17 | | | 1.000 | | 6 month LIBOR | | | (230,982 | ) | | | 481,858 | |
| SEK | 2,231,510 | | | | 03/16/17 | | | 0.000 | | 3 month STIBOR | | | 82,712 | | | | 670,611 | |
| $ | 13,890 | | | | 03/16/17 | | | 0.850 | | 3 month LIBOR | | | (21,606 | ) | | | 2,115 | |
| EUR | 49,020 | | | | 03/16/18 | | | 0.250 | | 6 month EURIBOR | | | 187 | | | | 293,888 | |
| GBP | 32,210 | | | | 03/16/18 | | | 1.250 | | 6 month LIBOR | | | 121 | | | | 62,216 | |
| JPY | 12,204,660 | | | | 03/16/18 | | | 6 month LIBOR | | 0.250% | | | 252 | | | | (291,359 | ) |
| $ | 8,440 | | | | 03/16/18 | | | 1.250 | | 3 month LIBOR | | | (1,057 | ) | | | (5,638 | ) |
| CZK | 185,000 | | | | 03/16/21 | | | 0.500 | | 6 month PRIBOR | | | 20,998 | | | | (89,492 | ) |
| HUF | 1,755,000 | | | | 03/16/21 | | | 2.250 | | 6 month BUBOR | | | 74,334 | | | | (21,138 | ) |
| MXN | 230,000 | | | | 03/16/21 | | | 5.750 | | 1 month TIIE | | | 37,565 | | | | (807 | ) |
| PLN | 21,000 | | | | 03/16/21 | | | 2.000 | | 6 month WIBOR | | | 6,760 | | | | (12,991 | ) |
| ZAR | 75,000 | | | | 03/16/21 | | | 3 month JIBAR | | 8.250 | | | (52,995 | ) | | | 225,427 | |
| CAD | 11,710 | | | | 03/16/26 | | | 2.000 | | 3 month BA | | | (28,843 | ) | | | 88,618 | |
| CHF | 7,850 | | | | 03/16/26 | | | 0.250 | | 6 month LIBOR | | | (230,556 | ) | | | 209,403 | |
| EUR | 43,000 | | | | 03/16/26 | | | 1.000 | | 6 month EURIBOR | | | (242,084 | ) | | | 75,402 | |
| GBP | 23,220 | | | | 03/16/26 | | | 6 month LIBOR | | 2.000 | | | 26,755 | | | | 90,085 | |
| JPY | 385,670 | | | | 03/16/26 | | | 6 month LIBOR | | 0.500 | | | 50 | | | | (19,121 | ) |
| SEK | 10,950 | | | | 03/16/26 | | | 3 month STIBOR | | 1.500 | | | 16,015 | | | | 7,658 | |
| $ | 54,840 | | | | 03/16/26 | | | 2.250 | | 3 month LIBOR | | | (74,109 | ) | | | 3,305 | |
| EUR | 11,010 | | | | 03/16/46 | | | 6 month EURIBOR | | 1.500 | | | (105,570 | ) | | | 461,969 | |
| GBP | 8,440 | | | | 03/16/46 | | | 2.250 | | 6 month LIBOR | | | 99,010 | | | | 129,698 | |
| JPY | 1,347,560 | | | | 03/16/46 | | | 1.500 | | 6 month LIBOR | | | 667,079 | | | | 150,182 | |
| $ | 21,990 | | | | 03/16/46 | | | 3 month LIBOR | | 2.500 | | | 804,218 | | | | 43,052 | |
| | TOTAL | | | | | | | | | | | $ | 1,021,969 | | | $ | 3,493,320 | |
| | (a) | | Represents forward starting interest rate swaps whose effective dates of commencement of accruals and cash flows occur subsequent to December 31, 2015. |
| | |
| 82 | | The accompanying notes are an integral part of these financial statements. |
GOLDMAN SACHS GLOBAL REAL ESTATE SECURITIES FUND
Schedule of Investments
December 31, 2015
| | | | | | | | |
Shares | | | Description | | Value | |
| | | | | | | | |
| | Common Stocks – 95.5% | |
| | Australia – 5.3% | | | | |
| | 15,013 | | | Charter Hall Group (REIT) (Diversified) | | $ | 49,317 | |
| | 15,302 | | | GPT Group (REIT) (Diversified) | | | 52,994 | |
| | 47,112 | | | Mirvac Group (REIT) (Diversified) | | | 67,443 | |
| | | | | | | | |
| | | | | | | 169,754 | |
| | |
| | Canada – 2.2% | | | | |
| | 2,386 | | | RioCan Real Estate Investment Trust (REIT) (Retail) | | | 40,850 | |
| | 1,334 | | | Smart Real Estate Investment Trust (REIT) (Retail) | | | 29,106 | |
| | | | | | | | |
| | | | | | | 69,956 | |
| | |
| | Finland – 1.3% | |
| | 15,329 | | | Citycon OYJ (Retail)* | | | 39,814 | |
| | |
| | France – 2.9% | | | | |
| | 2,092 | | | Klepierre (REIT) (Retail) | | | 92,989 | |
| | |
| | Germany – 2.5% | | | | |
| | 819 | | | Deutsche Wohnen AG (Residential) | | | 22,647 | |
| | 1,848 | | | Vonovia SE (Residential) | | | 57,090 | |
| | | | | | | | |
| | | | | | | 79,737 | |
| | |
| | Hong Kong – 5.9% | | | | |
| | 10,000 | | | China Overseas Land & Investment Ltd. (Diversified) | | | 34,814 | |
| | 9,800 | | | Hongkong Land Holdings Ltd. (Office) | | | 68,431 | |
| | 7,000 | | | Sun Hung Kai Properties Ltd. (Diversified) | | | 84,137 | |
| | | | | | | | |
| | | | | | | 187,382 | |
| | |
| | Japan – 11.4% | | | | |
| | 25 | | | Comforia Residential REIT, Inc. (REIT) (Residential) | | | 47,274 | |
| | 41 | | | Japan Retail Fund Investment Corp. (REIT) (Retail) | | | 78,879 | |
| | 3,000 | | | Mitsubishi Estate Co. Ltd. (Diversified) | | | 62,380 | |
| | 5,000 | | | Mitsui Fudosan Co. Ltd. (Office) | | | 125,489 | |
| | 2,800 | | | Sekisui House Ltd. (Residential) | | | 47,079 | |
| | | | | | | | |
| | | | | | | 361,101 | |
| | |
| | Singapore – 3.0% | | | | |
| | 7,000 | | | City Developments Ltd. (Diversified) | | | 37,657 | |
| | 57,000 | | | Fortune Real Estate Investment Trust (REIT) (Retail) | | | 58,577 | |
| | | | | | | | |
| | | | | | | 96,234 | |
| | |
| | Spain – 1.2% | | | | |
| | 3,166 | | | Merlin Properties Socimi SA (REIT) (Diversified) | | | 39,661 | |
| | |
| | Switzerland – 1.3% | | | | |
| | 455 | | | PSP Swiss Property AG (Registered) (Office)* | | | 39,899 | |
| | |
| | United Kingdom – 6.4% | | | | |
| | 3,923 | | | Big Yellow Group PLC (REIT) (Industrial) | | | 46,533 | |
| | 5,472 | | | British Land Co. PLC (REIT) (Diversified) | | | 63,316 | |
| | 761 | | | Derwent London PLC (REIT) (Office) | | | 41,160 | |
| | |
| | | | | | | | |
| | Common Stocks – (continued) | |
| | United Kingdom – (continued) | | | | |
| | 5,915 | | | Hammerson PLC (REIT) (Retail) | | $ | 52,291 | |
| | | | | | | | |
| | | | | | | 203,300 | |
| | |
| | United States – 52.1% | | | | |
| | 1,817 | | | Acadia Realty Trust (REIT) (Retail) | | | 60,234 | |
| | 429 | | | American Tower Corp. (REIT) (Other) | | | 41,592 | |
| | 677 | | | AvalonBay Communities, Inc. (REIT) (Residential) | | | 124,656 | |
| | 845 | | | Boston Properties, Inc. (REIT) (Office) | | | 107,771 | |
| | 2,864 | | | Brixmor Property Group, Inc. (REIT) (Retail) | | | 73,948 | |
| | 1,801 | | | Chesapeake Lodging Trust (REIT) (Hotels) | | | 45,313 | |
| | 1,480 | | | CyrusOne, Inc. (REIT) (Office) | | | 55,426 | |
| | 3,401 | | | DDR Corp. (REIT) (Retail) | | | 57,273 | |
| | 378 | | | Federal Realty Investment Trust (REIT) (Retail) | | | 55,226 | |
| | 1,015 | | | Highwoods Properties, Inc. (REIT) (Office) | | | 44,254 | |
| | 833 | | | Mid-America Apartment Communities, Inc. (REIT) (Residential) | | | 75,645 | |
| | 2,078 | | | Parkway Properties, Inc. (REIT) (Office) | | | 32,479 | |
| | 860 | | | Pebblebrook Hotel Trust (REIT) (Hotels) | | | 24,097 | |
| | 2,624 | | | Physicians Realty Trust (REIT) (Health Care) | | | 44,241 | |
| | 1,219 | | | Post Properties, Inc. (REIT) (Residential) | | | 72,116 | |
| | 2,197 | | | Prologis, Inc. (REIT) (Industrial) | | | 94,295 | |
| | 464 | | | PS Business Parks, Inc. (REIT) (Industrial) | | | 40,568 | |
| | 472 | | | Public Storage (REIT) (Industrial) | | | 116,914 | |
| | 2,197 | | | RLJ Lodging Trust (REIT) (Hotels) | | | 47,521 | |
| | 920 | | | Simon Property Group, Inc. (REIT) (Retail) | | | 178,885 | |
| | 587 | | | Sovran Self Storage, Inc. (REIT) (Industrial) | | | 62,991 | |
| | 1,740 | | | Ventas, Inc. (REIT) (Health Care) | | | 98,188 | |
| | 992 | | | Vornado Realty Trust (REIT) (Diversified) | | | 99,160 | |
| | | | | | | | |
| | | | | | | 1,652,793 | |
| | |
| | TOTAL COMMON STOCKS | |
| | (Cost $2,888,742) | | $ | 3,032,620 | |
| | |
| | | | | | |
| Shares | | Distribution
Rate | | Value | |
| | | | | | |
| Investment Company(a)(b) – 1.3% | |
Goldman Sachs Financial Square Government Fund – FST Shares | |
| 42,195 | | 0.185% | | $ | 42,195 | |
| (Cost $42,195) | | | | |
| |
| TOTAL INVESTMENTS – 96.8% | |
| (Cost $2,930,937) | | $ | 3,074,815 | |
| |
OTHER ASSETS IN EXCESS OF LIABILITIES – 3.2% | | | 100,210 | |
| |
| NET ASSETS – 100.0% | | $ | 3,175,025 | |
| |
| | |
| The accompanying notes are an integral part of these financial statements. | | 83 |
GOLDMAN SACHS GLOBAL REAL ESTATE SECURITIES FUND
Schedule of Investments (continued)
December 31, 2015
| | |
| The percentage shown for each investment category reflects the value of investments in that category as a percentage of net assets. |
* | | Non-income producing security. |
(a) | | Represents an affiliated issuer. |
(b) | | Variable rate security. Interest rate or distribution rate disclosed is that which is in effect on December 31, 2015. |
| | |
|
Investment Abbreviation: |
REIT | | —Real Estate Investment Trust |
|
| | |
| 84 | | The accompanying notes are an integral part of these financial statements. |
GOLDMAN SACHS INTERNATIONAL REAL ESTATE SECURITIES FUND
Schedule of Investments
December 31, 2015
| | | | | | | | |
Shares | | | Description | | Value | |
| | | | | | | | |
| | Common Stocks – 99.8% | |
| | Australia – 12.0% | | | | |
| | 1,578,195 | | | Charter Hall Group (REIT) (Diversified) | | $ | 5,184,324 | |
| | 2,622,820 | | | GPT Group (REIT) (Diversified) | | | 9,083,344 | |
| | 8,125,065 | | | Mirvac Group (REIT) (Diversified) | | | 11,631,360 | |
| | 1,678,705 | | | Stockland (REIT) (Diversified) | | | 4,983,211 | |
| | 3,399,021 | | | Vicinity Centres (REIT) (Retail) | | | 6,895,514 | |
| | 495,449 | | | Westfield Corp. Trust (REIT) (Retail) | | | 3,408,649 | |
| | | | | | | | |
| | | | | | | 41,186,402 | |
| | |
| | Canada – 4.9% | | | | |
| | 92,507 | | | Allied Properties Real Estate Investment Trust (REIT) (Office) | | | 2,110,606 | |
| | 67,706 | | | Canadian Apartment Properties Real Estate Investment Trust (REIT) (Residential) | | | 1,313,311 | |
| | 64,091 | | | Canadian Real Estate Investment Trust (REIT) (Diversified) | | | 1,948,159 | |
| | 48,296 | | | Granite Real Estate Investment Trust (REIT) (Industrial) | | | 1,324,938 | |
| | 213,617 | | | H&R Real Estate Investment Trust (REIT) (Diversified) | | | 3,095,339 | |
| | 257,980 | | | RioCan Real Estate Investment Trust (REIT) (Retail) | | | 4,416,815 | |
| | 126,050 | | | Smart Real Estate Investment Trust (REIT) (Retail) | | | 2,750,198 | |
| | | | | | | | |
| | | | | | | 16,959,366 | |
| | |
| | Finland – 1.3% | | | | |
| | 1,737,767 | | | Citycon OYJ (Retail)* | | | 4,513,504 | |
| | |
| | France – 11.3% | | | | |
| | 48,196 | | | Fonciere Des Regions (REIT) (Diversified) | | | 4,310,717 | |
| | 343,659 | | | Klepierre (REIT) (Retail) | | | 15,275,574 | |
| | 75,476 | | | Unibail-Rodamco SE (REIT) (Retail) | | | 19,165,713 | |
| | | | | | | | |
| | | | | | | 38,752,004 | |
| | |
| | Germany – 4.6% | | | | |
| | 199,072 | | | Deutsche Wohnen AG (Residential) | | | 5,504,703 | |
| | 330,125 | | | Vonovia SE (Residential) | | | 10,198,580 | |
| | | | | | | | |
| | | | | | | 15,703,283 | |
| | |
| | Hong Kong – 17.9% | | | | |
| | 1,138,000 | | | China Overseas Land & Investment Ltd. (Diversified) | | | 3,961,791 | |
| | 5,878,000 | | | Fortune Real Estate Investment Trust (REIT) (Retail) | | | 6,040,596 | |
| | 1,606,600 | | | Hongkong Land Holdings Ltd. (Office) | | | 11,186,595 | |
| | 1,403,500 | | | Kerry Properties Ltd. (Diversified) | | | 3,819,441 | |
| | 7,880,000 | | | Mapletree Greater China Commercial Trust (REIT) (Retail) | | | 5,073,010 | |
| | 4,017,026 | | | Sino Land Co. Ltd. (Diversified) | | | 5,851,826 | |
| | 1,623,475 | | | Sun Hung Kai Properties Ltd. (Diversified) | | | 19,513,496 | |
| | 1,015,000 | | | The Link REIT (REIT) (Retail) | | | 6,051,311 | |
| | | | | | | | |
| | | | | | | 61,498,066 | |
| | |
| | | | | | | | |
| | Common Stocks – (continued) | |
| | Japan – 24.5% | | | | |
| | 3,399 | | | Comforia Residential REIT, Inc. (REIT) (Residential) | | $ | 6,427,398 | |
| | 5,968 | | | Japan Retail Fund Investment Corp. (REIT) (Retail) | | | 11,481,694 | |
| | 1,054,000 | | | Mitsubishi Estate Co. Ltd. (Diversified) | | | 21,916,173 | |
| | 828,000 | | | Mitsui Fudosan Co. Ltd. (Office) | | | 20,781,051 | |
| | 322,200 | | | Sekisui House Ltd. (Residential) | | | 5,417,393 | |
| | 474,000 | | | Sumitomo Realty & Development Co. Ltd. (Office) | | | 13,529,232 | |
| | 1,154 | | | Top REIT, Inc. (REIT) (Diversified) | | | 4,371,004 | |
| | | | | | | | |
| | | | | | | 83,923,945 | |
| | |
| | Netherlands – 1.2% | | | | |
| | 72,835 | | | Wereldhave NV (REIT) (Diversified) | | | 4,085,592 | |
| | |
| | Norway – 0.5% | | | | |
| | 223,661 | | | Entra ASA (Office)(a) | | | 1,800,325 | |
| | |
| | Singapore – 2.6% | | | | |
| | 1,318,100 | | | City Developments Ltd. (Diversified) | | | 7,090,865 | |
| | 3,594,010 | | | OUE Commercial Real Estate Investment Trust (REIT) (Diversified) | | | 1,658,091 | |
| | | | | | | | |
| | | | | | | 8,748,956 | |
| | |
| | Spain – 2.0% | | | | |
| | 559,835 | | | Merlin Properties Socimi SA (REIT) (Diversified) | | | 7,013,173 | |
| | |
| | Sweden – 1.3% | | | | |
| | 313,481 | | | Hufvudstaden AB Class A (Diversified) | | | 4,431,558 | |
| | |
| | Switzerland – 2.1% | | | | |
| | 80,566 | | | PSP Swiss Property AG (Registered) (Office)* | | | 7,064,820 | |
| | |
| | United Kingdom – 13.6% | | | | |
| | 416,971 | | | Big Yellow Group PLC (REIT) (Industrial) | | | 4,945,913 | |
| | 915,189 | | | British Land Co. PLC (REIT) (Diversified) | | | 10,589,532 | |
| | 169,262 | | | Derwent London PLC (REIT) (Office) | | | 9,154,956 | |
| | 1,022,642 | | | Hammerson PLC (REIT) (Retail) | | | 9,040,525 | |
| | 345,957 | | | Helical Bar PLC (Diversified) | | | 2,421,271 | |
| | 390,074 | | | Kennedy Wilson Europe Real Estate PLC (Other) | | | 6,936,963 | |
| | 365,815 | | | The UNITE Group PLC (Residential) | | | 3,533,965 | |
| | | | | | | | |
| | | | | | | 46,623,125 | |
| | |
| | TOTAL INVESTMENTS – 99.8% | | | | |
| | (Cost $347,733,806) | | $ | 342,304,119 | |
| | |
| OTHER ASSETS IN EXCESS OF
LIABILITIES – 0.2% | | | 719,627 | |
| | |
| | NET ASSETS – 100.0% | | $ | 343,023,746 | |
| | |
| | |
| The accompanying notes are an integral part of these financial statements. | | 85 |
GOLDMAN SACHS INTERNATIONAL REAL ESTATE SECURITIES FUND
Schedule of Investments (continued)
December 31, 2015
| | |
| The percentage shown for each investment category reflects the value of investments in that category as a percentage of net assets. |
* | | Non-income producing security. |
(a) | | Exempt from registration under Rule 144A of the Securities Act of 1933. Under procedures approved by the Board of Trustees, such securities may be deemed liquid by the Investment Adviser and may be resold, normally to qualified institutional buyers in transactions exempt from registration. Total market value of Rule 144A securities amounts to $1,800,325, which represents approximately 0.5% of net assets as of December 31, 2015. |
| | | | |
|
Investment Abbreviation: |
REIT | | —Real Estate Investment Trust |
|
| | |
| 86 | | The accompanying notes are an integral part of these financial statements. |
GOLDMAN SACHS REAL ESTATE SECURITIES FUND
Schedule of Investments
December 31, 2015
| | | | | | | | |
Shares | | | Description | | Value | |
| | | | | | | | |
| | Common Stocks – 98.8% | | | | |
| | Commercial – 27.1% | | | | |
| | 103,876 | | | Alexandria Real Estate Equities, Inc. (REIT) | | $ | 9,386,235 | |
| | 261,896 | | | Boston Properties, Inc. (REIT) | | | 33,402,216 | |
| | 436,690 | | | CyrusOne, Inc. (REIT) | | | 16,354,040 | |
| | 224,122 | | | Highwoods Properties, Inc. (REIT) | | | 9,771,719 | |
| | 326,111 | | | Liberty Property Trust (REIT) | | | 10,125,747 | |
| | 599,339 | | | Parkway Properties, Inc. (REIT) | | | 9,367,669 | |
| | 457,860 | | | Prologis, Inc. (REIT) | | | 19,651,351 | |
| | 101,021 | | | PS Business Parks, Inc. (REIT) | | | 8,832,266 | |
| | 321,075 | | | Vornado Realty Trust (REIT) | | | 32,094,657 | |
| | | | | | | | |
| | | | | | | 148,985,900 | |
| | |
| | Health Care – 11.3% | | | | |
| | 198,311 | | | Care Capital Properties, Inc. (REIT) | | | 6,062,367 | |
| | 251,361 | | | HCP, Inc. (REIT) | | | 9,612,045 | |
| | 241,802 | | | Physicians Realty Trust (REIT) | | | 4,076,782 | |
| | 460,207 | | | Ventas, Inc. (REIT) | | | 25,969,481 | |
| | 238,782 | | | Welltower, Inc. (REIT) | | | 16,244,339 | |
| | | | | | | | |
| | | | | | | 61,965,014 | |
| | |
| | Leisure – 7.2% | | | | |
| | 601,227 | | | Chesapeake Lodging Trust (REIT) | | | 15,126,871 | |
| | 372,818 | | | Pebblebrook Hotel Trust (REIT) | | | 10,446,360 | |
| | 656,371 | | | RLJ Lodging Trust (REIT) | | | 14,197,305 | |
| | | | | | | | |
| | | | | | | 39,770,536 | |
| | |
| | Multifamily – 16.4% | | | | |
| | 201,458 | | | AvalonBay Communities, Inc. (REIT) | | | 37,094,462 | |
| | 154,241 | | | Equity Residential (REIT) | | | 12,584,523 | |
| | 238,602 | | | Mid-America Apartment Communities, Inc. (REIT) | | | 21,667,448 | |
| | 319,815 | | | Post Properties, Inc. (REIT) | | | 18,920,255 | |
| | | | | | | | |
| | | | | | | 90,266,688 | |
| | |
| | Other – 1.7% | | | | |
| | 96,941 | | | American Tower Corp. (REIT) | | | 9,398,430 | |
| | |
| | Retail – 24.3% | | | | |
| | 362,376 | | | Acadia Realty Trust (REIT) | | | 12,012,764 | |
| | 813,858 | | | Brixmor Property Group, Inc. (REIT) | | | 21,013,814 | |
| | 949,373 | | | DDR Corp. (REIT) | | | 15,987,441 | |
| | 130,354 | | | Federal Realty Investment Trust (REIT) | | | 19,044,719 | |
| | 320,117 | | | Simon Property Group, Inc. (REIT) | | | 62,243,550 | |
| | 278,073 | | | WP Glimcher, Inc. (REIT) | | | 2,950,355 | |
| | | | | | | | |
| | | | | | | 133,252,643 | |
| | |
| | Self Storage – 10.8% | | | | |
| | 174,387 | | | Public Storage (REIT) | | | 43,195,660 | |
| | 149,835 | | | Sovran Self Storage, Inc. (REIT) | | | 16,078,794 | |
| | | | | | | | |
| | | | | | | 59,274,454 | |
| | |
| | TOTAL INVESTMENTS – 98.8% | | | | |
| | (Cost $396,640,407) | | $ | 542,913,665 | |
| | |
| OTHER ASSETS IN EXCESS OF
LIABILITIES – 1.2% | | | 6,368,982 | |
| | |
| | NET ASSETS – 100.0% | | $ | 549,282,647 | |
| | |
| | |
| The percentage shown for each investment category reflects the value of investments in that category as a percentage of net assets. |
| | | | |
|
Investment Abbreviation: |
REIT | | —Real Estate Investment Trust |
|
| | |
| The accompanying notes are an integral part of these financial statements. | | 87 |
GOLDMAN SACHS SELECT SATELLITE FUNDS
Statements of Assets and Liabilities
December 31, 2015
| | | | | | |
| | | | |
Absolute Return
Tracker Fund(a) | |
| | Assets: | | | | |
| | Investments in unaffiliated issuers, at value (cost $179,763,528, $399,244,625, $178,236,201, $13,970,497, $8,444,000, $2,888,742, $347,733,806 and $396,640,407) | | $ | 180,989,862 | |
| | Investments in affiliated issuers, at value (cost $904,143,179, $137,213,970, $329,041,062, $8,464,763, $88,106,078, $42,195, $0 and $0) | | | 904,143,179 | |
| | Cash | | | 60,614,911 | |
| | Foreign currencies, at value (cost $132,252, $0, $22,757,557, $0, $4,756,550, $4,696, $99,544 and $0) | | | 134,998 | |
| | Receivables: | | | | |
| | Collateral on certain derivative contracts(b) | | | 46,020,876 | |
| | Fund shares sold | | | 1,617,824 | |
| | Dividends and interest | | | 180,005 | |
| | Reimbursement from investment adviser | | | 43,150 | |
| | Investments sold | | | — | |
| | Investments sold on an extended-settlement basis | | | — | |
| | Foreign tax reclaims | | | — | |
| | Unrealized gain on swap contracts | | | 541,860 | |
| | Unrealized gain on forward foreign currency exchange contracts | | | 362,774 | |
| | Deferred offering costs | | | — | |
| | Variation margin on certain derivative contracts | | | — | |
| | Total assets | | | 1,194,649,439 | |
| | | | | | |
| | Liabilities: | | | | |
| | Written options, at value (premiums received $3,800,048, $0, $0, $0, $0, $0, $0 and $0) | | | 2,340,014 | |
| | Variation margin on certain derivative contracts | | | 427,392 | |
| | Unrealized loss on swap contracts | | | 388,774 | |
| | Unrealized loss on forward foreign currency exchange contracts | | | 185,519 | |
| | Payables: | | | | |
| | Fund shares redeemed | | | 6,240,879 | |
| | Management fees | | | 597,891 | |
| | Investments purchased | | | 421,188 | |
| | Distribution and Service fees and Transfer Agency fees | | | 76,196 | |
| | Collateral on certain derivative contracts(b) | | | 20,000 | |
| | Investments purchased on an extended-settlement basis | | | — | |
| | Forward sale contracts, at value (proceeds received $0, $5,169,727, $0, $0, $0, $0, $0 and $0 ) | | | — | |
| | Accrued expenses and other liabilities | | | 278,706 | |
| | Total liabilities | | | 10,976,559 | |
| | | | | | |
| | Net Assets: | | | | |
| | Paid-in capital | | | 1,200,167,352 | |
| | Undistributed (distributions in excess of) net investment income (loss) | | | 1,168,451 | |
| | Accumulated net realized gain (loss) | | | (25,345,129 | ) |
| | Net unrealized gain (loss) | | | 7,682,206 | |
| | | NET ASSETS | | $ | 1,183,672,880 | |
| | | Net Assets: | | | | |
| | | Class A | | $ | 45,206,588 | |
| | | Class C | | | 18,328,596 | |
| | | Institutional | | | 1,111,353,302 | |
| | | Service | | | — | |
| | | Class IR | | | 6,755,427 | |
| | | Class R | | | 2,019,262 | |
| | | Class R6 | | | 9,705 | |
| | | Total Net Assets | | $ | 1,183,672,880 | |
| | | Shares outstanding $0.001 par value (unlimited shares authorized): | | | | |
| | | Class A | | | 5,215,099 | |
| | | Class C | | | 2,244,667 | |
| | | Institutional | | | 125,387,494 | |
| | | Service | | | — | |
| | | Class IR | | | 767,356 | |
| | | Class R | | | 237,593 | |
| | | Class R6 | | | 1,095 | |
| | | Net asset value, offering and redemption price per share:(c) | | | | |
| | | Class A | | | $8.67 | |
| | | Class C | | | 8.17 | |
| | | Institutional | | | 8.86 | |
| | | Service | | | — | |
| | | Class IR | | | 8.80 | |
| | | Class R | | | 8.50 | |
| | | Class R6 | | | 8.86 | |
| | (a) | | Statements of Assets and Liabilities for Absolute Return Tracker, Commodity Strategy, Dynamic Allocation and Dynamic Commodity Strategy Funds are consolidated and include the balances of Cayman Commodity-ART, Ltd., Cayman Commodity-CSF, Ltd., Cayman Commodity-DAF, Ltd. and Cayman Commodity-DCS, Ltd. (wholly-owned subsidiaries), respectively. Accordingly, all interfund balances and transactions have been eliminated. |
| | (b) | | Segregated for initial margin and/or collateral on transactions as follows: |
| | | | | | | | | | | | | | | | |
Fund | | Forwards | | | Futures | | | Options | | | Swaps | |
Absolute Return Tracker | | $ | — | | | $ | 11,555,955 | | | $ | 23,372,111 | | | $ | 11,072,810 | |
Commodity Strategy | | | — | | | | — | | | | — | | | | 103,522,891 | |
Dynamic Allocation | | | 4,110,000 | | | | 12,619,943 | | | | — | | | | 19,591,014 | |
Dynamic Commodity Strategy | | | — | | | | — | | | | — | | | | 1,860,000 | |
Managed Futures Strategy | | | 3,100,000 | | | | 3,094,628 | | | | — | | | | 4,720,943 | |
| | (c) | | Maximum public offering price per share for class A Shares of the Absolute Return Tracker, Commodity Strategy, Dynamic Allocation, Dynamic Commodity Strategy, Managed Futures Strategy, Global Real Estate Securities, International Real Estate Securities and Real Estate Securities Funds is $9.17, $10.98, $10.00, $6.30, $10.80, $11.05, $6.44 and $20.73, respectively. At redemption, Class C Shares may be subject to a contingent deferred sales charge assessed on the amount equal to the lesser of the current NAV or the original purchase price of the shares. |
| | (d) | | NAV may not recalculate due to rounding of fractional shares. |
| | |
| 88 | | The accompanying notes are an integral part of these financial statements. |
GOLDMAN SACHS SELECT SATELLITE FUNDS
| | | | | | | | | | | | | | | | | | | | | | | | | | | | | | | | | | | | | | | | |
| | | Commodity
Strategy Fund(a) | | | | | Dynamic
Allocation
Fund(a) | | | | | Dynamic
Commodity
Strategy Fund(a) | | | | | Managed
Futures
Strategy Fund | | | | | Global
Real Estate
Securities Fund | | | | | International
Real Estate
Securities Fund | | | | | Real Estate
Securities
Fund | |
| | | | | | | | | | | | | | | | | | | | | | | | | | | | | | | | | | | | | | | | |
| | | | | | | | | | | | | | | | | | | | | | | | | | | | | | | | | | | | | | | | |
| | $ | 402,442,409 | | | | | $ | 178,941,474 | | | | | $ | 13,968,535 | | | | | $ | 10,466,140 | | | | | $ | 3,032,620 | | | | | $ | 342,304,119 | | | | | $ | 542,913,665 | |
| | | 137,213,970 | | | | | | 329,041,062 | | | | | | 8,464,763 | | | | | | 88,106,078 | | | | | | 42,195 | | | | | | — | | | | | | — | |
| | | 31,052,002 | | | | | | 29,735,823 | | | | | | 103,867 | | | | | | 6,401,001 | | | | | | 61,832 | | | | | | 1,772,128 | | | | | | 6,216,643 | |
| | | — | | | | | | 23,182,799 | | | | | | — | | | | | | 4,750,699 | | | | | | 4,624 | | | | | | 99,180 | | | | | | — | |
| | | | | | | | | | | | | | | | | | | | | | | | | | | | | | | | | | | | | | | | |
| | | 103,522,891 | | | | | | 36,320,957 | | | | | | 1,860,000 | | | | | | 10,915,571 | | | | | | — | | | | | | — | | | | | | — | |
| | | 3,115,084 | | | | | | 801,676 | | | | | | — | | | | | | 533,376 | | | | | | 5 | | | | | | 296,426 | | | | | | 203,824 | |
| | | 1,065,067 | | | | | | 190,575 | | | | | | 1,610 | | | | | | 8,639 | | | | | | 12,332 | | | | | | 1,098,671 | | | | | | 2,557,936 | |
| | | 25,941 | | | | | | 7,537 | | | | | | — | | | | | | 23,388 | | | | | | 4,929 | | | | | | 76,652 | | | | | | 81,413 | |
| | | — | | | | | | — | | | | | | 38,077 | | | | | | — | | | | | | — | | | | | | 341,882 | | | | | | — | |
| | | 5,169,727 | | | | | | — | | | | | | — | | | | | | — | | | | | | — | | | | | | — | | | | | | — | |
| | | — | | | | | | 68,563 | | | | | | — | | | | | | — | | | | | | 14 | | | | | | 113,816 | | | | | | — | |
| | | — | | | | | | 73,823 | | | | | | 390,637 | | | | | | — | | | | | | — | | | | | | — | | | | | | — | |
| | | — | | | | | | 82,290 | | | | | | — | | | | | | 1,288,241 | | | | | | — | | | | | | — | | | | | | — | |
| | | — | | | | | | — | | | | | | — | | | | | | — | | | | | | 102,937 | | | | | | — | | | | | | — | |
| | | 1,161 | | | | | | 356,797 | | | | | | — | | | | | | 572,709 | | | | | | — | | | | | | — | | | | | | — | |
| | | 683,608,252 | | | | | | 598,803,376 | | | | | | 24,827,489 | | | | | | 123,065,842 | | | | | | 3,261,488 | | | | | | 346,102,874 | | | | | | 551,973,481 | |
| | | | | | | | | | | | | | | | | | | | | | | | | | | | | | | | | | | | | | | | |
| | | | | | | | | | | | | | | | | | | | | | | | | | | | | | | | | | | | | | | | |
| | | — | | | | | | — | | | | | | — | | | | | | — | | | | | | — | | | | | | — | | | | | | — | |
| | | 561,911 | | | | | | 871,131 | | | | | | — | | | | | | — | | | | | | — | | | | | | — | | | | | | — | |
| | | 49,286,731 | | | | | | 385,674 | | | | | | 335,477 | | | | | | — | | | | | | — | | | | | | — | | | | | | — | |
| | | — | | | | | | 3,910,872 | | | | | | — | | | | | | 1,109,119 | | | | | | — | | | | | | — | | | | | | — | |
| | | | | | | | | | | | | | | | | | | | | | | | | | | | | | | | | | | | | | | | |
| | | 7,727,764 | | | | | | 1,118,237 | | | | | | — | | | | | | 157,464 | | | | | | — | | | | | | 2,657,912 | | | | | | 2,093,465 | |
| | | 232,576 | | | | | | 357,088 | | | | | | 64,472 | | | | | | 89,001 | | | | | | 2,487 | | | | | | 281,032 | | | | | | 407,057 | |
| | | 1,043,331 | | | | | | — | | | | | | — | | | | | | — | | | | | | — | | | | | | — | | | | | | — | |
| | | 46,713 | | | | | | 65,298 | | | | | | 877 | | | | | | 15,470 | | | | | | 159 | | | | | | 16,300 | | | | | | 56,530 | |
| | | — | | | | | | — | | | | | | — | | | | | | — | | | | | | — | | | | | | — | | | | | | — | |
| | | 1,130,625 | | | | | | — | | | | | | — | | | | | | — | | | | | | — | | | | | | — | | | | | | — | |
| | | 5,157,422 | | | | | | — | | | | | | — | | | | | | — | | | | | | — | | | | | | — | | | | | | — | |
| | | 245,732 | | | | | | 271,832 | | | | | | 210,542 | | | | | | 131,664 | | | | | | 83,817 | | | | | | 123,884 | | | | | | 133,782 | |
| | | 65,432,805 | | | | | | 6,980,132 | | | | | | 611,368 | | | | | | 1,502,718 | | | | | | 86,463 | | | | | | 3,079,128 | | | | | | 2,690,834 | |
| | | | | | | | | | | | | | | | | | | | | | | | | | | | | | | | | | | | | | | | |
| | | | | | | | | | | | | | | | | | | | | | | | | | | | | | | | | | | | | | | | |
| | | 779,782,732 | | | | | | 626,181,188 | | | | | | 24,586,709 | | | | | | 117,147,107 | | | | | | 3,042,114 | | | | | | 931,426,104 | | | | | | 394,194,727 | |
| | | (11,759,714 | ) | | | | | 3,334,962 | | | | | | (423,786 | ) | | | | | (1,240,244 | ) | | | | | (18,074 | ) | | | | | (5,139,974 | ) | | | | | 1,388,104 | |
| | | (103,830,638 | ) | | | | | (34,620,895 | ) | | | | | — | | | | | | (56,565 | ) | | | | | 7,197 | | | | | | (577,825,103 | ) | | | | | 7,426,558 | |
| | | (46,016,933 | ) | | | | | (3,072,011 | ) | | | | | 53,198 | | | | | | 5,712,826 | | | | | | 143,788 | | | | | | (5,437,281 | ) | | | | | 146,273,258 | |
| | | $ | 618,175,447 | | | | | $ | 591,823,244 | | | | | $ | 24,216,121 | | | | | $ | 121,563,124 | | | | | $ | 3,175,025 | | | | | $ | 343,023,746 | | | | | $ | 549,282,647 | |
| | | | | | | | | | | | | | | | | | | | | | | | | | | | | | | | | | | | | | | | | |
| | | $ | 58,901,307 | | | | | $ | 43,166,662 | | | | | $ | 134,858 | | | | | $ | 24,000,350 | | | | | $ | 26,430 | | | | | $ | 7,702,499 | | | | | $ | 57,935,689 | |
| | | | 4,577,622 | | | | | | 27,913,704 | | | | | | 5,937 | | | | | | 3,056,490 | | | | | | 26,359 | | | | | | 1,622,436 | | | | | | 15,055,861 | |
| | | | 544,698,703 | | | | | | 510,789,432 | | | | | | 24,045,264 | | | | | | 87,819,974 | | | | | | 3,042,924 | | | | | | 333,601,169 | | | | | | 463,104,946 | |
| | | | — | | | | | | — | | | | | | — | | | | | | — | | | | | | — | | | | | | — | | | | | | 2,743,528 | |
| | | | 6,699,292 | | | | | | 9,932,831 | | | | | | 15,094 | | | | | | 6,489,222 | | | | | | 26,447 | | | | | | 88,151 | | | | | | 7,283,250 | |
| | | | 1,962,782 | | | | | | 11,165 | | | | | | 14,968 | | | | | | 197,088 | | | | | | 26,403 | | | | | | — | | | | | | 3,149,010 | |
| | | | 1,335,741 | | | | | | 9,450 | | | | | | — | | | | | | — | | | | | | 26,462 | | | | | | 9,491 | | | | | | 10,363 | |
| | | $ | 618,175,447 | | | | | $ | 591,823,244 | | �� | | | $ | 24,216,121 | | | | | $ | 121,563,124 | | | | | | 3,175,025 | | | | | $ | 343,023,746 | | | | | $ | 549,282,647 | |
| | | | | | | | | | | | | | | | | | | | | | | | | | | | | | | | | | | | | | | | | |
| | | | 5,613,665 | | | | | | 4,569,361 | | | | | | 22,419 | | | | | | 2,350,017 | | | | | | 2,532 | | | | | | 1,264,438 | | | | | | 2,957,189 | |
| | | | 456,103 | | | | | | 3,074,835 | | | | | | 1,000 | | | | | | 307,095 | | | | | | 2,526 | | | | | | 266,275 | | | | | | 791,210 | |
| | | | 51,416,243 | | | | | | 53,546,865 | | | | | | 3,976,079 | | | | | | 8,477,143 | | | | | | 291,393 | | | | | | 56,463,293 | | | | | | 23,184,661 | |
| | | | — | | | | | | — | | | | | | — | | | | | | — | | | | | | — | | | | | | — | | | | | | 139,229 | |
| | | | 632,152 | | | | | | 1,043,647 | | | | | | 2,500 | | | | | | 630,253 | | | | | | 2,533 | | | | | | 14,583 | | | | | | 370,060 | |
| | | | 189,706 | | | | | | 1,193 | | | | | | 2,500 | | | | | | 19,469 | | | | | | 2,530 | | | | | | — | | | | | | 161,732 | |
| | | | 126,042 | | | | | | 991 | | | | | | — | | | | | | — | | | | | | 2,534 | | | | | | 1,607 | | | | | | 519 | |
| | | | | | | | | | | | | | | | | | | | | | | | | | | | | | | | | | | | | | | | | |
| | | | $10.49 | | | | | | $9.45 | | | | | | $6.02 | | | | | | $10.21 | | | | | | $10.44 | | | | | | $6.09 | | | | | | $19.59 | |
| | | | 10.04 | | | | | | 9.08 | | | | | | 5.94 | | | | | | 9.95 | | | | | | 10.43 | (d) | | | | | 6.09 | | | | | | 19.03 | |
| | | | 10.59 | | | | | | 9.54 | | | | | | 6.05 | | | | | | 10.36 | | | | | | 10.44 | | | | | | 5.91 | | | | | | 19.97 | |
| | | | — | | | | | | — | | | | | | — | | | | | | — | | | | | | — | | | | | | — | | | | | | 19.71 | |
| | | | 10.60 | | | | | | 9.52 | | | | | | 6.04 | | | | | | 10.30 | | | | | | 10.44 | | | | | | 6.04 | | | | | | 19.68 | |
| | | | 10.35 | | | | | | 9.36 | | | | | | 5.99 | | | | | | 10.12 | | | | | | 10.44 | | | | | | — | | | | | | 19.47 | |
| | | | 10.60 | | | | | | 9.54 | | | | | | — | | | | | | — | | | | | | 10.44 | | | | | | 5.91 | | | | | | 19.98 | (d) |
| | |
| The accompanying notes are an integral part of these financial statements. | | 89 |
GOLDMAN SACHS SELECT SATELLITE FUNDS
Statements of Operations
For the Fiscal Year Ended December 31, 2015
| | | | | | |
| | | | | Absolute Return
Tracker Fund(a) | |
| | Investment income: | | | | |
| | Dividends — unaffiliated issuers (net of foreign taxes withheld of $0, $0, $197,565, $0, $1,297, $0, $1,083,083 and $0) | | $ | 4,058,903 | |
| | Dividends — affiliated issuers (net of foreign taxes withheld of $501, $1,297, $172, $26, $0, $0, $0 and $0) | | | 215,227 | |
| | Interest | | | — | |
| | Total investment income | | | 4,274,130 | |
| | | | | | |
| | Expenses: | | | | |
| | Management fees | | | 16,927,530 | |
| | Transfer Agency fees(c) | | | 736,948 | |
| | Distribution and Service fees(c) | | | 369,727 | |
| | Custody, accounting and administrative services | | | 179,984 | |
| | Professional fees | | | 176,010 | |
| | Registration fees | | | 124,901 | |
| | Printing and mailing costs | | | 124,680 | |
| | Trustee fees | | | 29,879 | |
| | Amortization of offering costs | | | — | |
| | Organization costs | | | — | |
| | Service share fees — Service Plan | | | — | |
| | Service share fees — Shareholder Administration Plan | | | — | |
| | Other | | | 41,577 | |
| | Total expenses | | | 18,711,236 | |
| | Less — expense reductions | | | (8,479,041 | ) |
| | Net expenses | | | 10,232,195 | |
| | NET INVESTMENT INCOME (LOSS) | | | (5,958,065 | ) |
| | | | | | |
| | Realized and unrealized gain (loss): | | | | |
| | Net realized gain (loss) from: | | | | |
| | Investments | | | (29,170,893 | ) |
| | Futures contracts | | | (4,283,662 | ) |
| | Swap contracts | | | (1,919,138 | ) |
| | Forward foreign currency exchange contracts | | | 3,641,767 | |
| | Foreign currency transactions | | | 546,315 | |
| | Written options | | | 20,078,492 | |
| | Net change in unrealized gain (loss) on: | | | | |
| | Investments (including the effects of the net change in the foreign capital gains tax liability of $0, $0, $0, $0, $0, $0,
$198,878 and $0) | | | 3,747,888 | |
| | Futures contracts | | | (4,732,726 | ) |
| | Swap contracts | | | 2,609,462 | |
| | Forward foreign currency exchange contracts | | | 5,177 | |
| | Foreign currency translation | | | 69,338 | |
| | Written options | | | (136,926 | ) |
| | Net realized and unrealized gain (loss) | | | (9,544,906 | ) |
| | NET INCREASE (DECREASE) IN NET ASSETS RESULTING FROM OPERATIONS | | $ | (15,502,971 | ) |
| | (a) | | Statements of Operations for Absolute Return Tracker, Commodity Strategy, Dynamic Allocation and Dynamic Commodity Strategy Funds are consolidated and includes the balances of Cayman Commodity-ART, Ltd., Cayman Commodity-CSF, Ltd., Cayman Commodity-DAF, Ltd. and Cayman Commodity-DCS, Ltd. (wholly-owned subsidiaries), respectively. Accordingly, all interfund balances and transactions have been eliminated. |
| | (b) | | Commenced operations on August 31, 2015. |
| | (c) | | Class specific Distribution and Service, and Transfer Agency fees were as follows: |
| | | | | | | | | | | | | | | | | | | | | | | | | | | | | | | | | | | | | | | | |
| | | Distribution and Service Fees | | | Transfer Agency Fees | |
Fund | | Class A | | | Class C | | | Class R | | | Class A | | | Class C | | | Institutional | | | Service | | | Class IR | | | Class R | | | Class R6 | |
Absolute Return Tracker | | $ | 133,047 | | | $ | 225,400 | | | $ | 11,280 | | | $ | 101,116 | | | $ | 42,826 | | | $ | 574,912 | | | $ | — | | | $ | 13,805 | | | $ | 4,287 | | | $ | 2 | |
Commodity Strategy | | | 213,026 | | | | 67,538 | | | | 9,081 | | | | 110,772 | | | | 8,780 | | | | 307,777 | | | | — | | | | 9,560 | | | | 2,361 | | | | 74 | |
Dynamic Allocation | | | 158,654 | | | | 358,500 | | | | 79 | | | | 120,578 | | | | 68,115 | | | | 232,880 | | | | — | | | | 29,551 | | | | 30 | | | | 1 | |
Dynamic Commodity Strategy | | | 207 | | | | 71 | | | | 89 | | | | 108 | | | | 9 | | | | 11,265 | | | | — | | | | 24 | | | | 23 | | | | — | |
Managed Futures Strategy | | | 23,384 | | | | 17,643 | | | | 506 | | | | 17,773 | | | | 3,352 | | | | 35,111 | | | | — | | | | 2,840 | | | | 192 | | | | — | |
Global Real Estate Securities | | | 22 | | | | 87 | | | | 43 | | | | 17 | | | | 16 | | | | 399 | | | | — | | | | 17 | | | | 17 | | | | 1 | |
International Real Estate Securities | | | 22,980 | | | | 18,549 | | | | — | | | | 17,465 | | | | 3,524 | | | | 148,245 | | | | — | | | | 206 | | | | — | | | | 2 | |
Real Estate Securities | | | 156,235 | | | | 160,738 | | | | 12,625 | | | | 118,739 | | | | 30,540 | | | | 192,944 | | | | 1,226 | | | | 12,651 | | | | 4,798 | | | | 2 | |
| | |
| 90 | | The accompanying notes are an integral part of these financial statements. |
GOLDMAN SACHS SELECT SATELLITE FUNDS
| | | | | | | | | | | | | | | | | | | | | | | | | | | | | | | | | | | | | | | | |
| | | Commodity
Strategy Fund(a) | | | | | Dynamic
Allocation
Fund(a) | | | | | Dynamic
Commodity
Strategy Fund(a) | | | | | Managed
Futures
Strategy Fund | | | | | Global
Real Estate
Securities Fund(b) | | | | | International
Real Estate
Securities Fund | | | | | Real Estate
Securities
Fund | |
| | | | | | | | | | | | | | | | | | | | | | | | | | | | | | | | | | | | | | | | |
| | $ | — | | | | | $ | 4,661,445 | | | | | $ | — | | | | | $ | — | | | | | $ | 29,504 | | | | | $ | 11,199,928 | | | | | $ | 15,689,217 | |
| | | 75,768 | | | | | | 66,996 | | | | | | 4,694 | | | | | | 19,355 | | | | | | 8 | | | | | | — | | | | | | — | |
| | | 5,439,199 | | | | | | 392,268 | | | | | | 1,369 | | | | | | — | | | | | | — | | | | | | — | | | | | | — | |
| | | 5,514,967 | | | | | | 5,120,709 | | | | | | 6,063 | | | | | | 19,355 | | | | | | 29,512 | | | | | | 11,199,928 | | | | | | 15,689,217 | |
| | | | | | | | | | | | | | | | | | | | | | | | | | | | | | | | | | | | | | | | |
| | | | | | | | | | | | | | | | | | | | | | | | | | | | | | | | | | | | | | | | |
| | | 4,354,685 | | | | | | 6,273,709 | | | | | | 226,307 | | | | | | 1,004,917 | | | | | | 10,938 | | | | | | 4,008,568 | | | | | | 5,731,778 | |
| | | 439,324 | | | | | | 451,155 | | | | | | 11,429 | | | | | | 59,268 | | | | | | 467 | | | | | | 169,442 | | | | | | 360,900 | |
| | | 289,645 | | | | | | 517,233 | | | | | | 367 | | | | | | 41,533 | | | | | | 152 | | | | | | 41,529 | | | | | | 329,598 | |
| | | 159,640 | | | | | | 124,303 | | | | | | 84,225 | | | | | | 54,756 | | | | | | 410 | | | | | | 204,574 | | | | | | 92,727 | |
| | | 236,958 | | | | | | 266,241 | | | | | | 179,161 | | | | | | 155,602 | | | | | | 51,164 | | | | | | 109,998 | | | | | | 107,443 | |
| | | 119,725 | | | | | | 76,434 | | | | | | 69,691 | | | | | | 86,696 | | | | | | 26,667 | | | | | | 80,736 | | | | | | 106,150 | |
| | | 230,066 | | | | | | 94,747 | | | | | | 42,693 | | | | | | 34,796 | | | | | | 22,000 | | | | | | 39,111 | | | | | | 53,717 | |
| | | 25,370 | | | | | | 27,266 | | | | | | 18,906 | | | | | | 24,442 | | | | | | 12,090 | | | | | | 24,800 | | | | | | 25,159 | |
| | | — | | | | | | — | | | | | | 97,945 | | | | | | — | | | | | | 47,952 | | | | | | — | | | | | | — | |
| | | — | | | | | | — | | | | | | — | | | | | | — | | | | | | 12,000 | | | | | | — | | | | | | — | |
| | | — | | | | | | — | | | | | | — | | | | | | — | | | | | | — | | | | | | — | | | | | | 7,663 | |
| | | — | | | | | | — | | | | | | — | | | | | | — | | | | | | — | | | | | | — | | | | | | 7,663 | |
| | | 37,016 | | | | | | 34,219 | | | | | | 6,962 | | | | | | 62,185 | | | | | | 2,501 | | | | | | 28,720 | | | | | | 30,289 | |
| | | 5,892,429 | | | | | | 7,865,307 | | | | | | 737,686 | | | | | | 1,524,195 | | | | | | 186,341 | | | | | | 4,707,478 | | | | | | 6,853,087 | |
| | | (1,081,903 | ) | | | | | (2,086,077 | ) | | | | | (533,626 | ) | | | | | (318,015 | ) | | | | | (175,679 | ) | | | | | (779,315 | ) | | | | | (1,465,957 | ) |
| | | 4,810,526 | | | | | | 5,779,230 | | | | | | 204,060 | | | | | | 1,206,180 | | | | | | 10,662 | | | | | | 3,928,163 | | | | | | 5,387,130 | |
| | | 704,441 | | | | | | (658,521 | ) | | | | | (197,997 | ) | | | | | (1,186,825 | ) | | | | | 18,850 | | | | | | 7,271,765 | | | | | | 10,302,087 | |
| | | | | | | | | | | | | | | | | | | | | | | | | | | | | | | | | | | | | | | | |
| | | | | | | | | | | | | | | | | | | | | | | | | | | | | | | | | | | | | | | | |
| | | | | | | | | | | | | | | | | | | | | | | | | | | | | | | | | | | | | | | | |
| | | (65,021 | ) | | | | | (24,962,488 | ) | | | | | — | | | | | | 1,664,018 | | | | | | 14,947 | | | | | | 15,314,483 | | | | | | 36,888,637 | |
| | | 1,035,193 | | | | | | (2,864,854 | ) | | | | | — | | | | | | 2,086,882 | | | | | | — | | | | | | — | | | | | | — | |
| | | (369,503,437 | ) | | | | | (11,503,871 | ) | | | | | (9,194,380 | ) | | | | | (226,934 | ) | | | | | — | | | | | | — | | | | | | — | |
| | | — | | | | | | 10,943,330 | | | | | | — | | | | | | 5,540,918 | | | | | | — | | | | | | — | | | | | | (42,418 | ) |
| | | — | | | | | | (3,097,601 | ) | | | | | — | | | | | | (266,030 | ) | | | | | (2,571 | ) | | | | | (127,432 | ) | | | | | 69,762 | |
| | | — | | | | | | — | | | | | | — | | | | | | — | | | | | | — | | | | | | — | | | | | | — | |
| | | | | | | | | | | | | | | | | | | | | | | | | | | | | | | | | | | | | | | | |
| | | (3,717,606 | ) | | | |
|
(3,497,019 |
) | | | | | (1,962 | ) | | | | | 768,085 | | | | | | 143,878 | | | | | | (26,842,428 | ) | | | | | (26,302,117 | ) |
| | | 1,247,979 | | | | | | (5,641,502 | ) | | | | | — | | | | | | (785,770 | ) | | | | | — | | | | | | — | | | | | | — | |
| | | 58,656,951 | | | | | | 102,361 | | | | | | 2,142,318 | | | | | | 2,873,186 | | | | | | — | | | | | | — | | | | | | — | |
| | | — | | | | | | (4,960,864 | ) | | | | | — | | | | | | (1,218,762 | ) | | | | | — | | | | | | — | | | | | | (34,345 | ) |
| | | — | | | | | | 812,225 | | | | | | — | | | | | | 94,778 | | | | | | (90 | ) | | | | | (69,718 | ) | | | | | 56 | |
| | | — | | | | | | — | | | | | | — | | | | | | — | | | | | | — | | | | | | — | | | | | | — | |
| | | (312,345,941 | ) | | | | | (44,670,283 | ) | | | | | (7,054,024 | ) | | | | | 10,530,371 | | | | | | 156,164 | | | | | | (11,725,095 | ) | | | | | 10,579,575 | |
| | $ | (311,641,500 | ) | | | | $ | (45,328,804 | ) | | | | $ | (7,252,021 | ) | | | | $ | 9,343,546 | | | | | $ | 175,014 | | | | | $ | (4,453,330 | ) | | | | $ | 20,881,662 | |
| | |
| The accompanying notes are an integral part of these financial statements. | | 91 |
GOLDMAN SACHS SELECT SATELLITE FUNDS
Statements of Changes in Net Assets
| | | | | | | | | | |
| | | | | Absolute Return Tracker Fund(a) | |
| | | | | For the Fiscal
Year Ended
December 31, 2015 | | | For the Fiscal
Year Ended
December 31, 2014 | |
| | From operations: | | | | | | | | |
| | Net investment income (loss) | | $ | (5,958,065 | ) | | $ | (10,929,129 | ) |
| | Net realized gain (loss) | | | (11,107,119 | ) | | | 105,134,057 | |
| | Net change in unrealized gain (loss) | | | 1,562,213 | | | | (36,079,842 | ) |
| | Net increase (decrease) in net assets resulting from operations | | | (15,502,971 | ) | | | 58,125,086 | |
| | | | | | | | | | |
| | Distributions to shareholders: | | | | | | | | |
| | From net investment income | | | | | | | | |
| | Class A Shares | | | (115,078 | ) | | | — | |
| | Class C Shares | | | — | | | | — | |
| | Institutional Shares | | | (7,926,420 | ) | | | (8,153,948 | ) |
| | Class IR Shares | | | (37,462 | ) | | | (5,005 | ) |
| | Class R Shares | | | (3,919 | ) | | | — | |
| | Class R6 Shares | | | (71 | ) | | | — | |
| | From net realized gains | | | | | | | | |
| | Class A Shares | | | (494,138 | ) | | | (2,391,928 | ) |
| | Class C Shares | | | (214,987 | ) | | | (1,140,755 | ) |
| | Institutional Shares | | | (12,340,757 | ) | | | (68,803,230 | ) |
| | Class IR Shares | | | (71,185 | ) | | | (303,610 | ) |
| | Class R Shares | | | (27,242 | ) | | | (87,089 | ) |
| | Class R6 Shares | | | (104 | ) | | | — | |
| | Total distributions to shareholders | | | (21,231,363 | ) | | | (80,885,565 | ) |
| | | | | | | | | | |
| | From share transactions: | | | | | | | | |
| | Proceeds from sales of shares | | | 712,929,377 | | | | 776,459,757 | |
| | Reinvestment of distributions | | | 11,712,590 | | | | 58,717,510 | |
| | Cost of shares redeemed | | | (1,482,138,840 | ) | | | (582,656,204 | ) |
| | Net increase (decrease) in net assets resulting from share transactions | | | (757,496,873 | ) | | | 252,521,063 | |
| | TOTAL INCREASE (DECREASE) | | | (794,231,207 | ) | | | 229,760,584 | |
| | | | | | | | | | |
| | Net assets: | | | | | | | | |
| | Beginning of year | | | 1,977,904,087 | | | | 1,748,143,503 | |
| | End of year | | $ | 1,183,672,880 | | | $ | 1,977,904,087 | |
| | Undistributed (distributions in excess of) net investment income (loss) | | $ | 1,168,451 | | | $ | 4,444,066 | |
| | (a) | | Statements of Changes in Net Assets for Absolute Return Tracker, Commodity Strategy, Dynamic Allocation and Dynamic Commodity Strategy Funds are consolidated and include the balances of Cayman Commodity-ART, Ltd., Cayman Commodity-CSF, Ltd., Cayman Commodity-DAF, Ltd. and Cayman Commodity-DCS, Ltd. (wholly-owned subsidiaries), respectively. Accordingly, all interfund balances and transactions have been eliminated. |
| | (b) | | Commenced operations on April 30, 2014. |
| | |
| 92 | | The accompanying notes are an integral part of these financial statements. |
GOLDMAN SACHS SELECT SATELLITE FUNDS
| | | | | | | | | | | | | | | | | | | | | | | | | | | | | | | | | | | | | | |
| | | Commodity Strategy Fund(a) | | Dynamic Allocation Fund(a) | | | | | Dynamic Commodity Strategy Fund(a) | | | | | Managed Futures Strategy Fund | |
| | | For the Fiscal
Year Ended
December 31, 2015 | | | For the Fiscal
Year Ended
December 31, 2014 | | | | | For the Fiscal
Year Ended
December 31, 2015 | | | For the Fiscal
Year Ended
December 31, 2014 | | | | | For the Fiscal
Year Ended
December 31, 2015 | | | For the
Period Ended
December 31, 2014(b) | | | | | For the Fiscal
Year Ended
December 31, 2015 | | | For the Fiscal
Year Ended
December 31, 2014 | |
| | | | | | | | | | | | | | | | | | | | | | | | | | | | | | | | | | | | | | |
| | $ | 704,441 | | | $ | (3,471,842 | ) | | | | $ | (658,521 | ) | | $ | (3,323,577 | ) | | | | $ | (197,997 | ) | | $ | (184,746 | ) | | | | $ | (1,186,825 | ) | | $ | (1,114,945 | ) |
| | | (368,533,265 | ) | | | (323,372,556 | ) | | | | | (31,485,484 | ) | | | 50,859,948 | | | | | | (9,194,380 | ) | | | (6,031,766 | ) | | | | | 8,798,854 | | | | (2,139,718 | ) |
| | | 56,187,324 | | | | (120,541,920 | ) | | | | | (13,184,799 | ) | | | (27,986,826 | ) | | | | | 2,140,356 | | | | (2,087,158 | ) | | | | | 1,731,517 | | | | 416,806 | |
| | | (311,641,500 | ) | | | (447,386,318 | ) | | | | | (45,328,804 | ) | | | 19,549,545 | | | | | | (7,252,021 | ) | | | (8,303,670 | ) | | | | | 9,343,546 | | | | (2,837,857 | ) |
| | | | | | | | | | | | | | | | | | | | | | | | | | | | | | | | | | | | | | |
| | | | | | | | | | | | | | | | | | | | | | | | | | | | | | | | | | | | | | |
| | | | | | | | | | | | | | | | | | | | | | | | | | | | | | | | | | | | | | |
| | | (112,173 | ) | | | — | | | | | | (55,579 | ) | | | (375,195 | ) | | | | | — | | | | — | | | | | | (874,511 | ) | | | — | |
| | | — | | | | — | | | | | | — | | | | — | | | | | | — | | | | — | | | | | | (101,551 | ) | | | — | |
| | | (2,960,017 | ) | | | (901,234 | ) | | | | | (3,645,142 | ) | | | (6,603,398 | ) | | | | | — | | | | — | | | | | | (3,314,600 | ) | | | — | |
| | | (33,309 | ) | | | (2,606 | ) | | | | | (46,536 | ) | | | (224,358 | ) | | | | | — | | | | — | | | | | | (244,828 | ) | | | — | |
| | | (675 | ) | | | — | | | | | | — | | | | (50 | ) | | | | | — | | | | — | | | | | | (7,072 | ) | | | — | |
| | | (4,381 | ) | | | — | | | | | | (70 | )�� | | | — | | | | | | — | | | | — | | | | | | — | | | | — | |
| | | | | | | | | | | | | | | | | | | | | | | | | | | | | | | | | | | | | | |
| | | — | | | | — | | | | | | (1,318,906 | ) | | | (4,315,196 | ) | | | | | — | | | | — | | | | | | — | | | | (27,556 | ) |
| | | — | | | | — | | | | | | (857,180 | ) | | | (2,376,606 | ) | | | | | — | | | | — | | | | | | — | | | | (9,019 | ) |
| | | — | | | | — | | | | | | (14,259,852 | ) | | | (34,020,496 | ) | | | | | — | | | | — | | | | | | — | | | | (830,088 | ) |
| | | — | | | | — | | | | | | (292,606 | ) | | | (1,453,940 | ) | | | | | — | | | | — | | | | | | — | | | | (3,992 | ) |
| | | — | | | | — | | | | | | (321 | ) | | | (647 | ) | | | | | — | | | | — | | | | | | — | | | | (796 | ) |
| | | — | | | | — | | | | | | (264 | ) | | | — | | | | | | — | | | | — | | | | | | — | | | | — | |
| | | (3,110,555 | ) | | | (903,840 | ) | | | | | (20,476,456 | ) | | | (49,369,886 | ) | | | | | — | | | | — | | | | | | (4,542,562 | ) | | | (871,451 | ) |
| | | | | | | | | | | | | | | | | | | | | | | | | | | | | | | | | | | | | | |
| | | | | | | | | | | | | | | | | | | | | | | | | | | | | | | | | | | | | | |
| | | 635,770,625 | | | | 896,376,938 | | | | | | 86,161,534 | | | | 137,756,095 | | | | | | 764,188 | | | | 40,053,175 | | | | | | 56,406,462 | | | | 16,538,574 | |
| | | 2,250,361 | | | | 745,658 | | | | | | 20,186,598 | | | | 48,408,082 | | | | | | — | | | | — | | | | | | 4,539,441 | | | | 870,756 | |
| | | (572,533,764 | ) | | | (1,042,611,953 | ) | | | | | (240,278,577 | ) | | | (403,654,580 | ) | | | | | (45,551 | ) | | | (1,000,000 | ) | | | | | (36,635,075 | ) | | | (31,236,213 | ) |
| | | 65,487,222 | | | | (145,489,357 | ) | | | | | (133,930,445 | ) | | | (217,490,403 | ) | | | | | 718,637 | | | | 39,053,175 | | | | | | 24,310,828 | | | | (13,826,883 | ) |
| | | (249,264,833 | ) | | | (593,779,515 | ) | | | | | (199,735,705 | ) | | | (247,310,744 | ) | | | | | (6,533,384 | ) | | | 30,749,505 | | | | | | 29,111,812 | | | | (17,536,191 | ) |
| | | | | | | | | | | | | | | | | | | | | | | | | | | | | | | | | | | | | | |
| | | | | | | | | | | | | | | | | | | | | | | | | | | | | | | | | | | | | | |
| | | 867,440,280 | | | | 1,461,219,795 | | | | | | 791,558,949 | | | | 1,038,869,693 | | | | | | 30,749,505 | | | | — | | | | | | 92,451,312 | | | | 109,987,503 | |
| | $ | 618,175,447 | | | $ | 867,440,280 | | | | | $ | 591,823,244 | | | $ | 791,558,949 | | | | | $ | 24,216,121 | | | $ | 30,749,505 | | | | | $ | 121,563,124 | | | $ | 92,451,312 | |
| | $ | (11,759,714 | ) | | $ | (16,900,562 | ) | | | | $ | 3,334,962 | | | $ | (354,767 | ) | | | | $ | (423,786 | ) | | $ | (53,198 | ) | | | | $ | (1,240,244 | ) | | $ | 1,227,578 | |
| | |
| The accompanying notes are an integral part of these financial statements. | | 93 |
GOLDMAN SACHS SELECT SATELLITE FUNDS
Statements of Changes in Net Assets (continued)
December 31, 2015
| | | | | | |
| | | | | Global Real Estate
Securities Fund(a) | |
| | | | | For the
Period Ended
December 31, 2015 | |
| | From operations: | | | | |
| | Net investment income | | $ | 18,850 | |
| | Net realized gain | | | 12,376 | |
| | Net change in unrealized gain (loss) | | | 143,788 | |
| | Net increase (decrease) in net assets resulting from operations | | | 175,014 | |
| | | | | | |
| | Distributions to shareholders: | | | | |
| | From net investment income | | | | |
| | Class A Shares | | | (291 | ) |
| | Class B Shares(b) | | | — | |
| | Class C Shares | | | (242 | ) |
| | Institutional Shares | | | (36,563 | ) |
| | Service Shares | | | — | |
| | Class IR Shares | | | (309 | ) |
| | Class R Shares | | | (276 | ) |
| | Class R6 Shares | | | (320 | ) |
| | | | | | |
| | From net realized gains | | | | |
| | Class A Shares | | | (36 | ) |
| | Class C Shares | | | (36 | ) |
| | Institutional Shares | | | (4,140 | ) |
| | Service Shares | | | — | |
| | Class IR Shares | | | (36 | ) |
| | Class R Shares | | | (36 | ) |
| | Class R6 Shares | | | (36 | ) |
| | Total distributions to shareholders | | | (42,321 | ) |
| | | | | | |
| | From share transactions: | | | | |
| | Proceeds from sales of shares | | | 3,000,035 | |
| | Reinvestment of distributions | | | 42,321 | |
| | Cost of shares redeemed | | | (24 | ) |
| | Net increase (decrease) in net assets resulting from share transactions | | | 3,042,332 | |
| | TOTAL INCREASE (DECREASE) | | | 3,175,025 | |
| | | | | | |
| | Net assets: | | | | |
| | Beginning of period | | | — | |
| | End of period | | $ | 3,175,025 | |
| | Undistributed (distributions in excess of) net investment income (loss) | | $ | (18,074 | ) |
| | (a) | | Commenced operations on August 31, 2015. |
| | (b) | | Class B Shares were converted into Class A Shares at the close of business on November 14, 2014. |
| | |
| 94 | | The accompanying notes are an integral part of these financial statements. |
GOLDMAN SACHS SELECT SATELLITE FUNDS
| | | | | | | | | | | | | | | | | | | | | | |
| | |
International Real Estate Securities Fund | | | | | Real Estate Securities Fund | |
| | | For the Fiscal
Year Ended
December 31, 2015 | | | | | For the Fiscal
Year Ended
December 31, 2014 | | | | | For the Fiscal
Year Ended
December 31, 2015 | | | | | For the Fiscal
Year Ended
December 31, 2014 | |
| | | | | | | | | | | | | | | | | | | | | | |
| | $ | 7,271,765 | | | | | $ | 13,551,050 | | | | | $ | 10,302,087 | | | | | $ | 8,051,374 | |
| | | 15,187,051 | | | | | | 27,201,176 | | | | | | 36,915,981 | | | | | | 48,073,124 | |
| | | (26,912,146 | ) | | | | | (33,689,361 | ) | | | | | (26,336,406 | ) | | | | | 90,543,112 | |
| | | (4,453,330 | ) | | | | | 7,062,865 | | | | | | 20,881,662 | | | | | | 146,667,610 | |
| | | | | | | | | | | | | | | | | | | | | | |
| | | | | | | | | | | | | | | | | | | | | | |
| | | | | | | | | | | | | | | | | | | | | | |
| | | (204,270 | ) | | | | | (381,081 | ) | | | | | (991,073 | ) | | | | | (936,693 | ) |
| | | — | | | | | | — | | | | | | — | | | | | | (7,426 | ) |
| | | (26,951 | ) | | | | | (56,634 | ) | | | | | (176,162 | ) | | | | | (146,583 | ) |
| | | (10,065,205 | ) | | | | | (15,209,932 | ) | | | | | (8,967,061 | ) | | | | | (8,797,749 | ) |
| | | — | | | | | | — | | | | | | (45,878 | ) | | | | | (51,405 | ) |
| | | (2,423 | ) | | | | | (17,794 | ) | | | | | (114,572 | ) | | | | | (61,153 | ) |
| | | — | | | | | | — | | | | | | (35,673 | ) | | | | | (16,549 | ) |
| | | (163 | ) | | | | | — | | | | | | (65 | ) | | | | | — | |
| | | | | | | | | | | | | | | | | | | | | | |
| | | | | | | | | | | | | | | | | | | | | | |
| | | — | | | | | | — | | | | | | (1,499,743 | ) | | | | | — | |
| | | — | | | | | | — | | | | | | (395,839 | ) | | | | | — | |
| | | — | | | | | | — | | | | | | (12,016,644 | ) | | | | | — | |
| | | — | | | | | | — | | | | | | (70,772 | ) | | | | | — | |
| | | — | | | | | | — | | | | | | (186,101 | ) | | | | | — | |
| | | — | | | | | | — | | | | | | (78,474 | ) | | | | | — | |
| | | — | | | | | | — | | | | | | (261 | ) | | | | | — | |
| | | (10,299,012 | ) | | | | | (15,665,441 | ) | | | | | (24,578,318 | ) | | | | | (10,017,558 | ) |
| | | | | | | | | | | | | | | | | | | | | | |
| | | | | | | | | | | | | | | | | | | | | | |
| | | 61,041,148 | | | | | | 89,554,549 | | | | | | 123,309,287 | | | | | | 140,510,270 | |
| | | 10,282,846 | | | | | | 14,792,193 | | | | | | 23,792,030 | | | | | | 9,551,570 | |
| | | (105,370,720 | ) | | | | | (109,099,521 | ) | | | | | (198,432,801 | ) | | | | | (171,676,700 | ) |
| | | (34,046,726 | ) | | | | | (4,752,779 | ) | | | | | (51,331,484 | ) | | | | | (21,614,860 | ) |
| | | (48,799,068 | ) | | | | | (13,355,355 | ) | | | | | (55,028,140 | ) | | | | | 115,035,192 | |
| | | | | | | | | | | | | | | | | | | | | | |
| | | | | | | | | | | | | | | | | | | | | | |
| | | 391,822,814 | | | | | | 405,178,169 | | | | | | 604,310,787 | | | | | | 489,275,595 | |
| | $ | 343,023,746 | | | | | $ | 391,822,814 | | | | | $ | 549,282,647 | | | | | $ | 604,310,787 | |
| | $ | (5,139,974 | ) | | | | $ | (10,539,438 | ) | | | | $ | 1,388,104 | | | | | $ | 1,050,857 | |
| | |
| The accompanying notes are an integral part of these financial statements. | | 95 |
GOLDMAN SACHS ABSOLUTE RETURN TRACKER FUND
Financial Highlights
Selected Data for a Share Outstanding Throughout Each Year
| | | | | | | | | | | | | | | | | | | | | | | | | | | | | | |
| | | | | | | | Income (loss) from
investment operations | | | Distributions
to shareholders | |
| | | Year - Share Class | | Net asset
value,
beginning
of year | | | Net
investment
loss(a) | | | Net realized
and unrealized
gain (loss) | | | Total from
investment
operations | | | From net
investment
income | | | From net
realized
gains | | | Total
distributions | |
| | FOR THE FISCAL YEARS ENDED DECEMBER 31, | | | | | | | | | | | | | | | | | |
| | 2015 - A | | $ | 9.01 | | | $ | (0.07 | ) | | $ | (0.15 | ) | | $ | (0.22 | ) | | $ | (0.02 | ) | | $ | (0.10 | ) | | $ | (0.12 | ) |
| | 2015 - C | | | 8.54 | | | | (0.13 | ) | | | (0.14 | ) | | | (0.27 | ) | | | — | | | | (0.10 | ) | | | (0.10 | ) |
| | 2015 - Institutional | | | 9.22 | | | | (0.03 | ) | | | (0.17 | ) | | | (0.20 | ) | | | (0.06 | ) | | | (0.10 | ) | | | (0.16 | ) |
| | 2015 - IR | | | 9.15 | | | | (0.04 | ) | | | (0.16 | ) | | | (0.20 | ) | | | (0.05 | ) | | | (0.10 | ) | | | (0.15 | ) |
| | 2015 - R | | | 8.85 | | | | (0.09 | ) | | | (0.15 | ) | | | (0.24 | ) | | | (0.01 | ) | | | (0.10 | ) | | | (0.11 | ) |
| | 2015 - R6 (Commenced July 31, 2015) | | | 9.30 | | | | (0.01 | ) | | | (0.26 | ) | | | (0.27 | ) | | | (0.07 | ) | | | (0.10 | ) | | | (0.17 | ) |
| | 2014 - A | | | 9.12 | | | | (0.09 | ) | | | 0.33 | | | | 0.24 | | | | — | | | | (0.35 | ) | | | (0.35 | ) |
| | 2014 - C | | | 8.72 | | | | (0.15 | ) | | | 0.32 | | | | 0.17 | | | | — | | | | (0.35 | ) | | | (0.35 | ) |
| | 2014 - Institutional | | | 9.32 | | | | (0.05 | ) | | | 0.34 | | | | 0.29 | | | | (0.04 | ) | | | (0.35 | ) | | | (0.39 | ) |
| | 2014 - IR | | | 9.24 | | | | (0.07 | ) | | | 0.34 | | | | 0.27 | | | | (0.01 | ) | | | (0.35 | ) | | | (0.36 | ) |
| | 2014 - R | | | 8.98 | | | | (0.11 | ) | | | 0.33 | | | | 0.22 | | | | — | | | | (0.35 | ) | | | (0.35 | ) |
| | 2013 - A | | | 8.95 | | | | (0.12 | ) | | | 0.82 | | | | 0.70 | | | | — | | | | (0.53 | ) | | | (0.53 | ) |
| | 2013 - C | | | 8.65 | | | | (0.18 | ) | | | 0.78 | | | | 0.60 | | | | — | | | | (0.53 | ) | | | (0.53 | ) |
| | 2013 - Institutional | | | 9.10 | | | | (0.09 | ) | | | 0.84 | | | | 0.75 | | | | — | | | | (0.53 | ) | | | (0.53 | ) |
| | 2013 - IR | | | 9.04 | | | | (0.10 | ) | | | 0.83 | | | | 0.73 | | | | — | | | | (0.53 | ) | | | (0.53 | ) |
| | 2013 - R | | | 8.85 | | | | (0.14 | ) | | | 0.80 | | | | 0.66 | | | | — | | | | (0.53 | ) | | | (0.53 | ) |
| | 2012 - A | | | 8.79 | | | | (0.13 | ) | | | 0.33 | | | | 0.20 | | | | — | | | | (0.04 | ) | | | (0.04 | ) |
| | 2012 - C | | | 8.56 | | | | (0.19 | ) | | | 0.32 | | | | 0.13 | | | | — | | | | (0.04 | ) | | | (0.04 | ) |
| | 2012 - Institutional | | | 8.90 | | | | (0.09 | ) | | | 0.33 | | | | 0.24 | | | | — | | | | (0.04 | ) | | | (0.04 | ) |
| | 2012 - IR | | | 8.86 | | | | (0.11 | ) | | | 0.33 | | | | 0.22 | | | | — | | | | (0.04 | ) | | | (0.04 | ) |
| | 2012 - R | | | 8.72 | | | | (0.15 | ) | | | 0.32 | | | | 0.17 | | | | — | | | | (0.04 | ) | | | (0.04 | ) |
| | 2011 - A | | | 9.25 | | | | (0.12 | ) | | | (0.23 | ) | | | (0.35 | ) | | | — | | | | (0.11 | ) | | | (0.11 | ) |
| | 2011 - C | | | 9.08 | | | | (0.18 | ) | | | (0.23 | ) | | | (0.41 | ) | | | — | | | | (0.11 | ) | | | (0.11 | ) |
| | 2011 - Institutional | | | 9.34 | | | | (0.08 | ) | | | (0.25 | ) | | | (0.33 | ) | | | — | | | | (0.11 | ) | | | (0.11 | ) |
| | 2011 - IR | | | 9.31 | | | | (0.09 | ) | | | (0.25 | ) | | | (0.34 | ) | | | — | | | | (0.11 | ) | | | (0.11 | ) |
| | 2011 - R | | | 9.20 | | | | (0.14 | ) | | | (0.23 | ) | | | (0.37 | ) | | | — | | | | (0.11 | ) | | | (0.11 | ) |
| | (a) | | Calculated based on the average shares outstanding methodology. |
| | (b) | | Assumes investment at the net asset value at the beginning of the year, reinvestment of all distributions, a complete redemption of the investment at the net asset value at the end of the year and no sales or redemption charges. Total returns would be reduced if a sales or redemption charge was taken into account. Returns do not reflect the deduction of taxes that a shareholder would pay on Fund distributions or the redemption of Fund shares. Total returns for periods less than one full year are not annualized. |
| | (c) | | The Fund’s portfolio turnover rate is calculated in accordance with regulatory requirements, without regard to transactions involving short term investments and certain derivatives. If such transactions were included, the Fund’s portfolio turnover rate may be higher. |
| | |
| 96 | | The accompanying notes are an integral part of these financial statements. |
GOLDMAN SACHS ABSOLUTE RETURN TRACKER FUND
| | | | | | | | | | | | | | | | | | | | | | | | | | | | | | | | | | | | | | | | |
| | | | | | | | | | | | | | | | | | | | | | | | | | | | | | | | | | |
| | | Net asset
value, end
of year | | | | | Total
return(b) | | | | | Net assets,
end of
year
(in 000s) | | | | | Ratio of
net expenses
to average
net assets | | | | | Ratio of
total expenses
to average
net assets | | | | | Ratio of
net investment
loss
to average
net assets | | | | | Portfolio
turnover
rate(c) | |
| | | | | | | | | | | | | | | | | | | | | | | | | | | | | | | | | | | | | | | | |
| | $ | 8.67 | | | | | | (2.45 | )% | | | | $ | 45,207 | | | | | | 1.04 | % | | | | | 1.60 | % | | | | | (0.74 | )% | | | | | 213 | % |
| | | 8.17 | | | | | | (3.20 | ) | | | | | 18,329 | | | | | | 1.79 | | | | | | 2.35 | | | | | | (1.51 | ) | | | | | 213 | |
| | | 8.86 | | | | | | (2.18 | ) | | | | | 1,111,353 | | | | | | 0.64 | | | | | | 1.20 | | | | | | (0.36 | ) | | | | | 213 | |
| | | 8.80 | | | | | | (2.23 | ) | | | | | 6,755 | | | | | | 0.79 | | | | | | 1.35 | | | | | | (0.49 | ) | | | | | 213 | |
| | | 8.50 | | | | | | (2.71 | ) | | | | | 2,019 | | | | | | 1.29 | | | | | | 1.85 | | | | | | (0.97 | ) | | | | | 213 | |
| | | 8.86 | | | | | | (2.98 | ) | | | | | 10 | | | | | | 0.64 | (d) | | | | | 1.21 | (d) | | | | | (0.22 | )(d) | | | | | 213 | |
| | | 9.01 | | | | | | 2.61 | | | | | | 64,120 | | | | | | 1.05 | | | | | | 1.59 | | | | | | (0.96 | ) | | | | | 134 | |
| | | 8.54 | | | | | | 1.92 | | | | | | 28,736 | | | | | | 1.80 | | | | | | 2.34 | | | | | | (1.69 | ) | | | | | 134 | |
| | | 9.22 | | | | | | 3.09 | | | | | | 1,874,703 | | | | | | 0.65 | | | | | | 1.19 | | | | | | (0.54 | ) | | | | | 134 | |
| | | 9.15 | | | | | | 2.85 | | | | | | 8,046 | | | | | | 0.81 | | | | | | 1.34 | | | | | | (0.73 | ) | | | | | 134 | |
| | | 8.85 | | | | | | 2.42 | | | | | | 2,299 | | | | | | 1.30 | | | | | | 1.84 | | | | | | (1.19 | ) | | | | | 134 | |
| | | 9.12 | | | | | | 7.90 | | | | | | 105,432 | | | | | | 1.55 | | | | | | 1.59 | | | | | | (1.33 | ) | | | | | 163 | |
| | | 8.72 | | | | | | 7.02 | | | | | | 29,942 | | | | | | 2.30 | | | | | | 2.34 | | | | | | (2.08 | ) | | | | | 163 | |
| | | 9.32 | | | | | | 8.33 | | | | | | 1,589,475 | | | | | | 1.15 | | | | | | 1.19 | | | | | | (0.92 | ) | | | | | 163 | |
| | | 9.24 | | | | | | 8.15 | | | | | | 21,565 | | | | | | 1.30 | | | | | | 1.34 | | | | | | (1.08 | ) | | | | | 163 | |
| | | 8.98 | | | | | | 7.54 | | | | | | 1,729 | | | | | | 1.80 | | | | | | 1.84 | | | | | | (1.57 | ) | | | | | 163 | |
| | | 8.95 | | | | | | 2.30 | | | | | | 133,654 | | | | | | 1.55 | | | | | | 1.59 | | | | | | (1.44 | ) | | | | | 79 | |
| | | 8.65 | | | | | | 1.55 | | | | | | 37,525 | | | | | | 2.30 | | | | | | 2.34 | | | | | | (2.19 | ) | | | | | 79 | |
| | | 9.10 | | | | | | 2.72 | | | | | | 1,355,193 | | | | | | 1.15 | | | | | | 1.19 | | | | | | (1.04 | ) | | | | | 79 | |
| | | 9.04 | | | | | | 2.51 | | | | | | 17,085 | | | | | | 1.30 | | | | | | 1.34 | | | | | | (1.19 | ) | | | | | 79 | |
| | | 8.85 | | | | | | 1.98 | | | | | | 1,988 | | | | | | 1.80 | | | | | | 1.84 | | | | | | (1.69 | ) | | | | | 79 | |
| | | 8.79 | | | | | | (3.77 | ) | | | | | 493,429 | | | | | | 1.56 | | | | | | 1.59 | | | | | | (1.31 | ) | | | | | 105 | |
| | | 8.56 | | | | | | (4.50 | ) | | | | | 60,598 | | | | | | 2.31 | | | | | | 2.34 | | | | | | (2.06 | ) | | | | | 105 | |
| | | 8.90 | | | | | | (3.51 | ) | | | | | 1,314,751 | | | | | | 1.16 | | | | | | 1.19 | | | | | | (0.88 | ) | | | | | 105 | |
| | | 8.86 | | | | | | (3.63 | ) | | | | | 16,341 | | | | | | 1.31 | | | | | | 1.34 | | | | | | (1.02 | ) | | | | | 105 | |
| | | 8.72 | | | | | | (4.00 | ) | | | | | 1,258 | | | | | | 1.81 | | | | | | 1.84 | | | | | | (1.54 | ) | | | | | 105 | |
| | |
| The accompanying notes are an integral part of these financial statements. | | 97 |
GOLDMAN SACHS COMMODITY STRATEGY FUND
Financial Highlights
Selected Data for a Share Outstanding Throughout Each Year
| | | | | | | | | | | | | | | | | | | | | | |
| | | | | | | | Income (loss) from
investment operations | | | | |
| | | Year - Share Class | | Net asset
value,
beginning
of year | | | Net
investment
income (loss)(a) | | | Net realized
and unrealized
gain (loss) | | | Total from
investment
operations | | | Distributions
to shareholders
from net
investment
income | |
| | FOR THE FISCAL YEARS ENDED DECEMBER 31,* | | | | | | | | | |
| | 2015 - A | | $ | 15.58 | | | $ | (0.03 | ) | | $ | (5.04 | ) | | $ | (5.07 | ) | | $ | (0.02 | ) |
| | 2015 - C | | | 14.99 | | | | (0.13 | ) | | | (4.82 | ) | | | (4.95 | ) | | | — | |
| | 2015 - Institutional | | | 15.72 | | | | 0.02 | | | | (5.10 | ) | | | (5.08 | ) | | | (0.05 | ) |
| | 2015 - IR | | | 15.74 | | | | — | (d) | | | (5.08 | ) | | | (5.08 | ) | | | (0.06 | ) |
| | 2015 - R | | | 15.38 | | | | (0.06 | ) | | | (4.97 | ) | | | (5.03 | ) | | | — | (d) |
| | 2015 - R6 (Commenced July 31, 2015) | | | 13.48 | | | | 0.02 | | | | (2.86 | ) | | | (2.84 | ) | | | (0.04 | ) |
| | 2014 - A | | | 22.54 | | | | (0.13 | ) | | | (6.83 | ) | | | (6.96 | ) | | | — | |
| | 2014 - C | | | 21.85 | | | | (0.26 | ) | | | (6.60 | ) | | | (6.86 | ) | | | — | |
| | 2014 - Institutional | | | 22.69 | | | | (0.04 | ) | | | (6.91 | ) | | | (6.95 | ) | | | (0.02 | ) |
| | 2014 - IR | | | 22.72 | | | | (0.05 | ) | | | (6.93 | ) | | | (6.98 | ) | | | 0.00 | (d) |
| | 2014 - R | | | 22.31 | | | | (0.16 | ) | | | (6.77 | ) | | | (6.93 | ) | | | — | |
| | 2013 - A | | | 22.94 | | | | (0.21 | ) | | | (0.19 | ) | | | (0.40 | ) | | | — | |
| | 2013 - C | | | 22.40 | | | | (0.36 | ) | | | (0.19 | ) | | | (0.55 | ) | | | — | |
| | 2013 - Institutional | | | 23.01 | | | | (0.13 | ) | | | (0.19 | ) | | | (0.32 | ) | | | — | |
| | 2013 - IR | | | 23.06 | | | | (0.15 | ) | | | (0.19 | ) | | | (0.34 | ) | | | — | |
| | 2013 - R | | | 22.76 | | | | (0.25 | ) | | | (0.20 | ) | | | (0.45 | ) | | | — | |
| | 2012 - A | | | 23.53 | | | | (0.14 | ) | | | (0.29 | ) | | | (0.43 | ) | | | (0.16 | ) |
| | 2012 - C | | | 23.12 | | | | (0.32 | ) | | | (0.28 | ) | | | (0.60 | ) | | | (0.12 | ) |
| | 2012 - Institutional | | | 23.56 | | | | (0.07 | ) | | | (0.28 | ) | | | (0.35 | ) | | | (0.20 | ) |
| | 2012 - IR | | | 23.63 | | | | (0.11 | ) | | | (0.28 | ) | | | (0.39 | ) | | | (0.18 | ) |
| | 2012 - R | | | 23.38 | | | | (0.20 | ) | | | (0.27 | ) | | | (0.47 | ) | | | (0.15 | ) |
| | 2011 - A | | | 24.14 | | | | (0.15 | ) | | | 0.02 | | | | (0.13 | ) | | | (0.48 | ) |
| | 2011 - C | | | 23.81 | | | | (0.33 | ) | | | 0.04 | | | | (0.29 | ) | | | (0.40 | ) |
| | 2011 - Institutional | | | 24.15 | | | | (0.07 | ) | | | 0.00 | | | | (0.07 | ) | | | (0.52 | ) |
| | 2011 - IR | | | 24.20 | | | | (0.09 | ) | | | 0.04 | | | | (0.05 | ) | | | (0.52 | ) |
| | 2011 - R | | | 24.03 | | | | (0.21 | ) | | | 0.04 | | | | (0.17 | ) | | | (0.48 | ) |
| | * | | All per share amounts representing data prior to November 6, 2015 have been restated to reflect a 4 to 1 reverse stock split which occurred on that date. |
| | (a) | | Calculated based on the average shares outstanding methodology. |
| | (b) | | Assumes investment at the net asset value at the beginning of the year, reinvestment of all distributions, a complete redemption of the investment at the net asset value at the end of the year and no sales or redemption charges. Total returns would be reduced if a sales or redemption charge was taken into account. Returns do not reflect the deduction of taxes that a shareholder would pay on Fund distributions or the redemption of Fund shares. Total returns for periods less than one full year are not annualized. |
| | (c) | | The Fund’s portfolio turnover rate is calculated in accordance with regulatory requirements, without regard to transactions involving short term investments and certain derivatives. If such transactions were included, the Fund’s portfolio turnover rate may be higher. |
| | (d) | | Amount is less than $0.005 per share. |
| | |
| 98 | | The accompanying notes are an integral part of these financial statements. |
GOLDMAN SACHS COMMODITY STRATEGY FUND
| | | | | | | | | | | | | | | | | | | | | | | | | | | | | | | | | | | | | | | | |
| | | | | | | | | | | | | |
| | | | | | | | | | | | | | | | | | | | | | | | | | | | | | | | | | |
| | | Net asset
value, end
of year | | | | | Total
return(b) | | | | | Net assets,
end of
year
(in 000s) | | | | | Ratio of
net expenses
to average
net assets | | | | | Ratio of
total expenses
to average
net assets | | | | | Ratio of
net investment
income (loss)
to average
net assets | | | | | Portfolio
turnover
rate(c) | |
| | | | | | | | | | | | | | | | | | | | | | | | | | | | | | | | | | | | | | | | |
| | $ | 10.49 | | | | | | (32.43 | )% | | | | $ | 58,901 | | | | | | 0.85 | % | | | | | 0.97 | % | | | | | (0.21 | )% | | | | | 506 | % |
| | | 10.04 | | | | | | (32.95 | ) | | | | | 4,578 | | | | | | 1.60 | | | | | | 1.72 | | | | | | (0.97 | ) | | | | | 506 | |
| | | 10.59 | | | | | | (32.38 | ) | | | | | 544,699 | | | | | | 0.51 | | | | | | 0.63 | | | | | | 0.12 | | | | | | 506 | |
| | | 10.60 | | | | | | (32.15 | ) | | | | | 6,699 | | | | | | 0.60 | | | | | | 0.72 | | | | | | 0.03 | | | | | | 506 | |
| | | 10.35 | | | | | | (32.88 | ) | | | | | 1,963 | | | | | | 1.10 | | | | | | 1.23 | | | | | | (0.44 | ) | | | | | 506 | |
| | | 10.60 | | | | | | (21.23 | ) | | | | | 1,336 | | | | | | 0.51 | (e) | | | | | 0.64 | (e) | | | | | 0.35 | (e) | | | | | 506 | |
| | | 15.58 | | | | | | (31.03 | ) | | | | | 85,200 | | | | | | 0.88 | | | | | | 0.95 | | | | | | (0.59 | ) | | | | | 234 | |
| | | 14.99 | | | | | | (31.32 | ) | | | | | 8,149 | | | | | | 1.62 | | | | | | 1.71 | | | | | | (1.27 | ) | | | | | 234 | |
| | | 15.72 | | | | | | (30.62 | ) | | | | | 764,809 | | | | | | 0.53 | | | | | | 0.62 | | | | | | (0.17 | ) | | | | | 234 | |
| | | 15.74 | | | | | | (30.80 | ) | | | | | 7,740 | | | | | | 0.61 | | | | | | 0.71 | | | | | | (0.24 | ) | | | | | 234 | |
| | | 15.38 | | | | | | (31.00 | ) | | | | | 1,542 | | | | | | 1.12 | | | | | | 1.21 | | | | | | (0.77 | ) | | | | | 234 | |
| | | 22.54 | | | | | | (1.57 | ) | | | | | 401,248 | | | | | | 0.92 | | | | | | 0.95 | | | | | | (0.91 | ) | | | | | 266 | |
| | | 21.85 | | | | | | (2.50 | ) | | | | | 11,444 | | | | | | 1.67 | | | | | | 1.70 | | | | | | (1.64 | ) | | | | | 266 | |
| | | 22.69 | | | | | | (1.39 | ) | | | | | 1,039,008 | | | | | | 0.58 | | | | | | 0.61 | | | | | | (0.56 | ) | | | | | 266 | |
| | | 22.72 | | | | | | (1.39 | ) | | | | | 7,991 | | | | | | 0.67 | | | | | | 0.70 | | | | | | (0.64 | ) | | | | | 266 | |
| | | 22.31 | | | | | | (1.93 | ) | | | | | 1,528 | | | | | | 1.17 | | | | | | 1.20 | | | | | | (1.13 | ) | | | | | 266 | |
| | | 22.94 | | | | | | (1.91 | ) | | | | | 353,082 | | | | | | 0.92 | | | | | | 0.96 | | | | | | (0.59 | ) | | | | | 690 | |
| | | 22.40 | | | | | | (2.64 | ) | | | | | 13,994 | | | | | | 1.67 | | | | | | 1.71 | | | | | | (1.39 | ) | | | | | 690 | |
| | | 23.01 | | | | | | (1.57 | ) | | | | | 742,974 | | | | | | 0.58 | | | | | | 0.62 | | | | | | (0.29 | ) | | | | | 690 | |
| | | 23.06 | | | | | | (1.81 | ) | | | | | 7,045 | | | | | | 0.67 | | | | | | 0.71 | | | | | | (0.45 | ) | | | | | 690 | |
| | | 22.76 | | | | | | (2.14 | ) | | | | | 1,450 | | | | | | 1.17 | | | | | | 1.21 | | | | | | (0.86 | ) | | | | | 690 | |
| | | 23.53 | | | | | | (0.56 | ) | | | | | 205,561 | | | | | | 0.92 | | | | | | 0.95 | | | | | | (0.61 | ) | | | | | 581 | |
| | | 23.12 | | | | | | (1.26 | ) | | | | | 15,273 | | | | | | 1.67 | | | | | | 1.70 | | | | | | (1.36 | ) | | | | | 581 | |
| | | 23.56 | | | | | | (0.41 | ) | | | | | 668,618 | | | | | | 0.58 | | | | | | 0.61 | | | | | | (0.27 | ) | | | | | 581 | |
| | | 23.63 | | | | | | (0.28 | ) | | | | | 19,007 | | | | | | 0.67 | | | | | | 0.70 | | | | | | (0.37 | ) | | | | | 581 | |
| | | 23.38 | | | | | | (0.83 | ) | | | | | 1,063 | | | | | | 1.17 | | | | | | 1.20 | | | | | | (0.87 | ) | | | | | 581 | |
| | |
| The accompanying notes are an integral part of these financial statements. | | 99 |
GOLDMAN SACHS DYNAMIC ALLOCATION FUND
Financial Highlights
Selected Data for a Share Outstanding Throughout Each Year
| | | | | | | | | | | | | | | | | | | | | | | | | | | | | | |
| | | | | | | | Income (loss) from
investment operations | | | Distributions
to shareholders | |
| | | Year - Share Class | | Net asset
value,
beginning
of year | | | Net
investment
income (loss)(a) | | | Net realized
and unrealized
gain (loss) | | | Total from
investment
operations | | | From net
investment
income | | | From net
realized
gains | | | Total
distributions | |
| FOR THE FISCAL YEARS ENDED DECEMBER 31, | | | | | | | | | | | | | | | | | |
| | 2015 - A | | $ | 10.49 | | | $ | (0.04 | ) | | $ | (0.71 | ) | | $ | (0.75 | ) | | $ | (0.01 | ) | | $ | (0.28 | ) | | $ | (0.29 | ) |
| | 2015 - C | | | 10.15 | | | | (0.11 | ) | | | (0.68 | ) | | | (0.79 | ) | | | — | | | | (0.28 | ) | | | (0.28 | ) |
| | 2015 - Institutional | | | 10.61 | | | | — | (d) | | | (0.72 | ) | | | (0.72 | ) | | | (0.07 | ) | | | (0.28 | ) | | | (0.35 | ) |
| | 2015 - IR | | | 10.57 | | | | (0.01 | ) | | | (0.72 | ) | | | (0.73 | ) | | | (0.04 | ) | | | (0.28 | ) | | | (0.32 | ) |
| | 2015 - R | | | 10.40 | | | | (0.05 | ) | | | (0.71 | ) | | | (0.76 | ) | | | — | | | | (0.28 | ) | | | (0.28 | ) |
| | 2015 - R6 (Commenced July 31, 2015) | | | 10.46 | | | | (0.01 | ) | | | (0.56 | ) | | | (0.57 | ) | | | (0.07 | ) | | | (0.28 | ) | | | (0.35 | ) |
| | 2014 - A | | | 10.89 | | | | (0.08 | ) | | | 0.32 | | | | 0.24 | | | | (0.05 | ) | | | (0.59 | ) | | | (0.64 | ) |
| | 2014 - C | | | 10.60 | | | | (0.15 | ) | | | 0.29 | | | | 0.14 | | | | — | | | | (0.59 | ) | | | (0.59 | ) |
| | 2014 - Institutional | | | 11.02 | | | | (0.03 | ) | | | 0.32 | | | | 0.29 | | | | (0.11 | ) | | | (0.59 | ) | | | (0.70 | ) |
| | 2014 - IR | | | 10.99 | | | | (0.05 | ) | | | 0.31 | | | | 0.26 | | | | (0.09 | ) | | | (0.59 | ) | | | (0.68 | ) |
| | 2014 - R | | | 10.83 | | | | (0.10 | ) | | | 0.30 | | | | 0.20 | | | | (0.04 | ) | | | (0.59 | ) | | | (0.63 | ) |
| | 2013 - A | | | 10.70 | | | | (0.13 | ) | | | 0.68 | | | | 0.55 | | | | — | | | | (0.36 | ) | | | (0.36 | ) |
| | 2013 - C | | | 10.50 | | | | (0.20 | ) | | | 0.66 | | | | 0.46 | | | | — | | | | (0.36 | ) | | | (0.36 | ) |
| | 2013 - Institutional | | | 10.78 | | | | (0.08 | ) | | | 0.68 | | | | 0.60 | | | | — | (d) | | | (0.36 | ) | | | (0.36 | ) |
| | 2013 - IR | | | 10.76 | | | | (0.10 | ) | | | 0.69 | | | | 0.59 | | | | — | | | | (0.36 | ) | | | (0.36 | ) |
| | 2013 - R | | | 10.67 | | | | (0.15 | ) | | | 0.67 | | | | 0.52 | | | | — | | | | (0.36 | ) | | | (0.36 | ) |
| | 2012 - A | | | 10.29 | | | | (0.07 | ) | | | 0.86 | | | | 0.79 | | | | — | | | | (0.38 | ) | | | (0.38 | ) |
| | 2012 - C | | | 10.18 | | | | (0.14 | ) | | | 0.84 | | | | 0.70 | | | | — | | | | (0.38 | ) | | | (0.38 | ) |
| | 2012 - Institutional | | | 10.35 | | | | (0.04 | ) | | | 0.88 | | | | 0.84 | | | | (0.03 | ) | | | (0.38 | ) | | | (0.41 | ) |
| | 2012 - IR | | | 10.33 | | | | (0.03 | ) | | | 0.85 | | | | 0.82 | | | | (0.01 | ) | | | (0.38 | ) | | | (0.39 | ) |
| | 2012 - R | | | 10.28 | | | | (0.09 | ) | | | 0.86 | | | | 0.77 | | | | — | | | | (0.38 | ) | | | (0.38 | ) |
| | 2011 - A | | | 10.54 | | | | (0.03 | ) | | | (0.15 | ) | | | (0.18 | ) | | | (0.04 | ) | | | (0.03 | ) | | | (0.07 | ) |
| | 2011 - C | | | 10.47 | | | | (0.13 | ) | | | (0.12 | ) | | | (0.25 | ) | | | (0.01 | ) | | | (0.03 | ) | | | (0.04 | ) |
| | 2011 - Institutional | | | 10.59 | | | | 0.01 | | | | (0.16 | ) | | | (0.15 | ) | | | (0.06 | ) | | | (0.03 | ) | | | (0.09 | ) |
| | 2011 - IR | | | 10.57 | | | | (0.02 | ) | | | (0.14 | ) | | | (0.16 | ) | | | (0.05 | ) | | | (0.03 | ) | | | (0.08 | ) |
| | 2011 - R | | | 10.52 | | | | (0.05 | ) | | | (0.16 | ) | | | (0.21 | ) | | | — | | | | (0.03 | ) | | | (0.03 | ) |
| | (a) | | Calculated based on the average shares outstanding methodology. |
| | (b) | | Assumes investment at the net asset value at the beginning of the year, reinvestment of all distributions, a complete redemption of the investment at the net asset value at the end of the year and no sales or redemption charges. Total returns would be reduced if a sales or redemption charge was taken into account. Returns do not reflect the deduction of taxes that a shareholder would pay on Fund distributions or the redemption of Fund shares. Total returns for periods less than one full year are not annualized. |
| | (c) | | The Fund’s portfolio turnover rate is calculated in accordance with regulatory requirements, without regard to transactions involving short term investments and certain derivatives. If such transactions were included, the Fund’s portfolio turnover rate may be higher. |
| | (d) | | Amount is less than $0.005 per share. |
| | (e) | | Amount is less than 0.005%. |
| | |
| 100 | | The accompanying notes are an integral part of these financial statements. |
GOLDMAN SACHS DYNAMIC ALLOCATION FUND
| | | | | | | | | | | | | | | | | | | | | | | | | | | | | | | | | | | | | | | | |
| | | | | | | | | | | | | | | | | | | | | | | | | | | | | | | | | | |
| | | Net asset
value, end
of year | | | | | Total
return(b) | | | | | Net assets,
end of
period
(in 000s) | | | | | Ratio of
net expenses
to average
net assets | | | | | Ratio of
total expenses
to average
net assets | | | | | Ratio of
net investment
income (loss)
to average
net assets | | | | | Portfolio
turnover
rate(c) | |
| | | | | | | | | | | | | | | | | | | | | | | | | | | | | | | | | | | | | | | | |
| | $ | 9.45 | | | | | | (7.17 | )% | | | | $ | 43,167 | | | | | | 1.13 | % | | | | | 1.43 | % | | | | | (0.39 | )% | | | | | 241 | % |
| | | 9.08 | | | | | | (7.82 | ) | | | | | 27,914 | | | | | | 1.88 | | | | | | 2.18 | | | | | | (1.14 | ) | | | | | 241 | |
| | | 9.54 | | | | | | (6.84 | ) | | | | | 510,789 | | | | | | 0.73 | | | | | | 1.03 | | | | | | — | (e) | | | | | 241 | |
| | | 9.52 | | | | | | (6.90 | ) | | | | | 9,933 | | | | | | 0.88 | | | | | | 1.18 | | | | | | (0.14 | ) | | | | | 241 | |
| | | 9.36 | | | | | | (7.35 | ) | | | | | 11 | | | | | | 1.33 | | | | | | 1.65 | | | | | | (0.49 | ) | | | | | 241 | |
| | | 9.54 | | | | | | (5.48 | ) | | | | | 9 | | | | | | 0.77 | (f) | | | | | 0.97 | (f) | | | | | (0.21 | )(f) | | | | | 241 | |
| | | 10.49 | | | | | | 2.19 | | | | | | 78,100 | | | | | | 1.23 | | | | | | 1.42 | | | | | | (0.70 | ) | | | | | 211 | |
| | | 10.15 | | | | | | 1.29 | | | | | | 41,299 | | | | | | 1.97 | | | | | | 2.17 | | | | | | (1.42 | ) | | | | | 211 | |
| | | 10.61 | | | | | | 2.61 | | | | | | 645,286 | | | | | | 0.81 | | | | | | 1.02 | | | | | | (0.25 | ) | | | | | 211 | |
| | | 10.57 | | | | | | 2.33 | | | | | | 26,862 | | | | | | 0.97 | | | | | | 1.17 | | | | | | (0.43 | ) | | | | | 211 | |
| | | 10.40 | | | | | | 1.85 | | | | | | 12 | | | | | | 1.49 | | | | | | 1.62 | | | | | | (0.92 | ) | | | | | 211 | |
| | | 10.89 | | | | | | 5.21 | | | | | | 169,197 | | | | | | 1.30 | | | | | | 1.37 | | | | | | (1.18 | ) | | | | | 311 | |
| | | 10.60 | | | | | | 4.45 | | | | | | 66,543 | | | | | | 2.05 | | | | | | 2.12 | | | | | | (1.89 | ) | | | | | 311 | |
| | | 11.02 | | | | | | 5.65 | | | | | | 756,409 | | | | | | 0.90 | | | | | | 0.97 | | | | | | (0.74 | ) | | | | | 311 | |
| | | 10.99 | | | | | | 5.55 | | | | | | 46,709 | | | | | | 1.05 | | | | | | 1.12 | | | | | | (0.88 | ) | | | | | 311 | |
| | | 10.83 | | | | | | 4.94 | | | | | | 12 | | | | | | 1.55 | | | | | | 1.59 | | | | | | (1.40 | ) | | | | | 311 | |
| | | 10.70 | | | | | | 7.66 | | | | | | 291,432 | | | | | | 1.38 | | | | | | 1.38 | | | | | | (0.61 | ) | | | | | 177 | |
| | | 10.50 | | | | | | 6.86 | | | | | | 76,580 | | | | | | 2.13 | | | | | | 2.13 | | | | | | (1.32 | ) | | | | | 177 | |
| | | 10.78 | | | | | | 8.06 | | | | | | 853,273 | | | | | | 0.97 | | | | | | 0.97 | | | | | | (0.37 | ) | | | | | 177 | |
| | | 10.76 | | | | | | 7.89 | | | | | | 59,935 | | | | | | 1.13 | | | | | | 1.14 | | | | | | (0.31 | ) | | | | | 177 | |
| | | 10.67 | | | | | | 7.48 | | | | | | 11 | | | | | | 1.63 | | | | | | 1.64 | | | | | | (0.84 | ) | | | | | 177 | |
| | | 10.29 | | | | | | (1.72 | ) | | | | | 165,877 | | | | | | 1.39 | | | | | | 1.47 | | | | | | (0.32 | ) | | | | | 297 | |
| | | 10.18 | | | | | | (2.43 | ) | | | | | 56,025 | | | | | | 2.14 | | | | | | 2.22 | | | | | | (1.22 | ) | | | | | 297 | |
| | | 10.35 | | | | | | (1.38 | ) | | | | | 199,083 | | | | | | 0.99 | | | | | | 1.07 | | | | | | 0.08 | | | | | | 297 | |
| | | 10.33 | | | | | | (1.47 | ) | | | | | 56,972 | | | | | | 1.14 | | | | | | 1.22 | | | | | | (0.22 | ) | | | | | 297 | |
| | | 10.28 | | | | | | (2.04 | ) | | | | | 10 | | | | | | 1.64 | | | | | | 1.72 | | | | | | (0.49 | ) | | | | | 297 | |
| | |
| The accompanying notes are an integral part of these financial statements. | | 101 |
GOLDMAN SACHS DYNAMIC COMMODITY STRATEGY FUND
Financial Highlights
Selected Data for a Share Outstanding Throughout Each Period
| | | | | | | | | | | | | | | | | | |
| | | | | | | | Income (loss) from
investment operations | |
| | | Year - Share Class | |
Net asset
value,
beginning
of period | | | Net
investment
loss(a) | | | Net realized
and unrealized
loss | | | Total from
investment
operations | |
| | FOR THE FISCAL YEAR ENDED DECEMBER 31, | | | | | | | | | | | | | | | | |
| | 2015 - A | | $ | 7.86 | | | $ | (0.07 | ) | | $ | (1.77 | ) | | $ | (1.84 | ) |
| | 2015 - C | | | 7.82 | | | | (0.13 | ) | | | (1.75 | ) | | | (1.88 | ) |
| | 2015 - Institutional | | | 7.88 | | | | (0.05 | ) | | | (1.78 | ) | | | (1.83 | ) |
| | 2015 - IR | | | 7.87 | | | | (0.06 | ) | | | (1.77 | ) | | | (1.83 | ) |
| | 2015 - R | | | 7.84 | | | | (0.09 | ) | | | (1.76 | ) | | | (1.85 | ) |
| | FOR THE PERIOD ENDED DECEMBER 31, | | | | | | | | | | | | | | | | |
| | 2014 - A (Commenced April 30, 2014) | | | 10.00 | | | | (0.06 | ) | | | (2.08 | ) | | | (2.14 | ) |
| | 2014 - C (Commenced April 30, 2014) | | | 10.00 | | | | (0.12 | ) | | | (2.06 | ) | | | (2.18 | ) |
| | 2014 - Institutional (Commenced April 30, 2014) | | | 10.00 | | | | (0.05 | ) | | | (2.07 | ) | | | (2.12 | ) |
| | 2014 - IR (Commenced April 30, 2014) | | | 10.00 | | | | (0.05 | ) | | | (2.08 | ) | | | (2.13 | ) |
| | 2014 - R (Commenced April 30, 2014) | | | 10.00 | | | | (0.08 | ) | | | (2.08 | ) | | | (2.16 | ) |
| | (a) | | Calculated based on the average shares outstanding methodology. |
| | (b) | | Assumes investment at the net asset value at the beginning of the period, reinvestment of all distributions, a complete redemption of the investment at the net asset value at the end of the period and no sales or redemption charges. Total returns would be reduced if a sales or redemption charge was taken into account. Returns do not reflect the deduction of taxes that a shareholder would pay on Fund distributions or the redemption of Fund shares. Total returns for periods less than one full year are not annualized. |
| | (c) | | The Fund’s portfolio turnover rate is calculated in accordance with regulatory requirements, without regard to transactions involving short term investments and certain derivatives. If such transactions were included, the Fund’s portfolio turnover rate may be higher. |
| | |
| 102 | | The accompanying notes are an integral part of these financial statements. |
GOLDMAN SACHS DYNAMIC COMMODITY STRATEGY FUND
| | | | | | | | | | | | | | | | | | | | | | | | | | | | | | | | | | | | | | | | |
| | | | | | | | | | | | | | | | | | | | | | | | | | | | | | | | | | |
| | | Net asset
value, end
of period | | | | | Total
return(b) | | | | | Net assets,
end of
period
(in 000s) | | | | | Ratio of
net expenses
to average
net assets | | | | | Ratio of
total expenses
to average
net assets | | | | | Ratio of
net investment
loss
to average
net assets | | | | | Portfolio
turnover
rate(c) | |
| | | | | | | | | | | | | | | | | | | | | | | | | | | | | | | | | | | | | | | | |
| | $ | 6.02 | | | | | | (23.54 | )% | | | | $ | 135 | | | | | | 1.06 | % | | | | | 2.68 | % | | | | | (1.02 | )% | | | | | — | % |
| | | 5.94 | | | | | | (24.17 | ) | | | | | 6 | | | | | | 1.82 | | | | | | 3.71 | | | | | | (1.81 | ) | | | | | — | |
| | | 6.05 | | | | | | (23.35 | ) | | | | | 24,045 | | | | | | 0.72 | | | | | | 2.61 | | | | | | (0.70 | ) | | | | | — | |
| | | 6.04 | | | | | | (23.38 | ) | | | | | 15 | | | | | | 0.81 | | | | | | 2.70 | | | | | | (0.80 | ) | | | | | — | |
| | | 5.99 | | | | | | (23.72 | ) | | | | | 15 | | | | | | 1.31 | | | | | | 3.20 | | | | | | (1.30 | ) | | | | | — | |
| | | | | | | | | | | | | | | | | | | | | | | | | | | | | | | | | | | | | | | | |
| | | 7.86 | | | | | | (21.40 | ) | | | | | 53 | | | | | | 1.08 | (d) | | | | | 2.50 | (d) | | | | | (1.07 | )(d) | | | | | — | |
| | | 7.82 | | | | | | (21.80 | ) | | | | | 8 | | | | | | 1.87 | (d) | | | | | 3.48 | (d) | | | | | (1.87 | )(d) | | | | | — | |
| | | 7.88 | | | | | | (21.20 | ) | | | | | 30,649 | | | | | | 0.76 | (d) | | | | | 2.38 | (d) | | | | | (0.76 | )(d) | | | | | — | |
| | | 7.87 | | | | | | (21.30 | ) | | | | | 20 | | | | | | 0.86 | (d) | | | | | 2.47 | (d) | | | | | (0.86 | )(d) | | | | | — | |
| | | 7.84 | | | | | | (21.60 | ) | | | | | 20 | | | | | | 1.36 | (d) | | | | | 2.97 | (d) | | | | | (1.36 | )(d) | | | | | — | |
| | |
| The accompanying notes are an integral part of these financial statements. | | 103 |
GOLDMAN SACHS MANAGED FUTURES STRATEGY FUND
Financial Highlights
Selected Data for a Share Outstanding Throughout Each Period
| | | | | | | | | | | | | | | | | | | | | | | | | | | | | | |
| | | | | | | | Income (loss) from
investment operations | | | Distributions
to shareholders | |
| | | Year - Share Class | |
Net asset
value,
beginning
of period | | | Net
investment
loss(a) | | | Net realized
and unrealized
gain (loss) | | | Total from
investment
operations | | | From net
investment
income | | | From net
realized
gains | | | Total
distributions | |
| | FOR THE FISCAL YEARS ENDED DECEMBER 31, | | | | | | | | | | | | | | | | | |
| | 2015 - A | | $ | 9.67 | | | $ | (0.16 | ) | | $ | 1.10 | | | $ | 0.94 | | | $ | (0.40 | ) | | $ | — | | | $ | (0.40 | ) |
| | 2015 - C | | | 9.45 | | | | (0.23 | ) | | | 1.07 | | | | 0.84 | | | | (0.34 | ) | | | — | | | | (0.34 | ) |
| | 2015 - Institutional | | | 9.77 | | | | (0.12 | ) | | | 1.12 | | | | 1.00 | | | | (0.41 | ) | | | — | | | | (0.41 | ) |
| | 2015 - IR | | | 9.73 | | | | (0.13 | ) | | | 1.11 | | | | 0.98 | | | | (0.41 | ) | | | — | | | | (0.41 | ) |
| | 2015 - R | | | 9.59 | | | | (0.18 | ) | | | 1.09 | | | | 0.91 | | | | (0.38 | ) | | | — | | | | (0.38 | ) |
| | 2014 - A | | | 10.04 | | | | (0.14 | ) | | | (0.14 | ) | | | (0.28 | ) | | | — | | | | (0.09 | ) | | | (0.09 | ) |
| | 2014 - C | | | 9.89 | | | | (0.21 | ) | | | (0.14 | ) | | | (0.35 | ) | | | — | | | | (0.09 | ) | | | (0.09 | ) |
| | 2014 - Institutional | | | 10.11 | | | | (0.11 | ) | | | (0.14 | ) | | | (0.25 | ) | | | — | | | | (0.09 | ) | | | (0.09 | ) |
| | 2014 - IR | | | 10.08 | | | | (0.12 | ) | | | (0.14 | ) | | | (0.26 | ) | | | — | | | | (0.09 | ) | | | (0.09 | ) |
| | 2014 - R | | | 9.99 | | | | (0.17 | ) | | | (0.14 | ) | | | (0.31 | ) | | | — | | | | (0.09 | ) | | | (0.09 | ) |
| | 2013 - A | | | 10.56 | | | | (0.15 | ) | | | (0.37 | ) | | | (0.52 | ) | | | — | | | | — | | | | — | |
| | 2013 - C | | | 10.48 | | | | (0.22 | ) | | | (0.37 | ) | | | (0.59 | ) | | | — | | | | — | | | | — | |
| | 2013 - Institutional | | | 10.59 | | | | (0.11 | ) | | | (0.37 | ) | | | (0.48 | ) | | | — | | | | — | | | | — | |
| | 2013 - IR | | | 10.58 | | | | (0.13 | ) | | | (0.37 | ) | | | (0.50 | ) | | | — | | | | — | | | | — | |
| | 2013 - R | | | 10.53 | | | | (0.17 | ) | | | (0.37 | ) | | | (0.54 | ) | | | — | | | | — | | | | — | |
| | | | | | | | | | | | | | | | | | | | | | | | | | | | | | |
| | FOR THE PERIOD ENDED DECEMBER 31, | |
| | 2012 - A (Commenced February 29, 2012) | | | 10.00 | | | | (0.12 | ) | | | 0.68 | | | | 0.56 | | | | — | | | | — | | | | — | |
| | 2012 - C (Commenced February 29, 2012) | | | 10.00 | | | | (0.19 | ) | | | 0.67 | | | | 0.48 | | | | — | | | | — | | | | — | |
| | 2012 - Institutional (Commenced February 29, 2012) | | | 10.00 | | | | (0.09 | ) | | | 0.68 | | | | 0.59 | | | | — | | | | — | | | | — | |
| | 2012 - IR (Commenced February 29, 2012) | | | 10.00 | | | | (0.10 | ) | | | 0.68 | | | | 0.58 | | | | — | | | | — | | | | — | |
| | 2012 - R (Commenced February 29, 2012) | | | 10.00 | | | | (0.15 | ) | | | 0.68 | | | | 0.53 | | | | — | | | | — | | | | — | |
| | (a) | | Calculated based on the average shares outstanding methodology. |
| | (b) | | Assumes investment at the net asset value at the beginning of the period, reinvestment of all distributions, a complete redemption of the investment at the net asset value at the end of the period and no sales or redemption charges. Total returns would be reduced if a sales or redemption charge was taken into account. Returns do not reflect the deduction of taxes that a shareholder would pay on Fund distributions or the redemption of Fund shares. Total returns for periods less than one full year are not annualized. |
| | (c) | | The Fund’s portfolio turnover rate is calculated in accordance with regulatory requirements, without regard to transactions involving short term investments and certain derivatives. If such transactions were included, the Fund’s portfolio turnover rate may be higher. |
| | |
| 104 | | The accompanying notes are an integral part of these financial statements. |
GOLDMAN SACHS MANAGED FUTURES STRATEGY FUND
| | | | | | | | | | | | | | | | | | | | | | | | | | | | | | | | | | | | | | | | |
| | | | | | | | | | | | | | | | | | | | | | | | | | | | | | | | | | |
| | | Net asset
value, end
of period | | | | | Total
return(b) | | | | | Net assets,
end of
period
(in 000s) | | | | | Ratio of
net expenses
to average
net assets | | | | | Ratio of
total expenses
to average
net assets | | | | | Ratio of
net investment
loss
to average
net assets | | | | | Portfolio
turnover
rate(c) | |
| | | | | | | | | | | | | | | | | | | | | | | | | | | | | | | | | | | | | | | | |
| | $ | 10.21 | | | | | | 9.69 | % | | | | $ | 24,000 | | | | | | 1.56 | % | | | | | 1.84 | % | | | | | (1.53 | )% | | | | | 196 | % |
| | | 9.95 | | | | | | 8.93 | | | | | | 3,056 | | | | | | 2.30 | | | | | | 2.60 | | | | | | (2.28 | ) | | | | | 196 | |
| | | 10.36 | | | | | | 10.24 | | | | | | 87,820 | | | | | | 1.14 | | | | | | 1.46 | | | | | | (1.12 | ) | | | | | 196 | |
| | | 10.30 | | | | | | 10.08 | | | | | | 6,489 | | | | | | 1.31 | | | | | | 1.60 | | | | | | (1.26 | ) | | | | | 196 | |
| | | 10.12 | | | | | | 9.47 | | | | | | 197 | | | | | | 1.79 | | | | | | 2.11 | | | | | | (1.77 | ) | | | | | 196 | |
| | | 9.67 | | | | | | (2.75 | ) | | | | | 2,698 | | | | | | 1.51 | | | | | | 1.96 | | | | | | (1.50 | ) | | | | | 343 | |
| | | 9.45 | | | | | | (3.50 | ) | | | | | 897 | | | | | | 2.26 | | | | | | 2.69 | | | | | | (2.26 | ) | | | | | 343 | |
| | | 9.77 | | | | | | (2.43 | ) | | | | | 88,381 | | | | | | 1.11 | | | | | | 1.54 | | | | | | (1.10 | ) | | | | | 343 | |
| | | 9.73 | | | | | | (2.54 | ) | | | | | 391 | | | | | | 1.26 | | | | | | 1.69 | | | | | | (1.25 | ) | | | | | 343 | |
| | | 9.59 | | | | | | (3.06 | ) | | | | | 85 | | | | | | 1.76 | | | | | | 2.20 | | | | | | (1.75 | ) | | | | | 343 | |
| | | 10.04 | | | | | | (4.83 | ) | | | | | 1,344 | | | | | | 1.46 | | | | | | 2.64 | | | | | | (1.54 | ) | | | | | — | |
| | | 9.89 | | | | | | (5.63 | ) | | | | | 1,536 | | | | | | 2.21 | | | | | | 3.34 | | | | | | (2.28 | ) | | | | | — | |
| | | 10.11 | | | | | | (4.44 | ) | | | | | 106,635 | | | | | | 1.07 | | | | | | 2.18 | | | | | | (1.12 | ) | | | | | — | |
| | | 10.08 | | | | | | (4.64 | ) | | | | | 384 | | | | | | 1.21 | | | | | | 2.32 | | | | | | (1.27 | ) | | | | | — | |
| | | 9.99 | | | | | | (5.13 | ) | | | | | 89 | | | | | | 1.69 | | | | | | 2.82 | | | | | | (1.79 | ) | | | | | — | |
| | | | | | | | | | | | | | | | | | | | | | | | | | | | | | | | | | | | | | | | |
| | | | | | | | | | | | | | | | | | | | | | | | | | | | | | | | | | | | | | | | |
| | | 10.56 | | | | | | 5.50 | | | | | | 272 | | | | | | 1.44 | (d) | | | | | 8.63 | (d) | | | | | (1.47 | )(d) | | | | | — | |
| | | 10.48 | | | | | | 4.80 | | | | | | 339 | | | | | | 2.15 | (d) | | | | | 7.43 | (d) | | | | | (2.18 | )(d) | | | | | — | |
| | | 10.59 | | | | | | 5.80 | | | | | | 19,401 | | | | | | 1.06 | (d) | | | | | 8.04 | (d) | | | | | (1.09 | )(d) | | | | | — | |
| | | 10.58 | | | | | | 5.70 | | | | | | 410 | | | | | | 1.20 | (d) | | | | | 5.65 | (d) | | | | | (1.21 | )(d) | | | | | — | |
| | | 10.53 | | | | | | 5.30 | | | | | | 11 | | | | | | 1.72 | (d) | | | | | 8.98 | (d) | | | | | (1.75 | )(d) | | | | | — | |
| | |
| The accompanying notes are an integral part of these financial statements. | | 105 |
GOLDMAN SACHS GLOBAL REAL ESTATE SECURITIES FUND
Financial Highlights
Selected Data for a Share Outstanding Throughout The Period
| | | | | | | | | | | | | | | | | | | | | | | | | | | | | | |
| | | | | | | | Income from
investment operations | | | Distributions
to shareholders | |
| | | Year - Share Class | |
Net asset
value,
beginning
of period | | | Net
investment
income(a) | | | Net realized
and unrealized
gain | | | Total from
investment
operations | | | From net
investment
income | | | From net
realized
gains | | | Total
distributions | |
| | FOR THE PERIOD ENDED DECEMBER 31, | |
| | 2015 - A (Commenced August 31, 2015) | | $ | 10.00 | | | $ | 0.05 | | | $ | 0.52 | | | $ | 0.57 | | | $ | (0.12 | ) | | $ | (0.01 | ) | | $ | (0.13 | ) |
| | 2015 - C (Commenced August 31, 2015) | | | 10.00 | | | | 0.02 | | | | 0.52 | | | | 0.54 | | | | (0.10 | ) | | | (0.01 | ) | | | (0.11 | ) |
| | 2015 - Institutional (Commenced August 31, 2015) | | | 10.00 | | | | 0.06 | | | | 0.52 | | | | 0.58 | | | | (0.13 | ) | | | (0.01 | ) | | | (0.14 | ) |
| | 2015 - IR (Commenced August 31, 2015) | | | 10.00 | | | | 0.06 | | | | 0.51 | | | | 0.57 | | | | (0.12 | ) | | | (0.01 | ) | | | (0.13 | ) |
| | 2015 - R (Commenced August 31, 2015) | | | 10.00 | | | | 0.04 | | | | 0.52 | | | | 0.56 | | | | (0.11 | ) | | | (0.01 | ) | | | (0.12 | ) |
| | 2015 - R6 (Commenced August 31, 2015) | | | 10.00 | | | | 0.06 | | | | 0.52 | | | | 0.58 | | | | (0.13 | ) | | | (0.01 | ) | | | (0.14 | ) |
| | (a) | | Calculated based on the average shares outstanding methodology. |
| | (b) | | Assumes investment at the net asset value at the beginning of the period, reinvestment of all distributions, a complete redemption of the investment at the net asset value at the end of the period and no sales or redemption charges. Total returns would be reduced if a sales or redemption charge was taken into account. Returns do not reflect the deduction of taxes that a shareholder would pay on Fund distributions or the redemption of Fund shares. Total returns for periods less than one full year are not annualized. |
| | (c) | | The Fund’s portfolio turnover rate is calculated in accordance with regulatory requirements, without regard to transactions involving short term investments. If such transactions were included, the Fund’s portfolio turnover rate may be higher. |
| | |
| 106 | | The accompanying notes are an integral part of these financial statements. |
GOLDMAN SACHS GLOBAL REAL ESTATE SECURITIES FUND
| | | | | | | | | | | | | | | | | | | | | | | | | | | | | | | | | | | | | | | | |
| | | | | | | | | | | | | | | | | | | | | | | | | | | | | | | | | | |
| | | Net asset
value, end
of period | | | | | Total
return(b) | | | | | Net assets,
end of
period
(in 000s) | | | | | Ratio of
net expenses
to average
net assets | | | | | Ratio of
total expenses
to average
net assets | | | | | Ratio of
net investment
income
to average
net assets | | | | | Portfolio
turnover
rate(c) | |
| | | | | | | | | | | | | | | | | | | | | | | | | | | | | | | | | | | | | | | | |
| | $ | 10.44 | | | | | | 5.71 | % | | | | $ | 26 | | | | | | 1.40 | %(d) | | | | | 15.24 | %(d) | | | | | 1.43 | %(d) | | | | | 14 | % |
| | | 10.43 | | | | | | 5.41 | | | | | | 26 | | | | | | 2.15 | (d) | | | | | 16.01 | (d) | | | | | 0.68 | (d) | | | | | 14 | |
| | | 10.44 | | | | | | 5.81 | | | | | | 3,043 | | | | | | 1.00 | (d) | | | | | 14.86 | (d) | | | | | 1.83 | (d) | | | | | 14 | |
| | | 10.44 | | | | | | 5.78 | | | | | | 26 | | | | | | 1.15 | (d) | | | | | 15.02 | (d) | | | | | 1.68 | (d) | | | | | 14 | |
| | | 10.44 | | | | | | 5.65 | | | | | | 26 | | | | | | 1.65 | (d) | | | | | 15.51 | (d) | | | | | 1.18 | (d) | | | | | 14 | |
| | | 10.44 | | | | | | 5.82 | | | | | | 26 | | | | | | 0.97 | (d) | | | | | 14.85 | (d) | | | | | 1.85 | (d) | | | | | 14 | |
| | |
| The accompanying notes are an integral part of these financial statements. | | 107 |
GOLDMAN SACHS INTERNATIONAL REAL ESTATE SECURITIES FUND
Financial Highlights
Selected Data for a Share Outstanding Throughout Each Year
| | | | | | | | | | | | | | | | | | | | | | |
| | | | | | | | Income (loss) from
investment operations | | | | |
| | | Year - Share Class | | Net asset
value,
beginning
of year | | | Net
investment
income(a) | | | Net realized
and unrealized
gain (loss) | | | Total from
investment
operations | | | Distributions
to shareholders
from net
investment
income | |
| | FOR THE FISCAL YEARS ENDED DECEMBER 31, | | | | | | | | | |
| | 2015 - A | | $ | 6.38 | | | $ | 0.10 | | | $ | (0.24 | ) | | $ | (0.14 | ) | | $ | (0.15 | ) |
| | 2015 - C | | | 6.38 | | | | 0.05 | | | | (0.24 | ) | | | (0.19 | ) | | | (0.10 | ) |
| | 2015 - Institutional | | | 6.19 | | | | 0.12 | | | | (0.22 | ) | | | (0.10 | ) | | | (0.18 | ) |
| | 2015 - IR | | | 6.33 | | | | 0.11 | | | | (0.24 | ) | | | (0.13 | ) | | | (0.16 | ) |
| | 2015 - R6 (Commenced July 31, 2015) | | | 6.33 | | | | 0.05 | | | | (0.37 | ) | | | (0.32 | ) | | | (0.10 | ) |
| | 2014 - A | | | 6.54 | | | | 0.21 | (e) | | | (0.14 | ) | | | 0.07 | | | | (0.23 | ) |
| | 2014 - C | | | 6.53 | | | | 0.16 | (e) | | | (0.13 | ) | | | 0.03 | | | | (0.18 | ) |
| | 2014 - Institutional | | | 6.35 | | | | 0.22 | (e) | | | (0.12 | ) | | | 0.10 | | | | (0.26 | ) |
| | 2014 - IR | | | 6.48 | | | | 0.20 | (e) | | | (0.11 | ) | | | 0.09 | | | | (0.24 | ) |
| | 2013 - A | | | 6.46 | | | | 0.15 | (f) | | | 0.22 | | | | 0.37 | | | | (0.29 | ) |
| | 2013 - C | | | 6.46 | | | | 0.11 | (f) | | | 0.20 | | | | 0.31 | | | | (0.24 | ) |
| | 2013 - Institutional | | | 6.29 | | | | 0.18 | (f) | | | 0.20 | | | | 0.38 | | | | (0.32 | ) |
| | 2013 - IR | | | 6.40 | | | | 0.18 | (f) | | | 0.20 | | | | 0.38 | | | | (0.30 | ) |
| | 2012 - A | | | 4.94 | | | | 0.12 | | | | 1.95 | | | | 2.07 | | | | (0.55 | ) |
| | 2012 - C | | | 4.95 | | | | 0.07 | | | | 1.96 | | | | 2.03 | | | | (0.52 | ) |
| | 2012 - Institutional | | | 4.84 | | | | 0.14 | | | | 1.91 | | | | 2.05 | | | | (0.60 | ) |
| | 2012 - IR | | | 4.92 | | | | 0.14 | | | | 1.93 | | | | 2.07 | | | | (0.59 | ) |
| | 2011 - A | | | 6.32 | | | | 0.13 | | | | (1.34 | ) | | | (1.21 | ) | | | (0.17 | ) |
| | 2011 - C | | | 6.34 | | | | 0.08 | | | | (1.35 | ) | | | (1.27 | ) | | | (0.12 | ) |
| | 2011 - Institutional | | | 6.20 | | | | 0.15 | | | | (1.32 | ) | | | (1.17 | ) | | | (0.19 | ) |
| | 2011 - IR | | | 6.30 | | | | 0.15 | | | | (1.35 | ) | | | (1.20 | ) | | | (0.18 | ) |
| | (a) | | Calculated based on the average shares outstanding methodology. |
| | (b) | | Assumes investment at the net asset value at the beginning of the year, reinvestment of all distributions, a complete redemption of the investment at the net asset value at the end of the year and no sales or redemption charges. Total returns would be reduced if a sales or redemption charge was taken into account. Returns do not reflect the deduction of taxes that a shareholder would pay on Fund distributions or the redemption of Fund shares. Total returns for periods less than one full year are not annualized. |
| | (c) | | The Fund’s portfolio turnover rate is calculated in accordance with regulatory requirements, without regard to transactions involving short term investments. If such transactions were included, the Fund’s portfolio turnover rate may be higher. |
| | (e) | | Reflects income recognized from corporate actions which amounted to $0.10 per share and 1.50% of average net assets. |
| | (f) | | Reflects income recognized from special dividends which amounted to $0.04 per share and 0.65% of average net assets. |
| | |
| 108 | | The accompanying notes are an integral part of these financial statements. |
GOLDMAN SACHS INTERNATIONAL REAL ESTATE SECURITIES FUND
| | | | | | | | | | | | | | | | | | | | | | | | | | | | | | | | | | | | | | | | |
| | | | | | | | | | | | | |
| | | | | | | | | | | | | | | | | | | | | | | | | | | | | | | | | | |
| | | Net asset
value, end
of year | | | | | Total
return(b) | | | | | Net assets,
end of
year
(in 000s) | | | | | Ratio of
net expenses
to average
net assets | | | | | Ratio of
total expenses
to average
net assets | | | | | Ratio of
net investment
income
to average
net assets | | | | | Portfolio
turnover
rate(c) | |
| | | | | | | | | | | | | | | | | | | | | | | | | | | | | | | | | | | | | | | | |
| | $ | 6.09 | | | | | | (2.25 | )% | | | | $ | 7,702 | | | | | | 1.41 | % | | | �� | | 1.62 | % | | | | | 1.50 | % | | | | | 45 | % |
| | | 6.09 | | | | | | (3.03 | ) | | | | | 1,622 | | | | | | 2.16 | | | | | | 2.37 | | | | | | 0.76 | | | | | | 45 | |
| | | 5.91 | | | | | | (1.73 | ) | | | | | 333,601 | | | | | | 1.01 | | | | | | 1.22 | | | | | | 1.92 | | | | | | 45 | |
| | | 6.04 | | | | | | (2.04 | ) | | | | | 88 | | | | | | 1.17 | | | | | | 1.37 | | | | | | 1.64 | | | | | | 45 | |
| | | 5.91 | | | | | | (5.03 | ) | | | | | 9 | | | | | | 0.99 | (d) | | | | | 1.15 | (d) | | | | | 1.91 | (d) | | | | | 45 | |
| | | 6.38 | | | | | | 1.05 | | | | | | 10,017 | | | | | | 1.46 | | | | | | 1.61 | | | | | | 3.13 | (e) | | | | | 50 | |
| | | 6.38 | | | | | | 0.44 | | | | | | 1,962 | | | | | | 2.21 | | | | | | 2.36 | | | | | | 2.42 | (e) | | | | | 50 | |
| | | 6.19 | | | | | | 1.53 | | | | | | 379,651 | | | | | | 1.05 | | | | | | 1.21 | | | | | | 3.42 | (e) | | | | | 50 | |
| | | 6.33 | | | | | | 1.38 | | | | | | 193 | | | | | | 1.21 | | | | | | 1.35 | | | | | | 2.98 | (e) | | | | | 50 | |
| | | 6.54 | | | | | | 5.81 | | | | | | 14,542 | | | | | | 1.48 | | | | | | 1.60 | | | | | | 2.24 | (f) | | | | | 45 | |
| | | 6.53 | | | | | | 4.90 | | | | | | 2,514 | | | | | | 2.23 | | | | | | 2.35 | | | | | | 1.65 | (f) | | | | | 45 | |
| | | 6.35 | | | | | | 6.15 | | | | | | 387,178 | | | | | | 1.08 | | | | | | 1.20 | | | | | | 2.79 | (f) | | | | | 45 | |
| | | 6.48 | | | | | | 6.11 | | | | | | 944 | | | | | | 1.23 | | | | | | 1.35 | | | | | | 2.70 | (f) | | | | | 45 | |
| | | 6.46 | | | | | | 42.31 | | | | | | 23,019 | | | | | | 1.52 | | | | | | 1.63 | | | | | | 2.01 | | | | | | 55 | |
| | | 6.46 | | | | | | 41.43 | | | | | | 2,253 | | | | | | 2.27 | | | | | | 2.37 | | | | | | 1.23 | | | | | | 55 | |
| | | 6.29 | | | | | | 42.78 | | | | | | 314,518 | | | | | | 1.12 | | | | | | 1.22 | | | | | | 2.35 | | | | | | 55 | |
| | | 6.40 | | | | | | 42.62 | | | | | | 2,043 | | | | | | 1.27 | | | | | | 1.36 | | | | | | 2.25 | | | | | | 55 | |
| | | 4.94 | | | | | | (19.46 | ) | | | | | 83,295 | | | | | | 1.53 | | | | | | 1.64 | | | | | | 2.15 | | | | | | 67 | |
| | | 4.95 | | | | | | (20.20 | ) | | | | | 1,980 | | | | | | 2.28 | | | | | | 2.39 | | | | | | 1.37 | | | | | | 67 | |
| | | 4.84 | | | | | | (19.14 | ) | | | | | 183,167 | | | | | | 1.13 | | | | | | 1.24 | | | | | | 2.56 | | | | | | 67 | |
| | | 4.92 | | | | | | (19.26 | ) | | | | | 16 | | | | | | 1.28 | | | | | | 1.39 | | | | | | 2.59 | | | | | | 67 | |
| | |
| The accompanying notes are an integral part of these financial statements. | | 109 |
GOLDMAN SACHS REAL ESTATE SECURITIES FUND
Financial Highlights
Selected Data for a Share Outstanding Throughout Each Year
| | | | | | | | | | | | | | | | | | | | | | | | | | | | | | |
| | | | | | | | Income (loss) from
investment operations | | | Distributions
to shareholders | |
| | | Year - Share Class | |
Net asset
value,
beginning
of year | | | Net
investment
income(a) | | | Net realized
and unrealized
gain | | | Total from
investment
operations | | | From net
investment
income | | | From net
realized
gains | | | Total
distributions | |
| | FOR THE FISCAL YEARS ENDED DECEMBER 31, | |
| | 2015 - A | | $ | 19.83 | | | $ | 0.29 | | | $ | 0.30 | | | $ | 0.59 | | | $ | (0.31 | ) | | $ | (0.52 | ) | | $ | (0.83 | ) |
| | 2015 - C | | | 19.32 | | | | 0.14 | | | | 0.30 | | | | 0.44 | | | | (0.21 | ) | | | (0.52 | ) | | | (0.73 | ) |
| | 2015 - Institutional | | | 20.18 | | | | 0.38 | | | | 0.30 | | | | 0.68 | | | | (0.37 | ) | | | (0.52 | ) | | | (0.89 | ) |
| | 2015 - Service | | | 19.94 | | | | 0.27 | | | | 0.32 | | | | 0.59 | | | | (0.30 | ) | | | (0.52 | ) | | | (0.82 | ) |
| | 2015 - IR | | | 19.90 | | | | 0.35 | | | | 0.30 | | | | 0.65 | | | | (0.35 | ) | | | (0.52 | ) | | | (0.87 | ) |
| | 2015 - R | | | 19.73 | | | | 0.27 | | | | 0.27 | | | | 0.54 | | | | (0.28 | ) | | | (0.52 | ) | | | (0.80 | ) |
| | 2015 - R6 (Commenced July 31, 2015) | | | 19.93 | | | | 0.22 | | | | 0.48 | | | | 0.70 | | | | (0.13 | ) | | | (0.52 | ) | | | (0.65 | ) |
| | 2014 - A | | | 15.54 | | | | 0.21 | (e) | | | 4.36 | | | | 4.57 | | | | (0.28 | ) | | | — | | | | (0.28 | ) |
| | 2014 - C | | | 15.18 | | | | 0.07 | (e) | | | 4.25 | | | | 4.32 | | | | (0.18 | ) | | | — | | | | (0.18 | ) |
| | 2014 - Institutional | | | 15.80 | | | | 0.27 | (e) | | | 4.44 | | | | 4.71 | | | | (0.33 | ) | | | — | | | | (0.33 | ) |
| | 2014 - Service | | | 15.63 | | | | 0.18 | (e) | | | 4.39 | | | | 4.57 | | | | (0.26 | ) | | | — | | | | (0.26 | ) |
| | 2014 - IR | | | 15.59 | | | | 0.31 | (e) | | | 4.31 | | | | 4.62 | | | | (0.31 | ) | | | — | | | | (0.31 | ) |
| | 2014 - R | | | 15.48 | | | | 0.19 | (e) | | | 4.31 | | | | 4.50 | | | | (0.25 | ) | | | — | | | | (0.25 | ) |
| | 2013 - A | | | 15.44 | | | | 0.16 | | | | 0.18 | | | | 0.34 | | | | (0.24 | ) | | | — | | | | (0.24 | ) |
| | 2013 - C | | | 15.12 | | | | 0.05 | | | | 0.16 | | | | 0.21 | | | | (0.15 | ) | | | — | | | | (0.15 | ) |
| | 2013 - Institutional | | | 15.68 | | | | 0.24 | | | | 0.17 | | | | 0.41 | | | | (0.29 | ) | | | — | | | | (0.29 | ) |
| | 2013 - Service | | | 15.53 | | | | 0.14 | | | | 0.18 | | | | 0.32 | | | | (0.22 | ) | | | — | | | | (0.22 | ) |
| | 2013 - IR | | | 15.49 | | | | 0.22 | | | | 0.15 | | | | 0.37 | | | | (0.27 | ) | | | — | | | | (0.27 | ) |
| | 2013 - R | | | 15.39 | | | | 0.14 | | | | 0.16 | | | | 0.30 | | | | (0.21 | ) | | | — | | | | (0.21 | ) |
| | 2012 - A | | | 13.48 | | | | 0.12 | | | | 2.05 | | | | 2.17 | | | | (0.21 | ) | | | — | | | | (0.21 | ) |
| | 2012 - C | | | 13.22 | | | | 0.04 | | | | 1.99 | | | | 2.03 | | | | (0.13 | ) | | | — | | | | (0.13 | ) |
| | 2012 - Institutional | | | 13.67 | | | | 0.21 | | | | 2.05 | | | | 2.26 | | | | (0.25 | ) | | | — | | | | (0.25 | ) |
| | 2012 - Service | | | 13.57 | | | | 0.14 | | | | 2.02 | | | | 2.16 | | | | (0.20 | ) | | | — | | | | (0.20 | ) |
| | 2012 - IR | | | 13.51 | | | | 0.19 | | | | 2.03 | | | | 2.22 | | | | (0.24 | ) | | | — | | | | (0.24 | ) |
| | 2012 - R | | | 13.45 | | | | 0.13 | | | | 2.00 | | | | 2.13 | | | | (0.19 | ) | | | — | | | | (0.19 | ) |
| | 2011 - A | | | 12.47 | | | | 0.13 | | | | 1.08 | | | | 1.21 | | | | (0.20 | ) | | | — | | | | (0.20 | ) |
| | 2011 - C | | | 12.26 | | | | 0.03 | | | | 1.06 | | | | 1.09 | | | | (0.13 | ) | | | — | | | | (0.13 | ) |
| | 2011 - Institutional | | | 12.62 | | | | 0.18 | | | | 1.11 | | | | 1.29 | | | | (0.24 | ) | | | — | | | | (0.24 | ) |
| | 2011 - Service | | | 12.55 | | | | 0.11 | | | | 1.10 | | | | 1.21 | | | | (0.19 | ) | | | — | | | | (0.19 | ) |
| | 2011 - IR | | | 12.50 | | | | 0.20 | | | | 1.04 | | | | 1.24 | | | | (0.23 | ) | | �� | — | | | | (0.23 | ) |
| | 2011 - R | | | 12.44 | | | | 0.10 | | | | 1.08 | | | | 1.18 | | | | (0.17 | ) | | | — | | | | (0.17 | ) |
| | (a) | | Calculated based on the average shares outstanding methodology. |
| | (b) | | Assumes investment at the net asset value at the beginning of the year, reinvestment of all distributions, a complete redemption of the investment at the net asset value at the end of the year and no sales or redemption charges. Total returns would be reduced if a sales or redemption charge was taken into account. Returns do not reflect the deduction of taxes that a shareholder would pay on Fund distributions or the redemption of Fund shares. Total returns for periods less than one full year are not annualized. |
| | (c) | | The Fund’s portfolio turnover rate is calculated in accordance with regulatory requirements, without regard to transactions involving short term investments and certain derivatives. If such transactions were included, the Fund’s portfolio turnover rate may be higher. |
| | (e) | | Reflects income recognized from special dividends which amounted to $0.07 per share and 0.37% of average net assets. |
| | |
| 110 | | The accompanying notes are an integral part of these financial statements. |
GOLDMAN SACHS REAL ESTATE SECURITIES FUND
| | | | | | | | | | | | | | | | | | | | | | | | | | | | | | | | | | | | | | | | |
| | | | | | | | | | | | | | | | | | | | | | | | | | | | | | | | | | |
| | | Net asset
value, end
of year | | | | | Total
return(b) | | | | | Net assets,
end of
year
(in 000s) | | | | | Ratio of
net expenses
to average
net assets | | | | | Ratio of
total expenses
to average
net assets | | | | | Ratio of
net investment
income
to average
net assets | | | | | Portfolio
turnover
rate(c) | |
| | | | | | | | | | | | | | | | | | | | | | | | | | | | | | | | | | | | | | | | |
| | $ | 19.59 | | | | | | 3.14 | % | | | | $ | 57,936 | | | | | | 1.26 | % | | | | | 1.51 | % | | | | | 1.44 | % | | | | | 41 | % |
| | | 19.03 | | | | | | 2.39 | | | | | | 15,056 | | | | | | 2.01 | | | | | | 2.26 | | | | | | 0.73 | | | | | | 41 | |
| | | 19.97 | | | | | | 3.56 | | | | | | 463,105 | | | | | | 0.86 | | | | | | 1.11 | | | | | | 1.88 | | | | | | 41 | |
| | | 19.71 | | | | | | 3.09 | | | | | | 2,744 | | | | | | 1.36 | | | | | | 1.61 | | | | | | 1.35 | | | | | | 41 | |
| | | 19.68 | | | | | | 3.44 | | | | | | 7,283 | | | | | | 1.01 | | | | | | 1.26 | | | | | | 1.77 | | | | | | 41 | |
| | | 19.47 | | | | | | 2.89 | | | | | | 3,149 | | | | | | 1.50 | | | | | | 1.77 | | | | | | 1.38 | | | | | | 41 | |
| | | 19.98 | | | | | | 3.64 | | | | | | 10 | | | | | | 0.91 | (d) | | | | | 1.07 | (d) | | | | | 2.65 | (d) | | | | | 41 | |
| | | 19.83 | | | | | | 29.63 | | | | | | 73,103 | | | | | | 1.39 | | | | | | 1.52 | | | | | | 1.15 | (e) | | | | | 52 | |
| | | 19.32 | | | | | | 28.64 | | | | | | 16,497 | | | | | | 2.14 | | | | | | 2.26 | | | | | | 0.39 | (e) | | | | | 52 | |
| | | 20.18 | | | | | | 30.10 | | | | | | 502,407 | | | | | | 0.99 | | | | | | 1.11 | | | | | | 1.49 | (e) | | | | | 52 | |
| | | 19.94 | | | | | | 29.49 | | | | | | 3,527 | | | | | | 1.49 | | | | | | 1.61 | | | | | | 0.98 | (e) | | | | | 52 | |
| | | 19.90 | | | | | | 29.94 | | | | | | 6,900 | | | | | | 1.14 | | | | | | 1.27 | | | | | | 1.70 | (e) | | | | | 52 | |
| | | 19.73 | | | | | | 29.29 | | | | | | 1,877 | | | | | | 1.64 | | | | | | 1.77 | | | | | | 1.05 | (e) | | | | | 52 | |
| | | 15.54 | | | | | | 2.13 | | | | | | 51,599 | | | | | | 1.41 | | | | | | 1.51 | | | | | | 0.99 | | | | | | 61 | |
| | | 15.18 | | | | | | 1.35 | | | | | | 12,375 | | | | | | 2.16 | | | | | | 2.26 | | | | | | 0.29 | | | | | | 61 | |
| | | 15.80 | | | | | | 2.54 | | | | | | 419,564 | | | | | | 1.01 | | | | | | 1.11 | | | | | | 1.46 | | | | | | 61 | |
| | | 15.63 | | | | | | 2.03 | | | | | | 3,342 | | | | | | 1.51 | | | | | | 1.61 | | | | | | 0.88 | | | | | | 61 | |
| | | 15.59 | | | | | | 2.33 | | | | | | 808 | | | | | | 1.16 | | | | | | 1.26 | | | | | | 1.33 | | | | | | 61 | |
| | | 15.48 | | | | | | 1.90 | | | | | | 802 | | | | | | 1.66 | | | | | | 1.76 | | | | | | 0.90 | | | | | | 61 | |
| | | 15.44 | | | | | | 16.11 | | | | | | 63,171 | | | | | | 1.44 | | | | | | 1.51 | | | | | | 0.80 | | | | | | 40 | |
| | | 15.12 | | | | | | 15.34 | | | | | | 12,403 | | | | | | 2.19 | | | | | | 2.26 | | | | | | 0.25 | | | | | | 40 | |
| | | 15.68 | | | | | | 16.59 | | | | | | 381,641 | | | | | | 1.04 | | | | | | 1.11 | | | | | | 1.40 | | | | | | 40 | |
| | | 15.53 | | | | | | 15.93 | | | | | | 4,694 | | | | | | 1.54 | | | | | | 1.61 | | | | | | 0.91 | | | | | | 40 | |
| | | 15.49 | | | | | | 16.45 | | | | | | 540 | | | | | | 1.19 | | | | | | 1.26 | | | | | | 1.26 | | | | | | 40 | |
| | | 15.39 | | | | | | 15.90 | | | | | | 521 | | | | | | 1.69 | | | | | | 1.76 | | | | | | 0.88 | | | | | | 40 | |
| | | 13.48 | | | | | | 9.79 | | | | | | 166,917 | | | | | | 1.44 | | | | | | 1.51 | | | | | | 0.98 | | | | | | 46 | |
| | | 13.22 | | | | | | 8.91 | | | | | | 10,954 | | | | | | 2.19 | | | | | | 2.26 | | | | | | 0.22 | | | | | | 46 | |
| | | 13.67 | | | | | | 10.32 | | | | | | 402,103 | | | | | | 1.04 | | | | | | 1.11 | | | | | | 1.38 | | | | | | 46 | |
| | | 13.57 | | | | | | 9.71 | | | | | | 4,670 | | | | | | 1.54 | | | | | | 1.61 | | | | | | 0.83 | | | | | | 46 | |
| | | 13.51 | | | | | | 9.99 | | | | | | 443 | | | | | | 1.19 | | | | | | 1.26 | | | | | | 1.57 | | | | | | 46 | |
| | | 13.45 | | | | | | 9.51 | | | | | | 245 | | | | | | 1.69 | | | | | | 1.76 | | | | | | 0.74 | | | | | | 46 | |
| | |
| The accompanying notes are an integral part of these financial statements. | | 111 |
GOLDMAN SACHS SELECT SATELLITE FUNDS
Notes to Financial Statements
December 31, 2015
Goldman Sachs Trust (the “Trust”) is a Delaware statutory trust registered under the Investment Company Act of 1940, as amended (the “Act”), as an open-end management investment company. The following table lists those series of the Trust that are included in this report (collectively, the “Funds” or individually a “Fund”), along with their corresponding share classes and respective diversification status under the Act:
| | | | |
| Fund | | Share Classes Offered | | Diversified/
Non-diversified |
Absolute Return Tracker | | A, C, Institutional, IR, R and R6 | | Diversified |
Commodity Strategy and Dynamic Allocation | | A, C, Institutional, IR, R and R6 | | Non-diversified |
Dynamic Commodity Strategy and Managed Futures Strategy | | A, C, Institutional, IR and R | | Non-diversified |
Global Real Estate Securities (commenced August 31, 2015) | | A, C, Institutional, IR, R and R6 | | Non-diversified |
International Real Estate Securities | | A, C, Institutional, IR and R6 | | Non-diversified |
Real Estate Securities | | A, C, Institutional, Service, IR, R and R6 | | Non-diversified |
Class A Shares of the Absolute Return Tracker, Dynamic Allocation, Managed Futures Strategy, Global Real Estate Securities, International Real Estate Securities, and Real Estate Securities Funds are sold with a front-end sales charge of up to 5.50%. Class A Shares of the Commodity Strategy and Dynamic Commodity Strategy Funds are sold with a front-end sales charge of up to 4.50%. Class C Shares are sold with a contingent deferred sales charge (“CDSC”) of 1.00%, which is imposed on redemptions made within 12 months of purchase. Institutional, Service, Class IR, Class R and Class R6 Shares are not subject to a sales charge.
Goldman Sachs Asset Management, L.P. (“GSAM”), an affiliate of Goldman, Sachs & Co. (“Goldman Sachs”), serves as Investment Adviser to the Funds pursuant to management agreements (the “Agreements”) with the Trust.
On October 15, 2015 the Board of Trustees (“Trustees”) of the Commodity Strategy Fund approved a 4-for-1 reverse stock split effective at the close of business on November 6, 2015. The stock split had no impact on the overall value of a shareholder’s investment in the Fund.
|
| 2. SIGNIFICANT ACCOUNTING POLICIES |
The financial statements have been prepared in accordance with accounting principles generally accepted in the United States of America (“GAAP”) and require management to make estimates and assumptions that may affect the reported amounts and disclosures. Actual results may differ from those estimates and assumptions.
A. Basis for Consolidation for Absolute Return Tracker, Commodity Strategy, Dynamic Allocation and Dynamic Commodity Strategy Funds — Cayman Commodity-ART, Ltd. (formerly Goldman Sachs Cayman Commodity-ART Fund, Ltd.), Cayman Commodity-CSF, Ltd. (formerly Goldman Sachs Cayman Commodity Fund, Ltd.), Cayman Commodity-DAF, Ltd. (formerly Goldman Sachs Cayman Commodity-DAF Fund, Ltd.) and Cayman Commodity-DCS, Ltd. (formerly Goldman Sachs DCS Cayman Commodity Fund, Ltd.) (each a “Subsidiary” and collectively, the “Subsidiaries”), Cayman Islands exempted companies, were incorporated on September 11, 2013, April 2, 2009, September 11, 2014 and March 10, 2014, respectively and are currently wholly-owned subsidiaries of the Absolute Return Tracker, Commodity Strategy, Dynamic Allocation and Dynamic Commodity Strategy Funds, respectively. The Subsidiaries act as investment vehicles for the Funds to enable the Funds to gain exposure to certain types of commodity-linked derivative instruments. The Funds are the sole shareholders of the Subsidiaries pursuant to subscription agreements dated as of June 20, 2014, June 17, 2009, November 17, 2014 and April 30, 2014, respectively, and it is intended that each Fund will remain the sole shareholder and will continue to control its respective Subsidiary. Under the Memorandum Articles of Association of each Subsidiary, shares issued by the Subsidiary confer upon a shareholder the right to vote
112
GOLDMAN SACHS SELECT SATELLITE FUNDS
|
| 2. SIGNIFICANT ACCOUNTING POLICIES (continued) |
at general meetings of the Subsidiary and certain rights in connection with any winding-up or repayment of capital, as well as the right to participate in the profits or assets of the Subsidiary. All inter-fund balances and transactions have been eliminated in consolidation.
As of December 31, 2015, the Fund and Subsidiary net assets were as follows:
| | | | | | | | | | | | | | |
| Fund | | | | Fund Net Assets | | | Subsidiary Net Assets | | | % Represented by
Subsidiary’s Net Assets | |
Absolute Return Tracker | | | | $ | 1,183,672,880 | | | $ | 29,898,367 | | | | 3 | % |
Commodity Strategy | | | | | 618,175,447 | | | | 110,860,214 | | | | 18 | |
Dynamic Allocation | | | | | 591,823,244 | | | | 9,028,327 | | | | 2 | |
Dynamic Commodity Strategy | | | | | 24,216,121 | | | | 4,460,025 | | | | 18 | |
B. Investment Valuation — The Funds’ valuation policy is to value investments at fair value.
C. Investment Income and Investments — Investment income includes interest income and dividend income, net of any foreign withholding taxes, less any amounts reclaimable. Interest income is accrued daily and adjusted for amortization of premiums and accretion of discounts. Dividend income is recognized on ex-dividend date or, for certain foreign securities, as soon as such information is obtained subsequent to the ex-dividend date. Investment transactions are reflected on trade date. Realized gains and losses are calculated using identified cost. Investment transactions are recorded on the following business day for daily net asset value (“NAV”) calculations. Any foreign capital gains tax is accrued daily based upon net unrealized gains, and is payable upon sale of such investments. Distributions received from the Funds’ investments in United States (“U.S.”) real estate investment trusts (“REITs”) may be characterized as ordinary income, net capital gain or a return of capital. A return of capital is recorded by the Funds as a reduction to the cost basis of the REIT.
For derivative contracts, realized gains and losses are recorded upon settlement of the contract. Upfront payments, if any, are made or received upon entering into a swap agreement and are reflected in the Statement of Assets and Liabilities. Upfront payments are recognized over the contract’s term/event as realized gains or losses, with the exception of forward starting interest rate swaps whose realized gains or losses are recognized from the effective start date. For securities with paydown provisions, principal payments received are treated as a proportionate reduction to the cost basis of the securities, and excess or shortfall amounts are recorded as income. For treasury inflation protected securities (“TIPS”), adjustments to principal due to inflation/deflation are reflected as increases/decreases to interest income with a corresponding adjustment to cost.
D. Class Allocations and Expenses — Investment income, realized and unrealized gain (loss), and non-class specific expenses of each Fund are allocated daily based upon the proportion of net assets of each class. Non-class specific expenses directly incurred by a Fund are charged to that Fund, while such expenses incurred by the Trust are allocated across the applicable Funds on a straight-line and/or pro-rata basis depending upon the nature of the expenses. Class specific expenses, where applicable, are borne by the respective share classes and include Distribution and Service, Transfer Agency and Service and Shareholder Administration fees.
E. Offering and Organization Costs — Offering costs paid in connection with the initial offering of shares of the Global Real Estate Securities Fund and the Dynamic Commodity Strategy Fund are being amortized on a straight-line basis over 12 months from the date of commencement of operations. Organization cost paid in connection with the organization of the Global Real Estate Securities Fund were expensed on the first day of operations.
F. Federal Taxes and Distributions to Shareholders — It is each Fund’s policy to comply with the requirements of the Internal Revenue Code of 1986, as amended (the “Code”), applicable to regulated investment companies (mutual funds) and to distribute each year substantially all of its investment company taxable income and capital gains to its shareholders. Accordingly, the
113
GOLDMAN SACHS SELECT SATELLITE FUNDS
Notes to Financial Statements (continued)
December 31, 2015
|
| 2. SIGNIFICANT ACCOUNTING POLICIES (continued) |
Funds are not required to make any provisions for the payment of federal income tax. Distributions to shareholders are recorded on the ex-dividend date. Income and capital gains distributions, if any, are declared and paid according to the following schedule:
| | | | | | |
| Fund | | | | Income Distributions
Declared/Paid | | Capital Gains Distributions
Declared/Paid |
Absolute Return Tracker, Dynamic Allocation and Managed Futures Strategy | | | | Annually | | Annually |
Global Real Estate Securities and Real Estate Securities | | | | Quarterly | | Annually |
Commodity Strategy, Dynamic Commodity Strategy and International Real Estate Securities | | | | Semi-Annually | | Annually |
Net capital losses are carried forward to future fiscal years and may be used to the extent allowed by the Code to offset any future capital gains. Utilization of capital loss carryforwards will reduce the requirement of future capital gains distributions.
The Subsidiaries are classified as controlled foreign corporations under the Code. Therefore, the Absolute Return Tracker, Commodity Strategy, Dynamic Allocation and Dynamic Commodity Strategy Funds are required to increase their taxable income by their share of their Subsidiary’s income. Net losses of a Subsidiary cannot be deducted by the Funds in the current period nor carried forward to offset taxable income in future periods.
Under the Regulated Investment Company Modernization Act of 2010, the Funds are permitted to carry forward capital losses incurred in taxable years beginning after December 22, 2010 for an unlimited period. However, any losses incurred during those future taxable years will be required to be utilized prior to the losses incurred in pre-enactment taxable years. As a result of this ordering rule, pre-enactment capital loss carryforwards may be more likely to expire unused. Additionally, post-enactment capital losses that are carried forward will retain their character as either short-term or long-term capital losses rather than being considered all short-term as under previous law.
The characterization of distributions to shareholders for financial reporting purposes is determined in accordance with federal income tax rules, which may differ from GAAP. The source of each Fund’s distributions may be shown in the accompanying financial statements as either from net investment income, net realized gain or capital. Certain components of the Funds’ net assets on the Statements of Assets and Liabilities reflect permanent GAAP/tax differences based on the appropriate tax character.
G. Foreign Currency Translation — The accounting records and reporting currency of the Funds are maintained in U.S. dollars. Assets and liabilities denominated in foreign currencies are translated into U.S. dollars using the current exchange rates at the close of each business day. The effect of changes in foreign currency exchange rates on investments is included within net realized and unrealized gain (loss) on investments. Changes in the value of other assets and liabilities as a result of fluctuations in foreign exchange rates are included in the Statements of Operations within net change in unrealized gain (loss) on foreign currency translations. Transactions denominated in foreign currencies are translated into U.S. dollars on the date the transaction occurred, the effects of which are included within net realized gain (loss) on foreign currency transactions.
|
| 3. INVESTMENTS AND FAIR VALUE MEASUREMENTS |
The fair value of a financial instrument is the amount that would be received to sell an asset or paid to transfer a liability in an orderly transaction between market participants at the measurement date (i.e., the exit price). GAAP establishes a fair value hierarchy that prioritizes the inputs to valuation techniques used to measure fair value. The hierarchy gives the highest priority to unadjusted quoted prices in active markets for identical assets or liabilities (Level 1 measurements) and the lowest priority to unobservable inputs (Level 3 measurements). The levels used for classifying investments are not necessarily an indication of the risk associated with investing in these investments. The three levels of the fair value hierarchy are described below:
Level 1 — Unadjusted quoted prices in active markets that are accessible at the measurement date for identical, unrestricted assets or liabilities;
114
GOLDMAN SACHS SELECT SATELLITE FUNDS
|
| 3. INVESTMENTS AND FAIR VALUE MEASUREMENTS (continued) |
Level 2 — Quoted prices in markets that are not active or financial instruments for which significant inputs are observable (including, but not limited to, quoted prices for similar investments, interest rates, foreign exchange rates, volatility and credit spreads), either directly or indirectly;
Level 3 — Prices or valuations that require significant unobservable inputs (including GSAM’s assumptions in determining fair value measurement).
Changes in valuation techniques may result in transfers into or out of an assigned level within the hierarchy. In accordance with the Funds’ policy, transfers between different levels of the fair value hierarchy resulting from such changes are deemed to have occurred as of the beginning of the reporting period.
The Trustees have approved Valuation Procedures that govern the valuation of the portfolio investments held by the Funds, including investments for which market quotations are not readily available. The Trustees have delegated to GSAM day-to-day responsibility for implementing and maintaining internal controls and procedures related to the valuation of the Funds’ portfolio investments. To assess the continuing appropriateness of pricing sources and methodologies, GSAM regularly performs price verification procedures and issues challenges as necessary to third party pricing vendors or brokers, and any differences are reviewed in accordance with the Valuation Procedures.
A. Level 1 and Level 2 Fair Value Investments — The valuation techniques and significant inputs used in determining the fair values for investments classified as Level 1 and Level 2 are as follows:
Equity Securities — Equity securities traded on a U.S. securities exchange or the NASDAQ system, or those located on certain foreign exchanges, including but not limited to the Americas, are valued daily at their last sale price or official closing price on the principal exchange or system on which they are traded. If there is no sale or official closing price or such price is believed by GSAM to not represent fair value, equity securities are valued at the last bid price for long positions and at the last ask price for short positions. To the extent these investments are actively traded, they are classified as Level 1 of the fair value hierarchy, otherwise they are generally classified as Level 2.
Unlisted equity securities for which market quotations are available are valued at the last sale price on the valuation date, or if no sale occurs, at the last bid price. Securities traded on certain foreign securities exchanges are valued daily at fair value determined by an independent fair value service (if available) under Valuation Procedures approved by the Trustees and consistent with applicable regulatory guidance. The independent fair value service takes into account multiple factors including, but not limited to, movements in the securities markets, certain depositary receipts, futures contracts and foreign currency exchange rates that have occurred subsequent to the close of the foreign securities exchange. These investments are generally classified as Level 2 of the fair value hierarchy.
Underlying Funds (including Money Market Funds) — Underlying Funds (“Underlying Funds”) include other investment companies and exchange traded funds (“ETFs”). Investments in Underlying Funds (except ETFs) are valued at the NAV per share of the Institutional Share class (the FST Share class for Money Market Funds) on the day of valuation. ETFs are valued daily at the last sale price or official closing price on the principal exchange or system on which the investment is traded. Because the Funds invest in Underlying Funds that fluctuate in value, the Funds’ shares will correspondingly fluctuate in value. To the extent these investments are actively traded, they are classified as Level 1 of the fair value hierarchy, otherwise they are generally classified as Level 2. For information regarding an Underlying Fund’s accounting policies and investment holdings, please see the Underlying Fund’s shareholder report.
Debt Securities — Debt securities for which market quotations are readily available are valued daily on the basis of quotations supplied by dealers or an independent pricing service approved by the Trustees. The pricing services may use valuation models or matrix pricing, which consider: (i) yield or price with respect to bonds that are considered comparable in characteristics such as rating, interest rate and maturity date or (ii) quotations from securities dealers to determine current value. Short-term debt obligations that mature in sixty days or less and that do not exhibit signs of credit deterioration are valued at amortized cost, which approximates fair value. With the exception of treasury securities of G8 countries (not held in money market funds), which are generally classified as Level 1, these investments are generally classified as Level 2 of the fair value hierarchy.
115
GOLDMAN SACHS SELECT SATELLITE FUNDS
Notes to Financial Statements (continued)
December 31, 2015
|
| 3. INVESTMENTS AND FAIR VALUE MEASUREMENTS (continued) |
i. Commodity Index-Linked Structured Notes — The value of a commodity index-linked structured note is based on the price movements of a commodity index. The value of these notes will rise and fall in response to changes in the underlying commodity index. These notes are often leveraged, increasing the volatility of each note’s value relative to the change in the underlying linked index. Commodity index-linked investments may be more volatile and less liquid than the underlying index, and their value may be affected by the performance of commodities as well as other factors including liquidity, quality, maturity and other economic variables. These notes are subject to prepayment, credit and interest rate risks. These notes have an automatic redemption feature if the underlying index declines from the purchase date by the amount specified in the agreement. A Fund has the option to request prepayment from the issuer at any time. Interim payments received (paid) are recorded as net realized gains (losses), and at maturity, or when a structured note is sold, a Fund records a realized gain or loss.
ii. Mortgage-Backed and Asset-Backed Securities — Mortgage-backed securities represent direct or indirect participations in, or are collateralized by and payable from, mortgage loans secured by residential and/or commercial real estate property. Asset-backed securities include securities whose principal and interest payments are collateralized by pools of other assets or receivables. The value of certain mortgage-backed and asset-backed securities (including adjustable rate mortgage loans) may be particularly sensitive to changes in prevailing interest rates. The value of these securities may also fluctuate in response to the market’s perception of the creditworthiness of the issuers.
Asset-backed securities may present credit risks that are not presented by mortgage-backed securities because they generally do not have the benefit of a security interest in collateral that is comparable to mortgage assets. Some asset-backed securities may only have a subordinated claim on collateral.
Stripped mortgage-backed securities are usually structured with two different classes: one that receives substantially all interest payments (interest-only, or “IO” and/or high coupon rate with relatively low principal amount, or “IOette”), and the other that receives substantially all principal payments (principal-only, or “PO”) from a pool of mortgage loans. Little to no principal will be received at the maturity of an IO; as a result, periodic adjustments are recorded to reduce the cost of the security until maturity. These adjustments are included in interest income.
iii. Mortgage Dollar Rolls — Mortgage dollar rolls are transactions whereby a Fund sells mortgage-backed securities and simultaneously contracts with the same counterparty to repurchase similar securities on a specified future date. During the settlement period, a Fund will not be entitled to accrue interest and receive principal payments on the securities sold. The Funds account for mortgage dollar roll transactions as purchases and sales and realize gains and losses on these transactions.
iv. Treasury Inflation Protected Securities — TIPS are treasury securities in which the principal amount is adjusted daily to keep pace with inflation, as measured by the U.S. Consumer Pricing Index for Urban Consumers. The repayment of the original bond principal upon maturity is guaranteed by the full faith and credit of the U.S. Government.
v. When-Issued Securities and Forward Commitments — When-issued securities, including TBA (“To Be Announced”) securities, are securities that are authorized but not yet issued in the market and purchased in order to secure what is considered to be an advantageous price or yield to a Fund. A forward commitment involves entering into a contract to purchase or sell securities, typically on an extended settlement basis, for a fixed price at a future date. The purchase of securities on a when-issued or forward commitment basis involves a risk of loss if the value of the security to be purchased declines before the settlement date. Conversely, the sale of securities on a forward commitment basis involves the risk that the value of the securities sold may increase before the settlement date. Although a Fund will generally purchase securities on a when-issued or forward commitment basis with the intention of acquiring the securities for its portfolio, the Fund may dispose of when-issued securities or forward commitments prior to settlement which may result in a realized gain or loss.
Derivative Contracts — A derivative is an instrument whose value is derived from underlying assets, indices, reference rates or a combination of these factors. The Funds enter into derivative transactions to hedge against changes in interest rates, securities prices, and/or currency exchange rates, to increase total return, or to gain access to certain markets or attain exposure to other underliers.
116
GOLDMAN SACHS SELECT SATELLITE FUNDS
|
| 3. INVESTMENTS AND FAIR VALUE MEASUREMENTS (continued) |
Exchange-traded derivatives, including futures and options contracts, are valued at the last sale or settlement price and typically fall within Level 1 of the fair value hierarchy. Over-the-counter (“OTC”) and centrally cleared derivatives are valued using market transactions and other market evidence, including market-based inputs to models, calibration to market-clearing transactions, broker or dealer quotations, or other alternative pricing sources. Where models are used, the selection of a particular model to value OTC and centrally cleared derivatives depends upon the contractual terms of, and specific risks inherent in, the instrument, as well as the availability of pricing information in the market. Valuation models require a variety of inputs, including contractual terms, market prices, yield curves, credit curves, measures of volatility, voluntary and involuntary prepayment rates, loss severity rates and correlations of such inputs. For OTC and centrally cleared derivatives that trade in liquid markets, model inputs can generally be verified and model selection does not involve significant management judgment. OTC and centrally cleared derivatives are classified within Level 2 of the fair value hierarchy when significant inputs are corroborated by market evidence.
i. Forward Contracts — A forward contract is a contract between two parties to buy or sell an asset at a specified price on a future date. A forward contract settlement can occur on a cash or delivery basis. Forward contracts are marked-to-market daily using independent vendor prices, and the change in value, if any, is recorded as an unrealized gain or loss. Cash and certain investments may be used to collateralize forward contracts.
A forward foreign currency contract is a forward contract in which a Fund agrees to receive or deliver a fixed quantity of one currency for another, at a pre-determined price at a future date. All forward foreign currency exchange contracts are marked-to-market daily at the applicable forward rate. Non-deliverable forward foreign currency exchange contracts are settled with the counterparty in cash without the delivery of foreign currency.
ii. Futures Contracts — Futures contracts are contracts to buy or sell a standardized quantity of a specified commodity or security and are valued based on exchanged settlement prices or independent market quotes. Futures contracts are valued at the last settlement price, or in the absence of a sale, the last bid price for long positions and at the last ask price for short positions, at the end of each day on the board of trade or exchange upon which they are traded. Upon entering into a futures contract, a Fund deposits cash or securities in an account on behalf of the broker in an amount sufficient to meet the initial margin requirement. Subsequent payments are made or received by a Fund equal to the daily change in the contract value and are recorded as variation margin receivable or payable with a corresponding offset to unrealized gains or losses.
iii. Options — When a Fund writes call or put options, an amount equal to the premium received is recorded as a liability and is subsequently marked-to-market to reflect the current value of the option written. Swaptions are options on interest rate swap contracts.
Upon the purchase of a call option or a put option by a Fund, the premium paid is recorded as an investment and subsequently marked-to-market to reflect the current value of the option. Certain options may be purchased with premiums to be determined on a future date. The premiums for these options are based upon implied volatility parameters at specified terms.
iv. Swap Contracts — Bilateral swap contracts are agreements in which a Fund and a counterparty agree to exchange periodic payments on a specified notional amount or make a net payment upon termination. Bilateral swap transactions are privately negotiated in the OTC market and payments are settled through direct payments between a Fund and the counterparty. By contrast, certain swap transactions are subject to mandatory central clearing. These swaps are executed through a derivatives clearing member (“DCM”), acting in an agency capacity, and submitted to a central counterparty (“CCP”)(“centrally cleared swaps”), in which case all payments are settled with the CCP through the DCM. Swaps are marked-to-market daily using pricing vendor quotations, counterparty or clearinghouse prices or model prices, and the change in value, if any, is recorded as an unrealized gain or loss. Upon entering into a swap contract, a Fund is required to satisfy an initial margin requirement by delivering cash or securities to the counterparty (or in some cases, segregated in a triparty account on behalf of the counterparty), which can be adjusted by any mark-to-market gains or losses pursuant to bilateral or centrally cleared arrangements. For centrally cleared swaps the daily change in valuation, if any, is recorded as a receivable or payable for variation margin.
117
GOLDMAN SACHS SELECT SATELLITE FUNDS
Notes to Financial Statements (continued)
December 31, 2015
|
| 3. INVESTMENTS AND FAIR VALUE MEASUREMENTS (continued) |
An interest rate swap is an agreement that obligates two parties to exchange a series of cash flows at specified intervals, based upon or calculated by reference to changes in interest rates on a specified notional principal amount. The payment flows are usually netted against each other, with the difference being paid by one party to the other.
A credit default swap is an agreement that involves one party (the buyer of protection) making a stream of payments to another party (the seller of protection) in exchange for the right to receive protection on a reference security or obligation, including a group of assets or exposure to the performance of an index. A Fund’s investment in credit default swaps may involve greater risks than if the Fund had invested in the referenced obligation directly. Credit events are contract specific but may include bankruptcy, failure to pay, restructuring and obligation acceleration. If a Fund buys protection through a credit default swap and no credit event occurs, its payments are limited to the periodic payments previously made to the counterparty. Upon the occurrence of a specified credit event, a Fund, as a buyer of credit protection, is entitled to receive an amount equal to the notional amount of the swap and deliver to the seller the defaulted reference obligation in a physically settled trade. A Fund may also receive a net settlement amount in the form of cash or securities equal to the notional amount of the swap reduced by the recovery value of the reference obligation in a cash settled trade.
As a seller of protection, a Fund generally receives a payment stream throughout the term of the swap, provided that there is no credit event. In addition, if a Fund sells protection through a credit default swap, a Fund could suffer a loss because the value of the referenced obligation and the premium payments received may be less than the notional amount of the swap paid to the buyer of protection. Upon the occurrence of a specified credit event, a Fund, as a seller of credit protection, may be required to take possession of the defaulted reference obligation and pay the buyer an amount equal to the notional amount of the swap in a physically settled trade. A Fund may also pay a net settlement amount in the form of cash or securities equal to the notional amount of the swap reduced by the recovery value of the reference obligation in a cash settled trade. Recovery values are at times established through the credit event auction process in which market participants are ensured that a transparent price has been set for the defaulted security or obligation. In addition, a Fund is entitled to a return of any assets, which have been pledged as collateral to the counterparty upon settlement.
The maximum potential amount of future payments (undiscounted) that a Fund as seller of protection could be required to make under a credit default swap would be an amount equal to the notional amount of the agreement. These potential amounts would be partially offset by any recovery values of the respective referenced obligations or net amounts received from a settlement of a credit default swap for the same reference security or obligation where a Fund bought credit protection.
A total return swap is an agreement that gives a Fund the right to receive the appreciation in the value of a specified security, index or other instrument in return for a fee paid to the counterparty, which will typically be an agreed upon interest rate. If the underlying asset declines in value over the term of the swap, a Fund may also be required to pay the dollar value of that decline to the counterparty.
Short Term Investments — Short-term investments having a maturity of 60 days or less are generally valued at amortized cost which approximates fair market value. These investments are classified as Level 2 of the fair value hierarchy.
B. Level 3 Fair Value Investments — To the extent that significant inputs to valuation models and other alternative pricing sources are unobservable, or if quotations are not readily available, or if GSAM believes that such quotations do not accurately reflect fair value, the fair value of the Funds’ investments may be determined under Valuation Procedures approved by the Trustees. GSAM, consistent with its procedures and applicable regulatory guidance, may make an adjustment to the most recent valuation prices of either domestic or foreign securities in light of significant events to reflect what it believes to be the fair value of the securities at the time of determining a Fund’s NAV. Significant events which could affect a large number of securities in a particular market may include, but are not limited to: significant fluctuations in U.S. or foreign markets; market dislocations; market disruptions; or unscheduled market closings. Significant events which could also affect a single issuer may include, but are not limited to: corporate actions such as reorganizations, mergers and buy-outs; ratings downgrades; and bankruptcies.
118
GOLDMAN SACHS SELECT SATELLITE FUNDS
|
| 3. INVESTMENTS AND FAIR VALUE MEASUREMENTS (continued) |
C. Fair Value Hierarchy — The following is a summary of the Funds’ investments and derivatives classified in the fair value hierarchy as of December 31, 2015:
| | | | | | | | | | | | |
| | | |
| ABSOLUTE RETURN TRACKER | | | | | | | | | | | | |
| | | |
| Investment Type | | Level 1 | | | Level 2 | | | Level 3 | |
| Assets | | | | | | | | | | | | |
Common Stock and/or Other Equity Investments(a) | | | | | | | | | | | | |
North America | | $ | 121,506,315 | | | $ | — | | | $ | — | |
Exchange Traded Funds | | | 59,483,547 | | | | — | | | | — | |
Investment Company | | | 904,143,179 | | | | — | | | | — | |
| Total | | $ | 1,085,133,041 | | | $ | — | | | $ | — | |
| | | |
| Derivative Type | | | | | | | | | |
| Assets(b) | | | | | | | | | | | | |
Forward Foreign Currency Exchange Contracts | | $ | — | | | $ | 362,774 | | | $ | — | |
Futures Contracts | | | 3,479,296 | | | | — | | | | — | |
Credit Default Swap Contracts | | | — | | | | 1,951,709 | | | | — | |
Total Return Swap Contracts | | | — | | | | 541,860 | | | | — | |
| Total | | $ | 3,479,296 | | | $ | 2,856,343 | | | $ | — | |
| Liabilities | | | | | | | | | | | | |
Forward Foreign Currency Exchange Contracts(b) | | $ | — | | | $ | (185,519 | ) | | $ | — | |
Futures Contracts(b) | | | (830,049 | ) | | | — | | | | — | |
Total Return Swap Contracts(b) | | | — | | | | (388,774 | ) | | | — | |
Written Options Contracts | | | (2,340,014 | ) | | | — | | | | — | |
| Total | | $ | (3,170,063 | ) | | $ | (574,293 | ) | | $ | — | |
| | | |
| COMMODITY STRATEGY | | | | | | | | | | | | |
| | | |
| Investment Type | | Level 1 | | | Level 2 | | | Level 3 | |
| Assets | | | | | | | | | | | | |
Fixed Income | | | | | | | | | | | | |
Mortgage-Backed Obligations | | $ | — | | | $ | 68,649,850 | | | $ | — | |
Asset-Backed Securities | | | — | | | | 176,559 | | | | — | |
U.S. Treasury Obligations and/or Other U.S. Government Agencies | | | 333,616,000 | | | | — | | | | — | |
Investment Company | | | 137,213,970 | | | | — | | | | — | |
| Total | | $ | 470,829,970 | | | $ | 68,826,409 | | | $ | — | |
| Liabilities | | | | | | | | | | | | |
Fixed Income | | | | | | | | | | | | |
Mortgage-Backed Obligations — Forward Sales Contracts | | $ | — | | | $ | (5,157,422 | ) | | $ | — | |
119
GOLDMAN SACHS SELECT SATELLITE FUNDS
Notes to Financial Statements (continued)
December 31, 2015
|
| 3. INVESTMENTS AND FAIR VALUE MEASUREMENTS (continued) |
| | | | | | | | | | | | |
| | | |
| COMMODITY STRATEGY (continued) | | | | | | | | | | | | |
| | | |
| Derivative Type | | Level 1 | | | Level 2 | | | Level 3 | |
| Assets(b) | | | | | | | | | | | | |
Futures Contracts | | $ | 272,092 | | | $ | — | | | $ | — | |
Interest Rate Swap Contracts | | | — | | | | 12,137 | | | | — | |
| Total | | $ | 272,092 | | | $ | 12,137 | | | $ | — | |
| Liabilities(b) | | | | | | | | | | | | |
Futures Contracts | | $ | (224,520 | ) | | $ | — | | | $ | — | |
Total Return Swap Contracts | | | — | | | | (49,286,731 | ) | | | — | |
| Total | | $ | (224,520 | ) | | $ | (49,286,731 | ) | | $ | — | |
| | | |
| DYNAMIC ALLOCATION | | | | | | | | | | | | |
| | | |
| Investment Type | | Level 1 | | | Level 2 | | | Level 3 | |
| Assets | | | | | | | | | | | | |
Common Stock and/or Other Equity Investments(a) | | | | | | | | | | | | |
Asia | | $ | — | | | $ | 67,117,107 | | | $ | — | |
Europe | | | 228,502 | | | | 66,461,749 | | | | — | |
North America | | | 15,054,022 | | | | — | | | | — | |
Investment Company | | | 329,041,062 | | | | — | | | | — | |
Fixed Income | | | | | | | | | | | | |
U.S. Treasury Obligations and/or Other U.S. Government Agencies | | | 24,364,561 | | | | — | | | | — | |
Commodity Index Linked Structured Notes | | | — | | | | 5,715,533 | | | | — | |
| Total | | $ | 368,688,147 | | | $ | 139,294,389 | | | $ | — | |
| | | |
| Derivative Type | | | | | | | | | |
| Assets(b) | | | | | | | | | | | | |
Forward Foreign Currency Exchange Contracts | | $ | — | | | $ | 82,290 | | | $ | — | |
Futures Contracts | | | 2,126,715 | | | | — | | | | — | |
Credit Default Swap Contracts | | | — | | | | 34,227 | | | | — | |
Total Return Swap Contracts | | | — | | | | 73,823 | | | | — | |
| Total | | $ | 2,126,715 | | | $ | 190,340 | | | $ | — | |
| Liabilities(b) | | | | | | | | | | | | |
Forward Foreign Currency Exchange Contracts | | $ | — | | | $ | (3,910,872 | ) | | $ | — | |
Futures Contracts | | | (1,565,550 | ) | | | — | | | | — | |
Credit Default Swap Contracts | | | — | | | | (20,693 | ) | | | — | |
Interest Rate Swap Contracts | | | — | | | | (629,470 | ) | | | — | |
Total Return Swap Contracts | | | — | | | | (385,674 | ) | | | — | |
| Total | | $ | (1,565,550 | ) | | $ | (4,946,709 | ) | | $ | — | |
120
GOLDMAN SACHS SELECT SATELLITE FUNDS
|
| 3. INVESTMENTS AND FAIR VALUE MEASUREMENTS (continued) |
| | | | | | | | | | | | |
| | | |
| DYNAMIC COMMODITY STRATEGY | | | | | | | | | | | | |
| | | |
| Investment Type | | Level 1 | | | Level 2 | | | Level 3 | |
| Assets | | | | | | | | | | | | |
Fixed Income | | | | | | | | | | | | |
U.S. Treasury Obligations and/or Other U.S. Government Agencies | | $ | 13,968,535 | | | $ | — | | | $ | — | |
Investment Company | | | 8,464,763 | | | | — | | | | — | |
| Total | | $ | 22,433,298 | | | $ | — | | | $ | — | |
| | | |
| Derivative Type | | | | | | | | | |
| Assets(b) | | | | | | | | | | | | |
Total Return Swap Contracts | | $ | — | | | $ | 390,637 | | | $ | — | |
| Liabilities(b) | | | | | | | | | | | | |
Total Return Swap Contracts | | $ | — | | | $ | (335,477 | ) | | $ | — | |
| | | |
| MANAGED FUTURES STRATEGY | | | | | | | | | | | | |
| | | |
| Investment Type | | Level 1 | | | Level 2 | | | Level 3 | |
| Assets | | | | | | | | | | | | |
Fixed Income | | | | | | | | | | | | |
Commodity Index-Linked Structured Notes | | $ | — | | | $ | 10,466,140 | | | $ | — | |
Investment Company | | | 88,106,078 | | | | — | | | | — | |
| | | $ | 88,106,078 | | | $ | 10,466,140 | | | $ | — | |
| | | |
| Derivative Type | | | | | | | | | |
| Assets(b) | | | | | | | | | | | | |
Forward Foreign Currency Exchange Contracts | | $ | — | | | $ | 1,288,241 | | | $ | — | |
Futures Contracts | | | 209,117 | | | | — | | | | — | |
Interest Rate Swap Contracts | | | — | | | | 3,933,866 | | | | — | |
| Total | | $ | 209,117 | | | $ | 5,222,107 | | | $ | — | |
| Liabilities(b) | | | | | | | | | | | | |
Forward Foreign Currency Exchange Contracts | | $ | — | | | $ | (1,109,119 | ) | | $ | — | |
Futures Contracts | | | (290,469 | ) | | | — | | | | — | |
Interest Rate Swap Contracts | | | — | | | | (440,546 | ) | | | — | |
| Total | | $ | (290,469 | ) | | $ | (1,549,665 | ) | | $ | — | |
121
GOLDMAN SACHS SELECT SATELLITE FUNDS
Notes to Financial Statements (continued)
December 31, 2015
|
| 3. INVESTMENTS AND FAIR VALUE MEASUREMENTS (continued) |
| | | | | | | | | | | | |
| | | |
| GLOBAL REAL ESTATE SECURITIES | | | | | | | | | | | | |
| | | |
| Investment Type | | Level 1 | | | Level 2 | | | Level 3 | |
| Assets | | | | | | | | | | | | |
Common Stock and/or Other Equity Investments(a) | | | | | | | | | | | | |
Asia | | $ | — | | | $ | 644,717 | | | $ | — | |
Australia and Oceania | | | — | | | | 169,754 | | | | — | |
Europe | | | — | | | | 495,400 | | | | — | |
North America | | | 1,722,749 | | | | — | | | | — | |
Investment Company | | | 42,195 | | | | — | | | | — | |
| Total | | $ | 1,764,944 | | | $ | 1,309,871 | | | $ | — | |
| | | |
| INTERNATIONAL REAL ESTATE SECURITIES | | | | | | | | | | | | |
| | | |
| Investment Type | | Level 1 | | | Level 2 | | | Level 3 | |
| Assets | | | | | | | | | | | | |
Common Stock and/or Other Equity Investments(a) | | | | | | | | | | | | |
Asia | | $ | 1,648,110 | | | $ | 152,522,857 | | | $ | — | |
Australia and Oceania | | | — | | | | 41,186,402 | | | | — | |
Europe | | | — | | | | 129,987,384 | | | | — | |
North America | | | 16,959,366 | | | | — | | | | — | |
| Total | | $ | 18,607,476 | | | $ | 323,696,643 | | | $ | — | |
| | | |
| REAL ESTATE SECURITIES | | | | | | | | | | | | |
| | | |
| Investment Type | | Level 1 | | | Level 2 | | | Level 3 | |
| Assets | | | | | | | | | | | | |
Common Stock and/or Other Equity Investments(a) | | | | | | | | | | | | |
North America | | $ | 542,913,665 | | | $ | — | | | $ | — | |
| (a) | | Amounts are disclosed by continent to highlight the impact of time zone differences between local market close and the calculation of NAV. Security valuations are based on the principal exchange or system on which they are traded, which may differ from country of domicile. The Funds utilize fair value model prices provided by an independent fair value service for international equities, resulting in a Level 2 classification. |
| (b) | | Amount shown represents unrealized gain (loss) at fiscal year end. |
For further information regarding security characteristics, see the Schedules of Investments.
122
GOLDMAN SACHS SELECT SATELLITE FUNDS
|
| 4. INVESTMENTS IN DERIVATIVES |
The following tables set forth, by certain risk types, the gross value of derivative contracts as of December 31, 2015. These instruments were used as part of the Funds’ investment strategies and to obtain and/or manage exposure related to the risks below. The values in the tables below exclude the effects of cash collateral received or posted pursuant to these derivative contracts, and therefore are not representative of the Funds’ net exposure.
| | | | | | | | | | | | |
| | | |
| ABSOLUTE RETURN TRACKER | | | | | | | | | | |
| Risk | | Statements of Assets
and Liabilities | | Assets | | | Statements of Assets
and Liabilities | | Liabilities | |
Commodity | | Receivable for unrealized gain on swap contracts and Variation margin on certain derivative contracts | | $ | 1,491,542 | (a) | | Variation margin on certain derivative contracts | | $ | (432,477) | (a) |
Credit | | Variation margin on certain derivative contracts | | | 1,951,709 | (a) | | — | | | — | |
Currency | | Receivable for unrealized gain on forward foreign currency exchange contracts | | | 362,774 | | | Payable for unrealized loss on forward foreign currency exchange contracts | | | (185,519) | |
Equity | | Receivable for unrealized gain on swap contracts and Variation margin on certain derivative contracts | | | 2,094,596 | (a) | | Payable for unrealized loss on swap contracts, Written options, at value and Variation margin on certain derivative contracts | | | (2,920,494) | (a)(b) |
Interest Rate | | Variation margin on certain derivative contracts | | | 435,018 | (a) | | Variation margin on certain derivative contracts | | | (205,866) | (a) |
| Total | | | | $ | 6,335,639 | | | | | $ | (3,744,356) | |
| | | |
| COMMODITY STRATEGY | | | | | | | | | | |
| Risk | | Statements of Assets
and Liabilities | | Assets | | | Statements of Assets
and Liabilities | | Liabilities | |
Commodity | | — | | $ | — | | | Payable for unrealized loss on swap contracts | | $ | (49,286,731) | (b) |
Interest Rate | | Receivable for unrealized gain on swap contracts, Variation margin on certain derivative contracts | | | 284,229 | (a) | | Variation margin on certain derivative contracts | | | (224,520) | (a) |
| Total | | | | $ | 284,229 | | | | | $ | (49,511,251) | |
123
GOLDMAN SACHS SELECT SATELLITE FUNDS
Notes to Financial Statements (continued)
December 31, 2015
|
| 4. INVESTMENTS IN DERIVATIVES (continued) |
| | | | | | | | | | | | |
| | | |
| DYNAMIC ALLOCATION | | | | | | | | | | |
| Risk | | Statements of Assets
and Liabilities | | Assets | | | Statements of Assets
and Liabilities | | Liabilities | |
Commodity | | Variation margin on certain derivative contracts | | $ | 300,153 | (a) | | Payable for unrealized loss on swap contracts and Variation margin on certain derivative contracts | | $ | (169,588) | (a)(b) |
Credit | | Variation margin on certain derivative contracts | | | 34,227 | (a) | | Variation margin on certain derivative contracts | | | (20,693) | (a) |
Currency | | Receivable for unrealized gain on forward foreign currency exchange contracts | | | 82,290 | | | Payable for unrealized loss on forward foreign currency exchange contracts | | | (3,910,872) | |
Equity | | Variation margin on certain derivative contracts | | | 1,396,805 | (a) | | Payable for unrealized loss on swap contracts and Variation margin on certain derivative contracts | | | (1,624,599) | (a)(b) |
Interest Rate | | Variation margin on certain derivative contracts | | | 503,580 | (a) | | Variation margin on certain derivative contracts | | | (786,507) | (a) |
| Total | | | | $ | 2,317,055 | | | | | $ | (6,512,259) | |
| | | |
| DYNAMIC COMMODITY STRATEGY | | | | | | | | | | |
| Risk | | Statements of Assets
and Liabilities | | Assets | | | Statements of Assets
and Liabilities | | Liabilities | |
Commodity | | Receivable for unrealized gain on swap contracts | | $ | 390,637 | | | Payable for unrealized loss on swap contracts | | $ | (335,477) | (b) |
| | | |
| MANAGED FUTURES STRATEGY | | | | | | | | | | |
| Risk | | Statements of Assets
and Liabilities | | Assets | | | Statements of Assets
and Liabilities | | Liabilities | |
Currency | | Receivable for unrealized gain on forward foreign currency exchange contracts | | $ | 1,288,241 | | | Payable for unrealized loss on forward foreign currency exchange contracts | | $ | (1,109,119) | |
Equity | | Variation margin on certain derivative contracts | | | 209,117 | (a) | | Variation margin on certain derivative contracts | | | (290,469) | (a) |
Interest Rate | | Variation margin on certain derivative contracts | | | 3,933,866 | (a) | | Variation margin on certain derivative contracts | | | (440,546) | (a) |
| Total | | | | $ | 5,431,224 | | | | | $ | (1,840,134) | |
| (a) | | Includes unrealized gain (loss) on futures contracts and centrally cleared swap contracts described in the Additional Investment Information sections of the Schedules of Investments. Only current day’s variation margin is reported within the Statements of Assets and Liabilities. |
| (b) | | Aggregate of amounts include $388,774, $49,286,731, $385,674 and $335,477 for the Absolute Return Tracker, Commodity Strategy, Dynamic Allocation and Dynamic Commodity Strategy Funds, respectively, which represent the payments to be made pursuant to bilateral agreements should counterparties exercise their “right to terminate” provisions based on, among others, the Funds’ performance, their failure to pay on its obligations or failure to pledge collateral. Such amounts do not include incremental charges directly associated with the close-out of the agreements. They also do not reflect the fair value of any assets pledged as collateral which, through the daily margining process, substantially offsets the aforementioned amounts and for which the Funds are entitled to a full return. |
124
GOLDMAN SACHS SELECT SATELLITE FUNDS
|
| 4. INVESTMENTS IN DERIVATIVES (continued) |
The following tables set forth, by certain risk types, the Funds’ gains (losses) related to these derivatives and their indicative volumes for the fiscal year ended December 31, 2015. These gains (losses) should be considered in the context that these derivative contracts may have been executed to create investment opportunities and/or economically hedge certain investments, and accordingly, certain gains (losses) on such derivative contracts may offset certain (losses) gains attributable to investments. These gains (losses) are included in “Net realized gain (loss)” or “Net change in unrealized gain (loss)” on the Statements of Operations:
| | | | | | | | | | | | | | |
|
| ABSOLUTE RETURN TRACKER | |
| Risk | | Statements of Operations | | Net Realized
Gain (Loss) | | | Net Change in
Unrealized
Gain (Loss) | | | Average
Number of
Contracts(a) | |
| Commodity | | Net realized gain (loss) from futures contracts and swap contracts/Net change in
unrealized gain (loss) on futures contracts and swap contracts | | $ | 2,345,403 | | | $ | (656,627 | ) | | | 1,495 | |
| Currency | | Net realized gain (loss) from forward foreign currency exchange contracts/Net change in unrealized gain (loss) on forward foreign currency exchange contracts | | | 3,641,767 | | | | 5,177 | | | | 89 | |
| Credit | | Net realized gain (loss) from swap contracts/Net change in unrealized gain (loss) on
swap contracts | | | 810,896 | | | | 270,724 | | | | 1 | |
| Equity | | Net realized gain (loss) from futures contracts, swap contracts and written options/Net change in unrealized gain (loss) on futures contracts, swap contracts and written options | | | 6,318,844 | | | | 615,569 | | | | 4,542 | |
| Interest rate | | Net realized gain (loss) from futures contracts/Net change in unrealized gain (loss) on futures contracts | | | 4,400,549 | | | | (2,489,856 | ) | | | 2,574 | |
| Total | | | | $ | 17,517,459 | | | $ | (2,255,013 | ) | | | 8,701 | |
|
| COMMODITY STRATEGY | |
| Risk | | Statements of Operations | | Net Realized
Gain (Loss) | | | Net Change in
Unrealized
Gain (Loss) | | | Average
Number of
Contracts(a) | |
| Commodity | | Net realized gain (loss) from futures contracts and swap contracts/Net change in
unrealized gain (loss) on futures contracts and swap contracts | | $ | (366,788,104 | ) | | $ | 59,191,489 | | | | 13 | |
| Interest rate | | Net realized gain (loss) from futures contracts and swap contracts/Net change in
unrealized gain (loss) on futures contracts and swap contracts | | | (1,680,140 | ) | | | 713,441 | | | | 1,067 | |
| Total | | | | $ | (368,468,244 | ) | | $ | 59,904,930 | | | | 1,080 | |
125
GOLDMAN SACHS SELECT SATELLITE FUNDS
Notes to Financial Statements (continued)
December 31, 2015
|
| 4. INVESTMENTS IN DERIVATIVES (continued) |
| | | | | | | | | | | | | | |
|
| DYNAMIC ALLOCATION | |
| Risk | | Statements of Operations | | Net Realized
Gain (Loss) | | | Net Change in
Unrealized
Gain (Loss) | | | Average
Number of
Contracts(a) | |
| Commodity | | Net realized gain (loss) from futures contracts and swap contracts/Net change in
unrealized gain (loss) on futures contracts and swap contracts | | $ | (6,471,525 | ) | | $ | 2,407,544 | | | | 199 | |
| Credit | | Net realized gain (loss) from swap contracts/Net change in unrealized gain (loss) on
swap contracts | | | (1,424,660 | ) | | | (73,699 | ) | | | 3 | |
| Currency | | Net realized gain (loss) from forward foreign currency exchange contracts/Net change in unrealized gain (loss) on forward foreign currency exchange contracts | | | 10,943,330 | | | | (4,960,864 | ) | | | 24 | |
| Equity | | Net realized gain (loss) from futures contracts and swap contracts/Net change in
unrealized gain (loss) on futures contracts and swap contracts | | | (4,865,733 | ) | | | (6,505,621 | ) | | | 2,284 | |
| Interest rate | | Net realized gain (loss) from futures contracts and swap contracts/Net change in
unrealized gain (loss) on futures contracts and swap contracts | | | (1,606,807 | ) | | | (1,367,365 | ) | | | 792 | |
| Total | | | | $ | (3,425,395 | ) | | $ | (10,500,005 | ) | | | 3,302 | |
|
| DYNAMIC COMMODITY STRATEGY | |
| Risk | | Statements of Operations | | Net Realized
Gain (Loss) | | | Net Change in
Unrealized
Gain (Loss) | | | Average
Number of
Contracts(a) | |
| Commodity | | Net realized gain (loss) from swap contracts/Net change in unrealized gain (loss) on
swap contracts | | $ | (9,194,380 | ) | | $ | 2,142,318 | | | | 36 | |
|
| MANAGED FUTURES STRATEGY | |
| Risk | | Statements of Operations | | Net Realized
Gain (Loss) | | | Net Change in
Unrealized
Gain (Loss) | | | Average
Number of
Contracts(a) | |
| Currency | | Net realized gain (loss) from forward foreign currency exchange contracts/Net change in unrealized gain (loss) on forward foreign currency exchange contracts | | $ | 5,540,918 | | | $ | (1,218,762 | ) | | | 188 | |
| Equity | | Net realized gain (loss) from futures contracts/Net change in unrealized gain (loss) on
futures contracts | | | 1,909,790 | | | | (785,770 | ) | | | 1,443 | |
| Interest rate | | Net realized gain (loss) from futures contracts and swap contracts/Net change in unrealized gain (loss) on futures contracts and swap contracts | | | (49,842 | ) | | | 2,873,186 | | | | 128 | |
| Total | | | | $ | 7,400,866 | | | $ | 868,654 | | | | 1,759 | |
|
| REAL ESTATE SECURITIES | |
| Risk | | Statements of Operations | | Net Realized
Gain (Loss) | | | Net Change in
Unrealized
Gain (Loss) | | | Average
Number of
Contracts(a) | |
| Currency | | Net realized gain (loss) from forward foreign currency exchange contracts/Net change in unrealized gain (loss) on forward foreign currency exchange contracts | | $ | (42,418 | ) | | $ | (34,345 | ) | | | 1 | |
| (a) | | Average number of contracts is based on the average of month end balances for the fiscal year ended December 31, 2015. |
126
GOLDMAN SACHS SELECT SATELLITE FUNDS
|
| 4. INVESTMENTS IN DERIVATIVES (continued) |
In order to better define its contractual rights and to secure rights that will help a Fund mitigate its counterparty risk, a Fund may enter into an International Swaps and Derivatives Association, Inc. Master Agreement (“ISDA Master Agreement”) or similar agreement with its derivatives counterparties. An ISDA Master Agreement is a bilateral agreement between a Fund and a counterparty that governs OTC derivatives (including forward foreign currency exchange contracts and certain options and swaps), and typically contains, among other things, collateral posting terms and netting provisions in the event of a default and/or termination event. The provisions of the ISDA Master Agreement typically permit a single net payment in the event of a default (close-out netting) or similar event, including the bankruptcy or insolvency of the counterparty.
Collateral and margin requirements differ between exchange traded derivatives and OTC derivatives. Margin requirements are established by the broker or clearing house for exchange-traded and centrally cleared derivatives (financial futures contracts, options and centrally cleared swaps) pursuant to governing agreements for those instrument types. Brokers can ask for margin in excess of the minimum in certain circumstances. Collateral terms are contract-specific for OTC derivatives. For derivatives traded under an ISDA Master Agreement, the collateral requirements are typically calculated by netting the marked to market amount for each transaction under such agreement and comparing that amount to the value of any collateral currently pledged by a Fund and the counterparty. Additionally, a Fund may be required to post initial margin to the counterparty, the terms of which would be outlined in the confirmation of the OTC transaction.
For financial reporting purposes, cash collateral that has been pledged to cover obligations of a Fund and cash collateral received from the counterparty, if any, is reported separately on the Statements of Assets and Liabilities as receivables/payables for collateral on certain derivative contracts. Non-cash collateral pledged by a Fund, if any, is noted in the Schedules of Investments. Generally, the amount of collateral due from or to a counterparty must exceed a minimum transfer amount threshold before a transfer is required to be made. To the extent amounts due to a Fund from its counterparties are not fully collateralized, contractually or otherwise, the Fund bears the risk of loss from counterparty nonperformance. A Fund attempts to mitigate counterparty risk by only entering into agreements with counterparties that the Investment Adviser believes to be of good standing and by monitoring the financial stability of those counterparties.
Additionally, the netting of assets and liabilities and the offsetting of collateral pledged or received are based on contractual netting/set-off provisions in the ISDA Master Agreement or similar agreements. However, in the event of a default or insolvency of a counterparty, a court could determine that such rights are not enforceable due to the restrictions or prohibitions against the right of setoff that may be imposed in accordance with a particular jurisdiction’s bankruptcy or insolvency laws.
The following tables set forth the Funds’ net exposure for derivative instruments that are subject to enforceable master netting arrangements or similar agreements as of December 31, 2015:
| | | | | | | | | | | | | | | | |
| | | |
| COMMODITY STRATEGY | | | | | | | | | | | | | |
| | | Derivative Liabilities(1) | | | Net Derivative
Assets
(Liabilities) | | | Collateral
(Received)
Pledged(1) | | | Net
Amount(2) | |
| Counterparty | | Swaps | | | | |
Deutsche Bank AG | | $ | (11,543,384 | ) | | $ | (11,543,384 | ) | | $ | 11,543,384 | | | $ | — | |
Macquarie Bank Ltd. | | | (11,919,548 | ) | | | (11,919,548 | ) | | | 11,919,548 | | | | — | |
Merrill Lynch International | | | (4,549,199 | ) | | | (4,549,199 | ) | | | 4,549,199 | | | | — | |
Societe Gererale SA | | | (8,706,293 | ) | | | (8,706,293 | ) | | | 8,706,293 | | | | — | |
UBS AG | | | (12,568,307 | ) | | | (12,568,307 | ) | | | 12,568,307 | | | | — | |
Total | | $ | (49,286,731 | ) | | $ | (49,286,731 | ) | | $ | 49,286,731 | | | $ | — | |
| (1) | | Gross amounts available for offset but not netted in the Statement of Assets and Liabilities. |
| (2) | | Net amount represents the net amount due (to) from counterparty in the event of a default based on the contractual set-off rights under the agreement. |
127
GOLDMAN SACHS SELECT SATELLITE FUNDS
Notes to Financial Statements (continued)
December 31, 2015
|
| 4. INVESTMENTS IN DERIVATIVES (continued) |
| | | | | | | | | | | | | | | | | | | | |
| | | | |
| DYNAMIC COMMODITY STRATEGY | | | | | | | | | | | | | | | | | |
| | | Derivative Assets(1) | | | Derivative Liabilities(1) | | | Net Derivative
Assets
(Liabilities) | | | Collateral
(Received)
Pledged(1) | | | Net
Amount(2) | |
| Counterparty | | Swaps | | | Swaps | | | | |
Merrill Lynch International | | $ | 379,177 | | | $ | (292,699 | ) | | $ | 86,478 | | | $ | 292,699 | | | $ | 379,177 | |
UBS AG | | | 11,460 | | | | (42,778 | ) | | | (31,318 | ) | | | 42,778 | | | | 11,460 | |
Total | | $ | 390,637 | | | $ | (335,477 | ) | | $ | 55,160 | | | $ | 335,477 | | | $ | 390,637 | |
| (1) | | Gross amounts available for offset but not netted in the Statement of Assets and Liabilities. |
| (2) | | Net amount represents the net amount due (to) from counterparty in the event of a default based on the contractual set-off rights under the agreement. |
| | | | | | | | | | | | | | | | | | | | |
| | | | | |
| MANAGED FUTURES STRATEGY | | | | | | | | | | | | | | | | | | | | |
| | | Derivative Assets(1) | | | Derivative Liabilities(1) | | | Net Derivative
Assets
(Liabilities) | | | Collateral
(Received)
Pledged(1) | | | Net
Amount(2) | |
| Counterparty | | Forwards | | | Forwards | | | | |
Morgan Stanley Co., Inc. | | $ | 1,288,241 | | | $ | (1,109,119 | ) | | $ | 179,122 | | | $ | 1,109,119 | | | $ | 1,288,241 | |
| (1) | | Gross amounts available for offset but not netted in the Statement of Assets and Liabilities. |
| (2) | | Net amount represents the net amount due (to) from counterparty in the event of a default based on the contractual set-off rights under the agreement. |
|
| 5. AGREEMENTS AND AFFILIATED TRANSACTIONS |
A. Management Agreement — Under the Agreement, GSAM manages the Funds, subject to the general supervision of the Trustees.
As compensation for the services rendered pursuant to the Agreement, the assumption of the expenses related thereto and administration of the Funds’ business affairs, including providing facilities, GSAM is entitled to a management fee, accrued daily and paid monthly, equal to an annual percentage rate of each Fund’s average daily net assets.
For the fiscal year ended December 31, 2015, contractual and effective net management fees with GSAM were at the following rates:
| | | | | | | | | | | | | | | | | | | | | | | | | | | | | | |
| | | | | Contractual Management Rate | | | | |
| Fund | | | | First
$1 billion | | | Next
$1 billion | | | Next
$3 billion | | | Next
$3 billion | | | Over
$8 billion | | | Effective
Rate | | | Effective Net Management
Rate^ | |
Absolute Return Tracker | | | | | 1.15 | % | | | 1.04 | % | | | 0.99 | % | | | 0.97 | % | | | 0.95 | % | | | 1.11 | % | | | 0.59 | %(1)(2)(3) |
Commodity Strategy | | | | | 0.50 | | | | 0.50 | | | | 0.45 | | | | 0.43 | | | | 0.42 | | | | 0.50 | | | | 0.41 | (1)(2) |
Dynamic Allocation | | | | | 0.90 | | | | 0.81 | | | | 0.77 | | | | 0.75 | | | | 0.74 | | | | 0.90 | | | | 0.69 | (1)(2)(3) |
Dynamic Commodity Strategy | | | | | 0.80 | | | | 0.80 | | | | 0.72 | | | | 0.68 | | | | 0.67 | | | | 0.80 | | | | 0.68 | (1)(2) |
Managed Futures Strategy | | | | | 1.00 | | | | 0.90 | | | | 0.86 | | | | 0.84 | | | | 0.82 | | | | 1.00 | | | | 0.88 | (1) |
Global Real Estate Securities | | | | | 1.05 | | | | 0.95 | | | | 0.90 | | | | 0.88 | | | | 0.86 | | | | 1.05 | | | | 0.93 | (3) |
International Real Estate Securities | | | | | 1.05 | | | | 1.05 | | | | 0.95 | | | | 0.90 | | | | 0.88 | | | | 1.05 | | | | 0.97 | (3) |
Real Estate Securities | | | | | 1.00 | | | | 0.90 | | | | 0.86 | | | | 0.84 | | | | 0.82 | | | | 1.00 | | | | 0.81 | (3) |
| ^ | | Effective Net Management Rate includes the impact of management fee waivers of affiliated underlying funds, if any. |
| (1) | | GSAM agreed to waive a portion of its management fee payable by the Funds in an amount equal to any management fees it earns as an investment adviser to any of the affiliated funds in which the Funds invest through at least July 31, 2016. Prior to such date GSAM may not terminate the arrangement without the approval of the Trustees. |
| (2) | | Reflects combined management fees paid to GSAM under the Agreement and the Funds’ Subsidiary Agreement (as defined below) after the waivers. |
| (3) | | GSAM agreed to waive a portion of its management fee in order to achieve net management rates, as defined in the Funds’ most recent prospectuses. These waivers will be effective through at least August 31, 2016 with respect to the Global Real Estate Securities Fund, and July 31, 2016 with respect to the International Real Estate Securities and Real Estate Securities Funds, and prior to such date GSAM may not terminate the arrangements without approval of the Trustees. |
128
GOLDMAN SACHS SELECT SATELLITE FUNDS
|
| 5. AGREEMENTS AND AFFILIATED TRANSACTIONS (continued) |
GSAM also provides management services to the Subsidiaries pursuant to a Subsidiary Management Agreement (each a “Subsidiary Agreement”) and is entitled to a management fee accrued daily and paid monthly, equal to an annual percentage rate of 0.42% of each Subsidiary’s average daily net assets. In consideration of the Subsidiary’s management fee, and for as long as the Subsidiary Agreement remains in effect, GSAM has contractually agreed to waive irrevocably a portion of each Fund’s management fee in an amount equal to the management fee accrued and paid to GSAM by the Subsidiary under the Subsidiary Agreement. For the fiscal year ended December 31, 2015, GSAM waived $154,984, $708,574, $48,271 and $19,507 of each Fund’s management fee for Absolute Return Tracker, Commodity Strategy, Dynamic Allocation and Dynamic Commodity Strategy Funds, respectively. This waiver represents an inter-fund transaction and, accordingly, has been eliminated in consolidation.
The Absolute Return Tracker, Commodity Strategy, Dynamic Allocation, Dynamic Commodity Strategy and Managed Futures Strategy Funds invest in FST Shares of the Goldman Sachs Financial Square Government Fund, which is an affiliated Underlying Fund. GSAM has agreed to waive a portion of its management fee payable by the Funds in an amount equal to the management fee it earns as an investment adviser to any of the affiliated Underlying Funds in which the Funds invest. For the fiscal year ended December 31, 2015, GSAM waived $1,653,967, $718,753, $440,606, $37,499 and $120,919 of the Funds’ management fees, respectively.
B. Distribution and Service Plans — The Trust, on behalf of each Fund, has adopted Distribution and Service Plans (the “Plans”). Under the Plans, Goldman Sachs, which serves as distributor (the “Distributor”), is entitled to a fee accrued daily and paid monthly, for distribution services and personal and account maintenance services, which may then be paid by Goldman Sachs to authorized dealers, at the following annual rates calculated on a Fund’s average daily net assets of each respective share class:
| | | | | | | | | | | | |
| | | Distribution and Service Plan Rates | |
| | | Class A* | | | Class C | | | Class R* | |
Distribution Plan | | | 0.25 | % | | | 0.75 | % | | | 0.50 | % |
Service Plan | | | — | | | | 0.25 | | | | — | |
| * | | With respect to Class A and Class R Shares, the Distributor at its discretion may use compensation for distribution services paid under the Distribution Plan to compensate service organizations for personal and account maintenance services and expenses as long as such total compensation does not exceed the maximum cap on “service fees” imposed by the Financial Industry Regulatory Authority. |
C. Distribution Agreement — Goldman Sachs, as Distributor of the shares of the Funds pursuant to a Distribution Agreement, may retain a portion of the Class A Shares’ front end sales charge and Class C Shares’ CDSC. During the fiscal year ended December 31, 2015, Goldman Sachs advised that it retained front end sales charges of $2,953, $33,061, $22,602, $103, $4,225, $526 and $7,058 for the Absolute Return Tracker, Commodity Strategy, Dynamic Allocation, Dynamic Commodity Strategy, Managed Futures Strategy, International Real Estate Securities and Real Estate Securities Funds, respectively.
D. Service Plan and Shareholder Administration Plan — The Trust, on behalf of each Fund that offers Service Shares, has adopted a Service Plan and a Shareholder Administration Plan. These plans allow for service organizations to provide varying levels of personal and account maintenance and shareholder administration services to their customers who are beneficial owners of such shares. The Service Plan and Shareholder Administration Plan each provide for compensation to the service organizations which is accrued daily and paid monthly at an annual rate of 0.25% (0.50% in aggregate) of the average daily net assets of the Service Shares.
E. Transfer Agency Agreement — Goldman Sachs also serves as the transfer agent of the Funds for a fee pursuant to the Transfer Agency Agreement. The fees charged for such transfer agency services are accrued daily and paid monthly at annual rates as follows: 0.19% (except for the Commodity Strategy and Dynamic Commodity Strategy Funds, which charge at an annual rate of 0.13%) of the average daily net assets of Class A, Class C, Class IR and Class R Shares; 0.02% of the average daily net assets of Class R6 Shares; and 0.04% of the average daily net assets of Institutional and Service Shares.
F. Other Expense Agreements and Affiliated Transactions — GSAM has agreed to limit certain “Other Expenses” of the Funds (excluding acquired fund fees and expenses, transfer agency fees and expenses, service fees and shareholder administration
129
GOLDMAN SACHS SELECT SATELLITE FUNDS
Notes to Financial Statements (continued)
December 31, 2015
|
| 5. AGREEMENTS AND AFFILIATED TRANSACTIONS (continued) |
fees (as applicable), taxes, interest, brokerage fees, shareholder meeting, litigation, indemnification and extraordinary expenses) to the extent such expenses exceed, on an annual basis, a percentage rate of the average daily net assets of each Fund. Such Other Expense reimbursements, if any, are accrued daily and paid monthly. In addition, the Funds are not obligated to reimburse GSAM for prior fiscal year expense reimbursements, if any. The Other Expense limitations as an annual percentage rate of average daily net assets for the Absolute Return Tracker, Commodity Strategy, Dynamic Allocation, Dynamic Commodity Strategy, Managed Futures Strategy, Global Real Estate Securities, International Real Estate Securities and Real Estate Securities Funds are 0.014%, 0.074%, 0.004%, 0.014%, 0.204%, 0.034%, 0.004% and 0.004%, respectively. Prior to April 30, 2015, the Other Expense limitation was 0.044% and 0.104% for the Commodity Strategy and Managed Futures Strategy Funds. These Other Expense limitations will remain in place through at least July 31, 2016 (August 31, 2016 with respect to the Global Real Estate Securities Fund), and prior to such date GSAM may not terminate the arrangements without the approval of the Trustees. The Subsidiaries also pay certain other expenses, including service and custody fees. GSAM has agreed to reduce or limit each Subsidiary’s expenses (excluding management fees) to 0.004% of the Subsidiary’s average daily net assets for the Absolute Return Tracker, Commodity Strategy, Dynamic Allocation and Dynamic Commodity Strategy Funds. In addition, the Funds have entered into certain offset arrangements with the custodian and the transfer agent, which may result in a reduction of the Funds’ expenses and are received irrespective of the application of the “Other Expense” limitations described above.
For the fiscal year ended December 31, 2015, these expense reductions, including any fee waivers and Other Expense reimbursements, were as follows:
| | | | | | | | | | | | | | | | | | |
| Fund | | | | Management
Fee Waiver | | | Other
Expense
Reimbursement | | | Custody
Fee Credits | | | Total
Expense
Reductions | |
Absolute Return Tracker | | | | $ | 7,923,672 | | | $ | 462,411 | | | $ | 92,958 | | | $ | 8,479,041 | |
Commodity Strategy | | | | | 792,622 | | | | 248,701 | | | | 40,580 | | | | 1,081,903 | |
Dynamic Allocation | | | | | 1,081,019 | * | | | 594,875 | | | | — | | | | 2,086,077 | |
Dynamic Commodity Strategy | | | | | 37,499 | | | | 495,440 | | | | 687 | | | | 533,626 | |
Managed Futures Strategy | | | | | 120,919 | | | | 192,016 | | | | 5,080 | | | | 318,015 | |
Global Real Estate Securities | | | | | 1,250 | | | | 174,429 | | | | — | | | | 175,679 | |
International Real Estate Securities | | | | | 302,790 | | | | 472,670 | | | | 3,855 | | | | 779,315 | |
Real Estate Securities | | | | | 586,255 | * | | | 392,557 | | | | 9,472 | | | | 1,465,957 | |
| * | | In addition to the management fee waivers above, GSAM has voluntarily agreed to waive $410,183 and $477,673 for the Dynamic Allocation and Real Estate Securities Funds, respectively. |
G. Line of Credit Facility — As of December 31, 2015, the Funds participated in a $1,205,000,000 committed, unsecured revolving line of credit facility (the “facility”) together with other funds of the Trust and certain registered investment companies having management agreements with GSAM or its affiliates (“Other Borrowers”). Pursuant to the terms of the facility, the Funds and Other Borrowers could increase the credit amount by up to an additional $115,000,000, for a total of up to $1,320,000,000. This facility is to be used for temporary emergency purposes, or to allow for an orderly liquidation of securities to meet redemption requests. The interest rate on borrowings is based on the federal funds rate. The facility also requires a fee to be paid by the Funds based on the amount of the commitment that has not been utilized. For the fiscal year ended December 31, 2015, the Funds did not have any borrowings under the facility.
H. Other Transactions with Affiliates — For the fiscal year ended December 31, 2015, Goldman Sachs earned $5,242 and $24,760 in brokerage commissions from portfolio transactions, including futures transactions executed with Goldman Sachs as the Futures Commission Merchant, on behalf of the Absolute Return Tracker and Dynamic Allocation Funds, respectively.
130
GOLDMAN SACHS SELECT SATELLITE FUNDS
|
| 5. AGREEMENTS AND AFFILIATED TRANSACTIONS (continued) |
The following table provides information about the Funds’ investment in the Goldman Sachs Financial Square Government Fund as of and for the fiscal year ended December 31, 2015:
| | | | | | | | | | | | | | | | | | | | | | |
| Fund | | | | Market
Value
12/31/14 | | | Purchases
at Cost | | | Proceeds
from Sales | | | Market
Value
12/31/15 | | | Dividend
Interest
Income | |
Absolute Return Tracker | | | | $ | 1,556,508,230 | | | $ | 1,005,780,292 | | | $ | (1,658,145,343 | ) | | $ | 904,143,179 | | | $ | 215,227 | |
Commodity Strategy | | | | | 444,385,962 | | | | 1,756,502,715 | | | | (2,063,674,707 | ) | | | 137,213,970 | | | | 75,768 | |
Dynamic Allocation | | | | | 345,603,019 | | | | 377,851,125 | | | | (394,413,082 | ) | | | 329,041,062 | | | | 66,996 | |
Dynamic Commodity Strategy | | | | | 26,469,114 | | | | 26,505,687 | | | | (44,510,038 | ) | | | 8,464,763 | | | | 4,694 | |
Managed Futures Strategy | | | | | 76,606,111 | | | | 96,784,027 | | | | (85,284,060 | ) | | | 88,106,078 | | | | 19,355 | |
Global Real Estate Securities | | | | | — | | | | 3,045,177 | | | | (3,002,982 | ) | | | 42,195 | | | | 8 | |
As of December 31, 2015, the following Goldman Sachs Fund of Funds Portfolios were beneficial owners of 5% or more of total outstanding shares of the following Funds:
| | | | | | | | | | | | | | | | | | | | |
| Fund | | | | | | Goldman Sachs
Balanced Strategy
Portfolio | | | Goldman Sachs
Growth and Income
Strategy Portfolio | | | Goldman Sachs
Growth Strategy
Portfolio | | | Goldman Sachs
Satellite Strategies
Portfolio | |
Commodity Strategy | | | | | | | — | % | | | — | % | | | — | % | | | 7 | % |
Dynamic Allocation | | | | | | | 9 | | | | 20 | | | | 17 | | | | — | |
Managed Futures Strategy | | | | | | | 13 | | | | 26 | | | | 23 | | | | — | |
Global Real Estate Securities | | | | | | | — | | | | — | | | | — | | | | — | |
International Real Estate Securities | | | | | | | — | | | | — | | | | — | | | | 40 | |
Real Estate Securities | | | | | | | — | | | | — | | | | — | | | | 25 | |
As of December 31, 2015, the Goldman Sachs Group, Inc. was the beneficial owner of the following Funds:
| | | | | | | | | | | | | | | | | | | | | | | | | | |
| | | | | Percent of Share Class owned by Goldman Sachs Group, Inc. | |
| Fund | | | | Class A | | | Class C | | | Institutional | | | Class IR | | | Class R | | | Class R6 | |
Absolute Return Tracker | | | | | — | % | | | — | % | | | — | % | | | — | % | | | — | % | | | 100 | % |
Dynamic Allocation | | | | | — | | | | — | | | | — | | | | — | | | | 100 | | | | 100 | |
Dynamic Commodity Strategy | | | | | — | | | | 100 | | | | 98 | | | | 100 | | | | 100 | | | | — | |
Global Real Estate Securities | | | | | 100 | | | | 100 | | | | 100 | | | | 100 | | | | 100 | | | | 100 | |
International Real Estate Securities | | | | | — | | | | — | | | | — | | | | 9 | | | | — | | | | 100 | |
Real Estate Securities | | | | | — | | | | — | | | | — | | | | — | | | | — | | | | 100 | |
131
GOLDMAN SACHS SELECT SATELLITE FUNDS
Notes to Financial Statements (continued)
December 31, 2015
|
| 6. PORTFOLIO SECURITIES TRANSACTIONS |
The cost of purchases and proceeds from sales and maturities of long-term securities for the fiscal year ended December 31, 2015, were as follows:
| | | | | | | | | | | | | | | | | | |
| Fund | | | | Purchases of
U.S. Government and
Agency Obligations | | | Purchases (Excluding
U.S. Government and
Agency Obligations) | | | Sales and
Maturities of
U.S. Government and
Agency Obligations | | | Sales and
Maturities (Excluding
U.S. Government and
Agency Obligations) | |
Absolute Return Tracker | | | | $ | — | | | $ | 496,987,854 | | | $ | — | | | $ | 499,693,332 | |
Commodity Strategy | | | | | 1,451,789,871 | | | | 33 | | | | 1,448,940,388 | | | | 2,645,260 | |
Dynamic Allocation | | | | | 75,656,988 | | | | 634,223,475 | | | | 65,353,124 | | | | 783,283,115 | |
Managed Futures Strategy | | | | | — | | | | 16,850,000 | | | | — | | | | 14,695,657 | |
Global Real Estate Securities | | | | | — | | | | 3,313,741 | | | | — | | | | 434,462 | |
International Real Estate Securities | | | | | — | | | | 168,561,884 | | | | — | | | | 202,844,858 | |
Real Estate Securities | | | | | — | | | | 231,466,309 | | | | — | | | | 285,547,898 | |
The tax character of distributions paid during the fiscal year ended December 31, 2015, was as follows:
| | | | | | | | | | | | | | | | | | | | | | | | | | | | | | | | |
| | | Absolute
Return
Tracker | | | Commodity
Strategy | | | Dynamic
Allocation | | | Dynamic
Commodity
Strategy | | | Managed
Futures
Strategy | | | Global Real
Estate Securities | | | International
Real Estate
Securities | | | Real Estate
Securities | |
Distributions paid from: | | | | | | | | | | | | | | | | | | | | | | | | | | | | | | | | |
Ordinary income | | $ | 18,548,910 | | | $ | 3,110,555 | | | $ | 10,498,445 | | | $ | — | | | $ | 4,542,562 | | | $ | 42,321 | | | $ | 10,299,012 | | | $ | 10,278,579 | |
Net long-term capital gains | | | 2,682,453 | | | | — | | | | 9,978,011 | | | | — | | | | — | | | | — | | | | — | | | | 14,299,739 | |
Total | | $ | 21,231,363 | | | $ | 3,110,555 | | | $ | 20,476,456 | | | $ | — | | | $ | 4,542,562 | | | $ | 42,321 | | | $ | 10,299,012 | | | $ | 24,578,318 | |
The tax character of distributions paid during the fiscal year ended December 31, 2014, was as follows:
| | | | | | | | | | | | | | | | | | | | | | | | | | | | |
| | | Absolute
Return
Tracker | | | Commodity
Strategy | | | Dynamic
Allocation | | | Dynamic
Commodity
Strategy | | | Managed
Futures
Strategy | | | International
Real Estate
Securities | | | Real Estate
Securities | |
Distributions paid from: | | | | | | | | | | | | | | | | | | | | | | | | | | | | |
Ordinary income | | $ | 49,714,558 | | | $ | 903,840 | | | $ | 42,906,765 | | | $ | — | | | $ | 240 | | | $ | 15,665,441 | | | $ | 10,017,558 | |
Net Long-Term Capital Gains | | | 31,171,007 | | | | — | | | | 6,463,121 | | | | — | | | | 871,211 | | | | — | | | | — | |
Total taxable distributions | | $ | 80,885,565 | | | $ | 903,840 | | | $ | 49,369,886 | | | $ | — | | | $ | 871,451 | | | $ | 15,665,441 | | | $ | 10,017,558 | |
132
GOLDMAN SACHS SELECT SATELLITE FUNDS
|
| 7. TAX INFORMATION (continued) |
As of December 31, 2015, the components of accumulated earnings (losses) on a tax-basis were as follows:
| | | | | | | | | | | | | | | | | | | | | | | | | | | | | | | | |
| | | Absolute Return Tracker | | | Commodity Strategy | | | Dynamic Allocation | | | Dynamic Commodity Strategy | | | Managed Futures Strategy | | | Global Real
Estate Securities | | | International Real Estate Securities | | | Real Estate Securities | |
Undistributed ordinary income — net | | $ | 1,621,976 | | | $ | 96,082 | | | $ | — | | | $ | — | | | $ | 120,357 | | | $ | 5,044 | | | $ | 533,936 | | | $ | — | |
Undistributed long-term capital gains | | | — | | | | — | | | | — | | | | — | | | | — | | | | 3,860 | | | | — | | | | 8,677,581 | |
Total undistributed earnings | | $ | 1,621,976 | | | $ | 96,082 | | | $— | | | | $ | — | | | $ | 120,357 | | | $ | 8,904 | | | $ | 533,936 | | | $ | 8,677,581 | |
Capital loss carryforwards:(1) | | | | | | | | | | | | | | | | | | | | | | | | | | | | | | | | |
Expiring 2016 | | $ | — | | | $ | (16,303,834 | ) | | $ | — | | | $ | — | | | $ | — | | | $ | — | | | $ | (315,734,034 | ) | | $ | — | |
Expiring 2017 | | | — | | | | (67,560,179 | ) | | | — | | | | — | | | | — | | | | — | | | | (239,206,981 | ) | | | — | |
Expiring 2018 | | | — | | | | — | | | | — | | | | — | | | | — | | | | — | | | | (18,621,372 | ) | | | — | |
Perpetual Short-term | | | (2,466,351 | ) | | | (9,976,477 | ) | | | (17,878,052 | ) | | | — | | | | — | | | | — | | | | — | | | | — | |
Perpetual Long-term | | | — | | | | (5,928,633 | ) | | | (2,327,721 | ) | | | — | | | | (12,787 | ) | | | — | | | | — | | | | — | |
Total capital loss carryforwards | | $ | (2,466,351 | ) | | $ | (99,769,123 | ) | | $ | (20,205,773 | ) | | $ | — | | | $ | (12,787 | ) | | $ | — | | | $ | (573,562,387 | ) | | $ | — | |
Timing differences (Qualified Late Year Loss Deferral/certain REIT dividends/straddle loss deferral/Post October Loss Deferral) | | | (7,160,548 | ) | | | (4,091,744 | ) | | | (12,654,226 | ) | | | — | | | | (1,318,465 | ) | | | 2,969 | | | | (645,764 | ) | | | 1,121,620 | |
Unrealized gains (losses) — net | | | (8,489,549 | ) | | | (57,842,500 | ) | | | (1,497,945 | ) | | | (370,588 | ) | | | 5,626,912 | | | | 121,038 | | | | (14,728,143 | ) | | | 145,288,719 | |
Total accumulated gains (losses) — net | | $ | (16,494,472 | ) | | $ | (161,607,285 | ) | | $ | (34,357,944 | ) | | $ | (370,588 | ) | | $ | 4,416,017 | | | $ | 132,911 | | | $ | (588,402,358 | ) | | $ | 155,087,920 | |
| (1) | | Expiration occurs on December 31 of the year indicated. The Managed Futures Strategy, International Real Estate Securities and Real Estate Securities Funds utilized $5,211,701, $3,582,322 and $13,910,055, respectively, of capital losses in the current fiscal year. |
As of December 31, 2015, the Funds’ aggregate security unrealized gains and losses based on cost for U.S. federal income tax purposes were as follows:
| | | | | | | | | | | | | | | | | | | | | | | | | | | | | | | | |
| | | Absolute Return Tracker | | | Commodity Strategy | | | Dynamic Allocation | | | Dynamic Commodity Strategy | | | Managed Futures Strategy | | | Global Real
Estate
Securities | | | International Real Estate
Securities | | | Real Estate
Securities | |
Tax cost | | $ | 1,097,222,428 | | | $ | 536,499,057 | | | $ | 508,808,557 | | | $ | 22,435,259 | | | $ | 96,550,078 | | | $ | 2,953,687 | | | $ | 357,024,668 | | | $ | 397,624,946 | |
Gross unrealized gain | | | 10,929,359 | | | | 4,725,525 | | | | 8,106,377 | | | | 1 | | | | 2,121,569 | | | | 210,046 | | | | 22,500,268 | | | | 151,002,331 | |
Gross unrealized loss | | | (23,018,746 | ) | | | (1,568,203 | ) | | | (8,932,398 | ) | | | (1,962 | ) | | | (99,429 | ) | | | (88,918 | ) | | | (37,220,817 | ) | | | (5,713,612 | ) |
Net unrealized security gain (loss) | | $ | (12,089,387 | ) | | $ | 3,157,322 | | | $ | (826,021 | ) | | $ | (1,961 | ) | | $ | 2,022,140 | | | $ | 121,128 | | | $ | (14,720,549 | ) | | $ | 145,288,719 | |
Net unrealized gain (loss) on other investments | | | 3,599,838 | | | | (60,999,822 | ) | | | (671,924 | ) | | | (368,627 | ) | | | 3,604,772 | | | | (90 | ) | | | (7,594 | ) | | | — | |
Net unrealized gain (loss) | | $ | (8,489,549 | ) | | $ | (57,842,500 | ) | | $ | (1,497,945 | ) | | $ | (370,588 | ) | | $ | 5,626,912 | | | $ | 121,038 | | | $ | (14,728,143 | ) | | $ | 145,288,719 | |
The difference between GAAP-basis and tax-basis unrealized gains (losses) is attributable primarily to wash sales, net mark to market gains (losses) on regulated futures, options and foreign currency contracts, and differences related to the tax treatment of
133
GOLDMAN SACHS SELECT SATELLITE FUNDS
Notes to Financial Statements (continued)
December 31, 2015
|
| 7. TAX INFORMATION (continued) |
swap transactions, inflation protected securities, underlying fund investments, passive foreign investment companies and real estate investment trust investments.
In order to present certain components of the Funds’ capital accounts on a tax-basis, certain reclassifications have been recorded to the Funds’ accounts. These reclassifications have no impact on the net asset value of the Funds and result primarily from certain non-deductible expenses, dividend redesignations and differences in the tax treatment of inflation protected securities, underlying fund investments, foreign currency transactions, swap transactions, passive foreign investment companies and real estate investment trust investments, net operating losses, realized capital gains tax, and paydowns.
| | | | | | | | | | | | | | |
Fund | | | | Paid-in
Capital | | | Accumulated Net Realized Gain (Loss) | | | Undistributed Net Investment Income (Loss) | |
Absolute Return Tracker | | | | $ | — | | | $ | (10,765,400 | ) | | $ | 10,765,400 | |
Commodity Strategy | | | | | (372,538,609 | ) | | | 364,991,647 | | | | 7,546,962 | |
Dynamic Allocation | | | | | (9,325,349 | ) | | | 1,229,772 | | | | 8,095,577 | |
Dynamic Commodity Strategy | | | | | (9,021,789 | ) | | | 9,194,380 | | | | (172,591 | ) |
Managed Futures Strategy | | | | | — | | | | (3,261,565 | ) | | | 3,261,565 | |
Global Real Estate Securities | | | | | (218 | ) | | | (859 | ) | | | 1,077 | |
International Real Estate Securities | | | | | (17,015 | ) | | | (8,409,696 | ) | | | 8,426,711 | |
Real Estate Securities | | | | | (9,360 | ) | | | (356,284 | ) | | | 365,644 | |
GSAM has reviewed the Funds’ tax positions for all open tax years (the current and prior three years, as applicable) and has concluded that no provision for income tax is required in the Funds’ financial statements. Such open tax years remain subject to examination and adjustment by tax authorities.
134
GOLDMAN SACHS SELECT SATELLITE FUNDS
The Funds’ risks include, but are not limited to, the following:
Foreign Custody Risk — A Fund that invests in foreign securities may hold such securities and cash with foreign banks, agents, and securities depositories appointed by the Fund’s custodian (each a “Foreign Custodian”). Some foreign custodians may be recently organized or new to the foreign custody business. In some countries, Foreign Custodians may be subject to little or no regulatory oversight over, or independent evaluation of, their operations. Further, the laws of certain countries may place limitations on a Fund’s ability to recover its assets if a Foreign Custodian enters bankruptcy. Investments in emerging markets may be subject to even greater custody risks than investments in more developed markets. Custody services in emerging market countries are very often undeveloped and may be considerably less well regulated than in more developed countries, and thus may not afford the same level of investor protection as would apply in developed countries.
Interest Rate Risk — When interest rates increase, fixed income securities or instruments held by the Funds will generally decline in value. Long-term fixed income securities or instruments will normally have more price volatility because of this risk than short-term fixed income securities or instruments.
Investments in Other Investment Companies — As a shareholder of another investment company, including an exchange traded fund (“ETF”), a Fund will directly bear its proportionate share of any net management fees and other expenses paid by such other investment companies, in addition to the fees and expenses regularly borne by the Fund. ETFs are subject to risks that do not apply to conventional mutual funds, including but not limited to the following: (i) the market price of the ETF’s shares may trade at a premium or a discount to their NAV; and (ii) an active trading market for an ETF’s shares may not develop or be maintained.
Large Shareholder Transactions Risk — A Fund may experience adverse effects when certain large shareholders, such as other funds, institutional investors (including those trading by use of non-discretionary mathematical formulas), financial intermediaries (who may make investment decisions on behalf of underlying clients and/or include a Fund in their investment model), individuals, accounts and Goldman Sachs affiliates, purchase or redeem large amounts of shares of a Fund. Such large shareholder redemptions may cause the Fund to sell portfolio securities at times when it would not otherwise do so, which may negatively impact a Fund’s NAV and liquidity. These transactions may also accelerate the realization of taxable income to shareholders if such sales of investments resulted in gains, and may also increase transaction costs. In addition, a large redemption could result in a Fund’s current expenses being allocated over a smaller asset base, leading to an increase in the Fund’s expense ratio. Similarly, large Fund share purchases may adversely affect a Fund’s performance to the extent that a Fund is delayed in investing new cash and is required to maintain a larger cash position than it ordinarily would.
135
GOLDMAN SACHS SELECT SATELLITE FUNDS
Notes to Financial Statements (continued)
December 31, 2015
|
| 8. OTHER RISKS (continued) |
Liquidity Risk — The Funds may make investments that are illiquid or that may become less liquid in response to market developments or adverse investor perceptions. Illiquid investments may be more difficult to value. Liquidity risk may also refer to the risk that a Fund will not be able to pay redemption proceeds within the allowable time period because of unusual market conditions, an unusually high volume of redemption requests, or other reasons. To meet redemption requests, a Fund may be forced to sell investments at an unfavorable time and/or under unfavorable conditions. Liquidity risk may be the result of, among other things, the reduced number and capacity of traditional market participants to make a market in fixed income securities or the lack of an active market. The potential for liquidity risk may be magnified by a rising interest rate environment or other circumstances where investor redemptions from fixed income mutual funds may be higher than normal, potentially causing increased supply in the market due to selling activity.
Market and Credit Risks — In the normal course of business, the Funds trade financial instruments and enter into financial transactions where risk of potential loss exists due to changes in the market (market risk). Additionally, the Funds may also be exposed to credit risk in the event that an issuer or guarantor fails to perform or that an institution or entity with which the Funds have unsettled or open transactions defaults.
Investing in foreign markets may involve special risks and considerations not typically associated with investing in the U.S. Foreign securities may be subject to risk of loss because of more or less foreign government regulation, less public information and less economic, political and social stability in the countries in which the Fund invests. Loss may also result from the imposition of exchange controls, confiscations and other government restrictions by the U.S. or other governments, or from problems in registration, settlement or custody. Foreign risk also involves the risk of negative foreign currency rate fluctuations, which may cause the value of securities denominated in such foreign currency (or other instruments through which the Fund has exposure to foreign currencies) to decline in value. Currency exchange rates may fluctuate significantly over short periods of time. To the extent that the Fund also invests in securities of issuers located in emerging markets, these risks may be more pronounced.
Non-Diversification Risk — The Funds (except for the Absolute Return Tracker Fund) are non-diversified, meaning that they are permitted to invest a larger percentage of their assets in fewer issuers than diversified mutual funds. Thus, each Fund (except for the Absolute Return Tracker Fund) may be more susceptible to adverse developments affecting any single issuer held in its portfolio, and may be more susceptible to greater losses because of these developments.
136
GOLDMAN SACHS SELECT SATELLITE FUNDS
|
| 8. OTHER RISKS (continued) |
Portfolio Concentration Risk — As a result of the Global Real Estate Securities, International Real Estate Securities and Real Estate Securities Funds’ ability to invest a large percentage of their assets in obligations of issuers within the same country, state, region, currency or economic sector, an adverse economic, business or political development may affect the value of the Funds’ investments more than if their investments were not so concentrated.
Short Position Risk — A Fund may enter into a short position through a futures contract, an option or swap agreement or through short sales of any instrument that a Fund may purchase for investment. Taking short positions involves leverage of a Fund’s assets and presents various risks. If the value of the underlying instrument or market in which a Fund has taken a short position increases, then the Fund will incur a loss equal to the increase in value from the time that the short position was entered into plus any related interest payments or other fees. Taking short positions involves the risk that losses may be disproportionate, may exceed the amount invested, and may be unlimited.
Tax Risk — The Absolute Return Tracker, Commodity Strategy, Dynamic Allocation, Dynamic Commodity Strategy and Managed Futures Strategy Funds will seek to gain exposure to the commodity markets primarily through investments in the Subsidiaries and/or commodity index-linked structured notes. Historically, the Internal Revenue Service (“IRS”) issued private letter rulings (“PLRs”) in which the IRS specifically concluded that income and gains from investments in commodity index-linked structured notes or a wholly-owned foreign subsidiary that invests in commodity-linked instruments are “qualifying income” for purposes of compliance with Subchapter M of the Code. The IRS has issued such PLRs to the Absolute Return Tracker, Commodity Strategy, and Dynamic Allocation Funds. Based on such rulings, these Funds may seek to gain exposure to the commodity markets through investments in commodity-linked notes and/or subsidiaries. The Dynamic Commodity Strategy and Managed Futures Strategy Funds have not received a PLR, and are not able to rely on PLRs issued to other taxpayers. Additionally, the IRS has suspended the granting of such PLRs, pending review of its position on this matter. In light of this, the Dynamic Commodity Strategy and Managed Futures Strategy Funds have obtained an opinion of counsel that the Funds’ income from such investments should constitute “qualifying income.” However, no assurances can be provided that the IRS would not be able to successfully assert that a Fund’s income from such investments was not “qualifying income”, in which case the Fund would fail to qualify as regulated investment company (“RIC”) under Subchapter M of the Code if over 10% of its gross income was derived from these investments. If a Fund failed to qualify as a RIC, it would be subject to federal and state income tax on all of its taxable income at regular corporate tax rates. This would significantly adversely affect the returns to, and could cause substantial losses for, Fund shareholders.
137
GOLDMAN SACHS SELECT SATELLITE FUNDS
Notes to Financial Statements (continued)
December 31, 2015
Under the Trust’s organizational documents, its Trustees, officers, employees and agents are indemnified, to the extent permitted by the Act and state law, against certain liabilities that may arise out of performance of their duties to the Funds. Additionally, in the course of business, the Funds enter into contracts that contain a variety of indemnification clauses. The Funds’ maximum exposure under these arrangements is unknown, as this would involve future claims that may be made against the Funds that have not yet occurred. However, GSAM believes the risk of loss under these arrangements to be remote.
Subsequent events after the Statements of Assets and Liabilities date have been evaluated through the date the financial statements were issued. GSAM has concluded that there is no impact requiring adjustment or disclosure in the financial statements.
138
GOLDMAN SACHS SELECT SATELLITE FUNDS
|
| 11. SUMMARY OF SHARE TRANSACTIONS |
Share activity is as follows:
| | | | | | | | | | | | | | | | |
| | | Absolute Return Tracker Fund | |
| | | | |
| | | For the Fiscal Year Ended
December 31, 2015 | | | For the Fiscal Year Ended
December 31, 2014 | |
| | | | |
| | | Shares | | | Dollars | | | Shares | | | Dollars | |
| | | | |
| Class A Shares | | | | | | | | | | | | | | | | |
Shares sold | | | 1,847,575 | | | $ | 16,563,412 | | | | 2,657,937 | | | $ | 24,238,484 | |
Reinvestment of distributions | | | 60,594 | | | | 526,947 | | | | 243,699 | | | | 2,198,655 | |
Shares redeemed | | | (3,809,052 | ) | | | (34,389,999 | ) | | | (7,349,480 | ) | | | (67,125,391 | ) |
| | | | (1,900,883 | ) | | | (17,299,640 | ) | | | (4,447,844 | ) | | | (40,688,252 | ) |
| Class C Shares | | | | | | | | | | | | | | | | |
Shares sold | | | 447,480 | | | | 3,743,293 | | | | 739,905 | | | | 6,433,199 | |
Reinvestment of distributions | | | 19,156 | | | | 156,508 | | | | 104,087 | | | | 890,779 | |
Shares redeemed | | | (1,588,503 | ) | | | (13,595,931 | ) | | | (910,626 | ) | | | (7,911,630 | ) |
| | | | (1,121,867 | ) | | | (9,696,130 | ) | | | (66,634 | ) | | | (587,652 | ) |
| Institutional Shares | | | | | | | | | | | | | | | | |
Shares sold | | | 75,029,251 | | | | 690,031,697 | | | | 79,374,935 | | | | 741,294,580 | |
Reinvestment of distributions | | | 1,222,896 | | | | 10,892,096 | | | | 5,964,324 | | | | 55,239,301 | |
Shares redeemed | | | (154,271,524 | ) | | | (1,430,199,546 | ) | | | (52,446,579 | ) | | | (489,723,270 | ) |
| | | | (78,019,377 | ) | | | (729,275,753 | ) | | | 32,892,680 | | | | 306,810,611 | |
| Class IR Shares | | | | | | | | | | | | | | | | |
Shares sold | | | 147,709 | | | | 1,342,665 | | | | 366,147 | | | | 3,373,064 | |
Reinvestment of distributions | | | 12,287 | | | | 108,647 | | | | 33,655 | | | | 308,615 | |
Shares redeemed | | | (271,629 | ) | | | (2,492,261 | ) | | | (1,854,130 | ) | | | (17,299,166 | ) |
| | | | (111,633 | ) | | | (1,040,949 | ) | | | (1,454,328 | ) | | | (13,617,487 | ) |
| Class R Shares | | | | | | | | | | | | | | | | |
Shares sold | | | 141,186 | | | | 1,238,305 | | | | 124,430 | | | | 1,120,430 | |
Reinvestment of distributions | | | 3,312 | | | | 28,217 | | | | 9,037 | | | | 80,160 | |
Shares redeemed | | | (166,665 | ) | | | (1,461,098 | ) | | | (66,185 | ) | | | (596,747 | ) |
| | | | (22,167 | ) | | | (194,576 | ) | | | 67,282 | | | | 603,843 | |
| Class R6 Shares(a) | | | | | | | | | | | | | | | | |
Shares sold | | | 1,076 | | | | 10,005 | | | | — | | | | — | |
Reinvestment of distributions | | | 20 | | | | 175 | | | | — | | | | — | |
Shares redeemed | | | (1 | ) | | | (5 | ) | | | — | | | | — | |
| | | | 1,095 | | | | 10,175 | | | | — | | | | — | |
NET INCREASE (DECREASE) | | | (81,174,832 | ) | | $ | (757,496,873 | ) | | | 26,991,156 | | | $ | 252,521,063 | |
| (a) | | Commenced operations on July 31, 2015. |
139
GOLDMAN SACHS SELECT SATELLITE FUNDS
Notes to Financial Statements (continued)
December 31, 2015
|
| 11. SUMMARY OF SHARE TRANSACTIONS (continued) |
Share activity is as follows:
| | | | | | | | | | | | | | | | |
| | | Commodity Strategy Fund | |
| | | | |
| | | For the Fiscal Year Ended
December 31, 2015 | | | For the Fiscal Year Ended
December 31, 2014 | |
| | | | |
| | | Shares | | | Dollars | | | Shares | | | Dollars | |
| | | | |
| Class A Shares | | | | | | | | | | | | | | | | |
Shares sold | | | 15,777,633 | | | $ | 60,858,137 | | | | 20,512,123 | | | $ | 110,199,625 | |
Reinvestment of distributions | | | 16,703 | | | | 91,097 | | | | — | | | | — | |
Shares redeemed | | | (32,059,716 | ) | | | (55,857,410 | ) | | | (69,826,612 | ) | | | (390,191,468 | ) |
| | | | (16,265,380 | ) | | | 5,091,824 | | | | (49,314,489 | ) | | | (279,991,843 | ) |
| Class C Shares | | | | | | | | | | | | | | | | |
Shares sold | | | 660,998 | | | | 2,545,945 | | | | 911,506 | | | | 4,714,935 | |
Shares redeemed | | | (2,379,704 | ) | | | (3,685,351 | ) | | | (831,342 | ) | | | (4,084,164 | ) |
| | | | (1,718,706 | ) | | | (1,139,406 | ) | | | 80,164 | | | | 630,771 | |
| Institutional Shares | | | | | | | | | | | | | | | | |
Shares sold | | | 138,190,452 | | | | 560,027,434 | | | | 149,321,235 | | | | 768,062,608 | |
Reinvestment of distributions | | | 336,102 | | | | 2,121,062 | | | | 151,783 | | | | 743,118 | |
Shares redeemed | | | (281,722,880 | ) | | | (505,178,505 | ) | | | (138,038,295 | ) | | | (640,059,804 | ) |
| | | | (143,196,326 | ) | | | 56,969,991 | | | | 11,434,723 | | | | 128,745,922 | |
| Class IR Shares | | | | | | | | | | | | | | | | |
Shares sold | | | 2,054,712 | | | | 9,039,056 | | | | 2,255,318 | | | | 12,175,005 | |
Reinvestment of distributions | | | 5,006 | | | | 33,309 | | | | 422 | | | | 2,540 | |
Shares redeemed | | | (3,394,503 | ) | | | (7,237,812 | ) | | | (1,695,841 | ) | | | (7,701,901 | ) |
| | | | (1,334,785 | ) | | | 1,834,553 | | | | 559,899 | | | | 4,475,644 | |
| Class R Shares | | | | | | | | | | | | | | | | |
Shares sold | | | 433,008 | | | | 1,676,370 | | | | 239,619 | | | | 1,224,765 | |
Reinvestment of distributions | | | 57 | | | | 512 | | | | — | | | | — | |
Shares redeemed | | | (644,435 | ) | | | (529,740 | ) | | | (112,561 | ) | | | (574,616 | ) |
| | | | (211,370 | ) | | | 1,147,142 | | | | 127,058 | | | | 650,149 | |
| Class R6 Shares(a) | | | | | | | | | | | | | | | | |
Shares sold | | | 507,090 | | | | 1,623,683 | | | | — | | | | — | |
Reinvestment of distributions | | | 417 | | | | 4,381 | | | | — | | | | — | |
Shares redeemed | | | (381,465 | ) | | | (44,946 | ) | | | — | | | | — | |
| | | | 126,042 | | | | 1,583,118 | | | | — | | | | — | |
NET INCREASE (DECREASE) | | | (162,600,525 | ) | | $ | 65,487,222 | | | | (37,112,645 | ) | | $ | (145,489,357 | ) |
| (a) | | Commenced operations on July 31, 2015. |
140
GOLDMAN SACHS SELECT SATELLITE FUNDS
|
| 11. SUMMARY OF SHARE TRANSACTIONS (continued) |
Share activity is as follows:
| | | | | | | | | | | | | | | | |
| | | Dynamic Allocation Fund | |
| | | | |
| | | For the Fiscal Year Ended
December 31, 2015 | | | For the Fiscal Year Ended
December 31, 2014 | |
| | | | |
| | | Shares | | | Dollars | | | Shares | | | Dollars | |
| | | | |
| Class A Shares | | | | | | | | | | | | | | | | |
Shares sold | | | 750,022 | | | $ | 7,855,574 | | | | 1,030,298 | | | $ | 11,255,931 | |
Reinvestment of distributions | | | 142,722 | | | | 1,354,380 | | | | 436,398 | | | | 4,631,065 | |
Shares redeemed | | | (3,769,594 | ) | | | (38,882,367 | ) | | | (9,551,154 | ) | | | (103,938,035 | ) |
| | | | (2,876,850 | ) | | | (29,672,413 | ) | | | (8,084,458 | ) | | | (88,051,039 | ) |
| Class C Shares | | | | | | | | | | | | | | | | |
Shares sold | | | 153,384 | | | | 1,513,060 | | | | 269,167 | | | | 2,846,735 | |
Reinvestment of distributions | | | 90,071 | | | | 820,546 | | | | 219,704 | | | | 2,249,775 | |
Shares redeemed | | | (1,235,995 | ) | | | (12,149,296 | ) | | | (2,701,634 | ) | | | (28,528,326 | ) |
| | | | (992,540 | ) | | | (9,815,690 | ) | | | (2,212,763 | ) | | | (23,431,816 | ) |
| Institutional Shares | | | | | | | | | | | | | | | | |
Shares sold | | | 7,376,472 | | | | 76,080,653 | | | | 10,400,911 | | | | 115,411,622 | |
Reinvestment of distributions | | | 1,837,452 | | | | 17,672,094 | | | | 3,698,719 | | | | 39,848,710 | |
Shares redeemed | | | (16,507,674 | ) | | | (172,589,919 | ) | | | (21,877,895 | ) | | | (242,277,195 | ) |
| | | | (7,293,750 | ) | | | (78,837,172 | ) | | | (7,778,265 | ) | | | (87,016,863 | ) |
| Class IR Shares | | | | | | | | | | | | | | | | |
Shares sold | | | 63,902 | | | | 681,900 | | | | 753,694 | | | | 8,241,807 | |
Reinvestment of distributions | | | 35,362 | | | | 338,923 | | | | 156,499 | | | | 1,677,835 | |
Shares redeemed | | | (1,596,497 | ) | | | (16,636,857 | ) | | | (2,620,880 | ) | | | (28,911,024 | ) |
| | | | (1,497,233 | ) | | | (15,616,034 | ) | | | (1,710,687 | ) | | | (18,991,382 | ) |
| Class R Shares | | | | | | | | | | | | | | | | |
Shares sold | | | 1,890 | | | | 20,341 | | | | — | | | | — | |
Reinvestment of distributions | | | 34 | | | | 321 | | | | 66 | | | | 697 | |
Shares redeemed | | | (1,890 | ) | | | (20,133 | ) | | | — | | | | — | |
| | | | 34 | | | | 529 | | | | 66 | | | | 697 | |
| Class R6 Shares(a) | | | | | | | | | | | | | | | | |
Shares sold | | | 956 | | | | 10,006 | | | | — | | | | — | |
Reinvestment of distributions | | | 35 | | | | 334 | | | | — | | | | — | |
Shares redeemed | | | — | | | | (5 | ) | | | — | | | | — | |
| | | | 991 | | | | 10,335 | | | | — | | | | — | |
NET DECREASE | | | (12,659,348 | ) | | $ | (133,930,445 | ) | | | (19,786,107 | ) | | $ | (217,490,403 | ) |
(a) Commenced operations on July 31, 2015.
141
GOLDMAN SACHS SELECT SATELLITE FUNDS
Notes to Financial Statements (continued)
December 31, 2015
|
| 11. SUMMARY OF SHARE TRANSACTIONS (continued) |
Share activity is as follows:
| | | | | | | | | | | | | | | | |
| | | Dynamic Commodity Strategy Fund | |
| | | | |
| | | For the Fiscal Year Ended
December 31, 2015 | | | For the Period Ended
December 31, 2014(a) | |
| | | | |
| | | Shares | | | Dollars | | | Shares | | | Dollars | |
| | | | |
| Class A Shares | | | | | | | | | | | | | | | | |
Shares sold | | | 18,211 | | | $ | 122,262 | | | | 6,767 | | | $ | 63,175 | |
Shares redeemed | | | (2,559 | ) | | | (15,429 | ) | | | — | | | | — | |
| | | | 15,652 | | | | 106,833 | | | | 6,767 | | | | 63,175 | |
| Class C Shares | | | | | | | | | | | | | | | | |
Shares sold | | | — | | | | — | | | | 1,000 | | | | 10,000 | |
| | | | — | | | | — | | | | 1,000 | | | | 10,000 | |
| Institutional Shares | | | | | | | | | | | | | | | | |
Shares sold | | | 86,965 | | | | 641,926 | | | | 3,993,000 | | | | 39,930,000 | |
Shares redeemed | | | (3,886 | ) | | | (30,122 | ) | | | (100,000 | ) | | | (1,000,000 | ) |
| | | | 83,079 | | | | 611,804 | | | | 3,893,000 | | | | 38,930,000 | |
| Class IR Shares | | | | | | | | | | | | | | | | |
Shares sold | | | — | | | | — | | | | 2,500 | | | | 25,000 | |
| | | | — | | | | — | | | | 2,500 | | | | 25,000 | |
| Class R Shares | | | | | | | | | | | | | | | | |
Shares sold | | | — | | | | — | | | | 2,500 | | | | 25,000 | |
| | | | — | | | | — | | | | 2,500 | | | | 25,000 | |
NET INCREASE | | | 98,731 | | | $ | 718,637 | | | | 3,905,767 | | | $ | 39,053,175 | |
| (a) | | Commenced operations on April 30, 2014. |
142
GOLDMAN SACHS SELECT SATELLITE FUNDS
|
| 11. SUMMARY OF SHARE TRANSACTIONS (continued) |
Share activity is as follows:
| | | | | | | | | | | | | | | | |
| | | Managed Futures Strategy Fund | |
| | | | |
| | | For the Fiscal Year Ended
December 31, 2015 | | | For the Fiscal Year Ended
December 31, 2014 | |
| | | | |
| | | Shares | | | Dollars | | | Shares | | | Dollars | |
| | | | |
| Class A Shares | | | | | | | | | | | | | | | | |
Shares sold | | | 2,665,760 | | | $ | 28,258,440 | | | | 231,138 | | | $ | 2,296,206 | |
Reinvestment of distributions | | | 85,521 | | | | 871,464 | | | | 2,833 | | | | 26,861 | |
Shares redeemed | | | (680,290 | ) | | | (7,190,542 | ) | | | (88,805 | ) | | | (849,968 | ) |
| | | | 2,070,991 | | | | 21,939,362 | | | | 145,166 | | | | 1,473,099 | |
| Class C Shares | | | | | | | | | | | | | | | | |
Shares sold | | | 227,775 | | | | 2,350,890 | | | | 24,129 | | | | 228,464 | |
Reinvestment of distributions | | | 10,227 | | | | 101,551 | | | | 973 | | | | 9,019 | |
Shares redeemed | | | (25,775 | ) | | | (259,704 | ) | | | (85,511 | ) | | | (796,285 | ) |
| | | | 212,227 | | | | 2,192,737 | | | | (60,409 | ) | | | (558,802 | ) |
| Institutional Shares | | | | | | | | | | | | | | | | |
Shares sold | | | 1,773,788 | | | | 18,961,451 | | | | 1,428,209 | | | | 13,893,562 | |
Reinvestment of distributions | | | 320,554 | | | | 3,314,526 | | | | 86,648 | | | | 830,088 | |
Shares redeemed | | | (2,660,604 | ) | | | (28,531,911 | ) | | | (3,021,711 | ) | | | (29,484,291 | ) |
| | | | (566,262 | ) | | | (6,255,934 | ) | | | (1,506,854 | ) | | | (14,760,641 | ) |
| Class IR Shares | | | | | | | | | | | | | | | | |
Shares sold | | | 628,007 | | | | 6,730,109 | | | | 11,578 | | | | 111,435 | |
Reinvestment of distributions | | | 23,839 | | | | 244,828 | | | | 418 | | | | 3,992 | |
Shares redeemed | | | (61,745 | ) | | | (652,304 | ) | | | (9,930 | ) | | | (95,449 | ) |
| | | | 590,101 | | | | 6,322,633 | | | | 2,066 | | | | 19,978 | |
| Class R Shares | | | | | | | | | | | | | | | | |
Shares sold | | | 10,014 | | | | 105,572 | | | | 928 | | | | 8,907 | |
Reinvestment of distributions | | | 700 | | | | 7,072 | | | | 85 | | | | 796 | |
Shares redeemed | | | (58 | ) | | | (614 | ) | | | (1,065 | ) | | | (10,220 | ) |
| | | | 10,656 | | | | 112,030 | | | | (52 | ) | | | (517 | ) |
NET INCREASE (DECREASE) | | | 2,317,713 | | | $ | 24,310,828 | | | | (1,420,083 | ) | | $ | (13,826,883 | ) |
143
GOLDMAN SACHS SELECT SATELLITE FUNDS
Notes to Financial Statements (continued)
December 31, 2015
|
| 11. SUMMARY OF SHARE TRANSACTIONS (continued) |
Share activity is as follows:
| | | | | | | | |
| | | Global Real Estate Securities Fund(a) | |
| | | | |
| | | For the Period Ended
December 31, 2015 | |
| | | | |
| | | Shares | | | Dollars | |
| | | | |
| Class A Shares | | | | | | | | |
Shares sold | | | 2,501 | | | $ | 25,005 | |
Reinvestment of distributions | | | 31 | | | | 327 | |
| | | | 2,532 | | | | 25,332 | |
| Class C Shares | | | | | | | | |
Shares sold | | | 2,499 | | | | 25,005 | |
Reinvestment of distributions | | | 27 | | | | 278 | |
Shares redeemed | | | — | | | | (4 | ) |
| | | | 2,526 | | | | 25,279 | |
| Institutional Shares | | | | | | | | |
Shares sold | | | 287,501 | | | | 2,875,010 | |
Reinvestment of distributions | | | 3,892 | | | | 40,703 | |
Shares redeemed | | | — | | | | (5 | ) |
| | | | 291,393 | | | | 2,915,708 | |
| Class IR Shares | | | | | | | | |
Shares sold | | | 2,500 | | | | 25,005 | |
Reinvestment of distributions | | | 33 | | | | 345 | |
Shares redeemed | | | — | | | | (5 | ) |
| | | | 2,533 | | | | 25,345 | |
| Class R Shares | | | | | | | | |
Shares sold | | | 2,501 | | | | 25,005 | |
Reinvestment of distributions | | | 30 | | | | 312 | |
Shares redeemed | | | (1 | ) | | | (5 | ) |
| | | | 2,530 | | | | 25,312 | |
| Class R6 Shares | | | | | | | | |
Shares sold | | | 2,501 | | | | 25,005 | |
Reinvestment of distributions | | | 34 | | | | 356 | |
Shares redeemed | | | (1 | ) | | | (5 | ) |
| | | | 2,534 | | | | 25,356 | |
NET INCREASE | | | 304,048 | | | $ | 3,042,332 | |
| (a) | | Commenced operations on August 31, 2015. |
144
GOLDMAN SACHS SELECT SATELLITE FUNDS
|
| 11. SUMMARY OF SHARE TRANSACTIONS (continued) |
Share activity is as follows:
| | | | | | | | | | | | | | | | |
| | | International Real Estate Securities Fund | |
| | | | |
| | | For the Fiscal Year Ended
December 31, 2015 | | | For the Fiscal Year Ended
December 31, 2014 | |
| | | | |
| | | Shares | | | Dollars | | | Shares | | | Dollars | |
| | | | |
| Class A Shares | | | | | | | | | | | | | | | | |
Shares sold | | | 235,165 | | | $ | 1,545,606 | | | | 193,534 | | | $ | 1,272,588 | |
Reinvestment of distributions | | | 32,208 | | | | 201,988 | | | | 56,191 | | | | 369,658 | |
Shares redeemed | | | (573,005 | ) | | | (3,716,305 | ) | | | (904,899 | ) | | | (5,948,781 | ) |
| | | | (305,632 | ) | | | (1,968,711 | ) | | | (655,174 | ) | | | (4,306,535 | ) |
| Class C Shares | | | | | | | | | | | | | | | | |
Shares sold | | | 14,440 | | | | 92,546 | | | | 10,577 | | | | 68,994 | |
Reinvestment of distributions | | | 3,945 | | | | 24,718 | | | | 7,672 | | | | 50,297 | |
Shares redeemed | | | (59,706 | ) | | | (382,082 | ) | | | (95,498 | ) | | | (620,170 | ) |
| | | | (41,321 | ) | | | (264,818 | ) | | | (77,249 | ) | | | (500,879 | ) |
| Institutional Shares | | | | | | | | | | | | | | | | |
Shares sold | | | 9,612,020 | | | | 59,364,280 | | | | 14,110,201 | | | | 88,210,178 | |
Reinvestment of distributions | | | 1,650,869 | | | | 10,053,554 | | | | 2,246,357 | | | | 14,354,444 | |
Shares redeemed | | | (16,094,291 | ) | | | (101,134,181 | ) | | | (15,989,928 | ) | | | (101,732,416 | ) |
| | | | (4,831,402 | ) | | | (31,716,347 | ) | | | 366,630 | | | | 832,206 | |
| Class IR Shares | | | | | | | | | | | | | | | | |
Shares sold | | | 4,678 | | | | 28,711 | | | | 430 | | | | 2,789 | |
Reinvestment of distributions | | | 390 | | | | 2,423 | | | | 2,675 | | | | 17,794 | |
Shares redeemed | | | (21,002 | ) | | | (138,147 | ) | | | (118,228 | ) | | | (798,154 | ) |
| | | | (15,934 | ) | | | (107,013 | ) | | | (115,123 | ) | | | (777,571 | ) |
| Class R6 Shares(a) | | | | | | | | | | | | | | | | |
Shares sold | | | 1,581 | | | | 10,005 | | | | — | | | | — | |
Reinvestment of distributions | | | 27 | | | | 163 | | | | — | | | | — | |
Shares redeemed | | | (1 | ) | | | (5 | ) | | | — | | | | — | |
| | | | 1,607 | | | | 10,163 | | | | — | | | | — | |
NET DECREASE | | | (5,192,682 | ) | | $ | (34,046,726 | ) | | | (480,916 | ) | | $ | (4,752,779 | ) |
| (a) | | Commenced operations on July 31, 2015. |
145
GOLDMAN SACHS SELECT SATELLITE FUNDS
Notes to Financial Statements (continued)
December 31, 2015
|
| 11. SUMMARY OF SHARE TRANSACTIONS (continued) |
Share activity is as follows:
| | | | | | | | | | | | | | | | |
| | | Real Estate Securities Fund | |
| | | | |
| | | For the Fiscal Year Ended
December 31, 2015 | | | For the Fiscal Year Ended
December 31, 2014 | |
| | | | |
| | | Shares | | | Dollars | | | Shares | | | Dollars | |
| | | | |
| Class A Shares | | | | | | | | | | | | | | | | |
Shares sold | | | 1,006,054 | | | $ | 20,162,437 | | | | 2,318,159 | | | $ | 41,741,751 | |
Shares converted from Class B | | | — | | | | — | | | | 7,514 | | | | 139,146 | |
Reinvestment of distributions | | | 110,637 | | | | 2,112,841 | | | | 48,278 | | | | 842,437 | |
Shares redeemed | | | (1,846,694 | ) | | | (37,000,156 | ) | | | (2,007,408 | ) | | | (35,830,234 | ) |
| | | | (730,003 | ) | | | (14,724,878 | ) | | | 366,543 | | | | 6,893,100 | |
| Class B Shares(a) | | | | | | | | | | | | | | | | |
Shares sold | | | — | | | | — | | | | 465 | | | | 6,860 | |
Shares converted to Class A | | | — | | | | — | | | | (7,571 | ) | | | (139,146 | ) |
Reinvestment of distributions | | | — | | | | — | | | | 394 | | | | 6,788 | |
Shares redeemed | | | — | | | | — | | | | (44,223 | ) | | | (814,617 | ) |
| | | | — | | | | — | | | | (50,935 | ) | | | (940,115 | ) |
| Class C Shares | | | | | | | | | | | | | | | | |
Shares sold | | | 139,919 | | | | 2,753,523 | | | | 193,402 | | | | 3,416,931 | |
Reinvestment of distributions | | | 27,256 | | | | 504,925 | | | | 7,181 | | | | 121,939 | |
Shares redeemed | | | (230,035 | ) | | | (4,407,019 | ) | | | (161,954 | ) | | | (2,796,947 | ) |
| | | | (62,860 | ) | | | (1,148,571 | ) | | | 38,629 | | | | 741,923 | |
| Institutional Shares | | | | | | | | | | | | | | | | |
Shares sold | | | 4,760,677 | | | | 94,751,120 | | | | 4,917,660 | | | | 86,874,616 | |
Reinvestment of distributions | | | 1,067,838 | | | | 20,746,124 | | | | 479,131 | | | | 8,490,777 | |
Shares redeemed | | | (7,540,815 | ) | | | (151,932,009 | ) | | | (7,061,894 | ) | | | (129,153,256 | ) |
| | | | (1,712,300 | ) | | | (36,434,765 | ) | | | (1,665,103 | ) | | | (33,787,863 | ) |
| Service Shares | | | | | | | | | | | | | | | | |
Shares sold | | | 40,767 | | | | 807,285 | | | | 55,135 | | | | 997,961 | |
Reinvestment of distributions | | | 2,316 | | | | 44,342 | | | | 831 | | | | 14,573 | |
Shares redeemed | | | (80,757 | ) | | | (1,603,897 | ) | | | (92,849 | ) | | | (1,629,588 | ) |
| | | | (37,674 | ) | | | (752,270 | ) | | | (36,883 | ) | | | (617,054 | ) |
| Class IR Shares | | | | | | | | | | | | | | | | |
Shares sold | | | 111,670 | | | | 2,221,821 | | | | 332,746 | | | | 6,010,950 | |
Reinvestment of distributions | | | 15,718 | | | | 300,673 | | | | 3,455 | | | | 61,153 | |
Shares redeemed | | | (104,014 | ) | | | (2,118,190 | ) | | | (41,331 | ) | | | (767,172 | ) |
| | | | 23,374 | | | | 404,304 | | | | 294,870 | | | | 5,304,931 | |
| Class R Shares | | | | | | | | | | | | | | | | |
Shares sold | | | 132,636 | | | | 2,603,096 | | | | 80,368 | | | | 1,461,201 | |
Reinvestment of distributions | | | 4,378 | | | | 82,799 | | | | 798 | | | | 13,903 | |
Shares redeemed | | | (70,413 | ) | | | (1,371,525 | ) | | | (37,831 | ) | | | (684,886 | ) |
| | | | 66,601 | | | | 1,314,370 | | | | 43,335 | | | | 790,218 | |
| Class R6 Shares(b) | | | | | | | | | | | | | | | | |
Shares sold | | | 502 | | | | 10,005 | | | | — | | | | — | |
Reinvestment of distributions | | | 17 | | | | 326 | | | | — | | | | — | |
Shares redeemed | | | — | | | | (5 | ) | | | — | | | | — | |
| | | | 519 | | | | 10,326 | | | | — | | | | — | |
NET DECREASE | | | (2,452,343 | ) | | $ | (51,331,484 | ) | | | (1,009,544 | ) | | $ | (21,614,860 | ) |
| (a) | | Class B Shares were converted into Class A Shares at the close of business on November 14, 2014. |
| (b) | | Commenced operations on July 31, 2015. |
146
Report of Independent Registered Public
Accounting Firm
To the Board of Trustees of Goldman Sachs Trust and Shareholders of
Goldman Sachs Select Satellite Funds:
In our opinion, the accompanying statements of assets and liabilities, including the schedules of investments, and the related statements of operations and of changes in net assets and the financial highlights present fairly, in all material respects, the financial position of Goldman Sachs Absolute Return Tracker Fund, Goldman Sachs Commodity Strategy Fund, Goldman Sachs Dynamic Allocation Fund, Goldman Sachs Dynamic Commodity Strategy Fund, Goldman Sachs Managed Futures Strategy Fund, Goldman Sachs Global Real Estate Securities Fund, Goldman Sachs International Real Estate Securities Fund and Goldman Sachs Real Estate Securities Fund (collectively the “Funds”), funds of Goldman Sachs Trust, at December 31, 2015, and the results of each of their operations, the changes in each of their net assets and the financial highlights for each of the periods indicated, in conformity with accounting principles generally accepted in the United States of America. These financial statements and financial highlights (consolidated financial statements and financial highlights for Goldman Sachs Absolute Return Tracker Fund, Goldman Sachs Commodity Strategy Fund, Goldman Sachs Dynamic Allocation Fund, and Goldman Sachs Dynamic Commodity Strategy Fund) (hereafter referred to as “financial statements”) are the responsibility of the Funds’ management. Our responsibility is to express an opinion on these financial statements based on our audits. We conducted our audits of these financial statements in accordance with the standards of the Public Company Accounting Oversight Board (United States). Those standards require that we plan and perform the audit to obtain reasonable assurance about whether the financial statements are free of material misstatement. An audit includes examining, on a test basis, evidence supporting the amounts and disclosures in the financial statements, assessing the accounting principles used and significant estimates made by management, and evaluating the overall financial statement presentation. We believe that our audits, which included confirmation of securities at December 31, 2015 by correspondence with the custodian, brokers, transfer agent of the underlying funds and the application of alternative auditing procedures where confirmation of securities purchased had not been received, provide a reasonable basis for the opinion expressed above.
PricewaterhouseCoopers LLP
Boston, Massachusetts
February 26, 2016
147
GOLDMAN SACHS SELECT SATELLITE FUNDS
Fund Expenses — Six Month Period Ended December 31, 2015 (Unaudited)
As a shareholder of Class A, Class C, Institutional, Service, Class IR, Class R or Class R6 Shares of a Fund you incur two types of costs: (1) transaction costs, including sales charges on purchase payments (with respect to Class A Shares) and contingent deferred sales charges on redemptions (with respect to Class C Shares); and (2) ongoing costs, including management fees; distribution and service (12b-1) fees (with respect to Class A, Class C and Class R Shares); and other Fund expenses. This example is intended to help you understand your ongoing costs (in dollars) of investing in Class A, Class C, Institutional, Service, Class IR, Class R and Class R6 Shares of the Funds and to compare these costs with the ongoing costs of investing in other mutual funds.
The example is based on an investment of $1,000 invested at the beginning of the period and held for the entire period from July 1, 2015 through December 31, 2015, which represents a period of 184 days of a 365 day year for the Absolute Return Tracker, Commodity Strategy, Dynamic Allocation, Dynamic Commodity Strategy, Managed Futures Strategy, International Real Estate Securities and Real Estate Securities Funds. The Global Real Estate Securities Example is based on the period from August 31, 2015 to December 31, 2015, which represents a period of 123 out of 365 days. The Class R6 Example is based on the period from July 31, 2015 through December 31, 2015, which represents a period of 153 out of 365 days.
Actual Expenses — The first line under each share class in the table below provides information about actual account values and actual expenses. You may use the information in this line, together with the amount you invested, to estimate the expenses that you paid over the period. Simply divide your account value by $1,000 (for example, an $8,600 account value divided by $1,000=8.6), then multiply the result by the number in the first line under the heading entitled “Expenses Paid” to estimate the expenses you paid on your account during this period.
Hypothetical Example for Comparison Purposes — The second line under each share class in the table below provides information about hypothetical account values and hypothetical expenses based on the Funds’ actual net expense ratio and an assumed rate of return of 5% per year before expenses, which is not the Funds’ actual return. The hypothetical account values and expenses may not be used to estimate the actual ending account balance or expenses you paid for the period. You may use this information to compare the ongoing costs of investing in the Funds and other funds. To do so, compare this 5% hypothetical example with the 5% hypothetical examples that appear in the shareholder reports of the other funds.
Please note that the expenses shown in the table are meant to highlight your ongoing costs only and do not reflect any transactional costs, such as sales charges, redemption fees, or exchange fees. Therefore, the second line of the table is useful in comparing ongoing costs only, and will not help you determine the relative total costs of owning different funds. In addition, if these transactional costs were included, your costs would have been higher.
| | | | | | | | | | | | | | | | | | | | | | | | | | | | | | | | | | | | | | | | | | | | | | | | |
| | | Absolute Return Tracker Fund | | | Commodity Strategy Fund | | | Dynamic Allocation Fund | | | Dynamic Commodity Strategy Fund | |
| Share Class | | Beginning
Account
Value
07/01/15 | | | Ending
Account
Value
12/31/15 | | | Expenses
Paid for the
6 Months Ended
12/31/15* | | | Beginning
Account
Value
07/01/15 | | | Ending
Account
Value
12/31/15 | | | Expenses
Paid for the
6 Months Ended
12/31/15* | | | Beginning
Account
Value
07/01/15 | | | Ending
Account
Value
12/31/15 | | | Expenses
Paid for the
6 Months Ended
12/31/15* | | | Beginning
Account
Value
07/01/15 | | | Ending
Account
Value
12/31/15 | | | Expenses
Paid for the
6 Months Ended
12/31/15* | |
| Class A | | | | | | | | | | | | | | | | | | | | | | | | | | | | | | | | | | | | | | | | | | | | | | | | |
Actual | | $ | 1,000 | | | $ | 967.90 | | | $ | 5.16 | | | $ | 1,000 | | | $ | 684.10 | | | $ | 3.65 | | | $ | 1,000 | | | $ | 936.30 | | | $ | 5.71 | | | $ | 1,000 | | | $ | 788.70 | | | $ | 4.78 | |
Hypothetical 5% return | | | 1,000 | | | | 1,019.96 | + | | | 5.30 | | | | 1,000 | | | | 1,020.87 | + | | | 4.38 | | | | 1,000 | | | | 1,019.31 | + | | | 5.96 | | | | 1,000 | | | | 1,019.86 | + | | | 5.40 | |
| Class C | | | | | | | | | | | | | | | | | | | | | | | | | | | | | | | | | | | | | | | | | | | | | | | | |
Actual | | | 1,000 | | | | 964.60 | | | | 8.86 | | | | 1,000 | | | | 683.20 | | | | 6.83 | | | | 1,000 | | | | 931.90 | | | | 9.35 | | | | 1,000 | | | | 785.40 | | | | 8.06 | |
Hypothetical 5% return | | | 1,000 | | | | 1,016.18 | + | | | 9.10 | | | | 1,000 | | | | 1,017.09 | + | | | 8.19 | | | | 1,000 | | | | 1,015.53 | + | | | 9.75 | | | | 1,000 | | | | 1,016.18 | + | | | 9.10 | |
| Institutional | | | | | | | | | | | | | | | | | | | | | | | | | | | | | | | | | | | | | | | | | | | | | | | | |
Actual | | | 1,000 | | | | 968.80 | | | | 3.18 | | | | 1,000 | | | | 683.90 | | | | 2.21 | | | | 1,000 | | | | 937.80 | | | | 3.71 | | | | 1,000 | | | | 789.50 | | | | 3.20 | |
Hypothetical 5% return | | | 1,000 | | | | 1,021.98 | + | | | 3.26 | | | | 1,000 | | | | 1,022.58 | + | | | 2.65 | | | | 1,000 | | | | 1,021.37 | + | | | 3.87 | | | | 1,000 | | | | 1,021.63 | + | | | 3.62 | |
| Service | | | | | | | | | | | | | | | | | | | | | | | | | | | | | | | | | | | | | | | | | | | | | | | | |
Actual | | | N/A | | | | N/A | | | | N/A | | | | N/A | | | | N/A | | | | N/A | | | | N/A | | | | N/A | | | | N/A | | | | N/A | | | | N/A | | | | N/A | |
Hypothetical 5% return | | | N/A | | | | N/A | | | | N/A | | | | N/A | | | | N/A | | | | N/A | | | | N/A | | | | N/A | | | | N/A | | | | N/A | | | | N/A | | | | N/A | |
| Class IR | | | | | | | | | | | | | | | | | | | | | | | | | | | | | | | | | | | | | | | | | | | | | | | | |
Actual | | | 1,000 | | | | 968.20 | | | | 3.92 | | | | 1,000 | | | | 686.40 | | | | 2.59 | | | | 1,000 | | | | 937.20 | | | | 4.49 | | | | 1,000 | | | | 789.30 | | | | 3.61 | |
Hypothetical 5% return | | | 1,000 | | | | 1,021.22 | + | | | 4.02 | | | | 1,000 | | | | 1,022.13 | + | | | 3.11 | | | | 1,000 | | | | 1,020.57 | + | | | 4.69 | | | | 1,000 | | | | 1,021.17 | + | | | 4.08 | |
| Class R | | | | | | | | | | | | | | | | | | | | | | | | | | | | | | | | | | | | | | | | | | | | | | | | |
Actual | | | 1,000 | | | | 966.40 | | | | 6.39 | | | | 1,000 | | | | 681.80 | | | | 4.71 | | | | 1,000 | | | | 934.60 | | | | 6.88 | | | | 1,000 | | | | 786.80 | | | | 5.85 | |
Hypothetical 5% return | | | 1,000 | | | | 1,018.70 | + | | | 6.56 | | | | 1,000 | | | | 1,019.61 | + | | | 5.65 | | | | 1,000 | | | | 1,018.10 | + | | | 7.17 | | | | 1,000 | | | | 1,018.65 | + | | | 6.61 | |
| Class R6(a) | | | | | | | | | | | | | | | | | | | | | | | | | | | | | | | | | | | | | | | | | | | | | | | | |
Actual | | | 1,000 | | | | 970.20 | | | | 2.57 | | | | 1,000 | | | | 787.70 | | | | 1.89 | | | | 1,000 | | | | 945.20 | | | | 2.53 | | | | N/A | | | | N/A | | | | N/A | |
Hypothetical 5% return | | | 1,000 | | | | 1,022.03 | + | | | 3.21 | | | | 1,000 | | | | 1,022.63 | + | | | 2.60 | | | | 1,000 | | | | 1,022.03 | + | | | 3.21 | | | | N/A | | | | N/A | | | | N/A | |
| * | | Expenses are calculated using each Fund’s annualized net expense ratio for each class, which represents the ongoing expenses as a percentage of net assets for the six months ended December 31, 2015. Expenses are calculated by multiplying the annualized net expense ratio by the average account value for the period; then multiplying the result by the number of days in the most recent fiscal half year; and then dividing that result by the number of days in the fiscal year. The annualized net expense ratios for the period were as follows: |
| | | | | | | | | | | | | | | | | | | | | | | | | | | | |
| Fund | | Class A | | | Class C | | | Institutional | | | Service | | | Class IR | | | Class R | | | Class R6(a) | |
Absolute Return Tracker | | | 1.04 | % | | | 1.79 | % | | | 0.64 | % | | | N/A | | | | 0.79 | % | | | 1.29 | % | | | 0.63 | % |
Commodity Strategy | | | 0.86 | | | | 1.61 | | | | 0.52 | | | | N/A | | | | 0.61 | | | | 1.11 | | | | 0.51 | |
Dynamic Allocation | | | 1.17 | | | | 1.92 | | | | 0.76 | | | | N/A | | | | 0.92 | | | | 1.41 | | | | 0.77 | |
Dynamic Commodity | | | 1.06 | | | | 1.79 | | | | 0.71 | | | | N/A | | | | 0.80 | | | | 1.30 | | | | N/A | |
| | + | | Hypothetical expenses are based on each Fund’s actual annualized net expense ratios and an assumed rate of return of 5% per year before expenses. | |
148
GOLDMAN SACHS SELECT SATELLITE FUNDS
Fund Expenses — Six Month Period Ended December 31, 2015 (Unaudited) (continued)
| | | | | | | | | | | | | | | | | | | | | | | | | | | | | | | | | | | | | | | | | | | | | | | | |
| | | Managed Futures Strategy Fund | | | Global Real Estate Securities Fund(b) | | | International Real Estate Securities Fund | | | Real Estate Securities Fund | |
| Share Class | | Beginning
Account
Value
07/01/15 | | | Ending
Account
Value
12/31/15 | | | Expenses
Paid for the
6 Months Ended
12/31/15* | | | Beginning
Account
Value
08/31/15 | | | Ending
Account
Value
12/31/15 | | | Expenses
Paid for the
6 Months Ended
12/31/15* | | | Beginning
Account
Value
07/01/15 | | | Ending
Account
Value
12/31/15 | | | Expenses
Paid for the
6 Months Ended
12/31/15* | | | Beginning
Account
Value
07/01/15 | | | Ending
Account
Value
12/31/15 | | | Expenses
Paid for the
6 Months Ended
12/31/15* | |
| Class A | | | | | | | | | | | | | | | | | | | | | | | | | | | | | | | | | | | | | | | | | | | | | | | | |
Actual | | $ | 1,000 | | | $ | 1,026.80 | | | $ | 8.02 | | | $ | 1,000 | | | $ | 1,057.10 | | | $ | 4.81 | | | $ | 1,000 | | | $ | 956.40 | | | $ | 6.85 | | | $ | 1,000 | | | $ | 1,095.90 | | | $ | 6.92 | |
Hypothetical 5% return | | | 1,000 | | | | 1,017.29 | + | | | 7.98 | | | | 1,000 | | | | 1,018.15 | + | | | 7.12 | | | | 1,000 | | | | 1,018.20 | + | | | 7.07 | | | | 1,000 | | | | 1,018.60 | + | | | 6.67 | |
| Class C | | | | | | | | | | | | | | | | | | | | | | | | | | | | | | | | | | | | | | | | | | | | | | | | |
Actual | | | 1,000 | | | | 1,023.30 | | | | 11.83 | | | | 1,000 | | | | 1,054.10 | | | | 7.38 | | | | 1,000 | | | | 952.50 | | | | 10.53 | | | | 1,000 | | | | 1,091.90 | | | | 10.86 | |
Hypothetical 5% return | | | 1,000 | | | | 1,013.51 | + | | | 11.77 | | | | 1,000 | | | | 1,014.37 | + | | | 10.92 | | | | 1,000 | | | | 1,014.42 | + | | | 10.87 | | | | 1,000 | | | | 1,014.82 | + | | | 10.46 | |
| Institutional | | | | | | | | | | | | | | | | | | | | | | | | | | | | | | | | | | | | | | | | | | | | | | | | |
Actual | | | 1,000 | | | | 1,029.70 | | | | 5.99 | | | | 1,000 | | | | 1,058.10 | | | | 3.44 | | | | 1,000 | | | | 958.80 | | | | 4.89 | | | | 1,000 | | | | 1,098.00 | | | | 4.81 | |
Hypothetical 5% return | | | 1,000 | | | | 1,019.31 | + | | | 5.96 | | | | 1,000 | | | | 1,020.16 | + | | | 5.09 | | | | 1,000 | | | | 1,020.21 | + | | | 5.04 | | | | 1,000 | | | | 1,020.62 | + | | | 4.63 | |
| Service | | | | | | | | | | | | | | | | | | | | | | | | | | | | | | | | | | | | | | | | | | | | | | | | |
Actual | | | N/A | | | | N/A | | | | N/A | | | | N/A | | | | N/A | | | | N/A | | | | N/A | | | | N/A | | | | N/A | | | | 1,000 | | | | 1,095.60 | | | | 7.45 | |
Hypothetical 5% return | | | N/A | | | | N/A | | | | N/A | | | | N/A | | | | N/A | | | | N/A | | | | N/A | | | | N/A | | | | N/A | | | | 1,000 | | | | 1,018.10 | + | | | 7.17 | |
| Class IR | | | | | | | | | | | | | | | | | | | | | | | | | | | | | | | | | | | | | | | | | | | | | | | | |
Actual | | | 1,000 | | | | 1,028.90 | | | | 6.75 | | | | 1,000 | | | | 1,057.80 | | | | 3.99 | | | | 1,000 | | | | 956.00 | | | | 5.62 | | | | 1,000 | | | | 1,097.40 | | | | 5.60 | |
Hypothetical 5% return | | | 1,000 | | | | 1,018.55 | + | | | 6.72 | | | | 1,000 | | | | 1,019.36 | + | | | 5.90 | | | | 1,000 | | | | 1,019.46 | + | | | 5.80 | | | | 1,000 | | | | 1,019.86 | + | | | 5.40 | |
| Class R | | | | | | | | | | | | | | | | | | | | | | | | | | | | | | | | | | | | | | | | | | | | | | | | |
Actual | | | 1,000 | | | | 1,025.20 | | | | 9.29 | | | | 1,000 | | | | 1,056.50 | | | | 5.67 | | | | N/A | | | | N/A | | | | N/A | | | | 1,000 | | | | 1,094.70 | | | | 8.24 | |
Hypothetical 5% return | | | 1,000 | | | | 1,016.03 | + | | | 9.25 | | | | 1,000 | | | | 1,016.89 | + | | | 8.39 | | | | N/A | | | | N/A | | | | N/A | | | | 1,000 | | | | 1,017.34 | + | | | 7.93 | |
| Class R6(a) | | | | | | | | | | | | | | | | | | | | | | | | | | | | | | | | | | | | | | | | | | | | | | | | |
Actual | | | N/A | | | | N/A | | | | N/A | | | | 1,000 | | | | 1,058.20 | | | | 3.37 | | | | 1,000 | | | | 949.70 | | | | 3.99 | | | | 1,000 | | | | 1,095.60 | | | | 3.94 | |
Hypothetical 5% return | | | N/A | | | | N/A | + | | | N/A | | | | 1,000 | | | | 1,020.27 | + | | | 4.99 | | | | 1,000 | | | | 1,021.21 | + | | | 5.04 | | | | 1,000 | | | | 1,020.62 | + | | | 4.63 | |
| * | | Expenses are calculated using each Fund’s annualized net expense ratio for each class, which represents the ongoing expenses as a percentage of net assets for the six months ended December 31, 2015. Expenses are calculated by multiplying the annualized net expense ratio by the average account value for the period; then multiplying the result by the number of days in the most recent fiscal half year; and then dividing that result by the number of days in the fiscal year. The annualized net expense ratios for the period were as follows: |
| | | | | | | | | | | | | | | | | | | | | | | | | | | | |
| Fund | | Class A | | | Class C | | | Institutional | | | Service | | | Class IR | | | Class R | | | Class R6(a) | |
Managed Futures Strategy | | | 1.57 | % | | | 2.32 | % | | | 1.17 | % | | | N/A | | | | 1.32 | % | | | 1.82 | % | | | N/A | |
Global Real Estate Securities | | | 1.40 | | | | 2.15 | | | | 1.00 | | | | N/A | | | | 1.15 | | | | 1.65 | | | | 0.97 | % |
International Real Estate Securities | | | 1.39 | | | | 2.14 | | | | 0.99 | | | | N/A | | | | 1.14 | | | | N/A | | | | 0.99 | |
Real Estate Securities | | | 1.31 | | | | 2.06 | | | | 0.91 | | | | 1.41 | % | | | 1.06 | | | | 1.56 | | | | 0.91 | |
| | + | | Hypothetical expenses are based on each Fund’s actual annualized net expense ratios and an assumed rate of return of 5% per year before expenses. | |
| | (a) | | Commenced operations on July 31, 2015. | |
| | (b) | | Commenced operations on August 31, 2015. | |
149
GOLDMAN SACHS SELECT SATELLITE FUNDS
Statement Regarding Basis for Initial Approval of Management Agreement (Unaudited)
Background
The Goldman Sachs Global Real Estate Securities Fund (the “Fund”) is a newly-organized investment portfolio of Goldman Sachs Trust (the “Trust”) that commenced investment operations on August 31, 2015. At a meeting held on August 12-13, 2015 (the “Meeting”) in connection with the Fund’s organization, the Trustees, including all of the Trustees present who are not parties to the Fund’s investment management agreement (the “Management Agreement”) or “interested persons” (as defined in the Investment Company Act of 1940, as amended) of any party thereto (the “Independent Trustees”) approved the Management Agreement with Goldman Sachs Asset Management, L.P. (the “Investment Adviser”).
At the Meeting, the Trustees reviewed the Management Agreement, including information regarding the terms of the Management Agreement; the nature, extent and quality of the Investment Adviser’s anticipated services; the fees and expenses to be paid by the Fund; a comparison of the Fund’s proposed management fees and anticipated expenses with those paid by other similar mutual funds; the Investment Adviser’s proposal to limit certain expenses of the Fund that exceed a specified level; and potential benefits to be derived by the Investment Adviser and its affiliates from their relationships with the Fund. Various information was also provided at a prior meeting at which the Fund was discussed.
In connection with the Meeting, the Trustees received written materials and oral presentations on the topics covered, and were advised by their independent legal counsel regarding their responsibilities under applicable law. In evaluating the Management Agreement at the Meeting, the Trustees relied upon information included in a presentation made by the Investment Adviser at the Meeting and information received at prior Board meetings, as well as on their knowledge of the Investment Adviser resulting from their meetings and other interactions over time.
Nature, Extent and Quality of the Services Provided Under the Management Agreement
As part of their review, the Trustees considered the nature, extent and quality of the services to be provided by the Investment Adviser. In this regard, the Trustees considered both the investment advisory services and non-advisory services that would be provided to the Fund by the Investment Adviser and its affiliates. The Trustees also considered information about the Fund’s structure, investment objective, strategies and other characteristics. The Trustees considered the experience and capabilities of the portfolio management team and noted that certain portfolio management personnel who would be managing the Fund were currently managing other series of the Trust. The Trustees concluded that the Investment Adviser would be able to commit substantial financial and other resources to the Fund. In this regard, the Trustees noted that, although the Fund was new (and therefore had no performance data to evaluate), the Investment Adviser had experience managing other funds and accounts that employ similar real estate-focused investment strategies. The Trustees also considered composite performance information for funds and accounts managed by the Investment Adviser that invest in similar securities. The Trustees concluded that the Investment Adviser’s management of the Fund likely would benefit the Fund and its shareholders.
Costs of Services to be Provided and Profitability
The Trustees considered the contractual terms of the Management Agreement and the fee rates payable by the Fund thereunder. In this regard, the Trustees considered information on the services to be rendered by the Investment Adviser to the Fund, which included both advisory and administrative services that were directed to the needs and operations of the Fund as a registered mutual fund.
In particular, the Trustees reviewed information on the proposed management fees and the Fund’s projected total operating expense ratios (both gross and net of expense limitations), and those were compared to similar information for comparable mutual funds advised by other, unaffiliated investment management firms, as well as the peer group and category medians. The comparisons of the Fund’s fee rates and total operating expense ratios were prepared by a third-party provider of mutual fund data. The Trustees believed that this information was useful in evaluating the reasonableness of the management fees and total expenses expected to be paid by the Fund.
The Trustees considered the Investment Adviser’s undertaking to waive a portion of its management fee and to limit certain expenses of the Fund that exceed a specified level. They also considered comparative fee information for services provided by the Investment Adviser to similarly managed funds and accounts. In addition, the Trustees recognized that there was not yet profitability data to evaluate for the Fund, but considered the Investment Adviser’s representations that (i) such data would be provided after the Fund commenced operations, and (ii) the Fund was not expected to be profitable to the Investment Adviser and its affiliates initially.
The Trustees noted the competitive nature of the fund marketplace, and that many of the Fund’s shareholders would be investing in the Fund in part because of the Fund’s relationship with the Investment Adviser. They also noted that shareholders would be able to redeem their Fund shares if they believe that the Fund fees and expenses are too high or if they are dissatisfied with the performance of the Fund.
150
GOLDMAN SACHS SELECT SATELLITE FUNDS
Statement Regarding Basis for Initial Approval of Management Agreement (Unaudited) (continued)
Economies of Scale
The Trustees considered the proposed breakpoints in the fee rate payable under the Management Agreement at the following annual percentage rates of the average daily net assets of the Fund:
| | | | |
| Average Daily Net Assets | | Management Fee Annual Rate | |
First $1 billion | | | 1.05 | % |
Next $1 billion | | | 0.95 | |
Next $3 billion | | | 0.90 | |
Next $3 billion | | | 0.88 | |
Over $8 billion | | | 0.86 | |
The Trustees noted that the breakpoints were meant to share potential economies of scale, if any, with the Fund and its shareholders as assets under management reach those asset levels. The Trustees considered the Fund’s projected asset levels and information comparing fee rates charged by the Investment Adviser with fee rates charged to other funds in the peer group, as well as the Investment Adviser’s undertaking to waive a portion of its management fee and to limit certain expenses of the Fund that exceed a specified level. Upon reviewing these matters, the Trustees concluded that the fee breakpoints represented a means of assuring that benefits of scalability, if any, would be passed along to shareholders at the specified asset levels.
Other Benefits to the Investment Adviser and Its Affiliates
The Trustees also considered the other benefits expected to be derived by the Investment Adviser and its affiliates from their relationship with the Fund, including: (a) transfer agency fees received by Goldman, Sachs & Co. (“Goldman Sachs”); (b) brokerage and futures commissions earned by Goldman Sachs for executing securities and futures transactions on behalf of the Fund; (c) research received by the Investment Adviser from broker-dealers in exchange for executing certain transactions on behalf of the Fund; (d) trading efficiencies resulting from aggregation of orders of the Fund with those for other funds or accounts managed by the Investment Adviser; (e) the Investment Adviser’s ability to leverage the infrastructure designed to service the Fund on behalf of its other clients; (f) the Investment Adviser’s ability to cross-market other products and services to Fund shareholders; (g) Goldman Sachs’ retention of certain fees as Fund Distributor; (h) the Investment Adviser’s ability to negotiate better pricing with custodians on behalf of its other clients, as a result of the relationship with the Fund; and (i) the possibility that the working relationship between the Investment Adviser and the Fund’s third-party service providers may cause those service providers to be open to doing business with other areas of Goldman Sachs.
Conclusion
In connection with their consideration of the Management Agreement for the Fund at the Meeting, the Trustees gave weight to various factors, but did not identify any particular factor as controlling their decision. After deliberation and consideration of the information provided, including the factors described above, the Trustees concluded, in the exercise of their business judgment, that the management fee that would be payable by the Fund was reasonable in light of the services to be provided to it by the Investment Adviser, the Investment Adviser’s anticipated costs and the Fund’s reasonably anticipated asset levels. The Trustees concluded that the Investment Adviser’s management likely would benefit the Fund and its shareholders and that the Management Agreement should be approved with respect to the Fund.
151
GOLDMAN SACHS SELECT SATELLITE FUNDS
Trustees and Officers (Unaudited)
Independent Trustees
| | | | | | | | | | |
Name,
Address and Age1 | | Position(s) Held with the Trust | | Term of Office and
Length of
Time Served2 | | Principal Occupation(s) During Past 5 Years | | Number of
Portfolios in
Fund Complex
Overseen by
Trustee3 | | Other Directorships Held by Trustee4 |
Ashok N. Bakhru Age: 73 | | Chairman of the Board of Trustees | | Since 1996 (Trustee since 1991) | | Mr. Bakhru is retired. He was formerly Director, Apollo Investment Corporation (a business development company) (2008-2013); President, ABN Associates (a management and financial consulting firm) (1994-1996 and 1998-2012); Trustee, Scholarship America (1998-2005); Trustee, Institute for Higher Education Policy (2003-2008); Director, Private Equity Investors — III and IV (1998-2007), and Equity-Linked Investors II (April 2002-2007). Chairman of the Board of Trustees — Goldman Sachs Fund Complex. | | 139 | | None |
Kathryn A. Cassidy Age: 61 | | Trustee | | Since 2015 | | Ms. Cassidy is retired. Formerly, she was Advisor to the Chairman (May 2014-December 2014); and Senior Vice President and Treasurer (2008-2014), General Electric Company & General Electric Capital Corporation (technology and financial services companies). Trustee — Goldman Sachs Fund Complex. | | 114 | | None |
John P. Coblentz, Jr. Age: 74 | | Trustee | | Since 2003 | | Mr. Coblentz is retired. Formerly, he was Partner, Deloitte & Touche LLP (a professional services firm) (1975-2003); Director, Emerging Markets Group, Ltd. (2004-2006); and Director, Elderhostel, Inc. (2006-2012). Trustee — Goldman Sachs Fund Complex. | | 139 | | None |
Diana M. Daniels Age: 66 | | Trustee | | Since 2007 | | Ms. Daniels is retired. Formerly, she was Vice President, General Counsel and Secretary, The Washington Post Company (1991-2006). Ms. Daniels is a Trustee Emeritus and serves as a Presidential Councillor of Cornell University (2013-Present); Member, Advisory Board, Psychology Without Borders (international humanitarian aid organization) (2007-Present), and former Member of the Legal Advisory Board, New York Stock Exchange (2003-2006) and of the Corporate Advisory Board, Standish Mellon Management Advisors (2006-2007). Trustee — Goldman Sachs Fund Complex. | | 114 | | None |
Joseph P. LoRusso Age: 58 | | Trustee | | Since 2010 | | Mr. LoRusso is retired. Formerly, he was President, Fidelity Investments Institutional Services Co. (“FIIS”) (2002-2008); Director, FIIS (2002-2008); Director, Fidelity Investments Institutional Operations Company (2003-2007); Executive Officer, Fidelity Distributors Corporation (2007-2008). Trustee — Goldman Sachs Fund Complex. | | 114 | | None |
Herbert J. Markley Age: 65 | | Trustee | | Since 2013 | | Mr. Markley is retired. Formerly, he was Executive Vice President, Deere & Company (an agricultural and construction equipment manufacturer) (2007-2009); and President, Agricultural Division, Deere & Company (2001-2007). Trustee — Goldman Sachs Fund Complex. | | 114 | | None |
Jessica Palmer Age: 66 | | Trustee | | Since 2007 | | Ms. Palmer is retired. She is Director, Emerson Center for the Arts and Culture (2011-Present); and was formerly a Consultant, Citigroup Human Resources Department (2007-2008); Managing Director, Citigroup Corporate and Investment Banking (previously, Salomon Smith Barney/Salomon Brothers) (1984-2006). Ms. Palmer was a Member of the Board of Trustees of Indian Mountain School (private elementary and secondary school) (2004-2009). Trustee — Goldman Sachs Fund Complex. | | 114 | | None |
| | | | | | | | | | |
152
GOLDMAN SACHS SELECT SATELLITE FUNDS
Trustees and Officers (Unaudited) (continued)
Independent Trustees
| | | | | | | | | | |
Name,
Address and Age1 | | Position(s) Held
with the Trust | | Term of Office and
Length of
Time Served2 | | Principal Occupation(s) During Past 5 Years | | Number of
Portfolios in
Fund Complex
Overseen by
Trustee3 | | Other Directorships Held by Trustee4 |
Richard P. Strubel Age: 76 | | Trustee | | Since 1987 | | Mr. Strubel is retired. Formerly, he served as Chairman of the Board of Trustees, Northern Funds (a family of retail and institutional mutual funds managed by Northern Trust Investments, Inc.) (2008-2014) and Trustee (1982-2014); Director, Cardean Learning Group (provider of educational services via the internet) (2003-2008); and Director, Gildan Activewear Inc. (a clothing marketing and manufacturing company) (2000-2014). He serves as Trustee Emeritus, The University of Chicago (1987-Present). Trustee — Goldman Sachs Fund Complex. | | 139 | | None |
Roy W. Templin Age: 55 | | Trustee | | Since 2013 | | Mr. Templin is retired. He is Chairman of the Board of Directors, Con-Way Incorporated (2014-Present); and was formerly Executive Vice President and Chief Financial Officer, Whirlpool Corporation (an appliance manufacturer and marketer) (2004-2012). Trustee — Goldman Sachs Fund Complex. | | 114 | | Con-Way Incorporated (a transportation, logistics and supply-chain management services company) |
Gregory G. Weaver Age: 64 | | Trustee | | Since 2015 | | Mr. Weaver is retired. He is Director, Verizon Communications Inc. (2015-Present); and was formerly Chairman and Chief Executive Officer, Deloitte & Touche LLP (a professional services firm) (2001-2005 and 2012-2014); and Member of the Board of Directors, Deloitte & Touche LLP (2006-2012). Trustee — Goldman Sachs Fund Complex. | | 114 | | Verizon Communications Inc. |
| | | | | | | | | | |
153
GOLDMAN SACHS SELECT SATELLITE FUNDS
Trustees and Officers (Unaudited) (continued)
Interested Trustees*
| | | | | | | | | | |
Name,
Address and Age1 | | Position(s) Held
with the Trust | | Term of Office and
Length of
Time Served2 | | Principal Occupation(s) During Past 5 Years | | Number of
Portfolios in
Fund Complex
Overseen by
Trustee3 | | Other Directorships Held by Trustee4 |
James A. McNamara Age: 53 | | President and Trustee | | Since 2007 | | Managing Director, Goldman Sachs (December 1998-Present); Director of Institutional Fund Sales, GSAM (April 1998-December 2000); and Senior Vice President and Manager, Dreyfus Institutional Service Corporation (January 1993- April 1998). President — Goldman Sachs Fund Complex (November 2007-Present); Senior Vice President — Goldman Sachs Fund Complex (May 2007-November 2007); and Vice President — Goldman Sachs Fund Complex (2001-2007). Trustee — Goldman Sachs Fund Complex (November 2007-Present and December 2002-May 2004). | | 138 | | None |
Alan A. Shuch Age: 66 | | Trustee | | Since 1990 | | Advisory Director — GSAM (May 1999-Present); Consultant to GSAM (December 1994-May 1999); and Limited Partner, Goldman Sachs (December 1994-May 1999). Trustee — Goldman Sachs Fund Complex. | | 114 | | None |
| | | | | | | | | | |
| * | | These persons are considered to be “Interested Trustees” because they hold positions with Goldman Sachs and own securities issued by The Goldman Sachs Group, Inc. Each Interested Trustee holds comparable positions with certain other companies of which Goldman Sachs, GSAM or an affiliate thereof is the investment adviser, administrator and/or distributor. |
| 1 | | Each Trustee may be contacted by writing to the Trustee, c/o Goldman Sachs, 200 West Street, New York, New York, 10282, Attn: Caroline Kraus. Information is provided as of December 31, 2015. |
| 2 | | Each Trustee holds office for an indefinite term until the earliest of: (a) the election of his or her successor; (b) the date the Trustee resigns or is removed by the Board of Trustees or shareholders, in accordance with the Trust’s Declaration of Trust; (c) December 31st of the year in which the Trustee turns 74 years of age, subject to waiver by a majority of the Trustees (in accordance with the current resolutions of the Board of Trustees, which may be changed by the Trustees without shareholder vote); or (d) the termination of the Trust. By resolution of the Board of Trustees determining that an extension of service would be beneficial to the Trust, the retirement age has been extended with respect to Richard P. Strubel. |
| 3 | | The Goldman Sachs Fund Complex includes the Trust and Goldman Sachs Variable Insurance Trust (“GSVIT”). As of December 31, 2015, the Trust consisted of 100 portfolios (91 of which offered shares to the public) and GSVIT consisted of 14 portfolios. The Goldman Sachs Fund Complex also includes, with respect to Messrs. Bakhru, Coblentz and Strubel, Goldman Sachs Trust II (“GSTII”), Goldman Sachs BDC, Inc. (“GSBDC”), Goldman Sachs MLP Income Opportunities Fund (“GSMLP”), Goldman Sachs MLP and Energy Renaissance Fund (“GSMER”) and Goldman Sachs ETF Trust (“GSETF”), and with respect to Mr. McNamara, GSTII, GSMLP, GSMER and GSETF. GSTII consisted of eight portfolios (six of which offered shares to the public). GSBDC, GSMLP and GSMER each consisted of one portfolio. GSETF consisted of 14 portfolios (three of which offered shares to the public). |
| 4 | | This column includes only directorships of companies required to report to the Securities and Exchange Commission under the Securities Exchange Act of 1934 (i.e., “public companies”) or other investment companies registered under the Act. |
Additional information about the Trustees is available in the Funds’ Statement of Additional Information, which can be obtained from Goldman Sachs free of charge by calling this toll-free number (in the United States of America): 1-800-526-7384.
154
GOLDMAN SACHS SELECT SATELLITE FUNDS
Trustees and Officers (Unaudited) (continued)
Officers of the Trust*
| | | | | | |
| Name, Address and Age1 | | Position(s) Held With the Trust | | Term of
Office and
Length of
Time Served2 | | Principal Occupation(s) During Past 5 Years |
James A. McNamara 200 West Street New York, NY 10282 Age: 53 | | President and Trustee | | Since 2007 | | Managing Director, Goldman Sachs (December 1998-Present); Director of Institutional Fund Sales, GSAM (April 1998-December 2000); and Senior Vice President and Manager, Dreyfus Institutional Service Corporation (January 1993-April 1998). President — Goldman Sachs Fund Complex (November 2007-Present); Senior Vice President — Goldman Sachs Fund Complex (May 2007-November 2007); and Vice President — Goldman Sachs Fund Complex (2001-2007). Trustee — Goldman Sachs Fund Complex (November 2007-Present and December 2002-May 2004). |
Caroline L. Kraus 200 West Street New York, NY 10282 Age: 38 | | Secretary | | Since 2012 | | Vice President, Goldman Sachs (August 2006-Present); Associate General Counsel, Goldman Sachs (2012-Present); Assistant General Counsel, Goldman Sachs (August 2006-December 2011); and Associate, Weil, Gotshal & Manges, LLP (2002-2006). Secretary — Goldman Sachs Fund Complex (August 2012-Present); and Assistant Secretary — Goldman Sachs Fund Complex (June 2012-August 2012). |
Scott M. McHugh 200 West Street New York, NY 10282 Age: 44 | | Principal Financial Officer, Senior Vice President and Treasurer | | Since 2009 (Principal Financial Officer since 2013) | | Vice President, Goldman Sachs (February 2007-Present); Assistant Treasurer of certain mutual funds administered by DWS Scudder (2005-2007); and Director (2005-2007), Vice President (2000-2005), and Assistant Vice President (1998-2000); Deutsche Asset Management or its predecessor (1998-2007). Principal Financial Officer — Goldman Sachs Fund Complex (November 2013-Present); Treasurer — Goldman Sachs Fund Complex (October 2009-Present); Senior Vice President — Goldman Sachs Fund Complex (November 2009-Present); and Assistant Treasurer — Goldman Sachs Fund Complex (May 2007-October 2009). |
| | | | | | |
| * | | Represents a partial list of officers of the Trust. Additional information about all the officers is available in the Funds’ Statement of Additional Information, which can be obtained from Goldman Sachs free of charge by calling this toll-free number (in the United States): 1-800-526-7384. |
| 1 | | Information is provided as of December 31, 2015. |
| 2 | | Officers hold office at the pleasure of the Board of Trustees or until their successors are duly elected and qualified. Each officer holds comparable positions with certain other companies of which Goldman Sachs, GSAM or an affiliate thereof is the investment adviser, administrator and/or distributor. |
155
GOLDMAN SACHS SELECT SATELLITE FUNDS
Goldman Sachs Trust — Select Satellite Funds — Tax Information (Unaudited)
For the fiscal year ended December 31, 2015, 5.94%, 10.29% and 2.77% of the dividends paid from net investment company taxable income by the Absolute Return Tracker, Dynamic Allocation and Real Estate Securities Funds, respectively, qualified for the dividends received deduction available to corporations.
For the 2015 tax year, the International Real Estate Securities Fund has elected to pass through a credit for taxes paid to foreign jurisdictions. The total amount of income received by the International Real Estate Securities Fund from sources within foreign countries and possessions of the United States was $0.1587 per share, all of which is attributable to qualified passive income. The percentage of net investment income dividends paid by the Fund during the year from foreign sources was 78.37%. The total amount of foreign taxes paid by the Fund was $0.0208 per share.
For the fiscal year ended December 31, 2015, 6.80%, 42.54%, 45.84%, 2.37%, and 7.27% of the dividends paid from net investment company taxable income by the Absolute Return Tracker, Dynamic Allocation, International Real Estate Securities, Real Estate Securities, and Global Real Estate Securities Funds, respectively, qualify for the reduced tax rate under the Jobs and Growth Tax Relief and Reconciliation Act of 2003.
Pursuant to Section 852 of the Internal Revenue Code, the Absolute Return Tracker, Dynamic Allocation, Real Estate Securities Funds, respectively, designate $2,682,453, $9,978,011, and $14,299,739, or, if different, the maximum amount allowable, as capital gain dividends paid during the fiscal year ended December 31, 2015.
During the fiscal year ended December 31, 2015, the Absolute Return Tracker, Dynamic Allocation, and Global Real Estate Securities Funds, respectively, designate $10,456,077, $6,748,044, and $4,320 as short-term capital gain dividends pursuant to Section 871(k) of the Internal Revenue Code.
156
FUNDS PROFILE
Goldman Sachs Funds

Goldman Sachs is a premier financial services firm, known since 1869 for creating thoughtful and customized investment solutions in complex global markets.
Today, the Investment Management Division of Goldman Sachs serves a diverse set of clients worldwide, including private institutions, public entities and individuals. With approximately $1.08 trillion in assets under supervision as of December 31, 2015, Goldman Sachs Asset Management (“GSAM”) has portfolio management teams located around the world and our investment professionals bring firsthand knowledge of local markets to every investment decision. Assets under supervision includes assets under management and other client assets for which Goldman Sachs does not have full discretion. GSAM leverages the resources of Goldman, Sachs & Co. subject to legal, internal and regulatory restrictions.

Money Market1
Financial Square FundsSM
| n | | Financial Square Tax-Exempt Funds |
| n | | Financial Square Treasury Solutions Fund2 |
| n | | Financial Square Government Fund |
| n | | Financial Square Money Market Fund |
| n | | Financial Square Prime Obligations Fund |
| n | | Financial Square Treasury Instruments Fund |
| n | | Financial Square Treasury Obligations Fund |
| n | | Financial Square Federal Instruments Fund |
Fixed Income
Short Duration and Government
| n | | High Quality Floating Rate Fund |
| n | | Limited Maturity Obligations Fund |
| n | | Short Duration Government Fund |
| n | | Short Duration Income Fund |
| n | | Inflation Protected Securities Fund |
Multi-Sector
Municipal and Tax-Free
| n | | High Yield Municipal Fund |
| n | | Dynamic Municipal Income Fund |
| n | | Short Duration Tax-Free Fund |
Single Sector
| n | | Investment Grade Credit Fund |
| n | | High Yield Floating Rate Fund |
| n | | Emerging Markets Debt Fund |
| n | | Local Emerging Markets Debt Fund |
| n | | Dynamic Emerging Markets Debt Fund |
Fixed Income Alternatives
| n | | Long Short Credit Strategies Fund |
| n | | Fixed Income Macro Strategies Fund |
Fundamental Equity
| n | | Small/Mid Cap Value Fund |
| n | | Small/Mid Cap Growth Fund |
| n | | Flexible Cap Growth Fund |
| n | | Concentrated Growth Fund |
| n | | Technology Opportunities Fund3 |
| n | | Growth Opportunities Fund |
| n | | Rising Dividend Growth Fund |
| n | | Dynamic U.S. Equity Fund4 |
Tax-Advantaged Equity
| n | | U.S. Tax-Managed Equity Fund |
| n | | International Tax-Managed Equity Fund |
| n | | U.S. Equity Dividend and Premium Fund |
| n | | International Equity Dividend and Premium Fund |
Equity Insights
| n | | Small Cap Equity Insights Fund |
| n | | U.S. Equity Insights Fund |
| n | | Small Cap Growth Insights Fund |
| n | | Large Cap Growth Insights Fund |
| n | | Large Cap Value Insights Fund |
| n | | Small Cap Value Insights Fund |
| n | | International Small Cap Insights Fund |
| n | | International Equity Insights Fund |
| n | | Emerging Markets Equity Insights Fund |
Fundamental Equity International
| n | | Strategic International Equity Fund |
| n | | Focused International Equity Fund |
| n | | International Small Cap Fund |
| n | | Emerging Markets Equity Fund5 |
Select Satellite6
| n | | Real Estate Securities Fund |
| n | | International Real Estate Securities Fund |
| n | | Global Real Estate Securities Fund |
| n | | Commodity Strategy Fund |
| n | | Dynamic Commodity Strategy Fund |
| n | | Dynamic Allocation Fund |
| n | | Absolute Return Tracker Fund |
| n | | Managed Futures Strategy Fund |
| n | | MLP Energy Infrastructure Fund |
| n | | Multi-Manager Alternatives Fund |
| n | | Multi-Asset Real Return Fund |
| n | | Retirement Portfolio Completion Fund |
Total Portfolio Solutions6
| n | | Global Managed Beta Fund |
| n | | Multi-Manager Non-Core Fixed Income Fund |
| n | | Multi-Manager U.S. Dynamic Equity Fund |
| n | | Multi-Manager Global Equity Fund |
| n | | Multi-Manager International Equity Fund |
| n | | Tactical Tilt Implementation Fund |
| n | | Balanced Strategy Portfolio |
| n | | Multi-Manager Real Assets Strategy Fund |
| n | | Growth and Income Strategy Portfolio |
| n | | Growth Strategy Portfolio |
| n | | Equity Growth Strategy Portfolio |
| n | | Satellite Strategies Portfolio |
| n | | Enhanced Dividend Global Equity Portfolio |
| n | | Tax-Advantaged Global Equity Portfolio |
| 1 | | An investment in a money market fund is neither insured nor guaranteed by the Federal Deposit Insurance Corporation (“FDIC”) or any other government agency. Although the Funds seek to preserve the value of your investment at $1.00 per share, it is possible to lose money by investing in the Funds. |
| 2 | | Effective on September 30, 2015, the Goldman Sachs Financial Square Federal Fund was renamed the Goldman Sachs Financial Square Treasury Solutions Fund. |
| 3 | | Effective on July 31, 2015, the Goldman Sachs Technology Tollkeeper Fund was renamed the Goldman Sachs Technology Opportunities Fund. |
| 4 | | Effective on April 30, 2015, the Goldman Sachs U.S. Equity Fund was renamed the Goldman Sachs Dynamic U.S. Equity Fund. |
| 5 | | Effective at the close of business on October 23, 2015, the Goldman Sachs BRIC Fund (Brazil, Russia, India, China) was reorganized with and into the Goldman Sachs Emerging Markets Equity Fund. |
| 6 | | Individual Funds within the Total Portfolio Solutions and Select Satellite categories will have various placement on the risk/return spectrum and may have greater or lesser risk than that indicated by the placement of the general Total Portfolio Solutions or Select Satellite category. |
| * | | This list covers open-end funds only. Please visit our website at www.GSAMFUNDS.com to learn about our closed-end funds. |
| | |
TRUSTEES Ashok N. Bakhru, Chairman Kathryn A. Cassidy Diana M. Daniels Herbert J. Markley James A. McNamara Jessica Palmer Alan A. Shuch Roy W. Templin Gregory G. Weaver | | OFFICERS James A. McNamara, President Scott M. McHugh, Principal Financial Officer, Senior Vice President, and Treasurer Caroline L. Kraus, Secretary |
| |
GOLDMAN, SACHS & CO. Distributor and Transfer Agent | | GOLDMAN SACHS ASSET MANAGEMENT, L.P. Investment Adviser |
Visit our Web site at www.GSAMFUNDS.com to obtain the most recent month-end returns.
Goldman Sachs Asset Management, L.P. 200 West Street, New York, New York 10282
Economic and market forecasts presented herein reflect our judgment as of the date of this presentation and are subject to change without notice. These forecasts do not take into account the specific investment objectives, restrictions, tax and financial situation or other needs of any specific client. Actual data will vary and may not be reflected here. These forecasts are subject to high levels of uncertainty that may affect actual performance. Accordingly, these forecasts should be viewed as merely representative of a broad range of possible outcomes. These forecasts are estimated, based on assumptions, and are subject to significant revision and may change materially as economic and market conditions change. Goldman Sachs has no obligation to provide updates or changes to these forecasts. Case studies and examples are for illustrative purposes only.
The portfolio risk management process includes an effort to monitor and manage risk, but does not imply low risk. Diversification does not protect an investor from market risk and does not ensure a profit.
The reports concerning the Funds included in this shareholder report may contain certain forward-looking statements about the factors that may affect the performance of the Funds in the future. These statements are based on Fund management’s predictions and expectations concerning certain future events and their expected impact on the Funds, such as performance of the economy as a whole and of specific industry sectors, changes in the levels of interest rates, the impact of developing world events, and other factors that may influence the future performance of the Funds. Management believes these forward-looking statements to be reasonable, although they are inherently uncertain and difficult to predict. Actual events may cause adjustments in portfolio management strategies from those currently expected to be employed.
A description of the policies and procedures that the Funds use to determine how to vote proxies relating to portfolio securities and information regarding how a Fund voted proxies relating to portfolio securities during the most recent 12-month period ended June 30 is available (i) without charge, upon request by calling 1-800-526-7384 (for Retail Shareholders) or 1-800-621-2550 (for Institutional Shareholders); and (ii) on the Securities and Exchange Commission (“SEC”) web site at http://www.sec.gov.
The Funds file their complete schedule of portfolio holdings the first and third quarters of each fiscal year on Forms N-Q. The Funds’ Forms N-Q are available on the SEC’s web site at http://www.sec.gov within 60 days after the Funds’ first and third fiscal quarters. The Funds’ Forms N-Q may be reviewed and copied at the SEC’s Public Reference Room in Washington, D.C. and information on the operation of the Public Reference Room may also be obtained by calling 1-800-SEC-0330. Forms N-Q may be obtained upon request and without charge by calling 1-800-526-7384 (for Retail Shareholders) or 1-800-621-2550 (for Institutional Shareholders).
Holdings and allocations shown are as of December 31, 2015 and may not be representative of future investments. Fund holdings should not be relied on in making investment decisions and should not be construed as research or investment advice regarding particular securities. Current and future holdings are subject to risk.
This material is not authorized for distribution to prospective investors unless preceded or accompanied by a current Prospectus or summary prospectus, if applicable. Investors should consider a Fund’s objective, risks, and charges and expenses, and read the summary prospectus, if available, and/or the Prospectus carefully before investing or sending money. The summary prospectus, if available, and the Prospectus contain this and other information about a Fund and may be obtained from your Authorized Institution or from Goldman, Sachs & Co. by calling (retail – 1-800-526-7384) (institutional – 1-800-621-2550).
© 2016 Goldman Sachs. All rights reserved. 31245-TEMPL-02/2016 SELSATAR16 / 53K
(a) As of the end of the period covered by this report, the registrant has adopted a code of ethics that applies to the registrant’s principal executive officer, principal financial officer, principal accounting officer or controller, or persons performing similar functions, regardless of whether these individuals are employed by the registrant or a third party (the “Code of Ethics”).
(b) During the period covered by this report, no amendments were made to the provisions of the Code of Ethics.
(c) During the period covered by this report, the registrant did not grant any waivers, including an implicit waiver, from any provision of the Code of Ethics.
(d) A copy of the Code of Ethics is available as provided in Item 12(a)(1) of this report.
| ITEM 3. | AUDIT COMMITTEE FINANCIAL EXPERT. |
The registrant’s board of trustees has determined that the registrant has at least one “audit committee financial expert” (as defined in Item 3 of Form N-CSR) serving on its audit committee. Gregory G. Weaver is the “audit committee financial expert” and is “independent” (as each term is defined in Item 3 of Form N-CSR).
| ITEM 4. | PRINCIPAL ACCOUNTANT FEES AND SERVICES. |
Table 1 — Items 4(a) - 4(d). The accountant fees below reflect the aggregate fees billed by all of the Funds of the Goldman Sachs Trust and includes the Goldman Sachs Funds to which this certified shareholder report relates.
| | | | | | | | | | | | |
| | | 2015 | | 2014 | | Description of Services Rendered |
| | | |
| | | | | | | | | | | | |
| | | |
Audit Fees: | | | | | | | | | | | | |
| | | |
• PricewaterhouseCoopers LLP
(“PwC”) | | | $ | 3,800,334 | | | | $ | 3,563,029 | | | Financial Statement audits. |
| | | |
Audit-Related Fees: | | | | | | | | | | | | |
| | | |
• PwC | | | $ | 158,000 | | | | $ | 0 | | | Other attest services. |
| | | |
Tax Fees: | | | | | | | | | | | | |
| | | |
• PwC | | | $ | 1,058,976 | | | | $ | 672,155 | | | Tax compliance services provided in connection with the preparation and review of registrant’s tax returns. |
Table 2 — Items 4(b)(c) & (d). Non-Audit Services to the Goldman Sachs Trust’s service affiliates * that were pre-approved by the Audit Committee of the Goldman Sachs Trust pursuant to Rule 2-01(c)(7)(ii) of Regulation S-X.
| | | | | | | | | | | | |
| | | 2015 | | 2014 | | Description of Services Rendered |
| | | |
| | | | | | | | | | | | |
| | | |
Audit-Related Fees: | | | | | | | | | | | | |
| | | |
• PwC | | | $ | 1,653,616 | | | | $ | 1,486,420 | | | Internal control review performed in accordance with Statement on Standards for Attestation Engagements No. 16 and Semi-Annual Updates related to withholding tax accrual for non-US Jurisdictions. These fees are borne by the Funds’ Adviser. |
| * | These include the advisor (excluding sub-advisors) and any entity controlling, controlled by or under common control with the advisor that provides ongoing services to the registrant (hereinafter referred to as “service affiliates”). |
Item 4(e)(1) — Audit Committee Pre-Approval Policies and Procedures
Pre-Approval of Audit and Non-Audit Services Provided to the Funds of the Goldman Sachs Trust. The Audit and Non-Audit Services Pre-Approval Policy (the “Policy”) adopted by the Audit Committee of Goldman Sachs Trust (“GST”) sets forth the procedures and the conditions pursuant to which services performed by an independent auditor for GST may be pre-approved. Services may be pre-approved specifically by the Audit Committee as a whole or, in certain circumstances, by the Audit Committee Chairman or the person designated as the Audit Committee Financial Expert. In addition, subject to specified cost limitations, certain services may be pre-approved under the provisions of the Policy. The Policy provides that the Audit Committee will consider whether the services provided by an independent auditor are consistent with the Securities and Exchange Commission’s rules on auditor independence. The Policy provides for periodic review and pre-approval by the Audit Committee of the services that may be provided by the independent auditor.
De Minimis Waiver. The pre-approval requirements of the Policy may be waived with respect to the provision of non-audit services that are permissible for an independent auditor to perform, provided (1) the aggregate amount of all such services provided constitutes no more than five percent of the total amount of revenues subject to pre-approval that was paid to the independent auditors during the fiscal year in which the services are provided; (2) such services were not recognized by GST at the time of the engagement to be non-audit services; and (3) such services are promptly brought to the attention of the Audit Committee and approved prior to the completion of the audit by the Audit Committee or by one or more members of the Audit Committee to whom authority to grant such approvals has been delegated by the Audit Committee, pursuant to the pre-approval provisions of the Policy.
Pre-Approval of Non-Audit Services Provided to GST’s Investment Advisers. The Policy provides that, in addition to requiring pre-approval of audit and non-audit services provided to GST, the Audit Committee will pre-approve those non-audit services provided to GST’s investment advisers (and entities controlling, controlled by or under common control with the investment advisers that provide ongoing services to GST) where the engagement relates directly to the operations or financial reporting of GST.
Item 4(e)(2) – 0% of the audit-related fees, tax fees and other fees listed in Table 1 were approved by GST’s Audit Committee pursuant to the “de minimis” exception of Rule 2-01(c)(7)(i)(C) of Regulation S-X. In addition, 0% of the non-audit services to the GST’s service affiliates listed in Table 2 were approved by GST’s Audit Committee pursuant to the “de minimis” exception of Rule 2-01(c)(7)(i)(C) of Regulation S-X.
Item 4(f) – Not applicable.
Item 4(g) Aggregate Non-Audit Fees Disclosure
The aggregate non-audit fees billed to GST by PwC for the twelve months ended December 31, 2015 and December 31, 2014 were $1,216,976 and $672,155 respectively.
The aggregate non-audit fees billed to GST’s adviser and service affiliates by PwC for non-audit services for the twelve months ended December 31, 2014 and December 31, 2013 were approximately $10.2 million and $9.8 million respectively. The figures for these entities are not yet available for twelve months ended December 31, 2015. With regard to the aggregate non-audit fees billed to GST’s adviser and service affiliates, the 2014 and 2013 amounts include fees for non-audit services required to be pre-approved [see Table 2] and fees for non-audit services that did not require pre-approval since they did not directly relate to GST’s operations or financial reporting.
Item 4(h) — GST’s Audit Committee has considered whether the provision of non-audit services to GST’s investment adviser and service affiliates that did not require pre-approval pursuant to paragraph (c)(7)(ii) of Rule 2-01 of Regulation S-X is compatible with maintaining the auditors’ independence.
| ITEM 5. | AUDIT COMMITTEE OF LISTED REGISTRANTS. |
| ITEM 6. | SCHEDULE OF INVESTMENTS. |
| | Schedule of Investments is included as part of the Report to Stockholders filed under Item 1. |
| ITEM 7. | DISCLOSURE OF PROXY VOTING POLICIES AND PROCEDURES FOR CLOSED-END MANAGEMENT INVESTMENT COMPANIES. |
| ITEM 8. | PORTFOLIO MANAGERS OF CLOSED-END MANAGEMENT INVESTMENT COMPANIES. |
| ITEM 9. | PURCHASES OF EQUITY SECURITIES BY CLOSED-END MANAGEMENT INVESTMENT COMPANY AND AFFILIATED PURCHASERS. |
| ITEM 10. | SUBMISSION OF MATTERS TO A VOTE OF SECURITY HOLDERS. |
| | There have been no material changes to the procedures by which shareholders may recommend nominees to the registrant’s board of trustees. |
| ITEM 11. | CONTROLS AND PROCEDURES. |
| | (a) | The registrant’s principal executive and principal financial officers, or persons performing similar functions have concluded that the registrant’s disclosure controls and procedures (as defined in Rule 30a-3(c) under the Investment Company Act of 1940, as amended (the “1940 Act”)) are effective as of a date within 90 days of the filing of this report that includes the disclosure required by this paragraph, based on the evaluation of these controls and procedures required by Rule 30a-3(b) under the 1940 Act and 15d-15(b) under the Securities Exchange Act of 1934, as amended. |
| | (b) | There were no changes in the registrant’s internal control over financial reporting (as defined in Rule 30a-3(d) under the 1940 Act) that occurred during the registrant’s second fiscal quarter of the period covered by this report that have materially affected, or are reasonably likely to materially affect, the registrant’s internal control over financial reporting. |
| | | | |
| (a)(1) | | Goldman Sachs Trust’s Code of Ethics for Principal Executive and Senior Financial Officers is incorporated by reference to Exhibit 12(a)(1) of the registrant’s Form N-CSR filed on July 8, 2015 for its International Equity Insights Funds. |
| | |
| (a)(2) | | Exhibit 99.CERT | | Certifications pursuant to Section 302 of the Sarbanes-Oxley Act of 2002 filed herewith. |
| | |
| (b) | | Exhibit 99.906CERT | | Certifications pursuant to Section 906 of the Sarbanes-Oxley Act of 2002 filed herewith. |
SIGNATURES
Pursuant to the requirements of the Securities Exchange Act of 1934 and the Investment Company Act of 1940, the registrant has duly caused this report to be signed on its behalf by the undersigned, thereunto duly authorized.
| | |
| | | Goldman Sachs Trust |
| |
| By: | | /s/ James A. McNamara |
| |
| | |
| | James A. McNamara |
| | Chief Executive Officer |
| | Goldman Sachs Trust |
| |
| Date: | | March 10, 2016 |
Pursuant to the requirements of the Securities Exchange Act of 1934 and the Investment Company Act of 1940, this report has been signed below by the following persons on behalf of the registrant and in the capacities and on the dates indicated.
| | |
| By: | | /s/ James A. McNamara |
| |
| | |
| | James A. McNamara |
| | Chief Executive Officer |
| | Goldman Sachs Trust |
| |
| Date: | | March 10, 2016 |
| |
| By: | | /s/ Scott McHugh |
| |
| | |
| | Scott McHugh |
| | Principal Financial Officer |
| | Goldman Sachs Trust |
| |
| Date: | | March 10, 2016 |