UNITED STATES
SECURITIES AND EXCHANGE COMMISSION
Washington, D.C. 20549
FORM N-CSR
CERTIFIED SHAREHOLDER REPORT OF REGISTERED
MANAGEMENT INVESTMENT COMPANIES
Investment Company Act file number 811-05349
Goldman Sachs Trust
(Exact name of registrant as specified in charter)
71 South Wacker Drive, Chicago, Illinois 60606
(Address of principal executive offices) (Zip code)
| | |
| Caroline Kraus, Esq. | | Copies to: |
| Goldman, Sachs & Co. | | Geoffrey R.T. Kenyon, Esq. |
| 200 West Street | | Dechert LLP |
| New York, New York 10282 | | 100 Oliver Street |
| | 40th Floor |
| | Boston, MA 02110-2605 |
(Name and address of agents for service)
Registrant’s telephone number, including area code: (312) 655-4400
Date of fiscal year end: December 31
Date of reporting period: December 31, 2015
| ITEM 1. | REPORTS TO STOCKHOLDERS. |
| | The Annual Report to Shareholders is filed herewith. |
Goldman Sachs Funds

| | | | |
| | |
| Annual Report | | | | December 31, 2015 |
| | |
| | | | Fund of Funds Portfolios |
| | | | Balanced Strategy |
| | | | Equity Growth Strategy |
| | | | Growth and Income Strategy |
| | | | Growth Strategy |
| | | | Satellite Strategies |

Goldman Sachs Fund of Funds Portfolios
| n | | GROWTH AND INCOME STRATEGY |
| | | | |
TABLE OF CONTENTS | | | | |
| |
Principal Investment Strategies and Risks | | | 1 | |
| |
Market Review | | | 3 | |
| |
Investment Process | | | 6 | |
| |
Portfolio Management Discussions and Performance Summaries | | | 8 | |
| |
Schedules of Investments | | | 40 | |
| |
Financial Statements | | | 46 | |
| |
Financial Highlights | | | 54 | |
| |
Notes to Financial Statements | | | 64 | |
| |
Report of Independent Registered Public Accounting Firm | | | 86 | |
| |
Other Information | | | 87 | |
| | | | |
| | | |
| NOT FDIC-INSURED | | May Lose Value | | No Bank Guarantee |
GOLDMAN SACHS FUND OF FUNDS PORTFOLIOS
Principal Investment Strategies and Risks
This is not a complete list of risks that may affect the Portfolios. For additional information concerning the risks applicable to the Portfolios, please see the Portfolios’ Prospectus and the Prospectuses for the Underlying Funds.
The Goldman Sachs Balanced Strategy Portfolio invests in affiliated domestic and international fixed income and equity funds (“underlying funds”). The Portfolio’s investment in any of the underlying funds may exceed 25% of its assets. The Portfolio currently expects to invest a relatively significant percentage of its assets in the Goldman Sachs Short Duration Government, Goldman Sachs Global Income, Goldman Sachs Core Fixed Income, Goldman Sachs Large Cap Growth Insights, Goldman Sachs Large Cap Value Insights, and Goldman Sachs International Equity Insights Funds. The Portfolio is subject to the risk factors of the underlying funds in direct proportion to its investments in those underlying funds, and the ability of the Portfolio to meet its investment objective is directly related to the ability of the underlying funds to meet their investment objectives, as well as the allocation among those underlying funds by the Investment Adviser. An underlying fund is subject to the risks associated with its investments, including (as applicable) those associated with equity, fixed income, foreign and derivative investments generally. From time to time, the underlying funds in which the Portfolio invests, and the size of the investments in the underlying funds, may change. Because the Portfolio is subject to the underlying fund expenses as well as its own expenses, the cost of investing in the Portfolio may be higher than investing in a mutual fund that only invests directly in stocks and bonds.
The Goldman Sachs Equity Growth Strategy Portfolio invests substantially all of its assets in affiliated domestic and international equity funds (“underlying funds”). The Portfolio’s investment in any of the underlying funds may exceed 25% of its assets. The Portfolio currently expects to invest a relatively significant percentage of its assets in the Goldman Sachs Large Cap Growth Insights, Goldman Sachs Large Cap Value Insights and Goldman Sachs International Equity Insights Funds. The Portfolio is subject to the risk factors of the underlying funds in direct proportion to its investments in those underlying funds, and the ability of the Portfolio to meet its investment objective is directly related to the ability of the underlying funds to meet their investment objectives, as well as the allocation among those underlying funds by the Investment Adviser. An underlying fund is subject to the risks associated with its investments, including (as applicable) those associated with equity, fixed income, foreign and derivative investments generally. From time to time, the underlying funds in which the Portfolio invests, and the size of the investments in the underlying funds, may change. Because the Portfolio is subject to the underlying fund expenses as well as its own expenses, the cost of investing in the Portfolio may be higher than investing in a mutual fund that only invests directly in stocks and bonds.
The Goldman Sachs Growth and Income Strategy Portfolio invests in affiliated domestic and international fixed income and equity funds (“underlying funds”). The Portfolio’s investment in any of the underlying funds may exceed 25% of its assets. The Portfolio currently expects to invest a relatively significant percentage of its assets in the Goldman Sachs Large Cap Growth Insights, Goldman Sachs Large Cap Value Insights, Goldman Sachs International Equity Insights, Goldman Sachs Core Fixed Income and Goldman Sachs Global Income Funds. The Portfolio is subject to the risk factors of the underlying funds in direct proportion to its investments in those underlying funds, and the ability of the Portfolio to meet its investment objective is directly related to the ability of the underlying funds to meet their investment objectives, as well as the allocation among those underlying funds by the Investment Adviser. An underlying fund is subject to the risks associated with its investments, including (as applicable) those associated with equity, fixed income, foreign and derivative investments generally. From time to time, the underlying funds in which the Portfolio invests, and the size of the investments in the underlying funds, may change. Because the Portfolio is subject to the underlying fund expenses as well as its own expenses, the cost of investing in the Portfolio may be higher than investing in a mutual fund that only invests directly in stocks and bonds.
1
GOLDMAN SACHS FUND OF FUNDS PORTFOLIOS
The Goldman Sachs Growth Strategy Portfolio invests in affiliated domestic and international fixed income and equity funds (“underlying funds”). The Portfolio’s investment in any of the underlying funds may exceed 25% of its assets. The Portfolio currently expects to invest a relatively significant percentage of its assets in the Goldman Sachs Large Cap Growth Insights, Goldman Sachs Large Cap Value Insights and Goldman Sachs International Equity Insights Funds. The Portfolio is subject to the risk factors of the underlying funds in direct proportion to its investments in those underlying funds, and the ability of the Portfolio to meet its investment objective is directly related to the ability of the underlying funds to meet their investment objectives, as well as the allocation among those underlying funds by the Investment Adviser. An underlying fund is subject to the risks associated with its investments, including (as applicable) those associated with equity, fixed income, foreign and derivative investments generally. From time to time, the underlying funds in which the Portfolio invests, and the size of the investments in the underlying funds, may change. Because the Portfolio is subject to the underlying fund expenses as well as its own expenses, the cost of investing in the Portfolio may be higher than investing in a mutual fund that only invests directly in stocks and bonds.
The Goldman Sachs Satellite Strategies Portfolio invests primarily in affiliated fixed income and equity funds (“underlying funds”) which are considered to invest in satellite asset classes. Satellite asset classes are those that have traditionally had low correlations to traditional market exposures such as large capitalization equities and investment grade fixed income. The Portfolio’s investment in any of the underlying funds may exceed 25% of its assets. The Investment Adviser expects to invest relatively significant percentages in the following satellite equity asset classes: emerging markets equity, international small cap, U.S. and international real estate securities. The Investment Adviser may invest a relatively significant percentage in the following satellite fixed income asset classes: high yield, emerging markets debt and commodities. The Portfolio is subject to the risk factors of the underlying funds in direct proportion to its investments in those underlying funds, and the ability of the Portfolio to meet its investment objective is directly related to the ability of the underlying funds to meet their investment objectives, as well as the allocation among those underlying funds by the Investment Adviser. An underlying fund is subject to the risks associated with its investments, including (as applicable) those associated with equity, fixed income, foreign, commodity and derivative investments generally. From time to time, the underlying funds in which the Portfolio invests, and the size of the investments in the underlying funds, may change. Because the Portfolio is subject to the underlying fund expenses as well as its own expenses, the cost of investing in the Portfolio may be higher than investing in a mutual fund that only invests directly in stocks and bonds.
2
MARKET REVIEW
Fund of Funds Portfolios
Dear Shareholder:
This report provides an overview of regional and sector preferences of the Goldman Sachs Fund of Funds Portfolios (each, a “Portfolio,” and collectively, the “Portfolios”) during the year ended December 31, 2015 (the “Reporting Period”).
Market Review
During the 12 months ended December 31, 2015 (the “Reporting Period”), U.S. equities recorded a modest gain, while international equities declined. In broad terms, global spread (non-government bond) sectors advanced slightly.
U.S. Equities
Market expectations of a Federal Reserve (“Fed”) interest rate hike increased during the Reporting Period, as evidence of a U.S. economic and labor market recovery mounted. Meanwhile, monetary policy divergence with the European Central Bank (“ECB”) and the Bank of Japan, which each eased policy during 2015, resulted in relative U.S. dollar strength. This paradoxically hurt U.S. equity performance despite improving domestic economic fundamentals. Also, geopolitical tensions intensified in the summer of 2015, as negotiations between Greece and its creditors unraveled, and the probability of a Greek exit, popularly known in the media as “Grexit,” from the euro increased. “Grexit” risk subsequently declined with an agreement in July 2015. However, concerns then escalated around China’s economic weakness, exacerbated by a surprise devaluation of its renminbi in August 2015, which further shook market confidence. U.S. equities sold off in the ensuing sharp global equity correction.
After holding the targeted federal funds rate steady in September and October 2015 in light of these external macroeconomic and geopolitical risks, the Fed voted unanimously for a 25 basis point hike in December 2015, a move largely expected by markets. (A basis point is 1/100th of a percentage point.) The fairly dovish language in the Fed’s announcement, which emphasized “gradual” adjustments to policy going forward, helped to somewhat assuage the markets. (Dovish language tends to suggest lower interest rates.)
Oil and commodity prices fell during 2015, as the supply glut took longer than expected to correct and demand concerns arose. West Texas Intermediate (“WTI”) crude oil prices began 2015 at $53 per barrel, already well below 2014 highs of more than $100 per barrel. WTI crude oil prices ended 2015 lower still, at approximately $37 per barrel. The U.S. consumer benefited from savings at the gas pump and consumer spending rose, particularly in areas typically associated with lower gas prices, such as autos and restaurants. However, this did not fully offset the negative impact on the U.S. energy industry and industrials companies.
Within the U.S. equity market, there was significant disparity in performance not only among sectors but also among the various capitalization and style segments. Large-cap stocks, as measured by the Russell 1000® Index, posted modestly positive returns, while mid-cap stocks and small-cap stocks, as measured by the Russell Midcap® Index and Russell 2000® Index, respectively, generated negative returns. Large-cap stocks were most successful relative to small-cap stocks in the consumer discretionary sector. From a style perspective, growth-oriented stocks significantly outpaced value-oriented stocks across the capitalization spectrum. Growth outperformed relative to value during the Reporting Period primarily due to stronger performance of the growth-oriented information technology sector. (All as measured by the Russell Investments indices.)
3
MARKET REVIEW
International Equities
At the beginning of the Reporting Period in January 2015, the ECB implemented historic quantitative easing measures. In contrast, as evidence of a U.S. economic and labor market recovery mounted, market expectations of a Fed interest rate hike increased. The monetary policy divergence resulted in relative U.S. dollar strength, which benefited equity markets in several major developed market regions outside the U.S. but detracted from their returns in U.S. dollar terms.
As mentioned previously, geopolitical tensions intensified in the summer of 2015, as negotiations between Greece and its creditors unraveled and the probability of a “Grexit” from the euro increased. “Grexit” risk subsequently declined with an agreement in July 2015. However, concerns then escalated around China’s economic weakness, exacerbated by a surprise devaluation of its renminbi in August 2015, which further shook market confidence. International equities sold off in the ensuing sharp global equity correction.
In the U.S., the Fed tightened its monetary policy during December 2015. Fairly dovish language in the Fed’s announcement, which emphasized “gradual” adjustments to policy going forward, appeared to ease the impact on the markets. Meanwhile, the Bank of Japan announced supplementary support for its quantitative and qualitative easing. The ECB also lowered its deposit rate by 10 basis points and announced an extension of its quantitative easing program at its December 2015 meeting. However, market reaction to the ECB announcement was one of disappointment, as more had been expected.
Oil and commodity prices were “lower for longer” in 2015, with a supply glut that took longer than expected to correct and concerns about demand arose. Brent crude oil prices began 2015 at $57 per barrel, already well below 2014 highs of more than $100 per barrel. Brent crude oil prices ended 2015 lower still, at approximately $37 per barrel.
International equities, as measured by the MSCI EAFE Index, returned -0.39% in U.S. dollar terms during the Reporting Period. Ten of the 21 countries in the MSCI EAFE Index were down for the Reporting Period, with Singapore (-18.06%), Spain (-16.06%) and Norway (-14.50%) posting the largest losses in absolute terms. The U.K. (-7.55%) was the largest negative contributor on the basis of impact, which takes both weightings and total returns into account.
Four of the 10 sectors in the MSCI EAFE Index were down, with energy (-17.96%) and materials (-16.82%) detracting most from returns. The materials sector was also the largest negative contributor on the basis of impact, which takes both weightings and total returns into account.
Fixed Income Markets
In January 2015, when the Reporting Period began, global spread sectors generated broadly positive returns. As the Fed and the U.K. considered raising short-term interest rates, global monetary policy easing intensified with the ECB announcing its quantitative easing program and approximately 25 other global central banks easing monetary policy. The U.S. dollar appreciated for a third consecutive quarter, reaching a 12-year high versus the euro ahead of
4
MARKET REVIEW
the Fed’s March 2015 policy meeting. The anti-austerity Syriza party was victorious in Greece’s elections, which seemed to raise fears of a renewed debt crisis. Near first calendar quarter end, Eurozone finance ministers agreed to a four-month extension of the existing Greek bailout package, buying time but leaving unresolved the question of how Greece would fund debt repayments during July and August 2015.
During the second calendar quarter, the performance of global spread sectors was mixed. High yield corporate bonds and emerging markets debt ended the quarter roughly where they began, while investment grade corporate bonds recorded a decline. U.S. Treasury yields rose amid significant volatility during May and early June 2015, as U.S. economic data improved, including positive surprises in inflation and retail sales. First quarter 2015 U.S. Gross Domestic Product (“GDP”) was revised upwards from -0.7% to a seasonally adjusted annual rate of -0.2%. The upward revision stemmed in part from stronger than estimated consumer spending and inventory data. U.S. dollar gains hit a roadblock on uncertainty around the Fed’s plans for raising interest rates in 2015. The Eurozone’s economic progress took a back seat in the second calendar quarter to the seemingly intractable challenges surrounding Greece.
In the third quarter of 2015, global spread sectors underperformed U.S. Treasuries as the outlook for the global economy grew cloudy. Investors focused on slowing economic growth in China, the devaluation of the Chinese renminbi and an unexpected increase in market volatility. Oil and other commodities prices dropped to new lows, partly because of falling demand from China. Uncertainty about the timing of potential Fed policy tightening became an increasingly key theme. Surprisingly to many, the Fed chose to leave rates unchanged at its September 2015 policy meeting, citing conditions in the global economy. Although the U.S. economy continued to improve, economic growth in other developed countries softened and emerging markets economies broadly weakened. Despite accommodative monetary policies by many global central banks, inflation remained subdued in the world’s major economies.
Global spread sectors generally outperformed U.S. Treasuries during the fourth quarter of 2015, which saw the first Fed rate hike since 2006. Outside the U.S., the global monetary policy environment remained highly accommodative. The U.S. economy continued to display a positive growth trend, but economic growth in other developed countries had softened by the end of the Reporting Period. At the same time, growth in emerging markets countries broadly weakened, largely due to commodity price declines and concerns about the slowing Chinese economy.
For the Reporting Period overall, U.S. high yield corporate bonds posted steep losses, underperforming U.S. Treasuries. Sovereign emerging markets debt also declined. In addition, investment grade corporate bonds and agency securities recorded negative returns, followed at some distance by commercial mortgage-backed securities and residential mortgage-backed securities. Although asset-backed securities generated a positive return, they also trailed U.S. Treasuries. The U.S. Treasury yield curve, or spectrum of maturities, flattened during the Reporting Period, as shorter-term yields rose more than either intermediate-term or longer-term yields. The yield on the bellwether 10-year U.S. Treasury rose approximately 10 basis points during the Reporting Period to 2.27%.
5
GOLDMAN SACHS FUND OF FUNDS PORTFOLIO
What Differentiates Goldman Sachs’
Approach to Asset Allocation?
We believe that strong, consistent investment results through asset allocation are best achieved through teams of experts working together on a global scale:
| n | | Goldman Sachs’ Quantitative Investment Strategies Team determines the strategic and quarterly tactical asset allocations. The team is comprised of over 90* professionals with significant academic and practitioner experience. |
| n | | Goldman Sachs’ Portfolio Management Teams offer expert management of the mutual funds that are contained within each Portfolio. These same teams manage portfolios for institutional and high net worth investors. |
Goldman Sachs Asset Allocation Investment Process

Quantitative Investment Strategies Team
Each Fund of Funds Portfolio represents a diversified global portfolio on the efficient frontier.† The Portfolios differ in their long-term objective, and therefore, their asset allocation mix. The long-term strategic asset allocation is the primary source of risk and the corresponding primary determinant of total return. It therefore represents an anchor, or neutral starting point, from which tactical asset allocation decisions are made.

Quantitative Investment Strategies Team
For each Portfolio, the strategic asset allocation is combined with a measured amount of tactical risk. Changing market conditions create opportunities to capitalize on investing in different countries and asset classes relative to others over time. Within each strategy, we shift assets away from the strategic allocation (over and underweighting certain asset classes and countries) to seek to benefit from changing conditions in global capital markets.
Using proprietary portfolio construction models to maintain each Portfolio’s original risk/ return profile over time, the team makes ten active decisions based on its current outlook on global equity, fixed income and currency markets.
| | |
n Asset class selection | | Are stocks, bonds or cash more attractive? |
n Regional equity selection | | Are U.S. or non-U.S. equities more attractive? |
n Regional bond selection | | Are U.S. or non-U.S. bonds more attractive? |
n U.S. equity style selection | | Are U.S. value or U.S. growth equities more attractive? |
n U.S. equity size selection | | Are U.S. large-cap or U.S. small-cap equities more attractive? |
n Emerging/developed equity selection | | Are emerging or developed equities more attractive? |
| † | | Portfolios on the efficient frontier are optimal in both the sense that they offer maximal expected return for some given level of risk and minimal risk for some given level of expected return. The efficient frontier is the line created from the risk-reward graph, comprised of optimal portfolios. The optimal portfolios plotted along the curve have the highest expected return possible for the given amount of risk. |
6
GOLDMAN SACHS FUND OF FUNDS PORTFOLIO

| | |
n Developed equity country selection | | Which international countries are more attractive? |
n Emerging equity country selection | | Which emerging market countries are more attractive? |
n High yield selection | | Are high yield or core fixed income securities more attractive? |
n Emerging/developed
bond selection | | Are emerging or developed bonds more attractive? |

Mutual Fund Portfolio Management Teams
Each Portfolio is comprised of underlying Goldman Sachs Mutual Funds managed by broad, deep portfolio management teams. In addition to global tactical asset allocation, we seek to generate excess returns through security selection within each underlying mutual fund. Whether in the equity or fixed income arenas, these portfolio management teams share a commitment to firsthand fundamental research and seek performance driven by successful security selection.
7
PORTFOLIO RESULTS
Fund of Funds Portfolios – Asset Allocation
Investment Process and Principal Strategies
Each Portfolio seeks to achieve its investment objective by investing in a combination of underlying funds that currently exist or that may become available for investment in the future for which Goldman Sachs Asset Management (“GSAM”) or an affiliate, now or in the future, acts as investment adviser or principal underwriter (the “underlying funds”). Some of the Portfolios’ underlying funds invest primarily in fixed income or money market instruments, and some invest primarily in equity securities. Some underlying funds also invest dynamically across equity, fixed income, commodity and other markets through a managed volatility or trend-following approach.
The investment adviser allows the Portfolios’ strategic targets to shift with their respective market returns but continues to adjust tactical tilts on a quarterly basis to reflect the investment adviser’s latest views. The investment adviser adjusts the overall asset allocation of the Portfolios based on current market conditions and the investment adviser’s economic and market forecasts.
Portfolio Management Discussion and Analysis
Below, the Goldman Sachs Quantitative Investment Strategies Team discusses the Portfolios’ performance and positioning for the 12-month period ended December 31, 2015 (the “Reporting Period”).
| Q | | How did the Portfolios perform during the Reporting Period? |
| A | | Goldman Sachs Balanced Strategy Portfolio — During the Reporting Period, the Balanced Strategy Portfolio’s Class A, C, Institutional, Service, IR and R Shares generated average annual total returns, without sales charges, of -0.90%, -1.65%, -0.49%, -0.99%, -0.73% and -1.23%, respectively. This compares to the -0.16% average annual total return of the Portfolio’s blended benchmark, which is composed 60% of the Barclays Global Aggregate Bond Index (Gross, USD, Hedged) (“Barclays Global Index”) and 40% of the MSCI All Country World Index (Net, USD, Unhedged) (“MSCI ACWI Index”), during the same period. |
| | | The components of the Portfolio’s blended benchmark, the Barclays Global Index and the MSCI ACWI Index, generated average annual total returns of 1.02% and -2.36%, respectively, during the Reporting Period. |
| | | During the period since their inception on July 31, 2015 through December 31, 2015, the Balanced Strategy Portfolio’s Class R6 Shares generated a cumulative total return of -2.01% compared to the -1.91% cumulative total return of the Portfolio’s blended benchmark. The components of the Portfolio’s blended benchmark, the Barclays Global Index and the MSCI ACWI Index, generated cumulative total returns of 0.42% and -5.72%, respectively, during the same period. |
| | | Goldman Sachs Equity Growth Strategy Portfolio — During the Reporting Period, the Equity Growth Strategy Portfolio’s Class A, C, Institutional, Service, IR and R Shares generated average annual total returns, without sales charges, of 0.83%, 0.13%, 1.31%, 0.78%, 1.11% and 0.61%, respectively. This compares to the -2.36% average annual total return of the Portfolio’s benchmark, the MSCI ACWI Index, during the same period. |
| | | During the period since their inception on July 31, 2015 through December 31, 2015, the Growth Equity Strategy Portfolio’s Class R6 Shares generated a cumulative total return of -3.93% compared to the -5.72% cumulative total return of the MSCI ACWI Index during the same period. |
| | | Goldman Sachs Growth and Income Strategy Portfolio — During the Reporting Period, the Growth and Income Strategy Portfolio’s Class A, C, Institutional, Service, IR and R Shares generated average annual total returns, without sales charges, of -0.54%, -1.24%, -0.13%, -0.56%, -0.29% and -0.69%, respectively. This compares to the -0.84% average annual total return of the Portfolio’s blended benchmark, which is composed 40% of the Barclays Global Index and 60% of the MSCI ACWI Index, during the same period. |
| | | The components of the Portfolio’s blended benchmark, the Barclays Global Index and the MSCI ACWI Index, generated average annual total returns of 1.02% and -2.36%, respectively, during the Reporting Period. |
8
PORTFOLIO RESULTS
| | | During the period since their inception on July 31, 2015 through December 31, 2015, the Growth and Income Strategy Portfolio’s Class R6 Shares generated a cumulative total return of -2.87% compared to the -2.24% cumulative total return of the Portfolio’s blended benchmark. The components of the Portfolio’s blended benchmark, the Barclays Global Index and the MSCI ACWI Index, generated cumulative total returns of 0.42% and -5.72%, respectively, during the same period. |
| | | Goldman Sachs Growth Strategy Portfolio — During the Reporting Period, the Growth Strategy Portfolio’s Class A, C, Institutional, Service, IR and R Shares generated average annual total returns, without sales charges, of -0.08%, -0.82%, 0.35%, -0.17%, 0.20% and -0.31%, respectively. This compares to the -1.57% average annual total return of the Portfolio’s blended benchmark, which is composed 80% of the MSCI ACWI Index and 20% of the Barclays Global Index, during the same period. |
| | | The components of the Portfolio’s blended benchmarks, the Barclays Global Index and the MSCI ACWI Index, generated average annual total returns of 1.02% and -2.36%, respectively, during the same period. |
| | | During the period since their inception on July 31, 2015 through December 31, 2015, the Growth Strategy Portfolio’s Class R6 Shares generated a cumulative total return of -3.66% compared to the -3.55% cumulative total return of the Portfolio’s blended benchmark. The components of the Portfolio’s blended benchmark, the Barclays Global Index and the MSCI ACWI Index, generated cumulative total returns of 0.42% and -5.72%, respectively, during the same period. |
| Q | | What key factors affected the Portfolios’ performance during the Reporting Period? |
| A | | During the Reporting Period, the Portfolios generated mixed results on an absolute basis, with those having greater equity exposure performing best. Three of the Portfolios generally outperformed their respective blended benchmarks. The Goldman Sachs Balanced Strategy Portfolio, which has a greater fixed income exposure, modestly underperformed its blended benchmark. Overall, security selection within the underlying funds added to the performance of each of the Portfolios. In addition, the Portfolios benefited from the implementation of our quarterly tactical views. However, our strategic, long-term asset allocation policy detracted from returns. |
| Q | | How did Global Tactical Asset Allocation decisions affect the Portfolios’ performance during the Reporting Period? |
| A | | The implementation of our quarterly tactical views contributed positively to the performance of the Portfolios during the Reporting Period. |
| | | Overall, the Portfolios benefited from our preference for equities over fixed income, especially during the first half of the Reporting Period. Within equity allocations, an underweight in emerging markets stocks versus developed markets stocks enhanced returns. Underweight positions in U.S. small-cap stocks relative to U.S. large-cap stocks also bolstered performance. These gains were partially offset by overweight positions in U.S. equities versus international equities and in U.S. value stocks versus U.S. growth stocks during the first quarter of 2015, which detracted. |
| | | Within fixed income allocations, underweight positions in local emerging markets debt versus developed markets debt added to results, especially during the third quarter of 2015. Conversely, an overweight position in high yield corporate bonds versus broad U.S. fixed income, mainly in the third calendar quarter, detracted from relative returns. The impact of our preference for U.S. fixed income versus international fixed income and our preference for U.S. dollar-denominated emerging markets debt versus developed markets debt had a relatively neutral impact on performance during the Reporting Period. |
| | | In terms of our country-level views, the Portfolios benefited from our country selection strategy within international equities (implemented through an investment in the Goldman Sachs International Equity Insights Fund). The impact of our country selection within emerging markets equities (accomplished through an investment in the Goldman Sachs Emerging Markets Equity Insights Fund) was relatively neutral during the Reporting Period. |
| Q | | How did the Portfolios’ underlying funds perform relative to their respective benchmark indices during the Reporting Period? |
| A | | Of the Portfolios’ underlying equity funds, the Goldman Sachs International Equity Insights Fund, the Goldman Sachs Emerging Markets Equity Insights Fund and the Goldman Sachs Small Cap Equity Insights Fund outperformed their respective benchmark indices the most. The Goldman Sachs Strategic Growth Fund, the Goldman Sachs Large Cap Growth Insights Fund and The Goldman Sachs Large Cap |
9
PORTFOLIO RESULTS
| | | Value Fund underperformed their respective benchmark indices most during the Reporting Period. |
| | | On the fixed income side, most underlying funds lagged their respective benchmark indices, with the Goldman Sachs Local Emerging Markets Debt Fund underperforming its benchmark index most during the Reporting Period. The Goldman Sachs Core Fixed Income Fund produced returns that were generally in line with its benchmark index. |
| | | Among alternative and dynamic investment strategies, the Goldman Sachs Managed Futures Strategy Fund generated strong returns and outperformed its benchmark index during the Reporting Period. The Goldman Sachs International Real Estate Securities Fund also outperformed its benchmark index. The Goldman Sachs Real Estate Securities Fund and the Goldman Sachs Dynamic Allocation Fund underperformed their respective benchmark indices. |
| Q | | How did the Portfolios use derivatives and similar instruments during the Reporting Period? |
| A | | The Portfolios do not directly invest in derivatives. However, some of the underlying funds used derivatives during the Reporting Period to apply their active investment views with greater versatility and to potentially afford greater risk management precision. As market conditions warranted during the Reporting Period, some of these underlying funds engaged in forward foreign currency exchange contracts, financial futures contracts, options, swap contracts and structured securities to attempt to enhance portfolio return and for hedging purposes. |
| Q | | What changes did you make during the Reporting Period within both the equity and fixed income portions of the Portfolio? |
| A | | In implementing our strategies, we were bullish on equities versus fixed income when the Reporting Period began, maintaining that view through the second quarter of 2015 due to continued strong momentum in the global equity markets. In the third calendar quarter, we shifted our view to neutral on stocks versus bonds given higher relative valuations in the global equity markets. During the fourth calendar quarter, we adopted a slightly bullish view of fixed income versus equities because of poor momentum in the global equity markets. |
| | | Within equities, at the beginning of the Reporting Period, we had a slightly bullish view on U.S. stocks versus international stocks due to high risk premiums and strong fund flows in the U.S. During the second and third quarters of 2015, we continued to hold a positive view of U.S. stocks over international stocks due to continued strong fund flows and what we considered to be an attractive risk-return profile in the U.S. During the fourth calendar quarter, and in spite of relatively expensive valuations, we continued to favor U.S. stocks over international stocks, a view driven by strong momentum in the U.S. stock market. |
| | | When the Reporting Period started, we were neutral on emerging markets equities relative to developed markets equities because of negative short-term momentum in emerging markets equities. We shifted to a bearish view on emerging markets equities versus developed markets equities during the second calendar quarter due to what we saw as an unattractive risk-reward profile and a poor macroeconomic environment for emerging markets equities. In the third calendar quarter, we maintained a slightly bearish view on emerging markets equities versus developed markets equities as a result of negative short-term momentum in emerging markets equities. We continued have a slightly bearish view on emerging markets equities relative to developed markets equities during the fourth calendar quarter because of poor momentum, expensive valuations and weak macroeconomic conditions in the emerging markets. |
| | | We implemented our country level views within the Goldman Sachs International Equity Insights Fund and the Goldman Sachs Emerging Markets Equity Insights Fund, which served as underlying funds during the Reporting Period. Among developed markets equities at the end of the Reporting Period, we were bullish on Japan and Austria due to what we considered to be attractive valuations and risk premiums. We held bearish views on the U.K. and Canada due to poor short-term momentum and weak fund flows. Among emerging markets equities at the end of the Reporting Period, we favored Russia and Hungary, primarily as a result of what we saw as attractive long-term valuations and an improving macroeconomic environment. We were bearish on Taiwan and Malaysia due to what we believe to be deteriorating macroeconomic conditions. |
| | | Among U.S. equities, we began the Reporting Period bullish on value stocks versus growth stocks because of continuing positive sentiment for value stocks. We shifted our view to neutral going into the second quarter of 2015, remaining neutral through the third calendar quarter, largely because of mixed consumer and business sentiment. During the fourth calendar quarter, we moved to a bullish view on growth stocks relative to value stocks because of improved market sentiment for growth stocks. At the beginning of the |
10
PORTFOLIO RESULTS
| | Reporting Period, we were bullish on large-cap stocks versus small-cap stocks as a result of positive sentiment for large-cap stocks. We remained bullish on large-cap stocks versus small-cap stocks in the second calendar quarter because of what we considered to be the attractive risk-reward profile of large-cap stocks. We maintained our bullish view on large-cap stocks compared to small-cap stocks during the third calendar quarter due to what we saw as the more attractive valuations and stronger sentiment for large-cap stocks. In the fourth quarter of 2015, we stayed bullish on large-cap stocks versus small-cap stocks because of heightened investor risk aversion. |
| | | Within fixed income, at the start of the Reporting Period, we had a neutral view on international fixed income versus U.S. fixed income because of falling yields in the U.S. and continued economic uncertainty in Europe and Japan. We maintained our neutral view in the second calendar quarter given uncertainty about future U.S. interest rates and continued macroeconomic risk in Europe and Japan. In the third calendar quarter, we shifted our view from neutral to bullish on U.S. fixed income versus international fixed income, remaining bullish through the end of the Reporting Period, due to what we considered to be more attractive yields in the U.S. fixed income market. At the beginning of the Reporting Period and through the third quarter of 2015, we were bullish on high yield corporate bonds versus investment grade corporate bonds given the strong momentum of high yield corporate bonds. In the fourth calendar quarter, we became bullish on investment grade corporate bonds relative to high yield corporate bonds given heightened risk aversion and negative momentum in the high yield corporate bond market. |
| | | When the Reporting Period started, we held a neutral view on U.S. dollar-denominated emerging markets debt versus developed markets debt due to negative momentum in U.S. dollar-denominated emerging markets debt. We maintained this neutral view throughout the Reporting Period. At the beginning of the Reporting Period, we had a neutral view on local emerging markets debt versus developed markets debt because of negative momentum in local emerging markets debt. In the second quarter of 2015, we shifted our view to bullish on local emerging markets debt versus developed markets debt as a result of what we considered to be the attractive risk-return profile and positive macroeconomic outlook for local emerging markets debt. We became bearish on local emerging markets debt versus developed markets debt during the third calendar quarter, maintaining this view through the end of the Reporting Period, largely because of weak momentum in emerging markets currencies. |
| Q | | Were there any changes to the Portfolios’ portfolio management team during the Reporting Period? |
| A | | During the Reporting Period, Edward J. Tostanoski III became a co-portfolio manager for the Portfolios. By design, all investment decisions for the Portfolios are performed within a co-lead or team structure, with multiple subject matter experts. This strategic decision making has been the cornerstone of our approach and ensures continuity in the Portfolios. Alongside Edward J. Tostanoski III, the portfolio managers for the Portfolios are William Fallon, James Park and Nicholas Chan. |
| Q | | What is the Portfolios’ tactical view and strategy for the months ahead? |
| A | | Global equilibrium is the foundation of our strategic asset allocation process — that is, we believe that a globally-diversified portfolio of asset classes, weighted by their market capitalization, provides economically intuitive, meaningful and balanced exposures to investment opportunities. We make 10 active decisions within the Portfolios based on our current outlook on global equity, fixed income and currency markets. On a monthly basis, we shift assets away from the strategic allocation (tilting our positions in certain asset classes and countries from their longer-term, strategic weights) in an effort to benefit from changing conditions in global capital markets. |
| | | At the end of the Reporting Period, we were neutral on equities relative to fixed income. We favored developed markets stocks over emerging markets stocks. We held a positive view of U.S. stocks versus international stocks. Within U.S. equities, we had increased our bullish view of growth stocks versus value stocks, and we maintained our positive view of large-cap stocks versus small-cap stocks. |
| | | In fixed income at the end of the Reporting Period, we had shifted our view from bullish to bearish on U.S. fixed income relative to international fixed income. We remained bullish on investment grade corporate bonds versus high yield corporate bonds. In addition, we were bearish on local emerging markets debt versus developed markets debt and had become bearish on U.S. dollar-denominated emerging markets debt versus developed markets debt. |
11
FUND BASICS
Balanced Strategy
as of December 31, 2015
| | | | | | | | | | | | | | | | | | |
| | PERFORMANCE REVIEW | |
| | | January 1, 2015– December 31, 2015 | | Portfolio Total
Return (based on NAV)1 | | | Balanced Strategy
Composite Index2 | | | Barclays Global Aggregate Bond Index (Gross, USD, Hedged) | | | MSCI ACWI
Index (Net, USD,
Unhedged) | |
| | Class A | | | -0.90 | | | | -0.16 | % | | | 1.02 | % | | | -2.36 | % |
| | Class C | | | -1.65 | | | | -0.16 | | | | 1.02 | | | | -2.36 | |
| | Institutional | | | -0.49 | | | | -0.16 | | | | 1.02 | | | | -2.36 | |
| | Service | | | -0.99 | | | | -0.16 | | | | 1.02 | | | | -2.36 | |
| | Class IR | | | -0.73 | | | | -0.16 | | | | 1.02 | | | | -2.36 | |
| | | Class R | | | -1.23 | | | | -0.16 | | | | 1.02 | | | | -2.36 | |
| | | | | |
| | | | | | | | | | | | | | | |
| | | July 31, 2015– December 31, 2015 | | | | | | | | | | | | |
| | | Class R6 | | | -2.01 | % | | | -1.91 | % | | | 0.42 | % | | | -5.72 | % |
| | 1 | | The net asset value (“NAV”) represents the net assets of the class of the Portfolio (ex-dividend) divided by the total number of shares of the class outstanding. The Portfolio’s performance assumes the reinvestment of dividends and other distributions. The Portfolio’s performance does not reflect the deduction of any applicable sales charges. |
| | 2 | | The Balanced Strategy Composite Index (“Balanced Composite”) is a composite representation prepared by the investment adviser of the performance of the Portfolio’s asset classes weighted according to their respective weightings in the Portfolio’s target range. The Balanced Strategy Composite Index (“Balanced Composite”) is comprised of a blend of the Barclays Global Aggregate Bond Index (Gross, USD, Hedged) (60%) and the MSCI® All Country World Index (the “MSCI ACWI Index”) (40%). The Balanced Composite figures do not reflect any deduction for fees, expenses or taxes. The Barclays Global Aggregate Bond Index hedged to the U.S. dollar, is an unmanaged index, provides a broad-based measure of the global investment-grade fixed-rate debt markets and covers the most liquid portion of the global investment grade fixed-rate bond market, including government, credit and collateralized securities. The Barclays Global Aggregate Bond Index figures do not include any deduction for fees, expenses or taxes. It is not possible to invest directly in an unmanaged index. The MSCI ACWI Index is a free float-adjusted market capitalization weighted index that is designed to measure the equity market performance of developed and emerging markets. The MSCI ACWI Index consists of 46 country indices comprising 23 developed and 23 emerging market country indices. The developed market country indexes included are: Australia, Austria, Belgium, Canada, Denmark, Finland, France, Germany, Hong Kong, Ireland, Israel, Italy, Japan, Netherlands, New Zealand, Norway, Portugal, Singapore, Spain, Sweden, Switzerland, the United Kingdom and the United States. The emerging market country indexes included are: Brazil, Chile, China, Colombia, Czech Republic, Egypt, Greece, Hungary, India, Indonesia, Malaysia, Mexico, Peru, Philippines, Poland, Qatar, Russia, South Africa, South Korea, Taiwan, Thailand, Turkey and United Arab Emirates. The MSCI ACWI Index figures do not include any deduction for fees, expenses or taxes. It is not possible to invest directly in an unmanaged index. |
The returns set forth in the table above represent past performance. Past performance does not guarantee future results. The Portfolio’s investment return and principal value will fluctuate so that an investor’s shares, when redeemed, may be worth more or less than their original cost. Current performance may be lower or higher than the performance quoted above. Please visit our web site at www.GSAMFUNDS.com to obtain the most recent month-end returns. Performance reflects fee waivers and/or expense limitations in effect. In their absence, performance would be reduced. Returns do not reflect the deduction of taxes that a shareholder would pay on Portfolio distributions or the redemption of Portfolio shares.
12
FUND BASICS
| | | | | | | | | | | | | | | | | | | | |
| | STANDARDIZED TOTAL RETURNS3 |
| | | For the period ended 12/31/15 | | One Year | | | Five Years | | | Ten Years | | | Since Inception | | | Inception Date |
| | Class A | | | -6.32 | % | | | 2.30 | % | | | 3.04 | % | | | 3.92 | % | | 1/2/98 |
| | Class C | | | -2.64 | | | | 2.70 | | | | 2.85 | | | | 3.48 | | | 1/2/98 |
| | Institutional | | | -0.49 | | | | 3.88 | | | | 4.04 | | | | 4.67 | | | 1/2/98 |
| | Service | | | -0.99 | | | | 3.36 | | | | 3.52 | | | | 4.15 | | | 1/2/98 |
| | Class IR | | | -0.73 | | | | 3.69 | | | | N/A | | | | 2.75 | | | 11/30/07 |
| | Class R | | | -1.23 | | | | 3.21 | | | | N/A | | | | 2.26 | | | 11/30/07 |
| | | Class R6 | | | N/A | | | | N/A | | | | N/A | | | | -2.01 | | | 7/31/15 |
| | 3 | | The Standardized Total Returns are average annual or cumulative total returns (only if the performance period is one year or less) as of the most recent calendar quarter-end. They assume reinvestment of all distributions at NAV. These returns reflect a maximum initial sales charge of 5.5% for Class A Shares and the assumed contingent deferred sales charge for Class C Shares (1% if redeemed within 12 months of purchase). Because Institutional, Service, Class IR, Class R and Class R6 Shares do not involve a sales charge, such a charge is not applied to their Standardized Total Returns. |
The returns set forth in the table above represent past performance. Past performance does not guarantee future results. The Portfolio’s investment return and principal value will fluctuate so that an investor’s shares, when redeemed, may be worth more or less than their original cost. Current performance may be lower or higher than the performance quoted above. Please visit our web site at www.GSAMFUNDS.com to obtain the most recent month-end returns. Performance reflects applicable fee waivers and/or expense limitations in effect during the periods shown. In their absence, performance would be reduced. Returns do not reflect the deduction of taxes that a shareholder would pay on Portfolio distributions or the redemption of Portfolio shares.
| | | | | | | | | | |
| | EXPENSE RATIOS4 | |
| | | | | Net Expense Ratio (Current) | | | Gross Expense Ratio (Before Waivers) | |
| | Class A | | | 1.37 | % | | | 1.43 | % |
| | Class C | | | 2.12 | | | | 2.18 | |
| | Institutional | | | 0.97 | | | | 1.03 | |
| | Service | | | 1.47 | | | | 1.52 | |
| | Class IR | | | 1.12 | | | | 1.18 | |
| | Class R | | | 1.62 | | | | 1.67 | |
| | | Class R6 | | | 0.95 | | | | 1.01 | |
| | 4 | | The expense ratios of the Portfolio, both current (net of applicable fee waivers and/or expense limitations) and before waivers (gross of applicable fee waivers and/or expense limitations) are as set forth above according to the most recent publicly available Prospectus for the Portfolio and will differ from the expense ratios disclosed in the Financial Highlights in this report due to the inclusion of Underlying Fund fees and expenses, which are not included in the operating expenses of the Portfolio reflected in the Financial Highlights. Pursuant to a contractual arrangement, the Portfolio’s waivers and/or expense limitations will remain in place through at least July 31, 2016, and prior to such date the Investment Adviser may not terminate the arrangements without the approval of the Portfolio’s Board of Trustees. If these arrangements are discontinued in the future, the expense ratios may change without shareholder approval. |
13
FUND BASICS
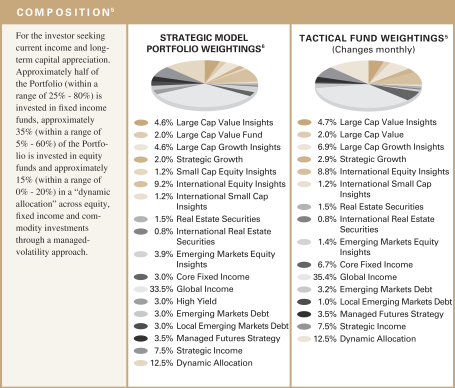
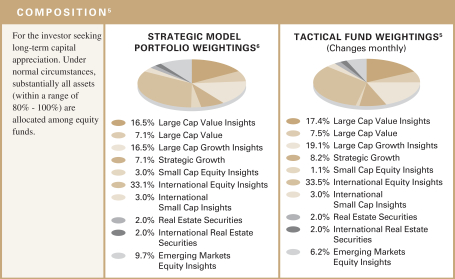
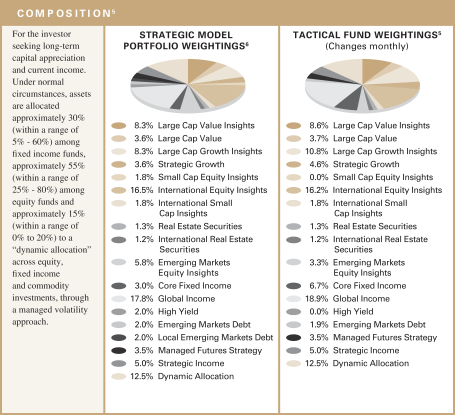
| | 5 | | The tactical fund weightings are set at the beginning of each calendar quarter. The weighting in the chart above reflects the allocations from September 30, 2015 to December 31, 2015. Actual Underlying Fund weighting in the Portfolios may differ from the figures shown above due to rounding, differences in returns of the Underlying Funds, or both. The above figures are not indicative of future allocations. |
| | 6 | | Strategic allocation is the process of determining the areas of the global markets in which to invest, and in what long-term proportion, for each Underlying Fund. Our global approach attempts to generate strong long-term returns across geographies and asset classes, and is determined through a careful review of market opportunities and risk/return tradeoffs. It is rebalanced annually. On a monthly basis, we shift assets around the strategic allocation, over and under-weighting asset classes and countries relative to the neutral starting point, seeking to benefit from changing short-term conditions in global capital markets. This is called tactical asset allocation. |
14
FUND BASICS
| | |
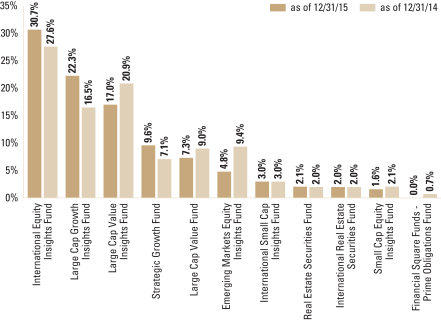
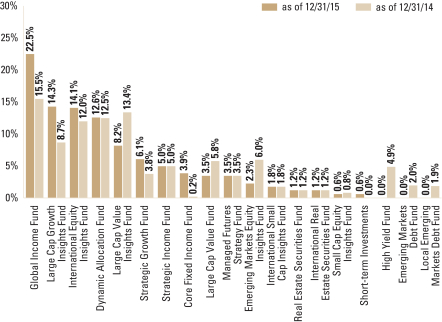
| OVERALL UNDERLYING FUND WEIGHTINGS7 |
Percentage of Net Assets |
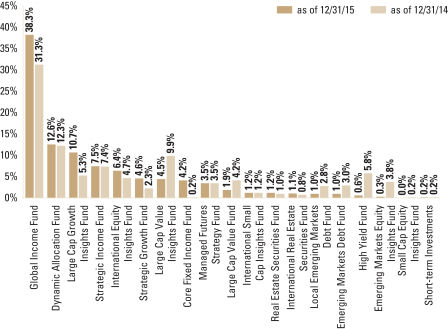
| | 7 | | The Portfolio is actively managed and, as such, its composition may differ over time. The percentage shown for each underlying fund reflects the value of that underlying fund as a percentage of net assets of the Portfolio. Short-term investments represent repurchase agreements. Figures in the above graph may not sum to 100% due to rounding and/or the exclusion of other assets and liabilities. |
15
GOLDMAN SACHS BALANCED STRATEGY PORTFOLIO
Performance Summary
December 31, 2015
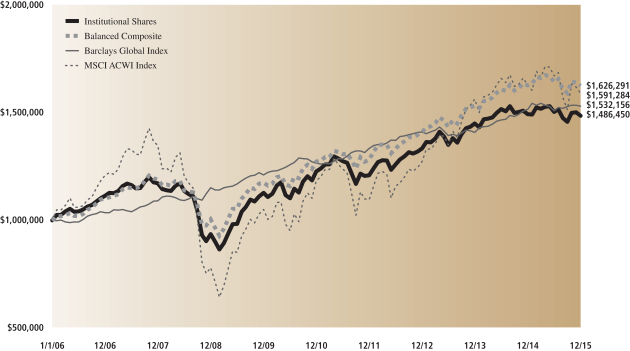
The following graph shows the value, as of December 31, 2015, of a $1,000,000 investment made on January 1, 2006 in Institutional Shares at NAV. For comparative purposes, the performance of the Portfolio’s benchmarks, the Balanced Strategy Composite Index (the “Balanced Composite”), which is comprised of 60% of the Barclays Global Aggregate Bond Index (Gross, USD, Hedged) (the “Barclays Global Index”) and 40% of the MSCI® All Country World Index (Net, USD, Unhedged) (the “MSCI ACWI Index”), the Barclays Global Index and the MSCI ACWI Index (each with distributions reinvested), are shown. This performance data represents past performance and should not be considered indicative of future performance, which will fluctuate with changes in market conditions. These performance fluctuations will cause an investor’s shares, when redeemed, to be worth more or less than their original cost. Performance reflects applicable fee waivers and/or expense limitations currently in effect during the periods shown and in their absence, performance would be reduced. Returns do not reflect the deduction of taxes that a shareholder would pay on Portfolio distributions or the redemption of Portfolio shares. Performance of Class A, Class C, Service, Class IR, Class R and Class R6 Shares will vary from Institutional Shares due to differences in class specific fees and any applicable sales charges. In addition to the Investment Adviser’s decisions regarding underlying fund selection and allocations among them, other factors may affect Portfolio performance. These factors include, but are not limited to, Portfolio operating fees and expenses, portfolio turnover and subscription and redemption cash flows affecting the Portfolio.
|
| Balanced Strategy Portfolio’s 10 Year Performance |
Performance of a $1,000,000 investment, with distributions reinvested, from January 1, 2006 through December 31, 2015.
| | | | | | | | | | | | | | |
| Average Annual Total Return through December 31, 2015 | | | One Year | | | | Five Years | | | | Ten Years | | | Since Inception |
Class A (Commenced January 2, 1998) | | | | | | | | | | | | | | |
Excluding sales charges | | | -0.90% | | | | 3.46% | | | | 3.62% | | | 4.25% |
Including sales charges | | | -6.32% | | | | 2.30% | | | | 3.04% | | | 3.92% |
|
Class C (Commenced January 2, 1998) | | | | | | | | | | | | | | |
Excluding contingent deferred sales charges | | | -1.65% | | | | 2.70% | | | | 2.85% | | | 3.48% |
Including contingent deferred sales charges | | | -2.64% | | | | 2.70% | | | | 2.85% | | | 3.48% |
|
Institutional Class (Commenced January 2, 1998) | | | -0.49% | | | | 3.88% | | | | 4.04% | | | 4.67% |
|
Service Class (Commenced January 2, 1998) | | | -0.99% | | | | 3.36% | | | | 3.52% | | | 4.15% |
|
Class IR (Commenced November 30, 2007) | | | -0.73% | | | | 3.69% | | | | N/A | | | 2.75% |
|
Class R (Commenced November 30, 2007) | | | -1.23% | | | | 3.21% | | | | N/A | | | 2.26% |
|
Class R6 (Commenced July 31, 2015) | | | N/A | | | | N/A | | | | N/A | | | -2.01%* |
|
| * | | Total return for periods of less than one year represents cumulative total return. |
16
FUND BASICS
Equity Growth Strategy
as of December 31, 2015
| | | | | | | | | | |
| | PERFORMANCE REVIEW | |
| | | January 1, 2015–December 31, 2015 | | Portfolio Total Return (based on NAV)1 | | | MSCI® ACWI Index2 | |
| | Class A | | | 0.83 | % | | | -2.36 | % |
| | Class C | | | 0.13 | | | | -2.36 | |
| | Institutional | | | 1.31 | | | | -2.36 | |
| | Service | | | 0.78 | | | | -2.36 | |
| | Class IR | | | 1.11 | | | | -2.36 | |
| | | Class R | | | 0.61 | | | | -2.36 | |
| | | |
| | | | | | | | | |
| | | July 31, 2015–December 31, 2015 | | | | | | |
| | | Class R6 | | | -3.93 | % | | | -5.72 | % |
| | 1 | | The net asset value (“NAV”) represents the net assets of the class of the Portfolio (ex-dividend) divided by the total number of shares of the class outstanding. The Portfolio’s performance assumes the reinvestment of dividends and other distributions. The Portfolio’s performance does not reflect the deduction of any applicable sales charges. |
| | 2 | | The Portfolio’s benchmark is the MSCI® All Country World Index (Net, USD, Unhedged) (the “MSCI ACWI Index”). The MSCI ACWI Index figures do not reflect any deduction for fees, expenses or taxes. The MSCI ACWI Index is a free float adjusted market capitalization weighted index that is designed to measure the equity market performance of developed and emerging markets. The MSCI ACWI consists of 46 country indices comprising 23 developed and 23 emerging market country indices. The developed market country indexes included are: Australia, Austria, Belgium, Canada, Denmark, Finland, France, Germany, Hong Kong, Ireland, Israel, Italy, Japan, Netherlands, New Zealand, Norway, Portugal, Singapore, Spain, Sweden, Switzerland, the United Kingdom and the United States. The emerging market country indexes included are: Brazil, Chile, China, Colombia, Czech Republic, Egypt, Greece, Hungary, India, Indonesia, Malaysia, Mexico, Peru, Philippines, Poland, Qatar, Russia, South Africa, South Korea, Taiwan, Thailand, Turkey and United Arab Emirates. The MSCI ACWI Index figures do not include any deduction for fees, expenses or taxes. It is not possible to invest directly in an unmanaged index. |
The returns set forth in the table above represent past performance. Past performance does not guarantee future results. The Portfolio’s investment return and principal value will fluctuate so that an investor’s shares, when redeemed, may be worth more or less than their original cost. Current performance may be lower or higher than the performance quoted above. Please visit our web site at www.GSAMFUNDS.com to obtain the most recent month-end returns. Performance reflects fee waivers and/or expense limitations in effect. In their absence, performance would be reduced. Returns do not reflect the deduction of taxes that a shareholder would pay on Portfolio distributions or the redemption of Portfolio shares.
17
FUND BASICS
| | | | | | | | | | | | | | | | | | | | |
| | STANDARDIZED TOTAL RETURNS3 |
| | | For the period ended 12/31/15 | | One Year | | | Five Years | | | Ten Years | | | Since Inception | | | Inception Date |
| | Class A | | | -4.71 | % | | | 5.57 | % | | | 3.34 | % | | | 4.09 | % | | 1/2/98 |
| | Class C | | | -0.87 | | | | 5.96 | | | | 3.15 | | | | 3.66 | | | 1/2/98 |
| | Institutional | | | 1.31 | | | | 7.20 | | | | 4.33 | | | | 4.82 | | | 1/2/98 |
| | Service | | | 0.78 | | | | 6.67 | | | | 3.82 | | | | 4.31 | | | 1/2/98 |
| | Class IR | | | 1.11 | | | | 7.06 | | | | N/A | | | | 1.93 | | | 11/30/07 |
| | Class R | | | 0.61 | | | | 6.51 | | | | N/A | | | | 1.48 | | | 11/30/07 |
| �� | | Class R6 | | | N/A | | | | N/A | | | | N/A | | | | -3.93 | | | 7/31/15 |
| | 3 | | The Standardized Total Returns are average annual or cumulative total returns (only if the performance period is one year or less) as of the most recent calendar quarter-end. They assume reinvestment of all distributions at NAV. These returns reflect a maximum initial sales charge of 5.5% for Class A Shares and the assumed contingent deferred sales charge for Class C Shares (1% if redeemed within 12 months of purchase). Because Institutional, Service, Class IR, Class R and Class R6 Shares do not involve a sales charge, such a charge is not applied to their Standardized Total Returns. |
The returns set forth in the table above represent past performance. Past performance does not guarantee future results. The Portfolio’s investment return and principal value will fluctuate so that an investor’s shares, when redeemed, may be worth more or less than their original cost. Current performance may be lower or higher than the performance quoted above. Please visit our web site at www.GSAMFUNDS.com to obtain the most recent month-end returns. Performance reflects applicable fee waivers and/or expense limitations in effect during the periods shown. In their absence, performance would be reduced. Returns do not reflect the deduction of taxes that a shareholder would pay on Portfolio distributions or the redemption of Portfolio shares.
| | | | | | | | | | |
| | EXPENSE RATIOS4 | |
| | | | | Net Expense Ratio (Current) | | | Gross Expense Ratio (Before Waivers) | |
| | Class A | | | 1.38 | % | | | 1.46 | % |
| | Class C | | | 2.13 | | | | 2.20 | |
| | Institutional | | | 0.98 | | | | 1.06 | |
| | Service | | | 1.48 | | | | 1.55 | |
| | Class IR | | | 1.13 | | | | 1.21 | |
| | Class R | | | 1.63 | | | | 1.70 | |
| | | Class R6 | | | 0.96 | | | | 1.04 | |
| | 4 | | The expense ratios of the Portfolio, both current (net of applicable fee waivers and/or expense limitations) and before waivers (gross of applicable fee waivers and/or expense limitations) are as set forth above according to the most recent publicly available Prospectus for the Portfolio and will differ from the expense ratios disclosed in the Financial Highlights in this report due to the inclusion of Underlying Fund fees and expenses, which are not included in the operating expenses of the Portfolio reflected in the Financial Highlights. Pursuant to a contractual arrangement, the Portfolio’s waivers and/or expense limitations will remain in place through at least July 31, 2016, and prior to such date the Investment Adviser may not terminate the arrangements without the approval of the Portfolio’s Board of Trustees. If these arrangements are discontinued in the future, the expense ratios may change without shareholder approval. |
18
FUND BASICS
| | 5 | | The tactical fund weightings are set at the beginning of each calendar quarter. The weighting in the chart above reflects the allocations from September 30, 2015 to December 31, 2015. Actual Underlying Fund weighting in the Portfolios may differ from the figures shown above due to rounding, differences in returns of the Underlying Funds, or both. The above figures are not indicative of future allocations. |
| | 6 | | Strategic allocation is the process of determining the areas of the global markets in which to invest, and in what long-term proportion, for each Underlying Fund. Our global approach attempts to generate strong long-term returns across geographies and asset classes, and is determined through a careful review of market opportunities and risk/return tradeoffs. It is rebalanced annually. On a monthly basis, we shift assets around the strategic allocation, over and under-weighting asset classes and countries relative to the neutral starting point, seeking to benefit from changing short-term conditions in global capital markets. This is called tactical asset allocation. |
19
FUND BASICS
|
| OVERALL UNDERLYING FUND WEIGHTINGS7 |
| Percentage of Net Assets |
| | 7 | | The Portfolio is actively managed and, as such, its composition may differ over time. The percentage shown for each underlying fund reflects the value of that underlying fund as a percentage of net assets of the Portfolio. Figures in the above graph may not sum to 100% due to rounding and/or the exclusion of other assets and liabilities. |
20
GOLDMAN SACHS EQUITY GROWTH STRATEGY PORTFOLIO
Performance Summary
December 31, 2015
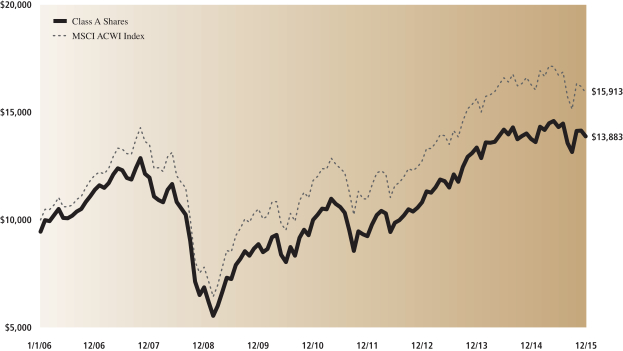
The following graph shows the value, as of December 31, 2015, of a $10,000 investment made on January 1, 2006 in Class A Shares (with the maximum sales charge of 5.5%). For comparative purposes, the performance of the Portfolio’s benchmark, the MSCI® All Country World Index (Net, USD, Unhedged) (“MSCI ACWI Index”) (with distributions reinvested), is shown. This performance data represents past performance and should not be considered indicative of future performance, which will fluctuate with changes in market conditions. These performance fluctuations will cause an investor’s shares, when redeemed, to be worth more or less than their original cost. Performance reflects applicable fee waivers and/or expense limitations currently in effect during the periods shown and in their absence, performance would be reduced. Returns do not reflect the deduction of taxes that a shareholder would pay on Portfolio distributions or the redemption of Portfolio shares. Performance of Class C, Institutional, Service, Class IR, Class R and Class R6 Shares will vary from Class A Shares due to differences in class specific fees and any applicable sales charges. In addition to the Investment Adviser’s decisions regarding underlying fund selection and allocations among them, other factors may affect Portfolio performance. These factors include, but are not limited to, Portfolio operating fees and expenses, portfolio turnover and subscription and redemption cash flows affecting the Portfolio.
|
| Equity Growth Strategy Portfolio’s 10 Year Performance |
Performance of a $10,000 investment, with distributions reinvested, from January 1, 2006 through December 31, 2015.
| | | | | | | | | | | | | | |
| Average Annual Total Return through December 31, 2015 | | | One Year | | | | Five Years | | | | Ten Years | | | Since Inception |
Class A (Commenced January 2, 1998) | | | | | | | | | | | | | | |
Excluding sales charges | | | 0.83% | | | | 6.77% | | | | 3.92% | | | 4.42% |
Including sales charges | | | -4.71% | | | | 5.57% | | | | 3.34% | | | 4.09% |
|
Class C (Commenced January 2, 1998) | | | | | | | | | | | | | | |
Excluding contingent deferred sales charges | | | 0.13% | | | | 5.96% | | | | 3.15% | | | 3.66% |
Including contingent deferred sales charges | | | -0.87% | | | | 5.96% | | | | 3.15% | | | 3.66% |
|
Institutional Class (Commenced January 2, 1998) | | | 1.31% | | | | 7.20% | | | | 4.33% | | | 4.82% |
|
Service Class (Commenced January 2, 1998) | | | 0.78% | | | | 6.67% | | | | 3.82% | | | 4.31% |
|
Class IR (Commenced November 30, 2007) | | | 1.11% | | | | 7.06% | | | | N/A | | | 1.93% |
|
Class R (Commenced November 30, 2007) | | | 0.61% | | | | 6.51% | | | | N/A | | | 1.48% |
|
Class R6 (Commenced July 31, 2015) | | | N/A | | | | N/A | | | | N/A | | | -3.93%* |
|
| * | | Total return for periods of less than one year represents cumulative total return. |
21
FUND BASICS
Growth and Income Strategy
as of December 31, 2015
| | | | | | | | | | | | | | | | | | |
| | PERFORMANCE REVIEW | |
| | | January 1, 2015– December 31, 2015 | | Portfolio Total
Return
(based on NAV)1 | | | Growth and Income
Strategy
Composite Index2 | | | Barclays Global Aggregate Bond Index (Gross, USD, Hedged) | | | MSCI ACWI
Index (Net, USD,
Unhedged) | |
| | Class A | | | -0.54 | % | | | -0.84 | % | | | 1.02 | % | | | -2.36 | % |
| | Class C | | | -1.24 | | | | -0.84 | | | | 1.02 | | | | -2.36 | |
| | Institutional | | | -0.13 | | | | -0.84 | | | | 1.02 | | | | -2.36 | |
| | Service | | | -0.56 | | | | -0.84 | | | | 1.02 | | | | -2.36 | |
| | Class IR | | | -0.29 | | | | -0.84 | | | | 1.02 | | | | -2.36 | |
| | | Class R | | | -0.69 | | | | -0.84 | | | | 1.02 | | | | -2.36 | |
| | | | | |
| | | | | | | | | | | | | | | |
| | | July 31, 2015– December 31, 2015 | | | | | | | | | | | | |
| | | Class R6 | | | -2.87 | % | | | -2.24 | % | | | 0.42 | % | | | -5.72 | % |
| | 1 | | The net asset value (“NAV”) represents the net assets of the class of the Portfolio (ex-dividend) divided by the total number of shares of the class outstanding. The Portfolio’s performance assumes the reinvestment of dividends and other distributions. The Portfolio’s performance does not reflect the deduction of any applicable sales charges. |
| | 2 | | The Growth and Income Strategy Composite (“Growth and Income Composite”) is comprised of a blend of the Barclays Global Aggregate Bond Index (Gross, USD, Hedged) (40%) and the MSCI® All Country World Index (Net, USD, Unhedged) (the “MSCI ACWI Index”) (60%). The Growth and Income Composite figures do not reflect any deduction for fees, expenses or taxes. The Barclays Global Aggregate Bond Index hedged to the U.S. dollar, is an unmanaged index, provides a broad-based measure of the global investment-grade fixed-rate debt markets and covers the most liquid portion of the global investment grade fixed-rate bond market, including government, credit and collateralized securities. The Barclays Global Aggregate Bond Index figures do not include any deduction for fees, expenses or taxes. It is not possible to invest directly in an unmanaged index. The MSCI ACWI Index is a free float-adjusted market capitalization weighted index that is designed to measure the equity market performance of developed and emerging markets. The MSCI ACWI consists of 46 country indices comprising 23 developed and 23 emerging market country indices. The developed market country indexes included are: Australia, Austria, Belgium, Canada, Denmark, Finland, France, Germany, Hong Kong, Ireland, Israel, Italy, Japan, Netherlands, New Zealand, Norway, Portugal, Singapore, Spain, Sweden, Switzerland, the United Kingdom and the United States. The emerging market country indexes included are: Brazil, Chile, China, Colombia, Czech Republic, Egypt, Greece, Hungary, India, Indonesia, Malaysia, Mexico, Peru, Philippines, Poland, Qatar, Russia, South Africa, South Korea, Taiwan, Thailand, Turkey and United Arab Emirates. The MSCI ACWI Index figures do not include any deduction for fees, expenses or taxes. It is not possible to invest directly in an unmanaged index. |
The returns set forth in the table above represent past performance. Past performance does not guarantee future results. The Portfolio’s investment return and principal value will fluctuate so that an investor’s shares, when redeemed, may be worth more or less than their original cost. Current performance may be lower or higher than the performance quoted above. Please visit our web site at www.GSAMFUNDS.com to obtain the most recent month-end returns. Performance reflects fee waivers and/or expense limitations in effect. In their absence, performance would be reduced. Returns do not reflect the deduction of taxes that a shareholder would pay on Portfolio distributions or the redemption of Portfolio shares.
22
FUND BASICS
| | | | | | | | | | | | | | | | | | | | |
| | STANDARDIZED TOTAL RETURNS3 |
| | | For the period ended 12/31/15 | | One Year | | | Five Years | | | Ten Years | | | Since Inception | | | Inception Date |
| | Class A | | | -5.98 | % | | | 3.36 | % | | | 2.90 | % | | | 4.14 | % | | 1/2/98 |
| | Class C | | | -2.23 | | | | 3.76 | | | | 2.72 | | | | 3.69 | | | 1/2/98 |
| | Institutional | | | -0.13 | | | | 4.94 | | | | 3.89 | | | | 4.88 | | | 1/2/98 |
| | Service | | | -0.56 | | | | 4.44 | | | | 3.39 | | | | 4.36 | | | 1/2/98 |
| | Class IR | | | -0.29 | | | | 4.79 | | | | N/A | | | | 2.15 | | | 11/30/07 |
| | Class R | | | -0.69 | | | | 4.27 | | | | N/A | | | | 1.68 | | | 11/30/07 |
| | | Class R6 | | | N/A | | | | N/A | | | | N/A | | | | -2.87 | | | 7/31/15 |
| | 3 | | The Standardized Total Returns are average annual or cumulative total returns (only if the performance period is one year or less) as of the most recent calendar quarter-end. They assume reinvestment of all distributions at NAV. These returns reflect a maximum initial sales charge of 5.5% for Class A Shares and the assumed contingent deferred sales charge for Class C Shares (1% if redeemed within 12 months of purchase). Because Institutional, Service, Class IR, Class R and Class R6 Shares do not involve a sales charge, such a charge is not applied to their Standardized Total Returns. |
The returns set forth in the table above represent past performance. Past performance does not guarantee future results. The Portfolio’s investment return and principal value will fluctuate so that an investor’s shares, when redeemed, may be worth more or less than their original cost. Current performance may be lower or higher than the performance quoted above. Please visit our web site at www.GSAMFUNDS.com to obtain the most recent month-end returns. Performance reflects applicable fee waivers and/or expense limitations in effect during the periods shown. In their absence, performance would be reduced. Returns do not reflect the deduction of taxes that a shareholder would pay on Portfolio distributions or the redemption of Portfolio shares.
| | | | | | | | | | |
| | EXPENSE RATIOS4 | |
| | | | | Net Expense Ratio (Current) | | | Gross Expense Ratio (Before Waivers) | |
| | Class A | | | 1.40 | % | | | 1.43 | % |
| | Class C | | | 2.15 | | | | 2.18 | |
| | Institutional | | | 1.00 | | | | 1.03 | |
| | Service | | | 1.50 | | | | 1.53 | |
| | Class IR | | | 1.15 | | | | 1.18 | |
| | Class R | | | 1.65 | | | | 1.68 | |
| | | Class R6 | | | 0.98 | | | | 1.01 | |
| | 4 | | The expense ratios of the Portfolio, both current (net of applicable fee waivers and/or expense limitations) and before waivers (gross of applicable fee waivers and/or expense limitations) are as set forth above according to the most recent publicly available Prospectus for the Portfolio and will differ from the expense ratios disclosed in the Financial Highlights in this report due to the inclusion of Underlying Fund fees and expenses, which are not included in the operating expenses of the Portfolio reflected in the Financial Highlights. Pursuant to a contractual arrangement, the Portfolio’s waivers and/or expense limitations will remain in place through at least July 31, 2016, and prior to such date the Investment Adviser may not terminate the arrangements without the approval of the Portfolio’s Board of Trustees. If these arrangements are discontinued in the future, the expense ratios may change without shareholder approval. |
23
FUND BASICS
| | 5 | | The tactical fund weightings are set at the beginning of each calendar quarter. The weighting in the chart above reflects the allocations from September 30, 2015 to December 31, 2015. Actual Underlying Fund weighting in the Portfolios may differ from the figures shown above due to rounding, differences in returns of the Underlying Funds, or both. The above figures are not indicative of future allocations. |
| | 6 | | Strategic allocation is the process of determining the areas of the global markets in which to invest, and in what long-term proportion, for each Underlying Fund. Our global approach attempts to generate strong long-term returns across geographies and asset classes, and is determined through a careful review of market opportunities and risk/return tradeoffs. It is rebalanced annually. On a monthly basis, we shift assets around the strategic allocation, over and under-weighting asset classes and countries relative to the neutral starting point, seeking to benefit from changing short-term conditions in global capital markets. This is called tactical asset allocation. |
24
FUND BASICS
|
| OVERALL UNDERLYING FUND WEIGHTINGS7 |
| Percentage of Net Assets |
|
| | 7 | | The Portfolio is actively managed and, as such, its composition may differ over time. The percentage shown for each underlying fund reflects the value of that underlying fund as a percentage of net assets of the Portfolio. Short-term investments represent repurchase agreements. Figures in the above graph may not sum to 100% due to rounding and/or the exclusion of other assets and liabilities. |
25
GOLDMAN SACHS GROWTH AND INCOME STRATEGY PORTFOLIO
Performance Summary
December 31, 2015
The following graph shows the value, as of December 31, 2015, of a $1,000,000 investment made on January 1, 2006 in Institutional Shares at NAV. For comparative purposes, the performance of the Portfolio’s benchmarks, the Growth and Income Strategy Composite Index (the “Growth and Income Composite”), which is comprised of 60% of the MSCI® All Country World Index (Net, USD, Unhedged) (the “MSCI ACWI Index”) and 40% of the Barclays Global Aggregate Bond Index (Gross, USD, Hedged) (the “Barclays Global Index”), the Barclays Global Index and the MSCI ACWI Index (each with distributions reinvested), are shown. This performance data represents past performance and should not be considered indicative of future performance, which will fluctuate with changes in market conditions. These performance fluctuations will cause an investor’s shares, when redeemed, to be worth more or less than their original cost. Performance reflects applicable fee waivers and/or expense limitations currently in effect during the periods shown and in their absence, performance would be reduced. Returns do not reflect the deduction of taxes that a shareholder would pay on Portfolio distributions or the redemption of Portfolio shares. Performance of Class A, Class C, Service, Class IR, Class R and Class R6 Shares will vary from Institutional Shares due to differences in class specific fees and any applicable sales charges. In addition to the Investment Adviser’s decisions regarding underlying mutual fund selection and allocations among them, other factors may affect Portfolio performance. These factors include, but are not limited to, Portfolio operating fees and expenses, portfolio turnover and subscription and redemption cash flows affecting the Portfolio.
|
| Growth and Income Strategy Portfolio’s 10 Year Performance |
Performance of a $1,000,000 investment, with distributions reinvested, from January 1, 2006 through December 31, 2015.
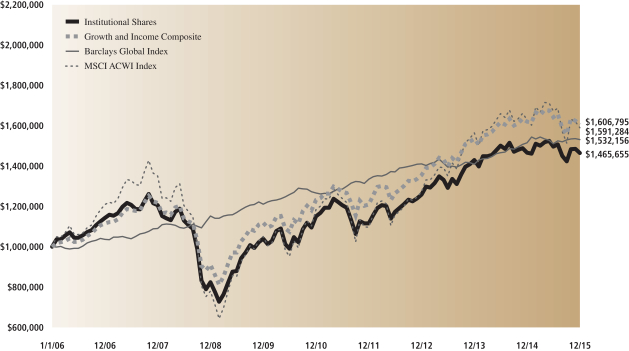
| | | | | | | | | | | | | | |
| Average Annual Total Return through December 31, 2015 | | | One Year | | | | Five Years | | | | Ten Years | | | Since Inception |
Class A (Commenced January 2, 1998) | | | | | | | | | | | | | | |
Excluding sales charges | | | -0.54% | | | | 4.53% | | | | 3.48% | | | 4.46% |
Including sales charges | | | -5.98% | | | | 3.36% | | | | 2.90% | | | 4.14% |
|
Class C (Commenced January 2, 1998) | | | | | | | | | | | | | | |
Excluding contingent deferred sales charges | | | -1.24% | | | | 3.76% | | | | 2.72% | | | 3.69% |
Including contingent deferred sales charges | | | -2.23% | | | | 3.76% | | | | 2.72% | | | 3.69% |
|
Institutional Class (Commenced January 2, 1998) | | | -0.13% | | | | 4.94% | | | | 3.89% | | | 4.88% |
|
Service Class (Commenced January 2, 1998) | | | -0.56% | | | | 4.44% | | | | 3.39% | | | 4.36% |
|
Class IR (Commenced November 30, 2007) | | | -0.29% | | | | 4.79% | | | | N/A | | | 2.15% |
|
Class R (Commenced November 30, 2007) | | | -0.69% | | | | 4.27% | | | | N/A | | | 1.68% |
|
Class R6 (Commenced July 31, 2015) | | | N/A | | | | N/A | | | | N/A | | | -2.87%* |
|
| * | | Total return for periods of less than one year represents cumulative total return. |
26
FUND BASICS
Growth Strategy
as of December 31, 2015
| | | | | | | | | | | | | | | | | | |
| | PERFORMANCE REVIEW | |
| | | January 1, 2015–
December 31, 2015 | | Portfolio Total
Return
(based on NAV)1 | | | Growth Strategy
Composite Index2 | | | Barclays Global Aggregate Bond Index (Gross, USD, Hedged) | | | MSCI ACWI
Index (Net, USD,
Unhedged) | |
| | Class A | | | -0.08 | % | | | -1.57 | % | | | 1.02 | % | | | -2.36 | % |
| | Class C | | | -0.82 | | | | -1.57 | | | | 1.02 | | | | -2.36 | |
| | Institutional | | | 0.35 | | | | -1.57 | | | | 1.02 | | | | -2.36 | |
| | Service | | | -0.17 | | | | -1.57 | | | | 1.02 | | | | -2.36 | |
| | Class IR | | | 0.20 | | | | -1.57 | | | | 1.02 | | | | -2.36 | |
| | | Class R | | | -0.31 | | | | -1.57 | | | | 1.02 | | | | -2.36 | |
| | | | | |
| | | | | | | | | | | | | | | |
| | | July 31, 2015–
December 31, 2015 | | | | | | | | | | | | |
| | | Class R6 | | | -3.66 | % | | | -3.55 | % | | | 0.42 | % | | | -5.72 | % |
| | 1 | | The net asset value (“NAV”) represents the net assets of the class of the Portfolio (ex-dividend) divided by the total number of shares of the class outstanding. The Portfolio’s performance assumes the reinvestment of dividends and other distributions. The Portfolio’s performance does not reflect the deduction of any applicable sales charges. |
| | 2 | | The Growth Strategy Composite Index (“Growth Strategy Composite”) is comprised of a blend of the Barclays Global Aggregate Bond Index (Gross, USD, Hedged) (20%) and the MSCI® All Country World Index (Net, USD, Unhedged) (the “MSCI ACWI Index”) (80%). The Growth Strategy Composite figures do not reflect any deduction for fees, expenses or taxes. The Barclays Global Aggregate Bond Index hedged to the U.S. dollar, is an unmanaged index, provides a broad-based measure of the global investment-grade fixed-rate debt markets and covers the most liquid portion of the global investment grade fixed-rate bond market, including government, credit and collateralized securities. The Barclays Global Aggregate Bond Index figures do not include any deduction for fees, expenses or taxes. It is not possible to invest directly in an unmanaged index. The MSCI ACWI Index is a free float-adjusted market capitalization weighted index that is designed to measure the equity market performance of developed and emerging markets. The MSCI ACWI consists of 46 country indices comprising 23 developed and 23 emerging market country indices. The developed market country indexes included are: Australia, Austria, Belgium, Canada, Denmark, Finland, France, Germany, Hong Kong, Ireland, Israel, Italy, Japan, Netherlands, New Zealand, Norway, Portugal, Singapore, Spain, Sweden, Switzerland, the United Kingdom and the United States. The emerging market country indexes included are: Brazil, Chile, China, Colombia, Czech Republic, Egypt, Greece, Hungary, India, Indonesia, Malaysia, Mexico, Peru, Philippines, Poland, Qatar, Russia, South Africa, South Korea Taiwan, Thailand, Turkey and United Arab Emirates. The MSCI ACWI Index figures do not include any deduction for fees, expenses or taxes. It is not possible to invest directly in an unmanaged index. |
The returns set forth in the table above represent past performance. Past performance does not guarantee future results. The Portfolio’s investment return and principal value will fluctuate so that an investor’s shares, when redeemed, may be worth more or less than their original cost. Current performance may be lower or higher than the performance quoted above. Please visit our web site at www.GSAMFUNDS.com to obtain the most recent month-end returns. Performance reflects fee waivers and/or expense limitations in effect. In their absence, performance would be reduced. Returns do not reflect the deduction of taxes that a shareholder would pay on Portfolio distributions or the redemption of Portfolio shares.
27
FUND BASICS
| | | | | | | | | | | | | | | | | | | | |
| | STANDARDIZED TOTAL RETURNS3 |
| | | For the period ended 12/31/15 | | One Year | | | Five Years | | | Ten Years | | | Since Inception | | | Inception Date |
| | Class A | | | -5.57 | % | | | 4.22 | % | | | 2.72 | % | | | 3.86 | % | | 1/2/98 |
| | Class C | | | -1.81 | | | | 4.63 | | | | 2.54 | | | | 3.41 | | | 1/2/98 |
| | Institutional | | | 0.35 | | | | 5.84 | | | | 3.72 | | | | 4.60 | | | 1/2/98 |
| | Service | | | -0.17 | | | | 5.33 | | | | 3.21 | | | | 4.08 | | | 1/2/98 |
| | Class IR | | | 0.20 | | | | 5.68 | | | | N/A | | | | 1.63 | | | 11/30/07 |
| | Class R | | | -0.31 | | | | 5.13 | | | | N/A | | | | 1.13 | | | 11/30/07 |
| | | Class R6 | | | N/A | | | | N/A | | | | N/A | | | | -3.66 | | | 7/31/15 |
| | 3 | | The Standardized Total Returns are average annual or cumulative total returns (only if the performance period is one year or less) as of the most recent calendar quarter-end. They assume reinvestment of all distributions at NAV. These returns reflect a maximum initial sales charge of 5.5% for Class A Shares and the assumed contingent deferred sales charge for Class C Shares (1% if redeemed within 12 months of purchase). Because Institutional, Service, Class IR, Class R and Class R6 Shares do not involve a sales charge, such a charge is not applied to their Standardized Total Returns. |
The returns represent past performance. Past performance does not guarantee future results. The Portfolio’s investment return and principal value will fluctuate so that an investor’s shares, when redeemed, may be worth more or less than their original cost. Current performance may be lower or higher than the performance quoted above. Please visit our Website at www.GSAMFUNDS.com to obtain the most recent month-end returns. Performance reflects applicable fee waivers and/or expense limitations in effect during the periods shown. In their absence, performance would be reduced. Returns do not reflect the deduction of taxes that a shareholder would pay on Portfolio distributions or the redemption of Portfolio shares.
| | | | | | | | | | |
| | EXPENSE RATIOS4 | |
| | | | | Net Expense Ratio (Current) | | | Gross Expense Ratio (Before Waivers) | |
| | Class A | | | 1.41 | % | | | 1.45 | % |
| | Class C | | | 2.16 | | | | 2.20 | |
| | Institutional | | | 1.01 | | | | 1.05 | |
| | Service | | | 1.51 | | | | 1.55 | |
| | Class IR | | | 1.16 | | | | 1.20 | |
| | Class R | | | 1.66 | | | | 1.70 | |
| | | Class R6 | | | 0.99 | | | | 1.03 | |
| | 4 | | The expense ratios of the Portfolio, both current (net of applicable fee waivers and/or expense limitations) and before waivers (gross of applicable fee waivers and/or expense limitations) are as set forth above according to the most recent publicly available Prospectus for the Portfolio and will differ from the expense ratios disclosed in the Financial Highlights in this report due to the inclusion of Underlying Fund fees and expenses, which are not included in the operating expenses of the Portfolio reflected in the Financial Highlights. Pursuant to a contractual arrangement, the Portfolio’s waivers and/or expense limitations will remain in place through at least July 31, 2016, and prior to such date the Investment Adviser may not terminate the arrangements without the approval of the Portfolio’s Board of Trustees. If these arrangements are discontinued in the future, the expense ratios may change without shareholder approval. |
28
FUND BASICS
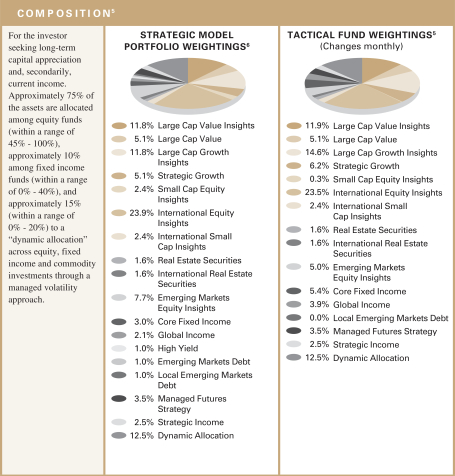
| | 5 | | The tactical fund weightings are set at the beginning of each calendar quarter. The weighting in the chart above reflects the allocations from September 30, 2015 to December 31, 2015. Actual Underlying Fund weighting in the Portfolios may differ from the figures shown above due to rounding, differences in returns of the Underlying Funds, or both. The above figures are not indicative of future allocations. |
| | 6 | | Strategic allocation is the process of determining the areas of the global markets in which to invest, and in what long-term proportion, for each Underlying Fund. Our global approach attempts to generate strong long-term returns across geographies and asset classes, and is determined through a careful review of market opportunities and risk/return tradeoffs. It is rebalanced annually. On a monthly basis, we shift assets around the strategic allocation, over and under-weighting asset classes and countries relative to the neutral starting point, seeking to benefit from changing short-term conditions in global capital markets. This is called tactical asset allocation. |
29
FUND BASICS
|
| OVERALL UNDERLYING FUND WEIGHTINGS7 |
| Percentage of Net Assets |
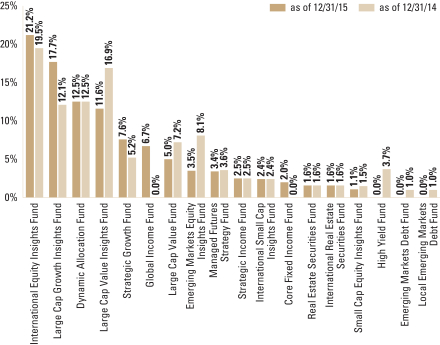
| | 7 | | The Portfolio is actively managed and, as such, its composition may differ over time. The percentage shown for each underlying fund reflects the value of that underlying fund as a percentage of net assets of the Portfolio. Figures in the above graph may not sum to 100% due to rounding and/or the exclusion of other assets and liabilities. |
30
GOLDMAN SACHS GROWTH STRATEGY PORTFOLIO
Performance Summary
December 31, 2015
The following graph shows the value, as of December 31, 2015, of a $10,000 investment made on January 1, 2006 in Class A Shares (with the maximum sales charge of 5.5%). For comparative purposes, the performance of the Portfolio’s benchmarks, the Growth Strategy Composite Index (the “Growth Strategy Composite”), which is comprised of 80% of the MSCI® All Country World Index (Net, USD, Unhedged) (the “MSCI ACWI Index”) and 20% of the Barclays Global Aggregate Bond Index (Gross, USD, Hedged) (the “Barclays Global Index”), the Barclays Global Index and the MSCI ACWI Index (each with distributions reinvested), are shown. This performance data represents past performance and should not be considered indicative of future performance, which will fluctuate with changes in market conditions. These performance fluctuations will cause an investor’s shares, when redeemed, to be worth more or less than their original cost. Performance reflects applicable fee waivers and/or expense limitations currently in effect during the periods shown and in their absence, performance would be reduced. Returns do not reflect the deduction of taxes that a shareholder would pay on Portfolio distributions or the redemption of Portfolio shares. Performance of Class C, Institutional, Service, Class IR, Class R and Class R6 Shares will vary from Class A Shares due to differences in class specific fees and any applicable sales charges. In addition to the Investment Adviser’s decisions regarding underlying mutual fund selection and allocations among them, other factors may affect Portfolio performance. These factors include, but are not limited to, Portfolio operating fees and expenses, portfolio turnover and subscription and redemption cash flows affecting the Portfolio.
|
| Growth Strategy Portfolio’s 10 Year Performance |
Performance of a $10,000 investment, with distributions reinvested, from January 1, 2006 through December 31, 2015.
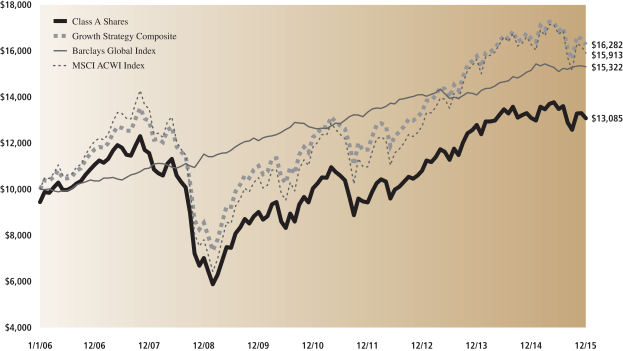
| | | | | | | | | | | | | | |
| Average Annual Total Return through December 31, 2015 | | | One Year | | | | Five Years | | | | Ten Years | | | Since Inception |
Class A (Commenced January 2, 1998) | | | | | | | | | | | | | | |
Excluding sales charges | | | -0.08% | | | | 5.41% | | | | 3.31% | | | 4.18% |
Including sales charges | | | -5.57% | | | | 4.22% | | | | 2.72% | | | 3.86% |
|
Class C (Commenced January 2, 1998) | | | | | | | | | | | | | | |
Excluding contingent deferred sales charges | | | -0.82% | | | | 4.63% | | | | 2.54% | | | 3.41% |
Including contingent deferred sales charges | | | -1.81% | | | | 4.63% | | | | 2.54% | | | 3.41% |
|
Institutional Class (Commenced January 2, 1998) | | | 0.35% | | | | 5.84% | | | | 3.72% | | | 4.60% |
|
Service Class (Commenced January 2, 1998) | | | -0.17% | | | | 5.33% | | | | 3.21% | | | 4.08% |
|
Class IR (Commenced November 30, 2007) | | | 0.20% | | | | 5.68% | | | | N/A | | | 1.63% |
|
Class R (Commenced November 30, 2007) | | | -0.31% | | | | 5.13% | | | | N/A | | | 1.13% |
|
Class R6 (Commenced July 31, 2015) | | | N/A | | | | N/A | | | | N/A | | | -3.66%* |
|
| * | | Total return for periods of less than one year represents cumulative total return. |
31
PORTFOLIO RESULTS
Goldman Sachs Satellite Strategies Portfolio
Investment Process and Principal Strategies
The Portfolio seeks to achieve its investment objective by investing in a combination of underlying funds that currently exist or that may become available for investment in the future for which Goldman Sachs Asset Management (“GSAM”) or an affiliate, now or in the future, acts as investment adviser or principal underwriter (the “underlying funds”). Some of the Portfolios’ underlying funds invest primarily in fixed income or money market instruments, and some invest primarily in equity securities.
The Portfolio invests assets in a strategic mix of underlying funds, which the investment adviser considers to be invested in satellite asset classes. Satellite asset classes are those that historically have lower correlations to traditional market exposures such as large cap equities and investment grade fixed income. The investment adviser allows strategic targets to shift with their respective market returns but adjusts the overall asset allocation of the Portfolio based on current market conditions and the investment adviser’s economic and market forecasts.
Portfolio Management Discussion and Analysis
Below, the Goldman Sachs Quantitative Investment Strategies Team discusses the Goldman Sachs Satellite Strategies Portfolio’s (the “Portfolio”) performance and positioning for the 12-month period ended December 31, 2015 (the “Reporting Period”).
| Q | | How did the Portfolio perform during the Reporting Period? |
| A | | During the Reporting Period, the Portfolio’s Class A, C, Institutional, Service, IR and R Shares generated average annual total returns, without sales charges, of -3.24%, -3.89%, -2.84%, -3.32%, -2.99%, and -3.49%, respectively. This compares to the 0.79% average annual total return of the Portfolio’s blended benchmark, which is composed 40% of the Barclays U.S. Aggregate Bond Index, 30% of the Standard & Poor’s 500 Index (the “S&P 500® Index”) and 30% of the MSCI EAFE Index (Gross, USD, Unhedged), during the same period. |
| | | The components of the blended benchmark, the Barclays U.S. Aggregate Bond Index, the S&P 500® Index and the MSCI EAFE Index, generated average annual total returns of 0.55%, 1.38% and -0.39%, respectively, during the same period. |
| | | During the period since their inception on July 31, 2015 through December 31, 2015, the Portfolio’s Class R6 Shares generated a cumulative total return of -4.43% compared to the -2.84% cumulative total return of the Portfolio’s blended benchmark. The components of the Portfolio’s blended benchmark, the Barclays U.S. Aggregate Bond Index, the S&P 500® Index and the MSCI EAFE Index, generated cumulative total returns of -0.04%, -1.90% and -7.84%, respectively, during the same period. |
| Q | | How did the various satellite asset classes perform during the Reporting Period? |
| A | | The continued rout in the commodities markets and an economic slump in the emerging markets, driven largely by events in China, weighed on satellite asset classes during the Reporting Period. |
| | | Commodities significantly underperformed core asset classes, with the S&P GSCI® Commodity Index declining -32.86%1 during the Reporting Period. Slackening demand from China, previously one of the largest consumers of raw materials, and increasing U.S. crude oil production were the primary causes of the weakness in commodities. |
| | | In addition, local emerging markets debt notably underperformed core asset classes. During the Reporting Period, the J.P. Morgan Government Bond Index — Emerging Markets (GBI-EMSM) Global Diversified Index (Gross, USD, Unhedged), which tracks emerging markets debt denominated in U.S. dollars, fell -14.92%. Given that many emerging economies are net commodity exporters, the drop in commodity prices during the Reporting Period appeared to heighten investors’ perception of risk within the broad emerging markets debt market. A secondary cause was U.S. dollar appreciation; a stronger U.S. dollar makes it more difficult for emerging countries to repay debt denominated |
| | 1 | | All returns herein quoted in U.S. dollars. |
32
PORTFOLIO RESULTS
| | | in U.S. dollars. As perceived risk increased, yields on local emerging markets debt rose. |
| | | For the Reporting Period overall, satellite asset classes underperformed core asset classes. International small-cap equities, as represented by the MSCI EAFE Small Cap Index, recorded a solid gain. U.S. real estate securities, as represented by the Wilshire Real Estate Securities Index, also advanced. Both satellite asset classes broadly benefited from improving macroeconomic conditions in the U.S., Europe and Japan. |
| Q | | What key factors affected the Portfolio’s performance during the Reporting Period? |
| A | | The Portfolio underperformed its blended benchmark during the Reporting Period, largely because of its exposure on an asset class level to commodities and local emerging markets debt. |
| | | On the positive side, the Portfolio benefited from its allocations to international small-cap equities and U.S. real estate securities, which were the best performing satellite asset classes during the Reporting Period. In addition, the performance of the Portfolio’s underlying funds relative to their respective benchmark indices contributed positively on a relative basis. In keeping with our investment approach, we dynamically adjusted Portfolio weights to ensure that overall risk and individual underlying fund contributions to risk remained within the ranges we feel are appropriate for a diversified satellite portfolio. |
| Q | | How did the Portfolio’s underlying funds perform relative to their respective benchmark indices during the Reporting Period? |
| A | | Overall, as mentioned earlier, the performance of the underlying funds relative to their respective benchmark indices added to the Portfolio’s relative performance. The Goldman Sachs Emerging Markets Equity Fund and the Goldman Sachs Emerging Markets Equity Insights Fund outperformed their respective benchmark indices significantly. The Goldman Sachs International Real Estate Securities Fund, the Goldman Sachs International Small Cap Insights Fund and the Goldman Sachs Commodity Strategy Fund also outperformed their respective benchmark indices. The Goldman Sachs Local Emerging Markets Debt Fund and the Goldman Sachs Real Estate Securities Fund underperformed their respective benchmarks. In addition, the Goldman Sachs International Small Cap Fund, the Goldman Sachs High Yield Fund, the Goldman Sachs Emerging Markets Debt Fund and the Goldman Sachs High Yield Floating Rate Fund modestly underperformed their respective benchmarks during the Reporting Period. |
| Q | | How did the Portfolio use derivatives and similar instruments during the Reporting Period? |
| A | | The Portfolio does not directly invest in derivatives. However, some of the underlying funds used derivatives during the Reporting Period to apply their active investment views with greater versatility and to afford greater risk management precision. As market conditions warranted during the Reporting Period, some of these underlying funds engaged in forward foreign currency exchange contracts, financial futures contracts, options, swap contracts and structured securities to enhance portfolio return and for hedging purposes. |
| Q | | What changes did you make during the Reporting Period within both the equity and fixed income portions of the Portfolio? |
| A | | During the first quarter of 2015, we rebalanced the Portfolio to maintain our target risk objectives. The risk contributions of local emerging markets debt and commodities had risen above the Portfolio’s minimum weight constraint relative to other satellite asset classes in the Portfolio. In response, we reduced the Portfolio’s allocations to local emerging markets debt and commodities while increasing its allocations to U.S. high yield loans and international real estate securities. |
| | | In the second calendar quarter, we rebalanced the Portfolio to maintain our target risk objectives. The risk contributions of U.S. dollar-denominated emerging markets debt and local emerging markets debt had risen above the Portfolio’s minimum weight constraint relative to other satellite asset classes in the Portfolio. In response, we reduced the Portfolio’s allocations to U.S. dollar-denominated emerging markets debt and local emerging markets debt and increased its allocation to U.S. high yield loans. |
| | | During the third calendar quarter, we rebalanced the Portfolio to maintain our target risk objectives. In July and August 2015, the risk contributions of U.S. dollar-denominated emerging markets debt and U.S. real estate securities had risen above the Portfolio’s minimum weight constraint relative to other satellite asset classes in the Portfolio. In response, we decreased the Portfolio’s allocations to U.S. dollar-denominated emerging markets debt and U.S. real estate securities and increased its allocation to U.S. high yield loans. During September 2015, as the risk contributions of U.S. dollar-denominated debt increased, we further reduced the Portfolio’s exposure to |
33
PORTFOLIO RESULTS
| | U.S. dollar-denominated debt and modestly increased its exposure to emerging markets equities, international small-cap equities and international real estate securities. |
| | | During the fourth calendar quarter, we rebalanced the Portfolio to maintain our target risk objectives. The risk contributions of U.S. dollar-denominated emerging markets debt and U.S. real estate securities had fallen below the Portfolio’s minimum weight constraint relative to other satellite asset classes in the Portfolio. In response, we increased the Portfolio’s allocations to U.S. dollar-denominated emerging markets debt and U.S. real estate securities and reduced its allocations to U.S. high yield bonds and U.S. high yield loans. |
| Q | | Were there any changes to the Portfolios’ portfolio management team during the Reporting Period? |
| A | | During the Reporting Period, Edward J. Tostanoski III became a co-portfolio manager for the Portfolio. By design, all investment decisions for the Portfolio are performed within a co-lead or team structure, with multiple subject matter experts. This strategic decision making has been the cornerstone of our approach and ensures continuity in the Portfolio. Alongside Edward J. Tostanoski III, the portfolio managers for the Portfolio are William Fallon, James Park and Nicholas Chan. |
| Q | | What is the Portfolio’s tactical view and strategy for the months ahead? |
| A | | We manage the Portfolio using a dynamic, risk-responsive rebalancing process. Using our sophisticated, proprietary risk models, we evaluate the overall risk of the Portfolio each month as well as the portion of risk contributed by each individual asset class. |
| | | At the end of the Reporting Period, through its underlying funds, the Portfolio had larger allocations than it did at the beginning of the Reporting Period to high yield floating rate bonds and high yield floating rate loans. It also had modestly higher allocations to non-floating rate high yield loans and international real estate securities. The Portfolio had a lower exposure to U.S. dollar-denominated and local emerging markets debt. To a lesser extent, the Portfolio also had a reduced exposure to emerging markets equities. |
| | | We will continue to monitor risk on a monthly basis and adjust our allocation to the satellite asset classes as the underlying funds drift beyond our longer-term risk-related guidelines. |
34
FUND BASICS
Satellite Strategies Portfolio
as of December 31, 2015
| | | | | | | | | | | | | | | | | | | | | | |
| | PERFORMANCE REVIEW | |
| | | January 1, 2015– December 31, 2015 | | Portfolio Total Return (based on NAV)1 | | | Satellite
Strategies
Composite Index2 | | | Barclays U.S.
Aggregate Bond
Index | | | S&P 500 Index | | | MSCI EAFE Index (Gross, USD, Unhedged) | |
| | Class A | | | -3.24 | % | | | 0.79 | % | | | 0.55 | % | | | 1.38 | % | | | -0.39 | % |
| | Class C | | | -3.89 | | | | 0.79 | | | | 0.55 | | | | 1.38 | | | | -0.39 | |
| | Institutional | | | -2.84 | | | | 0.79 | | | | 0.55 | | | | 1.38 | | | | -0.39 | |
| | Service | | | -3.32 | | | | 0.79 | | | | 0.55 | | | | 1.38 | | | | -0.39 | |
| | Class IR | | | -2.99 | | | | 0.79 | | | | 0.55 | | | | 1.38 | | | | -0.39 | |
| | | Class R | | | -3.49 | | | | 0.79 | | | | 0.55 | | | | 1.38 | | | | -0.39 | |
| | | | | | |
| | | | | | | | | | | | | | | | | | |
| | | July 31, 2015– December 31, 2015 | | | | | | | | | | | | | | | |
| | | Class R6 | | | -4.43 | % | | | -2.84 | % | | | -0.04 | % | | | -1.90 | % | | | -7.84 | % |
| | 1 | | The net asset value (“NAV”) represents the net assets of the class of the Portfolio (ex-dividend) divided by the total number of shares of the class outstanding. The Portfolio’s performance reflects the reinvestment of dividends and other distributions. The Portfolio’s performance does not reflect the deduction of any applicable sales charges. |
| | 2 | | The Satellite Strategies Composite Index (“Satellite Composite”) is a composite representation prepared by the investment adviser of the performance of the Portfolio’s asset classes weighted according to their respective weightings in the Portfolio’s target range. The Satellite Composite is comprised of the S&P 500® Index (30%), the MSCI® EAFE Index (Gross, USD, Unhedged) (30%) and the Barclays U.S. Aggregate Bond Index (40%). The Satellite Composite figures do not reflect any deduction for fees, expenses or taxes. The Barclays Aggregate Bond Index represents an unmanaged diversified portfolio of fixed income securities, including U.S. Treasuries, investment-grade corporate bonds, and mortgage-backed and asset-backed securities. The S&P 500® Index is the Standard & Poor’s 500 Composite Index of 500 stocks, an unmanaged index of common stock prices. The unmanaged MSCI® EAFE Index is a market capitalization weighted composite of securities in 21 developed markets. The Index figures do not include any deduction for fees, expenses or taxes. It is not possible to invest directly in an unmanaged index. |
35
FUND BASICS
| | | | | | | | | | | | | | | | |
| | STANDARDIZED TOTAL RETURNS3 |
| | | For the period ended 12/31/15 | | One Year | | | Five Years | | | Since Inception | | | Inception Date |
| | Class A | | | -8.57 | % | | | 1.08 | % | | | 0.12 | % | | 3/30/07 |
| | Class C | | | -4.86 | | | | 1.44 | | | | 0.01 | | | 3/30/07 |
| | Institutional | | | -2.84 | | | | 2.62 | | | | 1.13 | | | 3/30/07 |
| | Service | | | -3.32 | | | | 2.12 | | | | 1.17 | | | 8/29/08 |
| | Class IR | | | -2.99 | | | | 2.47 | | | | 0.34 | | | 11/30/07 |
| | Class R | | | -3.49 | | | | 1.96 | | | | -0.16 | | | 11/30/07 |
| | | Class R6 | | | N/A | | | | N/A | | | | -4.43 | | | 7/31/15 |
| | 3 | | The Standardized Total Returns are average annual or cumulative total returns (only if the performance period is one year or less) as of the most recent calendar quarter-end. They assume reinvestment of all distributions at NAV. These returns reflect a maximum initial sales charge of 5.5% for Class A Shares and the assumed contingent deferred sales charge for Class C Shares (1% if redeemed within 12 months of purchase). Because Institutional, Service, Class IR, Class R and Class R6 Shares do not involve a sales charge, such a charge is not applied to their Standardized Total Returns. |
The returns set forth in the tables above represent past performance. Past performance does not guarantee future results. The Portfolio’s investment return and principal value will fluctuate so that an investor’s shares, when redeemed, may be worth more or less than their original cost. Current performance may be lower or higher than the performance quoted above. Please visit our web site at www.GSAMFUNDS.com to obtain the most recent month-end returns. Performance reflects applicable fee waivers and/or expense limitations in effect during the periods shown. In their absence, performance would be reduced. Returns do not reflect the deduction of taxes that a shareholder would pay on Portfolio distributions or the redemption of Portfolio shares.
| | | | | | | | | | |
| | EXPENSE RATIOS4 | |
| | | | | Net Expense Ratio (Current) | | | Gross Expense Ratio (Before Waivers) | |
| | Class A | | | 1.47 | % | | | 1.49 | % |
| | Class C | | | 2.22 | | | | 2.24 | |
| | Institutional | | | 1.07 | | | | 1.09 | |
| | Service | | | 1.57 | | | | 1.59 | |
| | Class IR | | | 1.22 | | | | 1.24 | |
| | Class R | | | 1.72 | | | | 1.74 | |
| | | Class R6 | | | 1.05 | | | | 1.07 | |
| | 4 | | The expense ratios of the Portfolio, both current (net of applicable fee waivers and/or expense limitations) and before waivers (gross of applicable fee waivers and/or expense limitations) are as set forth above according to the most recent publicly available Prospectus for the Portfolio and will differ from the expense ratios disclosed in the Financial Highlights in this report due to the inclusion of Underlying Fund fees and expenses, which are not included in the operating expenses of the Portfolio reflected in the Financial Highlights. Pursuant to a contractual arrangement, the Portfolio’s waivers and/or expense limitations will remain in place through at least July 31, 2016, and prior to such date the Investment Adviser may not terminate the arrangements without the approval of the Portfolio’s Board of Trustees. If these arrangements are discontinued in the future, the expense ratios may change without shareholder approval. |
36
FUND BASICS
|
| TARGET RISK-CONTRIBUTION INVESTMENT PORTFOLIO5 AS OF 12/31/15 |
| Percentage of Investment Portfolio |
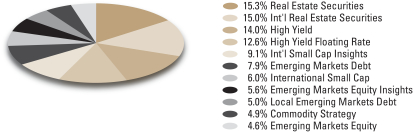
| | 5 | | The tactical fund weightings are set at the beginning of each calendar quarter. The weighting in the chart above reflects the allocations from September 30, 2015 to December 31, 2015. Actual Underlying Fund weighting in the Portfolios may differ from the figures shown above due to rounding, differences in returns of the Underlying Funds, or both. The above figures are not indicative of future allocations. |
|
| OVERALL UNDERLYING FUND WEIGHTINGS6 |
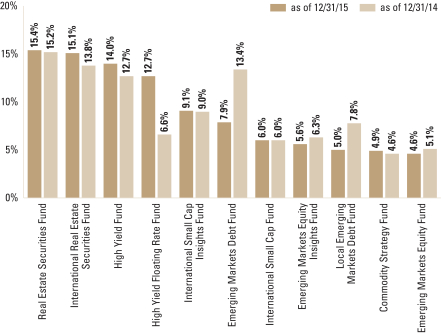
| | 6 | | The Portfolio is actively managed and, as such, its composition may differ over time. The percentage shown for each underlying fund reflects the value of that underlying fund as a percentage of net assets of the Portfolio. Figures in the above graph may not sum to 100% due to rounding and/or the exclusion of other assets and liabilities. |
37
GOLDMAN SACHS SATELLITE STRATEGIES PORTFOLIO
Performance Summary
December 31, 2015
The following graph shows the value, as of December 31, 2015, of a $1,000,000 investment made on March 30, 2007 (commencement of operations) in Institutional Shares at NAV. For comparative purposes, the performance of the Portfolio’s benchmarks, the Satellite Strategies Composite Index (the “Satellite Composite”), which is comprised of 40% of the Barclays U.S. Aggregate Bond Index (the “BCAB Index”), 30% of the Standard & Poor’s 500 Index (the “S&P 500® Index”), and 30% of the MSCI® Europe, Australasia and Far East Index (the “MSCI EAFE Index”), the S&P 500® Index, the BCAB Index and the MSCI EAFE Index (Gross, USD, Unhedged) (all with distributions reinvested), are shown. This performance data represents past performance and should not be considered indicative of future performance, which will fluctuate with changes in market conditions. These performance fluctuations will cause an investor’s shares, when redeemed, to be worth more or less than their original cost. Performance reflects applicable fee waivers and/or expense limitations currently in effect during the periods shown and in their absence, performance would be reduced. Returns do not reflect the deduction of taxes that a shareholder would pay on Portfolio distributions or the redemption of Portfolio shares. Performance of Class A, Class C, Service, Class IR, Class R and Class R6 Shares will vary from Institutional Shares due to differences in class specific fees and any applicable sales charges. In addition to the Investment Adviser’s decisions regarding underlying mutual fund selection and allocations among them, other factors may affect Portfolio performance. These factors include, but are not limited to, Portfolio operating fees and expenses, portfolio turnover and subscription and redemption cash flows affecting the Portfolio.
|
| Satellite Strategies Portfolio’s Lifetime Performance |
Performance of a $1,000,000 investment, with distributions reinvested, from March 30, 2007 through December 31, 2015.
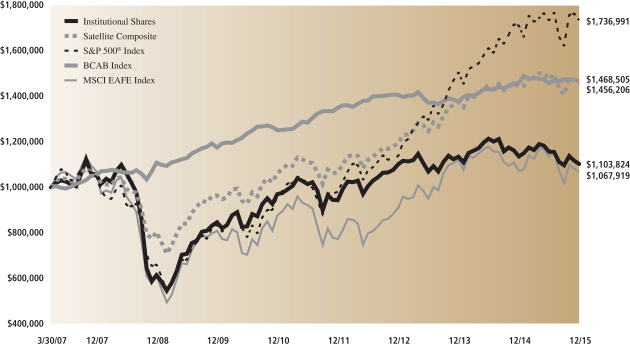
| | | | | | | | | | |
| Average Annual Total Return through December 31, 2015 | | | One Year | | | | Five Years | | | Since Inception |
Class A (Commenced March 30, 2007) | | | | | | | | | | |
Excluding sales charges | | | -3.24% | | | | 2.23% | | | 0.77% |
Including sales charges | | | -8.57% | | | | 1.08% | | | 0.12% |
|
Class C (Commenced March 30, 2007) | | | | | | | | | | |
Excluding contingent deferred sales charges | | | -3.89% | | | | 1.44% | | | 0.01% |
Including contingent deferred sales charges | | | -4.86% | | | | 1.44% | | | 0.01% |
|
Institutional Class (Commenced March 30, 2007) | | | -2.84% | | | | 2.62% | | | 1.13% |
|
Service Class (Commenced August 29, 2008) | | | -3.32% | | | | 2.12% | | | 1.17% |
|
Class IR (Commenced November 30, 2007) | | | -2.99% | | | | 2.47% | | | 0.34% |
|
Class R (Commenced November 30, 2007) | | | -3.49% | | | | 1.96% | | | -0.16% |
|
Class R6 (Commenced July 31, 2015) | | | N/A | | | | N/A | | | -4.43%* |
|
| * | | Total return for periods of less than one year represents cumulative total return. |
38
FUND BASICS
Index Definitions
MSCI ACWI captures large and mid-cap representation across 23 developed markets and 23 emerging markets countries. With 2,491 constituents (as of December 31, 2015), the index covers approximately 85% of the global investable equity opportunity set.
Barclays Global Aggregate Bond Index provides a broad-based measure of the global investment-grade fixed income markets. The three major components of this index are the U.S. Aggregate, the Pan-European Aggregate, and the Asian-Pacific Aggregate Indices. The index also includes eurodollar and euro-yen corporate bonds, Canadian government, agency and corporate securities, and U.S. dollar-denominated investment grade 144A securities.
Barclays U.S. Aggregate Bond Index represents an unmanaged diversified portfolio of fixed income securities, including U.S. Treasuries, investment-grade corporate bonds, and mortgage-backed securities and asset-backed securities.
S&P 500® Index is an unmanaged index of 500 stocks that is generally representative of the performance of larger companies in the U.S.
MSCI EAFE Index is an equity index that captures large and mid-cap representation across developed markets countries around the world, excluding the U.S. and Canada. With 926 constituents as of December 31, 2015, the index covers approximately 85% of the free float-adjusted market capitalization in each country. The developed markets countries in the MSCI EAFE Index include: Australia, Austria, Belgium, Denmark, Finland, France, Germany, Hong Kong, Ireland, Israel, Italy, Japan, the Netherlands, New Zealand, Norway, Portugal, Singapore, Spain, Sweden, Switzerland and the U.K.
Wilshire Real Estate Securities Index measures U.S. publicly-traded real estate securities. Designed to offer a market-based index that is more reflective of real estate held by pension funds, the Wilshire U.S. Real Estate Securities Index is composed of publicly-traded real estate equity securities and unencumbered by limitations of other appraisal-based indexes. It can serve as a proxy for direct real estate investing by excluding securities whose value is not always tied to the value of the underlying real estate. Exclusions include: mortgage REITs, net-lease REITs, real estate finance companies, mortgage brokers and bankers, commercial and residential real estate brokers, home builders, large landowners and sub-dividers of unimproved land, hybrid REITs and timber REITs. The rationale for the exclusions is that factors other than real estate supply and demand, such as interest rates, can influence the market value of these companies.
The MSCI EAFE Small Cap Index is an equity index which captures small cap representation across developed markets countries around the world, excluding the U.S. and Canada. With 2,195 constituents (as of December 31, 2015), the index covers approximately 14% of the free float-adjusted market capitalization in each country.
The S&P GSCI is the first major investable commodity index. It is one of the most widely recognized benchmarks that is broad-based and production weighted to represent the global commodity market beta. The index is designed to be investable by including the most liquid commodity futures, and provides diversification with low correlations to other asset classes.
The J.P. Morgan GBI-EMSM Global Diversified Index is an unmanaged index of debt instruments of 16 emerging countries. J.P. Morgan’s Government Bond-Emerging Market Index series, launched in June 2005, was the first comprehensive global emerging markets index of local government bond debt. The J.P. Morgan GBI-EMSM Global Diversified Index is positioned as the investable benchmark that includes only those countries that are accessible by most of the international investor base. It is the most popular amongst the six versions largely due to its diversification weighting scheme and country coverage.
39
GOLDMAN SACHS BALANCED STRATEGY PORTFOLIO
Schedule of Investments
December 31, 2015
| | | | | | | | |
Shares | | | Description | | Value | |
| | Underlying Funds (Institutional Shares)(a) – 100.6% | |
| | Equity – 32.0% | |
| | 2,043,153 | | | Goldman Sachs Large Cap Growth Insights Fund | | $ | 47,687,198 | |
| | 2,687,003 | | | Goldman Sachs International Equity Insights Fund | | | 28,267,274 | |
| | 1,664,831 | | | Goldman Sachs Strategic Growth Fund | | | 20,444,122 | |
| | 1,202,334 | | | Goldman Sachs Large Cap Value Insights Fund | | | 19,886,604 | |
| | 555,640 | | | Goldman Sachs Large Cap Value Fund | | | 8,534,624 | |
| | 523,700 | | | Goldman Sachs International Small Cap Insights Fund | | | 5,472,664 | |
| | 258,122 | | | Goldman Sachs Real Estate Securities Fund | | | 5,154,689 | |
| | 846,061 | | | Goldman Sachs International Real Estate Securities Fund | | | 5,000,218 | |
| | 193,447 | | | Goldman Sachs Emerging Markets Equity Insights Fund | | | 1,431,510 | |
| | 9,337 | | | Goldman Sachs Small Cap Equity Insights Fund | | | 178,985 | |
| | | | | | | | |
| | | | | | | 142,057,888 | |
| | |
| | Fixed Income – 52.5% | |
| | 14,228,844 | | | Goldman Sachs Global Income Fund | | | 170,176,970 | |
| | 3,461,030 | | | Goldman Sachs Strategic Income Fund | | | 33,295,107 | |
| | 1,783,445 | | | Goldman Sachs Core Fixed Income Fund | | | 18,494,320 | |
| | 772,432 | | | Goldman Sachs Local Emerging Markets Debt Fund | | | 4,518,727 | |
| | 373,011 | | | Goldman Sachs Emerging Markets Debt Fund | | | 4,416,456 | |
| | 445,896 | | | Goldman Sachs High Yield Fund | | | 2,697,668 | |
| | | | | | | | |
| | | | | | | 233,599,248 | |
| | |
| | Dynamic – 16.1% | |
| | 5,884,166 | | | Goldman Sachs Dynamic Allocation Fund | | | 56,134,944 | |
| | 1,483,114 | | | Goldman Sachs Managed Futures Strategy Fund | | | 15,365,058 | |
| | | | | | | | |
| | | | | | | 71,500,002 | |
| | |
| TOTAL UNDERLYING FUNDS
(INSTITUTIONAL SHARES) – 100.6% | | | | |
| | (Cost $477,098,285) | | $ | 447,157,138 | |
| | |
| | | | | | | | | | | | | | |
Principal
Amount | | | Interest
Rate | | | Maturity
Date | | | Value | |
| | Short-term Investment(b) – 0.2% | |
| | Repurchase Agreements – 0.2% | |
| Joint Repurchase Agreement Account II | | | | | |
| $ | 900,000 | | | | 0.322 | % | | | 01/04/16 | | | $ | 900,000 | |
| | (Cost $900,000) | | | | | |
| | |
| | TOTAL INVESTMENTS – 100.8% | | | | | |
| | (Cost $477,998,285) | | | $ | 448,057,138 | |
| | |
| LIABILITIES IN EXCESS OF
OTHER ASSETS – (0.8)% |
| | | (3,438,588 | ) |
| | |
| | NET ASSETS – 100.0% | | | $ | 444,618,550 | |
| | |
| | |
| The percentage shown for each investment category reflects the value of investments in that category as a percentage of net assets. |
(a) | | Represents Affiliated Funds. |
(b) | | Joint repurchase agreement was entered into on December 31, 2015. Additional information appears on page 45. |
| | |
| 40 | | The accompanying notes are an integral part of these financial statements. |
GOLDMAN SACHS EQUITY GROWTH STRATEGY PORTFOLIO
Schedule of Investments
December 31, 2015
| | | | | | | | |
Shares | | | Description | | Value | |
| | Underlying Funds (Institutional Shares)(a) – 100.4% | |
| | Equity – 100.4% | |
| | 10,041,119 | | | Goldman Sachs International Equity Insights Fund | | $ | 105,632,571 | |
| | 3,287,650 | | | Goldman Sachs Large Cap Growth Insights Fund | | | 76,733,743 | |
| | 3,532,155 | | | Goldman Sachs Large Cap Value Insights Fund | | | 58,421,849 | |
| | 2,679,213 | | | Goldman Sachs Strategic Growth Fund | | | 32,900,736 | |
| | 1,629,709 | | | Goldman Sachs Large Cap Value Fund | | | 25,032,325 | |
| | 2,238,827 | | | Goldman Sachs Emerging Markets Equity Insights Fund | | | 16,567,321 | |
| | 997,178 | | | Goldman Sachs International Small Cap Insights Fund | | | 10,420,515 | |
| | 351,914 | | | Goldman Sachs Real Estate Securities Fund | | | 7,027,726 | |
| | 1,165,394 | | | Goldman Sachs International Real Estate Securities Fund | | | 6,887,482 | |
| | 283,095 | | | Goldman Sachs Small Cap Equity Insights Fund | | | 5,426,934 | |
| | |
| TOTAL UNDERLYING FUNDS
(INSTITUTIONAL SHARES) – 100.4% | | | | |
| | (Cost $307,501,157) | | $ | 345,051,202 | |
| | |
| LIABILITIES IN EXCESS OF
OTHER ASSETS – (0.4)% | | | (1,446,570 | ) |
| | |
| | NET ASSETS – 100.0% | | $ | 343,604,632 | |
| | |
| | |
| The percentage shown for each investment category reflects the value of investments in that category as a percentage of net assets. |
(a) | | Represents Affiliated Funds. |
| | |
| The accompanying notes are an integral part of these financial statements. | | 41 |
GOLDMAN SACHS GROWTH AND INCOME STRATEGY PORTFOLIO
Schedule of Investments
December 31, 2015
| | | | | | | | |
Shares | | | Description | | Value | |
| | Underlying Funds (Institutional Shares)(a) – 100.8% | |
| | Equity – 53.4% | |
| | 5,671,200 | | | Goldman Sachs Large Cap Growth Insights Fund | | $ | 132,365,803 | |
| | 12,403,961 | | | Goldman Sachs International Equity Insights Fund | | | 130,489,674 | |
| | 4,550,016 | | | Goldman Sachs Large Cap Value Insights Fund | | | 75,257,271 | |
| | 4,618,399 | | | Goldman Sachs Strategic Growth Fund | | | 56,713,935 | |
| | 2,100,544 | | | Goldman Sachs Large Cap Value Fund | | | 32,264,351 | |
| | 2,829,020 | | | Goldman Sachs Emerging Markets Equity Insights Fund | | | 20,934,749 | |
| | 1,627,583 | | | Goldman Sachs International Small Cap Insights Fund | | | 17,008,238 | |
| | 574,960 | | | Goldman Sachs Real Estate Securities Fund | | | 11,481,958 | |
| | 1,902,195 | | | Goldman Sachs International Real Estate Securities Fund | | | 11,241,974 | |
| | 270,734 | | | Goldman Sachs Small Cap Equity Insights Fund | | | 5,189,970 | |
| | | | | | | | |
| | | | | | | 492,947,923 | |
| | |
| | Fixed Income – 31.3% | |
| | 17,359,479 | | | Goldman Sachs Global Income Fund | | | 207,619,368 | |
| | 4,781,882 | | | Goldman Sachs Strategic Income Fund | | | 46,001,705 | |
| | 3,438,905 | | | Goldman Sachs Core Fixed Income Fund | | | 35,661,447 | |
| | | | | | | | |
| | | | | | | 289,282,520 | |
| | |
| | Dynamic – 16.1% | |
| | 12,193,138 | | | Goldman Sachs Dynamic Allocation Fund | | | 116,322,536 | |
| | 3,073,686 | | | Goldman Sachs Managed Futures Strategy Fund | | | 31,843,390 | |
| | | | | | | | |
| | | | | | | 148,165,926 | |
| | |
| TOTAL UNDERLYING FUNDS
(INSTITUTIONAL SHARES) – 100.8% | | | | |
| | (Cost $945,032,295) | | $ | 930,396,369 | |
| | |
| | | | | | | | | | | | | | |
Principal
Amount | | | Interest
Rate | | | Maturity
Date | | | Value | |
| | Short-term Investment(b) – 0.6% | |
| | Repurchase Agreements – 0.6% | |
| Joint Repurchase Agreement Account II | |
| $ | 5,000,000 | | | | 0.322 | % | | | 01/04/16 | | | $ | 5,000,000 | |
| | (Cost $5,000,000) | | | | | | | | | |
| | |
| | TOTAL INVESTMENTS – 101.4% | | | | | |
| | (Cost $950,032,295) | | | $ | 935,396,369 | |
| | |
| LIABILITIES IN EXCESS OF
OTHER ASSETS – (1.4)% |
| | | (12,759,689 | ) |
| | |
| | NET ASSETS – 100.0% | | | $ | 922,636,680 | |
| | |
| | |
| The percentage shown for each investment category reflects the value of investments in that category as a percentage of net assets. |
(a) | | Represents Affiliated Funds. |
(b) | | Joint repurchase agreement was entered into on December 31, 2015. Additional information appears on page 45. |
| | |
| 42 | | The accompanying notes are an integral part of these financial statements. |
GOLDMAN SACHS GROWTH STRATEGY PORTFOLIO
Schedule of Investments
December 31, 2015
| | | | | | | | |
Shares | | | Description | | Value | |
| | Underlying Funds (Institutional Shares)(a) – 100.3% | |
| | Equity – 73.3% | |
| | 16,301,703 | | | Goldman Sachs International Equity Insights Fund | | $ | 171,493,915 | |
| | 6,139,811 | | | Goldman Sachs Large Cap Growth Insights Fund | | | 143,303,194 | |
| | 5,679,872 | | | Goldman Sachs Large Cap Value Insights Fund | | | 93,945,086 | |
| | 5,002,087 | | | Goldman Sachs Strategic Growth Fund | | | 61,425,633 | |
| | 2,621,553 | | | Goldman Sachs Large Cap Value Fund | | | 40,267,059 | |
| | 3,857,072 | | | Goldman Sachs Emerging Markets Equity Insights Fund | | | 28,542,335 | |
| | 1,888,226 | | | Goldman Sachs International Small Cap Insights Fund | | | 19,731,966 | |
| | 666,332 | | | Goldman Sachs Real Estate Securities Fund | | | 13,306,641 | |
| | 2,206,692 | | | Goldman Sachs International Real Estate Securities Fund | | | 13,041,548 | |
| | 453,881 | | | Goldman Sachs Small Cap Equity Insights Fund | | | 8,700,905 | |
| | | | | | | | |
| | | | | | | 593,758,282 | |
| | |
| | Fixed Income – 11.1% | |
| | 4,549,788 | | | Goldman Sachs Global Income Fund | | | 54,415,465 | |
| | 2,079,707 | | | Goldman Sachs Strategic Income Fund | | | 20,006,783 | |
| | 1,528,794 | | | Goldman Sachs Core Fixed Income Fund | | | 15,853,596 | |
| | | | | | | | |
| | | | | | | 90,275,844 | |
| | |
| | Dynamic – 15.9% | |
| | 10,607,902 | | | Goldman Sachs Dynamic Allocation Fund | | | 101,199,387 | |
| | 2,673,184 | | | Goldman Sachs Managed Futures Strategy Fund | | | 27,694,185 | |
| | | | | | | | |
| | | | | | | 128,893,572 | |
| | |
| TOTAL UNDERLYING FUNDS
(INSTITUTIONAL SHARES) – 100.3% | | | | |
| | (Cost $789,303,752) | | $ | 812,927,698 | |
| | |
| LIABILITIES IN EXCESS OF
OTHER ASSETS – (0.3)% | | | (2,496,876 | ) |
| | |
| | NET ASSETS – 100.0% | | $ | 810,430,822 | |
| | |
| | |
| The percentage shown for each investment category reflects the value of investments in that category as a percentage of net assets. |
(a) | | Represents Affiliated Funds. |
| | |
| The accompanying notes are an integral part of these financial statements. | | 43 |
GOLDMAN SACHS SATELLITE STRATEGIES PORTFOLIO
Schedule of Investments
December 31, 2015
| | | | | | | | |
Shares | | | Description | | Value | |
| | Underlying Funds (Institutional Shares)(a) – 100.3% | |
| | Equity – 55.8% | |
| | 7,038,971 | | | Goldman Sachs Real Estate Securities Fund | | $ | 140,568,242 | |
| | 23,310,120 | | | Goldman Sachs International Real Estate Securities Fund | | | 137,762,807 | |
| | 7,993,937 | | | Goldman Sachs International Small Cap Insights Fund | | | 83,536,647 | |
| | 2,834,044 | | | Goldman Sachs International Small Cap Fund | | | 55,235,515 | |
| | 6,892,960 | | | Goldman Sachs Emerging Markets Equity Insights Fund | | | 51,007,906 | |
| | 2,720,085 | | | Goldman Sachs Emerging Markets Equity Fund | | | 41,834,906 | |
| | | | | | | | |
| | | | | | | 509,946,023 | |
| | |
| | Fixed Income – 44.5% | |
| | 21,164,320 | | | Goldman Sachs High Yield Fund | | | 128,044,137 | |
| | 12,316,593 | | | Goldman Sachs High Yield Floating Rate Fund | | | 115,652,806 | |
| | 6,104,417 | | | Goldman Sachs Emerging Markets Debt Fund | | | 72,276,299 | |
| | 7,846,380 | | | Goldman Sachs Local Emerging Markets Debt Fund | | | 45,901,324 | |
| | 4,222,560 | | | Goldman Sachs Commodity Strategy Fund | | | 44,716,915 | |
| | | | | | | | |
| | | | | | | 406,591,481 | |
| | |
| TOTAL UNDERLYING FUNDS
(INSTITUTIONAL SHARES) – 100.3% | | | | |
| | (Cost $904,539,793) | | $ | 916,537,504 | |
| | |
| LIABILITIES IN EXCESS OF
OTHER ASSETS – (0.3)% | | | (2,496,454 | ) |
| | |
| | NET ASSETS – 100.0% | | $ | 914,041,050 | |
| | |
| | |
| The percentage shown for each investment category reflects the value of investments in that category as a percentage of net assets. |
(a) | | Represents Affiliated Funds. |
| | |
| 44 | | The accompanying notes are an integral part of these financial statements. |
GOLDMAN SACHS FUND OF FUNDS PORTFOLIOS
Schedule of Investments
December 31, 2015
|
| ADDITIONAL INVESTMENT INFORMATION |
JOINT REPURCHASE AGREEMENT ACCOUNT II — At December 31, 2015, certain Portfolios had undivided interests in the Joint Repurchase Agreement Account II, with a maturity date of January 4, 2016, as follows:
| | | | | | | | | | | | |
Portfolio | | Principal Amount | | | Maturity Value | | | Collateral Allocation Value | |
Balanced Strategy Portfolio | | $ | 900,000 | | | $ | 900,032 | | | $ | 921,589 | |
Growth and Income Strategy Portfolio | | | 5,000,000 | | | | 5,000,179 | | | | 5,119,937 | |
REPURCHASE AGREEMENTS — At December 31, 2015, the Principal Amount of Balanced Strategy and Growth and Income Strategy Portfolios’ interest in the Joint Repurchase Agreement Account II was as follows:
| | | | | | | | | | | | |
| Counterparty | | Interest
Rate | | | Balanced Strategy Portfolio | | | Growth and Income
Strategy Portfolio | |
BNP Paribas Securities Co. | | | 0.310 | % | | $ | 446,549 | | | $ | 2,480,830 | |
Citigroup Global Markets, Inc. | | | 0.340 | | | | 358,863 | | | | 1,993,685 | |
Merrill Lynch & Co., Inc. | | | 0.310 | | | | 94,588 | | | | 525,485 | |
| TOTAL | | | | | | $ | 900,000 | | | $ | 5,000,000 | |
At December 31, 2015, the Joint Repurchase Agreement Account II was fully collateralized by:
| | | | | | | | |
| Issuer | | Interest Rates | | | Maturity Dates | |
Federal Home Loan Banks | | | 0.625 | % | | | 12/28/16 | |
Federal Home Loan Mortgage Corp. | | | 1.000 to 7.500 | | | | 07/28/17 to 07/01/45 | |
Federal National Mortgage Association | | | 2.000 to 7.500 | | | | 04/01/16 to 11/01/45 | |
Government National Mortgage Association | | | 3.000 to 6.000 | | | | 05/15/18 to 10/20/45 | |
United States Treasury Inflation Protected Securities | | | 1.875 | | | | 07/15/19 | |
United States Treasury Note | | | 1.000 | | | | 09/30/19 | |
United States Treasury Stripped Securities | | | 0.000 | | | | 05/15/34 to 11/15/36 | |
| | |
| The accompanying notes are an integral part of these financial statements. | | 45 |
GOLDMAN SACHS FUND OF FUNDS PORTFOLIOS
Statements of Assets and Liabilities
December 31, 2015
| | | | | | | | |
| | | | |
Balanced Strategy
Portfolio | |
| | Assets: | | | |
| | Investments in Affiliated Underlying Funds, at value (cost $477,098,285, $307,501,157, $945,032,295, $789,303,752 and $904,539,793) | | $ | 447,157,138 | |
| | Repurchase agreement, at value which equals cost | | | 900,000 | |
| | Cash | | | 84,827 | |
| | Receivables: | | | | | | |
| | Portfolio shares sold | | | 712,597 | |
| | Dividends | | | 451,465 | |
| | Investments sold | | | — | |
| | Reimbursement from investment adviser | | | — | |
| | Other assets | | | 2,584 | |
| | Total assets | | | 449,308,611 | |
| | | | | | | | |
| | Liabilities: | | | |
| | Due to custodian | | | — | |
| | Payables: | | | | | | |
| | Portfolio shares redeemed | | | 3,216,393 | |
| | Investments purchased | | | 1,224,343 | |
| | Distribution and Service fees and Transfer Agency fees | | | 122,522 | |
| | Management fees | | | 56,930 | |
| | Distributions payable | | | 210 | |
| | Accrued expenses | | | 69,663 | |
| | Total liabilities | | | 4,690,061 | |
| | | | | | | | |
| | Net Assets: | | | |
| | Paid-in capital | | | 487,442,097 | |
| | Undistributed (distributions in excess of) net investment income | | | 147,612 | |
| | Accumulated net realized loss | | | (13,030,012 | ) |
| | Net unrealized gain (loss) | | | (29,941,147 | ) |
| | | NET ASSETS | | $ | 444,618,550 | |
| | | Net Assets: | | | | | | |
| | | Class A | | $ | 146,046,594 | |
| | | Class C | | | 53,733,823 | |
| | | Institutional | | | 234,109,957 | |
| | | Service | | | 967,374 | |
| | | Class IR | | | 4,554,747 | |
| | | Class R | | | 5,196,265 | |
| | | Class R6(a) | | | 9,790 | |
| | | Total Net Assets | | $ | 444,618,550 | |
| | | Shares Outstanding $0.001 par value (unlimited shares authorized): | | | | | | |
| | | Class A | | | 14,026,768 | |
| | | Class C | | | 5,159,285 | |
| | | Institutional | | | 22,475,527 | |
| | | Service | | | 92,594 | |
| | | Class IR | | | 439,121 | |
| | | Class R | | | 501,409 | |
| | | Class R6(a) | | | 940 | |
| | | Net asset value, offering and redemption price per share:(b) | | | | | | |
| | | Class A | | | $10.41 | |
| | | Class C | | | 10.41 | |
| | | Institutional | | | 10.42 | |
| | | Service | | | 10.45 | |
| | | Class IR | | | 10.37 | |
| | | Class R | | | 10.36 | |
| | | Class R6(a) | | | 10.42 | |
| | (a) | | Commenced operations on July 31, 2015. |
| | (b) | | Maximum public offering price per share for Class A Shares of the Balanced Strategy, Equity Growth Strategy, Growth and Income Strategy, Growth Strategy and Satellite Strategies Portfolios is $11.02, $15.28, $12.30, $13.44 and $7.88, respectively. At redemption, Class C Shares may be subject to a contingent deferred sales charge, assessed on the amount equal to the lesser of the current net asset value (“NAV”) or the original purchase price of the shares. |
| | |
| 46 | | The accompanying notes are an integral part of these financial statements. |
GOLDMAN SACHS FUND OF FUNDS PORTFOLIOS
| | | | | | | | | | | | | | | | | | | | | | |
| | | Equity Growth
Strategy Portfolio | | | | | Growth and
Income Strategy
Portfolio | | | | | Growth Strategy
Portfolio | | | | | Satellite Strategies
Portfolio | |
| | | | | | | | | | | | | | | | | | | | | | |
| | | $345,051,202 | | | | | $ | 930,396,369 | | | | | $ | 812,927,698 | | | | | $ | 916,537,504 | |
| | | — | | | | | | 5,000,000 | | | | | | — | | | | | | — | |
| | | 39,985 | | | | | | 25,715 | | | | | | — | | | | | | — | |
| | | | | | | | | | | | | | | | | | | | | | |
| | | 141,781 | | | | | | 601,879 | | | | | | 799,338 | | | | | | 658,374 | |
| | | — | | | | | | 495,033 | | | | | | 182,517 | | | | | | 1,710,608 | |
| | | 91,377 | | | | | | — | | | | | | 559,213 | | | | | | 3,478,083 | |
| | | 69,464 | | | | | | — | | | | | | — | | | | | | 34,625 | |
| | | 1,984 | | | | | | 5,125 | | | | | | 4,351 | | | | | | 6,174 | |
| | | 345,395,793 | | | | | | 936,524,121 | | | | | | 814,473,117 | | | | | | 922,425,368 | |
| | | | | | | | | | | | | | | | | | | | | | |
| | | | | | | | | | | | | | | | | | | | | | |
| | | — | | | | | | — | | | | | | 699,502 | | | | | | 2,945,475 | |
| | | | | | | | | | | | | | | | | | | | | | |
| | | 1,532,665 | | | | | | 8,285,253 | | | | | | 2,649,363 | | | | | | 3,418,223 | |
| | | — | | | | | | 5,081,329 | | | | | | 182,517 | | | | | | 1,710,608 | |
| | | 142,526 | | | | | | 294,202 | | | | | | 306,309 | | | | | | 152,537 | |
| | | 44,143 | | | | | | 117,416 | | | | | | 103,558 | | | | | | 99,329 | |
| | | 869 | | | | | | 2,779 | | | | | | 4,379 | | | | | | — | |
| | | 70,958 | | | | | | 106,462 | | | | | | 96,667 | | | | | | 58,146 | |
| | | 1,791,161 | | | | | | 13,887,441 | | | | | | 4,042,295 | | | | | | 8,384,318 | |
| | | | | | | | | | | | | | | | | | | | | | |
| | | | | | | | | | | | | | | | | | | | | | |
| | | 552,594,269 | | | | | | 1,528,213,627 | | | | | | 1,459,534,870 | | | | | | 989,096,604 | |
| | | 100,110 | | | | | | 4,290 | | | | | | 452,765 | | | | | | 1,336,518 | |
| | | (246,639,792 | ) | | | | | (590,945,311 | ) | | | | | (673,180,759 | ) | | | | | (88,389,783 | ) |
| | | 37,550,045 | | | | | | (14,635,926 | ) | | | | | 23,623,946 | | | | | | 11,997,711 | |
| | | | $343,604,632 | | | | | $ | 922,636,680 | | | | | $ | 810,430,822 | | | | | $ | 914,041,050 | |
| | | | | | | | | | | | | | | | | | | | | | | |
| | | | $134,851,014 | | | | | $ | 341,467,695 | | | | | $ | 336,879,802 | | | | | $ | 118,345,181 | |
| | | | 83,743,115 | | | | | | 143,256,660 | | | | | | 161,732,661 | | | | | | 68,764,888 | |
| | | | 117,357,424 | | | | | | 429,242,581 | | | | | | 303,236,710 | | | | | | 655,267,779 | |
| | | | 577,092 | | | | | | 3,245,605 | | | | | | 2,134,926 | | | | | | 988,117 | |
| | | | 5,281,825 | | | | | | 3,084,524 | | | | | | 4,114,393 | | | | | | 67,546,734 | |
| | | | 1,784,559 | | | | | | 2,329,908 | | | | | | 2,322,700 | | | | | | 3,118,797 | |
| | | | 9,603 | | | | | | 9,707 | | | | | | 9,630 | | | | | | 9,554 | |
| | | | $343,604,632 | | | | | $ | 922,636,680 | | | | | $ | 810,430,822 | | | | | $ | 914,041,050 | |
| | | | | | | | | | | | | | | | | | | | | | | |
| | | | 9,336,038 | | | | | | 29,379,265 | | | | | | 26,523,728 | | | | | | 15,892,739 | |
| | | | 6,058,622 | | | | | | 12,548,473 | | | | | | 12,755,514 | | | | | | 9,282,409 | |
| | | | 8,054,793 | | | | | | 36,810,638 | | | | | | 23,900,177 | | | | | | 88,153,324 | |
| | | | 40,105 | | | | | | 279,865 | | | | | | 168,512 | | | | | | 132,945 | |
| | | | 370,627 | | | | | | 266,569 | | | | | | 328,549 | | | | | | 9,086,824 | |
| | | | 124,161 | | | | | | 201,615 | | | | | | 187,106 | | | | | | 420,432 | |
| | | | 659 | | | | | | 833 | | | | | | 759 | | | | | | 1,285 | |
| | | | | | | | | | | | | | | | | | | | | | | |
| | | | $14.44 | | | | | | $11.62 | | | | | | $12.70 | | | | | | $7.45 | |
| | | | 13.82 | | | | | | 11.42 | | | | | | 12.68 | | | | | | 7.41 | |
| | | | 14.57 | | | | | | 11.66 | | | | | | 12.69 | | | | | | 7.43 | |
| | | | 14.39 | | | | | | 11.60 | | | | | | 12.67 | | | | | | 7.43 | |
| | | | 14.25 | | | | | | 11.57 | | | | | | 12.52 | | | | | | 7.43 | |
| | | | 14.37 | | | | | | 11.56 | | | | | | 12.41 | | | | | | 7.42 | |
| | | | 14.57 | | | | | | 11.66 | | | | | | 12.68 | | | | | | 7.44 | |
| | |
| The accompanying notes are an integral part of these financial statements. | | 47 |
GOLDMAN SACHS FUND OF FUNDS PORTFOLIOS
Statements of Operations
For the Fiscal Year Ended December 31, 2015
| | | | | | |
| | | | |
Balanced Strategy
Portfolio | |
| | Investment income: | | | | |
| | Dividends from Affiliated Underlying Funds | | $ | 16,816,314 | |
| | Interest | | | 519 | |
| | Total investment income | | | 16,816,833 | |
| | | | | | |
| | Expenses: | | | | |
| | Distribution and Service fees(a) | | | 1,016,465 | |
| | Management fees | | | 697,436 | |
| | Transfer Agency fees(a) | | | 531,819 | |
| | Printing and mailing costs | | | 67,975 | |
| | Professional fees | | | 61,137 | |
| | Registration fees | | | 54,749 | |
| | Custody, accounting and administrative services | | | 47,657 | |
| | Trustee fees | | | 21,227 | |
| | Service Share fees — Shareholder Administration Plan | | | 3,414 | |
| | Service Share fees — Service Plan | | | 3,414 | |
| | Other | | | 16,441 | |
| | Total expenses | | | 2,521,734 | |
| | Less — expense reductions | | | (250,589 | ) |
| | Net expenses | | | 2,271,145 | |
| | NET INVESTMENT INCOME | | | 14,545,688 | |
| | | | | | |
| | Realized and unrealized gain (loss): | | | | |
| | Capital gain distributions from Affiliated Underlying Funds | | | 3,348,780 | |
| | Net realized gain (loss) from Affiliated Underlying Funds | | | 3,634,465 | |
| | Net change in unrealized loss on Affiliated Underlying Funds | | | (25,031,392 | ) |
| | Net realized and unrealized gain (loss) | | | (18,048,147 | ) |
| | NET INCREASE (DECREASE) IN NET ASSETS RESULTING FROM OPERATIONS | | $ | (3,502,459 | ) |
| | (a) | | Class specific Distribution and Service and Transfer Agent fees were as follows: |
| | | | | | | | | | | | | | | | | | | | | | | | | | | | | | | | | | | | | | | | |
| | | Distribution and Service Fees | | | Transfer Agency Fees | |
Portfolio | | Class A | | | Class C | | | Class R | | | Class A | | | Class C | | | Institutional | | | Service | | | Class IR | | | Class R | | | Class R6(b) | |
Balanced Strategy | | $ | 404,752 | | | $ | 584,262 | | | $ | 27,451 | | | $ | 307,612 | | | $ | 111,010 | | | $ | 93,212 | | | $ | 546 | | | $ | 9,006 | | | $ | 10,431 | | | $ | 2 | |
Equity Growth Strategy | | | 359,317 | | | | 920,925 | | | | 10,793 | | | | 273,081 | | | | 174,976 | | | | 48,915 | | | | 250 | | | | 10,686 | | | | 4,101 | | | | 1 | |
Growth and Income Strategy | | | 950,768 | | | | 1,583,192 | | | | 12,053 | | | | 722,584 | | | | 300,806 | | | | 166,494 | | | | 1,400 | | | | 6,313 | | | | 4,580 | | | | 2 | |
Growth Strategy | | | 918,661 | | | | 1,788,719 | | | | 12,065 | | | | 698,182 | | | | 339,857 | | | | 115,475 | | | | 912 | | | | 7,979 | | | | 4,585 | | | | 2 | |
Satellite Strategies | | | 372,070 | | | | 878,239 | | | | 16,847 | | | | 282,773 | | | | 166,865 | | | | 314,045 | | | | 1,948 | | | | 154,596 | | | | 6,402 | | | | 2 | |
| | (b) | | Commenced operations on July 31, 2015. |
| | |
| 48 | | The accompanying notes are an integral part of these financial statements. |
GOLDMAN SACHS FUND OF FUNDS PORTFOLIOS
| | | | | | | | | | | | | | | | | | | | | | |
| | | Equity Growth
Strategy Portfolio | | | | | Growth and
Income Strategy
Portfolio | | | | | Growth Strategy
Portfolio | | | | | Satellite Strategies
Portfolio | |
| | | | | | | | | | | | | | | | | | | | | | |
| | $ | 4,483,351 | | | | | $ | 26,166,759 | | | | | $ | 15,106,387 | | | | | $ | 33,532,263 | |
| | | 81 | | | | | | 524 | | | | | | 503 | | | | | | 180 | |
| | | 4,483,432 | | | | | | 26,167,283 | | | | | | 15,106,890 | | | | | | 33,532,443 | |
| | | | | | | | | | | | | | | | | | | | | | |
| | | | | | | | | | | | | | | | | | | | | | |
| | | 1,291,035 | | | | | | 2,546,013 | | | | | | 2,719,445 | | | | | | 1,267,156 | |
| | | 549,777 | | | | | | 1,446,147 | | | | | | 1,265,882 | | | | | | 1,378,105 | |
| | | 512,010 | | | | | | 1,202,179 | | | | | | 1,166,992 | | | | | | 926,631 | |
| | | 62,601 | | | | | | 131,753 | | | | | | 130,074 | | | | | | 99,148 | |
| | | 75,766 | | | | | | 62,353 | | | | | | 74,842 | | | | | | 82,720 | |
| | | 81,338 | | | | | | 63,486 | | | | | | 96,918 | | | | | | 172,077 | |
| | | 42,436 | | | | | | 48,957 | | | | | | 42,110 | | | | | | 38,987 | |
| | | 19,098 | | | | | | 25,612 | | | | | | 19,246 | | | | | | 26,362 | |
| | | 1,564 | | | | | | 8,751 | | | | | | 5,702 | | | | | | 12,176 | |
| | | 1,564 | | | | | | 8,751 | | | | | | 5,702 | | | | | | 12,176 | |
| | | 1,950 | | | | | | 9,923 | | | | | | 18,339 | | | | | | 21,349 | |
| | | 2,639,139 | | | | | | 5,553,925 | | | | | | 5,545,252 | | | | | | 4,036,887 | |
| | | (269,510 | ) | | | | | (303,521 | ) | | | | | (347,772 | ) | | | | | (329,504 | ) |
| | | 2,369,629 | | | | | | 5,250,404 | | | | | | 5,197,480 | | | | | | 3,707,383 | |
| | | 2,113,803 | | | | | | 20,916,879 | | | | | | 9,909,410 | | | | | | 29,825,060 | |
| | | | | | | | | | | | | | | | | | | | | | |
| | | | | | | | | | | | | | | | | | | | | | |
| | | 3,869,044 | | | | | | 8,790,123 | | | | | | 9,393,339 | | | | | | 3,733,280 | |
| | | 26,524,412 | | | | | | 33,779,279 | | | | | | 51,208,919 | | | | | | (18,639,269 | ) |
| | | (28,776,252 | ) | | | | | (66,686,597 | ) | | | | | (69,260,756 | ) | | | | | (41,621,460 | ) |
| | | 1,617,204 | | | | | | (24,117,195 | ) | | | | | (8,658,498 | ) | | | | | (56,527,449 | ) |
| | $ | 3,731,007 | | | | | $ | (3,200,316 | ) | | | | $ | 1,250,912 | | | | | $ | (26,702,389 | ) |
| | |
| The accompanying notes are an integral part of these financial statements. | | 49 |
GOLDMAN SACHS FUND OF FUNDS PORTFOLIOS
Statements of Changes in Net Assets
| | | | | | | | | | |
| | | | | Balanced Strategy Portfolio | |
| | | | | For the Fiscal
Year Ended
December 31, 2015 | | | For the Fiscal
Year Ended
December 31, 2014 | |
| | From operations: | | | | | | | | |
| | Net investment income | | $ | 14,545,688 | | | $ | 9,930,538 | |
| | Net realized gain | | | 6,983,245 | | | | 23,113,791 | |
| | Net change in unrealized loss | | | (25,031,392 | ) | | | (19,270,122 | ) |
| | Net increase (decrease) in net assets resulting from operations | | | (3,502,459 | ) | | | 13,774,207 | |
| | | | | | | | | | |
| | Distributions to shareholders: | | | | | | | | |
| | From net investment income | | | | | | | | |
| | Class A Shares | | | (5,095,512 | ) | | | (5,235,872 | ) |
| | Class B Shares(a) | | | — | | | | (14,631 | ) |
| | Class C Shares | | | (1,565,196 | ) | | | (1,434,415 | ) |
| | Institutional Shares | | | (8,487,895 | ) | | | (8,498,984 | ) |
| | Service Shares | | | (44,435 | ) | | | (42,017 | ) |
| | Class IR Shares | | | (164,300 | ) | | | (154,268 | ) |
| | Class R Shares | | | (188,063 | ) | | | (151,046 | ) |
| | Class R6 Shares(b) | | | (310 | ) | | | — | |
| | Return of capital | | | | | | | | |
| | Class A Shares | | | (2,526,405 | ) | | | — | |
| | Class C Shares | | | (776,040 | ) | | | — | |
| | Institutional Shares | | | (4,208,383 | ) | | | — | |
| | Service Shares | | | (22,031 | ) | | | — | |
| | Class IR Shares | | | (81,461 | ) | | | — | |
| | Class R Shares | | | (93,243 | ) | | | — | |
| | Class R6 Shares(b) | | | (153 | ) | | | — | |
| | Total distributions to shareholders | | | (23,253,427 | ) | | | (15,531,233 | ) |
| | | | | | | | | | |
| | From share transactions: | | | | | | | | |
| | Proceeds from sales of shares | | | 98,709,246 | | | | 126,602,549 | |
| | Reinvestment of distributions | | | 22,189,595 | | | | 14,845,000 | |
| | Cost of shares redeemed | | | (153,490,200 | ) | | | (207,803,697 | ) |
| | Net decrease in net assets resulting from share transactions | | | (32,591,359 | ) | | | (66,356,148 | ) |
| | TOTAL DECREASE | | | (59,347,245 | ) | | | (68,113,174 | ) |
| | | | | | | | | | |
| | Net assets: | | | | | | | | |
| | Beginning of year | | | 503,965,795 | | | | 572,078,969 | |
| | End of year | | $ | 444,618,550 | | | $ | 503,965,795 | |
| | Undistributed (distributions in excess of) net investment income | | $ | 147,612 | | | $ | 275,383 | |
| | (a) | | Class B Shares were converted into Class A Shares at the close of business on November 14, 2014. |
| | (b) | | Commenced operations on July 31, 2015. |
| | |
| 50 | | The accompanying notes are an integral part of these financial statements. |
GOLDMAN SACHS FUND OF FUNDS PORTFOLIOS
| | | | | | | | | | | | | | | | | | | | | | |
| | | Equity Growth Strategy Portfolio | | | | | Growth and Income Strategy Portfolio | |
| | | For the Fiscal
Year Ended
December 31, 2015 | | | | | For the Fiscal
Year Ended
December 31, 2014 | | | | | For the Fiscal
Year Ended
December 31, 2015 | | | | | For the Fiscal
Year Ended
December 31, 2014 | |
| | | | | | | | | | | | | | | | | | | | | | |
| | $ | 2,113,803 | | | | | $ | 5,588,777 | | | | | $ | 20,916,879 | | | | | $ | 16,712,868 | |
| | | 30,393,456 | | | | | | 33,325,950 | | | | | | 42,569,402 | | | | | | 63,535,605 | |
| | | (28,776,252 | ) | | | | | (27,129,782 | ) | | | | | (66,686,597 | ) | | | | | (56,880,106 | ) |
| | | 3,731,007 | | | | | | 11,784,945 | | | | | | (3,200,316 | ) | | | | | 23,368,367 | |
| | | | | | | | | | | | | | | | | | | | | | |
| | | | | | | | | | | | | | | | | | | | | | |
| | | | | | | | | | | | | | | | | | | | | | |
| | | (1,308,140 | ) | | | | | (2,648,072 | ) | | | | | (12,235,759 | ) | | | | | (10,286,039 | ) |
| | | — | | | | | | (38 | ) | | | | | — | | | | | | — | |
| | | (169,086 | ) | | | | | (1,035,861 | ) | | | | | (4,206,483 | ) | | | | | (3,587,888 | ) |
| | | (1,615,705 | ) | | | | | (2,808,754 | ) | | | | | (16,299,566 | ) | | | | | (12,077,484 | ) |
| | | (4,927 | ) | | | | | (10,479 | ) | | | | | (112,387 | ) | | | | | (90,511 | ) |
| | | (68,602 | ) | | | | | (105,720 | ) | | | | | (120,119 | ) | | | | | (90,372 | ) |
| | | (10,858 | ) | | | | | (33,633 | ) | | | | | (76,493 | ) | | | | | (59,555 | ) |
| | | (134 | ) | | | | | — | | | | | | (326 | ) | | | | | — | |
| | | | | | | | | | | | | | | | | | | | | | |
| | | — | | | | | | — | | | | | | — | | | | | | — | |
| | | — | | | | | | — | | | | | | — | | | | | | — | |
| | | — | | | | | | — | | | | | | — | | | | | | — | |
| | | — | | | | | | — | | | | | | — | | | | | | — | |
| | | — | | | | | | — | | | | | | — | | | | | | — | |
| | | — | | | | | | — | | | | | | — | | | | | | — | |
| | | — | | | | | | — | | | | | | — | | | | | | — | |
| | | (3,177,452 | ) | | | | | (6,642,557 | ) | | | | | (33,051,133 | ) | | | | | (26,191,849 | ) |
| | | | | | | | | | | | | | | | | | | | | | |
| | | | | | | | | | | | | | | | | | | | | | |
| | | 25,374,959 | | | | | | 51,852,636 | | | | | | 128,739,332 | | | | | | 195,995,866 | |
| | | 3,020,454 | | | | | | 6,227,269 | | | | | | 30,906,155 | | | | | | 24,594,258 | |
| | | (69,366,483 | ) | | | | | (86,257,984 | ) | | | | | (210,351,612 | ) | | | | | (248,309,446 | ) |
| | | (40,971,070 | ) | | | | | (28,178,079 | ) | | | | | (50,706,125 | ) | | | | | (27,719,322 | ) |
| | | (40,417,515 | ) | | | | | (23,035,691 | ) | | | | | (86,957,574 | ) | | | | | (30,542,804 | ) |
| | | | | | | | | | | | | | | | | | | | | | |
| | | | | | | | | | | | | | | | | | | | | | |
| | | 384,022,147 | | | | | | 407,057,838 | | | | | | 1,009,594,254 | | | | | | 1,040,137,058 | |
| | $ | 343,604,632 | | | | | $ | 384,022,147 | | | | | $ | 922,636,680 | | | | | $ | 1,009,594,254 | |
| | $ | 100,110 | | | | | $ | 100,407 | | | | | $ | 4,290 | | | | | $ | 233,475 | |
| | |
| The accompanying notes are an integral part of these financial statements. | | 51 |
GOLDMAN SACHS FUND OF FUNDS PORTFOLIOS
Statements of Changes in Net Assets (continued)
| | | | | | | | | | |
| | | | | Growth Strategy Portfolio | |
| | | | | For the Fiscal
Year Ended
December 31, 2015 | | | For the Fiscal
Year Ended
December 31, 2014 | |
| | From operations: | | | | | | | | |
| | Net investment income | | $ | 9,909,410 | | | $ | 11,356,092 | |
| | Net realized gain | | | 60,602,258 | | | | 72,055,789 | |
| | Net change in unrealized loss | | | (69,260,756 | ) | | | (62,895,888 | ) |
| | Net increase in net assets resulting from operations | | | 1,250,912 | | | | 20,515,993 | |
| | | | | | | | | | |
| | Distributions to shareholders: | | | | | | | | |
| | From net investment income | | | | | | | | |
| | Class A Shares | | | (5,268,195 | ) | | | (8,390,748 | ) |
| | Class C Shares | | | (1,217,530 | ) | | | (2,554,856 | ) |
| | Institutional Shares | | | (6,012,695 | ) | | | (6,851,715 | ) |
| | Service Shares | | | (31,885 | ) | | | (50,319 | ) |
| | Class IR Shares | | | (77,652 | ) | | | (103,782 | ) |
| | Class R Shares | | | (31,649 | ) | | | (49,071 | ) |
| | Class R6 Shares(a) | | | (193 | ) | | | — | |
| | Total distributions to shareholders | | | (12,639,799 | ) | | | (18,000,491 | ) |
| | | | | | | | | | |
| | From share transactions: | | | | | | | | |
| | Proceeds from sales of shares | | | 108,927,723 | | | | 138,333,644 | |
| | Reinvestment of distributions | | | 12,018,514 | | | | 16,942,316 | |
| | Cost of shares redeemed | | | (151,803,088 | ) | | | (218,629,993 | ) |
| | Net decrease in net assets resulting from share transactions | | | (30,856,851 | ) | | | (63,354,033 | ) |
| | TOTAL DECREASE | | | (42,245,738 | ) | | | (60,838,531 | ) |
| | | | | | | | | | |
| | Net assets: | | | | | | | | |
| | Beginning of year | | | 852,676,560 | | | | 913,515,091 | |
| | End of year | | $ | 810,430,822 | | | $ | 852,676,560 | |
| | Undistributed (distributions in excess of) net investment income | | $ | 452,765 | | | $ | 441,748 | |
| | (a) | | Commenced operations on July 31, 2015. |
| | |
| 52 | | The accompanying notes are an integral part of these financial statements. |
GOLDMAN SACHS FUND OF FUNDS PORTFOLIOS
| | | | | | | | | | |
| | | | | Satellite Strategies Portfolio | |
| | | | | For the Fiscal
Year Ended
December 31, 2015 | | | For the Fiscal
Year Ended
December 31, 2014 | |
| | From operations: | | | | | | | | |
| | Net investment income | | $ | 29,825,060 | | | $ | 36,214,289 | |
| | Net realized loss | | | (14,905,989 | ) | | | (17,047,140 | ) |
| | Net change in unrealized loss | | | (41,621,460 | ) | | | (20,443,189 | ) |
| | Net decrease in net assets resulting from operations | | | (26,702,389 | ) | | | (1,276,040 | ) |
| | | | | | | | | | |
| | Distributions to shareholders: | | | | | | | | |
| | From net investment income | | | | | | | | |
| | Class A Shares | | | (3,402,921 | ) | | | (5,155,705 | ) |
| | Class C Shares | | | (1,351,435 | ) | | | (2,002,292 | ) |
| | Institutional Shares | | | (21,458,058 | ) | | | (25,341,639 | ) |
| | Service Shares | | | (71,931 | ) | | | (475,253 | ) |
| | Class IR Shares | | | (2,097,718 | ) | | | (2,676,935 | ) |
| | Class R Shares | | | (72,106 | ) | | | (92,446 | ) |
| | Class R6 Shares(a) | | | (152 | ) | | | — | |
| | From net realized gains | | | | | | | | |
| | Class A Shares | | | — | | | | (932,370 | ) |
| | Class C Shares | | | — | | | | (539,194 | ) |
| | Institutional Shares | | | — | | | | (4,364,246 | ) |
| | Service Shares | | | — | | | | (75,234 | ) |
| | Class IR Shares | | | — | | | | (454,751 | ) |
| | Class R Shares | | | — | | | | (18,035 | ) |
| | Total distributions to shareholders | | | (28,454,321 | ) | | | (42,128,100 | ) |
| | | | | | | | | | |
| | From share transactions: | | | | | | | | |
| | Proceeds from sales of shares | | | 178,922,896 | | | | 274,954,273 | |
| | Proceeds received in connection with merger | | | — | | | | 26,406,156 | |
| | Reinvestment of distributions | | | 22,469,087 | | | | 33,374,881 | |
| | Cost of shares redeemed | | | (449,257,975 | ) | | | (401,572,781 | ) |
| | Net decrease in net assets resulting from share transactions | | | (247,865,992 | ) | | | (66,837,471 | ) |
| | TOTAL DECREASE | | | (303,022,702 | ) | | | (110,241,611 | ) |
| | | | | | | | | | |
| | Net assets: | | | | | | | | |
| | Beginning of year | | | 1,217,063,752 | | | | 1,327,305,363 | |
| | End of year | | $ | 914,041,050 | | | $ | 1,217,063,752 | |
| | Undistributed net investment income | | $ | 1,336,518 | | | $ | 1,529,637 | |
| | (a) | | Commenced operations on July 31, 2015. |
| | |
| The accompanying notes are an integral part of these financial statements. | | 53 |
GOLDMAN SACHS BALANCED STRATEGY PORTFOLIO
Financial Highlights
Selected Data for a Share Outstanding Throughout Each Year
| | | | | | | | | | | | | | | | | | | | | | | | | | | | | | |
| | | | | | From
investment operations | | | Distributions
to shareholders | |
| | | Year - Share Class | | Net asset
value,
beginning
of year | | | Net
investment
income(a)(b) | | | Net realized
and unrealized
gain (loss) | | | Total from
investment
operations | | | From net investment income | | | From
capital | | | Total distributions | |
| | FOR THE FISCAL YEARS ENDED DECEMBER 31, | | | | | | | | | |
| | 2015 - A | | $ | 11.06 | | | $ | 0.33 | | | $ | (0.43 | ) | | $ | (0.10 | ) | | $ | (0.38 | ) | | $ | (0.17 | ) | | $ | (0.55 | ) |
| | 2015 - C | | | 11.07 | | | | 0.24 | | | | (0.43 | ) | | | (0.19 | ) | | | (0.32 | ) | | | (0.15 | ) | | | (0.47 | ) |
| | 2015 - Institutional | | | 11.07 | | | | 0.39 | | | | (0.44 | ) | | | (0.05 | ) | | | (0.40 | ) | | | (0.20 | ) | | | (0.60 | ) |
| | 2015 - Service | | | 11.10 | | | | 0.39 | | | | (0.50 | ) | | | (0.11 | ) | | | (0.36 | ) | | | (0.18 | ) | | | (0.54 | ) |
| | 2015 - IR | | | 11.03 | | | | 0.36 | | | | (0.44 | ) | | | (0.08 | ) | | | (0.39 | ) | | | (0.19 | ) | | | (0.58 | ) |
| | 2015 - R | | | 11.02 | | | | 0.36 | | | | (0.49 | ) | | | (0.13 | ) | | | (0.34 | ) | | | (0.19 | ) | | | (0.53 | ) |
| | 2015 - R6 (Commenced July 31, 2015) | | | 11.16 | | | | 0.30 | | | | (0.52 | ) | | | (0.22 | ) | | | (0.35 | ) | | | (0.17 | ) | | | (0.52 | ) |
| | 2014 - A | | | 11.13 | | | | 0.21 | | | | 0.06 | | | | 0.27 | | | | (0.34 | ) | | | — | | | | (0.34 | ) |
| | 2014 - C | | | 11.13 | | | | 0.12 | | | | 0.07 | | | | 0.19 | | | | (0.25 | ) | | | — | | | | (0.25 | ) |
| | 2014 - Institutional | | | 11.13 | | | | 0.25 | | | | 0.07 | | | | 0.32 | | | | (0.38 | ) | | | — | | | | (0.38 | ) |
| | 2014 - Service | | | 11.16 | | | | 0.19 | | | | 0.08 | | | | 0.27 | | | | (0.33 | ) | | | — | | | | (0.33 | ) |
| | 2014 - IR | | | 11.09 | | | | 0.25 | | | | 0.06 | | | | 0.31 | | | | (0.37 | ) | | | — | | | | (0.37 | ) |
| | 2014 - R | | | 11.08 | | | | 0.18 | | | | 0.07 | | | | 0.25 | | | | (0.31 | ) | | | — | | | | (0.31 | ) |
| | 2013 - A | | | 10.56 | | | | 0.25 | | | | 0.61 | | | | 0.86 | | | | (0.29 | ) | | | — | | | | (0.29 | ) |
| | 2013 - C | | | 10.56 | | | | 0.17 | | | | 0.61 | | | | 0.78 | | | | (0.21 | ) | | | — | | | | (0.21 | ) |
| | 2013 - Institutional | | | 10.56 | | | | 0.33 | | | | 0.58 | | | | 0.91 | | | | (0.34 | ) | | | — | | | | (0.34 | ) |
| | 2013 - Service | | | 10.59 | | | | 0.23 | | | | 0.62 | | | | 0.85 | | | | (0.28 | ) | | | — | | | | (0.28 | ) |
| | 2013 - IR | | | 10.53 | | | | 0.37 | | | | 0.51 | | | | 0.88 | | | | (0.32 | ) | | | — | | | | (0.32 | ) |
| | 2013 - R | | | 10.51 | | | | 0.23 | | | | 0.61 | | | | 0.84 | | | | (0.27 | ) | | | — | | | | (0.27 | ) |
| | 2012 - A | | | 9.86 | | | | 0.16 | | | | 0.82 | | | | 0.98 | | | | (0.28 | ) | | | — | | | | (0.28 | ) |
| | 2012 - C | | | 9.86 | | | | 0.09 | | | | 0.81 | | | | 0.90 | | | | (0.20 | ) | | | — | | | | (0.20 | ) |
| | 2012 - Institutional | | | 9.87 | | | | 0.23 | | | | 0.79 | | | | 1.02 | | | | (0.33 | ) | | | — | | | | (0.33 | ) |
| | 2012 - Service | | | 9.88 | | | | 0.15 | | | | 0.83 | | | | 0.98 | | | | (0.27 | ) | | | — | | | | (0.27 | ) |
| | 2012 - IR | | | 9.83 | | | | 0.22 | | | | 0.79 | | | | 1.01 | | | | (0.31 | ) | | | — | | | | (0.31 | ) |
| | 2012 - R | | | 9.82 | | | | 0.15 | | | | 0.80 | | | | 0.95 | | | | (0.26 | ) | | | — | | | | (0.26 | ) |
| | 2011 - A | | | 10.22 | | | | 0.15 | | | | (0.34 | ) | | | (0.19 | ) | | | (0.17 | ) | | | — | | | | (0.17 | ) |
| | 2011 - C | | | 10.22 | | | | 0.08 | | | | (0.35 | ) | | | (0.27 | ) | | | (0.09 | ) | | | — | | | | (0.09 | ) |
| | 2011 - Institutional | | | 10.23 | | | | 0.20 | | | | (0.35 | ) | | | (0.15 | ) | | | (0.21 | ) | | | — | | | | (0.21 | ) |
| | 2011 - Service | | | 10.25 | | | | 0.14 | | | | (0.35 | ) | | | (0.21 | ) | | | (0.16 | ) | | | — | | | | (0.16 | ) |
| | 2011 - IR | | | 10.21 | | | | 0.24 | | | | (0.42 | ) | | | (0.18 | ) | | | (0.20 | ) | | | — | | | | (0.20 | ) |
| | 2011 - R | | | 10.18 | | | | 0.14 | | | | (0.35 | ) | | | (0.21 | ) | | | (0.15 | ) | | | — | | | | (0.15 | ) |
| | (a) | | Calculated based on the average shares outstanding methodology. |
| | (b) | | Recognition of net investment income by the Portfolio is affected by the timing of declaration of dividends by the Underlying Funds in which the Portfolio invests. |
| | (c) | | Assumes investment at the NAV at the beginning of the year, reinvestment of all dividends and distributions, a complete redemption of the investment at the NAV at the end of the year and no sales or redemption charges. Total returns would be reduced if a sales or redemption charge was taken into account. Returns do not reflect the deduction of taxes that a shareholder would pay on Portfolio distributions or the redemption of Portfolio shares. Total returns for periods less than one full year are not annualized. |
| | (d) | | Expense ratios exclude the expenses of the Underlying Funds in which the Portfolio invests. |
| | (e) | | The Portfolio’s portfolio turnover rate is calculated in accordance with regulatory requirements, without regard to transactions involving short term investments. If such transactions were included, the Portfolio’s portfolio turnover rate may be higher. |
| | |
| 54 | | The accompanying notes are an integral part of these financial statements. |
GOLDMAN SACHS BALANCED STRATEGY PORTFOLIO
| | | | | | | | | | | | | | | | | | | | | | | | | | | | | | | | | | | | | | | | |
| | | | | | | | | | | | | | | | | | | | | | | | | | | | | | | | | | |
| | | Net asset
value, end
of year | | | | | Total
return(c) | | | | | Net assets,
end of
year
(in 000s) | | | | | Ratio of
net expenses
to average
net assets(d) | | | | | Ratio of
total expenses
to average
net assets(d) | | | | | Ratio of
net investment
income
to average
net assets(b) | | | | | Portfolio
turnover rate(e) | |
| | | | | | | | | | | | | | | | | | | | | | | | | | | | | | | | | | | | | | | | |
| | $ | 10.41 | | | | | | (0.90 | )% | | | | $ | 146,047 | | | | | | 0.59 | % | | | | | 0.65 | % | | | | | 2.95 | % | | | | | 48 | % |
| | | 10.41 | | | | | | (1.65 | ) | | | | | 53,734 | | | | | | 1.34 | | | | | | 1.40 | | | | | | 2.20 | | | | | | 48 | |
| | | 10.42 | | | | | | (0.49 | ) | | | | | 234,110 | | | | | | 0.19 | | | | | | 0.25 | | | | | | 3.48 | | | | | | 48 | |
| | | 10.45 | | | | | | (0.99 | ) | | | | | 967 | | | | | | 0.69 | | | | | | 0.75 | | | | | | 3.47 | | | | | | 48 | |
| | | 10.37 | | | | | | (0.73 | ) | | | | | 4,555 | | | | | | 0.34 | | | | | | 0.40 | | | | | | 3.29 | | | | | | 48 | |
| | | 10.36 | | | | | | (1.23 | ) | | | | | 5,196 | | | | | | 0.84 | | | | | | 0.90 | | | | | | 3.22 | | | | | | 48 | |
| | | | 10.42 | | | | | | (2.01 | ) | | | | | 10 | | | | | | 0.19 | (f) | | | | | 0.23 | (f) | | | | | 6.52 | (f) | | | | | 48 | |
| | | 11.06 | | | | | | 2.40 | | | | | | 173,813 | | | | | | 0.60 | | | | | | 0.66 | | | | | | 1.85 | | | | | | 38 | |
| | | 11.07 | | | | �� | | 1.71 | | | | | | 63,726 | | | | | | 1.35 | | | | | | 1.41 | | | | | | 1.05 | | | | | | 38 | |
| | | 11.07 | | | | | | 2.90 | | | | | | 254,620 | | | | | | 0.20 | | | | | | 0.26 | | | | | | 2.22 | | | | | | 38 | |
| | | 11.10 | | | | | | 2.38 | | | | | | 1,391 | | | | | | 0.70 | | | | | | 0.75 | | | | | | 1.65 | | | | | | 38 | |
| | | 11.03 | | | | | | 2.76 | | | | | | 4,980 | | | | | | 0.35 | | | | | | 0.41 | | | | | | 2.23 | | | | | | 38 | |
| | | | 11.02 | | | | | | 2.25 | | | | | | 5,436 | | | | | | 0.85 | | | | | | 0.90 | | | | | | 1.61 | | | | | | 38 | |
| | | 11.13 | | | | | | 8.23 | | | | | | 186,034 | | | | | | 0.60 | | | | | | 0.65 | | | | | | 2.29 | | | | | | 63 | |
| | | 11.13 | | | | | | 7.42 | | | | | | 74,053 | | | | | | 1.34 | | | | | | 1.40 | | | | | | 1.57 | | | | | | 63 | |
| | | 11.13 | | | | | | 8.67 | | | | | | 287,623 | | | | | | 0.20 | | | | | | 0.25 | | | | | | 2.99 | | | | | | 63 | |
| | | 11.16 | | | | | | 8.08 | | | | | | 1,736 | | | | | | 0.69 | | | | | | 0.75 | | | | | | 2.14 | | | | | | 63 | |
| | | 11.09 | | | | | | 8.45 | | | | | | 3,938 | | | | | | 0.35 | | | | | | 0.40 | | | | | | 3.37 | | | | | | 63 | |
| | | | 11.08 | | | | | | 8.00 | | | | | | 5,615 | | | | | | 0.84 | | | | | | 0.90 | | | | | | 2.07 | | | | | | 63 | |
| | | 10.56 | | | | | | 9.96 | | | | | | 219,919 | | | | | | 0.59 | | | | | | 0.65 | | | | | | 1.55 | | | | | | 66 | |
| | | 10.56 | | | | | | 9.16 | | | | | | 81,123 | | | | | | 1.34 | | | | | | 1.40 | | | | | | 0.87 | | | | | | 66 | |
| | | 10.56 | | | | | | 10.32 | | | | | | 247,494 | | | | | | 0.19 | | | | | | 0.25 | | | | | | 2.23 | | | | | | 66 | |
| | | 10.59 | | | | | | 9.95 | | | | | | 2,022 | | | | | | 0.69 | | | | | | 0.75 | | | | | | 1.48 | | | | | | 66 | |
| | | 10.53 | | | | | | 10.29 | | | | | | 920 | | | | | | 0.34 | | | | | | 0.40 | | | | | | 2.14 | | | | | | 66 | |
| | | | 10.51 | | | | | | 9.66 | | | | | | 8,237 | | | | | | 0.84 | | | | | | 0.90 | | | | | | 1.49 | | | | | | 66 | |
| | | 9.86 | | | | | | (1.88 | ) | | | | | 327,283 | | | | | | 0.59 | | | | | | 0.64 | | | | | | 1.49 | | | | | | 38 | |
| | | 9.86 | | | | | | (2.64 | ) | | | | | 94,041 | | | | | | 1.34 | | | | | | 1.39 | | | | | | 0.73 | | | | | | 38 | |
| | | 9.87 | | | | | | (1.48 | ) | | | | | 151,822 | | | | | | 0.19 | | | | | | 0.24 | | | | | | 1.96 | | | | | | 38 | |
| | | 9.88 | | | | | | (2.09 | ) | | | | | 2,466 | | | | | | 0.69 | | | | | | 0.74 | | | | | | 1.36 | | | | | | 38 | |
| | | 9.83 | | | | | | (1.79 | ) | | | | | 750 | | | | | | 0.34 | | | | | | 0.39 | | | | | | 2.38 | | | | | | 38 | |
| | | | 9.82 | | | | | | (2.11 | ) | | | | | 7,288 | | | | | | 0.84 | | | | | | 0.89 | | | | | | 1.38 | | | | | | 38 | |
| | |
| The accompanying notes are an integral part of these financial statements. | | 55 |
GOLDMAN SACHS EQUITY GROWTH STRATEGY PORTFOLIO
Financial Highlights
Selected Data for a Share Outstanding Throughout Each Year
| | | | | | | | | | | | | | | | | | | | | | |
| | | | | | | | From
investment operations | | | | |
| | | Year - Share Class | | Net asset
value,
beginning
of year | | | Net
investment
income (loss)(a)(b) | | | Net realized
and unrealized
gain (loss) | | | Total from
investment
operations | | | Distributions
to shareholders
from net
investment
income | |
| | FOR THE FISCAL YEARS ENDED DECEMBER 31, | |
| | 2015 - A | | $ | 14.46 | | | $ | 0.09 | | | $ | 0.03 | | | $ | 0.12 | | | $ | (0.14 | ) |
| | 2015 - C | | | 13.83 | | | | (0.02 | ) | | | 0.04 | | | | 0.02 | | | | (0.03 | ) |
| | 2015 - Institutional | | | 14.58 | | | | 0.16 | | | | 0.03 | | | | 0.19 | | | | (0.20 | ) |
| | 2015 - Service | | | 14.40 | | | | 0.08 | | | | 0.03 | | | | 0.11 | | | | (0.12 | ) |
| | 2015 - IR | | | 14.27 | | | | 0.13 | | | | 0.03 | | | | 0.16 | | | | (0.18 | ) |
| | 2015 - R | | | 14.37 | | | | 0.04 | | | | 0.05 | | | | 0.09 | | | | (0.09 | ) |
| | 2015 - R6 (Commenced July 31, 2015) | | | 15.38 | | | | 0.14 | | | | (0.74 | ) | | | (0.60 | ) | | | (0.21 | ) |
| | 2014 - A | | | 14.29 | | | | 0.23 | | | | 0.20 | | | | 0.43 | | | | (0.26 | ) |
| | 2014 - C | | | 13.68 | | | | 0.10 | | | | 0.20 | | | | 0.30 | | | | (0.15 | ) |
| | 2014 - Institutional | | | 14.41 | | | | 0.29 | | | | 0.20 | | | | 0.49 | | | | (0.32 | ) |
| | 2014 - Service | | | 14.22 | | | | 0.19 | | | | 0.23 | | | | 0.42 | | | | (0.24 | ) |
| | 2014 - IR | | | 14.11 | | | | 0.32 | | | | 0.14 | | | | 0.46 | | | | (0.30 | ) |
| | 2014 - R | | | 14.17 | | | | 0.13 | | | | 0.26 | | | | 0.39 | | | | (0.19 | ) |
| | 2013 - A | | | 11.75 | | | | 0.19 | | | | 2.57 | | | | 2.76 | | | | (0.22 | ) |
| | 2013 - C | | | 11.26 | | | | 0.08 | | | | 2.46 | | | | 2.54 | | | | (0.12 | ) |
| | 2013 - Institutional | | | 11.85 | | | | 0.27 | | | | 2.57 | | | | 2.84 | | | | (0.28 | ) |
| | 2013 - Service | | | 11.71 | | | | 0.19 | | | | 2.54 | | | | 2.73 | | | | (0.22 | ) |
| | 2013 - IR | | | 11.62 | | | | 0.47 | | | | 2.29 | | | | 2.76 | | | | (0.27 | ) |
| | 2013 - R | | | 11.64 | | | | 0.11 | | | | 2.59 | | | | 2.70 | | | | (0.17 | ) |
| | 2012 - A | | | 10.23 | | | | 0.21 | | | | 1.53 | | | | 1.74 | | | | (0.22 | ) |
| | 2012 - C | | | 9.82 | | | | 0.12 | | | | 1.46 | | | | 1.58 | | | | (0.14 | ) |
| | 2012 - Institutional | | | 10.33 | | | | 0.28 | | | | 1.52 | | | | 1.80 | | | | (0.28 | ) |
| | 2012 - Service | | | 10.14 | | | | 0.16 | | | | 1.55 | | | | 1.71 | | | | (0.14 | ) |
| | 2012 - IR | | | 10.13 | | | | 0.24 | | | | 1.51 | | | | 1.75 | | | | (0.26 | ) |
| | 2012 - R | | | 10.16 | | | | 0.20 | | | | 1.49 | | | | 1.69 | | | | (0.21 | ) |
| | 2011 - A | | | 11.33 | | | | 0.20 | | | | (1.05 | ) | | | (0.85 | ) | | | (0.25 | ) |
| | 2011 - C | | | 10.88 | | | | 0.11 | | | | (1.01 | ) | | | (0.90 | ) | | | (0.16 | ) |
| | 2011 - Institutional | | | 11.45 | | | | 0.25 | | | | (1.07 | ) | | | (0.82 | ) | | | (0.30 | ) |
| | 2011 - Service | | | 11.22 | | | | 0.16 | | | | (1.02 | ) | | | (0.86 | ) | | | (0.22 | ) |
| | 2011 - IR | | | 11.23 | | | | 0.27 | | | | (1.08 | ) | | | (0.81 | ) | | | (0.29 | ) |
| | 2011 - R | | | 11.26 | | | | 0.21 | | | | (1.08 | ) | | | (0.87 | ) | | | (0.23 | ) |
| | (a) | | Calculated based on the average shares outstanding methodology. |
| | (b) | | Recognition of net investment income by the Portfolio is affected by the timing of declaration of dividends by the Underlying Funds in which the Portfolio invests. |
| | (c) | | Assumes investment at the NAV at the beginning of the year, reinvestment of all dividends and distributions, a complete redemption of the investment at the NAV at the end of the year and no sales or redemption charges. Total returns would be reduced if a sales or redemption charge was taken into account. Returns do not reflect the deduction of taxes that a shareholder would pay on Portfolio distributions or the redemption of Portfolio shares. Total returns for periods less than one full year are not annualized. |
| | (d) | | Expense ratios exclude the expenses of the Underlying Funds in which the Portfolio invests. |
| | (e) | | The Portfolio’s portfolio turnover rate is calculated in accordance with regulatory requirements, without regard to transactions involving short term investments. If such transactions were included, the Portfolio’s portfolio turnover rate may be higher. |
| | |
| 56 | | The accompanying notes are an integral part of these financial statements. |
GOLDMAN SACHS EQUITY GROWTH STRATEGY PORTFOLIO
| | | | | | | | | | | | | | | | | | | | | | | | | | | | | | | | | | | | | | | | |
| | | | | | | | | | | | | | | | | | | | | | | | | | | | | | | | | | |
| | | Net asset
value, end
of year | | | | | Total
return(c) | | | | | Net assets,
end of
year
(in 000s) | | | | | Ratio of
net expenses
to average
net assets(d) | | | | | Ratio of
total expenses
to average
net assets(d) | | | | | Ratio of
net investment
income (loss)
to average
net assets(b) | | | | | Portfolio
turnover
rate(e) | |
| | | | | | | | | | | | | | | | | | | | | | | | | | | | | | | | | | | | | | | | |
| | $ | 14.44 | | | | | | 0.83 | % | | | | $ | 134,851 | | | | | | 0.59 | % | | | | | 0.67 | % | | | | | 0.63 | % | | | | | 18 | % |
| | | 13.82 | | | | | | 0.13 | | | | | | 83,743 | | | | | | 1.34 | | | | | | 1.42 | | | | | | (0.15 | ) | | | | | 18 | |
| | | 14.57 | | | | | | 1.31 | | | | | | 117,357 | | | | | | 0.19 | | | | | | 0.27 | | | | | | 1.05 | | | | | | 18 | |
| | | 14.39 | | | | | | 0.78 | | | | | | 577 | | | | | | 0.69 | | | | | | 0.77 | | | | | | 0.52 | | | | | | 18 | |
| | | 14.25 | | | | | | 1.11 | | | | | | 5,282 | | | | | | 0.34 | | | | | | 0.42 | | | | | | 0.91 | | | | | | 18 | |
| | | 14.37 | | | | | | 0.61 | | | | | | 1,785 | | | | | | 0.84 | | | | | | 0.92 | | | | | | 0.28 | | | | | | 18 | |
| | | 14.57 | | | | | | (3.93 | ) | | | | | 10 | | | | | | 0.18 | (f) | | | | | 0.29 | (f) | | | | | 2.32 | (f) | | | | | 18 | |
| | | 14.46 | | | | | | 3.01 | | | | | | 148,611 | | | | | | 0.60 | | | | | | 0.68 | | | | | | 1.56 | | | | | | 23 | |
| | | 13.83 | | | | | | 2.18 | | | | | | 96,667 | | | | | | 1.35 | | | | | | 1.42 | | | | | | 0.71 | | | | | | 23 | |
| | | 14.58 | | | | | | 3.38 | | | | | | 130,499 | | | | | | 0.20 | | | | | | 0.28 | | | | | | 1.96 | | | | | | 23 | |
| | | 14.40 | | | | | | 2.94 | | | | | | 626 | | | | | | 0.70 | | | | | | 0.77 | | | | | | 1.27 | | | | | | 23 | |
| | | 14.27 | | | | | | 3.27 | | | | | | 5,280 | | | | | | 0.35 | | | | | | 0.43 | | | | | | 2.19 | | | | | | 23 | |
| | | 14.37 | | | | | | 2.77 | | | | | | 2,339 | | | | | | 0.85 | | | | | | 0.92 | | | | | | 0.86 | | | | | | 23 | |
| | | 14.29 | | | | | | 23.51 | | | | | | 152,264 | | | | | | 0.60 | | | | | | 0.68 | | | | | | 1.45 | | | | | | 21 | |
| | | 13.68 | | | | | | 22.60 | | | | | | 106,208 | | | | | | 1.35 | | | | | | 1.43 | | | | | | 0.68 | | | | | | 21 | |
| | | 14.41 | | | | | | 23.96 | | | | | | 124,275 | | | | | | 0.20 | | | | | | 0.28 | | | | | | 2.07 | | | | | | 21 | |
| | | 14.22 | | | | | | 23.28 | | | | | | 715 | | | | | | 0.70 | | | | | | 0.78 | | | | | | 1.48 | | | | | | 21 | |
| | | 14.11 | | | | | | 23.77 | | | | | | 3,735 | | | | | | 0.35 | | | | | | 0.43 | | | | | | 3.55 | | | | | | 21 | |
| | | 14.17 | | | | | | 23.17 | | | | | | 3,740 | | | | | | 0.84 | | | | | | 0.93 | | | | | | 0.85 | | | | | | 21 | |
| | | 11.75 | | | | | | 16.95 | | | | | | 147,814 | | | | | | 0.59 | | | | | | 0.68 | | | | | | 1.85 | | | | | | 23 | |
| | | 11.26 | | | | | | 16.10 | | | | | | 102,156 | | | | | | 1.34 | | | | | | 1.43 | | | | | | 1.10 | | | | | | 23 | |
| | | 11.85 | | | | | | 17.45 | | | | | | 92,696 | | | | | | 0.19 | | | | | | 0.26 | | | | | | 2.45 | | | | | | 23 | |
| | | 11.71 | | | | | | 16.85 | | | | | | 488 | | | | | | 0.70 | | | | | | 0.78 | | | | | | 1.43 | | | | | | 23 | |
| | | 11.62 | | | | | | 17.30 | | | | | | 494 | | | | | | 0.34 | | | | | | 0.42 | | | | | | 2.20 | | | | | | 23 | |
| | | 11.64 | | | | | | 16.59 | | | | | | 4,946 | | | | | | 0.84 | | | | | | 0.92 | | | | | | 1.79 | | | | | | 23 | |
| | | 10.23 | | | | | | (7.52 | ) | | | | | 208,169 | | | | | | 0.59 | | | | | | 0.66 | | | | | | 1.77 | | | | | | 18 | |
| | | 9.82 | | | | | | (8.28 | ) | | | | | 112,247 | | | | | | 1.34 | | | | | | 1.41 | | | | | | 1.05 | | | | | | 18 | |
| | | 10.33 | | | | | | (7.16 | ) | | | | | 46,797 | | | | | | 0.19 | | | | | | 0.26 | | | | | | 2.20 | | | | | | 18 | |
| | | 10.14 | | | | | | (7.63 | ) | | | | | 1,246 | | | | | | 0.69 | | | | | | 0.76 | | | | | | 1.39 | | | | | | 18 | |
| | | 10.13 | | | | | | (7.25 | ) | | | | | 539 | | | | | | 0.34 | | | | | | 0.41 | | | | | | 2.45 | | | | | | 18 | |
| | | 10.16 | | | | | | (7.71 | ) | | | | | 5,073 | | | | | | 0.84 | | | | | | 0.91 | | | | | | 1.91 | | | | | | 18 | |
| | |
| The accompanying notes are an integral part of these financial statements. | | 57 |
GOLDMAN SACHS GROWTH AND INCOME STRATEGY PORTFOLIO
Financial Highlights
Selected Data for a Share Outstanding Throughout Each Year
| | | | | | | | | | | | | | | | | | | | | | |
| | | | | | | | From
investment operations | | | | |
| | | Year - Share Class | | Net asset
value,
beginning
of year | | | Net
investment
income (loss)(a)(b) | | | Net realized
and unrealized
gain (loss) | | | Total from
investment
operations | | | Distributions
to shareholders
from net
investment
income | |
| | FOR THE FISCAL YEARS ENDED DECEMBER 31, | |
| | 2015 - A | | $ | 12.10 | | | $ | 0.25 | | | $ | (0.31 | ) | | $ | (0.06 | ) | | $ | (0.42 | ) |
| | 2015 - C | | | 11.91 | | | | 0.16 | | | | (0.31 | ) | | | (0.15 | ) | | | (0.34 | ) |
| | 2015 - Institutional | | | 12.14 | | | | 0.32 | | | | (0.33 | ) | | | (0.01 | ) | | | (0.47 | ) |
| | 2015 - Service | | | 12.07 | | | | 0.25 | | | | (0.32 | ) | | | (0.07 | ) | | | (0.40 | ) |
| | 2015 - IR | | | 12.05 | | | | 0.29 | | | | (0.32 | ) | | | (0.03 | ) | | | (0.45 | ) |
| | 2015 - R | | | 12.03 | | | | 0.23 | | | | (0.31 | ) | | | (0.08 | ) | | | (0.39 | ) |
| | 2015 - R6 (Commenced July 31, 2015) | | | 12.42 | | | | 0.26 | | | | (0.62 | ) | | | (0.36 | ) | | | (0.40 | ) |
| | 2014 - A | | | 12.14 | | | | 0.20 | | | | 0.07 | | | | 0.27 | | | | (0.31 | ) |
| | 2014 - C | | | 11.99 | | | | 0.10 | | | | 0.08 | | | | 0.18 | | | | (0.26 | ) |
| | 2014 - Institutional | | | 12.18 | | | | 0.26 | | | | 0.06 | | | | 0.32 | | | | (0.36 | ) |
| | 2014 - Service | | | 12.11 | | | | 0.20 | | | | 0.06 | | | | 0.26 | | | | (0.30 | ) |
| | 2014 - IR | | | 12.09 | | | | 0.25 | | | | 0.05 | | | | 0.30 | | | | (0.34 | ) |
| | 2014 - R | | | 12.08 | | | | 0.16 | | | | 0.07 | | | | 0.23 | | | | (0.28 | ) |
| | 2013 - A | | | 10.95 | | | | 0.20 | | | | 1.23 | | | | 1.43 | | | | (0.24 | ) |
| | 2013 - C | | | 10.85 | | | | 0.12 | | | | 1.22 | | | | 1.34 | | | | (0.20 | ) |
| | 2013 - Institutional | | | 10.98 | | | | 0.28 | | | | 1.21 | | | | 1.49 | | | | (0.29 | ) |
| | 2013 - Service | | | 10.92 | | | | 0.20 | | | | 1.23 | | | | 1.43 | | | | (0.24 | ) |
| | 2013 - IR | | | 10.91 | | | | 0.29 | | | | 1.16 | | | | 1.45 | | | | (0.27 | ) |
| | 2013 - R | | | 10.90 | | | | 0.16 | | | | 1.24 | | | | 1.40 | | | | (0.22 | ) |
| | 2012 - A | | | 9.98 | | | | 0.17 | | | | 1.07 | | | | 1.24 | | | | (0.27 | ) |
| | 2012 - C | | | 9.92 | | | | 0.09 | | | | 1.04 | | | | 1.13 | | | | (0.20 | ) |
| | 2012 - Institutional | | | 10.02 | | | | 0.24 | | | | 1.03 | | | | 1.27 | | | | (0.31 | ) |
| | 2012 - Service | | | 9.97 | | | | 0.17 | | | | 1.04 | | | | 1.21 | | | | (0.26 | ) |
| | 2012 - IR | | | 9.95 | | | | 0.20 | | | | 1.05 | | | | 1.25 | | | | (0.29 | ) |
| | 2012 - R | | | 9.94 | | | | 0.16 | | | | 1.04 | | | | 1.20 | | | | (0.24 | ) |
| | 2011 - A | | | 10.55 | | | | 0.17 | | | | (0.53 | ) | | | (0.36 | ) | | | (0.21 | ) |
| | 2011 - C | | | 10.49 | | | | 0.10 | | | | (0.53 | ) | | | (0.43 | ) | | | (0.14 | ) |
| | 2011 - Institutional | | | 10.59 | | | | 0.22 | | | | (0.54 | ) | | | (0.32 | ) | | | (0.25 | ) |
| | 2011 - Service | | | 10.53 | | | | 0.17 | | | | (0.53 | ) | | | (0.36 | ) | | | (0.20 | ) |
| | 2011 - IR | | | 10.52 | | | | 0.40 | | | | (0.73 | ) | | | (0.33 | ) | | | (0.24 | ) |
| | 2011 - R | | | 10.52 | | | | 0.18 | | | | (0.57 | ) | | | (0.39 | ) | | | (0.19 | ) |
| | (a) | | Calculated based on the average shares outstanding methodology. |
| | (b) | | Recognition of net investment income by the Portfolio is affected by the timing of declaration of dividends by the Underlying Funds in which the Portfolio invests. |
| | (c) | | Assumes investment at the NAV at the beginning of the year, reinvestment of all dividends and distributions, a complete redemption of the investment at the NAV at the end of the year and no sales or redemption charges. Total returns would be reduced if a sales or redemption charge was taken into account. Returns do not reflect the deduction of taxes that a shareholder would pay on Portfolio distributions or the redemption of Portfolio shares. Total returns for periods less than one full year are not annualized. |
| | (d) | | Expense ratios exclude the expenses of the Underlying Funds in which the Portfolio invests. |
| | (e) | | The Portfolio’s portfolio turnover rate is calculated in accordance with regulatory requirements, without regard to transactions involving short term investments. If such transactions were included, the Portfolio’s portfolio turnover rate may be higher. |
| | |
| 58 | | The accompanying notes are an integral part of these financial statements. |
GOLDMAN SACHS GROWTH AND INCOME STRATEGY PORTFOLIO
| | | | | | | | | | | | | | | | | | | | | | | | | | | | | | | | | | | | | | | | |
| | | | | | | | | | | | | | | | | | | | | | | | | | | | | | | | | | |
| | | Net asset
value, end
of year | | | | | Total
return(c) | | | | | Net assets,
end of
year
(in 000s) | | | | | Ratio of
net expenses
to average
net assets(d) | | | | | Ratio of
total expenses
to average
net assets(d) | | | | | Ratio of
net investment
income (loss)
to average
net assets(b) | | | | | Portfolio
turnover
rate(e) | |
| | | | | | | | | | | | | | | | | | | | | | | | | | | | | | | | | | | | | | | | |
| | $ | 11.62 | | | | | | (0.54 | )% | | | | $ | 341,468 | | | | | | 0.59 | % | | | | | 0.63 | % | | | | | 2.08 | % | | | | | 40 | % |
| | | 11.42 | | | | | | (1.24 | ) | | | | | 143,257 | | | | | | 1.34 | | | | | | 1.38 | | | | | | 1.30 | | | | | | 40 | |
| | | 11.66 | | | | | | (0.13 | ) | | | | | 429,243 | | | | | | 0.19 | | | | | | 0.23 | | | | | | 2.59 | | | | | | 40 | |
| | | 11.60 | | | | | | (0.56 | ) | | | | | 3,246 | | | | | | 0.69 | | | | | | 0.73 | | | | | | 2.03 | | | | | | 40 | |
| | | 11.57 | | | | | | (0.29 | ) | | | | | 3,085 | | | | | | 0.34 | | | | | | 0.38 | | | | | | 2.42 | | | | | | 40 | |
| | | 11.56 | | | | | | (0.69 | ) | | | | | 2,330 | | | | | | 0.84 | | | | | | 0.88 | | | | | | 1.89 | | | | | | 40 | |
| | | 11.66 | | | | | | (2.87 | ) | | | | | 10 | | | | | | 0.19 | (f) | | | | | 0.21 | (f) | | | | | 5.04 | (f) | | | | | 40 | |
| | | 12.10 | | | | | | 2.22 | | | | | | 408,488 | | | | | | 0.60 | | | | | | 0.63 | | | | | | 1.64 | | | | | | 35 | |
| | | 11.91 | | | | | | 1.46 | | | | | | 169,745 | | | | | | 1.35 | | | | | | 1.38 | | | | | | 0.80 | | | | | | 35 | |
| | | 12.14 | | | | | | 2.62 | | | | | | 421,720 | | | | | | 0.20 | | | | | | 0.23 | | | | | | 2.11 | | | | | | 35 | |
| | | 12.07 | | | | | | 2.11 | | | | | | 3,725 | | | | | | 0.70 | | | | | | 0.73 | | | | | | 1.58 | | | | | | 35 | |
| | | 12.05 | | | | | | 2.49 | | | | | | 3,478 | | | | | | 0.35 | | | | | | 0.38 | | | | | | 2.00 | | | | | | 35 | |
| | | 12.03 | | | | | | 1.97 | | | | | | 2,438 | | | | | | 0.85 | | | | | | 0.88 | | | | | | 1.27 | | | | | | 35 | |
| | | 12.14 | | | | | | 13.10 | | | | | | 435,812 | | | | | | 0.60 | | | | | | 0.63 | | | | | | 1.74 | | | | | | 50 | |
| | | 11.99 | | | | | | 12.32 | | | | | | 196,121 | | | | | | 1.34 | | | | | | 1.38 | | | | | | 1.02 | | | | | | 50 | |
| | | 12.18 | | | | | | 13.63 | | | | | | 353,203 | | | | | | 0.20 | | | | | | 0.23 | | | | | | 2.36 | | | | | | 50 | |
| | | 12.11 | | | | | | 13.08 | | | | | | 3,917 | | | | | | 0.70 | | | | | | 0.73 | | | | | | 1.71 | | | | | | 50 | |
| | | 12.09 | | | | | | 13.36 | | | | | | 2,796 | | | | | | 0.35 | | | | | | 0.38 | | | | | | 2.46 | | | | | | 50 | |
| | | 12.08 | | | | | | 12.76 | | | | | | 3,430 | | | | | | 0.85 | | | | | | 0.88 | | | | | | 1.42 | | | | | | 50 | |
| | | 10.95 | | | | | | 12.40 | | | | | | 491,921 | �� | | | | | 0.59 | | | | | | 0.63 | | | | | | 1.61 | | | | | | 47 | |
| | | 10.85 | | | | | | 11.42 | | | | | | 210,201 | | | | | | 1.34 | | | | | | 1.38 | | | | | | 0.89 | | | | | | 47 | |
| | | 10.98 | | | | | | 12.69 | | | | | | 267,744 | | | | | | 0.19 | | | | | | 0.22 | | | | | | 2.21 | | | | | | 47 | |
| | | 10.92 | | | | | | 12.13 | | | | | | 3,848 | | | | | | 0.69 | | | | | | 0.73 | | | | | | 1.59 | | | | | | 47 | |
| | | 10.91 | | | | | | 12.62 | | | | | | 1,519 | | | | | | 0.34 | | | | | | 0.38 | | | | | | 1.90 | | | | | | 47 | |
| | | 10.90 | | | | | | 12.12 | | | | | | 4,068 | | | | | | 0.84 | | | | | | 0.88 | | | | | | 1.54 | | | | | | 47 | |
| | | 9.98 | | | | | | (3.46 | ) | | | | | 750,376 | | | | | | 0.59 | | | | | | 0.62 | | | | | | 1.62 | | | | | | 35 | |
| | | 9.92 | | | | | | (4.10 | ) | | | | | 250,381 | | | | | | 1.34 | | | | | | 1.37 | | | | | | 0.91 | | | | | | 35 | |
| | | 10.02 | | | | | | (3.04 | ) | | | | | 140,119 | | | | | | 0.19 | | | | | | 0.22 | | | | | | 2.12 | | | | | | 35 | |
| | | 9.97 | | | | | | (3.48 | ) | | | | | 4,073 | | | | | | 0.69 | | | | | | 0.72 | | | | | | 1.57 | | | | | | 35 | |
| | | 9.95 | | | | | | (3.18 | ) | | | | | 1,719 | | | | | | 0.34 | | | | | | 0.37 | | | | | | 3.99 | | | | | | 35 | |
| | | 9.94 | | | | | | (3.77 | ) | | | | | 4,384 | | | | | | 0.84 | | | | | | 0.87 | | | | | | 1.68 | | | | | | 35 | |
| | |
| The accompanying notes are an integral part of these financial statements. | | 59 |
GOLDMAN SACHS GROWTH STRATEGY PORTFOLIO
Financial Highlights
Selected Data for a Share Outstanding Throughout Each Year
| | | | | | | | | | | | | | | | | | | | | | |
| | | | | | From
investment operations | | | | |
| | | Year - Share Class | | Net asset
value,
beginning
of year | | | Net
investment
income (loss)(a)(b) | | | Net realized
and unrealized
gain (loss) | | | Total from
investment
operations | | | Distributions
to shareholders
from net
investment
income | |
| | FOR THE FISCAL YEARS ENDED DECEMBER 31, | |
| | 2015 - A | | $ | 12.91 | | | $ | 0.15 | | | $ | (0.16 | ) | | $ | (0.01 | ) | | $ | (0.20 | ) |
| | 2015 - C | | | 12.88 | | | | 0.05 | | | | (0.15 | ) | | | (0.10 | ) | | | (0.10 | ) |
| | 2015 - Institutional | | | 12.90 | | | | 0.22 | | | | (0.17 | ) | | | 0.05 | | | | (0.26 | ) |
| | 2015 - Service | | | 12.88 | | | | 0.14 | | | | (0.16 | ) | | | (0.02 | ) | | | (0.19 | ) |
| | 2015 - IR | | | 12.73 | | | | 0.19 | | | | (0.16 | ) | | | 0.03 | | | | (0.24 | ) |
| | 2015 - R | | | 12.62 | | | | 0.12 | | | | (0.16 | ) | | | (0.04 | ) | | | (0.17 | ) |
| | 2015 - R6 (Commenced July 31, 2015) | | | 13.44 | | | | 0.18 | | | | (0.68 | ) | | | (0.50 | ) | | | (0.26 | ) |
| | 2014 - A | | | 12.89 | | | | 0.19 | | | | 0.12 | | | | 0.31 | | | | (0.29 | ) |
| | 2014 - C | | | 12.85 | | | | 0.07 | | | | 0.13 | | | | 0.20 | | | | (0.17 | ) |
| | 2014 - Institutional | | | 12.88 | | | | 0.24 | | | | 0.12 | | | | 0.36 | | | | (0.34 | ) |
| | 2014 - Service | | | 12.84 | | | | 0.15 | | | | 0.15 | | | | 0.30 | | | | (0.26 | ) |
| | 2014 - IR | | | 12.72 | | | | 0.25 | | | | 0.08 | | | | 0.33 | | | | (0.32 | ) |
| | 2014 - R | | | 12.59 | | | | 0.11 | | | | 0.15 | | | | 0.26 | | | | (0.23 | ) |
| | 2013 - A | | | 11.05 | | | | 0.14 | | | | 1.88 | | | | 2.02 | | | | (0.18 | ) |
| | 2013 - C | | | 11.02 | | | | 0.05 | | | | 1.86 | | | | 1.91 | | | | (0.08 | ) |
| | 2013 - Institutional | | | 11.04 | | | | 0.21 | | | | 1.87 | | | | 2.08 | | | | (0.24 | ) |
| | 2013 - Service | | | 11.01 | | | | 0.14 | | | | 1.86 | | | | 2.00 | | | | (0.17 | ) |
| | 2013 - IR | | | 10.91 | | | | 0.26 | | | | 1.77 | | | | 2.03 | | | | (0.22 | ) |
| | 2013 - R | | | 10.80 | | | | 0.10 | | | | 1.84 | | | | 1.94 | | | | (0.15 | ) |
| | 2012 - A | | | 9.86 | | | | 0.18 | | | | 1.25 | | | | 1.43 | | | | (0.24 | ) |
| | 2012 - C | | | 9.83 | | | | 0.10 | | | | 1.25 | | | | 1.35 | | | | (0.16 | ) |
| | 2012 - Institutional | | | 9.87 | | | | 0.23 | | | | 1.24 | | | | 1.47 | | | | (0.30 | ) |
| | 2012 - Service | | | 9.83 | | | | 0.17 | | | | 1.25 | | | | 1.42 | | | | (0.24 | ) |
| | 2012 - IR | | | 9.75 | | | | 0.22 | | | | 1.22 | | | | 1.44 | | | | (0.28 | ) |
| | 2012 - R | | | 9.65 | | | | 0.17 | | | | 1.21 | | | | 1.38 | | | | (0.23 | ) |
| | 2011 - A | | | 10.75 | | | | 0.19 | | | | (0.84 | ) | | | (0.65 | ) | | | (0.24 | ) |
| | 2011 - C | | | 10.70 | | | | 0.11 | | | | (0.83 | ) | | | (0.72 | ) | | | (0.15 | ) |
| | 2011 - Institutional | | | 10.77 | | | | 0.22 | | | | (0.83 | ) | | | (0.61 | ) | | | (0.29 | ) |
| | 2011 - Service | | | 10.72 | | | | 0.18 | | | | (0.84 | ) | | | (0.66 | ) | | | (0.23 | ) |
| | 2011 - IR | | | 10.65 | | | | 0.30 | | | | (0.92 | ) | | | (0.62 | ) | | | (0.28 | ) |
| | 2011 - R | | | 10.55 | | | | 0.20 | | | | (0.87 | ) | | | (0.67 | ) | | | (0.23 | ) |
| | (a) | | Calculated based on the average shares outstanding methodology. |
| | (b) | | Recognition of net investment income by the Portfolio is affected by the timing of declaration of dividends by the Underlying Funds in which the Portfolio invests. |
| | (c) | | Assumes investment at the NAV at the beginning of the year, reinvestment of all dividends and distributions, a complete redemption of the investment at the NAV at the end of the year and no sales or redemption charges. Total returns would be reduced if a sales or redemption charge was taken into account. Returns do not reflect the deduction of taxes that a shareholder would pay on Portfolio distributions or the redemption of Portfolio shares. Total returns for periods less than one full year are not annualized. |
| | (d) | | Expense ratios exclude the expenses of the Underlying Funds in which the Portfolio invests. |
| | (e) | | The Portfolio’s portfolio turnover rate is calculated in accordance with regulatory requirements, without regard to transactions involving short term investments. If such transactions were included, the Portfolio’s portfolio turnover rate may be higher. |
| | |
| 60 | | The accompanying notes are an integral part of these financial statements. |
GOLDMAN SACHS GROWTH STRATEGY PORTFOLIO
| | | | | | | | | | | | | | | | | | | | | | | | | | | | | | | | | | | | | | | | |
| | | | | | | | | | | | | | | | | | | | | | | | | | | | | | | | | | |
| | | Net asset
value, end
of year | | | | | Total
return(c) | | | | | Net assets,
end of
year
(in 000s) | | | | | Ratio of
net expenses
to average
net assets(d) | | | | | Ratio of
total expenses
to average
net assets(d) | | | | | Ratio of
net investment
income (loss)
to average
net assets(b) | | | | | Portfolio
turnover
rate(e) | |
| | | | | | | | | | | | | | | | | | | | | | | | | | | | | | | | | | | | | | | | |
| | $ | 12.70 | | | | | | (0.08 | )% | | | | $ | 336,880 | | | | | | 0.59 | % | | | | | 0.64 | % | | | | | 1.15 | % | | | | | 38 | % |
| | | 12.68 | | | | | | (0.82 | ) | | | | | 161,733 | | | | | | 1.34 | | | | | | 1.39 | | | | | | 0.39 | | | | | | 38 | |
| | | 12.69 | | | | | | 0.35 | | | | | | 303,237 | | | | | | 0.19 | | | | | | 0.23 | | | | | | 1.68 | | | | | | 38 | |
| | | 12.67 | | | | | | (0.17 | ) | | | | | 2,135 | | | | | | 0.69 | | | | | | 0.74 | | | | | | 1.09 | | | | | | 38 | |
| | | 12.52 | | | | | | 0.20 | | | | | | 4,114 | | | | | | 0.34 | | | | | | 0.39 | | | | | | 1.50 | | | | | | 38 | |
| | | 12.41 | | | | | | (0.31 | ) | | | | | 2,323 | | | | | | 0.84 | | | | | | 0.89 | | | | | | 0.95 | | | | | | 38 | |
| | | 12.68 | | | | | | (3.66 | ) | | | | | 10 | | | | | | 0.21 | (f) | | | | | 0.25 | (f) | | | | | 3.22 | (f) | | | | | 38 | |
| | | 12.91 | | | | | | 2.36 | | | | | | 385,409 | | | | | | 0.60 | | | | | | 0.64 | | | | | | 1.46 | | | | | | 26 | |
| | | 12.88 | | | | | | 1.59 | | | | | | 190,125 | | | | | | 1.35 | | | | | | 1.39 | �� | | | | | 0.57 | | | | | | 26 | |
| | | 12.90 | | | | | | 2.76 | | | | | | 267,677 | | | | | | 0.20 | | | | | | 0.24 | | | | | | 1.84 | | | | | | 26 | |
| | | 12.88 | | | | | | 2.32 | | | | | | 2,509 | | | | | | 0.70 | | | | | | 0.74 | | | | | | 1.11 | | | | | | 26 | |
| | | 12.73 | | | | | | 2.58 | | | | | | 4,496 | | | | | | 0.35 | | | | | | 0.39 | | | | | | 1.92 | | | | | | 26 | |
| | | 12.62 | | | | | | 2.06 | | | | | | 2,461 | | | | | | 0.85 | | | | | | 0.89 | | | | | | 0.84 | | | | | | 26 | |
| | | 12.89 | | | | | | 18.31 | | | | | | 389,445 | | | | | | 0.60 | | | | | | 0.64 | | | | | | 1.19 | | | | | | 32 | |
| | | 12.85 | | | | | | 17.37 | | | | | | 218,776 | | | | | | 1.35 | | | | | | 1.39 | | | | | | 0.42 | | | | | | 32 | |
| | | 12.88 | | | | | | 18.81 | | | | | | 246,229 | | | | | | 0.20 | | | | | | 0.24 | | | | | | 1.77 | | | | | | 32 | |
| | | 12.84 | | | | | | 18.19 | | | | | | 3,419 | | | | | | 0.70 | | | | | | 0.74 | | | | | | 1.14 | | | | | | 32 | |
| | | 12.72 | | | | | | 18.65 | | | | | | 3,598 | | | | | | 0.35 | | | | | | 0.39 | | | | | | 2.17 | | | | | | 32 | |
| | | 12.59 | | | | | | 17.93 | | | | | | 4,208 | | | | | | 0.85 | | | | | | 0.89 | | | | | | 0.84 | | | | | | 32 | |
| | | 11.05 | | | | | | 14.49 | | | | | | 398,487 | | | | | | 0.59 | | | | | | 0.64 | | | | | | 1.65 | | | | | | 47 | |
| | | 11.02 | | | | | | 13.72 | | | | | | 224,471 | | | | | | 1.34 | | | | | | 1.39 | | | | | | 0.92 | | | | | | 47 | |
| | | 11.04 | | | | | | 14.89 | | | | | | 173,180 | | | | | | 0.19 | | | | | | 0.23 | | | | | | 2.10 | | | | | | 47 | |
| | | 11.01 | | | | | | 14.42 | | | | | | 3,185 | | | | | | 0.69 | | | | | | 0.74 | | | | | | 1.60 | | | | | | 47 | |
| | | 10.91 | | | | | | 14.79 | | | | | | 1,483 | | | | | | 0.34 | | | | | | 0.38 | | | | | | 2.05 | | | | | | 47 | |
| | | 10.80 | | | | | | 14.31 | | | | | | 4,885 | | | | | | 0.84 | | | | | | 0.88 | | | | | | 1.64 | | | | | | 47 | |
| | | 9.86 | | | | | | (6.08 | ) | | | | | 562,262 | | | | | | 0.59 | | | | | | 0.63 | | | | | | 1.73 | | | | | | 35 | |
| | | 9.83 | | | | | | (6.77 | ) | | | | | 257,778 | | | | | | 1.34 | | | | | | 1.38 | | | | | | 0.99 | | | | | | 35 | |
| | | 9.87 | | | | | | (5.69 | ) | | | | | 92,807 | | | | | | 0.19 | | | | | | 0.23 | | | | | | 2.08 | | | | | | 35 | |
| | | 9.83 | | | | | | (6.18 | ) | | | | | 3,644 | | | | | | 0.69 | | | | | | 0.73 | | | | | | 1.65 | | | | | | 35 | |
| | | 9.75 | | | | | | (5.85 | ) | | | | | 1,376 | | | | | | 0.34 | | | | | | 0.38 | | | | | | 2.90 | | | | | | 35 | |
| | | 9.65 | | | | | | (6.39 | ) | | | | | 4,413 | | | | | | 0.84 | | | | | | 0.88 | | | | | | 1.88 | | | | | | 35 | |
| | |
| The accompanying notes are an integral part of these financial statements. | | 61 |
GOLDMAN SACHS SATELLITE STRATEGIES PORTFOLIO
Financial Highlights
Selected Data for a Share Outstanding Throughout Each Year
| | | | | | | | | | | | | | | | | | | | | | | | | | | | | | |
| | | | | | From
investment operations | | | Distributions
to shareholders | |
| | | Year - Share Class | | Net asset
value,
beginning
of year | | | Net
investment
income(a)(b) | | | Net realized
and unrealized
gain (loss) | | | Total from
investment
operations | | | From net
investment
income | | | From net
realized
gains | | | Total
distributions | |
| | FOR THE FISCAL YEARS ENDED DECEMBER 31, | |
| | 2015 - A | | $ | 7.89 | | | $ | 0.19 | | | $ | (0.44 | ) | | $ | (0.25 | ) | | $ | (0.19 | ) | | $ | — | | | $ | (0.19 | ) |
| | 2015 - C | | | 7.84 | | | | 0.13 | | | | (0.43 | ) | | | (0.30 | ) | | | (0.13 | ) | | | — | | | | (0.13 | ) |
| | 2015 - Institutional | | | 7.87 | | | | 0.23 | | | | (0.45 | ) | | | (0.22 | ) | | | (0.22 | ) | | | — | | | | (0.22 | ) |
| | 2015 - Service | | | 7.84 | | | | 0.14 | | | | (0.40 | ) | | | (0.26 | ) | | | (0.15 | ) | | | — | | | | (0.15 | ) |
| | 2015 - IR | | | 7.87 | | | | 0.21 | | | | (0.44 | ) | | | (0.23 | ) | | | (0.21 | ) | | | — | | | | (0.21 | ) |
| | 2015 - R | | | 7.86 | | | | 0.18 | | | | (0.45 | ) | | | (0.27 | ) | | | (0.17 | ) | | | — | | | | (0.17 | ) |
| | 2015 - R6 (Commenced July 31, 2015) | | | 7.91 | | | | 0.11 | | | | (0.46 | ) | | | (0.35 | ) | | | (0.12 | ) | | | — | | | | (0.12 | ) |
| | 2014 - A | | | 8.16 | | | | 0.21 | | | | (0.23 | ) | | | (0.02 | ) | | | (0.21 | ) | | | (0.04 | ) | | | (0.25 | ) |
| | 2014 - C | | | 8.12 | | | | 0.15 | | | | (0.24 | ) | | | (0.09 | ) | | | (0.15 | ) | | | (0.04 | ) | | | (0.19 | ) |
| | 2014 - Institutional | | | 8.15 | | | | 0.25 | | | | (0.24 | ) | | | 0.01 | | | | (0.25 | ) | | | (0.04 | ) | | | (0.29 | ) |
| | 2014 - Service | | | 8.12 | | | | 0.19 | | | | (0.22 | ) | | | (0.03 | ) | | | (0.21 | ) | | | (0.04 | ) | | | (0.25 | ) |
| | 2014 - IR | | | 8.15 | | | | 0.23 | | | | (0.24 | ) | | | (0.01 | ) | | | (0.23 | ) | | | (0.04 | ) | | | (0.27 | ) |
| | 2014 - R | | | 8.13 | | | | 0.18 | | | | (0.22 | ) | | | (0.04 | ) | | | (0.19 | ) | | | (0.04 | ) | | | (0.23 | ) |
| | 2013 - A | | | 8.22 | | | | 0.25 | | | | (0.04 | ) | | | 0.21 | | | | (0.27 | ) | | | — | | | | (0.27 | ) |
| | 2013 - C | | | 8.18 | | | | 0.19 | | | | (0.04 | ) | | | 0.15 | | | | (0.21 | ) | | | — | | | | (0.21 | ) |
| | 2013 - Institutional | | | 8.21 | | | | 0.29 | | | | (0.04 | ) | | | 0.25 | | | | (0.31 | ) | | | — | | | | (0.31 | ) |
| | 2013 - Service | | | 8.19 | | | | 0.24 | | | | (0.04 | ) | | | 0.20 | | | | (0.27 | ) | | | — | | | | (0.27 | ) |
| | 2013 - IR | | | 8.21 | | | | 0.28 | | | | (0.04 | ) | | | 0.24 | | | | (0.30 | ) | | | — | | | | (0.30 | ) |
| | 2013 - R | | | 8.19 | | | | 0.24 | | | | (0.04 | ) | | | 0.20 | | | | (0.26 | ) | | | — | | | | (0.26 | ) |
| | 2012 - A | | | 7.39 | | | | 0.33 | | | | 0.86 | | | | 1.19 | | | | (0.34 | ) | | | (0.02 | ) | | | (0.36 | ) |
| | 2012 - C | | | 7.36 | | | | 0.26 | | | | 0.86 | | | | 1.12 | | | | (0.28 | ) | | | (0.02 | ) | | | (0.30 | ) |
| | 2012 - Institutional | | | 7.38 | | | | 0.36 | | | | 0.86 | | | | 1.22 | | | | (0.37 | ) | | | (0.02 | ) | | | (0.39 | ) |
| | 2012 - Service | | | 7.36 | | | | 0.32 | | | | 0.87 | | | | 1.19 | | | | (0.34 | ) | | | (0.02 | ) | | | (0.36 | ) |
| | 2012 - IR | | | 7.38 | | | | 0.35 | | | | 0.86 | | | | 1.21 | | | | (0.36 | ) | | | (0.02 | ) | | | (0.38 | ) |
| | 2012 - R | | | 7.37 | | | | 0.31 | | | | 0.86 | | | | 1.17 | | | | (0.33 | ) | | | (0.02 | ) | | | (0.35 | ) |
| | 2011 - A | | | 7.95 | | | | 0.28 | | | | (0.53 | ) | | | (0.25 | ) | | | (0.28 | ) | | | (0.03 | ) | | | (0.31 | ) |
| | 2011 - C | | | 7.92 | | | | 0.23 | | | | (0.53 | ) | | | (0.30 | ) | | | (0.23 | ) | | | (0.03 | ) | | | (0.26 | ) |
| | 2011 - Institutional | | | 7.94 | | | | 0.32 | | | | (0.53 | ) | | | (0.21 | ) | | | (0.32 | ) | | | (0.03 | ) | | | (0.35 | ) |
| | 2011 - Service | | | 7.92 | | | | 0.28 | | | | (0.53 | ) | | | (0.25 | ) | | | (0.28 | ) | | | (0.03 | ) | | | (0.31 | ) |
| | 2011 - IR | | | 7.94 | | | | 0.32 | | | | (0.54 | ) | | | (0.22 | ) | | | (0.31 | ) | | | (0.03 | ) | | | (0.34 | ) |
| | 2011 - R | | | 7.93 | | | | 0.26 | | | | (0.52 | ) | | | (0.26 | ) | | | (0.27 | ) | | | (0.03 | ) | | | (0.30 | ) |
| | (a) | | Calculated based on the average shares outstanding methodology. |
| | (b) | | Recognition of net investment income by the Portfolio is affected by the timing of declaration of dividends by the Underlying Funds in which the Portfolio invests. |
| | (c) | | Assumes investment at the NAV at the beginning of the year, reinvestment of all dividends and distributions, a complete redemption of the investment at the NAV at the end of the year and no sales or redemption charges. Total returns would be reduced if a sales or redemption charge was taken into account. Returns do not reflect the deduction of taxes that a shareholder would pay on Portfolio distributions or the redemption of Portfolio shares. Total returns for periods less than one full year are not annualized. |
| | (d) | | Expense ratios exclude the expenses of the Underlying Funds in which the Portfolio invests. |
| | (e) | | The Portfolio’s portfolio turnover rate is calculated in accordance with regulatory requirements, without regard to transactions involving short term investments. If such transactions were included, the Portfolio’s portfolio turnover rate may be higher. |
| | (g) | | Amount is less than 0.005%. |
| | |
| 62 | | The accompanying notes are an integral part of these financial statements. |
GOLDMAN SACHS SATELLITE STRATEGIES PORTFOLIO
| | | | | | | | | | | | | | | | | | | | | | | | | | | | | | | | | | | | | | | | |
| | | | | | | | | | | | | | | | | | | | | | | | | | | | | | | | | | |
| | | Net asset
value, end
of year | | | | | Total
return(c) | | | | | Net assets,
end of
year
(in 000s) | | | | | Ratio of
net expenses
to average
net assets(d) | | | | | Ratio of
total expenses
to average
net assets(d) | | | | | Ratio of
net investment
income
to average
net assets(b) | | | | | Portfolio
turnover
rate(e) | |
| | | | | | | | | | | | | | | | | | | | | | | | | | | | | | | | | | | | | | | | |
| | $ | 7.45 | | | | | | (3.24 | )% | | $ | | | 118,345 | | | | | | 0.57 | % | | | | | 0.60 | % | | | | | 2.43 | % | | | | | 22 | % |
| | | 7.41 | | | | | | (3.89 | ) | | | | | 68,765 | | | | | | 1.32 | | | | | | 1.35 | | | | | | 1.66 | | | | | | 22 | |
| | | 7.43 | | | | | | (2.84 | ) | | | | | 655,268 | | | | | | 0.17 | | | | | | 0.20 | | | | | | 2.85 | | | | | | 22 | |
| | | 7.43 | | | | | | (3.32 | ) | | | | | 988 | | | | | | 0.67 | | | | | | 0.70 | | | | | | 1.81 | | | | | | 22 | |
| | | 7.43 | | | | | | (2.99 | ) | | | | | 67,547 | | | | | | 0.32 | | | | | | 0.35 | | | | | | 2.69 | | | | | | 22 | |
| | | 7.42 | | | | | | (3.49 | ) | | | | | 3,119 | | | | | | 0.82 | | | | | | 0.85 | | | | | | 2.24 | | | | | | 22 | |
| | | 7.44 | | | | | | (4.43 | ) | | | | | 10 | | | | | | 0.15 | (f) | | | | | 0.18 | (f) | | | | | 3.58 | (f) | | | | | 22 | |
| | | 7.89 | | | | | | (0.28 | ) | | | | | 177,204 | | | | | | 0.58 | | | | | | 0.60 | | | | | | 2.50 | | | | | | 20 | |
| | | 7.84 | | | | | | (1.16 | ) | | | | | 102,605 | | | | | | 1.33 | | | | | | 1.35 | | | | | | 1.79 | | | | | | 20 | |
| | | 7.87 | | | | | | — | (g) | | | | | 833,657 | | | | | | 0.18 | | | | | | 0.20 | | | | | | 2.97 | | | | | | 20 | |
| | | 7.84 | | | | | | (0.39 | ) | | | | | 14,085 | | | | | | 0.68 | | | | | | 0.70 | | | | | | 2.30 | | | | | | 20 | |
| | | 7.87 | | | | | | (0.15 | ) | | | | | 86,018 | | | | | | 0.33 | | | | | | 0.35 | | | | | | 2.78 | | | | | | 20 | |
| | | 7.86 | | | | | | (0.54 | ) | | | | | 3,495 | | | | | | 0.83 | | | | | | 0.85 | | | | | | 2.23 | | | | | | 20 | |
| | | 8.16 | | | | | | 2.67 | | | | | | 231,868 | | | | | | 0.58 | | | | | | 0.60 | | | | | | 3.08 | | | | | | 36 | |
| | | 8.12 | | | | | | 1.91 | | | | | | 118,153 | | | | | | 1.33 | | | | | | 1.35 | | | | | | 2.35 | | | | | | 36 | |
| | | 8.15 | | | | | | 3.09 | | | | | | 853,543 | | | | | | 0.18 | | | | | | 0.20 | | | | | | 3.53 | | | | | | 36 | |
| | | 8.12 | | | | | | 2.45 | | | | | | 28,483 | | | | | | 0.68 | | | | | | 0.70 | | | | | | 2.96 | | | | | | 36 | |
| | | 8.15 | | | | | | 2.94 | | | | | | 91,493 | | | | | | 0.33 | | | | | | 0.35 | | | | | | 3.39 | | | | | | 36 | |
| | | 8.13 | | | | | | 2.44 | | | | | | 3,765 | | | | | | 0.83 | | | | | | 0.85 | | | | | | 2.91 | | | | | | 36 | |
| | | 8.22 | | | | | | 16.30 | | | | | | 250,407 | | | | | | 0.57 | | | | | | 0.60 | | | | | | 4.13 | | | | | | 14 | |
| | | 8.18 | | | | | | 15.37 | | | | | | 130,446 | | | | | | 1.32 | | | | | | 1.35 | | | | | | 3.32 | | | | | | 14 | |
| | | 8.21 | | | | | | 16.77 | | | | | | 803,541 | | | | | | 0.17 | | | | | | 0.20 | | | | | | 4.56 | | | | | | 14 | |
| | | 8.19 | | | | | | 16.26 | | | | | | 37,068 | | | | | | 0.67 | | | | | | 0.70 | | | | | | 4.04 | | | | | | 14 | |
| | | 8.21 | | | | | | 16.60 | | | | | | 74,216 | | | | | | 0.32 | | | | | | 0.35 | | | | | | 4.37 | | | | | | 14 | |
| | | 8.19 | | | | | | 15.96 | | | | | | 2,804 | | | | | | 0.82 | | | | | | 0.85 | | | | | | 3.86 | | | | | | 14 | |
| | | 7.39 | | | | | | (3.17 | ) | | | | | 201,416 | | | | | | 0.57 | | | | | | 0.61 | | | | | | 3.59 | | | | | | 35 | |
| | | 7.36 | | | | | | (3.88 | ) | | | | | 117,790 | | | | | | 1.32 | | | | | | 1.36 | | | | | | 2.88 | | | | | | 35 | |
| | | 7.38 | | | | | | (2.77 | ) | | | | | 590,521 | | | | | | 0.17 | | | | | | 0.21 | | | | | | 4.07 | | | | | | 35 | |
| | | 7.36 | | | | | | (3.26 | ) | | | | | 28,306 | | | | | | 0.67 | | | | | | 0.71 | | | | | | 3.54 | | | | | | 35 | |
| | | 7.38 | | | | | | (2.91 | ) | | | | | 58,940 | | | | | | 0.32 | | | | | | 0.36 | | | | | | 4.12 | | | | | | 35 | |
| | | 7.37 | | | | | | (3.42 | ) | | | | | 846 | | | | | | 0.82 | | | | | | 0.86 | | | | | | 3.33 | | | | | | 35 | |
| | |
| The accompanying notes are an integral part of these financial statements. | | 63 |
GOLDMAN SACHS FUND OF FUNDS PORTFOLIOS
Notes to Financial Statements
December 31, 2015
Goldman Sachs Trust (the “Trust”) is a Delaware statutory trust registered under the Investment Company Act of 1940, as amended (the “Act”), as an open-end management investment company. The following table lists those series of the Trust that are included in this report (collectively, the “Portfolios” or individually a “Portfolio”), along with their corresponding share classes and respective diversification status under the Act:
| | | | |
| Portfolio | | Share Classes Offered | | Diversified/
Non-diversified |
All Portfolios | | A, C, Institutional, Service, IR, R, R6 | | Diversified |
Class A Shares are sold with a front-end sales charge of up to 5.50%. Class C Shares are sold with a contingent deferred sales charge (“CDSC”) of 1.00%, which is imposed on redemptions made within 12 months of purchase. Institutional, Service, Class IR, Class R and Class R6 Shares are not subject to a sales charge.
Goldman Sachs Asset Management, L.P. (“GSAM”), an affiliate of Goldman, Sachs & Co. (“Goldman Sachs”), serves as investment adviser to the Portfolios pursuant to a management agreement (the “Agreement”) with the Trust.
The Portfolios are expected to invest primarily in a combination of domestic and international equity and fixed income underlying funds (“Underlying Funds”) which are registered under the Act, for which GSAM or Goldman Sachs Asset Management International (“GSAMI”), also an affiliate of Goldman Sachs, act as investment advisers.
|
| 2. SIGNIFICANT ACCOUNTING POLICIES |
The financial statements have been prepared in accordance with accounting principles generally accepted in the United States of America (“GAAP”) and require management to make estimates and assumptions that may affect the reported amounts and disclosures. Actual results may differ from those estimates and assumptions.
A. Investment Valuation — The valuation policy of the Portfolios and Underlying Funds is to value investments at fair value.
64
GOLDMAN SACHS FUND OF FUNDS PORTFOLIOS
|
| 2. SIGNIFICANT ACCOUNTING POLICIES (continued) |
B. Investment Income and Investments — Investment income includes interest income and dividend income, net of any foreign withholding taxes, less any amounts reclaimable. Interest income is accrued daily and adjusted for amortization of premiums and accretion of discounts. Dividend income is recognized on ex-dividend date or, for certain foreign securities, as soon as such information is obtained subsequent to the ex-dividend date. Investment transactions are reflected on trade date. Realized gains and losses are calculated using identified cost. Investment transactions are recorded on the following business day for daily net asset value (“NAV”) calculations. Any foreign capital gains tax is accrued daily based upon net unrealized gains, and is payable upon sale of such investments. Income distributions are recognized as capital gains or income in the financial statements in accordance with the character that is distributed.
C. Class Allocations and Expenses — Investment income, realized and unrealized gain (loss), and non-class specific expenses of each Portfolio are allocated daily based upon the proportion of net assets of each class. Class specific expenses, where applicable, are borne by the respective share classes and include Distribution and Service, Transfer Agency and Service and Shareholder Administration fees. Non-class specific expenses directly incurred by a Portfolio are charged to that Portfolio, while such expenses incurred by the Trust are allocated across the applicable Funds on a straight-line and/or pro-rata basis depending upon the nature of the expenses.
Expenses included in the accompanying financial statements reflect the expenses of each Portfolio and do not include any expenses associated with the Underlying Funds. Because the Underlying Funds have varied expense and fee levels and the Portfolios may own different proportions of the Underlying Funds at different times, the amount of fees and expenses incurred indirectly by each Portfolio will vary.
D. Federal Taxes and Distributions to Shareholders — It is each Portfolio’s policy to comply with the requirements of the Internal Revenue Code of 1986, as amended (the “Code”), applicable to regulated investment companies (mutual funds) and to distribute each year substantially all of its investment company taxable income and capital gains to its shareholders. Accordingly, the Portfolios are not required to make any provisions for the payment of federal income tax. Distributions to shareholders are recorded on the ex-dividend date. Income and capital gains distributions, if any, are declared and paid according to the following schedule:
| | | | | | |
| Portfolio | | | | Income Distributions
Declared/Paid | | Capital Gains Distributions
Declared/Paid |
Balanced Strategy, Growth and Income Strategy and Satellite Strategies | | | | Quarterly | | Annually |
Equity Growth Strategy and Growth Strategy | | | | Annually | | Annually |
65
GOLDMAN SACHS FUND OF FUNDS PORTFOLIOS
Notes to Financial Statements (continued)
December 31, 2015
|
| 2. SIGNIFICANT ACCOUNTING POLICIES (continued) |
Net capital losses are carried forward to future fiscal years and may be used to the extent allowed by the Code to offset any future capital gains. Utilization of capital loss carryforwards will reduce the requirement of future capital gains distributions.
Under the Regulated Investment Company Modernization Act of 2010, the Portfolios are permitted to carry forward capital losses incurred in taxable years beginning after December 22, 2010 for an unlimited period. However, any losses incurred during those future taxable years will be required to be utilized prior to the losses incurred in pre-enactment taxable years. As a result of this ordering rule, pre-enactment capital loss carryforwards may be more likely to expire unused. Additionally, post-enactment capital losses that are carried forward will retain their character as either short-term or long term capital losses rather than being considered all short-term as under previous law.
The characterization of distributions to shareholders for financial reporting purposes is determined in accordance with federal income tax rules, which may differ from GAAP. The source of each Portfolio’s distributions may be shown in the accompanying financial statements as either from net investment income, net realized gain or capital. Certain components of the Portfolios’ net assets on the Statements of Assets and Liabilities reflect permanent GAAP/tax differences based on the appropriate tax character.
| | |
| 3. INVESTMENTS AND FAIR VALUE MEASUREMENTS |
The fair value of a financial instrument is the amount that would be received to sell an asset or paid to transfer a liability in an orderly transaction between market participants at the measurement date (i.e., the exit price). GAAP establishes a fair value hierarchy that prioritizes the inputs to valuation techniques used to measure fair value. The hierarchy gives the highest priority to unadjusted quoted prices in active markets for identical assets or liabilities (Level 1 measurements) and the lowest priority to unobservable inputs (Level 3 measurements). The levels used for classifying investments are not necessarily an indication of the risk associated with investing in these investments. The three levels of the fair value hierarchy are described below:
Level 1 — Unadjusted quoted prices in active markets that are accessible at the measurement date for identical, unrestricted assets or liabilities;
Level 2 — Quoted prices in markets that are not active or financial instruments for which significant inputs are observable (including, but not limited to, quoted prices for similar investments, interest rates, foreign exchange rates, volatility and credit spreads), either directly or indirectly;
Level 3 — Prices or valuations that require significant unobservable inputs (including GSAM’s assumptions in determining fair value measurement).
66
GOLDMAN SACHS FUND OF FUNDS PORTFOLIOS
|
| 3. INVESTMENTS AND FAIR VALUE MEASUREMENTS (continued) |
Changes in valuation techniques may result in transfers into or out of an assigned level within the hierarchy. In accordance with the Portfolios’ policy, transfers between different levels of the fair value hierarchy resulting from such changes are deemed to have occurred as of the beginning of the reporting period.
The Board of Trustees ( “Trustees”) has approved Valuation Procedures that govern the valuation of the portfolio investments held by the Portfolios, including investments for which market quotations are not readily available. The Trustees have delegated to GSAM day-to-day responsibility for implementing and maintaining internal controls and procedures related to the valuation of the Portfolios’ portfolio investments. To assess the continuing appropriateness of pricing sources and methodologies, GSAM regularly performs price verification procedures and issues challenges as necessary to third party pricing vendors or brokers, and any differences are reviewed in accordance with the Valuation Procedures.
A. Level 1 and Level 2 Fair Value Investments — The valuation techniques and significant inputs used in determining the fair values for investments classified as Level 1 and Level 2 are as follows:
Underlying Funds — Investments in the Underlying Funds are valued at the NAV per share of the Institutional Share class of each Underlying Fund on the day of valuation. Because each Portfolio invests primarily in other mutual funds that fluctuate in value, the Portfolios’ shares will correspondingly fluctuate in value. These investments are generally classified as Level 1 of the fair value hierarchy. For information regarding an Underlying Fund’s accounting policies and investment holdings, please see the Underlying Fund’s shareholder report.
Short Term Investments — Short-term investments having a maturity of 60 days or less are generally valued at amortized cost which approximates fair market value. These investments are classified as Level 2 of the fair value hierarchy.
Repurchase Agreements — Repurchase agreements involve the purchase of securities subject to the seller’s agreement to repurchase the securities at a mutually agreed upon date and price, under the terms of a Master Repurchase Agreement (“MRA”). During the term of a repurchase agreement, the value of the underlying securities held as collateral on behalf of a Portfolio, including accrued interest, is required to exceed the value of the repurchase agreement, including accrued interest. The gross value of repurchase agreements is included in the Statements of Assets and Liabilities for financial reporting purposes. The underlying securities for all repurchase agreements are held at the Portfolios’ custodian or designated sub-custodians under tri-party repurchase agreements.
An MRA governs transactions between a Portfolio and select counterparties. An MRA contains provisions for, among other things, initiation of the transaction, income payments, events of default and maintenance of securities for repurchase agreements. An MRA also permits offsetting with collateral to create one single net payment in the event of default or similar events, including the bankruptcy or insolvency of a counterparty.
67
GOLDMAN SACHS FUND OF FUNDS PORTFOLIOS
Notes to Financial Statements (continued)
December 31, 2015
|
| 3. INVESTMENTS AND FAIR VALUE MEASUREMENTS (continued) |
If the seller defaults, a Portfolio could suffer a loss to the extent that the proceeds from the sale of the underlying securities and other collateral held by the Portfolio are less than the repurchase price and the Portfolio’s costs associated with delay and enforcement of the repurchase agreement. In addition, in the event of default or insolvency of the seller, a court could determine that a Portfolio’s interest in the collateral is not enforceable, resulting in additional losses to the Portfolio.
Pursuant to exemptive relief granted by the Securities and Exchange Commission (“SEC”) and terms and conditions contained therein, the Portfolios, together with other funds of the Trust and registered investment companies having management agreements with GSAM or its affiliates, may transfer uninvested cash into joint accounts, the daily aggregate balance of which is invested in one or more repurchase agreements. Under these joint accounts, the Portfolios maintain pro-rata credit exposure to the underlying repurchase agreements’ counterparties. With the exception of certain transaction fees, the Portfolios are not subject to any expenses in relation to these investments.
B. Level 3 Fair Value Investments — To the extent that the significant inputs to valuation models and other alternative pricing sources are unobservable, or if quotations are not readily available, or if GSAM believes that such quotations do not accurately reflect fair value, the fair value of the Portfolios’ investments may be determined under Valuation Procedures approved by the Trustees. GSAM, consistent with its procedures and applicable regulatory guidance, may make an adjustment to the most recent valuation prices of either domestic or foreign securities in light of significant events to reflect what it believes to be the fair value of the securities at the time of determining a Portfolio’s NAV. Significant events which could affect a large number of securities in a particular market may include, but are not limited to: significant fluctuations in U.S. or foreign markets; market dislocations; market disruptions; or unscheduled market closings. Significant events which could also affect a single issuer may include, but are not limited to: corporate actions such as reorganizations, mergers and buy-outs; ratings downgrades; and bankruptcies.
C. Fair Value Hierarchy — The following is a summary of the Portfolios’ investments and derivatives classified in the fair value hierarchy as of December 31, 2015:
| | | | | | | | | | | | |
| | | |
| BALANCED STRATEGY | | | | | | | | | | | | |
| | | |
| Investment Type | | Level 1 | | | Level 2 | | | Level 3 | |
| Assets | | | | | | | | | | | | |
Equity Underlying Funds | | $ | 142,057,888 | | | $ | — | | | $ | — | |
Fixed Income Underlying Funds | | | 233,599,248 | | | | — | | | | — | |
Dynamic Underlying Funds | | | 71,500,002 | | | | — | | | | — | |
Short-term Investments | | | — | | | | 900,000 | | | | — | |
| Total | | $ | 447,157,138 | | | $ | 900,000 | | | $ | — | |
68
GOLDMAN SACHS FUND OF FUNDS PORTFOLIOS
|
| 3. INVESTMENTS AND FAIR VALUE MEASUREMENTS (continued) |
| | | | | | | | | | | | |
| | | |
| EQUITY GROWTH STRATEGY PORTFOLIO | | | | | | | | | | | | |
| | | |
| Investment Type | | Level 1 | | | Level 2 | | | Level 3 | |
| Assets | | | | | | | | | | | | |
Equity Underlying Funds | | $ | 345,051,202 | | | $ | — | | | $ | — | |
| Total | | $ | 345,051,202 | | | $ | — | | | $ | — | |
| | | |
| GROWTH AND INCOME STRATEGY PORTFOLIO | | | | | | | | | | | | |
| | | |
| Investment Type | | Level 1 | | | Level 2 | | | Level 3 | |
| Assets | | | | | | | | | | | | |
Equity Underlying Funds | | $ | 492,947,923 | | | $ | — | | | $ | — | |
Fixed Income Underlying Funds | | | 289,282,520 | | | | — | | | | — | |
Dynamic Underlying Funds | | | 148,165,926 | | | | — | | | | — | |
Short-term Investments | | | — | | | | 5,000,000 | | | | — | |
| Total | | $ | 930,396,369 | | | $ | 5,000,000 | | | $ | — | |
| | | |
| GROWTH STRATEGY PORTFOLIO | | | | | | | | | | | | |
| | | |
| Investment Type | | | | | | | | | |
| Assets | | | | | | | | | | | | |
Equity Underlying Funds | | $ | 593,758,282 | | | $ | — | | | $ | — | |
Fixed Income Underlying Funds | | | 90,275,844 | | | | — | | | | — | |
Dynamic Underlying Funds | | | 128,893,572 | | | | — | | | | — | |
| Total | | $ | 812,927,698 | | | $ | — | | | $ | — | |
| | | |
| SATELLITE STRATEGIES PORTFOLIO | | | | | | | | | | | | |
| | | |
| Investment Type | | Level 1 | | | Level 2 | | | Level 3 | |
| Assets | | | | | | | | | | | | |
Equity Underlying Funds | | $ | 509,946,023 | | | $ | — | | | $ | — | |
Fixed Income Underlying Funds | | | 406,591,481 | | | | — | | | | — | |
| Total | | $ | 916,537,504 | | | $ | — | | | $ | — | |
For further information regarding security characteristics, see the Schedules of Investments.
69
GOLDMAN SACHS FUND OF FUNDS PORTFOLIOS
Notes to Financial Statements (continued)
December 31, 2015
|
| 4. AGREEMENTS AND AFFILIATED TRANSACTIONS |
A. Management Agreement — Under the Agreement, GSAM manages the Portfolios, subject to the general supervision of the Trustees.
As compensation for the services rendered pursuant to the Agreement, the assumption of the expenses related thereto and administration of the Portfolios’ business affairs, including providing facilities, GSAM is entitled to a management fee, accrued daily and paid monthly, equal to an annual percentage rate of average daily net assets of 0.124% for the Satellite Strategies Portfolio and 0.15% for each of the other Portfolios.
B. Distribution and Service Plans — The Trust, on behalf of each Portfolio, has adopted Distribution and Service Plans (the “Plans”). Under the Plans, Goldman Sachs, which serves as distributor (the “Distributor”), is entitled to a fee accrued daily and paid monthly, for distribution services and personal and account maintenance services, which may then be paid by Goldman Sachs to authorized dealers, at the following annual rates calculated on a Portfolio’s average daily net assets of each respective share class:
| | | | | | | | | | | | |
| | | Distribution and Service Plan Rates | |
| | | Class A* | | | Class C | | | Class R* | |
Distribution Plan | | | 0.25 | % | | | 0.75 | % | | | 0.50 | % |
Service Plan | | | — | | | | 0.25 | | | | — | |
| * | | With respect to Class A and Class R Shares, the Distributor at its discretion may use compensation for distribution services paid under the Distribution Plan to compensate service organizations for personal and account maintenance services and expenses as long as such total compensation does not exceed the maximum cap on “service fees” imposed by the Financial Industry Regulatory Authority. |
C. Distribution Agreement — Goldman Sachs, as Distributor of the shares of the Portfolios pursuant to a Distribution Agreement, may retain a portion of the Class A Shares’ front end sales charge and Class C Shares’ CDSC. During the fiscal year ended December 31, 2015, Goldman Sachs advised that it retained the following amounts:
| | | | | | | | | | |
| | | | | Front End
Sales Charge | | | Contingent Deferred
Sales Charge | |
| Portfolio | | | | Class A | | | Class C | |
Balanced Strategy | | | | $ | 14,826 | | | $ | 22 | |
Equity Growth Strategy | | | | | 13,847 | | | | 507 | |
Growth and Income Strategy | | | | | 29,307 | | | | 722 | |
Growth Strategy | | | | | 27,306 | | | | 433 | |
Satellite Strategies | | | | | 11,061 | | | | — | |
70
GOLDMAN SACHS FUND OF FUNDS PORTFOLIOS
|
| 4. AGREEMENTS AND AFFILIATED TRANSACTIONS (continued) |
D. Service Plan and Shareholder Administration Plan — The Trust, on behalf of each Portfolio that offers Service Shares, has adopted a Service Plan and a Shareholder Administration Plan. These plans allow for service organizations to provide varying levels of personal and account maintenance and shareholder administration services to their customers who are beneficial owners of such shares. The Service Plan and Shareholder Administration Plan each provide for compensation to the service organizations which is accrued daily and paid monthly at an annual rate of 0.25% (0.50% in aggregate) of the average daily net assets of the Service Shares.
E. Transfer Agency Agreement — Goldman Sachs also serves as the transfer agent of the Portfolios for a fee pursuant to the Transfer Agency Agreement. The fees charged for such transfer agency services are accrued daily and paid monthly at annual rates as follows: 0.19% of the average daily net assets of Class A, Class C, Class IR and Class R Shares; 0.02% of the average daily net assets of Class R6 Shares; and 0.04% of the average daily net assets of Institutional and Service Shares.
F. Other Expense Agreements and Affiliated Transactions — GSAM has agreed to limit certain “Other Expenses” of the Portfolios (excluding acquired (underlying) fund fees and expenses, transfer agency fees and expenses, service fees, shareholder administration fees (as applicable), taxes, interest, brokerage fees, shareholder meeting, litigation, indemnification and extraordinary expenses) to the extent such expenses exceed, on an annual basis, a percentage rate of the average daily net assets of each Portfolio. Such Other Expense reimbursements, if any, are accrued daily and paid monthly. In addition, the Portfolios are not obligated to reimburse GSAM for prior fiscal year expense reimbursements, if any. The Other Expense limitations as an annual percentage rate of average daily net assets are 0.01% for the Satellite Strategies Portfolio and 0.004% for each other Portfolio, respectively. These Other Expense limitations will remain in place through at least July 31, 2016, and prior to such date GSAM may not terminate the arrangements without the approval of the Trustees. In addition, the Portfolios have entered into certain offset arrangements with the transfer agent, which may result in a reduction of the Portfolios’ expenses and are received irrespective of the application of the “Other Expense” limitations described above.
For the fiscal year ended December 31, 2015, these expense reductions, including any fee waivers and Other Expense reimbursements, were as follows:
| | | | | | | | | | |
| | | | | Other
Expense
Reimbursements | | | Total
Expense
Reductions | |
Balanced Strategy | | | | $ | 250,589 | | | $ | 250,589 | |
Equity Growth Strategy | | | | | 269,510 | | | | 269,510 | |
Growth and Income Strategy | | | | | 303,521 | | | | 303,521 | |
Growth Strategy | | | | | 347,772 | | | | 347,772 | |
Satellite Strategies | | | | | 329,504 | | | | 329,504 | |
71
GOLDMAN SACHS FUND OF FUNDS PORTFOLIOS
Notes to Financial Statements (continued)
December 31, 2015
|
| 4. AGREEMENTS AND AFFILIATED TRANSACTIONS (continued) |
G. Line of Credit Facility — As of December 31, 2015, the Portfolios participated in a $1,205,000,000 committed, unsecured revolving line of credit facility (the “facility”) together with other funds of the Trust and registered investment companies having management agreements with GSAM or its affiliates (“Other Borrowers”). Pursuant to the terms of the facility, the Portfolios and Other Borrowers could increase the credit amount by up to an additional $115,000,000 for a total of up to $1,320,000,000. This facility is to be used for temporary emergency purposes, or to allow for an orderly liquidation of securities to meet redemption requests. The interest rate on borrowings is based on the federal funds rate. The facility also requires a fee to be paid by the Portfolios based on the amount of the commitment that has not been utilized. For the fiscal year ended December 31, 2015, the Portfolios did not have any borrowings under the facility.
H. Other Transactions with Affiliates — The Portfolios invest primarily in the Institutional Shares of the Underlying Funds. These Underlying Funds are considered to be affiliated with the Portfolios. The tables below show the transactions in and earnings from investments in these Underlying Funds for the fiscal year ended December 31, 2015 (in thousands):
| | | | | | | | | | | | | | | | | | | | | | | | | | | | | | | | |
|
| Balanced Strategy Portfolio | |
| Underlying Funds | | Market
Value
12/31/2014 | | | Purchases
at Cost* | | | Proceeds
from Sales | | | Net Realized
Gain (Loss) | | | Change in
Unrealized
Gain (Loss) | | | Market
Value
12/31/2015 | | | Dividend
Income | | | Capital Gain
Distributions | |
Goldman Sachs Core Fixed Income Fund | | $ | 1,053 | | | $ | 31,466 | | | $ | (13,817 | ) | | $ | (5 | ) | | $ | (203 | ) | | $ | 18,494 | | | $ | 370 | | | $ | — | |
Goldman Sachs Dynamic Allocation Fund | | | 62,219 | | | | 12,343 | | | | (12,745 | ) | | | 96 | | | | (5,778 | ) | | | 56,135 | | | | 399 | | | | 1,531 | |
Goldman Sachs Emerging Markets Debt Fund | | | 14,837 | | | | 3,722 | | | | (13,534 | ) | | | (662 | ) | | | 53 | | | | 4,416 | | | | 711 | | | | — | |
Goldman Sachs Emerging Markets Equity Insights Fund | | | 19,395 | | | | 5,732 | | | | (22,650 | ) | | | (2,345 | ) | | | 1,299 | | | | 1,431 | | | | 19 | | | | — | |
Goldman Sachs Global Income Fund | | | 157,430 | | | | 61,115 | | | | (40,105 | ) | | | 151 | | | | (8,414 | ) | | | 170,177 | | | | 9,212 | | | | 157 | |
Goldman Sachs High Yield Fund — Institutional Shares | | | 29,399 | | | | 6,032 | | | | (30,840 | ) | | | (3,269 | ) | | | 1,376 | | | | 2,698 | | | | 1,200 | | | | — | |
Goldman Sachs International Equity Insights Fund | | | 23,496 | | | | 22,329 | | | | (18,649 | ) | | | 882 | | | | 209 | | | | 28,267 | | | | 397 | | | | — | |
Goldman Sachs International Real Estate Securities Fund | | | 3,988 | | | | 2,111 | | | | (940 | ) | | | 127 | | | | (286 | ) | | | 5,000 | | | | 126 | | | | — | |
Goldman Sachs International Small Cap Insights Fund | | | 5,974 | | | | 865 | | | | (1,865 | ) | | | 644 | | | | (145 | ) | | | 5,473 | | | | 89 | | | | — | |
Goldman Sachs Large Cap Growth Insights Fund | | | 26,454 | | | | 33,657 | | | | (13,570 | ) | | | 2,635 | | | | (1,489 | ) | | | 47,687 | | | | 272 | | | | — | |
Goldman Sachs Large Cap Value Fund | | | 21,361 | | | | 2,121 | | | | (13,534 | ) | | | 1,525 | | | | (2,938 | ) | | | 8,535 | | | | 110 | | | | 775 | |
Goldman Sachs Large Cap Value Insights Fund | | | 49,724 | | | | 3,443 | | | | (31,644 | ) | | | 4,891 | | | | (6,527 | ) | | | 19,887 | | | | 559 | | | | — | |
72
GOLDMAN SACHS FUND OF FUNDS PORTFOLIOS
|
| 4. AGREEMENTS AND AFFILIATED TRANSACTIONS (continued) |
| | | | | | | | | | | | | | | | | | | | | | | | | | | | | | | | |
|
| Balanced Strategy Portfolio (continued) | |
| Underlying Funds | | Market
Value
12/31/2014 | | | Purchases
at Cost* | | | Proceeds
from Sales | | | Net Realized
Gain (Loss) | | | Change in
Unrealized
Gain (Loss) | | | Market
Value
12/31/2015 | | | Dividend
Income | | | Capital Gain
Distributions | |
Goldman Sachs Local Emerging Markets Debt Fund | | $ | 14,293 | | | $ | 11,084 | | | $ | (18,879 | ) | | $ | (2,445 | ) | | $ | 466 | | | $ | 4,519 | | | $ | 615 | | | $ | — | |
Goldman Sachs Managed Futures Strategy Fund | | | 17,701 | | | | 2,668 | | | | (6,229 | ) | | | 512 | | | | 713 | | | | 15,365 | | | | 575 | | | | — | |
Goldman Sachs Real Estate Securities Fund | | | 5,147 | | | | 3,171 | | | | (3,077 | ) | | | 642 | | | | (728 | ) | | | 5,155 | | | | 104 | | | | 176 | |
Goldman Sachs Small Cap Equity Insights Fund | | | 1,198 | | | | 370 | | | | (1,451 | ) | | | 122 | | | | (60 | ) | | | 179 | | | | — | | | | — | |
Goldman Sachs Strategic Growth Fund | | | 11,408 | | | | 15,151 | | | | (5,950 | ) | | | 285 | | | | (450 | ) | | | 20,444 | | | | 54 | | | | 710 | |
Goldman Sachs Strategic Income Fund | | | 37,304 | | | | 6,782 | | | | (8,510 | ) | | | (152 | ) | | | (2,129 | ) | | | 33,295 | | | | 2,004 | | | | — | |
Total | | $ | 502,381 | | | $ | 224,162 | | | $ | (257,989 | ) | | $ | 3,634 | | | $ | (25,031 | ) | | $ | 447,157 | | | $ | 16,816 | | | $ | 3,349 | |
|
| Equity Growth Strategy Portfolio | |
| Underlying Funds | | Market
Value
12/31/2014 | | | Purchases
at Cost* | | | Proceeds
from Sales | | | Net Realized
Gain (Loss) | | | Change in
Unrealized
Gain (Loss) | | | Market
Value
12/31/2015 | | | Dividend
Income | | | Capital Gain
Distributions | |
Goldman Sachs Emerging Markets Equity Insights Fund | | $ | 36,273 | | | $ | 3,151 | | | $ | (20,031 | ) | | $ | (740 | ) | | $ | (2,086 | ) | | $ | 16,567 | | | $ | 219 | | | $ | — | |
Goldman Sachs Financial Square Funds — Prime Obligations Fund | | | 2,534 | | | | — | | | | (2,534 | ) | | | — | | | | — | | | | — | | | | — | | | | — | |
Goldman Sachs International Equity Insights Fund | | | 105,857 | | | | 21,422 | | | | (27,046 | ) | | | 4,907 | | | | 493 | | | | 105,633 | | | | 1,509 | | | | — | |
Goldman Sachs International Real Estate Securities Fund | | | 7,703 | | | | 532 | | | | (1,054 | ) | | | 76 | | | | (370 | ) | | | 6,887 | | | | 203 | | | | — | |
Goldman Sachs International Small Cap Insights Fund | | | 11,533 | | | | 332 | | | | (2,381 | ) | | | 1,034 | | | | (98 | ) | | | 10,420 | | | | 173 | | | | — | |
Goldman Sachs Large Cap Growth Insights Fund | | | 63,582 | | | | 20,425 | | | | (8,983 | ) | | | 4,706 | | | | (2,996 | ) | | | 76,734 | | | | 575 | | | | — | |
Goldman Sachs Large Cap Value Fund | | | 34,426 | | | | 4,192 | | | | (10,028 | ) | | | 3,921 | | | | (7,479 | ) | | | 25,032 | | | | 312 | | | | 2,192 | |
Goldman Sachs Large Cap Value Insights Fund | | | 80,143 | | | | 2,161 | | | | (20,895 | ) | | | 9,879 | | | | (12,866 | ) | | | 58,422 | | | | 1,218 | | | | — | |
Goldman Sachs Real Estate Securities Fund | | | 7,734 | | | | 1,108 | | | | (1,782 | ) | | | 549 | | | | (581 | ) | | | 7,028 | | | | 138 | | | | 184 | |
73
GOLDMAN SACHS FUND OF FUNDS PORTFOLIOS
Notes to Financial Statements (continued)
December 31, 2015
|
| 4. AGREEMENTS AND AFFILIATED TRANSACTIONS (continued) |
| | | | | | | | | | | | | | | | | | | | | | | | | | | | | | | | |
|
| Equity Growth Strategy Portfolio (continued) | |
| Underlying Funds | | Market
Value
12/31/2014 | | | Purchases
at Cost* | | | Proceeds
from Sales | | | Net
Realized
Gain
(Loss) | | | Change in
Unrealized
Gain
(Loss) | | | Market
Value
12/31/2015 | | | Dividend
Income | | | Capital Gain
Distributions | |
Goldman Sachs Small Cap Equity Insights Fund | | $ | 8,018 | | | $ | 2,758 | | | $ | (5,356 | ) | | $ | 1,168 | | | $ | (1,161 | ) | | $ | 5,427 | | | $ | 22 | | | $ | — | |
Goldman Sachs Strategic Growth Fund | | | 27,354 | | | | 10,004 | | | | (3,849 | ) | | | 1,024 | | | | (1,632 | ) | | | 32,901 | | | | 114 | | | | 1,493 | |
Total | | $ | 385,157 | | | $ | 66,085 | | | $ | (103,939 | ) | | $ | 26,524 | | | $ | (28,776 | ) | | $ | 345,051 | | | $ | 4,483 | | | $ | 3,869 | |
|
| Growth and Income Strategy Portfolio | |
| Underlying Funds | | Market
Value
12/31/2014 | | | Purchases
at Cost* | | | Proceeds
from Sales | | | Net
Realized
Gain
(Loss) | | | Change in
Unrealized
Gain
(Loss) | | | Market
Value
12/31/2015 | | | Dividend
Income | | | Capital Gain
Distributions | |
Goldman Sachs Core Fixed Income Fund | | $ | 2,115 | | | $ | 64,714 | | | $ | (30,761 | ) | | $ | (12 | ) | | $ | (395 | ) | | $ | 35,661 | | | $ | 761 | | | $ | — | |
Goldman Sachs Dynamic Allocation Fund | | | 125,777 | | | | 18,936 | | | | (16,447 | ) | | | 106 | | | | (12,049 | ) | | | 116,323 | | | | 824 | | | | 3,136 | |
Goldman Sachs Emerging Markets Debt Fund | | | 19,968 | | | | 2,190 | | | | (21,311 | ) | | | (1,281 | ) | | | 434 | | | | — | | | | 937 | | | | — | |
Goldman Sachs Emerging Markets Equity Insights Fund | | | 60,250 | | | | 11,261 | | | | (46,459 | ) | | | (3,776 | ) | | | (341 | ) | | | 20,935 | | | | 273 | | | | — | |
Goldman Sachs Global Income Fund | | | 156,891 | | | | 96,428 | | | | (35,916 | ) | | | 146 | | | | (9,930 | ) | | | 207,619 | | | | 10,705 | | | | 172 | |
Goldman Sachs High Yield Fund | | | 48,994 | | | | 4,960 | | | | (50,553 | ) | | | (5,185 | ) | | | 1,784 | | | | — | | | | 2,064 | | | | — | |
Goldman Sachs International Equity Insights Fund | | | 121,504 | | | | 43,163 | | | | (40,213 | ) | | | 4,673 | | | | 1,363 | | | | 130,490 | | | | 1,836 | | | | — | |
Goldman Sachs International Real Estate Securities Fund | | | 12,096 | | | | 1,331 | | | | (1,722 | ) | | | 236 | | | | (699 | ) | | | 11,242 | | | | 323 | | | | — | |
Goldman Sachs International Small Cap Insights Fund | | | 18,112 | | | | 1,505 | | | | (4,123 | ) | | | 1,819 | | | | (305 | ) | | | 17,008 | | | | 278 | | | | — | |
Goldman Sachs Large Cap Growth Insights Fund | | | 88,182 | | | | 65,431 | | | | (24,473 | ) | | | 8,789 | | | | (5,563 | ) | | | 132,366 | | | | 872 | | | | — | |
Goldman Sachs Large Cap Value Fund | | | 58,267 | | | | 5,151 | | | | (26,275 | ) | | | 7,953 | | | | (12,832 | ) | | | 32,264 | | | | 409 | | | | 2,889 | |
Goldman Sachs Large Cap Value Insights Fund | | | 135,502 | | | | 6,119 | | | | (61,630 | ) | | | 21,406 | | | | (26,140 | ) | | | 75,257 | | | | 1,795 | | | | — | |
Goldman Sachs Local Emerging Markets Debt Fund | | | 19,108 | | | | 18,412 | | | | (35,542 | ) | | | (5,152 | ) | | | 3,174 | | | | — | | | | 739 | | | | — | |
Goldman Sachs Managed Futures Strategy Fund | | | 35,788 | | | | 4,111 | | | | (10,549 | ) | | | 903 | | | | 1,590 | | | | 31,843 | | | | 1,194 | | | | — | |
74
GOLDMAN SACHS FUND OF FUNDS PORTFOLIOS
|
| 4. AGREEMENTS AND AFFILIATED TRANSACTIONS (continued) |
| | | | | | | | | | | | | | | | | | | | | | | | | | | | | | | | |
|
| Growth and Income Strategy Portfolio (continued) | |
| Underlying Funds | | Market
Value
12/31/2014 | | | Purchases
at Cost* | | | Proceeds
from Sales | | | Net
Realized
Gain
(Loss) | | | Change in
Unrealized
Gain
(Loss) | | | Market
Value
12/31/2015 | | | Dividend
Income | | | Capital Gain
Distributions | |
Goldman Sachs Real Estate Securities Fund | | $ | 12,139 | | | $ | 2,161 | | | $ | (2,770 | ) | | $ | 1,803 | | | $ | (1,851 | ) | | $ | 11,482 | | | $ | 217 | | | $ | 314 | |
Goldman Sachs Small Cap Equity Insights Fund | | | 8,666 | | | | 5,289 | | | | (9,019 | ) | | | 759 | | | | (505 | ) | | | 5,190 | | | | — | | | | — | |
Goldman Sachs Strategic Growth Fund | | | 37,955 | | | | 30,469 | | | | (11,000 | ) | | | 792 | | | | (1,502 | ) | | | 56,714 | | | | 173 | | | | 2,279 | |
Goldman Sachs Strategic Income Fund | | | 50,274 | | | | 7,296 | | | | (8,448 | ) | | | (200 | ) | | | (2,920 | ) | | | 46,002 | | | | 2,767 | | | | — | |
Total | | $ | 1,011,588 | | | $ | 388,927 | | | $ | (437,211 | ) | | $ | 33,779 | | | $ | (66,687 | ) | | $ | 930,396 | | | $ | 26,167 | | | $ | 8,790 | |
|
| Growth Strategy Portfolio | |
| Underlying Funds | | Market
Value
12/31/2014 | | | Purchases
at Cost* | | | Proceeds
from Sales | | | Net
Realized
Gain
(Loss) | | | Change in
Unrealized
Gain
(Loss) | | | Market
Value
12/31/2015 | | | Dividend
Income | | | Capital Gain
Distributions | |
Goldman Sachs Core Fixed Income Fund | | $ | — | | | $ | 45,222 | | | $ | (29,144 | ) | | $ | (48 | ) | | $ | (176 | ) | | $ | 15,854 | | | $ | 525 | | | $ | — | |
Goldman Sachs Dynamic Allocation Fund | | | 106,679 | | | | 18,073 | | | | (13,024 | ) | | | 29 | | | | (10,558 | ) | | | 101,199 | | | | 721 | | | | 2,757 | |
Goldman Sachs Emerging Markets Debt Fund | | | 8,435 | | | | 776 | | | | (9,078 | ) | | | (407 | ) | | | 274 | | | | — | | | | 213 | | | | — | |
Goldman Sachs Emerging Markets Equity Insights Fund | | | 68,881 | | | | 5,090 | | | | (40,848 | ) | | | (2,629 | ) | | | (1,952 | ) | | | 28,542 | | | | 376 | | | | — | |
Goldman Sachs Global Income Fund | | | — | | | | 58,026 | | | | (1,279 | ) | | | 10 | | | | (2,342 | ) | | | 54,415 | | | | 2,278 | | | | 31 | |
Goldman Sachs High Yield Fund | | | 31,926 | | | | 10,215 | | | | (40,370 | ) | | | (2,672 | ) | | | 901 | | | | — | | | | 1,135 | | | | — | |
Goldman Sachs International Equity Insights Fund | | | 166,537 | | | | 42,840 | | | | (46,784 | ) | | | 7,330 | | | | 1,571 | | | | 171,494 | | | | 2,441 | | | | — | |
Goldman Sachs International Real Estate Securities Fund | | | 13,678 | | | | 1,647 | | | | (1,712 | ) | | | 187 | | | | (758 | ) | | | 13,042 | | | | 379 | | | | — | |
Goldman Sachs International Small Cap Insights Fund | | | 20,479 | | | | 1,750 | | | | (4,251 | ) | | | 1,887 | | | | (133 | ) | | | 19,732 | | | | 326 | | | | — | |
Goldman Sachs Large Cap Growth Insights Fund | | | 103,229 | | | | 60,490 | | | | (24,105 | ) | | | 11,411 | | | | (7,722 | ) | | | 143,303 | | | | 1,041 | | | | — | |
75
GOLDMAN SACHS FUND OF FUNDS PORTFOLIOS
Notes to Financial Statements (continued)
December 31, 2015
|
| 4. AGREEMENTS AND AFFILIATED TRANSACTIONS (continued) |
| | | | | | | | | | | | | | | | | | | | | | | | | | | | | | | | |
|
| Growth Strategy Portfolio (continued) | |
| Underlying Funds | | Market
Value
12/31/2014 | | | Purchases
at Cost* | | | Proceeds
from Sales | | | Net
Realized
Gain
(Loss) | | | Change in
Unrealized
Gain
(Loss) | | | Market
Value
12/31/2015 | | | Dividend
Income | | | Capital Gain
Distributions | |
Goldman Sachs Large Cap Value Fund | | $ | 61,811 | | | $ | 7,201 | | | $ | (22,893 | ) | | $ | 8,987 | | | $ | (14,839 | ) | | $ | 40,267 | | | $ | 505 | | | $ | 3,553 | |
Goldman Sachs Large Cap Value Insights Fund | | | 143,735 | | | | 9,429 | | | | (53,855 | ) | | | 25,043 | | | | (30,407 | ) | | | 93,945 | �� | | | 2,099 | | | | — | |
Goldman Sachs Local Emerging Markets Debt Fund | | | 8,287 | | | | 8,602 | | | | (16,000 | ) | | | (2,259 | ) | | | 1,370 | | | | — | | | | 333 | | | | — | |
Goldman Sachs Managed Futures Strategy Fund | | | 30,353 | | | | 4,370 | | | | (9,181 | ) | | | 815 | | | | 1,337 | | | | 27,694 | | | | 1,050 | | | | — | |
Goldman Sachs Real Estate Securities Fund | | | 13,733 | | | | 2,620 | | | | (2,926 | ) | | | 609 | | | | (729 | ) | | | 13,307 | | | | 254 | | | | 348 | |
Goldman Sachs Small Cap Equity Insights Fund | | | 12,611 | | | | 7,024 | | | | (11,005 | ) | | | 1,443 | | | | (1,372 | ) | | | 8,701 | | | | 12 | | | | — | |
Goldman Sachs Strategic Growth Fund | | | 44,446 | | | | 28,792 | | | | (10,918 | ) | | | 1,542 | | | | (2,436 | ) | | | 61,426 | | | | 206 | | | | 2,704 | |
Goldman Sachs Strategic Income Fund | | | 21,321 | | | | 3,802 | | | | (3,757 | ) | | | (69 | ) | | | (1,290 | ) | | | 20,007 | | | | 1,212 | | | | — | |
Total | | $ | 856,141 | | | $ | 315,969 | | | $ | (341,130 | ) | | $ | 51,209 | | | $ | (69,261 | ) | | $ | 812,928 | | | $ | 15,106 | | | $ | 9,393 | |
|
| Satellite Strategies Portfolio | |
| Underlying Funds | | Market
Value
12/31/2014 | | | Purchases
at Cost* | | | Proceeds
from Sales | | | Net
Realized
Gain
(Loss) | | | Change in
Unrealized
Gain
(Loss) | | | Market
Value
12/31/2015 | | | Dividend
Income | | | Capital Gain
Distributions | |
Goldman Sachs Commodity Strategy Fund | | $ | 55,548 | | | $ | 28,876 | | | $ | (20,293 | ) | | $ | (11,730 | ) | | $ | (7,684 | ) | | $ | 44,717 | | | $ | 219 | | | $ | — | |
Goldman Sachs Emerging Markets Debt Fund | | | 163,748 | | | | 9,681 | | | | (96,352 | ) | | | (4,056 | ) | | | (745 | ) | | | 72,276 | | | | 6,637 | | | | — | |
Goldman Sachs Emerging Markets Equity Fund | | | 62,505 | | | | 6,515 | | | | (25,527 | ) | | | 602 | | | | (2,260 | ) | | | 41,835 | | | | 42 | | | | — | |
76
GOLDMAN SACHS FUND OF FUNDS PORTFOLIOS
|
| 4. AGREEMENTS AND AFFILIATED TRANSACTIONS (continued) |
| | | | | | | | | | | | | | | | | | | | | | | | | | | | | | | | |
|
| Satellite Strategies Portfolio (continued) | |
| Underlying Funds | | Market
Value
12/31/2014 | | | Purchases
at Cost* | | | Proceeds
from Sales | | | Net
Realized
Gain
(Loss) | | | Change in
Unrealized
Gain
(Loss) | | | Market
Value
12/31/2015 | | | Dividend
Income | | | Capital Gain
Distributions | |
Goldman Sachs Emerging Markets Equity Insights Fund | | $ | 76,232 | | | $ | 10,766 | | | $ | (31,251 | ) | | $ | (1,842 | ) | | $ | (2,897 | ) | | $ | 51,008 | | | $ | 688 | | | $ | — | |
Goldman Sachs High Yield Floating Rate Fund | | | 79,822 | | | | 75,126 | | | | (32,985 | ) | | | (1,120 | ) | | | (5,190 | ) | | | 115,653 | | | | 4,529 | | | | — | |
Goldman Sachs High Yield Fund | | | 154,054 | | | | 29,314 | | | | (40,751 | ) | | | (3,992 | ) | | | (10,581 | ) | | | 128,044 | | | | 8,136 | | | | — | |
Goldman Sachs International Real Estate Securities Fund | | | 167,405 | | | | 25,270 | | | | (49,314 | ) | | | 211 | | | | (5,809 | ) | | | 137,763 | | | | 4,279 | | | | 3,733 | |
Goldman Sachs International Small Cap Fund | | | 73,372 | | | | 5,705 | | | | (26,918 | ) | | | 1,935 | | | | 1,142 | | | | 55,236 | | | | 820 | | | | — | |
Goldman Sachs International Small Cap Insights Fund | | | 110,146 | | | | 6,710 | | | | (42,480 | ) | | | 2,877 | | | | 6,284 | | | | 83,537 | | | | 1,412 | | | | — | |
Goldman Sachs Local Emerging Markets Debt Fund | | | 95,381 | | | | 9,804 | | | | (44,717 | ) | | | (13,445 | ) | | | (1,122 | ) | | | 45,901 | | | | 3,580 | | | | — | |
Goldman Sachs Real Estate Securities Fund | | | 184,924 | | | | 35,468 | | | | (78,736 | ) | | | 11,671 | | | | (12,759 | ) | | | 140,568 | | | | 3,190 | | | | — | |
Total | | $ | 1,223,137 | | | $ | 243,235 | | | $ | (489,324 | ) | | $ | (18,889 | ) | | $ | (41,621 | ) | | $ | 916,538 | | | $ | 33,532 | | | $ | 3,733 | |
| * | | Includes reinvestment of distributions. |
|
| 5. PORTFOLIO SECURITIES TRANSACTIONS |
The cost of purchases and proceeds from sales of the Underlying Funds for the fiscal year ended December 31, 2015, were as follows:
| | | | | | | | | | |
| Portfolio | | | | Purchases | | | Sales | |
Balanced Strategy | | | | $ | 224,162,070 | | | $ | 257,989,284 | |
Equity Growth Strategy | | | | | 66,084,959 | | | | 101,404,267 | |
Growth and Income Strategy | | | | | 388,926,571 | | | | 437,210,535 | |
Growth Strategy | | | | | 315,969,153 | | | | 341,129,758 | |
Satellite Strategies | | | | | 243,234,732 | | | | 489,324,402 | |
77
GOLDMAN SACHS FUND OF FUNDS PORTFOLIOS
Notes to Financial Statements (continued)
December 31, 2015
The tax character of distributions paid during the fiscal year ended December 31, 2015 was as follows:
| | | | | | | | | | | | | | | | | | | | |
| | | Balanced
Strategy | | | Equity
Growth
Strategy | | | Growth and
Income
Strategy | | | Growth
Strategy | | | Satellite
Strategies | |
Distribution paid from: | | | | | | | | | | | | | | | | | | | | |
Ordinary income | | $ | 15,545,710 | | | $ | 3,177,452 | | | $ | 33,051,133 | | | $ | 12,639,799 | | | $ | 28,454,321 | |
Tax return of capital | | $ | 7,707,717 | | | $ | — | | | $ | — | | | $ | — | | | $ | — | |
The tax character of distributions paid during the fiscal year ended December 31, 2014 was as follows:
| | | | | | | | | | | | | | | | | | | | |
| | | Balanced Strategy | | | Equity
Growth Strategy | | | Growth and Income
Strategy | | | Growth Strategy | | | Satellite Strategies | |
Distributions paid from: | | | | | | | | | | | | | | | | | | | | |
Ordinary income | | $ | 15,531,233 | | | $ | 6,642,557 | | | $ | 26,191,849 | | | $ | 18,000,491 | | | $ | 35,446,792 | |
Net long-term capital gains | | | — | | | | — | | | | — | | | | — | | | | 6,681,308 | |
Total taxable distributions | | $ | 15,531,233 | | | $ | 6,642,557 | | | $ | 26,191,849 | | | $ | 18,000,491 | | | $ | 42,128,100 | |
As of December 31, 2015, the components of accumulated earnings (losses) on a tax basis were as follows:
| | | | | | | | | | | | | | | | | | | | |
| | | Balanced
Strategy | | | Equity Growth Strategy | | | Growth and
Income Strategy | | | Growth Strategy | | | Satellite
Strategies | |
Undistributed ordinary income — net | | $ | — | | | $ | 99,948 | | | $ | — | | | $ | 450,560 | | | $ | 82,210 | |
Undistributed long-term capital gains | | | — | | | | — | | | | — | | | | — | | | | — | |
Total undistributed earnings | | $ | — | | | $ | 99,948 | | | $ | — | | | $ | 450,560 | | | $ | 82,210 | |
Capital loss carryforwards:(1) | | | | | | | | | | | | | | | | | | | | |
Expiring 2016 | | $ | — | | | $ | (41,731,954 | ) | | $ | (31,174,303 | ) | | $ | (101,609,585 | ) | | $ | — | |
Expiring 2017 | | | — | | | | (109,415,161 | ) | | | (358,977,420 | ) | | | (372,899,651 | ) | | | (853,855 | ) |
Expiring 2018 | | | (9,648,959 | ) | | | (76,608,179 | ) | | | (187,607,636 | ) | | | (181,275,105 | ) | | | — | |
Perpetual Short-Term | | | (524,476 | ) | | | — | | | | — | | | | — | | | | — | |
Perpetual Long-Term | | | — | | | | — | | | | — | | | | — | | | | (20,757,413 | ) |
Total capital loss carryforwards | | $ | (10,173,435 | ) | | $ | (227,755,294 | ) | | $ | (577,759,359 | ) | | $ | (655,784,341 | ) | | $ | (21,611,268 | ) |
Timing Difference (Post October Loss Deferral) | | $ | — | | | $ | (7,969 | ) | | $ | (1,424,438 | ) | | $ | (54,183 | ) | | $ | — | |
Unrealized gains (losses) — net | | | (32,650,111 | ) | | | 18,673,678 | | | | (26,393,150 | ) | | | 6,283,916 | | | | (53,526,496 | ) |
Total accumulated earnings (losses) net | | $ | (42,823,546 | ) | | $ | (208,989,637 | ) | | $ | (605,576,947 | ) | | $ | (649,104,048 | ) | | $ | (75,055,554 | ) |
| (1) | | Expiration occurs on December 31 of the year indicated. The Equity Growth Strategy, Growth and Income Strategy and Growth Strategy Portfolios utilized $22,088,402, $31,419,957 and $50,863,332, respectively, of capital losses in the current fiscal year. |
78
GOLDMAN SACHS FUND OF FUNDS PORTFOLIOS
|
| 6. TAX INFORMATION (continued) |
As of December 31, 2015, the Funds’ aggregate security unrealized gains and losses based on cost for U.S. federal income tax purposes were as follows:
| | | | | | | | | | | | | | | | | | | | |
| | | Balanced
Strategy | | | Equity Growth
Strategy | | | Growth and
Income
Strategy | | | Growth
Strategy | | | Satellite
Strategies | |
Tax Cost | | $ | 480,707,249 | | | $ | 326,377,524 | | | $ | 961,789,519 | | | $ | 806,643,782 | | | $ | 970,064,000 | |
Gross unrealized gain | | | 3,059,644 | | | | 41,439,531 | | | | 27,437,811 | | | | 48,738,348 | | | | 77,052,491 | |
Gross unrealized loss | | | (35,709,755 | ) | | | (22,765,853 | ) | | | (53,830,961 | ) | | | (42,454,432 | ) | | | (130,578,987 | ) |
Net unrealized gains (losses) on securities | | $ | (32,650,111 | ) | | $ | 18,673,678 | | | $ | (26,393,150 | ) | | $ | 6,283,916 | | | $ | (53,526,496 | ) |
The difference between GAAP-basis and tax-basis unrealized gains (losses) is attributable primarily to wash sales and differences in the tax treatment of underlying fund investments.
In order to present certain components of the Portfolios’ capital accounts on a tax-basis, certain reclassifications have been recorded to the Portfolios’ accounts. These reclassifications have no impact on the net asset value of the Portfolios’ and result primarily from taxable overdistributions, and differences in the tax treatment of underlying fund investments.
| | | | | | | | | | | | | | |
| Fund | | | | Paid-in
Capital | | | Accumulated
Net Realized
Gain (Loss) | | | Undistributed
Net Investment
Income (Loss) | |
Balanced Strategy | | | | $ | — | | | $ | (872,252 | ) | | $ | 872,252 | |
Equity Growth Strategy | | | | | 8 | | | | (1,063,360 | ) | | | 1,063,352 | |
Growth and Income Strategy | | | | | (9,488,261 | ) | | | (2,416,808 | ) | | | 11,905,069 | |
Growth Strategy | | | | | — | | | | (2,741,406 | ) | | | 2,741,406 | |
Satellite Strategies | | | | | — | | | | 1,563,858 | | | | (1,563,858 | ) |
GSAM has reviewed the Portfolios’ tax positions for all open tax years (the current and prior three years, as applicable) and has concluded that no provision for income tax is required in the Portfolios’ financial statements. Such open tax years remain subject to examination and adjustment by tax authorities.
The Portfolios’ risks include, but are not limited to, the following:
Investments in the Underlying Funds — The investments of a Portfolio are concentrated in the Underlying Funds, and the Portfolio’s investment performance is directly related to the investment performance of the Underlying Funds it holds. A Portfolio is subject to the risk factors associated with the investments of the Underlying Funds in direct proportion to the amount of assets allocated to each. A Portfolio that has a relative concentration of its portfolio in a single Underlying Fund may be more susceptible to adverse developments affecting that Underlying Fund, and may be more susceptible to losses because of these developments.
79
GOLDMAN SACHS FUND OF FUNDS PORTFOLIOS
Notes to Financial Statements (continued)
December 31, 2015
|
| 7. OTHER RISKS (continued) |
Large Shareholder Transactions Risk — A Portfolio or an Underlying Fund may experience adverse effects when certain large shareholders, such as other funds, institutional investors (including those trading by use of non-discretionary mathematical formulas), financial intermediaries (who may make investment decisions on behalf of underlying clients and/or include a Portfolio or an Underlying Fund in their investment model), individuals, accounts and Goldman Sachs affiliates, purchase or redeem large amounts of shares of a Portfolio or an Underlying Fund. Such large shareholder redemptions may cause a Portfolio or an Underlying Fund to sell portfolio securities at times when it would not otherwise do so, which may negatively impact the Portfolio’s or the Underlying Fund’s NAV and liquidity. These transactions may also accelerate the realization of taxable income to shareholders if such sales of investments resulted in gains, and may also increase transaction costs. In addition, a large redemption could result in a Portfolio’s or an Underlying Fund’s current expenses being allocated over a smaller asset base, leading to an increase in the expense ratio of the Portfolio or the Underlying Fund. Similarly, large Portfolio or Underlying Fund share purchases may adversely affect a Portfolio’s or an Underlying Fund’s performance to the extent that the Portfolio or the Underlying Fund is delayed in investing new cash and is required to maintain a larger cash position than it ordinarily would.
Liquidity Risk — The Portfolios may make investments that are illiquid or that may become less liquid in response to market developments or adverse investor perceptions. Illiquid investments may be more difficult to value. Liquidity risk may also refer to the risk that a Portfolio will not be able to pay redemption proceeds within the allowable time period because of unusual market conditions, an unusually high volume of redemption requests, or other reasons. To meet redemption requests, a Portfolio may be forced to sell investments at an unfavorable time and/or under unfavorable conditions. Liquidity risk may be the result of, among other things, the reduced number and capacity of traditional market participants to make a market in fixed income securities or the lack of an active market. The potential for liquidity risk may be magnified by a rising interest rate environment or other circumstances where investor redemptions from fixed income mutual funds may be higher than normal, potentially causing increased supply in the market due to selling activity.
Market and Credit Risks — In the normal course of business, the Portfolios trade financial instruments and enter into financial transactions where risk of potential loss exists due to changes in the market (market risk). Additionally, the Portfolios may also be exposed to credit risk in the event that an issuer or guarantor fails to perform or that an institution or entity with which the Portfolios have unsettled or open transactions defaults.
Investing in foreign markets may involve special risks and considerations not typically associated with investing in the United States. Foreign securities may be subject to risk of loss because of more or less foreign government regulation, less public information and less economic, political and social stability in the countries in which the Portfolios invest. Loss may also result from the imposition of exchange controls, confiscations and other government restrictions by the United States or other governments, or from problems in registration, settlement or custody. Foreign risk also involves the risk of negative foreign currency rate fluctuations, which may cause the value of securities denominated in such foreign currency (or other instruments through which the Portfolios have exposure to foreign currencies) to decline in value. Currency exchange rates may fluctuate significantly over short periods of time. To the extent that the Portfolios also invest in securities of issuers located in emerging markets, these risks may be more pronounced.
80
GOLDMAN SACHS FUND OF FUNDS PORTFOLIOS
Under the Trust’s organizational documents, its Trustees, officers, employees and agents are indemnified, to the extent permitted by the Act and state law, against certain liabilities that may arise out of performance of their duties to the Portfolios. Additionally, in the course of business, the Portfolios enter into contracts that contain a variety of indemnification clauses. The Portfolios’ maximum exposure under these arrangements is unknown, as this would involve future claims that may be made against the Portfolios that have not yet occurred. However, GSAM believes the risk of loss under these arrangements to be remote.
Subsequent events after the Statements of Assets and Liabilities date have been evaluated through the date the financial statements were issued. GSAM has concluded that there is no impact requiring adjustment or disclosure in the financial statements.
81
GOLDMAN SACHS FUND OF FUNDS PORTFOLIOS
Notes to Financial Statements (continued)
December 31, 2015
|
| 10. SUMMARY OF SHARE TRANSACTIONS |
Share activity is as follows:
| | | | | | | | | | | | | | | | |
| | | Balanced Strategy Portfolio | |
| | | | |
| | | For the Fiscal Year Ended
December 31, 2015 | | | For the Fiscal Year Ended
December 31, 2014 | |
| | | | |
| | | Shares | | | Dollars | | | Shares | | | Dollars | |
| | | | |
| Class A Shares | | | | | | | | | | | | | | | | |
Shares sold | | | 1,345,309 | | | $ | 14,904,278 | | | | 2,512,215 | | | $ | 28,542,187 | |
Reinvestment of distributions | | | 679,687 | | | | 7,264,620 | | | | 447,500 | | | | 4,998,282 | |
Shares converted from Class B(a) | | | — | | | | — | | | | 126,272 | | | | 1,440,146 | |
Shares redeemed | | | (3,706,738 | ) | | | (41,034,070 | ) | | | (4,094,576 | ) | | | (46,405,617 | ) |
| | | | (1,681,742 | ) | | | (18,865,172 | ) | | | (1,008,589 | ) | | | (11,425,002 | ) |
| Class B Shares(a) | | | | | | | | | | | | | | | | |
Shares sold | | | — | | | | — | | | | 15,801 | | | | 176,635 | |
Reinvestment of distributions | | | — | | | | — | | | | 1,189 | | | | 13,480 | |
Shares converted to Class A | | | — | | | | — | | | | (126,272 | ) | | | (1,440,146 | ) |
Shares redeemed | | | — | | | | — | | | | (1,064,765 | ) | | | (12,119,630 | ) |
| | | | — | | | | — | | | | (1,174,047 | ) | | | (13,369,661 | ) |
| Class C Shares | | | | | | | | | | | | | | | | |
Shares sold | | | 556,471 | | | | 6,110,029 | | | | 449,987 | | | | 5,060,716 | |
Reinvestment of distributions | | | 179,079 | | | | 1,907,051 | | | | 102,525 | | | | 1,140,074 | |
Shares redeemed | | | (1,334,753 | ) | | | (14,769,934 | ) | | | (1,448,090 | ) | | | (16,347,673 | ) |
| | | | (599,203 | ) | | | (6,752,854 | ) | | | (895,578 | ) | | | (10,146,883 | ) |
| Institutional Shares | | | | | | | | | | | | | | | | |
Shares sold | | | 6,772,216 | | | | 74,954,706 | | | | 7,831,692 | | | | 88,541,605 | |
Reinvestment of distributions | | | 1,170,862 | | | | 12,524,123 | | | | 751,245 | | | | 8,401,913 | |
Shares redeemed | | | (8,467,707 | ) | | | (94,040,907 | ) | | | (11,415,285 | ) | | | (128,951,685 | ) |
| | | | (524,629 | ) | | | (6,562,078 | ) | | | (2,832,348 | ) | | | (32,008,167 | ) |
| Service Shares | | | | | | | | | | | | | | | | |
Shares sold | | | 18,980 | | | | 209,103 | | | | 35,328 | | | | 404,133 | |
Reinvestment of distributions | | | 758 | | | | 8,110 | | | | 519 | | | | 5,816 | |
Shares redeemed | | | (52,460 | ) | | | (566,938 | ) | | | (66,014 | ) | | | (762,918 | ) |
| | | | (32,722 | ) | | | (349,725 | ) | | | (30,167 | ) | | | (352,969 | ) |
| Class IR Shares | | | | | | | | | | | | | | | | |
Shares sold | | | 48,053 | | | | 530,292 | | | | 131,558 | | | | 1,499,778 | |
Reinvestment of distributions | | | 23,069 | | | | 245,761 | | | | 13,857 | | | | 154,269 | |
Shares redeemed | | | (83,694 | ) | | | (926,159 | ) | | | (48,726 | ) | | | (549,269 | ) |
| | | | (12,572 | ) | | | (150,106 | ) | | | 96,689 | | | | 1,104,778 | |
| Class R Shares | | | | | | | | | | | | | | | | |
Shares sold | | | 182,472 | | | | 1,990,838 | | | | 211,600 | | | | 2,377,495 | |
Reinvestment of distributions | | | 22,552 | | | | 239,467 | | | | 11,806 | | | | 131,166 | |
Shares redeemed | | | (197,009 | ) | | | (2,152,192 | ) | | | (236,615 | ) | | | (2,666,905 | ) |
| | | | 8,015 | | | | 78,113 | | | | (13,209 | ) | | | (158,244 | ) |
| Class R6 Shares(b) | | | | | | | | | | | | | | | | |
Shares sold | | | 896 | | | | 10,000 | | | | — | | | | — | |
Reinvestment of distributions | | | 44 | | | | 463 | | | | — | | | | — | |
Shares redeemed | | | — | | | | — | | | | — | | | | — | |
| | | | 940 | | | | 10,463 | | | | — | | | | — | |
NET DECREASE | | | (2,841,913 | ) | | $ | (32,591,359 | ) | | | (5,857,249 | ) | | $ | (66,356,148 | ) |
| (a) | | Class B Shares were converted into Class A Shares at the close of business on November 14, 2014. |
| (b) | | Commenced operations on July 31, 2015. |
82
GOLDMAN SACHS FUND OF FUNDS PORTFOLIOS
| | | | | | | | | | | | | | | | | | | | | | | | | | | | | | |
| Equity Growth Strategy Portfolio | | | Growth and Income Strategy Portfolio | |
For the Fiscal Year Ended
December 31, 2015
| | | For the Fiscal Year Ended
December 31, 2014
| | | For the Fiscal Year Ended
December 31, 2015
| | | For the Fiscal Year Ended
December 31, 2014
| |
| Shares | | | Dollars | | | Shares | | | Dollars | | | Shares | | | Dollars | | | Shares | | | Dollars | |
| | | | | | | | | | | | | | | | | | | | | | | | | | | | | | |
| | 676,655 | | | $ | 9,974,657 | | | | 1,515,053 | | | $ | 22,283,515 | | | | 1,768,260 | | | $ | 21,602,904 | | | | 4,896,628 | | | $ | 60,903,871 | |
| | 82,676 | | | | 1,204,590 | | | | 167,978 | | | | 2,445,759 | | | | 953,718 | | | | 11,292,981 | | | | 785,816 | | | | 9,570,467 | |
| | — | | | | — | | | | 215,998 | | | | 3,198,094 | | | | — | | | | — | | | | 260,321 | | | | 3,250,073 | |
| | (1,703,707 | ) | | | (25,116,148 | ) | | | (2,275,926 | ) | | | (33,407,481 | ) | | | (7,104,902 | ) | | | (86,365,538 | ) | | | (8,081,044 | ) | | | (100,125,769 | ) |
| | (944,376 | ) | | | (13,936,901 | ) | | | (376,897 | ) | | | (5,480,113 | ) | | | (4,382,924 | ) | | | (53,469,653 | ) | | | (2,138,279 | ) | | | (26,401,358 | ) |
| | | | | | | | | | | | | | | | | | | | | | | | | | | | | | |
| | — | | | | — | | | | 2,142 | | | | 31,746 | | | | — | | | | — | | | | 12,770 | | | | 156,335 | |
| | — | | | | — | | | | 3 | | | | 38 | | | | — | | | | — | | | | — | | | | — | |
| | — | | | | — | | | | (225,401 | ) | | | (3,198,094 | ) | | | — | | | | — | | | | (263,631 | ) | | | (3,250,073 | ) |
| | — | | | | — | | | | (948,110 | ) | | | (13,444,880 | ) | | | — | | | | — | | | | (3,477,471 | ) | | | (42,829,682 | ) |
| | — | | | | — | | | | (1,171,366 | ) | | | (16,611,190 | ) | | | — | | | | — | | | | (3,728,332 | ) | | | (45,923,420 | ) |
| | | | | | | | | | | | | | | | | | | | | | | | | | | | | | |
| | 284,359 | | | | 4,016,390 | | | | 404,472 | | | | 5,636,695 | | | | 580,448 | | | | 6,940,989 | | | | 693,882 | | | | 8,419,930 | |
| | 10,509 | | | | 146,500 | | | | 63,476 | | | | 884,227 | | | | 292,948 | | | | 3,395,270 | | | | 239,465 | | | | 2,864,001 | |
| | (1,224,982 | ) | | | (17,302,688 | ) | | | (1,245,558 | ) | | | (17,386,336 | ) | | | (2,579,627 | ) | | | (31,019,966 | ) | | | (3,036,459 | ) | | | (37,073,371 | ) |
| | (930,114 | ) | | | (13,139,798 | ) | | | (777,610 | ) | | | (10,865,414 | ) | | | (1,706,231 | ) | | | (20,683,707 | ) | | | (2,103,112 | ) | | | (25,789,440 | ) |
| | | | | | | | | | | | | | | | | | | | | | | | | | | | | | |
| | 686,493 | | | | 10,239,123 | | | | 1,451,178 | | | | 21,496,888 | | | | 8,096,398 | | | | 98,631,039 | | | | 10,016,507 | | | | 124,314,848 | |
| | 108,006 | | | | 1,586,607 | | | | 187,440 | | | | 2,753,491 | | | | 1,345,558 | | | | 16,000,494 | | | | 978,957 | | | | 11,987,180 | |
| | (1,688,667 | ) | | | (25,135,152 | ) | | | (1,314,720 | ) | | | (19,442,384 | ) | | | (7,374,741 | ) | | | (90,550,667 | ) | | | (5,256,547 | ) | | | (65,438,884 | ) |
| | (894,168 | ) | | | (13,309,422 | ) | | | 323,898 | | | | 4,807,995 | | | | 2,067,215 | | | | 24,080,866 | | | | 5,738,917 | | | | 70,863,144 | |
| | | | | | | | | | | | | | | | | | | | | | | | | | | | | | |
| | 1,980 | | | | 29,181 | | | | 5,045 | | | | 74,244 | | | | 19,459 | | | | 237,746 | | | | 40,316 | | | | 500,650 | |
| | 227 | | | | 3,291 | | | | 446 | | | | 6,468 | | | | 2,595 | | | | 30,630 | | | | 1,993 | | | | 24,215 | |
| | (5,553 | ) | | | (80,960 | ) | | | (12,312 | ) | | | (184,974 | ) | | | (50,731 | ) | | | (622,650 | ) | | | (57,156 | ) | | | (703,249 | ) |
| | (3,346 | ) | | | (48,488 | ) | | | (6,821 | ) | | | (104,262 | ) | | | (28,677 | ) | | | (354,274 | ) | | | (14,847 | ) | | | (178,384 | ) |
| | | | | | | | | | | | | | | | | | | | | | | | | | | | | | |
| | 54,518 | | | | 797,164 | | | | 128,701 | | | | 1,875,726 | | | | 46,050 | | | | 561,646 | | | | 91,503 | | | | 1,132,622 | |
| | 4,774 | | | | 68,602 | | | | 7,357 | | | | 105,720 | | | | 10,181 | | | | 120,119 | | | | 7,441 | | | | 90,372 | |
| | (58,755 | ) | | | (842,269 | ) | | | (30,691 | ) | | | (438,793 | ) | | | (78,343 | ) | | | (948,958 | ) | | | (41,517 | ) | | | (514,940 | ) |
| | 537 | | | | 23,497 | | | | 105,367 | | | | 1,542,653 | | | | (22,112 | ) | | | (267,193 | ) | | | 57,427 | | | | 708,054 | |
| | | | | | | | | | | | | | | | | | | | | | | | | | | | | | |
| | 20,939 | | | | 308,444 | | | | 30,885 | | | | 453,822 | | | | 62,558 | | | | 755,003 | | | | 46,421 | | | | 567,610 | |
| | 740 | | | | 10,730 | | | | 2,180 | | | | 31,566 | | | | 5,640 | | | | 66,335 | | | | 4,797 | | | | 58,023 | |
| | (60,296 | ) | | | (889,266 | ) | | | (134,144 | ) | | | (1,953,136 | ) | | | (69,141 | ) | | | (843,828 | ) | | | (132,698 | ) | | | (1,623,551 | ) |
| | (38,617 | ) | | | (570,092 | ) | | | (101,079 | ) | | | (1,467,748 | ) | | | (943 | ) | | | (22,490 | ) | | | (81,480 | ) | | | (997,918 | ) |
| | | | | | | | | | | | | | | | | | | | | | | | | | | | | | |
| | 650 | | | | 10,000 | | | | — | | | | — | | | | 806 | | | | 10,005 | | | | — | | | | — | |
| | 9 | | | | 134 | | | | — | | | | — | | | | 28 | | | | 326 | | | | — | | | | — | |
| | — | | | | — | | | | — | | | | — | | | | (1 | ) | | | (5 | ) | | | — | | | | — | |
| | 659 | | | | 10,134 | | | | — | | | | — | | | | 833 | | | | 10,326 | | | | — | | | | — | |
| | (2,809,425 | ) | | $ | (40,971,070 | ) | | | (2,004,508 | ) | | $ | (28,178,079 | ) | | | (4,072,839 | ) | | $ | (50,706,125 | ) | | | (2,269,706 | ) | | $ | (27,719,322 | ) |
83
GOLDMAN SACHS FUND OF FUNDS PORTFOLIOS
Notes to Financial Statements (continued)
December 31, 2015
|
| 10. SUMMARY OF SHARE TRANSACTIONS (continued) |
Share activity is as follows:
| | | | | | | | | | | | | | | | |
| | | Growth Strategy Portfolio | |
| | | | |
| | | For the Fiscal Year Ended
December 31, 2015
| | | For the Fiscal Year Ended
December 31, 2014
| |
| | | | |
| | | Shares | | | Dollars | | | Shares | | | Dollars | |
| | | | |
| Class A Shares | | | | | | | | | | | | | | | | |
Shares sold | | | 1,511,876 | | | $ | 19,926,822 | | | | 4,488,971 | | | $ | 59,400,768 | |
Reinvestment of distributions | | | 386,955 | | | | 4,964,638 | | | | 609,249 | | | | 7,908,058 | |
Shares converted from Class B(a) | | | — | | | | — | | | | 534,180 | | | | 7,106,965 | |
Shares redeemed | | | (5,237,451 | ) | | | (68,894,549 | ) | | | (5,981,400 | ) | | | (78,872,890 | ) |
| | | | (3,338,620 | ) | | | (44,003,089 | ) | | | (349,000 | ) | | | (4,457,099 | ) |
| Class B Shares(a) | | | | | | | | | | | | | | | | |
Shares sold | | | — | | | | — | | | | 14,935 | | | | 193,386 | |
Shares converted to Class A | | | — | | | | — | | | | (533,365 | ) | | | (7,106,965 | ) |
Shares redeemed | | | — | | | | — | | | | (3,164,313 | ) | | | (42,102,856 | ) |
| | | | — | | | | — | | | | (3,682,743 | ) | | | (49,016,435 | ) |
| Class C Shares | | | | | | | | | | | | | | | | |
Shares sold | | | 548,668 | | | | 7,149,402 | | | | 675,102 | | | | 8,782,816 | |
Reinvestment of distributions | | | 79,160 | | | | 1,013,242 | | | | 163,460 | | | | 2,116,808 | |
Shares redeemed | | | (2,637,119 | ) | | | (34,481,265 | ) | | | (3,098,849 | ) | | | (40,520,777 | ) |
| | | | (2,009,291 | ) | | | (26,318,621 | ) | | | (2,260,287 | ) | | | (29,621,153 | ) |
| Institutional Shares | | | | | | | | | | | | | | | | |
Shares sold | | | 6,147,217 | | | | 79,984,554 | | | | 5,106,964 | | | | 67,371,655 | |
Reinvestment of distributions | | | 462,758 | | | | 5,927,936 | | | | 520,860 | | | | 6,755,555 | |
Shares redeemed | | | (3,465,050 | ) | | | (45,715,102 | ) | | | (3,988,778 | ) | | | (52,586,723 | ) |
| | | | 3,144,925 | | | | 40,197,388 | | | | 1,639,046 | | | | 21,540,487 | |
| Service Shares | | | | | | | | | | | | | | | | |
Shares sold | | | 30,816 | | | | 406,731 | | | | 42,084 | | | | 548,111 | |
Reinvestment of distributions | | | 534 | | | | 6,830 | | | | 878 | | | | 11,375 | |
Shares redeemed | | | (57,719 | ) | | | (752,000 | ) | | | (114,329 | ) | | | (1,488,776 | ) |
| | | | (26,369 | ) | | | (338,439 | ) | | | (71,367 | ) | | | (929,290 | ) |
| Class IR Shares | | | | | | | | | | | | | | | | |
Shares sold | | | 56,747 | | | | 740,404 | | | | 110,331 | | | | 1,438,543 | |
Reinvestment of distributions | | | 6,138 | | | | 77,652 | | | | 8,102 | | | | 103,782 | |
Shares redeemed | | | (87,431 | ) | | | (1,117,848 | ) | | | (48,147 | ) | | | (624,329 | ) |
| | | | (24,546 | ) | | | (299,792 | ) | | | 70,286 | | | | 917,996 | |
| Class R Shares | | | | | | | | | | | | | | | | |
Shares sold | | | 55,152 | | | | 709,805 | | | | 47,058 | | | | 598,365 | |
Reinvestment of distributions | | | 2,235 | | | | 28,023 | | | | 3,680 | | | | 46,738 | |
Shares redeemed | | | (65,230 | ) | | | (842,319 | ) | | | (189,996 | ) | | | (2,433,642 | ) |
| | | | (7,843 | ) | | | (104,491 | ) | | | (139,258 | ) | | | (1,788,539 | ) |
| Class R6 Shares(b) | | | | | | | | | | | | | | | | |
Shares sold | | | 745 | | | | 10,005 | | | | — | | | | — | |
Reinvestment of distributions | | | 15 | | | | 193 | | | | — | | | | — | |
Shares redeemed | | | (1 | ) | | | (5 | ) | | | — | | | | — | |
| | | | 759 | | | | 10,193 | | | | — | | | | — | |
NET DECREASE | | | (2,260,985 | ) | | $ | (30,856,851 | ) | | | (4,793,323 | ) | | $ | (63,354,033 | ) |
| (a) | | Class B Shares were converted into Class A Shares at the close of business on November 14, 2014. |
| (b) | | Commenced operations on July 31, 2015. |
84
GOLDMAN SACHS FUND OF FUNDS PORTFOLIOS
|
| 10. SUMMARY OF SHARE TRANSACTIONS (continued) |
Share activity is as follows:
| | | | | | | | | | | | | | | | |
| | | Satellite Strategies Portfolio | |
| | | | |
| | | For the Fiscal Year Ended
December 31, 2015
| | | For the Fiscal Year Ended
December 31, 2014
| |
| | | | |
| | | Shares | | | Dollars | | | Shares | | | Dollars | |
| | | | |
| Class A Shares | | | | | | | | | | | | | | | | |
Shares sold | | | 3,053,112 | | | $ | 24,160,171 | | | | 4,251,256 | | | $ | 35,288,986 | |
Shares issued in connection with merger | | | — | | | | — | | | | 1,059,709 | | | | 8,986,329 | |
Reinvestment of distributions | | | 416,665 | | | | 3,217,214 | | | | 709,050 | | | | 5,782,445 | |
Shares redeemed | | | (10,046,496 | ) | | | (79,422,300 | ) | | | (11,963,386 | ) | | | (99,618,364 | ) |
| | | | (6,576,719 | ) | | | (52,044,915 | ) | | | (5,943,371 | ) | | | (49,560,604 | ) |
| Class C Shares | | | | | | | | | | | | | | | | |
Shares sold | | | 473,325 | | | | 3,696,702 | | | | 1,298,464 | | | | 10,720,418 | |
Shares issued in connection with merger | | | — | | | | — | | | | 1,042,640 | | | | 8,779,032 | |
Reinvestment of distributions | | | 144,352 | | | | 1,108,594 | | | | 251,699 | | | | 2,029,786 | |
Shares redeemed | | | (4,416,585 | ) | | | (34,528,139 | ) | | | (4,066,099 | ) | | | (33,513,993 | ) |
| | | | (3,798,908 | ) | | | (29,722,843 | ) | | | (1,473,296 | ) | | | (11,984,757 | ) |
| Institutional Shares | | | | | | | | | | | | | | | | |
Shares sold | | | 16,547,453 | | | | 130,796,353 | | | | 23,027,158 | | | | 191,277,501 | |
Shares issued in connection with merger | | | — | | | | — | | | | 666,837 | | | | 5,648,133 | |
Reinvestment of distributions | | | 2,074,866 | | | | 15,974,611 | | | | 2,740,846 | | | | 22,271,662 | |
Shares redeemed | | | (36,331,336 | ) | | | (285,068,382 | ) | | | (25,300,663 | ) | | | (208,175,445 | ) |
| | | | (17,709,017 | ) | | | (138,297,418 | ) | | | 1,134,178 | | | | 11,021,851 | |
| Service Shares | | | | | | | | | | | | | | | | |
Shares sold | | | 91,527 | | | | 720,762 | | | | 322,987 | | | | 2,647,221 | |
Reinvestment of distributions | | | 636 | | | | 4,902 | | | | 7,546 | | | | 62,168 | |
Shares redeemed | | | (1,755,150 | ) | | | (14,049,930 | ) | | | (2,040,358 | ) | | | (16,832,023 | ) |
| | | | (1,662,987 | ) | | | (13,324,266 | ) | | | (1,709,825 | ) | | | (14,122,634 | ) |
| Class IR Shares | | | | | | | | | | | | | | | | |
Shares sold | | | 2,415,950 | | | | 19,126,605 | | | | 4,096,303 | | | | 33,949,999 | |
Shares issued in connection with merger | | | — | | | | — | | | | 337,317 | | | | 2,857,060 | |
Reinvestment of distributions | | | 272,144 | | | | 2,096,195 | | | | 383,885 | | | | 3,125,909 | |
Shares redeemed | | | (4,524,440 | ) | | | (35,516,369 | ) | | | (5,120,641 | ) | | | (41,983,001 | ) |
| | | | (1,836,346 | ) | | | (14,293,569 | ) | | | (303,136 | ) | | | (2,050,033 | ) |
| Class R Shares | | | | | | | | | | | | | | | | |
Shares sold | | | 52,342 | | | | 412,303 | | | | 129,895 | | | | 1,070,148 | |
Shares issued in connection with merger | | | — | | | | — | | | | 16,067 | | | | 135,602 | |
Reinvestment of distributions | | | 8,789 | | | | 67,419 | | | | 12,677 | | | | 102,911 | |
Shares redeemed | | | (85,496 | ) | | | (672,855 | ) | | | (176,932 | ) | | | (1,449,955 | ) |
| | | | (24,365 | ) | | | (193,133 | ) | | | (18,293 | ) | | | (141,294 | ) |
| Class R6 Shares(a) | | | | | | | | | | | | | | | | |
Shares sold | | | 1,265 | | | | 10,000 | | | | — | | | | — | |
Reinvestment of distributions | | | 20 | | | | 152 | | | | — | | | | — | |
| | | | 1,285 | | | | 10,152 | | | | — | | | | — | |
NET DECREASE | | | (31,607,057 | ) | | $ | (247,865,992 | ) | | | (8,313,743 | ) | | $ | (66,837,471 | ) |
| (a) | | Commenced operations on July 31, 2015. |
85
Report of Independent Registered Public
Accounting Firm
To the Board of Trustees of Goldman Sachs Trust and Shareholders of
Goldman Sachs Fund of Funds Portfolios:
In our opinion, the accompanying statements of assets and liabilities, including the schedules of investments, and the related statements of operations and of changes in net assets and the financial highlights present fairly, in all material respects, the financial position of the Goldman Sachs Balanced Strategy Portfolio, the Goldman Sachs Equity Growth Strategy Portfolio, the Goldman Sachs Growth and Income Strategy Portfolio, the Goldman Sachs Growth Strategy Portfolio and the Goldman Sachs Satellite Strategies Portfolio (collectively the “Fund of Funds Portfolios”), portfolios of Goldman Sachs Trust, at December 31, 2015, and the results of each of their operations, the changes in each of their net assets and the financial highlights for each of the periods indicated, in conformity with accounting principles generally accepted in the United States of America. These financial statements and financial highlights (hereafter referred to as “financial statements”) are the responsibility of the Fund of Funds Portfolios’ management. Our responsibility is to express an opinion on these financial statements based on our audits. We conducted our audits of these financial statements in accordance with the standards of the Public Company Accounting Oversight Board (United States). Those standards require that we plan and perform the audit to obtain reasonable assurance about whether the financial statements are free of material misstatement. An audit includes examining, on a test basis, evidence supporting the amounts and disclosures in the financial statements, assessing the accounting principles used and significant estimates made by management, and evaluating the overall financial statement presentation. We believe that our audits, which included confirmation of securities at December 31, 2015 by correspondence with brokers and the transfer agent of the underlying funds, provide a reasonable basis for the opinion expressed above.
PricewaterhouseCoopers LLP
Boston, Massachusetts
February 26, 2016
86
GOLDMAN SACHS FUND OF FUNDS PORTFOLIOS
Portfolio Expenses — Six Month Period Ended December 31, 2015 (Unaudited)
As a shareholder of Class A, Class C, Institutional, Service, Class IR, Class R and Class R6 Shares of a Portfolio, you incur two types of costs: (1) transaction costs, including sales charges on purchase payments (with respect to Class A Shares), contingent deferred sales charges on redemptions (with respect to Class C Shares), and (2) ongoing costs, including management fees; distribution and service (12b-1) fees (with respect to Class A, Class C and Class R Shares); and other Portfolio expenses. This Example is intended to help you understand your ongoing costs (in dollars) of investing in Class A, Class C, Institutional, Service, Class IR, Class R or Class R6 Shares of the Portfolios and to compare these costs with the ongoing costs of investing in other mutual funds.
The Example is based on an investment of $1,000 invested at the beginning of the period and held for the entire period from July 1, 2015 through December 31, 2015, which represents a period of 184 days of a 365 day year.
Actual Expenses — The first line under each share class in the table below provides information about actual account values and actual expenses. You may use the information in this line, together with the amount you invested, to estimate the expenses that you paid over the period. Simply divide your account value by $1,000 (for example, an $8,600 account value divided by $1,000=8.6), then multiply the result by the number in the first line under the heading entitled “Expenses Paid” to estimate the expenses you paid on your account during this period.
Hypothetical Example for Comparison Purposes — The second line under each share class in the table below provides information about hypothetical account values and hypothetical expenses based on the Portfolios’ actual net expense ratios and an assumed rate of return of 5% per year before expenses, which is not the Portfolios’ actual return. The hypothetical account values and expenses may not be used to estimate the actual ending account balance or expenses you paid for the period. You may use this information to compare the ongoing costs of investing in the Portfolios and other funds. To do so, compare this 5% hypothetical example with the 5% hypothetical examples that appear in the shareholder reports of the other funds.
Please note that the expenses shown in the table are meant to highlight your ongoing costs only and do not reflect any transactional costs, such as sales charges, redemption fees, or exchange fees. Therefore, the second line of the table is useful in comparing ongoing costs only, and will not help you determine the relative total costs of owning different funds. In addition, if these transactional costs were included, your costs would have been higher.
| | | | | | | | | | | | | | | | | | | | | | | | | | | | | | | | | | | | |
| | | Balanced Strategy Portfolio | | | Equity Growth Strategy Portfolio | | | Growth and Income Strategy Portfolio | |
| Share Class | | Beginning
Account
Value
7/1/15 | | | Ending
Account
Value
12/31/15 | | | Expenses
Paid for the
6 months ended
12/31/15* | | | Beginning
Account
Value
7/1/15 | | | Ending
Account
Value
12/31/15 | | | Expenses
Paid for the
6 months ended
12/31/15* | | | Beginning
Account
Value
7/1/15 | | | Ending
Account
Value
12/31/15 | | | Expenses
Paid for the
6 months ended
12/31/15* | |
| Class A | | | | | | | | | | | | | | | | | | | | | | | | | | | | | | | | | | | | |
Actual | | $ | 1,000.00 | | | $ | 985.70 | | | $ | 2.95 | | | $ | 1,000.00 | | | $ | 970.00 | | | $ | 2.93 | | | $ | 1,000.00 | | | $ | 977.00 | | | $ | 2.94 | |
Hypothetical 5% return | | | 1,000.00 | | | | 1,022.23 | | | | 3.01 | | | | 1,000.00 | | | | 1,022.23 | | | | 3.01 | | | | 1,000.00 | | | | 1,022.23 | | | | 3.01 | |
| Class C | | | | | | | | | | | | | | | | | | | | | | | | | | | | | | | | | | | | |
Actual | | | 1,000.00 | | | | 981.90 | | | | 6.69 | | | | 1,000.00 | | | | 966.30 | | | | 6.69 | | | | 1,000.00 | | | | 973.70 | | | | 6.67 | |
Hypothetical 5% return | | | 1,000.00 | | | | 1,018.45 | | | | 6.82 | | | | 1,000.00 | | | | 1,018.40 | | | | 6.87 | | | | 1,000.00 | | | | 1,018.45 | | | | 6.82 | |
| Institutional | | | | | | | | | | | | | | | | | | | | | | | | | | | | | | | | | | | | |
Actual | | | 1,000.00 | | | | 987.80 | | | | 0.95 | | | | 1,000.00 | | | | 972.40 | | | | 0.94 | | | | 1,000.00 | | | | 979.10 | | | | 0.95 | |
Hypothetical 5% return | | | 1,000.00 | | | | 1,024.25 | | | | 0.97 | | | | 1,000.00 | | | | 1,024.25 | | | | 0.97 | | | | 1,000.00 | | | | 1,024.25 | | | | 0.97 | |
| Service | | | | | | | | | | | | | | | | | | | | | | | | | | | | | | | | | | | | |
Actual | | | 1,000.00 | | | | 985.30 | | | | 3.45 | | | | 1,000.00 | | | | 969.50 | | | | 3.43 | | | | 1,000.00 | | | | 977.30 | | | | 3.44 | |
Hypothetical 5% return | | | 1,000.00 | | | | 1,021.73 | | | | 3.52 | | | | 1,000.00 | | | | 1,021.73 | | | | 3.52 | | | | 1,000.00 | | | | 1,021.73 | | | | 3.52 | |
| Class IR | | | | | | | | | | | | | | | | | | | | | | | | | | | | | | | | | | | | |
Actual | | | 1,000.00 | | | | 987.00 | | | | 1.70 | | | | 1,000.00 | | | | 971.70 | | | | 1.69 | | | | 1,000.00 | | | | 978.20 | | | | 1.70 | |
Hypothetical 5% return | | | 1,000.00 | | | | 1,023.49 | | | | 1.73 | | | | 1,000.00 | | | | 1,023.49 | | | | 1.73 | | | | 1,000.00 | | | | 1,023.49 | | | | 1.73 | |
| Class R | | | | | | | | | | | | | | | | | | | | | | | | | | | | | | | | | | | | |
Actual | | | 1,000.00 | | | | 983.60 | | | | 4.20 | | | | 1,000.00 | | | | 969.00 | | | | 4.17 | | | | 1,000.00 | | | | 976.60 | | | | 4.18 | |
Hypothetical 5% return | | | 1,000.00 | | | | 1,020.97 | | | | 4.28 | | | | 1,000.00 | | | | 1,020.97 | | | | 4.28 | | | | 1,000.00 | | | | 1,020.97 | | | | 4.28 | |
| Class R6(a) | | | | | | | | | | | | | | | | | | | | | | | | | | | | | | | | | | | | |
Actual | | | 1,000.00 | | | | 979.90 | | | | 0.79 | | | | 1,000.00 | | | | 960.70 | | | | 0.74 | | | | 1,000.00 | | | | 971.30 | | | | 0.79 | |
Hypothetical 5% return | | | 1,000.00 | | | | 1,020.16 | | | | 0.80 | | | | 1,000.00 | | | | 1,020.20 | | | | 0.76 | | | | 1,000.00 | | | | 1,020.16 | | | | 0.80 | |
87
GOLDMAN SACHS FUND OF FUNDS PORTFOLIOS
Portfolio Expenses — Six Month Period Ended December 31, 2015 (Unaudited) (continued)
| | | | | | | | | | | | | | | | | | | | | | | | |
| | | Growth Strategy Portfolio | | | Satellite Strategies Portfolio | |
| Share Class | | Beginning
Account
Value
7/1/15 | | | Ending
Account
Value
12/31/15 | | | Expenses
Paid for the
6 months ended
12/31/15* | | | Beginning
Account
Value
7/1/15 | | | Ending
Account
Value
12/31/15 | | | Expenses
Paid for the
6 months ended
12/31/15** | |
| Class A | | | | | | | | | | | | | | | | | | | | | | | | |
Actual | | $ | 1,000.00 | | | $ | 969.90 | | | $ | 2.93 | | | $ | 1,000.00 | | | $ | 951.30 | | | $ | 2.80 | |
Hypothetical 5% return | | | 1,000.00 | | | | 1,022.23 | | | | 3.01 | | | | 1,000.00 | | | | 1,022.33 | | | | 2.91 | |
| Class C | | | | | | | | | | | | | | | | | | | | | | | | |
Actual | | | 1,000.00 | | | | 966.30 | | | | 6.64 | | | | 1,000.00 | | | | 948.40 | | | | 6.53 | |
Hypothetical 5% return | | | 1,000.00 | | | | 1,018.45 | | | | 6.82 | | | | 1,000.00 | | | | 1,018.50 | | | | 6.77 | |
| Institutional | | | | | | | | | | | | | | | | | | | | | | | | |
Actual | | | 1,000.00 | | | | 972.60 | | | | 0.94 | | | | 1,000.00 | | | | 953.20 | | | | 0.84 | |
Hypothetical 5% return | | | 1,000.00 | | | | 1,024.25 | | | | 0.97 | | | | 1,000.00 | | | | 1,024.35 | | | | 0.87 | |
| Service | | | | | | | | | | | | | | | | | | | | | | | | |
Actual | | | 1,000.00 | | | | 969.70 | | | | 3.43 | | | | 1,000.00 | | | | 950.20 | | | | 3.29 | |
Hypothetical 5% return | | | 1,000.00 | | | | 1,021.73 | | | | 3.52 | | | | 1,000.00 | | | | 1,021.83 | | | | 3.41 | |
| Class IR | | | | | | | | | | | | | | | | | | | | | | | | |
Actual | | | 1,000.00 | | | | 970.80 | | | | 1.69 | | | | 1,000.00 | | | | 952.40 | | | | 1.57 | |
Hypothetical 5% return | | | 1,000.00 | | | | 1,023.49 | | | | 1.73 | | | | 1,000.00 | | | | 1,023.59 | | | | 1.63 | |
| Class R | | | | | | | | | | | | | | | | | | | | | | | | |
Actual | | | 1,000.00 | | | | 968.50 | | | | 4.17 | | | | 1,000.00 | | | | 949.90 | | | | 4.03 | |
Hypothetical 5% return | | | 1,000.00 | | | | 1,020.97 | | | | 4.28 | | | | 1,000.00 | | | | 1,021.07 | | | | 4.18 | |
| Class R6(a) | | | | | | | | | | | | | | | | | | | | | | | | |
Actual | | | 1,000.00 | | | | 963.40 | | | | 0.86 | | | | 1,000.00 | | | | 955.70 | | | | 0.61 | |
Hypothetical 5% return | | | 1,000.00 | | | | 1,020.08 | | | | 0.89 | | | | 1,000.00 | | | | 1,020.33 | | | | 0.64 | |
| * | | Expenses for each share class are calculated using each Portfolio’s annualized net expense ratio for each class, which represents the ongoing expenses as a percentage of net assets for the six months ended December 31, 2015. Expenses are calculated by multiplying the annualized net expense ratio by the average account value for the period; then multiplying the result by the number of days in the most recent fiscal half year; and then dividing that result by the number of days in the fiscal year. The annualized net expense ratios for the period were as follows: |
| | | | | | | | | | | | | | | | | | | | | | | | | | | | |
| Portfolio | | Class A | | | Class C | | | Institutional | | | Service | | | Class IR | | | Class R | | | Class R6 | |
Balanced Strategy | | | 0.59 | % | | | 1.34 | % | | | 0.19 | % | | | 0.69 | % | | | 0.34 | % | | | 0.84 | % | | | 0.19 | % |
Equity Growth Strategy | | | 0.59 | | | | 1.35 | | | | 0.19 | | | | 0.69 | | | | 0.34 | | | | 0.84 | | | | 0.18 | |
Growth and Income Strategy | | | 0.59 | | | | 1.34 | | | | 0.19 | | | | 0.69 | | | | 0.34 | | | | 0.84 | | | | 0.19 | |
Growth Strategy | | | 0.59 | | | | 1.34 | | | | 0.19 | | | | 0.69 | | | | 0.34 | | | | 0.84 | | | | 0.21 | |
Satellite Strategies | | | 0.57 | | | | 1.33 | | | | 0.17 | | | | 0.67 | | | | 0.32 | | | | 0.82 | | | | 0.15 | |
(a) Commenced operations on July 31, 2015.
88
GOLDMAN SACHS FUND OF FUNDS PORTFOLIOS
Trustees and Officers (Unaudited)
Independent Trustees
| | | | | | | | | | |
Name,
Address and Age1 | | Position(s) Held with the Trust | | Term of Office and
Length of
Time Served2 | | Principal Occupation(s) During Past 5 Years | | Number of
Portfolios in
Fund Complex
Overseen by
Trustee3 | | Other Directorships Held by Trustee4 |
Ashok N. Bakhru Age: 73 | | Chairman of the Board of Trustees | | Since 1996 (Trustee since 1991) | | Mr. Bakhru is retired. He was formerly Director, Apollo Investment Corporation (a business development company) (2008-2013); President, ABN Associates (a management and financial consulting firm) (1994-1996 and 1998-2012); Trustee, Scholarship America (1998-2005); Trustee, Institute for Higher Education Policy (2003-2008); Director, Private Equity Investors — III and IV (1998-2007), and Equity-Linked Investors II (April 2002-2007). Chairman of the Board of Trustees — Goldman Sachs Fund Complex. | | 139 | | None |
Kathryn A. Cassidy Age: 61 | | Trustee | | Since 2015 | | Ms. Cassidy is retired. Formerly, she was Advisor to the Chairman (May 2014-December 2014); and Senior Vice President and Treasurer (2008-2014), General Electric Company & General Electric Capital Corporation (technology and financial services companies). Trustee — Goldman Sachs Fund Complex. | | 114 | | None |
John P. Coblentz, Jr. Age: 74 | | Trustee | | Since 2003 retiring effective 1/1/2016, term is through 12/31/2015 | | Mr. Coblentz is retired. Formerly, he was Partner, Deloitte & Touche LLP (a professional services firm) (1975-2003); Director, Emerging Markets Group, Ltd. (2004-2006); and Director, Elderhostel, Inc. (2006-2012). Trustee — Goldman Sachs Fund Complex. | | 139 | | None |
Diana M. Daniels Age: 66 | | Trustee | | Since 2007 | | Ms. Daniels is retired. Formerly, she was Vice President, General Counsel and Secretary, The Washington Post Company (1991-2006). Ms. Daniels is a Trustee Emeritus and serves as a Presidential Councillor of Cornell University (2013-Present); Member, Advisory Board, Psychology Without Borders (international humanitarian aid organization) (2007-Present), and former Member of the Legal Advisory Board, New York Stock Exchange (2003-2006) and of the Corporate Advisory Board, Standish Mellon Management Advisors (2006-2007). Trustee — Goldman Sachs Fund Complex. | | 114 | | None |
Joseph P. LoRusso Age: 58 | | Trustee | | Since 2010 retiring effective 1/1/2016, term is through 12/31/2015 | | Mr. LoRusso is retired. Formerly, he was President, Fidelity Investments Institutional Services Co. (“FIIS”) (2002-2008); Director, FIIS (2002-2008); Director, Fidelity Investments Institutional Operations Company (2003-2007); Executive Officer, Fidelity Distributors Corporation (2007-2008). Trustee — Goldman Sachs Fund Complex. | | 114 | | None |
Herbert J. Markley Age: 65 | | Trustee | | Since 2013 | | Mr. Markley is retired. Formerly, he was Executive Vice President, Deere & Company (an agricultural and construction equipment manufacturer) (2007-2009); and President, Agricultural Division, Deere & Company (2001-2007). Trustee — Goldman Sachs Fund Complex. | | 114 | | None |
Jessica Palmer Age: 66 | | Trustee | | Since 2007 | | Ms. Palmer is retired. She is Director, Emerson Center for the Arts and Culture (2011-Present); and was formerly a Consultant, Citigroup Human Resources Department (2007-2008); Managing Director, Citigroup Corporate and Investment Banking (previously, Salomon Smith Barney/Salomon Brothers) (1984-2006). Ms. Palmer was a Member of the Board of Trustees of Indian Mountain School (private elementary and secondary school) (2004-2009). Trustee — Goldman Sachs Fund Complex. | | 114 | | None |
| | | | | | | | | | |
89
GOLDMAN SACHS FUND OF FUNDS PORTFOLIOS
Trustees and Officers (Unaudited) (continued)
Independent Trustees
| | | | | | | | | | |
Name,
Address and Age1 | | Position(s) Held with the Trust | | Term of Office and
Length of
Time Served2 | | Principal Occupation(s) During Past 5 Years | | Number of
Portfolios in
Fund Complex
Overseen by
Trustee3 | | Other Directorships Held by Trustee4 |
Richard P. Strubel Age: 76 | | Trustee | | Since 1987 retiring effective 1/1/2016, term is through 12/31/2015 | | Mr. Strubel is retired. Formerly, he served as Chairman of the Board of Trustees, Northern Funds (a family of retail and institutional mutual funds managed by Northern Trust Investments, Inc.) (2008-2014) and Trustee (1982-2014); Director, Cardean Learning Group (provider of educational services via the internet) (2003-2008); and Director, Gildan Activewear Inc. (a clothing marketing and manufacturing company) (2000-2014). He serves as Trustee Emeritus, The University of Chicago (1987-Present). Trustee — Goldman Sachs Fund Complex. | | 139 | | None |
Roy W. Templin Age: 55 | | Trustee | | Since 2013 | | Mr. Templin is retired. He is Chairman of the Board of Directors, Con-Way Incorporated (2014-Present); and was formerly Executive Vice President and Chief Financial Officer, Whirlpool Corporation (an appliance manufacturer and marketer) (2004-2012). Trustee — Goldman Sachs Fund Complex. | | 114 | | Con-Way Incorporated (a transportation, logistics and supply-chain management services company) |
Gregory G. Weaver Age: 64 | | Trustee | | Since 2015 | | Mr. Weaver is retired. He is Director, Verizon Communications Inc. (2015-Present); and was formerly Chairman and Chief Executive Officer, Deloitte & Touche LLP (a professional services firm) (2001-2005 and 2012-2014); and Member of the Board of Directors, Deloitte & Touche LLP (2006-2012). Trustee — Goldman Sachs Fund Complex. | | 114 | | Verizon Communications Inc. |
| | | | | | | | | | |
90
GOLDMAN SACHS FUND OF FUNDS PORTFOLIOS
Trustees and Officers (Unaudited) (continued)
Interested Trustees*
| | | | | | | | | | |
Name,
Address and Age1 | | Position(s) Held with the Trust | | Term of Office and
Length of
Time Served2 | | Principal Occupation(s) During Past 5 Years | | Number of
Portfolios in
Fund Complex
Overseen by
Trustee3 | | Other Directorships Held by Trustee4 |
James A. McNamara Age: 53 | | President and Trustee | | Since 2007 | | Managing Director, Goldman Sachs (December 1998-Present); Director of Institutional Fund Sales, GSAM (April 1998-December 2000); and Senior Vice President and Manager, Dreyfus Institutional Service Corporation (January 1993- April 1998). President — Goldman Sachs Fund Complex (November 2007-Present); Senior Vice President — Goldman Sachs Fund Complex (May 2007-November 2007); and Vice President — Goldman Sachs Fund Complex (2001-2007). Trustee — Goldman Sachs Fund Complex (November 2007-Present and December 2002-May 2004). | | 138 | | None |
Alan A. Shuch Age: 66 | | Trustee | | Since 1990 | | Advisory Director — GSAM (May 1999-Present); Consultant to GSAM (December 1994-May 1999); and Limited Partner, Goldman Sachs (December 1994-May 1999). Trustee — Goldman Sachs Fund Complex. | | 114 | | None |
| | | | | | | | | | |
| * | | These persons are considered to be “Interested Trustees” because they hold positions with Goldman Sachs and own securities issued by The Goldman Sachs Group, Inc. Each Interested Trustee holds comparable positions with certain other companies of which Goldman Sachs, GSAM or an affiliate thereof is the investment adviser, administrator and/or distributor. |
| 1 | | Each Trustee may be contacted by writing to the Trustee, c/o Goldman Sachs, 200 West Street, New York, New York, 10282, Attn: Caroline Kraus. Information is provided as of December 31, 2015. |
| 2 | | Each Trustee holds office for an indefinite term until the earliest of: (a) the election of his or her successor; (b) the date the Trustee resigns or is removed by the Board of Trustees or shareholders, in accordance with the Trust’s Declaration of Trust; (c) December 31st of the year in which the Trustee turns 74 years of age, subject to waiver by a majority of the Trustees (in accordance with the current resolutions of the Board of Trustees, which may be changed by the Trustees without shareholder vote); or (d) the termination of the Trust. By resolution of the Board of Trustees determining that an extension of service would be beneficial to the Trust, the retirement age has been extended with respect to Richard P. Strubel. |
| 3 | | The Goldman Sachs Fund Complex includes the Trust and Goldman Sachs Variable Insurance Trust (“GSVIT”). As of December 31, 2015, the Trust consisted of 100 portfolios (91 of which offered shares to the public) and GSVIT consisted of 14 portfolios. The Goldman Sachs Fund Complex also includes, with respect to Messrs. Bakhru, Coblentz and Strubel, Goldman Sachs Trust II (“GSTII”), Goldman Sachs BDC, Inc. (“GSBDC”), Goldman Sachs MLP Income Opportunities Fund (“GSMLP”), Goldman Sachs MLP and Energy Renaissance Fund (“GSMER”) and Goldman Sachs ETF Trust (“GSETF”), and with respect to Mr. McNamara, GSTII, GSMLP, GSMER and GSETF. GSTII consisted of eight portfolios (six of which offered shares to the public). GSBDC, GSMLP and GSMER each consisted of one portfolio. GSETF consisted of 14 portfolios (three of which offered shares to the public). |
| 4 | | This column includes only directorships of companies required to report to the Securities and Exchange Commission under the Securities Exchange Act of 1934 (i.e., “public companies”) or other investment companies registered under the Act. |
Additional information about the Trustees is available in the Portfolios’ Statement of Additional Information, which can be obtained from Goldman Sachs free of charge by calling this toll-free number (in the United States of America): 1-800-526-7384.
91
GOLDMAN SACHS FUND OF FUNDS PORTFOLIOS
Trustees and Officers (Unaudited) (continued)
Officers of the Trust*
| | | | | | |
Name, Address and Age1 | | Position(s) Held With the Trust | | Term of
Office and
Length of
Time Served2 | | Principal Occupation(s) During Past 5 Years |
James A. McNamara 200 West Street New York, NY 10282 Age: 53 | | President and Trustee | | Since 2007 | | Managing Director, Goldman Sachs (December 1998-Present); Director of Institutional Fund Sales, GSAM (April 1998-December 2000); and Senior Vice President and Manager, Dreyfus Institutional Service Corporation (January 1993-April 1998). President — Goldman Sachs Fund Complex (November 2007-Present); Senior Vice President — Goldman Sachs Fund Complex (May 2007-November 2007); and Vice President — Goldman Sachs Fund Complex (2001-2007). Trustee — Goldman Sachs Fund Complex (November 2007-Present and December 2002-May 2004). |
Caroline L. Kraus 200 West Street New York, NY 10282 Age: 38 | | Secretary | | Since 2012 | | Vice President, Goldman Sachs (August 2006-Present); Associate General Counsel, Goldman Sachs (2012-Present); Assistant General Counsel, Goldman Sachs (August 2006-December 2011); and Associate, Weil, Gotshal & Manges, LLP (2002-2006). Secretary — Goldman Sachs Fund Complex (August 2012-Present); and Assistant Secretary — Goldman Sachs Fund Complex (June 2012-August 2012). |
Scott M. McHugh 200 West Street New York, NY 10282 Age: 44 | | Principal Financial Officer, Senior Vice President and Treasurer | | Since 2009 (Principal Financial Officer since 2013) | | Vice President, Goldman Sachs (February 2007-Present); Assistant Treasurer of certain mutual funds administered by DWS Scudder (2005-2007); and Director (2005-2007), Vice President (2000-2005), and Assistant Vice President (1998-2000), Deutsche Asset Management or its predecessor (1998-2007). Principal Financial Officer — Goldman Sachs Fund Complex (November 2013-Present); Treasurer — Goldman Sachs Fund Complex (October 2009-Present); Senior Vice President — Goldman Sachs Fund Complex (November 2009-Present); and Assistant Treasurer — Goldman Sachs Fund Complex (May 2007-October 2009). |
| | | | | | |
| * | | Represents a partial list of officers of the Trust. Additional information about all the officers is available in the Portfolios’ Statement of Additional Information, which can be obtained from Goldman Sachs free of charge by calling this toll-free number (in the United States): 1-800-526-7384. |
| 1 | | Information is provided as of December 31, 2015. |
| 2 | | Officers hold office at the pleasure of the Board of Trustees or until their successors are duly elected and qualified. Each officer holds comparable positions with certain other companies of which Goldman Sachs, GSAM or an affiliate thereof is the investment adviser, administrator and/or distributor. |
Goldman Sachs Fund of Funds Portfolios — Tax Information (unaudited)
For the year ended December 31, 2015, 8.02%, 73.76%, 16.60%, 43.08%, and 0.31% of the dividends paid from net investment company taxable income by the Balanced Strategy, Equity Growth Strategy, Growth and Income Strategy, Growth Strategy, and Satellite Strategies Portfolios, respectively, qualify for the dividends received deduction available to corporations.
For the 2015 tax year, each Portfolio has elected to pass through a credit for taxes paid to foreign jurisdictions. The total amount of income received by the Balanced Strategy, Equity Growth Strategy, Growth and Income Strategy, Growth Strategy, and Satellite Strategies Portfolios from sources within foreign countries and possessions of the United States was $0.0150, $0.0752, $0.0319, $0.0488, and $0.0477 per share, respectively, all of which is attributable to qualified passive income. The percentage of net investment income dividends paid by the Balanced Strategy, Equity Growth Strategy, Growth and Income Strategy, Growth Strategy, and Satellite Strategies portfolios during the year from foreign sources was 3.44%, 31.05%, 8.46%, 16.77%, and 16.91%, respectively. The total amount of taxes paid by the Balanced Strategy, Equity Growth Strategy, Growth and Income Strategy, Growth Strategy, and Satellite Strategies Portfolios to such countries was $0.0014, $0.0100, $0.0040, $0.0064, and $0.0088 per share, respectively.
For the year ended December 31, 2015, 13.96%, 100%, 22.32%, 68.46%, and 18.52% of the dividends paid from net investment company taxable income by the Balanced Strategy, Equity Growth Strategy, Growth and Income Strategy, Growth Strategy, and Satellite Strategies Portfolios, respectively, qualify for the reduced tax rate under the Jobs and Growth Tax Relief and Reconciliation Act of 2003.
92
FUNDS PROFILE
Goldman Sachs Funds

Goldman Sachs is a premier financial services firm, known since 1869 for creating thoughtful and customized investment solutions in complex global markets.
Today, the Investment Management Division of Goldman Sachs serves a diverse set of clients worldwide, including private institutions, public entities and individuals. With approximately $1.08 trillion in assets under supervision as of December 31, 2015, Goldman Sachs Asset Management (“GSAM”) has portfolio management teams located around the world and our investment professionals bring firsthand knowledge of local markets to every investment decision. Assets under supervision includes assets under management and other client assets for which Goldman Sachs does not have full discretion. GSAM leverages the resources of Goldman, Sachs & Co. subject to legal, internal and regulatory restrictions.

Money Market1
Financial Square FundsSM
| n | | Financial Square Tax-Free Money Market Fund |
| n | | Financial Square Tax-Exempt Funds |
| n | | Financial Square Treasury Solutions Fund2 |
| n | | Financial Square Government Fund |
| n | | Financial Square Money Market Fund |
| n | | Financial Square Prime Obligations Fund |
| n | | Financial Square Treasury Instruments Fund |
| n | | Financial Square Treasury Obligations Fund |
| n | | Financial Square Federal Instruments Fund |
Fixed Income
Short Duration and Government
| n | | High Quality Floating Rate Fund |
| n | | Limited Maturity Obligations Fund |
| n | | Short Duration Government Fund |
| n | | Short Duration Income Fund |
| n | | Inflation Protected Securities Fund |
Multi-Sector
Municipal and Tax-Free
| n | | High Yield Municipal Fund |
| n | | Dynamic Municipal Income Fund |
| n | | Short Duration Tax-Free Fund |
Single Sector
| n | | Investment Grade Credit Fund |
| n | | High Yield Floating Rate Fund |
| n | | Emerging Markets Debt Fund |
| n | | Local Emerging Markets Debt Fund |
| n | | Dynamic Emerging Markets Debt Fund |
Fixed Income Alternatives
| n | | Long Short Credit Strategies Fund |
| n | | Fixed Income Macro Strategies Fund |
Fundamental Equity
| n | | Small/Mid Cap Value Fund |
| n | | Small/Mid Cap Growth Fund |
| n | | Flexible Cap Growth Fund |
| n | | Concentrated Growth Fund |
| n | | Technology Opportunities Fund3 |
| n | | Growth Opportunities Fund |
| n | | Rising Dividend Growth Fund |
| n | | Dynamic U.S. Equity Fund4 |
Tax-Advantaged Equity
| n | | U.S. Tax-Managed Equity Fund |
| n | | International Tax-Managed Equity Fund |
| n | | U.S. Equity Dividend and Premium Fund |
| n | | International Equity Dividend and Premium Fund |
Equity Insights
| n | | Small Cap Equity Insights Fund |
| n | | U.S. Equity Insights Fund |
| n | | Small Cap Growth Insights Fund |
| n | | Large Cap Growth Insights Fund |
| n | | Large Cap Value Insights Fund |
| n | | Small Cap Value Insights Fund |
| n | | International Small Cap Insights Fund |
| n | | International Equity Insights Fund |
| n | | Emerging Markets Equity Insights Fund |
Fundamental Equity International
| n | | Strategic International Equity Fund |
| n | | Focused International Equity Fund |
| n | | International Small Cap Fund |
| n | | Emerging Markets Equity Fund5 |
Select Satellite6
| n | | Real Estate Securities Fund |
| n | | International Real Estate Securities Fund |
| n | | Commodity Strategy Fund |
| n | | Global Real Estate Securities Fund |
| n | | Dynamic Commodity Strategy Fund |
| n | | Dynamic Allocation Fund |
| n | | Absolute Return Tracker Fund |
| n | | Managed Futures Strategy Fund |
| n | | MLP Energy Infrastructure Fund |
| n | | Multi-Manager Alternatives Fund |
| n | | Multi-Asset Real Return Fund |
| n | | Retirement Portfolio Completion Fund |
Total Portfolio Solutions6
| n | | Global Managed Beta Fund |
| n | | Multi-Manager Non-Core Fixed Income Fund |
| n | | Multi-Manager U.S. Dynamic Equity Fund |
| n | | Multi-Manager Global Equity Fund |
| n | | Multi-Manager International Equity Fund |
| n | | Tactical Tilt Implementation Fund |
| n | | Balanced Strategy Portfolio |
| n | | Multi-Manager Real Assets Strategy Fund |
| n | | Growth and Income Strategy Portfolio |
| n | | Growth Strategy Portfolio |
| n | | Equity Growth Strategy Portfolio |
| n | | Satellite Strategies Portfolio |
| n | | Enhanced Global Equity Portfolio |
| n | | Tax-Advantaged Global Equity Portfolio |
| 1 | | An investment in a money market fund is neither insured nor guaranteed by the Federal Deposit Insurance Corporation (“FDIC”) or any other government agency. Although the Funds seek to preserve the value of your investment at $1.00 per share, it is possible to lose money by investing in the Funds. |
| 2 | | Effective on September 30, 2015, the Goldman Sachs Financial Square Federal Fund was renamed the Goldman Sachs Financial Square Treasury Solutions Fund. |
| 3 | | Effective on July 31, 2015, the Goldman Sachs Technology Tollkeeper Fund was renamed the Goldman Sachs Technology Opportunities Fund. |
| 4 | | Effective on April 30, 2015, the Goldman Sachs U.S. Equity Fund was renamed the Goldman Sachs Dynamic U.S. Equity Fund. |
| 5 | | Effective at the close of business on October 23, 2015, the Goldman Sachs BRIC Fund (Brazil, Russia, India, China) was reorganized with and into the Goldman Sachs Emerging Markets Equity Fund. |
| 6 | | Individual Funds within the Total Portfolio Solutions and Select Satellite categories will have various placement on the risk/return spectrum and may have greater or lesser risk than that indicated by the placement of the general Total Portfolio Solutions or Select Satellite category. |
| *This | | list covers open-end funds only. Please visit our website at www.GSAMFUNDS.com to learn about our closed-end funds. |
| | |
TRUSTEES Ashok N. Bakhru, Chairman Kathryn A. Cassidy Diana M. Daniels Herbert J. Markley James A. McNamara Jessica Palmer Alan A. Shuch Roy W. Templin Gregory G. Weaver | | OFFICERS James A. McNamara, President Scott M. McHugh, Treasurer, Senior Vice President, and Principal Financial Officer Caroline L. Kraus, Secretary |
| |
GOLDMAN, SACHS & CO. Distributor and Transfer Agent | | GOLDMAN SACHS ASSET MANAGEMENT, L.P. Investment Adviser |
Visit our Web site at www.GSAMFUNDS.com to obtain the most recent month-end returns.
Goldman Sachs Asset Management, L.P. 200 West Street, New York, New York 10282
The portfolio risk management process includes an effort to monitor and manage risk, but does not imply low risk.
The reports concerning the Portfolios included in this shareholder report may contain certain forward-looking statements about the factors that may affect the performance of the Portfolios in the future. These statements are based on Portfolio management’s predictions and expectations concerning certain future events and their expected impact on the Portfolios, such as performance of the economy as a whole and of specific industry sectors, changes in the levels of interest rates, the impact of developing world events, and other factors that may influence the future performance of the Portfolios. Management believes these forward-looking statements to be reasonable, although they are inherently uncertain and difficult to predict. Actual events may cause adjustments in portfolio management strategies from those currently expected to be employed.
Views and opinions expressed are for informational purposes only and do not constitute a recommendation by GSAM to buy, sell, or hold any security. Views and opinions are current as of the date of this presentation and may be subject to change, they should not be construed as investment advice.
A description of the policies and procedures that the Portfolios use to determine how to vote proxies relating to portfolio securities and information regarding how a Portfolio voted proxies relating to portfolio securities during the most recent 12-month period ended June 30 is available (i) without charge, upon request by calling 1-800-526-7384 (for Retail Shareholders) or 1-800-621-2550 (for Institutional Shareholders); and (ii) on the Securities and Exchange Commission (“SEC”) web site at http://www.sec.gov.
References to indices, benchmarks or other measures of relative market performance over a specified period of time are provided for your information only and do not imply that the portfolio will achieve similar results. The index composition may not reflect the manner in which a portfolio is constructed. While an adviser seeks to design a portfolio which reflects appropriate risk and return features, portfolio characteristics may deviate from those of the benchmark.
The Portfolios file their complete schedule of portfolio holdings with the SEC for the first and third quarters of each fiscal year on Forms N-Q. The Portfolios’ Forms N-Q will become available on the SEC’s website at http://www.sec.gov within 60 days after the Portfolios’ first and third fiscal quarters. When available, the Portfolios’ Forms N-Q may be reviewed and copied at the SEC’s Public Reference Room in Washington, D.C. and information on the operation of the Public Reference Room may also be obtained by calling 1-800-SEC-0330. When available, Forms N-Q may be obtained upon request and without charge by calling 1-800-526-7384 (for Retail Shareholders) or 1-800-621-2550 (for Institutional Shareholders).
The Global Industry Classification Standard (GICS) was developed by and is the exclusive property and a service mark of Morgan Stanley Capital International Inc. (MSCI) and Standard & Poor’s, a division of The McGraw-Hill Companies, Inc. (S&P) and is licensed for use by Goldman Sachs. Neither MSCI, S&P nor any other party involved in making or compiling the GICS or any GICS classifications makes any express or implied warranties or representations with respect to such standard or classification (or the results to be obtained by the use thereof), and all such parties hereby expressly disclaim all warranties of originality, accuracy, completeness, merchantability or fitness for a particular purpose with respect to any of such standard or classification. Without limiting any of the foregoing, in no event shall MSCI, S&P, any of their affiliates or any third party involved in making or compiling the GICS or any GICS classifications have any liability for any direct, indirect, special, punitive, consequential or any other damages (including lost profits) even if notified of the possibility of such damages.
Portfolio holdings and allocations shown are as of December 31, 2015 and may not be representative of future investments. Portfolio holdings should not be relied on in making investment decisions and should not be construed as research or investment advice regarding particular securities. Current and future holdings are subject to risk.
This material is not authorized for distribution to prospective investors unless preceded or accompanied by a current Prospectus or summary prospectus, if applicable. Investors should consider a Portfolio’s objective, risks, and charges and expenses, and read the summary prospectus, if available, and/or the Prospectus carefully before investing or sending money. The summary prospectus, if available, and the Prospectus contain this and other information about a Portfolio and may be obtained from your Authorized Institution or from Goldman, Sachs & Co. by calling (retail – 1-800-526-7384) (institutional – 1-800-621-2550).
© 2016 Goldman Sachs. All rights reserved. 31906-TEMPL-02/2016 FFAR-16/69.3K
(a) As of the end of the period covered by this report, the registrant has adopted a code of ethics that applies to the registrant’s principal executive officer, principal financial officer, principal accounting officer or controller, or persons performing similar functions, regardless of whether these individuals are employed by the registrant or a third party (the “Code of Ethics”).
(b) During the period covered by this report, no amendments were made to the provisions of the Code of Ethics.
(c) During the period covered by this report, the registrant did not grant any waivers, including an implicit waiver, from any provision of the Code of Ethics.
(d) A copy of the Code of Ethics is available as provided in Item 12(a)(1) of this report.
| ITEM 3. | AUDIT COMMITTEE FINANCIAL EXPERT. |
The registrant’s board of trustees has determined that the registrant has at least one “audit committee financial expert” (as defined in Item 3 of Form N-CSR) serving on its audit committee. Gregory G. Weaver is the “audit committee financial expert” and is “independent” (as each term is defined in Item 3 of Form N-CSR).
| ITEM 4. | PRINCIPAL ACCOUNTANT FEES AND SERVICES. |
Table 1 — Items 4(a) - 4(d). The accountant fees below reflect the aggregate fees billed by all of the Funds of the Goldman Sachs Trust and includes the Goldman Sachs Funds to which this certified shareholder report relates.
| | | | | | | | | | | | |
| | | 2015 | | 2014 | | Description of Services Rendered |
| | | |
| | | | | | | | | | | | |
| | | |
Audit Fees: | | | | | | | | | | | | |
| | | |
• PricewaterhouseCoopers LLP
(“PwC”) | | | $ | 3,800,334 | | | | $ | 3,563,029 | | | Financial Statement audits. |
| | | |
Audit-Related Fees: | | | | | | | | | | | | |
| | | |
• PwC | | | $ | 158,000 | | | | $ | 0 | | | Other attest services. |
| | | |
Tax Fees: | | | | | | | | | | | | |
| | | |
• PwC | | | $ | 1,058,976 | | | | $ | 672,155 | | | Tax compliance services provided in connection with the preparation and review of registrant’s tax returns. |
Table 2 — Items 4(b)(c) & (d). Non-Audit Services to the Goldman Sachs Trust’s service affiliates * that were pre-approved by the Audit Committee of the Goldman Sachs Trust pursuant to Rule 2-01(c)(7)(ii) of Regulation S-X.
| | | | | | | | | | | | |
| | | 2015 | | 2014 | | Description of Services Rendered |
| | | |
| | | | | | | | | | | | |
| | | |
Audit-Related Fees: | | | | | | | | | | | | |
| | | |
• PwC | | | $ | 1,653,616 | | | | $ | 1,486,420 | | | Internal control review performed in accordance with Statement on Standards for Attestation Engagements No. 16 and Semi-Annual Updates related to withholding tax accrual for non-US Jurisdictions. These fees are borne by the Funds’ Adviser. |
| * | These include the advisor (excluding sub-advisors) and any entity controlling, controlled by or under common control with the advisor that provides ongoing services to the registrant (hereinafter referred to as “service affiliates”). |
Item 4(e)(1) — Audit Committee Pre-Approval Policies and Procedures
Pre-Approval of Audit and Non-Audit Services Provided to the Funds of the Goldman Sachs Trust. The Audit and Non-Audit Services Pre-Approval Policy (the “Policy”) adopted by the Audit Committee of Goldman Sachs Trust (“GST”) sets forth the procedures and the conditions pursuant to which services performed by an independent auditor for GST may be pre-approved. Services may be pre-approved specifically by the Audit Committee as a whole or, in certain circumstances, by the Audit Committee Chairman or the person designated as the Audit Committee Financial Expert. In addition, subject to specified cost limitations, certain services may be pre-approved under the provisions of the Policy. The Policy provides that the Audit Committee will consider whether the services provided by an independent auditor are consistent with the Securities and Exchange Commission’s rules on auditor independence. The Policy provides for periodic review and pre-approval by the Audit Committee of the services that may be provided by the independent auditor.
De Minimis Waiver. The pre-approval requirements of the Policy may be waived with respect to the provision of non-audit services that are permissible for an independent auditor to perform, provided (1) the aggregate amount of all such services provided constitutes no more than five percent of the total amount of revenues subject to pre-approval that was paid to the independent auditors during the fiscal year in which the services are provided; (2) such services were not recognized by GST at the time of the engagement to be non-audit services; and (3) such services are promptly brought to the attention of the Audit Committee and approved prior to the completion of the audit by the Audit Committee or by one or more members of the Audit Committee to whom authority to grant such approvals has been delegated by the Audit Committee, pursuant to the pre-approval provisions of the Policy.
Pre-Approval of Non-Audit Services Provided to GST’s Investment Advisers. The Policy provides that, in addition to requiring pre-approval of audit and non-audit services provided to GST, the Audit Committee will pre-approve those non-audit services provided to GST’s investment advisers (and entities controlling, controlled by or under common control with the investment advisers that provide ongoing services to GST) where the engagement relates directly to the operations or financial reporting of GST.
Item 4(e)(2) – 0% of the audit-related fees, tax fees and other fees listed in Table 1 were approved by GST’s Audit Committee pursuant to the “de minimis” exception of Rule 2-01(c)(7)(i)(C) of Regulation S-X. In addition, 0% of the non-audit services to the GST’s service affiliates listed in Table 2 were approved by GST’s Audit Committee pursuant to the “de minimis” exception of Rule 2-01(c)(7)(i)(C) of Regulation S-X.
Item 4(f) – Not applicable.
Item 4(g) Aggregate Non-Audit Fees Disclosure
The aggregate non-audit fees billed to GST by PwC for the twelve months ended December 31, 2015 and December 31, 2014 were $1,216,976 and $672,155 respectively.
The aggregate non-audit fees billed to GST’s adviser and service affiliates by PwC for non-audit services for the twelve months ended December 31, 2014 and December 31, 2013 were approximately $10.2 million and $9.8 million respectively. The figures for these entities are not yet available for twelve months ended December 31, 2015. With regard to the aggregate non-audit fees billed to GST’s adviser and service affiliates, the 2014 and 2013 amounts include fees for non-audit services required to be pre-approved [see Table 2] and fees for non-audit services that did not require pre-approval since they did not directly relate to GST’s operations or financial reporting.
Item 4(h) — GST’s Audit Committee has considered whether the provision of non-audit services to GST’s investment adviser and service affiliates that did not require pre-approval pursuant to paragraph (c)(7)(ii) of Rule 2-01 of Regulation S-X is compatible with maintaining the auditors’ independence.
| ITEM 5. | AUDIT COMMITTEE OF LISTED REGISTRANTS. |
| ITEM 6. | SCHEDULE OF INVESTMENTS. |
| | Schedule of Investments is included as part of the Report to Stockholders filed under Item 1. |
| ITEM 7. | DISCLOSURE OF PROXY VOTING POLICIES AND PROCEDURES FOR CLOSED-END MANAGEMENT INVESTMENT COMPANIES. |
| ITEM 8. | PORTFOLIO MANAGERS OF CLOSED-END MANAGEMENT INVESTMENT COMPANIES. |
| ITEM 9. | PURCHASES OF EQUITY SECURITIES BY CLOSED-END MANAGEMENT INVESTMENT COMPANY AND AFFILIATED PURCHASERS. |
| ITEM 10. | SUBMISSION OF MATTERS TO A VOTE OF SECURITY HOLDERS. |
| | There have been no material changes to the procedures by which shareholders may recommend nominees to the registrant’s board of trustees. |
| ITEM 11. | CONTROLS AND PROCEDURES. |
| | (a) | The registrant’s principal executive and principal financial officers, or persons performing similar functions have concluded that the registrant’s disclosure controls and procedures (as defined in Rule 30a-3(c) under the Investment Company Act of 1940, as amended (the “1940 Act”)) are effective as of a date within 90 days of the filing of this report that includes the disclosure required by this paragraph, based on the evaluation of these controls and procedures required by Rule 30a-3(b) under the 1940 Act and 15d-15(b) under the Securities Exchange Act of 1934, as amended. |
| | (b) | There were no changes in the registrant’s internal control over financial reporting (as defined in Rule 30a-3(d) under the 1940 Act) that occurred during the registrant’s second fiscal quarter of the period covered by this report that have materially affected, or are reasonably likely to materially affect, the registrant’s internal control over financial reporting. |
| | | | |
| (a)(1) | | Goldman Sachs Trust’s Code of Ethics for Principal Executive and Senior Financial Officers is incorporated by reference to Exhibit 12(a)(1) of the registrant’s Form N-CSR filed on July 8, 2015 for its International Equity Insights Funds. |
| | |
| (a)(2) | | Exhibit 99.CERT | | Certifications pursuant to Section 302 of the Sarbanes-Oxley Act of 2002 filed herewith. |
| | |
| (b) | | Exhibit 99.906CERT | | Certifications pursuant to Section 906 of the Sarbanes-Oxley Act of 2002 filed herewith. |
SIGNATURES
Pursuant to the requirements of the Securities Exchange Act of 1934 and the Investment Company Act of 1940, the registrant has duly caused this report to be signed on its behalf by the undersigned, thereunto duly authorized.
| | |
| | | Goldman Sachs Trust |
| |
| By: | | /s/ James A. McNamara |
| |
| | |
| | James A. McNamara |
| | Chief Executive Officer |
| | Goldman Sachs Trust |
| |
| Date: | | March 10, 2016 |
Pursuant to the requirements of the Securities Exchange Act of 1934 and the Investment Company Act of 1940, this report has been signed below by the following persons on behalf of the registrant and in the capacities and on the dates indicated.
| | |
| By: | | /s/ James A. McNamara |
| |
| | |
| | James A. McNamara |
| | Chief Executive Officer |
| | Goldman Sachs Trust |
| |
| Date: | | March 10, 2016 |
| |
| By: | | /s/ Scott McHugh |
| |
| | |
| | Scott McHugh |
| | Principal Financial Officer |
| | Goldman Sachs Trust |
| |
| Date: | | March 10, 2016 |