UNITED STATES
SECURITIES AND EXCHANGE COMMISSION
Washington, D.C. 20549
FORM N-CSR
CERTIFIED SHAREHOLDER REPORT OF REGISTERED
MANAGEMENT INVESTMENT COMPANIES
Investment Company Act file number 811-05349
Goldman Sachs Trust
(Exact name of registrant as specified in charter)
71 South Wacker Drive, Chicago, Illinois 60606
(Address of principal executive offices) (Zip code)
| | |
| Caroline Kraus, Esq. | | Copies to: |
| Goldman, Sachs & Co. | | Geoffrey R.T. Kenyon, Esq. |
| 200 West Street | | Dechert LLP |
| New York, New York 10282 | | 100 Oliver Street |
| | 40th Floor |
| | Boston, MA 02110-2605 |
(Name and address of agents for service)
Registrant’s telephone number, including area code: (312) 655-4400
Date of fiscal year end: December 31
Date of reporting period: December 31, 2015
| ITEM 1. | REPORTS TO STOCKHOLDERS. |
| | The Annual Report to Shareholders is filed herewith. |
Goldman Sachs Funds

| | | | |
| | |
| Annual Report | | | | December 31, 2015 |
| | |
| | | | Tax-Advantaged Equity Funds |
| | | | U.S. Equity Dividend and Premium |
| | | | International Equity Dividend and Premium |
| | | | U.S. Tax-Managed Equity |
| | | | International Tax-Managed Equity |

Goldman Sachs Tax-Advantaged Equity Funds
| n | | U.S. EQUITY DIVIDEND AND PREMIUM |
| n | | INTERNATIONAL EQUITY DIVIDEND AND PREMIUM |
| n | | U.S. TAX-MANAGED EQUITY |
| n | | INTERNATIONAL TAX-MANAGED EQUITY |
| | | | |
TABLE OF CONTENTS | | | | |
| |
Principal Investment Strategies and Risks | | | 1 | |
| |
Market Review | | | 3 | |
| |
Investment Process — Equity Dividend and Premium Funds | | | 6 | |
| |
Portfolio Management Discussions and Performance Summaries — Equity Dividend and Premium Funds | | | 7 | |
| |
Investment Process — Global Tax-Managed | | | 19 | |
| |
Portfolio Management Discussions and Performance Summaries — Tax-Managed Funds | | | 20 | |
| |
Schedules of Investments | | | 34 | |
| |
Financial Statements | | | 58 | |
| |
Financial Highlights | | | 62 | |
| |
Notes to the Financial Statements | | | 70 | |
| |
Report of Independent Registered Accounting Firm | | | 91 | |
| |
Other Information | | | 92 | |
| | | | |
| | | |
| NOT FDIC-INSURED | | May Lose Value | | No Bank Guarantee |
GOLDMAN SACHS TAX-ADVANTAGED EQUITY FUNDS
Principal Investment Strategies and Risks
This is not a complete list of risks that may affect the Funds. For additional information concerning the risks applicable to the Funds, please see the Funds’ Prospectus.
The Goldman Sachs U.S. Equity Dividend and Premium Fund invests primarily in dividend-paying equity investments in large-capitalization U.S. equity issuers, including foreign issuers that are traded in the United States. The Fund is subject to market risk, which means that the value of the securities in which it invests may go up or down in response to the prospects of individual companies, particular sectors and/or general economic conditions. The Fund is also subject to the risks associated with writing (selling) call options, which limits the opportunity to profit from an increase in the market value of stocks in exchange for up-front cash at the time of selling the call option. In a rising market, the Fund could significantly underperform the market, and the Fund’s options strategies may not fully protect it against declines in the value of the market. The Investment Adviser’s use of quantitative models to execute the Fund’s investment strategy may fail to produce the intended result. Different investment styles (e.g., “quantitative”) tend to shift in and out of favor, and at times the Fund may underperform other funds that invest in similar asset classes. The Fund is also subject to the risk that the pre-tax performance of the Fund may be lower than the performance of a similar fund that is not tax-managed. No assurance can be offered that the Fund’s tax-managed strategies will reduce the amount of taxable income and capital gains distributed by the Fund to shareholders.
The Goldman Sachs International Equity Dividend and Premium Fund invests primarily in dividend-paying equity investments in companies that are organized outside the United States or whose securities are principally traded outside the United States. The Fund is subject to market risk, which means that the value of the securities in which it invests may go up or down in response to the prospects of individual companies, particular sectors and/or general economic conditions. Foreign and emerging markets investments may be more volatile and less liquid than investments in U.S. securities and are subject to the risks of currency fluctuations and adverse economic or political developments. The Fund is also subject to the risks associated with writing (selling) call options, which limits the opportunity to profit from an increase in the market value of stocks in exchange for up-front cash at the time of selling the call option. In a rising market, the Fund could significantly underperform the market, and the Fund’s options strategies may not fully protect it against declines in the value of the market. The Investment Adviser’s use of quantitative models to execute the Fund’s investment strategy may fail to produce the intended result. Different investment styles (e.g., “quantitative”) tend to shift in and out of favor, and at times the Fund may underperform other funds that invest in similar asset classes. The Fund is also subject to the risk that the pre-tax performance of the Fund may be lower than the performance of a similar fund that is not tax-managed. No assurance can be offered that the Fund’s tax managed strategies will reduce the amount of taxable income and capital gains distributed by the Fund to shareholders.
The Goldman Sachs U.S. Tax-Managed Equity Fund invests in equity investments in U.S. issuers, including foreign issuers that are traded in the United States. The Fund is subject to market risk, which means that the value of the securities in which it invests may go up or down in response to the prospects of individual companies, particular sectors and/or general economic conditions. The Investment Adviser’s use of quantitative models to execute the Fund’s investment strategy may fail to produce the intended result. Different investment styles (e.g., “quantitative”) tend to shift in and out of favor, and at times the Fund may underperform other funds that invest in similar asset classes. Foreign and emerging markets investments may be more volatile and less liquid than U.S. securities and are subject to the risks of currency fluctuations and adverse economic or political developments. The Fund is also subject to the risk that the pre-tax performance of the Fund may be lower than the performance of a similar fund that is not tax-managed. No assurance can be offered that the Fund’s tax-managed strategies will reduce the amount of taxable income and capital gains distributed by the Fund to shareholders. The Fund is not suitable for IRAs or other tax-exempt or tax-deferred accounts.
Goldman Sachs does not provide legal, tax or accounting advice. Goldman Sachs clients should obtain independent tax advice based on their particular situation.
1
GOLDMAN SACHS TAX-ADVANTAGED EQUITY FUNDS
The Goldman Sachs International Tax-Managed Equity Fund invests primarily in equity securities investments in companies that are organized outside the United States or whose securities are principally traded outside the United States. The Fund is subject to market risk, which means that the value of the securities in which it invests may go up or down in response to the prospects of individual companies, particular sectors and/or general economic conditions. Foreign and emerging markets investments may be more volatile than investments in U.S. securities and are subject to the risks of currency fluctuations and adverse economic or political developments. The Investment Adviser’s use of quantitative models to execute the Fund’s investment strategy may fail to produce the intended result. Different investment styles (e.g., “quantitative”) tend to shift in and out of favor, and at times the Fund may underperform other funds that invest in similar asset classes. The Fund is also subject to the risk that the pre-tax performance of the Fund may be lower than the performance of a similar fund that is not tax-managed. No assurance can be offered that the Fund’s tax-managed strategies will reduce the amount of taxable income and capital gains distributed by the Fund to shareholders. The Fund is not suitable for IRAs or other tax-exempt or tax-deferred accounts.
Goldman Sachs does not provide legal, tax or accounting advice. Goldman Sachs clients should obtain independent tax advice based on their particular situation.
2
MARKET REVIEW
Goldman Sachs Tax-Advantaged Equity Funds
Market Review
During the 12 months ended December 31, 2015 (the “Reporting Period”), U.S. equities recorded a modest gain, while international equities posted a small decline. Central bank policy, geopolitical tensions, concerns about China and global economic growth, and a commodity price sell-off were key themes during the Reporting Period.
U.S. Equities
Market expectations of a Federal Reserve (“Fed”) interest rate hike increased during the Reporting Period, as evidence of a U.S. economic and labor market recovery mounted. Meanwhile, monetary policy divergence with the European Central Bank (“ECB”) and the Bank of Japan, which each eased policy during 2015, resulted in relative U.S. dollar strength. This paradoxically hurt U.S. equity performance despite improving domestic economic fundamentals. Also, geopolitical tensions intensified in the summer of 2015, as negotiations between Greece and its creditors unraveled, and the probability of a Greek exit, popularly known in the media as “Grexit,” from the euro increased. “Grexit” risk subsequently declined with an agreement in July 2015. However, concerns then escalated around China’s economic weakness, exacerbated by a surprise devaluation of its renminbi in August 2015, which, we believe, further shook market confidence. U.S. equities sold off in the ensuing sharp global equity correction.
After holding the targeted federal funds rate steady in September and October 2015 in light of these external macroeconomic and geopolitical risks, the Fed voted unanimously for a 25 basis point hike in December 2015. (A basis point is 1/100th of a percentage point.) In our opinion, the fairly dovish language in the Fed’s announcement, which emphasized “gradual” adjustments to policy going forward, helped to somewhat assuage the markets. (Dovish language tends to suggest lower interest rates.)
Oil and commodity prices fell during 2015, as the supply glut took longer than expected to correct and demand concerns arose. West Texas Intermediate (“WTI”) crude oil prices began 2015 at $53 per barrel, already well below 2014 highs of more than $100 per barrel. WTI crude oil prices ended 2015 lower still, at approximately $37 per barrel. The U.S. consumer benefited from savings at the gas pump and consumer spending rose, particularly in areas typically associated with lower gas prices, such as autos and restaurants. However, this did not fully offset the negative impact on the U.S. energy industry and industrials companies.
U.S. equities, as represented by the S&P 500® Index, gained 1.38% during the Reporting Period. Five of the 10 sectors within the S&P 500® Index were up, with the consumer discretionary (+10.13%) and health care (+6.91%) sectors posting the largest gains in absolute terms. The consumer discretionary sector was the largest contributor on the basis of impact, which takes both weightings and total returns into account.
Within the U.S. equity market, there was significant disparity in performance not only among sectors but also among the various capitalization and style segments. Large-cap stocks, as measured by the Russell 1000® Index, posted modestly positive returns, while mid-cap stocks and small-cap stocks, as measured by the Russell Midcap® Index and Russell 2000® Index, respectively, generated negative returns. Large-cap stocks were most successful relative to small-cap stocks in the consumer discretionary sector. From a style perspective, growth-oriented stocks significantly outpaced value-oriented stocks across the capitalization spectrum. Growth outperformed relative to value during the Reporting Period
3
MARKET REVIEW
primarily due to stronger performance of the growth-oriented information technology sector. (All as measured by the Russell Indexes.)
International Equities
At the beginning of the Reporting Period in January 2015, the ECB implemented historic quantitative easing measures. In contrast, as evidence of a U.S. economic and labor market recovery mounted, market expectations of a Fed interest rate hike increased. The monetary policy divergence resulted in relative U.S. dollar strength, which benefited equity markets in several major developed market regions outside the U.S. but detracted from their returns in U.S. dollar terms.
As mentioned previously, geopolitical tensions intensified in the summer of 2015, as negotiations between Greece and its creditors unraveled and the probability of a “Grexit” from the euro increased. “Grexit” risk subsequently declined with an agreement in July 2015. However, concerns then escalated around China’s economic weakness, exacerbated by a surprise devaluation of its renminbi in August 2015, which, we believe, further shook market confidence. International equities sold off in the ensuing sharp global equity correction.
In the U.S., the Fed tightened its monetary policy during December 2015. In our opinion, the fairly dovish language in the Fed’s announcement, which emphasized “gradual” adjustments to policy going forward, appeared to ease the impact on the markets. Meanwhile, the Bank of Japan announced supplementary support for its quantitative and qualitative easing. The ECB also lowered its deposit rate by 10 basis points and announced an extension of its quantitative easing program at its December 2015 meeting. However, market reaction to the ECB announcement was one of disappointment, as more had been expected.
Oil and commodity prices were “lower for longer” in 2015, with a supply glut that took longer than expected to correct and concerns about demand arose. Brent crude oil prices began 2015 at $57 per barrel, already well below 2014 highs of more than $100 per barrel. Brent crude oil prices ended 2015 lower still, at approximately $37 per barrel
International equities, as measured by the Morgan Stanley Capital International (MSCI) Europe, Australasia, Far East (EAFE) Index (the “MSCI EAFE Index”), returned -0.81% in U.S. dollar terms during the Reporting Period. Ten of the 21 countries in the MSCI EAFE Index were down for the Reporting Period, with Singapore (-18.06%), Spain (-16.06%) and Norway (-14.50%) posting the largest losses in absolute terms. The U.K. (-7.55%) was the largest negative contributor on the basis of impact, which takes both weightings and total returns into account.
Four of the 10 sectors in the MSCI EAFE Index were down, with energy (-17.96%) and materials (-16.82%) detracting most from returns. The materials sector was also the largest negative contributor on the basis of impact, which takes both weightings and total returns into account.
Looking Ahead
In the months ahead, we believe less expensive stocks will outpace more expensive stocks. We also believe that stocks with good momentum are likely to outperform those with poor momentum. Our plan is to seek profitable companies with positive fundamentals, sustainable earnings and a track record of using capital to enhance shareholder value. To that end, we
4
MARKET REVIEW
anticipate remaining fully invested, with long-term performance likely to be the result of stock selection rather than sector or capitalization allocations.
We stand behind our investment philosophy that sound economic investment principles, coupled with a disciplined quantitative approach, can provide potentially strong, uncorrelated returns over the long term. Our research agenda is robust, and we continue to enhance our existing models, add new proprietary forecasting signals and improve our trading execution as we seek to provide the most value to our shareholders.*
| *All | | sector and country returns quoted herein are based on cumulative total returns. |
5
INVESTMENT PROCESS
What Differentiates the Goldman Sachs
U.S. Equity Dividend and Premium and
Goldman Sachs International Equity Dividend
and Premium Funds’ Investment Process?
The Goldman Sachs U.S. Equity Dividend and Premium Fund seeks to maximize income and total return. The Goldman Sachs International Equity Dividend and Premium Fund seeks to maximize total return with an emphasis on income. Their portfolios consist primarily of large-cap, dividend-paying stocks.1 By investing in these securities, and through the use of option call writing, the Funds seek to generate an attractive after-tax cash flow.

A diversified portfolio:
| n | | Create a diversified large-cap equity portfolio that participates in all industries and sectors. |
| n | | Emphasize higher dividend-paying stocks within each industry and sector. |
Written call options:
| n | | The Funds utilize index call writing to seek to enhance their cash flow. |

| n | | We use proprietary quantitative techniques, including optimization tools, a risk model and a transactions cost model, in identifying a portfolio of stocks that we believe may enhance expected dividend yield while limiting deviations when compared to the S&P 500® Index or MSCI EAFE Index, as applicable. |

| n | | A fully invested, style-consistent portfolio. |
| n | | The Funds look for attractive after-tax cash flow from qualified dividends, long-term capital gains and option call writing. |
| n | | The Funds aim to enhance after-tax returns by generating distributions primarily from qualified dividends and long-term capital gains. |
| 1 | | Dividends are not guaranteed and a company’s future ability to pay dividends may be limited. There is no guarantee that these objectives will be met. Diversification does not protect an investor from market risk and does not ensure a profit |
6
PORTFOLIO RESULTS
U.S. Equity Dividend and Premium Fund
Investment Objective
The Fund seeks to maximize income and total return.
Portfolio Management Discussion and Analysis
Below, the Goldman Sachs Quantitative Investment Strategies Team discusses the Goldman Sachs U.S. Equity Dividend and Premium Fund’s (the “Fund”) performance and positioning for the 12-month period ended December 31, 2015 (the “Reporting Period”).
| Q | | How did the Fund perform during the Reporting Period? |
| A | | During the Reporting Period, the Fund’s Class A, C, Institutional and IR Shares generated average annual total returns, without sales charges, of 2.08%, 1.26%, 2.49% and 2.34%, respectively. These returns compare to the 1.38% average annual total return of the Fund’s primary benchmark, the Standard & Poor’s 500® Index (the “S&P 500® Index”), during the same period. The Barclays U.S. Aggregate Bond Index, the secondary benchmark, returned 0.55%. Although the Fund does not invest in fixed income securities, maximizing income is part of the Fund’s investment objective, and therefore we believe that a comparison of the Fund’s performance to that of the Barclays U.S. Aggregate Bond Index is useful to investors. |
| Q | | What key factors were most responsible for the Fund’s performance during the Reporting Period? |
| A | | The sale of call options on the S&P 500® Index contributed positively to the Fund’s total return during the Reporting Period. (A call option is an option that gives the holder the right to buy a certain quantity of an underlying security at an agreed-upon price at any time up to an agreed-upon date.) |
| | Security selection overall added value, with the Fund especially benefiting from its bias towards stocks with higher dividend yields. More specifically, positions in the utilities, consumer discretionary and consumer staples sectors added to relative performance. The Fund was overweight relative to the S&P 500® Index in the utilities sector and underweight in the consumer staples and consumer discretionary sectors. Conversely, positions in the telecommunication services, energy and information technology sectors detracted from relative returns. The Fund was overweight compared to the S&P 500® Index in the telecommunication services sector and was underweight in the energy and information technology sectors. |
| Q | | How did the Fund’s call writing affect its performance? |
| A | | Consistent with our investment approach, we wrote index call options on a portion of the stock portfolio’s market value. When the Fund sells an index call option, it retains the premium it receives from the sale. However, if the purchaser exercises the option, the Fund is obligated to pay the purchaser the difference between the price of the index and the exercise price of the option. Although the Fund retains the premium it receives from the sale of the option, the premium may not exceed the difference in the value of the index as call options are exercised. That said, and as mentioned previously, our call writing contributed positively to performance for the Reporting Period overall. |
| | Overall, call option writing tends to reduce Fund volatility. Since its inception, the realized daily volatility of the Fund has been 18.74% compared to the realized volatility of the S&P 500® Index of 20.32%. During the Reporting Period, the realized daily volatility of the Fund was 13.61% compared to the realized volatility of the S&P 500® Index of 15.34%.1 |
| Q | | What was the Fund’s dividend yield during the Reporting Period? |
| A | | While maintaining industry and sector weights consistent with the S&P 500® Index, we favor stocks with higher dividend yields. The dividend yield of the Fund’s Institutional Share class during the Reporting Period was 2.77% as compared to 2.16% for the S&P 500® Index. (Dividend yield is a ratio that shows how much a company |
| 1 | | The realized daily volatility of the Fund quoted herein is for Institutional Shares, net of fees. Based on GSAM calculations. |
7
PORTFOLIO RESULTS
| | pays out in dividends in a year divided by its share price.) The Fund’s dividend yield served to enhance its quarterly net income distributions. As of December 31, 2015, the Standardized 30-Day Subsidized Yield was 2.05% and the Standardized 30-Day Unsubsidized Yield was 1.96%. |
| Q | | Among individual holdings, which stocks contributed most to the Fund’s results? |
| A | | Relative to the S&P 500® Index, the Fund benefited from overweight positions in packaged food maker Kraft Foods Group, energy provider TECO Energy and property insurance and title and deed company Old Republic International. The Fund held these stocks largely because of their attractive dividend yields and/or risk metrics. |
| Q | | Which individual stock holdings detracted significantly from relative performance during the Reporting Period? |
| A | | Relative to the S&P 500® Index, the Fund was hurt by overweight positions in CenturyLink, a telecommunication services company; Mattel, a toy manufacturer; and Waddell & Reed Financial, an asset management and financial planning firm. The Fund held these stocks largely because of their attractive dividend yields and/or risk metrics. |
| Q | | How did the Fund use derivatives and similar instruments during the Reporting Period? |
| A | | During the Reporting Period, we used equity index futures, on an opportunistic basis, to equitize the Fund’s excess cash holdings. In other words, we put the Fund’s excess cash holdings to work by using them as collateral for the purchase of equity index futures. Equity index futures had a neutral impact on Fund performance during the Reporting Period. Consistent with our investment approach, we also wrote equity index options on a portion of the portfolio’s market value in an effort to generate premiums. Equity index options had a positive impact on performance during the Reporting Period. |
| Q | | What changes or enhancements did you make to your quantitative model during the Reporting Period? |
| A | | We made no changes to our quantitative model during the Reporting Period. |
8
FUND BASICS
U.S. Equity Dividend and Premium Fund
as of December 31, 2015
| | | | | | | | | | | | | | |
| | PERFORMANCE REVIEW | |
| | | January 1, 2015- December 31, 2015 | | Fund Total Return
(based on NAV)1 | | | S&P 500® Index2 | | | Barclays U.S. Aggregate
Bond Index3 | |
| | Class A | | | 2.08 | % | | | 1.38 | % | | | 0.55 | % |
| | Class C | | | 1.26 | | | | 1.38 | | | | 0.55 | |
| | Institutional | | | 2.49 | | | | 1.38 | | | | 0.55 | |
| | | Class IR | | | 2.34 | | | | 1.38 | | | | 0.55 | |
| | 1 | | The net asset value (“NAV”) represents the net assets of the class of the Fund (ex-dividend) divided by the total number of shares of the class outstanding. The Fund’s performance reflects the reinvestment of dividends and other distributions. The Fund’s performance does not reflect the deduction of any applicable sales charges. |
| | 2 | | The S&P 500® Index is an unmanaged composite index of 500 common stock prices. The Index figures do not include any deduction for fees, expenses or taxes. It is not possible to invest directly in an index. |
| | 3 | | The Barclays U.S. Aggregate Bond Index represents an unmanaged diversified portfolio of fixed income securities, including U.S. Treasuries, investment-grade corporate bonds, and mortgage-backed and asset-backed securities. The Index figures do not reflect any deduction for fees, expenses or taxes. It is not possible to invest directly in an index. |
| | | | | | | | | | | | | | | | | | | | |
| | STANDARDIZED TOTAL RETURNS4 |
| | | For the period ended 12/31/15 | | One Year | | | Five Years | | | Ten Years | | | Since Inception | | | Inception Date |
| | Class A | | | -3.51 | % | | | 8.96 | % | | | 5.73 | % | | | 5.75 | % | | 8/31/05 |
| | Class C | | | 0.24 | | | | 9.37 | | | | 5.52 | | | | 5.52 | | | 8/31/05 |
| | Institutional | | | 2.49 | | | | 10.64 | | | | 6.74 | | | | 6.74 | | | 8/31/05 |
| | | Class IR | | | 2.34 | | | | 10.47 | | | | N/A | | | | 13.15 | | | 8/31/10 |
| | 4 | | The Standardized Total Returns are average annual total returns as of the most recent calendar quarter-end. They assume reinvestment of all distributions at NAV. These returns reflect a maximum initial sales charge of 5.5% for Class A Shares and the assumed contingent deferred sales charge for Class C Shares (1% if redeemed within 12 months of purchase). Because Institutional and Class IR Shares do not involve a sales charge, such a charge is not applied to their Standardized Total Returns. |
The returns set forth in the tables above represent past performance. Past performance does not guarantee future results. The Fund’s investment return and principal value will fluctuate so that an investor’s shares, when redeemed, may be worth more or less than their original cost. Current performance may be lower or higher than the performance quoted above. Please visit our web site at www.GSAMFUNDS.com to obtain the most recent month-end returns. Performance reflects applicable fee waivers and/or expense limitations in effect during the periods shown. In their absence, performance would be reduced. Returns do not reflect the deduction of taxes that a shareholder would pay on Fund distributions or the redemption of Fund shares.
9
FUND BASICS
| | | | | | | | | | |
| | EXPENSE RATIOS5 | |
| | | | | Net Expense Ratio (Current) | | | Gross Expense Ratio (Before Waivers) | |
| | Class A | | | 1.19 | % | | | 1.20 | % |
| | Class C | | | 1.94 | | | | 1.95 | |
| | Institutional | | | 0.79 | | | | 0.80 | |
| | | Class IR | | | 0.94 | | | | 0.95 | |
| | 5 | | The expense ratios of the Fund, both current (net of applicable fee waivers and/or expense limitations) and before waivers (gross of applicable fee waivers and/or expense limitations) are as set forth above according to the most recent publicly available Prospectus for the Fund and may differ from the expense ratios disclosed in the Financial Highlights in this report. Pursuant to a contractual arrangement, the Fund’s waivers and/or expense limitations will remain in place through at least April 30, 2016, and prior to such date the Investment Adviser may not terminate the arrangements without the approval of the Fund’s Board of Trustees. If these arrangements are discontinued in the future, the expense ratios may change without shareholder approval. |
| | | | | | | | | | | | | | | | | | |
| | STANDARDIZED AFTER-TAX PERFORMANCE AS OF 12/31/156 | |
| | | Class A Shares | | One Year | | | Five Years | | | Ten Years | | | Since Inception
(8/31/05) | |
| | Returns Before Taxes* | | | -3.51 | % | | | 8.96 | % | | | 5.73 | % | | | 5.75 | % |
| | Returns After Taxes on Distributions** | | | -4.81 | | | | 7.62 | | | | 4.76 | | | | 4.79 | |
| | | Returns After Taxes on Distributions***
and Sale of Fund Shares | | | -0.94 | | | | 7.05 | | | | 4.60 | | | | 4.62 | |
| | 6 | | The after-tax returns are calculated using the historically highest individual federal marginal income tax rates at the time of distributions (currently 23.8% for qualifying ordinary income dividends and long-term capital gain distributions and 43.4% for non-qualifying ordinary income dividends) and do not reflect state and local taxes. Actual after-tax returns will be calculated at calendar year-end and depend on an investor’s tax situation and may differ from those shown. In addition, the after-tax returns shown are not relevant to investors who hold Fund shares through tax-deferred arrangements such as 401(k) plans or individual retirement accounts. Under certain circumstances, the addition of the tax benefits from capital losses resulting from redemptions may cause the Returns After Taxes on Distributions and Sale of Fund Shares to be greater than the Returns After Taxes on Distributions or even Returns Before Taxes. Standardized after-tax returns assume reinvestment of all distributions at NAV and reflect a maximum initial sales charge of 5.5% for Class A Shares. |
| | *Returns | | Before Taxes do not reflect taxes on distributions on the Fund’s Class A Shares nor do they show how performance can be impacted by taxes when shares are redeemed. |
| | **Returns | | After Taxes on Distributions assume that taxes are paid on distributions on the Fund’s Class A Shares (i.e., dividends and capital gains) but do not reflect taxes that may be incurred upon redemption of the Class A Shares at the end of the performance period. |
| ***Returns | | After Taxes on Distributions and Sale of Fund Shares reflect taxes paid on distributions on the Fund’s Class A Shares and taxes applicable when the shares are redeemed. |
10
FUND BASICS
| | | | | | | | |
| | TOP TEN HOLDINGS AS OF 12/31/157 |
| | | Holding | | % of Net Assets | | | Line of Business |
| | Apple, Inc. | | | 3.4 | % | | Technology Hardware & Equipment |
| | Microsoft Corp. | | | 2.5 | | | Software & Services |
| | Pfizer, Inc. | | | 1.8 | | | Pharmaceuticals, Biotechnology &
Life Sciences |
| | Exxon Mobil Corp. | | | 1.7 | | | Energy |
| | AT&T, Inc. | | | 1.6 | | | Telecommunication Services |
| | Wells Fargo & Co. | | | 1.6 | | | Banks |
| | General Electric Co. | | | 1.6 | | | Capital Goods |
| | Johnson & Johnson | | | 1.5 | | | Pharmaceuticals, Biotechnology &
Life Sciences |
| | Amazon.com, Inc. | | | 1.5 | | | Retailing |
| | | Facebook, Inc. Class A | | | 1.4 | | | Software & Services |
| | 7 | | The top 10 holdings may not be representative of the Fund’s future investments. |
| | |
| FUND VS. BENCHMARK SECTOR ALLOCATIONS8 |
| As of December 31, 2015 |
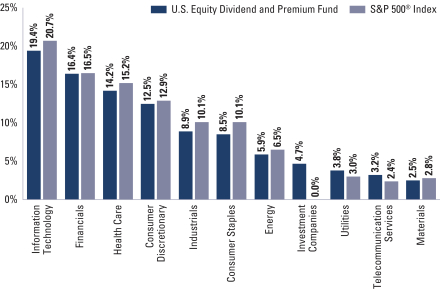
| | 8 | | The Fund is actively managed and, as such, its composition may differ over time. Consequently, the Fund’s overall sector allocations may differ from percentages contained in the graph above. The graph categorizes investments using Global Industry Classification Standard (“GICS”), however, the sector classifications used by the portfolio management team may differ from GICS. The percentage shown for each investment category reflects the value of investments in that category as a percentage of market value. Underlying sector allocations of Exchange Traded Funds and Investment Companies held by the Fund are not reflected in the graph above. The graph depicts the Fund’s investments but may not represent the Fund’s market exposure due to the exclusion of certain derivatives, if any, as listed in the Additional Investment Information section of the Schedule of Investments. |
11
GOLDMAN SACHS U.S. EQUITY DIVIDEND AND PREMIUM FUND
Performance Summary
December 31, 2015
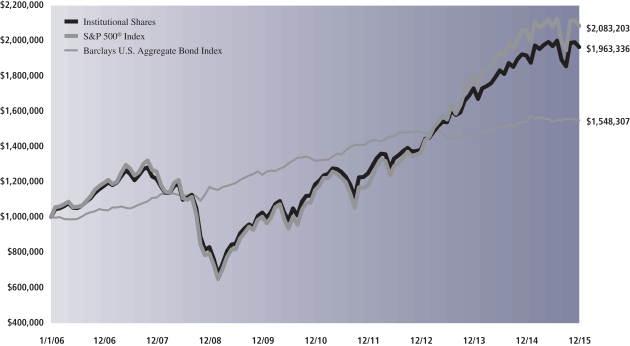
The following graph shows the value as of December 31, 2015, of a $1,000,000 investment made on January 1, 2006 in Institutional Shares at NAV. For comparative purposes, the performance of the Fund’s primary and secondary benchmarks, the S&P 500® Index and the Barclays U.S. Aggregate Bond Index, respectively, is shown. This performance data represents past performance and should not be considered indicative of future performance, which will fluctuate with changes in market conditions. These performance fluctuations will cause an investor’s shares, when redeemed, to be worth more or less than their original cost. Performance reflects applicable fee waivers and/or expense limitations in effect during the periods shown and in their absence, performance would be reduced. Returns do not reflect the deduction of taxes that a shareholder would pay on Fund distributions or the redemption of Fund shares. Performance of Class A, Class C and Class IR Shares will vary from Institutional Shares due to differences in class specific fees and any applicable sales charges. In addition to the Investment Adviser’s decision regarding issuer/industry investment selection and allocation, other factors may affect Fund performance. These factors include, but are not limited to, Fund operating fees and expenses, portfolio turnover, and subscription and redemption cash flows affecting the Fund.
|
| U.S. Equity Dividend and Premium Fund’s Lifetime Performance |
Performance of a $1,000,000 Investment, with distributions reinvested, from January 1, 2006 through December 31, 2015.
| | | | | | | | | | | | |
| Average Annual Total Return through December 31, 2015 | | | One Year | | | | Five Years | | | Ten Years | | Since Inception |
Class A (Commenced August 31, 2005) | | | | | | | | | | | | |
Excluding sales charges | | | 2.08% | | | | 10.20% | | | 6.33% | | 6.32% |
Including sales charges | | | -3.51% | | | | 8.96% | | | 5.73% | | 5.75% |
|
Class C (Commenced August 31, 2005) | | | | | | | | | | | | |
Excluding contingent deferred sales charges | | | 1.26% | | | | 9.37% | | | 5.52% | | 5.52% |
Including contingent deferred sales charges | | | -0.76% | | | | 9.37% | | | 5.52% | | 5.52% |
|
Institutional (Commenced August 31, 2005) | | | 2.49% | | | | 10.64% | | | 6.74% | | 6.74% |
|
Class IR (Commenced August 31, 2010) | | | 2.34% | | | | 10.47% | | | N/A | | 13.15% |
|
12
PORTFOLIO RESULTS
International Equity Dividend and Premium Fund
Investment Objective
The Fund seeks to maximize total return with an emphasis on income.
Portfolio Management Discussion and Analysis
Below, the Goldman Sachs Quantitative Investment Strategies Team discusses the Goldman Sachs International Equity Dividend and Premium Fund’s (the “Fund”) performance and positioning for the 12-month period ended December 31, 2015 (the “Reporting Period”).
| Q | | How did the Fund perform during the Reporting Period? |
| A | | During the Reporting Period, the Fund’s Class A, C, Institutional and IR Shares generated average annual total returns, without sales charges, of -4.80%, -5.59%, -4.42% and -4.69%, respectively. These returns compare to the -0.81% average annual total return of the Fund’s primary benchmark, the MSCI EAFE Index (Net, USD, Unhedged). The Barclays Global Aggregate Bond Index (Gross, USD, Unhedged), the secondary benchmark, returned -3.15%. Although the Fund does not invest in fixed income securities, maximizing income is part of the Fund’s investment objective, and therefore we believe that a comparison of the Fund’s performance to that of the Barclays Global Aggregate Bond Index is useful to investors. |
| Q | | What key factors were most responsible for the Fund’s performance during the Reporting Period? |
| A | | Security selection overall detracted, with the Fund being particularly hurt during the Reporting Period by its bias towards stocks with higher dividend yields. To a lesser extent, its sale of index call options also hampered relative results. (A call option is an option that gives the holder the right to buy a certain quantity of an underlying security at an agreed-upon price at any time up to an agreed-upon date.) More specifically, the Fund’s holdings in the financials, utilities and consumer staples sectors detracted from results. The Fund was underweight relative to the MSCI EAFE Index in the financials and consumer staples sectors and equal weight compared to the MSCI EAFE Index in the utilities sector. On the positive side, the Fund benefited from stock choices in the information technology sector. Relative to the MSCI EAFE Index, the Fund was slightly underweight the information technology sector during the Reporting Period. |
| Q | | How did the Fund’s call writing affect its performance? |
| A | | Consistent with our investment approach, we wrote index call options on a portion of the stock portfolio’s market value, primarily on the Japanese, United Kingdom and European indices. When the Fund sells an index call option, it retains the premium it receives from the sale. However, if the purchaser exercises the option, the Fund is obligated to pay the purchaser the difference between the price of the index and the exercise price of the option. While the Fund retains the premium it receives from the sale of the option, the premium may not exceed the difference in the value of the index as call options are exercised. Even though the MSCI EAFE Index declined slightly during the Reporting Period, the Fund’s call writing detracted from performance. |
| | Overall, call option writing tends to reduce Fund volatility. However, since its inception, the realized daily volatility of the Fund has been 22.57% compared to the realized volatility of the MSCI EAFE Index of 20.65%. During the Reporting Period, realized daily volatility of the Fund was 14.22% compared to the realized volatility of the MSCI EAFE Index of 13.96%.1 |
| Q | | What was the Fund’s dividend yield during the Reporting Period? |
| A | | While maintaining industry and sector weights consistent with the MSCI EAFE Index, we favor stocks with higher dividend yields. The dividend yield of the Fund’s Institutional Shares at the end of the Reporting Period was 4.03% compared to 3.29% for the MSCI EAFE Index. (Dividend yield is a ratio that shows how much a company pays out in dividends in a year divided by its share price.) The Fund’s dividend yield served to enhance its quarterly net income distributions. As of December 31, 2015, the |
| | 1 | | The realized daily volatility of the Fund quoted herein is Institutional Shares, net of fees. Based on GSAM calculations. |
13
PORTFOLIO RESULTS
| | Standardized 30-Day Subsidized Yield was 2.96% and the Standardized 30-Day Unsubsidized Yield was 2.96%. |
| Q | | Among individual holdings, which stocks contributed most to the Fund’s results? |
| A | | The Fund benefited from its underweight position in Glencore, an Anglo-Swiss commodity trading and mining company. Its overweights in Japanese mobile phone operator NTT DoCoMo and British house building company Persimmon also added to returns. The Fund held these stocks largely because of their attractive dividend yields and/or risk metrics. |
| Q | | Which individual stock holdings detracted significantly from relative performance during the Reporting Period? |
| A | | The Fund was hurt by its overweight positions in Spanish banking group Banco Santander, France-based mass retailer Casino Guichard Perrachon and Dutch insurer Delta Lloyd. The Fund held these stocks largely because of their attractive dividend yields and/or risk metrics. |
| Q | | How did the Fund use derivatives and similar instruments during the Reporting Period? |
| A | | During the Reporting Period, we used equity index futures, on an opportunistic basis, to equitize the Fund’s excess cash holdings. In other words, we put the Fund’s excess cash holdings to work by using them as collateral for the purchase of equity index futures. Equity index futures had a neutral impact on Fund performance during the Reporting Period. Consistent with our investment approach, we also wrote equity index options on a portion of the portfolio’s market value in an effort to generate premiums. Equity index options had a negative impact on performance during the Reporting Period. |
| Q | | What changes or enhancements did you make to your quantitative model during the Reporting Period? |
| A | | We made no changes to our quantitative model during the Reporting Period. |
14
FUND BASICS
International Equity Dividend and Premium Fund
as of December 31, 2015
| | | | | | | | | | | | | | |
| | PERFORMANCE REVIEW | |
| | | January 1, 2015
December 31, 2015 | | Fund Total Return
(based on NAV)1 | | | MSCI EAFE (Net, USD,
Unhedged)2 | | | Barclays Global Aggregate
Bond Index (Gross, USD,
Unhedged)3 | |
| | Class A | | | -4.80 | % | | | -0.81 | % | | | -3.15 | % |
| | Class C | | | -5.59 | | | | -0.81 | | | | -3.15 | |
| | Institutional | | | -4.42 | | | | -0.81 | | | | -3.15 | |
| | | Class IR | | | -4.69 | | | | -0.81 | | | | -3.15 | |
| | 1 | | The net asset value (“NAV”) represents the net assets of the class of the Fund (ex-dividend) divided by the total number of shares of the class outstanding. The Fund’s performance reflects the reinvestment of dividends and other distributions. The Fund’s performance does not reflect the deduction of any applicable sales charges. |
| | 2 | | The MSCI EAFE Index (Gross, USD, Unhedged) is an unmanaged market capitalization-weighted composite of securities in 21 developed markets. The Index figures do not include any deduction for fees or expenses. It is not possible to invest directly in an index. |
| | 3 | | The Barclays Global Aggregate Bond Index (Net, USD, Unhedged) represents an unmanaged diversified portfolio of fixed income securities, including U.S. Treasuries, investment-grade corporate bonds, and mortgage-backed and asset-backed securities. The Index figures do not reflect any deduction for fees, expenses or taxes. It is not possible to invest directly in an index. |
| | | | | | | | | | | | | | | | |
| | STANDARDIZED TOTAL RETURNS4 |
| | | For the period ended 12/31/15 | | One Year | | | Five Years | | | Since Inception | | | Inception Date |
| | Class A | | | -10.08 | % | | | -0.27 | % | | | -1.65 | % | | 1/31/08 |
| | Class C | | | -6.54 | | | | 0.12 | | | | -1.84 | | | 1/31/08 |
| | Institutional | | | -4.42 | | | | 1.31 | | | | -0.70 | | | 1/31/08 |
| | | Class IR | | | -4.69 | | | | 1.12 | | | | 3.92 | | | 8/31/10 |
| | 4 | | The Standardized Total Returns are average annual total returns as of the most recent calendar quarter-end. They assume reinvestment of all distributions at NAV. These returns reflect a maximum initial sales charge of 5.5% for Class A Shares and the assumed contingent deferred sales charge for Class C Shares (1% if redeemed within 12 months of purchase). Because Institutional and Class IR Shares do not involve a sales charge, such a charge is not applied to their Standardized Total Returns. |
The returns set forth in the tables above represent past performance. Past performance does not guarantee future results. The Fund’s investment return and principal value will fluctuate so that an investor’s shares, when redeemed, may be worth more or less than their original cost. Current performance may be lower or higher than the performance quoted above. Please visit our web site at www.GSAMFUNDS.com to obtain the most recent month-end returns. Performance reflects applicable fee waivers and/or expense limitations in effect during the periods shown. In their absence, performance would be reduced. Returns do not reflect the deduction of taxes that a shareholder would pay on Fund distributions or the redemption of Fund shares.
15
FUND BASICS
| | | | | | | | | | |
| | EXPENSE RATIOS5 | |
| | | | | Net Expense Ratio (Current) | | | Gross Expense Ratio (Before Waivers) | |
| | Class A | | | 1.35 | % | | | 1.35 | % |
| | Class C | | | 2.10 | | | | 2.10 | |
| | Institutional | | | 0.95 | | | | 0.95 | |
| | | Class IR | | | 1.09 | | | | 1.09 | |
| | 5 | | The expense ratios of the Fund, both current (net of applicable fee waivers and/or expense limitations) and before waivers (gross of applicable fee waivers and/or expense limitations) are as set forth above according to the most recent publicly available Prospectus for the Fund and may differ from the expense ratios disclosed in the Financial Highlights in this report. |
| | | | | | | | | | | | | | |
| | STANDARDIZED AFTER-TAX PERFORMANCE AS OF 12/31/156 | |
| | | Class A Shares | | One Year | | | Five Years | | | Since Inception
(1/31/08) | |
| | Returns Before Taxes* | | | -10.08 | % | | | -0.27 | % | | | -1.65 | % |
| | Returns After Taxes on Distributions** | | | -10.64 | | | | -1.08 | | | | -2.22 | |
| | | Returns After Taxes on Distributions***
and Sale of Fund Shares | | | -4.86 | | | | 0.18 | | | | -0.86 | |
| | 6 | | The after-tax returns are calculated using the historically highest individual federal marginal income tax rates at the time of distributions (currently 23.8% for qualifying ordinary income dividends and long-term capital gain distributions and 43.4% for non-qualifying ordinary income dividends) and do not reflect state and local taxes. Actual after-tax returns will be calculated at calendar year-end and depend on an investor’s tax situation and may differ from those shown. In addition, the after-tax returns shown are not relevant to investors who hold Fund shares through tax-deferred arrangements such as 401(k) plans or individual retirement accounts. Under certain circumstances, the addition of the tax benefits from capital losses resulting from redemptions may cause the Returns After Taxes on Distributions and Sale of Fund Shares to be greater than the Returns After Taxes on Distributions or even Returns Before Taxes. Standardized after-tax returns assume reinvestment of all distributions at NAV and reflect a maximum initial sales charge of 5.5% for Class A Shares. |
| | *Returns | | Before Taxes do not reflect taxes on distributions on the Fund’s Class A Shares nor do they show how performance can be impacted by taxes when shares are redeemed. |
| | **Returns | | After Taxes on Distributions assume that taxes are paid on distributions on the Fund’s Class A Shares (i.e., dividends and capital gains) but do not reflect taxes that may be incurred upon redemption of the Class A Shares at the end of the performance period. |
| ***Returns | | After Taxes on Distributions and Sale of Fund Shares reflect taxes paid on distributions on the Fund’s Class A Shares and taxes applicable when the shares are redeemed. |
16
FUND BASICS
| | | | | | | | |
| | TOP TEN HOLDINGS AS OF 12/31/157 |
| | | Company | | % of Net Assets | | | Line of Business |
| | HSBC Holdings PLC | | | 2.7 | % | | Banks |
| | GlaxoSmithKline PLC ADR | | | 2.3 | | | Pharmaceuticals, Biotechnology &
Life Sciences |
| | Novartis AG (Registered) | | | 2.0 | | | Pharmaceuticals, Biotechnology &
Life Sciences |
| | Daimler AG (Registered) | | | 1.7 | | | Automobiles & Components |
| | Unilever NV CVA | | | 1.6 | | | Household & Personal Products |
| | Anheuser-Busch InBev NV | | | 1.5 | | | Food, Beverage & Tobacco |
| | Vodafone Group PLC ADR | | | 1.5 | | | Telecommunication Services |
| | Zurich Insurance Group AG | | | 1.5 | | | Insurance |
| | Telefonica SA | | | 1.5 | | | Telecommunication Services |
| | | Engie | | | 1.4 | | | Utilities |
| | 7 | | The top 10 holdings may not be representative of the Fund’s future investments. |
| | |
| FUND VS. BENCHMARK SECTOR ALLOCATIONS8 |
| As of December 31, 2015 |
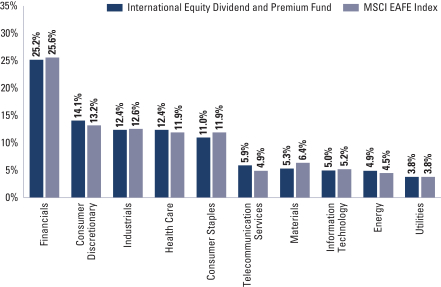
| | 8 | | The Fund is actively managed and, as such, its composition may differ over time. Consequently, the Fund’s overall sector allocations may differ from percentages contained in the graph above. The graph categorizes investments using Global Industry Classification Standard (“GICS”), however, the sector classifications used by the portfolio management team may differ from GICS. The percentage shown for each investment category reflects the value of investments in that category as a percentage of market value. The graph depicts the Fund’s investments but may not represent the Fund’s market exposure due to the exclusion of certain derivatives, if any, as listed in the Additional Investment Information section of the Schedule of Investments. |
17
GOLDMAN SACHS INTERNATIONAL EQUITY DIVIDEND AND PREMIUM FUND
Performance Summary
December 31, 2015
The following graph shows the value as of December 31, 2015, of a $1,000,000 investment made on January 31, 2008 (commencement of operations) in Institutional Shares. For comparative purposes, the performance of the Fund’s primary and secondary benchmarks, the MSCI EAFE Index (Net, USD, Unhedged) and the Barclays Global Aggregate Bond Index (Gross, USD, Unhedged), respectively, is shown. This performance data represents past performance and should not be considered indicative of future performance, which will fluctuate with changes in market conditions. These performance fluctuations will cause an investor’s shares, when redeemed, to be worth more or less than their original cost. Performance reflects applicable fee waivers and/or expense limitations in effect during the periods shown and in their absence, performance would be reduced. Returns do not reflect the deduction of taxes that a shareholder would pay on Fund distributions or the redemption of Fund shares. Performance of Class A, Class C and Class IR Shares will vary from Institutional Shares due to differences in class specific fees and any applicable sales charges. In addition to the Investment Adviser’s decision regarding issuer/industry/country investment selection and allocation, other factors may affect Fund performance. These factors include, but are not limited to, Fund operating fees and expenses, portfolio turnover, and subscription and redemption cash flows affecting the Fund.
|
| International Equity Dividend and Premium Fund’s Lifetime Performance |
Performance of a $1,000,000 Investment, with distributions reinvested, from January 31, 2008 through December 31, 2015.
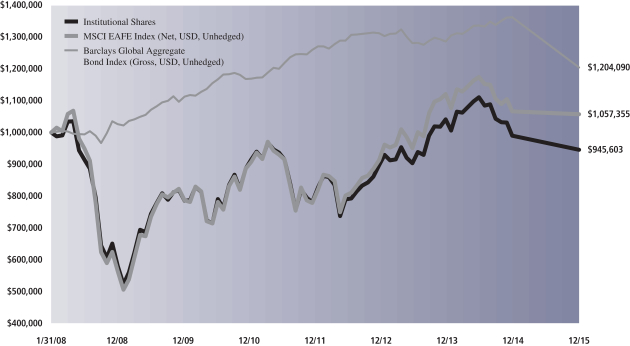
| | | | | | | | | | |
| Average Annual Total Return through December 31, 2015 | | | One Year | | | | Five Years | | | Since Inception |
| Class A (Commenced January 31, 2008) | | | | | | | | |
Excluding sales charges | | | -4.80% | | | | 0.88% | | | -0.94% |
Including sales charges | | | -10.08% | | | | -0.27% | | | -1.65% |
|
Class C (Commenced January 31, 2008) | | | | | | | | | | |
Excluding contingent deferred sales charges | | | -5.59% | | | | 0.12% | | | -1.84% |
Including contingent deferred sales charges | | | -6.54% | | | | 0.12% | | | -1.84% |
|
Institutional (Commenced January 31, 2008) | | | -4.42% | | | | 1.31% | | | -0.70% |
|
Class IR (Commenced August 31, 2010) | | | -4.69% | | | | 1.12% | | | 3.92% |
|
18
INVESTMENT PROCESS
What Differentiates the Goldman Sachs Global Tax-Management Investment Process?
In managing money for many of the world’s wealthiest taxable investors, Goldman Sachs often constructs a diversified investment portfolio around a tax-managed core. With the Goldman Sachs U.S. Tax-Managed Equity Fund and International Tax-Managed Equity Fund, investors can access Goldman Sachs’ tax-smart investment expertise while potentially capitalizing on this same strategic approach to portfolio construction.
Goldman Sachs Global Tax-Management Investment Process
The Goldman Sachs Global Tax-Management investment process is a disciplined quantitative approach that has been consistently applied since 1989. With the Goldman Sachs U.S.Tax-Managed Equity Fund and the Goldman Sachs International Tax-Managed Equity Fund, the investment process is enhanced with an additional layer that seeks to maximize after-tax returns.
Advantage: Daily analysis of approximately 3,000 U.S. and international equity securities using a proprietary model.
| n | | Sector and size neutral |
Tax optimization is an additional layer that is built into the existing investment process — a distinct advantage. While other managers may simply seek to minimize taxable distributions through a low turnover strategy, this extension of the investment process seeks to maximize after-tax returns — the true objective of every taxable investor.
Advantage: Value added through stock selection — not market timing, industry rotation or style bias.
| n | | A fully invested, style-consistent portfolio |
| n | | Broad access to the total U.S. and international equity markets |
| n | | A consistent goal of seeking to maximize after-tax risk-adjusted returns |
19
PORTFOLIO RESULTS
U.S. Tax-Managed Equity Fund
Investment Objective
The Fund seeks to provide long-term after-tax growth of capital through tax-sensitive participation in a broadly diversified portfolio of U.S. equity securities.
Portfolio Management Discussion and Analysis
Below, the Goldman Sachs Quantitative Investment Strategies Team discusses the Goldman Sachs U.S. Tax-Managed Equity Fund’s (the “Fund”) performance and positioning for the 12-month period ended December 31, 2015 (the “Reporting Period”).
| Q | | How did the Fund perform during the Reporting Period? |
| A | | During the Reporting Period, the Fund’s Class A, C, Institutional, Service and IR Shares generated average annual total returns, without sales charges, of -0.28%, -1.05%, 0.10%, -0.41% and -0.03%, respectively. These returns compare to the 0.48% average annual total return of the Fund’s benchmark, the Russell 3000® Index (the “Index”), over the same time period. |
| Q | | What key factors were most responsible for the Fund’s performance during the Reporting Period? |
| A | | During the Reporting Period, the Fund benefited from stock selection driven by our quantitative model, with four of our quantitative model’s six investment themes contributing positively to relative returns. However, the Fund underperformed the Index, largely due to the underperformance of our Valuation investment theme. |
| Q | | What impact did the Fund’s investment themes have on performance during the Reporting Period? |
| A | | In keeping with our investment approach, we use our quantitative model and its six investment themes to take a long-term view of market patterns and look for inefficiencies, selecting stocks for the Fund and overweighting or underweighting the ones chosen by the model. Over time and by design, the performance of any one of the model’s investment themes tends to have a low correlation with the model’s other themes, demonstrating the diversification benefit of the Fund’s theme-driven quantitative model. The variance in performance supports our research indicating that the diversification provided by the Fund’s different investment themes is a significant investment advantage over the long term, even though the Fund may experience underperformance in the short term. Of course, diversification does not protect an investor from market risk nor does it ensure a profit. |
| | During the Reporting Period, our Valuation theme detracted from Fund performance. The Valuation theme attempts to capture potential mispricings of securities, typically by comparing a measure of the company’s intrinsic value to its market value. |
| | Momentum, Sentiment, Profitability and Quality added to the Fund’s relative returns. The Momentum theme seeks to predict drifts in stock prices caused by delayed investor reaction to company-specific information and information about related companies. The Sentiment theme reflects selected investment views and decisions of individuals and financial intermediaries. The Profitability theme assesses whether a company is earning more than its cost of capital. The Quality theme seeks to assess both firm and management quality. |
| | Our Management theme had a relatively neutral impact on the Fund’s relative results during the Reporting Period. The Management theme assesses the characteristics, policies and strategic decisions of company management. |
| Q | | How did the Fund sector and industry allocations affect relative performance? |
| A | | In constructing the Fund’s portfolio, we focus on picking stocks rather than on making sector or industry bets. Consequently, the Fund is similar to the Index in terms of its sector and industry allocations and its style. Changes in its sector or industry weights generally do not have a meaningful impact on relative performance. |
20
PORTFOLIO RESULTS
| Q | | How successful was your stock selection during the Reporting Period? |
| A | | The Fund seeks to provide investors with a tax-efficient means for maintaining broadly diversified exposure to the entire U.S. equity market, ranging from large- to small-cap stocks. During the Reporting Period, our stock selection bolstered the Fund’s relative performance. |
| Q | | Among individual holdings, which stocks contributed most to the Fund’s results? |
| A | | Stock selection in the energy, industrials and financials sectors added to the Fund’s relative returns during the Reporting Period. The Fund benefited from overweight positions in Valero Energy, Cameron International and Broadcom. We adopted the overweight in petroleum refiner Valero Energy due to our positive views on Momentum and Sentiment. The Fund was overweight Cameron International, a global provider of pressure control, processing, flow control and compression systems, because of our positive views on Sentiment and Quality. The overweight in semiconductor maker Broadcom was the result of our positive views on Sentiment and Profitability. |
| Q | | Which individual stock holdings detracted significantly from relative performance during the Reporting Period? |
| A | | Stock choices in the information technology, consumer staples and health care sectors detracted from relative returns. The Fund was hampered by overweight positions in semiconductor maker Micron Technology and specialty coffee and coffeemaker company Keurig Green Mountain. We chose to overweight Micron Technology because of our positive views on Sentiment and Valuation. The Fund was overweight Keurig Green Mountain as a result of our positive views on Valuation. An underweight position in online retailer Amazon.com, which was based on our negative views on Valuation and Momentum, also weighed on the Fund’s results. |
| Q | | How did the Fund use derivatives and similar instruments during the Reporting Period? |
| A | | During the Reporting Period, we did not use derivatives as part of an active management strategy to add value to the Fund’s results. However, we used equity index futures, on an opportunistic basis, to equitize the Fund’s excess cash holdings. In other words, we put the Fund’s excess cash holdings to work by using them as collateral for the purchase of equity index futures. Equity index futures had a neutral impact on the Fund’s performance during the Reporting Period. |
| Q | | What changes or enhancements did you make to your quantitative model during the Reporting Period? |
| A | | During the Reporting Period, we made a number of enhancements to our quantitative model. We made two enhancements to our Sentiment theme. First, we introduced a signal that uses the credit default swap (CDS) spread of a company as an early indicator of potential stock price swings. We use data on single-name CDS spreads for more than 300 companies on a daily basis to arrive at our views. (CDS spread is the annual cost of protecting against default.) Second, we introduced a signal that uses stock options data of a company as a potential indicator of stock mispricing. Due to fewer restrictions on leverage and short-selling, we believe the option markets typically incorporate information more efficiently than equity markets. Because of the broad availability of options data on U.S. equities, we can form views on the majority of stocks in our investment universe using this signal. |
| | In addition, we enhanced our Management theme by expanding the scope of an existing signal that looks at managements’ personal transactions in the stock of their respective companies. Corporate executives who purchase or sell shares could potentially signal conviction in their company’s stock when these transactions are assessed under the right circumstances. We obtain and analyze this information through regulatory filings for more than 7,500 companies globally. |
| | We also expanded the scope of signals within our global linkages theme during the Reporting Period. First, we introduced a signal that analyzes patent data to identify economically linked companies. We analyze about 40 million patents from various patent offices for more than 3,000 companies globally to establish the economic linkages between the stocks of various industries. Second, we extended a signal that establishes economic linkages between companies in the automotive supply chain from Japan to the U.S. and Europe. We take a differentiated, region-specific approach and analyze the potential relationships between the stock returns of suppliers and manufacturers at multiple levels down the supply chain. |
| | Finally, we introduced a signal to our Profitability theme that analyzes web traffic data of companies that we believe can potentially forecast corporate revenue growth. We analyze this information for approximately 4,000 companies, spanning various sectors. |
21
PORTFOLIO RESULTS
| Q | | How was the Fund positioned relative to the Index at the end of the Reporting Period? |
| A | | In constructing the Fund’s portfolio, we focus on picking stocks rather than on making industry or sector bets. Consequently, the Fund is similar to the Index in terms of its sector allocation and style. That said, at the end of the Reporting Period, the Fund was overweight relative to the Index in the financials and energy sectors. It was underweight compared to the Index in the information technology, consumer discretionary, health care, industrials, consumer staples and telecommunication services sectors. The Fund was relatively neutral in the materials and utilities sectors at the end of the Reporting Period. |
22
FUND BASICS
U.S. Tax-Managed Equity Fund
as of December 31, 2015
| | | | | | | | | | |
| | PERFORMANCE REVIEW | | | | | | | | |
| | | January 1, 2015–December 31, 2015 | | Fund Total Return
(based on NAV)1 | | | Russell 3000® Index2 | |
| | Class A | | | -0.28 | % | | | 0.48 | % |
| | Class C | | | -1.05 | | | | 0.48 | |
| | Institutional | | | 0.10 | | | | 0.48 | |
| | Service | | | -0.41 | | | | 0.48 | |
| | | Class IR | | | -0.03 | | | | 0.48 | |
| | 1 | | The net asset value (“NAV”) represents the net assets of the class of the Fund (ex-dividend) divided by the total number of shares of the class outstanding. The Fund’s performance assumes the reinvestment of dividends and other distributions. The Fund’s performance does not reflect the deduction of any applicable sales charges. |
| | 2 | | The Russell 3000® Index is an unmanaged index that measures the performance of the 3,000 largest U.S. companies based on total market capitalization, which represents approximately 98% of the investable U.S. equity market. Index figures do not reflect any deduction for fees, expenses or taxes. It is not possible to invest directly in an index. |
| | | | | | | | | | | | | | | | | | | | |
| | STANDARDIZED TOTAL RETURNS3 | | | |
| | | For the period ended 12/31/15 | | One Year | | | Five Years | | | Ten Years | | | Since Inception | | | Inception Date |
| | Class A | | | -5.79 | % | | | 11.95 | % | | | 5.59 | % | | | 3.82 | % | | 4/3/00 |
| | Class C | | | -2.04 | | | | 12.37 | | | | 5.38 | | | | 3.40 | | | 4/3/00 |
| | Institutional | | | 0.10 | | | | 13.67 | | | | 6.60 | | | | 4.61 | | | 4/3/00 |
| | Service | | | -0.41 | | | | 13.10 | | | | 6.06 | | | | 4.09 | | | 4/3/00 |
| | | Class IR | | | -0.03 | | | | 13.52 | | | | N/A | | | | 16.92 | | | 8/31/10 |
| | 3 | | The Standardized Total Returns are average annual total returns as of the most recent calendar quarter-end. They assume reinvestment of all distributions at NAV. These returns reflect a maximum initial sales charge of 5.5% for Class A Shares, and the assumed contingent deferred sales charge for Class C Shares (1% if redeemed within 12 months of purchase). Because Institutional, Service and Class IR Shares do not involve a sales charge, such a charge is not applied to their Standardized Total Returns. |
The returns set forth in the tables above represent past performance. Past performance does not guarantee future results. The Fund’s investment return and principal value will fluctuate so that an investor’s shares, when redeemed, may be worth more or less than their original cost. Current performance may be lower or higher than the performance quoted above. Please visit our web site at www.GSAMFUNDS.com to obtain the most recent month-end returns. Performance reflects applicable fee waivers and/or expense limitations in effect during the periods shown. In their absence, performance would be reduced. Returns do not reflect the deduction of taxes that a shareholder would pay on Fund distributions or the redemption of Fund shares.
23
FUND BASICS
| | | | | | | | | | |
| | EXPENSE RATIOS4 | |
| | | | | Net Expense Ratio (Current) | | | Gross Expense Ratio (Before Waivers) | |
| | Class A | | | 1.18 | % | | | 1.19 | % |
| | Class C | | | 1.93 | | | | 1.94 | |
| | Institutional | | | 0.78 | | | | 0.79 | |
| | Service | | | 1.28 | | | | 1.29 | |
| | | Class IR | | | 0.93 | | | | 0.94 | |
| | 4 | | The expense ratios of the Fund, both current (net of applicable fee waivers and/or expense limitations) and before waivers (gross of applicable fee waivers and/or expense limitations) are as set forth above according to the most recent publicly available Prospectus for the Fund and may differ from the expense ratios disclosed in the Financial Highlights in this report. Pursuant to a contractual arrangement, the Fund’s waivers and/or expense limitations will remain in place through at least April 30, 2016, and prior to such date the Investment Adviser may not terminate the arrangements without the approval of the Fund’s Board of Trustees. If these arrangements are discontinued in the future, the expense ratios may change without shareholder approval. |
| | | | | | | | | | | | | | | | | | |
| | STANDARDIZED AFTER-TAX PERFORMANCE AS OF 12/31/155 | |
| | | Class A Shares | | One Year | | | Five Years | | | Ten Years | | | Since Inception
(4/3/00) | |
| | Returns Before Taxes* | | | -5.79 | % | | | 11.95 | % | | | 5.59 | % | | | 3.82 | % |
| | Returns After Taxes on Distributions** | | | -5.94 | | | | 11.73 | | | | 5.42 | | | | 3.70 | |
| | | Returns After Taxes on Distributions***
and Sale of Fund Shares | | | -3.16 | | | | 9.54 | | | | 4.48 | | | | 3.07 | |
| | 5 | | The after-tax returns are calculated using the historically highest individual federal marginal income tax rates at the time of distributions (currently 23.8% for qualifying ordinary income dividends and long-term capital gain distributions and 43.4% for non-qualifying ordinary income dividends) and do not reflect state and local taxes. Actual after-tax returns will be calculated at calendar year-end and depend on an investor’s tax situation and may differ from those shown. In addition, the after-tax returns shown are not relevant to investors who hold Fund shares through tax-deferred arrangements such as 401(k) plans or individual retirement accounts. Under certain circumstances, the addition of the tax benefits from capital losses resulting from redemptions may cause the Returns After Taxes on Distributions and Sale of Fund Shares to be greater than the Returns After Taxes on Distributions or even Returns Before Taxes. Standardized after-tax returns assume reinvestment of all distributions at NAV and reflect a maximum initial sales charge of 5.5% for Class A Shares. |
| | *Returns | | Before Taxes do not reflect taxes on distributions on the Fund’s Class A Shares nor do they show how performance can be impacted by taxes when shares are redeemed. |
| | **Returns | | After Taxes on Distributions assume that taxes are paid on distributions on the Fund’s Class A Shares (i.e., dividends and capital gains) but do not reflect taxes that may be incurred upon redemption of the Class A Shares at the end of the performance period. |
| ***Returns | | After Taxes on Distributions and Sale of Fund Shares reflect taxes paid on distributions on the Fund’s Class A Shares and taxes applicable when the shares are redeemed. |
24
FUND BASICS
| | | | | | | | |
| | TOP TEN HOLDINGS AS OF 12/31/156 |
| | | Holding | | % of Net Assets | | | Line of Business |
| | Apple, Inc. | | | 2.9 | % | | Technology Hardware & Equipment |
| | Microsoft Corp. | | | 2.2 | | | Software & Services |
| | Altria Group, Inc. | | | 1.6 | | | Food, Beverage & Tobacco |
| | JPMorgan Chase & Co. | | | 1.6 | | | Banks |
| | Bank of America Corp. | | | 1.5 | | | Banks |
| | CVS Health Corp. | | | 1.5 | | | Food & Staples Retailing |
| | The Home Depot, Inc. | | | 1.5 | | | Retailing |
| | Valero Energy Corp. | | | 1.4 | | | Energy |
| | Amgen, Inc. | | | 1.3 | | | Pharmaceuticals, Biotechnology &
Life Sciences |
| | | McKesson Corp. | | | 1.3 | | | Health Care Equipment & Services |
| | 6 | | The top 10 holdings may not be representative of the Fund’s future investments. |
| | | | |
| FUND VS. BENCHMARK SECTOR ALLOCATIONS7 |
| As of December 31, 2015 |
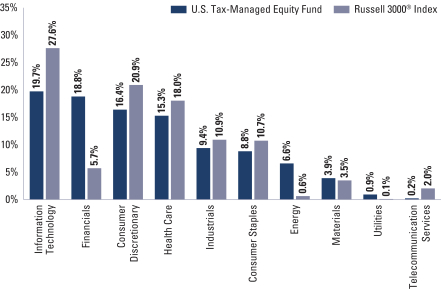
| | 7 | | The Fund is actively managed and, as such, its composition may differ over time. Consequently, the Fund’s overall sector allocations may differ from percentages contained in the graph above. The graph categorizes investments using Global Industry Classification Standard (“GICS”), however, the sector classifications used by the portfolio management team may differ from GICS. The percentage shown for each investment category reflects the value of investments in that category as a percentage of market value (excluding investments in the securities lending reinvestment vehicle, if any). Investments in the securities lending reinvestment vehicle represented 1.9% of the Fund’s net assets at December 31, 2015. The graph depicts the Fund’s investments but may not represent the Fund’s market exposure due to the exclusion of certain derivatives, if any, as listed in the Additional Investment Information section of the Schedule of Investments. |
25
GOLDMAN SACHS U.S. TAX-MANAGED EQUITY FUND
Performance Summary
December 31, 2015
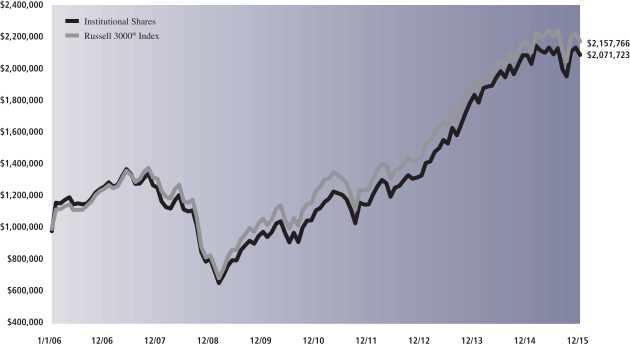
The following graph shows the value as of December 31, 2015, of a $1,000,000 investment made on January 1, 2006 in Institutional Shares at NAV. For comparative purposes, the performance of the Fund’s benchmark, the Russell 3000® Index, is shown. This performance data represents past performance and should not be considered indicative of future performance, which will fluctuate with changes in market conditions. These performance fluctuations will cause an investor’s shares, when redeemed, to be worth more or less than their original cost. Performance reflects applicable fee waivers and/or expense limitations in effect during the periods shown and in their absence, performance would be reduced. Returns do not reflect the deduction of taxes that a shareholder would pay on Fund distributions or the redemption of Fund shares. Performance of Class A, Class C, Service and Class IR Shares will vary from Institutional Shares due to differences in class specific fees and any applicable sales charges. In addition to the Investment Adviser’s decision regarding issuer/industry investment selection and allocation, other factors may affect Fund performance. These factors include, but are not limited to, Fund operating fees and expenses, portfolio turnover, and subscription and redemption cash flows affecting the Fund.
|
| U.S. Tax-Managed Equity Fund’s 10 Year Performance |
Performance of a $1,000,000 Investment, with distributions reinvested, from January 1, 2006 through December 31, 2015.
| | | | | | | | | | | | |
| Average Annual Total Return through December 31, 2015 | | | One Year | | | | Five Years | | | Ten Years | | Since Inception |
Class A (Commenced April 3, 2000) | | | | | | | | | | | | |
Excluding sales charges | | | -0.28% | | | | 13.23% | | | 6.18% | | 4.19% |
Including sales charges | | | -5.79% | | | | 11.95% | | | 5.59% | | 3.82% |
|
Class C (Commenced April 3, 2000) | | | | | | | | | | | | |
Excluding contingent deferred sales charges | | | -1.05% | | | | 12.37% | | | 5.38% | | 3.40% |
Including contingent deferred sales charges | | | -2.04% | | | | 12.37% | | | 5.38% | | 3.40% |
|
Institutional (Commenced April 3, 2000) | | | 0.10% | | | | 13.67% | | | 6.60% | | 4.61% |
|
Service (Commenced April 3, 2000) | | | -0.41% | | | | 13.10% | | | 6.06% | | 4.09% |
|
Class IR (Commenced August 31, 2010) | | | -0.03% | | | | 13.52% | | | N/A | | 16.92% |
|
26
PORTFOLIO RESULTS
International Tax-Managed Equity Fund
Investment Objective
The Fund seeks to provide long-term after-tax growth of capital through tax-sensitive participation in a broadly diversified portfolio of international equity securities.
Portfolio Management Discussion and Analysis
Below, the Goldman Sachs Quantitative Investment Strategies Team discusses the Goldman Sachs International Tax-Managed Equity Fund’s (the “Fund”) performance and positioning for the 12-month period ended December 31, 2015 (the “Reporting Period”).
| Q | | How did the Fund perform during the Reporting Period? |
| A | | During the Reporting Period, the Fund’s Class A, C, Institutional and IR Shares generated average annual total returns, without sales charges, of 3.77%, 3.07%, 4.26% and 4.04%, respectively. These returns compare to the -0.81% average annual total return of the Fund’s benchmark, the MSCI EAFE Index (net, USD, unhedged) (the “Index”), during the same time period. |
| Q | | What key factors were most responsible for the Fund’s performance during the Reporting Period? |
| A | | During the Reporting Period, the Fund benefited from stock selection driven by our quantitative model, with five of our quantitative model’s six investment themes contributing positively to relative returns. |
| Q | | What impact did the Fund’s investment themes have on performance during the Reporting Period? |
| A | | In keeping with our investment approach, we use our quantitative model and its six investment themes to take a long-term view of market patterns and look for inefficiencies, selecting stocks for the Fund and overweighting or underweighting the ones chosen by the model. Over time and by design, the performance of any one of the model’s investment themes tends to have a low correlation with the model’s other themes, demonstrating the diversification benefit of the Fund’s theme-driven quantitative model. The variance in performance supports our research indicating that the diversification provided by the Fund’s different investment themes is a significant investment advantage over the long term, even though the Fund may experience underperformance in the short term. Of course, diversification does not protect an investor from market risk nor does it ensure a profit. |
| | During the Reporting Period, five of our quantitative model’s six investment themes bolstered the Fund’s results. Sentiment, Momentum, Quality, Valuation and Profitability all contributed positively. The Sentiment theme reflects selected investment views and decisions of individuals and financial intermediaries. The Momentum theme seeks to predict drifts in stock prices caused by delayed investor reaction to company-specific information and information about related companies. The Quality theme seeks to assess both firm and management quality. The Valuation theme attempts to capture potential mispricings of securities, typically by comparing a measure of the company’s intrinsic value to its market value. The Profitability theme assesses whether a company is earning more than its cost of capital. |
| | Our Management theme detracted from relative performance. The Management theme assesses the characteristics, policies and strategic decisions of company management. |
| Q | | How did the Fund sector and industry allocations affect relative performance? |
| A | | In constructing the Fund’s portfolio, we focus on picking stocks rather than on making sector or industry bets. Consequently, the Fund is similar to the Index in terms of its sector and industry allocations and its style. Changes in its sector or industry weights generally do not have a meaningful impact on relative performance. |
| Q | | How successful was your stock selection during the Reporting Period? |
| A | | The Fund seeks to provide investors with a tax-efficient means for maintaining broadly diversified exposure to the |
27
PORTFOLIO RESULTS
| | entire Europe, Australasia and Far East (“EAFE”) market. During the Reporting Period, security selection added to the Fund’s relative returns. |
| Q | | Among individual holdings, which stocks contributed most to the Fund’s results? |
| A | | Stock picks in the financials, consumer discretionary and industrials sectors contributed positively to the Fund’s relative performance. The Fund benefited from an underweight position in Glencore, an Anglo-Swiss commodity trading and mining company. We chose to underweight Glencore because of our negative views on Momentum and Sentiment. The Fund’s overweights in Australian airline Qantas Airways and Japanese pharmaceutical company Daiichi Sankyo enhanced relative results. The overweight in Qantas Airways was based on our positive views of Sentiment and Momentum, while our positive views on Valuation and Management led us to overweight Daiichi Sankyo. |
| Q | | Which individual stock holdings detracted significantly from relative performance during the Reporting Period? |
| A | | On a sector basis, none of the Fund’s investments detracted from relative results. The Fund’s gains were limited by its underweight positions in Novo Nordisk and SAP as well as by an overweight position in K+S. We adopted the underweight in Danish pharmaceutical company Novo Nordisk as a result of our negative views on Valuation and Sentiment. The Fund was underweight German software company SAP due to our negative views on Momentum and Valuation. The overweight in K+S, a Germany-based resources company, was based on our positive views on Valuation and Management. |
| Q | | How did the Fund use derivatives and similar instruments during the Reporting Period? |
| A | | During the Reporting Period, we did not use derivatives as part of an active management strategy to add value to the Fund’s results. However, we used equity index futures, on an opportunistic basis, to equitize the Fund’s excess cash holdings. In other words, we put the Fund’s excess cash holdings to work by using them as collateral for the purchase of equity index futures. Equity index futures had a neutral impact on the Fund’s performance during the Reporting Period. |
| Q | | What changes or enhancements did you make to your quantitative model during the Reporting Period? |
| A | | During the Reporting Period, we made a number of enhancements to our quantitative model. Within our Sentiment theme, we introduced a signal in the Europe and Japan investment regions that uses the credit default swap (CDS) spread of a company as an early indicator of potential stock price swings. We use data on single-name CDS spreads for more than 300 companies on a daily basis to arrive at our views. (CDS spread is the annual cost of protecting against default.) |
| | In addition, we enhanced our Management theme in the Europe and emerging markets investment regions by expanding the scope of an existing signal that looks at managements’ personal transactions in the stock of their respective companies. Corporate executives who purchase or sell shares could potentially signal conviction in their company’s stock when these transactions are assessed under the right circumstances. We obtain and analyze this information through regulatory filings for more than 7,500 companies globally. |
| | We also expanded the scope of signals within our global linkages theme during the Reporting Period. First, we introduced a signal that analyzes patent data to identify economically linked companies. We analyze about 40 million patents from various patent offices for more than 3,000 companies globally to establish the economic linkages between the stocks of various industries. Second, we extended a signal that establishes economic linkages between companies in the automotive supply chain from Japan to the U.S. and Europe. We take a differentiated, region-specific approach and analyze the potential relationships between the stock returns of suppliers and manufacturers multiple levels down the supply chain. |
| | Finally, we introduced a signal to our Profitability theme within the emerging markets and Japan investment regions that analyzes web traffic data of companies that we believe can potentially forecast corporate revenue growth. We analyze this information for approximately 4,000 companies, spanning various sectors. |
| Q | | How was the Fund positioned relative to the Index at the end of the Reporting Period? |
| A | | In constructing the Fund’s portfolio, we focus on picking stocks rather than on country weightings. Consequently, the Fund is similar to the Index in terms of its sector and country allocations. That said, at the end of the Reporting Period, the Fund was overweight the industrials, consumer discretionary and health care sectors relative to the Index. It was underweight the financials, materials, telecommunication services and energy sectors. The Fund was relatively neutrally weighted in the consumer staples, information |
28
PORTFOLIO RESULTS
| | technology and utilities sectors at end of the Reporting Period. |
| | At the end of the Reporting Period, the Fund was overweight relative to the Index in Japan, France, Spain and Norway. Compared to the Index, it was underweight the U.K., Switzerland and Sweden. The Fund was relatively neutrally weighted relative to the Index in the Netherlands, Germany, Hong Kong, New Zealand, Finland, Portugal, Austria, Belgium, Ireland, Italy, Israel, Denmark, Australia and Singapore at the end of the Reporting Period. |
29
FUND BASICS
International Tax-Managed Equity Fund
as of December 31, 2015
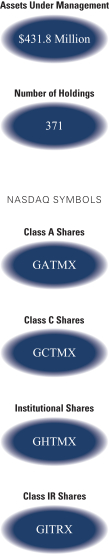
| | | | | | | | | | |
| | PERFORMANCE REVIEW | |
| | | January 1, 2015–December 31, 2015 | | Fund Total Return
(based on NAV)1 | | | MSCI EAFE (Net, USD,
Unhedged)2 | |
| | Class A | | | 3.77 | % | | | -0.81 | % |
| | Class C | | | 3.07 | | | | -0.81 | |
| | Institutional | | | 4.26 | | | | -0.81 | |
| | | Class IR | | | 4.04 | | | | -0.81 | |
| | 1 | | The net asset value (“NAV”) represents the net assets of the class of the Fund (ex-dividend) divided by the total number of shares of the class outstanding. The Fund’s performance reflects the reinvestment of dividends and other distributions. The Fund’s performance does not reflect the deduction of any applicable sales charges. |
| | 2 | | The unmanaged MSCI EAFE Index (Net, USD, Unhedged) is a market capitalization-weighted composite of securities in 21 developed markets. The Index figures do not include any deduction for fees or expenses. It is not possible to invest directly in an index. |
| | | | | | | | | | | | | | | | | | |
| | STANDARDIZED TOTAL RETURNS3 | |
| | | For the period ended 12/31/15 | | One Year | | | Five Years | | | Since Inception | | | Inception Date | |
| | Class A | | | -1.92 | % | | | 2.80 | % | | | -0.44 | % | | | 1/31/08 | |
| | Class C | | | 2.06 | | | | 3.19 | | | | -0.47 | | | | 1/31/08 | |
| | Institutional | | | 4.26 | | | | 4.39 | | | | 0.67 | | | | 1/31/08 | |
| | | Class IR | | | 4.04 | | | | 4.22 | | | | 7.25 | | | | 8/31/10 | |
| | 3 | | The Standardized Total Returns are average annual total returns as of the most recent calendar quarter-end. They assume reinvestment of all distributions at NAV. These returns reflect a maximum initial sales charge of 5.5% for Class A Shares and the assumed contingent deferred sales charge for Class C Shares (1% if redeemed within 12 months of purchase). Because Institutional and Class IR Shares do not involve a sales charge, such a charge is not applied to their Standardized Total Returns. |
The returns set forth in the tables above represent past performance. Past performance does not guarantee future results. The Fund’s investment return and principal value will fluctuate so that an investor’s shares, when redeemed, may be worth more or less than their original cost. Current performance may be lower or higher than the performance quoted above. Please visit our web site at www.GSAMFUNDS.com to obtain the most recent month-end returns. Performance reflects applicable fee waivers and/or expense limitations in effect during the periods shown. In their absence, performance would be reduced. Returns do not reflect the deduction of taxes that a shareholder would pay on Fund distributions or the redemption of Fund shares.
30
FUND BASICS
| | | | | | | | | | |
| | EXPENSE RATIOS4 | |
| | | | | Net Expense Ratio (Current) | | | Gross Expense Ratio (Before Waivers) | |
| | Class A | | | 1.38 | % | | | 1.42 | % |
| | Class C | | | 2.13 | | | | 2.17 | |
| | Institutional | | | 0.98 | | | | 1.02 | |
| | | Class IR | | | 1.13 | | | | 1.17 | |
| | 4 | | The expense ratios of the Fund, both current (net of applicable fee waivers and/or expense limitations) and before waivers (gross of applicable fee waivers and/or expense limitations) are as set forth above according to the most recent publicly available Prospectus for the Fund and may differ from the expense ratios disclosed in the Financial Highlights in this report. Pursuant to a contractual arrangement, the Fund’s waivers and/or expense limitations will remain in place through at least April 30, 2016, and prior to such date the Investment Adviser may not terminate the arrangements without the approval of the Fund’s Board of Trustees. If these arrangements are discontinued in the future, the expense ratios may change without shareholder approval. |
| | | | | | | | | | | | | | |
| | STANDARDIZED AFTER-TAX PERFORMANCE AS OF 12/31/155 | |
| | | Class A Shares | | One Year | | | Five Years | | | Since Inception
(1/31/08) | |
| | Returns Before Taxes* | | | -1.92 | % | | | 2.80 | % | | | -0.44 | % |
| | Returns After Taxes on Distributions** | | | -2.10 | | | | 2.47 | | | | -0.74 | |
| | | Returns After Taxes on Distributions***
and Sale of Fund Shares | | | -0.79 | | | | 2.26 | | | | -0.23 | |
| 5 | | The after-tax returns are calculated using the historically highest individual federal marginal income tax rates at the time of distributions (currently 23.8% for qualifying ordinary income dividends and long-term capital gain distributions and 43.4% for non-qualifying ordinary income dividends) and do not reflect state and local taxes. Actual after-tax returns will be calculated at calendar year-end and depend on an investor’s tax situation and may differ from those shown. In addition, the after-tax returns shown are not relevant to investors who hold Fund shares through tax-deferred arrangements such as 401(k) plans or individual retirement accounts. Under certain circumstances, the addition of the tax benefits from capital losses resulting from redemptions may cause the Returns After Taxes on Distributions and Sale of Fund Shares to be greater than the Returns After Taxes on Distributions or even Returns Before Taxes. Standardized after-tax returns assume reinvestment of all distributions at NAV and reflect a maximum initial sales charge of 5.5% for Class A Shares. |
| * | | Returns Before Taxes do not reflect taxes on distributions on the Fund’s Class A Shares nor do they show how performance can be impacted by taxes when shares are redeemed. |
| ** | | Returns After Taxes on Distributions assume that taxes are paid on distributions on the Fund’s Class A Shares (i.e., dividends and capital gains) but do not reflect taxes that may be incurred upon redemption of the Class A Shares at the end of the performance period. |
| *** | | Returns After Taxes on Distributions and Sale of Fund Shares reflect taxes paid on distributions on the Fund’s Class A Shares and taxes applicable when the shares are redeemed. |
31
FUND BASICS
| | | | | | | | |
| | TOP TEN HOLDINGS AS OF 12/31/156 |
| | | Holding | | % of Total
Net Assets | | | Line of Business |
| | British American Tobacco PLC | | | 1.4 | % | | Food, Beverage & Tobacco |
| | Allianz SE (Registered) | | | 1.2 | | | Insurance |
| | Deutsche Telekom AG (Registered) | | | 1.1 | | | Telecommunication Services |
| | Reckitt Benckiser Group PLC | | | 1.1 | | | Household & Personal Products |
| | Qantas Airways Ltd. | | | 1.1 | | | Transportation |
| | AXA SA | | | 1.0 | | | Insurance |
| | ING Groep NV CVA | | | 1.0 | | | Banks |
| | National Grid PLC | | | 1.0 | | | Utilities |
| | Imperial Tobacco Group PLC | | | 1.0 | | | Food, Beverage & Tobacco |
| | | BNP Paribas SA | | | 1.0 | | | Banks |
| | 6 | | The top 10 holdings may not be representative of the Fund’s future investments. |
|
| FUND VS. BENCHMARK SECTOR ALLOCATIONS7 |
| As of December 31, 2015 |
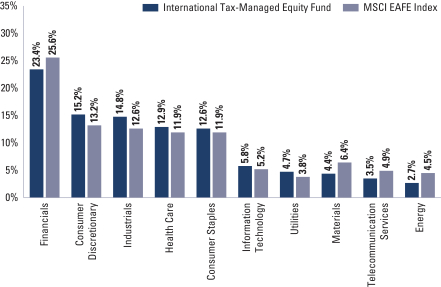
| | 7 | | The Fund is actively managed and, as such, its composition may differ over time. Consequently, the Fund’s overall sector allocations may differ from percentages contained in the graph above. The graph categorizes investments using Global Industry Classification Standard (“GICS”), however, the sector classifications used by the portfolio management team may differ from GICS. The percentage shown for each investment category reflects the value of investments in that category as a percentage of market value (excluding investments in the securities lending reinvestment vehicle, if any). Investments in the securities lending reinvestment vehicle represented 0.8% of the Fund’s net assets at December 31, 2015. The graph depicts the Fund’s investments but may not represent the Fund’s market exposure due to the exclusion of certain derivatives, if any, as listed in the Additional Investment Information section of the Schedule of Investments. |
32
GOLDMAN SACHS INTERNATIONAL TAX-MANAGED EQUITY FUND
Performance Summary
December 31, 2015
The following graph shows the value as of December 31, 2015, of a $1,000,000 investment made on January 31, 2008 (commencement of operations) in Institutional Shares at NAV. For comparative purposes, the performance of the Fund’s benchmark the MSCI EAFE Index (Net, USD, Unhedged) is shown. This performance data represents past performance and should not be considered indicative of future performance, which will fluctuate with changes in market conditions. These performance fluctuations will cause an investor’s shares, when redeemed, to be worth more or less than their original cost. Performance reflects applicable fee waivers and/or expense limitations in effect during the periods shown and in their absence, performance would be reduced. Returns do not reflect the deduction of taxes that a shareholder would pay on Fund distributions or the redemption of Fund shares. Performance of Class A, Class C and Class IR Shares will vary from Institutional Shares due to differences in class specific fees and any applicable sales charges. In addition to the Investment Adviser’s decision regarding issuer/industry/country investment selection and allocation, other factors may affect Fund performance. These factors include, but are not limited to, Fund operating fees and expenses, portfolio turnover, and subscription and redemption cash flows affecting the Fund.
|
| International Tax-Managed Equity Fund’s Lifetime Performance |
Performance of a $1,000,000 Investment, with distributions reinvested, from January 31, 2008 through December 31, 2015.
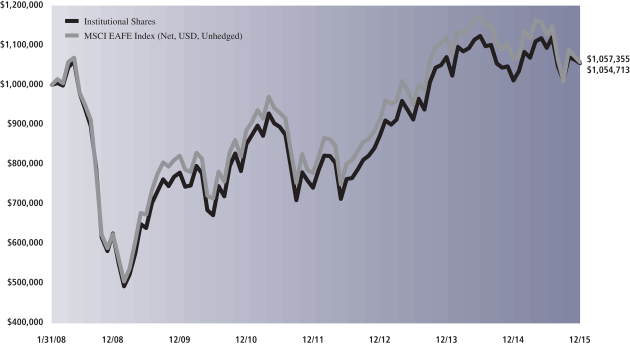
| | | | | | | | | | |
| Average Annual Total Return through December 31, 2015 | | | One Year | | | | Five Years | | | Since Inception |
Class A (Commenced January 31, 2008) | | | | | | | | | | |
Excluding sales charges | | | 3.77% | | | | 3.97% | | | 0.27% |
Including sales charges | | | -1.92% | | | | 2.80% | | | -0.44% |
|
Class C (Commenced January 31, 2008) | | | | | | | | | | |
Excluding contingent deferred sales charges | | | 3.07% | | | | 3.19% | | | -0.47% |
Including contingent deferred sales charges | | | 2.06% | | | | 3.19% | | | -0.47% |
|
Institutional (Commenced January 31, 2008) | | | 4.26% | | | | 4.39% | | | 0.67% |
|
Class IR (Commenced August 31, 2010) | | | 4.04% | | | | 4.22% | | | 7.25% |
|
33
GOLDMAN SACHS U.S. EQUITY DIVIDEND AND PREMIUM FUND
Schedule of Investments
December 31, 2015
| | | | | | | | |
| Shares | | | Description | | Value | |
| | Common Stocks – 96.2% | |
| | Automobiles & Components – 1.3% | |
| | 908,800 | | | Ford Motor Co. | | $ | 12,804,992 | |
| | 257,500 | | | General Motors Co. | | | 8,757,575 | |
| | | | | | | | |
| | | | | | | 21,562,567 | |
| | |
| | Banks – 6.3% | |
| | 601,381 | | | Bank of America Corp. | | | 10,121,242 | |
| | 2,000 | | | Bank of Hawaii Corp. | | | 125,800 | |
| | 29,100 | | | Cullen/Frost Bankers, Inc. | | | 1,746,000 | |
| | 5,901 | | | East West Bancorp, Inc. | | | 245,219 | |
| | 93,800 | | | First Niagara Financial Group, Inc. | | | 1,017,730 | |
| | 329,529 | | | JPMorgan Chase & Co. | | | 21,758,800 | |
| | 774,500 | | | New York Community Bancorp, Inc.(a)(b) | | | 12,639,840 | |
| | 158,900 | | | PacWest Bancorp | | | 6,848,590 | |
| | 963,300 | | | People’s United Financial, Inc.(a) | | | 15,557,295 | |
| | 118,100 | | | U.S. Bancorp | | | 5,039,327 | |
| | 475,900 | | | Wells Fargo & Co.(a) | | | 25,869,924 | |
| | | | | | | | |
| | | | | | | 100,969,767 | |
| | |
| | Capital Goods – 6.1% | |
| | 45,700 | | | 3M Co. | | | 6,884,248 | |
| | 119,800 | | | Caterpillar, Inc. | | | 8,141,608 | |
| | 185,100 | | | Eaton Corp. PLC | | | 9,632,604 | |
| | 135,900 | | | Emerson Electric Co. | | | 6,500,097 | |
| | 811,763 | | | General Electric Co. | | | 25,286,417 | |
| | 46,400 | | | Honeywell International, Inc. | | | 4,805,648 | |
| | 5,300 | | | Joy Global, Inc. | | | 66,833 | |
| | 6,500 | | | KBR, Inc. | | | 109,980 | |
| | 82,251 | | | Lockheed Martin Corp. | | | 17,860,805 | |
| | 68,100 | | | The Boeing Co. | | | 9,846,579 | |
| | 21,600 | | | The Timken Co. | | | 617,544 | |
| | 76,200 | | | United Technologies Corp. | | | 7,320,534 | |
| | | | | | | | |
| | | | | | | 97,072,897 | |
| | |
| | Commercial & Professional Services – 0.8% | |
| | 420,400 | | | Covanta Holding Corp. | | | 6,511,996 | |
| | 115,800 | | | KAR Auction Services, Inc. | | | 4,288,074 | |
| | 8,400 | | | ManpowerGroup, Inc. | | | 708,036 | |
| | 117,600 | | | R.R. Donnelley & Sons Co. | | | 1,731,072 | |
| | | | | | | | |
| | | | | | | 13,239,178 | |
| | |
| | Consumer Durables & Apparel – 1.1% | |
| | 176,000 | | | Coach, Inc. | | | 5,760,480 | |
| | 133,300 | | | Garmin Ltd. | | | 4,954,761 | |
| | 89,600 | | | Leggett & Platt, Inc. | | | 3,764,992 | |
| | 8,262 | | | Lululemon Athletica, Inc.* | | | 433,507 | |
| | 38,175 | | | Skechers U.S.A., Inc. Class A* | | | 1,153,267 | |
| | 36,600 | | | Tupperware Brands Corp. | | | 2,036,790 | |
| | | | | | | | |
| | | | | | | 18,103,797 | |
| | |
| | Consumer Services – 2.2% | |
| | 15,600 | | | Brinker International, Inc. | | | 748,020 | |
| | 5,300 | | | Dunkin’ Brands Group, Inc. | | | 225,727 | |
| | 74,247 | | | International Game Technology PLC | | | 1,201,316 | |
| | 135,400 | | | Las Vegas Sands Corp. | | | 5,935,936 | |
| | 96,600 | | | McDonald’s Corp. | | | 11,412,324 | |
| | 1,300 | | | Service Corp. International | | | 33,826 | |
| | |
| | Common Stocks – (continued) | |
| | Consumer Services – (continued) | |
| | 88,300 | | | Six Flags Entertainment Corp. | | $ | 4,851,202 | |
| | 156,197 | | | Starbucks Corp. | | | 9,376,506 | |
| | 104,900 | | | The Wendy’s Co. | | | 1,129,773 | |
| | | | | | | | |
| | | | | | | 34,914,630 | |
| | |
| | Diversified Financials – 4.8% | |
| | 31,100 | | | Ameriprise Financial, Inc. | | | 3,309,662 | |
| | 140,500 | | | Artisan Partners Asset Management, Inc. Class A | | | 5,066,430 | |
| | 52,596 | | | Berkshire Hathaway, Inc. Class B* | | | 6,944,776 | |
| | 32,900 | | | BlackRock, Inc. | | | 11,203,108 | |
| | 50,600 | | | Capital One Financial Corp. | | | 3,652,308 | |
| | 99,100 | | | CME Group, Inc. | | | 8,978,460 | |
| | 32,700 | | | Eaton Vance Corp. | | | 1,060,461 | |
| | 102,000 | | | Federated Investors, Inc. Class B | | | 2,922,300 | |
| | 264,200 | | | Invesco Ltd. | | | 8,845,416 | |
| | 160,421 | | | Morgan Stanley | | | 5,102,992 | |
| | 17,100 | | | MSCI, Inc. | | | 1,233,423 | |
| | 349,200 | | | Navient Corp. | | | 3,998,340 | |
| | 2,500 | | | NorthStar Asset Management Group, Inc. | | | 30,350 | |
| | 354,816 | | | Synchrony Financial* | | | 10,789,954 | |
| | 147,300 | | | Waddell & Reed Financial, Inc. Class A | | | 4,221,618 | |
| | | | | | | | |
| | | | | | | 77,359,598 | |
| | |
| | Energy – 6.0% | |
| | 57,900 | | | Anadarko Petroleum Corp. | | | 2,812,782 | |
| | 19,500 | | | Antero Resources Corp.* | | | 425,100 | |
| | 26,880 | | | California Resources Corp. | | | 62,630 | |
| | 7,400 | | | Cheniere Energy, Inc.* | | | 275,650 | |
| | 164,700 | | | Chevron Corp.(b) | | | 14,816,412 | |
| | 19,800 | | | Concho Resources, Inc.* | | | 1,838,628 | |
| | 123,800 | | | ConocoPhillips | | | 5,780,222 | |
| | 5,658 | | | Continental Resources, Inc.* | | | 130,021 | |
| | 600 | | | Core Laboratories NV | | | 65,244 | |
| | 22,500 | | | CVR Energy, Inc. | | | 885,375 | |
| | 20,300 | | | Diamondback Energy, Inc. | | | 1,358,070 | |
| | 2,100 | | | Dril-Quip, Inc.* | | | 124,383 | |
| | 1,300 | | | Energen Corp. | | | 53,287 | |
| | 73,400 | | | EOG Resources, Inc. | | | 5,195,986 | |
| | 344,500 | | | Exxon Mobil Corp. | | | 26,853,775 | |
| | 8,900 | | | Golar LNG Ltd. | | | 140,531 | |
| | 52,800 | | | Gulfport Energy Corp.* | | | 1,297,296 | |
| | 113,700 | | | Halliburton Co. | | | 3,870,348 | |
| | 17,900 | | | HollyFrontier Corp. | | | 714,031 | |
| | 176,500 | | | Kinder Morgan, Inc. | | | 2,633,380 | |
| | 24,700 | | | Kosmos Energy Ltd.* | | | 128,440 | |
| | 21,700 | | | Memorial Resource Development Corp.* | | | 350,455 | |
| | 69,300 | | | Occidental Petroleum Corp. | | | 4,685,373 | |
| | 5,600 | | | Oceaneering International, Inc. | | | 210,112 | |
| | 3,700 | | | Patterson-UTI Energy, Inc. | | | 55,796 | |
| | 12,700 | | | PBF Energy, Inc. Class A | | | 467,487 | |
| | 55,002 | | | Phillips 66 | | | 4,499,164 | |
| | 42,700 | | | Rice Energy, Inc.* | | | 465,430 | |
| | 16,200 | | | Rowan Companies PLC Class A | | | 274,590 | |
| | |
| | |
| 34 | | The accompanying notes are an integral part of these financial statements. |
GOLDMAN SACHS U.S. EQUITY DIVIDEND AND PREMIUM FUND
| | | | | | | | |
| Shares | | | Description | | Value | |
| | Common Stocks – (continued) | |
| | Energy – (continued) | |
| | 145,400 | | | Schlumberger Ltd. | | $ | 10,141,650 | |
| | 8,648 | | | SM Energy Co. | | | 170,020 | |
| | 3,800 | | | Targa Resources Corp. | | | 102,828 | |
| | 100 | | | Teekay Corp. | | | 987 | |
| | 99,900 | | | The Williams Companies, Inc. | | | 2,567,430 | |
| | 37,600 | | | Weatherford International PLC* | | | 315,464 | |
| | 36,435 | | | Whiting Petroleum Corp.* | | | 343,946 | |
| | 30,400 | | | World Fuel Services Corp. | | | 1,169,184 | |
| | 22,800 | | | WPX Energy, Inc.* | | | 130,872 | |
| | | | | | | | |
| | | | | | | 95,412,379 | |
| | |
| | Food & Staples Retailing – 1.9% | |
| | 73,478 | | | CVS Health Corp. | | | 7,183,944 | |
| | 111,100 | | | Walgreens Boots Alliance, Inc. | | | 9,460,721 | |
| | 215,000 | | | Wal-Mart Stores, Inc. | | | 13,179,500 | |
| | | | | | | | |
| | | | | | | 29,824,165 | |
| | |
| | Food, Beverage & Tobacco – 4.9% | |
| | 195,100 | | | Altria Group, Inc. | | | 11,356,771 | |
| | 25,800 | | | Flowers Foods, Inc. | | | 554,442 | |
| | 49,300 | | | General Mills, Inc. | | | 2,842,638 | |
| | 93,600 | | | Kellogg Co. | | | 6,764,472 | |
| | 163,000 | | | PepsiCo, Inc. | | | 16,286,960 | |
| | 165,300 | | | Philip Morris International, Inc. | | | 14,531,523 | |
| | 27,600 | | | Pinnacle Foods, Inc. | | | 1,171,896 | |
| | 395,400 | | | The Coca-Cola Co. | | | 16,986,384 | |
| | 105,900 | | | The Kraft Heinz Co. | | | 7,705,284 | |
| | | | | | | | |
| | | | | | | 78,200,370 | |
| | |
| | Health Care Equipment & Services – 3.8% | |
| | 171,941 | | | Abbott Laboratories(a)(b) | | | 7,721,870 | |
| | 12,800 | | | Acadia Healthcare Co., Inc.* | | | 799,488 | |
| | 41,200 | | | Anthem, Inc. | | | 5,744,928 | |
| | 82,700 | | | Cardinal Health, Inc. | | | 7,382,629 | |
| | 1,591 | | | Centene Corp.* | | | 104,704 | |
| | 7,223 | | | DexCom, Inc.* | | | 591,564 | |
| | 2,300 | | | Envision Healthcare Holdings, Inc.* | | | 59,731 | |
| | 244,554 | | | Medtronic PLC | | | 18,811,093 | |
| | 173,500 | | | UnitedHealth Group, Inc. | | | 20,410,540 | |
| | | | | | | | |
| | | | | | | 61,626,547 | |
| | |
| | Household & Personal Products – 1.8% | |
| | 27,300 | | | Avon Products, Inc. | | | 110,565 | |
| | 86,100 | | | Kimberly-Clark Corp. | | | 10,960,530 | |
| | 10,400 | | | Nu Skin Enterprises, Inc. Class A | | | 394,056 | |
| | 217,899 | | | The Procter & Gamble Co. | | | 17,303,360 | |
| | | | | | | | |
| | | | | | | 28,768,511 | |
| | |
| | Insurance – 3.1% | |
| | 25,569 | | | American Financial Group, Inc. | | | 1,843,013 | |
| | 96,600 | | | American International Group, Inc. | | | 5,986,302 | |
| | 5,700 | | | American National Insurance Co. | | | 582,939 | |
| | 175,400 | | | Arthur J. Gallagher & Co. | | | 7,180,876 | |
| | 191,500 | | | Mercury General Corp. | | | 8,918,155 | |
| | 186,900 | | | MetLife, Inc. | | | 9,010,449 | |
| | 371,501 | | | Old Republic International Corp. | | | 6,921,064 | |
| | 14,043 | | | ProAssurance Corp. | | | 681,507 | |
| | |
| | Common Stocks – (continued) | |
| | Insurance – (continued) | |
| | 93,800 | | | Prudential Financial, Inc. | | $ | 7,636,258 | |
| | 1,000 | | | StanCorp Financial Group, Inc. | | | 113,880 | |
| | | | | | | | |
| | | | | | | 48,874,443 | |
| | |
| | Materials – 2.5% | |
| | 5,619 | | | Albemarle Corp. | | | 314,720 | |
| | 38,400 | | | Allegheny Technologies, Inc. | | | 432,000 | |
| | 8,200 | | | Compass Minerals International, Inc. | | | 617,214 | |
| | 14,600 | | | Domtar Corp. | | | 539,470 | |
| | 73,500 | | | E.I. du Pont de Nemours & Co. | | | 4,895,100 | |
| | 35,300 | | | Huntsman Corp. | | | 401,361 | |
| | 192,900 | | | International Paper Co. | | | 7,272,330 | |
| | 70,701 | | | LyondellBasell Industries NV Class A | | | 6,143,848 | |
| | 31,400 | | | Packaging Corp. of America | | | 1,979,770 | |
| | 16,900 | | | Royal Gold, Inc. | | | 616,343 | |
| | 13,701 | | | Sonoco Products Co. | | | 559,945 | |
| | 13,100 | | | Steel Dynamics, Inc. | | | 234,097 | |
| | 319,002 | | | The Dow Chemical Co. | | | 16,422,223 | |
| | | | | | | | |
| | | | | | | 40,428,421 | |
| | |
| | Media – 2.9% | |
| | 43,200 | | | Cinemark Holdings, Inc. | | | 1,444,176 | |
| | 163,858 | | | Comcast Corp. Class A | | | 9,246,507 | |
| | 58,100 | | | Gannett Co., Inc. | | | 946,449 | |
| | 223,100 | | | Regal Entertainment Group Class A | | | 4,209,897 | |
| | 91,400 | | | The Walt Disney Co. | | | 9,604,312 | |
| | 159,500 | | | Thomson Reuters Corp. | | | 6,037,075 | |
| | 27,833 | | | Time Warner Cable, Inc. | | | 5,165,526 | |
| | 87,000 | | | Time Warner, Inc. | | | 5,626,290 | |
| | 1,900 | | | Viacom, Inc. Class A | | | 83,581 | |
| | 85,900 | | | Viacom, Inc. Class B | | | 3,535,644 | |
| | | | | | | | |
| | | | | | | 45,899,457 | |
| | |
| | Pharmaceuticals, Biotechnology & Life Sciences – 10.4% | |
| | 180,485 | | | AbbVie, Inc.(a) | | | 10,691,932 | |
| | 200 | | | Alkermes PLC* | | | 15,876 | |
| | 32,739 | | | Allergan PLC* | | | 10,230,938 | |
| | 9,600 | | | Alnylam Pharmaceuticals, Inc.* | | | 903,744 | |
| | 86,600 | | | Amgen, Inc. | | | 14,057,778 | |
| | 17,212 | | | Biogen, Inc.* | | | 5,272,896 | |
| | 4,982 | | | BioMarin Pharmaceutical, Inc.* | | | 521,914 | |
| | 5,400 | | | Bluebird Bio, Inc.* | | | 346,788 | |
| | 174,100 | | | Bristol-Myers Squibb Co. | | | 11,976,339 | |
| | 64,199 | | | Celgene Corp.* | | | 7,688,472 | |
| | 144,300 | | | Eli Lilly & Co. | | | 12,158,718 | |
| | 162,000 | | | Gilead Sciences, Inc. | | | 16,392,780 | |
| | 15,805 | | | Illumina, Inc.* | | | 3,033,691 | |
| | 10,800 | | | Incyte Corp.* | | | 1,171,260 | |
| | 226 | | | Intercept Pharmaceuticals, Inc.* | | | 33,753 | |
| | 8,500 | | | Intrexon Corp.* | | | 256,275 | |
| | 16,200 | | | Ionis Pharmaceuticals, Inc.* | | | 1,003,266 | |
| | 241,200 | | | Johnson & Johnson | | | 24,776,064 | |
| | 100 | | | Juno Therapeutics, Inc.* | | | 4,397 | |
| | 1,200 | | | Medivation, Inc.* | | | 58,008 | |
| | 333,350 | | | Merck & Co., Inc. | | | 17,607,547 | |
| | 896,000 | | | Pfizer, Inc.(a) | | | 28,922,880 | |
| | | | | | | | |
| | | | | | | 167,125,316 | |
| | |
| | |
| The accompanying notes are an integral part of these financial statements. | | 35 |
GOLDMAN SACHS U.S. EQUITY DIVIDEND AND PREMIUM FUND
Schedule of Investments (continued)
December 31, 2015
| | | | | | | | |
| Shares | | | Description | | Value | |
| | Common Stocks – (continued) | |
| | Real Estate Investment Trust – 2.4% | |
| | 23,900 | | | American Campus Communities, Inc. | | $ | 988,026 | |
| | 30,500 | | | American Homes 4 Rent | | | 508,130 | |
| | 62,301 | | | American Tower Corp. | | | 6,039,997 | |
| | 3,800 | | | Communications Sales & Leasing, Inc. | | | 71,022 | |
| | 52,300 | | | Crown Castle International Corp. | | | 4,521,335 | |
| | 33,900 | | | Duke Realty Corp. | | | 712,578 | |
| | 55,800 | | | Equity Residential | | | 4,552,722 | |
| | 24,800 | | | Extra Space Storage, Inc. | | | 2,187,608 | |
| | 187,200 | | | General Growth Properties, Inc. | | | 5,093,712 | |
| | 31,101 | | | Healthcare Trust of America, Inc. | | | 838,782 | |
| | 18,800 | | | Kilroy Realty Corp. | | | 1,189,664 | |
| | 1,300 | | | Lamar Advertising Co. | | | 77,974 | |
| | 2,000 | | | Mid-America Apartment Communities, Inc. | | | 181,620 | |
| | 41,200 | | | Omega Healthcare Investors, Inc. | | | 1,441,176 | |
| | 10,200 | | | Paramount Group, Inc. | | | 184,620 | |
| | 5,500 | | | Post Properties, Inc. | | | 325,380 | |
| | 48,401 | | | Simon Property Group, Inc. | | | 9,410,977 | |
| | 28,300 | | | VEREIT, Inc. | | | 224,136 | |
| | | | | | | | |
| | | | | | | 38,549,459 | |
| | |
| | Retailing – 5.1% | |
| | 35,200 | | | Amazon.com, Inc.* | | | 23,791,328 | |
| | 64,900 | | | DSW, Inc. Class A | | | 1,548,514 | |
| | 1,300 | | | Foot Locker, Inc. | | | 84,617 | |
| | 7,200 | | | GNC Holdings, Inc. Class A | | | 223,344 | |
| | 102,000 | | | Kohl’s Corp. | | | 4,858,260 | |
| | 56,200 | | | L Brands, Inc. | | | 5,385,084 | |
| | 115,300 | | | Macy’s, Inc. | | | 4,033,194 | |
| | 43,886 | | | Netflix, Inc.* | | | 5,019,680 | |
| | 11,000 | | | Penske Automotive Group, Inc. | | | 465,740 | |
| | 137,000 | | | Target Corp. | | | 9,947,570 | |
| | 146,500 | | | The Home Depot, Inc. | | | 19,374,625 | |
| | 4,965 | | | The Priceline Group, Inc.* | | | 6,330,127 | |
| | 13,100 | | | Williams-Sonoma, Inc. | | | 765,171 | |
| | | | | | | | |
| | | | | | | 81,827,254 | |
| | |
| | Semiconductors & Semiconductor Equipment – 2.3% | |
| | 67,900 | | | Analog Devices, Inc. | | | 3,756,228 | |
| | 56,300 | | | Atmel Corp. | | | 484,743 | |
| | 295,700 | | | Cypress Semiconductor Corp.* | | | 2,900,817 | |
| | 460,600 | | | Intel Corp. | | | 15,867,670 | |
| | 102,400 | | | Maxim Integrated Products, Inc. | | | 3,891,200 | |
| | 914 | | | NXP Semiconductors NV* | | | 77,004 | |
| | 681 | | | SunPower Corp.* | | | 20,437 | |
| | 164,849 | | | Texas Instruments, Inc. | | | 9,035,374 | |
| | | | | | | | |
| | | | | | | 36,033,473 | |
| | |
| | Software & Services – 11.8% | |
| | 55,200 | | | Accenture PLC Class A | | | 5,768,400 | |
| | 27,890 | | | Alphabet, Inc. Class A* | | | 21,698,699 | |
| | 28,259 | | | Alphabet, Inc. Class C* | | | 21,445,190 | |
| | 126,600 | | | Automatic Data Processing, Inc.(a)(b) | | | 10,725,552 | |
| | 7,100 | | | Broadridge Financial Solutions, Inc. | | | 381,483 | |
| | 321,100 | | | CA, Inc. | | | 9,170,616 | |
| | 1,701 | | | CDK Global, Inc. | | | 80,746 | |
| | 208,600 | | | Facebook, Inc. Class A* | | | 21,832,076 | |
| | 4,200 | | | FireEye, Inc.* | | | 87,108 | |
| | |
| | Common Stocks – (continued) | |
| | Software & Services – (continued) | |
| | 53,100 | | | IAC/InterActiveCorp | | $ | 3,188,655 | |
| | 104,500 | | | International Business Machines Corp. | | | 14,381,290 | |
| | 3,900 | | | LinkedIn Corp. Class A* | | | 877,812 | |
| | 719,351 | | | Microsoft Corp.(a)(b) | | | 39,909,594 | |
| | 219,079 | | | Oracle Corp. | | | 8,002,956 | |
| | 4,000 | | | Pandora Media, Inc.* | | | 53,640 | |
| | 324,600 | | | Paychex, Inc. | | | 17,168,094 | |
| | 10,760 | | | ServiceNow, Inc.* | | | 931,386 | |
| | 8,400 | | | Solera Holdings, Inc. | | | 460,572 | |
| | 14,952 | | | Splunk, Inc.* | | | 879,327 | |
| | 1,400 | | | Tableau Software, Inc. Class A* | | | 131,908 | |
| | 836 | | | The Ultimate Software Group, Inc.* | | | 163,446 | |
| | 3,400 | | | Twitter, Inc.* | | | 78,676 | |
| | 142,189 | | | Visa, Inc. Class A | | | 11,026,757 | |
| | 130 | | | Workday, Inc. Class A* | | | 10,358 | |
| | 8,500 | | | Yelp, Inc.* | | | 244,800 | |
| | 9,200 | | | Zillow Group, Inc. Class C* | | | 216,016 | |
| | | | | | | | |
| | | | | | | 188,915,157 | |
| | |
| | Technology Hardware & Equipment – 5.6% | |
| | 514,400 | | | Apple, Inc.(a)(b) | | | 54,145,744 | |
| | 447,348 | | | Cisco Systems, Inc. | | | 12,147,735 | |
| | 141,800 | | | Hewlett Packard Enterprise Co. | | | 2,155,360 | |
| | 141,800 | | | HP, Inc. | | | 1,678,912 | |
| | 40,500 | | | Lexmark International, Inc. Class A | | | 1,314,225 | |
| | 74,100 | | | National Instruments Corp. | | | 2,125,929 | |
| | 229,400 | | | QUALCOMM, Inc. | | | 11,466,559 | |
| | 118,300 | | | Seagate Technology PLC | | | 4,336,878 | |
| | | | | | | | |
| | | | | | | 89,371,342 | |
| | |
| | Telecommunication Services – 3.2% | |
| | 763,128 | | | AT&T, Inc.(a)(b) | | | 26,259,235 | |
| | 423,700 | | | CenturyLink, Inc. | | | 10,660,292 | |
| | 306,000 | | | Verizon Communications, Inc. | | | 14,143,320 | |
| | | | | | | | |
| | | | | | | 51,062,847 | |
| | |
| | Transportation – 2.1% | |
| | 800 | | | Alaska Air Group, Inc. | | | 64,408 | |
| | 24,700 | | | Copa Holdings SA Class A | | | 1,192,022 | |
| | 7,659 | | | JetBlue Airways Corp.* | | | 173,476 | |
| | 112,500 | | | Macquarie Infrastructure Corp. | | | 8,167,500 | |
| | 125,600 | | | Union Pacific Corp. | | | 9,821,920 | |
| | 153,300 | | | United Parcel Service, Inc. Class B | | | 14,752,059 | |
| | | | | | | | |
| | | | | | | 34,171,385 | |
| | |
| | Utilities – 3.8% | |
| | 188,800 | | | CenterPoint Energy, Inc. | | | 3,466,368 | |
| | 228,000 | | | Duke Energy Corp. | | | 16,276,920 | |
| | 277,102 | | | PPL Corp. | | | 9,457,435 | |
| | 452,400 | | | TECO Energy, Inc. | | | 12,056,460 | |
| | 12,100 | | | TerraForm Power, Inc.* | | | 152,218 | |
| | 412,900 | | | The Southern Co. | | | 19,319,591 | |
| | | | | | | | |
| | | | | | | 60,728,992 | |
| | |
| | TOTAL COMMON STOCKS | | | | |
| | (Cost $1,376,957,898) | | $ | 1,540,041,952 | |
| | |
| | |
| 36 | | The accompanying notes are an integral part of these financial statements. |
GOLDMAN SACHS U.S. EQUITY DIVIDEND AND PREMIUM FUND
| | | | | | | | |
| Shares | | | Rate | | Value | |
| | Investment Company(c)(d) – 4.7% | |
| Goldman Sachs Financial Square Government Fund – FST Shares | |
| | 76,057,604 | | | 0.185% | | $ | 76,057,604 | |
| | (Cost $76,057,604) | | | | |
| | |
| | TOTAL INVESTMENTS – 100.9% | |
| | (Cost $1,453,015,502) | | $ | 1,616,099,556 | |
| | |
| LIABILITIES IN EXCESS OF
OTHER ASSETS – (0.9)% | | | (14,689,402 | ) |
| | |
| | NET ASSETS – 100.0% | | $ | 1,601,410,154 | |
| | |
| | |
| The percentage shown for each investment category reflects the value of investments in that category as a percentage of net assets. |
* | | Non-income producing security. |
(a) | | All or a portion of this security is held as collateral for call options written. |
(b) | | All or a portion of security is segregated as collateral for initial margin requirements on futures transactions. |
(c) | | Represents an affiliated issuer. |
(d) | | Variable rate security. Interest rate or distribution rate disclosed is that which is in effect on December 31, 2015. |
| | |
|
Investment Abbreviation: |
REIT | | —Real Estate Investment Trust |
|
| | |
| The accompanying notes are an integral part of these financial statements. | | 37 |
GOLDMAN SACHS U.S. EQUITY DIVIDEND AND PREMIUM FUND
Schedule of Investments (continued)
December 31, 2015
|
| ADDITIONAL INVESTMENT INFORMATION |
FUTURES CONTRACTS — At December 31, 2015, the Fund had the following futures contracts:
| | | | | | | | | | | | |
| Type | | Number of
Contracts
Long (Short) | | Expiration
Date | | Current
Value | | | Unrealized
Gain (Loss) | |
S&P 500 E-Mini Index | | 423 | | March 2016 | | $ | 43,048,710 | | | $ | (34,713 | ) |
WRITTEN OPTIONS CONTRACTS — At December 31, 2015, the Fund had the following written options:
| | | | | | | | | | | | |
| Call Options | | Number of
Contracts | | | Exercise
Price | | Expiration
Month | | Value | |
S&P 500 Index | | | 3,071 | | | 2,090 | | March 2016 | | $ | (10,809,920 | ) |
(Premiums Received $10,810,872) | | | | | | | | | | | | |
For the year ended December 31, 2015, the Fund had the following written options activity:
| | | | | | | | |
| | | Number of
Contracts | | | Premiums
Received | |
Contracts Outstanding December 31, 2014 | | | 2,718 | | | $ | 10,676,304 | |
Contracts written | | | 11,179 | | | | 46,834,592 | |
Contracts expired | | | (5,500 | ) | | | (25,779,496 | ) |
Contracts bought to close | | | (5,326 | ) | | | (20,920,528 | ) |
Contracts Outstanding December 31, 2015 | | | 3,071 | | | $ | 10,810,872 | |
| | |
| 38 | | The accompanying notes are an integral part of these financial statements. |
GOLDMAN SACHS INTERNATIONAL EQUITY DIVIDEND AND PREMIUM FUND
Schedule of Investments
December 31, 2015
| | | | | | | | |
| Shares | | | Description | | Value | |
| | Common Stocks – 99.5% | |
| | Australia – 6.8% | |
| | 411,768 | | | ALS Ltd. (Commercial & Professional Services) | | $ | 1,120,620 | |
| | 101,952 | | | Australia & New Zealand Banking Group Ltd. (Banks) | | | 2,057,370 | |
| | 77,048 | | | BHP Billiton Ltd. (Materials) | | | 991,574 | |
| | 50,669 | | | BHP Billiton PLC (Materials) | | | 565,052 | |
| | 146,068 | | | Coca-Cola Amatil Ltd. (Food, Beverage & Tobacco) | | | 984,929 | |
| | 12,140 | | | Commonwealth Bank of Australia (Banks) | | | 750,549 | |
| | 767,403 | | | Insurance Australia Group Ltd. (Insurance) | | | 3,081,900 | |
| | 30,002 | | | LendLease Group (Real Estate) | | | 309,547 | |
| | 5,282 | | | Macquarie Group Ltd. (Diversified Financials) | | | 315,985 | |
| | 1,033,948 | | | Metcash Ltd. (Food & Staples Retailing)* | | | 1,207,192 | |
| | 30,544 | | | Orica Ltd. (Materials) | | | 342,206 | |
| | 19,903 | | | Platinum Asset Management Ltd. (Diversified Financials) | | | 116,301 | |
| | 443,339 | | | Scentre Group (REIT) | | | 1,344,712 | |
| | 399,407 | | | Suncorp Group Ltd. (Insurance) | | | 3,506,794 | |
| | 545,544 | | | Telstra Corp. Ltd. (Telecommunication Services) | | | 2,216,926 | |
| | 59,168 | | | Woodside Petroleum Ltd. (Energy) | | | 1,232,704 | |
| | | | | | | | |
| | | | | | | 20,144,361 | |
| | |
| | Austria – 0.1% | |
| | 12,942 | | | Raiffeisen Bank International AG (Banks)* | | | 189,668 | |
| | 2,728 | | | Voestalpine AG (Materials) | | | 83,445 | |
| | | | | | | | |
| | | | | | | 273,113 | |
| | |
| | Belgium – 2.1% | |
| | 36,348 | | | Anheuser-Busch InBev NV (Food, Beverage & Tobacco)(a) | | | 4,523,409 | |
| | 15,815 | | | KBC Groep NV (Banks) | | | 988,851 | |
| | 22,333 | | | Proximus (Telecommunication Services) | | | 726,737 | |
| | | | | | | | |
| | | | | | | 6,238,997 | |
| | |
| | Bermuda – 0.1% | |
| | 58,117 | | | Seadrill Ltd. (Energy)* | | | 200,702 | |
| | |
| | Denmark – 1.2% | |
| | 5,109 | | | Chr. Hansen Holding A/S (Materials) | | | 319,570 | |
| | 11,533 | | | Coloplast A/S Class B (Health Care Equipment & Services) | | | 931,142 | |
| | 34,828 | | | Novo Nordisk A/S Class B (Pharmaceuticals, Biotechnology & Life Sciences) | | | 2,016,479 | |
| | 908 | | | Pandora A/S (Consumer Durables & Apparel) | | | 114,484 | |
| | | | | | | | |
| | | | | | | 3,381,675 | |
| | |
| | Finland – 1.9% | |
| | 23,393 | | | Kone OYJ Class B (Capital Goods) | | | 990,485 | |
| | 10,415 | | | Metso OYJ (Capital Goods) | | | 233,298 | |
| | |
| | Common Stocks – (continued) | |
| | Finland – (continued) | |
| | 18,062 | | | Neste OYJ (Energy) | | $ | 539,077 | |
| | 58,816 | | | Nokia OYJ (Technology Hardware & Equipment) | | | 416,095 | |
| | 17,071 | | | Nokian Renkaat OYJ (Automobiles & Components) | | | 609,456 | |
| | 21,497 | | | Orion OYJ Class B (Pharmaceuticals, Biotechnology & Life Sciences) | | | 743,759 | |
| | 14,927 | | | Sampo OYJ Class A (Insurance) | | | 758,027 | |
| | 74,290 | | | Stora Enso OYJ Class R (Materials) | | | 671,741 | |
| | 34,012 | | | UPM-Kymmene OYJ (Materials) | | | 631,443 | |
| | | | | | | | |
| | | | | | | 5,593,381 | |
| | |
| | France – 8.1% | |
| | 17,656 | | | Accor SA (Consumer Services) | | | 764,681 | |
| | 11,970 | | | Airbus Group SE (Capital Goods) | | | 806,627 | |
| | 4,846 | | | AXA SA (Insurance) | | | 132,410 | |
| | 24,706 | | | BNP Paribas SA (Banks) | | | 1,397,799 | |
| | 17,413 | | | Bouygues SA (Capital Goods) | | | 690,437 | |
| | 14,125 | | | Cap Gemini SA (Software & Services) | | | 1,310,597 | |
| | 26,476 | | | Casino Guichard Perrachon SA (Food & Staples Retailing)(b) | | | 1,216,325 | |
| | 10,779 | | | Danone SA (Food, Beverage & Tobacco) | | | 728,375 | |
| | 36,643 | | | Electricite de France SA (Utilities) | | | 539,659 | |
| | 237,980 | | | Engie (Utilities)(a) | | | 4,215,392 | |
| | 2,079 | | | Kering (Consumer Durables & Apparel) | | | 355,457 | |
| | 2,358 | | | Klepierre (REIT) | | | 104,813 | |
| | 21,773 | | | Lagardere SCA (Media) | | | 649,738 | |
| | 746 | | | L’Oreal SA (Household & Personal Products) | | | 125,481 | |
| | 9,353 | | | LVMH Moet Hennessy Louis Vuitton SE (Consumer Durables & Apparel) | | | 1,469,078 | |
| | 25,799 | | | Orange SA (Telecommunication Services) | | | 431,507 | |
| | 162,701 | | | Rexel SA (Capital Goods) | | | 2,166,490 | |
| | 35,412 | | | Sanofi (Pharmaceuticals, Biotechnology & Life Sciences)(a) | | | 3,017,873 | |
| | 7,358 | | | Schneider Electric SE (Capital Goods) | | | 417,963 | |
| | 22,267 | | | Societe Generale SA (Banks) | | | 1,026,111 | |
| | 2,283 | | | Technip SA (Energy) | | | 113,534 | |
| | 32,658 | | | Total SA (Energy)(a) | | | 1,464,104 | |
| | 2,919 | | | Unibail-Rodamco SE (REIT) | | | 740,993 | |
| | | | | | | | |
| | | | | | | 23,885,444 | |
| | |
| | Germany – 7.5% | |
| | 9,286 | | | Allianz SE (Registered) (Insurance) | | | 1,636,918 | |
| | 12,698 | | | Axel Springer SE (Media) | | | 706,142 | |
| | 14,288 | | | BASF SE (Materials) | | | 1,088,432 | |
| | 20,057 | | | Bayer AG (Registered) (Pharmaceuticals, Biotechnology & Life Sciences) | | | 2,504,927 | |
| | 16,533 | | | Celesio AG (Health Care Equipment & Services) | | | 449,426 | |
| | 59,981 | | | Daimler AG (Registered) (Automobiles & Components) | | | 5,011,653 | |
| | 10,926 | | | Deutsche Boerse AG (Diversified Financials) | | | 960,408 | |
| | |
| | |
| The accompanying notes are an integral part of these financial statements. | | 39 |
GOLDMAN SACHS INTERNATIONAL EQUITY DIVIDEND AND PREMIUM FUND
Schedule of Investments (continued)
December 31, 2015
| | | | | | | | |
| Shares | | | Description | | Value | |
| | Common Stocks – (continued) | |
| | Germany – (continued) | |
| | 39,106 | | | Deutsche Post AG (Registered) (Transportation) | | $ | 1,093,318 | |
| | 40,069 | | | E.ON SE (Utilities) | | | 384,743 | |
| | 11,945 | | | Fresenius SE & Co. KGaA (Health Care Equipment & Services) | | | 850,869 | |
| | 7,947 | | | Hugo Boss AG (Consumer Durables & Apparel) | | | 655,700 | |
| | 18,783 | | | K+S AG (Registered) (Materials) | | | 478,800 | |
| | 5,575 | | | MAN SE (Capital Goods) | | | 560,007 | |
| | 6,232 | | | ProSiebenSat.1 Media SE (Registered) (Media) | | | 314,413 | |
| | 13,120 | | | SAP SE (Software & Services) | | | 1,041,114 | |
| | 18,669 | | | Siemens AG (Registered) (Capital Goods) | | | 1,806,149 | |
| | 4,311 | | | Symrise AG (Materials) | | | 285,381 | |
| | 130,261 | | | Telefonica Deutschland Holding AG (Telecommunication Services) | | | 687,086 | |
| | 13,045 | | | United Internet AG (Registered) (Software & Services) | | | 717,203 | |
| | 1,907 | | | Volkswagen AG (Automobiles & Components) | | | 293,042 | |
| | 21,374 | | | Vonovia SE (Real Estate) | | | 660,309 | |
| | | | | | | | |
| | | | | | | 22,186,040 | |
| | |
| | Hong Kong – 3.0% | |
| | 137,000 | | | AIA Group Ltd. (Insurance) | | | 818,586 | |
| | 88,500 | | | BOC Hong Kong Holdings Ltd. (Banks) | | | 269,307 | |
| | 56,000 | | | Cheung Kong Infrastructure Holdings Ltd. (Utilities) | | | 517,377 | |
| | 49,408 | | | Cheung Kong Property Holdings Ltd. (Real Estate) | | | 319,620 | |
| | 53,408 | | | CK Hutchison Holdings Ltd. (Capital Goods) | | | 717,907 | |
| | 59,000 | | | Galaxy Entertainment Group Ltd. (Consumer Services) | | | 184,866 | |
| | 111,000 | | | Hang Lung Properties Ltd. (Real Estate) | | | 251,510 | |
| | 34,900 | | | Hang Seng Bank Ltd. (Banks) | | | 661,472 | |
| | 780,701 | | | Hong Kong & China Gas Co. Ltd. (Utilities) | | | 1,527,864 | |
| | 15,700 | | | Hong Kong Exchanges and Clearing Ltd. (Diversified Financials) | | | 399,954 | |
| | 27,000 | | | Hysan Development Co. Ltd. (Real Estate) | | | 110,313 | |
| | 214,000 | | | Li & Fung Ltd. (Consumer Durables & Apparel) | | | 144,725 | |
| | 88,000 | | | MGM China Holdings Ltd. (Consumer Services) | | | 109,373 | |
| | 36,000 | | | MTR Corp. Ltd. (Transportation) | | | 177,761 | |
| | 137,189 | | | New World Development Co. Ltd. (Real Estate) | | | 134,711 | |
| | 56,000 | | | Power Assets Holdings Ltd. (Utilities) | | | 513,383 | |
| | 155,600 | | | Sands China Ltd. (Consumer Services) | | | 527,514 | |
| | 135,261 | | | Sino Land Co. Ltd. (Real Estate) | | | 197,042 | |
| | 29,000 | | | Sun Hung Kai Properties Ltd. (Real Estate) | | | 348,568 | |
| | 58,200 | | | Swire Properties Ltd. (Real Estate) | | | 167,345 | |
| | |
| | Common Stocks – (continued) | |
| | Hong Kong – (continued) | |
| | 24,000 | | | Techtronic Industries Co. Ltd. (Consumer Durables & Apparel) | | $ | 97,158 | |
| | 112,000 | | | Wharf Holdings Ltd. (Real Estate) | | | 617,510 | |
| | 141,200 | | | Wynn Macau Ltd. (Consumer Services) | | | 164,045 | |
| | | | | | | | |
| | | | | | | 8,977,911 | |
| | |
| | Ireland – 0.2% | |
| | 24,569 | | | CRH PLC (Materials) | | | 708,544 | |
| | |
| | Israel – 0.9% | |
| | 308,233 | | | Bezeq The Israeli Telecommunication Corp. Ltd. (Telecommunication Services) | | | 678,532 | |
| | 28,963 | | | Teva Pharmaceutical Industries Ltd. ADR (Pharmaceuticals, Biotechnology & Life Sciences) | | | 1,901,131 | |
| | | | | | | | |
| | | | | | | 2,579,663 | |
| | |
| | Italy – 1.5% | |
| | 54,886 | | | Atlantia SpA (Transportation) | | | 1,452,197 | |
| | 133,984 | | | Eni SpA (Energy) | | | 1,990,761 | |
| | 143,801 | | | Intesa Sanpaolo SpA RNC (Banks) | | | 439,274 | |
| | 172,049 | | | Intesa Sanpaolo SpA (Banks) | | | 571,375 | |
| | 9,575 | | | Saipem SpA (Energy)* | | | 77,393 | |
| | | | | | | | |
| | | | | | | 4,531,000 | |
| | |
| | Japan – 23.2% | |
| | 2,400 | | | ABC-Mart, Inc. (Retailing) | | | 131,372 | |
| | 7,000 | | | Ajinomoto Co., Inc. (Food, Beverage & Tobacco) | | | 165,730 | |
| | 29,300 | | | Alfresa Holdings Corp. (Health Care Equipment & Services) | | | 578,684 | |
| | 109,000 | | | All Nippon Airways Co. Ltd. (Transportation) | | | 314,477 | |
| | 3,500 | | | Alps Electric Co. Ltd. (Technology Hardware & Equipment) | | | 94,913 | |
| | 148,000 | | | Asahi Glass Co. Ltd. (Capital Goods) | | | 847,870 | |
| | 41,000 | | | Asahi Kasei Corp. (Materials) | | | 277,246 | |
| | 66,700 | | | Astellas Pharma, Inc. (Pharmaceuticals, Biotechnology & Life Sciences) | | | 949,526 | |
| | 64,000 | | | Bridgestone Corp. (Automobiles & Components) | | | 2,195,291 | |
| | 89,400 | | | Canon, Inc. (Technology Hardware & Equipment) | | | 2,704,353 | |
| | 18,200 | | | Casio Computer Co. Ltd. (Consumer Durables & Apparel) | | | 425,457 | |
| | 12,100 | | | Chugai Pharmaceutical Co. Ltd. (Pharmaceuticals, Biotechnology & Life Sciences) | | | 421,765 | |
| | 39,200 | | | Daicel Corp. (Materials) | | | 583,371 | |
| | 37,000 | | | Daihatsu Motor Co. Ltd. (Automobiles & Components) | | | 499,131 | |
| | 3,100 | | | Daikin Industries Ltd. (Capital Goods) | | | 225,747 | |
| | 6,600 | | | Daito Trust Construction Co. Ltd. (Real Estate) | | | 762,369 | |
| | 15,800 | | | Daiwa House Industry Co. Ltd. (Real Estate) | | | 454,192 | |
| | |
| | |
| 40 | | The accompanying notes are an integral part of these financial statements. |
GOLDMAN SACHS INTERNATIONAL EQUITY DIVIDEND AND PREMIUM FUND
| | | | | | | | |
| Shares | | | Description | | Value | |
| | Common Stocks – (continued) | |
| | Japan – (continued) | |
| | 6,300 | | | Dentsu, Inc. (Media) | | $ | 344,687 | |
| | 14,700 | | | Eisai Co. Ltd. (Pharmaceuticals, Biotechnology & Life Sciences) | | | 972,417 | |
| | 7,300 | | | FANUC Corp. (Capital Goods) | | | 1,257,716 | |
| | 500 | | | Fast Retailing Co. Ltd. (Retailing) | | | 174,906 | |
| | 32,500 | | | Fuji Heavy Industries Ltd. (Automobiles & Components) | | | 1,338,879 | |
| | 5,200 | | | Hamamatsu Photonics K.K. (Technology Hardware & Equipment) | | | 142,559 | |
| | 48,300 | | | Hino Motors Ltd. (Capital Goods) | | | 558,225 | |
| | 1,825 | | | Hirose Electric Co. Ltd. (Technology Hardware & Equipment) | | | 220,957 | |
| | 10,000 | | | Hitachi Construction Machinery Co., Ltd. (Capital Goods) | | | 155,523 | |
| | 93,000 | | | Hitachi Ltd. (Technology Hardware & Equipment) | | | 526,973 | |
| | 58,600 | | | Honda Motor Co. Ltd. (Automobiles & Components) | | | 1,872,946 | |
| | 49,000 | | | IHI Corp. (Capital Goods) | | | 135,264 | |
| | 11,800 | | | Isuzu Motors Ltd. (Automobiles & Components) | | | 127,117 | |
| | 4,200 | | | ITOCHU Techno-Solutions Corp. (Software & Services) | | | 83,682 | |
| | 13,900 | | | Japan Airlines Co. Ltd. (Transportation) | | | 497,521 | |
| | 38,400 | | | Japan Exchange Group, Inc. (Diversified Financials) | | | 600,260 | |
| | 34,600 | | | Japan Tobacco, Inc. (Food, Beverage & Tobacco) | | | 1,270,297 | |
| | 11,800 | | | JFE Holdings, Inc. (Materials) | | | 185,288 | |
| | 50,000 | | | Kaneka Corp. (Materials) | | | 519,713 | |
| | 24,000 | | | Kao Corp. (Household & Personal Products) | | | 1,233,330 | |
| | 33,900 | | | KDDI Corp. (Telecommunication Services) | | | 880,390 | |
| | 8,000 | | | Kikkoman Corp. (Food, Beverage & Tobacco) | | | 277,180 | |
| | 80,000 | | | Kintetsu Group Holdings Co. Ltd. (Transportation) | | | 325,263 | |
| | 45,500 | | | Kirin Holdings Co. Ltd. (Food, Beverage & Tobacco) | | | 617,760 | |
| | 43,600 | | | Komatsu Ltd. (Capital Goods) | | | 713,403 | |
| | 6,000 | | | Kose Corp. (Household & Personal Products) | | | 554,766 | |
| | 8,000 | | | Kubota Corp. (Capital Goods) | | | 123,589 | |
| | 29,300 | | | Kyushu Electric Power Co., Inc. (Utilities)* | | | 319,344 | |
| | 16,500 | | | LIXIL Group Corp. (Capital Goods) | | | 366,460 | |
| | 3,900 | | | M3, Inc. (Health Care Equipment & Services) | | | 80,863 | |
| | 3,000 | | | Makita Corp. (Capital Goods) | | | 172,880 | |
| | 179,100 | | | Marubeni Corp. (Capital Goods) | | | 920,771 | |
| | 23,100 | | | Marui Group Co. Ltd. (Retailing) | | | 375,897 | |
| | 2,800 | | | MEIJI Holdings Co. Ltd. (Food, Beverage & Tobacco) | | | 231,279 | |
| | 36,000 | | | Mitsubishi Estate Co. Ltd. (Real Estate) | | | 748,560 | |
| | 243,200 | | | Mitsubishi UFJ Financial Group, Inc. (Banks) | | | 1,506,441 | |
| | |
| | Common Stocks – (continued) | |
| | Japan – (continued) | |
| | 123,900 | | | Mitsui & Co. Ltd. (Capital Goods) | | $ | 1,472,185 | |
| | 13,000 | | | Mitsui Fudosan Co. Ltd. (Real Estate) | | | 326,273 | |
| | 794,100 | | | Mizuho Financial Group, Inc. (Banks) | | | 1,588,200 | |
| | 9,000 | | | Murata Manufacturing Co. Ltd. (Technology Hardware & Equipment) | | | 1,294,932 | |
| | 39,000 | | | NEC Corp. (Technology Hardware & Equipment) | | | 123,572 | |
| | 10,200 | | | NGK Spark Plug Co. Ltd. (Automobiles & Components) | | | 268,550 | |
| | 2,800 | | | Nidec Corp. (Capital Goods) | | | 203,045 | |
| | 9,800 | | | Nikon Corp. (Consumer Durables & Apparel) | | | 131,256 | |
| | 83,001 | | | Nippon Express Co. Ltd. (Transportation) | | | 390,056 | |
| | 368,000 | | | Nippon Yusen Kabushiki Kaisha (Transportation) | | | 891,919 | |
| | 11,600 | | | Nisshin Seifun Group, Inc. (Food, Beverage & Tobacco) | | | 189,480 | |
| | 7,100 | | | Nitto Denko Corp. (Materials) | | | 518,340 | |
| | 88,900 | | | Nomura Holdings, Inc. (Diversified Financials) | | | 495,178 | |
| | 364 | | | Nomura Real Estate Master Fund, Inc. (REIT)* | | | 452,445 | |
| | 9,000 | | | Nomura Research Institute Ltd. (Software & Services) | | | 345,634 | |
| | 32,300 | | | NSK Ltd. (Capital Goods) | | | 350,970 | |
| | 62,300 | | | NTT DoCoMo, Inc. (Telecommunication Services) | | | 1,277,873 | |
| | 25,000 | | | NTT Urban Development Corp. (Real Estate) | | | 240,207 | |
| | 4,200 | | | Obic Co. Ltd. (Software & Services) | | | 222,326 | |
| | 67,000 | | | Odakyu Electric Railway Co. Ltd. (Transportation) | | | 721,376 | |
| | 2,800 | | | Oracle Corp. Japan (Software & Services) | | | 130,368 | |
| | 2,300 | | | Oriental Land Co. Ltd. (Consumer Services) | | | 139,142 | |
| | 2,700 | | | Otsuka Corp. (Software & Services) | | | 132,634 | |
| | 3,400 | | | Otsuka Holdings Co. Ltd. (Pharmaceuticals, Biotechnology & Life Sciences) | | | 120,798 | |
| | 55,400 | | | Panasonic Corp. (Consumer Durables & Apparel) | | | 561,618 | |
| | 12,900 | | | Rakuten, Inc. (Retailing) | | | 148,579 | |
| | 35,300 | | | Resona Holdings, Inc. (Banks) | | | 171,425 | |
| | 72,400 | | | Ricoh Co. Ltd. (Technology Hardware & Equipment) | | | 745,489 | |
| | 1,000 | | | Ryohin Keikaku Co. Ltd. (Retailing) | | | 202,511 | |
| | 39,300 | | | Sankyo Co. Ltd. (Consumer Durables & Apparel) | | | 1,466,982 | |
| | 12,700 | | | Sanrio Co. Ltd. (Retailing) | | | 298,366 | |
| | 14,600 | | | SBI Holdings, Inc. (Diversified Financials) | | | 157,547 | |
| | 13,200 | | | Sega Sammy Holdings, Inc. (Consumer Durables & Apparel) | | | 123,464 | |
| | 34,400 | | | Seiko Epson Corp. (Technology Hardware & Equipment) | | | 529,731 | |
| | |
| | |
| The accompanying notes are an integral part of these financial statements. | | 41 |
GOLDMAN SACHS INTERNATIONAL EQUITY DIVIDEND AND PREMIUM FUND
Schedule of Investments (continued)
December 31, 2015
| | | | | | | | |
| Shares | | | Description | | Value | |
| | Common Stocks – (continued) | |
| | Japan – (continued) | |
| | 75,400 | | | Sekisui House Ltd. (Consumer Durables & Apparel) | | $ | 1,267,757 | |
| | 136,800 | | | Seven Bank Ltd. (Banks) | | | 599,936 | |
| | 7,000 | | | Shimadzu Corp. (Technology Hardware & Equipment) | | | 117,179 | |
| | 9,400 | | | Shin-Etsu Chemical Co. Ltd. (Materials) | | | 511,039 | |
| | 8,400 | | | Shionogi & Co. Ltd. (Pharmaceuticals, Biotechnology & Life Sciences) | | | 379,934 | |
| | 10,000 | | | Showa Shell Sekiyu KK (Energy) | | | 81,602 | |
| | 8,600 | | | SoftBank Group Corp. (Telecommunication Services) | | | 434,046 | |
| | 3,800 | | | Sompo Japan Nipponkoa Holdings, Inc. (Insurance) | | | 124,772 | |
| | 22,400 | | | Sony Corp. (Consumer Durables & Apparel) | | | 550,520 | |
| | 35,000 | | | Sumitomo Chemical Co. Ltd. (Materials) | | | 201,008 | |
| | 129,600 | | | Sumitomo Corp. (Capital Goods) | | | 1,321,315 | |
| | 11,000 | | | Sumitomo Metal Mining Co. Ltd. (Materials) | | | 133,528 | |
| | 62,000 | | | Sumitomo Mitsui Financial Group, Inc. (Banks) | | | 2,339,945 | |
| | 281,000 | | | Sumitomo Mitsui Trust Holdings, Inc. (Banks) | | | 1,064,240 | |
| | 7,000 | | | Sumitomo Realty & Development Co. Ltd. (Real Estate) | | | 199,799 | |
| | 9,700 | | | Sysmex Corp. (Health Care Equipment & Services) | | | 622,203 | |
| | 50,800 | | | Takeda Pharmaceutical Co. Ltd. (Pharmaceuticals, Biotechnology & Life Sciences) | | | 2,532,861 | |
| | 13,700 | | | Terumo Corp. (Health Care Equipment & Services) | | | 424,610 | |
| | 5,900 | | | The Dai-ichi Life Insurance Co. Ltd. (Insurance) | | | 98,162 | |
| | 8,500 | | | The Kansai Electric Power Co., Inc. (Utilities)* | | | 101,913 | |
| | 55,300 | | | Tohoku Electric Power Co., Inc. (Utilities) | | | 691,323 | |
| | 9,700 | | | Tokyo Electron Ltd. (Semiconductors & Semiconductor Equipment) | | | 587,673 | |
| | 115,000 | | | Tokyo Gas Co. Ltd. (Utilities) | | | 540,361 | |
| | 77,200 | | | Tokyu Fudosan Holdings Corp. (Real Estate) | | | 483,879 | |
| | 4,600 | | | TOTO Ltd. (Capital Goods) | | | 161,607 | |
| | 3,800 | | | Toyoda Gosei Co. Ltd. (Automobiles & Components) | | | 86,324 | |
| | 28,900 | | | Toyota Motor Corp. (Automobiles & Components) | | | 1,779,634 | |
| | 18,400 | | | Trend Micro, Inc. (Software & Services) | | | 746,619 | |
| | 61,200 | | | USS Co. Ltd. (Retailing) | | | 919,580 | |
| | 4,000 | | | Yamaha Corp. (Consumer Durables & Apparel) | | | 96,618 | |
| | 22,600 | | | Yamaha Motor Co. Ltd. (Automobiles & Components) | | | 506,586 | |
| | 13,300 | | | Yamato Holdings Co. Ltd. (Transportation) | | | 281,802 | |
| | | | | | | | |
| | | | | | | 68,485,446 | |
| | |
| | Common Stocks – (continued) | |
| | Luxembourg – 1.0% | |
| | 23,972 | | | ArcelorMittal (Materials) | | $ | 101,143 | |
| | 16,699 | | | RTL Group SA (Media) | | | 1,390,618 | |
| | 55,346 | | | SES SA FDR (Media) | | | 1,533,622 | |
| | | | | | | | |
| | | | | | | 3,025,383 | |
| | |
| | Netherlands – 3.0% | |
| | 113,685 | | | Delta Lloyd NV (Insurance) | | | 670,166 | |
| | 56,447 | | | ING Groep NV CVA (Banks) | | | 763,730 | |
| | 12,426 | | | Koninklijke DSM NV (Materials) | | | 623,107 | |
| | 42,145 | | | Koninklijke Philips NV (Capital Goods) | | | 1,075,720 | |
| | 3,755 | | | Koninklijke Vopak NV (Energy) | | | 161,709 | |
| | 3,100 | | | NXP Semiconductors NV (Semiconductors & Semiconductor Equipment)* | | | 261,175 | |
| | 139,595 | | | Royal Dutch Shell PLC Class A (Energy)(a) | | | 3,183,192 | |
| | 91,973 | | | Royal Dutch Shell PLC Class B (Energy) | | | 2,096,150 | |
| | | | | | | | |
| | | | | | | 8,834,949 | |
| | |
| | Norway – 0.6% | |
| | 215,934 | | | Orkla ASA (Food, Beverage & Tobacco) | | | 1,703,487 | |
| | |
| | Portugal – 0.1% | |
| | 62,112 | | | EDP – Energias de Portugal SA (Utilities) | | | 223,811 | |
| | |
| | Singapore – 1.3% | |
| | 254,000 | | | Genting Singapore PLC (Consumer Services) | | | 137,052 | |
| | 787,000 | | | Global Logistic Properties Ltd. (Real Estate) | | | 1,188,497 | |
| | 69,000 | | | Keppel Corp. Ltd. (Capital Goods) | | | 315,204 | |
| | 107,300 | | | Sembcorp Marine Ltd. (Capital Goods) | | | 132,027 | |
| | 22,900 | | | Singapore Exchange Ltd. (Diversified Financials) | | | 123,853 | |
| | 211,000 | | | Singapore Press Holdings Ltd. (Media) | | | 584,847 | |
| | 202,000 | | | Singapore Technologies Engineering Ltd. (Capital Goods) | | | 427,005 | |
| | 93,000 | | | StarHub Ltd. (Telecommunication Services) | | | 242,022 | |
| | 55,000 | | | United Overseas Bank Ltd. (Banks) | | | 758,275 | |
| | | | | | | | |
| | | | | | | 3,908,782 | |
| | |
| | Spain – 4.2% | |
| | 63,932 | | | Abertis Infraestructuras SA (Transportation) | | | 999,857 | |
| | 3,064 | | | ACS Actividades de Construccion y Servicios SA (Capital Goods) | | | 89,645 | |
| | 209,830 | | | Banco Bilbao Vizcaya Argentaria SA (Banks) | | | 1,533,183 | |
| | 722,852 | | | Banco Santander SA (Banks)(a) | | | 3,555,978 | |
| | 34,755 | | | Ferrovial SA (Capital Goods) | | | 785,922 | |
| | 30,367 | | | Industria de Diseno Textil SA (Retailing) | | | 1,043,232 | |
| | 385,267 | | | Telefonica SA (Telecommunication Services)(a) | | | 4,274,124 | |
| | | | | | | | |
| | | | | | | 12,281,941 | |
| | |
| | |
| 42 | | The accompanying notes are an integral part of these financial statements. |
GOLDMAN SACHS INTERNATIONAL EQUITY DIVIDEND AND PREMIUM FUND
| | | | | | | | |
| Shares | | | Description | | Value | |
| | Common Stocks – (continued) | |
| | Sweden – 3.9% | |
| | 33,237 | | | Hennes & Mauritz AB Class B (Retailing) | | $ | 1,182,250 | |
| | 49,766 | | | Husqvarna AB Class B (Consumer Durables & Apparel) | | | 328,426 | |
| | 352,747 | | | Nordea Bank AB (Banks) | | | 3,870,255 | |
| | 164,691 | | | Sandvik AB (Capital Goods) | | | 1,435,613 | |
| | 235,610 | | | Skandinaviska Enskilda Banken AB Class A (Banks) | | | 2,477,793 | |
| | 82,423 | | | Telefonaktiebolaget LM Ericsson Class B (Technology Hardware & Equipment) | | | 794,665 | |
| | 223,405 | | | TeliaSonera AB (Telecommunication Services) | | | 1,109,403 | |
| | 15,913 | | | Volvo AB Class B (Capital Goods) | | | 147,554 | |
| | | | | | | | |
| | | | | | | 11,345,959 | |
| | |
| | Switzerland – 9.5% | |
| | 10,073 | | | Compagnie Financiere Richemont SA (Registered) (Consumer Durables & Apparel) | | | 720,954 | |
| | 73,030 | | | Credit Suisse Group AG (Registered) (Diversified Financials)* | | | 1,573,210 | |
| | 2,869 | | | EMS-Chemie Holding AG (Registered) (Materials) | | | 1,262,638 | |
| | 1,736 | | | Geberit AG (Registered) (Capital Goods) | | | 587,988 | |
| | 981 | | | Givaudan SA (Registered) (Materials)* | | | 1,780,478 | |
| | 1,812 | | | Julius Baer Group Ltd. (Diversified Financials)* | | | 87,659 | |
| | 3,263 | | | Kuehne + Nagel International AG (Registered) (Transportation) | | | 447,028 | |
| | 8,091 | | | LafargeHolcim Ltd. (Materials)* | | | 409,283 | |
| | 42,505 | | | Nestle SA (Registered) (Food, Beverage & Tobacco) | | | 3,155,369 | |
| | 68,534 | | | Novartis AG (Registered) (Pharmaceuticals, Biotechnology & Life Sciences) | | | 5,895,245 | |
| | 2,576 | | | Partners Group Holding AG (Diversified Financials) | | | 926,418 | |
| | 14,498 | | | Roche Holding AG (Pharmaceuticals, Biotechnology & Life Sciences) | | | 4,017,518 | |
| | 464 | | | SGS SA (Registered) (Commercial & Professional Services) | | | 881,832 | |
| | 147,371 | | | STMicroelectronics NV (Semiconductors & Semiconductor Equipment) | | | 986,613 | |
| | 1,727 | | | Syngenta AG (Registered) (Materials) | | | 675,953 | |
| | 17,426 | | | Zurich Insurance Group AG (Insurance)* | | | 4,476,740 | |
| | | | | | | | |
| | | | | | | 27,884,926 | |
| | |
| | United Kingdom – 19.2% | |
| | 89,508 | | | Aberdeen Asset Management PLC (Diversified Financials) | | | 381,414 | |
| | 14,271 | | | ARM Holdings PLC ADR (Semiconductors & Semiconductor Equipment) | | | 645,620 | |
| | |
| | Common Stocks – (continued) | |
| | United Kingdom – (continued) | |
| | 2,573 | | | AstraZeneca PLC (Pharmaceuticals, Biotechnology & Life Sciences) | | $ | 173,620 | |
| | 7,794 | | | AstraZeneca PLC ADR (Pharmaceuticals, Biotechnology & Life Sciences) | | | 264,606 | |
| | 279,168 | | | BAE Systems PLC (Capital Goods) | | | 2,055,379 | |
| | 331,374 | | | Barclays PLC (Banks) | | | 1,066,617 | |
| | 56,891 | | | BG Group PLC (Energy) | | | 824,683 | |
| | 81,252 | | | BP PLC ADR (Energy)(a) | | | 2,539,937 | |
| | 52,689 | | | British American Tobacco PLC (Food, Beverage & Tobacco) | | | 2,926,033 | |
| | 24,262 | | | British Land Co. PLC (REIT) | | | 280,732 | |
| | 23,343 | | | Capita PLC (Commercial & Professional Services) | | | 415,331 | |
| | 108,358 | | | Centrica PLC (Utilities) | | | 347,935 | |
| | 218,452 | | | Cobham PLC (Capital Goods) | | | 912,229 | |
| | 34,714 | | | Compass Group PLC (Consumer Services) | | | 601,532 | |
| | 23,923 | | | Diageo PLC (Food, Beverage & Tobacco) | | | 653,283 | |
| | 18,746 | | | easyJet PLC (Transportation) | | | 480,778 | |
| | 167,076 | | | GlaxoSmithKline PLC ADR (Pharmaceuticals, Biotechnology & Life Sciences)(a)(b) | | | 6,741,517 | |
| | 1,024,775 | | | HSBC Holdings PLC (Banks) | | | 8,089,795 | |
| | 115,961 | | | ICAP PLC (Diversified Financials) | | | 870,413 | |
| | 20,152 | | | Imperial Tobacco Group PLC (Food, Beverage & Tobacco) | | | 1,064,381 | |
| | 118,879 | | | J Sainsbury PLC (Food & Staples Retailing) | | | 452,715 | |
| | 25,253 | | | Land Securities Group PLC (REIT) | | | 437,761 | |
| | 114,314 | | | Legal & General Group PLC (Insurance) | | | 451,072 | |
| | 170,571 | | | Marks & Spencer Group PLC (Retailing) | | | 1,135,695 | |
| | 89,636 | | | Melrose Industries PLC (Capital Goods) | | | 383,950 | |
| | 1,017 | | | Next PLC (Retailing) | | | 109,196 | |
| | 59,834 | | | Pearson PLC (Media) | | | 646,833 | |
| | 45,009 | | | Persimmon PLC (Consumer Durables & Apparel)* | | | 1,342,769 | |
| | 28,433 | | | Provident Financial PLC (Diversified Financials) | | | 1,409,784 | |
| | 1,916 | | | Reckitt Benckiser Group PLC (Household & Personal Products) | | | 177,280 | |
| | 8,038 | | | Rio Tinto Ltd. (Materials) | | | 259,945 | |
| | 26,576 | | | Rio Tinto PLC (Materials) | | | 773,767 | |
| | 3,497 | | | Rio Tinto PLC ADR (Materials) | | | 101,833 | |
| | 66,973 | | | Royal Mail PLC (Transportation) | | | 438,665 | |
| | 63,875 | | | SSE PLC (Utilities) | | | 1,434,234 | |
| | 126,237 | | | Standard Chartered PLC (Banks) | | | 1,047,408 | |
| | 101,080 | | | Standard Life PLC (Insurance) | | | 578,836 | |
| | 106,104 | | | Tate & Lyle PLC (Food, Beverage & Tobacco) | | | 934,600 | |
| | 108,331 | | | Unilever NV CVA (Household & Personal Products)(a) | | | 4,721,510 | |
| | 62,775 | | | Unilever PLC ADR (Household & Personal Products) | | | 2,706,858 | |
| | |
| | |
| The accompanying notes are an integral part of these financial statements. | | 43 |
GOLDMAN SACHS INTERNATIONAL EQUITY DIVIDEND AND PREMIUM FUND
Schedule of Investments (continued)
December 31, 2015
| | | | | | | | |
| Shares | | | Description | | Value | |
| | Common Stocks – (continued) | |
| | United Kingdom – (continued) | |
| | 138,945 | | | Vodafone Group PLC ADR (Telecommunication Services)(a)(b) | | $ | 4,482,366 | |
| | 140,007 | | | William Hill PLC (Consumer Services) | | | 817,094 | |
| | 257,553 | | | Wm Morrison Supermarkets PLC (Food & Staples Retailing) | | | 561,177 | |
| | | | | | | | |
| | | | | | | 56,741,183 | |
| | |
| | United States – 0.1% | |
| | 7,114 | | | Carnival PLC ADR (Consumer Services) | | | 404,929 | |
| | |
| | TOTAL COMMON STOCKS | |
| | (Cost $359,080,834) | | $ | 293,541,627 | |
| | |
| | | | | | | | | | | | |
| | | |
| Shares | | | Description | | Rate | | | Value | |
| | Preferred Stocks – 0.7% | |
| | Germany – 0.7% | |
| | 12,634 | | | Fuchs Petrolub SE (Materials) | | | 0.770 | % | | $ | 594,891 | |
| | 8,468 | | | Porsche Automobil Holding SE (Automobiles & Components) | | | 2.010 | | | | 455,726 | |
| | 6,480 | | | Volkswagen AG (Automobiles & Components) | | | 4.860 | | | | 935,578 | |
| | |
| | TOTAL PREFERRED STOCKS | |
| | (Cost $3,144,763) | | | $ | 1,986,195 | |
| | |
| | TOTAL INVESTMENTS – 100.2% | |
| | (Cost $362,225,597) | | | $ | 295,527,822 | |
| | |
| LIABILITIES IN EXCESS OF
OTHER ASSETS – (0.2)% |
| | | (713,625 | ) |
| | |
| | NET ASSETS – 100.0% | | | $ | 294,814,197 | |
| | |
| | |
| The percentage shown for each investment category reflects the value of investments in that category as a percentage of net assets. |
* | | Non-income producing security. |
(a) | | All or a portion of this security is held as collateral for call options written. |
(b) | | All or a portion of security is segregated as collateral for initial margin requirements on futures transactions. |
| | |
|
Investment Abbreviations: |
ADR | | —American Depositary Receipt |
CVA | | —Dutch Certification |
FDR | | —Fiduciary Depositary Receipt |
REIT | | —Real Estate Investment Trust |
|
|
| ADDITIONAL INVESTMENT INFORMATION |
FUTURES CONTRACTS — At December 31, 2015, the Fund had the following futures contracts:
| | | | | | | | | | | | | | |
| Type | | Number of
Contracts
Long (Short) | | | Expiration
Date | | Current
Value | | | Unrealized
Gain (Loss) | |
EURO STOXX 50 Index | | | 56 | | | March 2016 | | $ | 1,997,360 | | | $ | (5,654 | ) |
FTSE 100 Index | | | 10 | | | March 2016 | | | 913,709 | | | | (5,134 | ) |
TSE TOPIX Index | | | 7 | | | March 2016 | | | 901,244 | | | | (1,316 | ) |
| TOTAL | | | | | | | | | | | | $ | (12,104 | ) |
| | |
| 44 | | The accompanying notes are an integral part of these financial statements. |
GOLDMAN SACHS INTERNATIONAL EQUITY DIVIDEND AND PREMIUM FUND
|
| ADDITIONAL INVESTMENT INFORMATION (continued) |
WRITTEN OPTIONS CONTRACTS — At December 31, 2015, the Fund had the following written options:
| | | | | | | | | | | | | | |
| Call Options | | Number of
Contracts | | | Exercise
Price | | | Expiration
Month | | Value | |
EURO STOXX 50 Index | | | 1,705 | | | EUR | 3,400 | | | March 2016 | | $ | (1,361,888 | ) |
FTSE 100 Index | | | 288 | | | GBP | 6,275 | | | March 2016 | | | (619,872 | ) |
Nikkei-225 Stock Average | | | 188 | | | JPY | 19,750 | | | March 2016 | | | (477,058 | ) |
| TOTAL (Premiums Received $2,745,815) | | | 2,181 | | | | | | | | | $ | (2,458,818 | ) |
For the year ended December 31, 2015, the Fund had the following written options activity:
| | | | | | | | |
| | | Number of
Contracts | | | Premiums
Received | |
Contracts Outstanding December 31, 2014 | | | 2,787 | | | $ | 4,484,952 | |
Contracts written | | | 9,567 | | | | 12,033,384 | |
Contracts expired | | | (4,633 | ) | | | (4,199,504 | ) |
Contracts bought to close | | | (5,540 | ) | | | (9,573,017 | ) |
Contracts Outstanding December 31, 2015 | | | 2,181 | | | $ | 2,745,815 | |
| | |
| The accompanying notes are an integral part of these financial statements. | | 45 |
GOLDMAN SACHS U.S. TAX-MANAGED EQUITY FUND
Schedule of Investments
December 31, 2015
| | | | | | | | |
| Shares | | | Description | | Value | |
| | Common Stocks – 101.1% | |
| | Automobiles & Components – 0.2% | |
| | 44,411 | | | Cooper Tire & Rubber Co. | | $ | 1,680,962 | |
| | 47,826 | | | Gentex Corp. | | | 765,694 | |
| | | | | | | | |
| | | | | | | 2,446,656 | |
| | |
| | Banks – 8.5% | |
| | 939,643 | | | Bank of America Corp.(a) | | | 15,814,192 | |
| | 140,106 | | | CenterState Banks, Inc. | | | 2,192,659 | |
| | 72,108 | | | Central Pacific Financial Corp. | | | 1,587,818 | |
| | 12,033 | | | Citigroup, Inc. | | | 622,603 | |
| | 54,777 | | | FCB Financial Holdings, Inc. Class A* | | | 1,960,469 | |
| | 2,141 | | | First Citizens BancShares, Inc. Class A | | | 552,742 | |
| | 26,964 | | | Flagstar Bancorp, Inc.* | | | 623,138 | |
| | 23,719 | | | Hanmi Financial Corp. | | | 562,615 | |
| | 232,276 | | | Investors Bancorp, Inc. | | | 2,889,514 | |
| | 245,842 | | | JPMorgan Chase & Co. | | | 16,232,947 | |
| | 310,721 | | | KeyCorp | | | 4,098,410 | |
| | 5,886 | | | PacWest Bancorp | | | 253,687 | |
| | 257,591 | | | SunTrust Banks, Inc. | | | 11,035,198 | |
| | 77,393 | | | Synovus Financial Corp. | | | 2,505,985 | |
| | 67,338 | | | The PNC Financial Services Group, Inc. | | | 6,417,985 | |
| | 17,389 | | | TriCo Bancshares | | | 477,154 | |
| | 15,761 | | | U.S. Bancorp | | | 672,522 | |
| | 227,036 | | | Umpqua Holdings Corp. | | | 3,609,872 | |
| | 11,904 | | | United Community Banks, Inc. | | | 232,009 | |
| | 122,824 | | | Washington Federal, Inc. | | | 2,926,896 | |
| | 245,189 | | | Wells Fargo & Co. | | | 13,328,386 | |
| | | | | | | | |
| | | | | | | 88,596,801 | |
| | |
| | Capital Goods – 6.3% | |
| | 829 | | | Acuity Brands, Inc. | | | 193,820 | |
| | 61,413 | | | Allison Transmission Holdings, Inc. | | | 1,590,000 | |
| | 59,103 | | | B/E Aerospace, Inc. | | | 2,504,194 | |
| | 3,339 | | | Carlisle Companies, Inc. | | | 296,136 | |
| | 36,742 | | | Comfort Systems USA, Inc. | | | 1,044,208 | |
| | 39,516 | | | Danaher Corp. | | | 3,670,246 | |
| | 9,463 | | | DigitalGlobe, Inc.* | | | 148,191 | |
| | 15,843 | | | EMCOR Group, Inc. | | | 761,098 | |
| | 11,349 | | | Federal Signal Corp. | | | 179,882 | |
| | 425,250 | | | General Electric Co. | | | 13,246,538 | |
| | 6,702 | | | Granite Construction, Inc. | | | 287,583 | |
| | 12,216 | | | HD Supply Holdings, Inc.* | | | 366,846 | |
| | 9,481 | | | Honeywell International, Inc. | | | 981,947 | |
| | 22 | | | Hyster-Yale Materials Handling, Inc. | | | 1,154 | |
| | 73,341 | | | Illinois Tool Works, Inc. | | | 6,797,201 | |
| | 29,280 | | | Lockheed Martin Corp. | | | 6,356,905 | |
| | 31,609 | | | Orbital ATK, Inc. | | | 2,823,871 | |
| | 29,261 | | | Quanta Services, Inc.* | | | 592,535 | |
| | 64,168 | | | Raytheon Co. | | | 7,990,841 | |
| | 37,020 | | | Spirit AeroSystems Holdings, Inc. Class A* | | | 1,853,591 | |
| | 23,061 | | | Taser International, Inc.*(b) | | | 398,725 | |
| | 56,217 | | | The Boeing Co. | | | 8,128,416 | |
| | 11,082 | | | Trex Co., Inc.* | | | 422,024 | |
| | |
| | Common Stocks – (continued) | |
| | Capital Goods – (continued) | |
| | 21,794 | | | WABCO Holdings, Inc.* | | $ | 2,228,654 | |
| | 27,395 | | | Watsco, Inc. | | | 3,208,776 | |
| | | | | | | | |
| | | | | | | 66,073,382 | |
| | |
| | Commercial & Professional Services – 0.9% | |
| | 59,972 | | | ABM Industries, Inc. | | | 1,707,403 | |
| | 32,356 | | | Cintas Corp. | | | 2,946,014 | |
| | 41,577 | | | ManpowerGroup, Inc. | | | 3,504,525 | |
| | 58,300 | | | Steelcase, Inc. Class A | | | 868,822 | |
| | | | | | | | |
| | | | | | | 9,026,764 | |
| | |
| | Consumer Durables & Apparel – 3.7% | |
| | 5,886 | | | Callaway Golf Co. | | | 55,446 | |
| | 16,531 | | | Carter’s, Inc. | | | 1,471,755 | |
| | 19,685 | | | Columbia Sportswear Co. | | | 959,841 | |
| | 6,341 | | | D.R. Horton, Inc. | | | 203,102 | |
| | 16,265 | | | Ethan Allen Interiors, Inc. | | | 452,502 | |
| | 3,479 | | | Harman International Industries, Inc. | | | 327,757 | |
| | 33,386 | | | Hasbro, Inc. | | | 2,248,881 | |
| | 32,239 | | | Leggett & Platt, Inc. | | | 1,354,683 | |
| | 58,885 | | | Mohawk Industries, Inc.* | | | 11,152,230 | |
| | 91,578 | | | Newell Rubbermaid, Inc. | | | 4,036,758 | |
| | 163,278 | | | NIKE, Inc. Class B | | | 10,204,875 | |
| | 1,156 | | | NVR, Inc.* | | | 1,899,308 | |
| | 21,440 | | | Tempur Sealy International, Inc.* | | | 1,510,662 | |
| | 63,216 | | | Vista Outdoor, Inc.* | | | 2,813,744 | |
| | | | | | | | |
| | | | | | | 38,691,544 | |
| | |
| | Consumer Services – 3.5% | |
| | 28,139 | | | BJ’s Restaurants, Inc.* | | | 1,223,202 | |
| | 92,201 | | | Bloomin’ Brands, Inc. | | | 1,557,275 | |
| | 10,900 | | | Bob Evans Farms, Inc./DE | | | 423,465 | |
| | 38,745 | | | Boyd Gaming Corp.* | | | 769,863 | |
| | 160,834 | | | Carnival Corp. | | | 8,762,236 | |
| | 36,464 | | | Darden Restaurants, Inc. | | | 2,320,569 | |
| | 68,956 | | | Denny’s Corp.* | | | 677,837 | |
| | 6,048 | | | Marriott International, Inc. Class A(b) | | | 405,458 | |
| | 29,965 | | | Papa John’s International, Inc. | | | 1,674,145 | |
| | 20,192 | | | Regis Corp.* | | | 285,717 | |
| | 120,811 | | | Royal Caribbean Cruises Ltd. | | | 12,227,281 | |
| | 37,438 | | | Six Flags Entertainment Corp. | | | 2,056,844 | |
| | 35,271 | | | Starbucks Corp. | | | 2,117,318 | |
| | 5,310 | | | Wyndham Worldwide Corp. | | | 385,772 | |
| | 22,217 | | | Yum! Brands, Inc. | | | 1,622,952 | |
| | | | | | | | |
| | | | | | | 36,509,934 | |
| | |
| | Diversified Financials – 4.2% | |
| | 345,764 | | | Ally Financial, Inc.* | | | 6,445,041 | |
| | 12,436 | | | Ameriprise Financial, Inc. | | | 1,323,402 | |
| | 38,603 | | | Berkshire Hathaway, Inc. Class B* | | | 5,097,140 | |
| | 28,423 | | | BGC Partners, Inc. Class A | | | 278,830 | |
| | 41,308 | | | Capital One Financial Corp. | | | 2,981,612 | |
| | 25,587 | | | CBOE Holdings, Inc. | | | 1,660,596 | |
| | 137,041 | | | E*TRADE Financial Corp.* | | | 4,061,895 | |
| | 53,650 | | | Federated Investors, Inc. Class B | | | 1,537,073 | |
| | 6,805 | | | MarketAxess Holdings, Inc. | | | 759,370 | |
| | 13,258 | | | Morgan Stanley | | | 421,737 | |
| | |
| | |
| 46 | | The accompanying notes are an integral part of these financial statements. |
GOLDMAN SACHS U.S. TAX-MANAGED EQUITY FUND
| | | | | | | | |
| Shares | | | Description | | Value | |
| | Common Stocks – (continued) | |
| | Diversified Financials – (continued) | |
| | 38,272 | | | MSCI, Inc. | | $ | 2,760,559 | |
| | 174,387 | | | Nasdaq, Inc. | | | 10,144,045 | |
| | 14,033 | | | SEI Investments Co. | | | 735,285 | |
| | 163,531 | | | TD Ameritrade Holding Corp. | | | 5,676,161 | |
| | 15,348 | | | The Charles Schwab Corp. | | | 505,410 | |
| | | | | | | | |
| | | | | | | 44,388,156 | |
| | |
| | Energy – 6.7% | |
| | 18,487 | | | Baker Hughes, Inc. | | | 853,144 | |
| | 4,791 | | | Chevron Corp. | | | 430,912 | |
| | 30,994 | | | CVR Energy, Inc.(b) | | | 1,219,614 | |
| | 40,356 | | | Delek US Holdings, Inc. | | | 992,758 | |
| | 66,336 | | | Exxon Mobil Corp. | | | 5,170,891 | |
| | 40,501 | | | Green Plains, Inc. | | | 927,473 | |
| | 19,621 | | | Hess Corp. | | | 951,226 | |
| | 259,505 | | | HollyFrontier Corp. | | | 10,351,654 | |
| | 235,076 | | | Marathon Petroleum Corp. | | | 12,186,340 | |
| | 20,875 | | | Par Pacific Holdings, Inc.*(b) | | | 491,397 | |
| | 255,713 | | | PBF Energy, Inc. Class A | | | 9,412,795 | |
| | 42,863 | | | Phillips 66 | | | 3,506,193 | |
| | 80,224 | | | Tesoro Corp. | | | 8,453,203 | |
| | 9,713 | | | The Williams Companies, Inc. | | | 249,624 | |
| | 200,046 | | | Valero Energy Corp. | | | 14,145,253 | |
| | 20,543 | | | Western Refining, Inc. | | | 731,742 | |
| | | | | | | | |
| | | | | | | 70,074,219 | |
| | |
| | Food & Staples Retailing – 1.7% | |
| | 161,001 | | | CVS Health Corp. | | | 15,741,068 | |
| | 62,608 | | | Safeway PDC LLC* | | | 33,297 | |
| | 21,914 | | | Walgreens Boots Alliance, Inc. | | | 1,866,087 | |
| | | | | | | | |
| | | | | | | 17,640,452 | |
| | |
| | Food, Beverage & Tobacco – 6.1% | |
| | 284,076 | | | Altria Group, Inc. | | | 16,536,064 | |
| | 67,830 | | | Archer-Daniels-Midland Co. | | | 2,487,914 | |
| | 13,363 | | | Coca-Cola Enterprises, Inc. | | | 657,994 | |
| | 286,791 | | | ConAgra Foods, Inc. | | | 12,091,109 | |
| | 99 | | | Diamond Foods, Inc.* | | | 3,816 | |
| | 155,298 | | | Flowers Foods, Inc. | | | 3,337,354 | |
| | 4,909 | | | General Mills, Inc. | | | 283,053 | |
| | 26,785 | | | Hormel Foods Corp. | | | 2,118,158 | |
| | 15,945 | | | J&J Snack Foods Corp. | | | 1,860,303 | |
| | 13,687 | | | Lancaster Colony Corp. | | | 1,580,228 | |
| | 50,838 | | | PepsiCo, Inc. | | | 5,079,733 | |
| | 254,314 | | | Pilgrim’s Pride Corp.(b) | | | 5,617,796 | |
| | 8,754 | | | Post Holdings, Inc.* | | | 540,122 | |
| | 47,739 | | | Sanderson Farms, Inc.(b) | | | 3,700,727 | |
| | 1,511 | | | The Boston Beer Co., Inc. Class A* | | | 305,086 | |
| | 62,471 | | | The Kraft Heinz Co. | | | 4,545,390 | |
| | 62,617 | | | Tyson Foods, Inc. Class A | | | 3,339,365 | |
| | | | | | | | |
| | | | | | | 64,084,212 | |
| | |
| | Health Care Equipment & Services – 6.2% | |
| | 93,269 | | | Abbott Laboratories | | | 4,188,711 | |
| | 9,683 | | | Aetna, Inc. | | | 1,046,926 | |
| | 74,383 | | | Allscripts Healthcare Solutions, Inc.*(b) | | | 1,144,011 | |
| | |
| | Common Stocks – (continued) | |
| | Health Care Equipment & Services – (continued) | |
| | 112,579 | | | AmerisourceBergen Corp. | | $ | 11,675,568 | |
| | 11,187 | | | Anthem, Inc. | | | 1,559,915 | |
| | 12,250 | | | Becton, Dickinson and Co. | | | 1,887,603 | |
| | 179,530 | | | Boston Scientific Corp.* | | | 3,310,533 | |
| | 40,295 | | | C. R. Bard, Inc. | | | 7,633,485 | |
| | 20,463 | | | Cardinal Health, Inc. | | | 1,826,732 | |
| | 5,316 | | | CorVel Corp.* | | | 233,566 | |
| | 44,360 | | | Express Scripts Holding Co.* | | | 3,877,481 | |
| | 75,222 | | | Hologic, Inc.* | | | 2,910,339 | |
| | 68,728 | | | McKesson Corp. | | | 13,555,223 | |
| | 4,928 | | | Natus Medical, Inc.* | | | 236,790 | |
| | 49,709 | | | NuVasive, Inc.* | | | 2,689,754 | |
| | 23,851 | | | Sirona Dental Systems, Inc.* | | | 2,613,354 | |
| | 75,971 | | | St. Jude Medical, Inc. | | | 4,692,729 | |
| | | | | | | | |
| | | | | | | 65,082,720 | |
| | |
| | Household & Personal Products – 1.1% | |
| | 9,369 | | | Church & Dwight Co., Inc. | | | 795,241 | |
| | 75,060 | | | Kimberly-Clark Corp. | | | 9,555,138 | |
| | 8,185 | | | The Procter & Gamble Co. | | | 649,971 | |
| | 4,862 | | | USANA Health Sciences, Inc.* | | | 621,120 | |
| | | | | | | | |
| | | | | | | 11,621,470 | |
| | |
| | Insurance – 3.2% | |
| | 24,523 | | | Amtrust Financial Services, Inc.(b) | | | 1,510,126 | |
| | 5,228 | | | Argo Group International Holdings Ltd. | | | 312,843 | |
| | 74,202 | | | Aspen Insurance Holdings Ltd. | | | 3,583,957 | |
| | 13,711 | | | Endurance Specialty Holdings Ltd. | | | 877,367 | |
| | 39,747 | | | Lincoln National Corp. | | | 1,997,684 | |
| | 17,026 | | | Marsh & McLennan Companies, Inc. | | | 944,092 | |
| | 12,012 | | | MetLife, Inc. | | | 579,098 | |
| | 64,085 | | | Prudential Financial, Inc. | | | 5,217,160 | |
| | 87,034 | | | Reinsurance Group of America, Inc. | | | 7,445,759 | |
| | 84,924 | | | The Travelers Companies, Inc. | | | 9,584,523 | |
| | 10,305 | | | Unum Group | | | 343,053 | |
| | 4,433 | | | Validus Holdings Ltd. | | | 205,204 | |
| | 25,481 | | | XL Group PLC | | | 998,346 | |
| | | | | | | | |
| | | | | | | 33,599,212 | |
| | |
| | Materials – 3.9% | |
| | 20,121 | | | Ball Corp. | | | 1,463,245 | |
| | 87,896 | | | Berry Plastics Group, Inc.* | | | 3,180,077 | |
| | 7,764 | | | Carpenter Technology Corp. | | | 235,016 | |
| | 20,608 | | | Ecolab, Inc. | | | 2,357,143 | |
| | 1,340 | | | Ferroglobe PLC | | | 14,405 | |
| | 130,218 | | | LyondellBasell Industries NV Class A | | | 11,315,944 | |
| | 14,360 | | | Minerals Technologies, Inc. | | | 658,550 | |
| | 136,121 | | | Nucor Corp. | | | 5,485,676 | |
| | 6,257 | | | Packaging Corp. of America | | | 394,504 | |
| | 60,894 | | | PPG Industries, Inc. | | | 6,017,545 | |
| | 48,985 | | | Steel Dynamics, Inc. | | | 875,362 | |
| | 4,173 | | | The Scotts Miracle-Gro Co. Class A | | | 269,200 | |
| | 31,204 | | | The Sherwin-Williams Co. | | | 8,100,559 | |
| | 5,275 | | | WestRock Co. | | | 240,646 | |
| | | | | | | | |
| | | | | | | 40,607,872 | |
| | |
| | |
| The accompanying notes are an integral part of these financial statements. | | 47 |
GOLDMAN SACHS U.S. TAX-MANAGED EQUITY FUND
Schedule of Investments (continued)
December 31, 2015
| | | | | | | | |
| Shares | | | Description | | Value | |
| | Common Stocks – (continued) | |
| | Media – 1.7% | |
| | 135,579 | | | Comcast Corp. Class A | | $ | 7,650,723 | |
| | 14,898 | | | Regal Entertainment Group Class A(b) | | | 281,125 | |
| | 72,201 | | | Sirius XM Holdings, Inc.* | | | 293,858 | |
| | 208,444 | | | The Interpublic Group of Companies, Inc. | | | 4,852,576 | |
| | 23,422 | | | The Walt Disney Co. | | | 2,461,184 | |
| | 13,096 | | | Time Warner Cable, Inc. | | | 2,430,487 | |
| | | | | | | | |
| | | | | | | 17,969,953 | |
| | |
| | Pharmaceuticals, Biotechnology & Life Sciences – 9.2% | |
| | 117,983 | | | AbbVie, Inc. | | | 6,989,313 | |
| | 28,864 | | | Alexion Pharmaceuticals, Inc.* | | | 5,505,808 | |
| | 28,090 | | | Alkermes PLC* | | | 2,229,784 | |
| | 15,723 | | | Allergan PLC* | | | 4,913,437 | |
| | 84,315 | | | Amgen, Inc. | | | 13,686,854 | |
| | 16,914 | | | Biogen, Inc.* | | | 5,181,604 | |
| | 48,696 | | | Cambrex Corp.* | | | 2,293,095 | |
| | 13,570 | | | Celgene Corp.* | | | 1,625,143 | |
| | 34,308 | | | Cepheid, Inc.* | | | 1,253,271 | |
| | 49,131 | | | Eli Lilly & Co. | | | 4,139,778 | |
| | 126,346 | | | Gilead Sciences, Inc. | | | 12,784,952 | |
| | 18,610 | | | Incyte Corp.* | | | 2,018,255 | |
| | 45,194 | | | Ionis Pharmaceuticals, Inc.* | | | 2,798,864 | |
| | 101,303 | | | Johnson & Johnson | | | 10,405,844 | |
| | 12,759 | | | Medivation, Inc.* | | | 616,770 | |
| | 94,472 | | | Merck & Co., Inc. | | | 4,990,011 | |
| | 308,067 | | | Pfizer, Inc. | | | 9,944,403 | |
| | 15,767 | | | Prestige Brands Holdings, Inc.* | | | 811,685 | |
| | 4,670 | | | United Therapeutics Corp.* | | | 731,369 | |
| | 28,865 | | | Vertex Pharmaceuticals, Inc.* | | | 3,632,083 | |
| | | | | | | | |
| | | | | | | 96,552,323 | |
| | |
| | Real Estate – 3.1% | |
| | 53,031 | | | American Tower Corp. (REIT) | | | 5,141,356 | |
| | 15,622 | | | Apartment Investment & Management Co. Class A (REIT) | | | 625,349 | |
| | 4,398 | | | Brandywine Realty Trust (REIT) | | | 60,075 | |
| | 41,224 | | | CBRE Group, Inc. Class A* | | | 1,425,526 | |
| | 14,217 | | | CoreSite Realty Corp. (REIT) | | | 806,388 | |
| | 52,012 | | | Cousins Properties, Inc. (REIT) | | | 490,473 | |
| | 110,153 | | | CubeSmart (REIT) | | | 3,372,885 | |
| | 19,282 | | | CyrusOne, Inc. (REIT) | | | 722,111 | |
| | 42,346 | | | DCT Industrial Trust, Inc. (REIT) | | | 1,582,470 | |
| | 7,822 | | | DuPont Fabros Technology, Inc. (REIT) | | | 248,661 | |
| | 83,804 | | | Empire State Realty Trust, Inc. Class A (REIT) | | | 1,514,338 | |
| | 14 | | | Equity Commonwealth (REIT)* | | | 388 | |
| | 36,127 | | | Equity LifeStyle Properties, Inc. (REIT) | | | 2,408,587 | |
| | 13,450 | | | Equity Residential (REIT) | | | 1,097,386 | |
| | 28,074 | | | Extra Space Storage, Inc. (REIT) | | | 2,476,408 | |
| | 21,608 | | | Kite Realty Group Trust (REIT) | | | 560,295 | |
| | 65,740 | | | Mack-Cali Realty Corp. (REIT) | | | 1,535,029 | |
| | 29,080 | | | Post Properties, Inc. (REIT) | | | 1,720,373 | |
| | |
| | Common Stocks – (continued) | |
| | Real Estate – (continued) | |
| | 10,025 | | | PS Business Parks, Inc. (REIT) | | $ | 876,486 | |
| | 21,404 | | | Public Storage (REIT) | | | 5,302,270 | |
| | | | | | | | |
| | | | | | | 31,966,854 | |
| | |
| | Retailing – 7.5% | |
| | 7,711 | | | Advance Auto Parts, Inc. | | | 1,160,583 | |
| | 18,548 | | | Amazon.com, Inc.* | | | 12,536,408 | |
| | 33,073 | | | Asbury Automotive Group, Inc.* | | | 2,230,443 | |
| | 15,256 | | | AutoZone, Inc.* | | | 11,318,579 | |
| | 3,107 | | | Expedia, Inc. | | | 386,115 | |
| | 55,707 | | | GameStop Corp. Class A(b) | | | 1,562,024 | |
| | 178,063 | | | Liberty Interactive Corp QVC Group Series A* | | | 4,864,681 | |
| | 25,315 | | | Liberty Ventures Series A* | | | 1,141,960 | |
| | 160,385 | | | Lowe’s Companies, Inc. | | | 12,195,675 | |
| | 17,518 | | | Netflix, Inc.* | | | 2,003,616 | |
| | 37,334 | | | O’Reilly Automotive, Inc.* | | | 9,461,182 | |
| | 8,522 | | | Sally Beauty Holdings, Inc.* | | | 237,679 | |
| | 4,651 | | | Shutterfly, Inc.* | | | 207,248 | |
| | 114,983 | | | The Home Depot, Inc. | | | 15,206,502 | |
| | 2,551 | | | The Priceline Group, Inc.* | | | 3,252,397 | |
| | 2,076 | | | TripAdvisor, Inc.* | | | 176,979 | |
| | | | | | | | |
| | | | | | | 77,942,071 | |
| | |
| | Semiconductors & Semiconductor Equipment – 2.0% | |
| | 18,548 | | | Advanced Energy Industries, Inc.* | | | 523,610 | |
| | 181,233 | | | Broadcom Corp. Class A | | | 10,478,892 | |
| | 41,761 | | | Intel Corp. | | | 1,438,667 | |
| | 42,708 | | | Lam Research Corp. | | | 3,391,869 | |
| | 2,689 | | | NXP Semiconductors NV* | | | 226,290 | |
| | 38,872 | | | SunPower Corp.*(b) | | | 1,166,549 | |
| | 63,136 | | | Texas Instruments, Inc. | | | 3,460,421 | |
| | | | | | | | |
| | | | | | | 20,686,298 | |
| | |
| | Software & Services – 12.0% | |
| | 89,702 | | | Activision Blizzard, Inc. | | | 3,472,364 | |
| | 11,165 | | | Adobe Systems, Inc.* | | | 1,048,840 | |
| | 12,861 | | | Alphabet, Inc. Class A* | | | 10,005,987 | |
| | 13,118 | | | Alphabet, Inc. Class C* | | | 9,954,988 | |
| | 31,238 | | | Amdocs Ltd. | | | 1,704,658 | |
| | 25,773 | | | Aspen Technology, Inc.* | | | 973,189 | |
| | 7,278 | | | Automatic Data Processing, Inc. | | | 616,240 | |
| | 6,244 | | | Cimpress NV*(b) | | | 506,638 | |
| | 38,597 | | | Constant Contact, Inc.* | | | 1,128,623 | |
| | 13,589 | | | Cornerstone OnDemand, Inc.* | | | 469,228 | |
| | 431,405 | | | eBay, Inc.* | | | 11,855,009 | |
| | 50,031 | | | Electronic Arts, Inc.* | | | 3,438,130 | |
| | 96,670 | | | Facebook, Inc. Class A* | | | 10,117,482 | |
| | 15,981 | | | Gigamon, Inc.* | | | 424,615 | |
| | 7,365 | | | IAC/InterActiveCorp | | | 442,268 | |
| | 96,186 | | | Intuit, Inc. | | | 9,281,949 | |
| | 12,058 | | | Jack Henry & Associates, Inc. | | | 941,247 | |
| | 3,987 | | | LinkedIn Corp. Class A* | | | 897,394 | |
| | 92,280 | | | Mastercard, Inc. Class A | | | 8,984,381 | |
| | 36,897 | | | Mentor Graphics Corp. | | | 679,643 | |
| | 421,098 | | | Microsoft Corp. | | | 23,362,517 | |
| | |
| | |
| 48 | | The accompanying notes are an integral part of these financial statements. |
GOLDMAN SACHS U.S. TAX-MANAGED EQUITY FUND
| | | | | | | | |
| Shares | | | Description | | Value | |
| | Common Stocks – (continued) | |
| | Software & Services – (continued) | |
| | 212,944 | | | Oracle Corp. | | $ | 7,778,844 | |
| | 48,903 | | | PayPal Holdings, Inc.* | | | 1,770,289 | |
| | 29,264 | | | Progress Software Corp.* | | | 702,336 | |
| | 10,026 | | | Shutterstock, Inc.*(b) | | | 324,241 | |
| | 89,564 | | | Take-Two Interactive Software, Inc.* | | | 3,120,410 | |
| | 38,048 | | | Total System Services, Inc. | | | 1,894,790 | |
| | 18,627 | | | Twitter, Inc.* | | | 431,029 | |
| | 65,609 | | | Vantiv, Inc. Class A* | | | 3,111,179 | |
| | 12,293 | | | VeriSign, Inc.*(b) | | | 1,073,916 | |
| | 21,263 | | | Web.com Group, Inc.* | | | 425,463 | |
| | 36,210 | | | Yahoo!, Inc.* | | | 1,204,345 | |
| | 49,312 | | | Zillow Group, Inc. Class A*(b) | | | 1,284,084 | |
| | 98,624 | | | Zillow Group, Inc. Class C*(b) | | | 2,315,692 | |
| | | | | | | | |
| | | | | | | 125,742,008 | |
| | |
| | Technology Hardware & Equipment – 5.9% | |
| | 290,513 | | | Apple, Inc. | | | 30,579,398 | |
| | 9,061 | | | Avnet, Inc. | | | 388,173 | |
| | 41,795 | | | Benchmark Electronics, Inc.* | | | 863,903 | |
| | 26,668 | | | CDW Corp./DE | | | 1,121,090 | |
| | 56,972 | | | Cisco Systems, Inc. | | | 1,547,075 | |
| | 155,114 | | | Corning, Inc. | | | 2,835,484 | |
| | 22,102 | | | EchoStar Corp. Class A* | | | 864,409 | |
| | 10,829 | | | EMC Corp. | | | 278,089 | |
| | 43,885 | | | F5 Networks, Inc.* | | | 4,255,090 | |
| | 63,584 | | | Flextronics International Ltd.* | | | 712,777 | |
| | 9,425 | | | Harris Corp. | | | 819,032 | |
| | 60,841 | | | Hewlett Packard Enterprise Co. | | | 924,783 | |
| | 60,841 | | | HP, Inc. | | | 720,357 | |
| | 17,465 | | | Ingram Micro, Inc. Class A | | | 530,587 | |
| | 333,979 | | | Juniper Networks, Inc. | | | 9,217,820 | |
| | 35,577 | | | Methode Electronics, Inc. | | | 1,132,452 | |
| | 40,289 | | | NETGEAR, Inc.* | | | 1,688,512 | |
| | 18,932 | | | OSI Systems, Inc.* | | | 1,678,511 | |
| | 5,083 | | | Plantronics, Inc. | | | 241,036 | |
| | 22,355 | | | ShoreTel, Inc.* | | | 197,842 | |
| | 11,339 | | | SYNNEX Corp. | | | 1,019,578 | |
| | | | | | | | |
| | | | | | | 61,615,998 | |
| | |
| | Telecommunication Services – 0.2% | |
| | 48,654 | | | AT&T, Inc. | | | 1,674,155 | |
| | 11,270 | | | Verizon Communications, Inc. | | | 520,899 | |
| | | | | | | | |
| | | | | | | 2,195,054 | |
| | |
| | Transportation – 2.3% | |
| | 51,378 | | | Alaska Air Group, Inc. | | | 4,136,443 | |
| | 14,103 | | | Allegiant Travel Co. | | | 2,366,907 | |
| | 154,374 | | | American Airlines Group, Inc. | | | 6,537,739 | |
| | 11,928 | | | ArcBest Corp. | | | 255,140 | |
| | 19,608 | | | Avis Budget Group, Inc.* | | | 711,574 | |
| | 15,629 | | | CSX Corp. | | | 405,573 | |
| | |
| | Common Stocks – (continued) | |
| | Transportation – (continued) | |
| | 34,092 | | | Delta Air Lines, Inc. | | $ | 1,728,123 | |
| | 3,220 | | | FedEx Corp. | | | 479,748 | |
| | 9,918 | | | JetBlue Airways Corp.* | | | 224,617 | |
| | 5,744 | | | Saia, Inc.* | | | 127,804 | |
| | 63,265 | | | Southwest Airlines Co. | | | 2,724,191 | |
| | 30,565 | | | Spirit Airlines, Inc.* | | | 1,218,015 | |
| | 19,226 | | | Union Pacific Corp. | | | 1,503,473 | |
| | 16,477 | | | United Parcel Service, Inc. Class B | | | 1,585,582 | |
| | | | | | | | |
| | | | | | | 24,004,929 | |
| | |
| | Utilities – 1.0% | |
| | 9,874 | | | American Water Works Co., Inc. | | | 589,926 | |
| | 113,422 | | | Edison International | | | 6,715,717 | |
| | 199,921 | | | NRG Energy, Inc. | | | 2,353,070 | |
| | 44,729 | | | Talen Energy Corp.* | | | 278,662 | |
| | | | | | | | |
| | | | | | | 9,937,375 | |
| | |
| TOTAL INVESTMENTS BEFORE SECURITIES LENDING
REINVESTMENT VEHICLE |
|
| | (Cost $810,608,129) | | $ | 1,057,056,257 | |
| | |
| | |
| Shares | | | Distribution Rate | | Value | |
| | Securities Lending Reinvestment Vehicle(c)(d) – 1.9% | |
| Goldman Sachs Financial Square Money Market Fund – FST
Shares |
|
| | 19,803,509 | | | 0.285% | | $ | 19,803,509 | |
| | (Cost $19,803,509) | | | | |
| | |
| | TOTAL INVESTMENTS – 103.0% | |
| | (Cost $830,411,638) | | $ | 1,076,859,766 | |
| | |
| LIABILITIES IN EXCESS OF
OTHER ASSETS – (3.0)% | | | (31,445,253 | ) |
| | |
| | NET ASSETS – 100.0% | | $ | 1,045,414,513 | |
| | |
| | |
| The percentage shown for each investment category reflects the value of investments in that category as a percentage of net assets. |
* | | Non-income producing security. |
(a) | | All or a portion of security is segregated as collateral for initial margin requirements on futures transactions. |
(b) | | All or a portion of security is on loan. |
(c) | | Represents an affiliated issuer. |
(d) | | Variable rate security. Interest rate or distribution rate disclosed is that which is in effect on December 31, 2015. |
| | |
Investment Abbreviation: |
REIT | | —Real Estate Investment Trust |
|
| | |
| The accompanying notes are an integral part of these financial statements. | | 49 |
GOLDMAN SACHS U.S. TAX-MANAGED EQUITY FUND
Schedule of Investments (continued)
December 31, 2015
|
| ADDITIONAL INVESTMENT INFORMATION |
FUTURES CONTRACTS — At December 31, 2015, the Fund had the following futures contracts:
| | | | | | | | | | | | | | |
| Type | | Number of
Contracts
Long (Short) | | | Expiration
Date | | Current
Value | | | Unrealized
Gain (Loss) | |
Russell 2000 Mini Index | | | (11 | ) | | March 2016 | | $ | (1,244,650 | ) | | $ | (1,460 | ) |
S&P 500 E-Mini Index | | | (122 | ) | | March 2016 | | | (12,415,940 | ) | | | (5,706 | ) |
| TOTAL | | | | | | | | | | | | $ | (7,166 | ) |
| | |
| 50 | | The accompanying notes are an integral part of these financial statements. |
GOLDMAN SACHS INTERNATIONAL TAX-MANAGED EQUITY FUND
Schedule of Investments
December 31, 2015
| | | | | | | | |
| Shares | | | Description | | Value | |
| | Common Stocks – 98.7% | |
| | Australia – 6.0% | |
| | 39,279 | | | Australian Pharmaceutical Industries Ltd. (Health Care Equipment & Services) | | $ | 55,026 | |
| | 6,131 | | | Blackmores Ltd. (Household & Personal Products) | | | 969,437 | |
| | 36,540 | | | BT Investment Management Ltd. (Diversified Financials) | | | 339,830 | |
| | 75,536 | | | Caltex Australia Ltd. (Energy) | | | 2,064,680 | |
| | 88,980 | | | Coca-Cola Amatil Ltd. (Food, Beverage & Tobacco) | | | 599,987 | |
| | 33,790 | | | Domino’s Pizza Enterprises Ltd. (Consumer Services) | | | 1,409,835 | |
| | 4,830 | | | Event Hospitality and Entertainment Ltd. (Media) | | | 57,771 | |
| | 23,321 | | | Harvey Norman Holdings Ltd. (Retailing) | | | 70,498 | |
| | 32,645 | | | Japara Healthcare Ltd. (Health Care Equipment & Services) | | | 75,708 | |
| | 14,587 | | | Macquarie Group Ltd. (Diversified Financials) | | | 872,638 | |
| | 59,365 | | | Magellan Financial Group Ltd. (Diversified Financials) | | | 1,166,832 | |
| | 161,099 | | | Newcrest Mining Ltd. (Materials)* | | | 1,524,354 | |
| | 22,980 | | | nib holdings Ltd. (Insurance) | | | 58,631 | |
| | 120,547 | | | Nufarm Ltd. (Materials) | | | 728,017 | |
| | 15,845 | | | Platinum Asset Management Ltd. (Diversified Financials) | | | 92,589 | |
| | 26,605 | | | Premier Investments Ltd. (Retailing) | | | 273,160 | |
| | 1,539,363 | | | Qantas Airways Ltd. (Transportation)* | | | 4,562,781 | |
| | 38,948 | | | Ramsay Health Care Ltd. (Health Care Equipment & Services) | | | 1,915,159 | |
| | 20,300 | | | SAI Global Ltd. (Commercial & Professional Services) | | | 61,571 | |
| | 405,015 | | | Scentre Group (REIT) | | | 1,228,470 | |
| | 22,371 | | | Sonic Healthcare Ltd. (Health Care Equipment & Services) | | | 289,641 | |
| | 42,096 | | | The Star Entertainment Grp Ltd. (Consumer Services) | | | 154,469 | |
| | 468,658 | | | Treasury Wine Estates Ltd. (Food, Beverage & Tobacco) | | | 2,813,889 | |
| | 90,681 | | | Westpac Banking Corp. (Banks) | | | 2,198,087 | |
| | 64,429 | | | Woodside Petroleum Ltd. (Energy) | | | 1,342,311 | |
| | 57,584 | | | Woolworths Ltd. (Food & Staples Retailing) | | | 1,021,685 | |
| | | | | | | | |
| | | | | | | 25,947,056 | |
| | |
| | Austria – 0.0% | | | | |
| | 8,273 | | | Austria Technologie & Systemtechnik AG (Technology Hardware & Equipment) | | | 130,575 | |
| | |
| | Belgium – 1.2% | | | | |
| | 6,916 | | | Anheuser-Busch InBev NV (Food, Beverage & Tobacco) | | | 860,677 | |
| | 10,187 | | | Delhaize Group (Food & Staples Retailing) | | | 991,466 | |
| | 2,028 | | | Intervest Offices & Warehouses NV (REIT)* | | | 53,575 | |
| | |
| | Common Stocks – (continued) | |
| | Belgium – (continued) | |
| | 51,060 | | | KBC Groep NV (Banks) | | $ | 3,192,586 | |
| | 2,439 | | | Tessenderlo Chemie NV (Materials)* | | | 72,848 | |
| | 836 | | | Van de Velde NV (Consumer Durables & Apparel) | | | 57,025 | |
| | | | | | | | |
| | | | | | | 5,228,177 | |
| | |
| | Bermuda – 0.1% | | | | |
| | 23,279 | | | Frontline Ltd. (Energy) | | | 66,759 | |
| | 13,862 | | | Hiscox Ltd. (Insurance) | | | 214,907 | |
| | | | | | | | |
| | | | | | | 281,666 | |
| | |
| | China – 0.3% | | | | |
| | 64,000 | | | AAC Technologies Holdings, Inc. (Technology Hardware & Equipment) | | | 416,343 | |
| | 1,703,000 | | | FIH Mobile Ltd. (Technology Hardware & Equipment) | | | 648,128 | |
| | | | | | | | |
| | | | | | | 1,064,471 | |
| | |
| | Denmark – 1.2% | | | | |
| | 6,024 | | | Chr. Hansen Holding A/S (Materials) | | | 376,804 | |
| | 9,877 | | | GN Store Nord A/S (Health Care Equipment & Services) | | | 179,252 | |
| | 5,510 | | | Novo Nordisk A/S Class B (Pharmaceuticals, Biotechnology & Life Sciences) | | | 319,019 | |
| | 8,582 | | | Pandora A/S (Consumer Durables & Apparel) | | | 1,082,052 | |
| | 2,963 | | | Royal Unibrew A/S (Food, Beverage & Tobacco) | | | 120,421 | |
| | 45,818 | | | Vestas Wind Systems A/S (Capital Goods) | | | 3,199,874 | |
| | | | | | | | |
| | | | | | | 5,277,422 | |
| | |
| | Finland – 0.9% | | | | |
| | 75,406 | | | Neste OYJ (Energy) | | | 2,250,560 | |
| | 87,694 | | | UPM-Kymmene OYJ (Materials) | | | 1,628,067 | |
| | | | | | | | |
| | | | | | | 3,878,627 | |
| | |
| | France – 12.1% | | | | |
| | 162,343 | | | AXA SA (Insurance) | | | 4,435,791 | |
| | 76,078 | | | BNP Paribas SA (Banks) | | | 4,304,290 | |
| | 1,636 | | | Cap Gemini SA (Software & Services) | | | 151,797 | |
| | 13,517 | | | Christian Dior SE (Consumer Durables & Apparel) | | | 2,296,030 | |
| | 24,525 | | | Compagnie Generale des Etablissements Michelin Class B (Automobiles & Components) | | | 2,334,353 | |
| | 134,669 | | | Credit Agricole SA (Banks) | | | 1,586,959 | |
| | 3,936 | | | Gecina SA (REIT) | | | 478,506 | |
| | 27,595 | | | Klepierre (REIT) | | | 1,226,592 | |
| | 54,053 | | | Legrand SA (Capital Goods) | | | 3,057,523 | |
| | 174,492 | | | Natixis SA (Banks) | | | 987,117 | |
| | 127,845 | | | Orange SA (Telecommunication Services) | | | 2,138,301 | |
| | 163,669 | | | Peugeot SA (Automobiles & Components)* | | | 2,868,941 | |
| | 33,276 | | | Renault SA (Automobiles & Components) | | | 3,330,778 | |
| | |
| | |
| The accompanying notes are an integral part of these financial statements. | | 51 |
GOLDMAN SACHS INTERNATIONAL TAX-MANAGED EQUITY FUND
Schedule of Investments (continued)
December 31, 2015
| | | | | | | | |
| Shares | | | Description | | Value | |
| | Common Stocks – (continued) | |
| | France – (continued) | |
| | 34,456 | | | Safran SA (Capital Goods) | | $ | 2,367,223 | |
| | 24,451 | | | Sanofi (Pharmaceuticals, Biotechnology & Life Sciences) | | | 2,083,758 | |
| | 74,067 | | | SCOR SE (Insurance) | | | 2,771,420 | |
| | 3,988 | | | SEB SA (Consumer Durables & Apparel) | | | 409,413 | |
| | 8,999 | | | Societe BIC SA (Commercial & Professional Services) | | | 1,480,830 | |
| | 81,883 | | | Societe Generale SA (Banks) | | | 3,773,345 | |
| | 41,297 | | | Thales SA (Capital Goods) | | | 3,091,069 | |
| | 13,239 | | | UBISOFT Entertainment (Software & Services)* | | | 383,151 | |
| | 19,074 | | | Valeo SA (Automobiles & Components) | | | 2,940,728 | |
| | 56,426 | | | Vinci SA (Capital Goods) | | | 3,616,611 | |
| | | | | | | | |
| | | | | | | 52,114,526 | |
| | |
| | Germany – 8.8% | | | | |
| | 118,950 | | | ADVA Optical Networking SE (Technology Hardware & Equipment)* | | | 1,436,270 | |
| | 29,534 | | | Allianz SE (Registered) (Insurance) | | | 5,206,196 | |
| | 15,296 | | | Bayer AG (Registered) (Pharmaceuticals, Biotechnology & Life Sciences) | | | 1,910,323 | |
| | 12,606 | | | Continental AG (Automobiles & Components) | | | 3,049,517 | |
| | 5,878 | | | CTS Eventim AG & Co. KGaA (Media) | | | 233,059 | |
| | 594 | | | Daimler AG (Registered) (Automobiles & Components) | | | 49,631 | |
| | 259,148 | | | Deutsche Telekom AG (Registered) (Telecommunication Services) | | | 4,654,467 | |
| | 22,764 | | | Drillisch AG (Telecommunication Services) | | | 957,692 | |
| | 47,591 | | | Freenet AG (Telecommunication Services) | | | 1,605,951 | |
| | 3,968 | | | Fresenius Medical Care AG & Co. KGaA (Health Care Equipment & Services) | | | 333,449 | |
| | 52,655 | | | Fresenius SE & Co. KGaA (Health Care Equipment & Services) | | | 3,750,734 | |
| | 25,975 | | | Hannover Rueck SE (Insurance) | | | 2,966,073 | |
| | 706 | | | Henkel AG & Co. KGaA (Household & Personal Products) | | | 67,531 | |
| | 21,679 | | | Hochtief AG (Capital Goods) | | | 2,010,674 | |
| | 76,877 | | | Infineon Technologies AG (Semiconductors & Semiconductor Equipment) | | | 1,120,768 | |
| | 1,971 | | | KUKA AG (Capital Goods)(a) | | | 176,377 | |
| | 11,550 | | | Merck KGaA (Pharmaceuticals, Biotechnology & Life Sciences) | | | 1,118,281 | |
| | 19,234 | | | Muenchener Rueckversicherungs-Gesellschaft AG (Registered) (Insurance) | | | 3,832,127 | |
| | 4,248 | | | Nemetschek AG (Software & Services) | | | 210,859 | |
| | 24,382 | | | Nordex SE (Capital Goods)* | | | 856,346 | |
| | 14,461 | | | ProSiebenSat.1 Media SE (Registered) (Media) | | | 729,577 | |
| | 2,048 | | | STRATEC Biomedical AG (Health Care Equipment & Services) | | | 135,159 | |
| | |
| | Common Stocks – (continued) | |
| | Germany – (continued) | |
| | 13,751 | | | Symrise AG (Materials) | | $ | 910,295 | |
| | 8,620 | | | United Internet AG (Registered) (Software & Services) | | | 473,920 | |
| | 949 | | | XING AG (Software & Services) | | | 175,125 | |
| | | | | | | | |
| | | | | | | 37,970,401 | |
| | |
| | Hong Kong – 3.3% | | | | |
| | 168,000 | | | AIA Group Ltd. (Insurance) | | | 1,003,814 | |
| | 683,500 | | | BOC Hong Kong Holdings Ltd. (Banks) | | | 2,079,905 | |
| | 115,000 | | | Cheung Kong Infrastructure Holdings Ltd. (Utilities) | | | 1,062,471 | |
| | 191,464 | | | Cheung Kong Property Holdings Ltd. (Real Estate) | | | 1,238,578 | |
| | 852,000 | | | China Travel International Investment Hong Kong Ltd. (Consumer Services) | | | 356,345 | |
| | 116,964 | | | CK Hutchison Holdings Ltd. (Capital Goods) | | | 1,572,222 | |
| | 366,500 | | | CLP Holdings Ltd. (Utilities) | | | 3,106,456 | |
| | 130,000 | | | Giordano International Ltd. (Retailing) | | | 60,722 | |
| | 16,100 | | | Hang Seng Bank Ltd. (Banks) | | | 305,149 | |
| | 552,970 | | | Hong Kong & China Gas Co. Ltd. (Utilities) | | | 1,082,185 | |
| | 1,100 | | | Jardine Matheson Holdings Ltd. (Capital Goods) | | | 53,383 | |
| | 590,000 | | | Sino Land Co. Ltd. (Real Estate) | | | 859,486 | |
| | 297,000 | | | Sun Hung Kai & Co. Ltd. (Diversified Financials) | | | 194,438 | |
| | 28,000 | | | Swire Pacific Ltd. Class A (Real Estate) | | | 312,763 | |
| | 32,000 | | | Wheelock & Co. Ltd. (Real Estate) | | | 134,278 | |
| | 191,500 | | | Yue Yuen Industrial Holdings Ltd. (Consumer Durables & Apparel) | | | 648,710 | |
| | | | | | | | |
| | | | | | | 14,070,905 | |
| | |
| | Ireland – 0.4% | | | | |
| | 24,922 | | | Shire PLC (Pharmaceuticals, Biotechnology & Life Sciences) | | | 1,709,834 | |
| | 41,047 | | | Total Produce PLC (Food & Staples Retailing)(a) | | | 65,573 | |
| | | | | | | | |
| | | | | | | 1,775,407 | |
| | |
| | Israel – 0.0% | | | | |
| | 6,854 | | | Mizrahi Tefahot Bank Ltd. (Banks) | | | 81,861 | |
| | |
| | Italy – 1.8% | | | | |
| | 13,721 | | | ACEA SpA (Utilities) | | | 210,983 | |
| | 6,147 | | | ASTM SpA (Transportation) | | | 77,157 | |
| | 625,813 | | | Banca Popolare di Milano Scarl (Banks) | | | 619,844 | |
| | 3,686 | | | DiaSorin SpA (Health Care Equipment & Services) | | | 193,594 | |
| | 27,209 | | | Enel SpA (Utilities) | | | 114,095 | |
| | 1,626 | | | Exor SpA (Diversified Financials) | | | 73,799 | |
| | 59,332 | | | Finmeccanica SpA (Capital Goods)* | | | 824,968 | |
| | 257,892 | | | Intesa Sanpaolo SpA RNC (Banks) | | | 787,792 | |
| | 862,061 | | | Intesa Sanpaolo SpA (Banks) | | | 2,862,905 | |
| | 157,321 | �� | | Iren SpA (Utilities) | | | 253,878 | |
| | 10,076 | | | La Doria SpA (Food, Beverage & Tobacco) | | | 142,661 | |
| | |
| | |
| 52 | | The accompanying notes are an integral part of these financial statements. |
GOLDMAN SACHS INTERNATIONAL TAX-MANAGED EQUITY FUND
| | | | | | | | |
| Shares | | | Description | | Value | |
| | Common Stocks – (continued) | |
| | Italy – (continued) | |
| | 131,653 | | | Mediaset SpA (Media) | | $ | 545,556 | |
| | 3,444 | | | Recordati SpA (Pharmaceuticals, Biotechnology & Life Sciences) | | | 89,857 | |
| | 190,599 | | | Saras SpA (Energy)*(a) | | | 367,525 | |
| | 135,322 | | | UniCredit SpA (Banks) | | | 748,153 | |
| | | | | | | | |
| | | | | | | 7,912,767 | |
| | |
| | Japan – 26.2% | | | | |
| | 37,700 | | | AEON Financial Service Co. Ltd. (Diversified Financials) | | | 842,170 | |
| | 2,800 | | | Aisin Seiki Co. Ltd. (Automobiles & Components) | | | 120,507 | |
| | 92,000 | | | Ajinomoto Co., Inc. (Food, Beverage & Tobacco) | | | 2,178,167 | |
| | 70,900 | | | Alfresa Holdings Corp. (Health Care Equipment & Services) | | | 1,400,296 | |
| | 16,300 | | | Alps Electric Co. Ltd. (Technology Hardware & Equipment) | | | 442,024 | |
| | 21,000 | | | Amada Holdings Co. Ltd. (Capital Goods) | | | 200,396 | |
| | 21,600 | | | Amano Corp. (Technology Hardware & Equipment) | | | 292,154 | |
| | 15,400 | | | AOC Holdings, Inc. (Energy)* | | | 44,984 | |
| | 63,200 | | | Asahi Group Holdings Ltd. (Food, Beverage & Tobacco) | | | 1,978,439 | |
| | 5,700 | | | ASKA Pharmaceutical Co. Ltd. (Pharmaceuticals, Biotechnology & Life Sciences) | | | 70,206 | |
| | 256,100 | | | Astellas Pharma, Inc. (Pharmaceuticals, Biotechnology & Life Sciences) | | | 3,645,779 | |
| | 14,400 | | | Bandai Namco Holdings, Inc. (Consumer Durables & Apparel) | | | 304,231 | |
| | 32,000 | | | Calbee, Inc. (Food, Beverage & Tobacco) | | | 1,351,329 | |
| | 4,200 | | | Central Japan Railway Co. (Transportation) | | | 745,643 | |
| | 1,900 | | | Century Tokyo Leasing Corp. (Diversified Financials) | | | 67,871 | |
| | 27,100 | | | Chubu Electric Power Co., Inc. (Utilities) | | | 371,100 | |
| | 17,000 | | | Daihen Corp. (Capital Goods) | | | 80,052 | |
| | 157,800 | | | Daiichi Sankyo Co. Ltd. (Pharmaceuticals, Biotechnology & Life Sciences) | | | 3,256,946 | |
| | 3,740 | | | Daito Pharmaceutical Co. Ltd. (Pharmaceuticals, Biotechnology & Life Sciences) | | | 107,654 | |
| | 118,500 | | | Daiwa House Industry Co. Ltd. (Real Estate) | | | 3,406,443 | |
| | 41,000 | | | Daiwa Securities Group, Inc. (Diversified Financials) | | | 250,661 | |
| | 4,000 | | | Electric Power Development Co. Ltd. (Utilities) | | | 142,467 | |
| | 4,700 | | | Falco Holdings Co., Ltd. (Health Care Equipment & Services) | | | 57,279 | |
| | 77,700 | | | Fuji Heavy Industries Ltd. (Automobiles & Components) | | | 3,200,951 | |
| | |
| | Common Stocks – (continued) | |
| | Japan – (continued) | |
| | 71,700 | | | FUJIFILM Holdings Corp. (Technology Hardware & Equipment) | | $ | 2,992,220 | |
| | 1,100 | | | Fuyo General Lease Co. Ltd. (Diversified Financials) | | | 51,802 | |
| | 3,200 | | | Hiday Hidaka Corp. (Consumer Services) | | | 91,917 | |
| | 2,800 | | | HIS Co. Ltd. (Consumer Services) | | | 93,531 | |
| | 13,000 | | | Hisamitsu Pharmaceutical Co., Inc. (Pharmaceuticals, Biotechnology & Life Sciences) | | | 545,776 | |
| | 7,000 | | | Hokuriku Electric Power Co. (Utilities) | | | 103,449 | |
| | 26,100 | | | Honda Motor Co. Ltd. (Automobiles & Components) | | | 834,196 | |
| | 58,100 | | | Hoya Corp. (Health Care Equipment & Services) | | | 2,375,859 | |
| | 3,500 | | | Ibiden Co. Ltd. (Technology Hardware & Equipment)(a) | | | 50,177 | |
| | 37,000 | | | Iida Group Holdings Co. Ltd. (Consumer Durables & Apparel) | | | 685,758 | |
| | 50,900 | | | Isuzu Motors Ltd. (Automobiles & Components) | | | 548,327 | |
| | 35,200 | | | IT Holdings Corp. (Software & Services) | | | 804,279 | |
| | 252,400 | | | ITOCHU Corp. (Capital Goods) | | | 2,985,501 | |
| | 17,200 | | | J. Front Retailing Co. Ltd. (Retailing) | | | 250,047 | |
| | 75,700 | | | Japan Airlines Co. Ltd. (Transportation) | | | 2,709,523 | |
| | 17,800 | | | Japan Exchange Group, Inc. (Diversified Financials) | | | 278,246 | |
| | 10,200 | | | JTEKT Corp. (Capital Goods) | | | 166,955 | |
| | 415,400 | | | JX Holdings, Inc. (Energy) | | | 1,743,468 | |
| | 16,700 | | | Kaken Pharmaceutical Co. Ltd. (Pharmaceuticals, Biotechnology & Life Sciences) | | | 1,141,164 | |
| | 30,200 | | | Kao Corp. (Household & Personal Products) | | | 1,551,940 | |
| | 99,300 | | | KDDI Corp. (Telecommunication Services) | | | 2,578,840 | |
| | 27,000 | | | Kinden Corp. (Capital Goods) | | | 344,279 | |
| | 89,000 | | | Kirin Holdings Co. Ltd. (Food, Beverage & Tobacco) | | | 1,208,366 | |
| | 36,900 | | | Konami Holdings Corp. (Software & Services) | | | 878,388 | |
| | 15,000 | | | Konica Minolta, Inc. (Technology Hardware & Equipment) | | | 150,228 | |
| | 3,900 | | | K’s Holdings Corp. (Retailing) | | | 132,802 | |
| | 4,000 | | | Kusuri No Aoki Co. Ltd. (Food & Staples Retailing) | | | 195,243 | |
| | 3,480 | | | Kyoritsu Maintenance Co. Ltd. (Consumer Services) | | | 298,444 | |
| | 28,300 | | | Kyushu Electric Power Co., Inc. (Utilities)* | | | 308,445 | |
| | 8,800 | | | Marvelous, Inc. (Software & Services)(a) | | | 66,946 | |
| | 18,300 | | | Matsumotokiyoshi Holdings Co. Ltd. (Food & Staples Retailing) | | | 933,825 | |
| | 156,100 | | | Mitsubishi Tanabe Pharma Corp. (Pharmaceuticals, Biotechnology & Life Sciences) | | | 2,689,390 | |
| | |
| | |
| The accompanying notes are an integral part of these financial statements. | | 53 |
GOLDMAN SACHS INTERNATIONAL TAX-MANAGED EQUITY FUND
Schedule of Investments (continued)
December 31, 2015
| | | | | | | | |
| Shares | | | Description | | Value | |
| | Common Stocks – (continued) | |
| | Japan – (continued) | |
| | 520,900 | | | Mitsubishi UFJ Financial Group, Inc. (Banks) | | $ | 3,226,584 | |
| | 42,300 | | | Mitsubishi UFJ Lease & Finance Co. Ltd. (Diversified Financials) | | | 217,686 | |
| | 1,748,600 | | | Mizuho Financial Group, Inc. (Banks) | | | 3,497,201 | |
| | 2,500 | | | Mochida Pharmaceutical Co. Ltd. (Pharmaceuticals, Biotechnology & Life Sciences) | | | 177,160 | |
| | 91,600 | | | MS&AD Insurance Group Holdings, Inc. (Insurance) | | | 2,686,140 | |
| | 35,700 | | | Nexon Co. Ltd. (Software & Services) | | | 580,758 | |
| | 24,000 | | | Nichirei Corp. (Food, Beverage & Tobacco) | | | 176,840 | |
| | 517,000 | | | Nippon Electric Glass Co. Ltd. (Technology Hardware & Equipment) | | | 2,605,769 | |
| | 171,000 | | | Nippon Express Co. Ltd. (Transportation) | | | 803,568 | |
| | 53,200 | | | Nippon Telegraph & Telephone Corp. (Telecommunication Services) | | | 2,117,260 | |
| | 252,700 | | | Nissan Motor Co. Ltd. (Automobiles & Components) | | | 2,645,957 | |
| | 15,800 | | | Nomura Research Institute Ltd. (Software & Services) | | | 606,780 | |
| | 5,000 | | | NS Solutions Corp. (Software & Services) | | | 113,929 | |
| | 22,500 | | | NTT Data Corp. (Software & Services) | | | 1,087,788 | |
| | 7,500 | | | Otsuka Holdings Co. Ltd. (Pharmaceuticals, Biotechnology & Life Sciences) | | | 266,467 | |
| | 12,000 | | | PanaHome Corp. (Consumer Durables & Apparel) | | | 90,657 | |
| | 19,000 | | | Riken Corp. (Automobiles & Components) | | | 66,824 | |
| | 6,000 | | | Riso Kagaku Corp. (Technology Hardware & Equipment) | | | 97,680 | |
| | 10,000 | | | Ryosan Co. Ltd. (Technology Hardware & Equipment) | | | 256,706 | |
| | 6,000 | | | SAMTY Co. Ltd. (Real Estate) | | | 62,564 | |
| | 10,000 | | | San-Ai Oil Co. Ltd. (Energy) | | | 81,545 | |
| | 6,800 | | | Sangetsu Co. Ltd. (Consumer Durables & Apparel) | | | 124,117 | |
| | 37,500 | | | Santen Pharmaceutical Co. Ltd. (Pharmaceuticals, Biotechnology & Life Sciences) | | | 617,378 | |
| | 71,400 | | | Seiko Epson Corp. (Technology Hardware & Equipment) | | | 1,099,500 | |
| | 51,800 | | | Sekisui Chemical Co. Ltd. (Consumer Durables & Apparel) | | | 676,315 | |
| | 190,900 | | | Sekisui House Ltd. (Consumer Durables & Apparel) | | | 3,209,746 | |
| | 28,900 | | | Seven & I Holdings Co. Ltd. (Food & Staples Retailing) | | | 1,323,174 | |
| | 16,700 | | | Shinko Electric Industries Co. Ltd. (Semiconductors & Semiconductor Equipment) | | | 107,061 | |
| | 57,200 | | | Shionogi & Co. Ltd. (Pharmaceuticals, Biotechnology & Life Sciences) | | | 2,587,169 | |
| | |
| | Common Stocks – (continued) | |
| | Japan – (continued) | |
| | 12,100 | | | SoftBank Group Corp. (Telecommunication Services) | | $ | 610,692 | |
| | 90,900 | | | Sompo Japan Nipponkoa Holdings, Inc. (Insurance) | | | 2,984,674 | |
| | 9,900 | | | Space Co. Ltd. (Commercial & Professional Services) | | | 112,860 | |
| | 43,500 | | | Sumitomo Corp. (Capital Goods) | | | 443,497 | |
| | 81,700 | | | Sumitomo Dainippon Pharma Co. Ltd. (Pharmaceuticals, Biotechnology & Life Sciences) | | | 962,545 | |
| | 39,400 | | | Sumitomo Electric Industries Ltd. (Automobiles & Components) | | | 556,361 | |
| | 14,300 | | | Sumitomo Forestry Co. Ltd. (Consumer Durables & Apparel) | | | 192,951 | |
| | 78,800 | | | Sumitomo Mitsui Financial Group, Inc. (Banks) | | | 2,973,995 | |
| | 202,000 | | | Sumitomo Mitsui Trust Holdings, Inc. (Banks) | | | 765,041 | |
| | 8,800 | | | Systena Corp. (Software & Services) | | | 103,526 | |
| | 8,500 | | | T&D Holdings, Inc. (Insurance) | | | 112,145 | |
| | 5,000 | | | Takeda Pharmaceutical Co. Ltd. (Pharmaceuticals, Biotechnology & Life Sciences) | | | 249,297 | |
| | 775,000 | | | Teijin Ltd. (Materials) | | | 2,641,097 | |
| | 10,500 | | | Temp Holdings Co. Ltd. (Commercial & Professional Services) | | | 162,757 | |
| | 7,800 | | | The Chugoku Electric Power Co., Inc. (Utilities) | | | 102,986 | |
| | 28,200 | | | The Dai-ichi Life Insurance Co. Ltd. (Insurance) | | | 469,183 | |
| | 6,100 | | | The Kansai Electric Power Co., Inc. (Utilities)* | | | 73,138 | |
| | 4,800 | | | Toho Holdings Co. Ltd. (Health Care Equipment & Services) | | | 116,677 | |
| | 33,200 | | | Tohoku Electric Power Co., Inc. (Utilities) | | | 415,044 | |
| | 700 | | | Token Corp. (Consumer Durables & Apparel) | | | 54,030 | |
| | 69,400 | | | Tokio Marine Holdings, Inc. (Insurance) | | | 2,680,549 | |
| | 21,300 | | | Tokyo Electron Ltd. (Semiconductors & Semiconductor Equipment) | | | 1,290,457 | |
| | 9,000 | | | Tokyo Tatemono Co. Ltd. (Real Estate) | | | 97,954 | |
| | 12,000 | | | Tokyo Tekko Co. Ltd. (Materials) | | | 53,584 | |
| | 277,000 | | | Toppan Printing Co. Ltd. (Commercial & Professional Services) | | | 2,552,047 | |
| | 13,200 | | | Tosei Corp. (Real Estate) | | | 83,277 | |
| | 26,800 | | | Toyota Motor Corp. (Automobiles & Components) | | | 1,650,318 | |
| | 2,900 | | | Wacom Co. Ltd. (Technology Hardware & Equipment)(a) | | | 11,547 | |
| | 45,200 | | | West Japan Railway Co. (Transportation) | | | 3,124,361 | |
| | 301,300 | | | Yamada Denki Co. Ltd. (Retailing) | | | 1,301,474 | |
| | 33,700 | | | Yamaha Motor Co. Ltd. (Automobiles & Components) | | | 755,396 | |
| | 5,200 | | | Yusen Logistics Co. Ltd. (Transportation) | | | 69,421 | |
| | | | | | | | |
| | | | | | | 113,330,284 | |
| | |
| | |
| 54 | | The accompanying notes are an integral part of these financial statements. |
GOLDMAN SACHS INTERNATIONAL TAX-MANAGED EQUITY FUND
| | | | | | | | |
| Shares | | | Description | | Value | |
| | Common Stocks – (continued) | |
| | Jordan – 0.5% | | | | |
| | 65,791 | | | Hikma Pharmaceuticals PLC (Pharmaceuticals, Biotechnology & Life Sciences) | | $ | 2,230,281 | |
| | |
| | Luxembourg – 0.2% | | | | |
| | 14,441 | | | Aperam (Materials)* | | | 513,449 | |
| | 79,221 | | | Regus PLC (Commercial & Professional Services) | | | 389,258 | |
| | | | | | | | |
| | | | | | | 902,707 | |
| | |
| | Netherlands – 3.4% | | | | |
| | 12,145 | | | Corbion NV (Food, Beverage & Tobacco) | | | 294,049 | |
| | 35,387 | | | Heineken Holding NV (Food, Beverage & Tobacco) | | | 2,724,329 | |
| | 29,531 | | | Heineken NV (Food, Beverage & Tobacco) | | | 2,516,542 | |
| | 325,458 | | | ING Groep NV CVA (Banks)(b) | | | 4,403,459 | |
| | 59,257 | | | Koninklijke Ahold NV (Food & Staples Retailing) | | | 1,249,934 | |
| | 4,705 | | | NXP Semiconductors NV (Semiconductors & Semiconductor Equipment)* | | | 396,396 | |
| | 77 | | | Royal Dutch Shell PLC Class A (Energy) | | | 1,756 | |
| | 87,149 | | | Wolters Kluwer NV (Media) | | | 2,926,772 | |
| | | | | | | | |
| | | | | | | 14,513,237 | |
| | |
| | New Zealand – 0.5% | | | | |
| | 144,409 | | | Fisher & Paykel Healthcare Corp. Ltd. (Health Care Equipment & Services) | | | 877,893 | |
| | 76,291 | | | Nuplex Industries Ltd. (Materials) | | | 247,590 | |
| | 36,839 | | | The New Zealand Refining Co. Ltd. (Energy) | | | 94,485 | |
| | 157,069 | | | Z Energy Ltd. (Energy) | | | 725,230 | |
| | | | | | | | |
| | | | | | | 1,945,198 | |
| | |
| | Norway – 2.4% | | | | |
| | 6,860 | | | DNB ASA (Banks) | | | 84,524 | |
| | 47,005 | | | Gjensidige Forsikring ASA (Insurance) | | | 752,321 | |
| | 4,535 | | | Leroy Seafood Group ASA (Food, Beverage & Tobacco) | | | 168,570 | |
| | 348,534 | | | Norsk Hydro ASA (Materials) | | | 1,295,536 | |
| | 334,352 | | | Orkla ASA (Food, Beverage & Tobacco) | | | 2,637,677 | |
| | 188,788 | | | Statoil ASA (Energy)(a) | | | 2,632,984 | |
| | 10,324 | | | Tomra Systems ASA (Commercial & Professional Services) | | | 111,181 | |
| | 63,661 | | | Yara International ASA (Materials) | | | 2,737,949 | |
| | | | | | | | |
| | | | | | | 10,420,742 | |
| | |
| | Portugal – 0.0% | | | | |
| | 16,846 | | | Altri SGPS SA (Materials) | | | 87,197 | |
| | |
| | Singapore – 0.5% | | | | |
| | 55,604 | | | DBS Group Holdings Ltd. (Banks) | | | 651,651 | |
| | 3,000 | | | Jardine Cycle & Carriage Ltd. (Retailing) | | | 73,342 | |
| | |
| | Common Stocks – (continued) | |
| | Singapore – (continued) | |
| | 145,100 | | | SATS Ltd. (Transportation) | | $ | 392,471 | |
| | 120,000 | | | Singapore Telecommunications Ltd. (Telecommunication Services) | | | 309,392 | |
| | 69,000 | | | UOL Group Ltd. (Real Estate) | | | 302,403 | |
| | 46,600 | | | Venture Corp. Ltd. (Technology Hardware & Equipment) | | | 269,169 | |
| | | | | | | | |
| | | | | | | 1,998,428 | |
| | |
| | South Africa – 0.6% | | | | |
| | 142,310 | | | Mondi PLC (Materials) | | | 2,789,381 | |
| | |
| | Spain – 4.5% | | | | |
| | 2,482 | | | ACS Actividades de Construccion y Servicios SA (Capital Goods) | | | 72,617 | |
| | 79,785 | | | Amadeus IT Holding SA Class A (Software & Services) | | | 3,516,496 | |
| | 628,923 | | | Banco Santander SA (Banks) | | | 3,093,906 | |
| | 7,739 | | | Bankinter SA (Banks) | | | 54,880 | |
| | 132,494 | | | Endesa SA (Utilities) | | | 2,661,758 | |
| | 72,980 | | | Ferrovial SA (Capital Goods) | | | 1,650,313 | |
| | 162,233 | | | Gamesa Corp. Tecnologica SA (Capital Goods) | | | 2,777,423 | |
| | 16,399 | | | Grifols SA (Pharmaceuticals, Biotechnology & Life Sciences) | | | 757,991 | |
| | 93,447 | | | Iberdrola SA (Utilities) | | | 662,443 | |
| | 109,864 | | | Industria de Diseno Textil SA (Retailing) | | | 3,774,282 | |
| | 23,745 | | | Mediaset Espana Comunicacion SA (Media) | | | 258,341 | |
| | 13,785 | | | Papeles y Cartones de Europa SA (Materials) | | | 77,658 | |
| | | | | | | | |
| | | | | | | 19,358,108 | |
| | |
| | Sweden – 1.6% | | | | |
| | 10,347 | | | Atlas Copco AB (Capital Goods) | | | 237,882 | |
| | 25,717 | | | Axfood AB (Food & Staples Retailing) | | | 445,424 | |
| | 17,561 | | | BillerudKorsnas AB (Materials) | | | 324,995 | |
| | 28,989 | | | Fastighets AB Balder Class B (Real Estate)* | | | 713,673 | |
| | 42,710 | | | Intrum Justitia AB (Commercial & Professional Services) | | | 1,453,323 | |
| | 31,635 | | | Nordea Bank AB (Banks) | | | 347,092 | |
| | 2,133 | | | Svenska Cellulosa AB SCA Class A (Household & Personal Products) | | | 61,786 | |
| | 80,348 | | | Swedish Match AB (Food, Beverage & Tobacco) | | | 2,839,290 | |
| | 8,097 | | | Vitrolife AB (Pharmaceuticals, Biotechnology & Life Sciences) | | | 275,352 | |
| | | | | | | | |
| | | | | | | 6,698,817 | |
| | |
| | Switzerland – 7.1% | | | | |
| | 23,423 | | | Actelion Ltd. (Registered) (Pharmaceuticals, Biotechnology & Life Sciences)* | | | 3,254,477 | |
| | 43,672 | | | Adecco SA (Registered) (Commercial & Professional Services)* | | | 2,989,031 | |
| | 1,906 | | | Autoneum Holding AG (Automobiles & Components)* | | | 383,781 | |
| | |
| | |
| The accompanying notes are an integral part of these financial statements. | | 55 |
GOLDMAN SACHS INTERNATIONAL TAX-MANAGED EQUITY FUND
Schedule of Investments (continued)
December 31, 2015
| | | | | | | | |
| Shares | | | Description | | Value | |
| | Common Stocks – (continued) | |
| | Switzerland – (continued) | |
| | 4,801 | | | Baloise Holding AG (Registered) (Insurance) | | $ | 608,471 | |
| | 745 | | | Banque Cantonale Vaudoise (Registered) (Banks)* | | | 472,639 | |
| | 3,776 | | | Basilea Pharmaceutica AG (Registered) (Pharmaceuticals, Biotechnology & Life Sciences)* | | | 363,028 | |
| | 24 | | | Chocoladefabriken Lindt & Spruengli AG (Registered) (Food, Beverage & Tobacco)* | | | 1,788,019 | |
| | 712 | | | dorma+kaba Holding AG (Registered) Class B (Commercial & Professional Services)* | | | 483,541 | |
| | 3,524 | | | EMS-Chemie Holding AG (Registered) (Materials) | | | 1,550,902 | |
| | 1,006 | | | Flughafen Zuerich AG (Registered) (Transportation) | | | 754,814 | |
| | 428 | | | Forbo Holding AG (Registered) (Consumer Durables & Apparel)* | | | 503,918 | |
| | 5,140 | | | Geberit AG (Registered) (Capital Goods) | | | 1,740,932 | |
| | 20,071 | | | Lonza Group AG (Registered) (Pharmaceuticals, Biotechnology & Life Sciences)* | | | 3,264,245 | |
| | 9,857 | | | Nestle SA (Registered) (Food, Beverage & Tobacco) | | | 731,737 | |
| | 14,028 | | | Novartis AG (Registered) (Pharmaceuticals, Biotechnology & Life Sciences) | | | 1,206,678 | |
| | 2,475 | | | Partners Group Holding AG (Diversified Financials) | | | 890,095 | |
| | 10,955 | | | Roche Holding AG (Pharmaceuticals, Biotechnology & Life Sciences) | | | 3,035,723 | |
| | 40,237 | | | Swiss Re AG (Insurance) | | | 3,929,799 | |
| | 139 | | | Vaudoise Assurances Holding SA (Insurance) | | | 72,026 | |
| | 51,650 | | | Wolseley PLC (Capital Goods) | | | 2,805,261 | |
| | | | | | | | |
| | | | | | | 30,829,117 | |
| | |
| | United Kingdom – 14.6% | | | | |
| | 56,774 | | | 3i Group PLC (Diversified Financials) | | | 402,177 | |
| | 4,294 | | | Admiral Group PLC (Insurance) | | | 104,927 | |
| | 88,884 | | | AstraZeneca PLC ADR (Pharmaceuticals, Biotechnology & Life Sciences) | | | 3,017,612 | |
| | 15,643 | | | AstraZeneca PLC (Pharmaceuticals, Biotechnology & Life Sciences) | | | 1,056,643 | |
| | 69,647 | | | BAE Systems PLC (Capital Goods) | | | 512,777 | |
| | 54,919 | | | Barclays PLC (Banks) | | | 176,772 | |
| | 30,441 | | | Bellway PLC (Consumer Durables & Apparel) | | | 1,272,842 | |
| | 49,909 | | | Berkeley Group Holdings PLC (Consumer Durables & Apparel) | | | 2,713,229 | |
| | 6,399 | | | Bodycote PLC (Capital Goods) | | | 53,419 | |
| | 178,747 | | | Booker Group PLC (Food & Staples Retailing) | | | 477,053 | |
| | 110,945 | | | British American Tobacco PLC (Food, Beverage & Tobacco) | | | 6,161,224 | |
| | |
| | Common Stocks – (continued) | |
| | United Kingdom – (continued) | |
| | 27,422 | | | BT Group PLC (Telecommunication Services) | | $ | 190,407 | |
| | 14,449 | | | Cobham PLC (Capital Goods) | | | 60,337 | |
| | 15,032 | | | Diageo PLC (Food, Beverage & Tobacco) | | | 410,490 | |
| | 36,267 | | | Dialog Semiconductor PLC (Semiconductors & Semiconductor Equipment)* | | | 1,210,180 | |
| | 23,250 | | | Domino’s Pizza Group PLC (Consumer Services) | | | 360,352 | |
| | 148,729 | | | DS Smith PLC (Materials) | | | 870,000 | |
| | 78,621 | | | easyJet PLC (Transportation) | | | 2,016,391 | |
| | 6,865 | | | Galliford Try PLC (Capital Goods) | | | 154,254 | |
| | 35,759 | | | GlaxoSmithKline PLC ADR (Pharmaceuticals, Biotechnology & Life Sciences) | | | 1,442,876 | |
| | 90,591 | | | Great Portland Estates PLC (REIT) | | | 1,104,164 | |
| | 37,709 | | | Greene King PLC (Consumer Services) | | | 516,238 | |
| | 18,798 | | | Greggs PLC (Food & Staples Retailing) | | | 364,433 | |
| | 36,732 | | | Hammerson PLC (REIT) | | | 324,724 | |
| | 112,633 | | | Hansteen Holdings PLC (REIT) | | | 190,913 | |
| | 186,562 | | | Henderson Group PLC (Diversified Financials) | | | 847,928 | |
| | 124,560 | | | HSBC Holdings PLC (Banks) | | | 983,304 | |
| | 78,308 | | | IG Group Holdings PLC (Diversified Financials) | | | 925,798 | |
| | 81,749 | | | Imperial Tobacco Group PLC (Food, Beverage & Tobacco) | | | 4,317,790 | |
| | 89,787 | | | Inchcape PLC (Retailing) | | | 1,035,933 | |
| | 39,763 | | | Indivior PLC (Pharmaceuticals, Biotechnology & Life Sciences) | | | 109,883 | |
| | 329,377 | | | International Consolidated Airlines Group SA (Transportation) | | | 2,952,268 | |
| | 630,048 | | | ITV PLC (Media) | | | 2,565,147 | |
| | 108,139 | | | Lancashire Holdings Ltd. (Insurance) | | | 997,377 | |
| | 21,924 | | | Land Securities Group PLC (REIT) | | | 380,053 | |
| | 122,600 | | | Moneysupermarket.com Group PLC (Software & Services) | | | 663,216 | |
| | 313,874 | | | National Grid PLC (Utilities) | | | 4,328,820 | |
| | 9,667 | | | Next PLC (Retailing) | | | 1,037,954 | |
| | 4,530 | | | Novae Group PLC (Insurance) | | | 59,878 | |
| | 810 | | | Rank Group PLC (Consumer Services) | | | 3,406 | |
| | 49,416 | | | Reckitt Benckiser Group PLC (Household & Personal Products) | | | 4,572,282 | |
| | 100,923 | | | RELX NV (Media) | | | 1,699,775 | |
| | 4,989 | | | Rightmove PLC (Media) | | | 303,182 | |
| | 8,695 | | | Rio Tinto PLC (Materials) | | | 253,157 | |
| | 22,655 | | | Safestore Holdings PLC (REIT) | | | 119,106 | |
| | 86,549 | | | Severn Trent PLC (Utilities) | | | 2,766,677 | |
| | 167,143 | | | Sky PLC (Media) | | | 2,739,934 | |
| | 36,085 | | | Unilever PLC (Household & Personal Products) | | | 1,547,763 | |
| | 13,690 | | | Unilever PLC ADR (Household & Personal Products)(a) | | | 590,299 | |
| | 160,621 | | | United Utilities Group PLC (Utilities) | | | 2,211,641 | |
| | | | | | | | |
| | | | | | | 63,177,005 | |
| | |
| | |
| 56 | | The accompanying notes are an integral part of these financial statements. |
GOLDMAN SACHS INTERNATIONAL TAX-MANAGED EQUITY FUND
| | | | | | | | |
| Shares | | | Description | | Value | |
| | Common Stocks – (continued) | |
| | United States – 0.5% | | | | |
| | 39,581 | | | Carnival PLC ADR (Consumer Services)(a) | | $ | 2,252,951 | |
| | |
| | TOTAL COMMON STOCKS | |
| | (Cost $357,899,260) | | $ | 426,267,314 | |
| | |
| | | | | | | | | | | | |
| Shares | | | Description | | Rate | | | Value | |
| | Preferred Stocks – 0.4% | |
| | Germany – 0.4% | | | | | | | | |
| | 14,255 | | | Henkel AG & Co. KGaA (Household & Personal Products) | | | 1.310 | % | | $ | 1,590,887 | |
| | 4,614 | | | Sixt SE (Transportation) | | | 0.820 | | | | 189,396 | |
| | |
| | TOTAL PREFERRED STOCKS | |
| | (Cost $1,212,181) | | | | | | $ | 1,780,283 | |
| | |
| TOTAL INVESTMENTS BEFORE SECURITIES LENDING
REINVESTMENT VEHICLE |
|
| | (Cost $359,111,441) | | | $ | 428,047,597 | |
| | |
| | | | | | |
| Shares | | Distribution Rate | | Value | |
| Securities Lending Reinvestment Vehicle(c)(d) – 0.8% | |
Goldman Sachs Financial Square Money Market Fund – FST Shares | |
| 3,320,125 | | 0.285% | | $ | 3,320,125 | |
| (Cost $3,320,125) | | | | |
| |
| TOTAL INVESTMENTS – 99.9% | |
| (Cost $362,431,566) | | $ | 431,367,722 | |
| |
OTHER ASSETS IN EXCESS OF LIABILITIES – 0.1% | | | 464,582 | |
| |
| NET ASSETS – 100.0% | | $ | 431,832,304 | |
| |
| | |
| The percentage shown for each investment category reflects the value of investments in that category as a percentage of net assets. |
* | | Non-income producing security. |
(a) | | All or a portion of security is on loan. |
(b) | | All or a portion of security is segregated as collateral for initial margin requirements on futures transactions. |
(c) | | Represents an affiliated issuer. |
(d) | | Variable rate security. Interest rate or distribution rate disclosed is that which is in effect on December 31, 2015. |
| | |
|
Investment Abbreviations: |
ADR | | —American Depositary Receipt |
CVA | | —Dutch Certification |
REIT | | —Real Estate Investment Trust |
|
|
| ADDITIONAL INVESTMENT INFORMATION |
FUTURES CONTRACTS — At December 31, 2015, the Fund had the following futures contracts:
| | | | | | | | | | | | | | |
| Type | | Number of
Contracts
Long (Short) | | | Expiration
Date | | Current
Value | | | Unrealized
Gain (Loss) | |
EURO STOXX 50 Index | | | 111 | | | March 2016 | | $ | 3,959,052 | | | $ | 46,111 | |
FTSE 100 Index | | | 21 | | | March 2016 | | | 1,918,789 | | | | 43,293 | |
Hang Seng Index | | | 1 | | | January 2016 | | | 141,354 | | | | (323 | ) |
MSCI Singapore Index | | | 5 | | | January 2016 | | | 114,112 | | | | 216 | |
SPI 200 Index | | | 8 | | | March 2016 | | | 766,155 | | | | 29,406 | |
TSE TOPIX Index | | | 14 | | | March 2016 | | | 1,802,488 | | | | (4,414 | ) |
| TOTAL | | | | | | | | | | | | $ | 114,289 | |
| | |
| The accompanying notes are an integral part of these financial statements. | | 57 |
GOLDMAN SACHS TAX-ADVANTAGED EQUITY FUNDS
Statements of Assets and Liabilities
December 31, 2015
| | | | | | | | | | | | | | | | | | |
| | | | | U.S. Equity Dividend and Premium Fund | | | International Equity
Dividend and
Premium Fund | | | U.S. Tax- Managed Equity Fund | | | International Tax-Managed
Equity Fund | |
| | Assets: | | | | | | | | | | | | | | | | |
| | Investments in unaffiliated issuers, at value (cost $1,376,957,898, $362,225,597, $810,608,129 and $359,111,441)(a) | | $ | 1,540,041,952 | | | $ | 295,527,822 | | | $ | 1,057,056,257 | | | $ | 428,047,597 | |
| | Investments in affiliated issuer, at value (cost $76,057,604, $0, $0 and $0) | | | 76,057,604 | | | | — | | | | — | | | | — | |
| | Investments in affiliated securities lending reinvestment vehicle, at value which equals cost | | | — | | | | — | | | | 19,803,509 | | | | 3,320,125 | |
| | Cash | | | 8,464,799 | | | | — | | | | 12,810,532 | | | | 6,173,112 | |
| | Foreign currencies, at value (cost $0, $0, $0 and $2,261,254) | | | — | | | | — | | | | — | | | | 2,252,202 | |
| | Receivables: | | | | | | | | | | | | | | | | |
| | Investments sold | | | 10,843,399 | | | | 15,791,447 | | | | — | | | | — | |
| | Fund shares sold | | | 10,389,220 | | | | 632,100 | | | | 788,520 | | | | 3,310,944 | |
| | Dividends | | | 2,503,656 | | | | 416,802 | | | | 1,117,388 | | | | 325,635 | |
| | Reimbursement from investment adviser | | | 106,341 | | | | — | | | | — | | | | — | |
| | Foreign tax reclaims | | | — | | | | 1,225,492 | | | | — | | | | 297,634 | |
| | Securities lending income | | | — | | | | — | | | | 39,057 | | | | 10,801 | |
| | Total assets | | | 1,648,406,971 | | | | 313,593,663 | | | | 1,091,615,263 | | | | 443,738,050 | |
| | | | | | | | | | | | | | | | | | |
| | Liabilities: | | | | | | | | | | | | | | | | |
| | Written options, at value (premiums received $10,810,872, $2,745,815, $0 and $0) | | | 10,809,920 | | | | 2,458,818 | | | | — | | | | — | |
| | Due to custodian — foreign currencies, at value (cost $0, $684,859, $0 and $0) | | | — | | | | 673,104 | | | | — | | | | — | |
| | Variation margin on certain derivative contracts | | | 406,074 | | | | 4,080 | | | | 65,932 | | | | 11,687 | |
| | Payables: | | | | | | | | | | | | | | | | |
| | Investments purchased | | | 25,251,072 | | | | 7,828,566 | | | | — | | | | — | |
| | Fund shares redeemed | | | 9,249,850 | | | | 7,177,105 | | | | 25,408,097 | | | | 8,115,910 | |
| | Management fees | | | 966,246 | | | | 214,175 | | | | 631,567 | | | | 346,907 | |
| | Distribution and Service fees and Transfer Agency fees | | | 210,623 | | | | 17,080 | | | | 78,513 | | | | 16,720 | |
| | Payable upon return of securities loaned | | | — | | | | — | | | | 19,803,509 | | | | 3,320,125 | |
| | Due to custodian | | | — | | | | 295,415 | | | | — | | | | — | |
| | Accrued expenses and other liabilities | | | 103,032 | | | | 111,123 | | | | 213,132 | | | | 94,397 | |
| | Total liabilities | | | 46,996,817 | | | | 18,779,466 | | | | 46,200,750 | | | | 11,905,746 | |
| | | | | | | | | | | | | | | | | | |
| | Net Assets: | | | | | | | | | | | | | | | | |
| | Paid-in capital | | | 1,425,088,042 | | | | 365,602,471 | | | | 850,365,998 | | | | 453,625,941 | |
| | Undistributed (distributions in excess of) net investment income | | | 1,201,072 | | | | (93,495 | ) | | | 961,022 | | | | (64,643 | ) |
| | Accumulated net realized gain (loss) | | | 12,070,747 | | | | (4,150,436 | ) | | | (52,353,469 | ) | | | (90,752,175 | ) |
| | Net unrealized gain (loss) | | | 163,050,293 | | | | (66,544,343 | ) | | | 246,440,962 | | | | 69,023,181 | |
| | | NET ASSETS | | $ | 1,601,410,154 | | | $ | 294,814,197 | | | $ | 1,045,414,513 | | | $ | 431,832,304 | |
| | | Net Assets: | | | | | | | | | | | | | | | | |
| | | Class A | | $ | 194,236,670 | | | $ | 9,531,700 | | | $ | 57,913,325 | | | $ | 3,408,481 | |
| | | Class C | | | 90,090,987 | | | | 3,328,718 | | | | 22,193,545 | | | | 811,649 | |
| | | Institutional | | | 1,262,976,509 | | | | 281,204,451 | | | | 957,272,685 | | | | 426,168,266 | |
| | | Service | | | — | | | | — | | | | 1,235,512 | | | | — | |
| | | Class IR | | | 54,105,988 | | | | 749,328 | | | | 6,799,446 | | | | 1,443,908 | |
| | | Total Net Assets | | $ | 1,601,410,154 | | | $ | 294,814,197 | | | $ | 1,045,414,513 | | | $ | 431,832,304 | |
| | | Shares outstanding $0.001 par value (unlimited shares authorized): | | | | | | | | | | | | | | | | |
| | | Class A | | | 17,130,316 | | | | 1,453,524 | | | | 3,352,319 | | | | 392,980 | |
| | | Class C | | | 7,963,960 | | | | 524,208 | | | | 1,346,652 | | | | 96,083 | |
| | | Institutional | | | 111,656,652 | | | | 43,559,377 | | | | 54,603,576 | | | | 49,614,331 | |
| | | Service | | | — | | | | — | | | | 71,282 | | | | — | |
| | | Class IR | | | 4,777,290 | | | | 116,291 | | | | 387,709 | | | | 166,887 | |
| | | Net asset value, offering and redemption price per share:(b) | | | | | | | | | | | | | | | | |
| | | Class A | | | $11.34 | | | | $6.56 | | | | $17.28 | | | | $8.67 | |
| | | Class C | | | 11.31 | | | | 6.35 | | | | 16.48 | | | | 8.45 | |
| | | Institutional | | | 11.31 | | | | 6.46 | | | | 17.53 | | | | 8.59 | |
| | | Service | | | — | | | | — | | | | 17.33 | | | | — | |
| | | Class IR | | | 11.33 | | | | 6.44 | | | | 17.54 | | | | 8.65 | |
| | (a) | | Includes loaned securities having a market value of $19,016,126 and $3,175,537 for the U.S. Tax-Managed Equity and International Tax-Managed Equity Funds, respectively. |
| | (b) | | Maximum public offering price per share for Class A Shares of the U.S. Equity Dividend and Premium, International Equity Dividend and Premium, U.S. Tax-Managed Equity, International Tax-Managed Equity Funds is $12.00, $6.94, $18.29 and $9.17, respectively. At redemption, Class C Shares may be subject to a contingent deferred sales charge assessed on the amount equal to the lesser of the current NAV or the original purchase price of the shares. |
| | |
| 58 | | The accompanying notes are an integral part of these financial statements. |
GOLDMAN SACHS TAX-ADVANTAGED EQUITY FUNDS
Statement of Operations
For the Fiscal Year Ended December 31, 2015
| | | | | | | | | | | | | | | | | | |
| | | | | U.S. Equity
Dividend and
Premium Fund | | | International Equity
Dividend and
Premium Fund | | | U.S. Tax- Managed Equity Fund | | | International Tax-Managed
Equity Fund | |
| | Investment income: | | | | | | | | | | | | | | | | |
| | Dividends (net of foreign taxes withheld of $58,727, $1,047,371, $317 and $936,561) | | $ | 43,610,379 | | | $ | 13,524,865 | | | $ | 18,424,254 | | | $ | 10,497,865 | |
| | Dividends — affiliated issuer | | | 14,381 | | | | — | | | | — | | | | — | |
| | Securities lending income — affiliated issuer | | | — | | | | — | | | | 464,086 | | | | 251,718 | |
| | Total investment income | | | 43,624,760 | | | | 13,524,865 | | | | 18,888,340 | | | | 10,749,583 | |
| | | | | | | | | | | | | | | | | | |
| | Expenses: | | | | | | | | | | | | | | | | |
| | Management fees | | | 10,828,918 | | | | 3,034,758 | | | | 6,978,879 | | | | 3,390,832 | |
| | Distribution and Service fees(a) | | | 1,204,636 | | | | 55,328 | | | | 330,349 | | | | 11,259 | |
| | Transfer Agency fees(a) | | | 1,039,943 | | | | 170,575 | | | | 521,397 | | | | 165,381 | |
| | Registration fees | | | 133,085 | | | | 57,369 | | | | 65,448 | | | | 55,302 | |
| | Custody, accounting and administrative services | | | 132,734 | | | | 182,355 | | | | 78,229 | | | | 180,832 | |
| | Professional fees | | | 87,751 | | �� | | 129,140 | | | | 100,338 | | | | 94,152 | |
| | Printing and mailing costs | | | 77,130 | | | | 27,525 | | | | 33,018 | | | | 21,315 | |
| | Trustee fees | | | 28,856 | | | | 25,788 | | | | 27,665 | | | | 25,422 | |
| | Service share fees — Service Plan | | | — | | | | — | | | | 1,880 | | | | — | |
| | Service share fees — Shareholder Administration Plan | | | — | | | | — | | | | 1,880 | | | | — | |
| | Other | | | 47,225 | | | | 15,193 | | | | 28,896 | | | | 19,976 | |
| | Total expenses | | | 13,580,278 | | | | 3,698,031 | | | | 8,167,979 | | | | 3,964,471 | |
| | Less — expense reductions | | | (391,654 | ) | | | (2,920 | ) | | | (13,699 | ) | | | (27,710 | ) |
| | Net expenses | | | 13,188,624 | | | | 3,695,111 | | | | 8,154,280 | | | | 3,936,761 | |
| | NET INVESTMENT INCOME | | | 30,436,136 | | | | 9,829,754 | | | | 10,734,060 | | | | 6,812,822 | |
| | | | | | | | | | | | | | | | | | |
| | Realized and unrealized gain (loss): | | | | | | | | | | | | | | | | |
| | Net realized gain (loss) from: | | | | | | | | | | | | | | | | |
| | Investments — affiliated issuer | | | 19 | | | | — | | | | — | | | | — | |
| | Investments | | | 39,954,124 | | | | 12,563,251 | | | | (48,999,527 | ) | | | (29,487,692 | ) |
| | Futures contracts | | | 4,197,036 | | | | 624,749 | | | | 903,707 | | | | (260,431 | ) |
| | Foreign currency transactions | | | — | | | | (1,223,159 | ) | | | — | | | | (29,386 | ) |
| | Written options | | | 20,172,394 | | | | (4,935,672 | ) | | | — | | | | — | |
| | Net change in unrealized gain (loss) on: | | | | | | | | | | | | | | | | |
| | Investments | | | (59,319,773 | ) | | | (32,428,767 | ) | | | 31,174,859 | | | | 34,389,993 | |
| | Futures contracts | | | (460,856 | ) | | | 115,810 | | | | (9,886 | ) | | | 74,501 | |
| | Foreign currency translation | | | — | | | | 10,939 | | | | — | | | | (15,639 | ) |
| | Written options | | | (482,852 | ) | | | 419,084 | | | | — | | | | — | |
| | Net realized and unrealized gain (loss) | | | 4,060,092 | | | | (24,853,765 | ) | | | (16,930,847 | ) | | | 4,671,346 | |
| | NET INCREASE (DECREASE) IN NET ASSETS RESULTING FROM OPERATIONS | | $ | 34,496,228 | | | $ | (15,024,011 | ) | | $ | (6,196,787 | ) | | $ | 11,484,168 | |
| | (a) | | Class specific Distribution and Service, and Transfer Agency fees were as follows: |
| | | | | | | | | | | | | | | | | | | | | | | | | | | | |
| | | Distribution and Service Fees | | | Transfer Agent Fees | |
Fund | | Class A | | | Class C | | | Class A | | | Class C | | | Institutional | | | Service | | | Class IR | |
U.S. Equity Dividend and Premium | | $ | 439,692 | | | $ | 764,944 | | | $ | 334,168 | | | $ | 145,340 | | | $ | 477,393 | | | $ | — | | | $ | 83,042 | |
International Equity Dividend and Premium | | | 24,915 | | | | 30,413 | | �� | | 18,935 | | | | 5,779 | | | | 144,343 | | | | — | | | | 1,518 | |
U.S. Tax-Managed Equity | | | 139,478 | | | | 190,871 | | | | 106,004 | | | | 36,265 | | | | 367,437 | | | | 301 | | | | 11,390 | |
International Tax-Managed Equity | | | 6,667 | | | | 4,592 | | | | 5,068 | | | | 872 | | | | 158,020 | | | | — | | | | 1,421 | |
| | |
| The accompanying notes are an integral part of these financial statements. | | 59 |
GOLDMAN SACHS TAX-ADVANTAGED EQUITY FUNDS
Statements of Changes in Net Assets
| | | | | | | | | | |
| | | | | U.S. Equity Dividend and Premium Fund | |
| | | | | For the Fiscal Year Ended
December 31, 2015 | | | For the Fiscal Year Ended
December 31, 2014 | |
| | From operations: | | | | | | | | |
| | Net investment income | | $ | 30,436,136 | | | $ | 30,185,118 | |
| | Net realized gain | | | 64,323,573 | | | | 73,366,733 | |
| | Net change in unrealized gain (loss) | | | (60,263,481 | ) | | | 38,490,250 | |
| | Net increase (decrease) in net assets resulting from operations | | | 34,496,228 | | | | 142,042,101 | |
| | | | | | | | | | |
| | Distributions to shareholders: | | | | | | | | |
| | From net investment income | | | | | | | | |
| | Class A Shares | | | (2,983,321 | ) | | | (3,110,424 | ) |
| | Class C Shares | | | (762,284 | ) | | | (833,020 | ) |
| | Institutional Shares | | | (24,952,520 | ) | | | (24,915,119 | ) |
| | Service Shares | | | — | | | | — | |
| | Class IR Shares | | | (884,725 | ) | | | (836,386 | ) |
| | From net realized gains | | | | | | | | |
| | Class A Shares | | | (7,493,842 | ) | | | (6,251,267 | ) |
| | Class C Shares | | | (3,387,824 | ) | | | (2,813,376 | ) |
| | Institutional Shares | | | (49,625,833 | ) | | | (43,342,071 | ) |
| | Class IR Shares | | | (2,043,525 | ) | | | (1,500,736 | ) |
| | Total distributions to shareholders | | | (92,133,874 | ) | | | (83,602,399 | ) |
| | | | | | | | | | |
| | From share transactions: | | | | | | | | |
| | Proceeds from sales of shares | | | 434,055,698 | | | | 319,904,406 | |
| | Reinvestment of distributions | | | 81,914,708 | | | | 72,709,963 | |
| | Cost of shares redeemed | | | (293,200,186 | ) | | | (357,242,749 | ) |
| | Net increase (decrease) in net assets resulting from share transactions | | | 222,770,220 | | | | 35,371,620 | |
| | TOTAL INCREASE (DECREASE) | | | 165,132,574 | | | | 93,811,322 | |
| | | | | | | | | | |
| | Net assets: | | | | | | | | |
| | Beginning of year | | | 1,436,277,580 | | | | 1,342,466,258 | |
| | End of year | | $ | 1,601,410,154 | | | $ | 1,436,277,580 | |
| | Undistributed (distributions in excess of) net investment income | | $ | 1,201,072 | | | $ | 563,006 | |
| | |
| 60 | | The accompanying notes are an integral part of these financial statements. |
GOLDMAN SACHS TAX-ADVANTAGED EQUITY FUNDS
| | | | | | | | | | | | | | | | | | | | | | | | | | | | | | | | | | |
| | | International Equity Dividend and Premium Fund | | | | | U.S. Tax-Managed Equity Fund | | | | | International Tax-Managed Equity Fund | |
| | | For the Fiscal
Year Ended
December 31, 2015 | | | | | For the Fiscal
Year Ended
December 31, 2014 | | | | | For the Fiscal
Year Ended
December 31, 2015 | | | | | For the Fiscal
Year Ended
December 31, 2014 | | | | | For the Fiscal
Year Ended
December 31, 2015 | | | | | For the Fiscal
Year Ended
December 31, 2014 | |
| | | | | | | | | | | | | | | | | | | | | | | | | | | | | | | | | | |
| | $ | 9,829,754 | | | | | $ | 15,441,775 | | | | | $ | 10,734,060 | | | | | $ | 5,766,523 | | | | | $ | 6,812,822 | | | | | $ | 8,842,547 | |
| | | 7,029,169 | | | | | | 4,456,504 | | | | | | (48,095,820 | ) | | | | | (2,043,103 | ) | | | | | (29,777,509 | ) | | | | | (17,394,948 | ) |
| | | (31,882,934 | ) | | | | | (43,489,593 | ) | | | | | 31,164,973 | | | | | | 83,535,821 | | | | | | 34,448,855 | | | | | | (10,341,689 | ) |
| | | (15,024,011 | ) | | | | | (23,591,314 | ) | | | | | (6,196,787 | ) | | | | | 87,259,241 | | | | | | 11,484,168 | | | | | | (18,894,090 | ) |
| | | | | | | | | | | | | | | | | | | | | | | | | | | | | | | | | | |
| | | | | | | | | | | | | | | | | | | | | | | | | | | | | | | | | | |
| | | | | | | | | | | | | | | | | | | | | | | | | | | | | | | | | | |
| | | (187,384 | ) | | | | | (317,068 | ) | | | | | (368,040 | ) | | | | | (176,905 | ) | | | | | (38,028 | ) | | | | | (52,969 | ) |
| | | (44,943 | ) | | | | | (62,090 | ) | | | | | (19,448 | ) | | | | | — | | | | | | (7,200 | ) | | | | | (3,009 | ) |
| | | (7,913,955 | ) | | | | | (14,093,242 | ) | | | | | (9,925,748 | ) | | | | | (5,400,255 | ) | | | | | (6,266,165 | ) | | | | | (8,918,554 | ) |
| | | — | | | | | | — | | | | | | (9,114 | ) | | | | | — | | | | | | — | | | | | | — | |
| | | (14,810 | ) | | | | | (39,963 | ) | | | | | (59,966 | ) | | | | | (23,594 | ) | | | | | (20,104 | ) | | | | | (5,515 | ) |
| | | | | | | | | | | | | | | | | | | | | | | | | | | | | | | | | | |
| | | (152,285 | ) | | | | | (341,348 | ) | | | | | — | | | | | | — | | | | | | — | | | | | | — | |
| | | (52,312 | ) | | | | | (86,092 | ) | | | | | — | | | | | | — | | | | | | — | | | | | | — | |
| | | (5,346,252 | ) | | | | | (13,463,468 | ) | | | | | — | | | | | | — | | | | | | — | | | | | | — | |
| | | (12,537 | ) | | | | | (28,895 | ) | | | | | — | | | | | | — | | | | | | — | | | | | | — | |
| | | (13,724,478 | ) | | | | | (28,432,166 | ) | | | | | (10,382,316 | ) | | | | | (5,600,754 | ) | | | | | (6,331,497 | ) | | | | | (8,980,047 | ) |
| | | | | | | | | | | | | | | | | | | | | | | | | | | | | | | | | | |
| | | | | | | | | | | | | | | | | | | | | | | | | | | | | | | | | | |
| | | 104,320,071 | | | | | | 159,284,006 | | | | | | 389,850,321 | | | | | | 277,231,053 | | | | | | 179,753,113 | | | | | | 157,935,324 | |
| | | 13,554,512 | | | | | | 27,828,550 | | | | | | 10,087,140 | | | | | | 5,504,778 | | | | | | 6,331,416 | | | | | | 8,977,898 | |
| | | (223,876,777 | ) | | | | | (123,752,731 | ) | | | | | (144,600,334 | ) | | | | | (98,808,216 | ) | | | | | (78,004,097 | ) | | | | | (52,524,848 | ) |
| | | (106,002,194 | ) | | | | | 63,359,825 | | | | | | 255,337,127 | | | | | | 183,927,615 | | | | | | 108,080,432 | | | | | | 114,388,374 | |
| | | (134,750,683 | ) | | | | | 11,336,345 | | | | | | 238,758,024 | | | | | | 265,586,102 | | | | | | 113,233,103 | | | | | | 86,514,237 | |
| | | | | | | | | | | | | | | | | | | | | | | | | | | | | | | | | | |
| | | | | | | | | | | | | | | | | | | | | | | | | | | | | | | | | | |
| | | 429,564,880 | | | | | | 418,228,535 | | | | | | 806,656,489 | | | | | | 541,070,387 | | | | | | 318,599,201 | | | | | | 232,084,964 | |
| | $ | 294,814,197 | | | | | $ | 429,564,880 | | | | | $ | 1,045,414,513 | | | | | $ | 806,656,489 | | | | | $ | 431,832,304 | | | | | $ | 318,599,201 | |
| | $ | (93,495 | ) | | | | $ | (543,089 | ) | | | | $ | 961,022 | | | | | $ | 732,302 | | | | | $ | (64,643 | ) | | | | $ | (524,208 | ) |
| | |
| The accompanying notes are an integral part of these financial statements. | | 61 |
GOLDMAN SACHS U.S. EQUITY DIVIDEND AND PREMIUM FUND
Financial Highlights
Selected Data for a Share Outstanding Throughout Each Year
| | | | | | | | | | | | | | | | | | | | | | | | | | | | | | |
| | | | | | | | Income from
investment operations | | | Distributions
to shareholders | |
| | | Year - Share Class | |
Net asset
value,
beginning
of year | | | Net
investment
income(a) | | | Net realized
and unrealized
gain | | | Total from
investment
operations | | | From net
investment
income | | | From net
realized
gains | | | Total
distributions | |
| | FOR THE FISCAL YEARS ENDED DECEMBER 31, | |
| | 2015 - A | | $ | 11.76 | | | $ | 0.21 | | | $ | 0.04 | | | $ | 0.25 | | | $ | (0.20 | ) | | $ | (0.47 | ) | | $ | (0.67 | ) |
| | 2015 - C | | | 11.74 | | | | 0.12 | | | | 0.03 | | | | 0.15 | | | | (0.11 | ) | | | (0.47 | ) | | | (0.58 | ) |
| | 2015 - Institutional | | | 11.73 | | | | 0.25 | | | | 0.04 | | | | 0.29 | | | | (0.24 | ) | | | (0.47 | ) | | | (0.71 | ) |
| | 2015 - IR | | | 11.75 | | | | 0.24 | | | | 0.04 | | | | 0.28 | | | | (0.23 | ) | | | (0.47 | ) | | | (0.70 | ) |
| | 2014 - A | | | 11.26 | | | | 0.23 | | | | 0.95 | | | | 1.18 | | | | (0.22 | ) | | | (0.46 | ) | | | (0.68 | ) |
| | 2014 - C | | | 11.24 | | | | 0.14 | | | | 0.96 | | | | 1.10 | | | | (0.14 | ) | | | (0.46 | ) | | | (0.60 | ) |
| | 2014 - Institutional | | | 11.24 | | | | 0.27 | | | | 0.95 | | | | 1.22 | | | | (0.27 | ) | | | (0.46 | ) | | | (0.73 | ) |
| | 2014 - IR | | | 11.25 | | | | 0.26 | | | | 0.95 | | | | 1.21 | | | | (0.25 | ) | | | (0.46 | ) | | | (0.71 | ) |
| | 2013 - A | | | 9.60 | | | | 0.20 | | | | 2.12 | | | | 2.32 | | | | (0.20 | ) | | | (0.46 | ) | | | (0.66 | ) |
| | 2013 - C | | | 9.59 | | | | 0.13 | | | | 2.11 | | | | 2.24 | | | | (0.13 | ) | | | (0.46 | ) | | | (0.59 | ) |
| | 2013 - Institutional | | | 9.58 | | | | 0.25 | | | | 2.12 | | | | 2.37 | | | | (0.25 | ) | | | (0.46 | ) | | | (0.71 | ) |
| | 2013 - IR | | | 9.59 | | | | 0.23 | | | | 2.12 | | | | 2.35 | | | | (0.23 | ) | | | (0.46 | ) | | | (0.69 | ) |
| | 2012 - A | | | 9.39 | | | | 0.25 | | | | 0.71 | | | | 0.96 | | | | (0.24 | ) | | | (0.51 | ) | | | (0.75 | ) |
| | 2012 - C | | | 9.38 | | | | 0.18 | | | | 0.71 | | | | 0.89 | | | | (0.17 | ) | | | (0.51 | ) | | | (0.68 | ) |
| | 2012 - Institutional | | | 9.37 | | | | 0.28 | | | | 0.72 | | | | 1.00 | | | | (0.28 | ) | | | (0.51 | ) | | | (0.79 | ) |
| | 2012 - IR | | | 9.38 | | | | 0.29 | | | | 0.70 | | | | 0.99 | | | | (0.27 | ) | | | (0.51 | ) | | | (0.78 | ) |
| | 2011 - A | | | 9.38 | | | | 0.18 | (d) | | | 0.27 | | | | 0.45 | | | | (0.19 | ) | | | (0.25 | ) | | | (0.44 | ) |
| | 2011 - C | | | 9.38 | | | | 0.11 | (d) | | | 0.27 | | | | 0.38 | | | | (0.13 | ) | | | (0.25 | ) | | | (0.38 | ) |
| | 2011 - Institutional | | | 9.36 | | | | 0.22 | (d) | | | 0.27 | | | | 0.49 | | | | (0.23 | ) | | | (0.25 | ) | | | (0.48 | ) |
| | 2011 - IR | | | 9.38 | | | | 0.21 | (d) | | | 0.26 | | | | 0.47 | | | | (0.22 | ) | | | (0.25 | ) | | | (0.47 | ) |
| | (a) | | Calculated based on the average shares outstanding methodology. |
| | (b) | | Assumes investment at the net asset value at the beginning of the year, reinvestment of all distributions, a complete redemption of the investment at the net asset value at the end of the year and no sales or redemption charges. Total returns would be reduced if a sales or redemption charge was taken into account. Returns do not reflect the deduction of taxes that a shareholder would pay on Fund distributions or the redemption of Fund shares. |
| | (c) | | The Fund’s portfolio turnover rate is calculated in accordance with regulatory requirements, without regard to transactions involving short term investments and certain derivatives. If such transactions were included, the Fund’s portfolio turnover rate may be higher. |
| | (d) | | Reflects income recognized from special dividends which amounted to $0.01 per share and 0.12% of average net assets. |
| | |
| 62 | | The accompanying notes are an integral part of these financial statements. |
GOLDMAN SACHS U.S. EQUITY DIVIDEND AND PREMIUM FUND
| | | | | | | | | | | | | | | | | | | | | | | | | | | | | | | | | | | | | | | | |
| | | | | | | | | | | | | | | | | | | | | | | | | | | | | | | | | | |
| | | Net asset
value, end
of year | | | | | Total
return(b) | | | | | Net assets,
end of
year
(in 000s) | | | | | Ratio of
net expenses
to average
net assets | | | | | Ratio of
total expenses
to average
net assets | | | | | Ratio of
net investment
income
to average
net assets | | | | | Portfolio
turnover
rate(c) | |
| | | | | | | | | | | | | | | | | | | | | | | | | | | | | | | | | | | | | | | | |
| | $ | 11.34 | | | | | | 2.08 | % | | | | $ | 194,237 | | | | | | 1.17 | % | | | | | 1.20 | % | | | | | 1.75 | % | | | | | 39 | % |
| | | 11.31 | | | | | | 1.26 | | | | | | 90,091 | | | | | | 1.92 | | | | | | 1.95 | | | | | | 1.01 | | | | | | 39 | |
| | | 11.31 | | | | | | 2.49 | | | | | | 1,262,977 | | | | | | 0.77 | | | | | | 0.80 | | | | | | 2.15 | | | | | | 39 | |
| | | 11.33 | | | | | | 2.34 | | | | | | 54,106 | | | | | | 0.92 | | | | | | 0.95 | | | | | | 2.03 | | | | | | 39 | |
| | | 11.76 | | | | | | 10.47 | | | | | | 172,832 | | | | | | 1.19 | | | | | | 1.20 | | | | | | 1.96 | | | | | | 53 | |
| | | 11.74 | | | | | | 9.68 | | | | | | 74,125 | | | | | | 1.94 | | | | | | 1.95 | | | | | | 1.21 | | | | | | 53 | |
| | | 11.73 | | | | | | 10.83 | | | | | | 1,149,361 | | | | | | 0.79 | | | | | | 0.80 | | | | | | 2.36 | | | | | | 53 | |
| | | 11.75 | | | | | | 10.75 | | | | | | 39,960 | | | | | | 0.94 | | | | | | 0.95 | | | | | | 2.21 | | | | | | 53 | |
| | | 11.26 | | | | | | 24.58 | | | | | | 167,149 | | | | | | 1.19 | | | | | | 1.21 | | | | | | 1.92 | | | | | | 69 | |
| | | 11.24 | | | | | | 23.61 | | | | | | 66,872 | | | | | | 1.94 | | | | | | 1.96 | | | | | | 1.17 | | | | | | 69 | |
| | | 11.24 | | | | | | 25.14 | | | | | | 1,072,965 | | | | | | 0.79 | | | | | | 0.81 | | | | | | 2.32 | | | | | | 69 | |
| | | 11.25 | | | | | | 24.93 | | | | | | 35,480 | | | | | | 0.94 | | | | | | 0.96 | | | | | | 2.18 | | | | | | 69 | |
| | | 9.60 | | | | | | 10.30 | | | | | | 145,184 | | | | | | 1.21 | | | | | | 1.22 | | | | | | 2.48 | | | | | | 67 | |
| | | 9.59 | | | | | | 9.57 | | | | | | 45,243 | | | | | | 1.96 | | | | | | 1.97 | | | | | | 1.83 | | | | | | 67 | |
| | | 9.58 | | | | | | 10.74 | | | | | | 895,258 | | | | | | 0.81 | | | | | | 0.82 | | | | | | 2.83 | | | | | | 67 | |
| | | 9.59 | | | | | | 10.60 | | | | | | 19,787 | | | | | | 0.96 | | | | | | 0.97 | | | | | | 2.90 | | | | | | 67 | |
| | | 9.39 | | | | | | 4.90 | | | | | | 70,499 | | | | | | 1.24 | | | | | | 1.25 | | | | | | 1.94 | (d) | | | | | 90 | |
| | | 9.38 | | | | | | 4.03 | | | | | | 17,378 | | | | | | 1.99 | | | | | | 2.00 | | | | | | 1.14 | (d) | | | | | 90 | |
| | | 9.37 | | | | | | 5.31 | | | | | | 688,194 | | | | | | 0.84 | | | | | | 0.85 | | | | | | 2.29 | (d) | | | | | 90 | |
| | | 9.38 | | | | | | 5.05 | | | | | | 1,425 | | | | | | 0.99 | | | | | | 1.00 | | | | | | 2.20 | (d) | | | | | 90 | |
| | |
| The accompanying notes are an integral part of these financial statements. | | 63 |
GOLDMAN SACHS INTERNATIONAL EQUITY DIVIDEND AND PREMIUM FUND
Financial Highlights
Selected Data for a Share Outstanding Throughout Each Year
| | | | | | | | | | | | | | | | | | | | | | | | | | | | | | |
| | | | | | | | Income (loss) from
investment operations | | | Distributions
to shareholders | |
| | | Year - Share Class | |
Net asset
value,
beginning
of year | | | Net
investment
income | | | Net realized
and unrealized
gain (loss) | | | Total from
investment
operations | | | From net
investment
income | | | From net
realized
gains | | | Total
distributions | |
| | FOR THE FISCAL YEARS ENDED DECEMBER 31, | | | | | | | | | | | | | | | | | |
| | 2015 - A | | $ | 7.14 | | | $ | 0.16 | (c)(d) | | $ | (0.49 | ) | | $ | (0.33 | ) | | $ | (0.14 | ) | | $ | (0.11 | ) | | $ | (0.25 | ) |
| | 2015 - C | | | 6.94 | | | | 0.09 | (c)(d) | | | (0.47 | ) | | | (0.38 | ) | | | (0.10 | ) | | | (0.11 | ) | | | (0.21 | ) |
| | 2015 - Institutional | | | 7.03 | | | | 0.18 | (c)(d) | | | (0.48 | ) | | | (0.30 | ) | | | (0.16 | ) | | | (0.11 | ) | | | (0.27 | ) |
| | 2015 - IR | | | 7.02 | | | | 0.16 | (c)(d) | | | (0.48 | ) | | | (0.32 | ) | | | (0.15 | ) | | | (0.11 | ) | | | (0.26 | ) |
| | 2014 - A | | | 8.00 | | | | 0.25 | (c)(e) | | | (0.64 | ) | | | (0.39 | ) | | | (0.23 | ) | | | (0.24 | ) | | | (0.47 | ) |
| | 2014 - C | | | 7.80 | | | | 0.18 | (c)(e) | | | (0.62 | ) | | | (0.44 | ) | | | (0.18 | ) | | | (0.24 | ) | | | (0.42 | ) |
| | 2014 - Institutional | | | 7.89 | | | | 0.27 | (c)(e) | | | (0.63 | ) | | | (0.36 | ) | | | (0.26 | ) | | | (0.24 | ) | | | (0.50 | ) |
| | 2014 - IR | | | 7.88 | | | | 0.28 | (c)(e) | | | (0.66 | ) | | | (0.38 | ) | | | (0.24 | ) | | | (0.24 | ) | | | (0.48 | ) |
| | 2013 - A | | | 7.31 | | | | 0.19 | (c) | | | 0.92 | | | | 1.11 | | | | (0.18 | ) | | | (0.24 | ) | | | (0.42 | ) |
| | 2013 - C | | | 7.15 | | | | 0.12 | (c) | | | 0.90 | | | | 1.02 | | | | (0.13 | ) | | | (0.24 | ) | | | (0.37 | ) |
| | 2013 - Institutional | | | 7.21 | | | | 0.20 | (c) | | | 0.93 | | | | 1.13 | | | | (0.21 | ) | | | (0.24 | ) | | | (0.45 | ) |
| | 2013 - IR | | | 7.20 | | | | 0.21 | (c) | | | 0.91 | | | | 1.12 | | | | (0.20 | ) | | | (0.24 | ) | | | (0.44 | ) |
| | 2012 - A | | | 6.60 | | | | 0.16 | | | | 0.78 | | | | 0.94 | | | | (0.17 | ) | | | (0.06 | ) | | | (0.23 | ) |
| | 2012 - C | | | 6.47 | | | | 0.13 | | | | 0.74 | | | | 0.87 | | | | (0.13 | ) | | | (0.06 | ) | | | (0.19 | ) |
| | 2012 - Institutional | | | 6.52 | | | | 0.21 | | | | 0.74 | | | | 0.95 | | | | (0.20 | ) | | | (0.06 | ) | | | (0.26 | ) |
| | 2012 - IR | | | 6.52 | | | | 0.26 | | | | 0.67 | | | | 0.93 | | | | (0.19 | ) | | | (0.06 | ) | | | (0.25 | ) |
| | 2011 - A | | | 8.17 | | | | 0.21 | (f) | | | (1.20 | ) | | | (0.99 | ) | | | (0.23 | ) | | | (0.35 | ) | | | (0.58 | ) |
| | 2011 - C | | | 8.02 | | | | 0.16 | (f) | | | (1.19 | ) | | | (1.03 | ) | | | (0.17 | ) | | | (0.35 | ) | | | (0.52 | ) |
| | 2011 - Institutional | | | 8.07 | | | | 0.24 | (f) | | | (1.18 | ) | | | (0.94 | ) | | | (0.26 | ) | | | (0.35 | ) | | | (0.61 | ) |
| | 2011 - IR | | | 8.06 | | | | 0.24 | (f) | | | (1.18 | ) | | | (0.94 | ) | | | (0.25 | ) | | | (0.35 | ) | | | (0.60 | ) |
| | (a) | | Assumes investment at the net asset value at the beginning of the year, reinvestment of all distributions, a complete redemption of the investment at the net asset value at the end of the year and no sales or redemption charges. Total returns would be reduced if a sales or redemption charge was taken into account. Returns do not reflect the deduction of taxes that a shareholder would pay on Fund distributions or the redemption of Fund shares. |
| | (b) | | The Fund’s portfolio turnover rate is calculated in accordance with regulatory requirements, without regard to transactions involving short term investments and certain derivatives. If such transactions were included, the Fund’s portfolio turnover rate may be higher. |
| | (c) | | Calculated based on the average shares outstanding methodology. |
| | (d) | | Reflects income recognized from a corporate action which amounted to $0.03 per share and 0.38% of average net assets. |
| | (e) | | Reflects income recognized from a corporate action which amounted to $0.05 per share and 0.69% of average net assets. |
| | (f) | | Reflects income recognized from a corporate action which amounted to $0.01 per share and 0.13% of average net assets. |
| | |
| 64 | | The accompanying notes are an integral part of these financial statements. |
GOLDMAN SACHS INTERNATIONAL EQUITY DIVIDEND AND PREMIUM FUND
| | | | | | | | | | | | | | | | | | | | | | | | | | | | | | | | | | | | | | | | |
| | | | | | | | | | | | | | | | | | | | | | | | | | | | | | | | | | |
| | | Net asset
value, end
of year | | | | | Total
return(a) | | | | | Net assets,
end of
year
(in 000s) | | | | | Ratio of
net expenses
to average
net assets | | | | | Ratio of
total expenses
to average
net assets | | | | | Ratio of
net investment
income
to average
net assets | | | | | Portfolio
turnover
rate(b) | |
| | | | | | | | | | | | | | | | | | | | | | | | | | | | | | | | | | | | | | | | |
| | $ | 6.56 | | | | | | (4.80 | )% | | | | $ | 9,532 | | | | | | 1.37 | % | | | | | 1.37 | % | | | | | 2.26 | %(d) | | | | | 100 | % |
| | | 6.35 | | | | | | (5.59 | ) | | | | | 3,329 | | | | | | 2.12 | | | | | | 2.12 | | | | | | 1.38 | (d) | | | | | 100 | |
| | | 6.46 | | | | | | (4.42 | ) | | | | | 281,204 | | | | | | 0.97 | | | | | | 0.97 | | | | | | 2.65 | (d) | | | | | 100 | |
| | | 6.44 | | | | | | (4.69 | ) | | | | | 749 | | | | | | 1.12 | | | | | | 1.12 | | | | | | 2.33 | (d) | | | | | 100 | |
| | | 7.14 | | | | | | (5.30 | ) | | | | | 10,565 | | | | | | 1.35 | | | | | | 1.35 | | | | | | 3.13 | (e) | | | | | 44 | |
| | | 6.94 | | | | | | (6.04 | ) | | | | | 2,634 | | | | | | 2.10 | | | | | | 2.10 | | | | | | 2.32 | (e) | | | | | 44 | |
| | | 7.03 | | | | | | (4.99 | ) | | | | | 415,503 | | | | | | 0.95 | | | | | | 0.95 | | | | | | 3.45 | (e) | | | | | 44 | |
| | | 7.02 | | | | | | (5.16 | ) | | | | | 862 | | | | | | 1.09 | | | | | | 1.09 | | | | | | 3.52 | (e) | | | | | 44 | |
| | | 8.00 | | | | | | 15.57 | | | | | | 10,323 | | | | | | 1.34 | | | | | | 1.36 | | | | | | 2.56 | | | | | | 97 | |
| | | 7.80 | | | | | | 14.68 | | | | | | 2,582 | | | | | | 2.10 | | | | | | 2.11 | | | | | | 1.54 | | | | | | 97 | |
| | | 7.89 | | | | | | 16.14 | | | | | | 403,776 | | | | | | 0.94 | | | | | | 0.96 | | | | | | 2.71 | | | | | | 97 | |
| | | 7.88 | | | | | | 15.98 | | | | | | 1,547 | | | | | | 1.09 | | | | | | 1.11 | | | | | | 2.74 | | | | | | 97 | |
| | | 7.31 | | | | | | 14.48 | | | | | | 14,952 | | | | | | 1.30 | | | | | | 1.37 | | | | | | 3.51 | | | | | | 60 | |
| | | 7.15 | | | | | | 13.71 | | | | | | 1,640 | | | | | | 2.05 | | | | | | 2.11 | | | | | | 1.99 | | | | | | 60 | |
| | | 7.21 | | | | | | 14.93 | | | | | | 366,136 | | | | | | 0.90 | | | | | | 0.95 | | | | | | 2.68 | | | | | | 60 | |
| | | 7.20 | | | | | | 14.56 | | | | | | 2,133 | | | | | | 1.05 | | | | | | 1.10 | | | | | | 4.06 | | | | | | 60 | |
| | | 6.60 | | | | | | (12.44 | ) | | | | | 171,063 | | | | | | 1.30 | | | | | | 1.38 | | | | | | 2.74 | (f) | | | | | 51 | |
| | | 6.47 | | | | | | (13.06 | ) | | | | | 1,502 | | | | | | 2.05 | | | | | | 2.13 | | | | | | 1.87 | (f) | | | | | 51 | |
| | | 6.52 | | | | | | (11.99 | ) | | | | | 116,023 | | | | | | 0.90 | | | | | | 0.98 | | | | | | 3.17 | (f) | | | | | 51 | |
| | | 6.52 | | | | | | (12.01 | ) | | | | | 1,315 | | | | | | 1.05 | | | | | | 1.13 | | | | | | 0.54 | (f) | | | | | 51 | |
| | |
| The accompanying notes are an integral part of these financial statements. | | 65 |
GOLDMAN SACHS U.S. TAX-MANAGED EQUITY FUND
Financial Highlights
Selected Data for a Share Outstanding Throughout Each Year
| | | | | | | | | | | | | | | | | | | | | | | | | | | | | | |
| | | | | | | | Income (loss) from
investment operations | | | Distributions
to shareholders | |
| | | Year - Share Class | |
Net asset
value,
beginning
of year | | | Net
investment
income (loss)(a) | | | Net realized
and unrealized
gain (loss) | | | Total from
investment
operations | | | From net
investment
income | | | From net
realized
gains | | | Total
distributions | |
| | FOR THE FISCAL YEARS ENDED DECEMBER 31, | |
| | 2015 - A | | $ | 17.44 | | | $ | 0.13 | | | $ | (0.18 | ) | | $ | (0.05 | ) | | $ | (0.11 | ) | | $ | — | | | $ | (0.11 | ) |
| | 2015 - C | | | 16.67 | | | | — | (d) | | | (0.18 | ) | | | (0.18 | ) | | | (0.01 | ) | | | — | | | | (0.01 | ) |
| | 2015 - Institutional | | | 17.69 | | | | 0.20 | | | | (0.18 | ) | | | 0.02 | | | | (0.18 | ) | | | — | | | | (0.18 | ) |
| | 2015 - Service | | | 17.53 | | | | 0.12 | | | | (0.19 | ) | | | (0.07 | ) | | | (0.13 | ) | | | — | | | | (0.13 | ) |
| | 2015 - IR | | | 17.70 | | | | 0.18 | | | | (0.18 | ) | | | — | (d) | | | (0.16 | ) | | | — | | | | (0.16 | ) |
| | 2014 - A | | | 15.45 | | | | 0.09 | | | | 1.97 | | | | 2.06 | | | | (0.07 | ) | | | — | | | | (0.07 | ) |
| | 2014 - C | | | 14.82 | | | | (0.04 | ) | | | 1.89 | | | | 1.85 | | | | — | | | | — | | | | — | |
| | 2014 - Institutional | | | 15.66 | | | | 0.15 | | | | 2.01 | | | | 2.16 | | | | (0.13 | ) | | | — | | | | (0.13 | ) |
| | 2014 - Service | | | 15.49 | | | | 0.04 | | | | 2.00 | | | | 2.04 | | | | — | | | | — | | | | — | |
| | 2014 - IR | | | 15.68 | | | | 0.13 | | | | 2.00 | | | | 2.13 | | | | (0.11 | ) | | | — | | | | (0.11 | ) |
| | 2013 - A | | | 11.38 | | | | 0.11 | | | | 4.22 | | | | 4.33 | | | | (0.08 | ) | | | (0.18 | ) | | | (0.26 | ) |
| | 2013 - C | | | 10.95 | | | | — | (d) | | | 4.05 | | | | 4.05 | | | | — | | | | (0.18 | ) | | | (0.18 | ) |
| | 2013 - Institutional | | | 11.54 | | | | 0.16 | | | | 4.28 | | | | 4.44 | | | | (0.14 | ) | | | (0.18 | ) | | | (0.32 | ) |
| | 2013 - Service | | | 11.46 | | | | 0.12 | | | | 4.22 | | | | 4.34 | | | | (0.13 | ) | | | (0.18 | ) | | | (0.31 | ) |
| | 2013 - IR | | | 11.55 | | | | 0.14 | | | | 4.29 | | | | 4.43 | | | | (0.12 | ) | | | (0.18 | ) | | | (0.30 | ) |
| | 2012 - A | | | 9.94 | | | | 0.12 | | | | 1.44 | (e) | | | 1.56 | | | | (0.12 | ) | | | — | | | | (0.12 | ) |
| | 2012 - C | | | 9.57 | | | | 0.05 | | | | 1.38 | (e) | | | 1.43 | | | | (0.05 | ) | | | — | | | | (0.05 | ) |
| | 2012 - Institutional | | | 10.08 | | | | 0.18 | | | | 1.46 | (e) | | | 1.64 | | | | (0.18 | ) | | | — | | | | (0.18 | ) |
| | 2012 - Service | | | 10.01 | | | | 0.12 | | | | 1.45 | (e) | | | 1.57 | | | | (0.12 | ) | | | — | | | | (0.12 | ) |
| | 2012 - IR | | | 10.09 | | | | 0.16 | | | | 1.46 | (e) | | | 1.62 | | | | (0.16 | ) | | | — | | | | (0.16 | ) |
| | 2011 - A | | | 9.73 | | | | 0.09 | (f) | | | 0.20 | | | | 0.29 | | | | (0.08 | ) | | | — | | | | (0.08 | ) |
| | 2011 - C | | | 9.39 | | | | 0.01 | (f) | | | 0.20 | | | | 0.21 | | | | (0.03 | ) | | | — | | | | (0.03 | ) |
| | 2011 - Institutional | | | 9.89 | | | | 0.13 | (f) | | | 0.21 | | | | 0.34 | | | | (0.15 | ) | | | — | | | | (0.15 | ) |
| | 2011 - Service | | | 9.81 | | | | 0.07 | (f) | | | 0.22 | | | | 0.29 | | | | (0.09 | ) | | | — | | | | (0.09 | ) |
| | 2011 - IR | | | 9.89 | | | | 0.10 | (f) | | | 0.23 | | | | 0.33 | | | | (0.13 | ) | | | — | | | | (0.13 | ) |
| | (a) | | Calculated based on the average shares outstanding methodology. |
| | (b) | | Assumes investment at the net asset value at the beginning of the year, reinvestment of all distributions, a complete redemption of the investment at the net asset value at the end of the year and no sales or redemption charges. Total returns would be reduced if a sales or redemption charge was taken into account. Returns do not reflect the deduction of taxes that a shareholder would pay on Fund distributions or the redemption of Fund shares. |
| | (c) | | The Fund’s portfolio turnover rate is calculated in accordance with regulatory requirements, without regard to transactions involving short term investments and certain derivatives. If such transactions were included, the Fund’s portfolio turnover rate may be higher. |
| | (d) | | Amount is less than $0.005 per share. |
| | (e) | | Reflects payment from affiliate relating to certain investment transactions which amounted to $0.02 per share. Excluding such payment, the total return would have been 15.49%,14.74%, 14.68%, 15.92%, 15.36% and 15.80%, respectively. |
| | (f) | | Reflects income recognized from special dividends which amounted to $0.02 per share and 0.18% of average net assets. |
| | |
| 66 | | The accompanying notes are an integral part of these financial statements. |
GOLDMAN SACHS U.S. TAX-MANAGED EQUITY FUND
| | | | | | | | | | | | | | | | | | | | | | | | | | | | | | | | | | | | | | | | |
| | | | | | | | | | | | | | | | | | | | | | | | | | | | | | | | | | |
| | | Net asset
value, end
of year | | | | | Total
return(b) | | | | | Net assets, end of year
(in 000s) | | | | | Ratio of net expenses to average net assets | | | | | Ratio of total expenses to average net assets | | | | | Ratio of net investment income (loss) to average net assets | | | | | Portfolio turnover rate(c) | |
| | | | | | | | | | | | | | | | | | | | | | | | | | | | | | | | | | | | | | | | |
| | $ | 17.28 | | | | | | (0.28 | )% | | | | $ | 57,913 | | | | | | 1.17 | % | | | | | 1.17 | % | | | | | 0.73 | % | | | | | 96 | % |
| | | 16.48 | | | | | | (1.05 | ) | | | | | 22,194 | | | | | | 1.92 | | | | | | 1.92 | | | | | | (0.02 | ) | | | | | 96 | |
| | | 17.53 | | | | | | 0.10 | | | | | | 957,273 | | | | | | 0.77 | | | | | | 0.77 | | | | | | 1.12 | | | | | | 96 | |
| | | 17.33 | | | | | | (0.41 | ) | | | | | 1,236 | | | | | | 1.27 | | | | | | 1.27 | | | | | | 0.67 | | | | | | 96 | |
| | | 17.54 | | | | | | (0.03 | ) | | | | | 6,799 | | | | | | 0.92 | | | | | | 0.92 | | | | | | 0.99 | | | | | | 96 | |
| | | 17.44 | | | | | | 13.32 | | | | | | 51,253 | | | | | | 1.18 | | | | | | 1.19 | | | | | | 0.52 | | | | | | 57 | |
| | | 16.67 | | | | | | 12.48 | | | | | | 15,750 | | | | | | 1.93 | | | | | | 1.94 | | | | | | (0.22 | ) | | | | | 57 | |
| | | 17.69 | | | | | | 13.78 | | | | | | 735,421 | | | | | | 0.78 | | | | | | 0.79 | | | | | | 0.93 | | | | | | 57 | |
| | | 17.53 | | | | | | 13.17 | | | | | | 58 | | | | | | 1.28 | | | | | | 1.29 | | | | | | 0.25 | | | | | | 57 | |
| | | 17.70 | | | | | | 13.57 | | | | | | 4,175 | | | | | | 0.93 | | | | | | 0.94 | | | | | | 0.78 | | | | | | 57 | |
| | | 15.45 | | | | | | 38.17 | | | | | | 34,792 | | | | | | 1.15 | | | | | | 1.21 | | | | | | 0.80 | | | | | | 95 | |
| | | 14.82 | | | | | | 37.07 | | | | | | 10,648 | | | | | | 1.90 | | | | | | 1.96 | | | | | | 0.04 | | | | | | 95 | |
| | | 15.66 | | | | | | 38.73 | | | | | | 493,729 | | | | | | 0.75 | | | | | | 0.81 | | | | | | 1.17 | | | | | | 95 | |
| | | 15.49 | | | | | | 38.08 | | | | | | 411 | | | | | | 1.27 | | | | | | 1.29 | | | | | | 0.81 | | | | | | 95 | |
| | | 15.68 | | | | | | 38.48 | | | | | | 843 | | | | | | 0.91 | | | | | | 0.96 | | | | | | 1.02 | | | | | | 95 | |
| | | 11.38 | | | | | | 15.69 | (e) | | | | | 35,890 | | | | | | 1.09 | | | | | | 1.23 | | | | | | 1.13 | | | | | | 184 | |
| | | 10.95 | | | | | | 14.89 | (e) | | | | | 8,228 | | | | | | 1.84 | | | | | | 1.97 | | | | | | 0.44 | | | | | | 184 | |
| | | 11.54 | | | | | | 16.12 | (e) | | | | | 304,435 | | | | | | 0.69 | | | | | | 0.82 | | | | | | 1.65 | | | | | | 184 | |
| | | 11.46 | | | | | | 15.56 | (e) | | | | | 40 | | | | | | 1.19 | | | | | | 1.32 | | | | | | 1.11 | | | | | | 184 | |
| | | 11.55 | | | | | | 16.01 | (e) | | | | | 476 | | | | | | 0.84 | | | | | | 0.97 | | | | | | 1.42 | | | | | | 184 | |
| | | 9.94 | | | | | | 3.02 | | | | | | 51,064 | | | | | | 1.09 | | | | | | 1.24 | | | | | | 0.85 | (f) | | | | | 99 | |
| | | 9.57 | | | | | | 2.22 | | | | | | 7,964 | | | | | | 1.84 | | | | | | 1.99 | | | | | | 0.14 | (f) | | | | | 99 | |
| | | 10.08 | | | | | | 3.43 | | | | | | 227,070 | | | | | | 0.69 | | | | | | 0.84 | | | | | | 1.31 | (f) | | | | | 99 | |
| | | 10.01 | | | | | | 2.92 | | | | | | 36 | | | | | | 1.19 | | | | | | 1.34 | | | | | | 0.72 | (f) | | | | | 99 | |
| | | 10.09 | | | | | | 3.35 | | | | | | 494 | | | | | | 0.84 | | | | | | 0.99 | | | | | | 1.01 | (f) | | | | | 99 | |
| | |
| The accompanying notes are an integral part of these financial statements. | | 67 |
GOLDMAN SACHS INTERNATIONAL TAX-MANAGED EQUITY FUND
Financial Highlights
Selected Data for a Share Outstanding Throughout Each Year
| | | | | | | | | | | | | | | | | | | | | | |
| | | | | | | | Income (loss) from
investment operations | | | | |
| | | Year - Share Class | | Net asset
value,
beginning
of year | | | Net
investment
income(a) | | | Net realized
and unrealized
gain (loss) | | | Total from
investment
operations | | | Distributions
to shareholders
from net
investment
income | |
| | FOR THE FISCAL YEARS ENDED DECEMBER 31, | |
| | 2015 - A | | $ | 8.45 | | | $ | 0.11 | | | $ | 0.21 | | | $ | 0.32 | | | $ | (0.10 | ) |
| | 2015 - C | | | 8.27 | | | | 0.02 | | | | 0.23 | | | | 0.25 | | | | (0.07 | ) |
| | 2015 - Institutional | | | 8.36 | | | | 0.15 | | | | 0.21 | | | | 0.36 | | | | (0.13 | ) |
| | 2015 - IR | | | 8.43 | | | | 0.07 | | | | 0.27 | | | | 0.34 | | | | (0.12 | ) |
| | 2014 - A | | | 9.18 | | | | 0.27 | (d) | | | (0.80 | ) | | | (0.53 | ) | | | (0.20 | ) |
| | 2014 - C | | | 9.03 | | | | 0.15 | (d) | | | (0.74 | ) | | | (0.59 | ) | | | (0.17 | ) |
| | 2014 - Institutional | | | 9.10 | | | | 0.28 | (d) | | | (0.77 | ) | | | (0.49 | ) | | | (0.25 | ) |
| | 2014 - IR | | | 9.17 | | | | 0.29 | (d) | | | (0.80 | ) | | | (0.51 | ) | | | (0.23 | ) |
| | 2013 - A | | | 7.62 | | | | 0.15 | | | | 1.54 | | | | 1.69 | | | | (0.13 | )(e) |
| | 2013 - C | | | 7.55 | | | | 0.10 | | | | 1.51 | | | | 1.61 | | | | (0.13 | )(e) |
| | 2013 - Institutional | | | 7.59 | | | | 0.19 | | | | 1.53 | | | | 1.72 | | | | (0.21 | )(e) |
| | 2013 - IR | | | 7.66 | | | | 0.20 | | | | 1.51 | | | | 1.71 | | | | (0.20 | )(e) |
| | 2012 - A | | | 6.65 | | | | 0.17 | | | | 0.98 | | | | 1.15 | | | | (0.18 | ) |
| | 2012 - C | | | 6.64 | | | | 0.11 | | | | 0.96 | | | | 1.07 | | | | (0.16 | ) |
| | 2012 - Institutional | | | 6.64 | | | | 0.19 | | | | 0.98 | | | | 1.17 | | | | (0.22 | ) |
| | 2012 - IR | | | 6.64 | | | | 0.35 | | | | 0.82 | | | | 1.17 | | | | (0.15 | ) |
| | 2011 - A | | | 7.90 | | | | 0.20 | (f) | | | (1.25 | ) | | | (1.05 | ) | | | (0.20 | ) |
| | 2011 - C | | | 7.88 | | | | 0.13 | (f) | | | (1.23 | ) | | | (1.10 | ) | | | (0.14 | ) |
| | 2011 - Institutional | | | 7.90 | | | | 0.21 | (f) | | | (1.23 | ) | | | (1.02 | ) | | | (0.24 | ) |
| | 2011 - IR | | | 7.90 | | | | 0.20 | (f) | | | (1.24 | ) | | | (1.04 | ) | | | (0.22 | ) |
| | (a) | | Calculated based on the average shares outstanding methodology. |
| | (b) | | Assumes investment at the net asset value at the beginning of the year, reinvestment of all distributions, a complete redemption of the investment at the net asset value at the end of the year and no sales or redemption charges. |
| | (c) | | The Fund’s portfolio turnover rate is calculated in accordance with regulatory requirements, without regard to transactions involving short term investments and certain derivatives. If such transactions were included, the Fund’s portfolio turnover rate may be higher. |
| | (d) | | Reflects income recognized from special dividends which amounted to $0.06 per share and 0.71% of average net assets. |
| | (e) | | Includes a distribution from capital of less than $0.01 per share. |
| | (f) | | Reflects income recognized from special dividends which amounted to $0.01 per share and 0.16% of average net assets. |
| | |
| 68 | | The accompanying notes are an integral part of these financial statements. |
GOLDMAN SACHS INTERNATIONAL TAX-MANAGED EQUITY FUND
| | | | | | | | | | | | | | | | | | | | | | | | | | | | | | | | | | | | | | | | |
| | | | | | | | | | | | | | | | | | | | | | | | | | | | | | | | | | |
| | | Net asset
value, end
of year | | | | | Total
return(b) | | | | | Net assets,
end of
year
(in 000s) | | | | | Ratio of
net expenses
to average
net assets | | | | | Ratio of
total expenses
to average
net assets | | | | | Ratio of
net investment
income
to average
net assets | | | | | Portfolio
turnover
rate(c) | |
| | | | | | | | | | | | | | | | | | | | | | | | | | | | | | | | | | | | | | | | |
| | $ | 8.67 | | | | | | 3.77 | % | | | | $ | 3,408 | | | | | | 1.38 | % | | | | | 1.39 | % | | | | | 1.22 | % | | | | | 113 | % |
| | | 8.45 | | | | | | 3.07 | | | | | | 812 | | | | | | 2.13 | | | | | | 2.13 | | | | | | 0.20 | | | | | | 113 | |
| | | 8.59 | | | | | | 4.26 | | | | | | 426,168 | | | | | | 0.98 | | | | | | 0.99 | | | | | | 1.71 | | | | | | 113 | |
| | | 8.65 | | | | | | 4.04 | | | | | | 1,444 | | | | | | 1.13 | | | | | | 1.13 | | | | | | 0.84 | | | | | | 113 | |
| | | 8.45 | | | | | | (5.79 | ) | | | | | 2,151 | | | | | | 1.38 | | | | | | 1.42 | | | | | | 2.98 | (d) | | | | | 106 | |
| | | 8.27 | | | | | | (6.55 | ) | | | | | 181 | | | | | | 2.13 | | | | | | 2.17 | | | | | | 1.71 | (d) | | | | | 106 | |
| | | 8.36 | | | | | | (5.48 | ) | | | | | 316,062 | | | | | | 0.98 | | | | | | 1.02 | | | | | | 3.12 | (d) | | | | | 106 | |
| | | 8.43 | | | | | | (5.59 | ) | | | | | 205 | | | | | | 1.13 | | | | | | 1.17 | | | | | | 3.12 | (d) | | | | | 106 | |
| | | 9.18 | | | | | | 22.23 | | | | | | 3,388 | | | | | | 1.31 | | | | | | 1.51 | | | | | | 1.79 | | | | | | 95 | |
| | | 9.03 | | | | | | 21.38 | | | | | | 70 | | | | | | 2.10 | | | | | | 2.23 | | | | | | 1.15 | | | | | | 95 | |
| | | 9.10 | | | | | | 22.70 | | | | | | 228,410 | | | | | | 0.95 | | | | | | 1.08 | | | | | | 2.27 | | | | | | 95 | |
| | | 9.17 | | | | | | 22.36 | | | | | | 217 | | | | | | 1.12 | | | | | | 1.21 | | | | | | 2.34 | | | | | | 95 | |
| | | 7.62 | | | | | | 17.25 | | | | | | 15,384 | | | | | | 1.26 | | | | | | 1.59 | | | | | | 2.44 | | | | | | 182 | |
| | | 7.55 | | | | | | 16.20 | | | | | | 32 | | | | | | 2.01 | | | | | | 2.30 | | | | | | 1.52 | | | | | | 182 | |
| | | 7.59 | | | | | | 17.71 | | | | | | 134,290 | | | | | | 0.86 | | | | | | 1.17 | | | | | | 2.69 | | | | | | 182 | |
| | | 7.66 | | | | | | 17.68 | | | | | | 1 | | | | | | 1.02 | | | | | | 1.36 | | | | | | 5.14 | | | | | | 182 | |
| | | 6.65 | | | | | | (13.33 | ) | | | | | 40,837 | | | | | | 1.26 | | | | | | 1.57 | | | | | | 2.60 | (f) | | | | | 88 | |
| | | 6.64 | | | | | | (13.88 | ) | | | | | 19 | | | | | | 2.01 | | | | | | 2.32 | | | | | | 1.72 | (f) | | | | | 88 | |
| | | 6.64 | | | | | | (12.92 | ) | | | | | 101,165 | | | | | | 0.86 | | | | | | 1.17 | | | | | | 2.81 | (f) | | | | | 88 | |
| | | 6.64 | | | | | | (13.11 | ) | | | | | 1 | | | | | | 1.01 | | | | | | 1.32 | | | | | | 2.68 | (f) | | | | | 88 | |
| | |
| The accompanying notes are an integral part of these financial statements. | | 69 |
GOLDMAN SACHS TAX-ADVANTAGED EQUITY FUNDS
Notes to Financial Statements
December 31, 2015
Goldman Sachs Trust (the “Trust”) is a Delaware statutory trust registered under the Investment Company Act of 1940, as amended (the “Act”), as an open-end management investment company. The following table lists those series of the Trust that are included in this report (collectively, the “Funds” or individually a “Fund”), along with their corresponding share classes and respective diversification status under the Act:
| | | | |
| Fund | | Share Classes Offered | | Diversified/
Non-diversified |
U.S. Equity Dividend and Premium, International Equity Dividend and Premium, International Tax-Managed Equity | | A, C, Institutional and IR | | Diversified |
U.S. Tax-Managed Equity | | A, C, Institutional, Service and IR | | Diversified |
Class A Shares are sold with a front-end sales charge of up to 5.50%. Class C Shares are sold with a contingent deferred sales charge (“CDSC”) of 1.00%, which is imposed on redemptions made within 12 months of purchase. Institutional, Service and Class IR Shares are not subject to a sales charge.
Goldman Sachs Asset Management, L.P. (“GSAM”), an affiliate of Goldman, Sachs & Co. (“Goldman Sachs”), serves as investment adviser to the Funds pursuant to a management agreement (the “Agreement”) with the Trust.
|
| 2. SIGNIFICANT ACCOUNTING POLICIES |
The financial statements have been prepared in accordance with accounting principles generally accepted in the United States of America (“GAAP”) and require management to make estimates and assumptions that may affect the reported amounts and disclosures. Actual results may differ from those estimates and assumptions.
70
GOLDMAN SACHS TAX-ADVANTAGED EQUITY FUNDS
|
| 2. SIGNIFICANT ACCOUNTING POLICIES (continued) |
A. Investment Valuation — The Funds’ valuation policy is to value investments at fair value.
B. Investment Income and Investments — Investment income includes interest income and dividend income, net of any foreign withholding taxes, less any amounts reclaimable. Interest income is accrued daily and adjusted for amortization of premiums and accretion of discounts. Dividend income is recognized on ex-dividend date or, for certain foreign securities, as soon as such information is obtained subsequent to the ex-dividend date. Investment transactions are reflected on trade date. Realized gains and losses are calculated using identified cost. Investment transactions are recorded on the following business day for daily net asset value (“NAV”) calculations. Any foreign capital gains tax is accrued daily based upon net unrealized gains, and is payable upon sale of such investments. Distributions received from the Funds’ investments in United States (“U.S.”) real estate investment trusts (“REITs”) may be characterized as ordinary income, net capital gain or a return of capital. A return of capital is recorded by the Funds as a reduction to the cost basis of the REIT.
For derivative contracts, realized gains and losses are recorded upon settlement of the contract.
C. Class Allocations and Expenses — Investment income, realized and unrealized gain (loss), and non-class specific expenses of each Fund are allocated daily based upon the proportion of net assets of each class. Non-class specific expenses directly incurred by a Fund are charged to that Fund, while such expenses incurred by the Trust are allocated across the applicable Funds on a straight-line and/or pro-rata basis depending upon the nature of the expenses. Class specific expenses, where applicable, are borne by the respective share classes and include Distribution and Service, Transfer Agency and Service and Shareholder Administration fees.
D. Federal Taxes and Distributions to Shareholders — It is each Fund’s policy to comply with the requirements of the Internal Revenue Code of 1986, as amended (the “Code”), applicable to regulated investment companies (mutual funds) and to distribute each year substantially all of its investment company taxable income and capital gains to its shareholders. Accordingly, the Funds are not required to make any provisions for the payment of federal income tax. Distributions to shareholders are recorded on the ex-dividend date. Income and capital gains distributions, if any, are declared and paid according to the following schedule:
| | | | | | |
| Fund | | | | Income Distributions Declared/Paid | | Capital Gains Distributions
Declared/Paid |
U.S. Equity Dividend and Premium International Equity Dividend and Premium | | | | Quarterly | | Annually |
U.S. Tax-Managed Equity International Tax-Managed Equity | | | | Annually | | Annually |
71
GOLDMAN SACHS TAX-ADVANTAGED EQUITY FUNDS
Notes to Financial Statements (continued)
December 31, 2015
|
| 2. SIGNIFICANT ACCOUNTING POLICIES (continued) |
Net capital losses are carried forward to future fiscal years and may be used to the extent allowed by the Code to offset any future capital gains. Utilization of capital loss carryforwards will reduce the requirement of future capital gains distributions.
Under the Regulated Investment Company Modernization Act of 2010, the Funds are permitted to carry forward capital losses incurred in taxable years beginning after December 22, 2010 for an unlimited period. However, any losses incurred during those future taxable years will be required to be utilized prior to the losses incurred in pre-enactment taxable years. As a result of this ordering rule, pre-enactment capital loss carryforwards may be more likely to expire unused. Additionally, post-enactment capital losses that are carried forward will retain their character as either short-term or long-term capital losses rather than being considered all short-term as under previous law.
The characterization of distributions to shareholders for financial reporting purposes is determined in accordance with federal income tax rules, which may differ from GAAP. The source of each Fund’s distributions may be shown in the accompanying financial statements as either from net investment income, net realized gain or capital. Certain components of the Funds’ net assets on the Statements of Assets and Liabilities reflect permanent GAAP/tax differences based on the appropriate tax character.
E. Foreign Currency Translation — The accounting records and reporting currency of the Funds are maintained in U.S. dollars. Assets and liabilities denominated in foreign currencies are translated into U.S. dollars using the current exchange rates at the close of each business day. The effect of changes in foreign currency exchange rates on investments is included within net realized and unrealized gain (loss) on investments. Changes in the value of other assets and liabilities as a result of fluctuations in foreign exchange rates are included in the Statements of Operations within net change in unrealized gain (loss) on foreign currency translations. Transactions denominated in foreign currencies are translated into U.S. dollars on the date the transaction occurred, the effects of which are included within net realized gain (loss) on foreign currency transactions.
|
| 3. INVESTMENTS AND FAIR VALUE MEASUREMENTS |
The fair value of a financial instrument is the amount that would be received to sell an asset or paid to transfer a liability in an orderly transaction between market participants at the measurement date (i.e., the exit price). GAAP establishes a fair value hierarchy that prioritizes the inputs to valuation techniques used to measure fair value. The hierarchy gives the highest priority to unadjusted quoted prices in active markets for identical assets or liabilities (Level 1 measurements) and the lowest priority to unobservable inputs (Level 3 measurements). The levels used for classifying investments are not necessarily an indication of the risk associated with investing in these investments. The three levels of the fair value hierarchy are described below:
Level 1 — Unadjusted quoted prices in active markets that are accessible at the measurement date for identical, unrestricted assets or liabilities;
Level 2 — Quoted prices in markets that are not active or financial instruments for which significant inputs are observable (including, but not limited to, quoted prices for similar investments, interest rates, foreign exchange rates, volatility and credit spreads), either directly or indirectly;
Level 3 — Prices or valuations that require significant unobservable inputs (including GSAM’s assumptions in determining fair value measurement).
72
GOLDMAN SACHS TAX-ADVANTAGED EQUITY FUNDS
|
| 3. INVESTMENTS AND FAIR VALUE MEASUREMENTS (continued) |
Changes in valuation techniques may result in transfers into or out of an assigned level within the hierarchy. In accordance with the Funds’ policy, transfers between different levels of the fair value hierarchy resulting from such changes are deemed to have occurred as of the beginning of the reporting period.
The Board of Trustees (“Trustees”) has approved Valuation Procedures that govern the valuation of the portfolio investments held by the Funds, including investments for which market quotations are not readily available. The Trustees have delegated to GSAM day-to-day responsibility for implementing and maintaining internal controls and procedures related to the valuation of the Funds’ portfolio investments. To assess the continuing appropriateness of pricing sources and methodologies, GSAM regularly performs price verification procedures and issues challenges as necessary to third party pricing vendors or brokers, and any differences are reviewed in accordance with the Valuation Procedures.
A. Level 1 and Level 2 Fair Value Investments — The valuation techniques and significant inputs used in determining the fair values for investments classified as Level 1 and Level 2 are as follows:
Equity Securities — Equity securities traded on a U.S. securities exchange or the NASDAQ system, or those located on certain foreign exchanges, including but not limited to the Americas, are valued daily at their last sale price or official closing price on the principal exchange or system on which they are traded. If there is no sale or official closing price or such price is believed by GSAM to not represent fair value, equity securities are valued at the last bid price for long positions and at the last ask price for short positions. To the extent these investments are actively traded, they are classified as Level 1 of the fair value hierarchy, otherwise they are generally classified as Level 2.
Unlisted equity securities for which market quotations are available are valued at the last sale price on the valuation date, or if no sale occurs, at the last bid price. Securities traded on certain foreign securities exchanges are valued daily at fair value determined by an independent fair value service (if available) under Valuation Procedures approved by the Trustees and consistent with applicable regulatory guidance. The independent fair value service takes into account multiple factors including, but not limited to, movements in the securities markets, certain depositary receipts, futures contracts and foreign currency exchange rates that have occurred subsequent to the close of the foreign securities exchange. These investments are generally classified as Level 2 of the fair value hierarchy.
Money Market Funds — Investments in the Goldman Sachs Financial Square Government and Goldman Sachs Financial Square Money Market Funds (“Underlying Funds”) are valued at the NAV of the FST Share class on the day of valuation. These investments are generally classified as Level 1 of the fair value hierarchy. For information regarding an Underlying Fund’s accounting policies and investment holdings, please see the Underlying Fund’s shareholder report.
Derivative Contracts — A derivative is an instrument whose value is derived from underlying assets, indices, reference rates or a combination of these factors. The Funds enter into derivative transactions to hedge against changes in interest rates, securities prices, and/or currency exchange rates, to increase total return, or to gain access to certain markets or attain exposure to other underliers.
73
GOLDMAN SACHS TAX-ADVANTAGED EQUITY FUNDS
Notes to Financial Statements (continued)
December 31, 2015
|
| 3. INVESTMENTS AND FAIR VALUE MEASUREMENTS (continued) |
Exchange-traded derivatives, including futures and options contracts, are valued at the last sale or settlement price and typically fall within Level 1 of the fair value hierarchy. Over-the-counter (“OTC”) and centrally cleared derivatives are valued using market transactions and other market evidence, including market-based inputs to models, calibration to market-clearing transactions, broker or dealer quotations, or other alternative pricing sources. Where models are used, the selection of a particular model to value OTC and centrally cleared derivatives depends upon the contractual terms of, and specific risks inherent in, the instrument, as well as the availability of pricing information in the market. Valuation models require a variety of inputs, including contractual terms, market prices, yield curves, credit curves, measures of volatility, voluntary and involuntary prepayment rates, loss severity rates and correlations of such inputs. For OTC and centrally cleared derivatives that trade in liquid markets, model inputs can generally be verified and model selection does not involve significant management judgment. OTC and centrally cleared derivatives are classified within Level 2 of the fair value hierarchy when significant inputs are corroborated by market evidence.
i. Futures Contracts — Futures contracts are contracts to buy or sell a standardized quantity of a specified commodity or security and are valued based on exchanged settlement prices or independent market quotes. Futures contracts are valued at the last settlement price, or in the absence of a sale, the last bid price for long positions and at the last ask price for short positions, at the end of each day on the board of trade or exchange upon which they are traded. Upon entering into a futures contract, a Fund deposits cash or securities in an account on behalf of the broker in an amount sufficient to meet the initial margin requirement. Subsequent payments are made or received by a Fund equal to the daily change in the contract value and are recorded as variation margin receivable or payable with a corresponding offset to unrealized gains or losses.
ii. Options — When a Fund writes call or put options, an amount equal to the premium received is recorded as a liability and is subsequently marked-to-market to reflect the current value of the option written. Swaptions are options on interest rate swap contracts.
Upon the purchase of a call option or a put option by a Fund, the premium paid is recorded as an investment and subsequently marked-to-market to reflect the current value of the option. Certain options may be purchased with premiums to be determined on a future date. The premiums for these options are based upon implied volatility parameters at specified terms.
B. Level 3 Fair Value Investments — To the extent that significant inputs to valuation models and other alternative pricing sources are unobservable, or if quotations are not readily available, or if GSAM believes that such quotations do not accurately reflect fair value, the fair value of the Funds’ investments may be determined under Valuation Procedures approved by the Trustees. GSAM, consistent with its procedures and applicable regulatory guidance, may make an adjustment to the most recent valuation prices of either domestic or foreign securities in light of significant events to reflect what it believes to be the fair value of the securities at the time of determining a Fund’s NAV. Significant events which could affect a large number of securities in a particular market may include, but are not limited to: significant fluctuations in U.S. or foreign markets; market dislocations; market disruptions; or unscheduled market closings. Significant events which could also affect a single issuer may include, but are not limited to: corporate actions such as reorganizations, mergers and buy-outs; ratings downgrades; and bankruptcies.
74
GOLDMAN SACHS TAX-ADVANTAGED EQUITY FUNDS
|
| 3. INVESTMENTS AND FAIR VALUE MEASUREMENTS (continued) |
C. Fair Value Hierarchy — The following is a summary of the Funds’ investments and derivatives classified in the fair value hierarchy as of December 31, 2015:
| | | | | | | | | | | | |
| | | |
| U.S. EQUITY DIVIDEND AND PREMIUM | | | | | | | | | | | | |
| | | |
| Investment Type | | Level 1 | | | Level 2 | | | Level 3 | |
| Assets | | | | | | | | | | | | |
Common Stock and/or Other Equity Investments(a) | | | | | | | | | | | | |
North America | | $ | 1,540,041,952 | | | $ | — | | | $ | — | |
Investment Company | | | 76,057,604 | | | | — | | | | — | |
| Total | | $ | 1,616,099,556 | | | $ | — | | | $ | — | |
| | | |
| Derivative Type | | | | | | | | | |
| Liabilities | | | | | | | | | | | | |
Futures Contracts(b) | | $ | (34,713 | ) | | $ | — | | | $ | — | |
Written Options | | | (10,809,920 | ) | | | — | | | | — | |
| Total | | $ | (10,844,633 | ) | | $ | — | | | $ | — | |
| | | |
| INTERNATIONAL EQUITY DIVIDEND AND PREMIUM | | | | | | | | | | | | |
| | | |
| Investment Type | | Level 1 | | | Level 2 | | | Level 3 | |
| Assets | | | | | | | | | | | | |
Common Stock and/or Other Equity Investments(a) | | | | | | | | | | | | |
Asia | | $ | 1,901,131 | | | $ | 82,050,671 | | | $ | — | |
Australia and Oceania | | | — | | | | 20,144,361 | | | | — | |
Europe | | | 17,743,912 | | | | 173,082,116 | | | | — | |
North America | | | 404,929 | | | | 200,702 | | | | — | |
| Total | | $ | 20,049,972 | | | $ | 275,477,850 | | | $ | — | |
| | | |
| Derivative Type | | | | | | | | | |
| Liabilities | | | | | | | | | | | | |
Futures Contracts(b) | | $ | (12,104 | ) | | $ | — | | | $ | — | |
Written Options | | | (2,458,818 | ) | | | — | | | | — | |
| Total | | $ | (2,470,922 | ) | | $ | — | | | $ | — | |
| | | |
| U.S. TAX-MANAGED EQUITY | | | | | | | | | | | | |
| | | |
| Investment Type | | Level 1 | | | Level 2 | | | Level 3 | |
| Assets | | | | | | | | | | | | |
Common Stock and/or Other Equity Investments(a) | | | | | | | | | | | | |
North America | | $ | 1,057,022,960 | | | $ | 33,297 | | | $ | — | |
Securities Lending Reinvestment Vehicle | | | 19,803,509 | | | | — | | | | — | |
| Total | | $ | 1,076,826,469 | | | $ | 33,297 | | | $ | — | |
75
GOLDMAN SACHS TAX-ADVANTAGED EQUITY FUNDS
Notes to Financial Statements (continued)
December 31, 2015
|
| 3. INVESTMENTS AND FAIR VALUE MEASUREMENTS (continued) |
| | | | | | | | | | | | |
| | | |
| U.S. TAX-MANAGED EQUITY (continued) | | | | | | | | | | | | |
| | | |
| Derivative Type | | Level 1 | | | Level 2 | | | Level 3 | |
| Liabilities(b) | | | | | | | | | | | | |
Futures Contracts | | $ | (7,166 | ) | | $ | — | | | $ | — | |
| | | |
| INTERNATIONAL TAX-MANAGED EQUITY | | | | | | | | | | | | |
| | | |
| Investment Type | | Level 1 | | | Level 2 | | | Level 3 | |
| Assets | | | | | | | | | | | | |
Common Stock and/or Other Equity Investments(a) | | | | | | | | | | | | |
Africa | | $ | — | | | $ | 2,789,381 | | | $ | — | |
Asia | | | 53,383 | | | | 132,722,847 | | | | — | |
Australia and Oceania | | | — | | | | 27,892,254 | | | | — | |
Europe | | | 5,447,183 | | | | 256,607,932 | | | | — | |
North America | | | 2,252,951 | | | | 281,666 | | | | — | |
Securities Lending Reinvestment Vehicle | | | 3,320,125 | | | | — | | | | — | |
| Total | | $ | 11,073,642 | | | $ | 420,294,080 | | | $ | — | |
| | | |
| Derivative Type | | Level 1 | | | Level 2 | | | Level 3 | |
| Assets(b) | | | | | | | | | | | | |
Futures Contracts | | $ | 119,026 | | | $ | — | | | $ | — | |
| Liabilities(b) | | | | | | | | | | | | |
Futures Contracts | | $ | (4,737 | ) | | $ | — | | | $ | — | |
| (a) | | Amounts are disclosed by continent to highlight the impact of time zone differences between local market close and the calculation of net asset value. Security valuations are based on the principal exchange or system on which they are traded, which may differ from country of domicile. The Funds utilize fair value model prices provided by an independent fair value service for international equities, resulting in a Level 2 classification. |
| (b) | | Amount shown represents unrealized gain (loss) at fiscal year end. |
For further information regarding security characteristics, see the Schedules of Investments.
76
GOLDMAN SACHS TAX-ADVANTAGED EQUITY FUNDS
|
| 4. INVESTMENTS IN DERIVATIVES |
The following table sets forth, by certain risk types, the gross value of derivative contracts as of December 31, 2015. These instruments were used as part of the Funds’ investment strategies and to obtain and/or manage exposure related to the risks below. The values in the tables below exclude the effects of cash collateral received or posted pursuant to these derivative contracts, and therefore are not representative of the Funds’ net exposure.
| | | | | | | | | | | | | | |
| | | | | | | | | | | | | | |
| Fund | | Risk | | Statements of Assets
and Liabilities | | Assets | | | Statements of Assets
and Liabilities | | Liabilities(a) | |
| U.S. Equity Dividend and Premium | | Equity | | — | | $ | — | | | Variation margin on certain derivative contracts, Payable for written options, at value | | $ | (10,844,633) | |
| International Equity Dividend and Premium | | Equity | | — | | | — | | | Variation margin on certain derivative contracts, Payable for written options, at value | | | (2,470,922) | |
| U.S. Tax-Managed Equity | | Equity | | — | | | — | | | Variation margin on certain derivative contracts | | | (7,166) | |
| International Tax-Managed Equity | | Equity | | Variation margin on certain derivative contracts | |
| 119,026
| (a)
| | Variation margin on certain derivative contracts | | | (4,737) | |
| Total | | | | | | | $119,026 | | | | | $ | (13,327,458) | |
| (a) | | Includes cumulative appreciation (depreciation) on futures contracts described in the Additional Investment Information sections of the Schedules of Investments. Only current day’s variation margin is reported within the Statements of Assets and Liabilities. |
The following table sets forth, by certain risk types, the Funds’ gains (losses) related to these derivatives and their indicative volumes for the fiscal year ended December 31, 2015. These gains (losses) should be considered in the context that these derivative contracts may have been executed to create investment opportunities and/or economically hedge certain investments, and accordingly, certain gains (losses) on such derivative contracts may offset certain (losses) gains attributable to investments. These gains (losses) are included in “Net realized gain (loss)” or “Net change in unrealized gain (loss)” on the Statements of Operations:
| | | | | | | | | | | | | | | | |
| | | | | | | | | | | | | | | | |
| Fund | | Risk | | Statements of Operations | | Net
Realized
Gain (Loss) | | | Net Change in
Unrealized
Gain (Loss) | | | Average
Number of
Contracts(a) | |
U.S. Equity Dividend and Premium | | Equity | | Net realized gain (loss) from futures contracts and written options/Net change in unrealized gain (loss) on futures contracts and written options | | $ | 24,369,430 | | | $ | (943,708 | ) | | | 3,176 | |
International Equity Dividend and Premium | | Equity | | Net realized gain (loss) from futures contracts and written options/Net change in unrealized gain (loss) on futures contracts and written options | | | (4,310,923 | ) | | | 534,894 | | | | 2,432 | |
77
GOLDMAN SACHS TAX-ADVANTAGED EQUITY FUNDS
Notes to Financial Statements (continued)
December 31, 2015
|
| 4. INVESTMENTS IN DERIVATIVES (continued) |
| | | | | | | | | | | | | | | | |
| | | | | | | | | | | | | | | | |
| Fund | | Risk | | Statements of Operations | | Net
Realized
Gain (Loss) | | | Net Change in
Unrealized
Gain (Loss) | | | Average
Number of
Contracts(a) | |
U.S. Tax-Managed Equity | | Equity | | Net realized gain (loss) from futures contracts/Net change in unrealized gain (loss) on futures contracts | | $ | 903,707 | | | $ | (9,886 | ) | | | 75 | |
International Tax-Managed Equity | | Equity | | Net realized gain (loss) from futures contracts/Net change in unrealized gain (loss) on futures contracts | | | (260,431 | ) | | | 74,501 | | | | 135 | |
| (a) | | Average number of contracts is based on the average of month end balances for the fiscal year ended December 31, 2015. |
|
| 5. AGREEMENTS AND AFFILIATED TRANSACTIONS |
A. Management Agreement — Under the Agreement, GSAM manages the Funds, subject to the general supervision of the Trustees.
As compensation for the services rendered pursuant to the Agreement, the assumption of the expenses related thereto and administration of the Funds’ business affairs, including providing facilities, GSAM is entitled to a management fee, accrued daily and paid monthly, equal to an annual percentage rate of each Fund’s average daily net assets.
For the fiscal year ended December 31, 2015, contractual and effective net management fees with GSAM were at the following rates:
| | | | | | | | | | | | | | | | | | | | | | | | | | | | |
| | | Contractual Management Rate | | | | |
| Fund | | First
$1 billion | | | Next
$1 billion | | | Next
$3 billion | | | Next
$3 billion | | | Over
$8 billion | | | Effective
Rate | | | Effective Net
Management
Rate^ | |
U.S. Equity Dividend and Premium | | | 0.75 | % | | | 0.68 | % | | | 0.65 | % | | | 0.64 | % | | | 0.63 | % | | | 0.73 | % | | | 0.72 | % |
International Equity Dividend and Premium | | | 0.81 | | | | 0.73 | | | | 0.69 | | | | 0.68 | | | | 0.67 | | | | 0.81 | | | | 0.81 | |
U.S. Tax-Managed Equity | | | 0.70 | | | | 0.63 | | | | 0.60 | | | | 0.59 | | | | 0.58 | | | | 0.70 | | | | 0.70 | |
International Tax-Managed Equity | | | 0.85 | | | | 0.77 | | | | 0.73 | | | | 0.72 | | | | 0.71 | | | | 0.85 | | | | 0.85 | |
| ^ | | Effective Net Management Rate includes the impact of management fee waivers of affiliated underlying funds, if any. |
The U.S. Equity Dividend and Premium Fund invests in FST Shares of the Goldman Sachs Financial Square Government Fund, which is an affiliated Underlying Fund. GSAM has agreed to waive a portion of its management fee payable by the Fund in an amount equal to the management fee it earns as an investment adviser to any of the affiliated Underlying Funds in which the Fund invests through at least April 30, 2016. Prior to such date GSAM may not terminate the arrangement without the approval of the Trustees. For the fiscal year ended December 31, 2015, GSAM waived $72,166 of the Fund’s management fee.
78
GOLDMAN SACHS TAX-ADVANTAGED EQUITY FUNDS
|
| 5. AGREEMENTS AND AFFILIATED TRANSACTIONS (continued) |
B. Distribution and Service Plans — The Trust, on behalf of each Fund, has adopted Distribution and Service Plans (the “Plans”). Under the Plans, Goldman Sachs, which serves as distributor (the “Distributor”), is entitled to a fee accrued daily and paid monthly, for distribution services and personal and account maintenance services, which may then be paid by Goldman Sachs to authorized dealers, at the following annual rates calculated on a Fund’s average daily net assets of each respective share class:
| | | | | | | | |
| | | Distribution and Service Plan Rates | |
| | | Class A* | | | Class C | |
Distribution Plan | | | 0.25 | % | | | 0.75 | % |
Service Plan | | | — | | | | 0.25 | |
| * | | With respect to Class A Shares, the Distributor at its discretion may use compensation for distribution services paid under the Distribution Plan to compensate service organizations for personal and account maintenance services and expenses as long as such total compensation does not exceed the maximum cap on “service fees” imposed by the Financial Industry Regulatory Authority. |
C. Distribution Agreement — Goldman Sachs, as Distributor of the shares of the Funds pursuant to a Distribution Agreement, may retain a portion of the Class A Shares’ front end sales charge and Class C Shares’ CDSC. During the fiscal year ended December 31, 2015, Goldman Sachs advised that it retained the front end sales charges of $46,644, $1,258, $12,969, and $1,899 for the U.S. Equity Dividend and Premium, International Equity Dividend and Premium, U.S. Tax-Managed Equity and International Tax-Managed Equity Funds, respectively.
D. Service Plan and Shareholder Administration Plan — The Trust, on behalf of each Fund that offers Service Shares, has adopted a Service Plan and a Shareholder Administration Plan. These plans allow for service organizations to provide varying levels of personal and account maintenance and shareholder administration services to their customers who are beneficial owners of such shares. The Service Plan and Shareholder Administration Plan each provide for compensation to the service organizations which is accrued daily and paid monthly at an annual rate of 0.25% (0.50% in aggregate) of the average daily net assets of the Service Shares.
E. Transfer Agency Agreement — Goldman Sachs also serves as the transfer agent of the Funds for a fee pursuant to the Transfer Agency Agreement. The fees charged for such transfer agency services are accrued daily and paid monthly at annual rates as follows: 0.19% of the average daily net assets of Class A, Class C and Class IR Shares; and 0.04% of the average daily net assets of Institutional and Service Shares.
F. Other Expense Agreements and Affiliated Transactions — GSAM has agreed to limit certain “Other Expenses” of the Funds (excluding acquired fund fees and expenses, transfer agency fees and expenses, service fees and shareholder administration fees (as applicable), taxes, interest, brokerage fees, shareholder meeting, litigation, indemnification and extraordinary expenses) to the extent such expenses exceed, on an annual basis, a percentage rate of the average daily net assets of each Fund. Such Other Expense reimbursements, if any, are accrued daily and paid monthly. In addition, the Funds are not obligated to reimburse GSAM for prior fiscal year expense reimbursements, if any. The Other Expense limitations as an annual percentage rate of average daily net assets for the U.S. Equity Dividend and Premium, International Equity Dividend and Premium, U.S. Tax-Managed Equity and International Tax-Managed Equity Funds are 0.014%, 0.124%, 0.044% and 0.094%, respectively. These Other Expense limitations will remain in place through at least April 30, 2016, and prior to such date GSAM may not terminate the arrangements without the approval of the Trustees. In addition, the Funds have entered into certain offset arrangements with the custodian and the transfer agent, which may result in a reduction of the Funds’ expenses and are received irrespective of the application of the “Other Expense” limitations described above.
79
GOLDMAN SACHS TAX-ADVANTAGED EQUITY FUNDS
Notes to Financial Statements (continued)
December 31, 2015
|
| 5. AGREEMENTS AND AFFILIATED TRANSACTIONS (continued) |
For the fiscal year ended December 31, 2015, these expense reductions, including any fee waivers and Other Expense reimbursements, were as follows:
| | | | | | | | | | | | | | | | | | |
| Fund | | | | Management
Fee Waiver | | | Other
Expense
Reimbursement | | | Custody Fee
Credits | | | Total
Expense
Reductions | |
U.S. Equity Dividend and Premium | | | | $ | 72,166 | | | $ | 298,263 | | | $ | 21,225 | | | $ | 391,654 | |
International Equity Dividend and Premium | | | | | — | | | | — | | | | 2,920 | | | | 2,920 | |
U.S. Tax-Managed Equity | | | | | — | | | | — | | | | 13,699 | | | | 13,699 | |
International Tax-Managed Equity | | | | | — | | | | 22,043 | | | | 5,667 | | | | 27,710 | |
G. Line of Credit Facility — As of December 31, 2015, the Funds participated in a $1,205,000,000 committed, unsecured revolving line of credit facility (the “facility”) together with other funds of the Trust and certain registered investment companies having management agreements with GSAM or its affiliates (“Other Borrowers”). Pursuant to the terms of the facility, the Funds and Other Borrowers could increase the credit amount by up to an additional $115,000,000, for a total of up to $1,320,000,000. This facility is to be used for temporary emergency purposes, or to allow for an orderly liquidation of securities to meet redemption requests. The interest rate on borrowings is based on the federal funds rate. The facility also requires a fee to be paid by the Funds based on the amount of the commitment that has not been utilized. For the fiscal year ended December 31, 2015, the Funds did not have any borrowings under the facility.
H. Other Transactions with Affiliates — For the fiscal year ended December 31, 2015, Goldman Sachs earned $4,102, $11,549, $298 and $9,071 in brokerage commissions from portfolio transactions, including futures transactions executed with Goldman Sachs as the Futures Commission Merchant, on behalf of the U.S. Equity Dividend and Premium, International Equity Dividend and Premium, U.S. Tax-Managed Equity and International Tax-Managed Equity Funds, respectively.
The following table provides information about the U.S. Equity Dividend & Premium Fund’s investment in the Goldman Sachs Financial Square Government Fund as of and for the fiscal year ended December 31, 2015:
| | | | | | | | | | | | | | | | | | | | |
| Underlying Fund | | Market
Value
12/31/14 | | | Purchases
at Cost | | | Proceeds
from Sales | | | Market
Value
12/31/15 | | | Dividend
Income | |
Goldman Sachs Financial Square Government Fund | | $ | — | | | $ | 309,669,141 | | | $ | (233,611,537 | ) | | $ | 76,057,604 | | | $ | 14,381 | |
As of December 31, 2015, the following Goldman Sachs Fund of Funds Portfolios were the beneficial owners of 5% or more of total outstanding shares of the following Funds:
| | | | | | | | | | | | | | |
| Fund | | | | | | | | Goldman Sachs
Enhanced Dividend
Global Equity
Portfolio | | | Goldman Sachs
Tax-Advantaged
Global Equity
Portfolio | |
U.S. Equity Dividend & Premium | | | | | | | | | 12 | % | | | — | % |
International Equity Dividend & Premium | | | | | | | | | 33 | | | | — | |
U.S. Tax-Managed Equity | | | | | | | | | — | | | | 82 | |
International Tax-Managed Equity | | | | | | | | | — | | | | 89 | |
80
GOLDMAN SACHS TAX-ADVANTAGED EQUITY FUNDS
|
| 6. PORTFOLIO SECURITIES TRANSACTIONS |
The cost of purchases and proceeds from sales and maturities of long-term securities for the fiscal year ended December 31, 2015, were as follows:
| | | | | | | | | | |
| Fund | | | | Purchases | | | Sales | |
U.S. Equity Dividend & Premium | | | | $ | 745,637,097 | | | $ | 565,275,677 | |
International Equity Dividend & Premium | | | | | 364,877,227 | | | | 470,500,670 | |
U.S. Tax-Managed Equity | | | | | 1,203,419,221 | | | | 942,198,165 | |
International Tax-Managed Equity | | | | | 547,942,657 | | | | 435,403,219 | |
Pursuant to exemptive relief granted by the Securities and Exchange Commission (“SEC”) and the terms and conditions contained therein, the U.S. Tax-Managed and International Tax-Managed Equity Funds may lend their securities through a securities lending agent, Goldman Sachs Agency Lending (“GSAL”), a wholly-owned subsidiary of Goldman Sachs, to certain qualified borrowers including Goldman Sachs and affiliates. In accordance with the Funds’ securities lending procedures, the Funds receive cash collateral at least equal to the market value of the securities on loan. The market value of the loaned securities is determined at the close of business of the Funds, at their last sale price or official closing price on the principal exchange or system on which they are traded, and any additional required collateral is delivered to the Funds on the next business day. As with other extensions of credit, the Funds may experience delay in the recovery of their securities or incur a loss should the borrower of the securities breach its agreement with the Funds or become insolvent at a time when the collateral is insufficient to cover the cost of repurchasing securities on loan. Dividend income received from securities on loan may not be subject to withholding taxes and therefore withholding taxes paid may differ from the amounts listed in the Statements of Operations. Loans of securities are terminable at any time and as such 1) the remaining contractual maturities of the outstanding securities lending transactions are considered to be overnight and continuous and 2) the borrower, after notice, is required to return borrowed securities within the standard time period for settlement of securities transactions.
The Funds invest the cash collateral received in connection with securities lending transactions in the Goldman Sachs Financial Square Money Market Fund (“Money Market Fund”), an affiliated series of the Trust. The Money Market Fund is registered under the Act as an open end investment company, is subject to Rule 2a-7 under the Act, and is managed by GSAM, for which GSAM may receive an investment advisory fee of up to 0.205% on an annualized basis of the average daily net assets of the Money Market Fund.
81
GOLDMAN SACHS TAX-ADVANTAGED EQUITY FUNDS
Notes to Financial Statements (continued)
December 31, 2015
|
| 7. SECURITIES LENDING (continued) |
In the event of a default by a borrower with respect to any loan, GSAL will exercise any and all remedies provided under the applicable borrower agreement to make the Funds whole. These remedies include purchasing replacement securities by applying the collateral held from the defaulting broker against the purchase cost of the replacement securities. If, despite such efforts by GSAL to exercise these remedies, the Funds sustain losses as a result of a borrower’s default, GSAL indemnifies the Funds by purchasing replacement securities at GSAL’s expense, or paying the Funds an amount equal to the market value of the replacement securities, subject to an exclusion for any shortfalls resulting from a loss of value in the cash collateral pool due to reinvestment risk and a requirement that the Funds agree to assign rights to the collateral to GSAL for purpose of using the collateral to cover purchase of replacement securities as more fully described in the Securities Lending Agency Agreement. The Funds’ loaned securities were all subject to enforceable Securities Lending Agreements and the value of the collateral is at least equal to the value of the cash received. The value of loaned securities and cash collateral at period end are disclosed in the Funds’ Statement of Assets and Liabilities.
Both the Funds and GSAL received compensation relating to the lending of the Funds’ securities. The amounts earned by the Funds for the fiscal year ended December 31, 2015, are reported under Investment Income on the Statements of Operations.
The table below details securities lending activity with affiliates of Goldman Sachs:
| | | | | | | | | | | | | | |
| | | | | For the Fiscal Year ended December 31, 2015 | | | Amounts Payable to
Goldman Sachs
Upon Return of
Securities Loaned as of
December 31, 2015 | |
| Fund | | | | Earnings of GSAL
Relating to
Securities
Loaned | | | Amounts Received
by the Funds
from Lending to
Goldman Sachs | | |
U.S. Tax-Managed Equity | | | | $ | 51,528 | | | $ | 20,718 | | | $ | 1,915,350 | |
International Tax-Managed Equity | | | | | 27,969 | | | | 52,584 | | | | 1,268,770 | |
The following table provides information about the Funds’ investment in the Money Market Fund for the fiscal year ended December 31, 2015:
| | | | | | | | | | | | | | | | | | |
| Fund | | | | Market Value 12/31/14 | | | Purchases
at Cost | | | Proceeds
from Sales | | | Market Value
12/31/15 | |
U.S. Tax-Managed Equity | | | | $ | 31,242,618 | | | $ | 153,497,690 | | | $ | (164,936,799 | ) | | $ | 19,803,509 | |
International Tax-Managed Equity | | | | | 1,328,478 | | | | 112,764,707 | | | | (110,773,060 | ) | | | 3,320,125 | |
The tax character of distributions paid during the fiscal year ended December 31, 2015, was as follows:
| | | | | | | | | | | | | | | | |
| | | U.S. Equity
Dividend and
Premium | | | International
Equity Dividend
and Premium | | | U.S. Tax-
Managed
Equity | | | International
Tax-Managed
Equity | |
Distributions paid from: | | | | | | | | | | | | | | | | |
Ordinary income | | $ | 41,761,162 | | | $ | 12,593,620 | | | $ | 10,382,316 | | | $ | 6,331,497 | |
Net long-term capital gains | | | 50,372,712 | | | | 1,130,858 | | | | — | | | | — | |
Total taxable distributions | | $ | 92,133,874 | | | $ | 13,724,478 | | | $ | 10,382,316 | | | $ | 6,331,497 | |
82
GOLDMAN SACHS TAX-ADVANTAGED EQUITY FUNDS
|
| 8. TAX INFORMATION (continued) |
The tax character of distributions paid during the fiscal year ended December 31, 2014, was as follows:
| | | | | | | | | | | | | | | | |
| | | U.S. Equity
Dividend and
Premium | | | International
Equity Dividend
and Premium | | | U.S. Tax-
Managed
Equity | | | International
Tax-Managed
Equity | |
Distributions paid from: | | | | | | | | | | | | | | | | |
Ordinary income | | $ | 40,833,811 | | | $ | 17,688,813 | | | $ | 5,600,754 | | | $ | 8,980,047 | |
Net long-term capital gains | | | 42,768,588 | | | | 10,743,353 | | | | — | | | | — | |
Total taxable distributions | | | 83,602,399 | | | | 28,432,166 | | | | 5,600,754 | | | | 8,980,047 | |
As of December 31, 2015, the components of accumulated earnings (losses) on a tax-basis were as follows:
| | | | | | | | | | | | | | | | |
| | | U.S. Equity
Dividend and
Premium | | | International
Equity Dividend
and Premium | | | U.S. Tax-
Managed
Equity | | | International
Tax-Managed
Equity | |
Undistributed ordinary income — net | | $ | 5,995,585 | | | $ | 68,685 | | | $ | 761,832 | | | $ | 10,253 | |
Undistributed long-term capital gains | | | 8,033,765 | | | | — | | | | — | | | | — | |
Total undistributed earnings | | $ | 14,029,350 | | | $ | 68,685 | | | $ | 761,832 | | | $ | 10,253 | |
Capital loss carryforwards:(1) | | | | | | | | | | | | | | | | |
Expiring 2016 | | | — | | | | — | | | | — | | | | (2,078,605 | ) |
Expiring 2017 | | | — | | | | — | | | | — | | | | (31,387,420 | ) |
Perpetual Long-term | | | — | | | | — | | | | — | | | | (7,421,630 | ) |
Perpetual Short-term | | | — | | | | — | | | | (50,600,875 | ) | | | (42,227,380 | ) |
Total capital loss carryforwards | | $ | — | | | $ | — | | | $ | (50,600,875 | ) | | $ | (83,115,035 | ) |
Timing differences (Qualified Late Year Loss Deferral/Post October Loss Deferral and Deferred Dividends from REIT Distributions) | | $ | 29,333 | | | $ | (4,163,651 | ) | | $ | (1,705,994 | ) | | $ | (7,543,878 | ) |
Unrealized gains (losses) — net | | | 162,263,429 | | | | (66,693,308 | ) | | | 246,593,552 | | | | 68,855,023 | |
Total accumulated gains (losses) — net | | $ | 176,322,112 | | | $ | (70,788,274 | ) | | $ | 195,048,515 | | | $ | (21,793,637 | ) |
| (1) | | Expiration occurs on December 31 of the year indicated. |
83
GOLDMAN SACHS TAX-ADVANTAGED EQUITY FUNDS
Notes to Financial Statements (continued)
December 31, 2015
|
| 8. TAX INFORMATIO (continued) |
As of December 31, 2015, the Funds’ aggregate security unrealized gains and losses based on cost for U.S. federal income tax purposes were as follows:
| | | | | | | | | | | | | | | | |
| | | U.S. Equity
Dividend and
Premium | | | International
Equity Dividend
and Premium | | | U.S. Tax-
Managed
Equity | | | International
Tax-Managed
Equity | |
Tax cost | | $ | 1,453,836,127 | | | $ | 362,341,959 | | | $ | 830,266,214 | | | $ | 362,510,320 | |
Gross unrealized gain | | | 231,581,166 | | | | 5,046,933 | | | | 249,976,354 | | | | 70,829,908 | |
Gross unrealized loss | | | (69,317,737 | ) | | | (71,861,070 | ) | | | (3,382,802 | ) | | | (1,972,506 | ) |
Net unrealized security gain (loss) | | $ | 162,263,429 | | | $ | (66,814,137 | ) | | $ | 246,593,552 | | | $ | 68,857,402 | |
Net unrealized gain (loss) on other investments | | | — | | | | 120,829 | | | | — | | | | (2,379 | ) |
Net unrealized gain (loss) | | $ | 162,263,429 | | | $ | (66,693,308 | ) | | $ | 246,593,552 | | | $ | 68,855,023 | |
The difference between GAAP-basis and tax-basis unrealized gains (losses) is attributable primarily to wash sales, net mark to market gains (losses) on regulated futures, foreign currency and options contracts and differences related to the tax treatment of underlying fund investments and passive foreign investment company investments.
In order to present certain components of the Funds’ capital accounts on a tax-basis, certain reclassifications have been recorded to the Funds’ accounts. These reclassifications have no impact on the NAV of the Funds and result primarily from differences in the tax treatment of foreign currency transactions, passive foreign investment company investments and underlying fund investments.
| | | | | | | | |
Fund | | Accumulated Net
Realized Gain (Loss) | | | Undistributed Net
Investment Income (Loss) | |
U.S. Equity Dividend and Premium | | $ | 215,220 | | | $ | (215,220 | ) |
International Equity Dividend and Premium | | | 1,219,068 | | | | (1,219,068 | ) |
U.S. Tax-Managed Equity | | | 123,024 | | | | (123,024 | ) |
International Tax-Managed Equity | | | 21,760 | | | | (21,760 | ) |
GSAM has reviewed the Funds’ tax positions for all open tax years (the current and prior three years, as applicable) and has concluded that no provision for income tax is required in the Funds’ financial statements. Such open tax years remain subject to examination and adjustment by tax authorities.
84
GOLDMAN SACHS TAX-ADVANTAGED EQUITY FUNDS
The Funds’ risks include, but are not limited to, the following:
Foreign Custody Risk — A Fund that invests in foreign securities may hold such securities and cash with foreign banks, agents, and securities depositories appointed by the Fund’s custodian (each a “Foreign Custodian”). Some foreign custodians may be recently organized or new to the foreign custody business. In some countries, Foreign Custodians may be subject to little or no regulatory oversight over, or independent evaluation of, their operations. Further, the laws of certain countries may place limitations on a Fund’s ability to even recover its assets if a Foreign Custodian enters bankruptcy. Investments in emerging markets may be subject to even greater custody risks than investments in more developed markets. Custody services in emerging market countries are very often undeveloped and may be considerably less well regulated than in more developed countries, and thus may not afford the same level of investor protection as would apply in developed countries.
Investments in Other Investment Companies — As a shareholder of another investment company, including an exchange-traded fund (“ETF”), a Fund will indirectly bear its proportionate share of any net management fees and other expenses paid by such other investment companies, in addition to the fees and expenses regularly borne by a Fund. ETFs are subject to risks that do not apply to conventional mutual funds, including but not limited to the following: (i) the market price of the ETF’s shares may trade at a premium or a discount to their NAV; and (ii) an active trading market for an ETF’s shares may not develop or be maintained.
Large Shareholder Transactions Risk — A Fund may experience adverse effects when certain large shareholders, such as other funds, institutional investors (including those trading by use of non-discretionary mathematical formulas), financial intermediaries (who may make investment decisions on behalf of underlying clients and/or include a Fund in their investment model), individuals, accounts and Goldman Sachs affiliates, purchase or redeem large amounts of shares of a Fund. Such large shareholder redemptions may cause the Fund to sell portfolio securities at times when it would not otherwise do so, which may negatively impact a Fund’s NAV and liquidity. These transactions may also accelerate the realization of taxable income to shareholders if such sales of investments resulted in gains, and may also increase transaction costs. In addition, a large redemption could result in a Fund’s current expenses being allocated over a smaller asset base, leading to an increase in the Fund’s expense ratio. Similarly, large Fund share purchases may adversely affect a Fund’s performance to the extent that a Fund is delayed in investing new cash and is required to maintain a larger cash position than it ordinarily would.
Liquidity Risk — The Funds may make investments that are illiquid or that may become less liquid in response to market developments or adverse investor perceptions. Illiquid investments may be more difficult to value. Liquidity risk may also refer to the risk that a Fund will not be able to pay redemption proceeds within the allowable time period because of unusual market conditions, an unusually high volume of redemption requests, or other reasons. To meet redemption requests, a Fund may be forced to sell investments at an unfavorable time and/or under unfavorable conditions.
85
GOLDMAN SACHS TAX-ADVANTAGED EQUITY FUNDS
Notes to Financial Statements (continued)
December 31, 2015
|
| 9. OTHER RISKS (continued) |
Market and Credit Risks — In the normal course of business, the Funds trade financial instruments and enter into financial transactions where risk of potential loss exists due to changes in the market (market risk). Additionally, the Funds may also be exposed to credit risk in the event that an issuer or guarantor fails to perform or that an institution or entity with which the Funds have unsettled or open transactions defaults.
Investing in foreign markets may involve special risks and considerations not typically associated with investing in the U.S. Foreign securities may be subject to risk of loss because of more or less foreign government regulation, less public information and less economic, political and social stability in the countries in which the Funds invest. Loss may also result from the imposition of exchange controls, confiscations and other government restrictions by the U.S. or other governments, or from problems in registration, settlement or custody. Foreign risk also involves the risk of negative foreign currency rate fluctuations, which may cause the value of securities denominated in such foreign currency (or other instruments through which the Fund has exposure to foreign currencies) to decline in value. Currency exchange rates may fluctuate significantly over short periods of time. To the extent that the Fund also invests in securities of issuers located in emerging markets, these risks may be more pronounced.
Short Position Risk — A Fund may enter into a short position through a futures contract, an option or swap agreement or through short sales of any instrument that a Fund may purchase for investment. Taking short positions involves leverage of a Fund’s assets and presents various risks. If the value of the underlying instrument or market in which a Fund has taken a short position increases, then the Fund will incur a loss equal to the increase in value from the time that the short position was entered into plus any related interest payments or other fees. Taking short positions involves the risk that losses may be disproportionate, may exceed the amount invested, and may be unlimited.
Under the Trust’s organizational documents, its Trustees, officers, employees and agents are indemnified, to the extent permitted by the Act and state law, against certain liabilities that may arise out of performance of their duties to the Funds. Additionally, in the course of business, the Funds enter into contracts that contain a variety of indemnification clauses. The Funds’ maximum exposure under these arrangements is unknown, as this would involve future claims that may be made against the Funds that have not yet occurred. However, GSAM believes the risk of loss under these arrangements to be remote.
Subsequent events after the Statements of Assets and Liabilities date have been evaluated through the date the financial statements were issued. GSAM has concluded that there is no impact requiring adjustment or disclosure in the financial statements.
86
GOLDMAN SACHS TAX-ADVANTAGED EQUITY FUNDS
|
| 12. SUMMARY OF SHARE TRANSACTIONS |
Share activity is as follows:
| | | | | | | | | | | | | | | | |
| | | U.S. Equity Dividend and Premium | |
| | | | |
| | | For the Fiscal Year Ended
December 31, 2015 | | | For the Fiscal Year Ended
December 31, 2014 | |
| | | | |
| | | Shares | | | Dollars | | | Shares | | | Dollars | |
| | | | |
| Class A Shares | | | | | | | | | | | | | | | | |
Shares sold | | | 5,648,342 | | | $ | 66,635,723 | | | | 5,499,202 | | | $ | 63,519,324 | |
Reinvestment of distributions | | | 886,965 | | | | 10,161,450 | | | | 769,358 | | | | 9,018,643 | |
Shares redeemed | | | (4,099,843 | ) | | | (48,396,195 | ) | | | (6,414,860 | ) | | | (74,157,282 | ) |
| | | | 2,435,464 | | | | 28,400,978 | | | | (146,300 | ) | | | (1,619,315 | ) |
| Class C Shares | | | | | | | | | | | | | | | | |
Shares sold | | | 2,459,310 | | | | 28,711,644 | | | | 1,076,705 | | | | 12,403,228 | |
Reinvestment of distributions | | | 290,568 | | | | 3,313,646 | | | | 235,900 | | | | 2,763,465 | |
Shares redeemed | | | (1,100,675 | ) | | | (12,980,500 | ) | | | (946,503 | ) | | | (10,920,740 | ) |
| | | | 1,649,203 | | | | 19,044,790 | | | | 366,102 | | | | 4,245,953 | |
| Institutional Shares | | | | | | | | | | | | | | | | |
Shares sold | | | 26,692,822 | | | | 313,680,662 | | | | 20,351,628 | | | | 234,305,338 | |
Reinvestment of distributions | | | 5,726,581 | | | | 65,517,369 | | | | 5,010,602 | | | | 58,597,156 | |
Shares redeemed | | | (18,711,344 | ) | | | (220,010,222 | ) | | | (22,900,836 | ) | | | (262,887,282 | ) |
| | | | 13,708,059 | | | | 159,187,809 | | | | 2,461,394 | | | | 30,015,212 | |
| Class IR Shares | | | | | | | | | | | | | | | | |
Shares sold | | | 2,115,858 | | | | 25,027,669 | | | | 842,571 | | | | 9,676,516 | |
Reinvestment of distributions | | | 255,381 | | | | 2,922,243 | | | | 199,153 | | | | 2,330,699 | |
Shares redeemed | | | (995,108 | ) | | | (11,813,269 | ) | | | (794,394 | ) | | | (9,277,445 | ) |
| | | | 1,376,131 | | | | 16,136,643 | | | | 247,330 | | | | 2,729,770 | |
NET INCREASE (DECREASE) | | | 19,168,857 | | | $ | 222,770,220 | | | | 2,928,526 | | | $ | 35,371,620 | |
87
GOLDMAN SACHS TAX-ADVANTAGED EQUITY FUNDS
Notes to Financial Statements (continued)
December 31, 2015
|
| 12. SUMMARY OF SHARE TRANSACTIONS (continued) |
Share activity is as follows:
| | | | | | | | | | | | | | | | |
| | | International Equity Dividend and Premium | |
| | | | |
| | | For the Fiscal Year Ended December 31, 2015 | | | For the Fiscal Year Ended December 31, 2014 | |
| | | | |
| | | Shares | | | Dollars | | | Shares | | | Dollars | |
| | | | |
| Class A Shares | | | | | | | | | | | | | | | | |
Shares sold | | | 460,543 | | | $ | 3,244,830 | | | | 484,222 | | | $ | 3,862,860 | |
Reinvestment of distributions | | | 49,576 | | | | 339,539 | | | | 85,503 | | | | 658,412 | |
Shares redeemed | | | (535,757 | ) | | | (3,867,932 | ) | | | (380,346 | ) | | | (3,043,097 | ) |
| | | | (25,638 | ) | | | (283,563 | ) | | | 189,379 | | | | 1,478,175 | |
| Class C Shares | | | | | | | | | | | | | | | | |
Shares sold | | | 168,721 | | | | 1,164,830 | | | | 41,693 | | | | 322,879 | |
Reinvestment of distributions | | | 14,737 | | | | 97,255 | | | | 19,873 | | | | 148,182 | |
Shares redeemed | | | (38,961 | ) | | | (264,726 | ) | | | (13,017 | ) | | | (101,326 | ) |
| | | | 144,497 | | | | 997,359 | | | | 48,549 | | | | 369,735 | |
| Institutional Shares | | | | | | | | | | | | | | | | |
Shares sold | | | 14,258,529 | | | | 99,454,195 | | | | 20,131,598 | | | | 155,018,728 | |
Reinvestment of distributions | | | 1,940,053 | | | | 13,090,371 | | | | 3,555,501 | | | | 26,953,098 | |
Shares redeemed | | | (31,735,854 | ) | | | (219,209,892 | ) | | | (15,785,571 | ) | | | (119,876,202 | ) |
| | | | (15,537,272 | ) | | | (106,665,326 | ) | | | 7,901,528 | | | | 62,095,624 | |
| Class IR Shares | | | | | | | | | | | | | | | | |
Shares sold | | | 65,058 | | | | 456,216 | | | | 10,376 | | | | 79,539 | |
Reinvestment of distributions | | | 4,096 | | | | 27,347 | | | | 9,001 | | | | 68,858 | |
Shares redeemed | | | (75,696 | ) | | | (534,227 | ) | | | (92,965 | ) | | | (732,106 | ) |
| | | | (6,542 | ) | | | (50,664 | ) | | | (73,588 | ) | | | (583,709 | ) |
NET INCREASE (DECREASE) | | | (15,424,955 | ) | | $ | (106,002,194 | ) | | | 8,065,868 | | | $ | 63,359,825 | |
88
GOLDMAN SACHS TAX-ADVANTAGED EQUITY FUNDS
|
| 12. SUMMARY OF SHARE TRANSACTIONS (continued) |
Share activity is as follows:
| | | | | | | | | | | | | | | | |
| | | U.S. Tax-Managed Equity | |
| | | | |
| | | For the Fiscal Year Ended December 31, 2015 | | | For the Fiscal Year Ended December 31, 2014 | |
| | | | |
| | | Shares | | | Dollars | | | Shares | | | Dollars | |
| | | | |
| Class A Shares | | | | | | | | | | | | | | | | |
Shares sold | | | 928,541 | | | $ | 16,271,859 | | | | 916,816 | | | $ | 15,196,413 | |
Shares converted from Class B | | | — | | | | — | | | | 995 | | | | 17,028 | |
Reinvestment of distributions | | | 18,794 | | | | 327,578 | | | | 8,808 | | | | 153,885 | |
Shares redeemed | | | (533,922 | ) | | | (9,231,821 | ) | | | (239,434 | ) | | | (3,912,885 | ) |
| | | | 413,413 | | | | 7,367,616 | | | | 687,185 | | | | 11,454,441 | |
| Class B Shares(a) | | | | | | | | | | | | | | | | |
Shares sold | | | — | | | | — | | | | 3,947 | | | | 60,731 | |
Shares converted to Class A | | | — | | | | — | | | | (1,034 | ) | | | (17,028 | ) |
Shares redeemed | | | — | | | | — | | | | (46,191 | ) | | | (741,902 | ) |
| | | | — | | | | — | | | | (43,278 | ) | | | (698,199 | ) |
| Class C Shares | | | | | | | | | | | | | | | | |
Shares sold | | | 506,895 | | | | 8,465,057 | | | | 295,905 | | | | 4,712,103 | |
Reinvestment of distributions | | | 1,000 | | | | 16,633 | | | | — | | | | — | |
Shares redeemed | | | (106,063 | ) | | | (1,763,817 | ) | | | (69,448 | ) | | | (1,074,073 | ) |
| | | | 401,832 | | | | 6,717,873 | | | | 226,457 | | | | 3,638,030 | |
| Institutional Shares | | | | | | | | | | | | | | | | |
Shares sold | | | 20,043,930 | | | | 358,131,887 | | | | 15,287,233 | | | | 254,137,597 | |
Reinvestment of distributions | | | 546,854 | | | | 9,673,849 | | | | 300,638 | | | | 5,327,299 | |
Shares redeemed | | | (7,555,225 | ) | | | (130,444,037 | ) | | | (5,538,471 | ) | | | (92,542,624 | ) |
| | | | 13,035,559 | | | | 237,361,699 | | | | 10,049,400 | | | | 166,922,272 | |
| Service Shares | | | | | | | | | | | | | | | | |
Shares sold | | | 70,382 | | | | 1,230,818 | | | | 3,662 | | | | 57,000 | |
Reinvestment of distributions | | | 521 | | | | 9,114 | | | | — | | | | — | |
Shares redeemed | | | (2,915 | ) | | | (48,692 | ) | | | (26,892 | ) | | | (414,268 | ) |
| | | | 67,988 | | | | 1,191,240 | | | | (23,230 | ) | | | (357,268 | ) |
| Class IR Shares | | | | | | | | | | | | | | | | |
Shares sold | | | 322,157 | | | | 5,750,700 | | | | 187,863 | | | | 3,067,209 | |
Reinvestment of distributions | | | 3,390 | | | | 59,966 | | | | 1,331 | | | | 23,594 | |
Shares redeemed | | | (173,705 | ) | | | (3,111,967 | ) | | | (7,100 | ) | | | (122,464 | ) |
| | | | 151,842 | | | | 2,698,699 | | | | 182,094 | | | | 2,968,339 | |
NET INCREASE | | | 14,070,634 | | | $ | 255,337,127 | | | | 11,078,628 | | | $ | 183,927,615 | |
| (a) | | Class B Shares converted into Class A Shares at the close of business on November 14, 2014. |
89
GOLDMAN SACHS TAX-ADVANTAGED EQUITY FUNDS
Notes to Financial Statements (continued)
December 31, 2015
|
| 12. SUMMARY OF SHARE TRANSACTIONS (continued) |
Share activity is as follows:
| | | | | | | | | | | | | | | | |
| | | International Tax-Managed Equity | |
| | | | |
| | | For the Fiscal Year Ended December 31, 2015 | | | For the Fiscal Year Ended December 31, 2014 | |
| | | | |
| | | Shares | | | Dollars | | | Shares | | | Dollars | |
| | | | |
| Class A Shares | | | | | | | | | | | | | | | | |
Shares sold | | | 200,716 | | | $ | 1,797,112 | | | | 17,315 | | | $ | 158,929 | |
Reinvestment of distributions | | | 4,352 | | | | 37,947 | | | | 5,875 | | | | 50,820 | |
Shares redeemed | | | (66,808 | ) | | | (598,755 | ) | | | (137,419 | ) | | | (1,266,577 | ) |
| | | | 138,260 | | | | 1,236,304 | | | | (114,229 | ) | | | (1,056,828 | ) |
| Class C Shares | | | | | | | | | | | | | | | | |
Shares sold | | | 85,633 | | | | 754,418 | | | | 13,852 | | | | 122,120 | |
Reinvestment of distributions | | | 848 | | | | 7,200 | | | | 355 | | | | 3,009 | |
Shares redeemed | | | (12,292 | ) | | | (104,836 | ) | | | (67 | ) | | | (597 | ) |
| | | | 74,189 | | | | 656,782 | | | | 14,140 | | | | 124,532 | |
| Institutional Shares | | | | | | | | | | | | | | | | |
Shares sold | | | 19,886,852 | | | | 175,872,655 | | | | 17,564,519 | | | | 157,642,025 | |
Reinvestment of distributions | | | 726,091 | | | | 6,266,165 | | | | 1,041,888 | | | | 8,918,554 | |
Shares redeemed | | | (8,815,046 | ) | | | (77,228,789 | ) | | | (5,896,106 | ) | | | (51,245,606 | ) |
| | | | 11,797,897 | | | | 104,910,031 | | | | 12,710,301 | | | | 115,314,973 | |
| Class IR Shares | | | | | | | | | | | | | | | | |
Shares sold | | | 148,014 | | | | 1,328,928 | | | | 1,327 | | | | 12,250 | |
Reinvestment of distributions | | | 2,311 | | | | 20,104 | | | | 639 | | | | 5,515 | |
Shares redeemed | | | (7,787 | ) | | | (71,717 | ) | | | (1,327 | ) | | | (12,068 | ) |
| | | | 142,538 | | | | 1,277,315 | | | | 639 | | | | 5,697 | |
NET INCREASE | | | 12,152,884 | | | $ | 108,080,432 | | | | 12,610,851 | | | $ | 114,388,374 | |
90
Report of Independent Registered Public
Accounting Firm
To the Board of Trustees of Goldman Sachs Trust and Shareholders of
Goldman Sachs Tax-Advantaged Equity Funds:
In our opinion, the accompanying statements of assets and liabilities, including the schedules of investments, and the related statements of operations and of changes in net assets and the financial highlights present fairly, in all material respects, the financial position of the Goldman Sachs U.S. Equity Dividend and Premium Fund, the Goldman Sachs International Equity Dividend and Premium Fund, the Goldman Sachs U.S. Tax-Managed Equity Fund and the Goldman Sachs International Tax-Managed Equity Fund (collectively the “Funds”), funds of Goldman Sachs Trust, at December 31, 2015, and the results of each of their operations, the changes in each of their net assets and the financial highlights for each of the periods indicated, in conformity with accounting principles generally accepted in the United States of America. These financial statements and financial highlights (hereafter referred to as “financial statements”) are the responsibility of the Funds’ management. Our responsibility is to express an opinion on these financial statements based on our audits. We conducted our audits of these financial statements in accordance with the standards of the Public Company Accounting Oversight Board (United States). Those standards require that we plan and perform the audit to obtain reasonable assurance about whether the financial statements are free of material misstatement. An audit includes examining, on a test basis, evidence supporting the amounts and disclosures in the financial statements, assessing the accounting principles used and significant estimates made by management, and evaluating the overall financial statement presentation. We believe that our audits, which included confirmation of securities at December 31, 2015 by correspondence with the custodian, brokers, transfer agent of investment companies and the application of alternative auditing procedures where confirmation of securities purchased had not been received, provide a reasonable basis for the opinion expressed above.
PricewaterhouseCoopers LLP
Boston, Massachusetts
February 26, 2016
91
GOLDMAN SACHS TAX-ADVANTAGED EQUITY FUNDS
Fund Expenses — Six Month Period Ended December 31, 2015 (Unaudited)
As a shareholder of Class A, Class C, Institutional, Service or Class IR Shares of a Fund you incur types of costs: (1) transaction costs, including sales charges on purchase payments (with respect to Class A Shares), contingent deferred sales charges on redemptions (with respect to Class C Shares), (if any); and (2) ongoing costs, including management fees; distribution and service (12b-1) fees (with respect to Class A, Class C Shares); and other Fund expenses. This example is intended to help you understand your ongoing costs (in dollars) of investing in Class A, Class C, Institutional, Service or Class IR Shares of the Funds and to compare these costs with the ongoing costs of investing in other mutual funds.
The example is based on an investment of $1,000 invested at the beginning of the period and held for the entire period from July 1, 2015 through December 31, 2015, which represents a period of 184 days of a 365 day year.
Actual Expenses — The first line under each share class in the table below provides information about actual account values and actual expenses. You may use the information in this line, together with the amount you invested, to estimate the expenses that you paid over the period. Simply divide your account value by $1,000 (for example, an $8,600 account value divided by $1,000=8.6), then multiply the result by the number in the first line under the heading entitled “Expenses Paid” to estimate the expenses you paid on your account during this period.
Hypothetical Example for Comparison Purposes — The second line under each share class in the table below provides information about hypothetical account values and hypothetical expenses based on the Funds’ actual net expense ratio and an assumed rate of return of 5% per year before expenses, which is not the Funds’ actual return. The hypothetical account values and expenses may not be used to estimate the actual ending account balance or expenses you paid for the period. You may use this information to compare the ongoing costs of investing in the Funds and other funds. To do so, compare this 5% hypothetical example with the 5% hypothetical examples that appear in the shareholder reports of the other funds.
Please note that the expenses shown in the table are meant to highlight your ongoing costs only and do not reflect any transactional costs, such as sales charges, redemption fees, or exchange fees. Therefore, the second line of the table is useful in comparing ongoing costs only, and will not help you determine the relative total costs of owning different funds. In addition, if these transactional costs were included, your costs would have been higher.
| | | | | | | | | | | | | | | | | | | | | | | | | | | | | | | | | | | | | | | | | | | | | | | | |
| | | U.S. Equity Dividend and Premium Fund | | | International Equity Dividend and Premium Fund | | | U.S. Tax-Managed Equity Fund | | | International Tax-Managed Equity Fund | |
| Share Class | | Beginning
Account
Value
07/01/15 | | | Ending
Account
Value
12/31/15 | | | Expenses
Paid for the
6 Months Ended
12/31/15* | | | Beginning
Account
Value
07/01/15 | | | Ending
Account
Value
12/31/15 | | | Expenses
Paid for the
6 Months Ended
12/31/15* | | | Beginning
Account
Value
07/01/15 | | | Ending
Account
Value
12/31/15 | | | Expenses
Paid for the
6 Months Ended
12/31/15* | | | Beginning
Account
Value
07/01/15 | | | Ending
Account
Value
12/31/15 | | | Expenses
Paid for the
6 Months Ended
12/31/15* | |
| Class A | | | | | | | | | | | | | | | | | | | | | | | | | | | | | | | | | | | | | | | | | | | | | | | | |
Actual | | $ | 1,000 | | | $ | 995.00 | | | $ | 5.88 | | | $ | 1,000 | | | $ | 931.50 | | | $ | 6.82 | | | $ | 1,000 | | | $ | 996.60 | | | $ | 5.84 | | | $ | 1,000 | | | $ | 961.50 | | | $ | 6.82 | |
Hypothetical 5% return | | | 1,000 | | | | 1,019.31 | + | | | 5.96 | | | | 1,000 | | | | 1,018.15 | + | | | 7.12 | | | | 1,000 | | | | 1,019.36 | + | | | 5.90 | | | | 1,000 | | | | 1,018.25 | + | | | 7.02 | |
| Class C | | | | | | | | | | | | | | | | | | | | | | | | | | | | | | | | | | | | | | | | | | | | | | | | |
Actual | | | 1,000 | | | | 990.60 | | | | 9.63 | | | | 1,000 | | | | 927.60 | | | | 10.45 | | | | 1,000 | | | | 992.50 | | | | 9.59 | | | | 1,000 | | | | 958.80 | | | | 10.52 | |
Hypothetical 5% return | | | 1,000 | | | | 1,015.53 | + | | | 9.75 | | | | 1,000 | | | | 1,014.37 | + | | | 10.92 | | | | 1,000 | | | | 1,015.58 | + | | | 9.70 | | | | 1,000 | | | | 1,014.47 | + | | | 10.82 | |
| Institutional | | | | | | | | | | | | | | | | | | | | | | | | | | | | | | | | | | | | | | | | | | | | | | | | |
Actual | | | 1,000 | | | | 997.00 | | | | 3.88 | | | | 1,000 | | | | 934.30 | | | | 4.83 | | | | 1,000 | | | | 998.20 | | | | 3.83 | | | | 1,000 | | | | 964.20 | | | | 4.85 | |
Hypothetical 5% return | | | 1,000 | | | | 1,021.32 | + | | | 3.92 | | | | 1,000 | | | | 1,020.21 | + | | | 5.04 | | | | 1,000 | | | | 1,021.37 | + | | | 3.87 | | | | 1,000 | | | | 1,020.27 | + | | | 4.99 | |
| Service | | | | | | | | | | | | | | | | | | | | | | | | | | | | | | | | | | | | | | | | | | | | | | | | |
Actual | | | N/A | | | | N/A | | | | N/A | | | | N/A | | | | N/A | | | | N/A | | | | 1,000 | | | | 995.30 | | | | 6.34 | | | | N/A | | | | N/A | | | | N/A | |
Hypothetical 5% return | | | N/A | | | | N/A | | | | N/A | | | | N/A | | | | N/A | | | | N/A | | | | 1,000 | | | | 1,018.85 | + | | | 6.41 | | | | N/A | | | | N/A | | | | N/A | |
| Class IR | | | | | | | | | | | | | | | | | | | | | | | | | | | | | | | | | | | | | | | | | | | | | | | | |
Actual | | | 1,000 | | | | 996.30 | | | | 4.63 | | | | 1,000 | | | | 932.40 | | | | 5.55 | | | | 1,000 | | | | 997.50 | | | | 4.58 | | | | 1,000 | | | | 962.70 | | | | 5.54 | |
Hypothetical 5% return | | | 1,000 | | | | 1,020.57 | + | | | 4.69 | | | | 1,000 | | | | 1,019.46 | + | | | 5.80 | | | | 1,000 | | | | 1,020.62 | + | | | 4.63 | | | | 1,000 | | | | 1,019.56 | + | | | 5.70 | |
| * | | Expenses are calculated using each Fund’s annualized net expense ratio for each class, which represents the ongoing expenses as a percentage of net assets for the six months ended December 31, 2015. Expenses are calculated by multiplying the annualized net expense ratio by the average account value for the period; then multiplying the result by the number of days in the most recent fiscal half year; and then dividing that result by the number of days in the fiscal year. The annualized net expense ratios for the period were as follows: |
| | | | | | | | | | | | | | | | | | | | |
| Fund | | Class A | | | Class C | | | Institutional | | | Service | | | Class IR | |
U.S. Equity Dividend and Premium | | | 1.17 | % | | | 1.92 | % | | | 0.77 | % | | | N/A | | | | 0.92 | % |
International Equity Dividend and Premium | | | 1.40 | | | | 2.15 | | | | 0.99 | | | | N/A | | | | 1.14 | |
U.S. Tax-Managed Equity | | | 1.16 | | | | 1.91 | | | | 0.76 | | | | 1.26 | % | | | 0.91 | |
International Tax-Managed Equity | | | 1.38 | | | | 2.13 | | | | 0.98 | | | | N/A | | | | 1.12 | |
| + | | Hypothetical expenses are based on each Fund’s actual annualized net expense ratios and an assumed rate of return of 5% per year before expenses. |
92
GOLDMAN SACHS TAX-ADVANTAGED EQUITY FUNDS
Trustees and Officers (Unaudited)
Independent Trustees
| | | | | | | | | | |
Name,
Address and Age1 | | Position(s) Held with the Trust | | Term of Office and
Length of
Time Served2 | | Principal Occupation(s) During Past 5 Years | | Number of
Portfolios in
Fund Complex
Overseen by
Trustee3 | | Other Directorships Held by Trustee4 |
Ashok N. Bakhru Age: 73 | | Chairman of the Board of Trustees | | Since 1996 (Trustee since 1991) | | Mr. Bakhru is retired. He was formerly Director, Apollo Investment Corporation (a business development company) (2008-2013); President, ABN Associates (a management and financial consulting firm) (1994-1996 and 1998-2012); Trustee, Scholarship America (1998-2005); Trustee, Institute for Higher Education Policy (2003-2008); Director, Private Equity Investors — III and IV (1998-2007), and Equity-Linked Investors II (April 2002-2007). Chairman of the Board of Trustees — Goldman Sachs Fund Complex. | | 139 | | None |
Kathryn A. Cassidy Age: 61 | | Trustee | | Since 2015 | | Ms. Cassidy is retired. Formerly, she was Advisor to the Chairman (May 2014-December 2014); and Senior Vice President and Treasurer (2008-2014), General Electric Company & General Electric Capital Corporation (technology and financial services companies). Trustee — Goldman Sachs Fund Complex. | | 114 | | None |
John P. Coblentz, Jr. Age: 74 | | Trustee | | Since 2003 | | Mr. Coblentz is retired. Formerly, he was Partner, Deloitte & Touche LLP (a professional services firm) (1975-2003); Director, Emerging Markets Group, Ltd. (2004-2006); and Director, Elderhostel, Inc. (2006-2012). Trustee — Goldman Sachs Fund Complex. | | 139 | | None |
Diana M. Daniels Age: 66 | | Trustee | | Since 2007 | | Ms. Daniels is retired. Formerly, she was Vice President, General Counsel and Secretary, The Washington Post Company (1991-2006). Ms. Daniels is a Trustee Emeritus and serves as a Presidential Councillor of Cornell University (2013-Present); Member, Advisory Board, Psychology Without Borders (international humanitarian aid organization) (2007-Present), and former Member of the Legal Advisory Board, New York Stock Exchange (2003-2006) and of the Corporate Advisory Board, Standish Mellon Management Advisors (2006-2007). Trustee — Goldman Sachs Fund Complex. | | 114 | | None |
Joseph P. LoRusso Age: 58 | | Trustee | | Since 2010 | | Mr. LoRusso is retired. Formerly, he was President, Fidelity Investments Institutional Services Co. (“FIIS”) (2002-2008); Director, FIIS (2002-2008); Director, Fidelity Investments Institutional Operations Company (2003-2007); Executive Officer, Fidelity Distributors Corporation (2007-2008). Trustee — Goldman Sachs Fund Complex. | | 114 | | None |
Herbert J. Markley Age: 65 | | Trustee | | Since 2013 | | Mr. Markley is retired. Formerly, he was Executive Vice President, Deere & Company (an agricultural and construction equipment manufacturer) (2007-2009); and President, Agricultural Division, Deere & Company (2001-2007). Trustee — Goldman Sachs Fund Complex. | | 114 | | None |
Jessica Palmer Age: 66 | | Trustee | | Since 2007 | | Ms. Palmer is retired. She is Director, Emerson Center for the Arts and Culture (2011-Present); and was formerly a Consultant, Citigroup Human Resources Department (2007-2008); Managing Director, Citigroup Corporate and Investment Banking (previously, Salomon Smith Barney/Salomon Brothers) (1984-2006). Ms. Palmer was a Member of the Board of Trustees of Indian Mountain School (private elementary and secondary school) (2004-2009). Trustee — Goldman Sachs Fund Complex. | | 114 | | None |
| | | | | | | | | | |
93
GOLDMAN SACHS TAX-ADVANTAGED EQUITY FUNDS
Trustees and Officers (Unaudited) (continued)
Independent Trustees
| | | | | | | | | | |
Name,
Address and Age1 | | Position(s) Held
with the Trust | | Term of Office and
Length of
Time Served2 | | Principal Occupation(s) During Past 5 Years | | Number of
Portfolios in
Fund Complex
Overseen by
Trustee3 | | Other Directorships Held by Trustee4 |
Richard P. Strubel Age: 76 | | Trustee | | Since 1987 | | Mr. Strubel is retired. Formerly, he served as Chairman of the Board of Trustees, Northern Funds (a family of retail and institutional mutual funds managed by Northern Trust Investments, Inc.) (2008-2014) and Trustee (1982-2014); Director, Cardean Learning Group (provider of educational services via the internet) (2003-2008); and Director, Gildan Activewear Inc. (a clothing marketing and manufacturing company) (2000-2014). He serves as Trustee Emeritus, The University of Chicago (1987-Present). Trustee — Goldman Sachs Fund Complex. | | 139 | | None |
Roy W. Templin Age: 55 | | Trustee | | Since 2013 | | Mr. Templin is retired. He is Chairman of the Board of Directors, Con-Way Incorporated (2014-Present); and was formerly Executive Vice President and Chief Financial Officer, Whirlpool Corporation (an appliance manufacturer and marketer) (2004-2012). Trustee — Goldman Sachs Fund Complex. | | 114 | | Con-Way Incorporated (a transportation, logistics and supply-chain management services company) |
Gregory G. Weaver Age: 64 | | Trustee | | Since 2015 | | Mr. Weaver is retired. He is Director, Verizon Communications Inc. (2015-Present); and was formerly Chairman and Chief Executive Officer, Deloitte & Touche LLP (a professional services firm) (2001-2005 and 2012-2014); and Member of the Board of Directors, Deloitte & Touche LLP (2006-2012). Trustee — Goldman Sachs Fund Complex. | | 114 | | Verizon Communications Inc. |
| | | | | | | | | | |
94
GOLDMAN SACHS TAX-ADVANTAGED EQUITY FUNDS
Trustees and Officers (Unaudited) (continued)
Interested Trustees*
| | | | | | | | | | |
Name,
Address and Age1 | | Position(s) Held
with the Trust | | Term of Office and
Length of
Time Served2 | | Principal Occupation(s) During Past 5 Years | | Number of
Portfolios in
Fund Complex
Overseen by
Trustee3 | | Other Directorships Held by Trustee4 |
James A. McNamara Age: 53 | | President and Trustee | | Since 2007 | | Managing Director, Goldman Sachs (December 1998-Present); Director of Institutional Fund Sales, GSAM (April 1998-December 2000); and Senior Vice President and Manager, Dreyfus Institutional Service Corporation (January 1993- April 1998). President — Goldman Sachs Fund Complex (November 2007-Present); Senior Vice President — Goldman Sachs Fund Complex (May 2007-November 2007); and Vice President — Goldman Sachs Fund Complex (2001-2007). Trustee — Goldman Sachs Fund Complex (November 2007-Present and December 2002-May 2004). | | 138 | | None |
Alan A. Shuch Age: 66 | | Trustee | | Since 1990 | | Advisory Director — GSAM (May 1999-Present); Consultant to GSAM (December 1994-May 1999); and Limited Partner, Goldman Sachs (December 1994-May 1999). Trustee — Goldman Sachs Fund Complex. | | 114 | | None |
| | | | | | | | | | |
| * | | These persons are considered to be “Interested Trustees” because they hold positions with Goldman Sachs and own securities issued by The Goldman Sachs Group, Inc. Each Interested Trustee holds comparable positions with certain other companies of which Goldman Sachs, GSAM or an affiliate thereof is the investment adviser, administrator and/or distributor. |
| 1 | | Each Trustee may be contacted by writing to the Trustee, c/o Goldman Sachs, 200 West Street, New York, New York, 10282, Attn: Caroline Kraus. Information is provided as of December 31, 2015. |
| 2 | | Each Trustee holds office for an indefinite term until the earliest of: (a) the election of his or her successor; (b) the date the Trustee resigns or is removed by the Board of Trustees or shareholders, in accordance with the Trust’s Declaration of Trust; (c) December 31st of the year in which the Trustee turns 74 years of age, subject to waiver by a majority of the Trustees (in accordance with the current resolutions of the Board of Trustees, which may be changed by the Trustees without shareholder vote); or (d) the termination of the Trust. By resolution of the Board of Trustees determining that an extension of service would be beneficial to the Trust, the retirement age has been extended with respect to Richard P. Strubel. |
| 3 | | The Goldman Sachs Fund Complex includes the Trust and Goldman Sachs Variable Insurance Trust (“GSVIT”). As of December 31, 2015, the Trust consisted of 100 portfolios (91 of which offered shares to the public) and GSVIT consisted of 14 portfolios. The Goldman Sachs Fund Complex also includes, with respect to Messrs. Bakhru, Coblentz and Strubel, Goldman Sachs Trust II (“GSTII”), Goldman Sachs BDC, Inc. (“GSBDC”), Goldman Sachs MLP Income Opportunities Fund (“GSMLP”), Goldman Sachs MLP and Energy Renaissance Fund (“GSMER”) and Goldman Sachs ETF Trust (“GSETF”), and with respect to Mr. McNamara, GSTII, GSMLP, GSMER and GSETF. GSTII consisted of eight portfolios (six of which offered shares to the public). GSBDC, GSMLP and GSMER each consisted of one portfolio. GSETF consisted of 14 portfolios (three of which offered shares to the public). |
| 4 | | This column includes only directorships of companies required to report to the Securities and Exchange Commission under the Securities Exchange Act of 1934 (i.e., “public companies”) or other investment companies registered under the Act. |
Additional information about the Trustees is available in the Funds’ Statement of Additional Information, which can be obtained from Goldman Sachs free of charge by calling this toll-free number (in the United States of America): 1-800-526-7384.
95
GOLDMAN SACHS TAX-ADVANTAGED EQUITY FUNDS
Trustees and Officers (Unaudited) (continued)
Officers of the Trust*
| | | | | | |
| Name, Address and Age1 | | Position(s) Held With the Trust | | Term of
Office and
Length of
Time Served2 | | Principal Occupation(s) During Past 5 Years |
James A. McNamara 200 West Street New York, NY 10282 Age: 53 | | President and Trustee | | Since 2007 | | Managing Director, Goldman Sachs (December 1998-Present); Director of Institutional Fund Sales, GSAM (April 1998-December 2000); and Senior Vice President and Manager, Dreyfus Institutional Service Corporation (January 1993-April 1998). President — Goldman Sachs Fund Complex (November 2007-Present); Senior Vice President — Goldman Sachs Fund Complex (May 2007-November 2007); and Vice President — Goldman Sachs Fund Complex (2001-2007). Trustee — Goldman Sachs Fund Complex (November 2007-Present and December 2002-May 2004). |
Caroline L. Kraus 200 West Street New York, NY 10282 Age: 38 | | Secretary | | Since 2012 | | Vice President, Goldman Sachs (August 2006-Present); Associate General Counsel, Goldman Sachs (2012-Present); Assistant General Counsel, Goldman Sachs (August 2006-December 2011); and Associate, Weil, Gotshal & Manges, LLP (2002-2006). Secretary — Goldman Sachs Fund Complex (August 2012-Present); and Assistant Secretary — Goldman Sachs Fund Complex (June 2012-August 2012). |
Scott M. McHugh 200 West Street New York, NY 10282 Age: 44 | | Principal Financial Officer, Senior Vice President and Treasurer | | Since 2009 (Principal Financial Officer since 2013) | | Vice President, Goldman Sachs (February 2007-Present); Assistant Treasurer of certain mutual funds administered by DWS Scudder (2005-2007); and Director (2005-2007), Vice President (2000-2005), and Assistant Vice President (1998-2000); Deutsche Asset Management or its predecessor (1998-2007). Principal Financial Officer — Goldman Sachs Fund Complex (November 2013-Present); Treasurer — Goldman Sachs Fund Complex (October 2009-Present); Senior Vice President — Goldman Sachs Fund Complex (November 2009-Present); and Assistant Treasurer — Goldman Sachs Fund Complex (May 2007-October 2009). |
| | | | | | |
| * | | Represents a partial list of officers of the Trust. Additional information about all the officers is available in the Funds’ Statement of Additional Information, which can be obtained from Goldman Sachs free of charge by calling this toll-free number (in the United States): 1-800-526-7384. |
| 1 | | Information is provided as of December 31, 2015. |
| 2 | | Officers hold office at the pleasure of the Board of Trustees or until their successors are duly elected and qualified. Each officer holds comparable positions with certain other companies of which Goldman Sachs, GSAM or an affiliate thereof is the investment adviser, administrator and/or distributor. |
Goldman Sachs Trust — Tax-Advantaged Equity Funds — Tax Information (Unaudited)
For the fiscal year ended December 31, 2015, 81.20% and 100% of the dividends paid from net investment company taxable income by the U.S. Equity Dividend and Premium and U.S. Tax-Managed Equity Funds, respectively, qualify for the dividends received deduction available to corporations.
For the 2015 tax year, the International Equity Dividend and Premium and International Tax-Managed Equity Funds have elected to pass through a credit for taxes paid to foreign jurisdictions. The total amount of income received by the International Equity Dividend and Premium and International Tax-Managed Equity Funds from sources within foreign countries and possessions of the United States was $0.2449 and $0.1194 per share, respectively, all of which is attributable to qualified passive income. The percentage of net investment income dividends paid by the International Equity Dividend and Premium and International Tax-Managed Equity Funds during the year from foreign sources was 75.59% and 82.01%, respectively. The total amount of taxes paid by the International Equity Dividend and Premium and International Tax-Managed Equity Funds to such countries was $0.0218 and $0.0095 per share, respectively.
For the fiscal year ended December 31, 2015, 97.32%, 95.64%, 100% and 100% of the dividends paid from net investment company taxable income by the U.S. Equity Dividend and Premium, International Equity Dividend and Premium, U.S. Tax-Managed Equity and International Tax-Managed Equity Funds, respectively, qualify for the reduced tax rate under the Jobs and Growth Tax Relief and Reconciliation Act of 2003.
Pursuant to Section 852 of the Internal Revenue Code, the U.S. Equity Dividend and Premium and International Equity Dividend and Premium, designate $50,372,712 and $1,130,858, respectively, or, if different, the maximum amount allowable, as capital gain dividends paid during the fiscal year ended December 31, 2015.
During the fiscal year ended December 31, 2015, the U.S. Equity Dividend and Premium and International Equity Dividend and Premium Funds designate $12,178,312 and $4,432,528 respectively, as short-term capital gain dividends pursuant to Section 871(k) of the Internal Revenue Code.
96
FUNDS PROFILE
Goldman Sachs Funds

Goldman Sachs is a premier financial services firm, known since 1869 for creating thoughtful and customized investment solutions in complex global markets.
Today, the Investment Management Division of Goldman Sachs serves a diverse set of clients worldwide, including private institutions, public entities and individuals. With approximately $1.08 trillion in assets under supervision as of December 31, 2015, Goldman Sachs Asset Management (“GSAM”) has portfolio management teams located around the world and our investment professionals bring firsthand knowledge of local markets to every investment decision. Assets under supervision includes assets under management and other client assets for which Goldman Sachs does not have full discretion. GSAM leverages the resources of Goldman, Sachs & Co. subject to legal, internal and regulatory restrictions.

Money Market1
Financial Square FundsSM
| n | | Financial Square Tax-Exempt Funds |
| n | | Financial Square Treasury Solutions Fund2 |
| n | | Financial Square Government Fund |
| n | | Financial Square Money Market Fund |
| n | | Financial Square Prime Obligations Fund |
| n | | Financial Square Treasury Instruments Fund |
| n | | Financial Square Treasury Obligations Fund |
| n | | Financial Square Federal Instruments Fund |
Fixed Income
Short Duration and Government
| n | | High Quality Floating Rate Fund |
| n | | Limited Maturity Obligations Fund |
| n | | Short Duration Government Fund |
| n | | Short Duration Income Fund |
| n | | Inflation Protected Securities Fund |
Multi-Sector
Municipal and Tax-Free
| n | | High Yield Municipal Fund |
| n | | Dynamic Municipal Income Fund |
| n | | Short Duration Tax-Free Fund |
Single Sector
| n | | Investment Grade Credit Fund |
| n | | High Yield Floating Rate Fund |
| n | | Emerging Markets Debt Fund |
| n | | Local Emerging Markets Debt Fund |
| n | | Dynamic Emerging Markets Debt Fund |
Fixed Income Alternatives
| n | | Long Short Credit Strategies Fund |
| n | | Fixed Income Macro Strategies Fund |
Fundamental Equity
| n | | Small/Mid Cap Value Fund |
| n | | Small/Mid Cap Growth Fund |
| n | | Flexible Cap Growth Fund |
| n | | Concentrated Growth Fund |
| n | | Technology Opportunities Fund3 |
| n | | Growth Opportunities Fund |
| n | | Rising Dividend Growth Fund |
| n | | Dynamic U.S. Equity Fund4 |
Tax-Advantaged Equity
| n | | U.S. Tax-Managed Equity Fund |
| n | | International Tax-Managed Equity Fund |
| n | | U.S. Equity Dividend and Premium Fund |
| n | | International Equity Dividend and Premium Fund |
Equity Insights
| n | | Small Cap Equity Insights Fund |
| n | | U.S. Equity Insights Fund |
| n | | Small Cap Growth Insights Fund |
| n | | Large Cap Growth Insights Fund |
| n | | Large Cap Value Insights Fund |
| n | | Small Cap Value Insights Fund |
| n | | International Small Cap Insights Fund |
| n | | International Equity Insights Fund |
| n | | Emerging Markets Equity Insights Fund |
Fundamental Equity International
| n | | Strategic International Equity Fund |
| n | | Focused International Equity Fund |
| n | | International Small Cap Fund |
| n | | Emerging Markets Equity Fund5 |
Select Satellite6
| n | | Real Estate Securities Fund |
| n | | International Real Estate Securities Fund |
| n | | Global Real Estate Securities Fund |
| n | | Commodity Strategy Fund |
| n | | Dynamic Commodity Strategy Fund |
| n | | Dynamic Allocation Fund |
| n | | Absolute Return Tracker Fund |
| n | | Managed Futures Strategy Fund |
| n | | MLP Energy Infrastructure Fund |
| n | | Multi-Manager Alternatives Fund |
| n | | Multi-Asset Real Return Fund |
| n | | Retirement Portfolio Completion Fund |
Total Portfolio Solutions6
| n | | Global Managed Beta Fund |
| n | | Multi-Manager Non-Core Fixed Income Fund |
| n | | Multi-Manager U.S. Dynamic Equity Fund |
| n | | Multi-Manager Global Equity Fund |
| n | | Multi-Manager International Equity Fund |
| n | | Tactical Tilt Implementation Fund |
| n | | Balanced Strategy Portfolio |
| n | | Multi-Manager Real Assets Strategy Fund |
| n | | Growth and Income Strategy Portfolio |
| n | | Growth Strategy Portfolio |
| n | | Equity Growth Strategy Portfolio |
| n | | Satellite Strategies Portfolio |
| n | | Enhanced Dividend Global Equity Portfolio |
| n | | Tax-Advantaged Global Equity Portfolio |
| 1 | | An investment in a money market fund is neither insured nor guaranteed by the Federal Deposit Insurance Corporation (“FDIC”) or any other government agency. Although the Funds seek to preserve the value of your investment at $1.00 per share, it is possible to lose money by investing in the Funds. |
| 2 | | Effective on September 30, 2015, the Goldman Sachs Financial Square Federal Fund was renamed the Goldman Sachs Financial Square Treasury Solutions Fund. |
| 3 | | Effective on July 31, 2015, the Goldman Sachs Technology Tollkeeper Fund was renamed the Goldman Sachs Technology Opportunities Fund. |
| 4 | | Effective on April 30, 2015, the Goldman Sachs U.S. Equity Fund was renamed the Goldman Sachs Dynamic U.S. Equity Fund. |
| 5 | | Effective at the close of business on October 23, 2015, the Goldman Sachs BRIC Fund (Brazil, Russia, India, China) was reorganized with and into the Goldman Sachs Emerging Markets Equity Fund. |
| 6 | | Individual Funds within the Total Portfolio Solutions and Select Satellite categories will have various placement on the risk/return spectrum and may have greater or lesser risk than that indicated by the placement of the general Total Portfolio Solutions or Select Satellite category. |
*This list covers open-end funds only. Please visit our website at www.GSAMFUNDS.com to learn about our closed-end funds.
| | |
TRUSTEES Ashok N. Bakhru, Chairman Kathryn A. Cassidy Diana M. Daniels Herbert J. Markley James A. McNamara Jessica Palmer Alan A. Shuch Roy W. Templin Gregory G. Weaver | | OFFICERS James A. McNamara, President Scott M. McHugh, Treasurer, Senior Vice President and Principal Financial Officer Caroline L. Kraus, Secretary |
| |
GOLDMAN, SACHS & CO. Distributor and Transfer Agent | | GOLDMAN SACHS ASSET MANAGEMENT, L.P. Investment Adviser |
Visit our web site at www.GSAMFUNDS.com to obtain the most recent month-end returns.
Goldman Sachs Asset Management, L.P. 200 West Street, New York, New York 10282
The reports concerning the Funds included in this shareholder report may contain certain forward-looking statements about the factors that may affect the performance of the Funds in the future. These statements are based on Fund management’s predictions and expectations concerning certain future events and their expected impact on the Funds, such as performance of the economy as a whole and of specific industry sectors, changes in the levels of interest rates, the impact of developing world events, and other factors that may influence the future performance of the Funds. Management believes these forward-looking statements to be reasonable, although they are inherently uncertain and difficult to predict. Actual events may cause adjustments in portfolio management strategies from those currently expected to be employed.
A description of the policies and procedures that the Funds use to determine how to vote proxies relating to portfolio securities and information regarding how a Fund voted proxies relating to portfolio securities during the most recent 12-month period ended June 30 is available (i) without charge, upon request by calling 1-800-526-7384 (for Retail Shareholders) or 1-800-621-2550 (for Institutional Shareholders); and (ii) on the U.S. Securities and Exchange Commission (“SEC”) web site at http://www.sec.gov.
The Funds file their complete schedule of portfolio holdings with the SEC for the first and third quarters of each fiscal year on Form N-Q. The Funds’ Forms N-Q are available on the SEC’s web site at http://www.sec.gov within 60 days after the Funds’ first and third fiscal quarters. The Funds’ Forms N-Q may be reviewed and copied at the SEC’s Public Reference Room in Washington, D.C. and information on the operation of the Public Reference Room may also be obtained by calling 1-800-SEC-0330. Forms N-Q may be obtained upon request and without charge by calling 1-800-526-7384 (for Retail Shareholders) or 1-800-621-2550 (for Institutional Shareholders).
Goldman, Sachs & Co. (‘‘Goldman Sachs’’) does not provide legal, tax or accounting advice. Any statement contained in this communication (including any attachments) concerning U.S. tax matters was not intended or written to be used, and cannot be used, for the purpose of avoiding penalties under the Internal Revenue Code, and was written to support the promotion or marketing of the transaction(s) or matter(s) addressed. Clients of Goldman Sachs should obtain their own independent tax advice based on their particular circumstances.
Holdings and allocations shown are as of December 31, 2015 and may not be representative of future investments. Fund holdings should not be relied on in making investment decisions and should not be construed as research or investment advice regarding particular securities. Current and future holdings are subject to risk.
The Global Industry Classification Standard (GICS) was developed by and is the exclusive property and a service mark of Morgan Stanley Capital International Inc. (MSCI) and Standard & Poor’s, a division of The McGraw-Hill Companies, Inc. (S&P) and is licensed for use by Goldman Sachs. Neither MSCI, S&P nor any other party involved in making or compiling the GICS or any GICS classifications makes any express or implied warranties or representations with respect to such standard or classification (or the results to be obtained by the use thereof), and all such parties hereby expressly disclaim all warranties of originality, accuracy, completeness, merchantability or fitness for a particular purpose with respect to any of such standard or classification. Without limiting any of the foregoing, in no event shall MSCI, S&P, any of their affiliates or any third party involved in making or compiling the GICS or any GICS classifications have any liability for any direct, indirect, special, punitive, consequential or any other damages (including lost profits) even if notified of the possibility of such damages.
The portfolio risk management process includes an effort to monitor and manage risk, but does not imply low risk.
This material is not authorized for distribution to prospective investors unless preceded or accompanied by a current Prospectus or summary prospectus, if applicable. Investors should consider a Fund’s objective, risks, and charges and expenses, and read the summary prospectus, if available, and/or the Prospectus carefully before investing or sending money. The summary prospectus, if available, and the Prospectus contain this and other information about a Fund and may be obtained from your Authorized Institution or from Goldman, Sachs & Co. by calling (retail – 1-800-526-7384) (institutional – 1-800-621-2550).
© 2016 Goldman Sachs. All rights reserved. 31553-TEMPL-02/2016 TAXADVAR-16/15K
(a) As of the end of the period covered by this report, the registrant has adopted a code of ethics that applies to the registrant’s principal executive officer, principal financial officer, principal accounting officer or controller, or persons performing similar functions, regardless of whether these individuals are employed by the registrant or a third party (the “Code of Ethics”).
(b) During the period covered by this report, no amendments were made to the provisions of the Code of Ethics.
(c) During the period covered by this report, the registrant did not grant any waivers, including an implicit waiver, from any provision of the Code of Ethics.
(d) A copy of the Code of Ethics is available as provided in Item 12(a)(1) of this report.
| ITEM 3. | AUDIT COMMITTEE FINANCIAL EXPERT. |
The registrant’s board of trustees has determined that the registrant has at least one “audit committee financial expert” (as defined in Item 3 of Form N-CSR) serving on its audit committee. Gregory G. Weaver is the “audit committee financial expert” and is “independent” (as each term is defined in Item 3 of Form N-CSR).
| ITEM 4. | PRINCIPAL ACCOUNTANT FEES AND SERVICES. |
Table 1 — Items 4(a) - 4(d). The accountant fees below reflect the aggregate fees billed by all of the Funds of the Goldman Sachs Trust and includes the Goldman Sachs Funds to which this certified shareholder report relates.
| | | | | | | | | | | | |
| | | 2015 | | 2014 | | Description of Services Rendered |
| | | |
| | | | | | | | | | | | |
| | | |
Audit Fees: | | | | | | | | | | | | |
| | | |
• PricewaterhouseCoopers LLP
(“PwC”) | | | $ | 3,800,334 | | | | $ | 3,563,029 | | | Financial Statement audits. |
| | | |
Audit-Related Fees: | | | | | | | | | | | | |
| | | |
• PwC | | | $ | 158,000 | | | | $ | 0 | | | Other attest services. |
| | | |
Tax Fees: | | | | | | | | | | | | |
| | | |
• PwC | | | $ | 1,058,976 | | | | $ | 672,155 | | | Tax compliance services provided in connection with the preparation and review of registrant’s tax returns. |
Table 2 — Items 4(b)(c) & (d). Non-Audit Services to the Goldman Sachs Trust’s service affiliates * that were pre-approved by the Audit Committee of the Goldman Sachs Trust pursuant to Rule 2-01(c)(7)(ii) of Regulation S-X.
| | | | | | | | | | | | |
| | | 2015 | | 2014 | | Description of Services Rendered |
| | | |
| | | | | | | | | | | | |
| | | |
Audit-Related Fees: | | | | | | | | | | | | |
| | | |
• PwC | | | $ | 1,653,616 | | | | $ | 1,486,420 | | | Internal control review performed in accordance with Statement on Standards for Attestation Engagements No. 16 and Semi-Annual Updates related to withholding tax accrual for non-US Jurisdictions. These fees are borne by the Funds’ Adviser. |
| * | These include the advisor (excluding sub-advisors) and any entity controlling, controlled by or under common control with the advisor that provides ongoing services to the registrant (hereinafter referred to as “service affiliates”). |
Item 4(e)(1) — Audit Committee Pre-Approval Policies and Procedures
Pre-Approval of Audit and Non-Audit Services Provided to the Funds of the Goldman Sachs Trust. The Audit and Non-Audit Services Pre-Approval Policy (the “Policy”) adopted by the Audit Committee of Goldman Sachs Trust (“GST”) sets forth the procedures and the conditions pursuant to which services performed by an independent auditor for GST may be pre-approved. Services may be pre-approved specifically by the Audit Committee as a whole or, in certain circumstances, by the Audit Committee Chairman or the person designated as the Audit Committee Financial Expert. In addition, subject to specified cost limitations, certain services may be pre-approved under the provisions of the Policy. The Policy provides that the Audit Committee will consider whether the services provided by an independent auditor are consistent with the Securities and Exchange Commission’s rules on auditor independence. The Policy provides for periodic review and pre-approval by the Audit Committee of the services that may be provided by the independent auditor.
De Minimis Waiver. The pre-approval requirements of the Policy may be waived with respect to the provision of non-audit services that are permissible for an independent auditor to perform, provided (1) the aggregate amount of all such services provided constitutes no more than five percent of the total amount of revenues subject to pre-approval that was paid to the independent auditors during the fiscal year in which the services are provided; (2) such services were not recognized by GST at the time of the engagement to be non-audit services; and (3) such services are promptly brought to the attention of the Audit Committee and approved prior to the completion of the audit by the Audit Committee or by one or more members of the Audit Committee to whom authority to grant such approvals has been delegated by the Audit Committee, pursuant to the pre-approval provisions of the Policy.
Pre-Approval of Non-Audit Services Provided to GST’s Investment Advisers. The Policy provides that, in addition to requiring pre-approval of audit and non-audit services provided to GST, the Audit Committee will pre-approve those non-audit services provided to GST’s investment advisers (and entities controlling, controlled by or under common control with the investment advisers that provide ongoing services to GST) where the engagement relates directly to the operations or financial reporting of GST.
Item 4(e)(2) – 0% of the audit-related fees, tax fees and other fees listed in Table 1 were approved by GST’s Audit Committee pursuant to the “de minimis” exception of Rule 2-01(c)(7)(i)(C) of Regulation S-X. In addition, 0% of the non-audit services to the GST’s service affiliates listed in Table 2 were approved by GST’s Audit Committee pursuant to the “de minimis” exception of Rule 2-01(c)(7)(i)(C) of Regulation S-X.
Item 4(f) – Not applicable.
Item 4(g) Aggregate Non-Audit Fees Disclosure
The aggregate non-audit fees billed to GST by PwC for the twelve months ended December 31, 2015 and December 31, 2014 were $1,216,976 and $672,155 respectively.
The aggregate non-audit fees billed to GST’s adviser and service affiliates by PwC for non-audit services for the twelve months ended December 31, 2014 and December 31, 2013 were approximately $10.2 million and $9.8 million respectively. The figures for these entities are not yet available for twelve months ended December 31, 2015. With regard to the aggregate non-audit fees billed to GST’s adviser and service affiliates, the 2014 and 2013 amounts include fees for non-audit services required to be pre-approved [see Table 2] and fees for non-audit services that did not require pre-approval since they did not directly relate to GST’s operations or financial reporting.
Item 4(h) — GST’s Audit Committee has considered whether the provision of non-audit services to GST’s investment adviser and service affiliates that did not require pre-approval pursuant to paragraph (c)(7)(ii) of Rule 2-01 of Regulation S-X is compatible with maintaining the auditors’ independence.
| ITEM 5. | AUDIT COMMITTEE OF LISTED REGISTRANTS. |
| ITEM 6. | SCHEDULE OF INVESTMENTS. |
| | Schedule of Investments is included as part of the Report to Stockholders filed under Item 1. |
| ITEM 7. | DISCLOSURE OF PROXY VOTING POLICIES AND PROCEDURES FOR CLOSED-END MANAGEMENT INVESTMENT COMPANIES. |
| ITEM 8. | PORTFOLIO MANAGERS OF CLOSED-END MANAGEMENT INVESTMENT COMPANIES. |
| ITEM 9. | PURCHASES OF EQUITY SECURITIES BY CLOSED-END MANAGEMENT INVESTMENT COMPANY AND AFFILIATED PURCHASERS. |
| ITEM 10. | SUBMISSION OF MATTERS TO A VOTE OF SECURITY HOLDERS. |
| | There have been no material changes to the procedures by which shareholders may recommend nominees to the registrant’s board of trustees. |
| ITEM 11. | CONTROLS AND PROCEDURES. |
| | (a) | The registrant’s principal executive and principal financial officers, or persons performing similar functions have concluded that the registrant’s disclosure controls and procedures (as defined in Rule 30a-3(c) under the Investment Company Act of 1940, as amended (the “1940 Act”)) are effective as of a date within 90 days of the filing of this report that includes the disclosure required by this paragraph, based on the evaluation of these controls and procedures required by Rule 30a-3(b) under the 1940 Act and 15d-15(b) under the Securities Exchange Act of 1934, as amended. |
| | (b) | There were no changes in the registrant’s internal control over financial reporting (as defined in Rule 30a-3(d) under the 1940 Act) that occurred during the registrant’s second fiscal quarter of the period covered by this report that have materially affected, or are reasonably likely to materially affect, the registrant’s internal control over financial reporting. |
| | | | |
| (a)(1) | | Goldman Sachs Trust’s Code of Ethics for Principal Executive and Senior Financial Officers is incorporated by reference to Exhibit 12(a)(1) of the registrant’s Form N-CSR filed on July 8, 2015 for its International Equity Insights Funds. |
| | |
| (a)(2) | | Exhibit 99.CERT | | Certifications pursuant to Section 302 of the Sarbanes-Oxley Act of 2002 filed herewith. |
| | |
| (b) | | Exhibit 99.906CERT | | Certifications pursuant to Section 906 of the Sarbanes-Oxley Act of 2002 filed herewith. |
SIGNATURES
Pursuant to the requirements of the Securities Exchange Act of 1934 and the Investment Company Act of 1940, the registrant has duly caused this report to be signed on its behalf by the undersigned, thereunto duly authorized.
| | |
| | | Goldman Sachs Trust |
| |
| By: | | /s/ James A. McNamara |
| |
| | |
| | James A. McNamara |
| | Chief Executive Officer |
| | Goldman Sachs Trust |
| |
| Date: | | March 10, 2016 |
Pursuant to the requirements of the Securities Exchange Act of 1934 and the Investment Company Act of 1940, this report has been signed below by the following persons on behalf of the registrant and in the capacities and on the dates indicated.
| | |
| By: | | /s/ James A. McNamara |
| |
| | |
| | James A. McNamara |
| | Chief Executive Officer |
| | Goldman Sachs Trust |
| |
| Date: | | March 10, 2016 |
| |
| By: | | /s/ Scott McHugh |
| |
| | |
| | Scott McHugh |
| | Principal Financial Officer |
| | Goldman Sachs Trust |
| |
| Date: | | March 10, 2016 |