UNITED STATES
SECURITIES AND EXCHANGE COMMISSION
Washington, D.C. 20549
FORM N-CSR
CERTIFIED SHAREHOLDER REPORT OF REGISTERED
MANAGEMENT INVESTMENT COMPANIES
Investment Company Act file number 811-05349
Goldman Sachs Trust
(Exact name of registrant as specified in charter)
71 South Wacker Drive, Chicago, Illinois 60606
(Address of principal executive offices) (Zip code)
| | |
| Caroline Kraus, Esq. | | Copies to: |
| Goldman, Sachs & Co. | | Geoffrey R.T. Kenyon, Esq. |
| 200 West Street | | Dechert LLP |
| New York, New York 10282 | | 100 Oliver Street |
| | 40th Floor |
| | Boston, MA 02110-2605 |
(Name and address of agents for service)
Registrant’s telephone number, including area code: (312) 655-4400
Date of fiscal year end: March 31
Date of reporting period: March 31, 2016
| ITEM 1. | REPORTS TO STOCKHOLDERS. |
| | The Annual Report to Shareholders is filed herewith. |
Goldman Sachs Funds
| | | | |
| | |
| Annual Report | | | | March 31, 2016 |
| | |
| | | | Fixed Income Alternatives Funds |
| | | | Fixed Income Macro Strategies |
| | | | Long Short Credit Strategies |

Goldman Sachs Fixed Income Alternatives Funds
| n | | FIXED INCOME MACRO STRATEGIES FUND |
| n | | LONG SHORT CREDIT STRATEGIES FUND |
| | | | |
TABLE OF CONTENTS | | | | |
| |
Investment Process | | | 1 | |
| |
Portfolio Management Discussion and Performance Summaries | | | 2 | |
| |
Schedule of Investments | | | 19 | |
| |
Financial Statements | | | 44 | |
| |
Financial Highlights | | | 48 | |
| |
Notes to Financial Statements | | | 52 | |
| |
Report of Independent Auditor | | | 76 | |
| |
Other Information | | | 77 | |
| | | | |
| | | |
| NOT FDIC-INSURED | | May Lose Value | | No Bank Guarantee |
GOLDMAN SACHS FIXED INCOME ALTERNATIVES FUNDS
What Differentiates Goldman Sachs’ Fixed Income Macro Strategies Fund Investment Process?
The Goldman Sachs Fixed Income Macro Strategies Fund (the “Fund”) seeks to generate long-term absolute return. Changes in global fixed income and currency markets have created opportunities for generating attractive returns through fixed income alternative and unconstrained investment strategies.
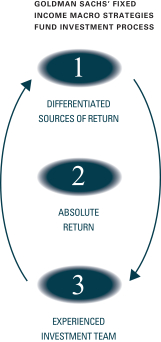
Our investment process seeks to create excess returns by:
| n | | Adopting a global perspective to compare and contrast investment opportunities around the world |
| n | | Employing eight specialist strategy teams that each conduct very detailed fundamental and quantitative research in their search for attractive investments |
| n | | Capturing the value in the inherent diversification benefits among the different investment strategies |
| n | | Using a disciplined risk-management approach to implement the strategy |
We believe the following characteristics drive the implementation and execution of the Fund’s investment process:

| n | | The Fund invests in a portfolio of fixed income, currency, and commodities in an attempt to generate returns different from traditional asset classes. |
| n | | Alternative investments do not necessarily move in tandem with traditional asset classes, such as stocks, bonds and credit. By adding them to the portfolio the Fund seeks to enhance its overall risk/return profile of its investors. |

| n | | The Fund seeks to generate returns in up and down markets when asset classes are in or out of favor. |
| n | | The Fund employs alternative investment techniques—such as hedging, leverage and shorting that may provide an opportunity for the Fund to achieve its goal of absolute returns. |

| n | | We have over 300 investment professionals covering multiple sectors of the global fixed income market who are focused on finding investment ideas for our portfolio. |
| n | | The senior professionals on the team have an average of over 20 years of investment experience through multiple market cycles. |
1
PORTFOLIO RESULTS
Goldman Sachs Fixed Income Macro Strategies Fund
Investment Objective
The Fund seeks to generate long-term absolute return.
Portfolio Management Discussion and Analysis
Below, the Goldman Sachs Fixed Income Investment Management Team discusses the Goldman Sachs Fixed Income Macro Strategies Fund’s (the “Fund”) performance and positioning for the 12-month period ended March 31, 2016 (the “Reporting Period”).
| Q | | How did the Fund perform during the Reporting Period? |
| A | | During the Reporting Period, the Fund’s Class A, Class C, Institutional, Class IR and Class R Shares generated average annual total returns, without sales charges, of 3.98%, 3.25%, 4.15%, 4.06% and 3.66%, respectively. These returns compare to the 0.33% average annual total return of the Fund’s benchmark, the Bank of America Merrill Lynch U.S. Dollar Three-Month LIBOR Constant Maturity Index (“the Index”) during the same time period. |
| | Because the composition of the Index (e.g., short-term cash securities) is not comparable to the range of instruments in which the Fund may transact (e.g., various fixed income, currency and commodities instruments), references to the Index are for informational purposes only and are not an indication of how the Fund is managed. |
| Q | | What economic and market factors most influenced the fixed income market as a whole during the Reporting Period? |
| A | | When the Reporting Period began in April 2015, the performance of spread, or non-government bond, sectors was mixed. U.S. Treasury yields rose as U.S. economic data improved, including positive surprises in inflation and retail sales. First quarter 2015 U.S. Gross Domestic Product (“GDP”) was revised upwards from -0.7% to a seasonally adjusted annualized rate of -0.2%. The upward revision stemmed in part from stronger than estimated consumer spending and inventory data. U.S. dollar gains hit a roadblock during the second calendar quarter on uncertainty around the Federal Reserve’s (the “Fed”) plans for raising interest rates in 2015. The Eurozone’s economic progress took a back seat to the seemingly intractable challenges surrounding Greece. |
| | In the third quarter of 2015, spread sectors underperformed U.S. Treasuries as the outlook for the global economy grew cloudy. Investors focused on slowing economic growth in China, the devaluation of the Chinese renminbi and an unexpected increase in market volatility. Oil and commodities prices dropped to new lows, partly because of falling demand from China. The U.S. dollar appreciated modestly during the third calendar quarter on cautious optimism that the Fed was on track to raise rates in 2015. However, the Fed chose to leave rates unchanged at its September 2015 policy meeting, citing conditions in the global economy. Although the U.S. economy continued to improve, economic growth in other developed countries softened, and emerging markets economies broadly weakened. Despite accommodative monetary policies by many global central banks, inflation remained subdued in the world’s major economies. |
| | In the fourth quarter of 2015, spread sectors generated positive returns. Outside the U.S., the global monetary policy environment remained highly accommodative, with the European Central Bank (“ECB”) lowering interest rates into negative territory and expanding its stimulus program. The U.S. dollar gained on expectations that the Fed would hike interest rates, which it did at its December 2015 policy meeting. During the fourth calendar quarter, the U.S. economy continued to display a positive growth trend, but economic growth in other developed countries had softened by the end of 2015. At the same time, growth in emerging markets countries broadly weakened, largely due to commodity price declines and concerns about the slowing Chinese economy. |
| | The first quarter of 2016 was very much a tale of two halves. Spread sectors sold off significantly from January to mid-February 2016 and then largely retraced their losses by the |
2
PORTFOLIO RESULTS
| | end of March 2016. Volatility early in the first calendar quarter was driven by an increase in a number of perceived risks, such as slowing Chinese economic activity, the possibility of persistent oil oversupply, and deteriorating corporate bond fundamentals as the U.S. credit cycle entered its later stage. Some of these risks eased in the second half of the first calendar quarter, as economic news from China improved, U.S. oil production showed signs of slowing, and commodity prices appeared to stabilize. Global central banks remained accommodative. The Bank of Japan, in a surprise move at its January 2016 policy meeting, introduced a -0.1% interest rate, reaffirming its commitment to achieving a 2% inflation target. The ECB shifted its focus from currency depreciation to credit creation by leaving the deposit rate unchanged, expanding its asset purchase program to include purchases of non-financial corporate credit and announcing a new series of easing measures in the form of targeted long-term refinancing operations (“TLTRO II”). (TLTRO II is designed to offer attractive long-term funding conditions to Eurozone banks to further ease private sector credit conditions and to stimulate credit creation.) In the U.S., Fed statements during March 2016 suggested U.S. interest rates would remain lower for longer than previously expected. After a sustained period of appreciation, the U.S. dollar weakened during the first calendar quarter due to generally tighter financial conditions, mixed U.S. economic data and the Fed’s more dovish commentary. (Dovish commentary tends to imply lower interest rates.) |
| | For the Reporting Period overall, sovereign emerging markets debt and asset-backed securities slightly outperformed U.S Treasuries. Mortgage-backed securities and commercial mortgage-backed securities generally performed in line with U.S. Treasuries, while investment grade corporate bonds and agencies underperformed. High yield corporate bonds significantly underperformed Treasuries. The U.S. Treasury yield curve, or spectrum of maturities, flattened during the Reporting Period. Both short-term and long-term yields rose during the Reporting Period, but long-term yields rose less. Intermediate-term U.S. Treasury yields actually declined modestly, with the yield on the bellwether 10-year U.S. Treasury declining approximately 15 basis points to end the Reporting Period at 1.77%. (A basis point is 1/100th of a percentage point.) |
| Q | | What key factors were responsible for the Fund’s performance during the Reporting Period? |
| A | | The Fund seeks long-term absolute return through the implementation of relative value, macro and other strategies that aim to exploit disparities or inefficiencies in the global fixed income, currency and commodities markets. In addition, as of November 20, 2015, the Fund also used a long/short strategy to invest in certain fixed income securities. We believe absolute return performance may be uncorrelated to fixed income and equity markets over the long-term. Absolute return is the return of an investment and is not relative to a benchmark. Relative value strategy means to simultaneously take long and short positions within an investment portfolio. A long/short strategy seeks to produce returns with risk and volatility that are uncorrelated with general global market risk and volatility by simultaneously taking long and short exposures in approximately equal amounts. The Fund may also employ a macro hedge to seek to remove unintended market directional risks, which may enable the Fund to pursue returns in a variety of market cycles. In addition, the Fund may use derivatives instead of buying and selling bonds to manage duration, to gain exposure to or to short individual securities, or to gain exposure to an index. Duration is a measure of the Fund’s sensitivity to changes in interest rates. |
| | Investment ideas for the Fund are generated through our specialized top-down and bottom-up strategy teams, in the following areas: Tactical Duration; Country Relative Value; Fundamental Currency; Commodities; Sector Allocation; Government and Swaps; Liquid Mortgages; and Emerging Markets Debt. |
| | Derivatives are used in combination with cash securities to implement our views in the Fund. During the Reporting Period, the Fund outperformed the Index, largely because of its Government and Swaps strategy and its Country Relative Value strategy. Within the Fund’s Government and Swaps strategy, the Fund benefited from curve steepening positions in the European government bond yield curve and the U.S. Treasury yield curve, as both of these curves steepened at certain times during the Reporting Period, particularly during June and July 2015. Curve steepening positions were implemented through interest rate swaps. (Yield curve indicates a spectrum of maturities.) In addition, the Fund’s holdings of shorter-maturity Treasury Inflation-Protected |
3
PORTFOLIO RESULTS
| | Securities (“TIPS”) bolstered performance. The Government and Swaps strategy is actively implemented via interest rate swaps and/or futures. Relative value positions within the Fund’s Country Relative Value strategy also added to performance. More specifically, the Fund benefited from its long positions in Japanese 10-year and 20-year interest rates versus its short positions in European 10-year and 20-year interest rates. It also benefited from its long positions in five-year Brazilian interest rates. In addition, the Fund was helped during the Reporting Period by its long positions in Canadian two-year interest rates. The Fund’s Country Relative Value strategy is actively implemented via interest rate swaps and/or futures. |
| | Conversely, the Fund was hurt during the Reporting Period by its Sector Allocation strategy and its Commodities strategy. In its Sector Allocation strategy, the Fund’s long position in corporate credit detracted from returns during the Reporting Period. The Sector Allocation strategy utilizes a blend of cash securities, interest rate swaps and credit default swaps. Within its Commodities strategy, the Fund was hampered by its short position in grains. The Commodities strategy uses a blend of commodity futures and options. Also, during the Reporting Period, the Fund employed a macro hedge wherein it held a short position in S&P 500® Index futures, a position that diminished performance. |
| Q | | How did the Fund use derivatives and similar instruments during the Reporting Period? |
| A | | During the Reporting Period, the Fund invested in interest rate futures, interest rate swaps, total return swaps, swaptions, options on futures, credit default swaps, equity index futures, non-deliverable forwards, forward foreign currency exchange contracts, currency options and cross currency swaps. The Fund used interest rate futures to hedge interest rate exposure, i.e., to manage exposure to fluctuations in interest rates, and to facilitate specific duration and yield curve strategies. Interest rate swaps were used to express our views on the direction of interest rates. Total return swaps were employed to manage the Fund’s yield curve exposures across various strategies. Swaptions (or options on interest rate swap contracts) were used to hedge interest rate exposure and manage the Fund’s exposure to potential market volatility. Options on futures were used within the Government/Swaps strategy to allow the Fund the right to enter into futures contracts. Credit default swaps were employed to implement specific credit-related investment strategies. Equity index futures were used as a means of reducing Fund volatility. Within the Fundamental Currency strategy, the Fund used non-deliverable currency forwards to gain exposure to a particular country and also to take advantage of relative value opportunities. The Fund also utilized forward foreign currency exchange contracts and currency options within the Fundamental Currency strategy to take long or short positions. Within the Emerging Markets Debt Strategy, the Fund employed cross currency swaps to express relative views on given currencies as well as our views on the direction of a country’s interest rates. Derivatives and similar instruments allow us to manage interest rate, credit and currency risks more effectively by allowing us both to apply active investment views with greater versatility and to afford greater risk management precision than we would otherwise be able to implement. During the Reporting Period, the use of derivatives and similar instruments had a positive impact on the Fund’s performance. |
| Q | | Were there any notable changes in the Fund’s weightings during the Reporting Period? |
| A | | Within the Government and Swaps Strategy, we increased the Fund’s yield curve steepening positions during the Reporting Period, particularly its curve steepening position in the European government bond yield curve. Within the Fund’s Fundamental Currency strategy, we increased exposure to certain emerging markets currencies, such as the Mexican peso, Colombian peso, Chilean peso and Russian ruble. In the Fund’s Commodities strategy, we eliminated the Fund’s short position in oil. In addition, during the Reporting Period, we initiated a short position in agency mortgage-backed securities within the Fund’s Sector Allocation strategy. |
| Q | | How was the Fund positioned at the end of the Reporting Period? |
| A | | At the end of the Reporting Period, within the Tactical Duration strategy, the Fund held a short duration position on the U.S. Treasury yield curve. In the Country Relative Value strategy, the Fund had a long position in European interest rates versus short positions in U.S. and U.K. interest rates. It also had a long position in Brazilian interest rates. In the Fundamental Currency strategy, the Fund had short positions in Asian currencies. It also had a short position in the euro versus the Swedish krona and a long position in the euro versus the British pound. Additionally, the Fund had long |
4
PORTFOLIO RESULTS
| | positions in the Mexican peso and Russian ruble and short positions in the Turkish lira and United Arab Emirates dirham. In the Fund’s Commodities strategy, it had short positions in agriculture, mainly through soybeans and wheat, as well as in natural gas. It had long positions in zinc versus short positions in copper and aluminum. Within the Sector Allocation strategy, the Fund held long positions in corporate credit, hard currency emerging markets debt, and an index of commercial mortgage-backed securities. It had a short position in agency mortgage-backed securities. Within the Government and Swaps strategy, the Fund held long positions in TIPS and nominal Japanese government bonds. In addition, the Fund had curve steepening positions in the U.S. and European government bond yield curves. Within the Emerging Markets Debt strategy, the Fund held long positions in Brazilian and Colombian external bonds and short positions in Hungarian and Turkish external bonds. At the end of the Reporting Period, we maintained the Fund’s macro hedge in which it held a short position in S&P 500® Index futures. |
| Q | | What is the Fund’s tactical view and strategy for the months ahead? |
| A | | At the end of the Reporting Period, we expected a continuation of trends seen in the early months of 2016: 1) modest global economic growth; 2) extreme monetary policy measures helping to support gradual economic improvement in Europe and Japan; and 3) a backdrop of rising U.S. inflation, rising debt in China and unpredictable politics globally. |
| | Overall, we believe global economic growth may be stuck in low gear. After a modestly stronger year for the U.S., Europe and Japan in 2015, we expect some softening in 2016. In terms of monetary policy, we believe the economic benefits of negative interest rates in Europe and Japan and a strong U.S. dollar are questionable, and investors appear increasingly focused on the potential negatives. Indeed, we see the ECB’s policy decision in March 2016 as shifting its emphasis away from negative rates and currency depreciation and toward stimulating domestic demand through the credit channel. In Japan, the corporate bond market is relatively small and government bond purchases are already at what we consider to be extreme levels, which could limit the Bank of Japan’s options. As a result, we think further rate cuts are possible. In the U.S., the Fed has adjusted its approach, reducing the number of projected interest rate hikes in 2016 from four to two, while emphasizing risks from soft global economic growth and continued strength of the U.S. dollar. In terms of the emerging markets, we believe they remain broadly at risk from developments in China. |
| | At the end of the Reporting Period, we considered the environment positive for selective exposure to corporate bonds, emerging markets debt and other higher yielding sectors of the fixed income market. At the same time, however, the volatility in the first quarter of 2016 added to our sense that markets are fragile and longer-term risks are growing. As a result, we remained biased to staying nimble overall with an emphasis on higher credit quality. |
|
| |
| Index Definition |
| The Bank of America Merrill Lynch U.S. Dollar Three-Month LIBOR Constant Maturity Index (the “Index”) tracks the performance of a synthetic asset paying LIBOR to a stated maturity. The Index is based on the assumed purchase at par of a synthetic instrument having exactly its stated maturity and with a coupon equal to that day’s fixing rate. That issue is assumed to be sold the following business day (priced at yield equal to the current day fixing rate) and rolled into a new instrument. |
5
FUND BASICS
Fixed Income Macro Strategies Fund
as of March 31, 2016
| | | | | | | | | | |
| | PERFORMANCE REVIEW | |
| | | April 1, 2015–March 31, 2016 | | Fund Total Return
(based on NAV)1 | | | Bank of America Merrill Lynch
U.S. Dollar Three-Month LIBOR
Constant Maturity Index2 | |
| | Class A | | | 3.98 | % | | | 0.33 | % |
| | Class C | | | 3.25 | | | | 0.33 | |
| | Institutional | | | 4.15 | | | | 0.33 | |
| | Class IR | | | 4.06 | | | | 0.33 | |
| | | Class R | | | 3.66 | | | | 0.33 | |
| | 1 | | The net asset value (“NAV”) represents the net assets of the class of the Fund (ex-dividend) divided by the total number of shares of the class outstanding. The Fund’s performance reflects the reinvestment of dividends and other distributions. The Fund’s performance does not reflect the deduction of any applicable sales charges. |
| | 2 | | The Bank of America Merrill Lynch U.S. Dollar Three-Month LIBOR Constant Maturity Index (the “BofA/Merrill Lynch Index”) tracks the performance of a synthetic asset paying LIBOR to a stated maturity. The BofA/Merrill Lynch Index is based on the assumed purchase at par of a synthetic instrument having exactly its stated maturity and with a coupon equal to that day’s fixing rate. That issue is assumed to be sold the following business day (priced at yield equal to the current day fixing rate) and rolled into a new instrument. |
| | | | | | | | | | | | |
| | STANDARDIZED TOTAL RETURNS3 |
| | | For the fiscal year ended 3/31/16 | | One Year | | | Since Inception | | | Inception Date |
| | Class A | | | 0.11 | % | | | -4.21 | % | | 12/16/13 |
| | Class C | | | 2.22 | | | | -2.92 | | | 12/16/13 |
| | Institutional | | | 4.15 | | | | -2.36 | | | 12/16/13 |
| | Class IR | | | 4.06 | | | | -2.51 | | | 12/16/13 |
| | | Class R | | | 3.66 | | | | -2.72 | | | 12/16/13 |
| | 3 | | The Standardized Total Returns are Average Annual total returns as of the most recent calendar quarter-end. They assume reinvestment of all distributions at NAV. These returns reflect a maximum initial sales charge of 3.75% for Class A Shares and the assumed contingent deferred sales charge for Class C Shares (1% if redeemed within 12 months of purchase). Because Institutional, Class IR and Class R Shares do not involve a sales charge, such a charge is not applied to their Standardized Total Returns. |
The returns set forth in the tables above represent past performance. Past performance does not guarantee future results. The Fund’s investment return and principal value will fluctuate so that an investor’s shares, when redeemed, may be worth more or less than their original cost. Current performance may be lower or higher than the performance quoted above. Please visit our web site at www.GSAMFUNDS.com to obtain the most recent month-end returns. Performance reflects applicable fee waivers and/or expense limitations in effect during the periods shown. In their absence, performance would be reduced. Returns do not reflect the deduction of taxes that a shareholder would pay on Fund distributions or the redemption of Fund shares.
6
FUND BASICS
| | | | | | | | | | |
| | EXPENSE RATIOS4 | |
| | | | | Net Expense Ratio (Current) | | | Gross Expense Ratio (Before Waivers) | |
| | Class A | | | 1.80 | % | | | 3.26 | % |
| | Class C | | | 2.55 | | | | 4.27 | |
| | Institutional | | | 1.46 | | | | 2.69 | |
| | Class IR | | | 1.54 | | | | 2.87 | |
| | | Class R | | | 2.05 | | | | 3.30 | |
| | 4 | | The expense ratios of the Fund, both current (net of applicable fee waivers and/or expense limitations) and before waivers (gross of applicable fee waivers and/or expense limitations) are as set forth above according to the most recent publicly available Prospectus for the Fund and may differ from the expense ratios disclosed in the Financial Highlights in this report. Pursuant to a contractual arrangement, the Fund’s waivers and/or expense limitations will remain in place through at least July 29, 2016, and prior to such date the Investment Adviser may not terminate the arrangements without the approval of the Fund’s Board of Trustees. If these arrangements are discontinued in the future, the expense ratios may change without shareholder approval. |
7
FUND BASICS
|
| FUND COMPOSITION5 |
| Percentage of Net Assets |
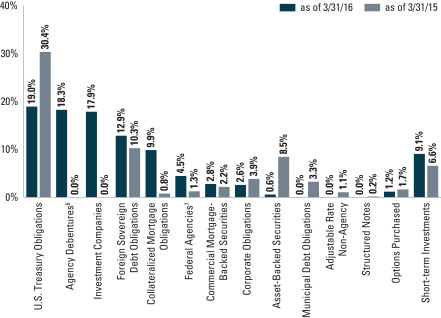
| | 5 | | The percentage shown for each investment category reflects the value of investments in that category as a percentage of net assets. Short-term investments represent repurchase agreements. Figures in the graph may not sum to 100% due to the exclusion of other assets and liabilities. The graph depicts the Fund’s investments but may not represent the Fund’s market exposure due to the exclusion of certain derivatives, if any, as listed in the Additional Investment Information section of the Schedule of Investments. |
| | 6 | | “Agency Debentures” include agency securities offered by companies such as Federal National Mortgage Association (“FNMA”) and Federal Home Loan Mortgage Corp. (“FHLMC”), which operate under a government charter. While they are required to report to a government regulator, their assets are not explicitly guaranteed by the government and they otherwise operate like any other publicly traded company. |
| | 7 | | “Federal Agencies” are mortgage-backed securities guaranteed by the Government National Mortgage Association (“GNMA”), FNMA and FHLMC. GNMA instruments are backed by the full faith and credit of the U.S. Government. |
8
GOLDMAN SACHS FIXED INCOME MACRO STRATEGIES FUND
Performance Summary
March 31, 2016
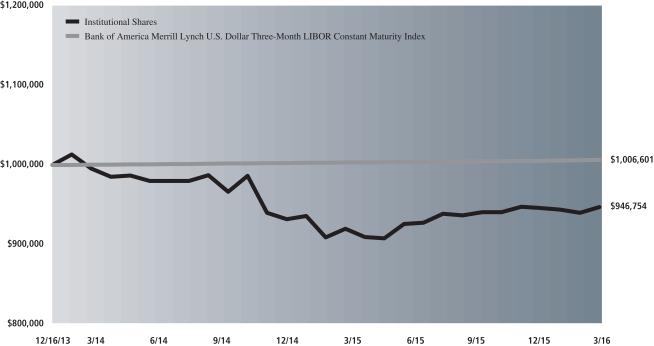
The following graph shows the value, as of March 31, 2016, of a $1,000,000 investment made on December 16, 2013 (commencement of operations) in Institutional Shares. For comparative purposes, the performance of the Fund’s benchmark, the Bank of America Merrill Lynch U.S. Dollar Three-Month LIBOR Constant Maturity Index, is shown. This performance data represents past performance and should not be considered indicative of future performance, which will fluctuate with changes in market conditions. These performance fluctuations will cause an investor’s shares, when redeemed, to be worth more or less than their original cost. Performance reflects applicable fee waivers and/or expense limitations in effect during the periods shown and in their absence, performance would be reduced. Returns do not reflect the deduction of taxes that a shareholder would pay on Fund distributions or the repurchase of Fund shares. Performance of Class A, Class C, Class IR and Class R Shares will vary from Institutional Shares due to differences in class specific fees and any applicable sales charges. In addition to the Investment Adviser’s decisions regarding issuer/industry/country investment selection and allocation, other factors may affect Fund performance. These factors include, but are not limited to, Fund operating fees and expenses, portfolio turnover and subscription and redemption cash flows affecting the Fund.
|
| Fixed Income Macro Strategies Fund’s Lifetime Performance |
Performance of a $1,000,000 investment, with distributions reinvested, from December 16, 2013 through March 31, 2016.
| | | | | | |
| Average Annual Total Return through March 31, 2016 | | | One Year | | | Since Inception |
Class A (Commenced December 16, 2013) | | | | | | |
Excluding sales charges | | | 3.98% | | | -2.60% |
Including sales charges | | | 0.11% | | | -4.21% |
|
Class C (Commenced December 16, 2013) | | | | | | |
Excluding contingent deferred sales charges | | | 3.25% | | | -2.92% |
Including contingent deferred sales charges | | | 2.22% | | | -2.92% |
|
Institutional (Commenced December 16, 2013) | | | 4.15% | | | -2.36% |
|
Class IR (Commenced December 16, 2013) | | | 4.06% | | | -2.51% |
|
Class R (Commenced December 16, 2013) | | | 3.66% | | | -2.72% |
|
9
GOLDMAN SACHS LONG SHORT CREDIT STRATEGIES FUND
What Differentiates Goldman Sachs’ Long Short Credit Strategies Fund Investment Process?
The Goldman Sachs Long Short Credit Strategies Fund (the “Fund”) seeks an absolute return comprised of income and capital appreciation.
The Fund uses a bottom-up, fundamental approach with a focus on high conviction ideas across the corporate credit spectrum. Inefficiencies in the credit markets may provide attractive opportunities for investors. The Fund seeks to capitalize on these through an unconstrained approach, security selection and providing active downside management.

| n | | The Fund is not limited by the traditional constraints of a benchmark strategy. |
| n | | The Fund uses a flexible and dynamic strategy that allows it to invest across the spectrum of corporate credit while seeking what we believe are the most attractive risk-adjusted return opportunities. |
| n | | The Fund invests across the spectrum of corporate credit including high yield, investment grade, bank loans, convertibles and preferred equity. |

| n | | The Fund seeks to identify issuers that offer compelling value through bottom-up security selection, with a focus on capital preservation. |
| n | | The Fund’s investment approach allows for flexibility in security selection, irrespective of industry, ratings and maturity constraints. |

| n | | The Fund manages long and short exposures to potentially generate absolute returns. A hedged approach allows the Fund to deploy tactical portfolio tilts via high yield index shorts. |
| n | | Dynamic portfolio management may enhance downside mitigation while providing investors access to security selection expertise. |
10
PORTFOLIO RESULTS
Goldman Sachs Long Short Credit Strategies Fund
Investment Objective
The Fund seeks an absolute return comprised of income and capital appreciation.
Portfolio Management Discussion and Analysis
Below, the Goldman Sachs Liberty Harbor Portfolio Management Team discusses the Goldman Sachs Long Short Credit Strategies Fund’s (the “Fund”) performance and positioning for the 12-month period ended March 31, 2016 (the “Reporting Period”).
| Q | | How did the Fund perform during the Reporting Period? |
| A | | During the Reporting Period, the Fund’s Class A, Class C, Institutional, Class IR and Class R Shares generated average annual total returns, without sales charges, of 0.19%, -0.55%, 0.53%, 0.44%, and 0.04%. These returns compare to the 0.33% average annual total return of the Fund’s benchmark, the Bank of America/Merrill Lynch U.S Dollar Three-Month LIBOR Constant Maturity Index (the “BofA/Merrill Lynch Index”), during the same time period. |
| | Because the composition of the BofA/Merrill Lynch Index (e.g. short-term cash securities) is not comparable to the range of instruments in which the Fund may transact (e.g., various credit-related instruments), references to the BofA/Merrill Lynch Index are for informational purposes only and not an indication of how the Fund is managed. |
| Q | | What economic and market factors most influenced the corporate credit markets as a whole during the Reporting Period? |
| A | | During the Reporting Period, corporate credit market performance was influenced most by heightened market volatility, driven, in turn, by global market uncertainty, persistent weakness in commodity prices and speculation that the Federal Reserve (the “Fed”) may increase interest rates. Concern regarding China’s economic slowdown and currency devaluations were primary drivers of global market uncertainty. During the Reporting Period, the Fed imposed its first rate hike since 2006 in December 2015. The energy sector continued to experience significant weakness on lower commodity prices. Given the persistent weakness in commodity prices, there was greater dispersion across the corporate credit market during the Reporting Period than seen in recent years, particularly in energy and basic industry sectors, which includes metals and mining. |
| | Broad corporate credit markets experienced their first January loss in 2016 since 2008 but experienced a significant rally and a tightening of spreads, or yield differential compared to U.S. Treasuries, during February and March 2016. Amidst the rally, high yield mutual funds experienced year-to-date 2016 inflows of $8.0 billion as of March 31, 2016. There was also an increase in new issue high yield volume toward the end of March 2016 compared to December 2015 through February 2016. We believe the first quarter 2016 bounce-back in the corporate credit markets was based on improved investor sentiment toward broader macro concerns, driven, in turn, by small increases in oil prices and a more dovish, or measured, view from the Fed. |
| Q | | What key factors were responsible for the Fund’s performance during the Reporting Period? |
| A | | As a part of our investment philosophy, we apply a value-oriented approach to credit market investing, with a focus on capital preservation via high conviction ideas. Consistent with the cornerstone of our fundamentally-based investment process focused on bottom-up security selection, the Fund’s performance during the Reporting Period was attributable to individual security selection. |
| | Indeed, security selection proved to be paramount while navigating the current credit cycle. Given the dispersion in credit seen during the last months of the Reporting Period, our value-oriented, fundamental approach, focused on security selection, buoyed the performance of the Fund during the Reporting Period. Our early decision to reduce the Fund’s oil and gas exploration and production exposure during 2015 was particularly beneficial to the Fund’s results. We also continued to avoid distressed/stressed market segments, including metals and mining. The Fund’s positive performance during the Reporting Period was broad-based, attributable to long positioning in consumer cyclicals/non- |
11
PORTFOLIO RESULTS
| | cyclicals, communications and non-bank financials. The largest individual contributors during the Reporting Period included positions in Rite Aid Corporation, Altice Financing and Beverage Package Holdings. |
| | The Fund’s energy credits modestly detracted from its performance during the Reporting Period. The three largest individual detractors during the Reporting Period were the Fund’s positions in Bonanza Creek Energy, Lone Pine Resources and Windstream Corporation. The Fund’s interest rate swaps, which are used to hedge duration, also modestly detracted from its performance. The Fund’s tactical short position in a high yield credit default swap index slightly dampened its results as well. |
| | Importantly, since the Fund’s portfolio is constructed through bottom-up, fundamental research and not relative to a benchmark, there is no requirement to hold issues from any single company or sector. |
| Q | | Which segments of the corporate credit sector most significantly affected Fund performance? |
| A | | The corporate credit markets, as mentioned earlier, broadly experienced volatility during the Reporting Period, driven, in our view, by a global economic slowdown in growth largely from China, persistent downward trends in energy prices and shifting macroeconomic policies. As greater dispersion was seen across credits, the Fund was able to avoid the more stressed market segments, which, coupled with a focus on fundamentals and individual security selection, contributed positively to its performance during the Reporting Period. |
| Q | | Did the Fund’s duration and yield curve positioning strategy help or hurt its results during the Reporting Period? |
| A | | The Fund does not use duration and yield curve positioning as active management strategies within its investment process. However, the Fund does implement interest rate swaps, which serve as a hedge to select long positions. The Fund’s interest rate swap positions modestly detracted from performance as rates tightened during the Reporting Period. |
| Q | | How did the Fund use derivatives and similar instruments during the Reporting Period? |
| A | | The Fund used credit default swaps via a short position in a credit default swap high yield index to tactically hedge market risk, which detracted from performance. The Fund used interest rate swaps to hedge the interest rate risk of certain bonds, thereby limiting the Fund’s exposure to changes in interest rates. Interest rate swaps detracted from Fund performance during the Reporting Period. The Fund used forward foreign currency exchange contracts to hedge the currency risk in non-U.S. dollar-denominated issues to U.S. dollars. This had a rather neutral impact on the Fund’s performance during the Reporting Period. |
| Q | | Were there any notable changes in the Fund’s weightings during the Reporting Period? |
| A | | During the Reporting Period, we continued to pursue investment opportunities based on fundamental, bottom-up research, which, in our view, offered compelling risk-adjusted return potential. We maintained our favor toward short-dated high yield credit securities, which, in our view, offer attractive risk-adjusted yields and some insulation from a potential increase in interest rates. |
| | Given the persistence of weakened commodity prices and the potential increase in the rise of defaults within the market segment, we decreased the Fund’s exposure to energy credits. We modestly increased the Fund’s exposure to telecommunication services companies, as we believe these credits offer an attractive risk and yield profile. We also believe there may be potential mergers and acquisitions activity within the telecommunication services sectors, which may lead to price dislocations. Also, given the rally in the corporate credit markets seen during the first quarter of 2016, we reduced some positions, as we believe there may be what we consider to be a more attractive entry point. |
12
PORTFOLIO RESULTS
| Q | | How was the Fund positioned at the end of March 2016? |
| A | | As of March 31, 2016, approximately 54% of the Fund’s total net assets was invested in unsecured debt obligations, 17% in secured debt obligations, 10% in secured bank loans, 1% in preferred and other equity securities and 17% in cash and cash equivalents. The Fund’s notional derivative exposure, calculated as a percentage of total net assets, was 26% in a credit default swap on an underlying credit default swap high yield index, and 14% in interest rate swaps. The Fund had a total of 115 holdings from 82 issuers at March 31, 2016, with the Fund’s top long corporate issuers, as measured by a percentage of total net assets invested, being First Data, Altice Financing and Bombardier. |
| Q | | What is the Fund’s tactical view and strategy for the months ahead? |
| A | | At the end of the Reporting Period, we still believed we are likely in the later stages of the credit cycle and may see increased volatility longer term given global economic growth slowdown concerns and persistently weak commodity prices. We remain focused on these factors and others that may potentially impact the markets. |
| | Given this view, we believe a sound approach, grounded in fundamentals with a focus on capital preservation, may offer a compelling means to navigate the current and anticipated market environment in the months ahead. We believe heightened volatility may lead to periods of technical dislocations in the market, which may provide for attractive single-name investing opportunities. The Fund’s ability to be flexible across the corporate credit spectrum—high yield, loans, bank loans and investment grade credit—enables the Fund to step in and seek to take advantage of market opportunities when inefficiencies arise. |
| | At the end of the Reporting Period, the Fund was defensively positioned given our cautious view of the market. The Fund continued to focus on what we view as defensive companies with strong cash flow and earnings. Our investment team has been identifying several new investment opportunities amidst the increased market volatility. We believe we may see an increase in crossover credits, as securities are downgraded from investment grade to high yield due to market pressures. We further believe that with a prudent amount of diligence, these crossover credits could present what we consider to be attractive investment opportunities as dislocations arise. (A crossover credit is a bond that has been assigned a split rating by two rating agencies that places it on the cusp between being an investment grade and non-investment grade.) Overall, on the long side, the Fund was approximately 82% invested at the end of the Reporting Period and had a short notional position of approximately 26% of total net assets in a credit default swap high yield index, reflecting our defensive positioning. |
| | In short, we believe the Fund’s focus on individual security selection is increasingly important given the recent and anticipated market environment. We believe our single-name security selection approach should help mitigate the potential impact of volatility and provide for attractive risk-adjusted return opportunities as we navigate the credit cycle going forward. In the months ahead, our investment team will continue to perform rigorous fundamental analysis to identify what we believe to be the most attractive investment opportunities on a risk-adjusted basis. |
13
FUND BASICS
Long Short Credit Strategies Fund
as of March 31, 2016
| | | | | | | | | | | | | | | | | | |
| | PERFORMANCE REVIEW | |
| | | April 1, 2015–March 31, 2016 | | Fund Total
Return
(based on NAV)1 | | | Bank of America Merrill Lynch U.S.
Dollar Three-Month
LIBOR Constant
Maturity Index2 | | | 30-Day
Standardized
Subsidized Yield3 | | | 30-Day
Standardized
Unsubsidized Yield3 | |
| | Class A | | | 0.19 | % | | | 0.33 | % | | | 3.28 | % | | | 3.00 | % |
| | Class C | | | -0.55 | | | | 0.33 | | | | 2.67 | | | | 2.39 | |
| | Institutional Shares | | | 0.53 | | | | 0.33 | | | | 3.76 | | | | 3.48 | |
| | Class IR | | | 0.44 | | | | 0.33 | | | | 3.67 | | | | 3.38 | |
| | | Class R | | | 0.04 | | | | 0.33 | | | | 3.16 | | | | 2.88 | |
| | 1 | | The net asset value (“NAV”) represents the net assets of the Fund (ex-dividend) divided by the total number of shares outstanding. The Fund’s performance assumes the reinvestment of dividends and other distributions. The Fund’s performance does not reflect the deduction of any applicable sales charges. |
| | 2 | | The Bank of America Merrill Lynch U.S. Dollar Three-Month LIBOR Constant Maturity Index (the “BofA/Merrill Lynch Index”) tracks the performance of a synthetic asset paying LIBOR to a stated maturity. The BofA/Merrill Lynch Index is based on the assumed purchase at par of a synthetic instrument having exactly its stated maturity and with a coupon equal to that day’s fixing rate. That issue is assumed to be sold the following business day (priced at yield equal to the current day fixing rate) and rolled into a new instrument. |
| | 3 | | The method of calculation of the 30-Day Standardized Subsidized Yield is mandated by the Securities and Exchange Commission and is determined by dividing the net investment income per share earned during the last 30 days of the period by the maximum public offering price (“POP”) per share on the last day of the period. This number is then annualized. The 30-Day Standardized Subsidized Yield reflects fee waivers and/or expense reimbursements recorded by the Fund during the period. Without waivers and/or reimbursements, yields would be reduced. This yield does not necessarily reflect income actually earned and distributed by the Fund and, therefore, may not be correlated with the dividends or other distributions paid to shareholders. The 30-Day Standardized Unsubsidized Yield does not adjust for any fee waivers and/ or expense reimbursements in effect. If the Fund does not incur any fee waivers and/or expense reimbursements during the period, the 30-Day Standard Subsidized Yield and 30-Day Standardized Unsubsidized Yield will be identical. |
The returns set forth in the table above represent past performance. Past performance does not guarantee future results. The Fund’s investment return and principal value will fluctuate so that an investor’s shares, when redeemed, may be worth more or less than their original cost. Current performance may be lower or higher than the performance quoted above. Please visit our web site at www.GSAMFUNDS.com to obtain the most recent month-end returns. Performance reflects applicable fee waivers and/or expense limitations in effect during the periods shown. In their absence, performance would be reduced. Returns do not reflect the deduction of taxes that a shareholder would pay on Fund distributions or the redemption of Fund shares.
14
FUND BASICS
| | | | | | | | | | | | | | | | |
| | STANDARDIZED TOTAL RETURNS4 |
| | | For the fiscal year ended 3/31/16 | | One Year | | | Five Years | | | Since Inception | | | Inception Date |
| | Class A | | | -3.54 | % | | | N/A | | | | -3.56 | % | | 4/30/14 |
| | Class C | | | -1.55 | | | | N/A | | | | -2.36 | | | 4/30/14 |
| | Institutional5 | | | 0.53 | | | | 3.48 | % | | | 5.63 | | | 6/15/09 |
| | Class IR | | | 0.44 | | | | N/A | | | | -1.37 | | | 4/30/14 |
| | | Class R | | | 0.04 | | | | N/A | | | | -1.85 | | | 4/30/14 |
| | 4 | | The Standardized Total Returns are average annual total returns as of the most recent calendar quarter-end. They assume reinvestment of all distributions at NAV. These returns reflect the maximum initial sales charge of 3.75% for Class A Shares and the assumed contingent deferred sales charge for Class C Shares (1.00% if redeemed within 12 months of purchase). Because Institutional, Class IR and Class R shares do not have a sales charge, such a charge is not applied to their Standardized Total Returns. |
| | 5 | | The average annual total return figures for the Fund’s Institutional Shares, which do not impose an initial sales charge, do not reflect an initial sales charge for the periods shown. Prior to March 24, 2014 (the effective date of the reorganization of the Goldman Sachs Credit Strategies Fund (“the Predecessor Fund”) into the Fund) the maximum initial sales charge applicable to sales of Common Shares of the Predecessor Fund was 2.50%, which is not reflected in the average annual total return figures shown. The Predecessor Fund commenced operations on June 15, 2009. |
The returns set forth in the table above represent past performance. Past performance does not guarantee future results. The Fund’s investment return and principal value will fluctuate so that an investor’s shares, when redeemed, may be worth more or less than their original cost. Current performance may be lower or higher than the performance quoted above. Please visit our web site at www.GSAMFUNDS.com to obtain the most recent month-end returns. Performance reflects applicable fee waivers and/or expense limitations in effect during the period shown. In their absence, performance would be reduced. Returns do not reflect the deduction of taxes that a shareholder would pay on Fund distributions or the redemption of Fund shares.
Effective at the close of business on March 21, 2014, the Goldman Sachs Credit Strategies Fund (the “Predecessor Fund”), a closed-end management investment company that was operated as an “interval fund,” was reorganized with and into the Fund. Because the Predecessor Fund is the accounting survivor, the Fund has assumed the Predecessor Fund’s historical performance. The performance information shown in this report is for the Predecessor Fund for the period prior to March 24, 2014, and reflects the Predecessor Fund’s investment strategies and policies. However, the Fund’s current investment strategies and policies, including the ability to implement short positions, are different from those of the Predecessor Fund, with shareholders of the Predecessor Fund receiving Institutional Shares of the Fund upon consummation of the reorganization. As a result, the Fund’s performance may differ substantially from what is shown for periods prior to March 24, 2014.
15
FUND BASICS
| | | | | | | | | | |
| | EXPENSE RATIOS6 | |
| | | | | Net Expense Ratio (Current) | | | Gross Expense Ratio (Before Waivers) | |
| | Class A | | | 1.48 | % | | | 1.62 | % |
| | Class C | | | 2.23 | | | | 2.39 | |
| | Institutional | | | 1.13 | | | | 1.30 | |
| | Class IR | | | 1.22 | | | | 1.41 | |
| | | Class R | | | 1.73 | | | | 1.90 | |
| | 6 | | The expense ratios of the Fund, both current (net of applicable fee waivers and/or expense limitations) and before waivers (gross of applicable fee waivers and/or expense limitations) are as set forth above according to the most recent publicly available Prospectus for the Fund and may differ from the expense ratios disclosed in the Financial Highlights in this report. Pursuant to a contractual arrangement, the Fund’s waivers and/or expense limitations will remain in place through at least July 29, 2016, and prior to such date the Investment Adviser may not terminate the arrangements without the approval of the Fund’s Board of Trustees. If these arrangements are discontinued in the future, the expense ratios may change without shareholder approval. |
|
| FUND COMPOSITION7 |
| Percentage of Net Assets |
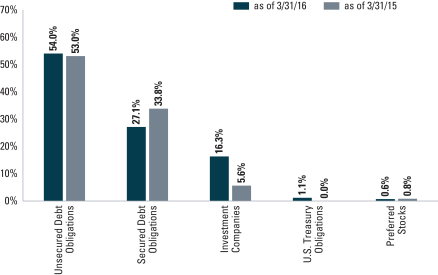
| | 7 | | The percentage shown for each investment category reflects the value of investments in that category as a percentage of net assets. Figures in the graph may not sum to 100% due to the exclusion of other assets and liabilities. The graph depicts the Fund’s investments but may not represent the Fund’s market exposure due to the exclusion of certain derivatives, if any, as listed in the Additional Investment Information section of the Schedule of Investments. |
16
FUND BASICS
| | | | | | |
| | TOP TEN INDUSTRY ALLOCATIONS8 | |
| | | As of March 31, 2016 | | Percentage of Net Assets | |
| | Investment Companies | | | 16.3 | % |
| | Media – Non Cable | | | 8.9 | |
| | Automotive | | | 7.3 | |
| | Media – Cable | | | 7.1 | |
| | Health Care – Services | | | 6.7 | |
| | Finance | | | 6.1 | |
| | Telecommunications – Wirelines | | | 5.2 | |
| | Consumer Cyclical Services | | | 4.7 | |
| | Packaging | | | 4.2 | |
| | | Aerospace & Defense | | | 3.0 | |
| | 8 | | The percentage shown for each investment category reflects the value of investments in that category as a percentage of net assets. The above table depicts the Fund’s investments but may not represent the Fund’s market exposure due to the exclusion of certain derivatives, if any, as listed in the Additional Investment Information section of the Schedule of Investments. |
17
GOLDMAN SACHS LONG SHORT CREDIT STRATEGIES FUND
Performance Summary
March 31, 2016
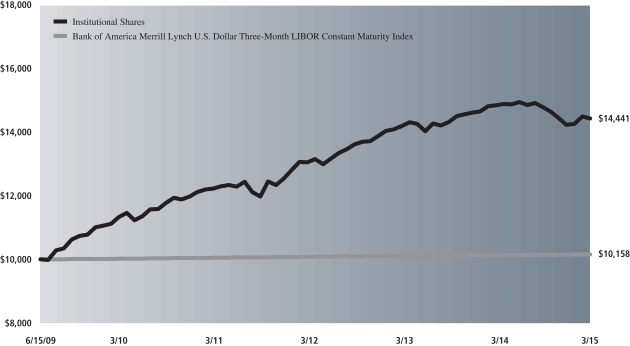
The following graph shows the value, as of March 31, 2016, of a $1,000,000 investment made on June 15, 2009 (the date on which the Predecessor Fund commenced operations) in Institutional Shares at NAV. The performance data in the graph for the Fund’s Institutional Shares, which do not impose an initial sales charge, do not reflect an initial sales charge for the period shown. Prior to March 24, 2014 (the effective date of the reorganization of the Predecessor Fund into the Fund), the maximum initial sales charge applicable to sales of Common Shares of the Predecessor Fund was 2.50%, which is not reflected in the following graph. For comparative purposes, the performance of the Fund’s benchmark, the Bank of America Merrill Lynch U.S. Dollar Three-Month LIBOR Constant Maturity Index, is shown. This performance data represents past performance and should not be considered indicative of future performance, which will fluctuate with changes in market conditions. These performance fluctuations will cause an investor’s shares, when redeemed, to be worth more or less than their original cost. Performance reflects applicable fee waivers and/or expense limitations in effect during the periods shown and in their absence, performance would be reduced. Returns do not reflect the deduction of taxes that a shareholder would pay on Fund distributions or the redemption of Fund shares. Performance of Class A, Class C, Class IR and Class R Shares will vary from Institutional Shares due to differences in class specific fees and any applicable sales charges. In addition to the Investment Adviser’s decisions regarding issuer/industry/country investment selection and allocation, other factors may affect Fund performance. These factors include, but are not limited to, Fund operating fees and expenses, portfolio turnover and subscription and repurchase cash flows affecting the Fund.
|
| Long Short Credit Strategies Fund’s Lifetime Performance |
Performance of a $1,000,000 investment, with distributions reinvested, from June 15, 2009 through March 31, 2016.
| | | | | | | | | | |
| Average Annual Total Return through March 31, 2016 | | | One Year | | | | Five Years | | | Since Inception* |
Class A (Commenced April 30, 2014) | | | | | | | | | | |
Excluding sales charges | | | 0.19% | | | | N/A | | | -1.62% |
Including sales charges | | | -3.54% | | | | N/A | | | -3.56% |
|
Class C (Commenced April 30, 2014) | | | | | | | | | | |
Excluding contingent deferred sales charges | | | -0.55% | | | | N/A | | | -2.36% |
Including contingent deferred sales charges | | | -1.55% | | | | N/A | | | -2.36% |
|
Institutional (Commenced March 24, 2014)** | | | 0.53% | | | | 3.48% | | | 5.63% |
|
Class IR (Commenced April 30, 2014) | | | 0.44% | | | | N/A | | | -1.37% |
|
Class R (Commenced April 30, 2014) | | | 0.04% | | | | N/A | | | -1.85% |
|
| * | | The since-inception return for Institutional Shares is from the date on which the Predecessor Fund commenced operations, June 15, 2009. |
| ** | | Effective at the close of business on March 21, 2014, the Predecessor Fund, a closed-end management investment company that was operated as an “interval fund,” was reorganized with and into the Fund, with shareholders of the Predecessor Fund receiving Institutional Shares of the Fund upon consummation of the reorganization. Because the Predecessor Fund is the accounting survivor, the Fund has assumed the Predecessor Fund’s historical performance. The performance information shown in this report is for the Predecessor Fund for the period prior to March 24, 2014, and reflects the Predecessor Fund’s investment strategies and policies. However, the Fund’s current investment strategies and policies, including the ability to implement short positions, are different from those of the Predecessor Fund. As a result, the Fund’s performance may differ substantially from what is shown for periods prior to March 24, 2014. |
18
GOLDMAN SACHS FIXED INCOME MACRO STRATEGIES FUND
Consolidated Schedule of Investments
March 31, 2016
| | | | | | | | | | | | | | |
Principal Amount | | | Interest
Rate | | | Maturity
Date | | | Value | |
| | Foreign Sovereign Debt Obligations – 12.9% | |
| | Brazilian Real – 2.7% | |
| Brazil Letras do Tesouro Nacional(a) | |
| BRL | 3,103,000 | | | | 0.000 | % | | | 01/01/17 | | | $ | 782,401 | |
| Brazil Notas do Tesouro Nacional | |
| | 255,000 | | | | 10.000 | | | | 01/01/17 | | | | 69,091 | |
| | 3,899,045 | | | | 6.000 | | | | 08/15/50 | | | | 1,008,731 | |
| | | | | | | | | | | | | | |
| | | | | | | | | | | | | 1,860,223 | |
| | |
| | Dominican Peso – 0.8% | |
| Dominican Republic | |
| DOP | 3,900,000 | | | | 15.000 | | | | 04/05/19 | | | | 95,781 | |
| | 1,300,000 | | | | 16.000 | | | | 07/10/20 | | | | 34,746 | |
| | 18,200,000 | | | | 11.375 | | | | 07/06/29 | | | | 406,344 | |
| | | | | | | | | | | | | | |
| | | | | | | | | | | | | 536,871 | |
| | |
| | Euro – 4.8% | |
| Italy Buoni Poliennali Del Tesoro | |
| EUR | 326,982 | | | | 2.100 | | | | 09/15/16 | | | | 380,221 | |
| | 1,167,038 | | | | 2.350 | | | | 09/15/19 | | | | 1,460,382 | |
| Spain Government Inflation Linked Bond(b) | |
| | 1,183,932 | | | | 0.550 | | | | 11/30/19 | | | | 1,397,042 | |
| | | | | | | | | | | | | | |
| | | | | | | | | | | | | 3,237,645 | |
| | |
| | Mexican Peso – 0.8% | |
| United Mexican States | |
| MXN | 2,332,400 | | | | 10.000 | | | | 12/05/24 | | | | 173,305 | |
| | 6,997,200 | | | | 5.750 | | | | 03/05/26 | | | | 398,670 | |
| | | | | | | | | | | | | | |
| | | | | | | | | | | | | 571,975 | |
| | |
| | Russian Ruble – 2.5% | |
| Russian Federation Bond | |
| RUB | 45,850,000 | | | | 8.150 | | | | 02/03/27 | | | | 647,237 | |
| | 75,770,000 | | | | 8.500 | | | | 09/17/31 | | | | 1,080,031 | |
| | | | | | | | | | | | | | |
| | | | | | | | | | | | | 1,727,268 | |
| | |
| | United States Dollar – 1.3% | |
| Republic of Venezuela | |
| $ | 1,820,000 | | | | 7.750 | | | | 10/13/19 | | | | 682,500 | |
| | 30,000 | | | | 6.000 | | | | 12/09/20 | | | | 10,050 | |
| | 140,000 | | | | 9.000 | | | | 05/07/23 | | | | 49,000 | |
| | 140,000 | | | | 8.250 | | | | 10/13/24 | | | | 47,600 | |
| | 30,000 | | | | 11.750 | | | | 10/21/26 | | | | 11,775 | |
| | 140,000 | | | | 9.250 | | | | 05/07/28 | | | | 49,350 | |
| | 60,000 | | | | 11.950 | | | | 08/05/31 | | | | 23,700 | |
| | 30,000 | | | | 9.375 | | | | 01/13/34 | | | | 10,575 | |
| | | | | | | | | | | | | | |
| | | | | | | | | | | | | 884,550 | |
| | |
| TOTAL FOREIGN SOVEREIGN DEBT
OBLIGATIONS |
|
| | (Cost $8,504,921) | | | $ | 8,818,532 | |
| | |
| | |
| | Mortgage-Backed Obligations – 17.2% | |
| | Collateralized Mortgage Obligations – 9.9% | |
| | Interest Only(c) – 1.9% | |
| FHLMC STRIPS Series 304, Class C45 | |
| $ | 554,729 | | | | 3.000 | % | | | 12/15/27 | | | $ | 51,102 | |
| | |
| | Mortgage-Backed Obligations – (continued) | |
| | Interest Only(c) – (continued) | |
| FNMA REMIC Series 2015-34, Class LS(d) | |
| $ | 923,810 | | | | 5.667 | % | | | 06/25/45 | | | $ | 194,334 | |
| GNMA REMIC Series 2013-183, Class NI | |
| | 1,118,217 | | | | 4.500 | | | | 10/20/42 | | | | 125,221 | |
| GNMA REMIC Series 2014-133, Class NI | |
| | 759,385 | | | | 5.000 | | | | 09/20/44 | | | | 134,046 | |
| GNMA REMIC Series 2015-129, Class IC | |
| | 1,288,638 | | | | 4.500 | | | | 09/16/45 | | | | 194,425 | |
| GNMA REMIC Series 2015-14, Class IO | |
| | 1,429,043 | | | | 5.000 | | | | 10/20/44 | | | | 255,267 | |
| GNMA REMIC Series 2015-63, Class IY | |
| | 1,216,247 | | | | 4.000 | | | | 05/20/45 | | | | 171,726 | |
| GNMA REMIC Series 2015-95, Class GI | |
| | 853,650 | | | | 4.500 | | | | 07/16/45 | | | | 174,325 | |
| | | | | | | | | | | | | | |
| | | | | | | | | | | | | 1,300,446 | |
| | |
| | Inverse Floaters(d) – 8.0% | |
| FHLMC REMIC Series 4314, Class SE | |
| | 1,997,394 | | | | 5.614 | | | | 03/15/44 | | | | 333,981 | |
| FHLMC REMIC Series 4320, Class SD | |
| | 583,837 | | | | 5.664 | | | | 07/15/39 | | | | 95,056 | |
| FHLMC REMIC Series 4372, Class SH | |
| | 1,994,142 | | | | 5.664 | | | | 08/15/44 | | | | 333,606 | |
| FHLMC REMIC Series 4431, Class ST | |
| | 911,038 | | | | 5.664 | | | | 01/15/45 | | | | 209,883 | |
| FNMA REMIC Series 2013-121, Class SA | |
| | 1,181,719 | | | | 5.667 | | | | 12/25/43 | | | | 201,569 | |
| FNMA REMIC Series 2013-96, Class SW | |
| | 569,828 | | | | 5.667 | | | | 09/25/43 | | | | 98,406 | |
| FNMA REMIC Series 2014-19, Class MS | |
| | 504,962 | | | | 6.167 | | | | 11/25/39 | | | | 73,349 | |
| FNMA REMIC Series 2014-74, Class SC | |
| | 2,123,246 | | | | 5.667 | | | | 11/25/44 | | | | 362,038 | |
| FNMA REMIC Series 2014-87, Class MS | |
| | 1,079,398 | | | | 5.817 | | | | 01/25/45 | | | | 186,533 | |
| FNMA REMIC Series 2015-20, Class ES | |
| | 919,105 | | | | 5.717 | | | | 04/25/45 | | | | 214,913 | |
| FNMA REMIC Series 2015-22, Class DS | |
| | 931,045 | | | | 5.767 | | | | 04/25/45 | | | | 210,412 | |
| FNMA REMIC Series 2015-79, Class SA | |
| | 889,268 | | | | 5.817 | | | | 11/25/45 | | | | 144,133 | |
| FNMA REMIC Series 2015-82, Class MS | |
| | 1,200,656 | | | | 5.267 | | | | 11/25/45 | | | | 188,583 | |
| FNMA REMIC Series 2015-86, Class BS | |
| | 456,245 | | | | 5.267 | | | | 11/25/45 | | | | 70,918 | |
| GNMA REMIC Series 2010-1, Class SD | |
| | 126,563 | | | | 5.358 | | | | 01/20/40 | | | | 20,162 | |
| GNMA REMIC Series 2010-20, Class SE | |
| | 1,844,981 | | | | 5.818 | | | | 02/20/40 | | | | 305,798 | |
| GNMA REMIC Series 2010-31, Class SA | |
| | 850,822 | | | | 5.318 | | | | 03/20/40 | | | | 126,935 | |
| GNMA REMIC Series 2010-37, Class SG | |
| | 589,560 | | | | 5.268 | | | | 03/20/40 | | | | 87,788 | |
| GNMA REMIC Series 2010-68, Class SD | |
| | 1,092,267 | | | | 6.148 | | | | 06/20/40 | | | | 170,294 | |
| | |
| | |
| The accompanying notes are an integral part of these financial statements. | | 19 |
GOLDMAN SACHS FIXED INCOME MACRO STRATEGIES FUND
Consolidated Schedule of Investments (continued)
March 31, 2016
| | | | | | | | | | | | | | |
Principal Amount | | | Interest
Rate | | | Maturity
Date | | | Value | |
| | Mortgage-Backed Obligations – (continued) | |
| | Inverse Floaters(d) – (continued) | |
| GNMA REMIC Series 2010-85, Class SN | |
| $ | 485,335 | | | | 5.508 | % | | | 07/20/40 | | | $ | 87,137 | |
| GNMA REMIC Series 2010-90, Class ES | |
| | 311,992 | | | | 5.518 | | | | 07/20/40 | | | | 47,676 | |
| GNMA REMIC Series 2013-113, Class SA | |
| | 526,982 | | | | 6.268 | | | | 08/20/43 | | | | 96,530 | |
| GNMA REMIC Series 2013-134, Class DS | |
| | 285,219 | | | | 5.668 | | | | 09/20/43 | | | | 46,474 | |
| GNMA REMIC Series 2014-133, Class BS | |
| | 661,760 | | | | 5.168 | | | | 09/20/44 | | | | 97,767 | |
| GNMA REMIC Series 2014-41, Class SA | |
| | 327,252 | | | | 5.668 | | | | 03/20/44 | | | | 54,532 | |
| GNMA REMIC Series 2015-110, Class MS | |
| | 1,533,713 | | | | 5.278 | | | | 08/20/45 | | | | 233,698 | |
| GNMA REMIC Series 2015-111, Class SM | |
| | 894,660 | | | | 5.768 | | | | 08/20/45 | | | | 153,132 | |
| GNMA REMIC Series 2015-112, Class SB | |
| | 876,407 | | | | 5.308 | | | | 08/20/45 | | | | 134,397 | |
| GNMA REMIC Series 2015-123, Class SE | |
| | 881,258 | | | | 5.288 | | | | 09/20/45 | | | | 134,315 | |
| GNMA REMIC Series 2015-126, Class HS | |
| | 1,834,620 | | | | 5.768 | | | | 09/20/45 | | | | 315,738 | |
| GNMA REMIC Series 2015-141, Class HS | |
| | 417,062 | | | | 5.768 | | | | 10/20/45 | | | | 71,776 | |
| GNMA REMIC Series 2015-142, Class SA | |
| | 1,099,170 | | | | 5.288 | | | | 10/20/45 | | | | 167,829 | |
| GNMA REMIC Series 2015-168, Class SD | |
| | 453,104 | | | | 5.768 | | | | 11/20/45 | | | | 74,201 | |
| GNMA REMIC Series 2016-6, Class S | |
| | 954,173 | | | | 5.218 | | | | 01/20/46 | | | | 142,990 | |
| GNMA REMIC Series 2016-6, Class SB | |
| | 959,883 | | | | 5.218 | | | | 01/20/46 | | | | 147,422 | |
| | | | | | | | | | | | | | |
| | | | | | | | | | | | | 5,439,971 | |
| | |
| TOTAL COLLATERALIZED MORTGAGE
OBLIGATIONS |
| | $ | 6,740,417 | |
| | |
| | Commercial Mortgage-Backed Securities – 2.8% | |
| | Sequential Fixed Rate – 2.8% | |
| FHLMC Multifamily Structured Pass-Through Certificates
Series K044, Class A2 |
|
| $ | 1,800,000 | | | | 2.811 | % | | | 01/25/25 | | | $ | 1,874,339 | |
| | |
| | Federal Agencies(e) – 4.5% | |
| | FNMA – 4.5% | |
| $ | 3,000,000 | | | | 3.000 | % | | | TBA-30yr | | | $ | 3,077,578 | |
| | |
| | TOTAL MORTGAGE-BACKED OBLIGATIONS | |
| | (Cost $11,634,968) | | | $ | 11,692,334 | |
| | |
| | | | | | | | | | | | | | |
| | Agency Debentures(a) – 18.3% | |
| FHLB | |
| $ | 5,000,000 | | | | 0.000 | % | | | 04/20/16 | | | $ | 4,999,445 | |
| | 3,000,000 | | | | 0.000 | | | | 04/22/16 | | | | 2,999,631 | |
| | |
| | Agency Debentures(a) – (continued) | |
| FHLB – (continued) | |
| $ | 2,000,000 | | | | 0.000 | % | | | 06/08/16 | | | $ | 1,998,828 | |
| | 2,500,000 | | | | 0.000 | | | | 06/10/16 | | | | 2,498,492 | |
| | |
| | TOTAL AGENCY DEBENTURES | |
| | (Cost $12,495,228) | | | $ | 12,496,396 | |
| | |
| | | | | | | | | | | | | | |
| | Asset-Backed Securities(b)(d) – 0.6% | |
| | Collateralized Loan Obligations – 0.6% | |
| ACIS CLO Ltd. Series 2014-4A, Class C | |
| $ | 500,000 | | | | 2.879 | % | | | 05/01/26 | | | $ | 412,789 | |
| | |
| | TOTAL ASSET-BACKED SECURITIES | |
| | (Cost $473,000) | | | $ | 412,789 | |
| | |
| | |
| | Corporate Obligations – 2.6% | |
| | Energy – 0.3% | |
| Petroleos de Venezuela SA | |
| $ | 70,000 | | | | 9.000 | % | | | 11/17/21 | | | $ | 25,900 | |
| | 330,000 | | | | 6.000 | | | | 05/16/24 | | | | 102,465 | |
| | 240,000 | | | | 6.000 | | | | 11/15/26 | | | | 74,040 | |
| | 40,000 | | | | 5.375 | | | | 04/12/27 | | | | 12,646 | |
| | | | | | | | | | | | | | |
| | | | | | | | | | | | | 215,051 | |
| | |
| | Supranational – 2.3% | |
| European Investment Bank | |
| GBP | 120,000 | | | | 5.625 | | | | 06/07/32 | | | | 250,891 | |
| | 320,000 | | | | 3.875 | | | | 06/08/37 | | | | 569,306 | |
| | 370,000 | | | | 5.000 | | | | 04/15/39 | | | | 762,864 | |
| | | | | | | | | | | | | | |
| | | | | | | | | | | | | 1,583,061 | |
| | |
| | TOTAL CORPORATE OBLIGATIONS | |
| | (Cost $1,954,123) | | | $ | 1,798,112 | |
| | |
| | |
| | U.S. Treasury Obligations – 19.0% | |
| United States Treasury Bills(a) | |
| $ | 7,500,000 | | | | 0.000 | % | | | 04/14/16 | | | $ | 7,499,702 | |
| | 1,000,000 | | | | 0.000 | | | | 05/26/16 | | | | 999,817 | |
| United States Treasury Inflation Protected Securities | |
| | 1,355,939 | | | | 0.125 | | | | 04/15/17 | | | | 1,371,614 | |
| | 808,824 | | | | 0.125 | | | | 04/15/19 | | | | 826,642 | |
| | 628,014 | | | | 0.125 | | | | 01/15/22 | | | | 638,119 | |
| | 618,108 | | | | 0.125 | | | | 07/15/22 | | | | 629,697 | |
| United States Treasury Note | |
| | 983,000 | | | | 0.375 | | | | 05/31/16 | | | | 983,128 | |
| | |
| | TOTAL U.S. TREASURY OBLIGATIONS | |
| | (Cost $12,878,848) | | | $ | 12,948,719 | |
| | |
| | |
| 20 | | The accompanying notes are an integral part of these financial statements. |
GOLDMAN SACHS FIXED INCOME MACRO STRATEGIES FUND
| | | | | | | | | | | | | | |
| Contracts | | | Exercise
Price | | | Expiration
Date | | | Value | |
| | Options Purchased – 1.2% | |
| | Options on Futures – % | |
| Citigroup, Inc. Call – Eurodollar | |
| | 124 | | | $ | 99.375 | | | | 05/13/16 | | | $ | 1,829 | |
| Citigroup, Inc. Call – Eurodollar | |
| | 52 | | | | 99.250 | | | | 06/13/16 | | | | 10,400 | |
| | |
| | | | | | | | | | | | | | |
Notional Amount | | | Exercise
Rate | | | Expiration
Date | | | Value | |
| | |
| | Interest Rate Swaptions – 1.2% | |
| Bank of America Securities LLC Put – OTC – 2 year Interest Rate
Swap |
|
| CAD | 6,800,000 | | | | 0.750 | % | | | 05/24/16 | | | $ | 2,857 | |
| Bank of America Securities LLC Put – OTC – 2 year Interest Rate
Swap |
|
| | 6,800,000 | | | | 1.250 | | | | 05/24/16 | | | | 39,839 | |
| Deutsche Bank AG Call – OTC – 2 year Interest Rate Swap | |
| KRW | 3,495,800,000 | | | | 2.800 | | | | 08/19/16 | | | | 2 | |
| Deutsche Bank AG Call – OTC – 2 year Interest Rate Swap | |
| | 3,532,720,000 | | | | 3.050 | | | | 09/05/16 | | | | 1 | |
| Deutsche Bank AG Put – OTC – 5 year Interest Rate Swap | |
| $ | 2,800,000 | | | | 1.250 | | | | 10/03/16 | | | | 26,699 | |
| JPMorgan Securities, Inc. Call – OTC – 2 year Interest Rate Swap | |
| KRW | 2,810,000,000 | | | | 2.800 | | | | 08/08/16 | | | | 1 | |
| JPMorgan Securities, Inc. Call – OTC – 2 year Interest Rate Swap | |
| | 3,505,000,000 | | | | 2.750 | | | | 08/12/16 | | | | 1 | |
| Morgan Stanley Capital Services, Inc. Call – OTC – 1 year
Interest Rate Swap |
|
| $ | 14,000,000 | | | | 1.690 | | | | 10/26/16 | | | | 29,967 | |
| Morgan Stanley Capital Services, Inc. Call – OTC – 1 year
Interest Rate Swap |
|
| | 14,000,000 | | | | 1.690 | | | | 10/26/16 | | | | 16,591 | |
| Morgan Stanley Capital Services, Inc. Call – OTC – 1 year
Interest Rate Swap |
|
| | 18,500,000 | | | | 1.660 | | | | 10/27/16 | | | | 23,560 | |
| Morgan Stanley Capital Services, Inc. Call – OTC – 1 year
Interest Rate Swap |
|
| | 18,500,000 | | | | 1.660 | | | | 10/27/16 | | | | 41,956 | |
| Morgan Stanley Capital Services, Inc. Call – OTC – 30 year
Interest Rate Swap |
|
| EUR | 1,300,000 | | | | 1.396 | | | | 02/05/19 | | | | 138,466 | |
| Morgan Stanley Capital Services, Inc. Call – OTC – 30 year
Interest Rate Swap |
|
| | 1,300,000 | | | | 1.303 | | | | 02/11/19 | | | | 153,924 | |
| Morgan Stanley Capital Services, Inc. Put – OTC – 1 year Interest
Rate Swap |
|
| $ | 13,400,000 | | | | 0.900 | | | | 08/16/16 | | | | 6,659 | |
| Morgan Stanley Capital Services, Inc. Put – OTC – 1 year Interest
Rate Swap |
|
| | 13,400,000 | | | | 1.900 | | | | 08/16/16 | | | | 63,773 | |
| Morgan Stanley Capital Services, Inc. Put – OTC – 1 year Interest
Rate Swap |
|
| | 14,000,000 | | | | 1.690 | | | | 10/26/16 | | | | 49,696 | |
| Morgan Stanley Capital Services, Inc. Put – OTC – 1 year Interest
Rate Swap |
|
| | 14,000,000 | | | | 1.690 | | | | 10/26/16 | | | | 68,656 | |
| | |
| | Options Purchased – (continued) | |
| | Interest Rate Swaptions – (continued) | |
| Morgan Stanley Capital Services, Inc. Put – OTC – 1 year Interest
Rate Swap |
|
| $ | 18,500,000 | | | | 1.660 | % | | | 10/27/16 | | | $ | 62,665 | |
| Morgan Stanley Capital Services, Inc. Put – OTC – 1 year Interest
Rate Swap |
|
| | 18,500,000 | | | | 1.660 | | | | 10/27/16 | | | | 86,937 | |
| | |
| | TOTAL OPTIONS PURCHASED | |
| | (Cost $1,117,341) | | | $ | 824,479 | |
| | |
| | | | | | | | |
| Shares | | Distribution
Rate | | | Value | |
| Investment Companies(d)(f) – 17.9% | |
Goldman Sachs Financial Square Government Fund – FST Institutional Shares | |
| 12,172,945 | | | 0.250 | % | | $ | 12,172,945 | |
| |
| TOTAL INVESTMENT COMPANIES | |
| (Cost $12,172,945) | | | $ | 12,172,945 | |
| |
| TOTAL INVESTMENTS BEFORE SHORT-TERM INVESTMENT | |
| (Cost $61,231,374) | | | $ | 61,164,306 | |
| |
| | | | | | | | | | | | | | |
Principal
Amount | | | Interest
Rate | | | Maturity
Date | | | Value | |
| | | | | | | | | | | | | | |
| | Short-term Investment(g) – 9.1% | |
| | Repurchase Agreements – 9.1% | |
| Joint Repurchase Agreement Account II | |
| $ | 6,200,000 | | | | 0.301 | % | | | 04/01/16 | | | $ | 6,200,000 | |
| | (Cost $6,200,000) | | | | | | | | | |
| | |
| | TOTAL INVESTMENTS – 98.8% | | | | | |
| | (Cost $67,431,374) | | | | | | | $ | 67,364,306 | |
| | |
| OTHER ASSETS IN EXCESS OF
LIABILITIES – 1.2% |
| | | 815,882 | |
| | |
| | NET ASSETS – 100.0% | | | $ | 68,180,188 | |
| | |
| | |
| The accompanying notes are an integral part of these financial statements. | | 21 |
GOLDMAN SACHS FIXED INCOME MACRO STRATEGIES FUND
Consolidated Schedule of Investments (continued)
March 31, 2016
| | |
| The percentage shown for each investment category reflects the value of investments in that category as a percentage of net assets. |
(a) | | Issued with a zero coupon. Income is recognized through the accretion of discount. |
(b) | | Exempt from registration under Rule 144A of the Securities Act of 1933. Such securities may be deemed liquid by the investment adviser and may be resold, normally to qualified institutional buyers in transactions exempt from registration. Total market value of Rule 144A securities amounts to $1,809,831, which represents approximately 2.7% of net assets as of March 31, 2016. |
(c) | | Security with a notional or nominal principal amount. The actual effective yield of this security is different than the stated interest rate. |
(d) | | Variable rate security. Interest rate or distribution rate disclosed is that which is in effect on March 31, 2016. |
(e) | | TBA (To Be Announced) Securities are purchased on a forward commitment basis with an approximate principal amount and no defined maturity date. The actual principal and maturity date will be determined upon settlement when the specific mortgage pools are assigned. Total market value of TBA securities (excluding forward sales contracts, if any) amounts to $3,077,578 which represents approximately 4.5% of net assets as of March 31, 2016. |
(f) | | Represents an affiliated fund. |
(g) | | Joint repurchase agreement was entered into on March 31, 2016. Additional information appears on page 43. |
| | |
|
Currency Abbreviations: |
AED | | — United Arab Emirates Dirham |
AUD | | —Australian Dollar |
BRL | | —Brazilian Real |
CAD | | —Canadian Dollar |
CHF | | —Swiss Franc |
CNH | | —Chinese Yuan Renminbi Offshore |
CNY | | —Chinese Yuan Renminbi |
COP | | —Colombian Peso |
CZK | | —Czech Koruna |
DOP | | —Dominican Peso |
EUR | | —Euro |
GBP | | —British Pound |
HKD | | —Hong Kong Dollar |
HUF | | —Hungarian Forint |
IDR | | —Indonesian Rupiah |
INR | | —Indian Rupee |
JPY | | —Japanese Yen |
KRW | | —South Korean Won |
MXN | | —Mexican Peso |
MYR | | —Malaysian Ringgit |
NOK | | —Norwegian Krone |
NZD | | —New Zealand Dollar |
PLN | | —Polish Zloty |
RUB | | —Russian Ruble |
SEK | | —Swedish Krona |
SGD | | —Singapore Dollar |
THB | | —Thai Baht |
TRY | | —Turkish Lira |
TWD | | —Taiwan Dollar |
USD | | —U.S. Dollar |
ZAR | | —South African Rand |
| | |
Investment Abbreviations: |
AUDOR | | —Australian Dollar Offered Rate |
BP | | —British Pound Offered Rate |
BUBOR | | —Budapest Interbank Offered Rate |
CDOR | | —Canadian Dollar Offered Rate |
CLO | | —Collateralized Loan Obligation |
EURO | | —Euro Offered Rate |
FHLB | | —Federal Home Loan Bank |
FHLMC | | —Federal Home Loan Mortgage Corp. |
FNMA | | —Federal National Mortgage Association |
GNMA | | —Government National Mortgage Association |
HIBOR | | —Hong Kong Interbank Offered Rate |
JIBAR | | —Johannesburg Interbank Agreed Rate |
JYOR | | —Japanese Yen Offered Rate |
KLIBOR | | —Kuala Lumpur Interbank Offered Rate |
KWCDC | | —South Korean Won Certificate of Deposit |
LIBOR | | —London Interbank Offered Rate |
LLC | | —Limited Liability Company |
MIBOR | | —MIBOR—Mumbai Interbank Offered Rate |
NIBOR | | —Norwegian Interbank Offered Rate |
NZDOR | | —New Zealand Dollar Offered Rate |
OTC | | —Over the Counter |
PLC | | —Public Limited Company |
PRIBOR | | —Prague Interbank Offered Rate |
REMIC | | —Real Estate Mortgage Investment Conduit |
STIBOR | | —Stockholm Interbank Offered Rate |
STRIPS | | —Separate Trading of Registered Interest and Principal of Securities |
TIIE | | —La Tasa de Interbank Equilibrium Interest Rate |
UK-RPI | | —United Kingdom Retail Price Index |
WIBOR | | —Warsaw Interbank Offered Rate |
|
| | |
| 22 | | The accompanying notes are an integral part of these financial statements. |
GOLDMAN SACHS FIXED INCOME MACRO STRATEGIES FUND
|
| ADDITIONAL INVESTMENT INFORMATION |
FORWARD FOREIGN CURRENCY EXCHANGE CONTRACTS — At March 31, 2016, the Fund had the following forward foreign currency exchange contracts:
FORWARD FOREIGN CURRENCY EXCHANGE CONTRACTS WITH UNREALIZED GAIN
| | | | | | | | | | | | | | | | | | | | | | | | |
| Counterparty | | Currency
Purchased | | | Currency
Sold | | | Current
Value | | | Settlement
Date | | | Unrealized
Gain | |
Citibank NA | | AUD | | | 1,655,701 | | | USD | | | 1,244,445 | | | $ | 1,267,660 | | | | 04/26/16 | | | $ | 23,213 | |
| | AUD | | | 428,335 | | | USD | | | 321,109 | | | | 327,917 | | | | 04/28/16 | | | | 6,808 | |
| | BRL | | | 14,921,998 | | | USD | | | 3,985,416 | | | | 4,145,072 | | | | 04/04/16 | | | | 159,656 | |
| | CAD | | | 1,602,368 | | | USD | | | 1,156,382 | | | | 1,233,802 | | | | 04/06/16 | | | | 77,420 | |
| | CAD | | | 445,804 | | | USD | | | 342,000 | | | | 343,271 | | | | 04/26/16 | | | | 1,271 | |
| | CHF | | | 335,928 | | | EUR | | | 306,000 | | | | 349,756 | | | | 04/26/16 | | | | 1,286 | |
| | CHF | | | 115,000 | | | USD | | | 116,603 | | | | 119,629 | | | | 04/06/16 | | | | 3,026 | |
| | CNH | | | 23,399,148 | | | USD | | | 3,537,986 | | | | 3,611,240 | | | | 05/26/16 | | | | 73,254 | |
| | CNH | | | 48,897,063 | | | USD | | | 7,397,000 | | | | 7,539,366 | | | | 06/13/16 | | | | 142,366 | |
| | CNH | | | 29,534,686 | | | USD | | | 4,524,453 | | | | 4,553,653 | | | | 06/14/16 | | | | 29,200 | |
| | CNH | | | 12,193,488 | | | USD | | | 1,782,804 | | | | 1,877,507 | | | | 07/08/16 | | | | 94,703 | |
| | CNH | | | 23,399,148 | | | USD | | | 3,518,035 | | | | 3,593,722 | | | | 08/26/16 | | | | 75,688 | |
| | CNH | | | 16,340,795 | | | USD | | | 2,397,300 | | | | 2,508,892 | | | | 09/01/16 | | | | 111,594 | |
| | CNH | | | 49,123,307 | | | USD | | | 7,362,659 | | | | 7,539,035 | | | | 09/09/16 | | | | 176,376 | |
| | CNH | | | 29,534,685 | | | USD | | | 4,469,872 | | | | 4,531,559 | | | | 09/14/16 | | | | 61,687 | |
| | CNY | | | 1,106,044 | | | USD | | | 164,248 | | | | 171,098 | | | | 04/14/16 | | | | 6,850 | |
| | CNY | | | 298,427 | | | USD | | | 45,182 | | | | 46,061 | | | | 05/19/16 | | | | 879 | |
| | CNY | | | 4,615,176 | | | USD | | | 698,000 | | | | 711,834 | | | | 05/31/16 | | | | 13,834 | |
| | CNY | | | 3,456,462 | | | USD | | | 505,750 | | | | 531,654 | | | | 07/11/16 | | | | 25,904 | |
| | CNY | | | 2,313,596 | | | USD | | | 339,001 | | | | 355,841 | | | | 07/12/16 | | | | 16,839 | |
| | CNY | | | 2,235,370 | | | USD | | | 328,495 | | | | 343,763 | | | | 07/14/16 | | | | 15,267 | |
| | CNY | | | 1,898,455 | | | USD | | | 280,972 | | | | 291,931 | | | | 07/15/16 | | | | 10,960 | |
| | CNY | | | 3,430,655 | | | USD | | | 504,266 | | | | 527,329 | | | | 07/21/16 | | | | 23,063 | |
| | CNY | | | 2,286,437 | | | USD | | | 337,943 | | | | 351,426 | | | | 07/22/16 | | | | 13,483 | |
| | CNY | | | 1,443,132 | | | USD | | | 213,614 | | | | 221,750 | | | | 07/26/16 | | | | 8,136 | |
| | CNY | | | 2,941,385 | | | USD | | | 435,240 | | | | 451,756 | | | | 08/02/16 | | | | 16,517 | |
| | CNY | | | 599,212 | | | USD | | | 88,549 | | | | 92,025 | | | | 08/03/16 | | | | 3,475 | |
| | CNY | | | 1,178,171 | | | USD | | | 174,003 | | | | 180,914 | | | | 08/05/16 | | | | 6,912 | |
| | CNY | | | 1,424,007 | | | USD | | | 211,528 | | | | 218,501 | | | | 08/16/16 | | | | 6,973 | |
| | CNY | | | 1,145,601 | | | USD | | | 172,193 | | | | 175,759 | | | | 08/18/16 | | | | 3,566 | |
| | CNY | | | 4,694,283 | | | USD | | | 703,000 | | | | 719,811 | | | | 08/26/16 | | | | 16,811 | |
| | COP | | | 690,038,626 | | | USD | | | 212,690 | | | | 229,959 | | | | 04/04/16 | | | | 17,268 | |
| | COP | | | 536,610,255 | | | USD | | | 169,752 | | | | 178,796 | | | | 04/11/16 | | | | 9,044 | |
| | COP | | | 217,292,776 | | | USD | | | 68,000 | | | | 72,392 | | | | 04/15/16 | | | | 4,392 | |
| | COP | | | 517,446,000 | | | USD | | | 171,000 | | | | 172,251 | | | | 05/02/16 | | | | 1,251 | |
| | COP | | | 690,038,626 | | | USD | | | 226,949 | | | | 229,278 | | | | 05/13/16 | | | | 2,329 | |
| | CZK | | | 2,013,000 | | | USD | | | 82,237 | | | | 84,726 | | | | 04/20/16 | | | | 2,488 | |
| | EUR | | | 156,000 | | | CHF | | | 168,619 | | | | 177,935 | | | | 06/15/16 | | | | 1,968 | |
| | EUR | | | 919,000 | | | GBP | | | 717,408 | | | | 1,046,544 | | | | 04/26/16 | | | | 16,089 | |
| | EUR | | | 713,858 | | | HUF | | | 224,129,997 | | | | 814,863 | | | | 07/08/16 | | | | 3,365 | |
| | EUR | | | 152,000 | | | NOK | | | 1,428,481 | | | | 173,095 | | | | 04/26/16 | | | | 483 | |
| | EUR | | | 698,152 | | | SEK | | | 6,442,885 | | | | 795,045 | | | | 04/26/16 | | | | 688 | |
| | EUR | | | 2,738,799 | | | USD | | | 3,069,332 | | | | 3,118,905 | | | | 04/26/16 | | | | 49,572 | |
| | EUR | | | 2,049,697 | | | USD | | | 2,298,622 | | | | 2,335,906 | | | | 05/19/16 | | | | 37,284 | |
| | GBP | | | 119,186 | | | EUR | | | 150,000 | | | | 171,194 | | | | 04/26/16 | | | | 375 | |
| | GBP | | | 2,753,284 | | | USD | | | 3,940,090 | | | | 3,954,484 | | | | 04/07/16 | | | | 14,394 | |
| | GBP | | | 173,741 | | | USD | | | 245,966 | | | | 249,555 | | | | 04/26/16 | | | | 3,588 | |
| | HUF | | | 70,114,761 | | | EUR | | | 223,000 | | | | 254,035 | | | | 04/26/16 | | | | 87 | |
| | HUF | | | 162,309,640 | | | USD | | | 574,547 | | | | 588,070 | | | | 04/26/16 | | | | 13,522 | |
| | |
| The accompanying notes are an integral part of these financial statements. | | 23 |
GOLDMAN SACHS FIXED INCOME MACRO STRATEGIES FUND
Consolidated Schedule of Investments (continued)
March 31, 2016
|
| ADDITIONAL INVESTMENT INFORMATION (continued) |
FORWARD FOREIGN CURRENCY EXCHANGE CONTRACTS WITH UNREALIZED GAIN (continued)
| | | | | | | | | | | | | | | | | | | | | | | | |
| Counterparty | | Currency
Purchased | | | Currency
Sold | | | Current
Value | | | Settlement
Date | | | Unrealized
Gain | |
Citibank NA (continued) | | HUF | | | 80,105,000 | | | USD | | | 286,802 | | | $ | 290,165 | | | | 05/10/16 | | | $ | 3,363 | |
| | IDR | | | 2,258,386,000 | | | USD | | | 168,536 | | | | 171,112 | | | | 04/04/16 | | | | 2,576 | |
| | IDR | | | 4,467,098,351 | | | USD | | | 336,171 | | | | 339,652 | | | | 04/07/16 | | | | 3,481 | |
| | IDR | | | 4,527,530,350 | | | USD | | | 341,123 | | | | 343,865 | | | | 04/18/16 | | | | 2,742 | |
| | IDR | | | 2,275,653,807 | | | USD | | | 171,000 | | | | 172,570 | | | | 05/02/16 | | | | 1,570 | |
| | INR | | | 23,092,543 | | | USD | | | 345,787 | | | | 348,463 | | | | 04/04/16 | | | | 2,677 | |
| | INR | | | 58,898,568 | | | USD | | | 859,443 | | | | 888,297 | | | | 04/07/16 | | | | 28,854 | |
| | INR | | | 23,057,128 | | | USD | | | 342,000 | | | | 347,180 | | | | 04/18/16 | | | | 5,180 | |
| | JPY | | | 325,791,876 | | | USD | | | 2,875,319 | | | | 2,897,101 | | | | 04/26/16 | | | | 21,782 | |
| | JPY | | | 106,991,000 | | | USD | | | 942,993 | | | | 951,670 | | | | 05/06/16 | | | | 8,677 | |
| | KRW | | | 875,392,171 | | | USD | | | 723,524 | | | | 764,014 | | | | 04/08/16 | | | | 40,489 | |
| | MXN | | | 60,513,696 | | | USD | | | 3,398,524 | | | | 3,494,098 | | | | 04/26/16 | | | | 95,575 | |
| | MXN | | | 5,965,878 | | | USD | | | 331,959 | | | | 344,021 | | | | 05/10/16 | | | | 12,062 | |
| | MYR | | | 1,408,406 | | | USD | | | 339,000 | | | | 361,301 | | | | 04/01/16 | | | | 22,301 | |
| | MYR | | | 1,218,607 | | | USD | | | 303,512 | | | | 314,236 | | | | 04/08/16 | | | | 10,723 | |
| | MYR | | | 1,398,234 | | | USD | | | 342,000 | | | | 360,568 | | | | 04/11/16 | | | | 18,568 | |
| | MYR | | | 699,236 | | | USD | | | 171,000 | | | | 180,334 | | | | 04/20/16 | | | | 9,334 | |
| | MYR | | | 698,429 | | | USD | | | 171,000 | | | | 180,128 | | | | 04/21/16 | | | | 9,128 | |
| | MYR | | | 701,435 | | | USD | | | 175,618 | | | | 180,911 | | | | 04/25/16 | | | | 5,294 | |
| | MYR | | | 664,489 | | | USD | | | 171,000 | | | | 171,386 | | | | 05/04/16 | | | | 386 | |
| | NOK | | | 4,337,627 | | | EUR | | | 457,000 | | | | 524,144 | | | | 04/26/16 | | | | 3,720 | |
| | NOK | | | 2,935,068 | | | EUR | | | 310,000 | | | | 354,565 | | | | 06/15/16 | | | | 976 | |
| | NOK | | | 1,081,000 | | | USD | | | 124,026 | | | | 130,629 | | | | 04/19/16 | | | | 6,602 | |
| | NOK | | | 1,968,763 | | | USD | | | 231,051 | | | | 237,898 | | | | 04/26/16 | | | | 6,847 | |
| | NZD | | | 2,982,922 | | | USD | | | 2,002,069 | | | | 2,058,950 | | | | 04/26/16 | | | | 56,882 | |
| | NZD | | | 862,524 | | | USD | | | 584,976 | | | | 595,291 | | | | 04/28/16 | | | | 10,315 | |
| | PLN | | | 2,013,060 | | | EUR | | | 467,000 | | | | 539,287 | | | | 04/26/16 | | | | 7,474 | |
| | PLN | | | 1,163,000 | | | USD | | | 293,422 | | | | 311,587 | | | | 04/20/16 | | | | 18,166 | |
| | PLN | | | 6,290,111 | | | USD | | | 1,590,211 | | | | 1,685,082 | | | | 04/26/16 | | | | 94,871 | |
| | RUB | | | 38,895,013 | | | USD | | | 522,000 | | | | 578,253 | | | | 04/04/16 | | | | 56,253 | |
| | RUB | | | 25,404,642 | | | USD | | | 335,450 | | | | 377,254 | | | | 04/08/16 | | | | 41,804 | |
| | RUB | | | 34,800,891 | | | USD | | | 497,945 | | | | 516,337 | | | | 04/11/16 | | | | 18,393 | |
| | RUB | | | 9,627,154 | | | USD | | | 137,000 | | | | 142,713 | | | | 04/14/16 | | | | 5,713 | |
| | RUB | | | 37,506,757 | | | USD | | | 527,634 | | | | 555,359 | | | | 04/18/16 | | | | 27,726 | |
| | RUB | | | 32,408,090 | | | USD | | | 437,527 | | | | 479,587 | | | | 04/20/16 | | | | 42,060 | |
| | RUB | | | 11,665,620 | | | USD | | | 171,000 | | | | 172,582 | | | | 04/21/16 | | | | 1,582 | |
| | RUB | | | 9,739,965 | | | USD | | | 139,519 | | | | 144,053 | | | | 04/22/16 | | | | 4,533 | |
| | RUB | | | 4,748,440 | | | USD | | | 68,000 | | | | 70,168 | | | | 04/25/16 | | | | 2,168 | |
| | RUB | | | 26,358,593 | | | USD | | | 387,470 | | | | 389,390 | | | | 04/26/16 | | | | 1,920 | |
| | RUB | | | 135,936,958 | | | USD | | | 1,852,399 | | | | 2,007,590 | | | | 04/27/16 | | | | 155,191 | |
| | RUB | | | 11,653,650 | | | USD | | | 171,000 | | | | 172,008 | | | | 04/29/16 | | | | 1,008 | |
| | RUB | | | 5,065,000 | | | USD | | | 66,365 | | | | 74,513 | | | | 05/12/16 | | | | 8,148 | |
| | SEK | | | 56,415,526 | | | EUR | | | 6,056,616 | | | | 6,955,595 | | | | 04/26/16 | | | | 58,408 | |
| | SEK | | | 9,630,461 | | | USD | | | 1,116,859 | | | | 1,187,068 | | | | 04/19/16 | | | | 70,209 | |
| | TRY | | | 2,480,878 | | | USD | | | 854,000 | | | | 873,762 | | | | 04/26/16 | | | | 19,762 | |
| | TRY | | | 10,157,000 | | | USD | | | 3,449,834 | | | | 3,563,555 | | | | 05/10/16 | | | | 113,722 | |
| | TWD | | | 5,613,392 | | | USD | | | 172,000 | | | | 174,626 | | | | 04/18/16 | | | | 2,626 | |
| | TWD | | | 22,151,340 | | | USD | | | 684,000 | | | | 689,130 | | | | 04/21/16 | | | | 5,130 | |
| | TWD | | | 11,023,122 | | | USD | | | 342,000 | | | | 342,953 | | | | 04/26/16 | | | | 953 | |
| | USD | | | 171,513 | | | AUD | | | 223,000 | | | | 170,736 | | | | 04/26/16 | | | | 777 | |
| | USD | | | 690,865 | | | BRL | | | 2,484,130 | | | | 690,049 | | | | 04/04/16 | | | | 818 | |
| | USD | | | 864,000 | | | CNH | | | 5,585,735 | | | | 857,609 | | | | 09/01/16 | | | | 6,391 | |
| | |
| 24 | | The accompanying notes are an integral part of these financial statements. |
GOLDMAN SACHS FIXED INCOME MACRO STRATEGIES FUND
|
| ADDITIONAL INVESTMENT INFORMATION (continued) |
FORWARD FOREIGN CURRENCY EXCHANGE CONTRACTS WITH UNREALIZED GAIN (continued)
| | | | | | | | | | | | | | | | | | | | | | | | |
| Counterparty | | Currency
Purchased | | | Currency
Sold | | | Current
Value | | | Settlement
Date | | | Unrealized
Gain | |
Citibank NA (continued) | | USD | | | 171,126 | | | EUR | | | 150,000 | | | $ | 170,818 | | | | 04/26/16 | | | $ | 308 | |
| | USD | | | 186,965 | | | IDR | | | 2,452,413,420 | | | | 186,260 | | | | 04/18/16 | | | | 704 | |
| | USD | | | 1,264,996 | | | JPY | | | 140,689,367 | | | | 1,251,079 | | | | 04/26/16 | | | | 13,918 | |
| | USD | | | 334,638 | | | KRW | | | 382,491,580 | | | | 333,826 | | | | 04/08/16 | | | | 812 | |
| | USD | | | 342,000 | | | MXN | | | 5,897,638 | | | | 340,534 | | | | 04/26/16 | | | | 1,466 | |
| | USD | | | 177,866 | | | MXN | | | 3,067,954 | | | | 176,913 | | | | 05/10/16 | | | | 953 | |
| | USD | | | 239,182 | | | NZD | | | 345,030 | | | | 238,156 | | | | 04/26/16 | | | | 1,027 | |
| | USD | | | 171,000 | | | RUB | | | 11,559,600 | | | | 170,620 | | | | 04/29/16 | | | | 380 | |
| | USD | | | 617,058 | | | RUB | | | 41,653,393 | | | | 614,012 | | | | 05/04/16 | | | | 3,046 | |
| | USD | | | 437,074 | | | THB | | | 15,210,166 | | | | 432,091 | | | | 04/26/16 | | | | 4,983 | |
| | USD | | | 102,000 | | | ZAR | | | 1,508,403 | | | | 101,649 | | | | 04/26/16 | | | | 351 | |
| | ZAR | | | 17,493,130 | | | USD | | | 1,125,218 | | | | 1,178,835 | | | | 04/26/16 | | | | 53,620 | |
| | | ZAR | | | 2,833,316 | | | USD | | | 176,026 | | | | 190,368 | | | | 05/10/16 | | | | 14,345 | |
| TOTAL | | | | | | | | $ | 2,657,027 | |
FORWARD FOREIGN CURRENCY EXCHANGE CONTRACTS WITH UNREALIZED LOSS
| | | | | | | | | | | | | | | | | | | | | | | | |
| Counterparty | | Currency
Purchased | | | Currency
Sold | | | Current
Value | | | Settlement
Date | | | Unrealized
Loss | |
Citibank NA | | AUD | | | 447,000 | | | USD | | | 342,248 | | | $ | 342,238 | | | | 04/26/16 | | | $ | (10 | ) |
| | CAD | | | 443,863 | | | USD | | | 342,000 | | | | 341,776 | | | | 04/26/16 | | | | (224 | ) |
| | CHF | | | 170,375 | | | EUR | | | 156,287 | | | | 177,799 | | | | 06/15/16 | | | | (464 | ) |
| | COP | | | 204,234,192 | | | USD | | | 68,000 | | | | 67,964 | | | | 05/04/16 | | | | (36 | ) |
| | EUR | | | 306,658 | | | CHF | | | 336,173 | | | | 349,218 | | | | 04/26/16 | | | | (792 | )�� |
| | EUR | | | 722,573 | | | PLN | | | 3,086,705 | | | | 822,855 | | | | 04/26/16 | | | | (4,053 | ) |
| | EUR | | | 463,000 | | | SEK | | | 4,299,758 | | | | 527,258 | | | | 04/26/16 | | | | (2,868 | ) |
| | EUR | | | 111,135 | | | SEK | | | 1,033,774 | | | | 126,762 | | | | 06/15/16 | | | | (935 | ) |
| | GBP | | | 483,568 | | | EUR | | | 612,000 | | | | 694,580 | | | | 04/26/16 | | | | (2,358 | ) |
| | HUF | | | 51,933,920 | | | EUR | | | 167,121 | | | | 188,163 | | | | 04/26/16 | | | | (2,151 | ) |
| | HUF | | | 224,129,997 | | | EUR | | | 714,054 | | | | 811,497 | | | | 07/08/16 | | | | (3,589 | ) |
| | IDR | | | 3,947,922,020 | | | USD | | | 301,000 | | | | 300,056 | | | | 04/11/16 | | | | (944 | ) |
| | IDR | | | 2,242,307,610 | | | USD | | | 171,000 | | | | 170,372 | | | | 04/14/16 | | | | (628 | ) |
| | IDR | | | 2,238,032,610 | | | USD | | | 171,000 | | | | 169,927 | | | | 04/21/16 | | | | (1,073 | ) |
| | IDR | | | 1,538,927,475 | | | USD | | | 117,118 | | | | 116,799 | | | | 04/25/16 | | | | (319 | ) |
| | JPY | | | 7,682,921 | | | USD | | | 68,511 | | | | 68,320 | | | | 04/26/16 | | | | (191 | ) |
| | KRW | | | 382,491,580 | | | USD | | | 334,492 | | | | 333,676 | | | | 04/25/16 | | | | (816 | ) |
| | MXN | | | 5,902,447 | | | USD | | | 342,000 | | | | 340,811 | | | | 04/26/16 | | | | (1,189 | ) |
| | NZD | | | 247,000 | | | USD | | | 170,500 | | | | 170,491 | | | | 04/26/16 | | | | (10 | ) |
| | USD | | | 2,134,000 | | | AED | | | 7,850,639 | | | | 2,135,304 | | | | 08/11/16 | | | | (1,304 | ) |
| | USD | | | 601,203 | | | AED | | | 2,213,254 | | | | 601,956 | | | | 08/15/16 | | | | (753 | ) |
| | USD | | | 2,910,957 | | | AUD | | | 3,913,237 | | | | 2,996,103 | | | | 04/26/16 | | | | (85,145 | ) |
| | USD | | | 285,273 | | | AUD | | | 380,000 | | | | 290,913 | | | | 04/28/16 | | | | (5,641 | ) |
| | USD | | | 3,140,434 | | | BRL | | | 12,412,766 | | | | 3,448,051 | | | | 04/04/16 | | | | (307,617 | ) |
| | USD | | | 1,893,116 | | | BRL | | | 7,021,000 | | | | 1,919,075 | | | | 06/02/16 | | | | (25,959 | ) |
| | USD | | | 1,032,966 | | | CAD | | | 1,431,720 | | | | 1,102,404 | | | | 04/06/16 | | | | (69,439 | ) |
| | USD | | | 1,392,641 | | | CAD | | | 1,855,020 | | | | 1,428,372 | | | | 04/26/16 | | | | (35,732 | ) |
| | USD | | | 112,170 | | | CHF | | | 110,627 | | | | 115,081 | | | | 04/06/16 | | | | (2,911 | ) |
| | USD | | | 164,248 | | | CNH | | | 1,107,030 | | | | 171,169 | | | | 04/14/16 | | | | (6,921 | ) |
| | USD | | | 1,314,186 | | | CNH | | | 8,591,885 | | | | 1,327,887 | | | | 04/26/16 | | | | (13,701 | ) |
| | USD | | | 45,182 | | | CNH | | | 298,427 | | | | 46,073 | | | | 05/19/16 | | | | (891 | ) |
| | USD | | | 3,541,146 | | | CNH | | | 23,399,148 | | | | 3,611,240 | | | | 05/26/16 | | | | (70,094 | ) |
| | |
| The accompanying notes are an integral part of these financial statements. | | 25 |
GOLDMAN SACHS FIXED INCOME MACRO STRATEGIES FUND
Consolidated Schedule of Investments (continued)
March 31, 2016
|
| ADDITIONAL INVESTMENT INFORMATION (continued) |
FORWARD FOREIGN CURRENCY EXCHANGE CONTRACTS WITH UNREALIZED LOSS (continued)
| | | | | | | | | | | | | | | | | | | | | | | | |
| Counterparty | | Currency
Purchased | | | Currency
Sold | | | Current
Value | | | Settlement
Date | | | Unrealized
Loss | |
Citibank NA (continued) | | USD | | | 698,000 | | | CNH | | | 4,614,129 | | | $ | 711,969 | | | | 05/31/16 | | | $ | (13,969 | ) |
| | USD | | | 7,373,476 | | | CNH | | | 48,897,064 | | | | 7,539,366 | | | | 06/13/16 | | | | (165,889 | ) |
| | USD | | | 4,496,258 | | | CNH | | | 29,534,685 | | | | 4,553,652 | | | | 06/14/16 | | | | (57,395 | ) |
| | USD | | | 169,000 | | | CNH | | | 1,118,621 | | | | 172,459 | | | | 06/15/16 | | | | (3,459 | ) |
| | USD | | | 505,750 | | | CNH | | | 3,457,813 | | | | 532,337 | | | | 07/11/16 | | | | (26,587 | ) |
| | USD | | | 339,001 | | | CNH | | | 2,314,531 | | | | 356,308 | | | | 07/12/16 | | | | (17,307 | ) |
| | USD | | | 328,495 | | | CNH | | | 2,235,083 | | | | 344,042 | | | | 07/14/16 | | | | (15,546 | ) |
| | USD | | | 280,972 | | | CNH | | | 1,897,879 | | | | 292,121 | | | | 07/15/16 | | | | (11,150 | ) |
| | USD | | | 504,266 | | | CNH | | | 3,430,406 | | | | 527,843 | | | | 07/21/16 | | | | (23,577 | ) |
| | USD | | | 337,943 | | | CNH | | | 2,285,086 | | | | 351,592 | | | | 07/22/16 | | | | (13,649 | ) |
| | USD | | | 213,614 | | | CNH | | | 1,442,328 | | | | 221,876 | | | | 07/26/16 | | | | (8,262 | ) |
| | USD | | | 435,240 | | | CNH | | | 2,939,720 | | | | 452,058 | | | | 08/02/16 | | | | (16,818 | ) |
| | USD | | | 88,549 | | | CNH | | | 598,858 | | | | 92,085 | | | | 08/03/16 | | | | (3,536 | ) |
| | USD | | | 174,003 | | | CNH | | | 1,177,475 | | | | 181,039 | | | | 08/05/16 | | | | (7,036 | ) |
| | USD | | | 211,528 | | | CNH | | | 1,423,160 | | | | 218,688 | | | | 08/16/16 | | | | (7,160 | ) |
| | USD | | | 172,193 | | | CNH | | | 1,144,740 | | | | 175,886 | | | | 08/18/16 | | | | (3,693 | ) |
| | USD | | | 4,224,184 | | | CNH | | | 28,089,916 | | | | 4,314,147 | | | | 08/26/16 | | | | (89,963 | ) |
| | USD | | | 3,808,723 | | | CNH | | | 25,488,288 | | | | 3,913,357 | | | | 09/01/16 | | | | (104,636 | ) |
| | USD | | | 7,397,000 | | | CNH | | | 49,123,307 | | | | 7,539,035 | | | | 09/09/16 | | | | (142,035 | ) |
| | USD | | | 4,507,000 | | | CNH | | | 29,534,685 | | | | 4,531,558 | | | | 09/14/16 | | | | (24,558 | ) |
| | USD | | | 1,782,804 | | | CNH | | | 12,279,954 | | | | 1,881,460 | | | | 10/11/16 | | | | (98,656 | ) |
| | USD | | | 106,116 | | | CNH | | | 732,678 | | | | 111,409 | | | | 02/03/17 | | | | (5,293 | ) |
| | USD | | | 228,112 | | | COP | | | 690,038,626 | | | | 229,958 | | | | 04/04/16 | | | | (1,846 | ) |
| | USD | | | 82,237 | | | CZK | | | 2,013,000 | | | | 84,726 | | | | 04/20/16 | | | | (2,488 | ) |
| | USD | | | 3,338,566 | | | EUR | | | 2,983,813 | | | | 3,397,924 | | | | 04/26/16 | | | | (59,358 | ) |
| | USD | | | 5,803,514 | | | EUR | | | 5,174,911 | | | | 5,897,510 | | | | 05/19/16 | | | | (93,999 | ) |
| | USD | | | 5,595,700 | | | GBP | | | 3,914,245 | | | | 5,621,950 | | | | 04/07/16 | | | | (26,250 | ) |
| | USD | | | 342,000 | | | HKD | | | 2,653,342 | | | | 342,108 | | | | 04/26/16 | | | | (108 | ) |
| | USD | | | 290,603 | | | HUF | | | 81,166,797 | | | | 294,011 | | | | 05/10/16 | | | | (3,408 | ) |
| | USD | | | 170,059 | | | IDR | | | 2,258,386,000 | | | | 171,112 | | | | 04/04/16 | | | | (1,053 | ) |
| | USD | | | 329,189 | | | IDR | | | 4,467,098,351 | | | | 339,652 | | | | 04/07/16 | | | | (10,462 | ) |
| | USD | | | 255,153 | | | IDR | | | 3,397,107,329 | | | | 258,192 | | | | 04/11/16 | | | | (3,039 | ) |
| | USD | | | 180,100 | | | IDR | | | 2,435,491,523 | | | | 184,975 | | | | 04/18/16 | | | | (4,875 | ) |
| | USD | | | 170,792 | | | IDR | | | 2,339,853,600 | | | | 177,586 | | | | 04/25/16 | | | | (6,794 | ) |
| | USD | | | 171,000 | | | IDR | | | 2,278,797,300 | | | | 172,883 | | | | 04/29/16 | | | | (1,883 | ) |
| | USD | | | 165,734 | | | IDR | | | 2,207,576,501 | | | | 167,408 | | | | 05/02/16 | | | | (1,674 | ) |
| | USD | | | 340,000 | | | INR | | | 23,092,543 | | | | 348,463 | | | | 04/04/16 | | | | (8,463 | ) |
| | USD | | | 854,959 | | | INR | | | 58,898,568 | | | | 888,298 | | | | 04/07/16 | | | | (33,339 | ) |
| | USD | | | 351,052 | | | INR | | | 23,413,704 | | | | 352,549 | | | | 04/18/16 | | | | (1,497 | ) |
| | USD | | | 775,496 | | | JPY | | | 87,759,502 | | | | 780,400 | | | | 04/26/16 | | | | (4,905 | ) |
| | USD | | | 924,171 | | | JPY | | | 104,855,540 | | | | 932,675 | | | | 05/06/16 | | | | (8,504 | ) |
| | USD | | | 411,387 | | | KRW | | | 492,900,591 | | | | 430,187 | | | | 04/08/16 | | | | (18,800 | ) |
| | USD | | | 171,000 | | | KRW | | | 206,830,485 | | | | 180,501 | | | | 04/11/16 | | | | (9,501 | ) |
| | USD | | | 171,000 | | | KRW | | | 203,695,200 | | | | 177,746 | | | | 04/15/16 | | | | (6,746 | ) |
| | USD | | | 685,127 | | | KRW | | | 808,487,574 | | | | 705,304 | | | | 04/25/16 | | | | (20,177 | ) |
| | USD | | | 500,320 | | | KRW | | | 584,118,342 | | | | 509,529 | | | | 04/28/16 | | | | (9,209 | ) |
| | USD | | | 684,000 | | | MXN | | | 12,054,347 | | | | 696,026 | | | | 04/26/16 | | | | (12,026 | ) |
| | USD | | | 326,959 | | | MXN | | | 5,876,000 | | | | 338,839 | | | | 05/10/16 | | | | (11,880 | ) |
| | USD | | | 343,792 | | | MYR | | | 1,408,406 | | | | 361,301 | | | | 04/01/16 | | | | (17,510 | ) |
| | USD | | | 297,984 | | | MYR | | | 1,218,607 | | | | 314,236 | | | | 04/08/16 | | | | (16,251 | ) |
| | USD | | | 88,413 | | | MYR | | | 366,364 | | | | 94,476 | | | | 04/11/16 | | | | (6,063 | ) |
| | USD | | | 832,527 | | | MYR | | | 3,389,776 | | | | 874,227 | | | | 04/20/16 | | | | (41,699 | ) |
| | |
| 26 | | The accompanying notes are an integral part of these financial statements. |
GOLDMAN SACHS FIXED INCOME MACRO STRATEGIES FUND
|
| ADDITIONAL INVESTMENT INFORMATION (continued) |
FORWARD FOREIGN CURRENCY EXCHANGE CONTRACTS WITH UNREALIZED LOSS (continued)
| | | | | | | | | | | | | | | | | | | | | | | | |
| Counterparty | | Currency
Purchased | | | Currency
Sold | | | Current
Value | | | Settlement
Date | | | Unrealized
Loss | |
Citibank NA (continued) | | USD | | | 171,000 | | | MYR | | | 685,727 | | | $ | 176,860 | | | | 04/25/16 | | | $ | (5,860 | ) |
| | USD | | | 171,000 | | | MYR | | | 689,874 | | | | 177,936 | | | | 04/28/16 | | | | (6,936 | ) |
| | USD | | | 115,508 | | | NOK | | | 1,006,751 | | | | 121,657 | | | | 04/19/16 | | | | (6,149 | ) |
| | USD | | | 1,366,427 | | | NZD | | | 2,030,727 | | | | 1,401,702 | | | | 04/26/16 | | | | (35,274 | ) |
| | USD | | | 571,056 | | | NZD | | | 842,000 | | | | 581,126 | | | | 04/28/16 | | | | (10,070 | ) |
| | USD | | | 290,382 | | | PLN | | | 1,150,951 | | | | 308,360 | | | | 04/20/16 | | | | (17,977 | ) |
| | USD | | | 558,747 | | | RUB | | | 38,895,013 | | | | 578,253 | | | | 04/04/16 | | | | (19,506 | ) |
| | USD | | | 340,264 | | | RUB | | | 24,047,000 | | | | 356,783 | | | | 04/11/16 | | | | (16,519 | ) |
| | USD | | | 68,000 | | | RUB | | | 4,676,972 | | | | 69,252 | | | | 04/18/16 | | | | (1,252 | ) |
| | USD | | | 136,000 | | | RUB | | | 9,271,290 | | | | 137,121 | | | | 04/22/16 | | | | (1,121 | ) |
| | USD | | | 720,671 | | | RUB | | | 49,110,118 | | | | 725,285 | | | | 04/27/16 | | | | (4,614 | ) |
| | USD | | | 1,694,284 | | | RUB | | | 126,023,495 | | | | 1,853,987 | | | | 05/12/16 | | | | (159,705 | ) |
| | USD | | | 1,079,768 | | | SEK | | | 9,304,072 | | | | 1,146,837 | | | | 04/19/16 | | | | (67,069 | ) |
| | USD | | | 301,189 | | | SEK | | | 2,510,747 | | | | 309,555 | | | | 04/26/16 | | | | (8,366 | ) |
| | USD | | | 1,370,672 | | | SGD | | | 1,894,266 | | | | 1,405,237 | | | | 04/26/16 | | | | (34,565 | ) |
| | USD | | | 887,263 | | | TRY | | | 2,626,050 | | | | 924,892 | | | | 04/26/16 | | | | (37,628 | ) |
| | USD | | | 171,000 | | | TWD | | | 5,603,670 | | | | 174,307 | | | | 04/11/16 | | | | (3,307 | ) |
| | USD | | | 224,305 | | | TWD | | | 7,482,829 | | | | 232,763 | | | | 04/12/16 | | | | (8,458 | ) |
| | USD | | | 525,209 | | | TWD | | | 17,319,882 | | | | 538,773 | | | | 04/14/16 | | | | (13,563 | ) |
| | USD | | | 171,044 | | | TWD | | | 5,606,832 | | | | 174,422 | | | | 04/18/16 | | | | (3,378 | ) |
| | USD | | | 490,197 | | | TWD | | | 16,109,379 | | | | 501,151 | | | | 04/19/16 | | | | (10,954 | ) |
| | USD | | | 587,143 | | | TWD | | | 19,351,636 | | | | 602,072 | | | | 04/26/16 | | | | (14,929 | ) |
| | USD | | | 252,000 | | | ZAR | | | 3,797,335 | | | | 255,897 | | | | 04/26/16 | | | | (3,897 | ) |
| | | USD | | | 179,964 | | | ZAR | | | 2,896,699 | | | | 194,627 | | | | 05/10/16 | | | | (14,663 | ) |
| TOTAL | | | | | | | | $ | (2,458,499 | ) |
FUTURES CONTRACTS — At March 31, 2016, the Fund had the following futures contracts:
| | | | | | | | | | | | |
| Type | | Number of
Contracts
Long (Short) | | | Expiration
Date | | | Value | | Unrealized
Gain (Loss) |
S&P 500 E-Mini Index | | | (38 | ) | | | June 2016 | | | $(3,897,850) | | $(78,285) |
| | |
| The accompanying notes are an integral part of these financial statements. | | 27 |
GOLDMAN SACHS FIXED INCOME MACRO STRATEGIES FUND
Consolidated Schedule of Investments (continued)
March 31, 2016
|
| ADDITIONAL INVESTMENT INFORMATION (continued) |
SWAP CONTRACTS — At March 31, 2016, the Fund had the following swap contracts:
OVER THE COUNTER INTEREST RATE SWAP CONTRACTS
| | | | | | | | | | | | | | | | | | | | | | | | |
| | | | | | | | | | | | Rates Exchanged | | Market Value | |
| Counterparty | | Notional Amount (000s) | | | Termination Date | | | Payments Received | | Payments Made | | Upfront
Payments
Made (Received) | | | Unrealized
Gain (Loss) | |
Bank of America Securities LLC | | | COP | | | | 1,611,010 | | | | 12/11/16 | | | Colombia IBR
Overnight Interbank | | 4.340% | | $ | — | | | $ | 8,695 | |
| | | BRL | | | | 10,770 | | | | 01/02/17 | | | 1 month Brazilian
Interbank Deposit
Average | | 14.220 | | | — | | | | (6,337 | ) |
| | | KRW | | | | 1,179,110 | | | | 11/04/17 | | | 2.060% | | 3 month KWCDC | | | — | | | | 10,975 | |
| | | BRL | | | | 6,660 | (a) | | | 01/02/18 | | | 11.830 | | 1 month Brazilian
Interbank Deposit
Average | | | — | | | | (23,210 | ) |
| | | MYR | | | | 10,000 | | | | 01/22/19 | | | 3 month KLIBOR | | 4.060 | | | — | | | | (33,302 | ) |
| | | | | | | 2,790 | | | | 12/03/20 | | | 3 month KLIBOR | | 4.245 | | | — | | | | (18,601 | ) |
| | | | | | | 2,930 | | | | 01/15/21 | | | 3 month KLIBOR | | 4.045 | | | — | | | | (13,238 | ) |
| | | INR | | | | 77,200 | (a) | | | 09/21/21 | | | 12 month MIBOR | | 6.420 | | | — | | | | 8,448 | |
| | | GBP | | | | 1,290 | | | | 12/09/24 | | | 12 month UK-RPI | | 3.150 | | | — | | | | (112,813 | ) |
| | | KRW | | | | 67,630 | (a) | | | 06/03/25 | | | 3 month KWCDC | | 2.427 | | | — | | | | (2,142 | ) |
| | | GBP | | | | 1,290 | | | | 12/09/29 | | | 3.377 | | 12 month UK-RPI | | | — | | | | 169,453 | |
| | | | | | | 1,000 | | | | 12/09/39 | | | 3.568 | | 12 month UK-RPI | | | — | | | | 224,959 | |
| | | | | | | 1,000 | | | | 12/09/44 | | | 12 month UK-RPI | | 3.565 | | | — | | | | (285,938 | ) |
Barclays Bank PLC | | | KRW | | | | 1,198,490 | | | | 11/07/17 | | | 2.034 | | 3 month KWCDC | | | — | | | | 10,658 | |
| | | MYR | | | | 2,700 | | | | 03/04/20 | | | 3 month KLIBOR | | 3.815 | | | — | | | | (4,837 | ) |
| | | KRW | | | | 176,475 | (a) | | | 07/15/25 | | | 3 month KWCDC | | 2.615 | | | — | | | | (6,965 | ) |
Citibank NA | | | COP | | | | 1,592,820 | | | | 12/11/16 | | | Colombia IBR
Overnight Interbank | | 4.330 | | | — | | | | 8,636 | |
| | | KRW | | | | 1,805,420 | | | | 03/07/17 | | | 2.875 | | 3 month KWCDC | | | — | | | | 21,908 | |
| | | | | | | 909,000 | | | | 10/14/17 | | | 2.240 | | 3 month KWCDC | | | — | | | | 10,789 | |
| | | | | | | 1,486,130 | | | | 10/28/17 | | | 2.173 | | 3 month KWCDC | | | — | | | | 16,291 | |
| | | INR | | | | 45,950 | (a) | | | 09/21/21 | | | 6 month MIBOR | | 6.420 | | | (1,172 | ) | | | 6,200 | |
| | | MYR | | | | 5,210 | | | | 01/15/24 | | | 3 month KLIBOR | | 4.575 | | | — | | | | (67,831 | ) |
Credit Suisse International (London) | | | BRL | | | | 1,370 | | | | 01/02/18 | | | 11.120 | | 1 month Brazilian
Interbank Deposit
Average | | | — | | | | (21,481 | ) |
Deutsche Bank AG | | | KRW | | | | 640,300 | | | | 03/03/17 | | | 2.850 | | 3 month KWCDC | | | — | | | | 7,617 | |
| | | | | | | 2,224,900 | | | | 10/13/17 | | | 2.248 | | 3 month KWCDC | | | — | | | | 26,560 | |
| | | | | | | 704,320 | | | | 11/04/17 | | | 2.075 | | 3 month KWCDC | | | — | | | | 6,717 | |
| | | BRL | | | | 50 | | | | 01/02/18 | | | 11.750 | | 1 month Brazilian
Interbank Deposit
Average | | | — | | | | (549 | ) |
| | | | | | | 1,220 | | | | 01/02/18 | | | 11.150 | | 1 month Brazilian
Interbank Deposit
Average | | | — | | | | (18,849 | ) |
| | | | | | | 1,520 | | | | 01/02/18 | | | 11.450 | | 1 month Brazilian
Interbank Deposit
Average | | | — | | | | (19,989 | ) |
| | | | | | | 1,100 | | | | 01/02/19 | | | 14.357 | | 1 month Brazilian
Interbank Deposit
Average | | | — | | | | 3,039 | |
| | |
| 28 | | The accompanying notes are an integral part of these financial statements. |
GOLDMAN SACHS FIXED INCOME MACRO STRATEGIES FUND
|
| ADDITIONAL INVESTMENT INFORMATION (continued) |
OVER THE COUNTER INTEREST RATE SWAP CONTRACTS (continued)
| | | | | | | | | | | | | | | | | | | | | | | | |
| | | | | | | | | | | | Rates Exchanged | | Market Value | |
| Counterparty | | Notional Amount (000s) | | | Termination Date | | | Payments Received | | Payments Made | | Upfront
Payments
Made (Received) | | | Unrealized
Gain (Loss) | |
Deutsche Bank AG (continued) | | | COP | | | | 2,311,520 | | | | 09/24/19 | | | Colombia IBR
Overnight Interbank | | 5.340% | | $ | — | | | $ | 23,944 | |
| | | BRL | | | | 1,670 | | | | 01/02/23 | | | 14.558% | | 1 month Brazilian
Interbank Deposit
Average | | | — | | | | 9,365 | |
| | | MXN | | | | 13,080 | | | | 12/05/23 | | | 6.710 | | Mexico Interbank TIIE
28 Days | | | — | | | | 46,252 | |
| | | MYR | | | | 1,270 | | | | 08/18/24 | | | 3 month KLIBOR | | 4.460 | | | — | | | | (13,927 | ) |
| | | BRL | | | | 1,680 | | | | 01/02/25 | | | 1 month Brazilian
Interbank Deposit
Average | | 12.340 | | | — | | | | 32,168 | |
| | | | | | | 2,600 | | | | 01/02/25 | | | 14.335 | | 1 month Brazilian
Interbank Deposit
Average | | | — | | | | 7,611 | |
| | | ZAR | | | | 14,640 | (a) | | | 02/27/35 | | | 9.040 | | 3 month JIBAR | | | — | | | | 19,049 | |
| | | | | | | 45,320 | (a) | | | 02/27/45 | | | 3 month JIBAR | | 6.765 | | | — | | | | 30,243 | |
JPMorgan Securities, Inc. | | | BRL | | | | 2,470 | | | | 01/02/19 | | | 13.935 | | 1 month Brazilian
Interbank Deposit
Average | | | — | | | | 1,080 | |
| | | | | | | 2,930 | | | | 01/02/19 | | | 1 month Brazilian
Interbank Deposit
Average | | 16.010 | | | — | | | | (34,144 | ) |
| | | | | | | 5,890 | | | | 01/02/19 | | | 15.970 | | 1 month Brazilian
Interbank Deposit
Average | | | — | | | | 67,567 | |
| | | KRW | | | | 1,154,150 | | | | 02/02/19 | | | 1.472 | | 3 month KWCDC | | | — | | | | 1,260 | |
| | | MYR | | | | 1,660 | | | | 11/02/20 | | | 3 month KLIBOR | | 4.235 | | | — | | | | (10,833 | ) |
| | | BRL | | | | 3,810 | | | | 01/04/21 | | | 1 month Brazilian
Interbank Deposit
Average | | 13.720 | | | — | | | | 3,209 | |
| | | | | | | 8,930 | | | | 01/04/21 | | | 1 month Brazilian
Interbank Deposit
Average | | 15.567 | | | — | | | | (115,631 | ) |
| | | MYR | | | | 2,790 | | | | 01/05/21 | | | 3 month KLIBOR | | 4.230 | | | — | | | | (18,776 | ) |
| | | | | | | 1,100 | | | | 01/06/21 | | | 3 month KLIBOR | | 4.250 | | | — | | | | (7,668 | ) |
| | | THB | | | | 25,850 | | | | 02/03/21 | | | 1.887 | | 6 month Thai Reuters | | | — | | | | 5,284 | |
| | | | | | | 22,290 | | | | 02/19/21 | | | 1.875 | | 6 month Thai Reuters | | | — | | | | 3,862 | |
| | | INR | | | | 14,920 | | | | 09/21/21 | | | 6 month MIBOR | | 6.420 | | | (407 | ) | | | — | |
| | | BRL | | | | 1,690 | | | | 01/02/23 | | | 13.760 | | 1 month Brazilian
Interbank Deposit
Average | | | — | | | | (2,538 | ) |
| | | | | | | 2,210 | | | | 01/02/23 | | | 15.580 | | 1 month Brazilian
Interbank Deposit
Average | | | — | | | | 31,491 | |
| | | | | | | 3,690 | | | | 01/02/23 | | | 15.470 | | 1 month Brazilian
Interbank Deposit
Average | | | — | | | | 49,347 | |
| | | KRW | | | | 3,527,190 | (a) | | | 09/19/24 | | | 3 month KWCDC | | 3.126 | | | — | | | | (222,292 | ) |
| | | | | | | 216,170 | (a) | | | 11/09/25 | | | 2.237 | | 3 month KWCDC | | | — | | | | 4,947 | |
| | | | | | | 286,230 | (a) | | | 11/10/25 | | | 2.330 | | 3 month KWCDC | | | — | | | | 7,679 | |
| | |
| The accompanying notes are an integral part of these financial statements. | | 29 |
GOLDMAN SACHS FIXED INCOME MACRO STRATEGIES FUND
Consolidated Schedule of Investments (continued)
March 31, 2016
|
| ADDITIONAL INVESTMENT INFORMATION (continued) |
OVER THE COUNTER INTEREST RATE SWAP CONTRACTS (continued)
| | | | | | | | | | | | | | | | | | | | | | | | |
| | | | | | | | | | | | Rates Exchanged | | Market Value | |
| Counterparty | | Notional Amount (000s) | | | Termination Date | | | Payments Received | | Payments Made | | Upfront
Payments
Made (Received) | | | Unrealized
Gain (Loss) | |
Morgan Stanley & Co. International PLC | | | COP | | | | 4,401,090 | | | | 11/24/16 | | | Colombia IBR
Overnight Interbank | | 6.060% | | $ | — | | | $ | 6,541 | |
| | | | | | | 1,755,890 | | | | 03/31/17 | | | Colombia IBR
Overnight Interbank | | 6.570 | | | — | | | | (999 | ) |
| | | | | | | 1,755,890 | | | | 04/03/17 | | | Colombia IBR
Overnight Interbank | | 6.550 | | | — | | | | (12 | ) |
| | | KRW | | | | 387,270 | | | | 10/13/17 | | | 2.250% | | 3 month KWCDC | | | — | | | | 4,638 | |
| | | | | | | 833,730 | | | | 10/14/17 | | | 2.245 | | 3 month KWCDC | | | — | | | | 9,960 | |
| | | | | | | 833,730 | | | | 10/14/17 | | | 2.250 | | 3 month KWCDC | | | — | | | | 10,023 | |
| | | | | | | 565,220 | | | | 10/28/17 | | | 2.168 | | 3 month KWCDC | | | — | | | | 6,148 | |
| | | | | | | 963,930 | | | | 10/29/17 | | | 2.175 | | 3 month KWCDC | | | — | | | | 10,583 | |
| | | BRL | | | | 2,600 | | | | 01/02/19 | | | 14.080 | | 1 month Brazilian
Interbank Deposit
Average | | | — | | | | 3,556 | |
| | | | | | | 4,220 | | | | 01/02/19 | | | 15.475 | | 1 month Brazilian
Interbank Deposit
Average | | | — | | | | 35,851 | |
| | | KRW | | | | 564,220 | | | | 02/03/19 | | | 1.461 | | 3 month KWCDC | | | — | | | | 451 | |
| | | BRL | | | | 2,260 | | | | 01/04/21 | | | 1 month Brazilian
Interbank Deposit
Average | | 11.410 | | | — | | | | 50,678 | |
| | | MYR | | | | 2,920 | | | | 01/12/21 | | | 3 month KLIBOR | | 4.195 | | | — | | | | (18,369 | ) |
| | | INR | | | | 19,550 | | | | 09/21/21 | | | 6 month MIBOR | | 6.420 | | | (182 | ) | | | 2,322 | |
| | | KRW | | | | 31,230 | (a) | | | 09/23/25 | | | 3 month KWCDC | | 2.265 | | | — | | | | (759 | ) |
| | | | | | | | 219,110 | (a) | | | 09/23/25 | | | 3 month KWCDC | | 2.260 | | | — | | | | (5,276 | ) |
| TOTAL | | | | | | | | | | | | | | | | | | $ | (1,761 | ) | | $ | (61,252 | ) |
| | (a) | | Represents forward starting interest rate swaps whose effective dates of commencement of accruals and cash flows occur subsequent to March 31, 2016. |
CENTRALLY CLEARED INTEREST RATE SWAP CONTRACTS
| | | | | | | | | | | | | | | | |
| | | | | | Rates Exchanged | | Market Value | |
Notional Amount (000s) | | | Termination Date | | Payments Received | | Payments Made | | Upfront
Payments
Made (Received) | | | Unrealized
Gain (Loss) | |
| $ | 500 | | | 03/19/17 | | 3 month LIBOR | | 0.750% | | $ | 1,192 | | | $ | (1,245 | ) |
| HUF | 130,750 | | | 06/09/18 | | 6 month BUBOR | | 1.860 | | | 1 | | | | (15,089 | ) |
| SEK | 54,250 | (a) | | 06/15/18 | | 0.050% | | 3 month STIBOR | | | 52,444 | | | | (4,431 | ) |
| PLN | 33,000 | (a) | | 06/15/18 | | 1.420 | | 6 month WIBOR | | | 61 | | | | (22,165 | ) |
| $ | 17,000 | (a) | | 06/15/18 | | 3 month LIBOR | | 1.250 | | | (58,468 | ) | | | (59,984 | ) |
| MXN | 17,800 | | | 11/22/18 | | Mexico Interbank
TIIE 28 Days | | 4.620 | | | 6 | | | | 3,532 | |
| EUR | 20,220 | (a) | | 02/17/19 | | 6 month EURO | | 0.086 | | | 1,737 | | | | (13,575 | ) |
MXN
|
21,460 |
(a) | | 06/12/19 | | 4.500 | | Mexico Interbank
TIIE 28 Days | | | (18,692 | ) | | | 2,696 | |
| $ | 8,500 | (a) | | 06/15/19 | | 3 month LIBOR | | 1.500 | | | (78,042 | ) | | | (46,936 | ) |
| MXN | 21,960 | | | 09/23/19 | | Mexico Interbank
TIIE 28 Days | | 5.480 | | | 7 | | | | (22,304 | ) |
| EUR | 8,760 | (a) | | 02/09/20 | | 6 month EURO | | 0.100 | | | (5,557 | ) | | | (10,598 | ) |
| | 6,070 | (a) | | 02/26/20 | | 0.050 | | 6 month EURO | | | 2,655 | | | | 505 | |
| | |
| 30 | | The accompanying notes are an integral part of these financial statements. |
GOLDMAN SACHS FIXED INCOME MACRO STRATEGIES FUND
|
| ADDITIONAL INVESTMENT INFORMATION (continued) |
CENTRALLY CLEARED INTEREST RATE SWAP CONTRACTS (continued)
| | | | | | | | | | | | | | | | |
| | | | | | Rates Exchanged | | Market Value | |
Notional Amount (000s) | | | Termination Date | | Payments Received | | Payments Made | | Upfront
Payments
Made (Received) | | | Unrealized
Gain (Loss) | |
| HUF | 763,240 | | | 12/16/20 | | 1.3500% | | 6 month BUBOR | | $ | (4,875 | ) | | $ | (164,476 | ) |
| GBP | 4,260 | (a) | | 02/16/21 | | 6 month BP | | 1.160% | | | (2,525 | ) | | | (3,519 | ) |
| CAD | 19,950 | (a) | | 06/15/21 | | 1.000 | | 6 month CDOR | | | 1,069 | | | | 1,752 | |
| AUD | 2,490 | (a) | | 06/15/21 | | 2.500 | | 6 month AUDOR | | | 6,516 | | | | 8,275 | |
| $ | 22,530 | (a) | | 06/15/21 | | 3 month LIBOR | | 2.000 | | | (669,613 | ) | | | (179,824 | ) |
| SEK | 61,500 | (a) | | 06/15/21 | | 3 month STIBOR | | 0.500 | | | (55,552 | ) | | | 893 | |
| GBP | 1,990 | (a) | | 06/15/21 | | 6 month BP | | 1.750 | | | (104,642 | ) | | | 3,866 | |
| HKD | 7,740 | (a) | | 09/21/21 | | 3 month HIBOR | | 1.500 | | | 4,704 | | | | (7,124 | ) |
| MXN | 8,270 | (a) | | 04/05/22 | | 6.900 | | Mexico Interbank
TIIE 28 Days | | | 4 | | | | 2,893 | |
| | 16,340 | (a) | | 08/08/22 | | 7.345 | | Mexico Interbank
TIIE 28 Days | | | 7 | | | | 10,096 | |
| | 16,560 | (a) | | 08/11/22 | | 7.370 | | Mexico Interbank
TIIE 28 Days | | | 7 | | | | 10,560 | |
| | 113,840 | (a) | | 09/15/22 | | 7.500 | | Mexico Interbank
TIIE 28 Days | | | 49 | | | | 81,665 | |
| GBP | 5,940 | (a) | | 12/11/22 | | 6 month BP | | 1.940 | | | (23,136 | ) | | | (247,694 | ) |
| EUR | 2,940 | (a) | | 02/09/23 | | 0.500 | | 6 month EURO | | | 3,732 | | | | 22,103 | |
| | 4,650 | (a) | | 06/15/23 | | 0.750 | | 6 month EURO | | | 153,063 | | | | 29,592 | |
| $ | 6,340 | (a) | | 06/15/23 | | 3 month LIBOR | | 2.000 | | | (189,120 | ) | | | (49,233 | ) |
| JPY | 888,300 | (a) | | 06/15/23 | | 6 month JYOR | | 0.100 | | | (39,996 | ) | | | (2,237 | ) |
| MXN | 100 | (a) | | 09/06/23 | | 5.250 | | Mexico Interbank
TIIE 28 Days | | | (269 | ) | | | 43 | |
| | 47,480 | (a) | | 11/29/23 | | Mexico Interbank
TIIE 28 Days | | 7.240 | | | 16 | | | | (8,732 | ) |
| | 16,740 | (a) | | 07/24/24 | | Mexico Interbank
TIIE 28 Days | | 7.370 | | | 7 | | | | (4,160 | ) |
| | 3,320 | | | 11/20/24 | | Mexico Interbank
TIIE 28 Days | | 5.955 | | | 2 | | | | (404 | ) |
| GBP | 4,190 | (a) | | 02/16/25 | | 1.570 | | 6 month BP | | | 12,532 | | | | 15,636 | |
| MXN | 3,570 | (a) | | 04/01/25 | | Mexico Interbank
TIIE 28 Days | | 6.920 | | | 2 | | | | (537 | ) |
| EUR | 4,870 | (a) | | 05/11/25 | | 1.567 | | 6 month EURO | | | 151,563 | | | | 41,768 | |
| | 33,830 | (a) | | 05/11/25 | | 1.568 | | 6 month EURO | | | (4,581 | ) | | | 1,347,577 | |
| HUF | 86,620 | | | 06/02/25 | | 6 month BUBOR | | 2.985 | | | 4 | | | | (34,705 | ) |
| EUR | 310 | | | 06/16/25 | | 1.226 | | 6 month EURO | | | 4 | | | | 28,186 | |
| | 310 | | | 06/16/25 | | 6 month EURO | | 0.050 | | | — | | | | 52 | |
| CZK | 8,440 | | | 06/16/25 | | 6 month PRIBOR | | 1.365 | | | 4 | | | | (30,903 | ) |
| NOK | 3,160 | (a) | | 06/17/25 | | 3 month NIBOR | | 2.500 | | | (4,040 | ) | | | (8,806 | ) |
| HUF | 51,240 | | | 06/19/25 | | 6 month BUBOR | | 3.580 | | | 2 | | | | (30,701 | ) |
| | 101,820 | | | 06/25/25 | | 6 month BUBOR | | 3.380 | | | 3 | | | | (53,991 | ) |
| | 79,720 | | | 07/09/25 | | 6 month BUBOR | | 3.280 | | | 3 | | | | (39,330 | ) |
| CZK | 8,450 | | | 07/15/25 | | 6 month PRIBOR | | 1.295 | | | 4 | | | | (28,103 | ) |
| MXN | 7,090 | (a) | | 08/04/25 | | Mexico Interbank
TIIE 28 Days | | 7.405 | | | 4 | | | | (7,147 | ) |
| | 7,150 | (a) | | 08/07/25 | | Mexico Interbank
TIIE 28 Days | | 7.430 | | | 4 | | | | (7,557 | ) |
| ZAR | 1,730 | (a) | | 08/24/25 | | 9.145 | | 3 month JIBAR | | | 2 | | | | (347 | ) |
| MXN | 49,530 | (a) | | 09/11/25 | | Mexico Interbank
TIIE 28 Days | | 7.600 | | | (1,300 | ) | | | (66,262 | ) |
| EUR | 2,310 | (a) | | 09/16/25 | | 2.000 | | 6 month EURO | | | 43,746 | | | | 94,192 | |
| GBP | 1,840 | (a) | | 09/16/25 | | 6 month BP | | 2.750 | | | (169,439 | ) | | | 49,415 | |
| | |
| The accompanying notes are an integral part of these financial statements. | | 31 |
GOLDMAN SACHS FIXED INCOME MACRO STRATEGIES FUND
Consolidated Schedule of Investments (continued)
March 31, 2016
|
| ADDITIONAL INVESTMENT INFORMATION (continued) |
CENTRALLY CLEARED INTEREST RATE SWAP CONTRACTS (continued)
| | | | | | | | | | | | | | | | |
| | | | | | Rates Exchanged | | Market Value | |
Notional Amount (000s) | | | Termination Date | | Payments Received | | Payments Made | | Upfront
Payments
Made (Received) | | | Unrealized
Gain (Loss) | |
| EUR | 240 | | | 10/09/25 | | 0.989% | | 6 month EURO | | $ | 3 | | | $ | 14,130 | |
| CZK | 7,040 | | | 10/09/25 | | 6 month PRIBOR | | 0.930% | | | 4 | | | | (10,890 | ) |
| ZAR | 2,550 | (a) | | 10/27/25 | | 9.200 | | 3 month JIBAR | | | 2 | | | | (299 | ) |
| EUR | 290 | | | 11/02/25 | | 0.895 | | 6 month EURO | | | 4 | | | | 13,669 | |
| CZK | 7,890 | | | 11/02/25 | | 6 month PRIBOR | | 0.835 | | | 2 | | | | (8,660 | ) |
| EUR | 260 | | | 11/20/25 | | 0.891 | | 6 month EURO | | | 3 | | | | 11,926 | |
| CZK | 7,000 | | | 11/20/25 | | 6 month PRIBOR | | 0.850 | | | 3 | | | | (8,021 | ) |
| EUR | 210 | | | 12/04/25 | | 0.816 | | 6 month EURO | | | 3 | | | | 7,687 | |
| CZK | 5,630 | | | 12/04/25 | | 6 month PRIBOR | | 0.760 | | | 3 | | | | (4,109 | ) |
| | 4,460 | | | 12/08/25 | | 6 month PRIBOR | | 0.935 | | | 2 | | | | (6,747 | ) |
| ZAR | 8,780 | (a) | | 12/10/25 | | 10.066 | | 3 month JIBAR | | | 7 | | | | 12,765 | |
| | 3,640 | (a) | | 12/11/25 | | 10.455 | | 3 month JIBAR | | | 3 | | | | 7,877 | |
| JPY | 448,710 | (a) | | 12/16/25 | | 6 month JYOR | | 1.000 | | | (211,476 | ) | | | 79,579 | |
| EUR | 6,480 | (a) | | 01/06/26 | | 1.550 | | 6 month EURO | | | 36,585 | | | | 160,253 | |
| ZAR | 620 | (a) | | 01/20/26 | | 10.130 | | 3 month JIBAR | | | — | | | | 959 | |
| PLN | 770 | (a) | | 01/20/26 | | 3.295 | | 6 month WIBOR | | | 2 | | | | 5,575 | |
| | 1,510 | (a) | | 01/22/26 | | 3.125 | | 6 month WIBOR | | | 4 | | | | 7,946 | |
| | 760 | (a) | | 01/25/26 | | 3.155 | | 6 month WIBOR | | | 2 | | | | 4,273 | |
| AUD | 1,650 | (a) | | 03/24/26 | | 3.100 | | 6 month AUDOR | | | 5,340 | | | | 4,045 | |
| EUR | 12,420 | (a) | | 06/15/26 | | 1.000 | | 6 month EURO | | | 592,957 | | | | 12,925 | |
| $ | 400 | (a) | | 06/15/26 | | 2.250 | | 3 month LIBOR | | | 14,912 | | | | 6,508 | |
| | 3,650 | (a) | | 06/15/26 | | 3 month LIBOR | | 2.250 | | | (133,654 | ) | | | (61,802 | ) |
| NZD | 3,530 | (a) | | 06/15/26 | | 3 month NZDOR | | 3.000 | | | 27,230 | | | | (24,584 | ) |
| SEK | 24,740 | (a) | | 06/15/26 | | 3 month STIBOR | | 1.250 | | | (11,227 | ) | | | (5,237 | ) |
| AUD | 5,810 | (a) | | 06/15/26 | | 3.000 | | 6 month AUDOR | | | 118,074 | | | | 31,537 | |
| | 4,620 | (a) | | 06/16/26 | | 3.000 | | 6 month AUDOR | | | 84,950 | | | | 33,947 | |
| MXN | 20,410 | (a) | | 11/25/26 | | 7.707 | | Mexico Interbank
TIIE 28 Days | | | 7 | | | | 20,415 | |
| $ | 2,370 | (a) | | 12/15/26 | | 2.500 | | 3 month LIBOR | | | 21,695 | | | | 7,443 | |
| EUR | 570 | (a) | | 12/15/26 | | 6 month EURO | | 1.500 | | | (8,353 | ) | | | (1,207 | ) |
| MXN | 7,390 | (a) | | 07/21/27 | | 7.660 | | Mexico Interbank
TIIE 28 Days | | | 4 | | | | 5,054 | |
| GBP | 10,430 | (a) | | 12/11/27 | | 2.190 | | 6 month BP | | | 75,316 | | | | 673,371 | |
| $ | 1,000 | (a) | | 06/15/31 | | 2.500 | | 3 month LIBOR | | | 64,947 | | | | 12,284 | |
| GBP | 140 | | | 06/07/32 | | 6 month BP | | 1.844 | | | (1,105 | ) | | | (5,120 | ) |
| | 5,310 | (a) | | 12/11/32 | | 6 month BP | | 2.250 | | | (41,676 | ) | | | (446,733 | ) |
| | 1,220 | (a) | | 02/16/33 | | 6 month BP | | 1.820 | | | (5,020 | ) | | | (1,974 | ) |
| EUR | 11,480 | (a) | | 05/11/35 | | 6 month EURO | | 1.695 | | | (267,093 | ) | | | (483,251 | ) |
| $ | 3,210 | (a) | | 12/17/35 | | 3.000 | | 3 month LIBOR | | | 121,847 | | | | 4,347 | |
| JPY | 405,810 | (a) | | 12/17/35 | | 6 month JYOR | | 2.000 | | | (354,101 | ) | | | (45,403 | ) |
| | 106,470 | (a) | | 03/30/36 | | 6 month JYOR | | 0.900 | | | (2,072 | ) | | | (1,333 | ) |
| $ | 2,000 | (a) | | 06/15/36 | | 2.500 | | 3 month LIBOR | | | 120,549 | | | | 32,649 | |
| | 1,100 | (a) | | 06/15/36 | | 3 month LIBOR | | 2.500 | | | (76,969 | ) | | | (7,290 | ) |
| JPY | 42,440 | (a) | | 06/15/36 | | 6 month JYOR | | 0.500 | | | 374 | | | | 95 | |
| GBP | 336 | | | 06/08/37 | | 6 month BP | | 2.100 | | | (18,392 | ) | | | (20,853 | ) |
| | 430 | | | 04/15/39 | | 6 month BP | | 2.060 | | | (21,994 | ) | | | (28,847 | ) |
| EUR | 1,020 | (a) | | 12/19/45 | | 1.250 | | 6 month EURO | | | (160 | ) | | | 13,143 | |
| $ | 3,210 | (a) | | 12/19/45 | | 2.750 | | 3 month LIBOR | | | 66,406 | | | | 346 | |
| JPY | 443,060 | (a) | | 12/19/45 | | 6 month JYOR | | 2.000 | | | (285,370 | ) | | | (124,214 | ) |
| GBP | 1,830 | (a) | | 01/05/46 | | 6 month BP | | 2.250 | | | (71,012 | ) | | | (110,393 | ) |
| | |
| 32 | | The accompanying notes are an integral part of these financial statements. |
GOLDMAN SACHS FIXED INCOME MACRO STRATEGIES FUND
|
| ADDITIONAL INVESTMENT INFORMATION (continued) |
CENTRALLY CLEARED INTEREST RATE SWAP CONTRACTS (continued)
| | | | | | | | | | | | | | | | |
| | | | | | Rates Exchanged | | Market Value | |
Notional Amount (000s) | | | Termination Date | | Payments Received | | Payments Made | | Upfront
Payments
Made (Received) | | | Unrealized
Gain (Loss) | |
| $ | 1,090 | (a) | | 06/15/46 | | 2.500% | | 3 month LIBOR | | $ | 75,707 | | | $ | 13,460 | |
| GBP | 2,590 | (a) | | 06/15/46 | | 6 month BP | | 2.000% | | | (331,367 | ) | | | 12,755 | |
| | TOTAL | | | | | | | | | $ | (1,408,785 | ) | | $ | 387,174 | |
| | (a) | | Represents forward starting interest rate swaps whose effective dates of commencement of accruals and cash flows occur subsequent to March 31, 2016. |
OVER THE COUNTER CROSS CURRENCY SWAP CONTRACTS
| | | | | | | | | | | | | | | | | | | | | | | | | | |
| | | | | | | | | | | | Rates Exchanged | | | Market Value | |
| Counterparty | | Notional Amount of Currency
Received | | | Notional Amount
of Currency
Delivered | | |
Termination
Date | | | Receive | | Pay | | | Upfront
Payments
made (received) | | |
Unrealized
Gain (Loss) | |
Bank of America Securities LLC | | $ | 400,771 | | | TRY | 1,040,000 | | | | 04/07/20 | | | 3 month LIBOR | | | 8.770 | % | | $ | 1,597 | ) | | $ | 14,751 | |
| | | 558,793 | | | | 163,000 | | | | 11/13/20 | | | 3 month LIBOR | | | 10.480 | | | | (364 | ) | | | (53,680 | ) |
| | | 662,116 | | | | 1,940,000 | | | | 06/15/21 | | | 3 month LIBOR | | | 10.440 | | | | (4,917 | ) | | | (35,708 | ) |
Barclays Bank PLC | | | 628,308 | | | | 1,840,000 | | | | 12/15/20 | | | 3 month LIBOR | | | 10.660 | | | | 11,065 | | | | (73,494 | ) |
Citibank NA | | | 931,649 | | | | 1,935,500 | | | | 05/16/19 | | | 3 month LIBOR | | | 9.370 | | | | (3,037 | ) | | | 201,184 | |
JPMorgan Securities, Inc. | | | 1,000,000 | | | | 3,030,000 | | | | 09/17/20 | | | 3 month LIBOR | | | 11.040 | | | | (479 | ) | | | (180,498 | ) |
| | | 750,853 | | | | 2,200,000 | | | | 06/15/21 | | | 3 month LIBOR | | | 10.440 | | | | (5,576 | ) | | | (40,494 | ) |
Morgan Stanley & Co. International PLC | | TRY | 990,000 | | | $ | 394,421 | | | | 03/03/20 | | | 3 month LIBOR | | | 8.930 | | | | 204 | | | | (51,924 | ) |
| | $ | 280,586 | | | TRY | 805,000 | | | | 11/20/20 | | | 3 month LIBOR | | | 10.420 | | | | (691 | ) | | | (20,154 | ) |
| | | | 1,220,000 | | | | 3,501,400 | | | | 06/15/21 | | | 3 month LIBOR | | | 10.210 | | | | (1,383 | ) | | | (36,154 | ) |
| TOTAL | | | $ | (6,775 | ) | | $ | (276,171 | ) |
OVER THE COUNTER TOTAL RETURN SWAP CONTRACTS ON COMMODITY INDICES
| | | | | | | | | | | | | | | | | | |
| Counterparty | | Referenced Obligation(b) | | Notional
Amount
(000s) | | | Paid
Rate | | | Termination
Date | | | Unrealized
Gain (Loss)* | |
Merrill Lynch & Co., Inc. | | Dow Jones-UBS Brent Crude Subindex | | $ | 640 | | | | 0.000 | % | | | 04/07/16 | | | $ | (71 | ) |
| | Dow Jones-UBS Copper Subindex | | | 250 | | | | 0.000 | | | | 09/30/16 | | | | — | |
| | Dow Jones-UBS Kansas Wheat Subindex | | | 5 | | | | 0.000 | | | | 04/07/16 | | | | (28 | ) |
| | Dow Jones-UBS Natural Gas Subindex | | | 1,209 | | | | 0.000 | | | | 04/07/16 | | | | — | |
| | Dow Jones-UBS Soybeans Subindex | | | 3,786 | | | | 0.000 | | | | 04/07/16 | | | | — | |
| | Dow Jones-UBS Wheat Subindex | | | 1,204 | | | | 0.000 | | | | 04/07/16 | | | | — | |
| | | | | |
| | | Dow Jones-UBS WTI Crude Oil Subindex | | | 453 | | | | 0.000 | | | | 04/07/16 | | | | — | |
| TOTAL | | | $ | (99 | ) |
| | (b) | | The Fund receives quarterly payments based on any positive monthly return of the Referenced Obligation. The Fund makes payments on any negative monthly return of such referenced obligation. |
| | * | | There are no upfront payments on the swap contracts, therefore the unrealized gain/loss of the swap contracts is equal to their market value. |
| | |
| The accompanying notes are an integral part of these financial statements. | | 33 |
GOLDMAN SACHS FIXED INCOME MACRO STRATEGIES FUND
Consolidated Schedule of Investments (continued)
March 31, 2016
|
| ADDITIONAL INVESTMENT INFORMATION (continued) |
NON-DELIVERABLE BOND FORWARD CONTRACTS#
| | | | | | | | | | | | |
| Counterparty | | Notional
Amount
(000s) | | | Reference
Obligation | | Settlement
Date | | Unrealized
Gain (Loss)* | |
Deutsche Bank AG | | COP | 3,476,400 | | | Titulos de Tesoreria 10.000% 04/06/16 | | 04/06/16 | | $ | 48,215 | |
| | COP | 2,162,000 | | | Titulos de Tesoreria 7.750% 04/06/16 | | 04/06/16 | | | 38,535 | |
| | COP | 1,558,700 | | | Titulos de Tesoreria 7.500% 04/06/16 | | 04/06/16 | | | 20,377 | |
| | COP | 2,119,000 | | | Titulos de Tesoreria 7.500% 04/12/16 | | 04/12/16 | | | 10,448 | |
| | | COP | 2,880,100 | | | Titulos de Tesoreria 7.750% 04/12/16 | | 04/12/16 | | | 21,453 | |
| TOTAL | | $ | 139,028 | |
| | # | | Represents a short term forward contract to purchase the referenced obligation denominated in a non-deliverable foreign currency. |
| | * | | There are no upfront payments on the bond forward contracts, therefore the unrealized gain (loss) of the bond forward contracts is equal to their market value. |
WRITTEN OPTIONS CONTRACTS — For the fiscal year ended March 31, 2016 the Fund had the following written options:
WRITTEN OPTION CURRENCY CONTRACTS
| | | | | | | | | | | | | | | | | | |
| Counterparty | | Description | | Notional
Amount
(000s) | | | Expiration
Date | | | Exercise
Price | | | Value | |
BNP Paribas SA | | Call USD/Put MXN | | $ | 343 | | | | 06/02/16 | | | $ | 17.25 | | | $ | (7,237 | ) |
| | Call USD/Put RUB | | | 171 | | | | 05/31/16 | | | | 68.00 | | | | (6,302 | ) |
| | Put USD/Call MXN | | | 343 | | | | 06/02/16 | | | | 17.25 | | | | (7,237 | ) |
| | Put USD/Call RUB | | | 171 | | | | 05/31/16 | | | | 68.00 | | | | (6,301 | ) |
Citibank NA | | Call USD/Put CNH | | | 717 | | | | 01/25/17 | | | | 7.55 | | | | (4,391 | ) |
JPMorgan Securities, Inc. | | Call USD/Put MXN | | | 342 | | | | 06/02/16 | | | | 17.30 | | | | (7,226 | ) |
| | | Put USD/Call MXN | | | 342 | | | | 06/02/16 | | | | 17.30 | | | | (7,276 | ) |
| TOTAL (Premiums Received $56,076) | | $ | 2,429 | | | | | | | | | | | $ | (45,970 | ) |
For the fiscal year ended March 31, 2016, the Fund had the following currency written options activities:
OPTIONS ON CURRENCY CONTRACTS
| | | | | | | | |
| | | Notional
Amount
(000s) | | | Premiums
Received | |
Contracts Outstanding March 31, 2015 | | $ | — | | | $ | — | |
Contracts Written | | | 12,514 | | | | 137,943 | |
Contracts Expired | | | (10,085 | ) | | | (81,867 | ) |
Contracts Outstanding March 31, 2016 | | $ | 2,429 | | | $ | 56,076 | |
| | |
| 34 | | The accompanying notes are an integral part of these financial statements. |
GOLDMAN SACHS FIXED INCOME MACRO STRATEGIES FUND
|
| ADDITIONAL INVESTMENT INFORMATION (continued) |
WRITTEN INTEREST RATE SWAPTION CONTRACTS
| | | | | | | | | | | | | | | | | | |
| Counterparty | | Description | | Notional
Amount
(000s) | | | Expiration
Date | | | Exercise
Rate | | | Value | |
Bank of America Securities LLC | | Put - OTC - 2 year Swap for the obligation to pay a fixed rate of 1.000% versus the 3 month LIBOR maturing on May 05, 2024 | | CAD | 13,600 | | | | 05/24/16 | | | | 1.000 | % | | $ | (32,704 | ) |
Citibank NA | | Call - OTC - 1 year Swap for the obligation to pay a fixed rate of 3.200% versus the 3 month LIBOR maturing on August 08, 2016 | | $ | 2,700 | | | | 08/08/16 | | | | 3.200 | | | | — | |
Citigroup Global Markets, Inc. | | Call - OTC - 1 year Swap for the obligation to pay a fixed rate of 3.100% versus the 3 month LIBOR maturing on January 7, 2020 | | | 3,400 | | | | 08/12/16 | | | | 3.100 | | | | — | |
| | Call - OTC - 1 year Swap for the obligation to pay a fixed rate of 3.550% versus the 3 month LIBOR maturing on January 7, 2020 | | | 3,400 | | | | 09/06/16 | | | | 3.550 | | | | — | |
Deutsche Bank AG | | Put - OTC - 5 year Swap for the obligation to pay a fixed rate of 0.750% versus the 3 month LIBOR maturing on October 05, 2021 | | | 2,800 | | | | 10/03/16 | | | | 0.750 | | | | (6,613 | ) |
| | Put - OTC - 5 year Swap for the obligation to pay a fixed rate of 1.000% versus the 3 month LIBOR maturing on October 05, 2021 | | | 2,800 | | | | 10/03/16 | | | | 1.000 | | | | (13,965 | ) |
JPMorgan Securities, Inc. | | Call - OTC - 1 year Swap for the obligation to pay a fixed rate of 3.000% versus the 3 month LIBOR maturing on January 07, 2020 | | | 3,400 | | | | 08/19/16 | | | | 3.000 | | | | — | |
Morgan Stanley Capital Services, Inc. | | Call - OTC - 10 year Swap for the obligation to pay a fixed rate of 1.160% versus the 3 month LIBOR maturing on February 13, 2029 | | EUR | 3,400 | | | | 02/11/19 | | | | 1.160 | | | | (151,290 | ) |
| | Call - OTC - 10 year Swap for the obligation to pay a fixed rate of 1.230% versus the 3 month LIBOR maturing on February 07, 2029 | | | 3,400 | | | | 02/05/19 | | | | 1.230 | | | | (139,710 | ) |
| | Call - OTC - 2 year Swap for the obligation to pay a fixed rate of 1.660% versus the 3 month LIBOR maturing on October 29, 2020 | | $ | 18,500 | | | | 10/27/16 | | | | 1.660 | | | | (63,250 | ) |
| | Call - OTC - 2 year Swap for the obligation to pay a fixed rate of 1.690% versus the 3 month LIBOR maturing on October 29, 2020 | | | 14,000 | | | | 10/26/16 | | | | 1.690 | | | | (44,849 | ) |
| | Call - OTC - 2 year Swap for the obligation to pay a fixed rate of 1.690% versus the 3 month LIBOR maturing on October 29, 2020 | | | 14,000 | | | | 10/26/16 | | | | 1.690 | | | | (116,641 | ) |
| | Put - OTC - 1 year Swap for the obligation to pay a fixed rate of 1.400% versus the 3 month LIBOR maturing on August 19, 2020 | | | 26,800 | | | | 08/16/16 | | | | 1.400 | | | | (49,392 | ) |
| | | Put - OTC - 2 year Swap for the obligation to pay a fixed rate of 1.660% versus the 3 month LIBOR maturing on October 29, 2020 | | | 18,500 | | | | 10/27/16 | | | | 1.660 | | | | (147,336 | ) |
| TOTAL (Premiums Received $1,069,853) | | | | | | | | | | | $ | (765,750 | ) |
| | |
| The accompanying notes are an integral part of these financial statements. | | 35 |
GOLDMAN SACHS FIXED INCOME MACRO STRATEGIES FUND
Consolidated Schedule of Investments (continued)
March 31, 2016
|
| ADDITIONAL INVESTMENT INFORMATION (continued) |
For the fiscal year ended March 31, 2016, the Fund had the following written interest rate swaptions activities:
INTEREST RATE SWAPTION CONTRACTS
| | | | | | | | |
| | | Notional
Amount
(000s) | | | Premiums
Received | |
Contracts Outstanding March 31, 2015 | | $ | 133,700 | | | $ | 495,514 | |
Contracts Written | | | 261,120 | | | | 1,736,974 | |
Contracts Bought to Close | | | (209,720 | ) | | | (719,824 | ) |
Contracts Expired | | | (54,400 | ) | | | (442,811 | ) |
Contracts Outstanding March 31, 2016 | | $ | 130,700 | | | $ | 1,069,853 | |
WRITTEN OPTIONS ON FUTURES CONTRACTS
| | | | | | | | | | | | | | | | | | |
| Counterparty | | Description | | Contracts | | | Expiration
Date | | | Strike
Price | | | Value | |
Morgan Stanley Capital Services, Inc. | | Call - 4 Year Eurodollar Futures | | | 124 | | | | 05/13/16 | | | $ | 99.250 | | | $ | (21,421 | ) |
| | | Call - 4 Year Eurodollar Futures | | | 104 | | | | 06/13/16 | | | | 99.375 | | | | (3,900 | ) |
| TOTAL (Premiums Received $31,587) | | | 228 | | | | | | | | | | | $ | (25,321 | ) |
For the fiscal year ended March 31, 2016, the Fund had the following futures written options activities:
OPTIONS ON FUTURE CONTRACTS
| | | | | | | | |
| | | Contracts | | | Premiums
Received | |
Contracts Outstanding March 31, 2015 | | | 514 | | | $ | 43,819 | |
Contracts Written | | | 1,007 | | | | 87,093 | |
Contracts Bought to Close | | | (931 | ) | | | (82,255 | ) |
Contracts Expired | | | (362 | ) | | | (17,070 | ) |
Contracts Outstanding March 31, 2016 | | | 228 | | | $ | 31,587 | |
| | |
| 36 | | The accompanying notes are an integral part of these financial statements. |
GOLDMAN SACHS LONG SHORT CREDIT STRATEGIES FUND
Schedule of Investments
March 31, 2016
| | | | | | | | | | | | | | |
Principal
Amount | | | Interest
Rate | | | Maturity
Date | | | Value | |
| | | | | | | | | | | | | | |
| | Secured Debt Obligations – 27.1% | |
| | Bank Loans(a) – 10.0% | |
| | Building Materials – 1.3% | |
| Builders FirstSource, Inc. (B+/B3) | |
| $ | 969,577 | | | | 6.000 | % | | | 07/31/22 | | | $ | 961,501 | |
| Hanson Building Products Ltd. (NR/NR) | |
| | 1,444,788 | | | | 6.500 | | | | 03/13/22 | | | | 1,430,340 | |
| | | | | | | | | | | | | | |
| | | | | | | | | | | | | 2,391,841 | |
| | |
| | Chemicals – 0.3% | |
| Kraton Polymers LLC (NR/NR) | |
| | 528,000 | | | | 6.000 | | | | 01/06/22 | | | | 497,244 | |
| | |
| | Consumer Cyclical Services – 1.7% | |
| First Data Corp. (BB/B1) | |
| | 3,226,000 | | | | 3.932 | | | | 09/24/18 | | | | 3,219,290 | |
| | |
| | Healthcare – Services – 0.5% | |
| Concordia Healthcare Corp. (NR/NR) | |
| | 526,680 | | | | 5.250 | | | | 10/21/21 | | | | 511,801 | |
| Vizient, Inc. (NR/NR) | |
| | 460,000 | | | | 6.250 | | | | 02/13/23 | | | | 462,682 | |
| | | | | | | | | | | | | | |
| | | | | | | | | | | | | 974,483 | |
| | |
| | Media – Non Cable – 2.5% | |
| Cengage Learning Acquisitions, Inc. (NR/NR) | |
| | 3,339,731 | | | | 7.000 | | | | 03/31/20 | | | | 3,320,661 | |
| Univision Communications, Inc. (B+/B2) | |
| | 1,438,667 | | | | 4.000 | | | | 03/01/20 | | | | 1,422,928 | |
| | | | | | | | | | | | | | |
| | | | | | | | | | | | | 4,743,589 | |
| | |
| | Pharmaceuticals – 0.0% | |
| Valeant Pharmaceuticals International, Inc. (BB/Ba2) | |
| | 17,495 | | | | 3.750 | | | | 08/05/20 | | | | 13,376 | |
| | |
| | Property/Casualty Insurance – 0.4% | |
| Hyperion Insurance Group Ltd. (NR/NR) | |
| | 866,250 | | | | 5.500 | | | | 04/29/22 | | | | 824,020 | |
| | |
| | Retailers – 1.0% | |
| Belk, Inc. (NR/NR) | |
| | 666,000 | | | | 5.750 | | | | 12/12/22 | | | | 587,192 | |
| Kate Spade & Co. (NR/NR) | |
| | 1,099,502 | | | | 4.000 | | | | 04/10/21 | | | | 1,083,009 | |
| Michaels Stores, Inc. (BB-/Ba2) | |
| | 222,586 | | | | 4.000 | | | | 01/28/20 | | | | 222,546 | |
| | | | | | | | | | | | | | |
| | | | | | | | | | | | | 1,892,747 | |
| | |
| | Software – 1.0% | |
| First Data Corp. (BB/B1) | |
| | 637,000 | | | | 4.182 | | | | 07/08/22 | | | | 632,541 | |
| Western Digital Corp. (NR/NR) | |
| | 1,319,000 | | | | 6.250 | | | | 03/16/23 | | | | 1,302,104 | |
| | | | | | | | | | | | | | |
| | | | | | | | | | | | | 1,934,645 | |
| | |
| | Telecommunications – Wireless – 0.5% | |
| Fairpoint Communications, Inc. (B/B2) | |
| | 933,816 | | | | 7.500 | | | | 02/14/19 | | | | 924,086 | |
| | |
| | | | | | | | | | | | | | |
| | Secured Debt Obligations – (continued) | |
| | Transportation – 0.8% | |
| XPO Logistics, Inc. (NR/NR) | |
| $ | 1,472,310 | | | | 5.500 | % | | | 11/01/21 | | | $ | 1,475,991 | |
| | |
| | TOTAL BANK LOANS | | | $ | 18,891,312 | |
| | |
| | Other Secured Debt Obligations – 17.1% | |
| | Airlines(b)(c) – 0.4% | |
| Air Canada (BB/B2) | |
| $ | 766,000 | | | | 8.750 | % | | | 04/01/20 | | | $ | 811,960 | |
| | |
| | Automotive(b)(c)(d) – 1.9% | |
| Schaeffler Holding Finance BV (B/Ba3) | |
| | 3,589,000 | | | | 6.875 | | | | 08/15/18 | | | | 3,692,184 | |
| | |
| | Building Materials(b)(c) – 0.7% | |
| HD Supply, Inc. (BB/Ba3) | |
| | 1,332,000 | | | | 5.250 | | | | 12/15/21 | | | | 1,396,935 | |
| | |
| | Consumer Cyclical Services(b) – 2.4% | |
| APX Group, Inc. (B/Ba3) | |
| | 2,969,000 | | | | 6.375 | | | | 12/01/19 | | | | 2,954,155 | |
| First Data Corp. (BB/B1)(c) | |
| | 1,500,000 | | | | 5.000 | | | | 01/15/24 | | | | 1,500,000 | |
| | | | | | | | | | | | | | |
| | | | | | | | | | | | | 4,454,155 | |
| | |
| | Electric(b)(c) – 0.9% | |
| Calpine Corp. (BB/Ba2) | |
| | 1,553,000 | | | | 6.000 | | | | 01/15/22 | | | | 1,628,709 | |
| | |
| | Gaming(b)(c) – 0.5% | |
| International Game Technology PLC (BB+/Ba2) | |
| | 874,000 | | | | 6.250 | | | | 02/15/22 | | | | 889,295 | |
| | |
| | Health Care – Services – 3.0% | |
| HCA, Inc. (BBB-/Ba1) | |
| | 2,202,000 | | | | 6.500 | | | | 02/15/20 | | | | 2,416,695 | |
| Tenet Healthcare Corp. (BB-/Ba2) | |
| | 624,000 | | | | 4.134 | (b)(c)(e) | | | 06/15/20 | | | | 619,320 | |
| | 537,000 | | | | 6.000 | | | | 10/01/20 | | | | 573,248 | |
| Universal Health Services, Inc. (BBB-/Ba1)(b)(c) | |
| | 1,973,000 | | | | 4.750 | | | | 08/01/22 | | | | 2,007,527 | |
| | | | | | | | | | | | | | |
| | | | | | | | | | | | | 5,616,790 | |
| | |
| | Media – Cable(b)(c) – 4.9% | |
| Altice Financing SA (BB-/B1) | |
| | 767,000 | | | | 6.500 | | | | 01/15/22 | | | | 774,670 | |
| | 3,499,000 | | | | 6.625 | | | | 02/15/23 | | | | 3,499,000 | |
| Altice Finco SA (B-/B3) | |
| | 710,000 | | | | 9.875 | | | | 12/15/20 | | | | 761,475 | |
| CCO Safari II LLC (BBB-/Ba1) | |
| | 1,287,000 | | | | 4.464 | | | | 07/23/22 | | | | 1,344,661 | |
| Numericable – SFR SA (B+/B1) | |
| | 1,393,000 | | | | 4.875 | | | | 05/15/19 | | | | 1,386,035 | |
| | 1,542,000 | | | | 6.000 | | | | 05/15/22 | | | | 1,503,450 | |
| | | | | | | | | | | | | | |
| | | | | | | | | | | | | 9,269,291 | |
| | |
| | Media – Non Cable(b)(c) – 0.6% | |
| Univision Communications, Inc. (B+/B2) | |
| | 1,156,000 | | | | 6.750 | | | | 09/15/22 | | | | 1,222,470 | |
| | |
| | |
| The accompanying notes are an integral part of these financial statements. | | 37 |
GOLDMAN SACHS LONG SHORT CREDIT STRATEGIES FUND
Schedule of Investments (continued)
March 31, 2016
| | | | | | | | | | | | | | |
Principal
Amount | | | Interest
Rate | | | Maturity
Date | | | Value | |
| | Secured Debt Obligations – (continued) | |
| | | | | | | | | | | | | | |
| | Software(c) – 1.0% | |
| Western Digital Corp. (BBB-/Ba1) | |
| $ | 1,810,000 | | | | 7.375 | % | | | 04/01/23 | | | $ | 1,846,200 | |
| | |
| | Transportation(b)(c) – 0.8% | |
| Jack Cooper Holdings Corp. (CCC+/B3) | |
| | 2,103,000 | | | | 9.250 | | | | 06/01/20 | | | | 1,498,387 | |
| | | | | | | | | | | | | | |
| | | | | | | | | | | | | 1,498,387 | |
| | |
| TOTAL OTHER SECURED DEBT
OBLIGATIONS |
| | $ | 32,326,376 | |
| | |
| | TOTAL SECURED DEBT OBLIGATIONS | |
| | (Cost $51,566,676) | | | $ | 51,217,688 | |
| | |
| | | | | | | | | | | | | | |
| | Unsecured Debt Obligations – 54.0% | |
| | Aerospace & Defense(c) – 3.0% | |
| Bombardier, Inc. (B/B2) | |
| $ | 3,214,000 | | | | 5.500 | % | | | 09/15/18 | | | $ | 2,956,880 | |
| | 3,045,000 | | | | 7.750 | | | | 03/15/20 | | | | 2,633,925 | |
| | | | | | | | | | | | | | |
| | | | | | | | | | | | | 5,590,805 | |
| | |
| | Airlines(c) – 0.7% | |
| Air Canada (B/B3) | |
| | 1,323,000 | | | | 7.750 | | | | 04/15/21 | | | | 1,326,308 | |
| | |
| | Automotive – 5.4% | |
| American Axle & Manufacturing, Inc. (BB-/B1)(b) | |
| | 252,000 | | | | 6.250 | | | | 03/15/21 | | | | 260,190 | |
| Dana Holding Corp. (BB+/B1)(b) | |
| | 184,000 | | | | 6.750 | | | | 02/15/21 | | | | 189,060 | |
| | 2,971,000 | | | | 5.375 | | | | 09/15/21 | | | | 2,956,145 | |
| Fiat Chrysler Automobiles NV (BB/B2) | |
| | 1,921,000 | | | | 5.250 | | | | 04/15/23 | | | | 1,911,395 | |
| Lear Corp. (BBB-/Ba1)(b) | |
| | 1,071,000 | | | | 4.750 | | | | 01/15/23 | | | | 1,100,452 | |
| | 2,189,000 | | | | 5.250 | | | | 01/15/25 | | | | 2,276,560 | |
| The Goodyear Tire & Rubber Co. (BB/Ba3)(b) | |
| | 1,418,000 | | | | 5.125 | | | | 11/15/23 | | | | 1,449,905 | |
| | | | | | | | | | | | | | |
| | | | | | | | | | | | | 10,143,707 | |
| | |
| | Brokerage(b) – 1.2% | |
| E*Trade Financial Corp. (BBB-/Baa3) | |
| | 778,000 | | | | 5.375 | | | | 11/15/22 | | | | 818,845 | |
| | 1,441,000 | | | | 4.625 | | | | 09/15/23 | | | | 1,437,398 | |
| | | | | | | | | | | | | | |
| | | | | | | | | | | | | 2,256,243 | |
| | |
| | Building Materials(b)(c) – 0.9% | |
| Taylor Morrison Communities, Inc./Monarch Communities, Inc.
(BB-/B2) |
|
| | 1,771,000 | | | | 5.250 | | | | 04/15/21 | | | | 1,740,008 | |
| | |
| | Captive Auto – 0.7% | |
| General Motors Financial Co., Inc. (BBB-/Ba1) | |
| | 1,258,000 | | | | 4.375 | | | | 09/25/21 | | | | 1,299,348 | |
| | |
| | Chemicals(b) – 2.2% | |
| Ashland, Inc. (BB/Ba1) | |
| | 471,000 | | | | 4.750 | | | | 08/15/22 | | | | 476,887 | |
| | |
| | | | | | | | | | | | | | |
| | Unsecured Debt Obligations – (continued) | |
| | Chemicals(b) – (continued) | |
| Eagle Spinco, Inc. (BB/Ba3) | |
| $ | 1,354,000 | | | | 4.625 | % | | | 02/15/21 | | | $ | 1,313,380 | |
| Huntsman International LLC (B/B1) | |
| | 415,000 | | | | 4.875 | | | | 11/15/20 | | | | 410,850 | |
| INEOS Group Holdings SA (B-/B3)(c) | |
| | 1,287,000 | | | | 6.125 | | | | 08/15/18 | | | | 1,306,305 | |
| Trinseo Materials Operating SCA/Trinseo Materials Finance, Inc.
(B-/B3)(c) |
|
| | 550,000 | | | | 6.750 | | | | 05/01/22 | | | | 563,750 | |
| | | | | | | | | | | | | | |
| | | | | | | | | | | | | 4,071,172 | |
| | |
| | Consumer Cyclical Services(b)(c) – 0.6% | |
| Avis Budget Car Rental LLC/Avis Budget Finance, Inc. (B+/B1) | |
| | 460,000 | | | | 6.375 | | | | 04/01/24 | | | | 461,150 | |
| First Data Corp. (B/Caa1) | |
| | 711,000 | | | | 7.000 | | | | 12/01/23 | | | | 716,333 | |
| | | | | | | | | | | | | | |
| | | | | | | | | | | | | 1,177,483 | |
| | |
| | Consumer Products(b) – 0.3% | |
| Sally Holdings LLC/Sally Capital, Inc. (BB+/Ba2) | |
| | 460,000 | | | | 5.750 | | | | 06/01/22 | | | | 483,000 | |
| | |
| | Electric(b) – 0.3% | |
| Calpine Corp. (B/B2) | |
| | 583,000 | | | | 5.375 | | | | 01/15/23 | | | | 561,866 | |
| | |
| | Energy – Exploration & Production(b) – 1.8% | |
| CrownRock LP/CrownRock Finance, Inc. (B+/Caa1)(c) | |
| | 853,000 | | | | 7.125 | | | | 04/15/21 | | | | 810,350 | |
| Endeavor Energy Resources LP/EER Finance, Inc. (CCC+/Ca)(c) | |
| | 1,618,000 | | | | 7.000 | | | | 08/15/21 | | | | 1,512,830 | |
| Memorial Resource Development Corp. (B/Caa1) | |
| | 1,306,000 | | | | 5.875 | | | | 07/01/22 | | | | 1,106,835 | |
| | | | | | | | | | | | | | |
| | | | | | | | | | | | | 3,430,015 | |
| | |
| | Entertainment(b) – 1.0% | |
| AMC Entertainment, Inc. (B/B2) | |
| | 515,000 | | | | 5.875 | | | | 02/15/22 | | | | 529,163 | |
| Cinemark USA, Inc. (BB/B2) | |
| | 1,321,000 | | | | 5.125 | | | | 12/15/22 | | | | 1,357,327 | |
| | | | | | | | | | | | | | |
| | | | | | | | | | | | | 1,886,490 | |
| | |
| | Finance – 6.1% | |
| Ally Financial, Inc. (BB+/Ba3) | |
| | 3,324,000 | | | | 4.750 | | | | 09/10/18 | | | | 3,382,170 | |
| Ally Financial, Inc. (BB-/B1) | |
| | 530,000 | | | | 8.000 | | | | 12/31/18 | | | | 575,050 | |
| CIT Group, Inc. (BB+/B1)(c) | |
| | 1,628,000 | | | | 5.500 | | | | 02/15/19 | | | | 1,684,980 | |
| GMAC Capital Trust I (B/B2)(b)(e) | |
| | 42,588 | | | | 6.402 | | | | 02/15/40 | | | | 1,043,832 | |
| Navient Corp. (BB-/Ba3) | |
| | 1,965,000 | | | | 8.450 | | | | 06/15/18 | | | | 2,102,550 | |
| Springleaf Finance Corp. (B/B3) | |
| | 2,872,000 | | | | 5.250 | | | | 12/15/19 | | | | 2,742,760 | |
| | | | | | | | | | | | | | |
| | | | | | | | | | | | | 11,531,342 | |
| | |
| | |
| 38 | | The accompanying notes are an integral part of these financial statements. |
GOLDMAN SACHS LONG SHORT CREDIT STRATEGIES FUND
| | | | | | | | | | | | | | |
Principal
Amount | | | Interest
Rate | | | Maturity
Date | | | Value | |
| | | | | | | | | | | | | | |
| | Unsecured Debt Obligations – (continued) | |
| | Food & Beverage(b)(c) – 1.2% | |
| Dean Foods Co. (BB-/B2) | |
| $ | 2,146,000 | | | | 6.500 | % | | | 03/15/23 | | | $ | 2,202,333 | |
| | |
| | Food & Drug Retailers(b) – 2.4% | |
| Rite Aid Corp. (CCC+/B3) | |
| | 3,739,000 | | | | 6.750 | | | | 06/15/21 | | | | 3,944,645 | |
| | 573,000 | | | | 6.125 | (c) | | | 04/01/23 | | | | 608,812 | |
| | | | | | | | | | | | | | |
| | | | | | | | | | | | | 4,553,457 | |
| | |
| | Gaming(b) – 1.8% | |
| GLP Capital LP/GLP Financing II, Inc. (BB+/Ba1) | |
| | 3,284,000 | | | | 4.875 | | | | 11/01/20 | | | | 3,415,360 | |
| | |
| | Health Care – Medical Products(b) – 0.2% | |
| Alere, Inc. (CCC+/Caa1) | |
| | 376,000 | | | | 6.500 | | | | 06/15/20 | | | | 382,580 | |
| | |
| | Health Care – Services – 3.7% | |
| Acadia Healthcare Co., Inc. (B/B3)(b)(c) | |
| | 938,000 | | | | 6.500 | | | | 03/01/24 | | | | 975,520 | |
| DaVita HealthCare Partners, Inc. (B+/B1)(b) | |
| | 2,373,000 | | | | 5.750 | | | | 08/15/22 | | | | 2,479,785 | |
| Fresenius Medical Care US Finance II, Inc. (BB+/Ba2)(b)(c) | |
| | 1,363,000 | | | | 4.125 | | | | 10/15/20 | | | | 1,393,667 | |
| Fresenius Medical Care US Finance, Inc. (BB+/Ba2)(c) | |
| | 232,000 | | | | 5.750 | | | | 02/15/21 | | | | 251,140 | |
| Kindred Healthcare, Inc. (B-/B2) | |
| | 338,000 | | | | 8.000 | | | | 01/15/20 | | | | 335,465 | |
| Lifepoint Hospitals, Inc. (BB-/Ba2)(b) | |
| | 1,032,000 | | | | 5.500 | | | | 12/01/21 | | | | 1,078,440 | |
| Tenet Healthcare Corp. (CCC+/B3)(b) | |
| | 502,000 | | | | 8.000 | | | | 08/01/20 | | | | 517,060 | |
| | | | | | | | | | | | | | |
| | | | | | | | | | | | | 7,031,077 | |
| | |
| | Media – Cable(b)(c) – 2.2% | |
| Altice Luxembourg SA (B/B3) | |
| | 818,000 | | | | 7.750 | | | | 05/15/22 | | | | 800,617 | |
| Cequel Communications Holdings I LLC/Cequel Capital Corp.
(B-/Caa1) |
|
| | 3,346,000 | | | | 6.375 | | | | 09/15/20 | | | | 3,329,270 | |
| | | | | | | | | | | | | | |
| | | | | | | | | | | | | 4,129,887 | |
| | |
| | Media – Non Cable(b) – 5.8% | |
| AMC Networks, Inc. (BB/Ba3) | |
| | 401,000 | | | | 5.000 | | | | 04/01/24 | | | | 402,002 | |
| Gray Television, Inc. (B/Caa1) | |
| | 1,811,000 | | | | 7.500 | | | | 10/01/20 | | | | 1,910,605 | |
| Lamar Media Corp. (BB-/Ba1) | |
| | 2,706,000 | | | | 5.375 | | | | 01/15/24 | | | | 2,814,240 | |
| Nexstar Broadcasting, Inc. (BB-/B3) | |
| | 2,484,000 | | | | 6.875 | | | | 11/15/20 | | | | 2,564,730 | |
| Sinclair Television Group, Inc. (B+/B1) | |
| | 2,441,000 | | | | 5.375 | | | | 04/01/21 | | | | 2,514,230 | |
| Univision Communications, Inc. (CCC+/Caa1)(c) | |
| | 702,000 | | | | 8.500 | | | | 05/15/21 | | | | 716,040 | |
| | | | | | | | | | | | | | |
| | | | | | | | | | | | | 10,921,847 | |
| | |
| | | | | | | | | | | | | | |
| | Unsecured Debt Obligations – (continued) | |
| | Oil Field Services – 0.5% | |
| Transocean, Inc. (BB+/B2) | |
| $ | 715,000 | | | | 5.800 | % | | | 12/15/16 | | | $ | 709,638 | |
| Weatherford International LLC (BB+/Ba3) | |
| | 325,000 | | | | 6.350 | | | | 06/15/17 | | | | 321,750 | |
| | | | | | | | | | | | | | |
| | | | | | | | | | | | | 1,031,388 | |
| | |
| | Packaging – 4.2% | |
| Ball Corp. (BB+/Ba1) | |
| | 1,694,000 | | | | 5.000 | | | | 03/15/22 | | | | 1,774,465 | |
| | 468,000 | | | | 4.000 | | | | 11/15/23 | | | | 462,150 | |
| Beverage Packaging Holdings Luxembourg II SA/Beverage
Packaging Holdings II Is (CCC+/Caa2)(b)(c) |
|
| | 1,854,000 | | | | 5.625 | | | | 12/15/16 | | | | 1,849,365 | |
| | 1,829,000 | | | | 6.000 | | | | 06/15/17 | | | | 1,815,282 | |
| Graphic Packaging International, Inc. (BB+/Ba2)(b) | |
| | 1,428,000 | | | | 4.750 | | | | 04/15/21 | | | | 1,474,410 | |
| SIG Combibloc Holdings SCA (B-/Caa1)(b) | |
| EUR | 535,000 | | | | 7.750 | | | | 02/15/23 | | | | 648,962 | |
| | | | | | | | | | | | | | |
| | | | | | | | | | | | | 8,024,634 | |
| | |
| | Pharmaceuticals(b) – 2.0% | |
| Concordia Healthcare Corp. (CCC+/Caa2)(c) | |
| $ | 728,000 | | | | 9.500 | | | | 10/21/22 | | | | 702,520 | |
| Endo Finance LLC (B/B1)(c) | |
| | 863,000 | | | | 5.750 | | | | 01/15/22 | | | | 817,693 | |
| Endo Finance LLC & Endo Finco, Inc. (B/B1)(c) | |
| | 1,538,000 | | | | 5.875 | | | | 01/15/23 | | | | 1,453,410 | |
| Grifols Worldwide Operations Ltd. (B+/B1) | |
| | 836,000 | | | | 5.250 | | | | 04/01/22 | | | | 863,170 | |
| | | | | | | | | | | | | | |
| | | | | | | | | | | | | 3,836,793 | |
| | |
| | Software(c) – 0.6% | |
| Western Digital Corp. (NR/NR) | |
| | 1,200,000 | | | | 10.500 | | | | 04/01/24 | | | | 1,203,000 | |
| | |
| | Telecommunications – Wirelines – 5.2% | |
| CenturyLink, Inc. (BB/Ba3)(b) | |
| | 1,304,000 | | | | 7.500 | | | | 04/01/24 | | | | 1,309,109 | |
| Frontier Communications Corp. (BB-/Ba3) | |
| | 2,380,000 | | | | 8.875 | (b)(c) | | | 09/15/20 | | | | 2,475,200 | |
| | 614,000 | | | | 8.750 | | | | 04/15/22 | | | | 597,115 | |
| Windstream Corp. (B+/B2)(b) | |
| | 6,417,000 | | | | 7.750 | | | | 10/15/20 | | | | 5,502,578 | |
| | | | | | | | | | | | | | |
| | | | | | | | | | | | | 9,884,002 | |
| | |
| | TOTAL UNSECURED DEBT OBLIGATIONS | |
| | (Cost $102,659,670) | | | $ | 102,114,145 | |
| | |
| | | | | | | | | | | | | | |
| | U.S. Treasury Obligation(f) – 1.1% | |
| United States Treasury Bill | |
| $ | 2,050,000 | | | | 0.000 | % | | | 06/02/16 | | | $ | 2,049,418 | |
| | (Cost $2,049,073) | | | | | |
| | |
| | |
| The accompanying notes are an integral part of these financial statements. | | 39 |
GOLDMAN SACHS LONG SHORT CREDIT STRATEGIES FUND
Schedule of Investments (continued)
March 31, 2016
| | | | | | | | |
Shares | | | Description | | Value | |
| | | | | | | | |
| | Common Stocks(g)(h)(i) – 0.0% | |
| | Oil, Gas & Consumable Fuels – 0.0% | |
| | 1,815,521 | | | Lone Pine Resources CDA Ltd. PI | | $ | 2 | |
| | | | (Cost $1,418,162) | | | | |
| | |
| | TOTAL COMMON STOCKS | |
| | (Cost $1,418,162) | | $ | 2 | |
| | |
| | | | | | |
| Shares | | Rate | | Value | |
| | | | | | |
| Preferred Stock(g)(h)(i) – 0.6% | |
| Oil, Gas & Consumable Fuels – 0.6% | |
Lone Pine Resources CDA Ltd. PI | |
| 1,194,849 | | 10.375% | | $ | 1,165,336 | |
| (Cost $1,528,270) | |
| |
| | | | | | | | |
| Units | | Expiration
Date | | | Value | |
| | | | | | | | |
| Warrant(h) – 0.0% | |
Everyware Global, Inc. | |
| 18,935 | | | 7/30/21 | | | $ | — | |
| (Cost $—) | |
| |
| | | | | | |
| Shares | | Distribution
Rate | | Value | |
| | | | | | |
| Investment Company(e)(j) – 16.3% | |
Goldman Sachs Financial Square Government Fund – FST Institutional Shares | |
| 30,744,104 | | 0.250% | | $ | 30,744,104 | |
| (Cost $30,744,104) | |
| |
| TOTAL INVESTMENTS – 99.1% | |
| (Cost $189,965,955) | | $ | 187,290,693 | |
| |
OTHER ASSETS IN EXCESS
OF LIABILITIES – 0.9% | | | 1,698,469 | |
| |
| NET ASSETS – 100.0% | | $ | 188,989,162 | |
| |
| | |
| The percentage shown for each investment category reflects the value of investments in that category as a percentage of net assets. |
(a) | | Bank Loans often require prepayments from excess cash flows or permit the borrower to repay at its election. The degree to which borrowers repay, whether as a contractual requirement or at their election, cannot be predicted with accuracy. As a result, the actual remaining maturity may be substantially less than the stated maturities shown. The stated interest rate represents the weighted average interest rate of all contracts within the bank loan facility on March 31, 2016. Bank Loans typically have rates of interest which are predetermined either daily, monthly, quarterly or semi-annually by reference to a base lending rate, plus a premium. These base lending rates are primarily the London-Interbank Offered Rate (“LIBOR”), and secondarily the prime rate offered by one or more major United States banks (the “Prime Rate”) and the certificate of deposit (“CD”) rate or other base lending rates used by commercial lenders. |
| | |
(b) | | Security with “Call” features with resetting interest rates. Maturity dates disclosed are the final maturity dates. |
(c) | | Exempt from registration under Rule 144A of the Securities Act of 1933. Such securities may be deemed liquid by the investment adviser and may be resold, normally to qualified institutional buyers in transactions exempt from registration. Total market value of Rule 144A securities amounts to $62,688,966, which represents approximately 33.2% of net assets as of March 31, 2016. |
(d) | | Pay-in-kind securities. |
(e) | | Variable rate security. Interest rate or distribution rate disclosed is that which is in effect on March 31, 2016. |
(f) | | Issued with a zero coupon. Income is recognized through the accretion of discount. |
(g) | | The Fund holds 1,505,185 shares of voting securities in an entity with zero cost and zero value. |
(h) | | Security is currently in default and/or non-income producing. |
(i) | | Restricted securities are not registered under the Securities Act of 1933 and are subject to legal restrictions on resale. These securities generally may be resold in transactions exempt from registration or to the public if the securities are subsequently registered and the registration statement is effective. Disposal of these securities may involve time consuming negotiations and prompt sale at an acceptable price may be difficult. Such securities were acquired between April 1, 2013 and February 5, 2016. |
(j) | | Represents an affiliated fund. |
Security ratings disclosed, if any, are obtained from Standard & Poor’s/Moody’s Investors Service and are unaudited. A description of the ratings is available in the Fund’s Statement of Additional Information.
| | |
|
Currency Abbreviations: |
EUR | | —Euro |
USD | | —U.S. Dollar |
| | |
Investment Abbreviations: |
GMAC | | —General Motors Acceptance Corporation |
LIBOR | | —London Interbank Offered Rate |
LLC | | —Limited Liability Company |
LP | | —Limited Partnership |
PI | | —Private Investment |
PLC | | —Public Limited Company |
|
| | |
| 40 | | The accompanying notes are an integral part of these financial statements. |
GOLDMAN SACHS LONG SHORT CREDIT STRATEGIES FUND
|
| ADDITIONAL INVESTMENT INFORMATION |
FORWARD FOREIGN CURRENCY EXCHANGE CONTRACTS — At March 31, 2016, the Fund had the following forward foreign currency exchange contracts:
FORWARD FOREIGN CURRENCY EXCHANGE CONTRACTS WITH UNREALIZED LOSS
| | | | | | | | | | | | | | | | | | | | | | | | |
| Counterparty | | Currency
Purchased | | | Currency
Sold | | | Current
Value | | | Settlement
Date | | | Unrealized
Gain | |
Citibank NA | | USD | | | 1,112,077 | | | EUR | | | 988,000 | | | $ | 1,130,423 | | | | 09/12/16 | | | $ | (18,346 | ) |
SWAP CONTRACTS — At March 31, 2016, the Fund had the following swap contracts:
CENTRALLY CLEARED INTEREST RATE SWAP CONTRACTS
| | | | | | | | | | | | | | | | |
| | | Rates Exchanged | | Market Value | |
Notional
Amount
(000s)(a) | | | Termination
Date | | Payments
Received | | Payments
Made | | Upfront
Payments
Made (Received) | | | Unrealized
Gain (Loss) | |
| $ | 10,681 | | | 06/15/19 | | 3 month LIBOR | | 1.500% | | $ | 22,916 | | | $ | (178,607 | ) |
| | 11,005 | | | 06/15/21 | | 3 month LIBOR | | 2.000 | | | (100,862 | ) | | | (308,135 | ) |
| | 1,120 | | | 09/21/21 | | 2.000% | | 3 month LIBOR | | | 30,364 | | | | 7,718 | |
| | 3,580 | | | 06/15/23 | | 3 month LIBOR | | 2.000 | | | 615 | | | | (131,565 | ) |
| | | | | | | | | | | | | | | | |
| | TOTAL | | $ | (46,967 | ) | | $ | (610,589 | ) |
| | | | | | | | | | | | | | | | |
| | (a) | | Represents forward starting interest rate swaps whose effective dates of commencement of accruals and cash flows occur subsequent to March 31, 2016. |
| | |
| The accompanying notes are an integral part of these financial statements. | | 41 |
GOLDMAN SACHS LONG SHORT CREDIT STRATEGIES FUND
Schedule of Investments (continued)
March 31, 2016
|
| ADDITIONAL INVESTMENT INFORMATION (continued) |
CENTRALLY CLEARED CREDIT DEFAULT SWAP CONTRACT
| | | | | | | | | | | | | | | | | | |
| | | Market Value | |
| Referenced Obligation | | Notional
Amount
(000s) | | Rates Received
(Paid) | | | Termination
Date | | Credit
Spread at
March 31,
2016(b) | | Upfront
Payments
Made (Received) | | | Unrealized
Gain (Loss) | |
Protection Purchased: | | | | | | | | | | |
CDX North America High Yield Index 26 | | $50,000 | | | (5.000 | )% | | 06/20/21 | | 4.38% | | $ | (876,355 | ) | | $ | (555,123 | ) |
| | (b) | | Credit spread on the Referenced Obligation, together with the term of the swap contract, are indicators of payment/performance risk. The likelihood of a credit event occurring which would require a fund to make a payment or otherwise be required to perform under the swap contract is generally greater as the credit spread and the term of the swap contract increase. |
| | |
| 42 | | The accompanying notes are an integral part of these financial statements. |
GOLDMAN SACHS FIXED INCOME ALTERNATIVES STRATEGIES FUNDS
Schedule of Investments
March 31, 2016
|
| ADDITIONAL INVESTMENT INFORMATION |
JOINT REPURCHASE AGREEMENT ACCOUNT II — At March 31, 2016, the Fixed Income Macro Strategies Fund had undivided interests in the Joint Repurchase Agreement Account II, with a maturity date of April 1, 2016, as follows:
| | | | |
| Principal Amount | | Maturity Value | | Collateral Allocation Value |
| $6,200,000 | | $6,200,052 | | $6,324,000 |
REPURCHASE AGREEMENTS — At March 31, 2016, the Principal Amounts of the Fund’s interest in the Joint Repurchase Agreement Account II were as follows:
| | | | | | | | |
| Counterparty | | Interest Rate | | | Principal Amount | |
BNP Paribas Securities Co. | | | 0.310 | % | | $ | 1,530,584 | |
Citigroup Global Markets, Inc. | | | 0.330 | | | | 1,218,799 | |
Merrill Lynch & Co., Inc. | | | 0.300 | | | | 1,154,741 | |
Merrill Lynch & Co., Inc. | | | 0.280 | | | | 2,295,876 | |
| TOTAL | | | | | | $ | 6,200,000 | |
At March 31, 2016, the Joint Repurchase Agreement Account II was fully collateralized by:
| | | | | | | | |
| Issuer | | Interest Rates | | | Maturity Dates | |
Federal Farm Credit Banks | | | 3.050% to 3.340 | % | | | 10/18/27 to 02/01/33 | |
Federal Home Loan Banks | | | 2.750 to 5.500 | | | | 06/08/18 to 07/15/36 | |
Federal Home Loan Mortgage Corp. | | | 3.000 to 6.000 | | | | 04/01/22 to 10/01/45 | |
Federal National Mortgage Association | | | 3.500 to 6.000 | | | | 12/01/17 to 09/01/44 | |
Government National Mortgage Association | | | 3.500 to 10.000 | | | | 04/05/18 to 09/20/45 | |
United States Treasury Note | | | 0.625 to 2.875 | | | | 03/31/18 to 11/15/25 | |
United States Treasury Stripped Securities | | | 0.000 | | | | 02/15/31 to 02/15/45 | |
| | |
| The accompanying notes are an integral part of these financial statements. | | 43 |
GOLDMAN SACHS FIXED INCOME ALTERNATIVES STRATEGIES FUNDS
Statements of Assets and Liabilities
March 31, 2016
| | | | | | | | | | | | |
| | | | | Fixed Income
Macro Strategies
Fund(a) | | | Long Short
Credit Strategies
Fund | |
| | Assets: | | | | | | | | | | |
| | Investments of unaffiliated issuers, at value (cost $55,258,429 and $159,221,851, respectively) | | $ | 55,191,361 | | | $ | 156,546,589 | |
| | Investments of affiliated issuers, at value (cost $12,172,945 and $30,744,104, respectively) | | | 12,172,945 | | | | 30,744,104 | |
| | Cash | | | 105,595 | | | | 1,966,244 | |
| | Foreign currencies, at value (cost $49,589 and $667,040, respectively) | | | 51,492 | | | | 669,484 | |
| | Unrealized gain on swap contracts | | | 1,241,989 | | | | — | |
| | Unrealized gain on forward foreign currency exchange contracts | | | 2,657,027 | | | | — | |
| | Unrealized gain on non-deliverable bond forwards contracts | | | 139,028 | | | | — | |
| | Variation margin on certain derivative contracts | | | 168,805 | | | | — | |
| | Receivables: | | | | | | | | | | |
| | Collateral on certain derivative contracts(b) | | | 4,810,700 | | | | 2,567,132 | |
| | Investments sold | | | 829,192 | | | | 1,015,908 | |
| | Interest and dividends | | | 333,456 | | | | 2,105,686 | |
| | Reimbursement from investment adviser | | | 80,703 | | | | 39,559 | |
| | Upfront payments made on swap contracts | | | 11,269 | | | | — | |
| | Fund shares sold | | | 3,961 | | | | 202,924 | |
| | Investments sold on an extended-settlement basis | | | — | | | | 5,071,159 | |
| | Other assets | | | 9,078 | | | | 155,375 | |
| | Total assets | | | 77,806,601 | | | | 201,084,164 | |
| | | | | | | | | | | | |
| | Liabilities: | | | |
| | Unrealized loss on swap contracts | | | 1,579,511 | | | | — | |
| | Unrealized loss on forward foreign currency exchange contracts | | | 2,458,499 | | | | 18,346 | |
| | Variation margin on certain derivative contracts | | | 9,258 | | | | 152,429 | |
| | Written option contracts, at value (premium received $1,157,516 and $0 respectively) | | | 837,041 | | | | — | |
| | Payables: | | | | | | | | | | |
| | Investments purchased on an extended-settlement basis | | | 3,046,563 | | | | 10,452,433 | |
| | Investments purchased | | | 591,159 | | | | 801,803 | |
| | Due to broker — upfront payment | | | 440,752 | | | | — | |
| | Collateral on certain derivative contracts | | | 260,000 | | | | — | |
| | Management fees | | | 76,252 | | | | 154,624 | |
| | Upfront payments received on swap contracts | | | 19,805 | | | | — | |
| | Fund shares redeemed | | | 2,747 | | | | 129,013 | |
| | Distribution and Service fees and Transfer Agency fees | | | 2,666 | | | | 10,492 | |
| | Distributions payable | | | — | | | | 81,058 | |
| | Accrued expenses | | | 302,160 | | | | 294,804 | |
| | Total liabilities | | | 9,626,413 | | | | 12,095,002 | |
| | | | | | | | | | | | |
| | Net Assets: | | | |
| | Paid-in capital | | | 76,983,983 | | | | 209,252,786 | |
| | Undistributed (distributions in excess of) net investment income | | | (1,044,322 | ) | | | 1,977,995 | |
| | Accumulated net realized loss | | | (8,382,386 | ) | | | (18,384,876 | ) |
| | Net unrealized gain (loss) | | | 622,913 | | | | (3,856,743 | ) |
| | | NET ASSETS | | $ | 68,180,188 | | | $ | 188,989,162 | |
| | | Net Assets: | | | | | | | | | | |
| | | Class A | | $ | 311,958 | | | $ | 8,358,484 | |
| | | Class C | | | 136,257 | | | | 1,772,584 | |
| | | Institutional | | | 66,006,011 | | | | 173,757,941 | |
| | | Class IR | | | 1,702,501 | | | | 5,067,203 | |
| | | Class R | | | 23,461 | | | | 32,950 | |
| | | Total Net Assets | | $ | 68,180,188 | | | $ | 188,989,162 | |
| | | Shares Outstanding $0.001 par value (unlimited number of shares authorized): | | | | | | | | | | |
| | | Class A | | | 35,294 | | | | 882,325 | |
| | | Class C | | | 15,431 | | | | 187,198 | |
| | | Institutional | | | 7,446,336 | | | | 18,359,015 | |
| | | Class IR | | | 192,538 | | | | 535,100 | |
| | | Class R | | | 2,655 | | | | 3,480 | |
| | | Net asset value, offering and redemption price per share:(c) | | | | | | | | | | |
| | | Class A | | | $8.84 | | | | $9.47 | |
| | | Class C | | | 8.83 | | | | 9.47 | |
| | | Institutional | | | 8.86 | | | | 9.46 | |
| | | Class IR | | | 8.84 | | | | 9.47 | |
| | | Class R | | | 8.84 | | | | 9.47 | |
| | (a) | | Statement of Assets and Liabilities for the Fund is consolidated and includes the balances of a wholly-owned subsidiary, Cayman Commodity — FIMS Ltd. Accordingly, all interfund balances and transactions have been eliminated. |
| | (b) | | Includes amounts segregated for initial margin and/or collateral on futures transactions and swaps transactions of $231,723 and $4,578,977, respectively for Fixed Income Macro Strategies Fund and $0 and $2,567,132, respectively for Long Short Credit Strategies Fund. |
| | (c) | | Maximum public offering price for Class A Shares of the Fixed Income Macro Strategies and the Long Short Credit Strategies Funds is $9.18 and $9.84, respectively. At redemption, Class C Shares may be subject to a contingent deferred sales charge, assessed on the amount equal to the lesser of the current net asset value or the original purchase price of the shares. |
| | |
| 44 | | The accompanying notes are an integral part of these financial statements. |
GOLDMAN SACHS FIXED INCOME ALTERNATIVES STRATEGIES FUNDS
Statements of Operations
For the Fiscal Year Ended March 31, 2016
| | | | | | | | | | |
| | | | | Fixed Income
Macro Strategies
Fund(a) | | | Long Short
Credit Strategies
Fund | |
| | Investment income: | | | | |
| | Interest (net of foreign withholding taxes of $3,171 and $0, respectively) | | $ | 1,274,961 | | | $ | 9,303,455 | |
| | Dividends — affiliated issuers | | | 9,738 | | | | 21,968 | |
| | Dividends — unaffiliated issuers | | | — | | | | 2,689 | |
| | Total investment income | | | 1,284,699 | | | | 9,328,112 | |
| | | | | | | | | | |
| | Expenses: | | | | |
| | Management fees | | | 1,043,564 | | | | 1,933,008 | |
| | Custody, accounting and administrative services | | | 501,032 | | | | 98,769 | |
| | Professional fees | | | 219,084 | | | | 90,301 | |
| | Registration fees | | | 72,421 | | | | 99,322 | |
| | Printing and mailing costs | | | 44,966 | | | | 55,858 | |
| | Transfer Agency fees(b) | | | 30,862 | | | | 89,188 | |
| | Trustee fees | | | 18,170 | | | | 18,438 | |
| | Distribution and Service fees(b) | | | 2,941 | | | | 34,502 | |
| | Prime Broker Fees | | | 9,913 | | | | — | |
| | Other | | | 7,441 | | | | 11,897 | |
| | Total expenses | | | 1,950,394 | | | | 2,431,283 | |
| | Less — expense reductions | | | (941,198 | ) | | | (165,642 | ) |
| | Net expenses | | | 1,009,196 | | | | 2,265,641 | |
| | NET INVESTMENT INCOME | | | 275,503 | | | | 7,062,471 | |
| | | | | | | | | | |
| | Realized and unrealized gain (loss): | | | | |
| | Net realized gain (loss) from: | | | | | | | | |
| | Investments — unaffiliated issuers | | | (2,242,353 | ) | | | (4,424,100 | ) |
| | Futures contracts | | | 308,215 | | | | — | |
| | Written options | | | 161,169 | | | | — | |
| | Swap contracts | | | 1,844,228 | | | | (1,906,912 | ) |
| | Non-deliverable bond forward contracts | | | (128,128 | ) | | | — | |
| | Forward foreign currency exchange contracts | | | 641,604 | | | | 1,578,012 | |
| | Foreign currency transactions | | | 386,823 | | | | (1,063,895 | ) |
| | Net change in unrealized gain (loss) on: | | | | | | | | |
| | Investments — unaffiliated issuers | | | 1,311,273 | | | | 211,410 | |
| | Futures contracts | | | (12,877 | ) | | | — | |
| | Non-deliverable bond forward contracts | | | 112,341 | | | | — | |
| | Written options | | | 111,175 | | | | — | |
| | Swap contracts | | | 361,756 | | | | (185,749 | ) |
| | Forward foreign currency exchange contracts | | | (396,692 | ) | | | (1,594,439 | ) |
| | Foreign currency translation | | | 58,775 | | | | 1,059,067 | |
| | Net realized and unrealized gain (loss) | | | 2,517,309 | | | | (6,326,606 | ) |
| | NET INCREASE IN NET ASSETS RESULTING FROM OPERATIONS | | $ | 2,792,812 | | | $ | 735,865 | |
| | (a) | | Statement of Operations for the Fund is consolidated and includes the balances of a wholly-owned subsidiary, Cayman Commodity — FIMS Ltd. Accordingly, all interfund balances and transactions have been eliminated. |
| | (b) | | Class specific Distribution and Service and Transfer Agency fees were as follows: |
| | | | | | | | | | | | | | | | | | | | | | | | | | | | | | | | |
| | | Distribution and Service Fees | | | Transfer Agency Fees | |
Fund | | Class A | | | Class C | | | Class R | | | Class A | | | Class C | | | Institutional | | | Class IR | | | Class R | |
Fixed Income Macro Strategies | | $ | 651 | | | $ | 2,174 | | | $ | 116 | | | $ | 339 | | | $ | 282 | | | $ | 26,479 | | | $ | 3,733 | | | $ | 29 | |
Long Short Credit Strategies | | | 21,310 | | | | 13,028 | | | | 164 | | | | 11,081 | | | | 1,693 | | | | 72,046 | | | | 4,324 | | | | 44 | |
| | |
| The accompanying notes are an integral part of these financial statements. | | 45 |
GOLDMAN SACHS FIXED INCOME ALTERNATIVES STRATEGIES FUNDS
Consolidated Statement of Changes in Net Assets(a)
| | | | | | | | | | |
| | | | | Fixed Income Macro Strategies Fund | |
| | | | | For the Fiscal
Year Ended
March 31, 2016 | | | For the Fiscal
Year Ended
March 31, 2015 | |
| | From operations: | | | | | | | | |
| | Net investment income | | $ | 275,503 | | | $ | 264,189 | |
| | Net realized gain (loss) | | | 971,558 | | | | (6,959,676 | ) |
| | Net change in unrealized gain (loss) | | | 1,545,751 | | | | (1,748,756 | ) |
| | Net increase (decrease) in net assets resulting from operations | | | 2,792,812 | | | | (8,444,243 | ) |
| | | | | | | | | | |
| | Distributions to shareholders: | | | | | | | | |
| | From net investment income | | | | | | | | |
| | Class A Shares | | | (10,269 | ) | | | — | |
| | Class C Shares | | | (4,827 | ) | | | — | |
| | Institutional Shares | | | (2,216,168 | ) | | | — | |
| | Class IR Shares | | | (54,591 | ) | | | — | |
| | Class R Shares | | | (725 | ) | | | — | |
| | Return of capital | | | | | | | | |
| | Class A Shares | | | (8,572 | ) | | | (1,883 | ) |
| | Class C Shares | | | (4,030 | ) | | | (129 | ) |
| | Institutional Shares | | | (1,850,041 | ) | | | (235,132 | ) |
| | Class IR Shares | | | (45,572 | ) | | | (7,529 | ) |
| | Class R Shares | | | (606 | ) | | | (27 | ) |
| | Total distributions to shareholders | | | (4,195,401 | ) | | | (244,700 | ) |
| | | | | | | | | | |
| | From share transactions: | | | | | | | | |
| | Proceeds from sales of shares | | | 10,415,184 | | | | 46,038,444 | |
| | Reinvestment of distributions | | | 4,195,401 | | | | 244,700 | |
| | Cost of shares redeemed | | | (24,134,214 | ) | | | (58,333,014 | ) |
| | Net decrease in net assets resulting from share transactions | | | (9,523,629 | ) | | | (12,049,870 | ) |
| | TOTAL DECREASE | | | (10,926,218 | ) | | | (20,738,813 | ) |
| | | | | | | | | | |
| | Net assets: | | | | | | | | |
| | Beginning of year | | | 79,106,406 | | | | 99,845,219 | |
| | End of year | | $ | 68,180,188 | | | $ | 79,106,406 | |
| | Undistributed (distributions in excess of) net investment income | | $ | (1,044,322 | ) | | $ | (913,816 | ) |
| | (a) | | Statement of Changes in Net Assets for the Fixed Income Macro Strategies Fund is consolidated and includes the balances of wholly owned subsidiary, Cayman Commodity — FIMS Ltd. Accordingly, all interfund balances and transactions have been eliminated. |
| | |
| 46 | | The accompanying notes are an integral part of these financial statements. |
GOLDMAN SACHS FIXED INCOME ALTERNATIVES STRATEGIES FUNDS
Statements of Changes in Net Assets
| | | | | | | | | | |
| | | | Long Short Credit Strategies Fund | |
| | | | | For the Fiscal
Year Ended
March 31, 2016 | | | For the Fiscal
Year Ended
March 31, 2015 | |
| | From operations: | | | | | | | | |
| | Net investment income | | $ | 7,062,471 | | | $ | 9,404,739 | |
| | Net realized loss | | | (5,816,895 | ) | | | (11,718,821 | ) |
| | Net change in unrealized loss | | | (509,711 | ) | | | (7,031,042 | ) |
| | Net increase (decrease) in net assets resulting from operations | | | 735,865 | | | | (9,345,124 | ) |
| | | | | | | | | | |
| | Distributions to shareholders: | | | | | | | | |
| | From net investment income | | | | | | | | |
| | Class A Shares | | | (309,196 | ) | | | (163,398 | ) |
| | Class C Shares | | | (37,911 | ) | | | (17,863 | ) |
| | Institutional Shares | | | (6,933,975 | ) | | | (8,388,981 | ) |
| | Class IR Shares | | | (123,133 | ) | | | (51,240 | ) |
| | Class R Shares | | | (1,073 | ) | | | (793 | ) |
| | From net realized gains | | | | | | | | |
| | Class A Shares | | | — | | | | (68,289 | ) |
| | Class C Shares | | | — | | | | (9,420 | ) |
| | Institutional Shares | | | — | | | | (2,124,980 | ) |
| | Class IR Shares | | | — | | | | (20,691 | ) |
| | Class R Shares | | | — | | | | (218 | ) |
| | Total distributions to shareholders | | | (7,405,288 | ) | | | (10,845,873 | ) |
| | | | | | | | | | |
| | From share transactions: | | | | | | | | |
| | Proceeds from sales of shares | | | 71,922,849 | | | | 127,337,683 | |
| | Reinvestment of distributions | | | 6,171,270 | | | | 10,197,816 | |
| | Cost of shares redeemed | | | (83,049,707 | ) | | | (252,151,116 | ) |
| | Net decrease in net assets resulting from share transactions | | | (4,955,588 | ) | | | (114,615,617 | ) |
| | TOTAL DECREASE | | | (11,625,011 | ) | | | (134,806,614 | ) |
| | | | | | | | | | |
| | Net assets: | | | | | | | | |
| | Beginning of year | | | 200,614,173 | | | | 335,420,787 | |
| | End of year | | $ | 188,989,162 | | | $ | 200,614,173 | |
| | Undistributed net investment income | | $ | 1,977,995 | | | $ | 1,224,807 | |
| | |
| The accompanying notes are an integral part of these financial statements. | | 47 |
GOLDMAN SACHS FIXED INCOME MACRO STRATEGIES FUND
Consolidated Financial Highlights
Selected Data for a Share Outstanding Throughout Each Year
| | | | | | | | | | | | | | | | | | | | | | | | | | | | | | |
| | | | | | Income (loss) from
investment operations | | | Distributions
to shareholders | |
| | | Year -Share Class | |
Net asset
value,
beginning
of year | | | Net
investment
income (loss)(a) | | | Net realized
and unrealized
gain (loss) | | | Total from
investment
operations | | | From net
investment
income | | | From
capital | | | Total
distributions | |
| | FOR THE FISCAL YEARS ENDED MARCH 31, | | | | | | | | | |
| | 2016 - A | | $ | 9.03 | | | $ | 0.03 | | | $ | 0.33 | | | $ | 0.36 | | | $ | (0.25 | ) | | $ | (0.30 | ) | | $ | (0.55 | ) |
| | 2016 - C | | | 9.04 | | | | (0.06 | ) | | | 0.35 | | | | 0.29 | | | | (0.33 | ) | | | (0.17 | ) | | | (0.50 | ) |
| | 2016 -Institutional | | | 9.05 | | | | 0.04 | | | | 0.33 | | | | 0.37 | | | | (0.30 | ) | | | (0.26 | ) | | | (0.56 | ) |
| | 2016 - IR | | | 9.03 | | | | — | (e) | | | 0.36 | | | | 0.36 | | | | (0.40 | ) | | | (0.15 | ) | | | (0.55 | ) |
| | 2016 - R | | | 9.04 | | | | (0.01 | ) | | | 0.34 | | | | 0.33 | | | | (0.29 | ) | | | (0.24 | ) | | | (0.53 | ) |
| | 2015 - A | | | 9.82 | | | | 0.03 | | | | (0.81 | ) | | | (0.78 | ) | | | — | | | | (0.01 | ) | | | (0.01 | ) |
| | 2015 - C | | | 9.82 | | | | 0.05 | | | | (0.82 | ) | | | (0.77 | ) | | | — | | | | (0.01 | ) | | | (0.01 | ) |
| | 2015 -Institutional | | | 9.84 | | | | 0.02 | | | | (0.79 | ) | | | (0.77 | ) | | | — | | | | (0.02 | ) | | | (0.02 | ) |
| | 2015 - IR | | | 9.81 | | | | 0.02 | | | | (0.78 | ) | | | (0.76 | ) | | | — | | | | (0.02 | ) | | | (0.02 | ) |
| | 2015 - R | | | 9.82 | | | | 0.01 | | | | (0.78 | ) | | | (0.77 | ) | | | — | | | | (0.01 | ) | | | (0.01 | ) |
| | 2014 - A (Commenced December 16, 2013) | | | 10.00 | | | | (0.01 | ) | | | (0.16 | ) | | | (0.17 | ) | | | — | | | | (0.01 | ) | | | (0.01 | ) |
| | 2014 - C (Commenced December 16, 2013) | | | 10.00 | | | | (0.02 | ) | | | (0.16 | ) | | | (0.18 | ) | | | — | | | | — | (e) | | | — | (e) |
| | 2014 -Institutional (Commenced December 16, 2013) | | | 10.00 | | | | — | (e) | | | (0.14 | ) | | | (0.14 | ) | | | — | | | | (0.02 | ) | | | (0.02 | ) |
| | 2014 - IR (Commenced December 16, 2013) | | | 10.00 | | | | — | (e) | | | (0.17 | ) | | | (0.17 | ) | | | — | | | | (0.02 | ) | | | (0.02 | ) |
| | 2014 - R (Commenced December 16, 2013) | | | 10.00 | | | | (0.01 | ) | | | (0.16 | ) | | | (0.17 | ) | | | — | | | | (0.01 | ) | | | (0.01 | ) |
| | (a) | | Calculated based on the average shares outstanding methodology. |
| | (b) | | Assumes investment at the NAV at the beginning of the period, reinvestment of all dividends and distributions, a complete redemption of the investment at the NAV at the end of the period and no sales or redemption charges. Total returns would be reduced if a sales or redemption charge was taken into account. Returns do not reflect the deduction of taxes that a shareholder would pay on Fund distributions or the redemption of Fund shares. Total returns for periods less than one full year are not annualized. |
| | (c) | | The Fund’s portfolio turnover rate is calculated in accordance with regulatory requirements, without regard to transactions involving short term investments and certain derivatives. If such transactions were included, the Fund’s portfolio turnover rate may be higher. |
| | (e) | | Amount is less than $0.005 per share. |
| | |
| 48 | | The accompanying notes are an integral part of these financial statements. |
GOLDMAN SACHS FIXED INCOME MACRO STRATEGIES FUND
| | | | | | | | | | | | | | | | | | | | | | | | | | | | | | | | | | | | | | | | |
| | | | | | | | | | | | | | | | | | | | | | | | | | | | | | | | | | |
| | | Net asset
value, end
of year | | | | | Total
return(b) | | | | | Net assets,
end of
year
(in 000s) | | | | | Ratio of
net expenses
to average
net assets | | | | | Ratio of
total expenses
to average
net assets | | | | | Ratio of
net investment
income (loss)
to average
net assets | | | | | Portfolio
turnover
rate(c) | |
| | | | | | | | | | | | | | | | | | | | | | | | | | | | | | | | | | | | | | | | |
| | $ | 8.84 | | | | | | 3.98 | % | | | | $ | 312 | | | | | | 1.85 | % | | | | | 3.39 | % | | | | | 0.33 | % | | | | | 472 | % |
| | | 8.83 | | | | | | 3.25 | | | | | | 136 | | | | | | 2.21 | | | | | | 3.88 | | | | | | (0.68 | ) | | | | | 472 | |
| | | 8.86 | | | | | | 4.15 | | | | | | 66,006 | | | | | | 1.44 | | | | | | 2.79 | | | | | | 0.42 | | | | | | 472 | |
| | | 8.84 | | | | | | 4.06 | | | | | | 1,703 | | | | | | 1.52 | | | | | | 2.89 | | | | | | 0.03 | | | | | | 472 | |
| | | 8.84 | | | | | | 3.66 | | | | | | 23 | | | | | | 1.93 | | | | | | 3.35 | | | | | | (0.05 | ) | | | | | 472 | |
| | | 9.03 | | | | | | (8.00 | ) | | | | | 2,562 | | | | | | 0.19 | | | | | | 3.06 | | | | | | 0.36 | | | | | | 487 | |
| | | 9.04 | | | | | | (7.97 | ) | | | | | 347 | | | | | | 0.88 | | | | | | 4.10 | | | | | | 0.60 | | | | | | 487 | |
| | | 9.05 | | | | | | (7.89 | ) | | | | | 72,251 | | | | | | 0.97 | | | | | | 2.65 | | | | | | 0.25 | | | | | | 487 | |
| | | 9.03 | | | | | | (7.85 | ) | | | | | 3,923 | | | | | | 0.72 | | | | | | 2.80 | | | | | | 0.20 | | | | | | 487 | |
| | | 9.04 | | | | | | (7.93 | ) | | | | | 23 | | | | | | 1.01 | | | | | | 3.25 | | | | | | 0.11 | | | | | | 487 | |
| | | 9.82 | | | | | | (1.60 | ) | | | | | 19 | | | | | | 1.79 | (d) | | | | | 3.34 | (d) | | | | | (0.29 | )(d) | | | | | 90 | |
| | | 9.82 | | | | | | (1.69 | ) | | | | | 10 | | | | | | 2.19 | (d) | | | | | 4.16 | (d) | | | | | (0.67 | )(d) | | | | | 90 | |
| | | 9.84 | | | | | | (1.32 | ) | | | | | 99,736 | | | | | | 1.45 | (d) | | | | | 2.72 | (d) | | | | | 0.11 | (d) | | | | | 90 | |
| | | 9.81 | | | | | | (1.64 | ) | | | | | 56 | | | | | | 1.55 | (d) | | | | | 2.90 | (d) | | | | | (0.01 | )(d) | | | | | 90 | |
| | | 9.82 | | | | | | (1.65 | ) | | | | | 25 | | | | | | 2.01 | (d) | | | | | 3.66 | (d) | | | | | (0.47 | )(d) | | | | | 90 | |
| | |
| The accompanying notes are an integral part of these financial statements. | | 49 |
GOLDMAN SACHS LONG SHORT CREDIT STRATEGIES FUND
Financial Highlights
Selected Data for a Share Outstanding Throughout Each Year
| | | | | | | | | | | | | | | | | | | | | | | | | | | | | | |
| | | | | | From
investment operations | | | Distributions
to shareholders | |
| | | Year - Share Class | | Net asset
value,
beginning
of year | | | Net
investment
income(a) | | | Net realized
and unrealized
gain (loss) | | | Total from
investment
operations | | | From net
investment
income | | | From net
realized
gains | | | Total
distributions | |
| | FOR THE FISCAL YEARS ENDED MARCH 31, | | | | | | | | | | | | | | | | | |
| | 2016 - A | | $ | 9.79 | | | $ | 0.32 | | | $ | (0.30 | ) | | $ | 0.02 | | | $ | (0.34 | ) | | $ | — | | | $ | (0.34 | ) |
| | 2016 - C | | | 9.79 | | | | 0.25 | | | | (0.31 | ) | | | (0.06 | ) | | | (0.26 | ) | | | — | | | | (0.26 | ) |
| | 2016 - Institutional | | | 9.78 | | | | 0.35 | | | | (0.30 | ) | | | 0.05 | | | | (0.37 | ) | | | — | | | | (0.37 | ) |
| | 2016 - IR | | | 9.79 | | | | 0.35 | | | | (0.31 | ) | | | 0.04 | | | | (0.36 | ) | | | — | | | | (0.36 | ) |
| | 2016 - R | | | 9.78 | | | | 0.30 | | | | (0.30 | ) | | | — | | | | (0.31 | ) | | | — | | | | (0.31 | ) |
| | 2015 - A (Commenced April 30, 2014) | | | 10.52 | | | | 0.31 | | | | (0.65 | ) | | | (0.34 | ) | | | (0.30 | ) | | | (0.09 | ) | | | (0.39 | ) |
| | 2015 - C (Commenced April 30, 2014) | | | 10.52 | | | | 0.24 | | | | (0.66 | ) | | | (0.42 | ) | | | (0.22 | ) | | | (0.09 | ) | | | (0.31 | ) |
| | 2015 - Institutional | | | 10.51 | | | | 0.37 | | | | (0.66 | ) | | | (0.29 | ) | | | (0.35 | ) | | | (0.09 | ) | | | (0.44 | ) |
| | 2015 - IR (Commenced April 30, 2014) | | | 10.52 | | | | 0.33 | | | | (0.65 | ) | | | (0.32 | ) | | | (0.32 | ) | | | (0.09 | ) | | | (0.41 | ) |
| | 2015 - R (Commenced April 30, 2014) | | | 10.52 | | | | 0.28 | | | | (0.65 | ) | | | (0.37 | ) | | | (0.28 | ) | | | (0.09 | ) | | | (0.37 | ) |
| | 2014 - Institutional/Common Shares | | | 10.80 | | | | 0.39 | | | | 0.09 | | | | 0.48 | | | | (0.39 | ) | | | (0.38 | ) | | | (0.77 | ) |
| | 2013 - Common Shares | | | 10.58 | | | | 0.45 | | | | 0.45 | | | | 0.90 | | | | (0.47 | ) | | | (0.21 | ) | | | (0.68 | ) |
| | 2012 - Common Shares | | | 10.70 | | | | 0.51 | | | | 0.17 | | | | 0.68 | | | | (0.51 | ) | | | (0.29 | ) | | | (0.80 | ) |
| | (a) | | Calculated based on the average shares outstanding methodology. |
| | (b) | | Assumes investment at the NAV at the beginning of the period, reinvestment of all dividends and distributions, a complete redemption of the investment at the NAV at the end of the period and no sales or redemption charges. Total returns would be reduced if a sales or redemption charge was taken into account. Returns do not reflect the deduction of taxes that a shareholder would pay on Fund distributions or the redemption of Fund shares. Total returns for periods less than one full year are not annualized. |
| | (c) | | The Fund’s portfolio turnover rate is calculated in accordance with regulatory requirements, without regard to transactions involving short term investments and certain derivatives. If such transactions were included, the Fund’s portfolio turnover rate may be higher. |
| | |
| 50 | | The accompanying notes are an integral part of these financial statements. |
GOLDMAN SACHS LONG SHORT CREDIT STRATEGIES FUND
| | | | | | | | | | | | | | | | | | | | | | | | | | | | | | | | | | | | | | | | |
| | | | | | | | | | | | | | | | | | | | | | | | | | | | | | | | | | |
| | | Net asset
value, end
of year | | | | | Total
return(b) | | | | | Net assets,
end of
year
(in 000s) | | | | | Ratio of
net expenses
to average
net assets | | | | | Ratio of
total expenses
to average
net assets | | | | | Ratio of
net investment
income
to average
net assets | | | | | Portfolio
turnover
rate(c) | |
| | | | | | | | | | | | | | | | | | | | | | | | | | | | | | | | | | | | | | | | |
| | $ | 9.47 | | | | | | 0.19 | % | | | | $ | 8,358 | | | | | | 1.49 | % | | | | | 1.57 | % | | | | | 3.34 | % | | | | | 173 | % |
| | | 9.47 | | | | | | (0.55 | ) | | | | | 1,773 | | | | | | 2.23 | | | | | | 2.32 | | | | | | 2.61 | | | | | | 173 | |
| | | 9.46 | | | | | | 0.53 | | | | | | 173,758 | | | | | | 1.15 | | | | | | 1.23 | | | | | | 3.68 | | | | | | 173 | |
| | | 9.47 | | | | | | 0.44 | | | | | | 5,067 | | | | | | 1.23 | | | | | | 1.32 | | | | | | 3.61 | | | | | | 173 | |
| | | 9.47 | | | | | | 0.04 | | | | | | 33 | | | | | | 1.74 | | | | | | 1.83 | | | | | | 3.08 | | | | | | 173 | |
| | | 9.79 | | | | | | (3.28 | ) | | | | | 6,943 | | | | | | 1.57 | (d) | | | | | 1.62 | (d) | | | | | 3.35 | (d) | | | | | 164 | |
| | | 9.79 | | | | | | (3.95 | ) | | | | | 1,016 | | | | | | 2.30 | (d) | | | | | 2.38 | (d) | | | | | 2.61 | (d) | | | | | 164 | |
| | | 9.78 | | | | | | (2.77 | ) | | | | | 190,148 | | | | | | 1.27 | | | | | | 1.35 | | | | | | 3.57 | | | | | | 164 | |
| | | 9.79 | | | | | | (3.05 | ) | | | | | 2,475 | | | | | | 1.30 | (d) | | | | | 1.40 | (d) | | | | | 3.60 | (d) | | | | | 164 | |
| | | 9.78 | | | | | | (3.57 | ) | | | | | 32 | | | | | | 1.84 | (d) | | | | | 1.93 | (d) | | | | | 2.98 | (d) | | | | | 164 | |
| | | 10.51 | | | | | | 4.61 | | | | | | 335,421 | | | | | | 1.49 | | | | | | 1.51 | | | | | | 3.67 | | | | | | 207 | |
| | | 10.80 | | | | | | 8.74 | | | | | | 506,996 | | | | | | 1.47 | | | | | | 1.47 | | | | | | 4.23 | | | | | | 204 | |
| | | 10.58 | | | | | | 6.69 | | | | | | 533,499 | | | | | | 1.48 | | | | | | 1.48 | | | | | | 4.81 | | | | | | 215 | |
| | |
| The accompanying notes are an integral part of these financial statements. | | 51 |
GOLDMAN SACHS FIXED INCOME ALTERNATIVES STRATEGIES FUNDS
Notes to Financial Statements
March 31, 2016
Goldman Sachs Trust (the “Trust”) is a Delaware statutory trust registered under the Investment Company Act of 1940, as amended (the “Act”), as an open-end management investment company. The Trust includes the Goldman Sachs Fixed Income Macro Strategies Fund and the Goldman Sachs Long Short Credit Strategies Fund (the “Funds”). The Funds are non-diversified portfolios and currently offer five classes of shares: Class A, Class C, Institutional, Class IR and Class R. Class A Shares are sold with a front-end sales charge of up to 3.75%. Class C Shares are sold with a contingent deferred sales charge (“CDSC”) of 1.00% which is imposed on redemptions made within 12 months of purchase.
Goldman Sachs Asset Management, L.P. (“GSAM”), an affiliate of Goldman, Sachs & Co. (“Goldman Sachs”), serves as investment adviser to the Funds pursuant to a management agreement (the “Agreement”) with the Trust.
Pursuant to an Agreement and Plan of Reorganization (the “Reorganization Agreement”) approved by the Trust’s Board of Trustees (“Trustee”) and shareholders of the Goldman Sachs Credit Strategies Fund (the “Predecessor Fund”), all of the assets and liabilities of the Predecessor Fund were transferred to the Goldman Sachs Long Short Credit Strategies Fund as of the close of business on March 21, 2014 (the “Reorganization”). GSAM agreed to reimburse the fund for 50% of the expenses related to the Reorganization. As part of the reorganization, holders of Common Shares (the “Shares”) of the Predecessor Fund received Institutional Shares of the Goldman Sachs Long Short Credit Strategies Fund, in an amount equal to the aggregate net asset value of his or her investment in the Predecessor Fund. The exchange was a tax-free event to shareholders. The Predecessor Fund was the accounting survivor in the Reorganization and as such, the financial statements and financial highlights reflect the financial information of the Predecessor Fund through March 21, 2014. Prior to the Reorganization, the Predecessor Fund operated as an “interval fund” which made quarterly offers to repurchase between 5% and 25% of its outstanding Shares at net asset value (“NAV”), pursuant to Rule 23c-3 under the Act.
|
| 2. SIGNIFICANT ACCOUNTING POLICIES |
The financial statements have been prepared in accordance with accounting principles generally accepted in the United States of America (“GAAP”) and require management to make estimates and assumptions that may affect the reported amounts and disclosures. Actual results may differ from those estimates and assumptions.
A. Basis of Consolidation for Fixed Income Macro Strategies Fund — The Cayman Commodity – FIMS, Ltd. (the “Subsidiary”), a Cayman Islands exempted company is currently a wholly-owned subsidiary of the Fixed Income Macro Strategies Fund (the “Fund”). The Subsidiary acts as an investment vehicle for the Fund to enable the Fund to gain exposure to certain types of commodity-linked derivative instruments. The Fund is the sole shareholder of the Subsidiary pursuant to a subscription agreement dated as of December 16, 2013, and it is intended that the Fund will remain the sole shareholder and will continue to control the Subsidiary. Under the Articles of Association of the Subsidiary, shares issued by the Subsidiary confer upon a shareholder the right to vote at general meetings of the Subsidiary and certain rights in connection with any winding-up or repayment of capital, as well as the right to participate in the profits or assets of the Subsidiary. All inter-fund balances and transactions have been eliminated in consolidation. As of March 31, 2016, the Fund’s net assets were $68,180,188, of which, $12,845,847, or 19%, represented the Subsidiary’s net assets.
B. Investment Valuation — The Funds’ valuation policy is to value investments at fair value.
C. Investment Income and Investments — Investment income includes interest income and dividend income, net of any foreign withholding taxes, less any amounts reclaimable. Interest income is accrued daily and adjusted for amortization of
52
GOLDMAN SACHS FIXED INCOME ALTERNATIVES STRATEGIES FUNDS
|
| 2. SIGNIFICANT ACCOUNTING POLICIES (continued) |
premiums and accretion of discounts. Dividend income is recognized on ex-dividend date or, for certain foreign securities, as soon as such information is obtained subsequent to the ex-dividend date. Investment transactions are reflected on trade date. Realized gains and losses are calculated using identified cost. Investment transactions are recorded on the following business day for daily NAV calculations. Any foreign capital gains tax is accrued daily based upon net unrealized gains, and is payable upon sale of such investments.
For derivative contracts, realized gains and losses are recorded upon settlement of the contract. Upfront payments, if any, are made or received upon entering into a swap agreement and are reflected in the Statements of Assets and Liabilities. Upfront payments are recognized over the contract’s term/event as realized gains or losses, with the exception of forward starting interest rate swaps whose realized gains or losses are recognized from the effective start date.
For securities with paydown provisions, principal payments received are treated as a proportionate reduction to the cost basis of the securities, and excess or shortfall amounts are recorded as income.
For treasury inflation protected securities (“TIPS”), adjustments to principal due to inflation/deflation are reflected as increases/decreases to interest income with a corresponding adjustment to cost.
D. Class Allocations and Expenses — Investment income, realized and unrealized gain (loss), and non-class specific expenses of each Fund are allocated daily based upon the proportion of net assets of each class. Non-class specific expenses directly incurred by a Fund are charged to that Fund, while such expenses incurred by the Trust are allocated across the applicable Funds on a straight-line and/or pro-rata basis depending upon the nature of the expenses. Class specific expenses, where applicable, are borne by the respective share classes and include Distribution and Service and Transfer Agency fees.
E. Federal Taxes and Distributions to Shareholders — It is each Fund’s policy to comply with the requirements of the Internal Revenue Code of 1986, as amended (the “Code”), applicable to regulated investment companies (mutual funds) and to distribute each year substantially all of its investment company taxable income and capital gains to its shareholders. Accordingly, the Funds are not required to make any provisions for the payment of federal income tax. Distributions to shareholders are recorded on the ex-dividend date. Income and capital gains distributions, if any, are declared and paid according to the following schedule:
| | | | | | |
| Fund | | | | Income Distributions Declared/Paid | | Capital Gains Distributions Declared/Paid |
Fixed Income Macro Strategies* | | | | Annually | | Annually |
Long Short Credit Strategies | | | | Daily/Monthly | | Annually |
| * | | Prior to August 1, 2015, the Fund’s distributions from net investment income were declared daily and paid monthly. |
The Subsidiary is classified as a controlled foreign corporation under the Code. Therefore, the Fixed income Macro Strategies Fund is required to increase its taxable income by its share of the Subsidiary’s income. Net losses of the Subsidiary cannot be deducted by the Fund in the current period nor carried forward to offset taxable income in future periods.
Net capital losses are carried forward to future fiscal years and may be used to the extent allowed by the Code to offset any future capital gains. Utilization of capital loss carryforwards will reduce the requirement of future capital gains distributions.
Under the Regulated Investment Company Modernization Act of 2010, the Funds are permitted to carry forward capital losses incurred in taxable years beginning after December 22, 2010 for an unlimited period. However, any losses incurred during those future taxable years will be required to be utilized prior to the losses incurred in pre-enactment taxable years. As a result of this ordering rule, pre-enactment capital loss carryforwards may be more likely to expire unused. Additionally, post-enactment capital
53
GOLDMAN SACHS FIXED INCOME ALTERNATIVES STRATEGIES FUNDS
Notes to Financial Statements (continued)
March 31, 2016
|
| 2. SIGNIFICANT ACCOUNTING POLICIES (continued) |
losses that are carried forward will retain their character as either short-term or long-term capital losses rather than being considered all short-term as under previous law.
The characterization of distributions to shareholders for financial reporting purposes is determined in accordance with federal income tax rules, which may differ from GAAP. The source of each Fund’s distributions may be shown in the accompanying financial statements as either from net investment income, net realized gain or capital. Certain components of the Funds’ net assets on the Statements of Assets and Liabilities reflect permanent GAAP/tax differences based on the appropriate tax character.
F. Foreign Currency Translation — The accounting records and reporting currency of the Funds are maintained in U.S. dollars. Assets and liabilities denominated in foreign currencies are translated into U.S. dollars using the current exchange rates at the close of each business day. The effect of changes in foreign currency exchange rates on investments is included within net realized and unrealized gain (loss) on investments. Changes in the value of other assets and liabilities as a result of fluctuations in foreign exchange rates are included in the Statements of Operations within net change in unrealized gain (loss) on foreign currency translations. Transactions denominated in foreign currencies are translated into U.S. dollars on the date the transaction occurred, the effects of which are included within net realized gain (loss) on foreign currency transactions.
| | |
| 3. INVESTMENTS AND FAIR VALUE MEASUREMENTS | | |
The fair value of a financial instrument is the amount that would be received to sell an asset or paid to transfer a liability in an orderly transaction between market participants at the measurement date (i.e., the exit price). GAAP establishes a fair value hierarchy that prioritizes the inputs to valuation techniques used to measure fair value. The hierarchy gives the highest priority to unadjusted quoted prices in active markets for identical assets or liabilities (Level 1 measurements) and the lowest priority to unobservable inputs (Level 3 measurements). The levels used for classifying investments are not necessarily an indication of the risk associated with investing in these investments. The three levels of the fair value hierarchy are described below:
Level 1 — Unadjusted quoted prices in active markets that are accessible at the measurement date for identical, unrestricted assets or liabilities;
Level 2 — Quoted prices in markets that are not active or financial instruments for which significant inputs are observable (including, but not limited to, quoted prices for similar investments, interest rates, foreign exchange rates, volatility and credit spreads), either directly or indirectly;
Level 3 — Prices or valuations that require significant unobservable inputs (including GSAM’s assumptions in determining fair value measurement).
Changes in valuation techniques may result in transfers into or out of an assigned level within the hierarchy. In accordance with the Funds’ policy, transfers between different levels of the fair value hierarchy resulting from such changes are deemed to have occurred as of the beginning of the reporting period.
The Trustees has approved Valuation Procedures that govern the valuation of the portfolio investments held by the Funds, including investments for which market quotations are not readily available. The Trustees have delegated to GSAM day-to-day responsibility for implementing and maintaining internal controls and procedures related to the valuation of the Funds’ portfolio investments. To assess the continuing appropriateness of pricing sources and methodologies, GSAM regularly performs price verification procedures and issues challenges as necessary to third party pricing vendors or brokers, and any differences are reviewed in accordance with the Valuation Procedures.
54
GOLDMAN SACHS FIXED INCOME ALTERNATIVES STRATEGIES FUNDS
|
| 3. INVESTMENTS AND FAIR VALUE MEASUREMENTS (continued) |
A. Level 1 and Level 2 Fair Value Investments — The valuation techniques and significant inputs used in determining the fair values for investments classified as Level 1 and Level 2 are as follows:
Debt Securities — Debt securities for which market quotations are readily available are valued daily on the basis of quotations supplied by dealers or an independent pricing service approved by the Trustees. The pricing services may use valuation models or matrix pricing, which consider: (i) yield or price with respect to bonds that are considered comparable in characteristics such as rating, interest rate and maturity date or (ii) quotations from securities dealers to determine current value. Short-term debt obligations that mature in sixty days or less and that do not exhibit signs of credit deterioration are valued at amortized cost, which approximates fair value. With the exception of treasury securities of G8 countries (not held in money market funds), which are generally classified as Level 1, these investments are generally classified as Level 2 of the fair value hierarchy.
i. Bank Loans — Bank loans (“Loans”) are interests in amounts owed by corporate, governmental, or other borrowers to lenders or lending syndicates. Loans are arranged through private negotiations between the borrower and one or more financial institutions (“Lenders”). A Fund’s investments in Loans are in the form of either participations in Loans (“Participations”) or assignments of all or a portion of Loans from third parties (“Assignments”). With respect to Participations, a Fund has the right to receive payments of principal, interest and any fees to which it is entitled from the Lender selling the Participations and only upon receipt by the Lender of the payments from the borrower. A Fund generally has no right to enforce compliance by the borrower with the terms of the loan agreement with respect to Participations. Conversely, Assignments result in a Fund having a direct contractual relationship with the borrower, and the Fund may be permitted to enforce compliance by the borrower with the terms of the loan agreement.
ii. Inverse Floaters — The interest rate on inverse floating rate securities (“inverse floaters”) resets in the opposite direction from the market rate of interest to which the inverse floaters are indexed. An inverse floater may be considered to be leveraged to the extent that its interest rate varies by a magnitude that exceeds the magnitude of the change in the index rate of interest. The higher the degree of leverage of an inverse floater, the greater the volatility of its market value.
iii. Mortgage-Backed and Asset-Backed Securities — Mortgage-backed securities represent direct or indirect participations in, or are collateralized by and payable from, mortgage loans secured by residential and/or commercial real estate property. Asset-backed securities include securities whose principal and interest payments are collateralized by pools of other assets or receivables. The value of certain mortgage-backed and asset-backed securities (including adjustable rate mortgage loans) may be particularly sensitive to changes in prevailing interest rates. The value of these securities may also fluctuate in response to the market’s perception of the creditworthiness of the issuers.
Asset-backed securities may present credit risks that are not presented by mortgage-backed securities because they generally do not have the benefit of a security interest in collateral that is comparable to mortgage assets. Some asset-backed securities may only have a subordinated claim on collateral.
Stripped mortgage-backed securities are usually structured with two different classes: one that receives substantially all interest payments (interest-only, or “IO” and/or high coupon rate with relatively low principal amount, or “IOette”), and the other that receives substantially all principal payments (principal-only, or “PO”) from a pool of mortgage loans. Little to no principal will be received at the maturity of an IO; as a result, periodic adjustments are recorded to reduce the cost of the security until maturity. These adjustments are included in interest income.
iv. Structured Notes — The values of structured notes are based on the price movements of a reference security or index. Upon termination, a Fund will receive a payment from the issuer based on the value of the referenced instrument (notional amount multiplied by price of the referenced instrument) and record a realized gain or loss.
55
GOLDMAN SACHS FIXED INCOME ALTERNATIVES STRATEGIES FUNDS
Notes to Financial Statements (continued)
March 31, 2016
|
| 3. INVESTMENTS AND FAIR VALUE MEASUREMENTS (continued) |
v. Treasury Inflation Protected Securities — TIPS are treasury securities in which the principal amount is adjusted daily to keep pace with inflation, as measured by the U.S. Consumer Pricing Index for Urban Consumers. The repayment of the original bond principal upon maturity is guaranteed by the full faith and credit of the U.S. Government.
vi. When-Issued Securities and Forward Commitments — When-issued securities, including TBA (“To Be Announced”) securities, are securities that are authorized but not yet issued in the market and purchased in order to secure what is considered to be an advantageous price or yield to a Fund. A forward commitment involves entering into a contract to purchase or sell securities, typically on an extended settlement basis, for a fixed price at a future date. The purchase of securities on a when-issued or forward commitment basis involves a risk of loss if the value of the security to be purchased declines before the settlement date. Conversely, the sale of securities on a forward commitment basis involves the risk that the value of the securities sold may increase before the settlement date. Although a Fund will generally purchase securities on a when-issued or forward commitment basis with the intention of acquiring the securities for its portfolio, the Fund may dispose of when-issued securities or forward commitments prior to settlement which may result in a realized gain or loss.
Equity Securities — Equity securities traded on a United States (“U.S.”) securities exchange or the NASDAQ system, or those located on certain foreign exchanges, including but not limited to the Americas, are valued daily at their last sale price or official closing price on the principal exchange or system on which they are traded. If there is no sale or official closing price or such price is believed by GSAM to not represent fair value, equity securities are valued at the last bid price for long positions and at the last ask price for short positions. To the extent these investments are actively traded, they are classified as Level 1 of the fair value hierarchy, otherwise they are generally classified as Level 2.
Unlisted equity securities for which market quotations are available are valued at the last sale price on the valuation date, or if no sale occurs, at the last bid price. Securities traded on certain foreign securities exchanges are valued daily at fair value determined by an independent fair value service (if available) under Valuation Procedures approved by the Trustees and consistent with applicable regulatory guidance. The independent fair value service takes into account multiple factors including, but not limited to, movements in the securities markets, certain depositary receipts, futures contracts and foreign currency exchange rates that have occurred subsequent to the close of the foreign securities exchange. These investments are generally classified as Level 2 of the fair value hierarchy.
Private Investments — Private investments may include, but are not limited to, investments in private equity or debt instruments. The Investment Manager estimates the fair value of private investments based upon various factors, including, but not limited to, transactions in similar instruments, completed or pending third-party transactions in underlying investments or comparable entities, subsequent rounds of financing, recapitalizations, and other transactions across the capital structure, offerings in equity or debt capital markets, and changes in current and projected financial ratios or cash flows.
Money Market Funds — Investments in the Goldman Sachs Financial Square Government Fund (“Underlying Fund”) are valued at the NAV of the FST Institutional Share class on the day of valuation. These investments are generally classified as Level 1 of the fair value hierarchy. For information regarding an Underlying Fund’s accounting policies and investment holdings, please see the Underlying Fund’s shareholder report.
Derivative Contracts — A derivative is an instrument whose value is derived from underlying assets, indices, reference rates or a combination of these factors. The Funds enter into derivative transactions to hedge against changes in interest rates, securities prices, and/or currency exchange rates, to increase total return, or to gain access to certain markets or attain exposure to other underliers.
56
GOLDMAN SACHS FIXED INCOME ALTERNATIVES STRATEGIES FUNDS
|
| 3. INVESTMENTS AND FAIR VALUE MEASUREMENTS (continued) |
Exchange-traded derivatives, including futures and options contracts, are valued at the last sale or settlement price and typically fall within Level 1 of the fair value hierarchy. Over-the-counter (“OTC”) and centrally cleared derivatives are valued using market transactions and other market evidence, including market-based inputs to models, calibration to market-clearing transactions, broker or dealer quotations, or other alternative pricing sources. Where models are used, the selection of a particular model to value OTC and centrally cleared derivatives depends upon the contractual terms of, and specific risks inherent in, the instrument, as well as the availability of pricing information in the market. Valuation models require a variety of inputs, including contractual terms, market prices, yield curves, credit curves, measures of volatility, voluntary and involuntary prepayment rates, loss severity rates and correlations of such inputs. For OTC and centrally cleared derivatives that trade in liquid markets, model inputs can generally be verified and model selection does not involve significant management judgment. OTC and centrally cleared derivatives are classified within Level 2 of the fair value hierarchy when significant inputs are corroborated by market evidence.
i. Forward Contracts — A forward contract is a contract between two parties to buy or sell an asset at a specified price on a future date. A forward contract settlement can occur on a cash or delivery basis. Forward contracts are marked-to-market daily using independent vendor prices, and the change in value, if any, is recorded as an unrealized gain or loss. Cash and certain investments may be used to collateralize forward contracts.
A forward foreign currency contract is a forward contract in which a Fund agrees to receive or deliver a fixed quantity of one currency for another, at a pre-determined price at a future date. All forward foreign currency exchange contracts are marked-to-market daily at the applicable forward rate. Non-deliverable forward foreign currency exchange contracts are settled with the counterparty in cash without the delivery of foreign currency.
A non-deliverable bond forward is a short term forward contract between two parties to buy or sell a bond denominated in a non-deliverable foreign currency at a specified future time and price. Non-deliverable bond forwards are marked-to-market daily using market quotations. Unrealized gains or losses on non-deliverable bond forwards are recorded by a Fund on a daily basis, and realized gains or losses are recorded on the termination date or sale of a contract.
ii. Futures Contracts — Futures contracts are contracts to buy or sell a standardized quantity of a specified commodity or security and are valued based on exchanged settlement prices or independent market quotes. Futures contracts are valued at the last settlement price, or in the absence of a sale, the last bid price for long positions and at the last ask price for short positions, at the end of each day on the board of trade or exchange upon which they are traded. Upon entering into a futures contract, a Fund deposits cash or securities in an account on behalf of the broker in an amount sufficient to meet the initial margin requirement. Subsequent payments are made or received by a Fund equal to the daily change in the contract value and are recorded as variation margin receivable or payable with a corresponding offset to unrealized gains or losses.
iii. Option Contracts — When a Fund writes call or put option contracts, an amount equal to the premium received is recorded as a liability and is subsequently marked-to-market to reflect the current value of the option written. Swaptions are options on interest rate swap contracts.
Upon the purchase of a call option or a put option by a Fund, the premium paid is recorded as an investment and subsequently marked-to-market to reflect the current value of the option. Certain options may be purchased with premiums to be determined on a future date. The premiums for these options are based upon implied volatility parameters at specified terms.
iv. Swap Contracts — Bilateral swap contracts are agreements in which a Fund and a counterparty agree to exchange periodic payments on a specified notional amount or make a net payment upon termination. Bilateral swap transactions are privately negotiated in the OTC market and payments are settled through direct payments between a Fund and the
57
GOLDMAN SACHS FIXED INCOME ALTERNATIVES STRATEGIES FUNDS
Notes to Financial Statements (continued)
March 31, 2016
|
| 3. INVESTMENTS AND FAIR VALUE MEASUREMENTS (continued) |
counterparty. By contrast, certain swap transactions are subject to mandatory central clearing. These swaps are executed through a derivatives clearing member (“DCM”), acting in an agency capacity, and submitted to a central counterparty (“CCP”) (“centrally cleared swaps”), in which case all payments are settled with the CCP through the DCM. Swaps are marked-to-market daily using pricing vendor quotations, counterparty or clearinghouse prices or model prices, and the change in value, if any, is recorded as an unrealized gain or loss. Upon entering into a swap contract, a Fund is required to satisfy an initial margin requirement by delivering cash or securities to the counterparty (or in some cases, segregated in a triparty account on behalf of the counterparty), which can be adjusted by any mark-to-market gains or losses pursuant to bilateral or centrally cleared arrangements. For centrally cleared swaps the daily change in valuation, if any, is recorded as a receivable or payable for variation margin.
An interest rate swap is an agreement that obligates two parties to exchange a series of cash flows at specified intervals, based upon or calculated by reference to changes in interest rates on a specified notional principal amount. The payment flows are usually netted against each other, with the difference being paid by one party to the other.
A credit default swap is an agreement that involves one party (the buyer of protection) making a stream of payments to another party (the seller of protection) in exchange for the right to receive protection on a reference security or obligation, including a group of assets or exposure to the performance of an index. A Fund’s investment in credit default swaps may involve greater risks than if the Fund had invested in the referenced obligation directly. Credit events are contract specific but may include bankruptcy, failure to pay, restructuring and obligation acceleration. If a Fund buys protection through a credit default swap and no credit event occurs, its payments are limited to the periodic payments previously made to the counterparty. Upon the occurrence of a specified credit event, a Fund, as a buyer of credit protection, is entitled to receive an amount equal to the notional amount of the swap and deliver to the seller the defaulted reference obligation in a physically settled trade. A Fund may also receive a net settlement amount in the form of cash or securities equal to the notional amount of the swap reduced by the recovery value of the reference obligation in a cash settled trade.
As a seller of protection, a Fund generally receives a payment stream throughout the term of the swap, provided that there is no credit event. In addition, if a Fund sells protection through a credit default swap, a Fund could suffer a loss because the value of the referenced obligation and the premium payments received may be less than the notional amount of the swap paid to the buyer of protection. Upon the occurrence of a specified credit event, a Fund, as a seller of credit protection, may be required to take possession of the defaulted reference obligation and pay the buyer an amount equal to the notional amount of the swap in a physically settled trade. A Fund may also pay a net settlement amount in the form of cash or securities equal to the notional amount of the swap reduced by the recovery value of the reference obligation in a cash settled trade. Recovery values are at times established through the credit event auction process in which market participants are ensured that a transparent price has been set for the defaulted security or obligation. In addition, a Fund is entitled to a return of any assets, which have been pledged as collateral to the counterparty upon settlement.
The maximum potential amount of future payments (undiscounted) that a Fund as seller of protection could be required to make under a credit default swap would be an amount equal to the notional amount of the agreement. These potential amounts would be partially offset by any recovery values of the respective referenced obligations or net amounts received from a settlement of a credit default swap for the same reference security or obligation where a Fund bought credit protection.
A cross currency swap is an agreement which a Fund may enter into to gain or mitigate exposure to currency risk. A cross currency swap is an agreement to exchange cash flows on a notional amount of two or more currencies based on the relative value differential among them. Such swaps may involve initial and final exchanges that correspond to the agreed upon notional amount. Cross currency swaps usually involve the delivery of the entire principle value of one designated currency in exchange for other designated currency. Therefore, the entire principle value of a cross currency swap is subject to risk that
58
GOLDMAN SACHS FIXED INCOME ALTERNATIVES STRATEGIES FUNDS
|
| 3. INVESTMENTS AND FAIR VALUE MEASUREMENTS (continued) |
the other party to the swap will default on its contractual delivery obligations. If there is a default by the counterparty, the Fund may have contractual remedies pursuant to the agreements related to the transaction.
A total return swap is an agreement that gives a Fund the right to receive the appreciation in the value of a specified security, index or other instrument in return for a fee paid to the counterparty, which will typically be an agreed upon interest rate. If the underlying asset declines in value over the term of the swap, a Fund may also be required to pay the dollar value of that decline to the counterparty.
Short Term Investments — Short-term investments having a maturity of 60 days or less are generally valued at amortized cost which approximates fair market value. These investments are classified as Level 2 of the fair value hierarchy.
i. Repurchase Agreements — Repurchase agreements involve the purchase of securities subject to the seller’s agreement to repurchase the securities at a mutually agreed upon date and price, under the terms of a Master Repurchase Agreement (“MRA”). During the term of a repurchase agreement, the value of the underlying securities held as collateral on behalf of a Fund, including accrued interest, is required to exceed the value of the repurchase agreement, including accrued interest. The gross value of repurchase agreements is included in the Statements of Assets and Liabilities for financial reporting purposes. The underlying securities for all repurchase agreements are held at the Funds’ custodian or designated sub-custodians under tri-party repurchase agreements.
An MRA governs transactions between a Fund and select counterparties. An MRA contains provisions for, among other things, initiation of the transaction, income payments, events of default and maintenance of securities for repurchase agreements. An MRA also permits offsetting with collateral to create one single net payment in the event of default or similar events, including the bankruptcy or insolvency of a counterparty.
If the seller defaults, a Fund could suffer a loss to the extent that the proceeds from the sale of the underlying securities and other collateral held by the Fund are less than the repurchase price and the Fund’s costs associated with delay and enforcement of the repurchase agreement. In addition, in the event of default or insolvency of the seller, a court could determine that a Fund’s interest in the collateral is not enforceable, resulting in additional losses to the Fund.
Pursuant to exemptive relief granted by the Securities and Exchange Commission (“SEC”) and terms and conditions contained therein, the Funds, together with other funds of the Trust and registered investment companies having management agreements with GSAM or its affiliates, may transfer uninvested cash into joint accounts, the daily aggregate balance of which is invested in one or more repurchase agreements. Under these joint accounts, the Funds maintain pro-rata credit exposure to the underlying repurchase agreements’ counterparties. With the exception of certain transaction fees, the Funds are not subject to any expenses in relation to these investments.
B. Level 3 Fair Value Investments — To the extent that significant inputs to valuation models and other alternative pricing sources are unobservable, or if quotations are not readily available, or if GSAM believes that such quotations do not accurately reflect fair value, the fair value of the Funds’ investments may be determined under Valuation Procedures approved by the Trustees. GSAM, consistent with its procedures and applicable regulatory guidance, may make an adjustment to the most recent valuation prices of either domestic or foreign securities in light of significant events to reflect what it believes to be the fair value of the securities at the time of determining a Fund’s NAV. Significant events which could affect a large number of securities in a particular market may include, but are not limited to: significant fluctuations in U.S. or foreign markets; market dislocations; market disruptions; or unscheduled market closings. Significant events which could also affect a single issuer may include, but are not limited to: corporate actions such as reorganizations, mergers and buy-outs; ratings downgrades; and bankruptcies.
59
GOLDMAN SACHS FIXED INCOME ALTERNATIVES STRATEGIES FUNDS
Notes to Financial Statements (continued)
March 31, 2016
|
| 3. INVESTMENTS AND FAIR VALUE MEASUREMENTS (continued) |
C. Fair Value Hierarchy — The following is a summary of the Funds’ investments and derivatives classified in the fair value hierarchy as of March 31, 2016:
| | | | | | | | | | | | |
| | | |
| FIXED INCOME MACRO STRATEGIES FUND | | | | | | | | | | | | |
| | | |
| Investment Type | | Level 1 | | | Level 2 | | | Level 3 | |
| Assets | |
Fixed Income | | | | | | | | | | | | |
Foreign Sovereign Debt Obligations | | $ | 1,840,603 | | | $ | 6,977,929 | | | $ | — | |
Mortgage-Backed Obligations | | | — | | | | 11,692,334 | | | | — | |
U.S. Treasury Obligations and/or Other U.S. Government Agencies | | | 12,948,719 | | | | 12,496,396 | | | | — | |
Asset-Backed Securities | | | — | | | | 412,789 | | | | — | |
Corporate Obligations | | | — | | | | 1,798,112 | | | | — | |
Investment Company | | | 12,172,945 | | | | — | | | | — | |
Short-term Investments | | | — | | | | 6,200,000 | | | | — | |
| Total | | $ | 26,962,267 | | | $ | 39,577,560 | | | $ | — | |
| | | |
| Derivative Type | | | | | | | | | |
| Assets | | | | | | | | | | | | |
Options Purchased | | $ | 12,229 | | | $ | 812,250 | | | $ | — | |
Forward Foreign Currency Exchange Contracts(a) | | | — | | | | 2,657,027 | | | | — | |
Interest Rate Swap Contracts(a) | | | — | | | | 3,992,314 | | | | — | |
Cross Currency Swap Contracts(a) | | | — | | | | 215,935 | | | | — | |
Non-Deliverable Bond Forward Contracts(a) | | | — | | | | 139,028 | | | | — | |
| Total | | $ | 12,229 | | | $ | 7,816,554 | | | $ | — | |
| Liabilities | | | | | | | | | | | | |
Forward Foreign Currency Exchange Contracts(a) | | $ | — | | | $ | (2,458,499 | ) | | $ | — | |
Futures Contracts(a) | | | (78,285 | ) | | | — | | | | — | |
Interest Rate Swap Contracts(a) | | | — | | | | (3,666,392 | ) | | | — | |
Cross Currency Swap Contracts(a) | | | — | | | | (492,106 | ) | | | — | |
Total Return Swap Contracts(a) | | | — | | | | (99 | ) | | | — | |
Written Options Contracts | | | (25,321 | ) | | | (811,720 | ) | | | — | |
| Total | | $ | (103,606 | ) | | $ | (7,428,816 | ) | | $ | — | |
60
GOLDMAN SACHS FIXED INCOME ALTERNATIVES STRATEGIES FUNDS
|
| 3. INVESTMENTS AND FAIR VALUE MEASUREMENTS (continued) |
| | | | | | | | | | | | |
| |
| LONG SHORT CREDIT STRATEGIES | | | | | |
| | | |
| Investment Type | | Level 1 | | | Level 2 | | | Level 3 | |
| Assets | | | | | | | | | | | | |
Fixed Income | | | | | | | | | | | | |
Bank Loans | | $ | — | | | $ | 18,891,312 | | | $ | — | |
Other Secured Debt Obligations | | | — | | | | 32,326,376 | | | | — | |
Unsecured Debt Obligations | | | — | | | | 102,114,145 | | | | — | |
U.S. Treasury Obligations | | | 2,049,418 | | | | — | | | | — | |
Common Stock and/or Other Equity Investments | | | | | | | | | | | | |
North America | | | — | | | | — | | | | 1,165,338 | |
Investment Company | | | 30,744,104 | | | | — | | | | — | |
| Total | | $ | 32,793,522 | | | $ | 153,331,833 | | | $ | 1,165,338 | |
| | | |
| Derivative Type | | | | | | | | | |
| Assets(a) | | | | | | | | | | | | |
Interest Rate Swap Contracts | | $ | — | | | $ | 7,718 | | | $ | — | |
| Liabilities(a) | | | | | | | | | | | | |
Forward Foreign Currency Exchange Contracts | | $ | — | | | $ | (18,346 | ) | | $ | — | |
Interest Rate Swap Contracts | | | — | | | | (618,307 | ) | | | — | |
Credit Default Swap Contracts | | | — | | | | (555,123 | ) | | | — | |
| Total | | $ | — | | | $ | (1,191,776 | ) | | $ | — | |
| (a) | | Amount shown represents unrealized gain (loss) at period end. |
For further information regarding security characteristics, see the Schedules of Investments.
61
GOLDMAN SACHS FIXED INCOME ALTERNATIVES STRATEGIES FUNDS
Notes to Financial Statements (continued)
March 31, 2016
|
| 4. INVESTMENTS IN DERIVATIVES |
The following tables set forth, by certain risk types, the gross value of derivative contracts as of March 31, 2016. These instruments were used as part of the Funds’ investment strategies and to obtain and/or manage exposure related to the risks below. The values in the tables below exclude the effects of cash collateral received or posted pursuant to these derivative contracts, and therefore are not representative of the Funds’ net exposure.
| | | | | | | | | | | | |
|
| Fixed Income Macro Strategies | |
| Risk | | Consolidated Statements of Assets and Liabilities | | Assets | | | Consolidated Statements of Assets and Liabilities | | Liabilities | |
Interest rate | | Variation margin on certain derivative contracts; Receivable for unrealized gain on swap contracts; Receivable for unrealized gain on non-deliverable bond forward contracts; Investments, at value | | $ | 4,955,821 | (a) | | Variation margin on certain derivative contracts; Payable for unrealized loss on swap contracts; Written options, at value | | $ | (4,457,463) | (a)(b) |
Commodity | | — | | | — | | | Payable for unrealized loss on swap contracts | | | (99) | (b) |
Currency | | Receivable for unrealized gain on swap contracts; Receivable for unrealized gain on forward foreign currency exchange contracts | | $ | 2,872,962 | | | Payable for unrealized loss on swap contracts; Payable for unrealized loss on forward foreign currency exchange contracts; Written options, at value | | $ | (2,996,575) | (b) |
Equity | | — | | | — | | | Variation margin on certain derivative contracts | | | (78,285) | (a) |
| Total | | | | $ | 7,828,783 | | | | | $ | (7,532,422) | |
|
| Long Short Credit Strategies | |
| Risk | | Statements of Assets and Liabilities | | Assets | | | Statements of Assets and Liabilities | | Liabilities | |
Interest rate | | Variation margin on certain derivative contracts | | $ | 7,718 | (a) | | Variation margin on certain derivative contracts | | $ | (618,307) | (a) |
Credit | | — | | | — | | | Variation margin on certain derivative contracts | | | (555,123) | (a) |
Currency | | — | | | — | | | Payable for unrealized loss on forward foreign currency exchange contracts | | | (18,346) | |
| Total | | | | $ | 7,718 | | | | | | $(1,191,776) | |
| (a) | | Includes unrealized gain (loss) on futures contracts and centrally cleared swaps described in the Additional Investment Information sections of the Schedules of Investments. Only current day’s variation margin is reported within the Statements of Assets and Liabilities. |
| (b) | | Aggregate of amounts include $1,579,511 for Fixed Income Macro Strategies Fund, which represent the payments to be made pursuant to bilateral agreements should counterparties exercise their “right to terminate” provisions based on, among others, the Funds’ performance, its failure to pay on its obligations or failure to pledge collateral. Such amounts do not include incremental charges directly associated with the close-out of the agreements. They also do not reflect the fair value of any assets pledged as collateral which, through the daily margining process, substantially offsets the aforementioned amounts and for which the Fund is entitled to a full return. |
62
GOLDMAN SACHS FIXED INCOME ALTERNATIVES STRATEGIES FUNDS
|
| 4. INVESTMENTS IN DERIVATIVES (continued) |
The following tables set forth, by certain risk types, the Funds’ gains (losses) related to these derivatives and their indicative volumes for the fiscal year ended March 31, 2016. These gains (losses) should be considered in the context that these derivative contracts may have been executed to create investment opportunities and/or economically hedge certain investments, and accordingly, certain gains (losses) on such derivative contracts may offset certain (losses) gains attributable to investments. These gains (losses) are included in “Net realized gain (loss)” or “Net change in unrealized gain (loss)” on the Statements of Operations:
| | | | | | | | | | | | | | |
|
| Fixed Income Macro Strategies | |
| Risk | | Consolidated Statements of Operations | | Net Realized
Gain (Loss) | | | Net Change in
Unrealized
Gain (Loss) | | | Average
Number of
Contracts(a) | |
| Interest rate | | Net realized gain (loss) from investments, futures contracts, swap contracts, non- deliverable bond forward contracts and written options/Net change in unrealized gain (loss) on investments, futures contracts, swap contracts, non-deliverable bond forward contracts and written options | | $ | 1,755,560 | | | $ | 963,242 | | | | 314 | |
| Commodity | | Net realized gain (loss) from swap contracts/Net change in unrealized gain (loss) on swap contracts | | | 439,056 | | | | (74 | ) | | | 21 | |
| Credit | | Net realized gain (loss) from swap contracts/Net change in unrealized gain (loss) on swap contracts | | | (133,727 | ) | | | 53,652 | | | | 25 | |
| Currency | | Net realized gain (loss) from investments, swap contracts, forward foreign currency exchange contracts and written options/Net change in unrealized gain (loss) on investments, swap contracts, forward foreign currency exchange contracts and written options | | | 553,352 | | | | (812,915 | ) | | | 540 | |
| Equity | | Net realized gain (loss) from futures contracts/Net change in unrealized gain (loss) on futures contracts | | | (24,892 | ) | | | (28,570 | ) | | | 46 | |
| Total | | | | $ | 2,589,349 | | | $ | 175,335 | | | | 946 | |
|
| Long Short Credit Strategies | |
| Risk | | Statements of Operations | | Net Realized
Gain (Loss) | | | Net Change in
Unrealized
Gain (Loss) | | | Average
Number of
Contracts(a) | |
| Interest rate | | Net realized gain (loss) from swap contracts /Net change in unrealized gain (loss) on swap contracts | | $ | (832,239 | ) | | $ | (21,917 | ) | | | 4 | |
| Credit | | Net realized gain (loss) from swap contracts/Net change in unrealized gain (loss) on swap contracts | | | (1,074,673 | ) | | | (163,832 | ) | | | 1 | |
| Currency | | Net realized gain (loss) from forward foreign currency exchange contracts / Net change in unrealized gain (loss) on forward foreign currency exchange contracts | | | 1,578,012 | | | | (1,594,439 | ) | | | 1 | |
| Total | | | | $ | (328,900 | ) | | $ | (1,780,188 | ) | | | 6 | |
| (a) | | Average number of contracts is based on the average of month end balances for the fiscal year ended March 31, 2016. |
63
GOLDMAN SACHS FIXED INCOME ALTERNATIVES STRATEGIES FUNDS
Notes to Financial Statements (continued)
March 31, 2016
|
| 4. INVESTMENTS IN DERIVATIVES (continued) |
In order to better define its contractual rights and to secure rights that will help a Fund mitigate its counterparty risk, a Fund may enter into an International Swaps and Derivatives Association, Inc. Master Agreement (“ISDA Master Agreement”) or similar agreement with its derivatives counterparties. An ISDA Master Agreement is a bilateral agreement between a Fund and a counterparty that governs OTC derivatives (including forward foreign currency exchange contracts, and certain options and swaps), and typically contains, among other things, collateral posting terms and netting provisions in the event of a default and/or termination event. The provisions of the ISDA Master Agreement typically permit a single net payment in the event of a default (close-out netting) or similar event, including the bankruptcy or insolvency of the counterparty.
Collateral and margin requirements differ between exchange traded derivatives and OTC derivatives. Margin requirements are established by the broker or clearing house for exchange-traded and centrally cleared derivatives (financial futures contracts, options and centrally cleared swaps) pursuant to governing agreements for those instrument types. Brokers can ask for margin in excess of the minimum in certain circumstances. Collateral terms are contract-specific for OTC derivatives. For derivatives traded under an ISDA Master Agreement, the collateral requirements are typically calculated by netting the marked to market amount for each transaction under such agreement and comparing that amount to the value of any collateral currently pledged by a Fund and the counterparty. Additionally, a Fund may be required to post initial margin to the counterparty, the terms of which would be outlined in the confirmation of the OTC transaction.
For financial reporting purposes, cash collateral that has been pledged to cover obligations of a Fund and cash collateral received from the counterparty, if any, is reported separately on the Statements of Assets and Liabilities as receivables/payables for collateral on certain derivative contracts. Non-cash collateral pledged by a Fund, if any, is noted in the Schedules of Investments. Generally, the amount of collateral due from or to a counterparty must exceed a minimum transfer amount threshold before a transfer is required to be made. To the extent amounts due to a Fund from its counterparties are not fully collateralized, contractually or otherwise, the Fund bears the risk of loss from counterparty nonperformance. A Fund attempts to mitigate counterparty risk by only entering into agreements with counterparties that the Investment Adviser believes to be of good standing and by monitoring the financial stability of those counterparties.
Additionally, the netting of assets and liabilities and the offsetting of collateral pledged or received are based on contractual netting/set-off provisions in the ISDA Master Agreement or similar agreements. However, in the event of a default or insolvency of a counterparty, a court could determine that such rights are not enforceable due to the restrictions or prohibitions against the right of setoff that may be imposed in accordance with a particular jurisdiction’s bankruptcy or insolvency laws.
64
GOLDMAN SACHS FIXED INCOME ALTERNATIVES STRATEGIES FUNDS
|
| 4. INVESTMENTS IN DERIVATIVES (continued) |
The following table sets forth the Fixed Income Macro Strategies Fund’s net exposure for derivative instruments that are subject to enforceable master netting arrangements or similar agreements as of March 31, 2016:
| | | | | | | | | | | | | | | | | | | | | | | | | | | | | | | | | | | | | | | | | | | | |
| | | Derivative Assets(1) | | | Derivative Liabilities(1) | | | Net Derivative
Asset
(Liabilities) | | | Collateral
(Received)
Pledged(1) | | | Net
Amount(2) | |
| Counterparty | | Options
Purchased | | | Swaps | | | Forward
Currency
Contracts | | | Total | | | Swaps | | | Forward
Currency
Contracts | | | Options
Written | | | Total | | | | |
Bank of America Securities LLC | | $ | 42,696 | | | $ | 437,281 | | | $ | — | | | $ | 479,977 | | | $ | (584,969 | ) | | $ | — | | | $ | (32,704 | ) | | $ | (617,673 | ) | | $ | (137,696 | ) | | $ | 137,696 | | | $ | — | |
Barclays Bank PLC | | | — | | | | 10,658 | | | | — | | | | 10,658 | | | | (85,296 | ) | | | — | | | | — | | | | (85,296 | ) | | | (74,638 | ) | | | — | | | | (74,638 | ) |
BNP Paribas SA | | | — | | | | — | | | | — | | | | — | | | | — | | | | — | | | | (27,077 | ) | | | (27,077 | ) | | | (27,077 | ) | | | — | | | | (27,077 | ) |
Citibank NA | | | — | | | | 265,008 | | | | 2,657,027 | | | | 2,922,035 | | | | (67,831 | ) | | | (2,458,499 | ) | | | (4,391 | ) | | | (2,530,721 | ) | | | 391,314 | | | | — | | | | 391,314 | |
Credit Suisse International (London) | | | — | | | | — | | | | — | | | | — | | | | (21,481 | ) | | | — | | | | — | | | | (21,481 | ) | | | (21,481 | ) | | | — | | | | (21,481 | ) |
Deutsche Bank AG | | | 26,702 | | | | 212,565 | | | | 139,028 | * | | | 378,295 | | | | (53,314 | ) | | | — | | | | (20,578 | ) | | | (73,892 | ) | | | 304,403 | | | | — | | | | 304,403 | |
JPMorgan Securities, Inc. | | | 2 | | | | 175,726 | | | | — | | | | 175,728 | | | | (632,874 | ) | | | — | | | | (14,502 | ) | | | (647,376 | ) | | | (471,648 | ) | | | 390,000 | | | | (81,648 | ) |
Merrill Lynch & Co., Inc. | | | — | | | | — | | | | — | | | | — | | | | (99 | ) | | | — | | | | — | | | | (99 | ) | | | (99 | ) | | | 99 | | | | — | |
Morgan Stanley & Co. International PLC | | | — | | | | 140,751 | | | | — | | | | 140,751 | | | | (133,647 | ) | | | — | | | | — | | | | (133,647 | ) | | | 7,104 | | | | (7,104 | ) | | | — | |
Morgan Stanley Capital Services, Inc. | | | 742,850 | | | | — | | | | — | | | | 742,850 | | | | — | | | | — | | | | (712,468 | ) | | | (712,468 | ) | | | 30,382 | | | | (30,382 | ) | | | — | |
Total | | $ | 812,250 | | | $ | 1,241,989 | | | $ | 2,796,055 | | | $ | 4,850,294 | | | $ | (1,579,511 | ) | | $ | (2,458,499 | ) | | $ | (811,720 | ) | | $ | (4,849,730 | ) | | $ | 564 | | | $ | 490,309 | | | $ | 490,873 | |
| * | | Includes Non-Deliverable Bond Forward Contracts assets of $139,028. |
| (1) | | Gross amounts available for offset but not netted in the Statement of Assets and Liabilities. |
| (2) | | Net amount represents the net amount due (to) from counterparty in the event of a default based on the contractual set-off rights under the agreement. Net amount excludes any over-collateralized amounts. |
|
| 5. AGREEMENTS AND AFFILIATED TRANSACTIONS |
A. Management Agreement — Under the Agreement, GSAM manages the Funds, subject to the general supervision of the Trustees.
As compensation for the services rendered pursuant to the Agreement, the assumption of the expenses related thereto and administration of the Funds’ business affairs, including providing facilities, GSAM is entitled to a management fee, accrued daily and paid monthly, equal to an annual percentage rate of each Fund’s average daily net assets.
For the fiscal year ended March 31, 2016, contractual and effective net management fees with GSAM were at the following rates:
| | | | | | | | | | | | | | | | | | | | | | | | | | | | | | |
| | | | | Contractual Management Rate | | | Effective Net
Management
Rate^ | |
| Fund | | | | First
$1 billion | | | Next
$1 billion | | | Next
$3 billion | | | Next
$3 billion | | | Over
$8 billion | | | Effective
Rate | | |
Fixed Income Macro Strategies* | | | | | 1.50 | % | | | 1.50 | % | | | 1.35 | % | | | 1.28 | % | | | 1.26 | % | | | 1.50 | % | | | 1.33 | %(a)* |
Long Short Credit Strategies | | | | | 1.00 | | | | 0.90 | | | | 0.86 | | | | 0.84 | | | | 0.82 | | | | 1.00 | | | | 0.98 | |
| ^ | | Effective Net Management Rate includes the impact of management fee waivers of affiliated underlying funds, if any, and any additional voluntary management fee waivers, if applicable. |
| * | | GSAM has agreed to waive a portion of it management fee in order to achieve the effective net management rate of 1.35% as an annual percentage rate of the average daily net assets of the Fund through at least July 29, 2016. Prior to such date GSAM may not terminate the arrangement without the approval of the Trustees. |
| (a) | | Reflects combined management fees paid to GSAM under the Agreement and the Subsidiary Agreement as defined below after waivers. |
65
GOLDMAN SACHS FIXED INCOME ALTERNATIVES STRATEGIES FUNDS
Notes to Financial Statements (continued)
March 31, 2016
|
| 5. AGREEMENTS AND AFFILIATED TRANSACTIONS (continued) |
The Fixed Income Macro Strategies and Long Short Credit Strategies Funds invest in the FST Institutional Shares of the Goldman Financial Square Government Fund, which is an affiliated Underlying Fund. GSAM has agreed to waive a portion of its management fee payable by the Funds in an amount equal to the management fee it earns as an investment adviser to any of the affiliated Underlying Funds in which the Funds invest. For the fiscal year ended March 31, 2016, GSAM waived $11,587 and $41,291 of the Underlying Fund’s management fee for Fixed Income Macro Strategies Fund and Long Short Credit Strategies Fund, respectively.
GSAM also provides management services to the Subsidiary pursuant to a Subsidiary Management Agreement (the “Subsidiary Agreement”) and is entitled to a management fee accrued daily and paid monthly, equal to an annual percentage rate of 0.42% of the Subsidiary’s average daily net assets. In consideration of the Subsidiary’s management fee, and for as long as the Subsidiary Agreement remains in effect, GSAM has contractually agreed to waive irrevocably a portion of the Fund’s management fee in an amount equal to the management fee accrued and paid to GSAM by the Subsidiary under the Subsidiary Agreement. For the fiscal year ended March 31, 2016 GSAM waived $54,139 of the Fund’s management fee. This waiver represents an interfund transaction and, accordingly, has been eliminated in consolidation.
B. Distribution and Service Plans — The Trust, on behalf of each Fund, has adopted Distribution and Service Plans (the “Plans”). Under the Plans, Goldman Sachs, which serves as distributor (the “Distributor”), is entitled to a fee accrued daily and paid monthly, for distribution services and personal and account maintenance services, which may then be paid by Goldman Sachs to authorized dealers, at the following annual rates calculated on a Fund’s average daily net assets of each respective share class:
| | | | | | | | | | | | |
| | | Distribution and Service Plan Rates | |
| | | Class A* | | | Class C | | | Class R* | |
Distribution Plan | | | 0.25 | % | | | 0.75 | % | | | 0.50 | % |
Service Plan | | | — | | | | 0.25 | | | | — | |
| * | | With respect to Class A and Class R Shares, the Distributor at its discretion may use compensation for distribution services paid under the Distribution Plan to compensate service organizations for personal and account maintenance services and expenses as long as such total compensation does not exceed the maximum cap on “service fees” imposed by the Financial Industry Regulatory Authority. |
For the fiscal year ended March 31, 2016, Goldman Sachs waived a portion of the distribution and service fees equal to 0.07% of the average daily net assets attributable to Class A Shares, 0.33% of the average daily net assets attributable to Class C Shares and 0.08% of the average daily net assets attributable to Class R Shares of the Fixed Income Macro Strategies Fund.
C. Distribution Agreement — Goldman Sachs, as Distributor of the shares of the Funds pursuant to a Distribution Agreement, may retain a portion of the Class A Shares’ front end sales charge and Class C Shares’ CDSC. During the fiscal year ended March 31, 2016, Goldman Sachs advised that it retained $1,065 and $2,256 in front end sales charges for the Fixed Income Macro Strategies and the Long Short Credit Strategies Funds, respectively, and it did not retain any contingent deferred sales charges for either fund.
D. Transfer Agency Agreement — Goldman Sachs also serves as the transfer agent of the Funds for a fee pursuant to the Transfer Agency Agreement. The fees charged for such transfer agency services are accrued daily and paid monthly at annual rates as follows: 0.13% of the average daily net assets of Class A, Class C, Class IR and Class R Shares and 0.04% of the average daily net assets of Institutional Shares.
For the fiscal year ended March 31, 2016, Goldman Sachs waived a portion of the transfer agency fees equal to 0.02% of the average daily net assets attributable to Class IR shares and equal to 0.01% of the average daily net assets of Institutional Shares of the Fixed Income Macro Strategies Fund.
66
GOLDMAN SACHS FIXED INCOME ALTERNATIVES STRATEGIES FUNDS
|
| 5. AGREEMENTS AND AFFILIATED TRANSACTIONS (continued) |
E. Other Expense Agreements and Affiliated Transactions — GSAM has agreed to limit certain “Other Expenses” of the Funds (excluding acquired fund fees and expenses, transfer agency fees and expenses, taxes, interest, brokerage fees, shareholder meeting, litigation, indemnification and extraordinary expenses), to the extent such expenses exceed, on an annual basis, a percentage rate of the average daily net assets of each Fund. Such Other Expense reimbursements, if any, are accrued daily and paid monthly. In addition, the Funds are not obligated to reimburse GSAM for prior fiscal year expense reimbursements, if any. The Other Expense limitations as an annual percentage rate of average daily net assets for the Fixed Income Macro Strategies and Long Short Credit Strategies Funds are 0.064% and 0.094%, respectively. Prior to July 29, 2015, the Other Expense limitation for the Long Short Credit Strategies Fund was 0.204%. These Other Expense limitations will remain in place through at least July 29, 2016, and prior to such date GSAM may not terminate the arrangements without the approval of the Trustees. In addition, the Funds have entered into certain offset arrangements with the transfer agent, which may result in a reduction of the Funds’ expenses and are received irrespective of the application of the “Other Expense” limitations described above.
For the fiscal year ended March 31, 2016, these expense reductions, including any fee waivers and Other Expense reimbursements, were as follows:
| | | | | | | | | | | | | | | | | | | | | | |
| Fund | | | | Management
Fee Waiver | | | Distribution and Service
Fees | | | Transfer
Agency Fees | | | Other
Expense
Reimbursements | | | Total Expense
Reductions | |
Fixed Income Macro Strategies | | | | $ | 115,943 | | | $ | 929 | | | $ | 6,870 | | | $ | 817,456 | | | $ | 941,198 | |
Long Short Credit Strategies | | | | | 41,291 | | | | — | | | | — | | | | 124,351 | | | | 165,642 | |
F. Line of Credit Facility — As of March 31, 2016, the Funds participated in a $1,205,000,000 committed, unsecured revolving line of credit facility (the “facility”) together with other funds of the Trust and certain registered investment companies having management agreements with GSAM or its affiliates (“Other Borrowers”). Pursuant to the terms of the facility, the Funds and Other Borrowers could increase the credit amount by up to an additional $115,000,000 for a total of up to $1,320,000,000. This facility is to be used for temporary emergency purposes, or to allow for an orderly liquidation of securities to meet redemption requests. The interest rate on borrowings is based on the federal funds rate. The facility also requires a fee to be paid by the Funds based on the amount of the commitment that has not been utilized. For the fiscal year ended March 31, 2016, the Funds did not have any borrowings under the facility.
G. Other Transactions with Affiliates — As of March 31, 2016, The Goldman Sachs Group, Inc. (“GSG”) was the beneficial owner of approximately 5% or more of the following outstanding shares of the Funds:
| | | | | | | | | | | | | | | | | | | | | | |
| Fund | | | | Class A | | | Class C | | | Institutional | | | Class IR | | | Class R | |
Fixed Income Macro Strategies | | | | | — | % | | | 7 | % | | | 33 | % | | | — | % | | | 100 | % |
Long Short Credit Strategies | | | | | — | | | | — | | | | — | | | | — | | | | 73 | |
67
GOLDMAN SACHS FIXED INCOME ALTERNATIVES STRATEGIES FUNDS
Notes to Financial Statements (continued)
March 31, 2016
|
| 5. AGREEMENTS AND AFFILIATED TRANSACTIONS (continued) |
The table below shows the transactions in and earnings from investments by the Funds in the Underlying Fund for the fiscal year ended March 31, 2016:
| | | | | | | | | | | | | | | | | | | | | | |
| Fund | | Underlying Fund | | Market
Value 3/31/15 | | | Purchases at Cost | | | Proceeds from Sales | | | Market
Value 3/31/16 | | | Dividend Income | |
Fixed Income Macro Strategies | | Goldman Sachs Financial Square Government Fund | | $ | — | | | $ | 18,259,874 | | | $ | (6,086,929 | ) | | $ | 12,172,945 | | | $ | 9,738 | |
Long Short Credit Strategies | | Goldman Sachs Financial Square Government Fund | | | 11,250,687 | | | | 152,638,358 | | | | (133,144,941 | ) | | | 30,744,104 | | | | 21,968 | |
|
| 6. PORTFOLIO SECURITIES TRANSACTIONS |
The cost of purchases and proceeds from sales and maturities of long-term securities for the fiscal year ended March 31, 2016, were as follows:
| | | | | | | | | | | | | | | | | | |
| Fund | | | | Purchases of
U.S. Government and
Agency Obligations | | | Purchases (Excluding
U.S. Government and
Agency Obligations) | | | Sales and
Maturities of
U.S. Government and
Agency Obligations | | | Sales and
Maturities (Excluding
U.S. Government and
Agency Obligations) | |
Fixed Income Macro Strategies | | | | $ | 116,114,073 | | | $ | 37,975,570 | | | $ | 110,030,016 | | | $ | 50,529,325 | |
Long Short Credit Strategies | | | | | — | | | | 279,332,676 | | | | — | | | | 296,766,066 | |
The tax character of distributions paid during the fiscal year ended March 31, 2016 was as follows:
| | | | | | | | |
| | | Fixed Income
Macro
Strategies | | | Long Short
Credit
Strategies | |
Distribution paid from: | | | | | | | | |
Ordinary income | | $ | 2,286,580 | | | $ | 7,405,288 | |
Total taxable distributions | | $ | 2,286,580 | | | $ | 7,405,288 | |
Tax return of capital | | $ | 1,908,821 | | | $ | — | |
68
GOLDMAN SACHS FIXED INCOME ALTERNATIVES STRATEGIES FUNDS
|
| 7. TAX INFORMATION (continued) |
The tax character of distributions paid during the fiscal year ended March 31, 2015 was as follows:
| | | | | | | | |
| | | Fixed Income
Macro
Strategies | | | Long Short
Credit
Strategies | |
Distribution paid from: | | | | | | | | |
Ordinary income | | $ | — | | | $ | 10,845,873 | |
Tax return of capital | | $ | 244,700 | | | $ | — | |
As of March 31, 2016, the components of accumulated earnings (losses) on a tax basis were as follows:
| | | | | | | | |
| | | Fixed Income
Macro
Strategies | | | Long Short
Credit
Strategies | |
Undistributed ordinary income — net | | $ | — | | | $ | 1,995,438 | |
Total undistributed earnings | | $ | — | | | $ | 1,995,438 | |
Capital loss carryforwards: | | | | | | | | |
Perpetual Short-Term | | | (3,918,527 | ) | | | (11,611,084 | ) |
Perpetual Long-Term | | | (3,807,524 | ) | | | (2,327,237 | ) |
Total capital loss carryforwards | | $ | (7,726,051 | ) | | $ | (13,938,321 | ) |
Timing differences (Qualified Late Year Loss Deferral, Post October Loss Deferral, Straddle Deferral and Dividend Payable) | | $ | (1,611,094 | ) | | $ | (5,289,234 | ) |
Unrealized gains (losses) — net | | | 533,350 | | | | (3,031,507 | ) |
Total accumulated earnings (losses) net | | $ | (8,803,795 | ) | | $ | (20,263,624 | ) |
As of March 31, 2016, the Funds’ aggregate security unrealized gains and losses based on cost for U.S. federal income tax purposes were as follows:
| | | | | | | | |
| | | Fixed Income
Macro
Strategies | | | Long Short
Credit
Strategies | |
Tax Cost | | $ | 67,525,423 | | | $ | 189,221,564 | |
Gross unrealized gain | | | 798,947 | | | | 2,297,076 | |
Gross unrealized loss | | | (960,064 | ) | | | (4,227,947 | ) |
Net unrealized gains (losses) on securities | | $ | (161,117 | ) | | $ | (1,930,871 | ) |
Net unrealized gain (loss) on other investments | | | 694,467 | | | | (1,100,636 | ) |
Net unrealized gains (losses) | | $ | 533,350 | | | $ | (3,031,507 | ) |
69
GOLDMAN SACHS FIXED INCOME ALTERNATIVES STRATEGIES FUNDS
Notes to Financial Statements (continued)
March 31, 2016
|
| 7. TAX INFORMATION (continued) |
The difference between GAAP-basis and tax-basis unrealized gains (losses) is attributable primarily to wash sales, net mark to market gains/(losses) on regulated futures, foreign currency contracts and options contracts, and differences in the tax treatment of swap transactions, inflation protected securities, and underlying Fund investments.
In order to present certain components of the Funds’ capital accounts on a tax-basis, certain reclassifications have been recorded to the Funds’ accounts. These reclassifications have no impact on the NAV of the Funds and result primarily from differences in the tax treatment of swap transactions, foreign currency transactions, the recognition of income and gains/losses of certain bonds, inflation protected securities, and underlying fund investments.
| | | | | | | | | | | | | | |
| Fund | | | | Paid-in
Capital | | | Accumulated
Net Realized
Gain (Loss) | | | Undistributed
Net Investment
Income (Loss) | |
Fixed Income Macro Strategies | | | | $ | 488,405 | | | $ | (2,368,976 | ) | | $ | 1,880,571 | |
Long Short Credit Strategies | | | | | — | | | | (1,096,005 | ) | | | 1,096,005 | |
GSAM has reviewed the Funds’ tax positions for all open tax years (the current year, as applicable) and has concluded that no provision for income tax is required in the Funds’ financial statements. Such open tax years remain subject to examination and adjustment by tax authorities.
The Funds’ risks include, but are not limited to, the following:
Derivatives Risk — Loss may result from the Funds’ investments in derivative instruments. These instruments may be illiquid, difficult to price and leveraged so that small changes in the value of the underlying instruments may produce disproportionate losses to the Funds. Derivatives are also subject to counterparty risk, which is the risk that the other party in the transaction will not fulfill its contractual obligation. Losses from investments in derivatives can result from a lack of correlation between changes in the value of derivative instruments and the portfolio assets (if any) being hedged.
Foreign Custody Risk — A Fund that invests in foreign securities may hold such securities and cash with foreign banks, agents, and securities depositories appointed by the Fund’s custodian (each a “Foreign Custodian”). Some foreign custodians may be recently organized or new to the foreign custody business. In some countries, Foreign Custodians may be subject to little or no regulatory oversight over, or independent evaluation of, their operations. Further, the laws of certain countries may place limitations on a Fund’s ability to recover its assets if a Foreign Custodian enters bankruptcy.
Interest Rate Risk — When interest rates increase, fixed income securities or instruments held by the Funds will generally decline in value. Long-term fixed income securities or instruments will normally have more price volatility because of this risk than short-term fixed income securities or instruments. The risks associated with increasing rates are heightened given that interest rates are near historic lows, but are expected to increase in the future with unpredictable effects on the markets and the Funds’ investments.
Investments in Other Investment Companies — As a shareholder of another investment company, a Funds will indirectly bear its proportionate share of any net management fees and other expenses paid by such other investment companies, in addition to the fees and expenses regularly borne by the Fund.
70
GOLDMAN SACHS FIXED INCOME ALTERNATIVES STRATEGIES FUNDS
|
| 8. OTHER RISKS (continued) |
Large Shareholder Transactions Risk — A Fund may experience adverse effects when certain large shareholders, such as other funds, institutional investors (including those trading by use of non-discretionary mathematical formulas), financial intermediaries (who may make investment decisions on behalf of underlying clients and/or include a Fund in their investment model), individuals, accounts and Goldman Sachs affiliates, purchase or redeem large amounts of shares of a Fund. Such large shareholder redemptions may cause the Fund to sell portfolio securities at times when it would not otherwise do so, which may negatively impact a Fund’s NAV and liquidity. These transactions may also accelerate the realization of taxable income to shareholders if such sales of investments resulted in gains, and may also increase transaction costs. In addition, a large redemption could result in a Fund’s current expenses being allocated over a smaller asset base, leading to an increase in the Fund’s expense ratio. Similarly, large Fund share purchases may adversely affect a Fund’s performance to the extent that the Fund is delayed in investing new cash and is required to maintain a larger cash position than it ordinarily would.
Leverage Risk — Leverage creates exposure to potential gains and losses in excess of the initial amount invested. Borrowing and the use of derivatives may result in leverage and may make the Funds more volatile. When the Funds use leverage, the sum of the Funds’ investment exposure may significantly exceed the amount of assets invested in the Funds, although these exposures may vary over time. Relatively small market movements may result in large changes in the value of a leveraged investment. The Funds will identify liquid assets on its books or otherwise cover transactions that may give rise to such risk, to the extent required by applicable law. The use of leverage may cause the Funds to liquidate portfolio positions to satisfy their obligations or to meet segregation requirements when it may not be advantageous to do so. The use of leverage by the Funds can substantially increase the adverse impact to which the Funds’ investment portfolio may be subject.
Liquidity Risk — The Funds may make investments that are illiquid or that may become less liquid in response to market developments or adverse investor perceptions. Illiquid investments may be more difficult to value. Liquidity risk may also refer to the risk that a Fund will not be able to pay redemption proceeds within the allowable time period because of unusual market conditions, an unusually high volume of redemption requests, or other reasons. To meet redemption requests, a Fund may be forced to sell investments at an unfavorable time and/or under unfavorable conditions. Liquidity risk may be the result of, among other things, the reduced number and capacity of traditional market participants to make a market in fixed income securities or the lack of an active market. The potential for liquidity risk may be magnified by a rising interest rate environment or other circumstances where investor redemptions from fixed income mutual funds may be higher than normal, potentially causing increased supply in the market due to selling activity.
Loan-Related Investments Risk — In addition to risks generally associated with debt investments, loan related investments such as loan participations and assignments are subject to other risks. Although a loan obligation may be fully collateralized at the time of acquisition, the collateral may decline in value, be relatively illiquid, or lose all or substantially all of its value subsequent to investment. Many loan investments are subject to legal or contractual restrictions on resale and may be relatively illiquid and difficult to value. There is less readily available, reliable information about most loan investments than is the case for many other types of securities. Substantial increases in interest rates may cause an increase in loan obligation defaults. With respect to loan participations, the Fund may not always have direct recourse against a borrower if the borrower fails to pay scheduled principal and/or interest; may be subject to greater delays, expenses and risks than if the Fund had purchased a direct obligation of the borrower; and may be regarded as the creditor of the agent lender (rather than the borrower), subjecting the Fund to the creditworthiness of that lender as well. The market for loan obligations may be subject to irregular trading activity, wide bid/ask spreads and extended trade settlement periods. Because transactions in many loans are subject to extended trade settlement periods, the Fund may not receive the proceeds from the sale of a loan for a period after the sale. As a result, sale proceeds related to the sale of loans may not be available to make additional investments or to meet the Fund’s redemption obligations for a period after
71
GOLDMAN SACHS FIXED INCOME ALTERNATIVES STRATEGIES FUNDS
Notes to Financial Statements (continued)
March 31, 2016
|
| 8. OTHER RISKS (continued) |
the sale of the loans, and, as a result, the Fund may have to sell other investments or engage in borrowing transactions, such as borrowing from its credit facility, if necessary to raise cash to meet its obligations. Senior Loans hold the most senior position in the capital structure of a business entity, and are typically secured with specific collateral, but are nevertheless usually rated below investment grade. Because Second Lien Loans are subordinated or unsecured and thus lower in priority of payment to Senior Loans, they are subject to the additional risk that the cash flow of the borrower and property securing the loan or debt, if any, may be insufficient to meet scheduled payments after giving effect to the senior secured obligations of the borrower. Second Lien Loans generally have greater price volatility than Senior Loans and may be less liquid.
Market and Credit Risks — In the normal course of business, the Funds trade financial instruments and enter into financial transactions where risk of potential loss exists due to changes in the market (market risk). Additionally, the Funds may also be exposed to credit risk in the event that an issuer or guarantor fails to perform or that an institution or entity with which the Funds have unsettled or open transactions defaults.
Investing in foreign markets may involve special risks and considerations not typically associated with investing in the United States. Foreign securities may be subject to risk of loss because of more or less foreign government regulation, less public information and less economic, political and social stability in the countries in which the Funds invest. Loss may also result from the imposition of exchange controls, confiscations and other government restrictions by the United States or other governments, or from problems in registration, settlement or custody. Foreign risk also involves the risk of negative foreign currency rate fluctuations, which may cause the value of securities denominated in such foreign currency (or other instruments through which the Funds have exposure to foreign currencies) to decline in value. Currency exchange rates may fluctuate significantly over short periods of time. To the extent that the Funds also invest in securities of issuers located in emerging markets, these risks may be more pronounced.
Non-Diversification Risk — The Funds are non-diversified, meaning that they are permitted to invest a larger percentage of their assets in fewer issuers than diversified mutual funds. Thus, a Fund may be more susceptible to adverse developments affecting any single issuer held in its portfolio, and may be more susceptible to greater losses because of these developments.
Tax Risk — The Fixed Income Macro Strategies Fund will seek to gain exposure to the commodity markets primarily through investments in the Subsidiary and/or commodity index-linked structured notes, as applicable. Historically, the Internal Revenue Service (“IRS”) issued private letter rulings (“PLRs”) in which the IRS specifically concluded that income and gains from investments in commodity index-linked structured notes or a wholly-owned foreign subsidiary that invests in commodity-linked instruments are “qualifying income” for purposes of compliance with Subchapter M of the Code. However, the Fund has not received a PLR, and is not able to rely on PLRs issued to other taxpayers. Additionally, the IRS has suspended the granting of such PLRs, pending review of its position on this matter. In light of this, the Fixed Income Macro Strategies Fund has obtained an opinion of counsel that the Fund’s income from such investments should constitute “qualifying income.” However, no assurances can be provided that the IRS would not be able to successfully assert that the Fund’s income from such investments was not “qualifying income,” in which case the Fund would fail to qualify as a regulated investment company (“RIC”) under Subchapter M of the Code if over 10% of the gross income were derived from these investments. If a Fund failed to qualify as a RIC, it would be subject to federal and state income tax on all of its taxable income at regular corporate tax rates. This would significantly adversely affect the returns to, and could cause substantial losses for, Fund shareholders.
72
GOLDMAN SACHS FIXED INCOME ALTERNATIVES STRATEGIES FUNDS
|
| 9. INDEMNIFICATIONS (continued) |
Under the Trust’s organizational documents, its Trustees, officers, employees and agents are indemnified, to the extent permitted by the Act and state law, against certain liabilities that may arise out of performance of their duties to the Funds. Additionally, in the course of business, the Funds enter into contracts that contain a variety of indemnification clauses. The Funds’ maximum exposure under these arrangements is unknown, as this would involve future claims that may be made against the Funds that have not yet occurred. However, GSAM believes the risk of loss under these arrangements to be remote.
Subsequent events after the Statements of Assets and Liabilities date have been evaluated through the date the financial statements were issued. GSAM has concluded that there is no impact requiring adjustment or disclosure in the financial statements.
73
GOLDMAN SACHS FIXED INCOME ALTERNATIVES STRATEGIES FUNDS
Notes to Financial Statements (continued)
March 31, 2016
|
| 11. SUMMARY OF SHARE TRANSACTIONS |
Share activity is as follows:
| | | | | | | | | | | | | | | | |
| | | Fixed Income Macro Strategies Fund | |
| | | | |
| | | For the Fiscal Year Ended
March 31, 2016
| | | For the Fiscal Year Ended
March 31, 2015
| |
| | | | |
| | | Shares | | | Dollars | | | Shares | | | Dollars | |
| | | | |
| Class A Shares | | | | | | | | | | | | | | | | |
Shares sold | | | 26,725 | | | $ | 249,488 | | | | 336,237 | | | $ | 3,087,797 | |
Reinvestment of distributions | | | 2,133 | | | | 18,841 | | | | 208 | | | | 1,883 | |
Shares redeemed | | | (277,292 | ) | | | (2,502,916 | ) | | | (54,613 | ) | | | (494,518 | ) |
| | | | (248,434 | ) | | | (2,234,587 | ) | | | 281,832 | | | | 2,595,162 | |
| Class C Shares | | | | | | | | | | | | | | | | |
Shares sold | | | 13,558 | | | | 124,467 | | | | 39,295 | | | | 356,698 | |
Reinvestment of distributions | | | 1,003 | | | | 8,857 | | | | 14 | | | | 129 | |
Shares redeemed | | | (37,537 | ) | | | (344,018 | ) | | | (1,902 | ) | | | (17,269 | ) |
| | | | (22,976 | ) | | | (210,694 | ) | | | 37,407 | | | | 339,558 | |
| Institutional Shares | | | | | | | | | | | | | | | | |
Shares sold | | | 934,739 | | | | 8,649,986 | | | | 3,814,149 | | | | 37,384,501 | |
Reinvestment of distributions | | | 459,286 | | | | 4,066,209 | | | | 25,207 | | | | 235,132 | |
Shares redeemed | | | (1,929,082 | ) | | | (17,518,429 | ) | | | (5,991,769 | ) | | | (56,745,429 | ) |
| | | | (535,057 | ) | | | (4,802,234 | ) | | | (2,152,413 | ) | | | (19,125,796 | ) |
| Class IR Shares | | | | | | | | | | | | | | | | |
Shares sold | | | 152,010 | | | | 1,391,243 | | | | 543,071 | | | | 5,209,448 | |
Reinvestment of distributions | | | 11,316 | | | | 100,163 | | | | 817 | | | | 7,529 | |
Shares redeemed | | | (405,374 | ) | | | (3,768,851 | ) | | | (114,985 | ) | | | (1,075,798 | ) |
| | | | (242,048 | ) | | | (2,277,445 | ) | | | 428,903 | | | | 4,141,179 | |
| Class R Shares | | | | | | | | | | | | | | | | |
Reinvestment of distributions | | | 151 | | | | 1,331 | | | | 3 | | | | 27 | |
| | | | 151 | | | | 1,331 | | | | 3 | | | | 27 | |
NET DECREASE | | | (1,048,364 | ) | | $ | (9,523,629 | ) | | | (1,404,268 | ) | | $ | (12,049,870 | ) |
74
GOLDMAN SACHS FIXED INCOME ALTERNATIVES STRATEGIES FUNDS
|
| 11. SUMMARY OF SHARE TRANSACTIONS (continued) |
Share activity is as follows:
| | | | | | | | | | | | | | | | |
| | | Long Short Credit Strategies Fund | |
| | | | |
| | | For the Fiscal Year Ended
March 31, 2016
| | | For the Fiscal Year Ended
March 31, 2015
| |
| | | | |
| | | Shares | | | Dollars | | | Shares | | | Dollars | |
| | | | |
| Class A Shares | | | | | | | | | | | | | | | | |
Shares sold | | | 780,602 | | | $ | 7,528,825 | | | | 1,384,039 | | | $ | 14,242,762 | |
Reinvestment of distributions | | | 32,402 | | | | 308,344 | | | | 23,611 | | | | 231,696 | |
Shares redeemed | | | (640,044 | ) | | | (6,058,372 | ) | | | (698,285 | ) | | | (7,048,423 | ) |
| | | | 172,960 | | | | 1,778,797 | | | | 709,365 | | | | 7,426,035 | |
| Class C Shares | | | | | | | | | | | | | | | | |
Shares sold | | | 147,163 | | | | 1,409,220 | | | | 106,163 | | | | 1,096,805 | |
Reinvestment of distributions | | | 3,990 | | | | 37,801 | | | | 2,789 | | | | 27,283 | |
Shares redeemed | | | (67,789 | ) | | | (647,878 | ) | | | (5,118 | ) | | | (50,095 | ) |
| | | | 83,364 | | | | 799,143 | | | | 103,834 | | | | 1,073,993 | |
| Institutional Shares | | | | | | | | | | | | | | | | |
Shares sold | | | 5,991,005 | | | | 58,047,972 | | | | 10,597,097 | | | | 109,192,487 | |
Reinvestment of distributions | | | 598,839 | | | | 5,709,626 | | | | 985,024 | | | | 9,865,895 | |
Shares redeemed | | | (7,672,327 | ) | | | (73,971,045 | ) | | | (24,047,921 | ) | | | (244,786,078 | ) |
| | | | (1,082,483 | ) | | | (10,213,447 | ) | | | (12,465,800 | ) | | | (125,727,696 | ) |
| Class IR Shares | | | | | | | | | | | | | | | | |
Shares sold | | | 516,890 | | | | 4,934,925 | | | | 271,680 | | | | 2,772,337 | |
Reinvestment of distributions | | | 12,028 | | | | 114,437 | | | | 7,346 | | | | 71,932 | |
Shares redeemed | | | (246,720 | ) | | | (2,371,319 | ) | | | (26,124 | ) | | | (266,143 | ) |
| | | | 282,198 | | | | 2,678,043 | | | | 252,902 | | | | 2,578,126 | |
| Class R Shares | | | | | | | | | | | | | | | | |
Shares sold | | | 197 | | | | 1,907 | | | | 3,224 | | | | 33,292 | |
Reinvestment of distributions | | | 112 | | | | 1,062 | | | | 102 | | | | 1,010 | |
Shares redeemed | | | (117 | ) | | | (1,093 | ) | | | (38 | ) | | | (377 | ) |
| | | | 192 | | | | 1,876 | | | | 3,288 | | | | 33,925 | |
NET DECREASE | | | (543,769 | ) | | $ | (4,955,588 | ) | | | (11,396,411 | ) | | $ | (114,615,617 | ) |
75
Report of Independent Registered Public
Accounting Firm
To the Board of Trustees of Goldman Sachs Trust and Shareholders of
Goldman Sachs Fixed Income Alternatives Funds:
In our opinion, the accompanying statements of assets and liabilities, including the consolidated (as applicable) schedules of investments, and the related consolidated (as applicable) statements of operations and of changes in net assets and the financial highlights present fairly, in all material respects, the financial position of the Goldman Sachs Fixed Income Macro Strategies Fund and Goldman Sachs Long Short Credit Strategies Fund (collectively the “Funds”), funds of Goldman Sachs Trust, at March 31, 2016, and the results of each of their operations, the changes in each of their net assets and the financial highlights for each of the periods indicated, in conformity with accounting principles generally accepted in the United States of America. These financial statements (consolidated financial statements for the Goldman Sachs Fixed Income Macro Strategies Fund) and financial highlights (hereafter referred to as “financial statements”) are the responsibility of the Funds’ management. Our responsibility is to express an opinion on these financial statements based on our audits. We conducted our audits of these financial statements in accordance with the standards of the Public Company Accounting Oversight Board (United States). Those standards require that we plan and perform the audit to obtain reasonable assurance about whether the financial statements are free of material misstatement. An audit includes examining, on a test basis, evidence supporting the amounts and disclosures in the financial statements, assessing the accounting principles used and significant estimates made by management, and evaluating the overall financial statement presentation. We believe that our audits, which included confirmation of securities at March 31, 2016 by correspondence with the custodian, brokers, transfer agent of the underlying funds and the application of alternative auditing procedures where confirmation of securities purchased had not been received, provide a reasonable basis for the opinion expressed above.
PricewaterhouseCoopers LLP
Boston, Massachusetts
May 26, 2016
76
GOLDMAN SACHS FIXED INCOME ALTERNATIVES STRATEGIES FUNDS
| | |
Fund Expenses — Six Month Period Ended March 31, 2016 (Unaudited) | | |
As a shareholder of Class A, Class C, Institutional, Class IR or Class R Shares of a Fund, you incur two types of costs: (1) transaction costs, including sales charges on purchase payments (with respect to Class A Shares), contingent deferred sales charges on redemptions (with respect to Class C Shares), and (2) ongoing costs, including management fees; distribution and service (12b-1) fees (with respect to Class A and Class R Shares); and other Fund expenses. This Example is intended to help you understand your ongoing costs (in dollars) of investing in Class A, Class C, Institutional, Class IR or Class R Shares of the Funds and to compare these costs with the ongoing costs of investing in other mutual funds.
The Example is based on an investment of $1,000 invested at the beginning of the period and held for the entire period from October 1, 2015 through March 31, 2016, which represents a period of 183 days in a 366-day year.
Actual Expenses — The first line under each share class in the table below provides information about actual account values and actual expenses. You may use the information in this line, together with the amount you invested, to estimate the expenses that you paid over the period. Simply divide your account value by $1,000 (for example, an $8,600 account value divided by $1,000=8.6), then multiply the result by the number in the first line under the heading entitled “Expenses Paid” to estimate the expenses you paid on your account during this period.
Hypothetical Example for Comparison Purposes — The second line under each share class in the table below provides information about hypothetical account values and hypothetical expenses based on the Funds’ actual net expense ratios and an assumed rate of return of 5% per year before expenses, which is not the Funds’ actual return. The hypothetical account values and expenses may not be used to estimate the actual ending account balance or expenses you paid for the period. You may use this information to compare the ongoing costs of investing in the Funds and other funds. To do so, compare this 5% hypothetical example with the 5% hypothetical examples that appear in the shareholder reports of the other funds.
Please note that the expenses shown in the table are meant to highlight your ongoing costs only and do not reflect any transactional costs, such as sales charges, redemption fees, or exchange fees. Therefore, the second line of the table is useful in comparing ongoing costs only, and will not help you determine the relative total costs of owning different funds. In addition, if these transactional costs were included, your costs would have been higher.
| | | | | | | | | | | | | | | | | | | | | | | | |
| | | Fixed Income Macro Strategies Fund | | | Long Short Credit Strategies Fund | |
| Share Class | | Beginning
Account
Value
10/1/15 | | | Ending
Account
Value
3/31/16 | | | Expenses
Paid for the
6 months ended
3/31/16* | | | Beginning
Account
Value
10/1/15 | | | Ending
Account
Value
3/31/16 | | | Expenses
Paid for the
6 months ended
3/31/16* | |
| Class A | | | | | | | | | | | | | | | | | | | | | | | | |
Actual | | $ | 1,000.00 | | | $ | 1,006.20 | | | $ | 10.38 | | | $ | 1,000.00 | | | $ | 1,017.50 | | | $ | 7.52 | |
Hypothetical 5% return | | | 1,000.00 | | | | 1,014.65 | + | | | 10.43 | | | | 1,000.00 | | | | 1,017.55 | + | | | 7.52 | |
| Class C | | | | | | | | | | | | | | | | | | | | | | | | |
Actual | | | 1,000.00 | | | | 1,002.20 | | | | 15.97 | | | | 1,000.00 | | | | 1,013.70 | | | | 11.23 | |
Hypothetical 5% return | | | 1,000.00 | | | | 1,009.05 | + | | | 16.02 | | | | 1,000.00 | | | | 1,013.85 | + | | | 11.23 | |
| Institutional | | | | | | | | | | | | | | | | | | | | | | | | |
Actual | | | 1,000.00 | | | | 1,007.10 | | | | 8.13 | | | | 1,000.00 | | | | 1,018.20 | | | | 5.80 | |
Hypothetical 5% return | | | 1,000.00 | | | | 1,016.90 | + | | | 8.17 | | | | 1,000.00 | | | | 1,019.25 | + | | | 5.81 | |
| Class IR | | | | | | | | | | | | | | | | | | | | | | | | |
Actual | | | 1,000.00 | | | | 1,007.40 | | | | 7.53 | | | | 1,000.00 | | | | 1,018.80 | | | | 6.21 | |
Hypothetical 5% return | | | 1,000.00 | | | | 1,017.50 | + | | | 7.57 | | | | 1,000.00 | | | | 1,018.85 | + | | | 6.21 | |
| Class R | | | | | | | | | | | | | | | | | | | | | | | | |
Actual | | | 1,000.00 | | | | 1,005.70 | | | | 11.63 | | | | 1,000.00 | | | | 1,016.20 | | | | 8.77 | |
Hypothetical 5% return | | | 1,000.00 | | | | 1,013.40 | + | | | 11.68 | | | | 1,000.00 | | | | 1,016.30 | + | | | 8.77 | |
| | * | | Expenses for each share class are calculated using each Fund’s annualized net expense ratio for each class, which represents the ongoing expenses as a percentage of net assets for the six months ended March 31, 2016. Expenses are calculated by multiplying the annualized net expense ratio by the average account value for the period; then multiplying the result by the number of days in the most recent fiscal half year; and then dividing that result by the number of days in the fiscal year. The annualized net expense ratios for the period were as follows: | |
| | | | | | | | | | | | | | | | | | | | |
| Fund | | Class A | | | Class C | | | Institutional | | | Class IR | | | Class R | |
Fixed Income Macro Strategies | | | 1.78 | % | | | 2.52 | % | | | 1.44 | % | | | 1.96 | % | | | 1.51 | % |
Long Short Credit Strategies | | | 1.49 | | | | 2.23 | | | | 1.15 | | | | 1.23 | | | | 1.74 | |
| | + | | Hypothetical expenses are based on each Fund’s actual annualized net expense ratios and an assumed rate of return of 5% per year before expenses. | |
77
GOLDMAN SACHS FIXED INCOME ALTERNATIVES STRATEGIES FUNDS
Trustees and Officers (Unaudited)
Independent Trustees
| | | | | | | | | | |
Name,
Address and Age1 | | Position(s) Held with the Trust | | Term of Office and
Length of
Time Served2 | | Principal Occupation(s) During Past 5 Years | | Number of
Portfolios in
Fund Complex
Overseen by
Trustee3 | | Other Directorships Held by Trustee4 |
Ashok N. Bakhru Age: 74 | | Chairman of the Board of Trustees | | Since 1996 (Trustee since 1991) | | Mr. Bakhru is retired. He was formerly Director, Apollo Investment Corporation (a business development company) (2008-2013); President, ABN Associates (a management and financial consulting firm) (1994-1996 and 1998-2012); Trustee, Scholarship America (1998-2005); Trustee, Institute for Higher Education Policy (2003-2008); Director, Private Equity Investors — III and IV (1998-2007), and Equity-Linked Investors II (April 2002-2007). Chairman of the Board of Trustees — Goldman Sachs Trust; Goldman Sachs Variable Insurance Trust; Goldman Sachs Trust II; Goldman Sachs BDC, Inc.; Goldman Sachs MLP Income Opportunities Fund; Goldman Sachs MLP and Energy Renaissance Fund; and Goldman Sachs ETF Trust. | | 142 | | None |
Kathryn A. Cassidy Age: 62 | | Trustee | | Since 2015 | | Ms. Cassidy is retired. Formerly, she was Advisor to the Chairman (May 2014-December 2014); and Senior Vice President and Treasurer (2008-2014), General Electric Company & General Electric Capital Corporation (technology and financial services companies). Trustee — Goldman Sachs Trust and Goldman Sachs Variable Insurance Trust. | | 109 | | None |
Diana M. Daniels Age: 66 | | Trustee | | Since 2007 | | Ms. Daniels is retired. Formerly, she was Vice President, General Counsel and Secretary, The Washington Post Company (1991-2006). Ms. Daniels is a Trustee Emeritus and serves as a Presidential Councillor of Cornell University (2013-Present); former Member of the Legal Advisory Board, New York Stock Exchange (2003-2006) and of the Corporate Advisory Board, Standish Mellon Management Advisors (2006-2007). Trustee — Goldman Sachs Trust and Goldman Sachs Variable Insurance Trust. | | 109 | | None |
Herbert J. Markley Age: 65 | | Trustee | | Since 2013 | | Mr. Markley is retired. Formerly, he was Executive Vice President, Deere & Company (an agricultural and construction equipment manufacturer) (2007-2009); and President, Agricultural Division, Deere & Company (2001-2007). Previously, Mr. Markley served as an Advisory Board Member of Goldman Sachs Trust and Goldman Sachs Variable Insurance Trust (June 2013-October 2013). Trustee — Goldman Sachs Trust and Goldman Sachs Variable Insurance Trust. | | 109 | | None |
Jessica Palmer Age: 67 | | Trustee | | Since 2007 | | Ms. Palmer is retired. She is Director, Emerson Center for the Arts and Culture (2011-Present); and was formerly a Consultant, Citigroup Human Resources Department (2007-2008); Managing Director, Citigroup Corporate and Investment Banking (previously, Salomon Smith Barney/Salomon Brothers) (1984-2006). Ms. Palmer was a Member of the Board of Trustees of Indian Mountain School (private elementary and secondary school) (2004-2009). Trustee — Goldman Sachs Trust and Goldman Sachs Variable Insurance Trust. | | 109 | | None |
| | | | | | | | | | |
78
GOLDMAN SACHS FIXED INCOME ALTERNATIVES STRATEGIES FUNDS
Trustees and Officers (Unaudited) (continued)
Interested Trustees*
| | | | | | | | | | |
Name,
Address and Age1 | | Position(s) Held with the Trust | | Term of Office and
Length of
Time Served2 | | Principal Occupation(s) During Past 5 Years | | Number of
Portfolios in
Fund Complex
Overseen by
Trustee3 | | Other Directorships Held by Trustee4 |
Roy W. Templin Age: 55 | | Trustee | | Since 2013 | | Mr. Templin is retired. He recently served as Chairman of the Board of Directors, Con-Way Incorporated (a transportation, logistics and supply chain management service company) (2014-2015); and was formerly Executive Vice President and Chief Financial Officer, Whirlpool Corporation (an appliance manufacturer and marketer) (2004-2012). Previously, Mr. Templin served as an Advisory Board Member of Goldman Sachs Trust and Goldman Sachs Variable Insurance Trust (June 2013-October 2013). Trustee — Goldman Sachs Trust and Goldman Sachs Variable Insurance Trust. | | 109 | | None |
Gregory G. Weaver Age: 64 | | Trustee | | Since 2015 | | Mr. Weaver is retired. He is Director, Verizon Communications Inc. (2015-Present); and was formerly Chairman and Chief Executive Officer, Deloitte & Touche LLP (a professional services firm) (2001-2005 and 2012-2014); and Member of the Board of Directors, Deloitte & Touche LLP (2006-2012). Trustee — Goldman Sachs Trust and Goldman Sachs Variable Insurance Trust. | | 109 | | Verizon Communications Inc. |
James A. McNamara Age: 53 | | President and Trustee | | Since 2007 | | Managing Director, Goldman Sachs (December 1998-Present); Director of Institutional Fund Sales, GSAM (April 1998-December 2000); and Senior Vice President and Manager, Dreyfus Institutional Service Corporation (January 1993- April 1998). President and Trustee — Goldman Sachs Trust; Goldman Sachs Variable Insurance Trust; Goldman Sachs Trust II; Goldman Sachs MLP Income Opportunities Fund; Goldman Sachs MLP and Energy Renaissance Fund; and Goldman Sachs ETF Trust. | | 141 | | None |
Alan A. Shuch Age: 66 | | Trustee | | Since 1990 | | Advisory Director — GSAM (May 1999-Present); Consultant to GSAM (December 1994-May 1999); and Limited Partner, Goldman Sachs (December 1994-May 1999). Trustee — Goldman Sachs Trust and Goldman Sachs Variable Insurance Trust. | | 109 | | None |
| | | | | | | | | | |
| * | | These persons are considered to be “Interested Trustees” because they hold positions with Goldman Sachs and own securities issued by The Goldman Sachs Group, Inc. Each Interested Trustee holds comparable positions with certain other companies of which Goldman Sachs, GSAM or an affiliate thereof is the investment adviser, administrator and/or distributor. |
| 1 | | Each Trustee may be contacted by writing to the Trustee, c/o Goldman Sachs, 200 West Street, New York, New York, 10282, Attn: Caroline Kraus. Information is provided as of March 31, 2016. |
| 2 | | Each Trustee holds office for an indefinite term until the earliest of: (a) the election of his or her successor; (b) the date the Trustee resigns or is removed by the Board of Trustees or shareholders, in accordance with the Trust’s Declaration of Trust; (c) December 31st of the year in which the Trustee turns 74 years of age, subject to waiver by a majority of the Trustees (in accordance with the current resolutions of the Board of Trustees, which may be changed by the Trustees without shareholder vote); or (d) the termination of the Trust. |
| 3 | | The Goldman Sachs Fund Complex includes the Trust and Goldman Sachs Variable Insurance Trust (“GSVIT”). As of March 31, 2016, the Trust consisted of 95 portfolios (91 of which offered shares to the public) and GSVIT consisted of 14 portfolios. The Goldman Sachs Fund Complex also includes, with respect to Mr. Bakhru, Goldman Sachs Trust II (“GSTII”), Goldman Sachs BDC, Inc. (“GSBDC”), Goldman Sachs MLP Income Opportunities Fund (“GSMLP”), Goldman Sachs MLP and Energy Renaissance Fund (“GSMER”) and Goldman Sachs ETF Trust (“GSETF”), and with respect to Mr. McNamara, GSTII, GSMLP, GSMER and GSETF. GSTII consisted of 16 portfolios (seven of which offered shares to the public). GSBDC, GSMLP and GSMER each consisted of one portfolio. GSETF consisted of 14 portfolios (five of which offered shares to the public). |
| 4 | | This column includes only directorships of companies required to report to the Securities and Exchange Commission under the Securities Exchange Act of 1934 (i.e., “public companies”) or other investment companies registered under the Act. |
Additional information about the Trustees is available in the Funds’ Statement of Additional Information, which can be obtained from Goldman Sachs free of charge by calling this toll-free number (in the United States of America): 1-800-526-7384.
79
GOLDMAN SACHS FIXED INCOME ALTERNATIVES STRATEGIES FUNDS
Trustees and Officers (Unaudited) (continued)
Officers of the Trust*
| | | | | | |
Name, Address and Age1 | | Position(s) Held With the Trust | | Term of
Office and
Length of
Time Served2 | | Principal Occupation(s) During Past 5 Years |
James A. McNamara 200 West Street New York, NY 10282 Age: 53 | | Trustee and President | | Since 2007 | | Managing Director, Goldman Sachs (December 1998-Present); Director of Institutional Fund Sales, GSAM (April 1998-December 2000); and Senior Vice President and Manager, Dreyfus Institutional Service Corporation (January 1993-April 1998). President and Trustee — Goldman Sachs Trust; Goldman Sachs Variable Insurance Trust; Goldman Sachs Trust II; Goldman Sachs MLP Income Opportunities Fund; Goldman Sachs MLP and Energy Renaissance Fund; and Goldman Sachs ETF Trust. |
Caroline L. Kraus 200 West Street New York, NY 10282 Age: 38 | | Secretary | | Since 2012 | | Managing Director, Goldman Sachs (January 2016-Present); Vice President, Goldman Sachs (August 2006-December, 2015); Associate General Counsel, Goldman Sachs (2012-Present); Assistant General Counsel, Goldman Sachs (August 2006-December 2011); and Associate, Weil, Gotshal & Manges, LLP (2002-2006). Secretary — Goldman Sachs Trust (previously Assistant Secretary (2012)); Goldman Sachs Variable Insurance Trust (previously Assistant Secretary (2012)); Goldman Sachs Trust II; Goldman Sachs BDC, Inc.; Goldman Sachs MLP Income Opportunities Fund; Goldman Sachs MLP and Energy Renaissance Fund; and Goldman Sachs ETF Trust. |
Scott M. McHugh 200 West Street New York, NY 10282 Age: 44 | | Treasurer, Senior Vice President and Principal Financial Officer | | Since 2009 (Principal Financial Officer since 2013) | | Managing Director, Goldman Sachs (January 2016-Present); Vice President, Goldman Sachs (February 2007-December, 2015); Assistant Treasurer of certain mutual funds administered by DWS Scudder (2005-2007); and Director (2005-2007), Vice President (2000-2005), and Assistant Vice President (1998-2000), Deutsche Asset Management or its predecessor (1998-2007). Treasurer, Senior Vice President and Principal Financial Officer — Goldman Sachs Trust; Goldman Sachs Variable Insurance Trust; Goldman Sachs Trust II; Goldman Sachs MLP Income Opportunities Fund; Goldman Sachs MLP and Energy Renaissance Fund; and Goldman Sachs ETF Trust. |
| | | | | | |
| * | | Represents a partial list of officers of the Trust. Additional information about all the officers is available in the Funds’ Statement of Additional Information, which can be obtained from Goldman Sachs free of charge by calling this toll-free number (in the United States): 1-800-526-7384. |
| 1 | | Information is provided as of March 31, 2016. |
| 2 | | Officers hold office at the pleasure of the Board of Trustees or until their successors are duly elected and qualified. Each officer holds comparable positions with certain other companies of which Goldman Sachs, GSAM or an affiliate thereof is the investment adviser, administrator and/or distributor. |
Fixed Income Alternatives Strategies Funds Tax Information (Unaudited)
For the fiscal year ended March 31, 2016, 1.00% of the dividends paid from net investment company taxable income by the Long Short Credit Strategies Fund qualify for the dividends received deduction available to corporations.
For the fiscal year ended March 31, 2016, 0.45% of the dividends paid from net investment company taxable income by the Long Short Credit Strategies Fund qualify for the reduced tax rate under the Jobs and Growth Tax Relief and Reconciliation Act of 2003.
80
FUNDS PROFILE
Goldman Sachs Funds

Goldman Sachs is a premier financial services firm, known since 1869 for creating thoughtful and customized investment solutions in complex global markets.
Today, the Investment Management Division of Goldman Sachs serves a diverse set of clients worldwide, including private institutions, public entities and individuals. With approximately $1.11 trillion in assets under supervision as of March 31, 2016, Goldman Sachs Asset Management (“GSAM”) has portfolio management teams located around the world and our investment professionals bring firsthand knowledge of local markets to every investment decision. Assets under supervision includes assets under management and other client assets for which Goldman Sachs does not have full discretion. GSAM leverages the resources of Goldman, Sachs & Co. subject to legal, internal and regulatory restrictions.

Money Market1
Financial Square FundsSM
| n | | Financial Square Tax-Exempt Funds |
| n | | Financial Square Treasury Solutions Fund2 |
| n | | Financial Square Government Fund |
| n | | Financial Square Money Market Fund |
| n | | Financial Square Prime Obligations Fund |
| n | | Financial Square Treasury Instruments Fund |
| n | | Financial Square Treasury Obligations Fund |
| n | | Financial Square Federal Instruments Fund |
| n | | Financial Square Tax-Exempt Money Market Fund |
Investor FundsSM
| n | | Investor Money Market Fund |
| n | | Investor Tax-Exempt Money Market Fund3 |
Fixed Income
Short Duration and Government
| n | | High Quality Floating Rate Fund |
| n | | Limited Maturity Obligations Fund |
| n | | Short Duration Government Fund |
| n | | Short Duration Income Fund |
| n | | Inflation Protected Securities Fund |
Multi-Sector
Municipal and Tax-Free
| n | | High Yield Municipal Fund |
| n | | Dynamic Municipal Income Fund |
| n | | Short Duration Tax-Free Fund |
Single Sector
| n | | Investment Grade Credit Fund |
| n | | High Yield Floating Rate Fund |
| n | | Emerging Markets Debt Fund |
| n | | Local Emerging Markets Debt Fund |
| n | | Dynamic Emerging Markets Debt Fund |
Fixed Income Alternatives
| n | | Long Short Credit Strategies Fund |
| n | | Fixed Income Macro Strategies Fund |
Fundamental Equity
| n | | Small/Mid Cap Value Fund |
| n | | Small/Mid Cap Growth Fund |
| n | | Flexible Cap Growth Fund |
| n | | Concentrated Growth Fund |
| n | | Technology Opportunities Fund4 |
| n | | Growth Opportunities Fund |
| n | | Rising Dividend Growth Fund |
| n | | Dynamic U.S. Equity Fund |
Tax-Advantaged Equity
| n | | U.S. Tax-Managed Equity Fund |
| n | | International Tax-Managed Equity Fund |
| n | | U.S. Equity Dividend and Premium Fund |
| n | | International Equity Dividend and Premium Fund |
Equity Insights
| n | | Small Cap Equity Insights Fund |
| n | | U.S. Equity Insights Fund |
| n | | Small Cap Growth Insights Fund |
| n | | Large Cap Growth Insights Fund |
| n | | Large Cap Value Insights Fund |
| n | | Small Cap Value Insights Fund |
| n | | International Small Cap Insights Fund5 |
| n | | International Equity Insights Fund |
| n | | Emerging Markets Equity Insights Fund |
Fundamental Equity International
| n | | Strategic International Equity Fund |
| n | | Focused International Equity Fund |
| n | | Emerging Markets Equity Fund6 |
Select Satellite7
| n | | Real Estate Securities Fund |
| n | | International Real Estate Securities Fund |
| n | | Commodity Strategy Fund |
| n | | Global Real Estate Securities Fund |
| n | | Dynamic Commodity Strategy Fund |
| n | | Dynamic Allocation Fund |
| n | | Absolute Return Tracker Fund |
| n | | Managed Futures Strategy Fund |
| n | | MLP Energy Infrastructure Fund |
| n | | Multi-Manager Alternatives Fund |
| n | | Multi-Asset Real Return Fund |
| n | | Absolute Return Multi-Asset Fund |
Total Portfolio Solutions7
| n | | Global Managed Beta Fund |
| n | | Multi-Manager Non-Core Fixed Income Fund |
| n | | Multi-Manager U.S. Dynamic Equity Fund |
| n | | Multi-Manager Global Equity Fund |
| n | | Multi-Manager International Equity Fund |
| n | | Multi-Manager U.S. Small Cap Equity Fund |
| n | | Tactical Tilt Implementation Fund |
| n | | Balanced Strategy Portfolio |
| n | | Multi-Manager Real Assets Strategy Fund |
| n | | Growth and Income Strategy Portfolio |
| n | | Growth Strategy Portfolio |
| n | | Equity Growth Strategy Portfolio |
| n | | Satellite Strategies Portfolio |
| n | | Enhanced Dividend Global Equity Portfolio |
| n | | Tax Advantaged Global Equity Portfolio |
| 1 | | An investment in a money market portfolio is not insured or guaranteed by the Federal Deposit Insurance Corporation or any other government agency. Although a money market portfolio seeks to preserve the value of an investment at $1.00 per share, it is possible to lose money by investing in a money market portfolio. The Fund’s sponsor has no legal obligation to provide financial support to a money market portfolio, and you should not expect that the sponsor will provide financial support to the money market portfolio at any time. |
| 2 | | Effective on September 30, 2015, the Goldman Sachs Financial Square Federal Fund was renamed the Goldman Sachs Financial Square Treasury Solutions Fund. |
| 3 | | Effective on March 31, 2016, the Goldman Sachs Financial Square Tax-Free Money Market Fund was renamed the Goldman Sachs Investor Tax-Exempt Money Market Fund. |
| 4 | | Effective on July 31, 2015, the Goldman Sachs Technology Tollkeeper Fund was renamed the Goldman Sachs Technology Opportunities Fund. |
| 5 | | Effective at the close of business on February 5, 2016, the Goldman Sachs International Small Cap Fund was reorganized with and into the Goldman Sachs International Small Cap Insights Fund. |
| 6 | | Effective at the close of business on October 23, 2015, the Goldman Sachs BRIC Fund (Brazil, Russia, India, China) was reorganized with and into the Goldman Sachs Emerging Markets Equity Fund. |
| 7 | | Individual Funds within the Total Portfolio Solutions and Select Satellite categories will have various placement on the risk/return spectrum and may have greater or lesser risk than that indicated by the placement of the general Total Portfolio Solutions or Select Satellite category. |
| * | | This list covers open-end funds only. Please visit our website at www.GSAMFUNDS.com to learn about our closed-end funds and exchange-traded funds. |
| | |
TRUSTEES Ashok N. Bakhru, Chairman Kathryn A. Cassidy Diana M. Daniels Herbert J. Markley James A. McNamara Jessica Palmer Alan A. Shuch Roy W. Templin Gregory G. Weaver | | OFFICERS James A. McNamara, President Scott M. McHugh, Principal Financial Officer, Senior Vice President, and Treasurer Caroline L. Kraus, Secretary |
| |
GOLDMAN, SACHS & CO. Distributor and Transfer Agent | | GOLDMAN SACHS ASSET MANAGEMENT, L.P. Investment Adviser |
Visit our Web site at www.GSAMFUNDS.com to obtain the most recent month-end returns.
Goldman Sachs Asset Management, L.P. 200 West Street, New York, New York 10282
The reports concerning the Funds included in this shareholder report may contain certain forward-looking statements about the factors that may affect the performance of the Funds in the future. These statements are based on Fund management’s predictions and expectations concerning certain future events and their expected impact on the Funds, such as performance of the economy as a whole and of specific industry sectors, changes in the levels of interest rates, the impact of developing world events, and other factors that may influence the future performance of the Funds. Management believes these forward-looking statements to be reasonable, although they are inherently uncertain and difficult to predict. Actual events may cause adjustments in portfolio management strategies from those currently expected to be employed.
A description of the policies and procedures that the Funds use to determine how to vote proxies relating to portfolio securities and information regarding how a Fund voted proxies relating to portfolio securities during the most recent 12-month period ended June 30 is available (I) without charge, upon request by calling 1-800-526-7384 (for Retail Shareholders) or 1-800-621-2550 (for Institutional Shareholders); and (II) on the Securities and Exchange Commission (“SEC”) Web site at http://www.sec.gov.
The Funds file their complete schedule of portfolio holdings with the SEC for the first and third quarters of each fiscal year on Form N-Q. The Funds’ Form N-Q is available on the SEC’s Web site at http://www.sec.gov within 60 days after the Funds’ first and third fiscal quarters. The Funds’ Form N-Q may be reviewed and copied at the SEC’s Public Reference Room in Washington, D.C., and information on the operation of the Public Reference Room may also be obtained by calling 1-800-SEC-0330. Forms N-Q may be obtained upon request and without charge by calling 1-800-526-7384 (for Retail Shareholders) or 1-800-621-2550 (for Institutional Shareholders).
The website links provided are for your convenience only and are not an endorsement or recommendation by GSAM of any of these websites or the products or services offered. GSAM is not responsible for the accuracy and validity of the content of these websites.
Fund holdings and allocations shown are as of March 31, 2016 and may not be representative of future investments. Fund holdings should not be relied on in making investment decisions and should not be construed as research or investment advice regarding particular securities. Current and future holdings are subject to risk.
Economic and market forecasts presented herein reflect our judgment as of the date of this presentation and are subject to change without notice. These forecasts do not take into account the specific investment objectives, restrictions, tax and financial situation or other needs of any specific client. Actual data will vary and may not be reflected here. These forecasts are subject to high levels of uncertainty that may affect actual performance. Accordingly, these forecasts should be viewed as merely representative of a broad range of possible outcomes. These forecasts are estimated, based on assumptions, and are subject to significant revision and may change materially as economic and market conditions change. Goldman Sachs has no obligation to provide updates or changes to these forecasts. Case studies and examples are for illustrative purposes only.
This material is not authorized for distribution to prospective investors unless preceded or accompanied by a current Prospectus or summary prospectus, if applicable. Investors should consider a Fund’s objective, risks, and charges and expenses, and read the summary prospectus, if available, and/or the Prospectus carefully before investing or sending money. The summary prospectus, if available, and the Prospectus contain this and other information about a Fund and may be obtained from your authorized dealer or from Goldman, Sachs & Co. by calling (retail – 1-800-526-7384) (institutional – 1-800-621-2550).
© 2016 Goldman Sachs. All rights reserved. 46032-TMPL-05-2016 FIALTAR-16/1.9K
(a) As of the end of the period covered by this report, the registrant has adopted a code of ethics that applies to the registrant’s principal executive officer, principal financial officer, principal accounting officer or controller, or persons performing similar functions, regardless of whether these individuals are employed by the registrant or a third party (the “Code of Ethics”).
(b) During the period covered by this report, no amendments were made to the provisions of the Code of Ethics.
(c) During the period covered by this report, the registrant did not grant any waivers, including an implicit waiver, from any provision of the Code of Ethics.
(d) A copy of the Code of Ethics is available as provided in Item 12(a)(1) of this report.
| ITEM 3. | AUDIT COMMITTEE FINANCIAL EXPERT. |
The registrant’s board of trustees has determined that the registrant has at least one “audit committee financial expert” (as defined in Item 3 of Form N-CSR) serving on its audit committee. Gregory G. Weaver is the “audit committee financial expert” and is “independent” (as each term is defined in Item 3 of Form N-CSR).
| ITEM 4. | PRINCIPAL ACCOUNTANT FEES AND SERVICES. |
The following disclosure relates to the independence of PricewaterhouseCoopers LLP (“PwC”) with respect to SEC Rule 2-01(c)(1)(ii)(A) of Regulation S-X (the “Loan Rule”). The Loan Rule prohibits accounting firms, such as PwC, from having certain financial relationships with their audit clients and affiliated entities. Specifically, the Loan Rule provides, in relevant part, that an accounting firm generally would not be independent if it receives a loan from a lender that is a “record or beneficial owner of more than ten percent of the audit client’s equity securities.” The Goldman Sachs Asset Management investment company complex (the “Funds”) has been notified by PwC that one of its lenders owns more than ten percent of at least one of the Funds. The Funds are providing this disclosure to explain the facts and circumstances as well as PwC’s conclusions concerning its independence and its objectivity and impartiality with respect to the audits of the Funds.
PwC has advised the Funds that, after evaluating the facts and circumstances related to the matter described above, it has concluded that its financial relationship described above did not and will not impair PwC’s application of objective and impartial judgment on any issues encompassed within its audits of the financial statements of the Funds. PwC has advised the Funds that this conclusion is based in part on the following considerations: (1) the lenders to PwC have no influence over the fund adviser to the Funds; (2) an investment in any such Fund is passive; (3) the PwC lenders are part of various syndicates of unrelated lenders; (4) there have been no changes to the loans in question since the origination of each respective note; (5) the debts are in good standing and no lender has the right to take action against PwC, as borrower, in connection with the financings; (6) the debt balances are immaterial to PwC and to each lender; and (7) the PwC audit engagement team has no involvement in PwC’s treasury function and PwC’s treasury function has no oversight of or ability to influence the PwC audit engagement team.
If it were ultimately determined that PwC was not independent with respect to the Funds for certain periods, any Fund filings with the SEC which contain the Funds’ financial statements for such periods would not comply with applicable securities laws which potentially could have a material adverse effect on the Funds.
Table 1 — Items 4(a) - 4(d). The accountant fees below reflect the aggregate fees billed by all of the Funds of the Goldman Sachs Trust and includes the Goldman Sachs Funds to which this certified shareholder report relates.
| | | | | | | | | | | | |
| | | 2016 | | 2015 | | Description of Services Rendered |
| | | |
| | | | | | | | | | | | |
| | | |
Audit Fees: | | | | | | | | | | | | |
| | | |
• PricewaterhouseCoopers LLP
(“PwC”) | | | $ | 3,724,925 | | | | $ | 3,570,472 | | | Financial Statement audits. |
| | | |
Audit-Related Fees: | | | | | | | | | | | | |
| | | |
• PwC | | | $ | 158,000 | | | | $ | 0 | | | Other attest services. |
| | | |
Tax Fees: | | | | | | | | | | | | |
| | | |
• PwC | | | $ | 1,091,628 | | | | $ | 659,410 | | | Tax compliance services provided in connection with the preparation and review of registrant’s tax returns. |
Table 2 — Items 4(b)(c) & (d). Non-Audit Services to the Goldman Sachs Trust’s service affiliates * that were pre-approved by the Audit Committee of the Goldman Sachs Trust pursuant to Rule 2-01(c)(7)(ii) of Regulation S-X.
| | | | | | | | | | | | |
| | | 2016 | | 2015 | | Description of Services Rendered |
| | | |
| | | | | | | | | | | | |
| | | |
Audit-Related Fees: | | | | | | | | | | | | |
| | | |
• PwC | | | $ | 1,653,616 | | | | $ | 1,568,616 | | | Internal control review performed in accordance with Statement on Standards for Attestation Engagements No. 16. These fees are borne by the Funds’ Adviser. |
| * | These include the advisor (excluding sub-advisors) and any entity controlling, controlled by or under common control with the advisor that provides ongoing services to the registrant (hereinafter referred to as “service affiliates”). |
Item 4(e)(1) — Audit Committee Pre-Approval Policies and Procedures
Pre-Approval of Audit and Non-Audit Services Provided to the Funds of the Goldman Sachs Trust. The Audit and Non-Audit Services Pre-Approval Policy (the “Policy”) adopted by the Audit Committee of Goldman Sachs Trust (“GST”) sets forth the procedures and the conditions pursuant to which services performed by an independent auditor for GST may be pre-approved. Services may be pre-approved specifically by the Audit Committee as a whole or, in certain circumstances, by the Audit Committee Chairman or the person designated as the Audit Committee Financial Expert. In addition, subject to specified cost limitations, certain services may be pre-approved under the provisions of the Policy. The Policy provides that the Audit Committee will consider whether the services provided by an independent auditor are consistent with the Securities and Exchange Commission’s rules on auditor independence. The Policy provides for periodic review and pre-approval by the Audit Committee of the services that may be provided by the independent auditor.
De Minimis Waiver. The pre-approval requirements of the Policy may be waived with respect to the provision of non-audit services that are permissible for an independent auditor to perform, provided (1) the aggregate amount of all such services provided constitutes no more than five percent of the total amount of revenues subject to pre-approval that was paid to the independent auditors during the fiscal year in which the services are provided; (2) such services were not recognized by GST at the time of the engagement to be non-audit services; and (3) such services are promptly brought to the attention of the Audit Committee and approved prior to the completion of the audit by the Audit Committee or by one or more members of the Audit Committee to whom authority to grant such approvals has been delegated by the Audit Committee, pursuant to the pre-approval provisions of the Policy.
Pre-Approval of Non-Audit Services Provided to GST’s Investment Advisers. The Policy provides that, in addition to requiring pre-approval of audit and non-audit services provided to GST, the Audit Committee will pre-approve those non-audit services provided to GST’s investment advisers (and entities controlling, controlled by or under common control with the investment advisers that provide ongoing services to GST) where the engagement relates directly to the operations or financial reporting of GST.
Item 4(e)(2) – 0% of the audit-related fees, tax fees and other fees listed in Table 1 were approved by GST’s Audit Committee pursuant to the “de minimis” exception of Rule 2-01(c)(7)(i)(C) of Regulation S-X. In addition, 0% of the non-audit services to the GST’s service affiliates listed in Table 2 were approved by GST’s Audit Committee pursuant to the “de minimis” exception of Rule 2-01(c)(7)(i)(C) of Regulation S-X.
Item 4(f) – Not applicable.
Item 4(g) Aggregate Non-Audit Fees Disclosure
The aggregate non-audit fees billed to GST by PwC for the twelve months ended March 31, 2016 and March 31, 2015 were approximately $1,091,628 and $659,410 respectively. The aggregate non-audit fees billed to GST’s adviser and service affiliates by PwC for non-audit services for the twelve months ended December 31, 2015 and December 31, 2014 were approximately $14.4 million and $10.2 million respectively. With regard to the aggregate non-audit fees billed to GST’s adviser and service affiliates, the 2015 and 2014 amounts include fees for non-audit services required to be pre-approved [see Table 2] and fees for non-audit services that did not require pre-approval since they did not directly relate to GST’s operations or financial reporting.
Item 4(h) — GST’s Audit Committee has considered whether the provision of non-audit services to GST’s investment adviser and service affiliates that did not require pre-approval pursuant to paragraph (c)(7)(ii) of Rule 2-01 of Regulation S-X is compatible with maintaining the auditors’ independence.
| ITEM 5. | AUDIT COMMITTEE OF LISTED REGISTRANTS. |
| ITEM 6. | SCHEDULE OF INVESTMENTS. |
| | Schedule of Investments is included as part of the Report to Shareholders filed under Item 1. |
| ITEM 7. | DISCLOSURE OF PROXY VOTING POLICIES AND PROCEDURES FOR CLOSED-END MANAGEMENT INVESTMENT COMPANIES. |
| ITEM 8. | PORTFOLIO MANAGERS OF CLOSED-END MANAGEMENT INVESTMENT COMPANIES. |
| ITEM 9. | PURCHASES OF EQUITY SECURITIES BY CLOSED-END MANAGEMENT INVESTMENT COMPANY AND AFFILIATED PURCHASERS. |
| ITEM 10. | SUBMISSION OF MATTERS TO A VOTE OF SECURITY HOLDERS. |
| | There have been no material changes to the procedures by which shareholders may recommend nominees to the registrant’s board of trustees. |
| ITEM 11. | CONTROLS AND PROCEDURES. |
| | (a) | The registrant’s principal executive and principal financial officers, or persons performing similar functions have concluded that the registrant’s disclosure controls and procedures (as defined in Rule 30a-3(c) under the Investment Company Act of 1940, as amended (the “1940 Act”)) are effective as of a date within 90 days of the filing of this report that includes the disclosure required by this paragraph, based on the evaluation of these controls and procedures required by Rule 30a-3(b) under the 1940 Act and 15d-15(b) under the Securities Exchange Act of 1934, as amended. |
| | (b) | There were no changes in the registrant’s internal control over financial reporting (as defined in Rule 30a-3(d) under the 1940 Act) that occurred during the registrant’s second fiscal quarter of the period covered by this report that have materially affected, or are reasonably likely to materially affect, the registrant’s internal control over financial reporting. |
| | | | |
| (a)(1) | | Goldman Sachs Trust’s Code of Ethics for Principal Executive and Senior Financial Officers is incorporated by reference to Exhibit 12(a)(1) of the registrant’s Form N-CSR filed on July 8, 2015 for its International Equity Insights Funds. |
| | |
| (a)(2) | | Exhibit 99.CERT | | Certifications pursuant to Section 302 of the Sarbanes-Oxley Act of 2002 filed herewith. |
| | |
| (b) | | Exhibit 99.906CERT | | Certifications pursuant to Section 906 of the Sarbanes-Oxley Act of 2002 filed herewith. |
SIGNATURES
Pursuant to the requirements of the Securities Exchange Act of 1934 and the Investment Company Act of 1940, the registrant has duly caused this report to be signed on its behalf by the undersigned, thereunto duly authorized.
| | |
| | | Goldman Sachs Trust |
| |
| By: | | /s/ James A. McNamara |
| |
| | |
| | James A. McNamara |
| | President/Chief Executive Officer |
| | Goldman Sachs Trust |
| |
| Date: | | June 6, 2016 |
Pursuant to the requirements of the Securities Exchange Act of 1934 and the Investment Company Act of 1940, this report has been signed below by the following persons on behalf of the registrant and in the capacities and on the dates indicated.
| | |
| By: | | /s/ James A. McNamara |
| |
| | |
| | James A. McNamara |
| | President/Chief Executive Officer |
| | Goldman Sachs Trust |
| |
| Date: | | June 6, 2016 |
| |
| By: | | /s/ Scott McHugh |
| |
| | |
| | Scott McHugh |
| | Principal Financial Officer |
| | Goldman Sachs Trust |
| |
| Date: | | June 6, 2016 |